All an ecologist wants to know, but never can find Peter M.J. Herman Netherlands Institute of...
19
All an ecologist wants to know, but never can find Peter M.J. Herman Netherlands Institute of Ecology Yerseke [email protected]
-
Upload
sabrina-bowerman -
Category
Documents
-
view
218 -
download
1
Transcript of All an ecologist wants to know, but never can find Peter M.J. Herman Netherlands Institute of...

All an ecologist wants to know, but never can find
Peter M.J. Herman
Netherlands Institute of Ecology
Yerseke
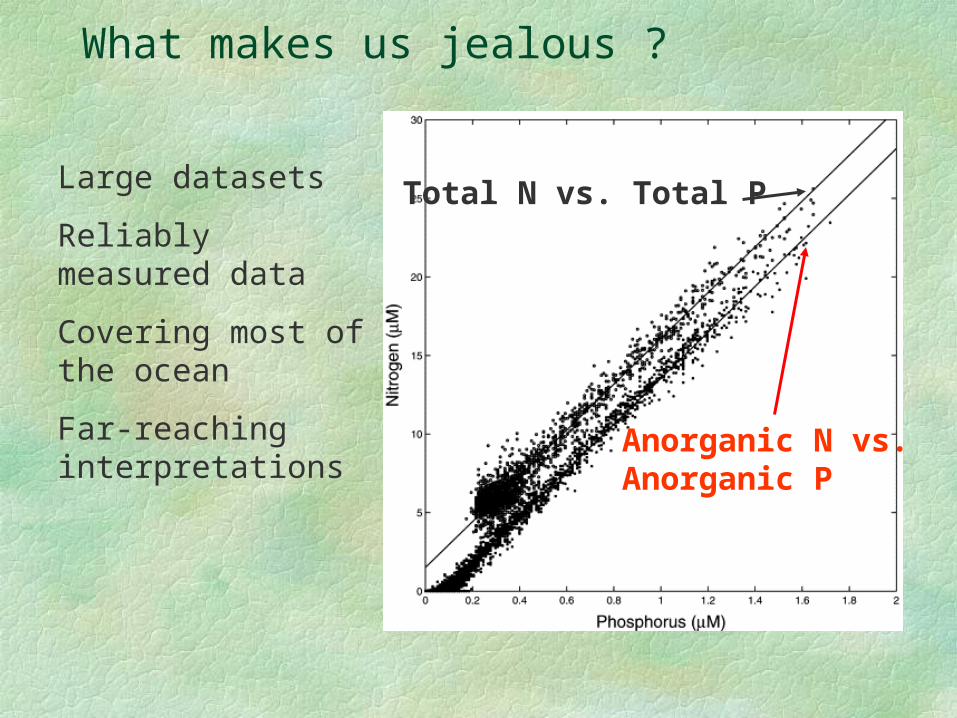
Total N vs. Total P
Anorganic N vs.Anorganic P
What makes us jealous ?
Large datasets
Reliably measured data
Covering most of the ocean
Far-reaching interpretations

System primary production (gC.m-2.y-1)
0 100 200 300 400 500 600 700
Sys
tem
-ave
rage
d m
acro
faun
a bi
omas
sg
AF
DW
m-2
0
10
20
30
40
50
60
70
B=-1.5 + 0.105 Pr2=0.77
GR
OS
VM
WS
B1
B2
ED
EW
CBSFBLIS
LY
COL
YT
BF
Cross-system comparisons of benthic biomass and primary production in estuaries
System-averaged benthic biomass relates to system-averaged primary production
Possible implications for effects eutrophication
Possible norm for biomass
But: system coverage poor!
Herman et al. 1999 Adv.Ecol.Res

0
2
4
6
8
10
12
14
0 2000 4000
Depth (m)
Re
sp
ira
tio
n (
gC
.m-2
.y-1
)
SCOC Macro Meio
Benthic data from shelf break
Heip et al. 2001 DSR IIOmex project: benthic fauna and sediment biogeochemisty

0.1
1
10
100
1 10 100 1000
(Estimated) SCOC (gC.m -2 .y-1)
Bio
mas
s m
acro
fau
na
(gA
FD
W.m
-2)
Shelf break data compared with shallow systems
Shallow systemsEstimated as 1/3 PP
Consistent pattern over orders of magnitude of organic loading

What could be mined further ?
More data sets on benthic biomass, PP and sediment oxygen consumption
Breakdown of datasets: regionally, with water depth, with physical conditions, with nature of primary production etc..
Breakdown of benthic biomass into different functional groups, even species.
Better resolution of variability behind the averages – what are determining factors for these

Sediment community oxygen consumption
0 2000 4000 6000Depth [m]
-6
-4
-2
0
2
4
6L
og
e (
SO
C [
mm
ol m
-2 d
-1]
)
Henrik Andersson et al. submitted

Refining with PP-depth gradients
0 2000 4000 6000
Depth [m]
0.05
0.50
5.00
50.00
500.00
Prim
ary
Pro
duct
ion
[ mm
ol C
m-2
d-1
]
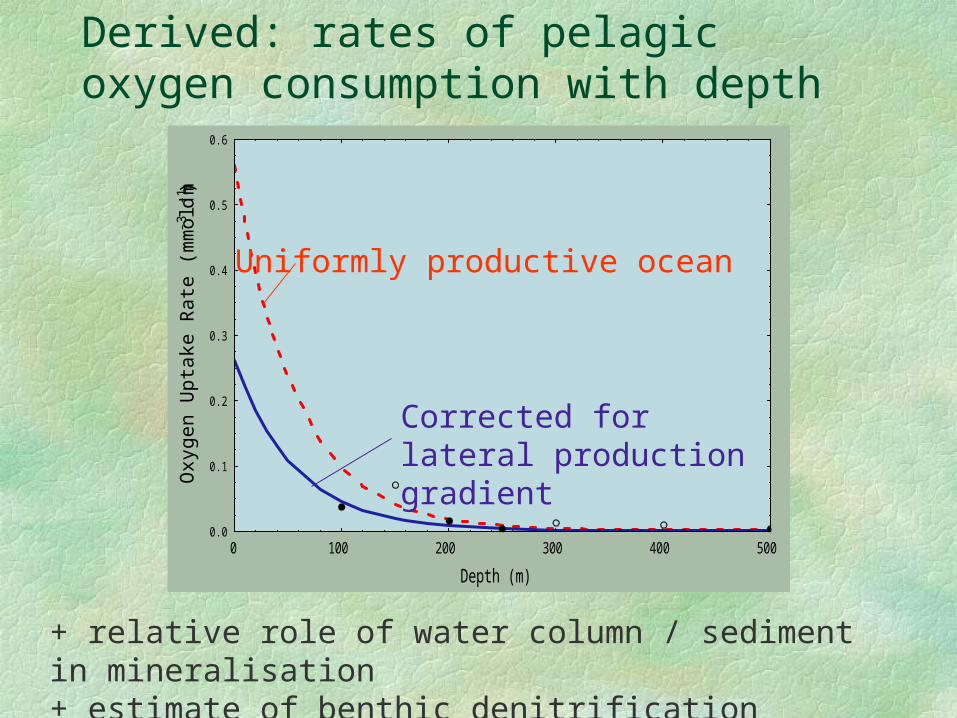
Derived: rates of pelagic oxygen consumption with depth
0 100 200 300 400 500
Depth (m)
0.0
0.1
0.2
0.3
0.4
0.5
0.6
Oxy
gen
Upt
ake
Rat
e (m
mol
m-3
d-1
)
+ relative role of water column / sediment in mineralisation+ estimate of benthic denitrification
Corrected for lateral production gradient
Uniformly productive ocean

What could be mined further?
Relation with macro/meiobenthic biomass, species composition and diversity
Depth (m) Latitude
Oxygen (ml/l) % Org. Carbon
E.g. Levin & Gage (1998)
Macrobenthic diversity as a function of depth, oxygen, latitude, carbon content of sediment

Danish monitoring: relation mussels – chl a
Kaas et al. (1996)
Bloom
Decay
graz
prod
'mix
prodK
'
Koseff et al., 1993
?-> mixing rates?

1 2 3 40
5
10
15
20
25
30
35
biom
ass
(g A
FD
W/m
² ±
se)
salinity region
intertidal undeep subtidal deep subtidal channel
Macrobenthos Westerschelde: depth & salinity
Tom YsebaertPeter Herman
Biomass (g AFDW.m-2) of feeding groupsIntertidal stratum
salinity zones
zone 1 zone 2 zone 3 zone 4
Bio
mas
s (g
AF
DW
m-2
)
0
5
10
15
20
25
susp surf depo omni pred

Comparison other regional systems
0
20
40
60
80
100
120
140
bio
mas
s (g
AF
DW
.m-2)
intertidalshallow subtidaldeep subtidalchannel
WS OS GR VM
Tom YsebaertPeter Herman
GrevelingenOosterscheldeVeerse MeerWesterschelde
Distribution ~ * macro- vs. micro-
vs. non-tidal* wave vs. current* transparancy* oxygen conditions

Functional guilds and depth distribution : Oosterschelde
0 1 2 3 4
-1 - 2 m
2 - 5 m
5 - 8 m
> 8 m
0 20 40 60
-1 - 2 m
2 - 5 m
5 - 8 m
> 8 m
Biomass (g AFDW.m-2)Deposit feeders
Biomass (g AFDW.m-2)Suspension feeders

Model for suspension feeder occurrence
CPCzz
CK
zt
C
mixing sinking
production - consumption
P
P
P
Phytoplankton growth at depth z:
-> food depletion suspension feeders depends on production, mixing, pelagic losses-> suspension feeders deeper as water gets more transparant

Some common denominators
Data sets must come from both similar and dissimilar systems
Comparability of methods is prerequisiteNot valuable without physical and/or chemical
metadataTaxonomy problems when analysed at species
level ; autecology often lacking when analysed at functional group level
Models needed to make data meaningful

What would we want?
Easily accessible, highly resolved ecological dataGeoreferencedConsistent taxonomyAuto-ecological informationWell-documented methodsPhysical and chemical data (depth, light,
chlorophyll, nutrients, sediment composition, physical stress,…) linked
Spatiotemporal variation represented

What could we do with it?
Inter-system comparison of limiting factors on species / functional guilds / trophic groups
Deriving norms and indicators adapted to local circumstances
Detecting general temporal trends ~ global changeBetter exploitation of remotely sensed variables
Testing ecological hypothesesDetecting patterns that suggest experimental
approach or detailed research

What would we need for it ?
Linking of existing databases from national / regional monitoring programmes
Quality control on data setsExchange formatsResolution of the taxonomic messBetter linking between ecological, physical and
biogeochemical datasets