ALJ/MLC/tcg - Online Documentsdocs.cpuc.ca.gov/.../Published/G000/M165/K862/165862363.docx · Web...
318
COM/MP6/ar9/lil PROPOSED DECISION Agenda ID #14984 (Rev. 1) Quasi- Legislative 8/18/2016 Decision PROPOSED DECISION OF COMMISSIONER PICKER (Mailed 6/14/2016) BEFORE THE PUBLIC UTILITIES COMMISSION OF THE STATE OF CALIFORNIA Application of San Diego Gas & Electric Company (U902M) for Review of its Safety Model Assessment Proceeding Pursuant to Decision 14-12-025. Application 15-05-002 (Filed May 1, 2015) And Related Matters. Application 15-05-003 Application 15-05-004 Application 15-05-005 INTERIM DECISION ADOPTING THE MULTI-ATTRIBUTE APPROACH (OR UTILITY EQUIVALENT FEATURES) AND DIRECTING UTILITIES TO TAKE STEPS TOWARD A MORE UNIFORM RISK MANAGEMENT FRAMEWORK 165862363 - 1 -
Transcript of ALJ/MLC/tcg - Online Documentsdocs.cpuc.ca.gov/.../Published/G000/M165/K862/165862363.docx · Web...
COM/MP6/ar9/lil PROPOSED DECISION Agenda ID #14984
(Rev. 1)Quasi-
Legislative 8/18/2016
Decision PROPOSED DECISION OF COMMISSIONER PICKER (Mailed 6/14/2016)
BEFORE THE PUBLIC UTILITIES COMMISSION OF THE STATE OF CALIFORNIA
Application of San Diego Gas & Electric Company (U902M) for Review of its Safety Model Assessment Proceeding Pursuant to Decision 14-12-025.
Application 15-05-002(Filed May 1, 2015)
And Related Matters.Application 15-05-003Application 15-05-004Application 15-05-005
INTERIM DECISION ADOPTING THE MULTI-ATTRIBUTE APPROACH (OR UTILITY EQUIVALENT FEATURES) AND DIRECTING UTILITIES TO TAKE STEPS TOWARD A MORE UNIFORM RISK MANAGEMENT FRAMEWORK
165862363 - 1 -
A.15-05-002 et al. COM/MP6/ar9/lil PROPOSED DECISION (Rev. 1)
Table of Contents
Title Page
INTERIM DECISION ADOPTING THE MULTI-ATTRIBUTE APPROACH (OR UTILITY EQUIVALENT FEATURES) AND DIRECTING UTILITIES TO TAKE STEPS TOWARD A MORE UNIFORM RISK MANAGEMENT FRAMEWORK..................................1Summary...............................................................................................21. Background.....................................................................................32. Procedural Background...................................................................73. Collaborative Process....................................................................104. Issues Before the Commission.......................................................135. Context..........................................................................................16
5.1. D.14-12-025 Requirements....................................................165.2. Cycla 10-Step Approach.........................................................165.3. Risk Evaluation Formulas and High Impact Events...............185.4. General Observations on Risk Scores....................................20
6. Common Set of Definitions or “Lexicon”.......................................246.1. D.14-12-025 Requirements....................................................246.2. Working Group Recommendation..........................................256.3. SED Staff Recommendation...................................................266.4. Parties’ Comments.................................................................296.5. Discussion..............................................................................30
7. Brief Overview of Utilities’ Risk Assessment Models and Frameworks...................................................................................327.1. PG&E.....................................................................................327.2. SCE........................................................................................337.3. Sempra...................................................................................377.4. Comparison of Utilities Risk Management Frameworks........40
8. Common and Different Elements Among Utility Models...............418.1. Utilities’ S-MAP Uniformity Report........................................41
8.1.1. Utilities’ Risk Management Framework.......................418.1.2. Common Elements........................................................43
8.2. 7x7 Matrix..............................................................................438.3. SED Staff Comments..............................................................488.4. Parties’ Comments.................................................................508.5. Discussion..............................................................................57
9. Alternative Approaches to Promote Uniformity.............................60
- i -
A.15-05-002 et al. COM/MP6/ar9/lil PROPOSED DECISION (Rev. 1)
Table of Contents(Cont’d)
Title Page
9.1. D.14-12-025 Requirements....................................................609.2. ALARP Framework.................................................................629.3. SED Staff Comments..............................................................679.4. Parties’ Comments.................................................................709.5. Discussion..............................................................................789.6. Joint Intervenor Framework...................................................81
9.6.1. Overview.......................................................................819.6.2. Limitations of Current Utility CoF Methodologies.......829.6.3. Building Blocks of Probabilistic Modeling....................869.6.4. Implementation............................................................909.6.5. Comparison of Utility and Joint Intervenor Approaches
......................................................................................949.6.6. SED Staff Comments....................................................979.6.7. Parties’ Comments.....................................................1009.6.8. Discussion..................................................................112
10.Potential Barriers to Effective Implementation...........................12010.1........................................Intrusion of Shareholders’ Financial Interests
.............................................................................................12010.2.......Sufficiency of Data Collection and Subject Matter Expertise
.............................................................................................12410.3...................Limited Expertise and Lack of Familiarity with Models
.............................................................................................12811.RAMP Requirements and Guidance.............................................131
11.1....................................................................................D.14-12-025 Requirements.............................................................................................131
11.2................................................................................SED Staff Recommendations.............................................................................................137
11.3.......................................................................................................Parties’ Comments.............................................................................................147
11.4..........................................................................................................................Discussion.............................................................................................151
12.Verification and Annual Reporting..............................................15612.1....................................................................................D.14-12-025 Requirements
.............................................................................................15612.2...................................................................................................................Status Report
.............................................................................................158
- ii -

A.15-05-002 et al. COM/MP6/ar9/lil PROPOSED DECISION (Rev. 1)
Table of Contents(Cont’d)
Title Page
13.Conclusions..................................................................................16314. Interim and Long-Term Plan “Road Map” to Migrate to More
Quantitative Methods for Optimized Risk Mitigation..................16514.1................................................................................SED Staff Recommendations
.............................................................................................16614.2.......................................................................................................Parties’ Comments
.............................................................................................16614.1..........................................................................................................................Discussion
.............................................................................................17114.2.............................................................First S-MAP Road Map (Short-Term)
.............................................................................................17314.3........................................................Second S-MAP Road Map (Long-Term)
.............................................................................................17515.Categorization and Need for Hearing.........................................17616.Comments on Proposed Decision................................................17617.Assignment of Proceeding...........................................................178Findings of Fact................................................................................178Conclusions of Law...........................................................................188ORDER..............................................................................................194
Appendix A – Utilities’ Risk Models and Decision Frameworks
- iii -

A.15-05-002 et al. COM/MP6/ar9/lil PROPOSED DECISION (Rev. 1)
INTERIM DECISION ADOPTING THE MULTI-ATTRIBUTE APPROACH (OR UTILITY EQUIVALENT FEATURES) AND DIRECTING UTILITIES
TO TAKE STEPS TOWARD A MORE UNIFORM RISK MANAGEMENT FRAMEWORK
SummaryConsistent with the directives established by Decision
14-12-025,1 this decision, among other things: Adopts the Cycla Corporation (Cycla) 10-Step
Evaluation Method as a common yardstick for evaluating the maturity of San Diego Gas & Electric Company, Southern California Gas Company, Southern California Edison Company, and Pacific Gas and Electric Company (utility) risk assessment and mitigation models;
Approves common elements of existing utility models to the extent that they provide a “bridge” to more sophisticated and administratively efficient multi-attribute risk analysis;
On an interim basis, adopts the Joint Intervenor “Multi-Attribute” Approach (or utility equivalent features) and directs utilities to take steps toward a more uniform approach to risk management in the second phase of this proceeding;
Directs utilities to “test drive” the Multi-Attribute Approach using real world problems before full scale adoption of any methodology;
Directs utilities to share results of pilots that highlight equivalent features of the Multi-Attribute Approach;
Directs stakeholder working group to promote appropriate data collection, calibration of subject matter expertise, and development of performance metrics and benchmarking procedures;
1 “Decision Incorporating a Risk-Based Decision-Making Framework Into the Rate Case Plan and Modifying Appendix A of Decision 07-07-004” issued December 9, 2014.
- 2 -

A.15-05-002 et al. COM/MP6/ar9/lil PROPOSED DECISION (Rev. 1)
Adopts Working Group Lexicon Proposal; Adopts Safety and Enforcement Division’s (SED)
recommended Guidance for Risk Assessment Mitigation Phase (RAMP) with modifications, and the ten major components that shall be included in RAMP filings;
In RAMP filings, explicitly asks for calculations of risk reduction and a ranking of mitigations based on risk reduction per dollar spent;
Supports Sempra filing its upcoming RAMP based on its current risk evaluation and risk-based decision making methodologies, and specifies additional requirements as listed in the ten major components that shall be included in RAMP filings.;
Approves an interim Road Map to migrate from relative risk scoring to more quantitative methods for optimized risk mitigation subject to review and revision in the second phase of this Safety Model Assessment Proceeding; and
Directs the Commission’s SED Staff to conduct a public workshop within 90 days of the approval of the decision, to review the Joint Intervenor Approach foundational requirements and how it operates in a real world setting; establish “test drive” requirements; and assess status of the pilots, as mentioned above, etc.
This proceeding shall remain open for a second phase to commence as soon as possible following the issuance of this decision.
1. BackgroundOn November 14, 2013, the Commission opened Rulemaking
(R.) 13-11-006 Order Instituting Rulemaking to Develop a Risk-Based Decision-Making Framework to Evaluate Safety and Reliability Improvements and Revise the Rate Case Plan for Energy Utilities (the Risk OIR). The purpose of this rulemaking was to incorporate a risk-based decision-making framework into the Rate Case Plan (RCP)
- 3 -

A.15-05-002 et al. COM/MP6/ar9/lil PROPOSED DECISION (Rev. 1)
for the energy utilities’ General Rate Cases (GRCs).1 The RCP guides the utility on the type of the information that is presented, and the procedural schedule to be followed, for addressing their revenue requests in their GRCs. In response to the Risk OIR, and as a result of Senate Bill (SB) 705,2 and its emphasis on making natural gas safety a top priority of this Commission, the existing RCP was modified in Decision (D.) 14-12-025 to incorporate a risk-based decisionmaking framework into the GRCs for the large energy utilities. Such a framework and associated parameters assists the utilities, interested parties, and the Commission, in evaluating how energy utilities assess their safety risk, and in managing, mitigating and minimizing such risks. D.14-12-025 recognized it will take some time to fully implement the Safety Model Assessment Proceeding (S-MAP) and Risk Assessment Mitigation Phase (RAMP) procedures, and to have the outputs of those two procedures considered in the utilities’ GRC proceedings.3 During this transition, all of the large energy utilities, beginning February 1, 2015, are to include in all their future GRC applications thorough descriptions of the risk assessments and mitigation plans that they use in their GRC.
For the large energy utilities, this will take place through two new procedures, which feed into GRC applications in which utilities request funding for safety-related activities: 1) May 1, 2015 filing of an S-MAP by each of the large utilities, which were consolidated on
1 In addition, this would apply to jurisdictional gas corporations’ Gas Transmission and Storage (GT&S) rate cases.2 SB 705 was codified into the Pub. Util. Code §§ 961 and 963 in Chapter 522 of the Statutes of 2011.3 D.14-12-025 at 26.
- 4 -

A.15-05-002 et al. COM/MP6/ar9/lil PROPOSED DECISION (Rev. 1)
June 19, 2015 and is the subject of this proceeding; and 2) a subsequent RAMP filing for the upcoming GRC wherein the large energy utility files its RAMP in the S-MAP approved report format describing how it plans to assess, mitigate, and minimize its risks. The RAMP submission, as clarified and modified in the RAMP proceeding, will then be incorporated into the large energy utility’s GRC filing. In addition, the large energy utilities are required to file annual reports following the GRC decisions.
According to D.14-12-025, the twin purposes of S-MAP are to: 1) allow parties to understand the models the utilities propose to use to prioritize programs/projects intended to mitigate risks; and 2) allow the Commission to establish standards and requirements for those models. Following the format that the Commission used to establish Long Term Procurement Plans proceedings, the idea is for each successive S-MAP to become more sophisticated, be able to respond to changing circumstances, and be able to build on its predecessor S-MAP to tackle increasingly difficult issues.
Based on the directives in D.14-12-025, the S-MAP is expected to accomplish several objectives:4
Undertake a comprehensive analysis of each utility’s risk-based decision making approach;
Compare the different approaches that each energy utility may use;
Detect whether there are common elements among the approaches and models that they use; and
Assess whether elements of one utility can be adapted for use by the other utilities.
4 D.14-12-025 at 27.
- 5 -

A.15-05-002 et al. COM/MP6/ar9/lil PROPOSED DECISION (Rev. 1)
The end-product of each S-MAP proceeding will be a Commission decision on whether a particular risk assessment approach or model that a utility is using, or a variant or alternative model, can be used as the basis for each energy utility’s RAMP filing in its respective GRC. The S-MAP decision can also address whether uniform or common standards must be used by the energy utilities in their next S-MAP filings or direct the energy utilities to pursue this issue further.5
Consistent with Section (§) 963(b)(3) of the Public Utilities Code, the objective is to fulfill the state’s policy of ensuring that the Commission and each energy utility place the safety of the public and its employees as the top priority, and for the Commission to carry out this safety priority policy consistent with the principle of just and reasonable cost-based rates.6
As the Commission’s most recent GRC decision D.15-11-021 points out, the ultimate balance the Commission must strike is between safety and reasonable rate levels, or as expressed in that same decision, “between affordability and risk reductions.”7
As the precursor D.14-12-025 also emphasized, “It is our intent that the adoption of these additional procedures will result in additional transparency and participation on how the safety risks for energy utilities are prioritized by the Commission and the energy
5 D.14-12-025 at 30.6 D.14-12-025 at 25.7 D.15-11-021 at 13.
- 6 -
A.15-05-002 et al. COM/MP6/ar9/lil PROPOSED DECISION (Rev. 1)
utilities, and provide accountability for how these safety risks are managed, mitigated and minimized.”8
To achieve these objectives, the Commission stated that “such an evaluation and decision-making framework” should be “institutionalized as the standard practice by incorporating it into the RCP.” (R.13-11-006 at 7.)
2. Procedural Background On May 15, 2015, Pacific Gas and Electric Company (PG&E),
Southern California Edison Company (SCE), and the two Sempra Utilities companies, Southern California Gas Company (SoCalGas), and San Diego Gas & Electric Company (SDG&E), filed and served their respective S-MAP applications consistent with D.14-12-025.
On June 1, 2015, Mussey Grade Road Alliance (MGRA) filed a protest to the applications. On June 8, 2015, the Utility Consumers’ Action Network (UCAN), and The Utility Reform Network (TURN) filed protests.
On June 19, 2015, the Administrative Law Judge (ALJ) issued a ruling consolidating the four utility applications, providing a notice of Prehearing Conference (PHC) and workshop, and soliciting PHC statements.
A PHC was held on July 27, 2015, in San Francisco to establish the service list, discuss the scope of the proceeding, review categorization and need for hearing, and develop a procedural timetable for the management of this proceeding. Following the PHC, post-PHC comments were filed on August 10, 2016.
8 D.14-12-025 at 3, 10.
- 7 -

A.15-05-002 et al. COM/MP6/ar9/lil PROPOSED DECISION (Rev. 1)
On September 9, 2016, the assigned Commissioner issued a Scoping Memo addressing the scope of the proceeding and other procedural matters, and establishing the procedural schedule.
Consistent with D.14-12-025 directives and Scoping Memo objectives, between August 2015 and January 2016, Safety and Enforcement Division (SED) Staff conducted the following workshops:
1. Workshop #1 on August 3, 2015: a) Utility applicants presented their proposed risk
assessment modelsb) SED presented Cycla Corporation’s (Cycla’s) 10-step
risk management program evaluation criteriac) A working group was formed to develop a proposed
Risk Lexicon for this proceeding
2. Workshop #2 on September 20-21, 2015:a) Status update from Risk Lexicon Working Groupb) Consideration of common risk management
standards used for judging utilities’ risk management programs
c) Detailed discussion of utilities’ risk-informed decision-making approach
d) Detailed discussion of utilities’ risk modelse) Prioritization of mitigations, cost effectiveness,
optimization of portfoliof) Discussion of elements in risk models that should
be made uniformg) Data issues
3. Workshop #3 on October 6, 2015:a) Lexicon updateb) Utilities’ presentations on examples of
low-frequency, high-consequence events
- 8 -
A.15-05-002 et al. COM/MP6/ar9/lil PROPOSED DECISION (Rev. 1)
c) Discussion of sufficient levels of granularity in risk models
d) Discussion of whether factors besides safety should be used in determining risk rankings
e) Guidance on the RAMPf) Roadmap for future S-MAP proceedingsg) General comments about the S-MAP workshop
process
4. Workshop #4 on December 4, 2015:a) ALARP (As Low as Reasonably Practicable) White
Paper presented by Commission Staff Mr. Steven Haine
b) Presentation by Dr. Sam L. Savage, Executive Director of ProbabilityManagement.org and Consulting Professor from Stanford University on actual application of ALARP in real world setting1
c) Presentation on utilities' efforts to identify possible common risk assessment/management approaches2
d) Residual questions about RAMPe) General discussion of accountability reporting
At Workshop #4, Joint Intervenors TURN, Indicated Shippers (IS) and Energy Producers & Users Coalition (EPUC) requested an additional fifth workshop to provide an alternative approach to the utilities’ risk scoring approaches and the ALJ granted this request.
1 ALARP (As Low As Reasonably Practicable) refers to a risk management framework that is used to decide whether risk mitigation is needed, when it is needed, and how much should be spent before the benefits of mitigation are disproportionately outweighed by the additional cost.2 Combined Utilities’ S-MAP Uniformity Report, December 4, 2015.
- 9 -

A.15-05-002 et al. COM/MP6/ar9/lil PROPOSED DECISION (Rev. 1)
5. Workshop #5 on January 25, 2016:a) Joint Intervenor White Paper presented by Dr.
Charles D. Feinstein and Dr. Jonathan A. Lesser, consultants to Electric Power Research Institute (EPRI) on behalf of Joint Intervenors.3
On January 15, 2016, parties filed and served comments on the ALARP white paper pursuant to the ALJ’s ruling on December 28, 2015.4 Similarly, in response to an ALJ ruling on January 29, 2016, parties filed and served initial and reply comments on the Intervenor White Paper on February 15, 2016 and February 25, 2016.5
On March 22, 2016, the ALJ issued a ruling entering the March 2016 “Safety and Enforcement Division Evaluation Report on the Risk Evaluation Models and Risk-Based Decision Frameworks in A.15-05-002, et al” (Staff Report) into the record and seeking comments on the overall report (16 findings and 11 recommendations) and related scoping memo questions. Parties filed and served initial and reply comments on April 11 and April 25, 2016.
The SED Evaluation Report, Utility Uniformity Report, ALARP and Intervenor White Paper, official workshop reports, and extensive formal comments by parties in response to these deliverables provide
3 The Joint Intervenor White Paper introduced a “multi-attribute” scaling methodology that is capable of calculating “risk reduction” strategies, assessing the cost effectiveness of alternative risk mitigation strategies, and prioritizing the “safety” attribute apart from other attributes such as “reliability” and “compliance,”etc. For the purposes of this proceeding, members of the Indicated Shippers and the Energy Producers and Users Coalition include Aera Energy LLC, Chevron U.S.A. Inc., ExxonMobil Power and Gas Services Inc., Phillips 66 Company, Shell Oil Products US, Tesoro Refining & Marketing Company LLC and CRC Marketing, Inc. 4 http://docs.cpuc.ca.gov/PublishedDocs/Efile/G000/M157/K359/157359431.PDF.5 http://docs.cpuc.ca.gov/PublishedDocs/Efile/G000/M157/K902/157902742.PDF.
- 10 -
A.15-05-002 et al. COM/MP6/ar9/lil PROPOSED DECISION (Rev. 1)
the necessary content needed to address issues before the Commission in this proceeding.
3. Collaborative ProcessBefore the proceeding began, Commission staff met informally
with utilities to review expected filings and to urge consistency in format and direction. This was largely a successful initiative in that there is a high degree of conformity among the applications despite some individual differences in each utility’s approach. This early preparation and continued collaboration between staff, utilities, and other parties throughout this “expedited” proceeding has greatly contributed to the accomplishment of key objectives in a short period of time. We agree with staff that the Rulemaking has provided extensive opportunity for the Commission and Parties to review and attempt to understand the Utilities’ approaches. All parties agree that the S-MAP Program represents an ongoing evolutionary process that will continue to be refined in pending GRCs and successive S-MAP proceedings.
In this decision, we elevate and/or emphasize key topics that either expands or goes beyond what was covered in the March 2016 Staff Report.
More specifically, this decision:1. Emphasizes D.14-12-025 requirements because we
consider this decision an “implementation” or “compliance” decision. While the Commissioners can “override” D.14-12-025 and adopt current or slightly adjusted status quo indexing models, we assume this is not their intent. (Current utility indexing models do not use probabilistic risk analysis to calculate alternative risk reduction strategies.) In recent decisions, the Commission has made it clear that it expects more
- 11 -

A.15-05-002 et al. COM/MP6/ar9/lil PROPOSED DECISION (Rev. 1)
quantitative information to inform safety expenditure choices in the future.1 Therefore, the utilities’ current models do not meet Commission expectations.
2. Provides a more extensive discussion of key concepts such as the current Cycla 10-step model that measures the maturity of utility risk management approaches, the utility “7x7 matrix” that constitutes the current indexing method to assess risks, and the “building blocks” of probabilistic analysis, so that one can understand better the limitations of the 7x7 matrix (statement of the “problem”) and why the Commission seeks to implement a more quantitative approach to risk-informed decision making (statement of the “solution”). Not all stakeholders have an extensive knowledge base or solid grounding in managerial economics, probabilistic theory and statistical concepts which aids understanding of existing and alternative risk management models. Therefore, we spend more time on this important educational component by explaining key concepts in the first phase of this S-MAP. Comprehending these concepts enables decisionmakers to better understand the strengths and weaknesses of existing and proposed models.
3. Based on the record in this proceeding, reviews parties’ comments, adjusts Staff Report findings and recommendations, and adds more commentary and relevant discussion. Omission or lack of reference to Staff Report findings and recommendations does not indicate agreement or disagreement with any of them. Staff comments are incorporated in this decision where appropriate.
4. Places more emphasis on a discussion of the Joint Intervenor Model since it was not adequately represented in the Staff Report (presumably due to time considerations) and because it has potential for short-term application. Conversely, this decision places less emphasis on the ALARP Model since all parties
1 D.15-11-021 at 13.
- 12 -

A.15-05-002 et al. COM/MP6/ar9/lil PROPOSED DECISION (Rev. 1)
agree that it (i.e. establishment of “risk tolerances”) represents a longer term strategy in future S-MAPs. That being said, we can do some important “groundwork” now—i.e. determining constraints that utilities face pertaining to those risks that need to be managed by the Commission’s to be established risk tolerances.
5. Places more emphasis on “Potential Barriers to Effective Implementation” (e.g., shareholder versus ratepayer interests; questionable role of data versus subject matter expertise; lack of expertise and familiarity with models).
6. Adds a “Road Map” regarding how we can expect to migrate from relative risk scoring to optimized risk management and what we can expect to accomplish in the second phase of this proceeding and future S-MAP cycles. This decision directs parties to reconfirm and/or adjust the Road Map based on work accomplished in the second phase of this proceeding.
4. Issues Before the CommissionAs detailed in the Scoping Memo, the questions to be addressed
in this proceeding include: A. Promote Understanding1) Provide Commission staff and parties an
opportunity to analyze and understand the various models that energy utilities will use to prioritize safety in their GRC proceedings.
2) What are the common and different elements among the models, methodologies, and approaches that utilities use in their risk-based decision making?
B. Provide a Common Set of Definitions3) What direction can and should be provided to the
utilities regarding use of a common lexicon, or list, or related terms and conditions?
- 13 -

A.15-05-002 et al. COM/MP6/ar9/lil PROPOSED DECISION (Rev. 1)
C. Assess Common Standards4) What standards or elements should the
Commission require to be uniform or common among all the utilities’ models?a. How detailed should these standards and
requirements be?b. Should investor-owned utilities subscribe to a
certain body of risk-related standards, including Independent System Operator (ISO) 31000 and ISO 55001, asset management North American Electric Reliability Corporation bulk electric system, among others?
D. Improve Risk-Informed Decision-Making5) Do the utilities’ approaches and models adequately
prioritize safety risk; if not, how can they be improved?
6) Do the utilities’ models and approaches adequately prioritize risk mitigation measures based on cost-effectiveness; if not, how can they be improved?
7) Are Utilities' Executive and Senior Management sufficiently engaged in the Risk Management process? To what extent do Executive and Senior Management participate in the Risk Assessment and prioritization process, and in determining mitigation proposals and budgeting for them?
8) Are the utilities’ approaches and models adequate for use in their RAMP GRC submissions; and if not, how can they be improved? What guidance should be provided in S-MAP that will inform RAMP applications?
9) Should the Commission consider and adopt the Cycla 10-step evaluation methodology1 to gauge the
1 Cycla original 10-step process originally appeared as Attachment 3 in the May 16, 2013, report prepared by Cycla Corporation for PG&E’s Test Year-2014 GRC.
- 14 -

A.15-05-002 et al. COM/MP6/ar9/lil PROPOSED DECISION (Rev. 1)
robustness and maturity of a utility’s risk-informed resource allocation process to manage its risks? If not, what other alternative methodology should the Commission adopt?
10)What is the appropriate scope of consideration that should be included in the methodologies for scoring risks and mitigation proposals? In particular, should S-MAP models and RAMP filings be focused not only on safety considerations, but also other considerations such as reliability, financial impacts, etc.?2
11) What is the appropriate level of granularity of the risks and mitigation efforts that should be scored in the utilities’ models?
12) How should the utilities’ models reflect the degree of uncertainty regarding the inputs and results of the models?
13) What constitutes an interim and long-term plan to migrate from relative risk scoring for prioritizing tasks to a more quantitative method for optimized risk mitigation?
E. Reporting 14) What direction can and should be provided to the
utilities for the structure and detail of the two accountability reports required by D.14-12-025: the risk mitigation accountability report and risk spending accountability report?3
15) What direction can and should be provided to the utilities regarding developing, tracking, and reporting a set of performance metrics that are designed to measure the safety improvements achieved by the utilities?
2 See D.14-12-025 at 20.3 For a more complete description of these, see D.14-12-025 Section 3.5 “Verification and Annual Reporting” at 43-47.
- 15 -

A.15-05-002 et al. COM/MP6/ar9/lil PROPOSED DECISION (Rev. 1)
a. What is the status of data collection and how can it be improved over time?
b. What performance metrics should be developed for the first S-MAP and/or second S-MAP?
F. Benchmarking/Identify Industry-Wide Practices 16) What direction can and should be provided to the
utilities regarding the value of benchmarking to gauge effectiveness of risk management programs?a. What benchmarking elements/industry wide
practices should be developed in the first and/or second S-MAP?
The first S-MAP scoping questions were primarily resolved through a series of workshops and the formation of stakeholder working groups (e.g., Lexicon Working Group, Safety Performance Metrics Working Group), along with written comments and replies in response to workshop summaries and staff and intervenor proposals.
A discussion of these topics follows.
5. Context5.1. D.14-12-025 RequirementsAccording to D.14-12-025 and reference to an early “Straw
Proposal” recommendation, the first S-MAP “serves primarily an informational and education function to acquaint parties with the utilities’ models – and provides utilities an opportunity to hear reactions from Commission staff and parties and modify their models as they deem appropriate in response to Staff/parties’ concerns and recommendations.”1 This “promotion of understanding” goal is emphasized in the Scoping Memo for this proceeding as well.
1 D.14-12-025 at 22-23.
- 16 -

A.15-05-002 et al. COM/MP6/ar9/lil PROPOSED DECISION (Rev. 1)
5.2. Cycla 10-Step ApproachUsing a modified approach based on the 10-step process
developed by the Cycla to evaluate PG&E’s Test Year (or TY) 2014 rate case,2 SED Staff applied the same evaluation process to analyze the risk assessment models and the risk-based decision framework. The evaluation covers two primary aspects of the utilities’ S-MAP applications. First, the evaluation reviews the risk assessment portion. Then it reviews the risk mitigation and resource allocation decision framework. The evaluation incorporates all useful and relevant information gained from the workshops.
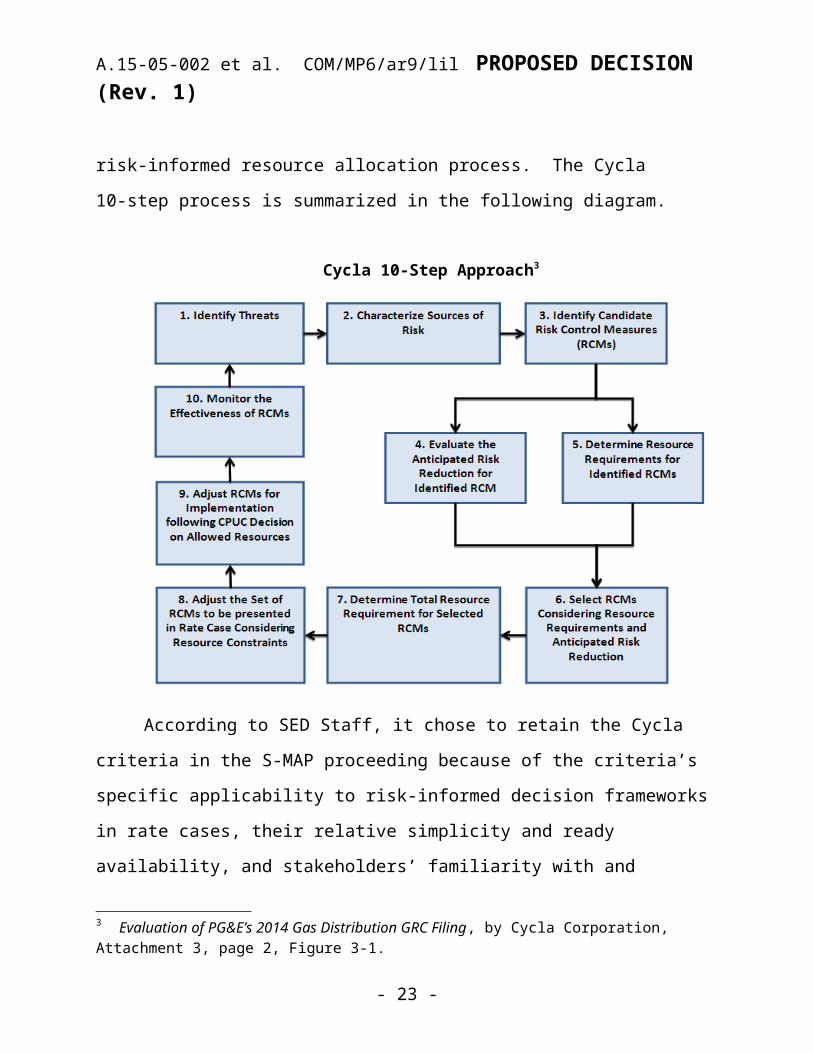
The primary focus of the Cycla criteria is on evaluating the reasonableness of the set of programs and projects presented by the utility to mitigate recognized risks. To accomplish this, the Cycla 10-step criteria are used to gauge the robustness, thoroughness, and maturity of the utility’s risk management program in the context of rate case proceedings by focusing on 10 key aspects (expressed as sequential steps on a flowchart) in the utility’s risk-informed resource allocation process. The Cycla 10-step process is summarized in the following diagram.
Cycla 10-Step Approach3
2 Evaluation of PG&E’s 2014 Gas Distribution GRC Filing, by Cycla Corporation, June 2014.3 Evaluation of PG&E’s 2014 Gas Distribution GRC Filing, by Cycla Corporation, Attachment 3, page 2, Figure 3-1.
- 17 -

A.15-05-002 et al. COM/MP6/ar9/lil PROPOSED DECISION (Rev. 1)
According to SED Staff, it chose to retain the Cycla criteria in the S-MAP proceeding because of the criteria’s specific applicability to risk-informed decision frameworks in rate cases, their relative simplicity and ready availability, and stakeholders’ familiarity with and acceptance of the criteria through their earlier use in previous Commission rate case proceedings. The method will gain in usefulness as utilities advance subsequent GRCs that are subject to the full Risk-Based Framework adopted in D.14-12-025 and refined in this and future S-MAP cycles.
SED Staff believes that, compared to PG&E’s risk model, the SCE and Sempra risk-based decision making frameworks are still in the nascent stages so any “grading” of these frameworks using the full Cycla model may be less productive. SED Staff further observes
- 18 -

A.15-05-002 et al. COM/MP6/ar9/lil PROPOSED DECISION (Rev. 1)
that most of the Cycla steps beyond the first two steps are not that meaningful in the absence of an actual rate filing. SED Staff believes that for this S-MAP an effective evaluation can be performed on risk calculation models without resorting to the specifics of the full Cycla process. In its evaluation, SED Staff focused on the first two steps.
In this evaluation, SED Staff gained valuable insights from five S-MAP workshops that aided their ability to evaluate the S-MAP applications. According to SED Staff, it used the Cycla 10-steps as a background document to guide its evaluation, but not as a rigid grading structure to evaluate the utilities’ risk frameworks.
In comments, all parties agree that the Commission should continue to use the Cycla 10-Step Evaluation method as a common yardstick for evaluating the maturity, robustness, and thoroughness of utility Risk Assessment and Mitigation models. The method will gain in usefulness as utilities advance subsequent GRCs that are subject to the full Risk-Based Framework adopted in D.14-12-025 and refined in this and future S-MAP cycles.
5.3. Risk Evaluation Formulas and High Impact Events
In order to compare the risk evaluation models, SED Staff modified the utilities’ original risk evaluation formulas to produce mathematically equivalent forms by using the same definitions for f (frequency), C (consequence), and W (weight).
Modified Equivalent Risk Evaluation Formulas
- 19 -
PG&E: RS = f(1/4) x [W1C1 + W2C2 + W3C3 + W4C4 + W5C5 + W6C6](1/2)
SCE: RS = f1C1 + f2C2 + f3C3 + f4C4 + f5C5 for each scenario Total RS = sum of all scenario risk scores

A.15-05-002 et al. COM/MP6/ar9/lil PROPOSED DECISION (Rev. 1)
Despite the similar appearance of the formulas, the risk scores are not comparable across the utilities. PG&E’s RET is a relative risk model that emphasizes high consequence events. Although SCE’s and Sempra’s models follow the traditional absolute risk formula (i.e. R = f x C), the scores they yield are also not comparable because the impact dimensions are different and the weights are also different. Additionally, SCE’s model sums individual scenario risk scores over multiple failure scenarios for the same asset or same incorrect operation, whereas Sempra’s and also PG&E’s RET are calculated for only one scenario at a time. SCE’s RET simply sums the contributions to the total risk score from all impact dimensions, whereas PG&E and Sempra apply percentage weights to the impact dimension index scores before summation. All three models map their risk scores to a 7x7 log-scale matrix.
SCE’s model uses the CP (consequence percentage) factor to denote the percentage of failure events that actually leads to safety-related results.
As the “Combined” Joint Utilities (SDG&E, SoCalGas, SCE, & PG&E) explain, “there are many areas where the combined utilities are regulated, yet each uses slightly different approaches for compliance.”4 For example, different utilities use different measures for reliability (e.g., SAIFI, SAIDI, CAIDI) and different utilities use
4 Uniformity Report at 13.
- 20 -
PG&E: RS = f(1/4) x [W1C1 + W2C2 + W3C3 + W4C4 + W5C5 + W6C6](1/2)
SCE: RS = f1C1 + f2C2 + f3C3 + f4C4 + f5C5 for each scenario Total RS = sum of all scenario risk scores

A.15-05-002 et al. COM/MP6/ar9/lil PROPOSED DECISION (Rev. 1)
different levels of confidence (e.g., 5-10%) in projecting commodity rates. Similarly, the utilities use different algorithms to determine where a particular risk will fall in the risk matrix. “Due to the fact that many of these assessments are subjective in nature, a proper calibration across the organization is important, and the ranking of risks reflects differences in calibration.”5 For this reason, each utility plans to use its own algorithm in the foreseeable future unless the Commission directs otherwise.
5.4. General Observations on Risk Scores In comments, at a high level, parties generally agree with SED
Staff’s preliminary findings on risk scores.The risk scores are not comparable across utilities. For the
risk scores to be comparable across utilities, the Commission would have to impose a uniform RET formula, with uniform definitions of frequency ranges, uniform impact dimensions, and uniform definitions of impact. The Commission would also have to require that calibration sessions be held across the utilities.
Furthermore, in order for the risk scores to be comparable across utilities of unequal sizes, the frequency and consequence scores would need to be adjusted based on company size.
None of the utilities’ models produce absolute risk scores at this stage of their evolution. The risk scores are either relative (PG&E model) or quasi-absolute (SCE and Sempra risk models).6 5 Uniformity Report at 13. 6 A “relative” risk score calculates the relative value of a risk in relation to other risks, but it does not have standalone meaning. A relative risk score only has meaning in terms of its ranking (or order) in relation to other relative risk scores. The magnitude of a relative risk score does not relate to the true magnitude of risk in a linear fashion. An “absolute” risk score is a representation of the magnitude
- 21 -

A.15-05-002 et al. COM/MP6/ar9/lil PROPOSED DECISION (Rev. 1)
Relative risk scores distort perception of the magnitude of a risk and are useful only for prioritization purposes but not optimization. The Commission could resolve this by imposing formulas that calculate linear-scale, absolute risk scores.
Risk evaluation formulas emphasizing high consequence events will not yield the same portfolio of risk mitigation activities compared to an approach using the traditional formula of risk = frequency x consequence. PG&E’s RET formula emphasizes high consequence events by applying a larger exponential power on the consequence term and produces a relative score that is not based on a traditional risk = frequency x consequence on a linear scale. The emphasis on high consequence risks can create a risk prioritization that differs from one based on linear-scale risk scores. There could be valid societal reasons for emphasizing high consequence events, but distortion in risk rankings due to this emphasis should be recognized.
Post publication of the March 2016 Staff report, SED staff observes that the utilities use two methods to emphasize high consequence events. The first method effectively, used only by PG&E, applies a larger exponential power to the consequence term in the risk formula. This method emphasizes risks that have a high average consequence if an event were to occur (e.g., corrosion on gas transmission pipes leading to an explosion in a congested area.) This
of risk based on a linear-scale risk formula, often expressed by risk = LoF x CoF. An absolute risk score may have direct physical interpretation if the scores are expressed in physical units (e.g., injuries/per unit of asset per unit time). An absolute risk score may also be expressed without physical units depending on how LoF and CoF are defined. These two definitions may be refined in Phase Two of the S-MAP proceeding.
- 22 -

A.15-05-002 et al. COM/MP6/ar9/lil PROPOSED DECISION (Rev. 1)
first method effectively places emphasis on the mean value of the distribution of potential consequence.
The second method the utilities’ models use to emphasize high consequence events is by evaluating the potential consequence at some “reasonable worst case” level, such as at the 95th percentile (or “P95”) of the consequence distribution, or some other similar specification. This latter method, used by all four utilities, emphasizes risks that have a wide range of potential consequence scenarios (e.g., high voltage overhead conductors making contact with one another or with trees under high winds). This second method effectively places emphasis on the standard deviation of the distribution of potential consequence.
Emphasizing high consequence events by applying a larger exponential power to the consequence term in the risk formula is not the same as emphasizing high consequence events by evaluating risk scenarios using a reasonable worst case, evaluating consequences at the 95th percentile (also known as “P95”) or similar consequence specification.
Joint Utilities opine, “All of the utility risk assessments focus on high consequence events.”7 Joint Intervenors agree with this assessment and SED Staff’s conclusion that “the disproportionate emphasis on low probability, high consequence events undermines the comparability of risk scores and defeats the goal of achieving an optimal portfolio of mitigations.”8
7 Joint Utilities’ Comments on Staff Report at 3.8 Joint Intervenors’ Reply Comments on Staff Report at 7-8.
- 23 -
A.15-05-002 et al. COM/MP6/ar9/lil PROPOSED DECISION (Rev. 1)
MGRA argues that the utility assertion that many high-consequence events deserve high risk scores is valid. However, they state, “Their method of artificially amplifying consequence with respect to frequency is flawed. Instead, consequence scores should accurately reflect all impacts and not just obvious impacts.”9 MGRA agrees with SED Staff that “modifying the traditional risk formula (risk=fxC) in order to emphasize high consequence events undermines the whole notion of using risk formulas and risk scores to evaluate risks.”
No party suggests that utilities should ignore low probability, high consequences such as wildfires. As Joint Intervenors point out, “The question is whether probabilistic risk assessment models should be distorted to address such events, thereby ignoring the ‘likelihood of failure’ [Lof] half of the risk equation.”10 Theoretically, the Commission and utilities could choose to deviate from model results, if justified or necessary, to address concerns with low probability, high consequence events.
In addition to SED Staff findings, we agree with parties’ additional observations:11
Common weights as well as common attribute ranges for each impact dimension are one possible approach to allow risk management models that can produce risk scores comparable across the utilities. Therefore, until this important developmental work is accomplished, we cannot currently compare risk scores across
9 MGRA Reply Comments on Staff Report at 7. 10 Joint Intervenors’ Reply Comments on PD at 4.11 For example, see Joint Intervenors’ Comments on SED Report at 20.
- 24 -
A.15-05-002 et al. COM/MP6/ar9/lil PROPOSED DECISION (Rev. 1)
the utilities even though there may be a strong case to do so. Parties have different opinions regarding whether we can calibrate risks across the utilities as risks may be perceived to be the same (or different) based on territories, “unique characteristics,” conditions, design and construction standards, equipment types, and business models, etc.
Direction from the Commission is necessary before any risk management model can result in the ability to compare risk scores across the utilities. For example, once common weights as well as attribute ranges for each impact dimension are established, the Commission should consider: 1) whether emphasis on high consequence events should be replaced with decreasing risk tolerance for high risk events. (The risk formulas could therefore follow the traditional aggregate risk formula (Risk = frequency x consequence) without any exponentials applied to the terms); and 2) whether risk scores should be comparable across utilities.
6. Common Set of Definitions or “Lexicon”6.1. D.14-12-025 RequirementsD.14-12-025 points out that there may not be a need for the
Commission to adopt a specific list of terms and definitions in the S-MAP so long as parties have a clear understanding of what is expected of them in the S-MAP and RAMP filings.1 However, parties who commented on the Lexicon proposal agree that having a common understanding or definition of certain terms that pertain to a risk-based decision-making framework will be useful.
1 D.14-12-025 at 48.
- 25 -

A.15-05-002 et al. COM/MP6/ar9/lil PROPOSED DECISION (Rev. 1)
6.2. Working Group RecommendationUtility applicants submitted a proposed risk lexicon in their
original applications. At the direction of the ALJ, a Risk Lexicon Working Group (RLWG) convened to further refine the risk lexicon for use in this proceeding. The RLAWG produced the following risk lexicon:
- 26 -

A.15-05-002 et al. COM/MP6/ar9/lil PROPOSED DECISION (Rev. 1)
Risk Lexicon Working Group Agreed upon Terms for Common LexiconTerm DefinitionRisk The potential for the occurrence of an event that would be desirable to avoid, often
expressed in terms of a combination of various outcomes of an adverse event and their associated probabilities. Different stakeholders may have varied perspectives on risk.
Inherent Risk The level of risk that exists without risk controls or mitigations.Event An occurrence or change of a particular set of circumstances that may have
potentially adverse consequences and may require action to address.Frequency Number of events generally defined per unit of time. (Frequency is often
incorrectly treated as synonymous with probability or likelihood).Probability The relative possibility that an event will occur, probability is quantified as a
number between 0% and 100% (where 0% indicates impossibility and 100% indicates certainty). The higher the probability of an event, the more certain we are that the event will occur. (Often informally referred to as likelihood or chance).
Impact (or Consequence)
The effect or outcome of an event affecting objectives, which may be expressed, by terms including, although not limited to health, safety, reliability, economic and/or environmental damage.
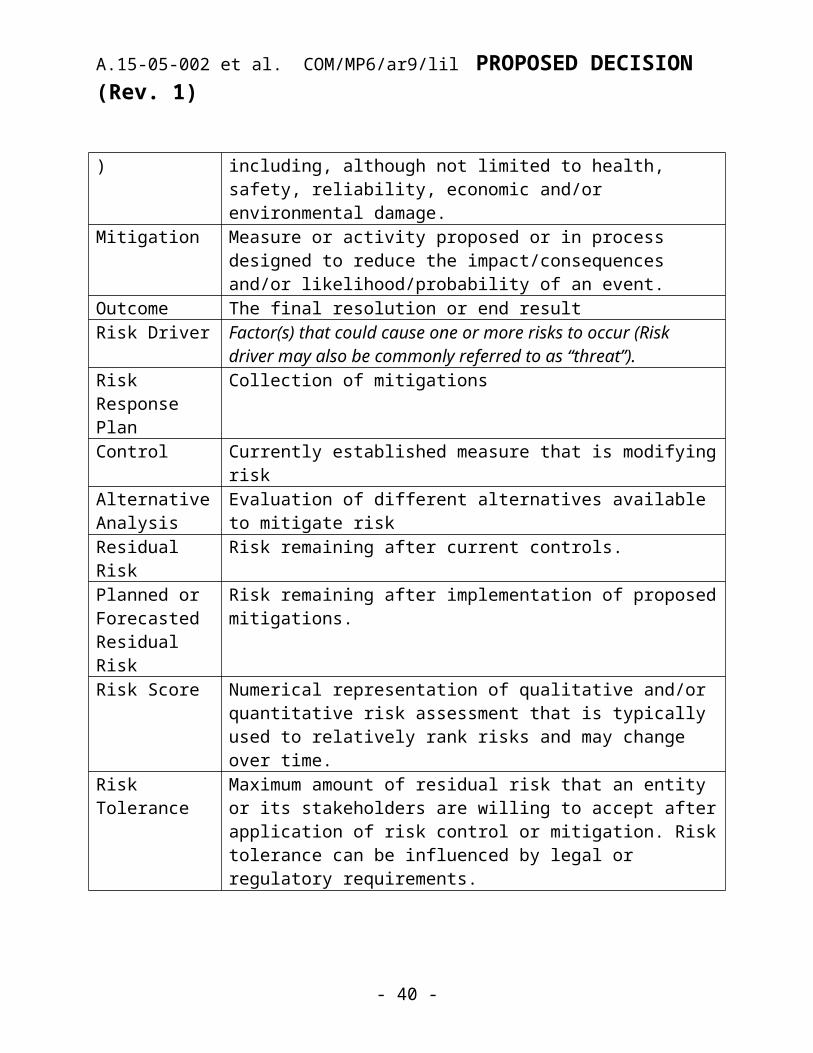
Mitigation Measure or activity proposed or in process designed to reduce the impact/consequences and/or likelihood/probability of an event.
Outcome The final resolution or end resultRisk Driver Factor(s) that could cause one or more risks to occur (Risk driver may also be
commonly referred to as “threat”).Risk Response Plan Collection of mitigationsControl Currently established measure that is modifying riskAlternative Analysis
Evaluation of different alternatives available to mitigate risk
Residual Risk Risk remaining after current controls.Planned or Forecasted Residual Risk
Risk remaining after implementation of proposed mitigations.
Risk Score Numerical representation of qualitative and/or quantitative risk assessment that is typically used to relatively rank risks and may change over time.
Risk Tolerance Maximum amount of residual risk that an entity or its stakeholders are willing to accept after application of risk control or mitigation. Risk tolerance can be influenced by legal or regulatory requirements.
6.3. SED Staff RecommendationAs a result of further insights gained through review of the
usage of the lexicon terms, SED Staff proposes to modify the RLWG lexicon in two ways: (Staff Report at 32-35.)
The RLWG’s definition for “risk” conflicts with the intended meaning of the term “risk” as used by parties and the Commission in
- 27 -

A.15-05-002 et al. COM/MP6/ar9/lil PROPOSED DECISION (Rev. 1)
this proceeding. The RLWG’s definition for risk omits mention of the unique risk drivers (threats) that give rise to the adverse outcomes. The current RLWG definition does not distinguish between two risks with identical adverse outcomes and identical probabilities of occurrence but which are caused by two completely different sets of risk drivers. For example, internal corrosion and external corrosion on steel gas pipelines are different risk drivers. Just because they may possibly lead to identical probabilities of failure and identical consequences does not mean they are identical risks. It would be entirely incorrect to confuse a risk caused by internal corrosion with a risk caused by external corrosion, since they require completely different methods of risk mitigation. The only way to remedy this deficiency is to include risk drivers in the definition for risk.
In the RLWG’s lexicon, the term “likelihood” is mentioned and retired by being subsumed into the definition of “probability.” SED initially supported this approach in the RLWG’s lexicon, but as SED’s understanding of the usage of these two terms has evolved, SED now recognizes that probability and likelihood have distinct connotations and neither should be subsumed into the definition of the other.
Although the two terms have the same denotative meaning, probability connotes a more precise number obtained by the use of a probability distribution function to model the stochastic behavior of trigger events; whereas likelihood connotes an average value of the probability obtained from an SME estimate without the use of a probability function. With this distinction, if an SME estimated the parameters (either based on historical data or opinion) to describe a probability function to produce a probability value, then the term
- 28 -

A.15-05-002 et al. COM/MP6/ar9/lil PROPOSED DECISION (Rev. 1)
probability would be used. If an SME simply estimated a probability number without first going through the rigor of defining a probability function, then the term likelihood should be used instead of probability.
SED Staff believes that this distinction is relevant, for example, in the White Paper “Intervenor Perspective Regarding an Improved Methodology to Promote Safety and Reliability of Electric and Natural Gas Service in California” introduced by the Joint Intervenors (TURN, IS and EPUC), in which the SME estimated likelihoods are referred to as “probabilities” because the numbers are bounded between 0 and 1, just as true probabilities are. Simply because a likelihood number is bounded between 0 and 1 does not mean that this likelihood mirrors the same stochastic character between the two end points as true probability does.
For these reasons, SED Staff proposes the following lexicon to recognize these distinctions. The italicized portions highlight the changes made to the original RLWG lexicon.
SED Staff Proposed Risk LexiconRisk Lexicon Proposed by SED (modifications highlighted in grey)
Term DefinitionRisk The potential for the occurrence of an event that would
be desirable to avoid, often expressed in terms of a combination of risk drivers, a scenario in which risk drivers lead to various outcomes of an adverse event, and the associated probabilities of the outcomes. Different stakeholders may have varied perspectives on risk.
Inherent Risk
The level of risk that exists without risk controls or mitigations.
Event An occurrence or change of a particular set of circumstances that may have potentially adverse
- 29 -

A.15-05-002 et al. COM/MP6/ar9/lil PROPOSED DECISION (Rev. 1)
consequences and may require action to address.Frequency Number of events generally defined per unit of time.
(Frequency is often incorrectly treated as synonymous with probability or likelihood).
Likelihood The expected value of possibility that an event will occur. Likelihoods are point values estimated by subject matter experts and are not derived from probability functions. Likelihood is quantified as a number between 0% and 100% (where 0% indicates impossibility and 100% indicates certainty). The higher the likelihood of an event, the more certain we are that the event will occur.
Probability The relative possibility that an event will occur. Probability is quantified as a number between 0% and 100% (where 0% indicates impossibility and 100% indicates certainty). The higher the probability of an event, the more certain we are that the event will occur. (Often informally referred to as likelihood or chance. See Likelihood for distinction in usage between likelihood and probability).
Impact (or Consequence)
The effect or outcome of an event affecting objectives, which may be expressed, by terms including, although not limited to health, safety, reliability, economic and/or environmental damage.
Mitigation Measure or activity proposed or in process designed to reduce the impact/consequences and/or likelihood/probability of an event.
Outcome The final resolution or end resultRisk Driver Factor(s) that could cause one or more risks to occur
(Risk driver may also be commonly referred to as “threat”).
Risk Response Plan
Collection of mitigations
Control Currently established measure that is modifying riskAlternative Analysis
Evaluation of different alternatives available to mitigate risk
Residual Risk
Risk remaining after current controls.
- 30 -

A.15-05-002 et al. COM/MP6/ar9/lil PROPOSED DECISION (Rev. 1)
Planned or Forecasted Residual Risk
Risk remaining after implementation of proposed mitigations.
Risk Score Numerical representation of qualitative and/or quantitative risk assessment that is typically used to relatively rank risks and may change over time.
Risk Tolerance
Maximum amount of residual risk that an entity or its stakeholders are willing to accept after application of risk control or mitigation. Risk tolerance can be influenced by legal or regulatory requirements.
6.4. Parties’ CommentsBoth the Joint Utilities and CUE agree with the proposed
Working Group Lexicon, and the two proposed changes proposed in the SED Staff Report.
However, while both the Joint Intervenors and UCAN also support the proposed Working Group Lexicon, they do not agree with the two proposed SED Staff changes. The Joint Intervenors emphasize that the Risk Lexicon was the product of extensive discussions and the input of Staff with an end-goal of helping non-experts understand the terminology used during the RAMP and GRC proceedings. However, they argue that “the proposed two changes that SED Staff proposes do not have the benefit of this debate, and ultimately will result in additional confusion rather than clarity.”2 For example, they point out that “including the concept of ‘risk driver’ within the definition of risk does not clarify the idea that different mitigations will address different drivers of any given risk” and will likely result in more confusion.3
2 Joint Intervenors’ Opening Comments on Staff Report at 27. 3 Joint Intervenors’ Opening Comments on Staff Report at 27-28.
- 31 -

A.15-05-002 et al. COM/MP6/ar9/lil PROPOSED DECISION (Rev. 1)
The Joint Intervenors also do not support SED Staff’s proposal to differentiate between “probability” and “likelihood.” While “likelihood” is a value estimated by SMEs, “probability” is “more precise” and refers to a probability function. Joint Intervenors complain that SED did not provide a source for this statement and points to the Intervenor White Paper as an example why the definitions are important. Joint Intervenors contend that “clear attribution” of concepts including “source of data” should be required in the development of risk management methodologies or else confusion will result.
Similarly, UCAN states, “As a party to the Risk Lexicon Working Group, UCAN disagrees with SED Staff’s proposed changes because they are based on subjective review by SED Staff and have not been vetted by the RLWG.”4
MGRA did not participate in the RLWG activities. However, in their general comments about “risk tolerance,” Joint Intervenors suggest that there is confusion about the concepts of “acceptable probability” of an event occurrence and “tolerability,” which are unique concepts in the ALARP process.5
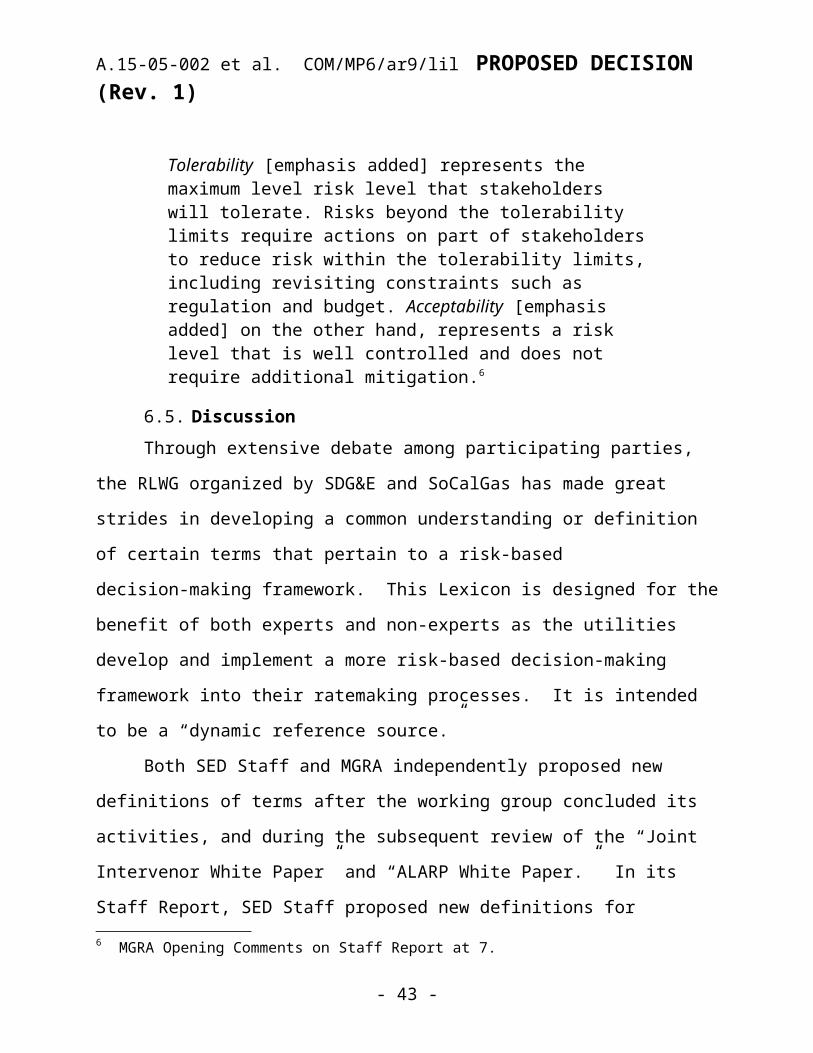
According to MGRA:
Tolerability [emphasis added] represents the maximum level risk level that stakeholders will tolerate. Risks beyond the tolerability limits require actions on part of stakeholders to reduce risk within the tolerability limits, including revisiting constraints such as regulation and budget. Acceptability [emphasis added] on the other hand, represents a risk
4 UCAN Opening Comments on Staff Report at 12. 5 MGRA Opening Comments on Staff Report at 7.
- 32 -

A.15-05-002 et al. COM/MP6/ar9/lil PROPOSED DECISION (Rev. 1)
level that is well controlled and does not require additional mitigation.6
6.5. Discussion Through extensive debate among participating parties, the
RLWG organized by SDG&E and SoCalGas has made great strides in developing a common understanding or definition of certain terms that pertain to a risk-based decision-making framework. This Lexicon is designed for the benefit of both experts and non-experts as the utilities develop and implement a more risk-based decision-making framework into their ratemaking processes. It is intended to be a “dynamic reference source.”
Both SED Staff and MGRA independently proposed new definitions of terms after the working group concluded its activities, and during the subsequent review of the “Joint Intervenor White Paper” and “ALARP White Paper.” In its Staff Report, SED Staff proposed new definitions for “likelihood,” “probability,” and “risk driver.” In response to the Staff Report, MGRA proposed new definitions for “tolerability” and “acceptability.” Joint Intervenors’ and UCAN’s arguments that these new terms should be vetted through the Working Group are persuasive. Ongoing “give and take” discussions among parties and stakeholders will help achieve both clarity and buy-in to proposed definition of terms. As the Workshop #2 notes suggest, such discussions address context, explanation and application of terms and theory versus practice. Workshop #2 notes acknowledge that challenging terms such as “likelihood” vs. “probability/chance” require further discussion for inclusion in the
6 MGRA Opening Comments on Staff Report at 7.
- 33 -

A.15-05-002 et al. COM/MP6/ar9/lil PROPOSED DECISION (Rev. 1)
Common Lexicon. There is no evidence in this record that such discussions among the parties have yet occurred.
Phase Two of this proceeding will address the intricacies of the alternative models and new insights may emerge about how to develop and refine a common language about these models. Therefore, in this decision we adopt the proposed Lexicon in which we have gained consensus so far and defer consideration of terms that have not been “tested” through working group discussions. Parties should have the opportunity to ask questions about proposed terms and their potential application, thereby promoting clarity among stakeholders as the S-MAP program moves forward.
7. Brief Overview of Utilities’ Risk Assessment Models and FrameworksIn this Section, SED Staff describes the utilities’ risk models and
risk decision frameworks contained in the utilities’ S-MAP applications. (The “complete” version, which provides more technical detail, is provided in Appendix A to this decision.) The descriptions that follow are not meant to be comprehensive, but are intended only to give highlights of elements that Staff deems to be important to point out in order to compare the different approaches employed by the utilities.
7.1. PG&E PG&E has advanced farther along the development and
experience curve of using risk calculating models than either SCE or Sempra. Although there have been minor improvements in the risk evaluation model since its first appearance in PG&E’s 2012 Test Year gas distribution GRC, PG&E’s risk evaluation model is still essentially
- 34 -

A.15-05-002 et al. COM/MP6/ar9/lil PROPOSED DECISION (Rev. 1)
unchanged and is still marked by many of the same problems that SED identified in the 2014 Test Year GT&S rate case.
PG&E’s risk-based resource allocation framework presented in this proceeding was developed from an enterprise and operations risk management (EORM) perspective. Operational Risk Management (ORM) is a subset of enterprise risk management (ERM), but PG&E’s application distinguishes ORM from the broader and higher level ERM and refers to the aggregate framework as enterprise and operational risk management.
PG&E is four years into its current risk management process and looks at the process as a continuing journey. The aim of this EORM framework is to make a risk management culture a company-wide conversation. Governance oversight is the hallmark of PG&E’s risk management program. PG&E has organized its risk management process into four main sessions:
1. Session D, where senior management is made aware of top enterprise risks and other main compliance issues.
2. Session 1, where discussions are held to consider strategies for managing line of business priorities, including plans to manage top risks.
3. Risk Informed Budget Allocation (RIBA), in which risk scores are calculated for all programs and projects in the operational lines of business capital and expense portfolios. Executive leadership is involved in the discussion at the end of this process.
4. Session 2, where resources are prioritized and allocated to execute the risk mitigation decisions resulting from RIBA.
The two main tools of PG&E’s risk management framework are the risk evaluation tool (RET) and the risk-informed budget allocation
- 35 -

A.15-05-002 et al. COM/MP6/ar9/lil PROPOSED DECISION (Rev. 1)
process (RIBA). RET was first presented to the Commission in PG&E’s Test Year 2014 GRC filed in 2012 (A.12-11-009). RIBA was introduced in the GT&S rate case proceeding (A.13-12-012) filed in 2013. Both RET and RIBA have gone through revisions and refinements since their initial appearance, but the essential shape and form of both RET and RIBA have remained unchanged.
7.2. SCESimilar to PG&E, SCE’s risk management framework is also
based on an Enterprise Risk Management framework. SCE’s ERM framework was derived primarily from the International Organization for Standardization (ISO) 31000 and, to a lesser extent, the Committee of Sponsoring Organizations of the Treadway Commission (COSO): 2004 Enterprise Risk Management.
SCE’s ERM framework follows a six-step approach, which, according to SCE’s testimony, corresponds to the Cycla 10-step process.
- 36 -

A.15-05-002 et al. COM/MP6/ar9/lil PROPOSED DECISION (Rev. 1)
Since SCE’s risk model and risk calculation framework as presented in this application have only been recently developed, they are still evolving and have yet to be implemented.
SCE’s risk model defines two groups of risks: asset-related risks and utility-wide risks. Asset-related risks are those that arise from physical assets and activities associated with the operation of the assets. Utility-wide risks arise from risks not associated with a particular asset, and include such risks as financial, economic risks, business model risks, legal and regulatory risks, compliance risks, and human resource risks.
SCE’s risk identification approach revolves around the listing of risk statements. A risk statement identifies: a risk event (e.g., a pole failure), an outcome (e.g., a wildfire), and the impact of the outcome (e.g., safety). SCE uses a “Bowtie diagram” to map the progression of multiple risk drivers to eventual multiple impacts.
Bowtie Diagram
Since there could be multiple outcomes for each risk event, SCE calculates a risk score across five impact dimensions (safety,
- 37 -

A.15-05-002 et al. COM/MP6/ar9/lil PROPOSED DECISION (Rev. 1)
reliability, environmental, compliance, financial) for each outcome without applying any weights across the impact dimensions. The total risk score for the risk event is calculated as the simple, non-weighted sum for all the different outcomes resulting from that failure event. Since the risk contribution from all 5 impact dimensions are summed without applying weights, each of the five impact dimensions is effectively given equal weight.
SCE’s also refers to its risk calculation formula as Risk Evaluation Tool (RET), but it differs from PG&E’s RET formula.
Risk Spend EfficiencyAlone among the utilities, SCE calculates a quantity known as
Risk Spend Efficiency (RSE) for each program or project. It is defined as risk reduction (difference between pre-mitigation and post-mitigation risk scores) divided by the cost of the risk mitigation program or project. Programs and projects are prioritized by the RSE numbers, subject to various operational constraints, and other non-risk considerations.
Since, as SED points out, the quasi-absolute risk scores have little to no direct physical interpretation in the real world, the relative RSE scores likewise have little to no direct physical interpretation. The RSE scores could, however, be very useful within SCE to inform decisions on mitigation activities. As part of its evolving risk-based planning approach, SCE intends to prioritize mitigation spending by taking RSE into consideration. SED cautions, however, that prioritizing a portfolio based on cost-effectiveness measures, such as the RSE, is not the same as choosing an optimal mix of mitigation activities based on some rigorous optimization routines. One in fact
- 38 -

A.15-05-002 et al. COM/MP6/ar9/lil PROPOSED DECISION (Rev. 1)
would expect that the results obtained by the two methods would not usually coincide. The information given by the RSE calculations could be useful but the limitations should be recognized.
Risk-Informed Planning Approach (RIPA)SCE is developing a RIPA to manage its enterprise level risks.
The objective of RIPA is to explicitly incorporate knowledge about risks into planning decisions. RIPA fits in SCE’s overall ERM process as the fifth step as shown in the following diagram:
RIPA uses input from risk scores and RSE scores to inform decisions to prioritize mitigation programs and projects. Since RIPA is an enterprise-wide tool, its use requires calibration across the whole enterprise to ensure common understanding and evaluation of different risks. SCE plans to pilot the RIPA process in the Transmission and Distribution (T&D) operating unit over the next rate case cycle.
7.3. SempraSimilar to PG&E and SCE, Sempra’s risk management
framework is also based on an Enterprise Risk Management framework that closely follows the ISO 31000 standards. The two
- 39 -

A.15-05-002 et al. COM/MP6/ar9/lil PROPOSED DECISION (Rev. 1)
Sempra utilities, SoCalGas and SDG&E, share the same basic approach to evaluating enterprise risks and have the same risk-based decision framework.
Sempra continues to develop and evolve its risk model and risk calculation framework. In the near term, Sempra intends to further develop its qualitative risk assessment processes, and in the long term it plans to achieve quantitative methods. It uses subject matter expertise that has been calibrated to fit its risk analyses and validates that expertise through supporting data.
Similar to SCE, Sempra has mapped its risk management steps to the Cycla 10-step process.1
1 From p. 4 of Sempra’s PowerPoint presentation during S-MAP workshop #1 on August 3, 2015.
- 40 -
A.15-05-002 et al. COM/MP6/ar9/lil PROPOSED DECISION (Rev. 1)
Sempra’s risk evaluation tool is also referred to as RET, but it, too, is different from PG&E’s formula. Sempra’s RET formula is stated as:
In this formula, impact is a logarithm-scale whole integer (1 to 7) index score of consequence.
Frequency follows a linear scale and is not modified by a logarithmic function. Sempra’s model chooses a fixed point from each of the seven log-scale ranges of frequency to represent a frequency within a frequency range.
Sempra’s risk model has four impact dimensions: Health, Safety & Environmental; Operational and Reliability; Regulatory, Legal & Compliance; and Financial. For convenience, we refer to these four broad categories by abbreviating them to safety, reliability, compliance, and financial. The safety impact dimension score receives a 40% weight. The remaining reliability, compliance, and financial impact scores each receive a 20% weight.
Whereas PG&E and SCE have distinct impact dimensions for safety and environment, Sempra takes a different approach by putting any impact touching “health, safety, and environment” under an overarching Safety dimension. Therefore, Sempra’s definition for the safety dimension is more inclusive but less completely oriented to safety. A case could be made that Sempra’s approach more fully captures safety because health, safety, and environmental quality are all tied together and all three parts affect safety. A case could also be made that Sempra’s approach diffuses the understanding of safety by
- 41 -
A.15-05-002 et al. COM/MP6/ar9/lil PROPOSED DECISION (Rev. 1)
including other characteristics. It is this overall safety impact dimension that receives a 40% weight in the total risk score. Regarding commonalities among the three utilities, this difference in categories is something to watch as the models evolve.
Sempra has recently communicated to SED that, similar to what PG&E does in its RIBA process, Sempra is also developing a process to evaluate risk scores for the risk mitigation programs and projects. The work-product for this development will not appear in this first S-MAP but will likely appear in future S-MAPs and may possibly even appear in Sempra’s upcoming GRC application.
- 42 -

A.15-05-002 et al. COM/MP6/ar9/lil PROPOSED DECISION (Rev. 1)
7.4. Comparison of Utilities Risk Management Frameworks
- 43 -
A.15-05-002 et al. COM/MP6/ar9/lil PROPOSED DECISION (Rev. 1)
PG&E SCE Sempra
Risk framework based on Enterprise Risk Management
yes yes yes
impact dimensions consider shareholder interests and/or financial performance
yes yes yes
predominantly SME-estimated inputs yes yes yesIndexing method on frequency score selection(whole integer-only inputs, 1 to 7)
partially yes, but allows for override with actual
frequency
no, uses continuous, linear-scale frequency
yes
Indexing method on consequence score selections (whole integer-only log-scale inputs, 1 to 7)
yes yes yes
number of frequency levels 7 7 7representative position within log-scale frequency range
right hand of rangenot applicable, uses
linear scale frequencyfixed point value from
each rangeallows for actual frequency data input where available
yes no no
model specifically considers asset condition on a per-asset element basis when determining frequency
nomodel has ability to
do sono
consequence evaluation standardbased on P95 (95th
percentile) "probably worst case outcome"
based on "worst reasonable direct
impact"not specified
number of impact (consequence) dimensions
6 5 4
number of levels per impact dimension
7 7 7
uses weights on impact dimensions yes no yes
impact (consequence) dimensions and weights
safety(30%), reliability(25%),
environment(5%), compliance(5%),
trust(5%), financial(30%)
safety, reliability, environment,
compliance, financial, (not weighted, risk
scores only summed)
safety(40%), reliability(20%),
compliance(20%), financial(20%)
linear scale risk score? no yes yesrelative or absolute risk score relative quasi-absolute quasi-absoluteconsequence scenarios in risk score single scenario multiple scenarios single scenariorisk formula emphasizes high consequence events
yes no no
takes into account threat interactions and their effects on frequency, impact, and impact dimensions
nono, but model does
not preclude possibility of it
no
takes into account mitigation overlaps on different risks and resulting synergies
nono, but model does
not preclude possibility of it
no
Risk framework calculates risk scores for programs and projects
yes yesunder consideration and
possible development
Other Areas
Comparison of Risk Evaluation Formulas and Risk Frameworks
Risk Management Framework
Input Type
Frequency
Consequence
Risk Scores
- 44 -

A.15-05-002 et al. COM/MP6/ar9/lil PROPOSED DECISION (Rev. 1)
8. Common and Different Elements Among Utility Models8.1. Utilities’ S-MAP Uniformity ReportUtilities conducted meetings on October 29 and 30, 2015, and
November 6, 2015, to discuss the common and different elements between the risk management approaches. The utilities discussed the frameworks used by each utility to assess and mitigate risks, and areas where common approaches were attainable. Utilities also reviewed risk scoring algorithms. During this exercise each company analyzed how the adoption of a common algorithm might affect its individual risk prioritizations.
Joint Utilities presented a “Combined Utilities S-MAP Uniformity Report” (Uniformity Report) during the fourth S-MAP workshop on December 4, 2016, and parties filed formal comments in response to the Uniformity Report on January 15, 2016. The Uniformity Report characterizes the changes the utilities can make in their models to move toward a more uniform approach, and the differences that the utilities plan to retain.
8.1.1. Utilities’ Risk Management FrameworkThe overall objective of the Joint Utilities was to identify
common practices and approaches to assess, manage, and mitigate public and employee safety and security risks. Based on workshops, it became clear to utilities that the overall risk frameworks employed by each company are substantially similar.
Throughout the GRC process, each company describes how it uses its risk management framework, practices, and approaches to address types of risk (risk categories). They include:
- 45 -

A.15-05-002 et al. COM/MP6/ar9/lil PROPOSED DECISION (Rev. 1)
Wildfire Gas Explosion Work Site accidents/employee, public, and
contractor safety Accident involving contact with electrified asset Blackout/major customer usage Data breach (e.g. cybersecurity).
As utilities emphasize: Even though there are differences in the size, financial capability, geography, commodities, structures and business processes of the utilities, each of the utilities has implemented processes and practices to address, where applicable, the risk categories noted above. Therefore, while there may be variances in approach, the end result, namely managing the right risks, is the same.1
For example, Joint Utilities contend that wind is the key driver of wildfire but that different conditions exist in different territories and may require different tools and methods used to assess and manage specific risk mitigations. According to Joint Utilities, “In Southern California, Santa Ana winds increase wildfire risk, but Northern California is not subject to this weather condition. In Northern California, high winds typically occur in winter and are often accompanied by rain, presenting less of a wildfire risk.”2
8.1.2. Common ElementsAs pointed out in the Staff Report, Joint Utilities discovered
common use of ISO 31000 risk management and ISO 55000 asset
1 Joint Utilities’ Uniformity Report at 6.2 Joint Utilities’ Uniformity Report at 13.
- 46 -
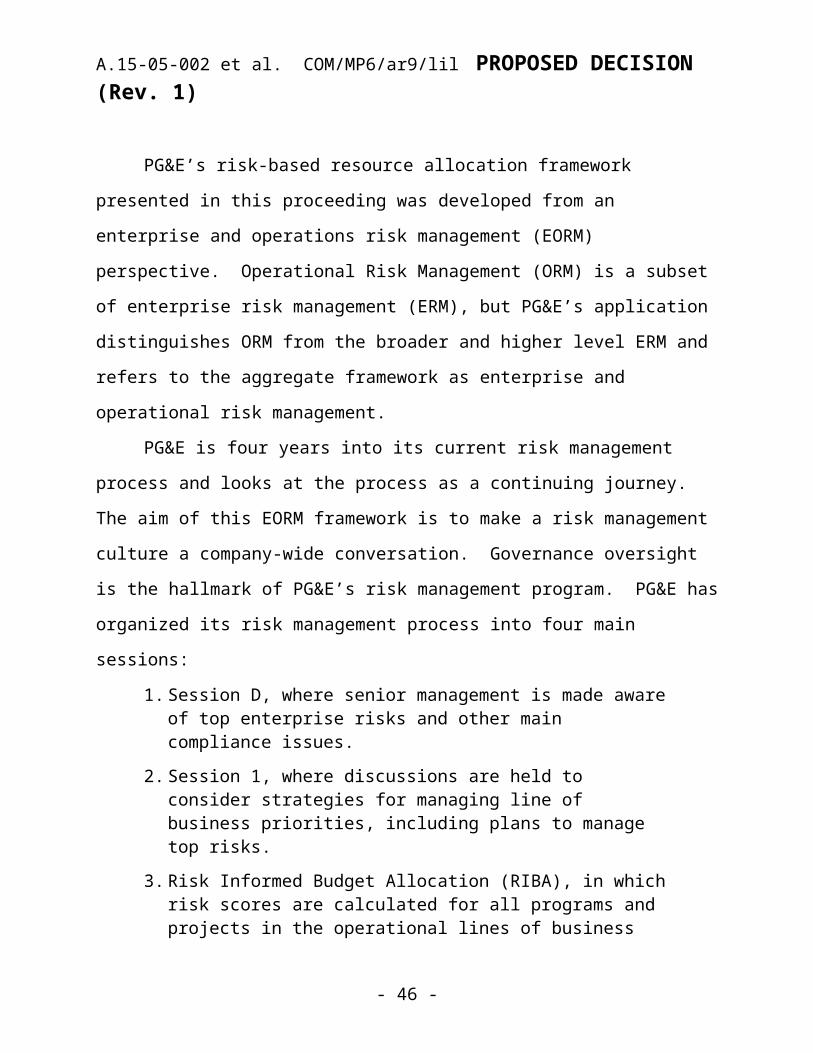
A.15-05-002 et al. COM/MP6/ar9/lil PROPOSED DECISION (Rev. 1)
management criteria.3 The utilities also found several areas where the workshop discussions led to additional agreement on uniformity, and where they changed their methods to make them more uniform.
Areas of commonality included: Cycla process (See Section 5.1 for a description and
introduction of the concept) 7x7 Matrix 7x7 Level Descriptors 7x7 Impact Categories 7x7 Likelihood Level Descriptors 7x7 Likelihood Criteria 7x7 Impact Criteria 7x7 Matrix Impact vs. Likelihood Absolute vs.
Continuous Values8.2. 7x7 MatrixWhat follows is the Joint Utilities’ explanation of the elements of
the 7x7 matrix that they used to address their risks. Over the last few years, the utilities have tested and discussed various matrices, including less granular versions. As a result, the utilities agreed to continue to use the 7x7 matrix. Because the issue of whether to continue use of the 7x7 matrix is a key issue in this proceeding, we spend more time here to explain what it is and its various dimensions that are subject to debate among the stakeholders.
3 ISO 31000 is an international standard on risk management. It consists of principles and generic guidelines and is published by the International Organization for Standardization (ISO). ISO 55000 and the related ISO 55001, ISO 55002 are a set of asset management standards comprising of principles, requirements, and generic guidelines. The standards enable an organization to achieve its objectives through the effective and efficient management of its assets.
- 47 -

A.15-05-002 et al. COM/MP6/ar9/lil PROPOSED DECISION (Rev. 1)
1. 7x7 Impact Level Descriptors
There were slight differences in the descriptions of the impact levels within the 7x7 matrices. Through discussions, the utilities agreed to standardize these descriptors in an effort to facilitate communications of the impacts of the various risks they manage.
1 2 3 4 5 6 7Negligibl
eMinor Moderate Major Extensive Severe Catastrophic
2. 7x7 Impact Categories
Based on individual differences, priorities and requirements, slightly different categories have been used for evaluating impacts within the 7x7 matrices. Despite those differences, all the utilities include impact categories pertinent to the risks the various GRC parties are concerned with (e.g., safety, reliability and environmental). Below are each of the utility’s impact categories as presented in their S-MAP testimonies:
PG&E: Safety, Environmental, Compliance, Reliability, Trust, and Financial.
SCE: Safety, Environmental, Compliance, Reliability, and Financial.
SoCalGas and SDG&E: Health, Safety and Environmental; Regulatory, Legal and Compliance; Operational and Reliability; and Financial.
3. 7x7 Likelihood Level Descriptors
Although the utilities had slight differences in describing the likelihood levels in their 7x7 matrices, through discussions, agreement was reached to standardize these descriptors in an effort to facilitate communications of the likelihood for the risks they manage.
- 48 -1 2 3 4 5 6 7
Negligible
Minor Moderate Major Extensive
Severe Catastrophic
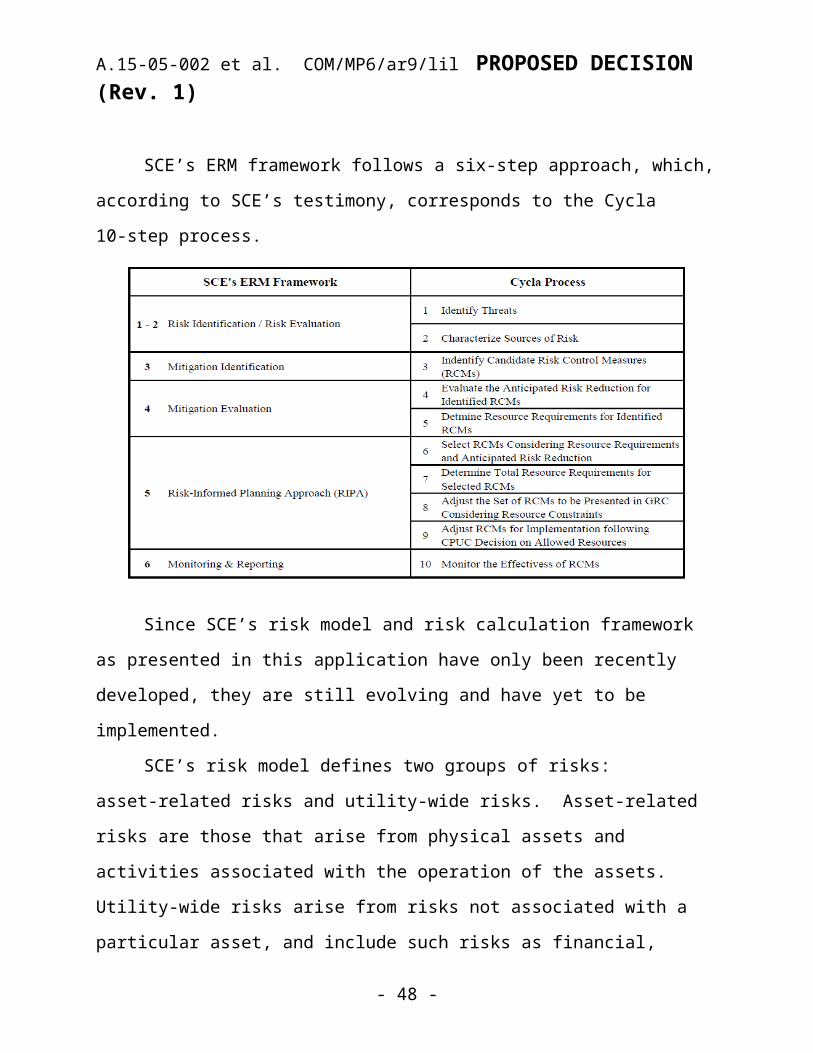
A.15-05-002 et al. COM/MP6/ar9/lil PROPOSED DECISION (Rev. 1)
4. Likelihood Criteria
Agreement was also reached to standardize the use of the same likelihood criteria for the various levels in their 7x7 matrices as follows:
1 2 3 4 5 6 7Negligibl
eMinor Moderate Major Extensive Severe Catastrophic
Once every 100+ years
Once every
30-100 years
Once every 10-30 years
Once every 3-10 years
Once every 1-3
years
1-10 times
per year
>10 times per year
5. 7x7 Impact Criteria
The criteria within each impact category cell reflects the individual demographics and systems of each of the utilities, which vary due to natural differences in operating environments, service territories and other factors. As such, the utilities will need to maintain flexibility to differentiate the levels of impact as deemed appropriate by the individual utility. For example, PG&E’s criteria for an extensive reliability impact varies from SoCalGas and SDG&E’s as seen below:
PG&E
Extensive(5)
Location: Impacts multiple critical locations or customers; orDuration: Disruption of service greater than 10 days; orCustomer Impact: Unplanned outage (net of replacement) impacts more than 10k customers; orEO: 100 thousand total customer hours, or more than 10 thousand MWh total load;GO: 100 thousand total customer hours, or reduction of capacity greater than or equal to 0.6 Bcf/d for seven monthsSoCalGas/SDG&E
Extensive(5)
> 50 K customers affected or impacts multiple critical locations or customers; substantial disruption of service greater 10 days.
- 49 -
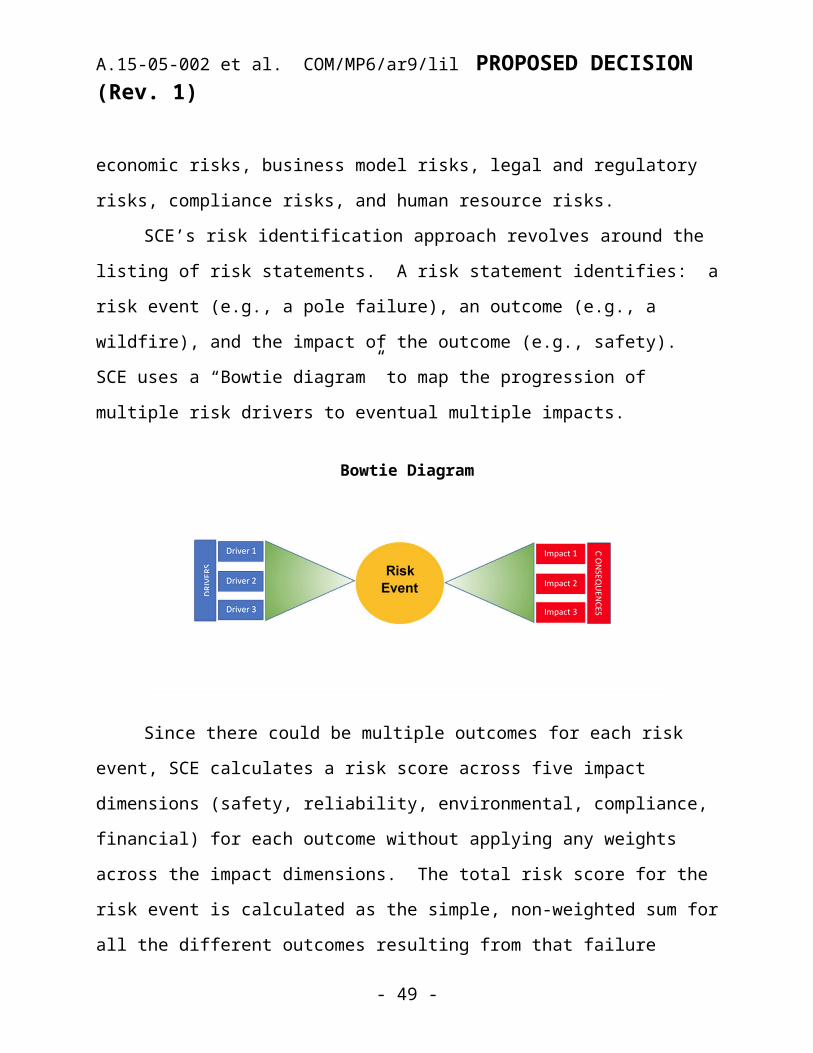
A.15-05-002 et al. COM/MP6/ar9/lil PROPOSED DECISION (Rev. 1)
Therefore, there was agreement that the impact criteria within each cell (1-7) of the 7x7 matrix should be defined by each utility.
However, there was agreement that each company shares the same safety concerns and, therefore, there was agreement to adopt common safety impact criteria as follows:
Impact Level DescriptionCatastrophic
(7)Fatalities: Many fatalities and life threatening injuries to the public or employees.
Severe(6)
Fatalities: Few fatalities and life threatening injuries to the public or employees.
Extensive(5)
Permanent/Serious Injuries or Illnesses: Many serious injuries or illnesses to the public or employees.
Major(4)
Permanent/Serious Injuries or Illnesses: Few serious injuries or illnesses to the public or employees.
Moderate(3)
Minor Injuries or illnesses: Minor injuries or illnesses to many public members or employees.
Minor(2)
Minor Injuries or illnesses: Minor injuries or illnesses to few public members or employees.
Negligible(1)
No injury or illness or up to an un-reported negligible injury.
6. 7x7 Matrix Impact vs Likelihood Absolute vs Continuous Values
Each of the utilities has adopted a different approach as to whether the values (1-7) within the cells of the matrix are either discrete or continuous.
- 50 -
Discrete ContinuousImpact SCE,
SoCalGas/SDG&EPG&E
Frequency/Likelihood SoCalGas/SDG&E PG&E, SCE

A.15-05-002 et al. COM/MP6/ar9/lil PROPOSED DECISION (Rev. 1)
The ultimate objective is to use continuous values, but the data available today and the quality of the data is not conducive to using continuous values. Therefore, there was agreement to maintain flexibility in applying the 7x7 evaluations based on the quantity and quality of data available.
Different ElementsAs previously discussed, the utilities also found areas of
uniqueness, on which they did not adapt their models toward commonalities:
Risk scoring algorithms Tools and Methods to Score Risk Categories (e.g. wildfire
risk)Elements for Future ConsiderationThe utilities also laid out areas for future consideration:
Risk toleranceAs will be discussed further in the ALARP framework, Joint
Utilities acknowledge the need for a risk tolerance framework that would allow the Commission and intervenors to develop their own perspective on each utility’s proposed risk tolerance. While some common approaches may exist, Joint Utilities believe that any risk tolerance determination needs to take into account demographic and system differences. This topic will be further reviewed in the “Alternative Approaches-ALARP Framework” section.
Risk reduction benefit per dollar investedJoint Utilities claim that currently “none of the present
implemented funding methods is currently capable of generating a
- 51 -

A.15-05-002 et al. COM/MP6/ar9/lil PROPOSED DECISION (Rev. 1)
risk reduction benefit per dollar invested.”4 However, with further discussions, utilities believe that some progress toward fulfilling this objective is possible by using the 7x7 matrix. “This potential approach would evaluate how various mitigation strategies at the risk level contribute to reduction of a specific risk.”5 Cross-risk prioritization of mitigations is more challenging and will take some time to develop.
Risk taxonomyJoint Utilities believe that they can achieve more standardization
in developing a comprehensive, common and stable set of risk categories across all of its operations and risk.
CommitmentIn general, the utilities support the Commission’s objective of
standardization. In the short-term, they support continued use of the 7x7 Matrix. In the long-term, they agree that future opportunities will allow more complex issues of risk tolerance and risk quantification to be addressed through dialogue and shared learning. They have agreed to continue to meet to explore the development of common standards that support movement towards implementing leading practices.
8.3. SED Staff Comments SED recommends that all common elements identified in
the “Combined Utilities S-MAP Uniformity Report” introduced in the S-MAP workshop on December 4, 2015, be adopted in this S-MAP. SED Staff believes that this exercise brought increased
4 Joint Utilities’ Uniformity Report at 14.5 Uniformity Report at 14.
- 52 -
A.15-05-002 et al. COM/MP6/ar9/lil PROPOSED DECISION (Rev. 1)
clarity to the proceeding and the parties, and can serve as a step in a long-term process of improving risk assessment models and optimizing mitigations.
In SED Staff’s opinion, more can be made common than expressed by the utilities in their Uniformity Report. For example, there is no unique geographical or operational reason why high consequence events are more important to PG&E than they are to SCE or Sempra. Consideration of high consequence events may be desirable, but it is counterbalanced by the distortion to human perception it creates to produce a non-linear-scale risk score formula. Any distortion in a risk evaluation formula renders the entire risk-based decision process less transparent. For this reason, SED Staff recommends against applying exponential powers to either the frequency or consequence terms in the risk formulas. Instead, SED Staff observes that downward sloping risk tolerance lines could be adopted as discussed earlier to force decreasing tolerance for high consequence risks.
Likewise, the Commission could decide whether a single scenario (PG&E’s and Sempra’s approach) or multiple scenarios (SCE’s approach) should be used to evaluate risk scores. The problem with the multiple scenario approach is that the resultant total risk score of all scenarios is influenced by the various scenarios that an SME can foresee. An imaginative SME could foresee more failure scenarios than one who is less imaginative.
SED Staff also asserts that utilities’ risk assessment models are still predominantly indexing models where Subject Matter Experts (SMEs) assign integer logarithm-scale scores to
- 53 -

A.15-05-002 et al. COM/MP6/ar9/lil PROPOSED DECISION (Rev. 1)
describe frequency and consequence rankings to produce risk scores. With the exception of PG&E’s nuclear operations, utilities’ risk evaluation models are based on a relative risk ranking approach. Despite the progress the utilities, particularly PG&E, have made over the last several years to improve their risk models, the risk score evaluation models presented by the utilities in this proceeding are still indexing models producing dimensionless relative risk ranking scores. There are many well-known limitations and drawbacks with indexing models. This finding should be interpreted as an observation rather than a criticism of the utilities since it has only been two years since the previous rate cases where this observation was made, and in this short period of time we do not expect the utilities to have been able to make any significant improvements in their data collection to deviate from the relative risk ranking models.
The indexing approach based on a logarithmic scale of integer scores creates significant distortion in perception of the true magnitude of frequency and impact variables and the resulting risk scores. Human perception of numerical magnitude is innately based on a linear scale.
8.4. Parties’ Comments Uniformity ReportAll parties, with the exception of the Joint Utilities, had
significant issues with the Uniformity Report. For example, in January 16, 2016 comments, IS and EPUC state, “Many of the uniformities included in the report reflect only very high level similarities between the utilities and do little to promote administrative efficiency. Unless the Commission requires more uniformity, the Commission and
- 54 -
A.15-05-002 et al. COM/MP6/ar9/lil PROPOSED DECISION (Rev. 1)
Intervenors will still be required to spend significant time and effort to understand the differences across utilities.”6 In addition, IS and EPUC assert, “Many of the uniform elements identified by the utilities reflect uniformity at the most superficial level in various categories.7 In the impact level descriptors (e.g., from “one,” to “catastrophic”), the utility has much discretion to describe the differences between each level. This makes it difficult to compare results and facilitate understanding across the utilities. In the safety category, utilities proposed descriptions of each impact level. However, the utilities have much discretion to determine the differences between each level. “What may constitute ‘few’ for one utility could be treated as ‘many’ for another.”8 The same injury might be viewed as either minor or serious depending on the utility, and further clarification of each descriptor is needed.
As to impact categories (e.g., safety, environmental, reliability, compliance, financial, etc.), there is no agreement on what the categories should be, which is a precursor to effective multi-attribute risk analysis. Utilities agree to use similar likelihood descriptors but further exploration may be warranted before likelihood measures are required. In sum, IS and EPUC believe that “these uniform elements identified by the utilities are best treated simply as a baseline, and in the interests of efficiency, the Commission ought to require additional uniformity across the utilities.”9
6 IS and EPUC Comments on Uniformity Report at 4-5. 7 IS and EPUC Comments on Uniformity Report at 5. 8 IS and EPUC Comments on Uniformity Report at 5. 9 IS and EPUC Comments on Uniformity Report at 6.
- 55 -
A.15-05-002 et al. COM/MP6/ar9/lil PROPOSED DECISION (Rev. 1)
IS and EPUC also contend that even though the utilities do not agree on a common risk algorithm, the Commission should provide further guidance in this area. They also do not think that the Commission should defer consideration of a risk reduction per dollar spent in the upcoming RAMP filing because SCE has already demonstrated that it is possible to calculate.
MGRA suggests that the Joint Utilities have made good progress in developing areas of commonality. However, they assert the IOUs can likely accomplish more in the areas of specific risk approaches (e.g., wildfire risk) and use of different scoring algorithms. As to wildfire risk, MGRA points out “the wildfire exposure of different electrical utilities depends on specific landscape and weather type and not upon which particular IOU service territory the risk occurs in.”10 While “Santa Ana” wind driven wildfire risk and Northern California vegetation-driven wildfire risk are distinct, they need not be specifically tied to a utility. To reinforce this point, why should “Santa Ana” SCE and SDG&E wildfires have different risk profiles? MGRA asserts, “To the extent that utilities have common assets and common environments, they should be able to develop common risk profiles specific to the environments and assets.”11
TURN also expresses strong reservations about the Uniformity Report. It observes, “In the Utility Uniformity Report, the utilities have proposed what can fairly be characterized as baby steps toward more uniformity in their risk models…But the utilities resisted making bigger steps toward uniformity, most notably declining to use the
10 MGRA Comments on Uniformity Report at 13.11 MGRA Comments on Uniformity Report at 13.
- 56 -

A.15-05-002 et al. COM/MP6/ar9/lil PROPOSED DECISION (Rev. 1)
same scoring algorithm.”12 TURN supports the concept of a uniform risk management methodology and touts the benefits, including “minimizing the amount of Commission and party resources to understand the work with disparate models and affording useful comparisons among the utilities.”13 Given the stated deficiencies in the utilities’ models, TURN does not advocate that “unsatisfactory” models be made uniform.
TURN observes that the utilities were slow to suggest when a risk reduction per dollar spent calculation could be worked out to provide a more common and transparent approach for evaluating risk mitigation effectiveness. Like MGRA and other parties, TURN rejects the utilities’ claims that “differences in their service territories or demographics counsel against requiring a common risk model.”14 The inputs and mitigation portfolio for each utility may be different, but the same model can be used. Instead of using the 7x7 matrix, TURN, IS, and EPUC present an alternative “Intervenor Approach” in Section 9 in which they discuss further flaws with the 7x7 matrix and recommend improvements to the utilities’ current models.
In comments on the Staff Report, the Office of Ratepayer Advocates (ORA) expresses strong views that “while not all aspects of all utilities will be comparable, the Commission should set a path toward greater commonality and comparability in the utilities’ risk assessment frameworks.”15 It supports the ability to be able to
12 TURN Comments on Uniformity Report at 3. 13 TURN Comments on Uniformity Report at 4. 14 TURN Comments on Uniformity Report at 4. 15 ORA Comments on Staff Report at 3.
- 57 -

A.15-05-002 et al. COM/MP6/ar9/lil PROPOSED DECISION (Rev. 1)
compare attributes such as safety, cost, reliability, and environmental aspects of risk between and among utilities. Like TURN, it points out the benefits including streamlining of Commission proceedings and providing greater clarity on risks (and the costs to mitigate them) to the Commission, parties, and the utilities themselves.
ORA agrees with many of the Staff Report findings including that none of the utilities have a way to optimize their portfolio in a mathematically rigorous sense;16 the indexing approach based on a logarithmic scale of integer scores creates significant distortion in perception of the true magnitude of frequency and impact variables and risk scores; a logarithmic scale is inherently non-intuitive (especially at intermediate or mid-range values), more difficult to understand than a linear scale, and can lead to skewed perceptions of risks and risk and risk mitigation. “The Commission should consider a shift from logarithmic to linear scales in a risk methodology development timeline.”17
In comments on the Staff Report, both Joint Intervenors and UCAN advocate that utilities should move away from the non-intuitive 1-7 logarithmic scales in favor of LoF that range from 0-1 and consequences of failure (CoF) that range from 0-100. In reply comments on the Staff Report, Joint Intervenors strongly argue that the Commission should reject the utility position and direct the parties to take additional steps toward uniformity in a second phase. They assert, “Additional delay of any discussion of uniformity will allow 16 “ORA notes as an illustrative example, that in response to discovery in the 2017 General Rate Case, PG&E stated: [PG&E] is not able to quantify the increase or decrease in safety associated with an increase or decrease in funding allocated to a given program or capital project.” ORA Comments on Staff Report at 3.17 ORA Comments on Staff Report at 4.
- 58 -

A.15-05-002 et al. COM/MP6/ar9/lil PROPOSED DECISION (Rev. 1)
PG&E and the other utilities to become further entrenched in current risk management practices, making future changes to those practices even more difficult to implement.”18
Indexing Models and Use of Subject Matter ExpertiseAt a high level, Joint Intervenors, UCAN, ORA, MGRA, and CUE,
agree with SED Staff’s finding that utilities’ risk assessment models are still predominantly indexing models where Subject Matter Experts (SMEs) assign integer logarithm scale scores to describe relative frequency and consequence rankings to produce risk scores. However, several parties take issue with some of the finer implications.
Joint Utilities suggest that SED Staff wrongly criticizes the utilities’ undue emphasis on the importance of subject matter experts and judgment in the early stages where there may be insufficient data to conduct rigorous analysis as part of the models. They contend that “SME expertise (i.e. human judgment) will always be part of this exercise, albeit less so as programs mature.”19 “Calibrated subject matter expertise is an essential component of developing the distributions used in risk analysis so, in the absence of complete data sets, (which there always will be), one has a starting place for determining the value of data relative to the overall risk assessment.”20 The issue of SME will be further discussed in context of the Intervenor Model evaluation in Section 9.
18 Joint Intervenors’ Reply Comments on Staff Report at 7. 19 Joint Utilities’ Comments on Staff Report at 8. 20 Joint Utilities’ Comments on Staff Report at 8.
- 59 -

A.15-05-002 et al. COM/MP6/ar9/lil PROPOSED DECISION (Rev. 1)
In contrast to SED’s finding, MGRA states, “We find the Staff’s Report’s concern with the use of logarithmic scales is inappropriate.”21
For instance, the report states that: The indexing approach based on a logarithmic scale of integer scores creates significant distortion in perception of the magnitude of frequency and impact variables and the resulting risk scores. Human perception of numerical is innately based on a linear scale.22
MGRA claims that “this isn’t necessarily an accurate statement. Where scales extend over very large ranges, the shorthand of a scale can be useful, and in fact such scales are common use in scientific and engineering communities.”23 MGRA explains this contention via a high profile public example: “In geology, the moment magnitude scale for earthquake size is a base-10 logarithmic scale, where an increase in magnitude of 0.67 corresponds to a ten-fold increase of released energy. A magnitude 7 earthquake releases 1000 times the energy of a magnitude 5 earthquake.”24
In response to SED staff’s claim, MGRA asserts: What is keenly important is not so much whether logarithmic or linear scales are used, but rather that a uniform definition of the scale is used and the appropriate mathematical values are applied when values are added, multiplied, or weighted. The appropriate choice of linear of logarithmic scale
21 MGRA Comments on Staff Report at 8. 22 SED Staff Report at 8. 23 MGRA Comments on Staff Report at 8. 24 MGRA Comments on Staff Report at 8. In comments, MGRA also cites other similar examples drawn from meteorology, physics, chemistry, and astronomy.
- 60 -

A.15-05-002 et al. COM/MP6/ar9/lil PROPOSED DECISION (Rev. 1)
depends on the type of information that is necessary to convey—whether a difference in linear or logarithmic scale depends on the type of information that is necessary to convey—whether a difference in linear value or a difference in scale is the most important.25
On the other hand, MGRA agrees with SED Staff’s observations that the utilities’ method of developing overall risk scores lacks any objective or absolute meaning. “The weights establish equivalence relationships among the impact dimensions. For example, if a utility’s formula uses 30% weight on safety impact and 25% weight on reliability, it in effect establishes that 30 units of safety impact are to be treated as equal to 25 units of reliability impact.”26 MGRA concurs that a common dimension be found to describe all impact dimensions, but disagrees that the scale on the impact dimensions must be linear.
In reply comments, Joint Intervenors reassert their position that “reliance on logarithmic likelihood and valuation scales or exponential risk scores is confusing and unnecessarily complex.”27 As examples, they point to errors that occur when logarithmic scales are used, such as inappropriate reliance on event frequencies rather than probability values and using logarithmic scales for consequences.28
8.5. DiscussionAs most parties acknowledge, the Joint Utilities have made
tremendous strides in discussing and documenting the common and 25 MGRA Comments on Staff Report at 5. 26 SED Staff Report at 9. 27 Joint Intervenors’ Reply Comments on Staff Report at 5. 28 Intervenor White Paper at 19-27.
- 61 -
A.15-05-002 et al. COM/MP6/ar9/lil PROPOSED DECISION (Rev. 1)
different elements between the risk management approaches and what should be considered in future S-MAPs (e.g., need for specific risk tolerance standard) consistent with scoping memo objectives. In a highly systematic manner, they compared their respective risk categories and risk management frameworks and made an effort to standardize the use of the Cycla 10-step process and 7x7 Matrix to assess and manage risk. It is significant to note that the utilities have spent years testing various matrices, so they have spent much time and energy to make these models work. In a sense they are “vested” in these models, answerable to the management of the utility, with minimal incentives to change their approaches unless directed by the Commission. While utilities admit the models aren’t perfect, they believe that they should be used for the foreseeable future and that any major changes should be deferred to the next S-MAP.
While these models appear similar on the surface, parties make a compelling case that these models do not go far enough in achieving S-MAP objectives. While utilities have made some small steps to provide comparable descriptors, impact categories, likelihood criteria, impact criteria etc., there are significant issues at the detail level to suggest that more can be done than expressed by the utilities in their Uniformity Report. For example, SED Staff and parties make a convincing argument that specific risk profiles for wildfire should be based on common assets and environments rather than utility location. Similarly, most parties agree that there can be further alignment on the use of particular impact categories (e.g., safety, environmental, reliability, compliance, financial, etc.) that would lead to a more effective implementation of multi-attribute risk analysis.
- 62 -

A.15-05-002 et al. COM/MP6/ar9/lil PROPOSED DECISION (Rev. 1)
More work can be done to develop a common risk algorithm, and uniform approaches to high impact events and single or multiple scenario analysis.
As to future considerations, because SCE already performs a calculation of a “risk reduction per dollar spent,” there is no reason that other utilities cannot follow suit, even if more common linear-scale risk formulas need to be adopted to support this goal. Similarly, there is no need to wait to develop a “taxonomy,” which will standardize a comprehensive, common and stable set of risk categories across all of a utility’s operations and risk.
We agree with parties that adopting a common framework will ultimately streamline proceedings, minimize the amount of resources and time devoted to understanding the intricacies of various models and provide useful comparisons. Therefore, we consider the Uniformity Report a reflection of the “status quo” or “baseline” upon which to build more uniform risk assessment and risk mitigation strategies. We only “approve” common elements highlighted in the report to the extent that they provide a “bridge” to more sophisticated and administratively efficient multi-attribute risk analysis, or other preferred alternative methods, which we will further explore in the second phase of this proceeding. In making the necessary transition to more mature approaches, we acknowledge that we may be creating “parallel paths” to support both existing status quo models and newer models that successfully enable prioritization of mitigations and a systematic approach to portfolio optimization.
- 63 -

A.15-05-002 et al. COM/MP6/ar9/lil PROPOSED DECISION (Rev. 1)
This will take extra time, resources, and possibly specialized training, to effectuate in the short-term. However, over time further benefits will be realized with continued commitment and persistence.
We appreciate the Joint Utilities’ commitment as expressed in the Uniformity Report that they will continue to meet with other utilities to explore further development of common standards that support movement towards implementing “leading practices” and addressing future opportunities for risk tolerance and risk quantification. Should utilities languish in this pursuit, any safety model assessment program will lose its momentum. Utilities could then become even more entrenched in conventional approaches, and not achieve the ambitious objectives explicitly laid out in D.14-12-025.
Without exception, parties agree that while there is need for a risk tolerance standard, this will take considerable time to develop and much groundwork must be laid before the Commission can establish standards and requirements in this area. (See Section 9 for a more thorough discussion of this topic.)
The Intervenor Approach, also introduced in Section 9, also provides a more expanded discussion regarding the limitations of the utilities’ current indexing methods and offers a proposed solution.
9. Alternative Approaches to Promote Uniformity9.1. D.14-12-025 RequirementsAccording to D.14-12-025, “the end-product of each S-MAP
proceeding will be a Commission decision deciding whether a particular risk assessment approach or model that a utility is using, or a variant or alternative model, can be used as the basis for each energy utilities’ RAMP filing in its respective GRC. The S-MAP
- 64 -

A.15-05-002 et al. COM/MP6/ar9/lil PROPOSED DECISION (Rev. 1)
decision can also address whether uniform or common standards must be used by the energy utilities in their next S-MAP filings, or direct the energy utilities to pursue this issue further.”1
The Commission also stated that “we need to require testimony in GRCs detailing the technical state of the utility system, giving a risk assessment of its physical and operational system as well as an assessment of its risk tolerance [emphasis added], identifying areas of low risk and high risk, providing underlying reasons for the assessments, as well as explaining the metrics underlying its analysis.” (R.13-11-006 at 7.)2
To support these key objectives of the proceeding, SED staff introduced an ALARP white paper at the December 4, 2015 workshop to address the lack of risk tolerance standards and the lack of a formal decision structure to decide when and to what extent mitigation activities must continue in a resource-constrained environment.3 At that workshop, Dr. Sam L. Savage, Executive Director of ProbabilityManagement.org and Consulting Professor at Stanford University, presented an illustration of the ALARP approach to utility risk mitigation strategies by using probabilistic simulation and optimization techniques. Dr. Savage later consulted with PG&E to experiment with the application of the discipline of probability management to their gas operations.4 1 D.14-12-025 at 30.2 D.14-12-025 at 5.3 Safety and Enforcement Division Staff White Paper on As Low As Reasonably Practicable (ALARP) Risk-informed Decision Framework Applied to Public Utility Safety, by Steven Haine, P.E., dated December 24, 2015. For more detail, see: http://docs.cpuc.ca.gov/PublishedDocs/Efile/G000/M157/K359/157359431.PDF.4 Joint Utilities’ Comments on Staff Report at 18 (Appendix 1).
- 65 -

A.15-05-002 et al. COM/MP6/ar9/lil PROPOSED DECISION (Rev. 1)
Subsequently, the Joint Intervenors (TURN, IS and EPUC) also introduced a white paper at the January 24, 2015 workshop authored by their two consultants on an alternative methodology to evaluate and rank risks in a more intuitively understandable and transparent fashion.5 According to SED Staff, both alternative approaches mention optimization of the portfolio of mitigation activities as a necessary end goal. These two alternative approaches are compatible with each other in that they both deal with different aspects of risk management approaches. Specifically, while ALARP is an overarching risk management framework, it does not contain any risk evaluation formulas or methodologies. ALARP must still rely on external risk evaluation tools in order for the framework to function. The Joint Intervenors’ model is a set of risk evaluation formulas and methodologies that can fill this role by operating under the umbrella of an ALARP framework.
9.2. ALARP Framework (Original SED Staff Report at 64-65 account is slightly enhanced
below in response to parties’ comments.) According to SED Staff who authored the ALARP White Paper,
ALARP is a systematic risk-informed decision framework used to decide whether risk mitigation is needed and, when it is needed, how much should be spent until the mitigation costs are deemed to be
5 Intervenors Perspective Regarding an Improved Methodology to Promote Safety and Reliability of Electric and Natural Gas Service in California, prepared for the S-MAP Workshop January 25, 2016, by Charles D. Feinstein, Ph.D. and Jonathan A. Lesser Ph.D. on behalf of The Utility Reform Network/Indicated Shippers/Energy Producers and Users Coalition, revised January 28, 2016. For more detail, see: http://docs.cpuc.ca.gov/PublishedDocs/Efile/G000/M157/K902/157902630.PDF.
- 66 -

A.15-05-002 et al. COM/MP6/ar9/lil PROPOSED DECISION (Rev. 1)
grossly disproportionate relative to the benefits. It is a framework used to address the tradeoff between safety and utility rate affordability.
There are three essential components in a full ALARP framework:
1. The upper and lower risk tolerance limit lines define three regions: the intolerable region, the ALARP region, and the broadly acceptable region.
2. The cost/benefit gross disproportionality ratio.3. “FN” curves (also known as loss exceedance curves).6 For a full ALARP framework to work, all three components have
to be present. Both the risk tolerance limit lines and the disproportionality ratio have to be established by regulatory action. However, the risk tolerance limit lines and the gross disproportionality ratio can be adopted separately or together. If only one component was adopted (i.e. either risk tolerance limits or gross disproportionality ratio), either component could still find application in the S-MAP proceeding outside of the ALARP framework.
The ALARP framework relies on external optimization routines to produce an optimal mix of risk mitigation activities.
The following is a high level graphical example of an actual ALARP framework:
6 The definition of frequency-fatalities exceedance curves, or FN curves is that for any threat that can affect public safety, an FN curve plots the frequency (measured in deaths/person-year) of accidents with N or more fatalities per year caused by that threat on the vertical axis against different values of N on the horizontal axis. In essence, an FN curve describes the accident causing potential (measured in frequency of N or more fatalities) of an identified threat, as that threat applies to a utility operator based on the operator’s unique circumstances.
- 67 -
A.15-05-002 et al. COM/MP6/ar9/lil PROPOSED DECISION (Rev. 1)
Realistic Basic ALARP Diagram
Following is a graphical representation of an exceedance or FN curve.
Representative Shape of a Typical FN Curve
- 68 -
Intolerable (or
unacceptable) region
Broadly acceptable region
Upper tolerability limit
line
Lower tolerability limit line

A.15-05-002 et al. COM/MP6/ar9/lil PROPOSED DECISION (Rev. 1)
Number of Fatalities (N)
10-3
Freq
uenc
y of
N o
r mor
e fa
taliti
es p
er y
ear
10-6
FN curve
A mathematical property of FN curves is that they are either flat or sloping downward as N increases but never upward sloping. An FN curve is typically shown on graphing paper with logarithmic scales on both the vertical and horizontal axes. An FN curve can be either derived from empirical accident data or represented by probabilistic models, which in turn are usually based on empirical data. Since an FN curve represents the potential physical risk to society at a fixed point in time, an FN curve can change shape or shift based on any circumstances that affect the calculation of risk. When an FN curve is constructed with the same units of measurement as an ALARP diagram, the two can be superimposed onto each other. (For more detail, see the ALARP White Paper.)
- 69 -

A.15-05-002 et al. COM/MP6/ar9/lil PROPOSED DECISION (Rev. 1)
FN Curve with ALARP Diagram Overlay
Intolerable region
ALARPregion
Broadly acceptableregion
Number of Fatalities (N)
Freq
uenc
y of
N o
r mor
e fa
taliti
es p
er y
ear
10-3
10-6
Initial FN curve
ApplicabilityIn the U.S., the ALARP principle has been employed by the U.S.
Army Corps of Engineers since 2009.7 8 The U.S. Nuclear Regulatory Commission has used a principle similar to ALARP since the 1950s to regulate exposures to radiation (where it goes by the name As Low As Reasonably Achievable, ALARA). In 1972 and 1977 the ALARA principle was adopted into two U.S. federal regulations (10 CFR 835
7 Interim Tolerable Risk Guidelines for US Army Corps of Engineers Dams: http://www.nfrmp.us/TRG2010/docs/USSD_2009_Corps_Tolerable_RisK_Dam_Safety_10_Feb_09.pdf. 8 U.S. Army Corps of Engineers, Best Practices in Dam and Levee Safety Risk Analysis - Public Risk Tolerance and Risk Guidelines.
- 70 -
A.15-05-002 et al. COM/MP6/ar9/lil PROPOSED DECISION (Rev. 1)
and 10 CFR 20) to regulate radiation exposures at Department of Energy and NRC-regulated facilities.9
Except for use in the nuclear industry and by the U.S. Army Corps of Engineers, the ALARP principle has yet to see wide usage in the U.S. However, a primary component of the ALARP framework involving cost/benefit analysis to compare the incremental cost of risk reduction measures against the monetized value of a statistical human life saved by these measures has long been used by several federal government agencies, including the Department of Transportation, the Environmental Protection Agency, and the Federal Drug Administration.
Pros of ALARP Framework1. It forces recognition of tradeoff between safety and rate
affordability.2. It treats the tradeoff between safety and rate
affordability in an explicit way.3. It forces explicit recognition of risk tolerance.4. The downward sloping risk tolerance limit lines
automatically reduce tolerance for high risks (including both high consequence risks and high frequency risks) as the risk value increases, without needing to artificially boost only the consequence term in the risk evaluation formula.
Cons of ALARP Framework1. A full ALARP framework relies on building probabilistic
models to construct the loss exceedance curves (but a partial ALARP approach can make use of the risk
9 10 CFR 835 “Occupational Radiation Protection” regulating ALARA in DOE facilities; and 10 CFR 20 regulating ALARA facilities licensed by the NRC as prescribed by 10 CFR part 50, and Part 52 and Part 70 –ANS Local Section Address Eric P. Loewen, 2011; refers to the commercial nuclear power plants, food irradiation facilities, medical facilities that handle radiation sources.
- 71 -

A.15-05-002 et al. COM/MP6/ar9/lil PROPOSED DECISION (Rev. 1)
tolerance limits and/or the disproportionality ratio without involving probabilistic models).
2. A full ALARP framework relies on explicit estimation of the value of statistical live (VSL).
3. It relies on explicit statements of risk tolerance.Barriers to Implementation (some overlap with “cons”
above)1. Need to place a value on a statistical life.2. Regulator and stakeholder unfamiliarity with models
that requires some understanding of probability and statistical concepts.
3. Lack of data and deficiencies in quantitative models. 4. ALARP requires an explicit statement of risk tolerance,
stated in the form of the upper and lower risk tolerability limits in the ALARP diagrams.
5. Absent more robust quantitative risk models, it would be difficult to attribute an incremental benefit to any particular threat and any particular mitigation control measure associated with that threat. (For example, leak survey is one type of risk mitigation but the total benefit must somehow be apportioned to all threats that have benefited from the leak survey, including for example, internal corrosion, external corrosion, stress corrosion cracking, earth movement, etc.
6. Regulators’ “no accidents” expectation does not conform with reality.
9.3. SED Staff Comments SED Staff asserts that the As Low As Reasonably Practical
(ALARP) framework is a valuable alternative risk assessment approach or model for consideration by the Commission. ALARP is an overarching framework meant to be used in conjunction with whatever RET that a utility may use (including the Joint Intervenors’
- 72 -

A.15-05-002 et al. COM/MP6/ar9/lil PROPOSED DECISION (Rev. 1)
proposed approach). ALARP tends to be more useful in the longer horizon as the models mature and can incorporate more fully probabilistic approaches. However, the risk tolerance and gross disproportionality concepts in ALARP can be used even in the absence of fully probabilistic approaches. The downward-sloping risk tolerance limit lines in ALARP automatically emphasize avoiding high severity risks without needing to artificially boost the consequence term in the risk formula.
As stated in previous Section 8 “Common and Different Elements Among Utility Models,” there is no specification of risk tolerance. Risk tolerance, as further explained in this section, is not explicitly considered in any of the utility applicants’ risk calculation models or risk-based decision frameworks. The utilities expressed in the workshops that their proposed programs/projects and proposed expenditures “imply” the individual utility’s level of risk tolerance. There are two problems with this assertion.
By failing to provide an explicit specification of risk tolerance, the utilities are handicapping the ability of other stakeholders to make an informed decision as to whether the utilities’ rate case proposals would have the desired risk reduction effect in relation to the desired level of risk tolerance. By failing to provide an explicit risk tolerance, the utilities would in effect be asking the stakeholders to accept in blind faith that the proposed programs and projects are necessary and sufficient (and no more than necessary or sufficient) to mitigate the risk down to a level that the utilities can tolerate, whatever that level is. No stakeholder would be able to verify this because the risk tolerance is not specified. This problem is compounded by the fact
- 73 -

A.15-05-002 et al. COM/MP6/ar9/lil PROPOSED DECISION (Rev. 1)
that, except in the case of PG&E’s nuclear operations, their risk assessment models are a mixture of relative risk ranking models, where the scores produced by these models have no physical interpretation in the real world.
To some degree, this problem has been ameliorated by the utilities’ use of performance metrics, benchmarks, industry best practices, and other performance measures in relation to industry peers in deciding their risk mitigation activities. However, measuring risk mitigation performance relative to metrics, benchmarks, industry best practices, and industry peers is not equivalent to providing an explicit risk tolerance, since these measures still provide at best only an implied level of risk tolerance.
SED Staff’s “number one” recommendation is that the Commission should adopt explicit risk tolerance standards. Consideration of risk tolerance is integral to risk management. The concept of risk tolerance is a sensitive subject in an atmosphere where the public has little appetite for anything less than perfect safety. What the general public may not always be conscious of is the tradeoff between unrealistically high expectations of safety and utility rate affordability. The moment the Commission embarked on a risk-based approach to safety, it implicitly recognized that absolute safety rarely exists within a finite safety budget. The Commission should therefore confront the issue by making an explicit recognition of this tradeoff and defining acceptable levels of risk tolerance.
Consideration of risk tolerance could be part of the larger picture to consider whether an ALARP approach should be adopted. The Commission should consider addressing whether explicit risk
- 74 -

A.15-05-002 et al. COM/MP6/ar9/lil PROPOSED DECISION (Rev. 1)
tolerance standards should be set for the utilities in their rate cases. The failure to adopt explicit risk tolerance standards will hinder the utilities’ ability to apply optimization techniques to their risk mitigation portfolios.
9.4. Parties’ CommentsWhile parties are quick to point out the conceptual value of
establishing a risk tolerance standard, they tout practical barriers to implementation that preclude immediate adoption of it. As Dr. Sam Savage pointed out at the December 4, 2016 workshop, “adopting the ALARP framework without addressing all of the other considerations (e.g., quantification of risk, model development and utility industry complexities) was like building the 50th floor of a building without the constructed floors 1-49.”10 Joint Utilities list a number of issues, too numerous to mention here, associated with the ALARP framework including the claim that implementing it will drive up rates since expensive models must be built to accurately represent FN curves (e.g., Probability Risk Assessment, Fire Risk Mitigation, Calibration of Subject Matter Expertise, Asset Life Cycle Analysis). They point out that the approach has had limited application in the United States or regulatory context similar to the Commission framework. It will take considerable discussion to create a process for determining the threshold at which risk becomes tolerable or intolerable. The White Paper does not make clear when a “hazard” is beyond the control of the utility (e.g., drought). Setting tolerable lower limits and the associated risk mitigation activities may be difficult in a dynamic environment. The ALARP White Paper does not address the
10 Joint Utilities’ Comments on ALARP White Paper at 1-2.
- 75 -

A.15-05-002 et al. COM/MP6/ar9/lil PROPOSED DECISION (Rev. 1)
problematic policy issue that “all risks/threats are not equal” and do not represent the same level of risk to the public.11
As shared in its Uniformity Report:1) Utilities cannot themselves establish an acceptable risk
tolerance level for ratemaking purposes; intervenors and regulators must be involved.
2) Risk management calculations included in rate proceedings need to be readily communicated and understood by all parties.
3) A value to measure the risk tolerance level should be acceptable to all stakeholders. An explicit Value of Statistical Life used in the ALARP White Paper is not appropriate for this purpose.
4) Adoption of risk tolerance standards will not be quick. The timeline for implementation of any risk tolerance method needs to be realistic and align with the abilities and resources of all stakeholders.12
Joint Utilities support the use of “lost exceedance” curves in ratemaking and claim that they are a useful tool to use within the context of probabilistic risk analysis. (See the Joint Utilities’ Comments on ALARP Paper “Example Loss Exceedance Curve with Risk Tolerance” at 9 as follows.)
11 Joint Utilities’ Comments on ALARP White Paper at 2-4.12 Joint Utilities’ Comments on ALARP White Paper at 4. For a more detailed technical comments on the ALARP paper, see pages 7-13.
- 76 -
A.15-05-002 et al. COM/MP6/ar9/lil PROPOSED DECISION (Rev. 1)
Joint Utilities object to SED Staff’s claim that “By failing to provide an explicit risk tolerance, the utilities would in effect be asking the stakeholders to accept in blind faith that the proposed programs and projects are efficient. While we are striving to establish a more quantified risk tolerance, it is incorrect to suggest that ‘blind faith’ is expected.”13 CUE touts the limitations of ALARP when it states that “the flaw which prevents moving from the appealing concept in the title to driving specific decisions is the lack of data needed to quantify in monetary terms all the benefits of avoided risks.”14 CUE highlights some of the issues associated with using the Value of Statistical Life to measure loss. “But beyond these easily quantified areas, we should exercise enough humility to recognize
13 Joint Utilities’ Comments on Staff Report at 2.14 CUE Comments on ALARP White Paper at 2.
- 77 -

A.15-05-002 et al. COM/MP6/ar9/lil PROPOSED DECISION (Rev. 1)
that it is a fool’s errand to try to quantify all the inherently unquantifiable effects of an unsafe or unreliable utility system.”15
IS Shippers and EPUC also agree that barriers to ALARP adoption are significant and “make short-term adoption impossible and long-term implementation of the principles unlikely.”16 They also agree with the Joint Utilities that “the more difficult task is the assignment of a value to human life” and “the public perception and political difficulties in assigning an explicit value of this nature ultimately makes it unlikely that the Commission, intervenors or the utilities will have any appetite to define the concept.”17 They contend that there are other approaches to risk management that may not have as many hurdles to adoption. “While the ALARP and multi-attribution optimization complement one another, it is not as the Staff White Paper acknowledges, necessary to adopt ALARP in order to implement multi-attribute optimization methods.”18 They too agree that the Commission should set ALARP aside and focus on other short-term solutions, such as the adoption of multi-attribute optimization, to improve risk management methodologies.
TURN echoes the same themes when it refers to major challenges including the “difficult, and likely controversial decisions about such matters as: levels at which risks are deemed tolerable; appropriate ratios for determining when costs of mitigation ‘grossly and disproportionately’ exceed benefits; and monetizing the value of
15 CUE Comments on ALARP White Paper at 4. 16 IS and EPUC Comments on ALARP White Paper at 3. 17 IS and EPUC Comments on ALARP White Paper at 3. 18 IS and EPUC Comments on ALARP White Paper at 4.
- 78 -

A.15-05-002 et al. COM/MP6/ar9/lil PROPOSED DECISION (Rev. 1)
human lives and injuries.”19 TURN suggests that “perhaps more important, a key limitation of ALARP, is that by itself it does not determine the optimum mix of mitigations in light of limited funds and limited constraints.”20 ALARP does not select “optimum.” “ALARP only tells an operator whether enough has been spent on risk mitigation. ALARP does not specify what precise mitigations to use or how quickly to apply risk mitigation.”21
In tandem with ALARP, “optimization” is necessary to “1) minimize total cost at fixed level of total risk reduction, 2) maximize total risk reduction at fixed portfolio cost, or 3) to produce some other optimal outcomes subject to constraints.”22 If the Commission wants to be effective, then it should focus on a systematic approach to optimizing risk reduction in light of available resources. “Focusing on getting the utilities to adopt risk management models that allow such ranking and optimization of mitigations is a higher priority than implementing the ALARP framework.”23
TURN also suggests that a key developmental step to achieve for both ALARP and portfolio optimization is the probabilistic modeling of risk. “The ‘FN’ curves that are central to the ALARP framework are dependent on probabilistic models to estimate frequency of accidents and number of deaths or injuries, which are similar to the concepts of likelihood of failure (Lof) and consequences of failure (CoF) used in
19 TURN Comments on ALARP White Paper at 1-2.20 TURN Comments on ALARP White Paper at 2. 21 TURN Comments on ALARP White Paper at 2.22 TURN Comments on ALARP White Paper at 2. 23 TURN Comments on ALARP White Paper at 2.
- 79 -

A.15-05-002 et al. COM/MP6/ar9/lil PROPOSED DECISION (Rev. 1)
utility models.”24 Similarly development of probabilistic models will aid a key step in portfolio optimization—measurement of risk reduction from a given mitigation. The Commission can work on both ALARP and portfolio optimization by focusing on the development of probabilistic modeling now rather than later.25
While ORA didn’t file comments on the ALARP White Paper, it did state that, “Any adoption of an explicit risk tolerance should be accompanied by more probabilistic measurements that may necessitate further changes to frameworks, data gathering, or specific mitigation measures.”26
MGRA and UCAN strongly support ALARP and ask the Commission to take the necessary steps to enable it to be used as a framework for utility risk management. However, they raise issues related to proper understanding of technical assumptions of the model itself rather than discuss barriers to implementation, broad strategy and timing, and intermediate steps need to accomplish before implementing ALARP (e.g., developing probabilistic modeling “building blocks”). Accordingly, MGRA and UCAN support a more stringent standard to define “tolerability limits” (e.g., United Kingdom standards may be too lenient); establish values to determine “values” regarding whether or not a risk is “tolerable” (e.g., filtering “lives lost” as a tolerability limit would weight gas pipelines’ explosion risk much more heavily than wildfire risks, since wildfires tend to be more survivable than explosions); and explain that a same “lack of
24 TURN Comments on ALARP White Paper at 3.25 TURN Comments on ALARP White Paper at 3.26 ORA Comments on Staff Report at 1.
- 80 -
A.15-05-002 et al. COM/MP6/ar9/lil PROPOSED DECISION (Rev. 1)
certainty” regarding risks and tolerance levels will apply to any risk reduction framework chosen not just ALARP.27
MGRA and UCAN question the utilities’ proposed “loss exceedance” framework for general use. They contend that “while ‘loss exceedance’ is an analysis tool that has a general statistical meaning, i.e. the probability that a loss will exceed a certain value in a specific time frame, use of the term “loss exceedance” as a general framework for identification and reduction of risk isn’t a common term.”28 They believe ALARP is “well-defined, in common usage, and well cited.” If another framework is considered, MGRA and UCAN agree with utilities that “[d]esirable attributes include adequately accounting for uncertainty, recognition of probability of impact, reducing subjectivity, and establishing a network and methodology that is easily communicated and understood in a regulatory environment when considering rates and funding risk management activities.”29
Finally, in response to the Staff Report recommendation that utilities have the “burden” to demonstrate adherence to risk tolerance standards, MGRA and UCAN assert that “utilities should not themselves be wholly responsible for establishing the risk tolerance level applicable to ratemaking.”30 With guidance from the Commission, regulators and utilities would jointly establish the tolerance levels that utilities and intervenors would operate within.
27 MGRA and UCAN Comments on ALARP White Paper at 2-5. 28 MGRA and UCAN Comments on ALARP White Paper at 6. 29 MGRA and UCAN Comments on ALARP White Paper at 6.30 MGRA and UCAN Comments on ALARP Report at 7.
- 81 -

A.15-05-002 et al. COM/MP6/ar9/lil PROPOSED DECISION (Rev. 1)
“It will then be the function of the ERM and the utility to demonstrate its evaluation and risk mitigation controls that meet or exceed the established tolerance.”31 If the Commission is representing “societal” values, it will set tolerance limits, not the utilities.
MGRA and UCAN are concerned that the “implicit tolerance level” that the utilities claims that they adhere to should be of concern to regulators. Presumably through an “informal understanding” via give and take in numerous proceedings, utilities have an idea regarding the boundaries of what is acceptable or not to the Commission. However, MGRA and UCAN state, “Nowhere is this level explicitly codified or defined.”32 If one of the goals of S-MAP is to develop a risk management framework that can be uniformly applied across all utilities, then this is one place to start. Similarly, “vision zero” or “no accidents” is a worthy aspirational goal, but it isn’t realistic. Under an ALARP framework, reframing “Vision Zero” “could be that all societally unacceptable risks should be eliminated.”33
UCAN acknowledges the tradeoff between unrealistically high expectations and utility rate affordability. “The moment the Commission embarked on a risk based approach to safety, it implicitly recognized that absolute safety rarely exists within any finite amount of safety budget.”34 Therefore, the Commission should address this issue by recognizing the tradeoffs by defining risk tolerance standards.
31 MGRA and UCAN Comments on ALARP Report at 7. 32 MGRA and UCAN Comments on ALARP Paper at 8. 33 MGRA and UCAN Comments on ALARP Paper at 8. 34 UCAN Comments on Staff Report at 9.
- 82 -
A.15-05-002 et al. COM/MP6/ar9/lil PROPOSED DECISION (Rev. 1)
9.5. DiscussionParties generally agree that there is no specification of risk
tolerance in utility risk management frameworks. They opine on the pros and cons in using the approach and barriers to implementation as highlighted in SED Staff’s Report. As to pros, the ALARP approach focuses explicit recognition on risk tolerance, deals with the tradeoffs between safety and rate affordability and appropriately gauges the tolerance for high consequence risks without needing to apply exponential factors to the consequence term in conventional risk evaluation formulas. However, parties express concerns about quantifying the statistical value of life, setting acceptable risk tolerances relative to “zero tolerance” in cooperation with the Commission, and having access to sufficient data to evaluate risk tolerance limits versus FN curves, etc.
A key issue is where the ALARP framework should fit within the overall framework of a risk management strategy. Joint Intervenors make a convincing argument that tackling other developmental steps first, such as achieving the probabilistic modeling of risk, to achieve both ALARP and portfolio optimization is key. Preliminary focus should be on the development of risk scoring models (i.e. “foundation” of the 50 foot high building) with ALARP eventually used as a “check” on the model. Over time ALARP could become a more dominant model. As Dr. Sam Savage explains, there are two parts to a coordinated approach towards probabilistic modeling: 1) an aggregated risk model that captures the probabilistic nature of adverse safety-related events, resulting in the FN curve; and 2) the
- 83 -

A.15-05-002 et al. COM/MP6/ar9/lil PROPOSED DECISION (Rev. 1)
ALARP decision framework for guiding mitigation decisions that reflect the objectives of diverse stakeholders.35
Even if all the preliminary developmental steps to implement such a probabilistic modeling approach were accomplished—and this is no easy task--it will take time to implement all of the ALARP-specific steps: 1) establish “explicit” rather than “implicit” risk tolerance at the enterprise level, line of business level, or threat level; 2) adopt a statistical value of life from well-known, published requirements; 3) reconcile resource requirements and/or constraints with impacts on rates; 4) promulgate a gross disproportionality ratio (or a range of ratios) to be used in specific circumstances to justify before a Commission; 5) build loss models and collect data; and 6) refine models and risk exposure analysis with better data and increased quantification over time.
As Dr. Sam Savage reminds us, the subject of aggregate risk modeling required to create an enterprise-wide FN curve is complex, even more so if one is allowing “enterprise” models to be decomposed into sub models at the business and asset level. Beginning to create risk models either at the asset level or structured by event and rolling up into higher levels of analysis will take time, but the effort should contribute to safety objectives over time. The ALARP framework, by itself, does not acknowledge the complexity of the regulatory environment. The ALARP framework, in its original form, does not heed other risks associated with other attributes such as reliability, environment, cost, and other areas. However, similar to a multi-attribute approach, risks from these other attributes can be
35 Joint Utilities’ Comments on ALARP Framework, Appendix 1 at 18.
- 84 -
A.15-05-002 et al. COM/MP6/ar9/lil PROPOSED DECISION (Rev. 1)
incorporated into an ALARP framework if the impacts on these different attributes and the FN curves are expressed in a common unit of measurement such as monetary terms.36 Even if one considers “safety” alone, data is missing and risk quantification will require input and collaboration among multiple stakeholders. Therefore, the ALARP framework, or its equivalent, should be developed over time, not necessarily in this first S-MAP, but in parallel or following the development of probabilistic models of adverse events.
ALARP is just one of a number of decision frameworks. The situation that utilities face is probably more complex than for example, “mine safety” risks, where stakeholders may have common objectives. Further, this concept of a “loss exceedance curve” as a separate tool isn’t fully explored on the record. At least from a visual review of the charts, the loss exceedance framework looks at risk from a binary perspective. A risk is either acceptable or unacceptable based on whether it exceeds a single curve. And “doing business” in the regulatory environment is more complicated than that.
ALARP, on the other hand, defines three regions. There is an intolerable and an intolerable region. ALARP adds an extra region. The middle (ALARP) region is where the shades of gray are. In the ALARP region, risks are not simply outright unacceptable or outright acceptable. It depends on the cost/benefits test to determine whether cost of mitigation disproportionally exceeds the benefit. ALARP may be a more realistic framework that offers more flexibility than the loss exceedance framework, but this theory hasn’t been fully tested. As Dr. Sam Savage reminds us, no “off the shelf” method is completely
36 ALARP White Paper at 34-35.
- 85 -

A.15-05-002 et al. COM/MP6/ar9/lil PROPOSED DECISION (Rev. 1)
satisfactory. Therefore, there may be some value in pursuing complementary features of several models in order to head down the path of more quantification of risk and associated probabilistic risk analysis.
In summary, we agree with SED Staff and parties that there is no specification of risk tolerance in current utility models. The Commission should adopt explicit risk standards over time, but not before laying the groundwork in the development of probabilistic risk analysis. We shall explore this interim step via an evaluation of the Joint Intervenors’ proposed approach in the following section.
9.6. Joint Intervenor Framework9.6.1. OverviewFollowing a discussion of the ALARP paper, Joint Intervenors
offered an alternative approach “to managing risk and ensuring that electric and natural gas utilities can provide safe, reliable, and affordable services to their customers.”37 Unlike the ALARP Approach, Joint Intervenors claim that their alternative approach can be implemented in the short-term and refined in the long-term. The proposed Joint Intervenor approach, using a well-established EPRI methodology and software, based on multi-attribute utility functions and probabilistic modeling, defines risk as the product of the LoF and the CoF, which is similar to the Utilities’ approach.38 “However, with respect to LoF, the proposed approach uses mathematical probabilities of failure events determined by relying on subject matter 37 Intervenor White Paper at 1. 38 In this decision, the terms “Joint Intervenor Approach,” “Multi-Attribute Approach,” and “EPRI Model” are used interchangeably.
- 86 -
A.15-05-002 et al. COM/MP6/ar9/lil PROPOSED DECISION (Rev. 1)
experts and other data regarding the condition of, and likelihood of threats to, the utility’s system, and eliminates the utilities’ current extra step of converting their frequencies to an artificial, nonlinear scale of values between 1 and 7.”39
As to CoF, the approach relies on multi-attribute scaling of event consequences in a way that prioritizes safety and accounts for any other consequence impacting other dimensions (e.g., reliability, compliance) the utilities and the Commission may wish to include. Importantly, with every proposed risk-mitigation, measurement of risk reduction can occur. “This allows the utilities to select the optimal combination of risk mitigation actions given the constraints under which the utilities operate.40
According to Joint Intervenors, this alternative approach accomplishes a number of goals:41
a) ensures public and employee safety are the priority;b) promotes cost-effective and optimized risk management;c) is transparent, easy-to-use, and understandable; andd) allows for common application and uniformity (can be
used by all utilities). 9.6.2. Limitations of Current Utility CoF MethodologiesStatement of the ProblemFollowing are preliminary observations of the perceived issues
with current utility models (“statement of the problem”) that must precede any discussion of the “building blocks” that compromise a more quantitative approach to risk management. This discussion
39 Intervenor White Paper at 1.40 Intervenor White Paper at 1.41 Intervenor White Paper at 1-2.
- 87 -

A.15-05-002 et al. COM/MP6/ar9/lil PROPOSED DECISION (Rev. 1)
complements the list of issues parties’ raised in response to the utilities’ Uniformity Report.
As to impact level categories and scores, the utilities have adopted different impact ranges to describe the severity of different failure events. The utilities have not adopted common attribute categories but all have agreed to include a safety category.
Joint Intervenors point out that the utilities’ CoF approach does not clearly delineate changes along the scale. The definitions are vague and unclear. What do we mean by “more” or “few” fatalities, injuries, illnesses, etc.? Few means one or more, but how many more? “This kind of ambiguity always accompanies the specification of an attribute that is measured numerically (e.g., number of injuries, etc.) in terms that are not numerical.”42
This seven-point scale makes it very challenging to compute risk reduction of different mitigation strategies. “For example, using the utilities’ CoF scale and holding the LoF for a specific failure constant, the risk reduction achieved by changing CoF from 7 to 6 will not be the same as the risk reduction achieved by changing CoF from 2 to 1.”43 The CoF scale is not additive, so it makes risk reduction estimates very difficult. (“Additive” means that the contribution of each attribute, such as “safety,” ”reliability,” etc. are added together to determine the overall CoF score.)
42 Intervenor White Paper at 26. 43 Intervenor White Paper at 26.
- 88 -

A.15-05-002 et al. COM/MP6/ar9/lil PROPOSED DECISION (Rev. 1)
Impact Level DescriptionCatastrophic (7) Fatalities: Many fatalities and life threatening
injuriesSevere (6) Fatalities: Few fatalities and life threatening
injuriesExtensive (5) Permanent/Serious Injuries and Illnesses:
ManyMajor (4) Permanent/Serious Injuries and Illnesses: FewModerate (3) Minor Injuries or Illnesses: Minor to many
personsMinor (2) Minor Injuries or Illnesses: Minor to few
personsNegligible (1) No injury or illnesses, un-reported, negligible
injury
As described in the Uniformity Report, the utilities currently assign LoF values to risky events using a 1 to 7 scale. The scale defines event frequencies or “arrival rates” as demonstrated below. As referred to in Section 5, the utility scales are similar to Richter scales, which are based on “order of magnitude.” According to Joint Intervenors, this 1 to 7 scale is “nonlinear” because the underlying “hazard rates” or frequencies represent changes in a way that are similar to order of magnitude differences. They observe, “Moreover, this scale means that an event occurring every 35 years has the same LoF (2) as an event occurring every 90 years, an event occurring every 3 years has the same LoF (4) as an event occurring every 9 years, and so forth, even though the mathematical probabilities of these events are different.”44 In essence, “the 1 to 7 LoF values do not correspond to mathematical probabilities.”45
44 Intervenor White Paper at 13. 45 Intervenor White Paper at 14. See discussion that highlights illustrative examples to demonstrate these key points.
- 89 -

A.15-05-002 et al. COM/MP6/ar9/lil PROPOSED DECISION (Rev. 1)
1 2 3 4 5 6 7Remote Rare Infrequent Occasional Frequent Regular Common
Once every 100+ years
Once every
30-100 years
Once every 10-30 years
Once every 3-10 years
Once every 1-3 years
1-10 times per year
>10 times per year
Joint Intervenors also point out that the utilities do not use a consistent set of “weights” for each attribute. “Instead, it appears that the weights are set independently of the attribute ranges by individuals who did not specify the attribute ranges. Therefore, there is no reason to believe that either risk reduction will be measured correctly using such attribute weights.”46 Also, the utilities use “discrete” rather than “continuous” values in their scales. (If a scale is “continuous,” then all values within a range are possible and not just the discrete values 1, 2, 3, etc.)
The utilities themselves admit the shortcomings of their current 7x7 approach. According to the Uniformity Report, they state that “none of the implemented funding methods is currently capable of generating a risk reduction per dollar invested” although they acknowledge further progress towards fulfilling this objective as the proceeding progressed. They added that “cross-risk prioritization of mitigations is more challenging and will require more efforts to establish a methodology that can optimize spending based on risk reduction benefits across an entire organization.”47 Joint Intervenors interpret these statements as “indicating that the utilities believe that: (i) they are not now able to calculate risk reduction; (ii) they may be
46 Intervenor White Paper at 27.47 Uniformity Report at 14.
- 90 -

A.15-05-002 et al. COM/MP6/ar9/lil PROPOSED DECISION (Rev. 1)
able to make progress toward that goal at some future unspecified time; and (iii) the ability to compare and quantify risk reductions across an entire organization is a longer term challenge.”48
9.6.3. Building Blocks of Probabilistic ModelingStatement of the SolutionThe Joint Intervenors state that the fundamental requirement of
its approach is that “risk reduction must be quantifiable to permit assessment of the cost-effectiveness of the risk mitigation strategies.”49 If this requirement is not fulfilled, then it is impossible to determine cost-effectiveness strategies and there would be no “benchmarks” to compare alternatives.
The Joint Intervenor’s suggested approach can be broken down as follows:50 Using ASME B31.8’s definition of risk, the process defines risk on the linear scale as Risk = Likelihood of Failure x Consequence of Failure, or:
Risk = LoF x CoF.A risk score produced by the Joint Intervenors’ approach
produces a unit-less risk value that has a linear scale but does not otherwise have a direct physical interpretation in the real world.
Risk Reduction = (LoF x CoF) Before – (LoF x CoF) AfterUtilities currently use discrete, non-additive “order of
magnitude” 1 to 7 LoF and CoF scales which do not allow the computation of risk reduction. In this proposed approach, the risk score is calculated for both before and after risk mitigation. For all 48 Intervenor White Paper at 3. 49 Joint Intervenors’ Workshop Power Point at 4.50 Excerpts from “The Building Blocks of an Effective Risk Management Methodology” presented at January 25, 2016 workshop.
- 91 -
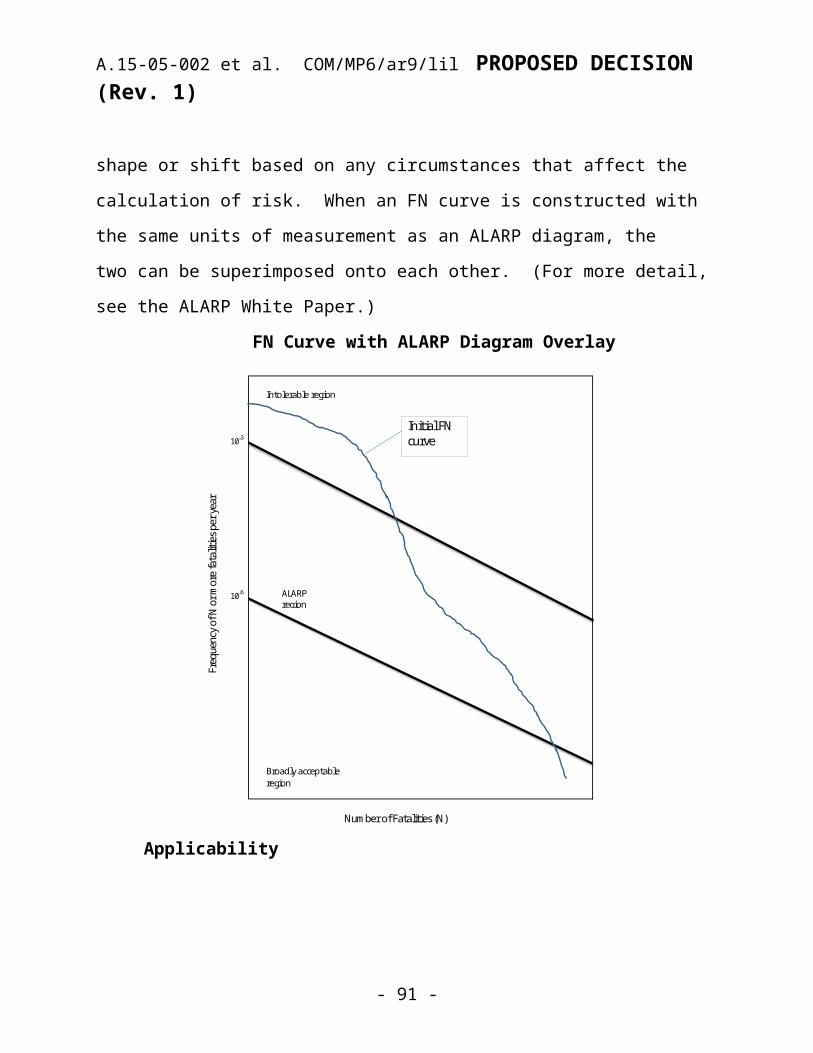
A.15-05-002 et al. COM/MP6/ar9/lil PROPOSED DECISION (Rev. 1)
the identified risks in a utility’s risk register, risk scores are calculated both before and after mitigation. By using this formula and an optimization routine subject to various constraints, an optimal mix of risk mitigation activities could then theoretically be produced.
The Intervenor Approach uses additive LoF and CoF scales.LoF values are computed as mathematical probabilities,
between 0 and 100%. LoF is determined by a hazard rate, i.e. the probability
that an asset will fail over time; typically using an annual time frame.
LoF is defined as the likelihood (between 0 and 1) of failure within some specified time frame (usually one year).
A condition dependent hazard rate refers to the probability that the asset will fail based on the condition of the asset (e.g., gas transmission pipe based on manufacturing defects or corrosion; wooden electric distribution poles with insect and wind damage.)
LoF also depends on exogenous factors: Outside events: earthquakes, wildfires, terrorism (will shift hazard rates upwards recognizing they can never be greater than 100%) Operator error: failure to operate equipment properlyMeasuring LoF is based on probability of failure, not the
frequency of failure.Instead of 1-7 scale values, LoF values are mathematical
probabilities, between 0 and 100%.
- 92 -

A.15-05-002 et al. COM/MP6/ar9/lil PROPOSED DECISION (Rev. 1)
Frequency, e.g., once every 10 years, is different from probability, e.g., 10% likelihood that a failure will occur next year.
SMEs define what it means for assets to have different condition (e.g., good, fair, poor) and develop hazard rates.
SMEs provide information about the types of outside events that can lead to asset failure and the likelihood of those outside events.
SMEs provide “multipliers” that are used to shift the hazard rates to account for outside events.
Measuring CoF is obtained by using a multi-attribute utility function. (“Attributes” are synonymous with “impact dimensions” in the utilities’ risk models.)
CoF is defined as a weighted sum of values of different attribute levels (e.g., safety, reliability, financial impact, environmental, etc.).
CoF(X) = wSafetyScore(X) + wReliabilityScore(X) + wFinancialScore(X) + wEnvironmentalScore(X).
where: wSafety + wReliability + WFinancial + WEnvironment = 100% The actual multi-attribute value is dimensionless; it is just a number.
There is no need to [explicitly] estimate that statistical value of life.
The approach uses “natural units” to measure level of attributes (e.g., injuries, loss-of services measures, $impacts for financial, etc.).
Scales convert natural units into values.
- 93 -
A.15-05-002 et al. COM/MP6/ar9/lil PROPOSED DECISION (Rev. 1)
Weights convert values into values that can be compared.It is critical to ensure that attribute ranges, scales, and
weights are all internally consistent (current utilities do not do this).
It is important to point out that the Joint Intervenor approach deals with a different way of calculating LoF and CoF, but the Joint Intervenor approach by itself is not an optimization technique. Rather, it relies on other external optimization techniques (e.g., “off the shelf” software) to produce an optimal portfolio.
Pros of Joint Intervenors’ ApproachConsistent with the Joint Intervenors’ goal statement, the
proposed model: 1. Supports public and employees, by measuring risk of
failure events as accurately as possible;2. Supports cost-effectiveness by allowing computation
of risk reduction; 3. Supports understandability by using mathematical
probabilities, not relative comparisons; and4. Support transparency by using a rigorous process to
develop likelihood of risky events that can be reviewed by all stakeholders.
The model allows some flexibility in terms of how it is implemented. For example, similar to the utilities’ approaches, the Joint Intervenors’ approach allows for SMEs to fill in the gap where data are missing and probability functions can be built using either SME estimates or quantitative data. It is relatively easier to understand and more straightforward to apply than the utilities’ approaches. All building blocks (LoF, CoF, and risk score) are based
- 94 -

A.15-05-002 et al. COM/MP6/ar9/lil PROPOSED DECISION (Rev. 1)
on a linear scale mapped and bounded by limits that people can relate to: LoF is between 0 and 1, attribute scores are between 0 and 100.
Parties note that the model can be used in tandem with the ALARP framework. It can be adapted to accommodate exogenous impacts on asset conditions and more sophisticated optimization models through the use of software. It can be applied to both electric and natural gas utility operations including T&D functions.
Cons of Joint Intervenors’ Approach1. Certain distinguishing aspects of the Joint Intervenor
approach must still rely on subjective SME input, e.g., SMEs determine condition of the assets and the multipliers to be applied to the condition dependent hazard rates.
2. Just like the utilities’ models, the Joint Intervenor approach does not normalize or adjust to account for different utility sizes.
3. The process of computing weights involving safety impacts often indirectly estimates the value of a statistical life (VSL).51
Parties point out that limited data, utility resistance to change, and lack of specialized expertise are also obstacles to effective implementation.
9.6.4. ImplementationAccording to the Joint Intervenors, in order to deal with these
perceived deficiencies, the Commission should require the utilities to replace their less sophisticated scoring systems and adopt the
51 Joint Intervenors agree that this statement is “true.” However they contend that, “SED fails to note that this is the case with all utility risk management approaches—including the utility and SED’s approaches—that consider safety as an impact dimension. Should the Commission prefer to use an explicit value of life, it is possible but not necessary, to do so within the Joint Intervenors’ Approach.” See Joint Intervenors’ Comments on Staff Report at 16-17.
- 95 -
A.15-05-002 et al. COM/MP6/ar9/lil PROPOSED DECISION (Rev. 1)
following measures (or a subset of measures) more fully described in the Intervenor White Paper:52
Likelihood of Failure (LoF) based on Mathematical Probability: For the LoF, each utility should use the mathematical probability (between 0%-100%) that a failure will occur within a year. Mathematical probabilities are more easily understood and will allow the calculation of risk reduction from proposed mitigations. Mathematical probabilities can be derived using utility or industry data and, in the absence of quantitative data, by relying on Subject Matter Experts’ (SMEs) input. Uncertainty regarding the timing of a failure event can be reflected in the LoF by converting a range of frequencies into a probability using the Poisson distribution.
Condition Dependent Hazard Rate: The LoF should take into account the observed behavior of the equipment and the condition of the asset. Condition dependent hazard rates are a more accurate measure of the LoF of any given asset. Subject Matter Experts can provide feedback on the accuracy and applicability of available data and help define categories of asset condition (e.g., good, fair or poor).
Continuous Consequence of Failure (CoF) Scores: Rather than a discrete 1-7 scale, utilities should rely on a continuous 0-100 scale for CoF.53 A
52 Excerpts drawn from the Joint Intervenors’ Comments on the Intervenor White Paper at 3-6.53 MGRA expressed concerns in comments on the original PD that limiting the consequence to 100% for the worst possible consequence would seriously compromise the risk scoring process if a new risk were discovered that exceeded the 100% value. MGRA proposed as a possible solution that for even more extreme risks than originally anticipated, the 100% could be exceeded. This proposal is in fact in agreement with the Commission’s understanding of the Joint Intervenor model that the 100% is only a convenient mark on a yardstick, which could be exceeded for even more extreme events.
- 96 -
A.15-05-002 et al. COM/MP6/ar9/lil PROPOSED DECISION (Rev. 1)
continuous scale enables the calculation of risk reduction and is easier to understand.
Multi-Attribute Utility Functions: Utilities should calculate the CoF associated with a risk using a properly designed multi-attribute utility function. For each attribute (consequence category) the utility must specify the range, or units over which the attribute will be measured; the scale or the relative value of each level of the attribute; and the weight or the relative importance of each attribute as compared to the other identified attributes. The weight of each attribute is determined by comparing the value of changing each attribute from its worst to its best level to similar changes in level for the other attributes. Each utility should be required to demonstrate in its RAMP that its multi-attribute utility function is properly designed and implemented.
Safety Impacts: In order to ensure the proper prioritization of public and employee safety when calculating the CoF, the Commission should identify its preferred attribute weight for a public and employee safety attribute.
Prioritization of Projects by Risk Reduction per Dollar Spent: The proposed improvements to CoF and LoF will allow the utilities to determine the risk reduction score for any given mitigation project. That information can be used in conjunction with project costs to calculate the risk reduction per dollar spent for every proposed mitigation. Prioritization of projects by this metric will provide an interim means to judge the cost-effectiveness of utility risk mitigation portfolios while optimization techniques are implemented.
Initial Implementation of Optimization: While full optimization of utility risk management portfolios may require additional time and effort, the utilities can begin to implement optimization techniques
- 97 -

A.15-05-002 et al. COM/MP6/ar9/lil PROPOSED DECISION (Rev. 1)
beyond prioritization based on risk reduction per dollar spent. Provided that a utility has successfully achieved the measures outlined above, it should identify and quantify other constraints and determine the optimal portfolio of projects in light of those constraints. Each utility should be required to demonstrate in its first RAMP filing not just the results of its risk management activities, but also that it has correctly implemented the interim measures identified above.
Over the longer term, the Commission should require the utilities to further refine quantitative and optimization methods. As soon as the utilities successfully implement the short-term measures, they should begin to pursue longer-term improvements to their risk management methodology. Specifically, the utilities should move toward:
Improved Data Collection: As a result of implementing the Intervenor White Paper approach to risk management and the short-term measures above, the utilities will gain an improved understanding of what data is required to determine the optimal portfolio. As the utilities collect additional data, SMEs will continue to have an important role in supplementing the data and confirming its reliability.
Refined Optimization Techniques: The utilities, under the direction of the Commission, should further implement optimization techniques. As the utilities correct their risk reduction calculations, improve their data collection and identify all constraints, they should rely on these inputs to determine the optimal risk mitigation portfolio.
Improved Hazard Rates: Long-lived assets change over time, and the utilities should implement condition dependent hazard rates that take into account the dynamic nature of assets. Better understanding of how assets change over time will
- 98 -

A.15-05-002 et al. COM/MP6/ar9/lil PROPOSED DECISION (Rev. 1)
allow for a more accurate understanding of risk and the development of targeted risk mitigation portfolios.
These longer-term developments will augment the ability of the utilities to demonstrate that they have developed the most cost-effective risk management portfolio. Decision 14-12-025 directed that this S-MAP would be only the first proceeding of this type, and states that at least one additional S-MAP proceeding should be convened. The next S-MAP proceeding should consider, among other topics:
Initial Utility RAMP Filings: The Commission should elicit feedback from Commission staff and intervenors regarding the successes and failures of the initial RAMP proceedings. Based on feedback received, the Commission can make the modifications and improvements required for future RAMP filings.
Increased Application of Optimization: To the extent that the utilities have not fully implemented optimization techniques, the Commission should provide additional feedback regarding what additional optimization will be required in the second round of RAMP proceedings.
CoF Impact Categories: In the short term, the Commission should determine a threshold weighting for the safety impact category, as identified above. In future S-MAP proceedings, the Commission can consider whether it should further specify the proper impact categories for consideration in a multi-attribute utility function, and if so, whether, based on a record developed in such future S-MAP, the Commission also would like to establish the attribute scales, ranges and weights.
Together these interim and long-term plans will result in utility reliance on improved risk management methodologies and will achieve the
- 99 -

A.15-05-002 et al. COM/MP6/ar9/lil PROPOSED DECISION (Rev. 1)
Commission goal of “a more quantitative method for optimized risk mitigation.”
9.6.5. Comparison of Utility and Joint Intervenor Approaches Based on an evaluation of the Joint Intervenor model and deeper
understanding of utility risk management frameworks, the following table is a comparison of Utility Risk Evaluation Formulas and Risk Frameworks and the Joint Intervenors Framework: (SED Staff Report at 64, slightly modified based on comments.)
- 100 -

A.15-05-002 et al. COM/MP6/ar9/lil PROPOSED DECISION (Rev. 1)
Comparison of Utility Risk Evaluation Formulas and Risk Frameworks
PG&E SCE SempraJoint
Intervenors 54
Risk Management Framework
Risk framework based on Enterprise Risk Management
yes yes yes yes
impact dimensions consider shareholder interests and/or financial performance
yes yes yes
to be defined by the utility
or Commission
Input Type
predominantly SME-estimated inputs yes yes yes
no, only where
observed data is unavailable
Indexing method on frequency score selection(whole integer-only inputs, 1 to 7)
partially yes, but allows for
override with actual frequency
no, uses continuous, linear-scale frequency
yes no
Indexing method on consequence score selections (whole integer-only log-scale inputs, 1 to 7)
yes yes yes no
Frequency
number of frequency levels 7 7 7
model uses actual
likelihood or probability
representative position within log-scale frequency range
right hand of range
not applicable, uses linear
scale frequency
fixed point value from each range
model uses actual
likelihood or probability
allows for actual frequency data input where available yes yes no
model uses actual
likelihood or probability
model specifically considers asset condition on a per-asset element basis when determining frequency
no model has ability to do so no yes
Consequence
54 See Joint Intervenor’s Reply Comments on Staff Paper Attachment B, Revised Table 7A
- 101 -

A.15-05-002 et al. COM/MP6/ar9/lil PROPOSED DECISION (Rev. 1)
consequence evaluation standard
based on P95 (95th percentile) "probably worst case outcome"
based on "worst
reasonable direct impact"
reasonable worst case scenario
use complete probability distribution
number of impact (consequence) dimensions 6 5 4
to be defined by the utility
or Commission
number of levels per impact dimension 7 7 7 to be defined
uses weights on impact dimensions yes no yes yes
impact (consequence) dimensions and weights
safety(30%), reliability(25%),
environment(5%),
compliance(5%), trust(5%),
financial(30%)
safety, reliability,
environment, compliance,
financial, (not weighted, risk
scores only summed)
safety(40%), reliability(20%),
compliance(20%), financial(20%)
Joint Intervenors
advocate analytically
derived weights to be
properly defined by the
utility or imposed by
the Commission
Risk Scoreslinear scale risk score? no yes yes yesrelative or absolute risk score relative quasi-absolute quasi-absolute absolute55
consequence scenarios in risk score single scenario multiple
scenarios single scenario single scenario
risk formula emphasizes high consequence events yes no no no
Other Areastakes into account threat interactions and their effects on frequency, impact, and impact dimensions
no
no, but model does not preclude
possibility of it
no no
takes into account mitigation overlaps on different risks and resulting synergies
no
no, but model does not preclude
possibility of it
no no
Risk framework calculates risk scores for programs
yes yes under consideration and
yes
55 “Absolute risk score” is based on “a representation of the magnitude of risk based on a linear-scale risk formula, often expressed by risk=LoF x CoF.” See “Section 5.4 General Observations on Risk Scores.” This definition may be refined in Phase Two of this proceeding.
- 102 -

A.15-05-002 et al. COM/MP6/ar9/lil PROPOSED DECISION (Rev. 1)
and projects possible development
calculates risk reduction in a way that allows comparisons across the enterprise
no methodology presented, non-linear
relative scores make this impossible
yes
no methodology presented, but
linear scale quasi-absolute
scores make this possible
yes
9.6.6. SED Staff Comments Next we turn to pertinent SED Staff Findings and
Recommendations about Utility Approaches (Staff Report at 86-102.) and parties’ high level responses to them. (See language in italics.)56 These issues closely correspond to issues Joint Intervenors raised in their White Paper.
The weights on impact dimensions were not chosen based on true equivalence and convertibility of different dimensions. The utilities’ risk models obtain the risk score for a risk driver (or threat) and consequence scenario by summing (or weighting) the dimensionless contributions from different impact dimensions. (Summing the different impact dimension scores without applying weights is in fact equivalent to assigning equal weight to all the impact dimension scores.)
The risk scores defined as such would lack physical interpretation. The weights establish equivalence relationships among the different impact dimensions. For example, if a utility’s formula uses 30% weight on safety impact and 25% weight on reliability, it in effect establishes that 30 units of safety impact are to be treated as equal to 25 units of reliability impact.
56 See Parties’ Comments on Intervenor White Paper, February 12, 2015 and February 25, 2015.
- 103 -

A.15-05-002 et al. COM/MP6/ar9/lil PROPOSED DECISION (Rev. 1)
The current process is similar to adding two rotten apples, seven rotten oranges, and two missing dollars and then calling that weighted sum a risk score. Such a summation of different dimensions with different implied or explicit physical units is inherently nonsensical unless the disparate impact dimensions had weights that were objectively chosen based on detailed analysis to establish the conversion among the different impact dimensions. This, however, was not the case with the current weights chosen by the utilities. The Commission could impose uniform conversion weights by regulatory fiat, but then the same criticism about the weights would still remain.
Most parties agree with this statement.There is no optimization of the portfolio of risk mitigation
activities. None of the utilities have a way to optimize their portfolio in a mathematically rigorous sense. There is no explicit consideration of optimization. Programs and projects are prioritized but not optimized. Prioritization is only an interim substitute for optimization but is not a replacement for it.
Inherent in risk management is the unavoidable fact of limited resources and other constraints. Without resource constraints, an operator could simply apply an infinite amount of an infinite number of risk mitigation activities and the risks would be driven to zero. Clearly this is reduction of the argument to an absurdity. Therefore, risk management always assumes recognition of some constraints (rate shock, availability of trained personnel, and limitation of resources). And, optimization is always tied to risk tolerance. These concepts are all tied together.
- 104 -

A.15-05-002 et al. COM/MP6/ar9/lil PROPOSED DECISION (Rev. 1)
Most parties agree with this statement and consider it a longer term priority.
The models are marked by weak transparency and questionable repeatability. To various degrees the utilities have made good progress in creating a structured risk management framework that can be described in terms of the Cycla 10-step process, but the decision-making process leading from risk evaluation to the eventual portfolio mix of proposed risk mitigation programs and projects is still only vaguely described. The most transparent and verifiable step seems to be the one offered by SCE: that SCE intends to prioritize their portfolio based on a risk-spend efficiency scores.
Most parties think that current utility models lack transparency. Joint Utilities think that their models are “transparent enough” for the Commission and intervenors.
The Joint Intervenors’ proposed framework is a valuable alternative consideration by the Commission. The Joint Intervenors’ alternative approach is intended to replace the utilities’ existing RETs. According to SED, it has features that more closely align with the requirements of D.14-12-025, but it may need a longer time to successfully implement.
Parties generally agree with this statement. CUE warns that use of the Joint Intervenor model could result in “false precision.”
The Commission should prescribe uniform impact dimensions and a uniform methodology to derive the impact dimension weights. The Commission should not prescribe uniform weights. Alternatively, the Commission could dispense with using weights by specifying that all impact dimension scores be
- 105 -

A.15-05-002 et al. COM/MP6/ar9/lil PROPOSED DECISION (Rev. 1)
expressed in one common equivalent unit of measurement, such as inflation-adjusted dollars. A uniform methodology to derive impact dimension weights would enhance inter-utility risk score comparability, but uniform weights that do not take into account the different cost structures and loss experience across utilities would paradoxically make the risk scores non-comparable.
With the exception of Joint Utilities and CUE, parties generally agree with prescribing uniform impact dimensions and a uniform methodology to derive the impact dimension weights; and a uniform methodology for deriving weights that allow internally comparable risk reduction calculations. However, some parties differ on the pace of change to accomplish this. Joint Utilities support continued use of the 7x7 model in the foreseeable future. Joint Intervenors support setting a weight for the “safety attribute,” (only) in the second phase of this proceeding.
The idea regarding whether utilities should have uniform impact dimensions and a uniform methodology to derive weights are two of the most contentious issues in the proceeding outside of what should be the appropriate pace of change to develop a more probabilistic approach to risk management.
The utilities should develop methods to optimize their risk mitigation portfolios. The current methods employed by the utilities entail prioritization, which is not the same as optimization.
Most parties agree that more complex optimization is a long term goal. However, Joint Intervenors believe that relatively simple optimization is possible in the short term under the Joint Intervenors’ Approach. Calculation of risk reduction is a key element.
- 106 -
A.15-05-002 et al. COM/MP6/ar9/lil PROPOSED DECISION (Rev. 1)
9.6.7. Parties’ CommentsIn response to the agreed-upon shortcomings of the utilities’ 7x7
scoring system, most parties acknowledge that the Joint Intervenor Approach proposes a number of helpful steps to moving utilities forward from a qualitative to a quantitative mechanism for optimized risk mitigation. More specifically, parties comment on the overall framework, strengths and weaknesses of the approach, outstanding issues, and how the Intervenor Approach complements the ALARP approach. Joint Intervenors (EPUC, IS, and TURN) ORA, UCAN, MGRA, generally support the approach while the Joint Utilities do not. In reply comments, Joint Intervenors respond to issues and criticisms that parties raise, some of which they consider to have some merit and some others which they consider “baseless.”
ORA generally supports the Joint Intervenor White Paper as “it prioritizes safety, is transparent, and effectively distinguishes risk measurement from policy decisions. For these reasons, the Commission should work to transition risk assessment to such a methodology.”57 However, ORA believes that “more data is needed to make any methodology effective.”58 Consequently, they believe “it is premature to fully implement any methodology at this time.”59 ORA favors a common methodology but believes that it may take the Commission a five-year timeline to implement a more quantitative methodology, such as the one proposed in the White Paper. ORA recommends that “a Technical Working Group (perhaps as an
57 ORA Comments on Intervenor White Paper at 1. 58 ORA Comments on Intervenor White Paper at 2.59 ORA Comments on Intervenor White Paper at 2.
- 107 -
A.15-05-002 et al. COM/MP6/ar9/lil PROPOSED DECISION (Rev. 1)
outgrowth or continuation of the Metrics Working Group) should be established to address questions of data gathering and to identify appropriate milestones and timelines for implementation of a quantitative methodology.”60 ORA expresses concern that using subject matter experts in place of data may be inadequate for accurate risk estimation.61
According to MGRA, it “is generally aligned with ORA’s position, though we believe that the Commission should adopt a more aggressive timeline to move towards a common methodology.”62
MGRA observes that the “multi-attribute utility approach” will help the Commission focus on safety priorities and choose from a portfolio of possible risk mitigation strategies. “It is an analytical (rather than simulation) approach that concentrates on the impacts of hazards on utility assets and potential consequences.”63
MGRA points out a number of advantages of the approach. First, they contend that the Intervenor White Paper “makes a convincing argument that optimization techniques will result in a superior risk mitigation strategy over simple ranking of projects by cost/benefit analysis.”64 It maintains that the “multi-attribute utility” 60 ORA Comments on Intervenor White Paper at 2.61 ORA Comments on Intervenor White Paper at 4.62 MGRA Reply Comments on Intervenor White Paper at 2. 63 MGRA Reply Comments on Intervenor White Paper at 2.64 MGRA Reply Comments on Intervenor White Paper at 2. “As an alternative to optimization, the utilities may rank projects by their benefit/cost ratios, and select projects in rank order under the budget is exhausted. This heuristic is sometimes called prioritization. If there is only a single resource constraint, the benefit/cost ratio can be a useful approximation. But, if there is more than one constraint, as there typically are in the utilities’ risk management determination, using benefit/cost ratios would not likely result in an optimal portfolio.” See White Paper at 29-30.
- 108 -

A.15-05-002 et al. COM/MP6/ar9/lil PROPOSED DECISION (Rev. 1)
models enables the goals of cost-benefit analysis to be realized by ensuring utilities are spending their safety dollars in the most effective way. Using multiple attributes, which represent multiple values (that may not have a dollar value assigned) may facilitate the optimization of solutions by taking into account not only safety concerns, but environmental and other concerns as well.65 Second, use of subject matter experts provides an interim quantitative risk measure, which “addresses the utilities’ concerns that development of quantitative models is gated by collection of a significant history of data that is currently not even being acquired.”66 Third, the “multi-attribute utility” approach is compatible with the ALARP approach that it strongly endorsed earlier in the proceeding. The ALARP approach is able to help determine the constraints that utilities face pertaining to those risks that need to be managed by society’s (or the Commission’s to be prescribed) risk tolerance. Fourth, MGRA notes that the Intervenor Approach is capable of incorporating exogenous impacts on asset conditions such as high winds and earthquakes. These estimates will originally be provided by SMEs until access to more sophisticated data is provided.
In comments, MGRA express concerns that high impact/low probability events need to be described in “greater detail in order to clearly show how contributions from extreme events would be incorporated.”67 MGRA recommends beginning an analysis with a “near-worst case scenario” and then applying sensitivity analysis to
65 MGRA Reply Comments on Intervenor White Paper at 2.66 MGRA Reply Comments on Intervenor White Paper at 3.67 MGRA Reply Comments on Intervenor White Paper at 6.
- 109 -

A.15-05-002 et al. COM/MP6/ar9/lil PROPOSED DECISION (Rev. 1)
ascertain if there are any mitigations that adequately address worst case events in a reasonable and cost-effective manner. MGRA also comments on the lack of the authors’ exposure to wildfire issues in California that may provide more context of the issues in the October 2007 firestorms. Under extreme weather conditions, utility infrastructure can be a source of wildfire ignitions and are difficult to model from an analytical standpoint. MGRA supports the use of continuous values, with uncertainties or ranges explicitly stated for any estimate.68
Joint Intervenors fully support the EPRI approach presented in the White Paper and urge rapid adoption. They indicate interim and long-term steps to facilitate quantitative risk mitigation strategies. (See “Implementation” discussion above.) They also indicate that both the Intervenor approach and ALARP approach are compatible with each another. Given the limitation that ALARP does not select “optimum,” Joint Intervenors recommend that “implementing a methodology that enables an optimized portfolio of risk mitigation measures should be the Commission’s primary focus at this point.”69 ALARP has many barriers to implementation. “ALARP need not be adopted in order to implement multi-attribute optimization methods.”70
UCAN also supports the Intervenor Approach and recommends that related actions be taken soon, and not on the five-year scale that ORA proposed. UCAN suggests that a common methodology be 68 MGRA Reply Comments on Intervenor White Paper at 10.69 Joint Intervenors’ Comments on Intervenor White Paper at 7.70 Joint Intervenors’ Comments on Intervenor White Paper at 8 referring to Staff Paper at 27.
- 110 -

A.15-05-002 et al. COM/MP6/ar9/lil PROPOSED DECISION (Rev. 1)
developed that applies to all utilities and that utilities can do far more than they have suggested in the Uniformity Report. They point out that both the Intervenor White Paper and ALARP White Paper suggest that a probabilistic modeling approach could be achieved with subject matter experts substituting for the lack of available data.
CUE expresses doubt about the value of the Intervenor Approach: “Like the other methods considered in this proceeding, it would likely lead to risk assessments that suffer from false precision. Its primary value may be to highlight the gaps in data.”71 CUE is concerned that SMEs do not know the precise conditions of assets and that subjective “good,” “fair,” and “poor” estimates of risk cannot generate an accurate risk assessment of a low probability/high impact event.72 It also suggests that the Intervenor’s Approach quantifies a statistical value of life despite claims to the contrary.73
The Joint Utilities ResponseJoint Utilities observe that the Intervenor Approach is sound
based on applicable decision making theory and engineering methods. “It is also in line with Utilities’ existing risk-informed planning efforts, though there are some areas where the details of the methodologies are different.”74 Joint Utilities generally support the “aspirational”
71 CUE Comments on Intervenor White Paper at 3. 72 CUE Comments on Intervenor White Paper at 5.73 According to CUE, “[t]he Case Study example scales death at 100, moderate injury at 30, and no injury at 0. The White Paper stresses that Safety is not expressed in dollars, and “thus, there is no need to specify a statistical value of life. However, this is misleading. By assigning any unit scale to an outcome of death, and then comparing that scale to another scale expressed in monetary terms (or any terms), the proposal assigns a statistical value of life.” Id. at 6. 74 Joint Utilities’ Comments on Intervenor White Paper at 5.
- 111 -

A.15-05-002 et al. COM/MP6/ar9/lil PROPOSED DECISION (Rev. 1)
goals of the Joint Intervenors but claim these goals are already part of the utilities’ current approach to risk management.
Despite supporting its overall goals, the Joint Utilities are skeptical about the Joint Intervenors’ Approach: “There are many difficult challenges to developing a common methodology, and time would be better spent improving existing methods.”75 Joint Utilities refers to their entrenched culture that has “bought in” to existing processes and methods. “Reiterating the salient point, switching to a new methodology that does not provide an exceptional difference from what is not being used will misuse precious time and efforts of all parties.”76
From a practical perspective, Joint Utilities claim that there is no evidence that the EPRI tool will be useful in a regulatory proceeding. “Nevertheless, the Utilities are willing to consider further investigation and benchmark with other utility companies to determine if and how the tool would be useful.”77 That being said, they currently oppose “arbitrary weightings or formulas for risk identification and evaluation, especially in light of the relative and qualitative nature of risk assessment maturity at present.”78
Joint Utilities complain that the Intervenor White Paper demonstrates a lack of understanding of current utility methods. They claim that the paper does not acknowledge the similarity in approach that the Utilities have adopted. “Similar to the Intervenor
75 Joint Utilities’ Comments on Intervenor White Paper at 5. 76 Joint Utilities’ Comments on Intervenor White Paper at 5. 77 Joint Utilities’ Comments on Intervenor White Paper at 6. 78 Joint Utilities’ Reply Comments on Staff Report at 21.
- 112 -

A.15-05-002 et al. COM/MP6/ar9/lil PROPOSED DECISION (Rev. 1)
methodology, the Utilities consider: developing a likehood of failure (LoF), consequence of failure (CoF), conditional probability (CP), differentiation of safety risks from other risk drivers, and use of a consistent risk function that can demonstrate an understanding of risk reduction per investment.”79 They then provided illustrative examples demonstrating how each methodology accounts for these elements. Further, the Joint Utilities claim that the Joint Intervenors are “unaware that the Utilities are piloting and testing approaches that go beyond the presented methodology and EPRI work done between 1997 and 2007.”80 They claim that “the Utilities’ work in calibration of subject matter expertise, use of probabilistic analysis, value of information analysis, and SIP Math models81 represent a real improvement to the current methodologies.” Taking this process one step further, they offer to provide a mechanism to the Commission to enable it to compare and explain risk analyses across utilities until a common methodology is defined.82
Joint Utilities also acknowledge the uncertainty regarding the repeatability of inputs provided by SMEs and agree that all parties should strive to address this over time. Consistent with the views of most other parties, “[t]he Joint Utilities agree that lack of data should not be a reason to delay implementation of probabilistic modeling techniques.”83 In future risk management efforts, they support a
79 Joint Utilities’ Comments on Intervenor White Paper at 6.80 Joint Utilities’ Comments on Intervenor White Paper at 6.81 “SIP” stands for “Stochastic Informative Packet” and refers to a tool used to conduct Monte Carlo analysis for determining probability. 82 Joint Utilities’ Comments on Intervenor White Paper at 9.83 Joint Utilities’ Comments on Intervenor White Paper at 13.
- 113 -

A.15-05-002 et al. COM/MP6/ar9/lil PROPOSED DECISION (Rev. 1)
range of values and probabilistic models that incorporate probability distributions for analysis of risk. (In contrast, Joint Utilities claim that the Joint Intervenor’s Approach settles on a single value rather than probability distribution in its analysis.) Joint Utilities suggest that they exhibit sufficient transparencies with their models since they provide the Commission and intervenors access to “excel spreadsheets with drop down boxes that are transparent and easy to use.”84
Joint Utilities claim that there are some technical errors in the White Paper’s representation of current utility scoring practices and concerns about how to manage low probability/high impact events.85
Joint Utilities agree with other parties that a Phase Two of the S-MAP proceeding should be initiated to deal with unresolved issues in the proceeding.86
Joint Intervenor ResponseIn response to Joint Utilities’ comments, Joint Intervenors note
some positive developments regarding more recent formal acknowledgment by the Joint Utilities that they are experimenting with methodologies which calculate risk based LoF and CoF to calculate and compare risk reduction. In addition, despite earlier contrary assertions made in the proceeding, Joint Utilities are beginning to suggest they can calculate risk reductions as SCE has indicated all along.87 Joint Intervenors observe that “the proposed
84 Joint Utilities’ Comments on Intervenor White Paper at 6. 85 Joint Utilities’ Comments on Intervenor White Paper at 9. 86 Joint Utilities’ Comments on Intervenor White Paper 8. 87 Joint Intervenors’ Reply Comments on Intervenor White Paper at 3.
- 114 -

A.15-05-002 et al. COM/MP6/ar9/lil PROPOSED DECISION (Rev. 1)
improvements to utility methodology will empower both the Commission and all intervenors to understand and evaluate the spending portfolios in each utility’s RAMP proceeding, leading to improved decisions and ultimately, increased safety for the public and greater value for ratepayers.”88
Joint Intervenors are “surprised” that, given the increasing significant areas of “agreement,” the Joint Utilities spend considerable effort criticizing the model without any constructive suggestions.89 They are disappointed that Joint Utilities failed to respond to the final version of the Intervenor White Paper which reflected edits to address feedback received and concerns raised by utilities and other intervenors at the January 25, 2015 workshop.90 Joint Intervenors believe inaccuracies and distortions advanced by the Joint Utilities undermine the credibility of their criticism of the Joint Intervenor Methodology. “If, as the Utilities suggest, they are already pursuing methodologies that are substantially similar to the proposed intervenor methodology, it should be relatively simple to implement the changes needed to align the Utilities’ models with the more transparent Joint Intervenor methodology.”91
Joint Intervenors respond to many “unclear, incorrect, and inaccurate objections.”92 For example, contrary to what Joint Utilities allege (partial list):93
88 Joint Intervenors’ Reply Comments on Intervenor White Paper at 6.89 Joint Intervenors’ Reply Comments on Intervenor White Paper at 4.90 Joint Intervenors’ Reply Comments on Intervenor White Paper at 7. 91 Joint Intervenors’ Reply Comments on Intervenor White Paper at 22.92 Joint Intervenors’ Reply Comments on Intervenor White Paper at 7.93 Joint Intervenors’ Reply Comments on Intervenor White Paper at 7-11.
- 115 -
A.15-05-002 et al. COM/MP6/ar9/lil PROPOSED DECISION (Rev. 1)
Joint Intervenors agree that “risks can rarely be reduced to zero.”
Joint Intervenors have made no such claim that risks are additive at anything other than the Expected Value.
The Joint Intervenor Methodology considers multiple factors concerning the condition of each asset in order to determine the asset’s behavior over time and would reject a simple replacement strategy solely based on age.
The Joint Intervenor Methodology contemplates that risk mitigation activities implemented at different paces would each be treated as different alternatives to be scored and compared.
In a technical appendix, Joint Intervenors explain that probability distributions are used in the Joint Intervenor methodology; they are taken one step further, however into an expected value to allow calculation of risk reduction.
Joint Utilities have provided no evidence or even explanation, as to why the EPRI methodology would not be useful in a regulatory proceeding whereas their proposed methodologies would be.
The Joint Intervenor methodology can be adapted to any industry and applies equally well to gas utilities.
The Joint Intervenors acknowledge that optimization techniques can get increasingly sophisticated, which is why Joint Intervenors have proposed beginning with a simplified optimization approach in the short term and progressing to more complex optimization problem formulations and method as a longer term goal of this process.
As demonstrated in the example of a multi-attribute function and stated at the workshop, the attribute
- 116 -

A.15-05-002 et al. COM/MP6/ar9/lil PROPOSED DECISION (Rev. 1)
scales relied on in the Intervenor Methodology need not be linear.
The Utilities’ use of logarithmic scales invites other problems, including potential bias in favor of mitigations that reduce consequences at the upper end of the scale and unnecessarily complicating the specification of attribute weights for calculating CoF.
Statistical value of life will be either explicit or implicit [emphasis added] in all risk assessment methodologies in which safety is one of the attributes and for which safety incorporates measures of reduced risk of death and injury.
In response to comments, Joint Intervenors suggest that implementation of the Intervenors’ proposed methodology does not preclude separate evaluation of “tail risks.” The Joint Intervenors explain that the model need not be implemented without deviation if the Commission or utility determines that low frequency/high consequence events must be mitigated. Such an approach, however, involves tradeoffs in light of affordability constraints, and a higher range of consequences if a situation was left unmitigated, etc. While the weights of various attributes may be subjective, Joint Intervenors suggest a process in which they can be developed in a “thoughtful, structured, and transparent” way that is aligned with Commission preferences and allows for periodic review by intervenors.94 In terms of dealing with uncertainty, Joint Intervenors acknowledge that SMEs are providing estimates, based on their judgment. “The uncertainty underlying the SME estimates is acknowledged and taken into account in the Joint Intervenor Methodology.” The methodology also supports the use of sensitivity analysis to determine the change in 94 Joint Intervenors’ Reply Comments on Intervenor White Paper at 17.
- 117 -

A.15-05-002 et al. COM/MP6/ar9/lil PROPOSED DECISION (Rev. 1)
mitigation strategies based on uncertainty relating to the likelihood that adverse events will occur and the consequence of such events.95 In response to ORA comments, Joint Intervenors explain that “allowing limited reliance on SME input while data sets are developed allows the Commission to implement improved risk management in the near future.”96
Joint Intervenors also assert that the utilities set a low bar for transparency. “Simply providing access to a spreadsheet of utility inputs to their risk calculations does not meet a reasonable standard of transparency.”97
In response to SED Staff recommendations, Joint Intervenors suggest that “the utilities models need improvements in order to calculate risk reduction in a way that is comparable across the enterprise.”98 For optimization or prioritization or risk mitigations, calculation of risk reduction is imperative. The Joint Intervenors recommend utility adoption of the Joint Intervenor Approach or that utilities “adapt the features of the Joint Intervenor Approach necessary for risk reduction calculations that are comparable across the enterprise.”
9.6.8. Discussion Two of the most contentious issues in the proceeding, outside of
what should be the appropriate pace of change to develop a more probabilistic approach to risk management, are whether utilities
95 Joint Intervenors’ Reply Comments on Intervenor White Paper at 23.96 Joint Intervenors’ Reply Comments on Intervenor White Paper at 25. 97 Joint Intervenors’ Reply Comments on Intervenor White Paper at 20.98 Joint Intervenors’ Comments on SED Staff Report at 13.
- 118 -
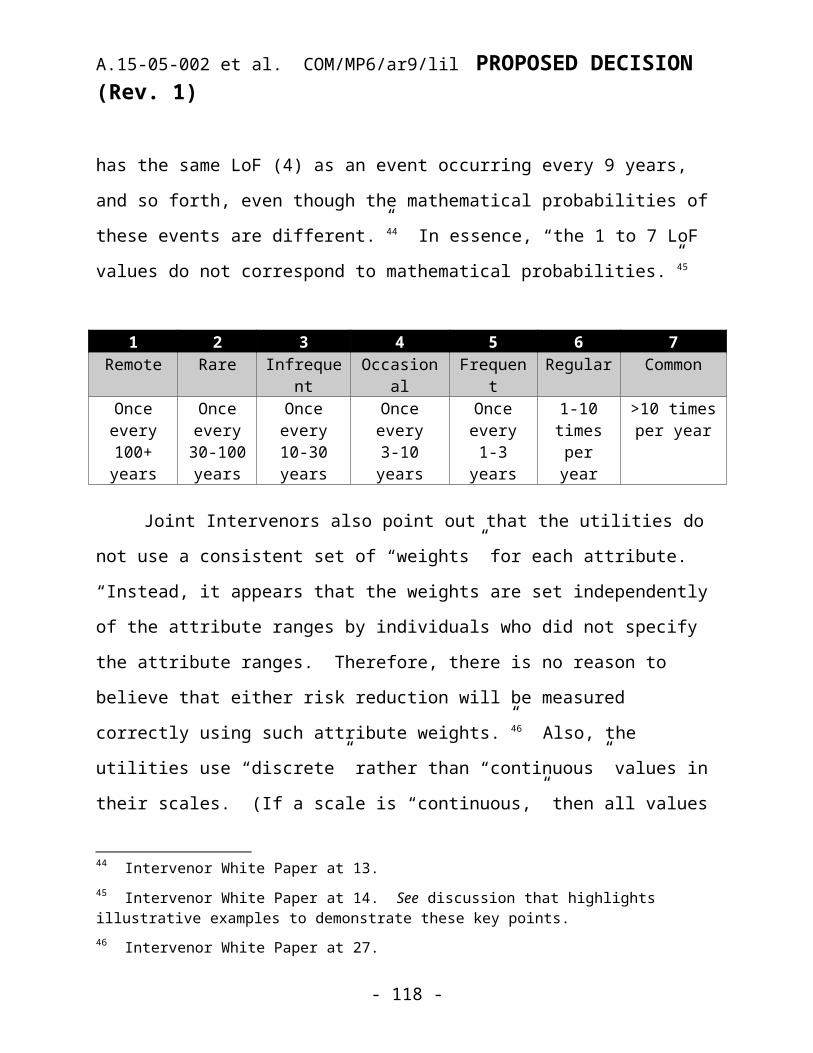
A.15-05-002 et al. COM/MP6/ar9/lil PROPOSED DECISION (Rev. 1)
should have uniform impact dimensions and a uniform methodology to derive weights.
All parties acknowledge, in varying degrees, a “statement of the problem” that most utility models preclude the calculation of risk reduction which is necessary to permit cost-effectiveness of risk mitigation strategies. Joint Intervenors explain the issues associated with the 7x7 matrix including lack of uniformity among the utilities’ impact level categories and scores, and impact dimensions. The utilities’ CoF approach does not delineate changes along the scale and definitions are vague and unclear. The seven-point “exponential” scale function makes it very challenging to compute the risk reduction of different mitigation strategies. The 1 to 7 values do not correspond to mathematical probabilities. Joint Intervenors also point out that the utilities do not use a consistent set of “weights” for each attribute. Weights are set independently of the process to establish attribute ranges, which results in lack of internal consistency. Scales are “discrete” rather than “continuous” so all values between ranges are not available. It may be that the CoF scales introduce bias in favor of projects that address large consequences.
In general, we agree with SED Staff who observes that weights on impact dimensions were not chosen based on true equivalence and convertibility of different dimension. There is no optimization of the portfolio, and models are marked by weak transparency and questionable repeatability. Utilities themselves acknowledge that their models are currently not capable of generating a risk reduction per dollar reduction invested and cannot yet achieve cross-risk prioritization of mitigations.
- 119 -

A.15-05-002 et al. COM/MP6/ar9/lil PROPOSED DECISION (Rev. 1)
We agree with the Joint Intervenors’ assertion that the utilities models’ need improvement in order to calculate risk reduction in a way that is comparable across the enterprise. In response to the unsettling issues with the current 1 to 7 scales, SED Staff and parties, including Joint Intervenors, ORA, UCAN, and MGRA make a compelling case that 7x7 logarithm scale scores should ultimately be abandoned in favor of using continuous linear scales/scores. As to the Intervenor’s proposed framework, “for each attribute (consequence category) the utility must specify the range, or units over which the unit will be measured; and the weight or relative importance of each attribute compared to the other identified attribute.” For ease of computing, for LoF, probabilities should be computed on a scale from 0% to %100, and for CoF, attribute ranges can be created naturally as opposed to being constrained to fit a modeling function. This approach would enable attribute ranges, scales, and weights to be transparent and consistent.
Accordingly, on an interim basis before potential full-scale adoption of any model, in the second phase of this proceeding, we conceptually adopt the Joint Intervenor “Multi-Attribute” Approach measures listed on pages 90 - 94 (or utility equivalent features).
Central elements of the Joint Intervenor approach include: LoF based on mathematical probabilities using
condition-dependent hazard rates; CoF expressed using a properly designed multi-attribute
utility function expressed on a linear scale; Evaluation of risk mitigation measuring the risks
reduction per dollar spent; and Replacement of non-optimal ranking methods with
actual optimization techniques.
- 120 -
A.15-05-002 et al. COM/MP6/ar9/lil PROPOSED DECISION (Rev. 1)
Potential full-scale adoption of the Joint Intervenor approach is subject to successful “test runs” of the methodology, in the second phase of this proceeding.
We agree with Joint Intervenors, ORA, UCAN, SCE, and MGRA that “test drives” of the approach, using a small set of detailed test problems (at least five), constitute a good approach to evaluate Joint Intervenor probabilistic modeling of safety risks. “Test drives” of the methodology should also be used to work through specific case studies of extreme event risks and allow all parties to analyze how both utility models and the Joint Intervenor Approach would calculate risk scores and validate the statistical validity of the approaches. Similarly, “test drives” should be used to evaluate the Joint Intervenor Approach to non-asset related risks raised by utilities such as cybersecurity issues, environmental issues or pandemics.
As to “weighting” of the “safety” or other dimensions, given the lack of maturity of existing risk management models, we agree with parties that imposing weighting or formulas for risk identification and evaluation at the present time is premature and requires further discussion in Phase Two of this proceeding.
We agree with parties that such a model fulfills the goals of ensuring that safety is the highest priority; enables the computation of cost-effectiveness for different mitigations; is relatively transparent, and easy to use; and given the extensive applicability of the model to regulated utilities, can be used by not only electric companies, but gas companies as well. This approach balances Section 963 (b)(3) (“safety is the Commission’s highest priority”) with Section 451 (rates must be
- 121 -
A.15-05-002 et al. COM/MP6/ar9/lil PROPOSED DECISION (Rev. 1)
“just and reasonable” in light of constraints that utilities face, such as budget, available labor and equipment, etc.).
This approach supports principles of transparency, participation (ongoing collaboration), and accountability. Beyond access to an Excel spreadsheet, we agree with parties that the processes and methodologies used by utilities must be fully transparent to parties, including regulators and intervenors. Being able to replicate each step of the process towards calculating risk and choosing risk management action is of paramount importance.
In addition to the advantages cited in the introduction to this section, we agree with MGRA’s list of advantages including that the Intervenor Approach: 1) is a superior mitigation strategy over simple ranking of projects by cost/benefit analysis; 2) uses subject matter experts as an interim measure to deal with lack of data; 3) is compatible with the ALARP approach which helps determine constraints or “risk tolerance” that need to be managed; and 4) is able to incorporate exogenous impacts on asset conditions such as high winds. Given that ALARP does not choose “optimum,” the primary focus should be to enable the development of an optimized portfolio of risk mitigation measures.
We acknowledge that there are potential obstacles to effective implementation including lack of data, lack of familiarity with models and expertise, and utility resistance to switching to other models after spending years on existing models. However, these matters are not impossible to overcome and are far outweighed by the potential upside of the short- and long-term benefits as described.
- 122 -
A.15-05-002 et al. COM/MP6/ar9/lil PROPOSED DECISION (Rev. 1)
We are encouraged that utilities have recently been experimenting with probabilistic models through pilots that contain some of the attributes (e.g., use of LoF, CoF, CP, and calculations for risk reduction) that we are adopting in concept in this decision.99 However, given the utilities’ stated interest in preserving their own models, we understand why they not have been as forthcoming in the presentation of these models and direct them to share the results of these pilots so that the attributes of the various models can be compared with those of the EPRI and other alternative models.
While we are endorsing in concept the Joint Intervenor Multi-Attribute Approach, much more work needs to be done to vet the “foundational requirements” of the approach, test drive the model against real-life business scenarios; determine where the Commission or utility needs to provide guidance or not (e.g., determination of “safety” or other weights); rank order the most desirable measures in terms of priority for the first S-MAP second phase versus second S-MAP; reconcile parties’ different approaches; assess subject matter expertise versus availability of data via sensitivity analysis; determine in greater detail how the Joint Intervenor Approach is being used by other utilities around the country; and work out other program details.
Although we appreciate the Utilities’ efforts to migrate towards more uniform approaches and experiment with probabilistic analysis, we see no compelling reason to spend a large, disproportionate investment of time correcting the inconsistencies in the utilities’ current indexing models that will likely continue to “fall short” despite
99 Joint Intervenors’ Comments on Intervenor White Paper at 3.
- 123 -
A.15-05-002 et al. COM/MP6/ar9/lil PROPOSED DECISION (Rev. 1)
superficial “fixes.” Adhering to the 7x7 model only encourages ongoing entrenchment in current methodologies and unnecessarily delays any decision until the next S-MAP three or more years away. If we allow this to happen, we agree with parties that we will waste valuable time, lose much momentum in this proceeding, and undermine the explicit Commission direction provided by D.14-12-025. During this transition we agree with the adage that “the perfect should not be the enemy of the good.”
In the interest of establishing business certainty for the utilities, we provide clear direction that change is necessary now to implement safety objectives and that the Commission is serious about migrating from relative risk scoring to more quantitative methods for optimized risk mitigation. Such an approach provides the necessary information to balance safety and reasonable rate objectives and make clear, risk-informed choices about safety-related expenditures. We agree with staff and parties that without strong Commission direction, it is unlikely that the utilities will embrace change and adopt a common risk management approach at a pace and to the extent that the Commission and intervenors might desire. In this decision, we reject the utilities’ position that we should delay any significant progress until the next S-MAP in approximately three years and direct the parties to work with Commission staff to consider additional steps toward uniformity in the second phase of this proceeding.
In this decision, we agree with Joint Intervenors’, MGRA’s and UCAN’s observations that the Joint Intervenor Approach has already
- 124 -
A.15-05-002 et al. COM/MP6/ar9/lil PROPOSED DECISION (Rev. 1)
received much high-level “vetting” through the workshop and through comment/reply process on the Joint Intervenor White Paper.100
According to UCAN: Even though the utilities claim that the record does not support the adoption of the JIF [Joint Intervenor Framework], UCAN would note that the Commission considered the proposal, heard from two different experts as well as the sponsors of the proposal in a Commission workshop, reviewed 6 parties’ comments to the proposal, and 6 parties’ reply comments, reviewed the SED evaluation report on the risk evaluation models which compared and contrasted all the models under consideration in this proceeding including the JIF, reviewed 6 parties’ comments to the SED report and 6 parties’ reply comments to that report. The record amply supports the PD’s conclusion to adopt on an interim basis the JIF.101
MGRA makes a good point in its reply comments that we need to ask ourselves whether high-level theoretical discussions would further shed light on the pros and cons of the Joint Intervenor Approach or whether it would be more desirable to “start defining solid, tangible risk problems that clearly illustrate the concerns that utilities and other parties raise.”102 We agree with MGRA’s assumption that further “vetting” of the Joint Intervenor Approach would be “part and parcel” of the “test drive” process.103 A review of the Joint Intervenor Approach would naturally include a review of common attributes, potential weights for each attributes, potential sub-attributes and
100 TURN Reply Comments on PD at 4; MGRA Reply Comments on PD at 2; UCAN Reply Comments on PD at 3. 101 UCAN Reply Comments on PD at 3. 102 MGRA Reply Comments on PD at 2. 103 MGRA Reply Comments on PD at 2.
- 125 -

A.15-05-002 et al. COM/MP6/ar9/lil PROPOSED DECISION (Rev. 1)
potential weights for sub-attributes, natural units (e.g. MW), determination of “natural units” into points, determination of how SME input would be calibrated, etc.104
If shortcomings are uncovered during “test drives” of any model, then this would be documented, and included in any final evaluation of the model for Commission consideration. To the extent that utilities are already conducting probabilistic model testing, this can be used to better leverage “test drive” efforts and desired outcomes consistent with Commission goals.
We emphasize that this decision is an “interim” decision. Contrary to some suggestions made by parties in comments, this decision does not “order” or “mandate” that the utilities immediately implement the Joint Intervenor, multi-attribute, probabilistic model. This decision affirms that the characteristics of the Joint Intervenor Approach, as discussed in this section, would improve the quality of existing risk-based decision making approaches. And implementing such a model would require many steps both in the short- and long-term. Many goals such as improved data collection and subject matter expertise, and optimization of the portfolio will take time.
We discuss the desired pace of change implement needed changes in the upcoming Road Map section.
10. Potential Barriers to Effective ImplementationThe following is a discussion of several “barriers to
implementation” that could impede progress of this utility safety risk reduction program if left unmanaged or unchecked. Potential obstacles to effective implementation of models include intrusion of
104 For a more complete list, see PG&E Comments on PD at 13.
- 126 -

A.15-05-002 et al. COM/MP6/ar9/lil PROPOSED DECISION (Rev. 1)
financial interests into enterprise and ORM focus, lack of data and calibration of subject matter expertise, and potential limited staffing and lack of expertise over time.
10.1. Intrusion of Shareholders’ Financial Interests
According to SED Staff, shareholder financial interests crept into the enterprise and ORM focus. The utilities’ risk assessment models and risk management frameworks as presented in this proceeding are based on enterprise and operational level risk management (EORM). With EORM, a utility manages risks at both the operational level and the enterprise level explicitly for the benefit respectively of the operation and of the enterprise. Implicit in EORM are the beneficiaries of the actions taken to reduce risks. When a utility practices risk management, it in effect acts as a fiduciary to mitigate risks for the benefit of the public at-large, utility workers, contractors to the utility, the environment, utility regulators, utility customers, intervenors in Commission proceedings, other stakeholders, and shareholders. The interests of these different beneficiary groups are reflected in the categories used by the utilities to characterize the potential consequence (or impact) and evaluate impact scores in the risk scoring formulas.
Accordingly, SED Staff recommends that the utilities should remove shareholders’ financial interests from consideration in their risk models and decision frameworks used to support rate case expenditure proposals.
With the exception of Joint Utilities and CUE, Joint Intervenors, ORA, UCAN, and MGRA generally agree with this finding and
- 127 -
A.15-05-002 et al. COM/MP6/ar9/lil PROPOSED DECISION (Rev. 1)
recommendation with limited exceptions. According to ORA, “Shareholder financial considerations should be removed from utility models, although some ratepayer financial considerations may warrant consideration on a case-by-case basis.”1 Similarly, MGRA has brought up this point several times at workshops and repeatedly asserts that “financial risk affecting shareholders has no place in risk estimations that are relevant to Commission or to ratepayers. We think that this component needs to be removed from the ‘common’ methodology, with an exception for financial losses that can be recovered from ratepayers.”2
In contrast, CUE disagrees that overemphasis of shareholder financial interests is an issue: “While it is commonly believed that utility decisions are controlled by the interests of shareholders, our observation is that most analysis and planning is performed by mid-level professionals who simply seek to make utility systems safer and more reliable.”3 Joint Utilities consider financial impacts of events very important and regardless of who pays, utilities want to avoid high cost events. They allege that “taking out financial impacts would not materially shift the 1-n top safety risk priority list but it is an important consideration when gauging total impact of an event and should not be ignored.”4 Joint Utilities claim that it is unclear how they can separate out financial interests of shareholders and customers since they are “intertwined” and it is not possible to
1 ORA Comments on Staff Report at 1. 2 MGRA Reply Comments on Intervenor White Paper at 10.3 CUE Comments on Staff Report at 7-8. 4 Joint Utilities’ Comments on Staff Report at 4.
- 128 -

A.15-05-002 et al. COM/MP6/ar9/lil PROPOSED DECISION (Rev. 1)
predict what costs for risks shareholders should pay for versus ratepayers.5 “For instance, if utility credit ratings deteriorate, they would also result in customer rates going up. Financial interests of ratepayers should not be excluded simply because shareholders have similar interests.”6 When utilities assess risks at the enterprise level, they don’t necessarily place a preference on one over the other.
MGRA questions this logic since it implies that “what is good for the utility is good for ratepayers.” “However the entire CPUC regulatory framework is premised on the assumption that utility interests are separate from ratepayer interests, and must be carefully regulated.”7 With this line of thinking, any financial losses may be passed to ratepayers, but there are no assurances that financial gains will be passed on to ratepayers. In response to MGRA’s comments, Joint Utilities argue, “All risks, if realized, have a financial impact whether it is acknowledged in the scoring mechanism or not.8 They further explain, “Plus the point is moot, since the risks that are the focus of this proceeding do not consider any financial impacts.”9
UCAN argues that “taking financial impacts out would not shift the 1-n top safety risk priority but is important consideration when gauging total impact of an event and should not be ignored.”10 That being said, UCAN doesn’t change its position: “If the results will be the same when a utility considers shareholder interests and when 5 Joint Utilities’ Comments on Staff Report at 18. 6 Joint Utilities’ Comments on Staff Report at 18. 7 MGRA Reply Comments on Staff Report at 5. 8 Joint Utilities’ Reply Comments on Staff Report at 5.9 Joint Utilities’ Reply Comments on Staff Report at 5 - 6.10 UCAN Reply Comments on Staff Report at 6.
- 129 -
A.15-05-002 et al. COM/MP6/ar9/lil PROPOSED DECISION (Rev. 1)
they exclude consideration of shareholder interests, then SED’s recommendation in this regard should be heeded.”11
Based on the parties’ discussion, it is difficult to assess to what extent shareholder considerations have crept into the equation to assess top safety risks at the enterprise and operational level especially since Joint Utilities claim that their current top risks are devoid of such considerations. In general, we strongly agree that prioritizing the reduction of safety risks in RAMP should be geared towards safety risk, irrespective of shareholder considerations. The issue is compounded when one considers the strengths of weaknesses of the current 7x7 indexing model. “While it is acceptable to in principle to use logarithmic scales for CoF, this approach can mask the weights assigned to the various attributes (e.g., financial) and prevent the weights from being consistent with the attribute scales themselves.”12 This lack of transparency makes it difficult to ascertain the weight of and the tradeoffs between the “safety” attribute, versus other attributes such as “reliability,” and “compliance, etc. For now, we agree with SED staff’s recommendation that the utilities should remove shareholders’ financial interests from consideration in their risk models and the decision frameworks used to support rate case expenditure proposals, especially at the operational level, unless the utility can make a good case for an exception in its RAMP filing. As ORA suggests, “some assessment of financial
11 UCAN Reply Comments on Staff Report at 6. 12 Joint Intervenors’ “Technical Appendix Risk Reduction, Probability Distributions of Consequences, and the Importance of Using Expected Values,” by Charles D. Feinstein, Ph.D and Jonathan A. Lesser, Ph.D., February 26, 2016, at 2.
- 130 -

A.15-05-002 et al. COM/MP6/ar9/lil PROPOSED DECISION (Rev. 1)
risks may serve as useful indictors of impacts, but these should be evaluated on a case-by-case basis.”13
10.2. Sufficiency of Data Collection and Subject Matter Expertise
Some parties question whether there is sufficient data to proceed with model development (e.g., Intervenor and ALARP Models). Other parties believe that the use of subject matter expertise provides an interim bridge until data sets are sufficiently developed.
The following highlights the perspectives of key parties and discusses Commission’s direction in this area moving forward.
According to the Joint Utilities, “one of the biggest issues that has come up is the inputs to the risk models in terms of data to determine the Likelihood of Failure (LoF) and Consequences of Failure (CoF).”14 Confidence in risk scores erodes if there is underdeveloped data regardless of which scoring model is used. In the intermediate term, they suggest that a key priority should be developing data/probabilistic risk modeling. “These models will also facilitate transparency regarding the asset attributes, rationale for risk scores, and choice of mitigation.”15
CUE agrees with this point of view: “As we have heard throughout this proceeding, the IOUs have large gaps in the data necessary to perform quantitative methods for assessing risk with any certainty…Therefore the interim plan should allow enough time for
13 ORA Comments on Staff Report at 6.14 Joint Utilities’ Comments on Intervenor White Paper at 4. 15 Joint Utilities’ Comments on Intervenor White Paper at 4.
- 131 -

A.15-05-002 et al. COM/MP6/ar9/lil PROPOSED DECISION (Rev. 1)
the utilities to gather the necessary data.”16 CUE states that it is unrealistic for the Commission to use solely quantitative data, if the data does not support decision-making at such granular and specific levels. Utilities acknowledge that no matter what model is used, subject matter expertise is always important.
ORA questions the use of subject matter expertise that would substitute for data during an interim transition period. “It is unclear how reliable such expertise would be, particularly given the age of some assets, the safety and liability implications of such substitution on a large scale, and what data cannot be replaced (even if only on a temporary basis) by subject matter expertise.”17 Accordingly, ORA believes that it is “premature” to establish a model that would rely on subject matter expertise, when there is a need for more solid quantitative data. ORA qualifies this statement by stating that concerns about heavy reliance on SME’s are valid, but the Intervenor Methodology does not inherently rely heavily on SME’s as claimed in the Staff Report. “Calibration for data sensitivity could address instances where the use of SME data is most problematic.”18
In contrast to ORA and UCAN’s position, Joint Intervenors argue that “as a result of implementing the intervenor White Paper approach to risk management and the short-term measures above, the utilities will gain an improved understanding of what data is required to determine the optimal portfolio. As the utilities collect additional
16 CUE Comments on Intervenor White Paper at 2. 17 ORA Comments on Intervenor White Paper at 4. 18 ORA Comments on Staff Report at 1.
- 132 -
A.15-05-002 et al. COM/MP6/ar9/lil PROPOSED DECISION (Rev. 1)
data, SMEs will continue to have an important role in supplementing the data and confirming its reliability.”19
In response to utilities’ concerns about the time and expense required to collect data necessary to implement probabilistic methodologies, Joint Utilities“note that a particular strength of their proposed approach is its ability to identify data requirements, ensuring that data gathering is done in the most efficient and cost-effective manner by focusing on the most valuable data needed.”20 Joint Intervenors agree with Joint Utilities that SMEs will always fulfill an important role in risk management. They emphasize that “SMEs can help provide data inputs where observed data is otherwise missing during the early implementation of a probabilistic methodology.”21 As to MGRA’s concerns about managing uncertainty and whether ranges should be included in any frequency or consequence estimates used in calculations, “the Joint Intervenor Approach provides for the incorporation of uncertainty in risk scores through the use of sensitivity analysis.”22
MGRA agrees with the Joint Intervenors’ basic position. “Where data availability is insufficient, MGRA would suggest adopting the Joint Intervenor white paper suggestion of using SME estimates as the initial value for risk estimation.”23 MGRA advocates for the increased use of simulations. In response, Joint Intervenors state 19 Joint Intervenors’ Reply Comments on Staff Report at 9.20 Joint Intervenors’ Comments on Intervenor White Paper at 9.21 Joint Intervenors’ Reply Comments on Staff Report at 9. 22 Joint Intervenors’ Reply Comments on Staff Report at 9. 23 MGRA Comments on Staff Report at 7.
- 133 -
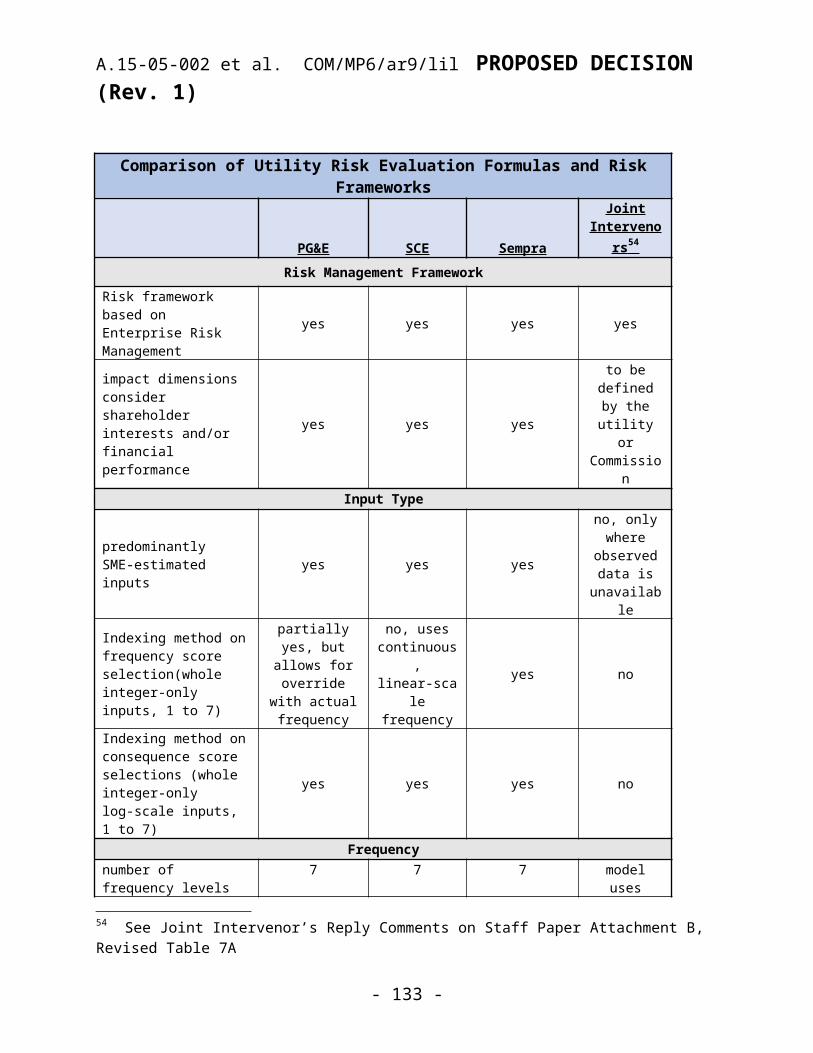
A.15-05-002 et al. COM/MP6/ar9/lil PROPOSED DECISION (Rev. 1)
“whenever possible, analysis, real world experience and institutional knowledge is preferable to reliance on simulation. Simulations should only be relied on in those instances where a probability distribution cannot be developed analytically.”24
As to next steps, MGRA recommends, “In the interim, leverage data that is currently being collected regarding weather, fire, outage rates, and inspections to obtain initial estimates of risk. In the longer term, determine what sort of data needs to be gathered in order to adequately quantify unknown risks.”25
ORA suggests, “To continue developing data and models ahead of the next S-MAP, a Technical Working Group should be established. The Working Group could also address questions related to the timeline/transition, including:
What data is necessary to successfully implement a quantitative framework?How long will it take to gather the necessary data, and how does this change the timeline? In which cases will gathering the data take longer? How should this be addressed? Where (if anywhere) is gathering the data impossible or ineffective, and how will utilities compensate for this? What level of data “completeness” is needed before beginning to use the model?When and to what extent, can SME expertise be substituted for this data, both within the transition period, and more generally?26
24 Joint Intervenors’ Reply Comments on Intervenor White Paper at 14. 25 MGRA Comments on Intervenor White Paper at 11.26 ORA Comments on Intervenor White Paper” at 5-6.
- 134 -
A.15-05-002 et al. COM/MP6/ar9/lil PROPOSED DECISION (Rev. 1)
In this decision, we agree with parties that the utilities should continue to improve their risk management models and data collection efforts to support increasing use of fully probabilistic risk management models in both the short- and long-term. Further, there is no reason to delay using any of the models due to the lack of data. Implementing new models provides a unique opportunity to improve data collection over time. In the meantime, SMEs can help provide data inputs where observed data is otherwise missing during the early implementation of a probabilistic methodology. For asset based risks, in the absence of objective asset condition data, calibrated subject matter expertise is an essential component of developing the distributions used in risk analysis. While lack of data can be a short-term obstacle to implementation, it also presents a unique opportunity to improve understanding about what data is required to determine the optimal portfolio. As additional required data is collected, SMEs will continue to have an important role in supplementing the data and verifying its reliability.
In this decision, we agree with ORA that a Technical Working Group should be established in the Second Phase of this proceeding (perhaps an outgrowth of the Metrics Working Group) that will address questions related to what data is needed to support risk evaluation, at what granular level, how long it will take to gather the data, and how SMEs can continue to fulfill an important role in filling in the data gaps.
- 135 -

A.15-05-002 et al. COM/MP6/ar9/lil PROPOSED DECISION (Rev. 1)
10.3. Limited Expertise and Lack of Familiarity with Models
According to D.14-12-025, the time that it may take to develop uniform and common standards raises an important topic regarding “whether Commission staff and other parties have the expertise to understand and analyze the utilities’ risk assessment methods and methodologies in the S-MAP proceeding.”27 D.14-12-025 left it up to the Commission’s executive management and staff to decide whether it has the internal resources and expertise to participate in the S-MAP, or if it needs to retain outside consultants who understand the assessment and management of the risks inherent in the operations of an energy utility.28 In the past, the Commission has hired consultants to evaluate risk assessment analysis in GRC applications. For example, on March 5, 2012, the Commission’s Executive Director directed PG&E to perform a risk assessment of its gas and electric distribution systems and electric generation facilities, and to include in its 2014 GRC application the risk assessments that form the basis for PG&E’s forecast. This resulted in the hiring of safety and risk assessment consultants by the Commission’s SED and the issuance of reports of their findings.29
In the first phase of this proceeding, Commission budget constraints precluded the hiring of consultants to evaluate the utilities’ applications or provide third-party facilitation. Instead, SED staff performed multiple roles of independent evaluator (SED Staff 27 D.14-12-025 at 26-27.28 D.14-02-025 at 28. According to D.14-02-025, “…the Executive Director shall ensure there is adequate staffing to undertake work associated with risk-based decision making framework adopted in this decision.” See OP 7 at 56. 29 D.14-02-025 at 16-17.
- 136 -
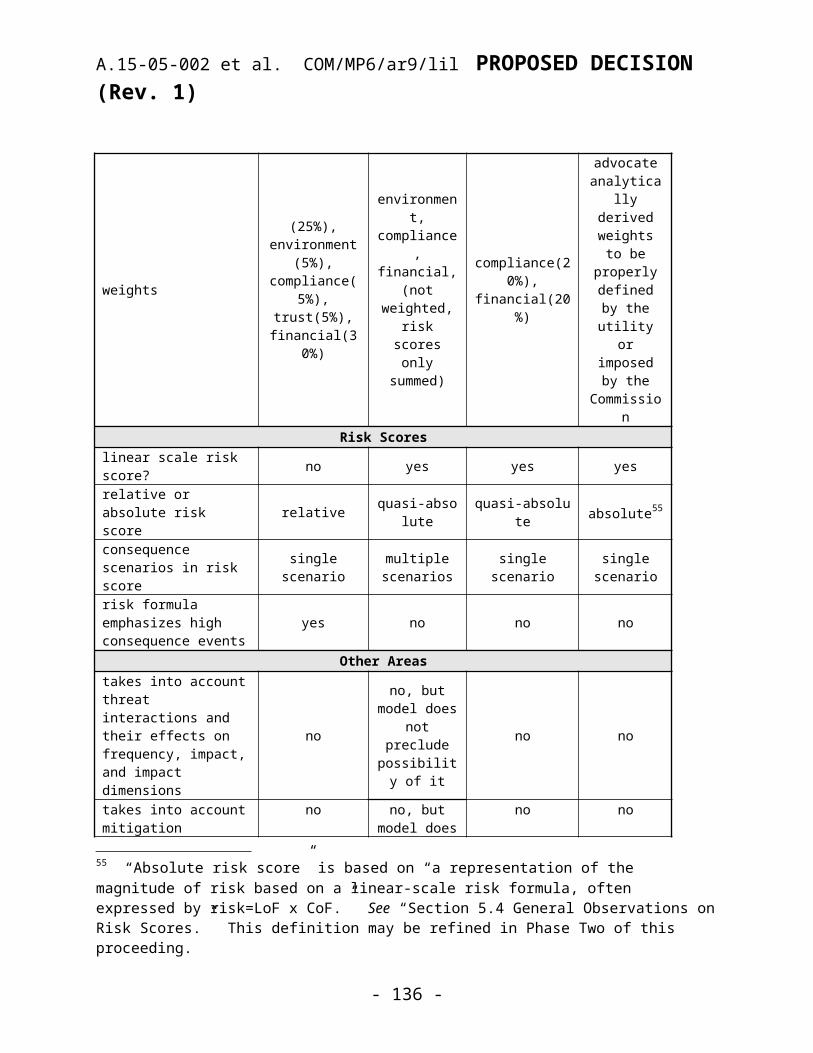
A.15-05-002 et al. COM/MP6/ar9/lil PROPOSED DECISION (Rev. 1)
“Findings”); advocate (SED Staff “Recommendations”); “neutral” workshop facilitator and recorder (five workshops); and advisor to the assigned Commissioner and ALJ (as requested) in this rulemaking.
Apart from the success of this initial S-MAP, several issues could arise in the future related to the workload itself and actual roles of SED Staff as S-MAPs become more sophisticated: 1) Does the Commission have the breadth and depth of expertise and time required to review ongoing RAMP applications, metrics, accountability reports, and other deliverables? In the future, if staff expertise is not available or spread too thin, to what extent will this slow down proceeding timelines and delay issuance of needed deliverables in the context of RAMP and GRC proceeding deadlines? How are these roles reconciled if the interests of all of the roles are not aligned? For example, D.14-02-025 left it up to the RAMP proceedings to determine whether staff or consultants would testify should there be a need for hearings. In this case, advocacy and advisory functions should be clearly separated.
In the longer term, as risk management frameworks evolve, what is the Commission’s plan to obtain scientific, engineering, and other technical expertise to help address knowledge gaps in specific areas and manage various staff roles, as described above, more effectively?30 30 In its FY 2016-2017 budget request, the Commission has proposed creation of a new Division of Safety Analysis (DSA). As currently described, DSA would provide expert testimony and safety advocacy in general rate cases, akin to the role that ORA plays with regard to utility rates and expenditure requests, but devoted specifically to safety of utility infrastructure and operations. As an independent intervenor, the exact role DSA might have in future S-MAP cycles, the RAMP phase of GRCs, or accountability reporting, is unclear and can be expected to evolve over time as it grows in resources and experience. However, it is possible that a future S-MAP proceeding could redirect some of the GRC oversight responsibilities
- 137 -

A.15-05-002 et al. COM/MP6/ar9/lil PROPOSED DECISION (Rev. 1)
In this proceeding, we were aided not only by Commission staff expertise but also by outside consultants to both the Joint Utilities (i.e. ALARP Proposal) and Joint Intervenors (i.e. Joint Intervenor Proposal). These parties, in cooperation with consultants, provided valuable “on the record,” long- and short-term approaches to a practical risk management framework that have the potential to help meet Commission goals. It remains to be seen whether Commission staff will continue to piggyback on the work of these outside consultants to gain more familiarity with the models and gain needed expertise. As D.14-12-025 stated, “For those parties eligible for the Commission’s intervenor compensation program, who don’t have the internal resources to participate, those parties will need to decide whether they can afford to retain a consultant, and whether they will be able to make a significant contribution to the decision which is issued in connection with the S-MAP so that they can recover the cost of the consultant.”31
Overcoming organizational development obstacles in a risk-based decision-making program requires the Commission’s ongoing access to outside professional consulting expertise if needed, adequate breadth and depth of Commission staffing and subject matter expertise, and effective management of multiple staff roles. If these issues are not addressed and effectively managed, then the ongoing risk management program and timeline for achieving desired milestones may be compromised in the second phase of this S-MAP or successive S-MAPs.
currently assigned to SED or ED Staff to the new Division, if appropriate to its mission. 31 D.14-12-025 at 28.
- 138 -

A.15-05-002 et al. COM/MP6/ar9/lil PROPOSED DECISION (Rev. 1)
11. RAMP Requirements and Guidance 11.1. D.14-12-025 RequirementsDecision 14-12-025 provides guidance for assessing and
mitigating risk in future GRCs. Given these requirements, this PD addresses any proposed SED Staff and/or parties’ suggested changes.
Purpose of RAMPThe objective of the RAMP is to incorporate the risk assessment approach used by each of the energy utilities, as developed in the S-MAP, into the GRC process. This will provide a transparent process to ensure that the energy utilities are placing the safety of the public, and of their employees, as a top priority in their respective GRC proceedings. Each energy utility would be required under the RAMP proposal to submit its RAMP report to the SED as part of the GRC process. The purpose of the utility’s RAMP report is to provide information about the utility’s assessment of its key safety risks and its proposed programs for mitigating those risks.1
Content of RAMPIn the initial phase of each utility’s GRC, a RAMP occurs in
which the utility presents the top ten asset-related risks for which the utility expects to seek recovery in the GRC. The focus of at least the initial RAMP will be on asset conditions and mitigating risks to those assets. However, with each successive S-MAP proceeding, S-MAPs will become more and more sophisticated, and the Commission will also have better information upon which to develop more refined guidelines and standards that go beyond just asset conditions. Assessments that make up the RAMP will be based on mandatory requirements previously vetted by parties in the most recent S-MAP.
1 D.14-12-025 at 35-36.
- 139 -
A.15-05-002 et al. COM/MP6/ar9/lil PROPOSED DECISION (Rev. 1)
A transparent process allows all parties, including Commission staff, to have the opportunity to question the analysis, data and assumptions underlying the utility’s filing and to present a response to the utility’s filing. There is no Commission decision in this phase. At the same time, staff and interested parties’ responses to the utility RAMP filing would “inform” the utility’s recommended projects and funding requests in the subsequent phase of the GRC, which would be equivalent to the current project-focused GRC.2
D.14-12-025 also directs the utilities to include in their filings, “For comparison purposes, at least two other alternative mitigation plans the utility considered and an explanation of why the utility views these plans as inferior to the proposal plan.”3 The utilities should present these two alternative scenarios in their RAMP filings. The utilities should justify why they chose the alternatives that they did, based on the change in risk reduction, cost, reasonableness, current conditions, and other analyses.
TimelineThe following is the schedule to be followed in opening the OII,
filing the RAMP, and incorporating the RAMP into the GRC application filing.4
2 D.14-12-025 at 11.3 D.14-12-025 at 32.4 D.14-12-025 at 41-42.
- 140 -
A.15-05-002 et al. COM/MP6/ar9/lil PROPOSED DECISION (Rev. 1)
RAMP Application
Date ActivitySeptember 1 of the year prior to the GRC filing date.
Utility sends letter to Executive Director (with a copy to the Chief ALJ) requesting that an OII be initiated for the utility’s upcoming GRC filing, and pursuant to this decision.
By November 15 of the year prior to the GRC filing date.
OII for the upcoming GRC initiated.
By November 30 of the year prior to the GRC filing date.
Utility files RAMP submission in the OII.
By December 15 of the year prior to the GRC filing date.
PHC held.
By December 15 of the year prior to the GRC filing date.
Utility and SED hold public workshop on utility’s RAMP submission.
February 28, prior to the GRC filing date.
SED files and serve staff report on utility’s RAMP submission.
By March 15, prior to the GRC filing date.
Staff hosts public workshop on SED staff report.
April 10, prior to the GRC filing date.
Other parties serve comments on utility’s RAMP submission, and on SED’s staff report.
April/May If needed, additional workshops on RAMP-related items.
May to August, prior to the GRC filing date.
Utility incorporates RAMP results into its GRC filing.
GRC Application Filing
September 1 Utility files GRC application, and serves prepared testimony including changes resulting from the RAMP process.
Per Rule 2.6(a). Protests and responses filed to GRC application.By October 15 Utility holds public workshop on overall GRC
application.
- 141 -
A.15-05-002 et al. COM/MP6/ar9/lil PROPOSED DECISION (Rev. 1)
By October 31 PHC held.By February 20 ORA serves opening testimony.By March 17 Intervenors serve opening testimony.May 1 Concurrent rebuttal testimony served.March/April Public Participation Hearings.May/June (Three or four weeks of evidentiary hearings.)
Evidentiary hearings held, if needed.
To be decided. Opening briefs filed.To be decided. Reply briefs filed.May/June Update testimony and hearings, if necessary.September/October Proposed decision.November Final decision.In accordance with Verification schedule discussed in this decision.
Utility files annual Risk Mitigation Accountability Report and Risk Spending Accountability Report.
According to D.14-12-025, We will require each of the four large energy utilities to send a letter to the Commission’s Executive Director (with a copy to the Chief ALJ) requesting that an Order Instituting Investigation (OII) be opened in connection with its upcoming GRC filing, and pursuant to this decision. This letter shall be submitted by September 1 of the year preceding the utility’s scheduled GRC application filing. An OII will then be issued by the Commission in connection with the utility’s upcoming GRC filing, which will provide a proceeding in which the RAMP submission can be made. The utility shall then file its RAMP in that OII.5
Content
5 D.14-12-025 at 37-38.
- 142 -

A.15-05-002 et al. COM/MP6/ar9/lil PROPOSED DECISION (Rev. 1)
The Refined Straw Proposal referenced in D.14-12-025 describes the recommended content of the RAMP filing. At a minimum, it should contain:
The utility’s prioritization of the risks it believes it is facing and a description of the methodology used to determine these risks.
A description of the controls currently in place as well as the “baseline” costs associated with the current controls.
The utility’s prioritization of risk mitigation alternatives, in light of estimated mitigation costs in relation to risk mitigation benefits (Risk Mitigated to Cost Ratio).
The utility’s risk mitigation plan, including an explanation of how the plan takes into account: utility financial constraints; execution feasibility; affordability impacts; and any other constraints identified by the utility.
For comparison purposes, at least two other alternative mitigation plans the utility considered and an explanation of why the utility views these plans as inferior to the proposed plan.6
D.14-12-025 extends the filing:Limiting the utility’s RAMP submission to just 10 asset categories may prevent the Commission and interested parties from having a comprehensive view of the utilities potential safety risks, and its plans for addressing those risks. Since the RAMP will provide the first opportunity for parties to see how the utility prioritizes safety in terms of its assets and operations, the RAMP should not be limited to a maximum of 10 asset categories. Accordingly, the utility’s RAMP submission shall include all of its risk assessments and mitigation plans. [emphasis added]7
6 D.14-12-025 at 32.7 D.14-12-025 at 39-40.
- 143 -

A.15-05-002 et al. COM/MP6/ar9/lil PROPOSED DECISION (Rev. 1)
To facilitate transparent review, D.14-12-025 also required each utility’s GRC filing to explain how it met parties’ and staff concerns about the utility’s RAMP application. D.14-12-025 did not adopt the proposal that the SED report on the utility’s RAMP submission be included as part of the utility’s GRC filing submission.8
The utility will host a public workshop after it files its RAMP application and provide an overview of its submission for the benefit of staff and interested parties. SED will file and serve a single report (only) on the utility’s RAMP submission. “The objective of this staff report is to evaluate the utility’s risk assessment procedures, and to assess the technical merits of the utility’s proposal.”9
Flexibility of RAMPAccording to D.14-12-025, while the S-MAP and RAMP processes
provide specific requirements, this decision and follow-up ones have the flexibility to take action to adjudicate the S-MAP application and/or RAMP application process and/or alter schedules as appropriate.10
11.2. SED Staff RecommendationsThe following are SED Staff recommendations that have not
already been specified by the requirements of D.14-12-025: (For more background and detail, see Staff Report pages 77 through 85.)
The Utilities should more fully explain their approaches to risk assessment in RAMP filings
8 D.14-12-025 at 40. 9 D.14-12-025 at 38.10 D.14-12-025 at 43.
- 144 -

A.15-05-002 et al. COM/MP6/ar9/lil PROPOSED DECISION (Rev. 1)
For their RAMP filings, the utilities will make choices about how many risks to include and how to select those risks. The utilities should explain, in narrative form and with charts, how and why they made the choices that they did. For example, if a utility includes all items of level four or above on its 7x7 risk matrix in its RAMP filing, then the utility should explain why four is the optimal level. If the utility takes those risks of “consequence” level four or above but does not also include the “frequency” category, then the utility should explain in narrative why the result is optimized through that method and not through a different method. If the utility blends the “consequence” and “frequency” categories, with or without a greater weight on one or the other, then the utility should explain why it chose that approach. If the utility uses the result of its risk score algorithm to rank its top risks, then it should describe that choice.
The goal of the S-MAP proceeding is to make California safer by explicit identification and prioritization of the mitigations that can enhance safety. The utility should therefore show in its RAMP filing how it is accomplishing the goal of the S-MAP proceeding. The RAMP filing is an opportunity for the utilities to improve their methods for assessing and mitigating risk. It is also a way for the utilities to demonstrate new methods to better calculate and identify risk — and to mitigate risk more effectively. The utilities should use the RAMP filings as opportunities to clearly identify the most effective ways to achieve these goals and should communicate that understanding to all parties so that others can adopt the best practices that result.
Demonstrate progress towards “risk-spend efficiency” calculations
- 145 -

A.15-05-002 et al. COM/MP6/ar9/lil PROPOSED DECISION (Rev. 1)
California’s utilities have attempted to develop “risk-spend efficiency” calculations that can compare the costs and benefits of particular mitigations. These calculations have posed a challenge, and the utilities and other parties have not always agreed among themselves on what methods are most useful for calculating risk-spend efficiency. Nevertheless, understanding the costs of mitigations is an important part of the proceeding and an important step toward a more transparent and robust analysis of safety expenditures in the GRCs. The utilities should include risk-spend efficiency calculations in their RAMP filings, even if those calculations are imperfect. It may take iterations over multiple cycles to refine those calculations, but by starting now California can benefit in the future. This guidance is for S-MAP #1. By S-MAP #2 or S-MAP #3 these risk-spend efficiency calculations should improve. If a utility develops a different method to calculate and optimize its spending for mitigations, then the utility should describe that method in its RAMP filing for the Commission to understand and for other parties to see.
How the Utilities [should] show progress toward probabilistic calculations
SED Staff and the parties to the S-MAP proceeding have had discussions on the goal of developing probabilistic calculations of risk. Currently, the utilities rank relative risks on a 7x7 matrix using a logarithmic scale. Ultimately, the utilities might instead carry out a more precise calculation. The utilities should describe their progress toward probabilistic calculations in their RAMP filings. If the utility has been able to do more precise calculations of risk for one of its lines of business, sub-lines of business, sub-sub-lines, or other portion
- 146 -
A.15-05-002 et al. COM/MP6/ar9/lil PROPOSED DECISION (Rev. 1)
of its operations, then the utility should indicate that success. It should also indicate whether that success can be used as a platform for carrying out more precise calculations of risk in the future for other portions of its business, stating which ones. The utility should indicate how many more years of work it will need before the next portions of its business can benefit from probabilistic analysis. Each utility should indicate those areas where it is most advanced in its progress toward probabilistic analysis; those areas that it expects to come next; and the areas of its business that are still quite far from using probabilistic risk assessment. It might be possible for the utilities to use a table format to show progress: the first column might show the most advanced areas, where the utility is within one to three years of achieving probabilistic analysis; the second column could show areas three to five years away from that point; and a third column could show areas of business that are five to seven years away.
Sempra ExampleFor example, the Sempra utilities have made progress on
calculating and analyzing risks related to wildfires — Sempra’s number one risk. While the utility does not have a similar depth of analysis for its other risks, it has made progress in a key area. The utility has also said that it is working on ways to more precisely calculate risks related to gas transmission and gas distribution. But in other areas, Sempra may lack data or otherwise lack the ability to improve its risk calculations.
For Sempra utilities, column one might have wildfires only; column two might have gas transmission, gas distribution, and other
- 147 -

A.15-05-002 et al. COM/MP6/ar9/lil PROPOSED DECISION (Rev. 1)
areas; column three would have areas of greater difficulty. For areas of the business that lack data for advanced calculations, the utility should indicate the steps that it is taking to develop that data over time and indicate a timeframe for how long it may take. For areas where the utility has succeeded in advancing its calculations, it should indicate whether and how those successes can inform its work to improve other risk calculations.
Inclusion of Safety Culture and Organizational Structure in RAMP Filings
The SED Staff Report recommended that RAMP filings should show whether the utilities’ executive and senior management are sufficiently engaged in the risk assessment, prioritization, mitigation, and budgeting process and how they are engaged. Further, SED recommended, RAMP filings should also inform the Commission of the utility board’s level of engagement and oversight over its safety performance and expenditures. The company’s compensation policies related to safety also should be included in the RAMP filing.11
RAMP filings should also cover the company’s organizational structure as it relates to safety. Each utility should analyze its successes and failures at improving its safety culture and describe its path forward toward a deep and pervasive safety culture.
Beyond this, the Commission in other proceedings has expressed its interest in ensuring that executive and senior management are not only engaged in the risk management process, but that these executives also have a defined stake in the safety outcomes of utility operations. For example, the pending PG&E Safety Culture OII has
11 SED Staff Report at 80.
- 148 -

A.15-05-002 et al. COM/MP6/ar9/lil PROPOSED DECISION (Rev. 1)
directly linked expectations regarding executive performance to a corporate culture that emphasizes safety and reliability: “PG&E’s executive and senior management should be serving as patient capital managers, with an appropriate emphasis on an organizational culture that prioritizes safety and reliability. Accordingly, PG&E’s Board of Directors should be holding its executive and senior management accountable for meeting these expectations through its governance and leadership in corporate culture. If PG&E’s Board and executive and senior management do not, then the Commission, in its regulation of public utilities, must act accordingly.”12
Taking this a step further, in the pending GRC for SDG&E/SoCalGas, the Commission has also suggested that executive compensation, particularly variable incentive compensation, should be based at least in part on safety performance:
With the added emphasis on risk-based decision-making as set forth in D.14-12-025, safety-related considerations are something the Commission may want to be highlighted as part of variable incentive compensation. By weighting these kinds of considerations more heavily as part of the variable compensation, this could incentivize utility personnel for a safer and more reliable system.13
Testimony in both this proceeding and in PG&E’s current GRC application14 do show that at least some of the utility’s short-term 12 OII 15-08-019 Order Instituting Investigation on the Commission’s Own Motion to Determine Whether Pacific Gas and Electric Company and PG&E Corporation’s Organizational Culture and Governance Prioritize Safety at 14. 13 A.13-11-003/004 Proposed Decision Application of San Diego Gas & Electric Company (U902M) for Authority, Among Other Things, to Increase Rates and Charges for Electric and Gas Service Effective on January 1, 2016 at 156.14 A.15-09-001 Application of Pacific Gas and Electric Company for Authority, Among Other Things, to Increase Rates and Charges for Electric and Gas Service
- 149 -

A.15-05-002 et al. COM/MP6/ar9/lil PROPOSED DECISION (Rev. 1)
incentive program (STIP) for executives is based upon safety performance metrics reported to the Board of Directors in the monthly Safety Metrics Dashboard. This is a point also echoed in the final decision for the 2016 SDG&E/SoCalGas GRC.15
While the Commission may in the future consider a rulemaking to develop a standardized approach for basing executive compensation on safety performance, the RAMP filing is a logical place for utilities to show the Commission how their executives and board members are engaged and at risk for safety performance.
How RAMP filings progress to General Rate Cases [Adoption Order]
SED is considering a process to use to formally adopt each utility’s RAMP filing and application prior to the GRC. This adoption will be informed by SED’s evaluation of each RAMP filing. The adoption order will provide direction to the utility for incorporating changes to safety expenditures into its upcoming GRC filings. Following the adoption of the RAMP filing, SED will hand off the completed RAMP to the Commission’s Energy Division and the Office of Ratepayer Advocates as they begin their work on the upcoming GRC. At that point, the utility will incorporate the safety steps into its upcoming GRC, testimony, and documents.
Outlines for RAMP FilingsSED Staff and the utilities have considered outlines and
templates for the utilities’ RAMP filings. Sempra Utilities will be the Effective on January 1, 2017, PGE-02, Attachment A Table 2A-2, at 2-Attachment A-5.15 “The Commission preserves its right to ensure that the utilities’ governance and management properly incents safety via incentive compensation.” D.16-06-054 at 150.
- 150 -
A.15-05-002 et al. COM/MP6/ar9/lil PROPOSED DECISION (Rev. 1)
first to make a RAMP filing, which is due in November 2016. Sempra informally provided SED staff with a draft proposed outline for its upcoming filing, which is shown below.16 This is an example for discussion only, not a final document:
1. Introduction/Summary
2. S-MAP Update3. Risk Assessment Overview4. Risk Mitigation Plan Overview5. Risk #1 [Repeated for Risk #2, #3…]
a. Risk Descriptionb. Risk Scenariosc. Potential Driversd. Risk Scoree. Current Projects/Programs and Baseline Costsf. Proposed Projects/Programs and Forecasted Costsg. Alternatives Analysis
Summary/ConclusionThis outline consists largely of a narrative format. SED Staff
also encourages inclusion of graphs, charts, and tables to illustrate the utilities’ risk assessments, mitigations, and budgets. Some of the charts presented in the RAMP filings may be of use later in the GRC materials and also might be adapted for use in the two accountability reports.
Sempra Example
16 SED staff met with Sempra staff on February 5, 2016, and Sempra presented slides entitled “Risk Assessment Mitigation Phase: Plan and Approach Overview, February 5, 2016.”
- 151 -
A.15-05-002 et al. COM/MP6/ar9/lil PROPOSED DECISION (Rev. 1)
In its informal discussions with Commission Staff, Sempra indicated plans to include risks with an impact/consequence score of 4 or above on its 7x7 matrix in its category of “Health, Safety, and Environment.” (PG&E and SCE use a category of “Safety” that does not include “Health” or “Environment.”) Sempra’s level 4 includes consequences with “few serious injuries or illnesses to public or employees; significant and short-term impacts to environment.” Level 5 includes many serious injuries or illnesses and medium-term impacts to environment. Level 6 includes fatalities. Level 7 includes multiple fatalities and life-threatening injuries and severe impacts to environment.
In total, Sempra expects to include 28 risks in its RAMP filing, of which eight are from its gas business, seven are from its electric business, and 13 are cross-cutting. Sempra’s data is largely based on subject matter expertise. If Sempra were to include risks that score a 3 or higher on its 7x7 matrix — instead of a 4 as Sempra currently plans to do — then approximately 10 more risks would be included in the RAMP filing.
Sempra is preparing an analysis of the costs of its mitigations, as discussed above in this document as “spend efficiency,” which is risk reduction per dollar calculated with a methodology currently being piloted. Sempra plans to use 2015 actuals for these calculations and to analyze five years of historical data if possible. It also plans to base its forecast costs off its 2015 actuals. Sempra is looking ahead to 2019 for its GRC and will use range estimates because that is too far away to know precise costs. Sempra is also preparing analyses of two alternative mitigations, as required by D.14-12-025.
- 152 -
A.15-05-002 et al. COM/MP6/ar9/lil PROPOSED DECISION (Rev. 1)
Responsibility for rapid-response mitigationsThe RAMP filings feed into the utilities’ GRC filings in a
three-year cycle. This can work well for ordinary procedures and procurement and as a forward-looking approach to mitigating risk. However, some risks may be discovered that will require action on a much shorter time horizon. The utilities carry full responsibility for acting on those shorter-term needs. The three-year cycle of RAMP and GRC does not in any way absolve the utilities of the responsibility to respond to unexpected or urgent needs. The utilities must respond to shorter-term needs through processes other than the RAMP and GRC. If the utilities need action from the Commission to make rapid response more possible, then the utilities should communicate that to the Commission through appropriate channels.
Ten major components of RAMP filings recommended by SED
According to SED Staff, the Commission should adopt SED’s recommended Guidance for RAMP and the ten major components that should be included in RAMP filings. (These steps represent a combination of D.14-12-025 basic requirements and specific staff recommendations as discussed above.)
- 153 -
A.15-05-002 et al. COM/MP6/ar9/lil PROPOSED DECISION (Rev. 1)
Ten Major Components of Ramp Filings Recommended by SED Staff
(Steps slightly adjusted in response to comments)Step DescriptionOverall, the utility should show how it will use its expertise and budget to improve its safety record. To do so, each utility should:
The goal of the S-MAP proceeding is to make California safer by identifying the mitigations that can optimize safety
Identify its top risks SED currently foresees this including those risks ranked 4 or higher on the 7x7 matrices
Describe the controls or mitigations currently in place
Creates a baseline for understanding how safety mitigation improves over time
Present its plan for improving the mitigation of each risk
Includes analysis of execution feasibility, affordability, and any constraints
Present two alternative mitigation plans that it considered
D.14-12-025 calls for the presentation of two alternative plans
Present an early stage “risk mitigated to cost ratio” or related optimization
Pilot calculations are attempting to measure this item, although they are in an early stage
Identify lessons learned in the current round to apply in future rounds
Lessons learned by one company will also inform the RAMP filings of the other companies
Move toward probabilistic calculations to the maximum extent possible
While not all of a utility’s lines of business may have the data needed, some areas can move toward these calculations in the short term
For those business areas with less data, improve the collection of data and provide a timeframe for improvement
By beginning in S-MAP #1, the utilities can position themselves to make major improvements in risk assessment in S-MAP #2 and #3
Describe the company’s safety culture, executive engagement, and compensation policies
Should show how compensation is tied to safety performance, board and executive engagement in safety, and organizational structure related to safety
Respond to immediate or short-term crises outside of the RAMP and GRC process
The RAMP and GRCs follow a three-year cycle and are not designed to address immediate needs; the utilities have responsibility for addressing safety regardless of the GRC cycle
- 154 -
A.15-05-002 et al. COM/MP6/ar9/lil PROPOSED DECISION (Rev. 1)
11.3. Parties’ CommentsParties were generally very favorable about the overall SED
Staff Proposal. Joint Utilities said, “Joint Utilities appreciate the guidance provided in the SED Report and believes that the proposed structure and components of the RAMP guidance section are appropriate.”17 They further point out that they support the concept of an SED “adoption” order and want to work collaboratively with SED staff to implement this approach. CUE said that it appreciates “that the RAMP guidance requires the utilities to explain in narrative form and with charts, how and why they made their choices.”18 It believes that the RAMP process will provide adequate information and a greater level of transparency into GRC processes. ORA was supportive of the RAMP process and “concurs with SED staff that this first RAMP should focus on key risks.”19 However, ORA suggests that the filing should be more ambitious and include reported risks to Level 3 instead of Level 4, since including Level 3 or higher would provide approximately 10 more risks according to a recent Sempra analysis.20
The Joint Intervenors generally support the guidance for RAMP with “limited changes.” Joint Intervenors agree that top risks need to be identified but suggest that the “utilities should move away from the 1-7 scales for impact dimensions and frequency.”21
17 Joint Utilities’ Opening Comments on Staff Report at 19. 18 CUE Opening Comments on Staff Report at 8. 19 ORA Opening Comments on Staff Report at 6. 20 ORA Opening Comments on Staff Report at 6 referring to SED Staff Report at 83.21 Joint Intervenors’ Comments on Intervenor White Paper at 26.
- 155 -

A.15-05-002 et al. COM/MP6/ar9/lil PROPOSED DECISION (Rev. 1)
The utilities’ RAMP filings should include calculations of risk reduction and a ranking of mitigations based on risk reduction and a ranking of mitigations based on risk reduction per dollar spent. To the extent that the utility’s proposed mitigations do not follow from the ranking, the RAMP filing should explain the difference.22
They justify this on the basis that “Calculating risk reduction per dollar spent was required by D.14-12-025 and is necessary information for balancing safety with reasonable rates and for holding utilities accountable for safety spending. Utilities need not use this ranking as the sole basis for choosing mitigations, but should explain when their proposed mitigations do not follow the ranking.”23
In other words, Joint Intervenors object to the presentation only of an “early stage” “risk mitigated to cost ratio” or related optimization. Instead, they suggest the following:
Risk reduction calculations and risk mitigated to cost rankings need not be “pilot” or “early stage” calculations. Using [the] Joint Intervenors Approach or requirements based on that approach, the RAMP filing should provide risk reduction calculations that are comparable across the enterprise and use risk reduction per dollar spent to prioritize projects. Optimization should be implemented to the extent possible.24
Joint Intervenors also point out that the Joint Intervenors’ Approach would assist with the RAMP steps to “implement the probabilistic calculation in the short-term” and “assist in the identification of data collection requirements.”22 Joint Intervenors’ Comments on Staff Report at 14. 23 Joint Intervenors’ Comments on Staff Report at 14. 24 Joint Intervenors’ Comments on the Staff Report at 26.
- 156 -
A.15-05-002 et al. COM/MP6/ar9/lil PROPOSED DECISION (Rev. 1)
Aside from the “Ten Components” matrix, Joint Intervenors strongly oppose the concept of an SED “Adoption Order” that would enable SED to formally adopt each utility’s RAMP filing and application prior to the GRC. Joint Intervenors objected to this proposal for two reasons. First, “Joint Intervenors oppose any process that purports to allow SED, or any unit of CPUC staff to issue an order that has binding effect or otherwise has the status of a Commission determination.”25 This would constitute an “improper delegation of the Commission’s authority” since major GRC issues generally require the higher level judgement of Commissioners. Second, Joint Intervenors also point out that the proposed “Adoption Order” is contrary to the direction of D.14-12-025 which directs the issuance of a single, final SED report before parties have an opportunity to ask questions or provide comments on it. “Issuing a report that has binding effect without even an opportunity for parties to be heard would be a violation of due process, contrary to the promise of D.14-12-025 that ‘due process rights of the parties should be preserved.’”26 Accordingly, instead of having the status of an “order,” the document should have the status of an “advisory document” with the analysis and recommendations of SED with the appropriate “weight” to be given in the RAMP and GRC.
UCAN is also concerned that the SED document might be given added weight to a utilities’ funding request for risk mitigation in the utilities’ GRCs. UCAN asks the Commission for some assurances that “SED is not going to be identifying any need and/or determining the
25 Joint Intervenors’ Comments on the Staff Report at 25. 26 Joint Intervenors’ Comments on Staff Report at 25-26.
- 157 -

A.15-05-002 et al. COM/MP6/ar9/lil PROPOSED DECISION (Rev. 1)
appropriateness of any funding request for mitigating any identified risk.”27 It further asserts that “SED should not be put in the positon of evaluating if a utilities’ request is sufficient or reasonable.”28 Such a situation would put SED in an “untenable position” and “seriously impact the rights of the parties in the GRC.” The Joint Utilities also remind parties that D.14-12-025 emphasizes that due process rights of parties should be preserved and asks the Commission to clarify SED’s role.
As to the timing of the first RAMP, Sempra Utilities are scheduled to submit their first RAMP in November 2016. The Joint Intervenors note that it may be a challenge for Sempra to make the changes required to implement necessary risk reduction calculation improvements after the publication of this decision and before Sempra’s RAMP filing date. Despite strong support for implementation of a yet-to-be developed alternative risk model, “Joint Intervenors do not object to SEMPRA filing its upcoming RAMP based on its current risk evaluation and risk-based decisionmaking methodologies, as modified by the additional requirements adopted by the Commission in its first S-MAP decision.”29 In response to this statement, Joint Utilities reply, “SDG&E and SoCalGas appreciate Joint Intervenors’ understanding of the difficulties involved in putting together the first-ever RAMP filing, and fully support the proposal above.”30
27 UCAN Opening Comments on Staff Report at 12.28 UCAN Opening Comments on Staff Report at 12.29 Joint Intervenors’ Opening Comments on Staff Report at 29. 30 Joint Utilities’ Reply Comments on the Staff Report at 3.
- 158 -

A.15-05-002 et al. COM/MP6/ar9/lil PROPOSED DECISION (Rev. 1)
11.4. Discussion Consistent with the findings and recommendations in this
decision so far, and parties’ comments regarding the RAMP process itself, it is appropriate to make the following changes highlighted in italics:
Ten Major Components of RAMP Filings Recommended by SED (Modified)
Step DescriptionOverall, the utility should show how it will use its expertise and budget to improve its safety record. To do so, each utility should:
The goal of the S-MAP proceeding is to make California safer by identifying the mitigations that can optimize safety
Identify its top risks Includes those risks ranked 4 or higher on the 7x7 matrices (Sempra only). Because the utilities may be moving away from the 1-7 scales for impact dimension and frequency, they should be poised to receive further direction pending the outcome of a Phase Two decision in this proceeding.
Describe the controls or mitigations currently in place
Creates a baseline for understanding how safety mitigation improves over time
Present its plan for improving the mitigation of each risk
Includes analysis of execution feasibility, affordability, and any constraints.
Present two alternative mitigation plans that it considered
D.14-12-025 calls for the presentation of two alternative plans.
Present an early stage “risk mitigated to cost ratio” or related “risk reduction per dollar spent.”
Pilot calculations are attempting to measure this item, although they are in an early stage (Sempra only)Depending on the outcome of the Phase Two “test drive” of risk reduction calculations and risk mitigated to cost rankings, calculations may not need to be “early stage” or pilot. Pending the outcome of Phase Two of this
- 159 -
A.15-05-002 et al. COM/MP6/ar9/lil PROPOSED DECISION (Rev. 1)
proceeding, utilities should be ready to provide risk reduction calculations that are comparable across the enterprise and use risk reduction per dollar spent to prioritize projects. In time, utilities should strive toward optimization to the extent possible.
Identify lessons learned in the current round to apply in future rounds
Lessons learned by one company will also inform the RAMP filings of the other companies
Move toward probabilistic calculations as much as possible
While not all of a utility’s lines of business may have the data needed, some areas can move toward these calculations in the short term. Pending the outcome of Phase Two of this proceeding, the utilities may be able to implement probabilistic calculations in the short-term.
For those business areas with less data, improve the collection of data and provide a timeframe for improvement
By beginning in S-MAP #1, the utilities can position themselves to make major improvements in risk assessment in S-MAP #2 and #3; In the short-term, subject matter expertise can help fill in the gaps where information may be missing.
Describe the company’s safety culture, executive engagement, and compensation policies
Should show how compensation is tied to safety performance, board and executive engagement in safety, and organizational structure related to safety
Respond to immediate or short-term crises outside of the RAMP and GRC process
The RAMP and GRCs follow a three-year cycle and are not designed to address immediate needs; the utilities have responsibility for addressing safety regardless of the GRC cycle.
In general, we support SED Staff recommendations with the addition of language highlighted in italics above. In response to comments, we agree with Joint Intervenors’ suggested finding that “prioritizing based on cost effectiveness measures is an important improvement to rate cases and an important step to
- 160 -
A.15-05-002 et al. COM/MP6/ar9/lil PROPOSED DECISION (Rev. 1)
optimizing portfolios.”31 “Consistent with optimization, such rankings need not be the sole basis for choosing mitigations and utilities can explain how other constraints changed their choice of mitigation.”32 Therefore, consistent with D.14-12-025, “the utilities’ RAMP filings should include calculations of risk reduction and a ranking of mitigations based on risk reduction per dollar spent.”33 This will help balance safety with reasonable rates and keep a check on necessary expenditures for safety-related projects.
As to the proposed SED “Adoption Order,” explicit with the advice provided by D.14-12-025, this “delegation of authority,” or official “pre-screening” is not necessary to guide the utility for incorporating expenditures changes to safety expenditures into its upcoming GRC filings. As shown in the RAMP application schedule above, SED “files and serves” a single report (only) following the RAMP application and associated RAMP workshops. Testimony, and a utility explanation regarding how it addressed SED staff report concerns, would then be filed as part of the GRC’s application, and parties would have an opportunity to provide feedback via comments/workshops, etc. This will ensure due process, transparency, and an expedient process. There is no separate “RAMP” decision to approve the RAMP filings and the assigned ALJ will give the staff advisory advice proper weight in the GRC. D.14-12-025 explicitly reserves to the RAMP proceedings the issues of
31 Joint Intervenors’ Comments on Staff Report at 14. 32 Joint Intervenors’ Comments on Staff Report at 14. 33 Joint Intervenors’ Comments on Staff Report at 14.
- 161 -

A.15-05-002 et al. COM/MP6/ar9/lil PROPOSED DECISION (Rev. 1)
whether SED should be required to sponsor and testify about the staff report if hearings are held in the RAMP application.34
Because this decision is issued only a short time before the Sempra letter requesting an OII and filing a RAMP (see below) and has a compressed schedule to implement the directives of this decision, we are sympathetic to parties’ sentiments to allow Sempra to file its upcoming RAMP based on its current risk evaluation and risk-based decision-making methodologies, as modified by the additional requirements as highlighted in italics in the table entitled “Ten Major Components of RAMP Recommended by SED (modified); but Sempra shall not adopt the Multi-Attribute Approach (or utility equivalent features) in its first RAMP November 2016 filing. The issuance of a Phase Two decision in this proceeding should provide SCE and PG&E sufficient time to comply with any new directives. With each successive S-MAP, requirements can be adjusted to reflect new conditions, lessons learned through experience, and changing Commission priorities.
Utility RAMP Filing Schedule
Issue Letter Requesting OII
RAMP Filing GRC Filing
Sempra TY 2019
Sept 1, 2016 Nov 30, 2016 Sept 1, 2017
PG&E TY 2020 Sept 1, 2017 Nov 30, 2017 Sept 1, 2018SCE TY 2021 Sept 1, 2018 Nov 30, 2018 Sept 1, 2019
The requirement to file a RAMP phase as described in D.14-12-025 formally commences with the upcoming
34 D.14-12-025 at 39.
- 162 -

A.15-05-002 et al. COM/MP6/ar9/lil PROPOSED DECISION (Rev. 1)
SDG&E/SoCalGas GRCs for TY 2019. Following the procedure established in D.14-12-025, the utilities will, on September 1, 2016, send a letter to the Commission Executive Director asking for an OII. The RAMP filing will follow by November 30, 2016.
On July 1, 2016, the Commission issued D.16-06-056 “Decision Authorizing PG&E’s 2015-2018 Revenue Requirements for Gas Transmission and Storage and Services and Adopting Interim Rates,” in which it extended PG&E’s current GT&S through 2018, which postponed the filing of PG&E’s next GT&S application from 2016 to 2017. According to D.16-06-056, such changed circumstances allows PG&E to begin incorporating the RAMP process at an earlier date.35 Therefore, in this decision, we clarify that the scope of PG&E’s November 30, 2017 RAMP filing shall include the GT&S system. We agree with Joint Intervenors’ assessment that “in this way, PG&E’s risks and mitigation prioritization to be more usefully compared across the enterprise, and not exclude a portion of PG&E’s gas system in which safety considerations are particularly important.”36 Both Joint Intervenors and PG&E agree that PG&E’s next RAMP should include its GT&S systems.
In the evaluation of RAMP filings that SED files and serves, SED will verify that the utility did what it was required to do--that the utility performed the analysis and presented the information that S-MAP and RAMP require. For the first S-MAP this approach is practical for SED to accomplish in the relatively short time available in the schedule. In time, if staff resources and expertise are available, 35 D.16-16-056 at 411 and COL 318.36 See Joint Intervenor’s Comments on PD at 7-8 and PG&E Reply Comments on PD at 4-5.
- 163 -

A.15-05-002 et al. COM/MP6/ar9/lil PROPOSED DECISION (Rev. 1)
SED could do a much more in-depth analysis, based on SED’s own information or that of other parties, to analyze whether the utility may have had other and better options for safety spending and mitigation separate from the ones that the utility presented to the Commission. In this case, SED may need more information about utility assets and options that SED usually doesn’t have. For example, SED doesn’t know the prices of most utility assets, and so may have limited ability to know if the chosen mitigations are the most cost-effective ones. SED can evaluate the risk-spend-efficiency calculation used by the utility, but may not know for sure that the utility didn’t expose other viable options. We acknowledge that the content, format, and granularity of data required for staff review of RAMP filings need to be refined over time.
12. Verification and Annual Reporting 12.1. D.14-12-025 RequirementsAccording to D.14-12-025, the Commission also recognizes the
“need to have the utility’s system evaluated in terms of implementation of best practices, industry standards, and the associated metrics of the security and safety of its electric grid, gas pipelines, and facilities.”1 “To achieve these objectives, the Commission stated that ‘such an evaluation and decision-making framework’ should be “institutionalized as the standard practice by incorporating it into the RCP.”2
Accordingly, the Scoping Memo for this proceeding asks the following two questions:
1 D.14-12-025 at 6.2 D.14-12-025 at 6.
- 164 -

A.15-05-002 et al. COM/MP6/ar9/lil PROPOSED DECISION (Rev. 1)
What direction can and should be provided to the utilities for the structure and detail of the two accountability reports required by D.14-12-025: the risk mitigation accountability report and risk spending accountability report?3
What direction can and should be provided to the utilities regarding developing, tracking, and reporting a set of performance metrics that are designed to measure the safety improvements achieved by the utilities?
What is the status of data collection and how can it be improved over time?
What performance metrics should be developed for the first S-MAP and/or second S-MAP?
Two Accountability ReportsD.14-02-025 requires the filing of an annual Risk Mitigation
Accountability Report, and a Risk Spending Accountability Report. These reports shall contain the information as summarized below:
1. Two annual Verification documents to be submitted by each utility:a. A Risk Mitigation Accountability Report, in
which the utility compares its GRC projections of the benefits and costs of the risk mitigation programs adopted in the GRC with the actual benefits and costs, and explains any discrepancies; and
b. A Risk Spending Accountability Report, in which the utility compares its GRC projected spending for approved risk mitigation projects with the actual spending on those projects, and explains any discrepancies.4
3 For a more complete description of these, see D.14-12-025 Section 3.5 “Verification and Annual Reporting” at 43-47.4 For a more detailed discussion of what these reports require, see D.14-12-025 at 43-44.
- 165 -
A.15-05-002 et al. COM/MP6/ar9/lil PROPOSED DECISION (Rev. 1)
According to D.14-12-025, Commission staff will review and verify these two utility reports on an annual basis. SED will prepare a report on the utility’s Risk Mitigation Accountability Report, and Energy Division will prepare a report on the utility’s Risk Spending Accountability Report. SED and Energy Division will work cooperatively in preparing each of those reports. SED and Energy Division shall file their respective reports in the applicable GRC proceeding within 120 days from the date each utility files these two reports. See the staggered schedule below.Utility Report
Filing DateSDG&E SoCalG
asSCE PG&E Staff
ReviewRisk Mitigation Accountability Report
Sept 31(after the applicable reporting period)
July 31 May 31
March 31
120 days after utility report filing
Risk Spending Mitigation Report
Sept 31 July 31 May 31
March 31
120 days after utility report filing
12.2. Status Report SED Staff discussed verification and annual reporting in the
S-MAP proceeding in working group calls, public workshops, and briefing meetings with the utility and non-utility parties. Most of these discussions are documented in the workshop reports and the SED Staff Report. Because the accountability reports are not due until after the utilities file their GRCs, SED Staff did not focus attention on the accountability reports during the first phase of this proceeding.
- 166 -
A.15-05-002 et al. COM/MP6/ar9/lil PROPOSED DECISION (Rev. 1)
Instead, SED Staff focused its time on the development of performance metrics with the aid of a working group comprised of many parties in the proceeding. SED Staff reports that the working group has made strong progress and has reached the stage of refining a comprehensive and detailed set of performance metrics to offer in Phase Two of the first S-MAP.
Following is a more detailed status report of both the accountability reports and performance metrics.
Two Accountability ReportsStaff and parties discussed the two accountability reports
primarily in Workshop #3 and during Workshop #4. In compliance with D.14-12-025, the Commission’s Energy Division will review the Risk Spending Accountability Report once it is filed by each utility. SED will review the Risk Mitigation Accountability Report once it is filed by the utility. One method for analyzing the risk mitigation accountability report may be to track the performance metrics developed by the working group to assess the safety performance of the utilities over time. But the approach to analyzing the reports has not yet been determined. During Phase Two of this proceeding, Commission staff and parties may focus not only on the content and format of these reports, but also on methods for analyzing the accountability reports.
Specific elements of the accountability reports may also be determined as part of the GRC decisions that precede the reporting cycle. The Commission also may determine that some level of accountability reporting would be appropriate for GRCs that are not completely covered under this S-MAP; for example, the pending
- 167 -

A.15-05-002 et al. COM/MP6/ar9/lil PROPOSED DECISION (Rev. 1)
decision in the SDG&E/SoCalGas 2016 GRC includes a limited reporting requirement.5 Similarly, the pending PG&E 2017 GRC6 and the upcoming SCE 2018 GRC are not subject to the full RAMP phase of the revised RCP adopted in D.14-12-025, but the Commission may consider in those decisions that some level of accountability reporting is warranted.
Performance MetricsSED Staff convened a working group on reporting metrics for
the S-MAP proceeding to develop a set of performance metrics to use as a baseline in the proceeding. Staff’s intention is to improve upon the initial set of reporting metrics in each successive S-MAP until the set becomes mature, and to then continually refine and improve the set of metrics. The working group defined 70 potential performance metrics as a starting set of metrics for S-MAP.
The working group employed a method for each utility to list its top risks and then to select the performance metrics that can address those risks. Through this approach, the metrics are aligned with the risks that the utilities must mitigate. The initial spreadsheets of metrics had three columns: 1) the risk to be mitigated; 2) the metric that can track performance toward mitigating the risk; and 3) a longer description of the metric for increased clarity.
The risks addressed by the performance metrics include:5 See A.14-11-003/004 Application of San Diego Gas & Electric Company (U902M) for Authority, Among Other Things, to Increase Rates and Charges for Electric and Gas Service Effective on January 1, 2016. (Consolidated with application of Southern California Gas Company) Proposed Decision, with discussion of reporting at 39-43, and OP 12 at 331.6 See A.15-09-001 Application of Pacific Gas and Electric Company (U39M) for Authority, Among Other Things, to Increase Rates and Charges for Electric and Gas Service Effective on January 1, 2017.
- 168 -

A.15-05-002 et al. COM/MP6/ar9/lil PROPOSED DECISION (Rev. 1)
Employee Safety Cybersecurity Catastrophic Damage Involving Gas Infrastructure (Dig-ins) Catastrophic Damage Involving High-Pressure Pipeline
Failure Catastrophic Event Related to Storage Well Integrity Wildfire Catastrophic Damage Involving Medium Pressure Pipeline
Failure Records and Information Management Overhead Conductor—Transmission and Distribution/Public
Safety Events Electric Infrastructure Integrity Workplace Violence Workforce Planning Electric Grid Restoration/Failure to
Blackstart Aviation Incident/Helicopter Operations Distributed Energy Resources Safety and Operational
ConcernsNot all proposed metrics are appropriate for all utilities; for
example, natural gas-related metrics do not apply to electric-only utilities. Once the working group developed its three-column list of relevant risks and related metrics, the working group decided to add six more columns to describe the risks in more dimensions. A column called “explanation” offers a description of how the metric is tied to its relevant risk. Other additional columns pertain to the following descriptions:
- 169 -

A.15-05-002 et al. COM/MP6/ar9/lil PROPOSED DECISION (Rev. 1)
Whether data is already available for that metric, or not yet available;
Whether it is a leading or lagging metric; Whether it shows consequence of a failure or frequency of
a failure; Whether the data collection is prone to bias or
inconsistency; and Whether the data is auditable (by the Commission or a
third party).Parties spent considerable time and effort in the development of
relevant spreadsheets: 70 metrics with nine columns for each, times the three utilities, means that the parties reported on 1,890 cells in the spreadsheets. Most of the proposed metrics are ones for which the utilities are already collecting data. Despite the high level of cooperation among working group members to identify and characterize the proposed metrics, there is still more that needs to be done to pare the list to a useful and relevant set of performance metrics that can be generally applied.
The working group intends to organize the performance metrics according to whether a) they are ready for use in the short term and have reliable data available; b) need more work but may be ready for use in the medium term; or c) will require development over the longer term. The working group also intends to work toward more uniform definitions among the California utilities for the metrics and uniform application of the metrics in reporting documents such as accountability reports.
- 170 -

A.15-05-002 et al. COM/MP6/ar9/lil PROPOSED DECISION (Rev. 1)
Leading indicators are more suited to the goals of the proceeding than lagging indicators, because the goal is to understand potential safety incidents in advance and avoid them. Some of the proposed metrics are already leading indicators. Future S-MAPs can seek to replace the remaining lagging indicators with leading indicators as new data becomes available. It may also become possible to adopt metrics less prone to bias and more conducive to Commission audit. In these ways and others, the set of reporting metrics can improve over time.
In cooperation with parties, SED Staff should continue refining the proposed set of metrics. If consensus can be achieved, the working group should file a motion requesting that the proposed set of metrics be entered into the record for consideration in the proceeding. If consensus cannot be reached, the ALJ may issue a ruling that solicits comments from parties on a similar SED staff proposal.
Ongoing Data Collection The Commission’s goal stated in D.14-12-025 –- of providing
direction to the utilities regarding developing, tracking, and reporting a set of performance metrics designed to measure safety improvements achieved by the utilities –- can be achieved by adopting a subset of the metrics offered by the reporting working group after it finishes its work in Phase Two of the proceeding. The goal is not just to have metrics that can be used in the accountability reporting, but also to have metrics that can be used as inputs to the risk evaluation process so that over time, it may be based on more quantitative data.
- 171 -

A.15-05-002 et al. COM/MP6/ar9/lil PROPOSED DECISION (Rev. 1)
To improve the set of metrics over time, additional and improved data will have to be collected. During Phase 2 of this S-MAP, a priority will be to identify areas where data collection can improve and make possible new reporting metrics. Leading metrics, rather than lagging ones, should be a priority. Metrics less prone to bias in collection and less prone to inconsistencies should also be a priority. Similarly, data sets that can be audited for accuracy should be a priority. Of course, top safety risks faced by the utilities should drive the type of metrics and data sought.
Because there was insufficient time to work on benchmarking procedures during the first phase of this processing, this important work should commence in the second phase, especially as it relates to application of the EPRI multi-attribute model which we adopt on an interim basis in this decision. This also means reaching out to industry associations, utilities in other states, or possibly to other non-utility companies, to understand how and to what extent those companies use risk-informed decision making, how they inject it into their GRCs, how they measure and evaluate the results, and what success or failure they have had. Benchmarking will likely provide valuable input into the next S-MAP proceeding.
13. ConclusionsMost parties agreed with SEDs Staff’s observation that good
progress has been made by all four utilities to develop a risk-based approach to manage their operations and assets and to inform rate case decisions. To various degrees of maturity, all four utilities have embarked on a journey to adopt a risk-based approach to enhance safety and reliability. All four utilities have a
- 172 -

A.15-05-002 et al. COM/MP6/ar9/lil PROPOSED DECISION (Rev. 1)
risk-based decision framework that can be mapped to the Cycla 10-step process.
However, consistent with SED Staff Report Findings, we summarize the problems with the utilities’ current indexing models that preclude them from implementing risk reduction and risk mitigation strategies consistent with D.14-12-025 (partial list):
No comparable or absolute risk scores across utilities at this stage of their evolution.
Flawed approach to calculating impact of utility high consequence events.
Models are indexing models relying on subjective SME estimates 1 to 7.
Models are marked by weak transparency and questionable repeatability.
Utilities’ models have not specified an explicit risk tolerance.
Enterprise risk management models commingle shareholder financial interest with safety.
There is no optimization of the portfolio of risk mitigation activities.
The utilities’ models need improvements in order to calculate risk reduction in a way that is comparable across the utilities.
Without quantifying risk reduction, no meaningful ranking, prioritization or optimization of risk mitigations is possible, and the Commission’s goals and processes set forth in D.14-12-025 are compromised.
In the short-term, we have concluded that the Joint Intervenors’ Approach facilitates the calculation of risk reduction that is essential for optimization or prioritization of risk mitigations. This can be accomplished by the multi-attribute features of the Joint Intervenors’
- 173 -

A.15-05-002 et al. COM/MP6/ar9/lil PROPOSED DECISION (Rev. 1)
Approach (or utility equivalent features) necessary for risk reduction calculations comparable across the enterprise.
In the long-term, we have concluded that the ALARP approach, or some variation of it, will enable the establishment of risk tolerances necessary to achieve an optimization of the portfolio. This will take several years of evolving utility models, data collection, and assessments.
Parties strongly suggest specific guidance from the Commission and a specific Road Map that moves beyond these findings and implements recommendations consistent with D.14-12-025 objectives at a faster pace that recognizes that safety is the Commission’s highest priority.
14. Interim and Long-Term Plan “Road Map” to Migrate to More Quantitative Methods for Optimized Risk MitigationAs D.14-12-025 acknowledges, “We recognize that the
development of uniform and common standards is likely to take some time, and may not be accomplished in the first S-MAP. That is because each energy utility may be developing or using different methods for assessing, managing, and mitigating their risks. Commission staff and other parties interested in these issues will need to analyze and understand each of the utility’s modeling approaches and their capabilities.” (D.14-12-025 at 26)
As parties have observed, there are two distinct modes of thought about implementing a common risk methodology: those parties who support SED Staff’s conclusion that it is premature to prescribe a common risk methodology in the first S-MAP and those parties who wish to move the IOUs to a common methodology
- 174 -
A.15-05-002 et al. COM/MP6/ar9/lil PROPOSED DECISION (Rev. 1)
immediately. We explore SED Staff’s and parties’ conclusions in this regard and provide a timeline subject to further review in the second phase of this S-MAP.
14.1. SED Staff Recommendations SED believes it is premature to prescribe a common risk
evaluation methodology in the first S-MAP.1 However, instead of adopting common elements in this first S-MAP beyond what the utilities have identified in their Uniformity Report, SED Staff recommends that the most desirable features from the risk models be identified for possible adoption in the next S-MAP, or perhaps in Phase Two, [emphasis added] of the first S-MAP. The original SED Staff recommendations also suggested that utilities should continue to improve their existing risk management models. However, as previously mentioned, we accept this approach only to the extent that existing models provide a “bridge” to more probabilistic approaches.
14.2. Parties’ CommentsFollowing are parties’ comments pertaining to the pace of
change, call for short-term and long-term action, and how we may gauge the effectiveness of methodologies through “tests” and “pilots.” Based on an analysis of comments, we provide an interim short-term and long-term “Road Map” to achieve Commission directives subject to review and verification during the second phase of this proceeding.
Utilities strongly argue that they should continue to: 1) work with and use the Utilities’ [existing] methodologies until the Commission has addressed all the important issues surrounding the 1 D.14-12-025 also determined that it is premature to decide what specific risk approach, model or methodology should be adopted for us in the S-MAP and RAMP process.” See D.14-12-025, FOF, at 23.
- 175 -

A.15-05-002 et al. COM/MP6/ar9/lil PROPOSED DECISION (Rev. 1)
process and methodologies; 2) initially, consider only safety risk management in the rate case process; and 3) establish a Phase Two of the S-MAP to develop a “next steps” methodology.2 In the short-term, utilities believe a more modest approach is in order: focus on comparable risks and risk tolerances, rather than comparable risk scores; limit S-MAP/RAMP proceeding to those risks that may have a severe impact (fatalities or life-threatening injuries), and work with utilities and other stakeholders to develop risk tolerances over time. Utilities generally support pilots, they do not think that time-consuming “test runs” are necessary to prove the value of a proposed methodology as suggested by other parties.3
Pace of ChangeCUE agrees with the IOU’s approach as described above. It
emphasizes that “the Commission should focus Phase Two of this proceeding on collecting better data, and refining and improving the utilities’ models.”4 It agrees with the SED Staff Report that “now is the time to identify the most effective features from the risk models for possible adoption in the next S-Map or Phase Two”5 [of this S-MAP].
ORA suggests a five-year timeline (or the third S-MAP cycle) to come to a common methodology that is shared by all utilities.6 UCAN
2 Joint Utilities’ Reply Comments on Scoping Memo Question #13 at 10. (Comments on Scoping Memo Question #13 were included with comments on the Staff Report.)3 Joint Utilities’ Reply Comments on Staff Report at 6. 4 CUE Reply Comments on Intervenor White Paper at 3.5 CUE Reply Comments on Scoping Memo Question #13 at 3.6 ORA on Intervenor White Paper at 5.
- 176 -

A.15-05-002 et al. COM/MP6/ar9/lil PROPOSED DECISION (Rev. 1)
“suggests that the time frame ORA proposes (up to 5 years) for implementing a common and more quantitative methodology is unnecessarily too long.”7
Similarly, MGRA believes that “this is not a sufficiently aggressive goal, and that by adopting a time line important decisions that should be addressed soon may be deferred.”8 “Such a timeline would only be acceptable if it were accompanied by very specific intermediate milestones for achieving all required steps toward the unified methodology, and that a process was put into place for measuring whether the milestones are achieved.”9
They further argue that waiting for the next S-MAP proceeding in order to make key decisions “would mean putting off much needed safety improvements for another three years, while deferring these decisions to the RAMP proceedings would mean that these issues will be solved on an ad-hoc basis for each utility in turn.”10 They believe that running an S-MAP Phase 2 proceeding in parallel with the RAMP process would help address all the issues that remain unresolved at this point in the proceeding.
Joint Intervenors contend, “Unfortunately, the SED Report’s findings and recommendations are too focused on long-term goals and do not sufficiently focus on the short-term steps necessary to improve the Commission’s ability to achieve its overarching goals of prioritizing safety and ensuring just and reasonable rates.”11 Joint 7 UCAN Reply Comments on Intervenor White Paper at 5.8 MGRA Reply Comments on Intervenor White Paper at 9.9 MGRA Reply Comments on Intervenor White Paper at 9.10 MGRA Reply Comments on Intervenor White Paper at 9.11 Joint Intervenors’ Comments on Staff Report Paper at 3.
- 177 -

A.15-05-002 et al. COM/MP6/ar9/lil PROPOSED DECISION (Rev. 1)
Intervenors believe the SED Report should be more proactive in moving forward risk management. They observe that the utilities would postpone any further progress toward implementation of a uniform approach until a second S-MAP, which is years away. Joint Intervenors argue that “the Commission should reject the utility position and direct the parties to consider additional steps toward uniformity in a second phase of this proceeding.”12
Test Runs MGRA “strongly urges the Commission to ‘test drive’ any model
under consideration as a potential common risk scoring method using well-defined, relevant power scenarios”13 such as:
Determine the effectiveness of a specific mitigation (enhanced wind-loading standard) to prevent the scenario that a utility pole fails under high wind fire conditions and a large wildfire is ignited. This could be limited to a specific region in a utility’s service area. The analysis would take into account the probability of a high wind event during fire weather, relevant local topographical effects, etc.
Determine the effectiveness of more frequent inspections preventing the scenario that a tree falls into a power line and ignites a large wildfire in a specific segment of a utility’s service area.
Determine the effectiveness of shortening the effective lifetime for pipe replacement in preventing leak and explosion of gas transmission pipe in residential neighborhoods.14
12 Joint Intervenors’ Reply Comments on Staff Report at 6. 13 MGRA Comments on Staff Report at 9.14 MGRA Comments on Staff Report at 16-17.
- 178 -

A.15-05-002 et al. COM/MP6/ar9/lil PROPOSED DECISION (Rev. 1)
According to MGRA, the details of how each method would solve the given test method should be laid out in a manner that allows outcomes of different methods to be compared against each other.
PilotsJoint Utilities support the concept of increased quantification but
also note “that piloting makes sense because pilots allow the ideas and concepts to be tested.”15 They stress that it will take time and effort to develop appropriate models and tools. Utilities are optimistic that results of current pilots will be instructive. They are “confident that these projects will lead to improved alternatives analysis, quantification of risk reduction and ability to explicitly state risk tolerance.”16
MGRA reinforces this point: “We might suggest that a common calibration of methods might be most rapidly achieved if utilities were to agree on specific problems to be solved, thus enabling a direct comparison of ‘pilot’ results between utilities.”17
Explicit Risk Tolerance StandardsParties generally support the development of explicit risk
tolerance standards as a long-term rather than short-term strategy:The Joint Utilities caution against hasty and premature risk tolerance standard-setting by the Commission. Just as the utilities are bound by certain limiting variables (such as laws, safety concerns, current budget constraints, industry practices, etc.) so must the Commission take these constraints into account in setting any safety standard with respect to utility operations. In any event, it would be
15 Joint Utilities’ Reply Comments on Staff Report at 7.16 Joint Utilities ‘Reply Comments on Staff Report at 9.17 MGRA Reply Comments on Intervenor White Paper at 4.
- 179 -

A.15-05-002 et al. COM/MP6/ar9/lil PROPOSED DECISION (Rev. 1)
unreasonable and unhelpful for the Commission to require the utilities to prematurely declare risk tolerances in RAMP for use in GRCs, while simultaneously helping the CPUC set standard risk tolerances for all utilities. (Joint Utilities)
This is a complex matter that should be addressed in a future S-MAP. In the meanwhile, the Commission should focus on increased probabilistic analysis because it will be required in a future S-MAP. In the meanwhile, the Commission should focus on increased probabilistic analysis because it will be required as part of any discussion of risk tolerance. The Joint Utilities support the concept of increased quantification but also note that piloting makes sense because pilots allow the ideas and concepts to be tested. It will take time to develop appropriate models and tools. (Joint Utilities)
Risk tolerance can be incorporated into the Joint Intervenor Approach as a constraint when optimizing the risk mitigation portfolio of the utility. Neither the Joint Intervenor Approach, nor the current utility approaches, however, will, on their own, provide a risk tolerance. Instead, as noted by the SED Report, the Commission must define the acceptable risk tolerance in order to fully empower the utilities to adopt full optimization techniques. (Joint Intervenors)
While MGRA would agree that there may be realistic constraints that may need to be applied to risk tolerance, part of the exercise defining tolerability limits will be to re-visit those constraints. Tolerability limits need to be determined holistically. If it is decided that a certain risk is societally unacceptable, it may be necessary to increase available funding, change regulations, or pass laws to enable utilities to address the issue. Necessary actions required to achieve tolerability goals will not be limited to the utilities. (MGRA)
- 180 -
A.15-05-002 et al. COM/MP6/ar9/lil PROPOSED DECISION (Rev. 1)
14.1. DiscussionIn this decision, we agree with the Joint Intervenors that too
much emphasis has been placed on the long-term goals associated with achieving explicit risk tolerance standards, which reflects SED Staff’s “number one” recommendation. As parties overwhelmingly agreed, it is not possible to achieve this goal until other rudimentary steps are accomplished first such as developing a capability to build an aggregated risk model that captures the probabilistic nature of adverse safety-related events. Once this is achieved, then an ALARP-like “risk tolerance” decision framework for guiding mitigation decisions can be pursued. (See “ALARP” discussion in Section 9.) The academic discussion about developing risk tolerance standards has been very useful from an educational standpoint. But much more work needs to be done from a practical, business standpoint to translate “theory” to “practice” and build the first floor of a 50-story building. (See “ALARP Framework” discussion in Section 9.) If we put off this important work, we will “stay in the basement of the 50-foot building” and miss an exceptional opportunity to replace outmoded models with newer and more sophisticated ones that better achieve Commission safety objectives. Accordingly, it is reasonable to develop a workplan to implement the Road Map in a manner that allows parties to meaningfully participate in all of the work that must be undertaken over time.
Both MGRA and the Joint Utilities provide convincing reasons why the second phase of this proceeding should “test run” the multi-attribute Intervenor Methodology (or equivalent utility attributes) by using problems which are common across more than
- 181 -

A.15-05-002 et al. COM/MP6/ar9/lil PROPOSED DECISION (Rev. 1)
one utility and work through the Intervenor risk reduction methodology. We are not convinced that this exercise would necessarily lose valuable time and slow down the proceeding, since regulators and parties have a familiarity with problems at hand and access to examples at both the enterprise and operational levels of analysis. This exercise could involve a complex and iterative process which could be refined over time as utility staff become more familiar with basic concepts and best practices.
The details regarding how each method would solve the test scenario should provide a structure wherein the results of each method can be compared with one other. Criteria to determine any priorities should be fulfillment of stated Commission goals, ability to impact short-term change, transparency, reasonableness and accuracy of results, and ease of preparation and implementation, among other things.
Without experimentation with the approach, there is no compelling reason for utilities to be motivated to change their existing ways of doing things. Consistent with MGRA’s suggestion, we also support the idea of learning how the approach is being used by other utilities around the country, including analysis of specific risks of interest to California utilities. This could also be one of the first steps in the evaluation of the Intervenor Model before potential full scale adoption at the end of the second phase of this proceeding.
One of the most beneficial outcomes of this proceeding is the parties’ universal pleas for a Road Map that highlights what key milestones can be accomplished within a specified period of time on a short-term, medium-term, and long-term basis. This will ensure that
- 182 -

A.15-05-002 et al. COM/MP6/ar9/lil PROPOSED DECISION (Rev. 1)
we will not put the “cart before the horse” on what milestone needs to be accomplished first, second, third, and what are the interdependencies between these. Now that clear direction is provided, parties will have an opportunity to revisit and refine key milestones through persistent commitment, continuous dialogue, and shared learning.
14.2. First S-MAP Road Map (Short-Term)Consistent with the advice provided in Section 9 regarding the
Intervenor Approach following is a suggested Road Map that will guide activities in the second phase of this proceeding:
1. Adopt Multi-Attribute Intervenor Model (or Utility Equivalent Features) subject to verification of “test runs” and review of utility current “pilots” that may offer alternative strategies.
2. Adopt Cycla Corporation 10-Step Evaluation Method as a common yardstick for evaluating the maturity of utility risk assessment and mitigation models
3. Direct utilities to take steps toward a more uniform approach towards calculation of risk reduction in second phase of this proceeding.18
a. Consider eliminating the unnecessary step of converting arriving rates of failure events into scaled 1 to 7 LoF values, and instead express LoF as a mathematical probability.
LoF should be based on a condition dependent hazard rate. The resulting LoF scale will be between 0% and 100%, linear, additive, and capable of measuring risk reductions associated with different mitigation strategies
18 Primary source: Intervenor White Paper.
- 183 -

A.15-05-002 et al. COM/MP6/ar9/lil PROPOSED DECISION (Rev. 1)
Utilities should move away from non-intuitive logarithmic scales in favor of 1-7 logarithmic scales in favor of LoF that range from 0-1 and CoF that range from 0-100.
b. Consider eliminating the existing discrete 1-7 CoF scale for failure events and replace it with a continuous rather than discrete scale and implement a more intuitive 0 to 100 scale.
c. Consider a specific safety weight at a minimum of 40% to ensure that the Safety attribute is weighted is most heavily
With that weight set, the utilities can also implement a multi-attribute approach that correctly defines weights and attribute scales together.
4. Begin to implement optimization techniques by first requiring the utilities to clearly identify and quantify the key constraints affecting the utilities.19
5. Direct Working Group to develop a small set of detailed test problems that are common across more than one utility and work through risk reduction methodology and suggest refinements to “Road Map” timeline.
6. Along with above, require utilities to provide “showing” of “pilots” demonstrating the use of probabilistic models (e.g., probabilistic risk analysis, calibrated subject matter expertise, and risk reduction benefit per dollar) and compare strategies with the Intervenor Approach using the same or similar set of problems.
7. Direct the formation of a Technical Working Group (perhaps an outgrowth or continuation of Metrics Working Group) to address data gathering, metrics, accountability reports, and identify milestones and
19 According to Joint Intervenors, utilities could rely on commercially available software to identify the optimal sets of risk management activities given those constraints. As an interim step, however, the utilities should prioritize risk mitigation activities based on risk reduction per dollar cost.
- 184 -
A.15-05-002 et al. COM/MP6/ar9/lil PROPOSED DECISION (Rev. 1)
timelines for implementation (e.g., “Road Map” of a quantitative methodology)
8. Support SED guidance for RAMP filings and ten major components that should be included in the RAMP filings, with limited changes. For RAMP and GRC filings, require risk reduction calculations and risk mitigated to cost rankings and use risk reduction per dollar spent to prioritize projects.
9. While a common scoring algorithm need not be required at this time, develop requirements for calculating Risk Reduction in a useful way according to direction provided above.
10. Adopt original lexicon and direct Working Group to more thoroughly vet and reevaluate newly proposed SED definitions and MGRA’s and others’ suggestions.
14.3. Second S-MAP Road Map (Long-Term) Based on comments, the following are suggested longer-term
goals to support S-MAP goals moving forward. These will be further addressed in the second phase of this decision.
1. Implement the Joint Intervenor Multi-Attribute methodology (or utility equivalent features) and supplement it with more refined methods to optimize portfolio of risk mitigations.
2. Develop a Risk Tolerance Framework. 3. Develop comparable risk scores across utilities.4. Perform ongoing review of other models.We can spend more time to determine how the Multi-Attribute
and ALARP/Loss Exceedance models complement each other. This will take time and cooperation among the parties.
5. Revisit utility RAMP filings and requirements.6. Increase application of optimization. 7. Review CoF impact categories.
- 185 -

A.15-05-002 et al. COM/MP6/ar9/lil PROPOSED DECISION (Rev. 1)
8. Review interacting risk drivers.D.14-12-025 directed that this S-MAP would be the only first
proceeding of this type and states that at least one additional S-MAP proceeding should occur.
15. Categorization and Need for HearingThe Commission preliminarily categorized this matter as
ratesetting with a need for hearings pursuant to Rule 7.1 (Resolution ALJ 176-3357, dated May 27, 2015). Parties had mixed views about whether this proceeding should be “ratesetting” or “quasi-legislative.” In the interest of promoting transparency, open dialogue among parties, and shared learning about high-level policy considerations and implications in the “start up” or initial phase of the S-MAP program, the Assigned Commissioner determined that this proceeding would be categorized as “quasi-legislative” and this decision confirms that categorization.
16. Comments on Proposed DecisionThe proposed decision in this matter was mailed to the parties in
accordance with Section 311 of the Public Utilities Code and comments were allowed under Rule 14.3 of the Commission’s Rules of Practice and Procedure. Comments were filed on July 5, 2016 by PG&E, SCE, CUE, SDG&E and SoCalGas, MGRA, Joint Intervenors (EPUC/IS/TURN), and ORA. Reply comments were filed on July 11, 2016 by PG&E, SDG&E and SoCalGas, MGRA, Joint Intervenors, and UCAN.
In response to comments from parties, and in addition to non-substantive changes and fine technical refinements, the following substantive changes have been made to the proposed decision:
- 186 -

A.15-05-002 et al. COM/MP6/ar9/lil PROPOSED DECISION (Rev. 1)
1. Clarifies that the decision is “interim” decision subject to the following before final adoption of any model:a. Vet the Joint Intervenor Approach “foundational
requirements” and how they operate in a real world setting;
b. “Test drive” the model, using a small set of detailed test problems (at least five), which are common across more than one utility; and
c. Review results of utility pilots that highlight equivalent or similar features of the Multi-Attribute Approach.
2. Changes the due date for the outcome of pilots demonstrating probabilistic models from October 1, 2016, to a “to be determined date” in the Scoping Memo for the second phase of this proceeding;
3. Provides both a more accurate broad and technical description of the Joint Intervenor Model;1
4. If utilities want to include shareholders’ financial interests in consideration in their risk models and decision frameworks used to support rate case expenditure, especially at the operational level, directs utilities to make a case for any exception in their respective RAMP filings:
5. Clarifies that Sempra’s November 30, 2016, RAMP filings shall file a RAMP based on its current risk evaluation and risk-based decision making methodologies, and additional requirements as listed in the ten major components that shall be included in RAMP filings.
6. Clarifies that the scope of the November 30, 2017 RAMP filing by PG&E shall include the GT&S system.
7. Directs SED Staff to conduct a public workshop within 90 days of the approval of the decision, to review the Joint Intervenor Approach foundational requirements and how it operates in a real world setting; establish
1 See revised discussion in “Section 9.6 Joint Intervenor Framework.”
- 187 -

A.15-05-002 et al. COM/MP6/ar9/lil PROPOSED DECISION (Rev. 1)
“test drive” requirements; and assess status of pilots, as mentioned above, etc.
17. Assignment of ProceedingCommissioner Michael Picker is the assigned Commissioner and
Colette E. Kersten is the assigned ALJ in this proceeding.
Findings of Fact1. On November 14, 2013, the Commission opened R.13-11-006
Order Instituting Rulemaking to Develop a Risk-Based Decision-Making Framework to Evaluate Safety and Reliability Improvements and Revise the Rate Case Plan for Energy Utilities (the Risk OIR) to incorporate a risk-based decision-making framework into the RCP for the energy utilities’ GRCs.
2. D.14-12-025 adopted the risk-based decision-making framework, consisting of S-MAP, RAMP Phase proceeding, and the filing of annual verification reports consisting of the Risk Mitigation Accountability Report and the Risk Spending Accountability Report for use by the large energy utilities, consisting of PG&E, SDG&E, SoCalGas, and SCE.
3. The purpose of the S-MAP is to allow the Commission and parties to examine, understand, and comment on the models that the energy utilities plan to use to prioritize and mitigate risks, and for the Commission to establish guidelines and standards for these models.
4. The end-product of each S-MAP proceeding will be a Commission decision deciding whether a particular risk assessment approach or model that a utility is using, or a variant or alternative model, can be used as the basis for each energy utilities’ RAMP filing in its respective GRC.
- 188 -
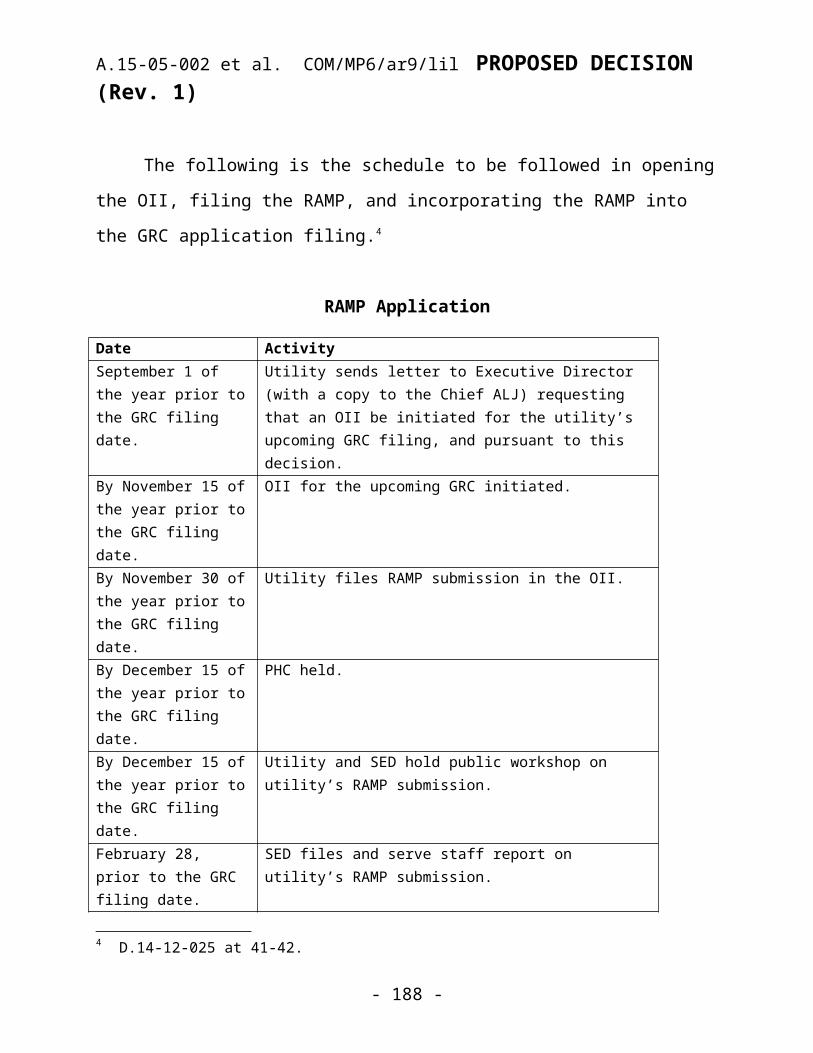
A.15-05-002 et al. COM/MP6/ar9/lil PROPOSED DECISION (Rev. 1)
5. According to D.14-12-025, beginning February 1, 2015, the risk-based decision-making framework shall apply to all future GRC application filings of PG&E, SDG&E, SoCalGas, and SCE.
6. Utilities have taken steps to include more probabilistic risk assessment analysis in their GRC applications.
7. In response to the Risk OIR and D.14-12-025 directives, the utilities’ May 2015 applications, the SED Evaluation Report, Utility Uniformity Report, ALARP and Intervenor White Papers, official workshop reports, and extensive formal comments by parties in response to these deliverables provide the necessary content needed to address many issues before the Commission in this proceeding. But more work and time is needed for many complex issues to be addressed and resolved.
8. This Rulemaking has provided extensive opportunity for the Commission and parties to review and attempt to understand the utilities’ risk management approaches.
9. In recent decisions, the Commission has made it clear that it expects more quantitative information to inform safety expenditure choices in the future; in this regard, the utilities’ current models do not meet Commission expectations.
10.All four utilities have a risk-based decision framework that can be mapped to the Cycla 10-step process.
11.The primary focus of the Cycla criteria is on evaluating the reasonableness of the set of programs and projects presented by the utility to mitigate recognized risks.
12.Despite the similar appearance of the formulas, the utilities’ risk scores are not comparable across the utilities.
- 189 -

A.15-05-002 et al. COM/MP6/ar9/lil PROPOSED DECISION (Rev. 1)
13.None of the utilities’ models produce absolute risk scores at this stage of their evolution.
14.Risk evaluation formulas emphasizing high consequence events will not yield the same portfolio of risk mitigation activities compared to an approach using the traditional formula of risk = frequency x consequence.
15.Common weights as well as common attribute ranges for each impact dimension are one possible approach to allow risk management models that can produce risk scores comparable across the utilities.
16.Direction from the Commission is necessary before any risk management model can result in the ability to compare risk scores among different utilities.
17.Having a common understanding or definition of certain terms that pertain to a risk-based decision-making framework is useful.
18.Based on workshops, it became clear to utilities that the overall risk frameworks employed by each company are substantially similar.
19.Adopting a common framework will ultimately streamline proceedings, and minimize the amount of resources and time devoted to understanding the intricacies of various models and provide useful comparisons.
20.Areas of uniqueness upon which utilities did not adapt their models towards commonalities include risk-scoring algorithms, tools and methods to score risk categories (e.g. wild fire risk).
21.Elements for future consideration include risk tolerance, risk reduction benefit per dollar invested, and risk taxonomy or a
- 190 -

A.15-05-002 et al. COM/MP6/ar9/lil PROPOSED DECISION (Rev. 1)
comprehensive, common and stable set risk attributes across all of its operations and risk.
22.The utilities’ risk assessment models are still predominantly indexing models where SMEs assign integer logarithm-scale scores to describe frequency and consequence rankings to produce risk scores.
23.Utilities generally use discrete, non-additive “order of magnitude” LoF and CoF values, rather than continuous values in their scales, although SCE’s approach uses a continuous frequency scale.
24.The 1 to 7 LoF values do not correspond to mathematical probabilities.
25.Utilities do not use a consistent set of weights for each attribute. 26.Weights are set independently of the attribute range by
individuals who did not specify the attribute ranges.27.The weights on impact dimensions were not chosen based on
true equivalence and convertibility of different dimensions.28.While it is acceptable in principle to use logarithmic scales for
CoF, this approach can mask the weights assigned to the various attributes (e.g., financial) and prevent the weights from being consistent with the attributes themselves.
29.Utilities do not ensure that attribute ranges and scales are all internally consistent.
30.Current utility scales introduce bias in favor of projects that address large consequences.
31.The utilities’ and Joint Intervenors’ models both have their shortcomings.
- 191 -

A.15-05-002 et al. COM/MP6/ar9/lil PROPOSED DECISION (Rev. 1)
32.The utilities’ models need improvement in order to calculate risk reduction in a way that is comparable across the utilities.
33.Without quantifying risk reduction, no meaningful ranking, prioritization or optimization of risk mitigations is possible, and the Commission’s goals and processes set forth in D.14-12-025 are compromised.
34.Sustaining use of the 7x7 matrix for the foreseeable future encourages ongoing entrenchment in current methodologies and unnecessarily delays any decision until the next S-MAP three or more years way.
35.There is no optimization of portfolio of risk mitigation activities, but this will take several more years of evolving utility models, data collection, and assessments.
36.The utility models are marked by weak transparency and questionable repeatability.
37. In making the necessary transition to more mature approaches, there may be “parallel paths” to support both existing status quo models and newer models that successfully enable prioritization of mitigations and systematic approach to portfolio optimization.
38.There is no specification of risk tolerance in any proposed model.39.While there is need for a risk tolerance standard, this will take
much time to develop and much groundwork must first be established before the Commission can establish standards and requirements in this area.
40.The development of uniform and common standards is likely to take some time, and may not be accomplished in the first S-MAP.
- 192 -

A.15-05-002 et al. COM/MP6/ar9/lil PROPOSED DECISION (Rev. 1)
41.With every successive S-MAP, risk management approaches will become more sophisticated.
42.Both the ALARP and Intervenor alternative White Papers mention optimization of the portfolio of mitigation activities as a necessary end goal.
43.ALARP focuses explicit recognition on risk tolerance, deals with the tradeoffs between safety and rate affordability, and imposes a lower tolerance for high consequence risks without needing to apply exponential factors to the consequence term in conventional risk evaluation formulas.
44.Quantifying an explicit statistical value of life, setting acceptable risk tolerances relative to “zero tolerance” in cooperation with the Commission, and having access to sufficient data to evaluate risk tolerance limits versus FN curves, etc. may inhibit use of the ALARP model in a regulatory setting.
45.No “off the shelf” method to model safety risk is satisfactory.46.The ALARP framework relies on external optimization routines
to produce an optimal mix of risk mitigation activities.47.The ALARP framework can consider risks associated with safety,
reliability, environment, cost, and other areas if the impacts are expressed in monetary terms.
48.Except for the use in the nuclear industry and by the U.S. Army Corps of Engineers, the ALARP principle has yet to see wide usage in the U.S.
49.ALARP and the Intervenor Approaches, two alternative approaches, are compatible with each other in that they both deal with different aspects of risk management approaches. Specifically,
- 193 -

A.15-05-002 et al. COM/MP6/ar9/lil PROPOSED DECISION (Rev. 1)
while ALARP is an overarching risk management framework, it does not contain any risk evaluation formulas or methodologies.
50.ALARP tends to be useful in the longer horizon as models mature and can incorporate more fully probabilistic approaches.
51.The subject of aggregate risk modeling required to create an enterprise wide FN curve is complex, even more so if one allows “enterprise” models to be decomposed into the sub-models at the business level, and asset level.
52.A key developmental step to achieve for both ALARP and portfolio optimization is the probabilistic modeling of risk.
53. It is not necessary to adopt ALARP in order to implement multi-attribute optimization methods.
54. In the long-term, the ALARP Approach, or some variation of it, will enable the establishment of risk tolerances necessary to achieve an optimization of the portfolio.
55.Measuring risk mitigation performance relative to metrics, benchmarks, industry best practices, and industry peers is not equivalent to providing an explicit risk tolerance, since these measures still provide at best only an implied level of risk tolerance.
56. Joint Intervenors (TURN, IS, and EPUC) presented an alternative risk evaluation model based on the Multi-Attribute Utility Theory, which they commented has been implemented in an EPRI software package.
57.According to the Joint Intervenors, the Joint Intervenor Approach (or “EPRI model”) is an alternative approach to managing risk and ensuring that electric and natural gas utilities can provide safe, reliable, and affordable services to their customers.
- 194 -

A.15-05-002 et al. COM/MP6/ar9/lil PROPOSED DECISION (Rev. 1)
58.According to the Joint Intervenors, the “EPRI model” is a well-established model that has been used by approximately 20 utilities across the country.
59.According to the Joint Intervenors, the Joint Intervenor Approach defines risk on the linear scale as Risk = Likelihood of Failure x Consequence of Failure, or Risk = LoF x CoF.
60.The Joint Intervenor Approach uses additive LoF and CoF scales. 61.The Joint Intervenor Approach determines risk reduction using
the equation Risk Reduction = (LoF x CoF) Before – (LoF x CoF) After.62.With respect to LoF, the Joint Intervenor Approach uses
mathematical probabilities of failure events determined by relying on subject matter experts and other data regarding the condition of, and likelihood of threats to, the utility’s system.
63.As to CoF, the Joint Intervenor Approach relies on multi-attribute scaling of event consequences in a way that prioritizes safety and accounts for any other consequence impacting other dimensions (e.g., reliability, compliance) the utilities and the Commission may wish to include.
64.According to Joint Intervenors, measuring LoF is based on probability of failure, not frequency of failure (e.g., frequency, e.g., once every 10 years, is different from probability, e.g., 10% likelihood that a failure will occur next year).
65.Using the Joint Intervenor Approach, with every proposed risk mitigation, measurement of risk reduction can occur.
66.According to Joint Intervenors, the Joint Intervenor Approach does not require an explicit estimate of the statistical value of life.
- 195 -
A.15-05-002 et al. COM/MP6/ar9/lil PROPOSED DECISION (Rev. 1)
67.Under the current definitions of absolute and relative risk scores stated in this decision, the Joint Intervenor Approach creates absolute risk scores that are directly proportional to the likelihood and consequence of failure.
68.The Joint Intervenor Approach by itself is not an optimization technique; but it can rely on external optimization techniques (e.g., “off the shelf” software) to produce an optimal portfolio.
69.The Joint Intervenor Approach is a multi-attribute, probabilistic modeling approach, which can be implemented in the near term and refined in the long term.
70.The Joint Intervenor Approach facilitates the calculation of risk reduction that is essential for optimization or prioritization of risk mitigations.
71.According to the Joint Intervenors, the multi-attribute approach ensures public and employee safety are a priority, promotes cost-effective and optimized risk management, and is transparent and easy-to-use, and understandable.
72.Similar to the utilities’ approaches, the Joint Intervenors’ Approach allows SMEs to fill in the gaps where data are missing and probability functions can be built using either SME estimates or numbers.
73.For asset based risks, in the absence of objective asset condition data, calibrated subject matter expertise is an essential component of developing the distributions used in risk analysis.
74.Under the Joint Intervenor model, SMEs define what it means for assets to have different condition (e.g., good, fair, poor) and develop hazard rates.
- 196 -
A.15-05-002 et al. COM/MP6/ar9/lil PROPOSED DECISION (Rev. 1)
75.Under the Joint Intervenor model, SMEs provide information about the types of outside events that can lead to asset failure and the likelihood of those outside events.
76.Under the Joint Intervenor model, SMEs provide “multipliers” that are used to shift the hazard rates to account for outside events.
77.Potential obstacles to effective implementation of models include intrusion of shareholder financial interests into enterprise and ORM focus, lack of data and calibration of subject matter expertise, and potential limited staffing and lack of expertise over time.
78.A major issue is the inputs to risk models in terms of data to determine the LoF and CoF.
79.While lack of data can be a short-term obstacle to implementation, it also presents a unique opportunity to improve understanding about what data is required to determine the optimal portfolio.
80.Utilities have been experimenting with probabilistic models through pilots that contain some of the attributes (e.g., use of LoF, CoF, and calculations for risk reduction).
81.Calculating risk reduction per dollar is required by D.14-12-025 and is necessary information for balancing safety with reasonable rates and holding utilities accountable for safety spending.
82.Prioritizing based on cost-effectiveness measures is an important improvement to rate cases and an important step to optimizing portfolios.
83.There is no separate RAMP decision to approve the RAMP filings.
- 197 -

A.15-05-002 et al. COM/MP6/ar9/lil PROPOSED DECISION (Rev. 1)
84.Because the D.14-12-025 mandated risk mitigation and risk spending accountability reports are not due until after the utilities file their GRCs, SED staff did not focus on the development of accountability reports during the first phase of this proceeding.
85.SED Staff has collaborated with a working group to develop and refine a comprehensive and detailed set of performance metrics to initiate in Phase 2 of this proceeding.
86.During the first phase of this proceeding, there was insufficient time to focus on the development of benchmarking.
87.Specific elements of the accountability reports may also be determined as part of the GRC decisions that precede the reporting cycle.
88.Good progress had been made by all four utilities to develop a risk-based approach to manage operations and assets and to inform rate case decisions.
89.Parties strongly suggest specific guidance from the Commission on a Road Map that will implement short- and long-term recommendations consistent with D.14-12-025 at a pace that recognizes that safety is the Commission’s highest priority. It is reasonable to develop a workplan to implement the Road Map in a manner that allows parties to meaningfully participate in all that work that must be undertaken.
90.Parties have different views about the pace of change necessary to move utilities to a common risk-informed decision making process.
91.Without strong Commission direction, it is unlikely that the utilities will embrace change and adopt a common risk management
- 198 -
A.15-05-002 et al. COM/MP6/ar9/lil PROPOSED DECISION (Rev. 1)
approach at a pace and to the extent that the Commission and intervenors might desire.
92.The Commission needs ongoing access to outside professional consulting expertise if needed, adequate breadth and depth of Commission staffing and subject matter expertise, and effective management of multiple staff roles.
Conclusions of Law1. Section 963(b)(3) declares that it is the policy of the state that
the Commission and each gas corporation place safety of the public and gas corporation employees as the top priority, and that the Commission shall take all reasonable and appropriate actions necessary to carry out the safety priority policy of this paragraph consistent with the principle of just and reasonable cost-based rates.
2. As the precursor D.14-12-025 also emphasized, “It is our intent that the adoption of these additional procedures will result in additional transparency and participation on how the safety risks for energy utilities are prioritized by the Commission and the energy utilities, and provide accountability for how these safety risks are managed, mitigated and minimized.”
3. No evidentiary hearings are needed in this proceeding because this is a quasi-legislative proceeding which establishes policy, and the Commission can consider and base its policy determinations on the pleadings and comment process which has been filed in this proceeding.
4. The Commission should adopt the Cycla 10-Step Evaluation method as a common yardstick for evaluating the maturity,
- 199 -

A.15-05-002 et al. COM/MP6/ar9/lil PROPOSED DECISION (Rev. 1)
robustness, and thoroughness of utility Risk Assessment and Mitigation models and risk management frameworks.
5. The Commission should adopt the original Working Group Proposed Lexicon and direct the Working Group to more thoroughly vet and reevaluate newly proposed SED definitions and other parties’ suggestions during the second phase of this proceeding.
6. Parties should have the opportunity to ask questions about proposed lexicon terms and their potential application, thereby promoting clarity and not confusion among stakeholders as the S-MAP program moves forward.
7. To the extent that utilities have common assets and common environments, they should be encouraged to develop common risk profiles specific to environments and assets, not just utility territories.
8. It is reasonable to “approve” common elements highlighted in the report to the extent that they provide a “bridge” to more sophisticated and administratively efficient multi-attribute risk analysis, or other preferred alternative methods, which the Commission will explore in the second phase of this proceeding.
9. Criteria to determine any priorities should be fulfilment of stated Commission goals, ability to impact short-term change, transparency, reasonableness and accuracy of results, ease of preparation and implementation, among other things.
10. In order to deal with the known deficiencies of the current 1 to 7 scales, the Commission should replace less sophisticated scoring systems with more advanced scoring systems that are capable of calculating risk reduction.
- 200 -

A.15-05-002 et al. COM/MP6/ar9/lil PROPOSED DECISION (Rev. 1)
11.The Commission should consider a shift from logarithmic to linear scales in assessing consequences of failure.
12.The Commission should consider uniform impact dimensions and a prescription for uniform weights and uniform attribute ranges.
13.Given the lack of maturity of existing risk management models, it is premature to impose weightings.
14.The Commission should develop a risk tolerance standard (e.g., ALARP Framework), but not before taking steps to implement a probabilistic modeling approach in the short-term.
15.Beginning to create risk models either at the asset level or structured by event and rolling up into higher levels will take time, but the effort should contribute to safety objectives over time.
16.On an interim basis, and before final Commission adoption of any model, the Commission should conceptually adopt the Multi-Attribute Intervenor Model (or Utility Equivalent Features) subject to review of foundational requirements and verification through the use of “test runs,” and review of utility current “pilots” that may offer alternative strategies.
17.The utilities should take steps toward a more uniform approach towards calculation of risk reduction in the second phase of this proceeding.
18.The Commission should begin to implement optimization techniques by first requiring the utilities to clearly identify and quantify the key constraints affecting the utilities.
19.After further vetting in the second phase of this proceeding, the Joint Intervenor Model should be tested against test scenarios and real life problems that are common across more than one utility,
- 201 -
A.15-05-002 et al. COM/MP6/ar9/lil PROPOSED DECISION (Rev. 1)
which should provide a structure wherein the results of each method can be compared to one another.
20.The most desirable features from the Joint Intervenor Multi-Attribute Approach (and equivalent features from utility models) should be identified for possible adoption in Phase Two of this proceeding.
21. In an effort to migrate towards more uniform approaches and probabilistic approaches, utilities should not spend a large, disproportionate investment of time correcting the inconsistencies in the utilities’ current indexing models that will likely continue to “fall short” of Commission expectations.
22. It is reasonable to direct a Working Group to develop a small set of detailed test problems which are common across more than one utility and work through a risk reduction methodology.
23. It is reasonable to not delay using models due to lack of data. 24.A Technical Working Group should be established in the second
phase of this proceeding (perhaps an outgrowth of the Metrics Working Group) who will address questions related to what data is needed to support risk evaluation, at what granular level, how long it will take to gather the data, and how SMEs can continue to fulfill an important role in the data gaps.
25.The Commission should determine that some level of accountability reporting would be appropriate for GRCs that is not covered under S-MAP.
26. In cooperation with parties, SED staff should continue to refine the proposed performance metrics for review by the Commission during the second phase of this proceeding.
- 202 -
A.15-05-002 et al. COM/MP6/ar9/lil PROPOSED DECISION (Rev. 1)
27.During Phase Two of this S-MAP proceeding, work should take place to develop benchmarking procedures, especially in the context of use of the Joint Intervenor Approach.
28.The Commission should require utilities to provide a “showing” of pilots (as scheduled and addressed in the Phase Two Scoping Memo) which demonstrate the use of probabilistic models (e.g., probabilistic risk analysis, calibrated subject matter expertise, and risk reduction benefit per dollar) and compare strategies with the Intervenor Approach using the same or similar set of problems.
29. It is reasonable to direct the formation of a Technical Working Group (perhaps an outgrowth or continuation of Metrics Working Group) to address issues associated with data gathering, performance metrics, benchmarking procedures, and accountability reports.
30.The utilities’ RAMP filings should include calculations of risk reduction and a ranking of mitigations based on risk reduction per dollar spent.
31.A modified RAMP procedure, clarified by this decision, should be adopted, and an OII should be initiated following the request of each of the large energy utilities for their respective upcoming GRC filings.
32. It is reasonable to allow Sempra to file its upcoming RAMP based on its current risk evaluation and risk-based decision making methodologies, with additional requirements highlighted in italics in the Section 12.4 table entitled “Ten Major Components of RAMP Filings Recommended by SED (Modified).”
33.PG&E’s 2017 RAMP submission should address all of its CPUC-regulated systems, including GT&S.
- 203 -

A.15-05-002 et al. COM/MP6/ar9/lil PROPOSED DECISION (Rev. 1)
34.The Commission should adopt explicit risk tolerance standards over time, but not before laying the groundwork in the development of probabilistic risk analysis.
35. Implementing a methodology that enables an optimized portfolio of risk mitigation measures should be the Commission’s primary focus at this point.
36.Prioritizing the reduction of safety risks should be geared towards safety risk, and should not include shareholder financial interests.
37.Utilities should remove shareholders’ financial interests from consideration in their risk models and decision frameworks used to support rate case expenditure proposals, especially at the operational level, unless the utility can make a good case for an exception in its filing. Utilities, intervenors, and SED staff should, at a future workshop, test the potential impacts of removing shareholders’ financial interests and to explore possible exceptions.
38.Utilities should continue to improve their risk management models and data collection efforts to support increasing use of fully probabilistic risk management models in both the short-term and long-term.
39.The Commission must provide clear direction that change is necessary now to implement safety objectives and that the Commission is serious about migrating from relative risk scoring to more quantified methods for optimized risk mitigation.
40. It is reasonable to implement an interim Road Map, with accompanying workplan, that will implement short- and long-term
- 204 -

A.15-05-002 et al. COM/MP6/ar9/lil PROPOSED DECISION (Rev. 1)
recommendations consistent with D.14-12-025 at a pace that recognizes that safety is the Commission’s highest priority.
41.Consistent with the Commission’s long term goals, subject to further testing, the Commission should implement the Joint Intervenor Approach, commonly referred to as the EPRI multi-attribute risk reduction methodology (or utility equivalent features) and supplement current utility models with more refined methods to optimize portfolio of risk mitigations; consider and adopt a Risk Tolerance standard; adopt a uniform model to enable comparability of risk scores across utilities; and perform ongoing review of other models.
42. In the long term, the Commission should revisit utility RAMP filings and requirements, increase application of optimization, review CoF impact categories, and review interacting risk drivers.
43. In order to address organizational obstacles in a risk-based decision making program, the Commission should have ongoing access to outside professional consulting if needed and adequate breadth and depth of Commission staffing and subject matter expertise; and perform effective management of multiple staff roles.
44.Today’s decision, which describes and adopts the parameters of the S-MAP and RAMP processes, does not prevent the assigned ALJs in either of those proceedings from taking any other action to adjudicate the S-MAP application or the RAMP application.
- 205 -

A.15-05-002 et al. COM/MP6/ar9/lil PROPOSED DECISION (Rev. 1)
I N T E R I M O R D E R
IT IS ORDERED that:1. On an interim basis, the Joint Intervenor Multi-Attribute
Approach (or Utility Equivalent Features) is adopted and San Diego Gas & Electric Company, Southern California Gas Company, Southern California Edison Company, and Pacific Gas and Electric Company are directed to take steps to implement a more uniform risk management approach subject to the following conditions before full scale adoption:
a. Vet the Joint Intervenor Multi-Attribute Approach (or Utility Equivalent Features) foundational requirements and how it operates in real-world scenarios;
b. “Test drive” the Joint Intervenor Multi-Attribute Approach (or utility equivalent features) using a small set of detailed test problems (at least five) which are common across more than one utility; and
c. Review utility pilots that highlight equivalent or similar features of the Multi-Attribute Approach.
2. By the date determined by the Phase Two Scoping Memo for this proceeding, Joint Utilities (San Diego Gas & Electric Company, Southern California Gas Company, Southern California Edison Company, and Pacific Gas and Electric Company) are directed to provide a “showing” of their pilots demonstrating the use of probabilistic models (e.g., probabilistic risk analysis, subject matter expertise that is calibrated within and across utilities as appropriate, risk reduction benefit per dollar) and how strategies align and/or differ with the Joint Intervenor Approach using the same or similar problems.
- 206 -

A.15-05-002 et al. COM/MP6/ar9/lil PROPOSED DECISION (Rev. 1)
3. The Lexicon Working Group’s proposed lexicon is adopted and the Working Group shall continue to convene to more thoroughly vet and reevaluate newly proposed Safety and Enforcement Division definitions and other parties’ suggestions during the second phase of this proceeding.
4. The Cycla Corporation 10-Step Evaluation Method as a common yardstick for evaluating maturity, robustness, and thoroughness of utility Risk Assessment and Mitigation Models and risk management frameworks is adopted.
5. The common elements highlighted in the Joint Utility Uniformity Report, as detailed in Section 8.2 “7x7 Matrix,” are approved only to the extent that they provide a “bridge” to a more sophisticated and administratively efficient multi-attribute analysis, or other preferred methods, which the Commission will explore in the second phase of this proceeding.
6. The Joint Utilities (San Diego Gas & Electric Company, Southern California Gas Company, Southern California Edison Company, and Pacific Gas and Electric Company) are directed to remove shareholders’ financial interests from consideration in their risk models and decision frameworks used to support rate case expenditure proposals, especially at the operational level, unless the utility can make a good case for an exception in its Risk Assessment Mitigation Phase filing.
7. A modified Risk Assessment Mitigation Phase procedure, clarified by this decision, is adopted, and an Order Instituting Investigation shall be initiated following the request of each of the large utilities for their respective upcoming General Rate Cases.
- 207 -

A.15-05-002 et al. COM/MP6/ar9/lil PROPOSED DECISION (Rev. 1)
8. Risk Assessment Mitigation Phase filings by San Diego Gas & Electric Company, Southern California Gas Company, Southern California Edison Company, and Pacific Gas and Electric Company shall explicitly include calculation of risk reduction and a ranking of mitigations based on risk reduction per dollar spent.
9. Because the Sempra utilities (San Diego Gas and Electric Company (SDG&E) and Southern California Gas Company (SoCalGas)) have limited time to file a Risk Assessment Mitigation Phase (RAMP), SDG&E and SoCalGas shall file a RAMP based on its current risk evaluation and risk-based decision making methodologies, and additional requirements as listed in the ten major components that shall be included in the RAMP filings.
10. The scope of the November 30, 2017 Risk Assessment and Mitigation Phase filing by Pacific Gas and Electric Company shall include the gas transmission and storage system.
11.The Commission’s Safety and Enforcement Division Staff shall convene a Technical Working Group by October 1, 2016, comprised of utilities and other stakeholders, to develop a plan to improve data collection efforts, refine the proposed performance metrics, design the content and format of the Risk Mitigation Accountability Report and Risk Spending Accountability Reports, and initiate benchmarking procedures (especially as they relate to the Electric Power and Research Institute multi-attribute model), for review and consideration by the Commission at the end of Phase Two of this proceeding.
12.The Commission’s Safety and Enforcement Division shall continue to coordinate with other Commission divisions to determine
- 208 -

A.15-05-002 et al. COM/MP6/ar9/lil PROPOSED DECISION (Rev. 1)
their respective roles in the processes adopted in today’s decision, and the Executive Director shall ensure there is adequate staffing to undertake the work associated with the risk-based decision-making framework adopted in today’s decision.
13.Within 90 days of the effective date of this decision, the Commission’s Safety and Enforcement Division Staff shall conduct a public workshop to further understand the Joint Intervenor Approach foundational requirements and how it operates in a real world setting, and explore a “test drive” of the Joint Intervenor Multi-Attribute Approach (or utility equivalent features) using a small set of detailed test problems in specific real-world scenarios, which are common across more than one utility.
14.The interim and long-term Road Map to migrate from relative risk scoring to more quantitative methods for optimized risk mitigation is approved subject to review and revision in the second phase of this proceeding.
15.This rulemaking remains open to begin Phase Two immediately after the issuance of this decision.
This order is effective today.Dated , at San Francisco, California.
- 209 -

A.15-05-002 et al. COM/MP6/ar9/lil PROPOSED DECISION (Rev. 1)
APPENDIX A
UTILITIES’ RISK MODELS AND DECISION FRAMEWORKS AND COMPARISON OF RISK MODEL FORMULAS
EXCERPTS FROM “SAFETY AND ENFORCEMENT DIVISION EVALUATION REPORT ON THE RISK EVALUATION MODELS AND RISK-BASED DECISION FRAMEWORK IN A.15-
05-002”MARCH 22, 2016
(REVISED IN RESPONSE TO PARTIES’ COMMENTS ON APRIL 11, 2015 AND APRIL 25, 2015)
- 1 -

A.15-05-002 et al. COM/MP6/ar9/lil PROPOSED DECISION (Rev. 1)
1. Utilities’ Risk Models and Decision Frameworks
This section briefly describes the utilities’ risk models and risk decision frameworks as presented in their applications in the S-MAP proceeding. The descriptions that follow are not meant to be comprehensive, but are intended only to give highlights of elements that we deem to be important to point out in order to compare the different approaches employed by the utilities.
1.1. PG&E’s Risk Model and Decision FrameworkPG&E has advanced farther along the development and experience curve of using risk calculating models than either SCE or Sempra. Although there have been minor improvements in the risk evaluation model since its first appearance in PG&E’s 2012 Test Year gas distribution GRC, PG&E’s risk evaluation model is still essentially unchanged and is still marked by many of the same problems that SED identified in the 2014 Test Year GT&S rate case.
PG&E’s risk-based resource allocation framework presented in this proceeding was developed from an enterprise and operations risk management (EORM) perspective. Operational Risk Management (ORM) is a subset of enterprise risk management (ERM), but PG&E’s application distinguishes ORM from the broader and higher level ERM and refers to the aggregate framework as enterprise and operational risk management.
PG&E is four years into its current risk management process and looks at the process as a continuing journey. The aim of this EORM framework is to make a risk management culture a company-wide conversation. Governance oversight is the hallmark of PG&E’s risk management program. PG&E has organized its risk management process into four main sessions:
- 2 -

A.15-05-002 et al. COM/MP6/ar9/lil PROPOSED DECISION (Rev. 1)
5. Session D, where senior management is made aware of top enterprise risks and other main compliance issues.
6. Session 1, where discussions are held to consider strategies for managing line of business priorities, including plans to manage top risks.
7. Risk Informed Budget Allocation (RIBA), in which risk scores are calculated for all programs and projects in the operational lines of business capital and expense portfolios. Executive leadership is involved in the discussion at the end of this process.
8. Session 2, where resources are prioritized and allocated to execute the risk mitigation decisions resulting from RIBA.
The two main tools of PG&E’s risk management framework are the risk evaluation tool (RET) and the risk-informed budget allocation process (RIBA). RET was first presented to the Commission in PG&E’s Test Year 2014 general rate case filed in 2012 (A.12-11-009). RIBA was introduced in the GT&S rate case proceeding (A.13-12-012) filed in 2013. Both RET and RIBA have gone through revisions and refinements since their initial appearance, but the essential shape and form of both RET and RIBA have remained unchanged.
RET 2.1RET is a Microsoft Excel spreadsheet-based risk evaluation model that can be loosely viewed as a spreadsheet representation of graphical fault-tree analysis. PG&E’s RET consists of only operational risks that line of business subject matter experts deem important enough to include for consideration in the RET model. The term “risk register” is used by PG&E to refer to the roster of all threat causes (defined below) developed in RET.
- 3 -

A.15-05-002 et al. COM/MP6/ar9/lil PROPOSED DECISION (Rev. 1)
The primary function of RET is to help top corporate officers in the Risk and Compliance Committee in Session D become aware of the most significant (top 10) operational risks that have the potential to affect the operation and viability of PG&E as an ongoing enterprise. RET’s secondary function, using the same input and output, is to help asset family owners in Session 1 at the line of business to see all top operational risks at once in order to prioritize top operational risks for mitigation strategies. The output of RET and the risk scores are mapped to a 7x7 matrix with the frequency in the vertical axis and the impact (consequence) in the horizontal axis. PG&E does not have a definite cut-off risk score in RET below which a risk is considered insignificant enough that mitigation spending is not warranted.
The current version of RET is 2.1. Each line of business (e.g. gas operation, electric operation, energy supply, nuclear, etc.) uses the same RET model, but each line of business creates its own risk register and estimates its own set of risk drivers, failure modes, consequence scenarios, and risk scores. Subject matter expert (SME) input is used throughout the RET process ranging from threat identification to risk score evaluation. The RET model has a hierarchical structure. First, SME input is used to populate potential threats affecting the assets within the line of business. Then SME input is used to estimate potential failure modes of the asset elements and their associated consequence scenarios. PG&E refers to a threat (risk driver), the threat cause, a consequence scenario, together with its associated risk score, as a “risk.”
In PG&E’s RET model, a “risk” is an entry that comprises of a risk driver (which is typically asset-based), a failure mode due to the risk driver, a 95th-percentile consequence scenario based on the failure mode, a frequency of the failure mode, and finally the resulting risk score.
- 4 -
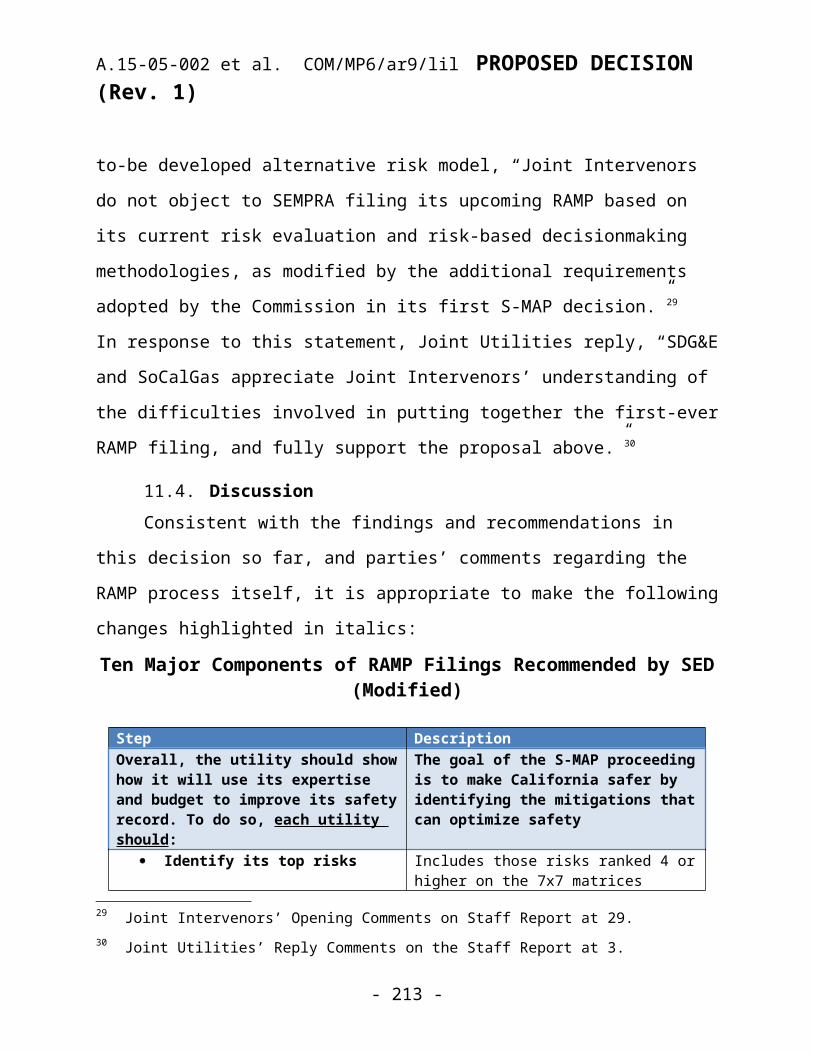
A.15-05-002 et al. COM/MP6/ar9/lil PROPOSED DECISION (Rev. 1)
For each threat cause, an integer (1 to 7) impact (consequence) score is estimated by the SMEs for each of six impact dimensions (safety, reliability, environment, compliance, trust, financial) based on an estimated 95th-percentile probable worst case outcome scenario. PG&E refers to this as a “P95” scenario. In other words, given that a failure event has occurred, the P95 scenario is meant to capture the potential consequence at the 95th-percentile of all possible unfavorable outcomes.
The RET risk score represents an estimated 95th-percentile probable worst outcome of (residual) risk if no (additional) risk mitigation measures are taken. Calibration sessions are used to ensure consistency of SME-assigned scores across threat causes and across asset families.
The latest improvement reflected in RET 2.1 is that for threat causes where PG&E has reliable actual frequency data, these data may be used instead of frequencies based on SME opinions. PG&E has expressed a desire to move toward more rigorous quantification using actual frequency data. The stumbling block has been the unavailability of data for failure events that are either very rare or have not even occurred yet.
The RET formula is described in Chapter 2, Attachment A of PG&E’s testimony.Figure 2
- 5 -

A.15-05-002 et al. COM/MP6/ar9/lil PROPOSED DECISION (Rev. 1)
If we introduce a linear-scale variable C to stand for consequence, we will show in the following pages that PG&E’s RET formula can be equivalently restated as:
RS = f(1/4) x [W1C1 + W2C2 + W3C3 + W4C4 + W5C5 + W6C6](1/2)
Except in cases where PG&E has reliable frequency data, SMEs are used to estimate one of seven broad logarithmic ranges into which frequencies fall. In PG&E’s RET formula, frequencies are evaluated at the right end of a logarithm range. For example, if the frequency range is estimated to fall into “once every 30 to 100 years”. Then the right end of the range is 100 years and the frequency is 1/100. The representative logarithm of this frequency range is -2. Any event within this “once every 30 to 100 years” would have the same log f equal to -2.
The top frequency range has a description of “> 10 times per year.” In reality, PG&E assigns an upper frequency value of 100 times per year to this range. In other words, the current RET model limits failure events to a maximum frequency of 100 times per year for any particular threat and failure scenario.
- 6 -

A.15-05-002 et al. COM/MP6/ar9/lil PROPOSED DECISION (Rev. 1)
By substituting k = 100.5 and by simple algebraic manipulation, PG&E’s original RET formula can be transformed into this mathematically equivalent form:
RS = f(1/4) x 10(0.5 x IEvent
)
(Eq. 1)
By substituting the definition of IEvent into the above equation, the RET RS
formula in Eq. 1 can also be equivalently expressed as:
RS = f(1/4) x [W110(I1) + W210(I2) + W310(I3) + W410(I4) + W510(I5) +
W610(I6)](1/2) (Eq. 2)
To gain further insight into PG&E’s RET formula, we introduce the variable, C, to represent the linear scale consequence value on an impact dimension. Since the (1 to 7) integer impact scores, I, represent logarithms of the linear scale consequence values, raising the logarithm of a consequence value to the power 10 recovers the original linear scale consequence value:
10I = 10log(C) = C
PG&E’s RET formula can now be equivalently expressed as:
RS = f(1/4) x [W1C1 + W2C2 + W3C3 + W4C4 + W5C5 + W6C6](1/2) (Eq. 3)
In other words, a RET score calculated using PG&E’s RET formula is proportional to the expected annual frequency raised to the 1/4 power. The RET score is also proportional to the square root (i.e. raised to the ½ power) of the weighted sum of linear scale consequence values. Equations 1, 2,
- 7 -
A.15-05-002 et al. COM/MP6/ar9/lil PROPOSED DECISION (Rev. 1)
and 3 are mathematically equivalent to PG&E’s original RET formula. By using the same definitions of frequency and consequence, the equivalent form of PG&E’s RET formula in Eq. 3 facilitates comparison with the risk scoring formulas used by SCE and Sempra, as we will see later on in this report.
A risk score produced by PG&E’s RET formula would differ from that produced by the traditional expression of absolute risk (i.e. risk = frequency x consequence)1 due to the distortion created by the frequency term being raised to the 1/4 power and the weighted sum of the linear scale consequence values being raised to the 1/2 power. The effect of raising the consequence term to 1/2 power and the frequency term to only 1/4 power is to emphasize high consequence events and de-emphasize high frequency low consequence events. With the emphasis on high consequence events, the overall effect is that for certain combinations of frequency and consequence values, PG&E’s RET could produce relative risk rankings that would differ from those produced by the traditional absolute risk formula (risk = f x C) as the hypothetical risk scenarios in Table 3 below show:2
Table 3
1 There are two different commonly used expressions to calculate risk. One form (risk = probability of a single element failure x consequence of failure for an element) expresses risk for an element within an asset class (e.g. risk for a single power pole failing). The other form (risk = aggregate frequency of failure for an entire asset class x average consequence of failure for an element) expresses risk on an aggregate basis for an entire asset class (or group) of similar elements (e.g. aggregate risk for all similar wooden power poles failing). The aggregate form is based on the fact that for very small probabilities, frequency of failure for one element is very nearly equal to the probability of failure for that element. The aggregate form (Risk = frequency x consequence) is the approach used in the utilities’ current risk evaluation models. We refer to the aggregate form as the “traditional” risk formula.2 This table uses a single consequence dimension to simplify the computations in order to illustrate the conclusions, but the conclusions would remain unchanged for six consequence dimensions.
- 8 -

A.15-05-002 et al. COM/MP6/ar9/lil PROPOSED DECISION (Rev. 1)
Risk scenario frequency (f) Consequence (C) f x C PG&E RET f x C PG&E RET
A 10 100,000 1,000,000 562 1 3B 0.001 300,000,000 300,000 3,080 2 1C 0.02 10,000,000 200,000 1,189 3 2D 100 400 40,000 63 4 5E 1 10,000 10,000 100 5 4
Risk Score by Formula Risk ranking by risk score
There may be valid societal reasons for placing disproportional emphasis on low frequency but very high consequence risks (catastrophic wildfires, for example). However, modifying the traditional risk formula (risk = f x C) in order to emphasize high consequence events undermines the whole notion of using risk formulas and risk scores to evaluate risks. A risk score is meant to allow an objective comparison so that two different risks with equal risk scores should be equally undesirable, whether or not one is high frequency/low consequence and the other is low frequency/high consequence. Furthermore, a portfolio of risk mitigation activities prioritized to favor mitigating low frequency/very high consequence events would almost certainly not yield an optimal solution from a portfolio optimization standpoint of trying to achieve either lowest rate increase or highest aggregate (i.e. enterprise-wide) risk reduction, or some combination. Whether or not this suboptimal solution is an acceptable tradeoff from a rate case perspective is a policy question that does not have a right or wrong answer.
It is worth noting that adopting the downward-sloping risk tolerance limit lines in an ALARP framework would obviate the need to artificially boost the consequence term in the RET formula in order to emphasize high consequence events. An ALARP framework has emphasis on avoiding high consequence risks built into the risk tolerance limit lines. This is because
- 9 -

A.15-05-002 et al. COM/MP6/ar9/lil PROPOSED DECISION (Rev. 1)
the downward-sloping risk tolerance limit lines in ALARP place ever lower limits on risks as the consequences of risks increase.3
RIBARIBA is a risk scoring model applied to all programs and projects in
the operational business lines of business capital and expense portfolios. Its main purpose is to help prioritize (but not optimize) the portfolio of mitigation activities (programs and projects) at the enterprise-level investment planning sessions.
To help prioritize risk mitigation activities, RIBA uses the same risk calculation formula as RET. Whereas RET evaluates the risk for threats and failure scenarios, RIBA is applied to evaluate the risk for programs and projects designed to mitigate those threats and failure events. The frequency and impact components measure the frequency and impact of the underlying risks that the programs and projects are meant to mitigate. To accomplish this, RIBA uses three impact (or consequence) dimensions versus six in RET:
RET RIBASafety x xReliability x xEnvironmental
x x
Compliance
x -
Trust x -Financial x -
Whereas RET’s outputs are mapped to a 7x7 matrix, RIBA has an additional gradation in the frequency level of 4.5 to result in an 8 x7 (frequency by consequence) matrix. Since RIBA uses the same RET formula, all the observations we made concerning RET applies to RIBA as well, namely, that 3 See Figures 3a, 3b, and Figure 5 in SED Staff White Paper on ALARP.
- 10 -
A.15-05-002 et al. COM/MP6/ar9/lil PROPOSED DECISION (Rev. 1)
the RIBA risk score is proportional to the expected annual frequency raised to the 1/4 power. The RIBA score is also proportional to the square root (i.e. raised to the ½ power) of the weighted sum of linear scale consequence values. Similarly, RIBA places emphasis on high consequence events and that RIBA could lead to prioritizing programs and projects with high consequence events ahead of other lower consequence events, even if a strictly frequency x consequence risk score might indicate otherwise.
Besides RET and RIBA, PG&E also relies on specific operational level programs to manage certain asset and operational risks. On the gas side, these include gas transmission integrity management program (TIMP) to management transmission and storage assets and gas distribution integrity management program (DIMP) to manage distribution assets to comply with gas safety codes. On the electric distribution and transmission side, there are Generation Risk Information Tool (GRIT) used to evaluate risks associated with PG&E’s hydroelectric assets and Electric Tool for Asset Risk (STAR) used for evaluating risks in PG&E’s electric operations.
One way to look at these operational level special programs is that they help to manage risk components within an asset family for risk mitigation prioritization purposes. Whereas RET and RIBA are used to identify enterprise and operational level risks and help prioritize risk mitigation activities at an enterprise level, operation-specific programs such as DIMP and TIMP help to identify, evaluate, and prioritize risks within the operational level. RET and particularly RIBA help to determine the scope and pace of risk mitigation activities and funding allocation at an enterprise level across lines of business and asset families. Once that RIBA process has been completed, the operational programs help to determine allocation of funding, to prioritize, and to determine the scope and pace of mitigation activities within the lines of business and asset families. There is two-way
- 11 -
A.15-05-002 et al. COM/MP6/ar9/lil PROPOSED DECISION (Rev. 1)
communication between the enterprise level and operational risk management tools (RET and RIBA) and the operational risk management programs (TIMP, DIMP, GRIT, STAR, etc.) in that they act as input to the other and they influence the output of the other.
1.2. SCE’s Risk Model and Decision FrameworkSimilar to PG&E, SCE’s risk management framework is also based on an Enterprise Risk Management framework. SCE’s ERM framework was derived primarily from the International Organization for Standardization (ISO) 31000 and, to a lesser extent, the Committee of Sponsoring Organizations of the Treadway Commission (COSO): 2004 Enterprise Risk Management.
SCE’s ERM framework follows a six-step approach, which, according to SCE’s testimony, corresponds to the Cycla 10-step process.
Table 4
- 12 -
A.15-05-002 et al. COM/MP6/ar9/lil PROPOSED DECISION (Rev. 1)
Since SCE’s risk model and risk calculation framework as presented in this application have only been recently developed, they are still evolving and have yet to be implemented.
SCE’s risk model defines two groups of risks: asset-related risks and utility-wide risks. Asset-related risks are those that arise from physical assets and activities associated with the operation of the assets. Utility-wide risks arise from risks not associated with a particular asset, and include such risks as financial, economic risks, business model risks, legal and regulatory risks, compliance risks, and human resource risks.
SCE’s risk identification approach revolves around the listing of risk statements. A risk statement identifies: a risk event (e.g., a pole failure), an outcome (e.g., a wildfire), and the impact of the outcome (e.g., safety). SCE uses a “Bowtie diagram” to map the progression of multiple risk drivers to eventual multiple impacts.
Figure 3Bowtie Diagram
Since there could be multiple outcomes for each risk event, SCE calculates a risk score across five impact dimensions (safety, reliability, environmental, compliance, financial) for each outcome without applying
- 13 -

A.15-05-002 et al. COM/MP6/ar9/lil PROPOSED DECISION (Rev. 1)
any weights across the impact dimensions. The total risk score for the risk event is calculated as the simple, non-weighted sum for all the different outcomes resulting from that failure event. Since the risk contribution from all 5 impact dimensions are summed without applying weights, each of the five impact dimensions is effectively given equal weight.
SCE’s also refers to its risk calculation formula as Risk Evaluation Tool (RET), but it differs from PG&E’s RET formula.
SCE’s RET formula for each impact dimension and each scenario is:
TEF is the trigger event frequency. TEF is the annual frequency of failure events described by the risk statement.
CP is the consequence percentage. It is defined as the percentage of trigger events that result in an adverse outcome across any of the 5 impact dimensions. The CP term appears in SCE risk formula but not in those of PG&E or Sempra.
CI is an integer logarithm-scale impact score across any of the 5 impact dimensions. Since the terms impact and consequence are synonymous, if we use the same linear-scale consequence variable C we previously defined in PG&E’s RET, CI must by definition be equal to log(C):
CI = log(C)
To aid comparison against PG&E’s RET, we transform SCE’s RET formula into a form similar to PG&E’s RET formula, by substituting the following equation into the SCE’s RET:
- 14 -

A.15-05-002 et al. COM/MP6/ar9/lil PROPOSED DECISION (Rev. 1)
10CI = 10log(C) = C or simply, 10CI = C
With this substitution, SCE’s RET formula for each scenario and each impact dimension can now be equivalently restated as:
RS = TEF * CP * C (Eq. 4)
Next we recognize that the product, TEF x CP, in SCE’s RET formula can be treated as equivalent to the frequency term in PG&E’s RET formula:
f = TEF x CP (Eq. 5)
Substituting Eq. 5 into Eq. 4 yields the familiar risk score formula:
RS = f x C for each scenarios and each impact dimension. (Eq. 6)
Since for each scenario, SCE’s RET is to be summed over five impact dimensions, it can be equivalently restated as:
For each scenario, RS = f1C1 + f2C2 + f3C3 + f4C4 + f5C5 (Eq. 7)
The total risk score for an asset (or operation) is the sum of all scenario risk scores for that asset or operation.
In Eq. 7, f1 represents the frequency of only those trigger events that lead to a loss in the first impact dimension, etc. Consequence is the average per-event consequence taking into account only events that result in a loss.
Since SCE’s RET formula is equivalent to the traditional risk formula (risk = f x C), the risk score it produces follows a linear scale. It is, however, not a
- 15 -

A.15-05-002 et al. COM/MP6/ar9/lil PROPOSED DECISION (Rev. 1)
true absolute risk score despite its linear scale and the f x C format because the impact dimension (consequence) scores are not all stated in a common unit of measurement. There is an “apples plus oranges” effect in the risk score calculations. We, therefore, describe SCE’s RET formula as a quasi-absolute risk score formula.
However, these quasi-absolute risk scores have little, if any, direct-physical interpretation in the real world. The first reason is that the different impact dimension scores that go into the risk score calculations are simply added together without any conversion into a common unit of measurement. This results in the aforementioned apples plus oranges effect of mixing non-comparable units. The second reason is that the logarithm-scale impact (consequence) index scores estimated by SMEs are not based on any uniform calibration standard that anyone else outside of SCE can relate to. For these two reasons, the quasi-absolute risk scores, though they have the appearance of being absolute and being on a linear scale, do not have the physical interpretation that truly absolute risk scores have.
An alternative way to manipulate SCE’s original RET formula is to combine the CP term with C (instead of combining the CP term with the trigger event frequency, TEF) to form a new consequence variable, lower case c, i.e. c = CP x C. This lower case c would then be equivalent to the consequence term C in PG&E’s RET. If we took this approach, SCE’s RET formula could be cast into this equivalent form:
RS = f x (c1 + c2 + c3 + c4 + c5) (Eq. 8)
In this formula, f represents the frequency of all trigger events, whether or not they lead to a consequence with a loss. Lower case c represents the
- 16 -

A.15-05-002 et al. COM/MP6/ar9/lil PROPOSED DECISION (Rev. 1)
average consequence for all trigger events whether or not a trigger event leads to an actual loss.
For simplicity when comparing SCE’s model with PG&E’s and Sempra’s formulas, we will not use the alternative form in Eq. 8 and will use Eq. 7, instead. A comparison using Eq. 8 would be equally valid as one using Eq. 7 and would result in identical observations so long as we keep track of the nuances in the definitions of the various variables in the equations.
Risk Spend EfficiencyAlone among the utilities, SCE calculates a quantity known as Risk Spend Efficiency (RSE) for each program or project. It is defined as risk reduction (difference between pre-mitigation and post-mitigation risk scores) divided by the cost of the risk mitigation program or project. Programs and projects are prioritized by the risk spend efficiency numbers, subject to various operational constraints, and other non-risk considerations.
Since, as we pointed out, the quasi-absolute risk scores have little to no direct physical interpretation in the real world, the relative risk spend efficiency scores likewise have little to no direct physical interpretation. The RSE scores could, however, be very useful within SCE to inform decisions on mitigation activities. As part of its evolving risk-based planning approach, SCE intends to prioritize mitigation spending by taking Risk Spend Efficiency into consideration. We caution, however, that prioritizing a portfolio based on cost-effectiveness measures, such as the RSE, is not the same as choosing an optimal mix of mitigation activities based on some rigorous optimization routines. One in fact would expect that the results obtained by the two methods would not usually coincide. The information given by the risk spend efficiency calculations could be useful but the limitations should be recognized.
- 17 -

A.15-05-002 et al. COM/MP6/ar9/lil PROPOSED DECISION (Rev. 1)
Risk-Informed Planning Approach (RIPA)SCE is developing a Risk-Informed Planning Approach (RIPA) to manage its enterprise level risks. The objective of RIPA is to explicitly incorporate knowledge about risks into planning decisions. RIPA fits in SCE’s overall enterprise risk management process as the fifth step as shown in the following diagram:
Figure 4
RIPA uses input from risk scores and risk spend efficiency scores to inform decisions to prioritize mitigation programs and projects. Since RIPA is an enterprise-wide tool, its use requires calibration across the whole enterprise to ensure common understanding and evaluation of different risks. SCE plans to pilot the RIPA process in the T&D operating unit over the next rate case cycle.
1.3. Sempra’s Risk Model and Decision FrameworkSimilar to PG&E and SCE, Sempra’s risk management framework is also based on an Enterprise Risk Management framework that closely follows the ISO 31000 standards. The two Sempra utilities, SoCalGas and SDG&E, share the same basic approach to evaluating enterprise risks and have the same risk-based decision framework.
- 18 -

A.15-05-002 et al. COM/MP6/ar9/lil PROPOSED DECISION (Rev. 1)
Sempra continues to develop and evolve its risk model and risk calculation framework. In the near term Sempra intends to further develop its qualitative risk assessment processes, and in the long term it plans to achieve quantitative methods. It uses subject matter expertise that has been calibrated to fit its risk analyses and validates that expertise through supporting data.
Similar to SCE, Sempra has mapped its risk management steps to the Cycla 10-step process.4
Table 5
Sempra’s risk evaluation tool is also referred to as RET, but it, too, is different from PG&E’s formula. Sempra’s RET formula is stated as:
4 From p.4 of Sempra’s PowerPoint presentation during S-MAP workshop #1 on August 3, 2015.
- 19 -
A.15-05-002 et al. COM/MP6/ar9/lil PROPOSED DECISION (Rev. 1)
In this formula, impacti is a logarithm-scale whole integer (1 to 7) index score of impact (consequence).
Frequency follows a linear scale and is not modified by a logarithmic function. Sempra’s model chooses a fixed point from each of the seven log-scale ranges of frequency to represent a frequency within a frequency range.
Sempra’s risk model has four impact dimensions: Health, Safety & Environmental; Operational and Reliability; Regulatory, Legal & Compliance; and Financial. For convenience, we refer to these four broad categories by abbreviating them to safety, reliability, compliance, and financial. The safety impact dimension score receives a 40% weight. The remaining reliability, compliance, and financial impact scores each receive a 20% weight.
Whereas PG&E and SCE have distinct impact dimensions for safety and environment, Sempra takes a different approach by putting any impact touching “health, safety, and environment” under an overarching Safety dimension. Therefore, Sempra’s definition for the safety dimension is more inclusive but less completely oriented to safety. A case could be made that Sempra’s approach more fully captures safety because health, safety, and environmental quality are all tied together and all three parts affect safety. A case could also be made that Sempra’s approach diffuses the understanding of safety by including other characteristics. It is this overall safety impact dimension that receives a 40% weight in the total risk score. Regarding commonalities among the three utilities, this difference in categories is something to watch as the models evolve.
Sempra has recently communicated to SED that, similar to what PG&E does in its RIBA process, Sempra is also developing a process to evaluate risk
- 20 -

A.15-05-002 et al. COM/MP6/ar9/lil PROPOSED DECISION (Rev. 1)
scores for the risk mitigation programs and projects. The work-product for this development will not appear in this first S-MAP but will likely appear in future S-MAPs and may possibly even appear in Sempra’s upcoming general rate case application.
SDG&E’s top risks for its gas line of business are as follows: Catastrophic damage involving gas infrastructure (dig-ins) Catastrophic damage involving gas transmission pipeline failure Catastrophic damage involving medium and non-Department of
Transportation pipeline failure
SoCalGas’ top risks are as follows: Catastrophic damage involving gas infrastructure (dig-ins) Catastrophic damage involving gas transmission pipeline failure Catastrophic damage involving medium and non-Department of
Transportation pipeline failure Catastrophic event related to storage well integrity Physical security of critical infrastructure
SDG&E’s top risks for its electric line of business are as follows: Wildfires caused by SDG&E equipment (including 3rd party pole
attachments) Distributed energy resources (DERs) safety and operational concerns Major disturbance to electrical services (e.g. blackout) Fail to black start Unmanned aircraft system incident Public safety events – electric Electric infrastructure integrity
Sempra also has cross-cutting risks common to both SDG&E and SoCalGas, as follows:
- 21 -
A.15-05-002 et al. COM/MP6/ar9/lil PROPOSED DECISION (Rev. 1)
Employee, contractor, and public safety Cybersecurity Workplace violence Records management Workforce planning Climate change adaptation Aviation incident
Sempra’s top identified risk is wildfires linked to utility infrastructure (such as downed poles, wire contact with trees, or sparks from equipment, etc.). As a result, Sempra has developed an extensive software-based model and cultivated new sources of data including items such as wind patterns to assess and mitigate this risk. This software model is distinct from the risk assessment model presented above, which is parallel to those of the other utilities. Called Fire Risk Mitigation (FiRM), the model is a unique aspect of Sempra’s approach. Sempra also has a related Wildfire Risk Reduction Model (WRRM), which the utility launched in 2013, and which performs computer simulations.
Sempra has recently stated that it is developing a risk spend efficiency calculation, and is attempting to move that tool forward in ways that none of the utilities have been able to yet. Its calculation will be a pilot, and will be expected to go through iterations before becoming mature. SED plans to watch that calculation develop, but does not yet know to what extent it will succeed.
SED does not know what eventual form Sempra’s risk spend efficiency will take, but our earlier caution regarding SCE’s strategy to prioritize mitigation activities based on cost effectiveness measures alone being unlikely to yield an optimized mix also applies to Sempra’s attempt to
- 22 -
A.15-05-002 et al. COM/MP6/ar9/lil PROPOSED DECISION (Rev. 1)
develop its own risk spend efficiency. So long as Sempra and other stakeholders recognize the limitation of cost effectiveness measures, risk efficiency measures could provide useful information to rate case proceedings.
2. Comparison of Risk Model FormulasHaving described all the utilities’ risk score formulas, we can now list all the RET formulas at once to compare them. First we list the RET models in their original forms as presented by the utilities in their S-MAP applications:
PG&E:
SCE:
Sempra:
The above RET formulas in their original forms use different terms and different definitions and are clearly not conducive to easy comparison. To facilitate comparison across the three models by using the same definitions of linear-scale f (frequency) and linear-scale C (consequence), we restate them in the modified equivalent forms we showed earlier:Table 6: Modified Equivalent RET Formulas
- 23 -
PG&E: RS = f(1/4) x [W1C1 + W2C2 + W3C3 + W4C4 + W5C5 + W6C6](1/2)
SCE: RS = f1C1 + f2C2 + f3C3 + f4C4 + f5C5 for each scenario Total RS = sum of all scenario risk scores
Sempra: RS = W1f1C1 + W2f2C2 + W3f3C3 + W4f4C4

A.15-05-002 et al. COM/MP6/ar9/lil PROPOSED DECISION (Rev. 1)
It should be pointed out that even though the terms f and C in the three formulas share the same meaning of frequency and consequence, the suffixes (1, 2, 3, 4, etc.) may refer to different dimensions across the formulas. For example, W3 in PG&E’s formula is not the same as W3 in Sempra’s formula, even though both terms have the same suffix 3. SCE’s C1
is not necessarily the same as the C1 term in Sempra’s or PG&E’s formulas. f4 in SCE’s formula is not the same as f4 in Sempra’s formula, etc.
2.1. Observations on Risk Evaluation Formulas
The three models yield scores that are not comparable. PG&E’s RET is a relative risk model that emphasizes high consequence events. Although SCE’s and Sempra’s models follow the traditional absolute risk formula (i.e. R = f x C), the scores they yield are also not comparable because the impact dimensions are different and the weights are also different. Additionally, SCE’s model sums individual scenario risk scores over multiple failure scenarios for the same asset or same incorrect operation, whereas Sempra’s and also PG&E’s RET are calculated for only one scenario at a time. SCE’s RET simply sums the contributions to the total risk score from all impact dimensions, whereas PG&E and Sempra apply percentage weights to the impact dimension sub-scores before summation. All three models map their risk scores to a 7x7 log-scale matrix.
SCE’s model uses the CP (consequence percentage) factor to denote the percentage of failure events that actually leads to safety related results.
(End of Appendix A)
- 24 -