ALISO CANYON NATURAL GAS LEAK: AIR MONITORING RESULTS
47
South Coast Air Quality Management District ALISO CANYON NATURAL GAS LEAK: AIR MONITORING RESULTS Final Report January 2018
Transcript of ALISO CANYON NATURAL GAS LEAK: AIR MONITORING RESULTS

South Coast Air Quality Management District
ALISO CANYON NATURAL GAS LEAK:
AIR MONITORING RESULTS
Final Report
January 2018
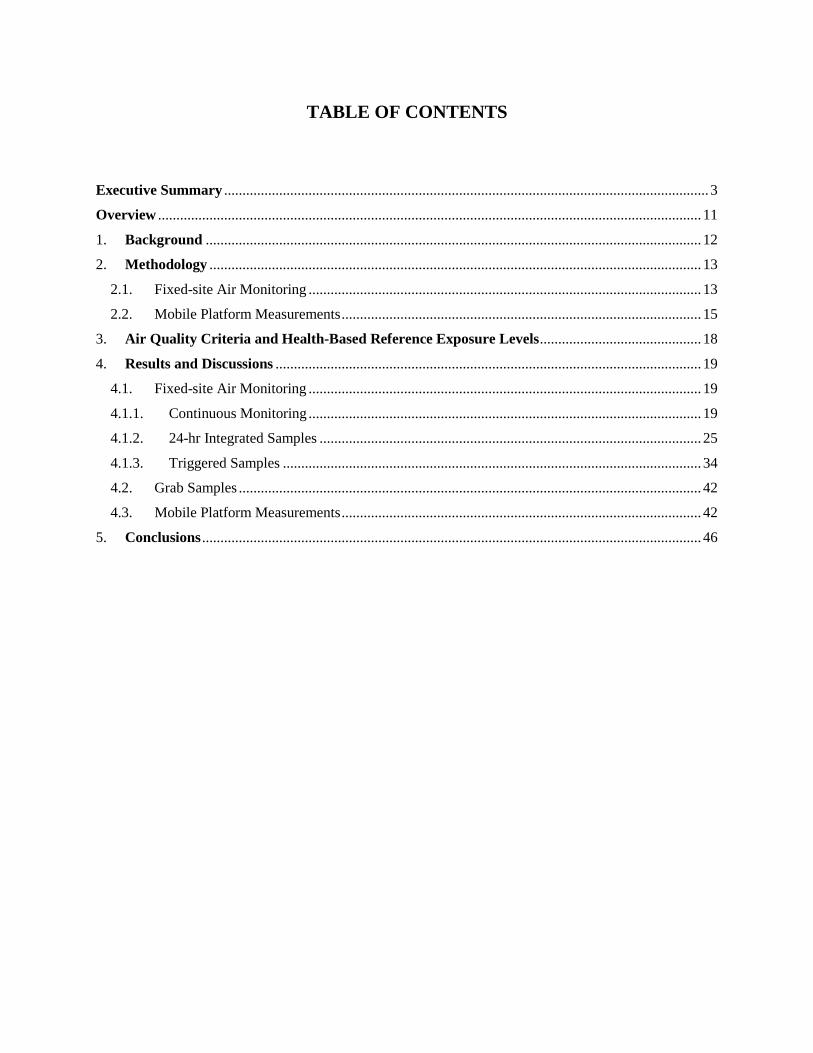
TABLE OF CONTENTS
Executive Summary .................................................................................................................................... 3
Overview .................................................................................................................................................... 11
1. Background ....................................................................................................................................... 12
2. Methodology ...................................................................................................................................... 13
2.1. Fixed-site Air Monitoring ........................................................................................................... 13
2.2. Mobile Platform Measurements .................................................................................................. 15
3. Air Quality Criteria and Health-Based Reference Exposure Levels ............................................ 18
4. Results and Discussions .................................................................................................................... 19
4.1. Fixed-site Air Monitoring ........................................................................................................... 19
4.1.1. Continuous Monitoring ........................................................................................................... 19
4.1.2. 24-hr Integrated Samples ........................................................................................................ 25
4.1.3. Triggered Samples .................................................................................................................. 34
4.2. Grab Samples .............................................................................................................................. 42
4.3. Mobile Platform Measurements .................................................................................................. 42
5. Conclusions ........................................................................................................................................ 46

3 | A l i s o C a n y o n F i n a l R e p o r t
Executive Summary
Background and Results Highlights
On October 24, 2015, the South Coast Air Quality Management District (SCAQMD) received the
first air quality complaints resulting from sulfur type odors associated with the natural gas leak at
Well SS-25 of the Southern California Gas Company’s (SoCalGas) Aliso Canyon Facility
(Facility). In response to these complaints and to characterize the ambient (outdoor) levels of air
pollutants resulting from this massive leak, the SCAQMD and the California Air Resources Board
(CARB) commenced air monitoring measurements on October 26, 2015. These air monitoring
efforts included extensive stationary and mobile air measurements in and around the Facility, both
in the Porter Ranch residential neighborhood and other nearby communities. Through February
11, 2016, SCAQMD received over 2,300 complaints regarding odors from the leak. The odors
were predominantly from compounds added to natural gas (including mercaptans) to identify leaks
that can be smelled even at very low concentrations (around or below 1 part per billion - ppb). The
human nose is very sensitive and has the ability to detect odors that are below the detection level
of any currently available monitoring device.
Notable results from the air monitoring efforts include:
Ambient (outdoor) methane levels in the Porter Ranch community near the Aliso Canyon
Facility were periodically higher than typical levels while the ruptured well was actively
leaking (October 2015 to February 2016);
Methane daily average levels, maximum daily hourly maximum, and frequency of samples
exceeding 5 ppm significantly reduced after the leaking well was sealed in February 2016;
Ambient air results were shown to be consistently within the SCAQMD’s and CARB’s air
quality criteria (established specifically for this study) for over a year after the well was
sealed;
With a few exceptions, levels of air toxics measured from 24-hr time-integrated samples
were comparable to typical levels for the Los Angeles Basin
Levels of air toxics measured after the leaking well was sealed were within the range or
lower than the typical air toxics levels measured elsewhere in the Los Angeles Basin;

4 | A l i s o C a n y o n F i n a l R e p o r t
Long-term concentrations of air toxics were found to be substantially lower than the health-
based reference exposure levels (REL) for long-term exposures; and
Mobile air monitoring surveys conducted throughout the Porter Ranch community for more
than one year after the closure of the leaking well detected methane concentrations similar
to background levels.
Pursuant to the Aliso Canyon air monitoring plan1, some fixed monitoring sites were removed in
late July 2016, but SCAQMD continued its stationary and mobile air monitoring efforts until July
2017.
SoCalGas has installed eight permanent infrared monitors on the southern perimeter of the Aliso
Canyon Facility and will continue monitoring methane concentrations in real-time. The data from
these fence-line monitors are displayed on a publicly-available website2.
SCAQMD efforts that will continue include:
Consistently review data from existing continuous methane monitors
Respond to air quality concerns. To report an air quality concern, a person may call 1-800-
CUT-SMOG
Re-deploy monitoring efforts, if warranted
Periodic on-site SCAQMD inspections
Fund and oversee a health study
Participate with community member discussions on air monitoring
Methodology and Approach
In order to thoroughly characterize the spatial and temporal variations of methane and other air
contaminants of concern, a combination of fixed-site and mobile air measurements were conducted
inside the SoCalGas Aliso Canyon Facility and within the neighboring communities from October
2015 through July 2017. The monitoring plan, sampling equipment, and measurement techniques
1 http://www.aqmd.gov/docs/default-source/compliance/aliso-cyn/aliso-canyon-monitoring-plan.pdf?sfvrsn=4 2 https://socalgas.esriemcs.com/MethaneMonitoring/

5 | A l i s o C a n y o n F i n a l R e p o r t
used in this study have been thoroughly discussed in a separate document which can be found
here1.
In collaboration with CARB, a combination of continuous, short-term, and time-integrated air
monitoring was conducted at eight community locations and one background sampling location
(Figure (I)). Table (I) summarizes the air pollutants that were measured in near-real time at each
site within the Porter Ranch community and at the background station in Reseda.
Table (I). List of continuous measurements at different sampling locations.
Air Pollutants Sampling site #
Methane 1,2,3,4,5,6,7,8, Reseda
Hydrogen Sulfide 3
Benzene 4,5,7
Total Sulfur 4
Time-integrated and triggered air samples were collected at Sites #3, #4, #6 and analyzed to
measure the concentrations of volatile organic compounds (VOCs), methane (CH4), carbon
monoxide (CO), carbon dioxide (CO2), ethane (C2H6), sulfur odorant additives (t‐Butyl Mercaptan
and tetrahydrothiophene), and carbonyls.
1 http://www.aqmd.gov/docs/default-source/compliance/aliso-cyn/aliso-canyon-monitoring-plan.pdf?sfvrsn=4

6 | A l i s o C a n y o n F i n a l R e p o r t
Figure (I). Fixed-site air monitoring locations operated by the SCAQMD and CARB.
Starting on December 21, 2015, SCAQMD initiated extensive mobile methane monitoring surveys
in communities near the Facility and throughout the San Fernando Valley (SFV) to better
characterize methane concentrations and gradients and to support the fixed-site methane
monitoring efforts.
Results
Methane was the main air pollutant released as a result of the natural gas leak. During the leak,
concentrations of methane measured from the stationary monitors showed strong fluctuations.
While concentrations were mostly within the typical levels, there were occasional episodes that
methane in ambient air were up to 15 times higher than the background levels (on a daily-average
basis). However, the daily-average concentrations of methane did not exceed the criteria

7 | A l i s o C a n y o n F i n a l R e p o r t
established by SCAQMD and CARB (i.e., 3 ppm) at any of the monitoring locations after the
leaking SS-25 Well was sealed on February 18, 2016 (Figure (II)).
Figure (II). 24-hr average concentrations of methane measured at all monitoring locations. The dotted purple
line represents the 24-hr average methane concentration criteria (3 ppm) set by CARB and SCAQMD for this
study.

8 | A l i s o C a n y o n F i n a l R e p o r t
Results from the mobile surveys also indicated that when the leak was on-going, elevated levels
of methane (sometimes as high as 70 ppm) were observed over short intervals (e.g., seconds to
minutes) on the northern portion of this community. After the Well SS-25 was sealed, methane
levels measured by the mobile platform south of the Facility and throughout the SFV were almost
always close to background levels (~2 ppm). Figure (III) shows three representative maps of
methane concentration measured by the mobile platform in the Porter Ranch area during the leak
and two days and three months after the leak was controlled.
Figure (III). Three representative maps of methane concentrations measured by the mobile platform in Porter
Ranch.
Similar to methane, marked reductions in the ambient concentrations of toxic VOCs (e.g., benzene,
toluene, ethylbenzene, xylene, styrene) were observed after the leaking Well was sealed. While
detectable, the measured concentrations of the aforementioned species from nearly all of the
collected time-integrated air samples were always below the chronic RELs even during the leak.
Figure (IV) shows the concentrations of selected toxic VOCs detected in the majority of air
samples at Sites #3, #4, #6, and the Reseda station after the closure of the SS-25 Well. A more
detailed discussion on the levels and trends of the measured VOCs can be found in the following
sections.
Hourly concentrations of hydrogen sulfide (H2S) were mostly at or below the detection limit for
this compound, and the highest hourly H2S ambient levels measured during this monitoring
campaign were always below 5 ppb, which is substantially lower than the acute REL for this
compound (30 ppb). The other two sulfur odorant additives to natural gas (i.e., t-Butyl mercaptan
and tetrahydrothiophene) were below detection limits in all of the air samples collected by the
SCAQMD at multiple locations throughout the Porter Ranch community during and after the leak.

9 | A l i s o C a n y o n F i n a l R e p o r t
Sulfur odorants can be detected by the human nose at very low levels, and odors can cause health
symptoms at levels below the detection limits of any currently available monitoring device. The
long-term average concentrations of all of measured air toxics during this event, including the
carbonyl compounds formaldehyde and acetaldehyde, were substantially lower than the chronic
RELs. Additionally, a comparison of the air toxic levels following the full closure of the SS-25
Well with the fourth Multiple Air Toxics Exposure Study (MATES IV1) measurements indicate
that the concentrations of all air toxics measured in Porter Ranch and other part of the SFV were
either within the range or lower than what was measured elsewhere in the Los Angeles Basin
(Figure (IV)). A more detailed discussion on the comparison between the ambient levels of all
VOCs measured during this study and the corresponding MATES IV concentrations is provided
in the following sections.
Figure (IV). Concentrations of selected toxic VOCs from MATES IV and the 24-hr integrated samples collected
at Sites #3, #4, #6, and the Reseda Station after the closure of the SS-25 Well. A Reference Exposure Level
(REL) is the level of a chemical in the air that is not anticipated to pose a significant non-cancer health risk. In
California, RELs are established by the California Office of Environmental Health Hazard Assessment. Black
dots represent the 5th and 95th percentiles.
1 http://www.aqmd.gov/home/library/air-quality-data-studies/health-studies/mates-iv

10 | A l i s o C a n y o n F i n a l R e p o r t
Conclusions
The results from this extensive air monitoring campaign indicate that the ambient concentrations
of measured air pollutants related to natural gas in the residential communities near the Aliso
Canyon Facility decreased substantially following the full closure of the SS-25 Well and then
gradually returned to background levels. The mobile monitoring data collected inside of the
Facility showed a steady decrease of ambient methane levels around the SS-25 Well after the leak
was fully certified sealed on February 18, 2016. Despite these reductions, the measured levels of
methane have occasionally been elevated above what would be expected in the area, suggesting
there could be other local sources of natural gas being released. These ephemeral events did not
result in any considerable methane increase in the ambient air within the adjoining communities.
Overall, the results from this nearly 20-month air monitoring effort demonstrate that an excessive
amount of methane was present in ambient air in communities near the Aliso Canyon Facility
during the leak. After the SS-25 well was sealed, air quality in the Porter Ranch area and
surrounding communities has returned to typical background levels for over a year and the
measured air toxics in this community have been within the typical levels observed elsewhere in
the Los Angeles Basin and substantially lower than the RELs.
11 | A l i s o C a n y o n F i n a l R e p o r t
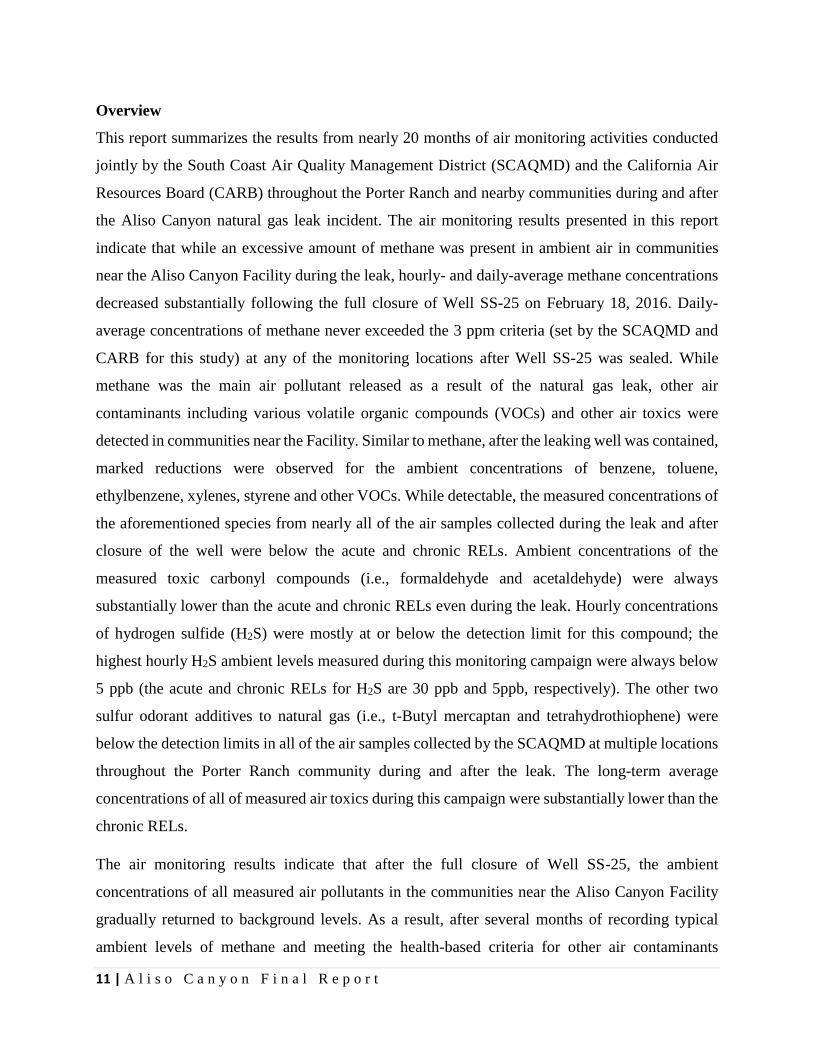
Overview
This report summarizes the results from nearly 20 months of air monitoring activities conducted
jointly by the South Coast Air Quality Management District (SCAQMD) and the California Air
Resources Board (CARB) throughout the Porter Ranch and nearby communities during and after
the Aliso Canyon natural gas leak incident. The air monitoring results presented in this report
indicate that while an excessive amount of methane was present in ambient air in communities
near the Aliso Canyon Facility during the leak, hourly- and daily-average methane concentrations
decreased substantially following the full closure of Well SS-25 on February 18, 2016. Daily-
average concentrations of methane never exceeded the 3 ppm criteria (set by the SCAQMD and
CARB for this study) at any of the monitoring locations after Well SS-25 was sealed. While
methane was the main air pollutant released as a result of the natural gas leak, other air
contaminants including various volatile organic compounds (VOCs) and other air toxics were
detected in communities near the Facility. Similar to methane, after the leaking well was contained,
marked reductions were observed for the ambient concentrations of benzene, toluene,
ethylbenzene, xylenes, styrene and other VOCs. While detectable, the measured concentrations of
the aforementioned species from nearly all of the air samples collected during the leak and after
closure of the well were below the acute and chronic RELs. Ambient concentrations of the
measured toxic carbonyl compounds (i.e., formaldehyde and acetaldehyde) were always
substantially lower than the acute and chronic RELs even during the leak. Hourly concentrations
of hydrogen sulfide (H2S) were mostly at or below the detection limit for this compound; the
highest hourly H2S ambient levels measured during this monitoring campaign were always below
5 ppb (the acute and chronic RELs for H2S are 30 ppb and 5ppb, respectively). The other two
sulfur odorant additives to natural gas (i.e., t-Butyl mercaptan and tetrahydrothiophene) were
below the detection limits in all of the air samples collected by the SCAQMD at multiple locations
throughout the Porter Ranch community during and after the leak. The long-term average
concentrations of all of measured air toxics during this campaign were substantially lower than the
chronic RELs.
The air monitoring results indicate that after the full closure of Well SS-25, the ambient
concentrations of all measured air pollutants in the communities near the Aliso Canyon Facility
gradually returned to background levels. As a result, after several months of recording typical
ambient levels of methane and meeting the health-based criteria for other air contaminants

12 | A l i s o C a n y o n F i n a l R e p o r t
associated with the incident (e.g., VOCs), the SCAQMD concluded its air monitoring campaign
in Porter Ranch in July 2017.
It should be noted that Southern California Gas Company (SoCalGas) has installed eight
permanent infrared monitors on the southern perimeter of the Aliso Canyon Facility and will
continue monitoring methane concentrations in near-real time. The data from these fence-line
monitors are displayed on a publicly available website1 where users can view a chart showing the
methane levels in parts per million (ppm), reported in near-real time over the previous 24 hours.
While SoCalGas does not intend to use these monitors as the primary means for detecting potential
leaks in its pipelines and wells, this fence-line system will allow nearby residents to continuously
observe the methane concentrations in their community.
1. Background
On October 23, 2015, SoCalGas informed the State of California of the natural gas leak from well
SS-25 at its Aliso Canyon natural gas storage facility (hereafter referred to as Facility). After
numerous attempts to stop the leak which was ongoing for about four months, on February 11,
2016, SoCalGas reported that the leaking well had been temporarily sealed. On February 18, 2016,
the Division of Oil, Gas and Geothermal Resources (DOGGR) confirmed that Well SS-25 had
been permanently sealed.
In response to this major gas leak incident, SCAQMD commenced an air monitoring campaign on
October 26, 2015 and since that time, in conjunction with CARB, installed and operated nine fixed
monitoring stations and conducted extensive mobile air monitoring throughout the Porter Ranch
and other nearby communities. In accordance to the air monitoring plan, CARB removed their air
quality monitors in late July 2016, while SCAQMD continued its stationary and mobile air
monitoring efforts until July 2017 to confirm that the Facility was not adversely impacting local
air quality and that the ambient concentrations of methane and other air pollutants associated with
the gas leak decreased to typical background levels. The scope of this report is to summarize the
results of the stationary and mobile air monitoring efforts conducted by the SCAQMD and CARB
to characterize the ambient air pollution levels in the Porter Ranch community near the Facility
during and after the gas leak incident. It is noteworthy that a series of monitoring efforts (e.g.,
1 https://socalgas.esriemcs.com/MethaneMonitoring/

13 | A l i s o C a n y o n F i n a l R e p o r t
aircraft studies, indoor sampling, stored gas inventory analysis, etc.) were conducted by multiple
agencies to fully address the emissions from the SS-25 Well and its impact on the nearby
communities. While this report focuses only on the air monitoring efforts conducted by the
SCAQMD and CARB, a comprehensive report 1 published by the Interagency Task Force on
Natural Gas Storage Safety has summarized all of the monitoring efforts carried out by different
agencies.
2. Methodology
In order to fully characterize the spatial and temporal variations of the ambient concentrations of
methane and other air contaminants of concern, a combination of fixed-site and mobile air
monitoring activities were carried out on-site at the Facility and in the neighboring communities
from October 2015 through July 2017. The monitoring plan, sampling equipment, and
measurement techniques used in this study have been thoroughly discussed in a separate document
which can be found here2. In the following sections, the applied methodology will be briefly
discussed.
2.1. Fixed-site Air Monitoring
Since the onset of the air monitoring campaign in October 2015, a combination of continuous,
short-term, and time-integrated air monitoring was conducted at eight community locations and
one background sampling site (Figure 1). The SCAQMD’s Reseda air monitoring station is located
approximately 8 miles south of Well SS-25 and outside the area of odor complaints reported to
SCAQMD related to this incident. Thus, this sampling site is representative of a “background”
location for the air pollutants measured in this study.
1 https://energy.gov/under-secretary-science-and-energy/downloads/report-ensuring-safe-and-reliable-underground-natural 2 http://www.aqmd.gov/docs/default-source/compliance/aliso-cyn/aliso-canyon-monitoring-plan.pdf?sfvrsn=4
14 | A l i s o C a n y o n F i n a l R e p o r t
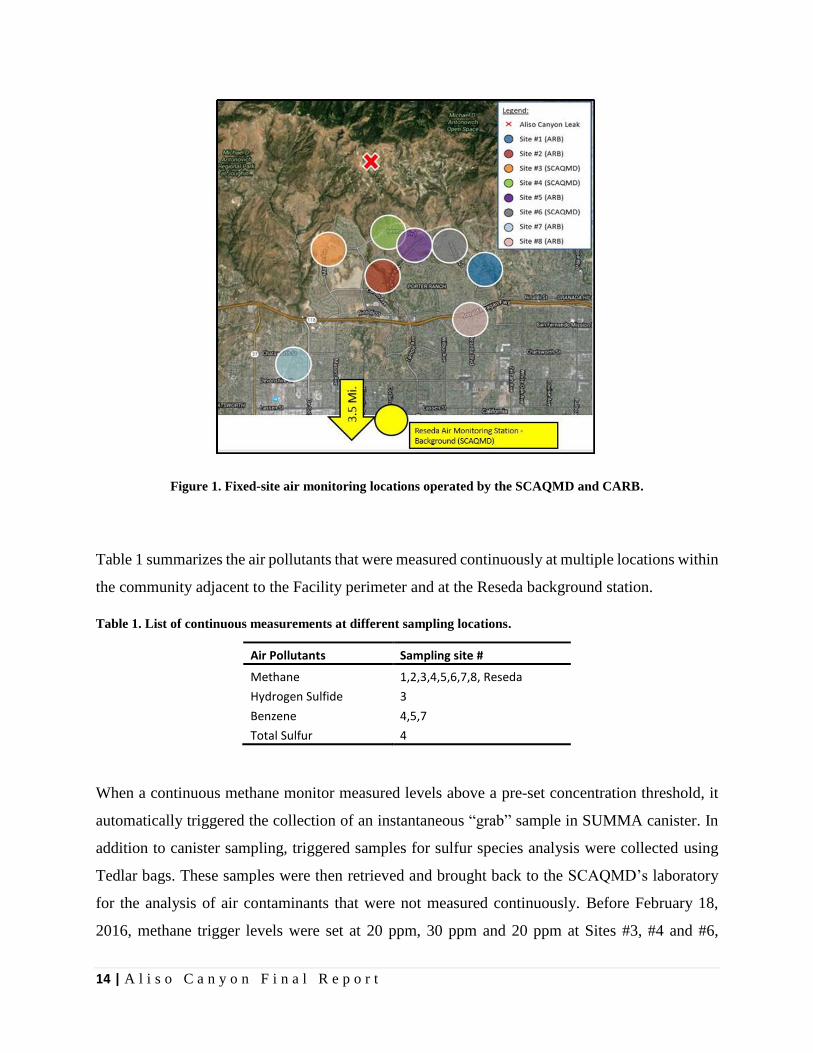
Figure 1. Fixed-site air monitoring locations operated by the SCAQMD and CARB.
Table 1 summarizes the air pollutants that were measured continuously at multiple locations within
the community adjacent to the Facility perimeter and at the Reseda background station.
Table 1. List of continuous measurements at different sampling locations.
Air Pollutants Sampling site #
Methane 1,2,3,4,5,6,7,8, Reseda
Hydrogen Sulfide 3
Benzene 4,5,7
Total Sulfur 4
When a continuous methane monitor measured levels above a pre-set concentration threshold, it
automatically triggered the collection of an instantaneous “grab” sample in SUMMA canister. In
addition to canister sampling, triggered samples for sulfur species analysis were collected using
Tedlar bags. These samples were then retrieved and brought back to the SCAQMD’s laboratory
for the analysis of air contaminants that were not measured continuously. Before February 18,
2016, methane trigger levels were set at 20 ppm, 30 ppm and 20 ppm at Sites #3, #4 and #6,

15 | A l i s o C a n y o n F i n a l R e p o r t
respectively. After the closure of Well SS-25 on February 18, 2016, these levels were changed to
5 ppm for all three sites. Instantaneous grab samples were also collected from multiple locations
throughout the Porter Ranch community as a result of odor investigations or routine surveillance
activities during the leak and after the closure of the SS-25 Well. Triggered and grab samples
provide an instantaneous snapshot of the area during times when an odor was detected or ambient
methane levels, as detected by the continuous monitors, were substantially higher than
background. Thus, the results from the analysis of these samples provide valuable information for
short-term exposure assessment. It should be noted that these triggered/grab samples were not
intended to be representative of typical levels in the air, but rather, reflect the levels of these air
pollutants at times when the methane levels were high. These triggered samples were not intended
to be used to assess long-term exposures.
In addition to the continuous monitoring and the collection of grab samples, 24-hour integrated
canister samples were collected at Sites #3, #4, #6, and the Reseda station on a daily, 1-in-3-day,
or 1-in-6-day schedule from midnight to midnight. These samples were primarily collected for
assessing daily exposure and long-term health impacts.
Time-integrated and triggered canister samples were analyzed to measure the concentrations of
volatile organic compounds (VOCs), methane (CH4), carbon monoxide (CO), carbon dioxide
(CO2), and ethane (C2H6). The triggered Teldar bags were analyzed to measure the levels of sulfur
species and odorant additives (t‐Butyl Mercaptan and tetrahydrothiophene) in the ambient air.
Additionally, at Sites #3 and #4, a few 24-hr integrated samples were collected by drawing air
through a DNPH (2,4-Dinitrophenylhedrazine) cartridge for carbonyls measurement.
2.2. Mobile Platform Measurements
In conjunction with the air monitoring at fixed sampling sites, starting on December 21, 2015,
SCAQMD initiated extensive mobile methane monitoring surveys in communities near the Facility
and throughout the San Fernando Valley (SFV) to better characterize methane concentrations and
gradients and to support the fixed-site methane monitoring efforts. For this purpose, a state-of-the-
art methane analyzer (LI-COR 7700) and a Global Positioning System (GPS) were mounted on
top of a hybrid vehicle and driven inside the Facility, around the Porter Ranch neighborhood, and
other surrounding areas of the SFV. The LI-COR 7700 is an open-path instrument capable of
measuring methane concentrations as low as single parts per billion (ppb) at rates as fast as 40

16 | A l i s o C a n y o n F i n a l R e p o r t
times per second with high accuracy and precision. Daily mobile methane monitoring maps for
the community of Porter Ranch and other parts of the SFV can be found on the SCAQMD’s
website1.
This mobile platform assessed methane concentrations and gradients in real-time at a higher spatial
resolution than those provided by the fixed monitoring sites. Several routes in and around Porter
Ranch and neighboring communities were selected for these surveys and monitoring was
conducted during different times of the day (e.g., morning, afternoon, evening, and night) and
under different meteorological conditions. Figure 2 illustrates the map of the highest methane
concentrations measured by the SCAQMD’s mobile platform between 12/21/2015 and 1/29/2016
around the Facility. Sites # 3, #4, and #6 are located in the areas where the peak methane levels
were usually measured by the mobile monitor. The mobile methane monitoring results thus further
supported the representativeness of the selected fixed monitoring sites and the fact that these
sampling locations would provide appropriate coverage for the long-term assessment of air quality
in nearby communities.
Figure 2. Map of the highest methane concentrations measured by the SCAQMD’s mobile monitor between
12/21/2015 and 1/29/2016.
1 http://www.aqmd.gov/home/regulations/compliance/aliso-canyon-update/air-sampling/mobile-methane-measurement-surveys
17 | A l i s o C a n y o n F i n a l R e p o r t
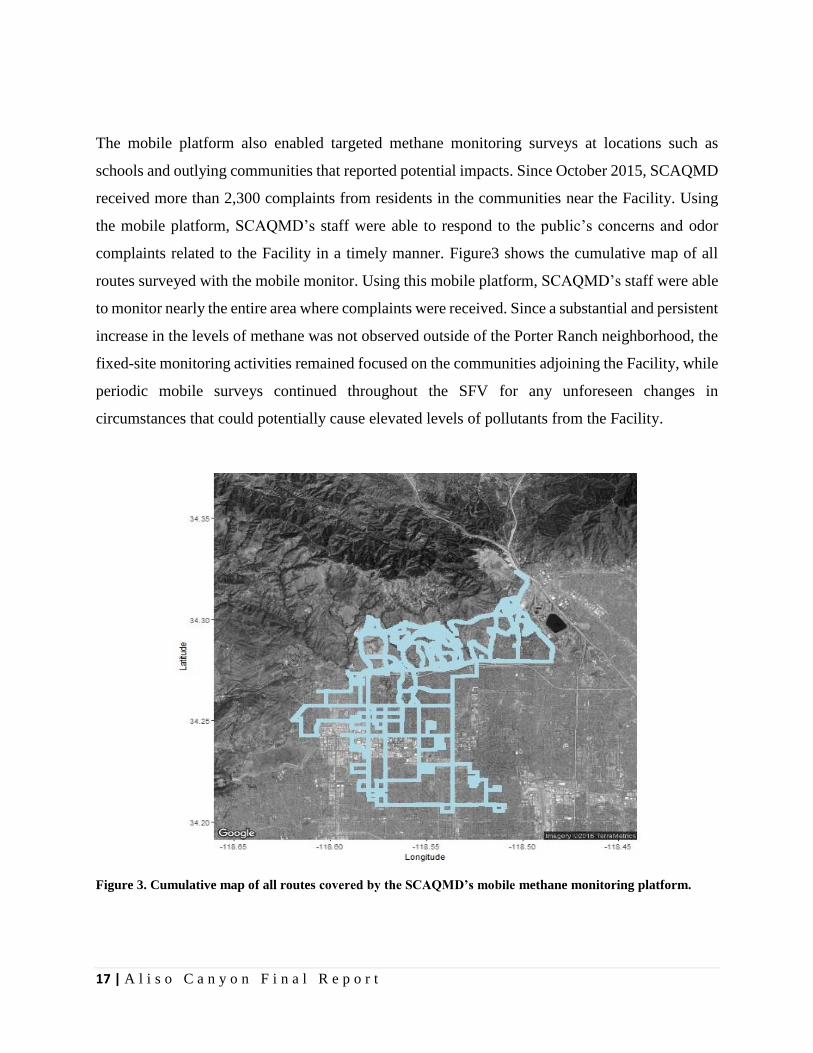
The mobile platform also enabled targeted methane monitoring surveys at locations such as
schools and outlying communities that reported potential impacts. Since October 2015, SCAQMD
received more than 2,300 complaints from residents in the communities near the Facility. Using
the mobile platform, SCAQMD’s staff were able to respond to the public’s concerns and odor
complaints related to the Facility in a timely manner. Figure3 shows the cumulative map of all
routes surveyed with the mobile monitor. Using this mobile platform, SCAQMD’s staff were able
to monitor nearly the entire area where complaints were received. Since a substantial and persistent
increase in the levels of methane was not observed outside of the Porter Ranch neighborhood, the
fixed-site monitoring activities remained focused on the communities adjoining the Facility, while
periodic mobile surveys continued throughout the SFV for any unforeseen changes in
circumstances that could potentially cause elevated levels of pollutants from the Facility.
Figure 3. Cumulative map of all routes covered by the SCAQMD’s mobile methane monitoring platform.

18 | A l i s o C a n y o n F i n a l R e p o r t
After Well SS-25 was temporarily sealed on February 11, 2016, SCAQMD’s staff started mobile
methane surveys inside the Facility, the results of which can be found here1.
While most of the LI-COR measurements inside the Facility focused on quantifying methane
emissions around Well SS-25, mobile methane surveys were also conducted in other parts of the
Facility to identify other potential emission sources of natural gas.
3. Air Quality Criteria and Health-Based Reference Exposure Levels
The California Office of Environmental Health Hazard Assessment (OEHHA) has identified a list
of air toxics that are known to cause health effects, and has established Reference Exposure Levels
(RELs) for these air toxics. An REL is the level of a chemical in the air that is not anticipated to
pose a significant non-cancer health risk. The acute RELs are designed to be protective for
infrequent short-term exposures. The chronic RELs are designed to be protective for continuous
exposure for at least a significant fraction of a lifetime. Some of the measured ambient species in
this study are among the known air toxics identified by the OEHHA, including hydrogen sulfide
(H2S), some of the VOCs (e.g., benzene, toluene, ethylbenzene, xylenes, and styrene), and
carbonyls (e.g., formaldehyde and acetaldehyde). Table 2 summarizes the OEHHA’s acute and
chronic REL standards for the aforementioned species. Throughout this report, concentrations of
the air toxics that were measured in this air monitoring campaign will be compared to the RELs.
Table 2. OEHHA’s acute and chronic reference exposure levels (RELs) for relevant air toxics measured during
this study.
Air toxics Acute REL (ppb) [1-hour average]
Chronic REL (ppb) [long-term average]
Benzene 8 1
Toluene 9800 80
Ethylbenzene - 460
Xylenes 5000 160
Styrene 4900 200
Acetaldehyde 260 80
Formaldehyde 44 7
Hydrogen Sulfide 30 7
1 http://www.aqmd.gov/home/regulations/compliance/aliso-canyon-update/air-sampling/xxx
19 | A l i s o C a n y o n F i n a l R e p o r t
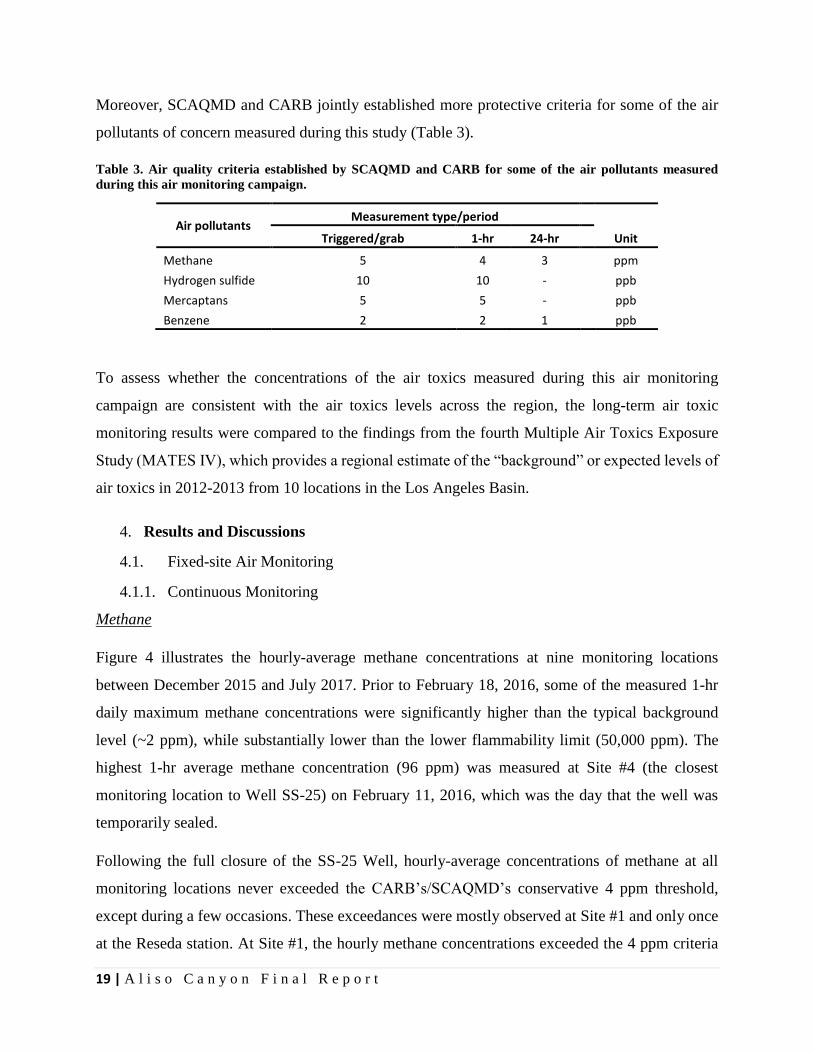
Moreover, SCAQMD and CARB jointly established more protective criteria for some of the air
pollutants of concern measured during this study (Table 3).
Table 3. Air quality criteria established by SCAQMD and CARB for some of the air pollutants measured
during this air monitoring campaign.
Air pollutants Measurement type/period
Unit Triggered/grab 1-hr 24-hr
Methane 5 4 3 ppm
Hydrogen sulfide 10 10 - ppb
Mercaptans 5 5 - ppb
Benzene 2 2 1 ppb
To assess whether the concentrations of the air toxics measured during this air monitoring
campaign are consistent with the air toxics levels across the region, the long-term air toxic
monitoring results were compared to the findings from the fourth Multiple Air Toxics Exposure
Study (MATES IV), which provides a regional estimate of the “background” or expected levels of
air toxics in 2012-2013 from 10 locations in the Los Angeles Basin.
4. Results and Discussions
4.1. Fixed-site Air Monitoring
4.1.1. Continuous Monitoring
Methane
Figure 4 illustrates the hourly-average methane concentrations at nine monitoring locations
between December 2015 and July 2017. Prior to February 18, 2016, some of the measured 1-hr
daily maximum methane concentrations were significantly higher than the typical background
level (~2 ppm), while substantially lower than the lower flammability limit (50,000 ppm). The
highest 1-hr average methane concentration (96 ppm) was measured at Site #4 (the closest
monitoring location to Well SS-25) on February 11, 2016, which was the day that the well was
temporarily sealed.
Following the full closure of the SS-25 Well, hourly-average concentrations of methane at all
monitoring locations never exceeded the CARB’s/SCAQMD’s conservative 4 ppm threshold,
except during a few occasions. These exceedances were mostly observed at Site #1 and only once
at the Reseda station. At Site #1, the hourly methane concentrations exceeded the 4 ppm criteria

20 | A l i s o C a n y o n F i n a l R e p o r t
for a total of 21 times after February 18, 2016, with a maximum daily hourly maximum level of
8.4 ppm on July 11, 2016 at 1:00 pm. Since July 2016, only one exceedance was observed among
the monitoring sites at the background Reseda station on April 10, 2017 (at 8:00 pm), when the
methane concentration reached 5.2 ppm. An assessment of wind data measured at the same
monitoring station indicated that at that time light wind (~2-4 mph) was blowing from
west/southwest (Figure 5), suggesting that emissions from the Aliso Canyon Facility did not
contribute to this increased concentration. Moreover, during that time, a concurrent increase in
methane concentration was not observed at Site #4, which is the closest monitoring location to the
Facility. Thus, this spike in the methane concentration was most likely due to a local source close
to the Reseda station rather than emissions from the Aliso Canyon Facility.
Figure 4. Hourly-average concentrations of methane measured at all monitoring locations. The dotted purple
line represents the hourly methane concentration criteria (4 ppm) set by CARB and SCAQMD for this study.

21 | A l i s o C a n y o n F i n a l R e p o r t
Figure 5. Wind speed/direction on April 10, 2017 (at 8:00 pm) at the Reseda station.
Figure 6 shows the 24-hr average methane concentrations at all monitoring locations, and
illustrates a drastic reduction in the measured levels after February 18, 2016. Also, these 24-hr
averages never exceeded the CARB’s/SCAQMD’s 3 ppm criteria (dotted purple line) at any of the
monitoring locations since the SS-25 Well was fully sealed.

22 | A l i s o C a n y o n F i n a l R e p o r t
Figure 6. 24-hr average concentrations of methane measured at all monitoring locations. The dotted purple line
represents the 24-hr average methane concentration criteria (3 ppm) set by CARB and SCAQMD for this
study.

23 | A l i s o C a n y o n F i n a l R e p o r t
Benzene
Near real-time benzene levels were measured by CARB at Sites #5 and #7 from early February
through late June, 2016, and by SCAQMD at Site #4 starting mid-October, 2016. As shown in
Figure 7, hourly-average benzene concentrations at all three locations were substantially lower
than the acute REL of 8 ppb. However, on a few occasions, benzene concentrations exceeded the
more conservative criteria set by CARB and SCAQMD for this study (i.e., 2 ppb; reported as
hourly average). The 24-hr average concentrations of benzene, on the other hand, were consistently
below the 1 ppb criteria (also set by CARB and SCAQMD) throughout the monitoring campaign
(Figure 8).
Figure 7. Hourly-average concentrations of benzene measured at Sites #5, #7, and #4. The dotted purple line
represents the hourly benzene concentration criteria (2 ppb) set by CARB and SCAQMD for this study, and
the dashed orange line represents the acute REL.

24 | A l i s o C a n y o n F i n a l R e p o r t
Figure 8. 24-hr average concentrations of benzene measured at Sites #5, #7, and #4. The dotted purple line
represents the chronic REL as well as the 24-hr benzene concentration criteria (1 ppb) set by CARB and
SCAQMD for this study.
Hydrogen Sulfide
The SCAQMD operated a continuous H2S monitor at Site #3 from early December 2015 to late
February 2017. Values from this instrument were mostly non-detect and the highest levels
observed were always lower than 5 ppb (Figure 9). These concentrations are well below the 10
ppb criteria established for this study and also substantially lower than both the acute REL (30
ppb) and chronic REL (8 ppb) for H2S.
Figure 9. 5-minute average concentrations of hydrogen sulfide (H2S) measured at Site #3. The dotted purple
line represents the H2S concentration criteria (10 ppb) set by CARB and SCAQMD for this study.

25 | A l i s o C a n y o n F i n a l R e p o r t
Total Sulfur
Odorizing compounds such as tetrahydrothiophene and t-Butyl mercaptan are added to natural gas
to provide an alert that natural gas is present in the ambient air. To detect the concentrations of
these and other sulfur-containing compounds near real-time, in addition to the continuous
measurements of H2S at Site #3 (Figure 9), total sulfur concentrations were continuously measured
at Site #4 since March 2016 through April 2017 (Figure 10). Similar to H2S, the hourly-average
concentrations of total sulfur were consistently low throughout the measurement period and never
exceeded 5 ppb.
Figure 10. Hourly-average concentrations of total sulfur measured at Site #4.
4.1.2. 24-hr Integrated Samples
Methane
Concentrations of methane from the analysis of the 24-hr integrated canister samples collected at
Sites #3, #4, #6, and the Reseda station are illustrated in Figure 11. In concert with the trends
observed from the continuous measurements (Figure 6), methane concentrations measured from
the time-integrated canister samples along with the frequency of the samples exceeding the 3 ppm
criteria (set by CARB and SCAQMD) decreased substantially after February 18, 2016.

26 | A l i s o C a n y o n F i n a l R e p o r t
Figure 11. Methane concentrations from 24-hr integrated canister samples at Sites #3, #4, #6, and Reseda
station. The dotted purple line represents the 24-hr methane concentration criteria (3 ppm) set by CARB and
SCAQMD for this study.
Volatile Organic Compounds (VOCs)
While a wide range of VOCs were measured from the time-integrated canister samples, the
concentrations of several compounds were at or below their corresponding detection limits in the
majority of the collected samples. In this report, the focus will be on those VOCs that are known
to cause health effects and for which the OEHHA has established RELs (Table 2). These
compounds include benzene, toluene, ethylbenzene, xylenes (abbreviated as BTEX) and styrene.
The complete VOC dataset can be found in the Appendix.
Figures 12-19 show the concentrations of the selected VOCs from the analysis of valid time-
integrated samples collected at Sites #3, #4, #6 and the Reseda station. Values in parentheses next
to each compound in the plots’ legends indicate the percentage of samples with levels below the
method detection limits. In addition, to compare the levels of the selected VOCs at the
aforementioned monitoring locations with their “background” or typical ambient levels, a
statistical summary of the concentrations of these compounds measured during MATES IV is
provided in Table 4.

27 | A l i s o C a n y o n F i n a l R e p o r t
Table 4. Statistical summary of the concentrations of selected VOCs measured during MATES IV.
MATES IV VOCs
Benzene Toluene Ethylbenzene Xylenes Styrene
(ppb) (ppb) (ppb) (ppb) (ppb)
Avg 0.37 1.02 0.21 0.86 0.04 SD 0.08 0.3 0.17 0.75 0.03 Median 0.29 0.75 0.12 0.46 0.02 Min 0.02 0.10 0.00 0.06 0.00 Max 1.77 6.15 4.75 19.39 0.85
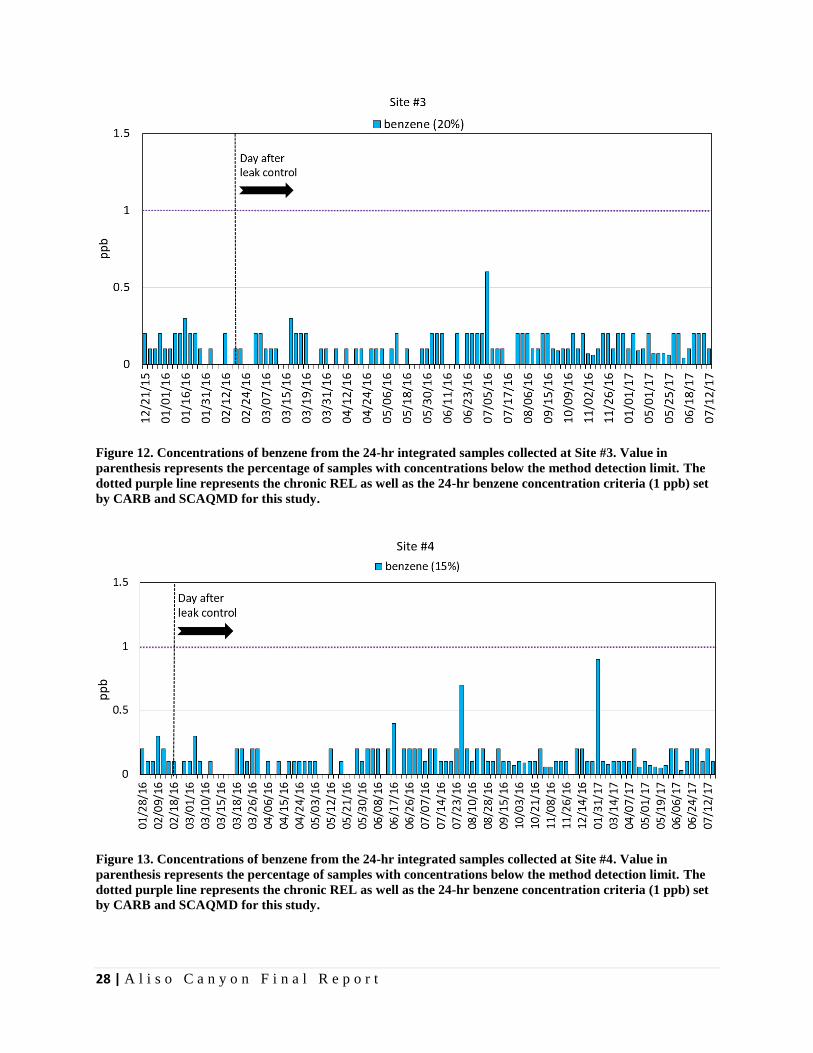
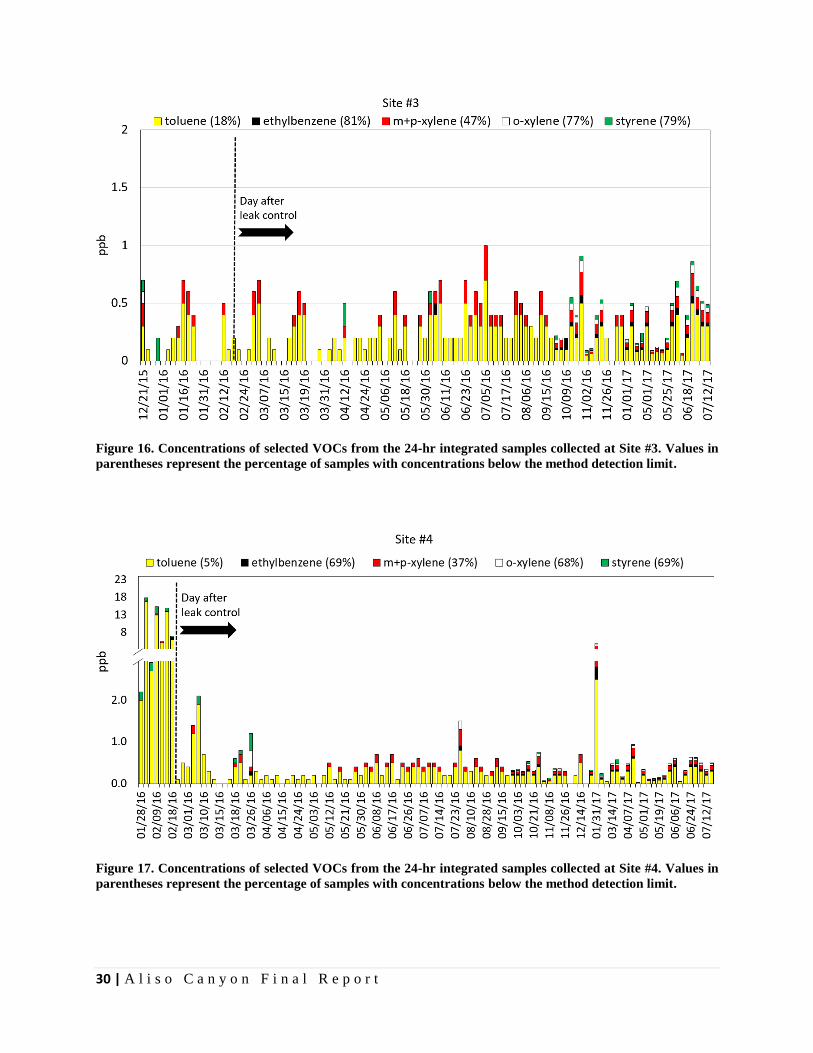
With the exception of a few samples that were collected at Sites #3 and #4 prior to February 18,
2016, concentrations of the selected toxic VOCs were overall comparable to or even lower than
the corresponding levels found elsewhere in the Basin (also refer to Figure (IV) in Executive
Summary). Ethylbenzene and styrene were mostly non-detect with respectively 51-97% and 63-
97% of samples containing concentrations below their corresponding method detection limits
among the monitoring locations. At the monitoring sites in the Porter Ranch community (i.e., Sites
#3, #4, and #6), concentrations of toluene decreased substantially following the closure of the
leaking SS-25. The concentrations of benzene were below the 24-hr 1 ppb criteria at all monitoring
locations even during the leak. The average concentrations of benzene among all time-integrated
samples were 0.15, 0.15, 0.18, and 0.28 ppb at Sites #3, #4, #6 and Reseda, respectively. These
averages which are well below the 1ppb chronic REL, more appropriately represent the chronic,
long-term exposure in the community than any single measurement value. Moreover, the estimated
averages are based solely on the samples with a detectable level and, therefore, are higher than the
actual averages if non-detects were to be taken into account. Yet, these levels are below the basin-
wide one-year average of benzene as measured during MATES IV (i.e., 0.37 ppb).
It is noteworthy that under typical conditions (i.e., after the leak was controlled), higher
concentrations of BTEX and styrene were measured at the Reseda station compared to the
monitoring sites in the Porter Ranch community. This is most likely due to the close proximity of
this monitoring site to major surface streets (e.g., Ventura Blvd) with relatively higher emissions
from vehicles, which are important sources of VOCs.
28 | A l i s o C a n y o n F i n a l R e p o r t
Figure 12. Concentrations of benzene from the 24-hr integrated samples collected at Site #3. Value in
parenthesis represents the percentage of samples with concentrations below the method detection limit. The
dotted purple line represents the chronic REL as well as the 24-hr benzene concentration criteria (1 ppb) set
by CARB and SCAQMD for this study.
Figure 13. Concentrations of benzene from the 24-hr integrated samples collected at Site #4. Value in
parenthesis represents the percentage of samples with concentrations below the method detection limit. The
dotted purple line represents the chronic REL as well as the 24-hr benzene concentration criteria (1 ppb) set
by CARB and SCAQMD for this study.

29 | A l i s o C a n y o n F i n a l R e p o r t
Figure 14. Concentrations of benzene from the 24-hr integrated samples collected at Site #6. Value in
parenthesis represents the percentage of samples with concentrations below the method detection limit. The
dotted purple line represents the chronic REL as well as the 24-hr benzene concentration criteria (1 ppb) set
by CARB and SCAQMD for this study.
Figure 15. Concentrations of benzene from the 24-hr integrated samples collected at the Reseda station. Value
in parenthesis represents the percentage of samples with concentrations below the method detection limit.
The dotted purple line represents the chronic REL as well as the 24-hr benzene concentration criteria (1 ppb)
set by CARB and SCAQMD for this study.
30 | A l i s o C a n y o n F i n a l R e p o r t
Figure 16. Concentrations of selected VOCs from the 24-hr integrated samples collected at Site #3. Values in
parentheses represent the percentage of samples with concentrations below the method detection limit.
Figure 17. Concentrations of selected VOCs from the 24-hr integrated samples collected at Site #4. Values in
parentheses represent the percentage of samples with concentrations below the method detection limit.

31 | A l i s o C a n y o n F i n a l R e p o r t
Figure 18. Concentrations of selected VOCs from the 24-hr integrated samples collected at Site #6. Values in
parentheses represent the percentage of samples with concentrations below the method detection limit.
Figure 19. Concentrations of selected VOCs from the 24-hr integrated samples collected at the Reseda station.
Values in parentheses represent the percentage of samples with concentrations below the method detection
limit.
32 | A l i s o C a n y o n F i n a l R e p o r t
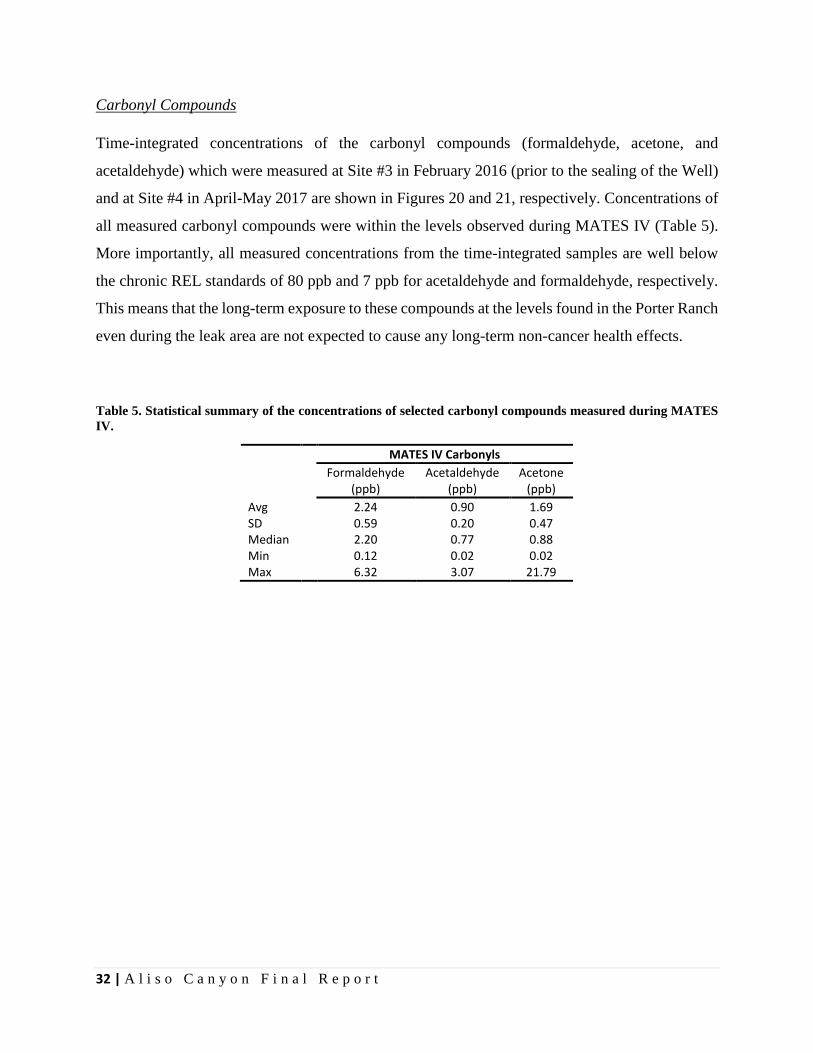
Carbonyl Compounds
Time-integrated concentrations of the carbonyl compounds (formaldehyde, acetone, and
acetaldehyde) which were measured at Site #3 in February 2016 (prior to the sealing of the Well)
and at Site #4 in April-May 2017 are shown in Figures 20 and 21, respectively. Concentrations of
all measured carbonyl compounds were within the levels observed during MATES IV (Table 5).
More importantly, all measured concentrations from the time-integrated samples are well below
the chronic REL standards of 80 ppb and 7 ppb for acetaldehyde and formaldehyde, respectively.
This means that the long-term exposure to these compounds at the levels found in the Porter Ranch
even during the leak area are not expected to cause any long-term non-cancer health effects.
Table 5. Statistical summary of the concentrations of selected carbonyl compounds measured during MATES
IV.
MATES IV Carbonyls
Formaldehyde Acetaldehyde Acetone
(ppb) (ppb) (ppb)
Avg 2.24 0.90 1.69 SD 0.59 0.20 0.47 Median 2.20 0.77 0.88 Min 0.12 0.02 0.02 Max 6.32 3.07 21.79

33 | A l i s o C a n y o n F i n a l R e p o r t
Figure 20. Concentrations of selected carbonyl compounds from the 24-hr integrated samples collected at Site
#3.
Figure 21. Concentrations of selected carbonyl compounds from the 24-hr integrated samples collected at Site
#4.

34 | A l i s o C a n y o n F i n a l R e p o r t
4.1.3. Triggered Samples
Instantaneous grab samples were automatically collected for about 5 minutes when the measured
methane concentrations from the continuous monitors exceeded the pre-set threshold levels. In this
section, the results from individual trigged samples at Sites #3, #4, and #6 are presented and
discussed. It should be noted that in some of the following plots (Figures 22-30), more than one
data point is reported for some given days. This means that more than one triggered sample was
collected on that day.
Methane
Concentrations of methane measured from the analysis of triggered samples collected at Sites #3,
#4, and #6 are shown in Figures 22, 23, and 24, respectively. At Site #3, methane concentrations
among the 30 collected triggered samples ranged between 2 to 48 ppm with a median value of 18
ppm. Additionally, no triggered samples were collected at this site after February 18, 2016,
meaning that the concentration of methane measured by the continuous monitor at this site never
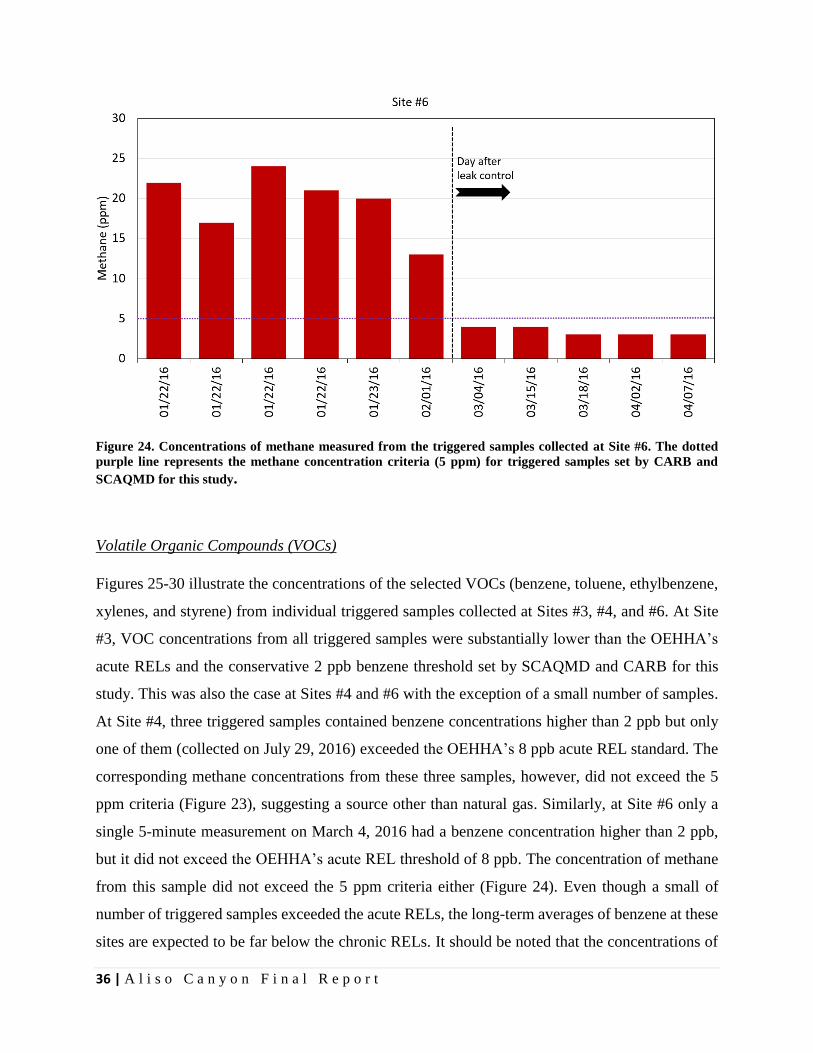
exceeded the 5 ppm threshold following the permanent closure of Well SS-25. At Site #6, a total
of 11 valid triggered samples were collected between January and April 2016. During the gas leak,
concentrations of methane from the six triggered canister samples collected at this site ranged
between 13 and 24 ppm. Concentrations of methane from the five triggered samples collected at
Site #6 after the closure of Well SS-25 did not exceed the 5 ppm criteria (Figure 24). The largest
number of triggered samples were collected at Site #4, which was the closest monitoring location
to the Facility. Prior to February 18, 2016 more than 70 triggered samples were collected at this
site and the median methane concentration among these samples was 33 ppm. The frequency of
the triggered samples at this site, however, decreased substantially after February 18, 2016 and the
measured methane concentrations from these samples never exceeded the 5 ppm criteria set by
SCAQMD and CARB (Figure 23).

35 | A l i s o C a n y o n F i n a l R e p o r t
Figure 22. Concentrations of methane measured from the triggered samples collected at Site #3. The dotted
purple line represents the methane concentration criteria (5 ppm) for triggered samples set by CARB and
SCAQMD for this study.
Figure 23. Concentrations of methane measured from the triggered samples collected at Site #4. The dotted
purple line represents the methane concentration criteria (5 ppm) for triggered samples set by CARB and
SCAQMD for this study.
36 | A l i s o C a n y o n F i n a l R e p o r t
Figure 24. Concentrations of methane measured from the triggered samples collected at Site #6. The dotted
purple line represents the methane concentration criteria (5 ppm) for triggered samples set by CARB and
SCAQMD for this study.
Volatile Organic Compounds (VOCs)
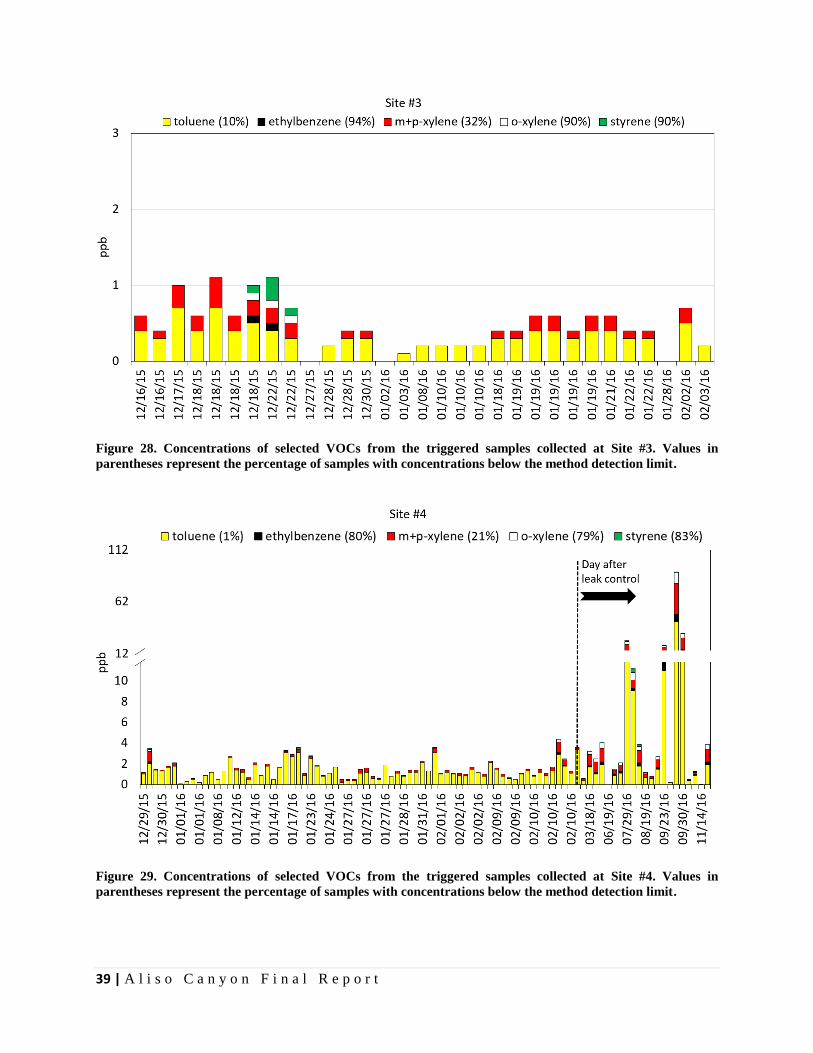
Figures 25-30 illustrate the concentrations of the selected VOCs (benzene, toluene, ethylbenzene,
xylenes, and styrene) from individual triggered samples collected at Sites #3, #4, and #6. At Site
#3, VOC concentrations from all triggered samples were substantially lower than the OEHHA’s
acute RELs and the conservative 2 ppb benzene threshold set by SCAQMD and CARB for this
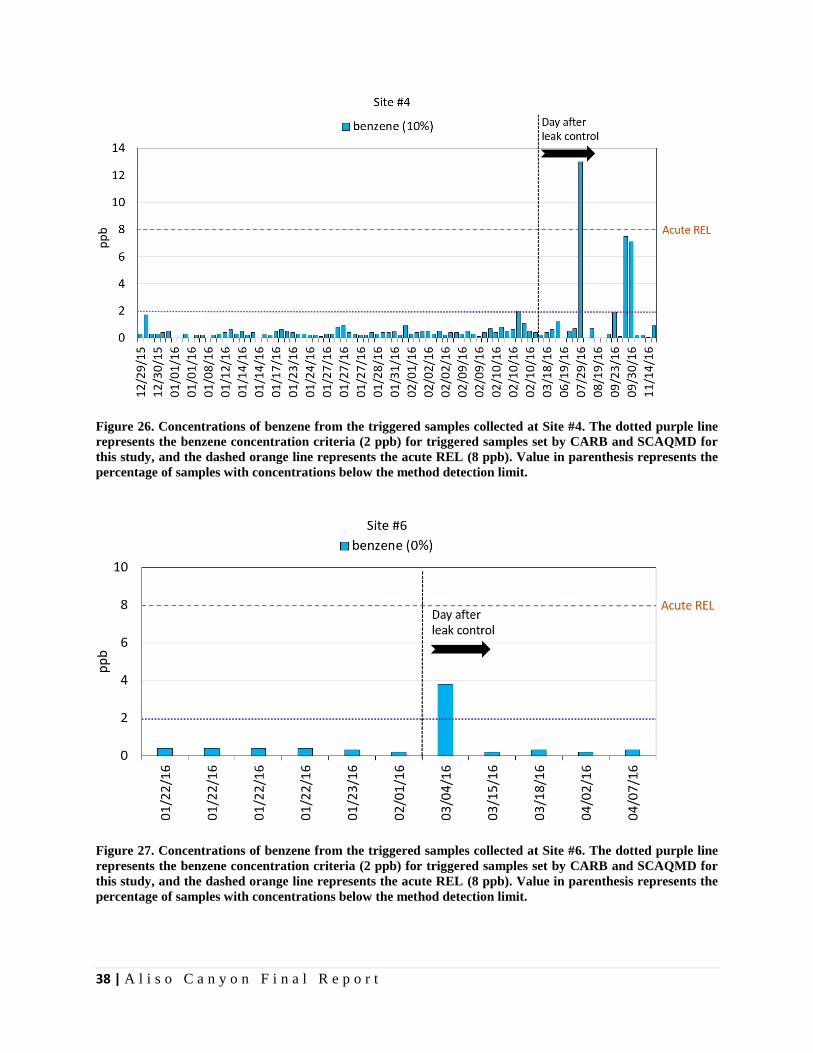
study. This was also the case at Sites #4 and #6 with the exception of a small number of samples.
At Site #4, three triggered samples contained benzene concentrations higher than 2 ppb but only
one of them (collected on July 29, 2016) exceeded the OEHHA’s 8 ppb acute REL standard. The
corresponding methane concentrations from these three samples, however, did not exceed the 5
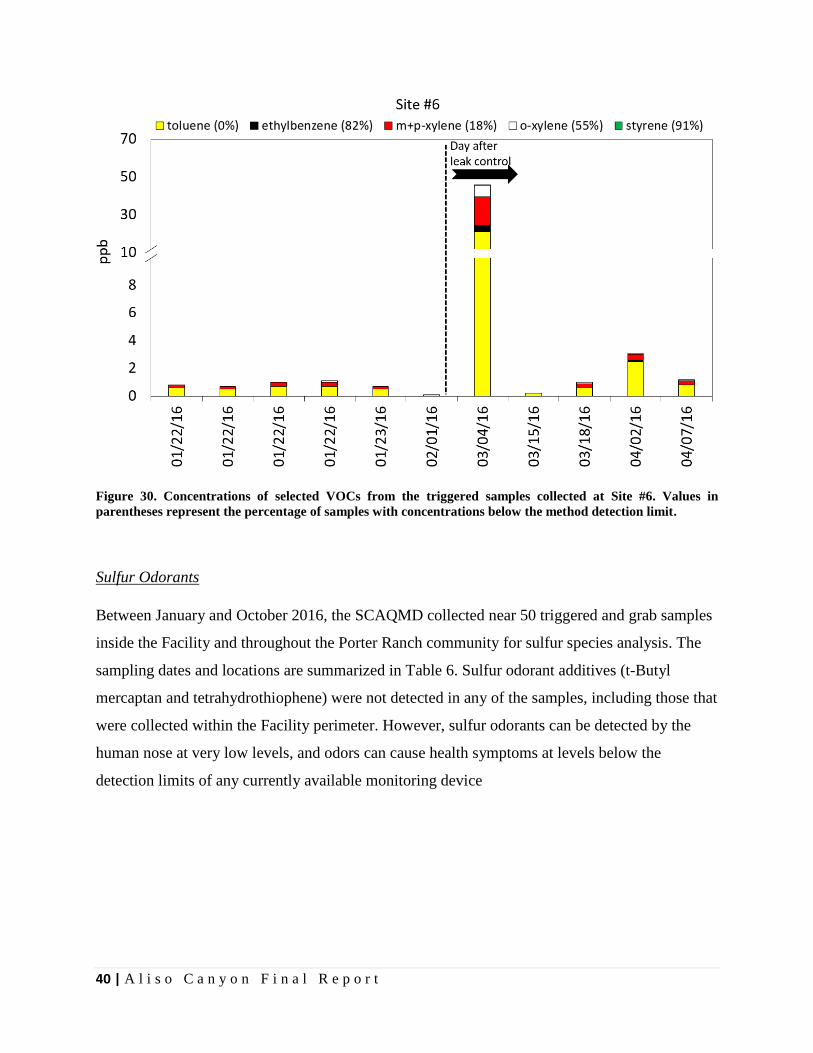
ppm criteria (Figure 23), suggesting a source other than natural gas. Similarly, at Site #6 only a
single 5-minute measurement on March 4, 2016 had a benzene concentration higher than 2 ppb,
but it did not exceed the OEHHA’s acute REL threshold of 8 ppb. The concentration of methane
from this sample did not exceed the 5 ppm criteria either (Figure 24). Even though a small of
number of triggered samples exceeded the acute RELs, the long-term averages of benzene at these
sites are expected to be far below the chronic RELs. It should be noted that the concentrations of

37 | A l i s o C a n y o n F i n a l R e p o r t
toluene, xylenes, and styrene measured from all of the triggered samples never exceeded the
OEHHA’s acute RELs at any of the monitoring locations.
Figure 25. Concentrations of benzene from the triggered samples collected at Site #3. The dotted purple line
represents the benzene concentration criteria (2 ppb) for triggered samples set by CARB and SCAQMD for
this study, and the dashed orange line represents the acute REL (8 ppb). Value in parenthesis represents the
percentage of samples with concentrations below the method detection limit.
38 | A l i s o C a n y o n F i n a l R e p o r t
Figure 26. Concentrations of benzene from the triggered samples collected at Site #4. The dotted purple line
represents the benzene concentration criteria (2 ppb) for triggered samples set by CARB and SCAQMD for
this study, and the dashed orange line represents the acute REL (8 ppb). Value in parenthesis represents the
percentage of samples with concentrations below the method detection limit.
Figure 27. Concentrations of benzene from the triggered samples collected at Site #6. The dotted purple line
represents the benzene concentration criteria (2 ppb) for triggered samples set by CARB and SCAQMD for
this study, and the dashed orange line represents the acute REL (8 ppb). Value in parenthesis represents the
percentage of samples with concentrations below the method detection limit.
39 | A l i s o C a n y o n F i n a l R e p o r t
Figure 28. Concentrations of selected VOCs from the triggered samples collected at Site #3. Values in
parentheses represent the percentage of samples with concentrations below the method detection limit.
Figure 29. Concentrations of selected VOCs from the triggered samples collected at Site #4. Values in
parentheses represent the percentage of samples with concentrations below the method detection limit.
40 | A l i s o C a n y o n F i n a l R e p o r t
Figure 30. Concentrations of selected VOCs from the triggered samples collected at Site #6. Values in
parentheses represent the percentage of samples with concentrations below the method detection limit.
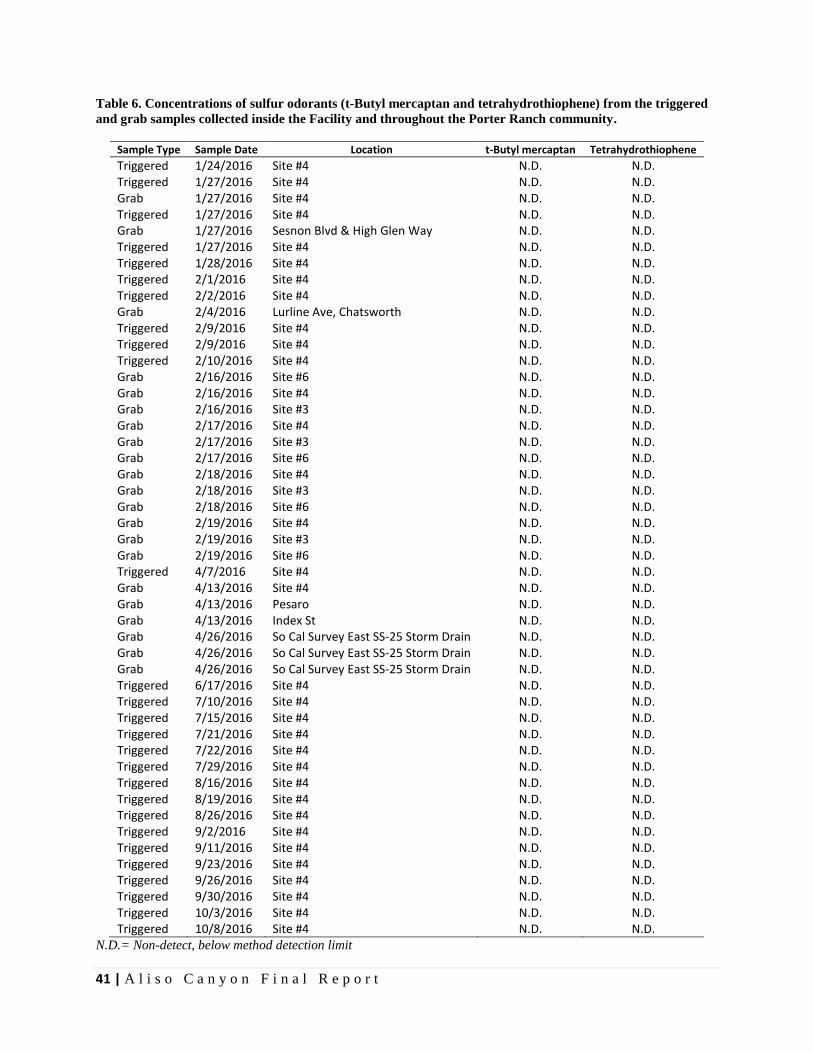
Sulfur Odorants
Between January and October 2016, the SCAQMD collected near 50 triggered and grab samples
inside the Facility and throughout the Porter Ranch community for sulfur species analysis. The
sampling dates and locations are summarized in Table 6. Sulfur odorant additives (t-Butyl
mercaptan and tetrahydrothiophene) were not detected in any of the samples, including those that
were collected within the Facility perimeter. However, sulfur odorants can be detected by the
human nose at very low levels, and odors can cause health symptoms at levels below the
detection limits of any currently available monitoring device
41 | A l i s o C a n y o n F i n a l R e p o r t
Table 6. Concentrations of sulfur odorants (t-Butyl mercaptan and tetrahydrothiophene) from the triggered
and grab samples collected inside the Facility and throughout the Porter Ranch community.
Sample Type Sample Date Location t-Butyl mercaptan Tetrahydrothiophene
Triggered 1/24/2016 Site #4 N.D. N.D. Triggered 1/27/2016 Site #4 N.D. N.D. Grab 1/27/2016 Site #4 N.D. N.D. Triggered 1/27/2016 Site #4 N.D. N.D. Grab 1/27/2016 Sesnon Blvd & High Glen Way N.D. N.D. Triggered 1/27/2016 Site #4 N.D. N.D. Triggered 1/28/2016 Site #4 N.D. N.D. Triggered 2/1/2016 Site #4 N.D. N.D. Triggered 2/2/2016 Site #4 N.D. N.D. Grab 2/4/2016 Lurline Ave, Chatsworth N.D. N.D. Triggered 2/9/2016 Site #4 N.D. N.D. Triggered 2/9/2016 Site #4 N.D. N.D. Triggered 2/10/2016 Site #4 N.D. N.D. Grab 2/16/2016 Site #6 N.D. N.D. Grab 2/16/2016 Site #4 N.D. N.D. Grab 2/16/2016 Site #3 N.D. N.D. Grab 2/17/2016 Site #4 N.D. N.D. Grab 2/17/2016 Site #3 N.D. N.D. Grab 2/17/2016 Site #6 N.D. N.D. Grab 2/18/2016 Site #4 N.D. N.D. Grab 2/18/2016 Site #3 N.D. N.D. Grab 2/18/2016 Site #6 N.D. N.D. Grab 2/19/2016 Site #4 N.D. N.D. Grab 2/19/2016 Site #3 N.D. N.D. Grab 2/19/2016 Site #6 N.D. N.D. Triggered 4/7/2016 Site #4 N.D. N.D. Grab 4/13/2016 Site #4 N.D. N.D. Grab 4/13/2016 Pesaro N.D. N.D. Grab 4/13/2016 Index St N.D. N.D. Grab 4/26/2016 So Cal Survey East SS-25 Storm Drain N.D. N.D. Grab 4/26/2016 So Cal Survey East SS-25 Storm Drain N.D. N.D. Grab 4/26/2016 So Cal Survey East SS-25 Storm Drain N.D. N.D. Triggered 6/17/2016 Site #4 N.D. N.D. Triggered 7/10/2016 Site #4 N.D. N.D. Triggered 7/15/2016 Site #4 N.D. N.D. Triggered 7/21/2016 Site #4 N.D. N.D. Triggered 7/22/2016 Site #4 N.D. N.D. Triggered 7/29/2016 Site #4 N.D. N.D. Triggered 8/16/2016 Site #4 N.D. N.D. Triggered 8/19/2016 Site #4 N.D. N.D. Triggered 8/26/2016 Site #4 N.D. N.D. Triggered 9/2/2016 Site #4 N.D. N.D. Triggered 9/11/2016 Site #4 N.D. N.D. Triggered 9/23/2016 Site #4 N.D. N.D. Triggered 9/26/2016 Site #4 N.D. N.D. Triggered 9/30/2016 Site #4 N.D. N.D. Triggered 10/3/2016 Site #4 N.D. N.D. Triggered 10/8/2016 Site #4 N.D. N.D.
N.D.= Non-detect, below method detection limit

42 | A l i s o C a n y o n F i n a l R e p o r t
4.2. Grab Samples
Table 7 summarizes the concentrations of methane and selected VOCs (i.e., BTEX and styrene)
from the grab samples collected from several locations in the Porter ranch community. While the
SS-25 Well was actively leaking, concentrations of methane were substantially higher (up to 616
ppm) than the typical levels (i.e., 2-3 ppm). Levels of methane from all of the grab samples
collected after the full closure of the well were between 2-3 ppm. Concentrations of BTEX and
Styrene from these samples were consistently below their corresponding acute RELs even during
the period of the leak.
Table 7. Concentrations of methane and selected VOCs from the grab samples collected throughout the
Porter Ranch community.
Sample Date
Location methane benzene toluene ethylbenzene m+p-xylene o-xylene styrene
(ppm) (ppb) (ppb) (ppb) (ppb) (ppb) (ppb)
10/26/15 19400 Block Kilfinen 616 3.0 3.4 0.2 1.2 0.2 0.1 11/03/15 19400 Block Kilfinen - N.D. N.D. N.D. N.D. N.D. N.D. 11/12/15 20070 Block Sesnon Blvd. 14 0.2 0.2 N.D. N.D. N.D. N.D. 11/13/15 20050 Block Sesnon Blvd. 67 0.7 0.9 N.D. 0.6 0.1 N.D. 11/17/15 19900 Block Crystal Hills Lane 49 0.2 0.2 N.D. 0.1 N.D. N.D. 11/20/15 Crystal Springs Circle - N.D. N.D. N.D. N.D. N.D. N.D. 11/22/15 Site #4 - 1.3 1.8 0.2 1.1 0.2 N.D. 12/08/15 19500 Block Turtle Ridge Ln. 17 0.3 1.1 0.2 0.8 0.2 N.D. 12/18/15 High Glen Way 37 0.3 0.7 N.D. 0.9 0.1 N.D. 12/18/15 Crystal Hills & Eagle Ridge Way 22 0.3 0.4 N.D. 0.2 N.D. N.D. 12/18/15 Crystal Hills & Eagle Ridge Way 24 0.5 1.1 N.D. 1.1 0.2 0.2 12/23/15 19800 Block S. Falcon Crest 28 N.D. N.D. N.D. N.D. N.D. N.D. 04/13/16 Killoch 2 0.2 0.5 N.D. 0.2 N.D. N.D. 04/13/16 Site #4 2 0.2 0.6 N.D. 0.2 0.1 N.D. 04/13/16 Crystal Hills 2 0.2 0.4 N.D. 0.2 N.D. N.D. 04/13/16 Pesaro 2 0.2 0.5 N.D. 0.2 N.D. N.D. 04/13/16 Index St 2 0.2 0.4 N.D. 0.1 N.D. N.D. 05/04/16 Site #4 3 0.2 0.5 N.D. 0.2 N.D. N.D.
N.D.= Non-detect, below method detection limit
4.3. Mobile Platform Measurements
When the leak was on-going, mobile surveys often detected elevated levels of methane in Porter
Ranch. The highest methane concentrations, sometimes reaching up to 70 ppm, were observed
mostly on the northern portion of this community, along Sesnon Boulevard (Figure 2). After Well
SS-25 was sealed, methane levels south of Aliso Canyon and throughout the SFV were almost
always close to background (~2-3 ppm). Figure 31 shows three representative maps of methane

43 | A l i s o C a n y o n F i n a l R e p o r t
concentration measured by the mobile platform in the Porter Ranch area during the leak and two
days and three months after the leak was controlled.
Figure 31. Three representative maps of methane concentrations measured by the mobile platform in Porter
Ranch.
During this monitoring campaign, we also conducted numerous mobile methane surveys in the
vicinity of schools in the SFV to evaluate whether these locations were impacted by gas emissions
from the Aliso Canyon Facility. Figures 32 shows the methane concentration maps from two
surveys conducted during the leak at 15 different schools throughout the SFV. The methane
concentration was found to be close to or slightly above background levels at all of these schools.

44 | A l i s o C a n y o n F i n a l R e p o r t
Figure 32. Maps of methane concentrations around different schools in the San Fernando Valley from two
mobile surveys during the gas leak.

45 | A l i s o C a n y o n F i n a l R e p o r t
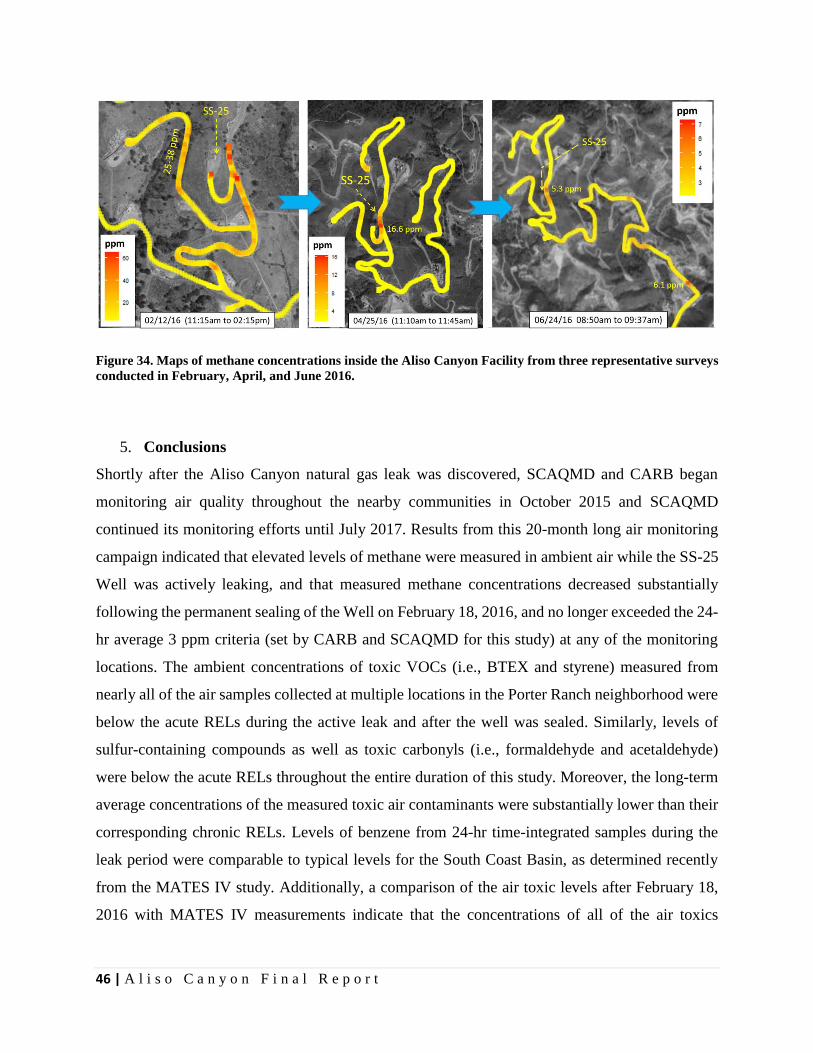
The mobile monitoring data collected inside the Facility documented steady decrease of ambient
methane levels around SS-25 following the full closure of this Well on February 18, 2016 (Figure
33). However, likely due to off-gassing of residual methane from the soil, valves, and other
equipment around the wellhead, our mobile surveys occasionally detected elevated methane
concentrations in the vicinity of SS-25 for several months following the closure of the Well. These
ephemeral events did not result in any considerable methane increase in the ambient air within the
adjoining communities. The concentration maps from three representative surveys conducted in
February, April, and June 2016 also show a clear downward trend in methane levels inside the
Facility (Figure 34) over the months following the closure of the leaking well. As mentioned
earlier, the results for all of the mobile surveys inside the Facility can be found on the SCAQMD’s
website1.
Figure 33. Average methane concentrations measured by the SCAQMD’s mobile methane monitor near the
SS-25 Well.
1 http://www.aqmd.gov/home/regulations/compliance/aliso-canyon-update/air-sampling/xxx
46 | A l i s o C a n y o n F i n a l R e p o r t
Figure 34. Maps of methane concentrations inside the Aliso Canyon Facility from three representative surveys
conducted in February, April, and June 2016.
5. Conclusions
Shortly after the Aliso Canyon natural gas leak was discovered, SCAQMD and CARB began
monitoring air quality throughout the nearby communities in October 2015 and SCAQMD
continued its monitoring efforts until July 2017. Results from this 20-month long air monitoring
campaign indicated that elevated levels of methane were measured in ambient air while the SS-25
Well was actively leaking, and that measured methane concentrations decreased substantially
following the permanent sealing of the Well on February 18, 2016, and no longer exceeded the 24-
hr average 3 ppm criteria (set by CARB and SCAQMD for this study) at any of the monitoring
locations. The ambient concentrations of toxic VOCs (i.e., BTEX and styrene) measured from
nearly all of the air samples collected at multiple locations in the Porter Ranch neighborhood were
below the acute RELs during the active leak and after the well was sealed. Similarly, levels of
sulfur-containing compounds as well as toxic carbonyls (i.e., formaldehyde and acetaldehyde)
were below the acute RELs throughout the entire duration of this study. Moreover, the long-term
average concentrations of the measured toxic air contaminants were substantially lower than their
corresponding chronic RELs. Levels of benzene from 24-hr time-integrated samples during the
leak period were comparable to typical levels for the South Coast Basin, as determined recently
from the MATES IV study. Additionally, a comparison of the air toxic levels after February 18,
2016 with MATES IV measurements indicate that the concentrations of all of the air toxics

47 | A l i s o C a n y o n F i n a l R e p o r t
measured in Porter Ranch and other parts of the SFV were either within the range or lower than
what was measured elsewhere in the Los Angeles Basin in 2012-2013.
Overall, results from this air monitoring campaign (October 2015 – July 2017) indicate that after
the full closure of the SS-25 Well, air quality in the communities near the Facility returned to
background levels. While SCAQMD concluded its stationary air quality monitoring in the Porter
Ranch community, staff will continue to perform periodic mobile and on-site inspections. In
addition, SCAQMD will consistently monitor the levels of methane from the existing monitoring
network (established by SoCalGas) and re-deploy the monitoring efforts, if deemed necessary.
Moreover, to further address the impacts of the well rupture at Aliso Canyon and resulting
emissions, an independent health study will be conducted. This study will examine the unexplained
health symptoms that were reported during and after the massive gas leak and address the potential
toxicity of the species for which there is no established REL (e.g., mercaptan odorants).
Lastly, it is noteworthy that a series of monitoring, measurements, and analysis were conducted
by other agencies (e.g., CARB, LADPH, OEHHA) as well. These efforts include but not limited
to indoor air monitoring, aircraft studies, mobile tracer flux ratio studies, and satellite remote
sensing. The report1 published by the Interagency Task Force on Natural Gas Storage Safety has
summarized all of these monitoring efforts.
1 https://energy.gov/under-secretary-science-and-energy/downloads/report-ensuring-safe-and-reliable-underground-natural