Alimentary Pharmacology and Therapeutics · Alimentary Pharmacology and Therapeutics. INTRODUCTION...
14
Chemotherapy-driven dysbiosis in the intestinal microbiome E. Montassier* ,† , T. Gastinne ‡ , P. Vangay § , G. A. Al-Ghalith †,§ , S. Bruley des Varannes ¶ , S. Massart**, P. Moreau ‡ , G. Potel*, M. F. de La Cocheti ere †† , E. Batard* & D. Knights †,‡‡ *EA 3826 Th erapeutiques Cliniques et Exp erimentales des Infections, Facult e de M edecine, Universit e de Nantes, Nantes, France. † Department of Computer Science and Engineering, University of Minnesota, Minneapolis, MN, USA. ‡ Department of Hematology, Nantes University Hospital, Nantes, France. § Biomedical Informatics and Computational Biology, University of Minnesota, Minneapolis, MN, USA. ¶ Institut des Maladies de l’ Appareil Digestif, Nantes University Hospital, Nantes, France. **Gembloux Agro-Bio Tech, University of Li ege, Gembloux, Belgium. †† EA 3826 Th erapeutiques Cliniques et Exp erimentales des Infections, Facult e de M edecine, INSERM, Universit e de Nantes, Nantes, France. ‡‡ BioTechnology Institute, University of Minnesota, St. Paul, MN, USA. Correspondence to: Dr. E. Montassier, EA 3826 Th erapeutiques Cliniques et Exp erimentales des Infections, Facult e de M edecine, Universit e de Nantes, 1 Rue G Veil, Nantes 44000, France. E-mail: emmanuelmontassier@ hotmail.com Prof. D. Knights, Department of Computer Science and Engineering, University of Minnesota, Minneapolis, MN 55455, USA. E-mail: [email protected] Publication data Submitted 30 March 2015 First decision 16 April 2015 Resubmitted 25 May 2015 Resubmitted 9 June 2015 Resubmitted 11 June 2015 Accepted 12 June 2015 EV Pub Online 6 July 2015 This article was accepted for publication after full peer-review. SUMMARY Background Chemotherapy is commonly used as myeloablative conditioning treatment to prepare patients for haematopoietic stem cell transplantation (HSCT). Chemotherapy leads to several side effects, with gastrointestinal (GI) muco- sitis being one of the most frequent. Current models of GI mucositis patho- physiology are generally silent on the role of the intestinal microbiome. Aim To identify functional mechanisms by which the intestinal microbiome may play a key role in the pathophysiology of GI mucositis, we applied high- throughput DNA-sequencing analysis to identify microbes and microbial functions that are modulated following chemotherapy. Methods We amplified and sequenced 16S rRNA genes from faecal samples before and after chemotherapy in 28 patients with non-Hodgkin’s lymphoma who received the same myeloablative conditioning regimen and no other con- comitant therapy such as antibiotics. Results We found that faecal samples collected after chemotherapy exhibited signifi- cant decreases in abundances of Firmicutes (P = 0.0002) and Actinobacteria (P = 0.002) and significant increases in abundances of Proteobacteria (P = 0.0002) compared to samples collected before chemotherapy. Following che- motherapy, patients had reduced capacity for nucleotide metabolism (P = 0.0001), energy metabolism (P = 0.001), metabolism of cofactors and vitamins (P = 0.006), and increased capacity for glycan metabolism (P = 0.0002), signal transduction (P = 0.0002) and xenobiotics biodegradation (P = 0.002). Conclusions Our study identifies a severe compositional and functional imbalance in the gut microbial community associated with chemotherapy-induced GI muco- sitis. The functional pathways implicated in our analysis suggest potential directions for the development of intestinal microbiome-targeted interven- tions in cancer patients. Aliment Pharmacol Ther 2015; 42: 515–528 ª 2015 John Wiley & Sons Ltd 515 doi:10.1111/apt.13302 Alimentary Pharmacology and Therapeutics
Transcript of Alimentary Pharmacology and Therapeutics · Alimentary Pharmacology and Therapeutics. INTRODUCTION...

Chemotherapy-driven dysbiosis in the intestinal microbiomeE. Montassier*,†, T. Gastinne‡, P. Vangay§, G. A. Al-Ghalith†,§, S. Bruley des Varannes¶, S. Massart**, P. Moreau‡,G. Potel*, M. F. de La Cocheti�ere††, E. Batard* & D. Knights†,‡‡
*EA 3826 Th�erapeutiques Cliniques etExp�erimentales des Infections, Facult�e deM�edecine, Universit�e de Nantes, Nantes,France.†Department of Computer Science andEngineering, University of Minnesota,Minneapolis, MN, USA.‡Department of Hematology, NantesUniversity Hospital, Nantes, France.§Biomedical Informatics and ComputationalBiology, University of Minnesota,Minneapolis, MN, USA.¶Institut des Maladies de l’Appareil Digestif,Nantes University Hospital, Nantes, France.**Gembloux Agro-Bio Tech, University ofLi�ege, Gembloux, Belgium.††EA 3826 Th�erapeutiques Cliniques etExp�erimentales des Infections, Facult�e deM�edecine, INSERM, Universit�e de Nantes,Nantes, France.‡‡BioTechnology Institute, University ofMinnesota, St. Paul, MN, USA.
Correspondence to:Dr. E. Montassier, EA 3826 Th�erapeutiquesCliniques et Exp�erimentales des Infections,Facult�e de M�edecine, Universit�e de Nantes,1 Rue G Veil, Nantes 44000, France.E-mail: [email protected]. D. Knights, Department of ComputerScience and Engineering, University ofMinnesota, Minneapolis, MN 55455, USA.E-mail: [email protected]
Publication dataSubmitted 30 March 2015First decision 16 April 2015Resubmitted 25 May 2015Resubmitted 9 June 2015Resubmitted 11 June 2015Accepted 12 June 2015EV Pub Online 6 July 2015
This article was accepted for publicationafter full peer-review.
SUMMARY
BackgroundChemotherapy is commonly used as myeloablative conditioning treatmentto prepare patients for haematopoietic stem cell transplantation (HSCT).Chemotherapy leads to several side effects, with gastrointestinal (GI) muco-sitis being one of the most frequent. Current models of GI mucositis patho-physiology are generally silent on the role of the intestinal microbiome.
AimTo identify functional mechanisms by which the intestinal microbiome mayplay a key role in the pathophysiology of GI mucositis, we applied high-throughput DNA-sequencing analysis to identify microbes and microbialfunctions that are modulated following chemotherapy.
MethodsWe amplified and sequenced 16S rRNA genes from faecal samples beforeand after chemotherapy in 28 patients with non-Hodgkin’s lymphoma whoreceived the same myeloablative conditioning regimen and no other con-comitant therapy such as antibiotics.
ResultsWe found that faecal samples collected after chemotherapy exhibited signifi-cant decreases in abundances of Firmicutes (P = 0.0002) and Actinobacteria(P = 0.002) and significant increases in abundances of Proteobacteria (P =0.0002) compared to samples collected before chemotherapy. Following che-motherapy, patients had reduced capacity for nucleotide metabolism(P = 0.0001), energy metabolism (P = 0.001), metabolism of cofactors andvitamins (P = 0.006), and increased capacity for glycan metabolism (P =0.0002), signal transduction (P = 0.0002) and xenobiotics biodegradation(P = 0.002).
ConclusionsOur study identifies a severe compositional and functional imbalance in thegut microbial community associated with chemotherapy-induced GI muco-sitis. The functional pathways implicated in our analysis suggest potentialdirections for the development of intestinal microbiome-targeted interven-tions in cancer patients.
Aliment Pharmacol Ther 2015; 42: 515–528
ª 2015 John Wiley & Sons Ltd 515
doi:10.1111/apt.13302
Alimentary Pharmacology and Therapeutics

INTRODUCTIONChemotherapy is commonly used as myeloablative con-ditioning treatment to prepare for haematopoietic stemcell transplantation (HSCT).1 However, chemotherapyleads to several side effects, with gastrointestinal (GI)mucositis being the most frequent in HSCT recipients.2
GI mucositis is responsible for nonspecific symptomssuch as nausea, vomiting, abdominal pain and diarrhoeathat are reported in almost all HSCT recipients.3 Histo-logical GI mucositis lesions are represented by villusatrophy and loss of enterocytes, resulting in epitheliumimpairment and barrier dysfunction.4
A previous model, proposed by Sonis, detailed thepathophysiology of mucositis including: (i) formation ofreactive oxygen (ROS), nitrogen (RNS) and sulphur spe-cies (RSS) resulting in nuclear factor kappa B activation(NFjB), (ii) induction of messenger molecules, such astumour necrosis factor alpha (TNFa) leading to inflam-mation and apoptosis, (iii) amplification of messengermolecules increasing inflammation and apoptosis and(iv) disruption of the epithelial barrier enabling bacterialtranslocation.5 Chemotherapy-induced mucositis oftenleads to life-threatening systemic infections.6 However,this previously proposed model does not include theintestinal microbiome, although some studies reportmicrobial changes following chemotherapy.7 Further-more, a comprehensive review proposed five pathwaysthrough which the intestinal microbiota may impact thepathophysiology of GI mucositis: (i) inflammatory pro-cess and oxidative stress, (ii) intestinal permeability, (iii)mucus layer composition, (iv) epithelial repair and (v)production and release of immune effector molecules.8
The objective of our study was to perform a high-throughput DNA-sequencing analysis on faecal samplesto identify microbial taxa and functions that are modu-lated following chemotherapy.
MATERIALS AND METHODS
Study patients and faecal sample collectionParticipants with non-Hodgkin’s lymphoma wererecruited in the hematology department of Nantes Uni-versity Hospital, France. We excluded patients with ahistory of Inflammatory Bowel Diseases (IBD), wereexposed to probiotics, prebiotics or broad-spectrumantibiotics, or were administered nasal-tube feeding orparenteral nutrition in the month prior to initiation ofthe study. Participants received the same myeloablativeconditioning regimen for five consecutive days, includ-ing high-dose Carmustine (Bis-chloroethylnitrosourea),
Etoposide, Aracytine and Melphalan. HSCT occurred onDay 7 as reported previously.9 Most of the participantsreceived antibiotic prophylaxis before the conditioningtherapy, based on penicillin V and cotrimoxazole(Table 1). This prophylactic treatment was stopped onthe hospital in-patient admission. Therefore, patientsdid not receive concomitant antibiotics during chemo-therapy. We collected two faecal samples from eachparticipant. A faecal sample was collected on hospitalin-patient admission (named S1), prior to administra-tion of chemotherapy, and 7 days later immediatelyprior to HSCT (named S2). For each faecal sample, wecollected one gram of stool into a sterile tube subse-quently stored at �80 °C for molecular analysis as pre-viously reported.9
16S rRNA gene sequencingDNA from primary stool samples were extracted withQIAamp DNA Stool Minikit (Qiagen, Hilden, Germany),as previously reported.9 The aliquots were then stored at�20 °C. We amplified 16S rRNA genes using primers784F (AGG ATTAGATACCCTGGTA) and 1061R(CRRCACGAGC TGACGAC) targeting the V5 and V6hypervariable 16S rRNA gene regions.10 The ampliconswere visualised using 1% agarose gels and GelGreen
Table 1 | Clinical characteristics of the studypopulation. Participant metadata includes age, sex,body mass index (calculated according to the formulaBMI = W/H2, where ‘W’ is weight in Kilograms, and ‘H’is height in metre), use of antibiotic prophylaxis,previous history of chemotherapy and a description ofthe gastrointestinal (GI) mucositis-related symptoms.Categorical data are reported as percentages and 95%confidence interval (95% CI), and quantitative data arereported as means and median, 1st and 3rd quartile
Clinical features
Age, years median, 1st and 3rd quartile 55 [45–62]Sex male, n (%, 95% CI) 18 (64.3, 44.1–80.7)Body mass index, median,1st and 3rd quartile
24 [23–27]
Antibiotic prophylaxis, n (%, 95% CI) 24 (85.7, 66.4–95.3)Penicillin V 14 (50.0, 32.6–67.4)Cotrimoxazole 18 (64.3, 44.1–80.7)Cotrimoxazole + penicillin, V 6 (25.0, 10.6–47.0)
Previous history of chemotherapyn (%, 95% CI)
27 (96.4, 79.7–99.8)
GI mucositis-related symptoms n (%, 95% CI)Nausea and vomiting 17 (60.7, 40.7–77.8)Severe Abdominal pain 10 (35.7, 19.3–55.8)Diarrhoea grade 1 or 2 20 (71.4, 51.1–86.0)Diarrhoea grade 3 or 4 8 (28.6, 13.9–48.9)
516 Aliment Pharmacol Ther 2015; 42: 515–528
ª 2015 John Wiley & Sons Ltd
E. Montassier et al.

Nucleic Acid gel stain (Biotium, Hayward, CA, USA) andwere then purified using the Wizard� SV Gel and PCRClean-up System (Promega, Madison, WI, USA). Ampli-con DNA concentrations were determined using theQuant-iT PicoGreen dsDNA reagent and kit (Invitrogen,Waltham, MA, USA) and the final concentration of DNAwas determined using a NanoDrop spectrophotometer(Thermo Fischer Scientific, Waltham, MA, USA). Pyrose-quencing was carried out using primer A on the Roche454 Life Sciences Genome Sequencer FLX instrument (454Life Sciences-Roche, Branford, CT, USA) with titaniumchemistry at DNAVision (Charleroi, Belgium).
Sequence analysisThe 16S rRNA raw sequences were analysed with theQIIME (Quantitative Insights Into Microbial Ecology)1.8.0 software.11 Sequences were assigned to 97% IDOTUs by comparison to the Greengenes reference data-base 13_8 using pick_open_reference_otus.py.12 Of thefaecal samples collected, a total of 390 773 high-quality16S rRNA-encoding sequences were identified, repre-senting 4839 OTUs. The median number of sequencesobtained per sample was 8524 [6659–10 909]. Sincesamples contained between 3033 and 24 636 sequences,diversity analyses were rarefied at 3033 sequences persample to avoid bias. We used the beta_diver-sity_through_plots.py script to assess the differences inbacterial communities and functional compositionbetween faecal samples collected before and after che-motherapy. We visualised beta diversity using un-weighed, weighed UniFrac and Bray–Curtis distanceswith Principal Coordinate Analysis (PCoA). We usedthe compare_categories.py script, which applied theANOSIM method on the previously obtained dissimilar-ity matrices to determine whether communities differsignificantly between faecal samples collected before andafter chemotherapy. We used the alpha_rarefaction.pyscript to compute alpha diversity metrics, which evalu-ated diversity within a sample and generated rarefactioncurves. We then tested differences in alpha diversitybetween faecal samples collected before and after che-motherapy with a Monte Carlo permuted t-test usingthe compare_alpha_diversity.py script. We used thesupervised_learning.py script and performed RandomForest classification with 500 trees and 10-fold cross-validation to obtain robust estimates of the generalisa-tion error and feature importance.13 Cross-validation isoften used to assess how well a classifier trained onknown samples will generalise to a new data set ofnever before seen samples. To do this, our dataset was
partitioned into a training set (including 90% of thepatients) and a validation set (including the remaining10%). The random forest classifier was trained on the90% and used to predict the outcome of the held out10%. This was repeated ten times, allowing everypatient to act as a test case once. The model’s accuracywas determined by its ability on average to predict theoutcome of the 10% of patients that were held out. Weused the relative abundance in each sample of genera orfamilies as features. The measure of the method’s suc-cess is its ability to classify new samples as comingfrom one of the two groups (i.e. faecal sample collectedbefore or after chemotherapy). Random Forests assignan importance score to each genus or family by estimat-ing the increase in error caused by removing that genusfrom the set of predictors. Here, we considered a genusor a family to be highly predictive if its average impor-tance score was at least 0.001.14, 15
Statistical analysisQuantitative data were reported as medians [25th–75thPercentile]. Qualitative data were reported as percentages[95% confidence interval]. We used PICRUSt, a computa-tional approach to predicting the functional compositionof a metagenome using marker gene data (here the 16SrRNA gene) and the Greengenes reference genomes data-base.16 Comparison of taxonomic and functional countsdata between faecal samples collected before and after che-motherapy were performed using Mann–Withney U testwith false discovery rate (FDR) correction for multipletesting. Boxplots, beeswarms and two-dimensional PCoAplots were generated using R.17 We used a linear modelwith FDR correction to find associations between clinicaldata (age, sex, previous antibiotic use, history of chemo-therapy and delay of previous chemotherapy) and taxa orpredicted functions using code available at https://git-hub.com/danknights/mwas. To find taxa that were resis-tant to chemotherapy, we used Spearman correlation ofwithin-patient pre- and post-chemotherapy relative abun-dances, followed by FDR correction. A taxa was consid-ered resistant to chemotherapy if Pearson correlationcoefficient >0.70 and FDR-corrected P < 0.05). We alsocomputed Pearson correlations between relative abun-dance of taxa collapsed at genus level and KEGG signallingpathways of L3 categories. We plotted a correlation net-work of pairs that significantly correlated with a FDR-cor-rected P < 0.05. Network analyses were displayed withCytoscape using an edge-weighted spring embedded lay-out.18 Positive correlations were in blue and negative cor-relations in grey.
Aliment Pharmacol Ther 2015; 42: 515–528 517
ª 2015 John Wiley & Sons Ltd
Intestinal microbiome and chemotherapy

Study approvalWritten informed consent was obtained from allpatients. The protocol received IRB approval by theNantes University Hospital Ethics Committee (identifica-tion of the protocol: BRD/10/04-Q).
Accession numberSequences have been deposited on NCBI under BioPro-ject ID PRJNA257960.
RESULTS
Patient and faecal sample characteristicsTwenty-eight patients with non-Hodgkin’s lymphomaadmitted for HSCT were included in our study. Clinicalcharacteristics of the patients are listed in Table 1. Allpatients experienced GI mucositis-related symptoms,such as nausea, vomiting, abdominal pain and diarrhoeawith varying degrees of severity. Overall, 28 faecal sam-ples were collected before chemotherapy (named S1) and15 faecal samples were collected after chemotherapy(named S2). Indeed, it was not possible to obtain a faecalsample immediately prior to HSCT in all the patients.
Taxonomic shifts in the microbiome followingchemotherapyPCoA of faecal samples, based on 16S rRNA sequencesusing the unweighed and weighed UniFrac distance met-rics, showed strong differences between faecal samplescollected before and after chemotherapy (Figure 1). The
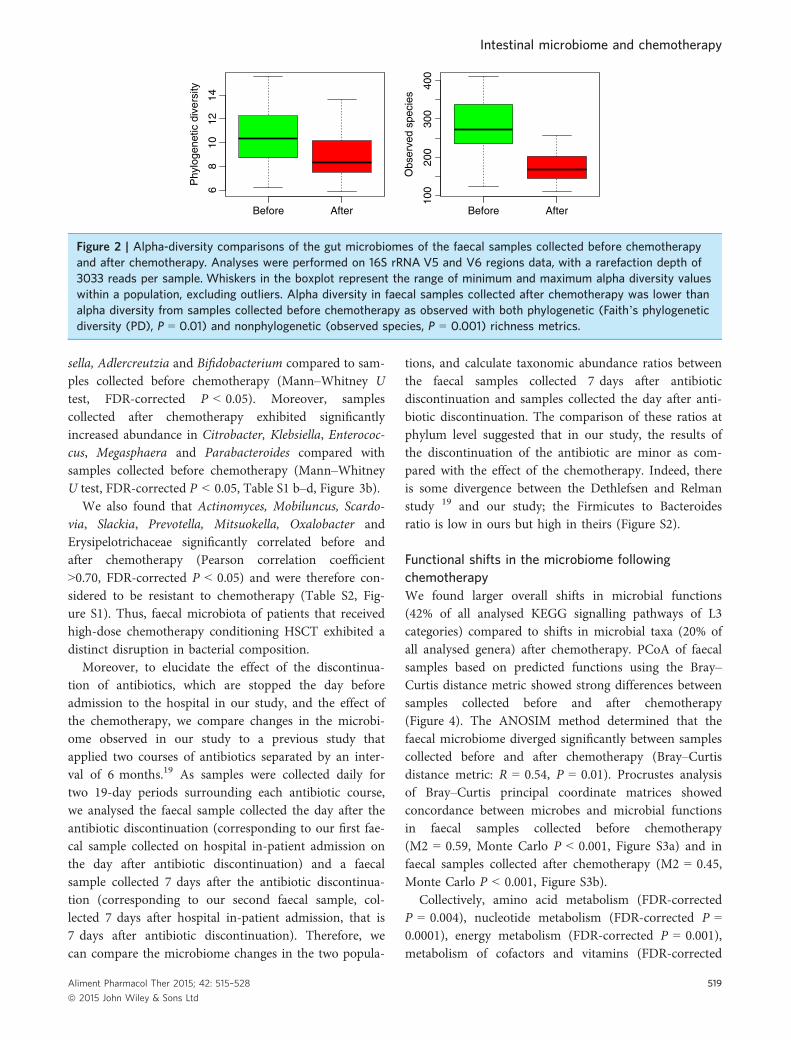
ANOSIM method determined that faecal bacterial com-munities diverged significantly between samples collectedbefore and after chemotherapy (unweighed UniFracdistance metric: R = 0.51, P = 0.001; weighted UniFracdistance metric: R = 0.58, P = 0.001). Moreover, alphadiversity in faecal samples collected after chemotherapywas lower than alpha diversity from samples collectedbefore chemotherapy. The trend is observed with bothphylogenetic [Faith’s phylogenetic diversity (PD), P =0.01] and nonphylogenetic (observed species, P = 0.001)richness metrics (Figure 2). Furthermore, using RandomForest, unknown samples were classified with a0.09 � 0.16 error rate, which is 3.7 times better than thebaseline error rate for random guessing, showing thatfaecal microbiota is distinctly altered following chemo-therapy. Thus, faecal microbiota of patients that receivedhigh-dose chemotherapy conditioning HSCT exhibited arapid and marked decreased overall diversity.
At the phylum level, faecal samples collected after che-motherapy exhibited significant decreases in abundancesof Firmicutes (Mann–Whitney U test, FDR-correctedP = 0.0002) and Actinobacteria (Mann–Whitney U test,FDR-corrected P = 0.002) and significant increases inabundances of Proteobacteria (Mann–Whitney U test,FDR-corrected P = 0.0002) compared to samples collectedbefore chemotherapy (Table S1a, Figure 3a). At the genuslevel, we found that faecal samples collected after chemo-therapy exhibited significantly decreased abundance inRuminococcus, Oscillospira, Blautia, Lachnospira, Rosebu-ria, Dorea, Coprococcus, Anaerostipes, Clostridium, Collin-
Unweighted UniFrac distance
PC axis 1 ~ 16%
PC
axi
s 2
~ 1
5%
PC
axi
s 2
~ 6
%
–0.4 –0.2 –0.2
–0.2
0.0
0.0
0.0–0.10.2
0.2
0.20
0.1
0.1
0.1
–0.1
00.
000.
10
PC axis 1 ~ 50%
Weighted UniFrac distance
Before After
(a) (b)
Figure 1 | Beta-diversity comparisons of the gut microbiomes of the faecal samples collected before chemotherapyand after chemotherapy. Analyses were performed on 16S rRNA V5 and V6 regions data, with a rarefaction depth of3033 reads per sample. (a) Principal Coordinate Analysis (PCoA) of unweighted UniFrac distances. Proportion ofvariance explained by each principal coordinate axis is denoted in the corresponding axis label. (b) PrincipalCoordinate Analysis (PCoA) of weighted UniFrac distances. Proportion of variance explained by each principalcoordinate axis is denoted in the corresponding axis label. The PCoAs shows clear separation between faecal samplescollected before chemotherapy and after chemotherapy.
518 Aliment Pharmacol Ther 2015; 42: 515–528
ª 2015 John Wiley & Sons Ltd
E. Montassier et al.
sella, Adlercreutzia and Bifidobacterium compared to sam-ples collected before chemotherapy (Mann–Whitney Utest, FDR-corrected P < 0.05). Moreover, samplescollected after chemotherapy exhibited significantlyincreased abundance in Citrobacter, Klebsiella, Enterococ-cus, Megasphaera and Parabacteroides compared withsamples collected before chemotherapy (Mann–WhitneyU test, FDR-corrected P < 0.05, Table S1 b–d, Figure 3b).
We also found that Actinomyces, Mobiluncus, Scardo-via, Slackia, Prevotella, Mitsuokella, Oxalobacter andErysipelotrichaceae significantly correlated before andafter chemotherapy (Pearson correlation coefficient>0.70, FDR-corrected P < 0.05) and were therefore con-sidered to be resistant to chemotherapy (Table S2, Fig-ure S1). Thus, faecal microbiota of patients that receivedhigh-dose chemotherapy conditioning HSCT exhibited adistinct disruption in bacterial composition.
Moreover, to elucidate the effect of the discontinua-tion of antibiotics, which are stopped the day beforeadmission to the hospital in our study, and the effect ofthe chemotherapy, we compare changes in the microbi-ome observed in our study to a previous study thatapplied two courses of antibiotics separated by an inter-val of 6 months.19 As samples were collected daily fortwo 19-day periods surrounding each antibiotic course,we analysed the faecal sample collected the day after theantibiotic discontinuation (corresponding to our first fae-cal sample collected on hospital in-patient admission onthe day after antibiotic discontinuation) and a faecalsample collected 7 days after the antibiotic discontinua-tion (corresponding to our second faecal sample, col-lected 7 days after hospital in-patient admission, that is7 days after antibiotic discontinuation). Therefore, wecan compare the microbiome changes in the two popula-
tions, and calculate taxonomic abundance ratios betweenthe faecal samples collected 7 days after antibioticdiscontinuation and samples collected the day after anti-biotic discontinuation. The comparison of these ratios atphylum level suggested that in our study, the results ofthe discontinuation of the antibiotic are minor as com-pared with the effect of the chemotherapy. Indeed, thereis some divergence between the Dethlefsen and Relmanstudy 19 and our study; the Firmicutes to Bacteroidesratio is low in ours but high in theirs (Figure S2).
Functional shifts in the microbiome followingchemotherapyWe found larger overall shifts in microbial functions(42% of all analysed KEGG signalling pathways of L3categories) compared to shifts in microbial taxa (20% ofall analysed genera) after chemotherapy. PCoA of faecalsamples based on predicted functions using the Bray–Curtis distance metric showed strong differences betweensamples collected before and after chemotherapy(Figure 4). The ANOSIM method determined that thefaecal microbiome diverged significantly between samplescollected before and after chemotherapy (Bray–Curtisdistance metric: R = 0.54, P = 0.01). Procrustes analysisof Bray–Curtis principal coordinate matrices showedconcordance between microbes and microbial functionsin faecal samples collected before chemotherapy(M2 = 0.59, Monte Carlo P < 0.001, Figure S3a) and infaecal samples collected after chemotherapy (M2 = 0.45,Monte Carlo P < 0.001, Figure S3b).
Collectively, amino acid metabolism (FDR-correctedP = 0.004), nucleotide metabolism (FDR-corrected P =0.0001), energy metabolism (FDR-corrected P = 0.001),metabolism of cofactors and vitamins (FDR-corrected
Phy
loge
netic
div
ersi
ty
Before After6
810
1214
Before After
100
200
300
400
Obs
erve
d sp
ecie
s
Figure 2 | Alpha-diversity comparisons of the gut microbiomes of the faecal samples collected before chemotherapyand after chemotherapy. Analyses were performed on 16S rRNA V5 and V6 regions data, with a rarefaction depth of3033 reads per sample. Whiskers in the boxplot represent the range of minimum and maximum alpha diversity valueswithin a population, excluding outliers. Alpha diversity in faecal samples collected after chemotherapy was lower thanalpha diversity from samples collected before chemotherapy as observed with both phylogenetic (Faith’s phylogeneticdiversity (PD), P = 0.01) and nonphylogenetic (observed species, P = 0.001) richness metrics.
Aliment Pharmacol Ther 2015; 42: 515–528 519
ª 2015 John Wiley & Sons Ltd
Intestinal microbiome and chemotherapy

AfterBefore
0.0
0.2
0.4
0.6
0.8
1.0
After
OthersUncl. Clostridiales 1
Uncl. Clostridiales 2
Porphyromonadaceae
BifidobacteriaceaeStreptococcaceaeBacteroidaceaeRuminococcaceae
LachnospiraceaeEnterobacteriaceae
Coriobacteriaceae
Before0.0
0.2
0.4
0.6
0.8
1.0
FirmicutesProteobacteriaBacteroidetesActinobacteriaUncl. UnassingnedTenericutesOthers
(a)
(b)
Figure 3 | Taxonomic profile of the gut microbiomes of the samples collected before and after chemotherapy.Analyses were performed on 16S rRNA V5 and V6 regions data, with a rarefaction depth of 3033 reads per sample.(a) Relative taxa abundance plots for individuals from the samples collected before and after chemotherapy,summarised at the phylum level. Individuals are represented along the horizontal axis, and relative taxa frequency isdenoted by the vertical axis. (b) Relative taxa abundance plots for individuals from the samples collected before andafter chemotherapy, summarised at the family level. Individuals are represented along the horizontal axis, and relativetaxa frequency is denoted by the vertical axis.
520 Aliment Pharmacol Ther 2015; 42: 515–528
ª 2015 John Wiley & Sons Ltd
E. Montassier et al.

P = 0.006) and carbohydrate metabolism (FDR-correctedP = 0.20) categories were decreased in samples collectedafter chemotherapy compared to samples collectedbefore chemotherapy. In contrast, signal transduction(FDR-corrected P = 0.0002), xenobiotics biodegradation(FDR-corrected P = 0.002) and glycan metabolism (FDR-corrected P = 0.0002) categories were enriched in samplescollected after chemotherapy compared to samplescollected before chemotherapy (Figure 5, Table S3a).Interestingly, these modulated pathways were similar tothose found in a recent study differentiating remission andactive colitis in mice.20
We also found an enrichment in sulphur, nitrogen, glu-tathione, riboflavin metabolism and phosphotransferasesystem in samples collected after chemotherapy (Figure S4,Table S3b), as found in mice with colitis and in IBDpatients.21, 22 The thiamine metabolism pathway, as previ-ously reported in Crohn’s disease (CD) patients, wasreduced following chemotherapy.23 Following chemother-apy, within the cell motility category, we found an increasein bacterial motility proteins and flagellar assembly (Fig-ure S4, Table S3b), as found in mice with active acute coli-tis.20 Flagella are essential for bacterial pathogenesis, andare required for bacterial motility, adhesion, invasion andsecretion of virulence factors.24, 25
Within the xenobiotics biodegradation category, mostof the pathways were increased following chemotherapy
(Figure S4, Table S3b). Aminobenzoate degradation waspreviously associated with disease and fluorobenzoatedegradation with disease severity in CD patients. Benzo-ate also promotes Enterobacteriaceae growth and viru-lence.26, 27 Moreover, following chemotherapy, we foundan increase in pathways involved in pathogenesis andvirulence processes (bacterial secretion system, secretionsystem and adherence/invasion) as found in CD patientsand in mice with acute colitis.21, 22 These pathways areimplicated in the secretion of cell wall-degradingenzymes and toxins, inducing epithelium impairmentand barrier dysfunction.28, 29 Nine microbial functions inthe replication and repair categories were depleted afterchemotherapy, indicating a decreased ability for epithe-lial repair.
Network analyses of taxonomic and functionalrepertoireIn samples collected before chemotherapy, we found 35taxon-functional pathway pairs that were significantlycorrelated and, in samples collected after chemotherapy,we found 33 taxon-functional pathway pairs that weresignificantly correlated (q < 0.05), both at the familylevel.
In samples collected before chemotherapy, the correla-tion network consisted of 43 nodes (taxa or functionalpathways) and 95 edges (correlations) (Figure S5a, TableS4a). These correlations mostly implicated Firmicutesand Bacteroidetes. Members of Firmicutes were nega-tively correlated with cell motility, glycan metabolismand xenobiotic degradation, pathways that were previ-ously associated with intestinal inflammation.20, 21, 23 Incontrast, Clostridiales was positively correlated withamino acid metabolism, as well as members of Bacteroi-detes. Members of Bacteroidetes were also negatively cor-related with xenobiotics biodegradation and membranetransport, pathways linked to intestinal inflamma-tion.20, 20, 23 Moreover, Faecalibacterium was negativelycorrelated with glutathione metabolism and phospho-transferase system, pathways associated with oxidativestress, and Ruminococcus was positively correlated withcarbohydrate metabolism, a pathway associated with pro-tection against intestinal inflammation in mice andhumans.20, 30, 31
In samples collected after chemotherapy, the networkconsisted of 35 nodes and 113 edges (Figure S5b, TableS4b). This post-chemotherapy network showed increasedcorrelation implicating phylum Proteobacteria (94%increase as compared to samples collected before chemo-therapy). Firmicutes members were negatively correlated
−0.3 −0.2 −0.1 0.0 0.1 0.2
−0.
15−
0.05
0.05
Bray curtis distance
PC axis 1 ~ 79%
PC
axi
s 2
~ 5
%
BeforeAfter
Figure 4 | Functional diversity of the gut microbiomesof the faecal samples collected before chemotherapyand after chemotherapy. Principal Coordinates Analysisof Bray–Curtis distances generated from KEGGOrthologue tables rarefied to 200 000 counts persample. Proportion of variance explained by eachprincipal coordinate axis is denoted in thecorresponding axis label. The PCoA shows clearseparation between faecal samples collected beforechemotherapy and after chemotherapy.
Aliment Pharmacol Ther 2015; 42: 515–528 521
ª 2015 John Wiley & Sons Ltd
Intestinal microbiome and chemotherapy

with glycan metabolism and signal transduction,pathways that were previously associated with intestinalinflammation.20, 21, 23 In contrast, Enterobacteriaceaewas negatively correlated with enzyme families,metabolism of nearly all amino acids and nucleotidemetabolism, pathways previously associated with healthystates; and was positively correlated with signal transduc-tion, xenobiotics degradation, membrane transport, cellmotility, riboflavin, glutathione, nitrogen and sulphurmetabolism, all pathways known to be associated withintestinal inflammation.20, 21, 23 Thus, these networkanalyses reinforce the findings that a specific imbalancein taxonomic composition and metabolic capacity is
associated with intestinal inflammation, as previouslycharacterised in various acute and chronic intestinalinflammation states in mice and humans.
DISCUSSIONMicrobiome-targeted studies aim to shed light on thecomposition and function of the intestinal microbiomein multiple disease conditions.32 Here, we identifiedmicrobes and microbial functions that change followingchemotherapy using 16S rRNA high-throughputsequencing-based approaches. As all the patients in ourcohort experienced GI mucositis symptoms after chemo-therapy, our study provided new insights into intestinal
Energy metabolismCell growth and death
Xenobiotics biodegradationand metabolism
0.19
50.
205
Rel
ativ
e ab
unda
nce
Rel
ativ
e ab
unda
nce
Rel
ativ
e ab
unda
nce
Rel
ativ
e ab
unda
nce
Rel
ativ
e ab
unda
nce
Amino acid metabolism Metabolism of other amino acids
0.29
50.
305
0.31
5
0.11
50.
125
0.05
50.
065
0.07
5
Before After Before After
Nucleotide metabolism
0.18
0.20
Before After
0.22
00.
230
0.24
00.
250
Before After
Signal transduction
0.11
0.13
0.15
Before After
0.12
50.
135
0.14
50.
155
Before After
Before After
Glycan biosynthesisand metabolism
0.12
0.14
0.16
0.18
Before After
Metabolism of cofactorsand vitamins
Before After
Rel
ativ
e ab
unda
nce
Rel
ativ
e ab
unda
nce
Rel
ativ
e ab
unda
nce
Rel
ativ
e ab
unda
nce
** *** ***
*** *** ***
*** ** ***
Figure 5 | Relative abundance of the most significant metabolic pathways (L2 KEGG Orthology profiles) in samplescollected before (n = 28) and after chemotherapy (n = 15) Mann–Whitney test: *P < 0.05; **P < 0.01 and***P < 0.001. Boxplots denote top quartile, median and bottom quartile.
522 Aliment Pharmacol Ther 2015; 42: 515–528
ª 2015 John Wiley & Sons Ltd
E. Montassier et al.

microbiome changes that may be implicated in the che-motherapy-induced GI mucositis pathophysiology. Weidentified microbes and microbial functions that may beuseful for the development of future microbiome-tar-geted therapies to manage GI mucositis in cancerpatients.
We confirmed that chemotherapy was associated withreduced diversity, as previously reported.9 Reduced rich-ness of the intestinal microbiota is a well-described fea-ture of intestinal inflammation as found in obese orelderly patients, as well as patients with HIV orIBD.15, 33–35
Our study identified microbes that changed duringchemotherapy independently of covariates such as age,sex, previous history of antibiotic use and previous his-tory of chemotherapy. Samples collected after chemo-therapy were marked with an increased inEnterococcaceae and Enterobacteriaceae, and a decreasein Firmicutes (Ruminococcaceae, Lachnospiraceae) andActinobacteria (Bifidobacterium), among others. Thesefindings extend those reported in the literature.7
Recently, a study in mice observed that a substantialdecrease in the absolute number and diversity of bacte-rial species was associated with an increase in potentiallyenteropathogenic bacteria such as Bacteroides, Entero-cocci and Enterobacteriaceae following methotrexateadministration.36
Our study also identified metabolic pathways thatchanged during chemotherapy. Amino acid metabolism,carbohydrate metabolism, nucleotide metabolism, energymetabolism, and metabolism of cofactors and vitaminscategories were decreased in samples collected after che-motherapy compared to samples collected before chemo-therapy, whereas signal transduction, xenobioticsbiodegradation and glycan metabolism categories wereenriched in samples collected after chemotherapy com-pared with samples collected before chemotherapy. Anintestinal microbiome enriched for glycan metabolismand depleted for amino-acid and carbohydrate metabo-lism, as found after chemotherapy in our study, was pre-viously associated with intestinal inflammation in humanand mouse models (Table S5).21, 30 As short chain fattyacids (SCFAs) contributed to host energy homeostasis,the intestinal microbiome following chemotherapy isassociated with limited capacity for energy harvest.37
Moreover, increased nitrogen and sulphur pathways dur-ing chemotherapy reflect inflammatory processes andproduction of specific metabolites (ROS, RNS, RSS)under oxidative stress conditions and glutathioneand riboflavin pathways, also increased following
chemotherapy, were increased in inflammatory diseasesin human and mouse models, and were positively corre-lated with inflammation and bacterial translocation inHIV patients (Table S5).21, 38–40 These increases mayrepresent the intestinal microbiome attempt to resist oxi-dative stress.21 Furthermore, following chemotherapy, wefound an increase in bacterial motility proteins, flagellarassembly and an increase in signal transduction pathway,which were previously associated with inflammatoryenvironment (Table S5).24, 25, 41
Van Vliet et al. previously proposed that microbiotamay play a role in the pathophysiology of GI mucositis.8
We now discuss our observations of chemotherapy-mod-ulated microbes and microbial functions in the contextof the current understanding of the pathophysiology ofGI mucositis, specifically the five pathophysiologicalphases proposed by Sonis mentioned above.5 First, theintestinal microbiome may modulate the activation ofNFjB and the induction of TNFa, potentially favouringinflammation. Several taxa that we found decreased afterchemotherapy, such as Faecalibacterium, Ruminococcus,Coprococcus, Dorea, Lachnospira, Roseburia and Clostrid-ium, are well-known to diminish inflammation by mod-ulation of the NFjB pathway.42 Bifidobacterium, whichwas decreased following chemotherapy, also has the abil-ity to inhibit inflammation in intestinal epithelial cellsthrough attenuation of TNFa and lipopolysaccharide-induced inflammatory responses.43, 44 Moreover, severaltaxa depleted following chemotherapy in our study(Roseburia, Coprococcus, Bifidobacterium, Ruminococcus,Faecalibacterium) are butyrate-producing bacteria, result-ing in reduced production of SCFAs, well-described tomaintain the homeostasis in the colonic mucosa andinhibit inflammatory response.8, 45 Moreover, Citrobact-er, found increased after chemotherapy in our study, hasthe ability to activate NFjB and therefore may increaseinflammatory responses.46 Globally, Enterobacteriaceaewere increased after chemotherapy in our study, similarto that of IBD and an active colitis mouse model.20, 21, 47
Furthermore, the thiamine pathway, found decreasedafter chemotherapy in our study, was negatively corre-lated with inflammation in cancer patients and its anti-inflammatory properties have been well-described inmammals.23, 48, 49 The lipopolysaccharide (LPS) biosyn-thesis pathway, found to be increased after chemother-apy in our study, possibly increases intestinalinflammation.50 In our study, we also found that nitro-gen and sulphur metabolisms were increased after che-motherapy, extending the link between oxidative stressand increased Enterobacteriaceae (Figure S6).
Aliment Pharmacol Ther 2015; 42: 515–528 523
ª 2015 John Wiley & Sons Ltd
Intestinal microbiome and chemotherapy

Second, the intestinal microbiome may modulateintestinal permeability.51–54 TNFa and NFjB have theability to increase the production of myosin light-chainkinase resulting in the disorganisation of tight-junctionproteins. Indeed, depleted Faecalibacterium, Ruminococ-cus, Coprococcus, Dorea, Lachnospira, Roseburia, Clos-tridium and Bifidobacterium after chemotherapy wereassociated with increased intestinal permeability throughNFjB and TNFa inhibition.55 Colonisation of the GItract with Bifidobacterium reduces intestinal endotoxinformation.56 Moreover, Bifidobacterium infantis Y1 wasable to increase the production of tight-junction pro-teins and transepithelial resistance, which reduces colo-nic permeability.57 Thus, a decrease in Bifidobacteriumafter chemotherapy, as found in our study, may be det-rimental to the maintenance of efficient barrier func-tion. A decreased in butyrate-producing bacteria afterchemotherapy also reduces intestinal permeability andleads to barrier dysfunction.58 Furthermore, previousstudies reported that LPS-induced inflammationincreased intestinal permeability through TLR-4-depen-dent up-regulation of CD14 membrane expres-sion.50, 59–61 The increase in the glycosaminoglycandegradation pathway after chemotherapy revealed thatmicrobes degrade glycosaminoglycan, which may deteri-orate the intestinal barrier, as found in mice.62 Theincreased pathways implicated in pathogenesis and viru-lence processes (bacterial secretion system, secretionsystem and adherence/invasion) following chemotherapymay also resulted in intestinal epithelial barrier dys-function.28, 29
Third, the intestinal microbiome may modulate thecomposition of the mucus layer. Butyrate-producing bac-teria play a role in the composition of the mucus layer,as butyrate has the ability to increase mucin synthesisvia MUC2.63 Therefore, the reduction in butyrate-pro-ducing bacteria after chemotherapy may be detrimentalto the mucus layer composition, potentially leading totissue damage and translocation of bacteria.37 The mucuslayer may also be compromised by specific pathogens,such as Enterobacteriaceae, which can form biofilms onthe epithelial surface that alter the mucus layer.64 More-over, mucin synthesis may be altered by the limitedavailability of some amino acids. Specifically, thedecrease in cysteine, proline and methionine metabolismfollowing chemotherapy may be responsible fordecreased mucin synthesis and impaired colonic protec-tion.65, 66 Another study demonstrated that L-cysteineand methylmethionine sulfonium chloride inhibited etha-nol-induced gastric mucosal damage and increased the
amount of surface mucin in rats.67 Furthermore, Citrob-acter, found increased after chemotherapy in our study,may participate in the degradation of the mucus barrier,using mucinases or glycosidases to digest mucin.68 Add-ing rectal mucosal samples to future studies would likelyimprove our ability to understand histological andmucosa-associated microbiota changes. However, in afragile population of cancer patients receiving a highdose of chemotherapy the infectious risk of such a pro-cedure is generally considered too high.
On the basis of our findings, we proposed that thetaxonomic and functional dysbiosis found after chemo-therapy may be implicated in the pathophysiology of GImucositis (Figure S6). The intestinal microbiome afterchemotherapy was associated with increased capacity forpromoting colonisation, and invasion of mucosa andhost systemic organs. This may favour bacterial translo-cation in these immunocompromised patients.5 Blood-stream infections (BSI) are a frequent complication incancer patients receiving chemotherapy.6, 69 In previousstudies, the incidence of BSI was reported to be22–62%.70–73 In many cases, the infection enters thebloodstream from the digestive tract, as the lining of thedigestive tract is severely compromised.70, 72, 73
Importantly, sepsis-associated mortality ranges from 9%to 31% in HSCT patients.70, 72, 73
CONCLUSIONSIn summary, we found a profound disruption of theintestinal microbiome in terms of both taxonomic com-position and metabolic capacity that may partly explainthe acute inflammation, known as GI mucositis, observedafter chemotherapy. This dysbiosis is also characteristicof other acute and chronic inflammatory conditions inmice as well as in humans, suggesting a causal role forthe microbiome in chemotherapy-induced GI mucositis.Therefore, interventions targeting taxonomic and func-tional imbalances may be relevant to limiting the burdenof HSCT-related complications and to reducing the costof care.
AUTHORSHIPGuarantor of the article: Dr E. Montassier accepts fullresponsibility for this study. He has access to the dataand accepts for responsibilities association with its publi-cation.Author contributions: E.M. drafted the article. E.M.,M.F.C., S.M., S.B.V., G.A.A. and D.K. collected and anal-ysed the data. G.P., P.V. and D.K. critically revised thearticle for important intellectual content and analysed
524 Aliment Pharmacol Ther 2015; 42: 515–528
ª 2015 John Wiley & Sons Ltd
E. Montassier et al.

and interpreted the data. E.M., T.G., P.M. and E.B. con-ceived and designed the study.
All authors have approved the final version of the arti-cle, including the authorship list.
ACKNOWLEDGEMENTSDeclaration of personal interests: None.Declaration of funding interests: Emmanuel Montassierreceived a research grant from Nantes University Hospi-tal, Grant BRD/10/04-Q.
SUPPORTING INFORMATIONAdditional Supporting Information may be found in theonline version of this article:Figure S1. Scatter plot of taxa that significantly corre-
late before and after chemotherapy (i.e. taxa that areresistant to chemotherapy). Analyses were performed on16S rRNA V5 and V6 regions data, with a rarefactiondepth of 3033 reads per sample. OTUs were collapsedto the genus level. We performed Spearman correlationof taxon–taxon relative abundance and included onlythose links with correlation >0.7 and FDR-correctedP < 0.05.Figure S2. Scatter plot of the ratio of taxa collapsed at
phylum level, after antibiotic discontinuation in Dethlef-sen and Relman study (x label) and our study (y label).19
The ratio was built between the fist sample collected theday after the antibiotic discontinuation and a sample col-lected 7 days later. We compared the microbiomechanges in the two populations, and calculated taxo-nomic abundance ratios between the faecal samples col-lected 7 days after antibiotic discontinuation andsamples collected the day after antibiotic discontinuation.The comparison of these ratios at phylum level suggestedthat in our study, the results of the discontinuation ofthe antibiotic are minor as compared with the effect ofthe chemotherapy. Indeed, there is some divergencebetween the Dethlefsen and Relman study 19 and ourstudy, the Firmicutes to Bacteroides ratio is low in oursbut high in theirs.Figure S3. (a) Procrustes analyses comparing spatial
fit of Bray–Curtis principal coordinate matrices ofmicrobes (blue points, n = 28) and microbial functions(red points, n = 28) in faecal samples collected beforechemotherapy. (b) Procrustes analyses comparing spatialfit of Bray–Curtis principal coordinate matrices ofmicrobes (blue points, n = 15) and microbial functions(red points, n = 15) in faecal samples collected beforechemotherapy. These analyses showed concordance infaecal samples collected before chemotherapy and after
chemotherapy, indicating consistency between taxonomicand functional profiles (P < 0.001 in both cases).Figure S4. Relative abundance of the most significant
metabolic pathways (L3 KEGG Orthology profiles) insamples collected before (n = 28) and after chemother-apy (n = 15) Mann–Whitney test: *P < 0.05; **P < 0.01and ***P < 0.001. Boxplots denote top quartile, medianand bottom quartile.Figure S5. Correlation network including OTUs col-
lapsed at genus level and KEGG Orthology profiles infaecal samples collected before chemotherapy (a) and insamples collected after chemotherapy (b). Positive corre-lations are in blue and negative correlations are in grey.Nodes are positioned using an edge-weighted springembedded layout.Figure S6. Proposed pathophysiology of chemother-
apy-induced mucositis incorporating the role of theintestinal microbiome.Table S1. (a) Phyla that discriminated faecal microbiota
from faecal samples collected before chemotherapy andfaecal samples collected after chemotherapy (Mann–Whit-ney U test, false discovery rate (FDR)-corrected P < 0.05).(b) Families that discriminated faecal microbiota from fae-cal samples collected before chemotherapy and faecal sam-ples collected after chemotherapy (Mann–Whitney U test,FDR-corrected P < 0.05). (c) Genera that discriminatedfaecal microbiota from faecal samples collected before che-motherapy and faecal samples collected after chemother-apy (Mann–Whitney U test, FDR-corrected P < 0.05). (d)Association using a linear model of clinical covariates andtaxonomic data collapsed at genus level.Table S2. Taxa that significantly correlate before and
after chemotherapy, (i.e. taxa that are resistant to chemo-therapy). We used Spearman correlation of within-patient pre- and post-chemotherapy relative abundances.Taxa that are resistant to chemotherapy are those with aPearson correlation coefficient >0.70 and a false discov-ery rate (FDR)-corrected P < 0.05.Table S3. (a) L2 KEGG signalling pathways that dis-
criminated faecal microbiota from faecal samples col-lected before chemotherapy and faecal samples collectedafter chemotherapy (Mann–Whitney U test, false discov-ery rate (FDR)-corrected P < 0.25). (b) L3 KEGG signal-ling pathways that discriminated faecal microbiota fromfaecal samples collected before chemotherapy and faecalsamples collected after chemotherapy (Mann–Whitney Utest, false discovery rate (FDR)-corrected P < 0.25).Table S4. (a) Correlation network in samples collected
before chemotherapy, at family level and KEGG signal-ling pathways of L2 categories. Spearman correlation,
Aliment Pharmacol Ther 2015; 42: 515–528 525
ª 2015 John Wiley & Sons Ltd
Intestinal microbiome and chemotherapy

false discovery rate (FDR)-corrected P value. (b) Correla-tion network in samples collected after chemotherapy, atfamily level and KEGG signalling pathways of L2 catego-ries. Spearman correlation, false discovery rate (FDR)-corrected P value.
Table S5. Metabolic pathways that changed duringacute and chronic inflammation, in mice and humanspublished in recent datasets. Microbial functions thatchanged in the same direction in more than 2 datasetsare highlighted in yellow.
REFERENCES1. Vose JM, Anderson JR, Kessinger A,
et al. High-dose chemotherapy andautologous hematopoietic stem-celltransplantation for aggressive non-Hodgkin’s lymphoma. J Clin Oncol1993; 11: 1846–51.
2. Elting LS, Cooksley C, Chambers M,Cantor SB, Manzullo E, Rubenstein EB.The burdens of cancer therapy. Clinicaland economic outcomes ofchemotherapy-induced mucositis.Cancer 2003; 98: 1531–9.
3. Blijlevens NMA, Lutgens LCHW,Schattenberg AVMB, Donnelly JP.Citrulline: a potentially simplequantitative marker of intestinalepithelial damage followingmyeloablative therapy. Bone MarrowTransplant 2004; 34: 193–6.
4. Keefe DM, Brealey J, Goland GJ,Cummins AG. Chemotherapy forcancer causes apoptosis that precedeshypoplasia in crypts of the smallintestine in humans. Gut 2000; 47: 632–7.
5. Sonis ST. The pathobiology ofmucositis. Nat Rev Cancer 2004; 4:277–84.
6. Marin M, Gudiol C, Ardanuy C, et al.Bloodstream infections in neutropenicpatients with cancer: differencesbetween patients with haematologicalmalignancies and solid tumours. J Infect2014; 69: 417–23.
7. Touchefeu Y, Montassier E, Nieman K,et al. Systematic review: the role of thegut microbiota in chemotherapy- orradiation-induced gastrointestinalmucositis - current evidence andpotential clinical applications. AlimentPharmacol Ther 2014; 40: 409–21.
8. Van Vliet MJ, Harmsen HJM, de BontESJM, Tissing WJE. The role ofintestinal microbiota in thedevelopment and severity ofchemotherapy-induced mucositis. PLoSPathog 2010; 6: e1000879.
9. Montassier E, Batard E, Massart S,et al. 16S rRNA gene pyrosequencingreveals shift in patient faecal microbiotaduring high-dose chemotherapy asconditioning regimen for bone marrowtransplantation. Microb Ecol 2014; 67:690–9.
10. Andersson AF, Lindberg M, JakobssonH, B€ackhed F, Nyr�en P, Engstrand L.Comparative analysis of human gutmicrobiota by barcodedpyrosequencing. PLoS ONE 2008; 3:e2836.
11. Caporaso JG, Kuczynski J, StombaughJ, et al. QIIME allows analysis of high-throughput community sequencingdata. Nat Methods 2010; 7: 335–6.
12. DeSantis TZ, Hugenholtz P, Larsen N,et al. Greengenes, a chimera-checked16S rRNA gene database andworkbench compatible with ARB. ApplEnviron Microbiol 2006; 72: 5069–72.
13. Knights D, Costello EK, Knight R.Supervised classification of humanmicrobiota. FEMS Microbiol Rev 2011;35: 343–59.
14. Yatsunenko T, Rey FE, Manary MJ,et al. Human gut microbiome viewedacross age and geography. Nature 2012;486: 222–7.
15. Lozupone CA, Li M, Campbell TB,et al. Alterations in the gut microbiotaassociated with HIV-1 infection. CellHost Microbe 2013; 14: 329–39.
16. Langille MGI, Zaneveld J, Caporaso JG,et al. Predictive functional profiling ofmicrobial communities using 16S rRNAmarker gene sequences. Nat Biotechnol2013; 31: 814–21.
17. Team RC. R: a Language andEnvironment for Statistical Computing(R Foundation for StatisticalComputing, 2012) ISBN 3-900051-07-0.
18. Saito R, Smoot ME, Ono K, et al. Atravel guide to Cytoscape plugins. NatMethods 2012; 9: 1069–76.
19. Dethlefsen L, Relman DA. Incompleterecovery and individualized responsesof the human distal gut microbiota torepeated antibiotic perturbation.Proc Natl Acad Sci USA 2011; 108:4554–61.
20. Rooks MG, Veiga P, Wardwell-ScottLH, et al. Gut microbiome compositionand function in experimental colitisduring active disease and treatment-induced remission. ISME J 2014; 8:1403–17.
21. Morgan XC, Tickle TL, Sokol H, et al.Dysfunction of the intestinalmicrobiome in inflammatory bowel
disease and treatment. Genome Biol2012; 13: R79.
22. Schwab C, Berry D, Rauch I, et al.Longitudinal study of murinemicrobiota activity and interactionswith the host during acuteinflammation and recovery. ISME J2014; 8: 1101–14.
23. Gevers D, Kugathasan S, Denson LA,et al. The treatment-naive microbiomein new-onset Crohn’s disease. Cell HostMicrobe 2014; 15: 382–92.
24. Ottemann KM, Miller JF. Roles formotility in bacterial-host interactions.Mol Microbiol 1997; 24: 1109–17.
25. Ramos HC, Rumbo M, Sirard J-C.Bacterial flagellins: mediators ofpathogenicity and host immuneresponses in mucosa. Trends Microbiol2004; 12: 509–17.
26. Lyte M, Vulchanova L, Brown DR.Stress at the intestinal surface:catecholamines and mucosa-bacteriainteractions. Cell Tissue Res 2011; 343:23–32.
27. Freestone PPE, Walton NJ, Haigh RD,Lyte M. Influence of dietary catecholson the growth of enteropathogenicbacteria. Int J Food Microbiol 2007;119: 159–69.
28. Jha G, Rajeshwari R, Sonti RV.Bacterial type two secretion systemsecreted proteins: double-edged swordsfor plant pathogens. Mol Plant MicrobeInteract 2005; 18: 891–8.
29. Sandkvist M. Type II secretion andpathogenesis. Infect Immun 2001; 69:3523–35.
30. Tong M, McHardy I, Ruegger P, et al.Reprograming of gut microbiomeenergy metabolism by the FUT2Crohn’s disease risk polymorphism.ISME J 2014; 8: 2193–206.
31. De Fazio L, Cavazza E, Spisni E,et al. Longitudinal analysis ofinflammation and microbiotadynamics in a model of mild chronicdextran sulfate sodium-induced colitisin mice. World J Gastroenterol 2014;20: 2051–61.
32. Huttenhower C, Knight R, Brown CT,et al. Advancing the microbiomeresearch community. Cell 2014; 159:227–30.
526 Aliment Pharmacol Ther 2015; 42: 515–528
ª 2015 John Wiley & Sons Ltd
E. Montassier et al.

33. Manichanh C, Rigottier-Gois L,Bonnaud E, et al. Reduced diversity offaecal microbiota in Crohn’s diseaserevealed by a metagenomic approach.Gut 2006; 55: 205–11.
34. Turnbaugh PJ, Hamady M, YatsunenkoT, et al. A core gut microbiome inobese and lean twins. Nature 2009; 457:480–4.
35. Claesson MJ, Jeffery IB, Conde S, et al.Gut microbiota composition correlateswith diet and health in the elderly.Nature 2012; 488: 178–84.
36. Fijlstra M, Ferdous M, Koning AM,Rings EHHM, Harmsen HJM, TissingWJE. Substantial decreases in thenumber and diversity of microbiotaduring chemotherapy-inducedgastrointestinal mucositis in a rat model.Support Care Cancer 2015; 23: 1513–22.
37. Bergman EN. Energy contributions ofvolatile fatty acids from thegastrointestinal tract in various species.Physiol Rev 1990; 70: 567–90.
38. Giles GI, Jacob C. Reactive sulfurspecies: an emerging concept inoxidative stress. Biol Chem 2002; 383:375–88.
39. Ashoori M, Saedisomeolia A. Riboflavin(vitamin B2) and oxidative stress: areview. Br J Nutr 2014; 000: 1–7.
40. Mytilineou C, Kramer BC, Yabut JA.Glutathione depletion and oxidativestress. Parkinsonism Relat Disord 2002;8: 385–7.
41. Reedquist KA, Tak PP. Signaltransduction pathways in chronicinflammatory autoimmune disease:small GTPases. Open Rheumatol J 2012;6: 259–72.
42. Lakhdari O, Tap J, B�eguet-Crespel F,et al. Identification of NF-jBmodulation capabilities within humanintestinal commensal bacteria. J BiomedBiotechnol 2011; 2011: 282356.
43. Khokhlova EV, Smeianov VV, EfimovBA, Kafarskaia LI, Pavlova SI,Shkoporov AN. Anti-inflammatoryproperties of intestinal Bifidobacteriumstrains isolated from healthy infants.Microbiol Immunol 2012; 56: 27–39.
44. Riedel C-U, Foata F, Philippe D,Adolfsson O, Eikmanns B-J, Blum S.Anti-inflammatory effects ofbifidobacteria by inhibition of LPS-induced NF-kappaB activation. World JGastroenterol 2006; 12: 3729–35.
45. Segain JP, Raingeard de la Bl�eti�ere D,Bourreille A, et al. Butyrate inhibitsinflammatory responses throughNFkappaB inhibition: implications forCrohn’s disease. Gut 2000; 47: 397–403.
46. Wang Y, Xiang G-S, Kourouma F,Umar S. Citrobacter rodentium-inducedNF-kappaB activation inhyperproliferating colonic epithelia: role
of p65 (Ser536) phosphorylation. Br JPharmacol 2006; 148: 814–24.
47. Garrett WS, Gallini CA, Yatsunenko T,et al. Enterobacteriaceae act in concertwith the gut microbiota to inducespontaneous and maternally transmittedcolitis. Cell Host Microbe 2010; 8: 292–300.
48. Naik SR, Rupawalla EN, Sheth UK.Anti-inflammatory activity of thiamineand nicotinic acid. Biochem Pharmacol1970; 19: 2867–73.
49. Moallem SA, Hosseinzadeh H, Farahi S.A study of acute and chronic anti-nociceptive and anti-inflammatoryeffects of thiamine in mice. IranBiomed J 2008; 12: 173–8.
50. Verhasselt V, Buelens C, Willems F, DeGroote D, Haeffner-Cavaillon N,Goldman M. Bacteriallipopolysaccharide stimulates theproduction of cytokines and theexpression of costimulatory moleculesby human peripheral blood dendriticcells: evidence for a soluble CD14-dependent pathway. J Immunol 1950;1997: 2919–25.
51. Carneiro-Filho BA, Lima IPF, AraujoDH, et al. Intestinal barrier functionand secretion in methotrexate-inducedrat intestinal mucositis. Dig Dis Sci2004; 49: 65–72.
52. Russo F, Linsalata M, Clemente C,et al. The effects of fluorouracil,epirubicin, and cyclophosphamide(FEC60) on the intestinal barrierfunction and gut peptides in breastcancer patients: an observational study.BMC Cancer 2013; 13: 56.
53. Nejdfors P, Ekelund M, Westr€om BR,Will�en R, Jeppsson B. Intestinalpermeability in humans is increasedafter radiation therapy. Dis ColonRectum 2000; 43: 1582–7; discussion1587–1588.
54. Melichar B, Zezulov�a M. Thesignificance of altered gastrointestinalpermeability in cancer patients. CurrOpin Support Palliat Care 2011; 5: 47–54.
55. Resta-Lenert S, Barrett KE. Probioticsand commensals reverse TNF-alpha-and IFN-gamma-induceddysfunction in human intestinalepithelial cells. Gastroenterology 2006;130: 731–46.
56. Strowski MZ, Wiedenmann B. Probioticcarbohydrates reduce intestinalpermeability and inflammation inmetabolic diseases. Gut 2009; 58: 1044–5.
57. Ewaschuk JB, Diaz H, Meddings L,et al. Secreted bioactive factors fromBifidobacterium infantis enhanceepithelial cell barrier function. Am JPhysiol Gastrointest Liver Physiol 2008;295: G1025–34.
58. Canani RB, Costanzo MD, Leone L,Pedata M, Meli R, Calignano A.Potential beneficial effects of butyrate inintestinal and extraintestinal diseases.World J Gastroenterol 2011; 17: 1519–28.
59. V�azquez-Castellanos JF, Serrano-VillarS, Latorre A, et al. Altered metabolismof gut microbiota contributes to chronicimmune activation in HIV-infectedindividuals. Mucosal Immunol 2015; 8:760–72.
60. Guo S, Al-Sadi R, Said HM, Ma TY.Lipopolysaccharide causes an increasein intestinal tight junction permeabilityin vitro and in vivo by inducingenterocyte membrane expression andlocalization of TLR-4 and CD14. Am JPathol 2013; 182: 375–87.
61. Eutamene H, Theodorou V, SchmidlinF, et al. LPS-induced lunginflammation is linked to increasedepithelial permeability: role of MLCK.Eur Respir J 2005; 25: 789–96.
62. Lee H-S, Han S-Y, Ryu K-Y, Kim D-H.The degradation of glycosaminoglycansby intestinal microflora deterioratescolitis in mice. Inflammation 2009; 32:27–36.
63. Burger-van Paassen N, Vincent A,Puiman PJ, et al. The regulation ofintestinal mucin MUC2 expression byshort-chain fatty acids: implications forepithelial protection. Biochem J 2009;420: 211–9.
64. Johansson MEV, Phillipson M,Petersson J, Velcich A, Holm L,Hansson GC. The inner of the twoMuc2 mucin-dependent mucus layersin colon is devoid of bacteria. Proc NatlAcad Sci USA 2008; 105: 15064–9.
65. Faure M, Mettraux C, Moennoz D,et al. Specific amino acids increasemucin synthesis and microbiota indextran sulfate sodium-treated rats. JNutr 2006; 136: 1558–64.
66. Watanabe T, Ohara S, Miyazawa S,Saigenji K, Hotta K. Augmentativeeffects of L-cysteine andmethylmethionine sulfonium chlorideon mucin secretion in rabbit gastricmucous cells. J Gastroenterol Hepatol2000; 15: 45–52.
67. Watanabe T, Ohara S, Ichikawa T,Saigenji K, Hotta K. Mechanisms forcytoprotection by vitamin U fromethanol-induced gastric mucosaldamage in rats. Dig Dis Sci 1996; 41:49–54.
68. Bergstrom KSB, Kissoon-Singh V,Gibson DL, et al. Muc2 protects againstlethal infectious colitis by disassociatingpathogenic and commensal bacteriafrom the colonic mucosa. PLoS Pathog2010; 6: e1000902.
69. Montassier E, Batard E, Gastinne T,Potel G, de La Cocheti�ere MF. Recent
Aliment Pharmacol Ther 2015; 42: 515–528 527
ª 2015 John Wiley & Sons Ltd
Intestinal microbiome and chemotherapy

changes in bacteremia in patients withcancer: a systematic review ofepidemiology and antibiotic resistance.Eur J Clin Microbiol Infect Dis 2013;32: 841–50.
70. Almyroudis NG, Fuller A, Jakubowski A,et al. Pre- and post-engraftmentbloodstream infection rates and associatedmortality in allogeneic hematopoieticstem cell transplant recipients. TransplInfect Dis 2005; 7: 11–7.
71. Poutsiaka DD, Price LL, Ucuzian A,Chan GW, Miller KB, Snydman DR.Blood stream infection afterhematopoietic stem cell transplantationis associated with increased mortality.Bone Marrow Transplant 2007; 40: 63–70.
72. Mikulska M, Del Bono V, Raiola AM,et al. Enterococcal bloodstreaminfection after hematopoietic stem celltransplant: experience of a center with a
low prevalence of vancomycin-resistantenterococci. Clin Infect Dis 2012; 55:1744.
73. Blennow O, Ljungman P, Sparrelid E,Mattsson J, Remberger M. Incidence,risk factors, and outcome ofbloodstream infections during the pre-engraftment phase in 521 allogeneichematopoietic stem celltransplantations. Transpl Infect Dis2014; 16: 106–14.
528 Aliment Pharmacol Ther 2015; 42: 515–528
ª 2015 John Wiley & Sons Ltd
E. Montassier et al.