Alignment of Alaska's Educational Programs from Pre-School
21
Alignment of Alaska’s Educational Programs from Pre-School through Graduate Study: A First Look G. Williamson McDiarmid Alexandra Hill ISER Working Paper 2010.1 Revised January 2010 The authors thank Gary Rice and Yuan-Fang Dong of UAA’s Office of Institutional Planning, Research, and Assessment, Diane Erickson of UAA, and the public school superintendents and principals who gave us their time. About the authors: G. Williamson McDiarmid is a former director of ISER with 30 years’ experience studying Alaska education issues; he is currently the dean of the School of Education at the University of North Carolina at Chapel Hill. Alexandra Hill is an ISER research associate who has examined a broad range of issues surrounding education in the state. ISER and Avant-Garde Learning Foundation jointly carried out this research, funded by a grant from Shell Exploration and Production Alaska.
Transcript of Alignment of Alaska's Educational Programs from Pre-School

Alignment of Alaska’s Educational Programs from Pre-School through Graduate Study:
A First Look
G. Williamson McDiarmid Alexandra Hill
ISER Working Paper 2010.1
Revised January 2010 The authors thank Gary Rice and Yuan-Fang Dong of UAA’s Office of Institutional Planning, Research, and Assessment, Diane Erickson of UAA, and the public school superintendents and principals who gave us their time. About the authors: G. Williamson McDiarmid is a former director of ISER with 30 years’ experience studying Alaska education issues; he is currently the dean of the School of Education at the University of North Carolina at Chapel Hill. Alexandra Hill is an ISER research associate who has examined a broad range of issues surrounding education in the state.
ISER and Avant-Garde Learning Foundation jointly carried out this research, funded by a grant from Shell Exploration and Production Alaska.


1
Alignment of Alaska’s Educational Programs from Pre-School Through Graduate Study: A First Look
By alignment we mean integrating the expectations of one education system into the other and connecting course work, pedagogy, curricula, and assessments.
Andrea Venezia, Joni Finney, Patrick Callan, Chapter 3: “Common Ground,” in Minding the Gap, Harvard Education Press, 2007
Introduction
Too many Alaska students leave formal education unprepared for their next steps in life. Too many drop out of high school; too few high-school graduates go on to post-secondary education; and too few of those who do enroll in post-secondary education graduate in a timely manner. Employers report that a substantial number of young people who enter the work world directly after graduating from high school (or after dropping out) lack the reading, writing, and math skills necessary for many of today’s jobs, even at entry level. Ideally, the various components of the education system would be structured so that as children or young people complete each step, they would be adequately prepared for the next. In practice, this is often not the case. Students arrive at kindergarten and again at college, vocational training, or work unprepared for the challenges they face and without the skills their teachers, professors, or employers expect. Alaska is not alone in these problems, and many states are focusing on alignment as a possible response. Policymakers and others are studying how students progress through the entire education system—from pre-school through college, graduate study, or career training. As defined above, alignment would coordinate the work of institutions providing different levels of education. Educators in K-12 and early childhood programs would agree on what children should know and be able to do when entering kindergarten (or first grade)—and on how those skills and abilities would be taught and assessed. Likewise, employers, institutions of higher education, and K-12 schools would work together to reach similar agreements on what young people need to know to enter the workforce or college. Alignment efforts bring together policymakers and practitioners from all levels of education to identify what needs to be done to achieve this coordination and to oversee the work. The first section of this report looks at alignment of early childhood programs and K-12 education. Why is it important to begin alignment at the level of early childhood education? Research has demonstrated the strong effect of quality early childhood education on later educational outcomes. Among the best-known research is the High/Scope Perry Preschool study, which followed 120 children from the time they attended that preschool in the 1960s, at ages 3 or 4, until they were age 40.1 Schweinhart, et al. (1993) looked at program participants through age 27 and estimated that the program had produced savings to taxpayers of over $7 for each dollar spent. Program participants were less likely to need special education services throughout their school careers, less likely to commit crimes, and less likely to receive welfare—and they also
1 For more information on this study, see http://www.highscope.org/Content.asp?ContentId=219

2
earned more and paid higher taxes than non-participants. Other studies have found that children who participate in quality early childhood education programs are less likely to be retained in grade, placed in special education, or drop out of high school (Schweinhart 1994). In Alaska, public early childhood education is limited to federally mandated special education and federally funded (with state supplemental funding) Head Start programs. These programs together enroll about 16% of 3-year-olds and 22% of 4-year-olds in the state. Many more students in urban areas are enrolled in some form of private pre-school. Head start programs exist in more than 75 Alaska communities and are run by 16 different grantees, which have varying degrees of coordination with their local K-12 districts and with each other. The second focus of this report is readiness of Alaska high-school graduates for post-secondary education or work. Alaska’s colleges and universities find that many of their entering students—even those with good grades in high school—aren’t ready for college-level work. Again, national research affirms that Alaska’s problems are not unique. Callan, Finney, Kirst, Usdan, and Venezia (2006) report “The more difficult challenge for students is becoming prepared academically for college coursework. Once students enter college, about half of them learn that they are not prepared for college-level courses. Forty percent of students at four-year institutions and 63 percent at two-year colleges take remedial education. Additionally, high-school students face an incredibly complex system of placement tests and college admissions requirements.” A national survey of 431 employers about workforce readiness found that “When asked to assess new workforce entrants, employers report that many of the new entrants lack skills essential to job success… Over 40 percent (42.4 percent) of employer respondents rate new entrants with a high school diploma as ‘deficient’ in their overall preparation for the entry-level jobs they typically fill. Almost the same percentage (45.6 percent) rate the overall preparation of high school graduate entrants as ‘adequate,’ but almost no one (less than ½ of 1 percent—0.2 percent) rates their overall preparation as ‘excellent.’ ” 2 Anecdotal information from Alaska employers indicates that many young people entering the workforce in Alaska aren’t prepared for work, either. This report brings together available data on the scope of these problems in Alaska and discusses what other states have tried and what we can tell so far about what has worked. We identify areas that need more research and where there may not even be data to conduct research. Finally, we suggest steps the state can undertake now, while conducting research, to fill in the gaps.
2 Casner-Lotto, J, et al., Are they Really Ready to Work? Employers’ Perspectives on the Basic Knowledge and Applied Skills of New Entrants to the 21st Century U.S. Workforce, (2006)

3
Early Childhood into K-12 Education How many children in Alaska aren’t ready to enter school when they reach school age? The main source of data on Alaska children’s school readiness when we did this research was the Kindergarten Developmental Profile (KDP), which has now been replaced by the Revised Alaska Developmental Profile (RADP).3 However, in considering KDP aggregated results—or results of the new RADP—policymakers need to remember that it is a screening tool, not an assessment. The implementation guide describes the purpose of the profile as “…to identify, record and summarize the skills and behaviors students demonstrate at the beginning of their kindergarten year… The instrument is not intended to be used for the evaluation of individual students to determine their eligibility for any programs, including kindergarten, or for the evaluation of specific learning programs.” 4 Thus we should be cautious in using the results to assess the effectiveness of Alaska’s early learning programs as a group. Teachers administer this assessment when children enroll for the first time in public school—usually in kindergarten, but sometimes first grade. The profile includes information on the child’s physical development, social development, language and literacy development, and thinking and cognitive development. According to the statewide results from fall 2007 (Table 1), about two-thirds of Alaska children attend some sort of pre-school, broadly defined as “including Head Start, private schools, and child care environments.”
3 In 2009 the KDP was replaced with the Revised Alaska Developmental Profile (RADP), which is aligned with the state’s Early Learning Guidelines adopted in 2006. 4 This language is from the Implementation Guide for the Revised Alaska Developmental Profile; similar language was in the guide for the old KDP. www.eed.state.ak.us/tls/Assessment/DevelopmentalProfile/Fall09/Implementation%20Guide_Sept08_2009.pdf

4
Table 1. 2007-2008 Developmental Profile Statewide Results
Yes Developing No PHYSICAL WELL-BEING appears physically well
nourished, well rested, and dressed for the environment 97% 3% FINE MOTOR DEVELOPMENT cuts with scissors, strings beads, uses crayon comfortably, stacks blocks 74% 22% 4%
Physical Well Being and Motor
Development GROSS MOTOR DEVELOPMENT hops on one foot, balances while walking on a line on floor, walks and
runs with ease 80% 15% 4% SPEAKING Communicates needs, wants, or thoughts
in his/her own primary language 79% 15% 6% LISTENING follows simple two-step directions 65% 26% 8%
EMERGENT READING orally retells a familiar story, knows print carries the message in a picture book 58% 29% 13%
Language and Literacy Development
EMERGENT WRITING draws pictures or symbols to tell a story 43% 46% 10%
SOCIAL DEVELOPMENT plays and works cooperatively with others, adapts to activity changes 76% 18% 6% Personal
Social Development
APPROACHES TO LEARNING shows eagerness and curiosity as a learner, sustains attention in learning
experiences 73% 22% 5% PROBLEM SOLVING identifies problems and seeks solutions while playing with objects such as sand and
water, blocks, construction toys 55% 33% 11% Thinking and Cognitive
Development NUMBER CONCEPTS understands sequence of turn taking in games such as Candy Land, divides materials
to use with a friend 65% 24% 10% ATTENDED PRESCHOOL preschool experiences can happen in many configurations including Head Start,
private schools, and child care environments 66% 31% HEALTH DATA has health file that goes beyond State requirements (e.g., includes dental or physical exam) 57% 41%
Child Background
Individualized Education Plan (IEP) child has IEP 10% 89% Number of records submitted 8934
Yes: the indicators describe the child’s routine behavior Developing: the child exhibits some of the behaviors some of the time No: the child does not yet routinely exhibit these behaviors How well prepared are children entering Alaska’s schools? While few children rate “no” in physical well-being and social development areas, about one in ten children doesn’t demonstrate each of the skills in language and literacy development and thinking and cognitive development. Many more—typically between 20% and 50%—show these behaviors only “inconsistently.” Furthermore, the statewide results mask wide variations between districts. There are many districts where more than one-third of entering students don’t have some of the readiness abilities, and a few where 60% or more don’t. Those districts lose valuable time trying to catch children up, and some children never do catch up. The statewide results have varied by only a few percentage points over the last five years, with no evident trends.

5
Alaska provides early learning opportunities for children who qualify for special education, and the state also supplements funding for federal Head Start programs. Elsewhere in the country, 38 states have state-funded pre-kindergarten programs serving 4-year-olds and 26 of those state programs also serve 3-year-olds.5 So Alaska is one of 12 states with no state-funded early childhood programs. Even so, Alaska’s many Head Start programs mean that Alaska ranks 20th nationally in the percentage of 3-year-olds enrolled in either state funded pre-K, special education, or Head Start, and 37th in the percent of 4-year-olds enrolled. It’s difficult to tell if Alaska’s rural Head Start programs are effective at preparing children for school. Some rural districts whose communities are served by Head Start programs have developmental profile results that are similar to the state average. For example, Dillingham, whose results are reported only approximately, has “better than 90% yes/developing, less than 10% no” across the profile. Yupiit district, with its three communities all served by Head Start programs, has some areas of strength—88% attended pre-school, 90% or more appear physically healthy—but others are problematic. Half of the 34 children assessed in the fall of 2007 did not show emergent writing skills,6 and fewer than 25% showed problem solving skills, either consistently or intermittently. There is little research on what approaches and programs are most effective for Alaska Native children, and it’s not clear to what extent (if any) Head Start grantees, who are almost all Alaska Native organizations, coordinate with their school districts. Districts report their developmental profile results to the state without individually identifying information. While this is in keeping with the main goal of the profile as a tool for teachers and parents, it means there is no way to disaggregate the data by student characteristics such as ethnicity, gender, or socio-economic status. With these limitations, it’s not useful as a tool to track efforts to improve Alaska children’s school readiness, or to explore the effectiveness of different programs.
5 The State of Preschool 2007, Barnett, et. al., 2007. 6 For example, “draws pictures or symbols to tell a story”.

6
High School Graduation to College and Work When Alaska students graduate from high school, are they prepared to enter college or go to work? There’s much more systematic information on the first question than the second, and those data indicate that many high-school graduates lack adequate preparation for college-level work. However, even within Alaska, what constitutes “ready” can differ between institutions. The majority of Alaska students who enroll in college within the state go to one of the University of Alaska’s three major academic units: University of Alaska Fairbanks, University of Alaska Anchorage, or University of Alaska Southeast. All three require that students demonstrate they are prepared for introductory level courses in English and math—either through previous test scores (such as the SAT) or placement tests offered by the university. Unprepared students are directed into “developmental” courses, many of which don’t count toward a degree. Table 2 shows the course title and description for the lowest level English and math courses that count toward general education requirements at each campus; Tables 3 and 4 show (in abbreviated form) testing requirements to place into those courses. While some of the introductory-level course content and placement requirements are similar across all these institutions, others are quite different.
Table 2. Placement Requirements for Introductory-Level Courses, University of Alaska English Math
UAF
ENGL F111X Introduction to Academic Writing Instruction and practice in written inquiry and critical reading. Introduction to writing as a way of developing, exploring and testing ideas. Concentration on research methods and techniques.
MATH F107X Functions for Calculus A study of algebraic, logarithmic, and exponential functions; sequences and series; conic sections; and as time allows, systems of equations, matrices and counting methods. A brief review of basic algebra in the first week prepares students for the rigor expected. The primary purpose of this course, in conjunction with MATH F108, is to prepare students for calculus.
UAA
ENGL A111 Methods of Written Communication Instruction in composition of expository essays with emphasis on different techniques for organization and development. Documented paper required. Readings in some sections may be coordinated with another discipline.
MATH A107 College Algebra Covers equations and inequalities, function theory, solution of equations greater than second degree, determinants and matrices, systems of equations and inequalities, exponential and logarithmic function, graphs and equations of conic sections, including applications of all these topics; binomial theorem; sequences and series; mathematical induction and combinatoric notation.
UAS
ENGL S111 Methods of Written Communication Instruction is on techniques of essay organization and development, research, and analytical reading and writing. Critical analysis and research papers are required.
MATH S107 College Algebra A detailed study of linear, quadratic, rational, radical, exponential and logarithmic functions; operations on and applications of these functions, and selected topics from algebra.

7
Table 3. Prerequisites for Introductory English, University of Alaska Campuses Campus ACT SAT Accuplacer* Other UAF 17 430 Not mentioned COMPASS (52)
ASSET (45) HS GPA 3.0 or higher and permission
UAA 22 530 180 combined reading and sentence skills, including at >=85 reading,
>=95 sentence skills
UAS n/a n/a 454 combined essay, reading, sentence skills, including
>=92 in both reading and sentence skills
Not mentioned
*Accuplacer scoring is not a simple cut-off score, but rather a set of minimum total score and subtest scores, simplified here for comparison.
Table 4. Prerequisites for Introductory Mathematics, University of Alaska Campuses Campus ACT SAT Accuplacer Other UAF 23 540 Not mentioned COMPASS: Algebra 50;
College Algebra 76 ASSET: College Algebra 23; Intermediate Algebra 41
UAA 22 520 College Math 50 Not mentioned UAS n/a n/a College Math 63 Not mentioned Two issues emerge from these tables. First, the information is neither easy to find nor interpret. UAA puts placement test information in its course schedules, but interpreting what is required, especially for Accuplacer into English 111, can be complicated. UAS doesn’t publish its cutoff scores anywhere that’s easy to find. UAF cutoff scores are available—in the faculty handbook. The other notable difference is in SAT/ACT scores for entry into English 111 in Anchorage and Fairbanks: SAT of 540 vs. 430, ACT of 22 vs. 17. At UAA, students must score a bit above the mean (about 59th percentile), while the UAF scores are in the 20th to 30th percentile range. Students, parents, and schools trying to ensure that graduates are ready for college English will face confusing standards, difficult to find and interpret, and differing from one institution to another. The requirements for math are fairly straightforward—but they are well beyond what many high-school students take, and certainly beyond most districts’ graduation requirements. Patterns of Developmental Course-Taking7 Data available at UAA allow us to see how many entering students were unprepared in either math or English. Among recent high-school graduates enrolling in UAA for the first time, almost 60% took at least one developmental course; almost one-quarter took more than 6 credits of 7 Note that in the compilation of placement requirements in the previous section, Math 107 is considered the first college-level math course; in this analysis, Math 105, while one level lower than Math 107 and roughly equivalent to High School Algebra II, is not considered a developmental course. While Math 105 does not meet the Quantitative Skills (or equivalent) university General Education Requirement, it does provide elective credit toward a degree.

8
developmental courses. About half of recent entering high-school graduates took at least one developmental math course, and about one-third took at least one English course. For this analysis, we defined cohorts of students who enrolled at UAA for the first time in the fall semester of each of 10 years, 1998 through 2007. This included all students whose first UAA enrollment was in one of those ten semesters—both full- and part-time, and both degree-seeking and non-degree seeking students. Within those cohorts, we focused on recent high-school graduates, defined as those who had graduated from high school either the same year as their UAA enrollment, or one year earlier. Thus, students entering in fall semester 2007 were considered recent high-school graduates if they had graduated in 2007 or 2006; those who entered in fall 2006 were recent graduates of they had graduated in 2006 or 2005, and so on. Over the 10-year sample, just over 40% of entering students were recent high-school graduates; that share has been increasing, from just under 40% in the late 1990s to almost 50% by 2007. Within recent high-school graduates, we looked at Alaska Natives and non-Natives, men and women, and those who had graduated from urban and rural Alaska high schools. Ethnicity was self-reported. Urban graduates were those whose high schools were in the Anchorage, Fairbanks, Juneau, Mat-Su, or Kenai Peninsula school districts; graduates from all other districts were classified as rural. Table 5 shows how many students were in each group over the 10-year period, and the average high school GPA. Notably, all but one of these groups averaged 3.0 or better high school GPAs.
Table 5. Students Enrolling in UAA for the First Time, Fall 1998 through Fall 2007 Number Avg HS
GPA All Entering Students 37,090 3.01 Recent High-School Graduates 15,713 3.09 Recent High-School Graduates by: Gender
Males 6,742 2.96 Females 8,943 3.18
Ethnicity Alaska Native 1,698 3.05 White 10,308 3.12 Other 3,707 3.02
High-School Location* Urban Alaska 10,018 3.07 Rural Alaska 3,286 3.18
*About 15% of recent high-school graduates were from other states or other countries, or the locations of their high schools were unknown.

9
For each group, we looked at the number of developmental credits they had taken: none, 1 to 6 credits, or more than 6 credits. We also looked at the type of developmental courses students took, grouping students into those who took both math and English courses, math only, or English only. A few students—about 1% of the sample—took only “other” developmental courses, such as study skills. Chart 1 and Table 6 show the results of this analysis. Recent high-school graduates were more likely than entering students overall to enroll in developmental courses, probably because the group of entering students who are not recent high-school graduates includes those who are enrolling for one or two courses with no pre-requisites, are transfer students, or are professionals enrolling for continuing education.
Chart 1.

10
Table 6. Developmental Course-Taking Patterns of UAA Students Enrolling for the First Time, Fall 1998 through Fall 2007
Number of Students
Percent of students taking
No
development courses
1 to 6 credits More than 6 credits
All 37,090 56.6% 28.4% 15.0% Recent HS Grads* 15,713 39.0% 37.6% 23.4% Female recent HS grads 8,943 36.2% 38.1% 25.7% Male recent HS grads 6,742 42.7% 37.0% 20.4% Ak Native recent HS grads 1,698 24.0% 38.8% 37.2% Non-native recent HS grads 14,015 40.8% 37.5% 21.7% Recent HS grads Urban Dists 10,018 39.1% 37.4% 23.5% Recent HS grads Rural Dists 3,286 34.0% 40.3% 25.7%
*Students who graduated from high school the same year or one year before enrolling at UAA. Among recent high-school graduates, young men were somewhat less likely to take developmental courses than young women, and to take fewer credits if they did. This may mean that men did better on placement tests (despite their slightly lower GPAs), that they disproportionately enrolled in programs that don’t require college-level English or math (e.g., certificate programs in vocational fields), or that they were more likely to find ways around enrolling in recommended developmental course work—such as getting the professor’s permission for the college-level course. Alaska Natives were about 30% more likely than non-Natives to take at least one developmental course, and about 70% more likely to be taking more than 6 credits of developmental work. Graduates of rural high schools were only slightly more likely—about 8%—to take developmental courses than were graduates of urban high schools. Table 7 and Charts 2 through 4 show how successful these students were in their developmental course work – what percentage of courses did they pass? It’s important to remember that the success rates are for the student, not the type of course. The success rate in the “only English” column is not the same as the success rate for all students in developmental English courses, but rather the success rate in developmental English for students who took only English. Overall, recent high-school graduates passed just over half the developmental courses they took. Women were more successful than men, and Alaska Natives less successful than non-Natives. Again, there was little difference in the success of students from urban and rural high schools. Students taking only English were usually much more successful than those taking only math. However, graduates of rural high schools taking only math were more successful, and Alaska Natives taking only math were only somewhat less successful than those taking only English. Those taking 1 to 6 credits were more successful than those taking over 6 credits.

11
Table 7. Developmental Course Success for Students Enrolling at UAA Fall 1998 – Fall 2007
Students whose developmental
coursework was: Number of
developmental course credits:
All students in group
Both Math and
English
Only English
Only Math 1 to 6 over 6
All Entering Students 59% 57% 67% 58% 60% 56%
Recent HS Graduates 56% 56% 67% 53% 58% 53%
Female 60% 59% 70% 58% 62% 56%
Male 51% 51% 65% 46% 53% 49%
Alaska Native 45% 46% 47% 43% 45% 46%
Non-native 58% 58% 70% 54% 60% 55%
Urban Alaska High Schools 57% 57% 71% 52% 59% 53%
Rural Alaska High Schools 55% 52% 56% 57% 57% 51%
Chart 2

12
Chart 3
Chart 4
56%
67%
53%
58% 53
% 56%
0% 10%
20%
30%
40%
50%
60%
70%
80%
Both Math and English Courses Only
English Courses Only Math Courses 1 to 6
credits over 6 credits All who
took developmental course
s Student took...
Success Rates of All Recent High School Graduates in Developmental Courses by Type and Number and Courses
Taken

13
Work Readiness of Alaska High-School Graduates Alaska’s students may graduate from high school unprepared for today’s careers, just as many graduate unprepared for college. While there are no comprehensive data for the state, employers often report that they can’t find qualified applicants for their openings. They also say that many of today’s technical careers require as much mathematics or writing as entry-level college work. A 2003 report on the status of vocational education in Alaska reported that as accountability mandates and high states testing were instituted between 1997 and 2003, the resources available for and participation in career and technical education in secondary schools declined. 8 Even though there are no systematic data on how ready Alaska high-school graduates are for work, concerns voiced by employers, teachers, and others have led to the creation of the Alaska Career Ready program. This joint program of the departments of Labor and Education and Early Development aims “to give Alaska students and job-seekers 1) knowledge of the skill levels required for entry into careers and post-secondary training; 2) a way to increase their skill levels, and 3) a way to demonstrate to an employer, apprenticeship program, technical school, college, university, or other training provider, that they have mastered the basic foundational skills required by virtually all careers and post-secondary programs.” 9 The program makes workplace skill assessments and on-line training software keyed to those skills available to job seekers and students throughout the state. The assessments are the ACT’s WorkKeys10 assessments, and students can earn a Career Ready Certificate from ACT by scoring well enough on the Applied Math, Reading for Information, and Locating Information assessments. Those three assessments will be required of all Alaska 11th graders starting in the 2010/2011 school year— so eventually this program will also provide one measure of how ready Alaska high-school students are for today’s careers. However, the data currently available cover too few students to be generalizable.
Do We Expect High-School Graduates to be Ready for College or Careers? We’ve seen that a lot of the young people who graduate from Alaska’s school system don’t seem to be ready to go to college or to start work. But do we expect them to be? Alaska’s state standards in English and math stop at the 10th grade level; science includes 11th grade. The High School Graduation Qualifying Examination (HSGQE) is also the 10th grade level Standards-Based Assessment. Most districts require, in addition to the HSGQE, a certain number of courses in particular areas, without specifying the level of those courses. The published high-school graduation requirements of the districts we reviewed (Anchorage, Bristol Bay, Aleutians East, Lake and Peninsula, Northwest Arctic, North Slope, and Chugach) didn’t make it clear to what extent districts require students to meet standards beyond the 10th grade level for graduation. This study was too small to undertake a comprehensive review of these questions across Alaska’s 53 districts, but we were able to interview superintendents of four districts (Chugach, Aleutians East, Lake and Peninsula, and Bristol Bay) and four principals in two of those districts. We asked them about their expectations for 11th and 12th graders, and whether they expected their graduation requirements to ensure graduates would be prepared for post-secondary education, job training, or work.
8 Vocational Education Status Report, 2003 Update, prepared for the Alaska Workforce Investment Board by Madden Associates 9 http://www.careerready.alaska.gov/faq.html 10 http://www.act.org/workkeys/overview/
14
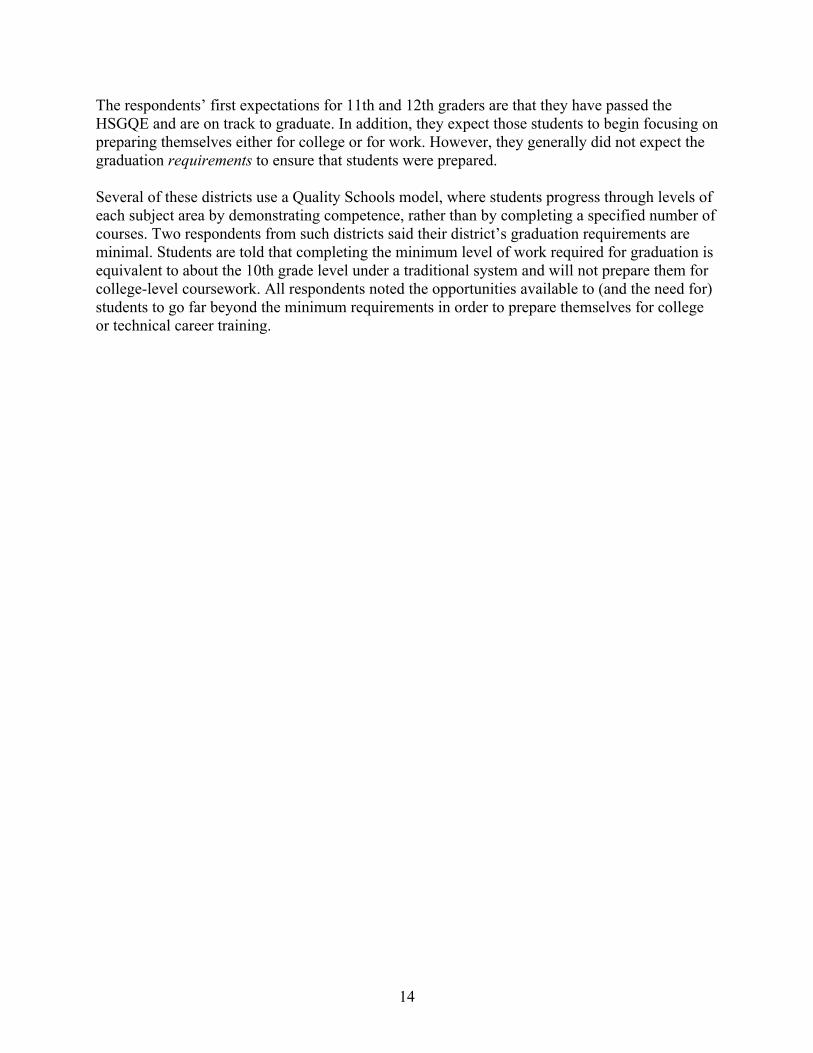
The respondents’ first expectations for 11th and 12th graders are that they have passed the HSGQE and are on track to graduate. In addition, they expect those students to begin focusing on preparing themselves either for college or for work. However, they generally did not expect the graduation requirements to ensure that students were prepared. Several of these districts use a Quality Schools model, where students progress through levels of each subject area by demonstrating competence, rather than by completing a specified number of courses. Two respondents from such districts said their district’s graduation requirements are minimal. Students are told that completing the minimum level of work required for graduation is equivalent to about the 10th grade level under a traditional system and will not prepare them for college-level coursework. All respondents noted the opportunities available to (and the need for) students to go far beyond the minimum requirements in order to prepare themselves for college or technical career training.

15
Summary and Recommendations Reviewing the national research and the available data on Alaska, we see that:
• Up to one-third of Alaska’s children enter the public schools with no pre-school experience
• In some school districts, more than half the entering children don’t display all the measures of school readiness educators expect to see, even some of the time
• Research predicts that these students are more likely to need special education services while in school and more likely to drop out before completing high school
• In the districts where we talked to school administrators, students need to go beyond high-school graduation requirements to be prepared for college or technical training
• Many of Alaska’s high-school graduates who do enroll in college find they are not prepared for college-level work
• Employers report they find many recent high-school graduates unprepared to embark on careers
To address these problems effectively will require coordinated efforts among key stakeholders—parents, educators, policymakers, and researchers. One approach that many states are using is a P-16 council—that is, a council that brings together stakeholders from all levels of education, from pre-school through college. As of June 2006, 30 states had some form of formal P-20, P-16, or K-16 organization. While the specific membership, funding structures, and goals differ, such organizations typically aim to: 11 • Expand access to early learning for children ages 3 to 5 and improve their readiness for
kindergarten • Smooth student transitions from one level of learning to the next • Close the achievement gap between white and minority students • Upgrade teacher education and professional development • Strengthen relationships between families and schools • Create a wider range of learning experiences and opportunities for students in the final
two years of high school • Improve college readiness and college success
In a review of P-16 efforts (Krueger, Carl, The Progress of P-16 Collaboration, April 2006), the Education Commission of the States tracks several states’ successes, including smaller achievement gaps and more as well as more successful advanced placement testing (Georgia), and rising college enrollment (Indiana and Kentucky). To be effective, councils need to work within a shared vision of a P-16 system, commit to long-term efforts, and commit to real change. Venezia (2006) cautions that, “convening a commission and holding cross-system discussions may be helpful, but these steps alone will not create meaningful K-16 reform. To be lasting and effective, the deliberations must be anchored in policy and finance reform and must reflect each state’s culture and history.” Any effort, whether under the umbrella of a P-16 council or not, will have to convene stakeholders, determine what additional data and analyses are necessary, get that additional data, identify potential solutions, and make recommendations for change. This is not a linear process. Previous work in Alaska has already identified some problems and areas of needed research, as well as offering a few recommendations. While there is enough 11 ECS Legislative Primer

16
information to describe these problems in general terms—as we did earlier—there has not been the kind of comprehensive research that would allow us to clearly describe their scope, or to measure the success of efforts to address them. Specifically:
• We need better data on children who enter school unprepared: how many are there, in what areas are they unprepared, what sorts of pre-school experience did they have, and how do they fare in elementary school? The new Revised Alaska Developmental Profile, aligned with the state’s early learning standards, has the potential to provide some of this information, but it was not designed as a program assessment tool.
• We need better information on dropouts. How many students drop out? The data available now—aggregated counts—give no indication of how many students who drop out return to school and graduate, or drop out again without graduating. How many dropouts earn GEDs? Currently, K-12 school data and GED data can’t be easily linked. How many secondary students transfer out of the public school system, and how many of those ultimately drop out, graduate, or earn GEDs? The state’s data system will soon allow for some of these analyses; it has to be in place long enough for students who were 7th graders when the system began to graduate from high school. However, we also need to find a way to link public school student data to GED data.
• We need to understand what teachers expect of their 11th and 12th graders, and how they convey those expectations to students and parents. Do students and parents realize that the minimum graduation requirements will leave graduates unprepared for most post-secondary education and training? For many jobs? Do teachers understand what students need to succeed in college-level work?
• We need to consider how to collect data about the success of our high-school and college graduates. If we want to hold high schools and universities accountable for preparing their students for work or further education, we must be able to measure how well they do so. Currently, the state is creating an excellent data system for tracking students in the public schools—from entry through high-school graduation. It’s difficult to link K-12 data to university data, or university data to workforce data. Issues of privacy and legal limitations on how various data sources may be used present challenges, but they are not insurmountable.
Finally, a few recommendations do emerge from this review. First, Alaska should create publicly funded, high-quality early childhood education opportunities for all families who want them. By funding early childhood programs, the state could expand enrollment and help ensure that programs actually did prepare students for kindergarten and first grade. Investment in school readiness would save money in the K-12 system and beyond. Next, we need to ensure that our high-school graduates are prepared for college or careers. Whether this should be through more rigorous high-school graduation requirements, better counseling, increased investments in career and technical education, or some combination of these and other approaches is not clear. But we can’t leave so many of our high-school graduates unprepared for life.

17
Third, the University of Alaska should be involved in those efforts. UAF, UAS, and UAA should coordinate their efforts to communicate university expectations clearly to high-school students, their parents, and teachers. They should also align their expectations for incoming freshmen with each other, so that students know what to expect, regardless of which campus they attend. Increases in the number and quality of distance-education offerings mean that students anywhere in the state make take classes—especially general freshman and sophomore classes—from any campus. They should be able to do so without suddenly finding that they’re not prepared. Finally, the state should consider how to support these efforts and ensure that they have the political strength to overcome the inevitable difficulties—and that they persist long enough to accomplish the needed reforms.

18
References Barnett, W. Steven, Hustedt, J. T., Friedman, A. H., Boyd, J. S., and Ainsworth, P. (2007), The
State of Preschool 2007,National Institute for Early Education Research, New Brunswick, NJ.
Bueschel, A. and Venezia, A. (2006). Local pathways and statewide policies aligning standards and curricula. New Directions for Community Colleges, 2006(135), 29-38.
Burkam, D. and Lee, V. (2002). Inequality at the Starting Gate: Social Background Differences in Achievement as Children Begin School. Washington, D.C: Economic Policy Institute.
Callan, P., Finney, J., Kirst, M., Usdan, M. & Venezia, A. (2006). Claiming common ground: State policymaking for improving college readiness and success. National Center for Public Policy and Higher Education. San Jose, CA.
Casner-Lotto, J, et al., Are they Really Ready to Work? Employers’ Perspectives on the Basic Knowledge and Applied Skills of New Entrants to the 21st Century U.S. Workforce, (2006). The Partnership for 21st Century Skills, Tucson, AZ.
Education Commission of the States. (2008). Early Learning, Brain Research. Retrieved October 14, 2008, from http://www.ecs.org/ecsmain.asp?page=/html/IssueCollapse.asp
Fulton, M. (1996). ABCs of Investing in Student Performance. Education Commission of the States. Denver, CO. ERIC Clearinghouse on Teaching and Teacher Education. (ERIC Document Reproduction Service No. 402652).
High Scope Educational Research Foundation. (2008). High/Scope Perry Preschool Study. Retrieved October 15, 2008, from http://www.highscope.org/Content.asp?ContentId=219
Jobs for the Future. (2006). Smoothing the Path: Changing State Policies to Support Early College High School. Case Studies from Georgia, Ohio, Texas, and Utah. Early College High School Initiative. Boston, MA.
Parks, G. (2000). The High/Scope Perry Preschool Project. Retrieved October 15, 2008, from http://www.ncjrs.gov/pdffiles1/ojjdp/181725.pdf
Schweinhart, L.J., H.V. Barnes, and D.P. Weikart. (1993). Significant Benefits: The High/Scope Perry Preschool Study through Age 27. (Monographs of the High/Scope Educational Research Foundation, 10). Ypsilanti, MI: High/Scope Press. PS 021 998.
Schweinhart, L.J. (1994). Lasting Benefits of Preschool Programs. ERIC Digest. ERIC Clearinghouse on Elementary and Early Childhood Education, Urbana IL. ERIC Identifier: ED365478. http://www.ericdigests.org/1994/lasting.htm
Shonkoff, J. & Phillips, D. (Eds.). (2000). From neurons to neighborhoods: the science of early childhood development. Retrieved October 15, 2008, from http://www.nap.edu/openbook.php?record_id=9824&page=R20
Slavin, R., Karvweit, N., & Wasik, B. (Eds.). (1992). Preventing early school failure. Boston: Allyn and Bacon.

19
Thompson, L., Tullis, T., Franke, T., & Halfon, N. (2005). Critical pathways to school readiness: Implications for First Five Ventura County Strategic Planning, Funding, and Evaluation. Los Angeles, CA: UCLA Center for Healthier Children, Families, and Communities.
U.S. Department of Education. (1997). Mathematics Equals Opportunity. Retrieved October 15, 2008, from http://www.ed.gov/pubs/math/index.html
Van de Water, G. & Rainwater, T. (n.d.). What is P-16? A primer for legislators – A practical introduction to the concept, language and policy issues of an integrated system of public education. Denver, CO: Education Commission of the States.
Venezia, A. (2006). Levers for change: Steps states can take to improve students’ college readiness. The Journal of the New England Board of Higher Education, 20(4), 16-18.
Venezia, A., Finney, J., and Callan, P. (2007) Chapter 3: “Common Ground,” in Minding the Gap. Hoffman, Vargas, Venezia, Miller, Eds. Harvard Education Press.