
Alignment, Morphology and Defect Control of Vertically ... · and amine capping aspects balance and...
30
Alignment, Morphology ZnO Nanorod array: C ‘stabilizer’ roles of the Kugalur Shanmugam Ranjith, a R Thangavelu Rajendrakumar* a, d Abstract We show that the mor defect and alignment of vertically one dimensional (1D) ZnO nanor arrays grown using an aqueous method could be effectively contr simply varying the hexamine conc in the growth solution. Lower concentration (0.2 M) resulted in r aligned ZnO NRs with non diameters. Increasing the concentration (to 1.0 M) yield aligned, prismatic ZnO NR a uniform NR diameters of 80 nm a amine concentration (> 1M) and thi (CA) measurements show increase due to improvement in alignment o studies revealed that increases in am concentration and influences both revealed that the amine acts both a release for ZnO formation and cap grown along the [002] direction. Th amine facilitates the morphology, a concentrations, the role as surfactan growth due to the slow release of Z and amine capping aspects balance higher amine concentrations, the su over the surfactant capping asp y and Defect Control of Vertically Competition between ‘surfactant’ a amine species in aqueous solution Ramanathaswamy Pandian, b Enda McGlynn c and rphology, y aligned rod (NR) solution rolled by centration r amine randomly uniform e amine ded well arrays with along the NR length. 1D growth ceases on further is favors the formation of 2D platelet like structures es in CA from 83º to 145º with increases in amine of the ZnO NR array. Low temperature (10 K) phot mine concentration (0.2 to 1M) increases the optical free and bound exciton emissions from ZnO NRs. as a growth stabilizer and a surfactant and thus co ps non-polar planes, the latter function facilitating he competition between the ‘stabilizer’ and ‘surfacta alignment and defect control of 1D ZnO NR array. nt dominates over that of stabilizer which does not Zn to form ZnO. On increasing the amine concentrat and this results in uniform and aligned growth of NR udden release of Zn generates an overshoot effect, w pect, thus favoring the growth of irregular m y aligned and n growth Ramasamy r increasing the s. Contact angle concentrations toluminescence lly active defect . Investigations ontrols both Zn 1D anisotropic ant’ roles by the . At low amine t favor uniform tion, Zn release R arrays. At the which dominates micro platelets. Page 1 of 30 ACS Paragon Plus Environment Crystal Growth & Design 1 2 3 4 5 6 7 8 9 10 11 12 13 14 15 16 17 18 19 20 21 22 23 24 25 26 27 28 29 30 31 32 33 34 35 36 37 38 39 40 41 42 43 44 45 46 47 48 49 50 51 52 53 54 55 56 57 58 59 60
Transcript of Alignment, Morphology and Defect Control of Vertically ... · and amine capping aspects balance and...

Alignment, Morphology and Defect Control of Vertically aligned
ZnO Nanorod array: Competition between ‘surfactant’ and
‘stabilizer’ roles of the amine species in aqueous solution growth
Kugalur Shanmugam Ranjith, a Ramanathaswamy Pandian,
Thangavelu Rajendrakumar*a, d
Abstract
We show that the morphology,
defect and alignment of vertically
one dimensional (1D) ZnO nanorod (NR)
arrays grown using an aqueous solution
method could be effectively controlled by
simply varying the hexamine concentration
in the growth solution. Lower amine
concentration (0.2 M) resulted in randomly
aligned ZnO NRs with non uniform
diameters. Increasing the amine
concentration (to 1.0 M) yielded well
aligned, prismatic ZnO NR arrays with
uniform NR diameters of 80 nm along the NR length. 1D growth ceases on further increasing the
amine concentration (> 1M) and this favors the formation of 2
(CA) measurements show increases in CA from 83º to 145º with increases in amine concentrations
due to improvement in alignment of the ZnO NR array. Low temperature (10 K) photoluminescence
studies revealed that increases in amine concentration (0.2 to 1M) increases the optically active defect
concentration and influences both free and bound exciton emissions from ZnO NRs.
revealed that the amine acts both as a growth stabilizer and a surfactant and th
release for ZnO formation and caps non
grown along the [002] direction. The competition between the ‘stabilizer’ and ‘surfactant’ roles by the
amine facilitates the morphology, alignment and defect control of 1D ZnO NR array. At low amine
concentrations, the role as surfactant dominates over that of stabilizer which does not favor uniform
growth due to the slow release of Zn to form ZnO. On increasing the amine concentration,
and amine capping aspects balance and this results in uniform and aligned growth of NR arrays. At the
higher amine concentrations, the sudden release of Zn generates an overshoot effect, which dominates
over the surfactant capping aspect, thus
Alignment, Morphology and Defect Control of Vertically aligned
ZnO Nanorod array: Competition between ‘surfactant’ and
‘stabilizer’ roles of the amine species in aqueous solution growth
Ramanathaswamy Pandian,b Enda McGlynn
c and
We show that the morphology,
defect and alignment of vertically aligned
nanorod (NR)
arrays grown using an aqueous solution
method could be effectively controlled by
simply varying the hexamine concentration
in the growth solution. Lower amine
concentration (0.2 M) resulted in randomly
aligned ZnO NRs with non uniform
s. Increasing the amine
concentration (to 1.0 M) yielded well
aligned, prismatic ZnO NR arrays with
uniform NR diameters of 80 nm along the NR length. 1D growth ceases on further increasing the
amine concentration (> 1M) and this favors the formation of 2D platelet like structures.
(CA) measurements show increases in CA from 83º to 145º with increases in amine concentrations
due to improvement in alignment of the ZnO NR array. Low temperature (10 K) photoluminescence
reases in amine concentration (0.2 to 1M) increases the optically active defect
concentration and influences both free and bound exciton emissions from ZnO NRs.
revealed that the amine acts both as a growth stabilizer and a surfactant and thus controls both Zn
release for ZnO formation and caps non-polar planes, the latter function facilitating 1D anisotropic
grown along the [002] direction. The competition between the ‘stabilizer’ and ‘surfactant’ roles by the
gy, alignment and defect control of 1D ZnO NR array. At low amine
concentrations, the role as surfactant dominates over that of stabilizer which does not favor uniform
growth due to the slow release of Zn to form ZnO. On increasing the amine concentration,
and amine capping aspects balance and this results in uniform and aligned growth of NR arrays. At the
higher amine concentrations, the sudden release of Zn generates an overshoot effect, which dominates
over the surfactant capping aspect, thus favoring the growth of irregular micro platelets.
Alignment, Morphology and Defect Control of Vertically aligned
ZnO Nanorod array: Competition between ‘surfactant’ and
‘stabilizer’ roles of the amine species in aqueous solution growth
Ramasamy
uniform NR diameters of 80 nm along the NR length. 1D growth ceases on further increasing the
D platelet like structures. Contact angle
(CA) measurements show increases in CA from 83º to 145º with increases in amine concentrations
due to improvement in alignment of the ZnO NR array. Low temperature (10 K) photoluminescence
reases in amine concentration (0.2 to 1M) increases the optically active defect
concentration and influences both free and bound exciton emissions from ZnO NRs. Investigations
us controls both Zn
polar planes, the latter function facilitating 1D anisotropic
grown along the [002] direction. The competition between the ‘stabilizer’ and ‘surfactant’ roles by the
gy, alignment and defect control of 1D ZnO NR array. At low amine
concentrations, the role as surfactant dominates over that of stabilizer which does not favor uniform
growth due to the slow release of Zn to form ZnO. On increasing the amine concentration, Zn release
and amine capping aspects balance and this results in uniform and aligned growth of NR arrays. At the
higher amine concentrations, the sudden release of Zn generates an overshoot effect, which dominates
favoring the growth of irregular micro platelets.
Page 1 of 30
ACS Paragon Plus Environment
Crystal Growth & Design
123456789101112131415161718192021222324252627282930313233343536373839404142434445464748495051525354555657585960

Understanding the role of amine in the growth of 1D ZnO NR arrays holds great promise for tailoring
ZnO NR functionalities for various potential applications.
Page 2 of 30
ACS Paragon Plus Environment
Crystal Growth & Design
123456789101112131415161718192021222324252627282930313233343536373839404142434445464748495051525354555657585960

1
Alignment, Morphology and Defect Control of Vertically aligned ZnO
Nanorod array: Competition between ‘surfactant’ and ‘stabilizer’ roles
of the amine species and its Photocatalytic properties
Kugalur Shanmugam Ranjith,a
Ramanathaswamy Pandian,b
EndaMcGlynnc
and Ramasamy
Thangavelu Rajendra kumar*a, d
aAdvanced Materials and Devices Laboratory, Department of Physics, Bharathiar University, Coimbatore, India. Fax:
(91)422-2422387Tel: 9894865562; E-mail: [email protected]
b Surface and Nanoscience Division, Materials Science Group, IGCAR, Kalpakkam, India. Fax:(91)42-27480081; Tel:
(91) 44 27480500; E-mail: [email protected]
cSchool of Physical Sciences, National Centre for Plasma Science & Technology, Dublin City University, Glasnevin,
Dublin 9, Ireland. Fax: ++353 1 7005384; Tel: ++353 17005387; E-mail: [email protected]
d Department of Nanoscience and Technology, Bharathiar University, Coimbatore, India. Fax: (91)422-2422387; Tel:
9789757888; E-mail: [email protected]
Abstract
We show that the morphology, defect and alignment of vertically aligned one dimensional (1D) ZnO
nanorod (NR) arrays grown using an aqueous solution method could be effectively controlled by
simply varying the hexamine concentration in the growth solution. Lower amine concentration (0.2
M) resulted in randomly aligned ZnO NRs with non-uniform diameters. Increasing the amine
concentration (to 1.0 M) yielded well aligned, prismatic ZnO NR arrays with uniform NR diameters
of 80 nm along the NR length. 1D growth ceases on further increasing the amine concentration (>
1M) and this favors the formation of 2D platelet like structures. Contact angle (CA) measurements
show an increase in CA from 83º to 145º with an increase in amine concentrations due to
improvement in alignment of the ZnO NR array. Low temperature (10 K) photoluminescence studies
revealed that increase in amine concentration (0.2 to 2M) increases the optically active defect
concentration and influences both free and bound exciton emissions from ZnO NRs. Investigations
revealed that the amine acts both as a growth stabilizer and a surfactant and thus controls both Zn
release for ZnO formation and caps non-polar planes, the latter function facilitating 1D anisotropic
grown along the [002] direction. The competition between the ‘stabilizer’ and ‘surfactant’ roles by
the amine facilitates the morphology, alignment and defect control of 1D ZnO NR array. At low
Page 3 of 30
ACS Paragon Plus Environment
Crystal Growth & Design
123456789101112131415161718192021222324252627282930313233343536373839404142434445464748495051525354555657585960

2
amine concentrations, the role as surfactant dominates over that of stabilizer which does not favor
uniform growth due to the slow release of Zn to form ZnO. On increasing the amine concentration,
Zn release and amine capping aspects were balanced and this result in uniform and aligned growth of
NR arrays. At the higher amine concentrations, the sudden release of Zn generates an overshoot
effect, which dominates over the surfactant capping aspect, thus favoring the growth of irregular
micro platelets. 1D, well aligned, prismatic, ZnO NR arrays grown at an amine concentration of 1M
show higher photocatalytic degradation activity for the degradation of Methylene Blue dye solution
under UV irradiation owing to both the high surface to volume ratio of the arrays and increased
charge carrier density due to Zn interstitial defects. Zinc interstitials are shallow donors readily
supply electrons to conduction band which could buildup space charge near to the nanocatalayst
surface. The occurrence of band bending associated with the interfacial electric field in the space
charge region could facilitate the separation of photogenerated electrons and holes and thus enhances
the photocatalytic performance. Understanding the role of amine in the growth of 1D ZnO NR arrays
holds great promise for tailoring ZnO NR functionalities for various potential applications
Introduction
ZnO is an environmentally friendly and nontoxic II-VI semiconducting material possessing a high
exciton binding energy of 60meV and a wide band gap of ~ 3.3eV. Recently, researchers have shown
tremendous interest in 1D ZnO nano arrays due to their remarkable physical and chemical properties
[1]. 1D ZnO nanostructural arrays have been extensively studied due to their potential applications
in nanodevices such as sensors [2], solar cells [3], light emitting diodes [4], field effect transistors [5]
and field emitters [6].These nanostructures have large surface area, high aspect ratio, and show
quantum confinement and high electron mobility compared to nanoparticle thin films. Synthesis of
well aligned 1D nanostructured arrays is of great interest because it is an important step towards
realizing nano-optoelectronics devices, which include light emitting diodes and laser diodes. Many
techniques are used to produce vertically aligned 1D ZnO nanostructural arrays, including vapour
phase transport [7], metal organic vapour phase transport [8], thermal evaporation [9], pulsed laser
deposition [10], spray pyrolysis[3], electro chemical deposition [11], hydrothermal [12] and aqueous
solution technique [13]. Among the many methods reported for the growth of ZnO nanostructures,
the aqueous solution technique is simple, cost effective and nanostructures can be obtained at lower
growth temperature, thereby facilitating growth on a wide range of possible substrates with a reduced
cost in terms of process steps. As mentioned above, morphology and defect control of ZnO
Page 4 of 30
ACS Paragon Plus Environment
Crystal Growth & Design
123456789101112131415161718192021222324252627282930313233343536373839404142434445464748495051525354555657585960

3
nanoarrays are important for their applications in optoelectronics. Very few authors have used
hexamine as a surfactant along with growth precursors to control the morphology of ZnO
nanostructures in aqueous solution growth. Control of defects in ZnO nanostructures is also critical
for their applications in optoelectronics. Jingbiao Cui et al.,[11] has reported no role due to amine in
the growth solution for the growth of ZnO structures via electrodeposition. Other reports show that
defect emission from ZnO nanostructures may be controlled by plasma treatment of nanostructures
[14]. Besides plasma treatment, annealing processes in various gas ambients (i.e., O2, H2, N2, etc.)
conditions is also useful for controlling the defect concentration in nanorods [15, 16]. Control on the
defect state play a major role on tune the optoelectronic properties of nanostructures. Rapid progress
in nanotechnology promises few semiconductors as a potential tool on the environmental
remediation applications. Semiconductors such as titanium dioxide (TiO2), zinc oxide (ZnO), iron
oxide (Fe2O3), tungsten oxide (WO3) and cadmium sulphide (CdS) have became popular as a
photocatalyst for degradation of organic pollutance in water and air. Recently the ZnO based
nanostructures has attracted much attention as a photocatalysis on removing the organic dye
pollutance from the water. Although the photocatalytic activity of the ZnO nanostructures toward the
organic molecules have been widely documented, studies on their renewable catalytic properties are
rarely performed and presumably because of the poor recovery of the catalyst for multiple use [17,
18, 19]. Recovery of the ZnO powders after photocatalytic water treatment is tricky/complex but a
necessity. Due to the cost of recovery operations, possible powder loss and to avoid the catalysis
presence in the degraded solution after purification, it is proposed that instead of ZnO nano powders,
ZnO nanostructural arrayed thin films may be used. For water treatment applications, ZnO
nanoarrays might be interesting as dispersion of the catalyst and the catalyst loss will be avoided.
In this work, we highlight the effects of varying hexamine concentration in the precursor-solution on
the growth, morphology and alignment control of ZnO nanorod arrays. We show that increase in
hexamine concentration drastically affects the morphology and defect content of ZnO nanostructures.
On increasing the hexamine concentration, the aspect ratio of ZnO nanorods decreases along while
the optically active defect concentration increases, associated with an increased release rate of Zn
ions in growth solution. We demonstrate that well aligned ZnO NR arrays show higher
photocatalytic activity. And we propose that amine concentration not only plays an important role on
the growth and alignment of the 1D NR arrays, but it also plays a role in the control of their the
defect states and improved the photocatalytic efficiency.
Page 5 of 30
ACS Paragon Plus Environment
Crystal Growth & Design
123456789101112131415161718192021222324252627282930313233343536373839404142434445464748495051525354555657585960

4
Materials and Methods
ZnO nanostructures were synthesized by a low temperature aqueous solution growth method. A ZnO
buffer layer of ~100 nm thickness was coated on glass substrates by dip coating method [20]. For the
growth solution, zinc nitrate hexahydrade Zn(NO3)2.6H2O and hexamine (HMTA) (C6H12N4) were
dissolved in double distilled water and stirred continuously for 15 min in separate beakers. HMTA
solution was added drop wise to Zn(NO3)2 solution and stirred continuously for 20 min to form a
single phase solution. The buffer layer coated substrates were immersed in the growth solution and
maintained at 90°C for 4 hours. After completing the growth process, the substrates with deposited
nanostructures were cleaned twice, with distilled water and ethanol, and baked at 150°C. The molar
ratio between the hexamine and zinc nitrate hexahydrade was varied with the ratios, (0.2:1), (0.5:1),
(0.75:1), (1:1), (1.5:1) and (2:1). X-ray diffraction was used to investigate the crystalline phase of
ZnO nanostructures (Bruker Advanced D8). Plane and cross-sectional images of ZnO nanostructural
arrays were obtained using a field-emission scanning electron microscopy (FESEM). The
photoluminescence (PL) properties of the synthesised nanostructural arrays were investigated by
generating 325-nm line of a HeCd laser operating in the range 80 - 200 mW. The spectra were
recorded at temperatures in the range 10 K using Janis closed cycle helium cryostats. The
luminescence was analysed by a SPEX 0.75 m grating spectrometer equipped with a LN2-cooled
Jobin-Yvon CCD detector for the radiotracer implanted samples, and a Jobin-Yvon iHR320 grating
spectrometer fitted with an Andor Newton EM-CCD detector cooled to -25°C for the uniaxial stress
and normal PL measurements.
Photocatalytic degradation
The photocatalytic activity of the ZnO NR arrays was evaluated using a 9 W of Hg lamp (ZF-1 UV,
Philips, China), setup with strongest emission at ~365nm. The amine:Zn ratio controlled ZnO NR
arrays of dimension 4 cm x 1 cm were immersed in 5 ml of 15 ppm Methylene Blue (MB) dye
solution in a typical quartz container. Quartz container with samples grown with different amine
ratios were placed side by side at the same time and irradiated under UV light at a distance of 10 cm
to minimize heating effects. The catalyst loaded solution was first kept in the dark for 10 minutes to
achieve an absorption/desorption equilibrium between the catalyst and the MB dye molecules. After
UV irradiation the substrate was removed and the dye solution was collected and UV-Vis absorption
analyses were performed using a JASCO V-660 spectrophotometer. After these spectral
measurements, the substrates were placed back into the solutions for further irradiation for periods of
20 min (at which time further UV-Vis absorption analyses were performed) for 200 min in total. The
Page 6 of 30
ACS Paragon Plus Environment
Crystal Growth & Design
123456789101112131415161718192021222324252627282930313233343536373839404142434445464748495051525354555657585960
5
concentration of organic dyes was determined by measuring the absorption intensity at the maximum
absorbance wavelength of the supernatant (for MB = 661 nm). The degradation percentage (η) of the
solutions is defined as follows [21].
1000
0 ×−
=C
CC tη
Co is the initial dye concentration and Ct the dye concentration after an illumination time t (min).
Result and Discussion
Figure 1 shows SEM images of the ZnO nanostructures grown using different amine: zinc nitrate
ratios and the corresponding growth schematic are shown in figure 2. A low amine: Zn concentration
ratio of (0.2:1) results in randomly aligned ZnO 1D nanostructures (figure 1a, figure 2a). The
diameter of the nanorods at their base is around 150 - 200 nm and decreased to 30 nm at their top. On
increasing the hexamine:Zn ratio to (0.5:1), the alignment of nanorod arrays improved (figure 1b)
and the diameter was again found to gradually from their base (100 – 150 nm) to the top (30 nm).
Figure 1c shows the morphology of nanorod arrays grown with amine:Zn ratio of 0.75:1. At this
growth condition, the alignment of the nanorod arrays was further improved and the diameters of the
NRs were nearly constant along their length. By increasing the amine:Zn to 1:1 better control over
the morphology and alignment of the NRs was achieved (Fig. 1d) and well aligned, homogenously
distributed and clearly faceted hexagonal NRs with diameters of 80nm were obtained. Further
increasing the amine:Zn concentration to 1.5:1 resulted in NRs with an inhomogeneous morphology
and diameters (50-150 nm) as shown in figure 1e. Finally, increasing the amine:Zn concentration to
2:1 resulted in the formation of two dimensional nanostructures with platelet/disc-like morphology
(figure 1f).
Figures 3a, 3b & 3c show the cross sectional views of ZnO nanorod arrays grown at amine:Zn ratios
of 0.2:1, 1:1 and 1.5:1, respectively. The concentration of amine plays a critical role on the control
of NR length and the diameter of the nanostructures. On increasing the amine concentration in the
growth solution, the diameter of the NRs increased along with a decrease in the length of the NRs
(Table I). Figure 4 shows the XRD patterns from ZnO nanostructures prepared with different
concentration ratios of amine:Zn. The observed XRD peaks match well with those predicted for
wurtzite ZnO (JCPDS card 36-1451) in all cases (figure 4a). Figure 4b indicates the presence of
(100), (002) and (101) peaks from ZnO nanostructures grown on the seed substrate at low amine:Zn
Page 7 of 30
ACS Paragon Plus Environment
Crystal Growth & Design
123456789101112131415161718192021222324252627282930313233343536373839404142434445464748495051525354555657585960

6
(0.2:1) concentrations. The presence of multiple peaks indicates the random alignment of the nano
structured arrays, consistent with our SEM data. On increasing the amine:Zn concentration, Figures
4c,d,e,f show that the intensity of the (002) plane reflection is increasing relative to other peaks
associated with (100) and (101) planes. This indicates that one dimensional nanostructural growth
occurs preferentially along the c-axis perpendicular to the substrate. Thus on increasing the
amine:Zn up to 1.5:1, the alignment of the ZnO nanorod arrays found to be improved. However,
further increasing the amine:Zn concentration to 2:1 (fig 4g) leads to a reduction in this alignment
and the emergence of other XRD peaks, especially one associated with the (100) plane. This result
shows that the alignment of the nanostructured arrays is strongly influenced by the amine
concentration in the growth solution.
In order to study the surface wettability behaviour of the ZnO NR arrays grown at different amine
ratios, the water contact angle was evaluated for the different ZnO arrays, as shown in figure 5.
Water contact angles from 145° to 36° are obtained for the different amine concentration ratio
samples. A sample is considered to be hydrophobic when it has a contact angle greater than 90° and
hydrophilic when its contact angle is less than 90° [22]. Figure 5 shows the graph and images of
water drops on the surface of the NR arrays grown with different amine concentration ratios. From
figure 5, it can be observed that the NR arrays grown at the lowest amine ratios have a contact angle
of 83°. On increasing the amine ratio to 1:1 the hydrophobicity increased up to a maximum contact
angle of 145°, due to the improvement in NR alignment. At the higher amine concentration ratios the
contact angle reduces and the sample changed to a hydrophilic behaviour, due to the irregular growth
of micro platelet type structures.
Figure 6 shows PL spectra obtained for ZnO nanostructural arrays measured at 10 K. It is interesting
to note that the emission properties of ZnO nanostructured arrays drastically vary with amine
concentration. The sample grown at low amine:Zn (0.2:1) concentration ratios show two distinct
optical emission features (figure 6a). The emission peak centered at 3.25 eV corresponds to the band
edge emission and the broad defect emission peak centered at 2.5 eV originates from defects, most
probably due to oxygen vacancies [23, 24]. On increasing the amine:Zn (0.5:1) concentration (figure
6b) the defect emission is suppressed and band edge emission is shifted to 3.2 eV along with the
appearance of a blue band emission around 2.9 eV probably associated with Zn interstitials [25]. On
further increasing the amine:Zn concentration ratio from 0.75:1 to 2:1 the ratio of Zn interstitial
emission at 2.9 eV to band edge emission at 3.2 eV increases (figure 6c,d,e,f). The samples grown at
Page 8 of 30
ACS Paragon Plus Environment
Crystal Growth & Design
123456789101112131415161718192021222324252627282930313233343536373839404142434445464748495051525354555657585960

7
1.5:1 and 2:1 amine:Zn concentration ratios also both show the broad defect emission centered at 2.5
eV.
The photocatalytic activity of the amine:Zn ratio controlled ZnO NR arrays on glass substrates was
investigated using degradation of MB dye. Time dependent UV irradiation shows that the amine
ratio controlled ZnO NR arrays are highly active as photocatalysts under UV irradiation. The
decomposition efficiency of amine ratio controlled ZnO NR arrays, as well as a bare substrate
sample, on MB is shown in figure 7. The sample without ZnO catalyst, shows a decomposition
efficiency of 10% of MB dye following UV irradiation for 200 min. In the presence of ZnO NR
array catalysts and after UV irradiation of 200 min, the morphology and defect controlled ZnO
nanorod arrays exhibited MB decomposition levels of 80%, 88%, 94%, 95%, 96% and 91% of for
(0.2:1), (0.5:1), (0.75:1), (1:1), (1.5:1) and (2:1) amine:Zn ratio grown ZnO NRs, respectively. The
exponential decay profiles and plots of ln(C/C0) versus time suggest that the photodecomposition
reactions follow a pseudo-first-order rate law [26]. The calculated rate constant for MB
decomposition using these ZnO NR array catalyst samples are 0.007, 0.0136, 0.0155, 0.0163, 0.0182
and 0.0144 min-1
for (0.2:1), (0.5:1) 0.75:1), (1:1), (1.5:1) and (2:1) amine: Zn ratio grown ZnO NRs,
respectively. These results show that the lowest degradation rate is seen for the sample grown with a
(0.2:1) amine:Zn ratio and the sample grown with a (1:1) amine:Zn ratio shows the higher
degradation rate.
Previous reports show that amine has a role as a stabiliser which controls the formation of Zn
complexes followed by release of Zn (equations 1 to 4) in the growth solution [27] and it also
decomposes to form the formaldehyde and ammonia species (equation 5) upon raising the
temperature [17]. Reports also show that amine can be an effective surfactant; being a non-polar
chelating agent it covers the non-polar planes (100) & (110) of ZnO and thus facilitates the growth of
ZnO nanostructures along the [002] axis [11, 28, 29]. J. Cui et al., reported no role due to amine in
the growth solution for the growth of ZnO structures via electrodeposition. However in our case, the
absence of amine in the growth solution resulted in no formation of ZnO nanostructures and this
clearly indicates its active role as a stabiliser for the release of Zn. Table.1 clearly shows the
increase in pH of the growth solution observed before and after ZnO NR growth. This may be due to
the decomposition of amine into formaldehyde and NH3. The increase in amine decomposition
increases ammonia concentration thereby increasing the pH of the growth solution.
Page 9 of 30
ACS Paragon Plus Environment
Crystal Growth & Design
123456789101112131415161718192021222324252627282930313233343536373839404142434445464748495051525354555657585960

8
At a low amine:Zn concentration ratio of (0.2:1), a substantial volume of amine decomposes to form
ammonia compared to the very small fraction left for the release of Zn for the subsequent formation
of ZnO. During NR growth, the amine concentration decreases with time due to decomposition and
thus the rate of Zn release also decreases. This can be seen from the SEM images shown previously,
where the diameter of NRs grown in these conditions is ~ 200 nm at their base and decreases to 20
nm at the tip. Therefore at lower concentrations, amine behaves a weak stabiliser and only a small
fraction of amine is left for ZnO formation. On increasing the amine concentration, a greater fraction
of amine is available for ZnO formation and its stabiliser role is promoted. At an amine:Zn
concentration ratio of 0.75:1 alignment of the NR arrays is found to be improved and the diameters
of the NRs were nearly constant along the length of the NRs, as shown in figure 1c. At an amine:Zn
concentration ratio of 1:1 the role of the amine balances between stabilizer and surfactant, resulting
in the formation of well aligned, prismatic, NRs with uniform diameters. With further increases of
the relative amine concentration, a strong enhancement in the release of Zn in an uncontrolled
manner leads to the formation of 2D disc-like structures rather than 1D NR morphologies. In other
words, the competition between the stabilizer and surfactant roles of the amine dictates the
morphology and alignment of the ZnO NRs.
Zn(NO3)2 + C6H12N4� [Zn(C6H12N4)]2+
+ 2NO3- .......…..(1)
[Zn(C6H12N4)]2+
+ 4OH- ---------- Zn(OH)4
2- + C6H12N4……….(2)
Zn(OH)42-
----------Zn2+
+ 4OH- ………..(3)
Zn2+
+ 2OH- ------ Zn(OH)2------------ZnO + H2O ………..(4)
C6H12N4 + 6H2O ↔ 6CH2O + 4NH3 ............. (5)
It is interesting to note, along with morphology and alignment, that the emission properties of ZnO
nanostructured arrays also vary with their morphology. Our data provides evidence that the relative
amine concentration plays a role in controlling the optically active defect concentration in ZnO NRs
in addition to controlling the NR morphology and alignment. PL analysis revealed that the sample
grown at a low amine:Zn concentration ratio had a dominant defect emission peak centered at 2.5
eV, probably due appearance of a strong green emission is ascribed to the formation of oxygen
Page 10 of 30
ACS Paragon Plus Environment
Crystal Growth & Design
123456789101112131415161718192021222324252627282930313233343536373839404142434445464748495051525354555657585960

9
vacancy defects or antisite defects (OZn). On increasing the amine:Zn concentration ratio, the
oxygen vacancy defect emission was found to be suppressed and a new defect emission around 2.9
eV (probably associated with Zn interstitials) emerges accompanied by change in the detailed
spectral shape of the band edge emission (3.25 eV). This increase in Zn interstitial defects as a
function of amine concentration may be attributed to a greater release of Zn in the growth solution
associated with enhancement of the ‘stabiliser’ role of the amine. The low temperature PL spectrum
for samples with different amine concentration ratios were shown in the figure 6. The fitted peak
position of the FX emission varied from 3.38eV to 3.31 eV as the hexamine concentration was
increased from (0.2:1) to (1.5:1) ratio. It is possible that the defect density is responsible for the
increase in carrier concentration on the ZnO nano arrays. Due to the presence of the high defect
density, the FX emission was totally suppressed in the micro structure arrays grown in high amine
ratio. The interesting fact is that on controlling the amine ratio in the growth solution, the domination
of free excitonic emission was varied. As stated previously, the additional low intensity peak at ~ 2.9
eV has been associated with a transition between a state due to Zn interstials and the valence band
[25]. This association is consistent with our data because the increased Zn interstitial concentration
may be due to the increasing Zn release rate with increasing amine concentration in the growth
solution.
The mechanism behind photocatalytic activity on metal oxides is based on electrons (e-) and holes
(h+) creation upon irradiating the nanocatalysts. When the incident photon energy exceeds the band
gap energy of the nanomaterial, electron-hole pairs are created. These photoexcited electron-hole
pairs reach the surface of the nanoparticles and generate reactive oxygen species (ROS) which is
responsible for degradation of the dye solution [30]. When aqueous ZnO suspension is illuminated
by UV light the conduction band electrons (e-) and valence band holes (h+) are generated. Majority
of the photoexcited electron-hole pairs recombine before reaching to nanocatalyst surface. Surface
defects play a vital role on the enhancement of photocatalyst activity. Oxygen vacancies in ZnO
nanoparticles act as a trap states for photogenerated electrons or holes which prevent the
recombination and enhances the photocatalytic activity [31]. In our case, PL spectra clearly exhibit
that on increasing the amine ratio, zinc interstitial defects were increased (Figure.6). The influence of
zinc interstitials in ZnO nanostructures on the photocatalytic performance is not understood sofar.
Zinc interstitials are shallow donors lie 0.26 eV below the conduction band of ZnO [32-35] readily
supply electrons to conduction band and increases the carrier concentration at the surface of
nanostructures. Increase in carrier concentration at the surface could lead the formation of space
Page 11 of 30
ACS Paragon Plus Environment
Crystal Growth & Design
123456789101112131415161718192021222324252627282930313233343536373839404142434445464748495051525354555657585960

10
charge region near to the nanocatalayst surface [36]. The space charge region could affect energy
band structure and local conductivity at nanocatalyst surface. The space charge formation due to the
accumulation of electrons at nanocatalyst surface may cause downward band bending associated
with the interfacial electric field in the space charge region as shown in the schematics (Figure. 8)
which may facilitate the separation of photogenerated electrons and holes and thus enhances the
photocatalytic behavior. Our results showed that the density of the nanostructures grown at low
amine:Zn concentration ratio (0.2:1) is around 12 NRs/µm2 (Figure. 1) whereas the samples grown
in amine:Zn concentration ratio (0.5:1) to (1.5:1) show higher density in the range of ~ 56 NRs/ µm2
(Figure.1). ZnO nanostructures fabricated at low amine concentration show slower photocatalytic
response due to lower density of ZnO nanostructures. On increasing the amine:Zn concentration
ratio (0.5:1)-(1.5:1), the photocatalytic degradation efficiency found to be enhanced with the increase
of Zn interstitials. The micron scale platelets grown at high amine ratio (2:1) exhibit slow
photocatalytic degradation due to their low surface to volume ratio.
Conclusions
We have demonstrated that the morphology, alignment and optically active defect content of
vertically aligned 1D ZnO NR arrays grown using an aqueous solution method can be controlled by
simply varying the hexamine relative concentration in the growth solution. Well aligned, prismatic
ZnO NR arrays with a uniform NR diameter of 80 nm along their lengths were obtained at an
amine:Zn ratio of 1:1. We propose that amine concentration not only plays an important role on the
growth and alignment of the 1D NR arrays, but it also plays a role in controlling their optically active
defect concentration. Amine plays a role both as growth stabilizer and as a surfactant and thus
controls the Zn release rate for ZnO formation while also capping non polar planes. The competition
between these ‘stabliser’ and ‘surfactant’ roles facilitates the morphology, alignment and defect
control of 1D ZnO NR arrays. These defect controlled NR arrays have also been demonstrated to
work as effective photocatalysts and exhibit excellent photocatalytic activity under UV irradiation.
ZnO NR arrays grown at amine concentrations of 1M show higher photocatalytic degradation in an
MB dye solution under UV irradiation owing to both the high surface to volume ratio of the arrays
and increased charge carrier density due to Zn interstitial defects. Understanding and then utilizing
the role of amine in the growth of 1D ZnO NR arrays offers tremendous promise as a simple but
highly effective method for tailoring ZnO NR morphologies (and thus functionalities) for various
potential applications.
Page 12 of 30
ACS Paragon Plus Environment
Crystal Growth & Design
123456789101112131415161718192021222324252627282930313233343536373839404142434445464748495051525354555657585960

11
Acknowledgements
The authors KSR and RTR would like to thank the Department of Science and Technology,
Government of India, for financial support under the Nano mission project (SR/NM/NS-113/2010-
BU (G)) and the authors EMCG, KSR and RTR would like to thank both Dublin City University and
the Department of Science and Technology, Government of India, for financial support, including
travel funding, under the Indo-Ireland bilateral project (DST/INT/IRE/P-16/2011).
References
1. Sheng Xu; and Zhong Lin Wang. Nano Research. 2011, 4, 1013-1098.
2. F. Fang; J. Futter; A. Markwitz; J. Kennedy. Nanotechnology. 2009, 20,245502.
3. Charu Dwivedi; V Dutta. Adv. Nat. Sci.: Nanosci. Nanotechnology. 2012, 3,015011.
4. R. Konenkamp; R. C. Word; M. Godinez. Nano Letters. 2005, 5, 2005-2008.
5. Michael S. Arnold; Phaedon Avouris; Zheng Wei Pan; Zhong L. Wang. J. Phys. Chem. B.
2003, 107, 659-663.
6. Zengxing Zhang; Huajun Yuan; Jianjun Zhou; Dongfang Liu; Shudong Luo; Yanming Miao;
Yan Gao; Jianxiong Wang; Lifeng Liu; Li Song; Yanjuan Xiang; Xiaowei Zhao; Weiya Zhou;
Sishen Xie. J. Phys. Chem. B. 2006, 110, 8566-8569.
7. R. T. Rajendra Kumar; E. McGlynn; M. Biswas; R. Saunders; G. Trolliard; B. Soulestin; J.-R.
Duclere; J. P. Mosnier; M. O. Henry; J. Appl. Phy. 2008, 104, 084309.
8. Elena Galoppini; Jonathan Rochford; Hanhong Chen; Gaurav Saraf; Yicheng Lu; Anders
Hagfeldt; Gerrit Boschloo. J. Phys. Chem. B. 2006,110, 16159-16161.
9. Guozhen Shen; Yoshio bando; Baodan Liu; Dmtri Golberg; Cheol Jin Lee. Adv. Funct. Mater.
2006, 16, 410-416.
10. Ye Sun; Gareth M. Fuge; Michael, N.R; Ashfold. Chemical Physics Letters. 2004, 396, 21-26.
11. Jingbiao Cui. J. Phys. Chem. C. 2008, 112, 10385-10388.
12. Francisco Solís-Pomar; Eduardo Martínez; Manuel F Meléndrez; Eduardo Pérez-Tijerinal.
Nanoscale Research Letters. 2011, 6,524.
13. Yong-Jin Kim; Chul-Ho Lee; Young Joon Hong; Gyu-Chul Yi. Appl. Phys. Letters. 2006, 89,
163128.
14. B. Angadi; H. C. Park; H. W. Choi; J. W. Choi; W. K. Choi. J. Phys. D: Appl. Phys. 2007, 40,
1422-1425.
15. J. Lee; J. Chung; S. Lim. Physica E. 2010, 42, 2143-2146.
Page 13 of 30
ACS Paragon Plus Environment
Crystal Growth & Design
123456789101112131415161718192021222324252627282930313233343536373839404142434445464748495051525354555657585960
12
16. X. Q. Zhao; C. R. Kim; J. Y. Lee; C. M. Shin; J. H. Heo; J. Y. Leem; H. Ryu; J. H. Chang; H.
C. Lee; C. S. Son; B. C. Shin; W. J. Lee; W. G. Jung; S. T. Tan; J. L. Zhao; X. W. Sun. Appl.
Surf. Science. 2009, 255, 5861-5865.
17. Tz-Jun Kuo; Chun-Neng Lin; Chi-Liang Kuo; Michael H. Huang. Chem. Mater. 2007, 19,
5143-5147.
18. Tianjun Sun; Jieshan Qiuand; Changhai Liang. J. Phys. Chem. C. 2008, 112, 715-721.
19. Jiu-Ju Feng; Zhen-Zhen Wang; Yong-Fang Li; Jian-Rong Chen; Ai-Jun Wang; J Nanopart Res.
2013, 15,1565.
20. K. S. Ranjith; S. Pandian; N. Gomathi; M. Kamruddin; R. T. Rajendrakumar. Advanced
Material Research. 2012, 584, 319-323.
21. C. Sahoo; A. K. Gupta; A. Pal. Desalination. 2005, 181, 91-100.
22. http://phys.org/news/2013-07-hydrophobic-hydrophilic.html
23. Yang Zhang; Manoj, K. Ram; Elias K. Stefanakos; D. Yogi Goswami. Journal of
Nanomaterials. 2012, 2012, 624520.
24. Zeng xing Zhang; Huajun Yuan; Jianjun Zhou; Dongfang Liu; Shudong Luo; Yanming Miao;
Yan Gao; Jianxiong Wang; Lifeng Liu; Li Song; Yanjuan Xiang; Xiaowei Zhao; Weiya Zhou;
Sishen Xie. J. Phys. Chem. B. 2006, 110, 8566-8569.
25. R.N. Gayen; A. Rajaram; R. Bhar; A.K. Pal. Thin Solid Films. 2010, 518, 1627-1636.
26. Behnajady MA; Modirshahla N; Hamzavi R. J Hazard Mater. 2006, 133, 226-232.
27. Mohamad Hafiz Mamat; Zuraida Khusaimi; Musa Mohamed Zahidi; Suriani Abu Bakar; Yosri
Mohd Siran; Syahril Anuar MdRejab; Ahmad Jaril Asis; ShawaluddinTahiruddin; Saifollah
Abdullah; Mohamad Rusop Mahmood. Jpn. J. Appl. Phys. 2011, 50, 06GH04.
28. A. Suguna; HC. Warad; M. Boman; J. Dutta. J. Sol-Gel Technology. 2004, 39, 49-56.
29. R. A. Laudise; E. D. Kolb; A. J. Caporaso. 1964, 47, 9-12.
30. Yang Li, Wen Zhang, Junfeng Niu, Yongsheng Chen; ACS Nano. 2012, 6, 5164–5173.
31. Jianchun Wang, Ping Liu, Xianzhi Fu, Zhaohui Li, Wei Han, Xuxu Wang; Langmuir. 2009, 25,
1218-1223.
32. Christoph Knies, Matthias T. elm, Peter J. Klar, Jan Stehr, Detlev M. Hofmann, Nikolai
Romanov, Tom Kammermeier, Andreas Ney; Journal of Applied Physics. 2009, 105, 073918.
33. J.Sann, J.Stehr, A.Hofstaetter, D.M.Hofmann, A.Neumann, M.Lerch, U.Haboeck, A.Hoffmann,
C.Thomsen; Physical Review B. 2007, 76, 195203.
34. Aleksandra B.Djurisic and Yu Hand Leung; Small. 2006, 2, 944-961.
Page 14 of 30
ACS Paragon Plus Environment
Crystal Growth & Design
123456789101112131415161718192021222324252627282930313233343536373839404142434445464748495051525354555657585960
13
35. M.Trunk, V.Venkatachalapathy, A. Galeckas, A.Yu. Kuznetsov; Applied Physics Letter. 2010,
97, 211901.
36. Zhen Zhang, John T.Yates; Chemical Reviews. 2012, 112, 5520-5551.
Table
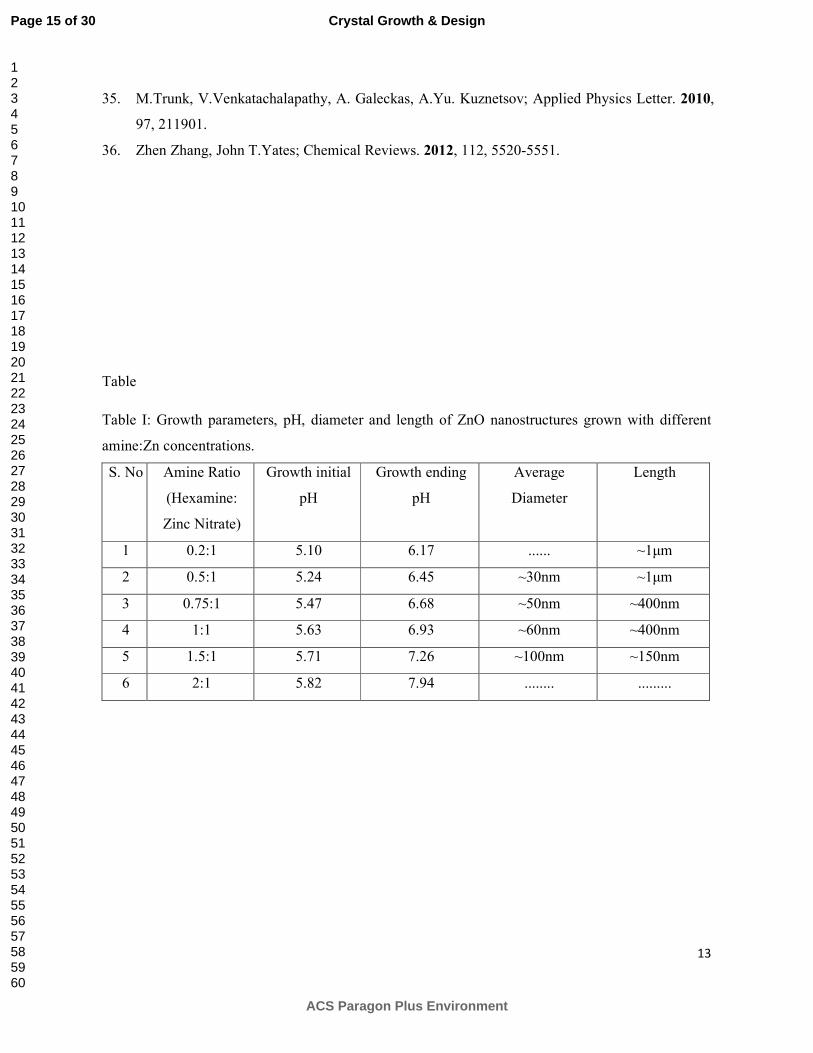
Table I: Growth parameters, pH, diameter and length of ZnO nanostructures grown with different
amine:Zn concentrations.
S. No Amine Ratio
(Hexamine:
Zinc Nitrate)
Growth initial
pH
Growth ending
pH
Average
Diameter
Length
1 0.2:1 5.10 6.17 ...... ~1µm
2 0.5:1 5.24 6.45 ~30nm ~1µm
3 0.75:1 5.47 6.68 ~50nm ~400nm
4 1:1 5.63 6.93 ~60nm ~400nm
5 1.5:1 5.71 7.26 ~100nm ~150nm
6 2:1 5.82 7.94 ........ .........
Page 15 of 30
ACS Paragon Plus Environment
Crystal Growth & Design
123456789101112131415161718192021222324252627282930313233343536373839404142434445464748495051525354555657585960

14
Figure Caption
Figure 1: SEM images showing plan views of ZnO nanostructure arrays grown on dip coated ZnO
thin film seeded substrates at amine: zinc nitride ratios of (a) 0.2:1, (b)0.5:1, (c)0.75:1, (d) 1:1, (e)
1.5:1, (f) 2:1. The images in the insets are more highly magnified images of the respective
nanostructures shown in the main images.
Figure 2: Schematic diagram of the nanostructured arrays grown with different amine:zinc nitride
concentrations of (a)0.2:1, (b)0.5:1, (c)0.75:1, (d)1:1, (e) 1.5:1, (f) 2:1.
Figure 3: SEM image showing cross sectional views of 1D NR arrays grown on dip coated ZnO thin
film seeded substrates with amine:zinc nitride ratios of (a) 0.2:1, (b) 1:1 , (c) 1.5:1. Schematic
representations of the morphologies with varying amine:zinc nitrate ratios are also shown in (d)0.2:1,
(e) 1:1, (f) 1.5:1.
Figure 4: XRD patterns from nanostructured arrays grown using different amine:zinc nitrate
concentrations (a)standard pattern of ZnO (JCPDS 36-1451), (b)0.2:1, (c)0.5:1, (d)0.75:1, (e)1:1,
(f) 1.5:1, (j) 2:1.
Figure 5: Water contact angle on ZnO NR arrays as a function of varying the amine concentration
ratio.
Figure 6: PL spectra (measured at 10 K) of ZnO nanostructured arrays grown with different
hexamine:zinc nitrate concentrations (a) 0.2:1, (b) 0.5:1, (c) 0.75:1, (d) 1:1, (e) 1.5:1, (f) 2:1. Insets
show the corresponding sample morphologies.
Figure 7: (a) The photo degradation efficiency of MB versus time using ZnO NR array samples
grown with hexamine:zinc nitrate concentrations of 0.2:1, 0.5:1, 0.75:1, 1:1,1.5:1 and 2:1. (b)
Kinetics of photocatalytic degradation of MB in the presence of ZnO NR array samples grown with
different hexamine:zinc nitrate concentrations.
Figure 8: Schematic diagram showing the energy levels and free charge carrier densities from the
ZnO nanostructural surface to the dye solution (a) under dark and (b) under UV irradiation.
Page 16 of 30
ACS Paragon Plus Environment
Crystal Growth & Design
123456789101112131415161718192021222324252627282930313233343536373839404142434445464748495051525354555657585960

15
Page 17 of 30
ACS Paragon Plus Environment
Crystal Growth & Design
123456789101112131415161718192021222324252627282930313233343536373839404142434445464748495051525354555657585960

16
Figure 1
Figure 2
200nm
a b c d e
f
Page 18 of 30
ACS Paragon Plus Environment
Crystal Growth & Design
123456789101112131415161718192021222324252627282930313233343536373839404142434445464748495051525354555657585960

17
Figure 3
20 30 40 50 60 70
(100)
(002)
(101)
(102)
(110)
(103)
2Theta (deg)
a
b (0.2:1)
c (0.5:1)
d (0.75:1)
e (1:1)
f (1.5:1)
g (2:1)
Figure 4
Page 19 of 30
ACS Paragon Plus Environment
Crystal Growth & Design
123456789101112131415161718192021222324252627282930313233343536373839404142434445464748495051525354555657585960

18
Figure 5
Page 20 of 30
ACS Paragon Plus Environment
Crystal Growth & Design
123456789101112131415161718192021222324252627282930313233343536373839404142434445464748495051525354555657585960

19
2.0 2.2 2.4 2.6 2.8 3.0 3.2 3.4
2.0 2.2 2.4 2.6 2.8 3.0 3.2 3.4
2.0 2.2 2.4 2.6 2.8 3.0 3.2 3.4
2.0 2.2 2.4 2.6 2.8 3.0 3.2 3.4
2.0 2.2 2.4 2.6 2.8 3.0 3.2 3.4
2.0 2.2 2.4 2.6 2.8 3.0 3.2 3.4
PL intensity (a.u)
Blueish defect emission
Blueish defect emission
Greenish defect emission
Greenish defect emission
Photon energy (eV)Photon energy (eV)
Figure 6
Page 21 of 30
ACS Paragon Plus Environment
Crystal Growth & Design
123456789101112131415161718192021222324252627282930313233343536373839404142434445464748495051525354555657585960

20
0 50 100 150 200
0
20
40
60
80
100
Photo Degradation %
Time (min)
(0.2:1)
(0.5:1)
(0.75:1)
(1:1)
(1.5:1)
(2:1)
(With out catalyst)
0 50 100 150 200
0.0
0.5
1.0
1.5
2.0
2.5
3.0
3.5
In (C/C0)
Time (min)
(0.2:1)
(0.5:1)
(0.75:1)
(1:1)
(1.5:1)
(2:1)
Figure 7
Figure 8
Page 22 of 30
ACS Paragon Plus Environment
Crystal Growth & Design
123456789101112131415161718192021222324252627282930313233343536373839404142434445464748495051525354555657585960

SEM images showing plan views of ZnO nanostructure arrays grown on dip coated ZnO thin film seeded substrates at amine: zinc nitride ratios of (a) 0.2:1, (b)0.5:1, (c)0.75:1, (d) 1:1, (e) 1.5:1, (f) 2:1. The images in the insets are more highly magnified images of the respective nanostructures shown in the main
images. 136x177mm (150 x 150 DPI)
Page 23 of 30
ACS Paragon Plus Environment
Crystal Growth & Design
123456789101112131415161718192021222324252627282930313233343536373839404142434445464748495051525354555657585960
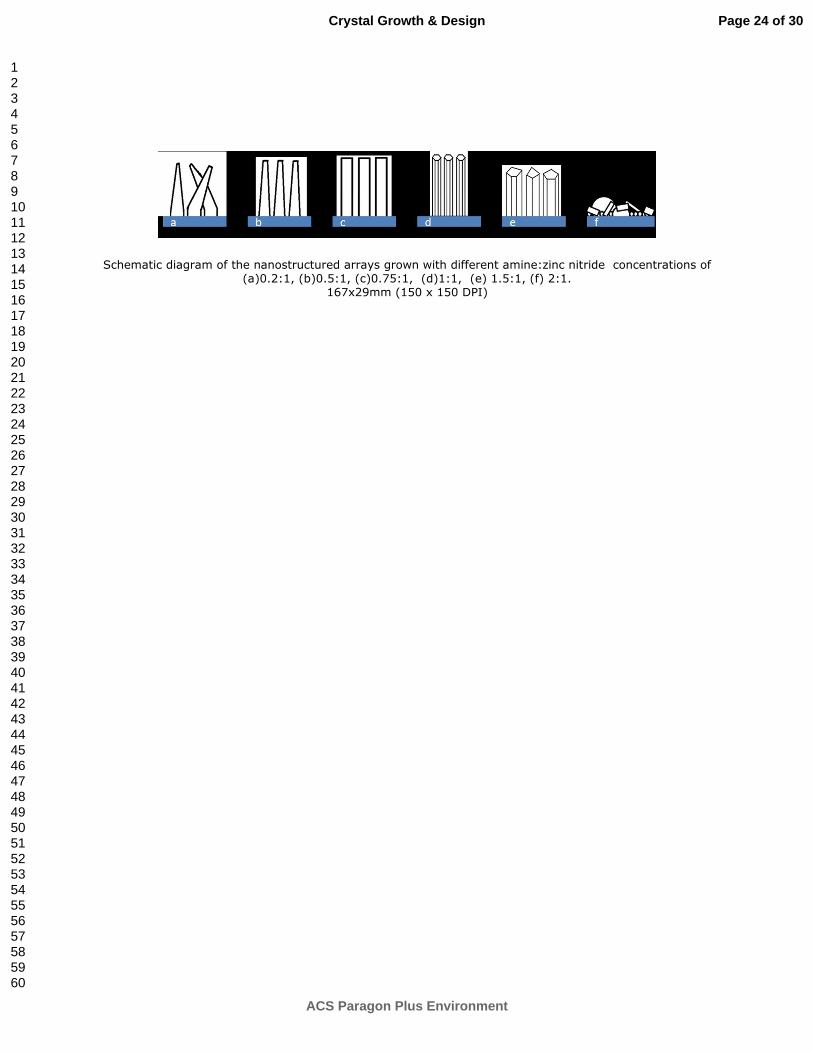
Schematic diagram of the nanostructured arrays grown with different amine:zinc nitride concentrations of (a)0.2:1, (b)0.5:1, (c)0.75:1, (d)1:1, (e) 1.5:1, (f) 2:1.
167x29mm (150 x 150 DPI)
Page 24 of 30
ACS Paragon Plus Environment
Crystal Growth & Design
123456789101112131415161718192021222324252627282930313233343536373839404142434445464748495051525354555657585960

SEM image showing cross sectional views of 1D NR arrays grown on dip coated ZnO thin film seeded substrates with amine:zinc nitride ratios of (a) 0.2:1, (b) 1:1 , (c) 1.5:1. Schematic representations of the
morphologies with varying amine:zinc nitrate ratios are also shown in (d)0.2:1, (e) 1:1, (f) 1.5:1.
167x86mm (150 x 150 DPI)
Page 25 of 30
ACS Paragon Plus Environment
Crystal Growth & Design
123456789101112131415161718192021222324252627282930313233343536373839404142434445464748495051525354555657585960

XRD patterns from nanostructured arrays grown using different amine:zinc nitrate concentrations (a)0.2:1, (b)0.5:1, (c)0.75:1, (d)1:1, (e) 1.5:1, (f) 2:1.
172x141mm (150 x 150 DPI)
Page 26 of 30
ACS Paragon Plus Environment
Crystal Growth & Design
123456789101112131415161718192021222324252627282930313233343536373839404142434445464748495051525354555657585960

Water contact angle on ZnO NR arrays as a function of varying the amine concentration ratio. 182x155mm (104 x 104 DPI)
Page 27 of 30
ACS Paragon Plus Environment
Crystal Growth & Design
123456789101112131415161718192021222324252627282930313233343536373839404142434445464748495051525354555657585960
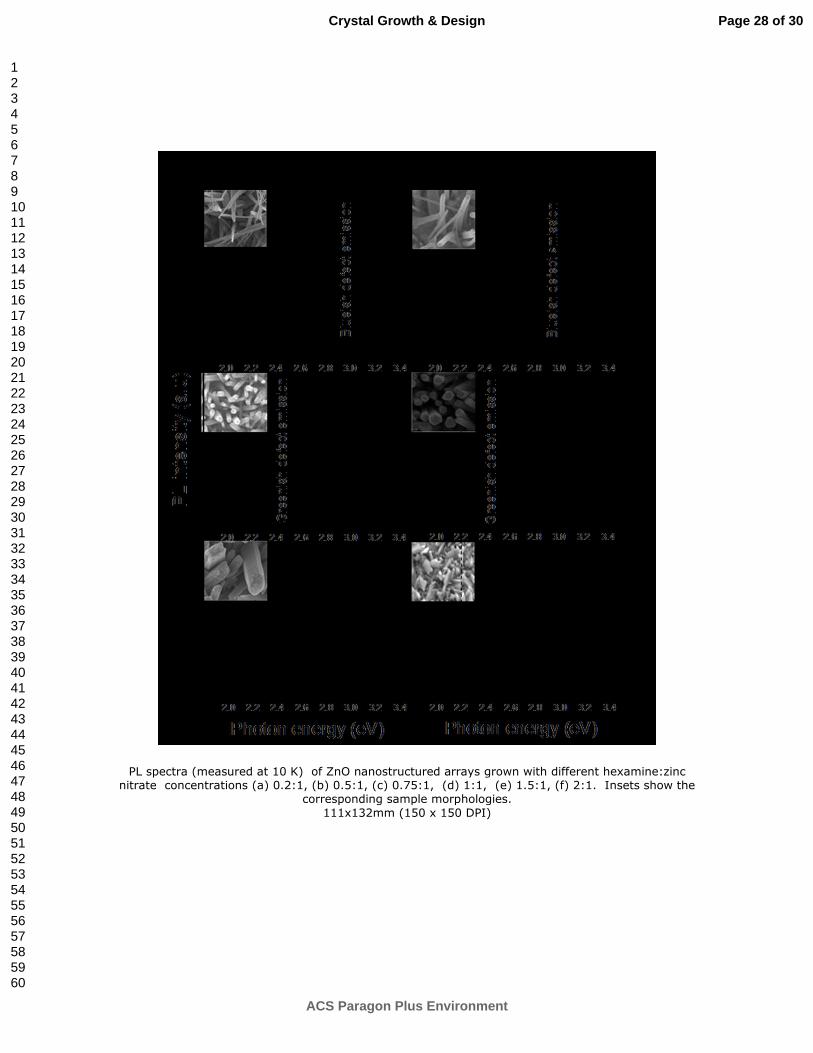
PL spectra (measured at 10 K) of ZnO nanostructured arrays grown with different hexamine:zinc nitrate concentrations (a) 0.2:1, (b) 0.5:1, (c) 0.75:1, (d) 1:1, (e) 1.5:1, (f) 2:1. Insets show the
corresponding sample morphologies.
111x132mm (150 x 150 DPI)
Page 28 of 30
ACS Paragon Plus Environment
Crystal Growth & Design
123456789101112131415161718192021222324252627282930313233343536373839404142434445464748495051525354555657585960

(a) The photo degradation efficiency of MB versus time using ZnO NR array samples grown with hexamine:zinc nitrate concentrations of 0.2:1, 0.5:1, 0.75:1, 1:1,1.5:1 and 2:1. (b) Kinetics of photocatalytic degradation of MB in the presence of ZnO NR array samples grown with different
hexamine:zinc nitrate concentrations. 159x79mm (150 x 150 DPI)
Page 29 of 30
ACS Paragon Plus Environment
Crystal Growth & Design
123456789101112131415161718192021222324252627282930313233343536373839404142434445464748495051525354555657585960

Schematic diagram showing the energy levels and free charge carrier densities from the ZnO nanostructural surface to the dye solution (a) under dark and (b) under UV irradiation.
195x75mm (150 x 150 DPI)
Page 30 of 30
ACS Paragon Plus Environment
Crystal Growth & Design
123456789101112131415161718192021222324252627282930313233343536373839404142434445464748495051525354555657585960