alifornia Occupational Health Indicators - CDPH Home Document... · alifornia Occupational Health...
53
California Occupaonal Health Indicators Annual measures of worker health and safety for years 2008-2013 March 2017 Occupaonal Health Indicators Data and Resources (hps://www.cdph.ca.gov/Programs/CCDPHP/ DEODC/OHB/Pages/Indicators.aspx) Occupaonal Health Branch CA Department of Public Health (www.cdph.ca.gov/ohb) 1
Transcript of alifornia Occupational Health Indicators - CDPH Home Document... · alifornia Occupational Health...

California OccupationalHealth Indicators
Annual measures of worker health and safety for years 2008-2013
March 2017
Occupational Health Indicators
Data and Resources
(https://www.cdph.ca.gov/Programs/CCDPHP/DEODC/OHB/Pages/Indicators.aspx)
Occupational Health Branch
CA Department of Public Health
(www.cdph.ca.gov/ohb) 1

Contact
Robert Harrison, MD, MPH Occupational Health Branch California Department of Public Health 850 Marina Bay Parkway, Building P, 3rd Floor Richmond, CA 94804 (510) 620-5769 (phone) (510) 620-5743 (fax) [email protected] (email) Occupational Health Branch Public Information Lines – toll-free numbers for California callers Workplace Hazard Helpline (866) 282-5516 Free Publications on Workplace Hazards (866) 627-1586 Lead in the Workplace Information Line (English/Spanish) (866) 627-1587 Pesticide Poisoning Helpline (English/Spanish) (800) 970-6680
Acknowledgments
This project is supported by the National Institute for Occupational Safety and Health (NIOSH). The contributors also wish to acknowledge our colleagues at NIOSH, the Council of State and Territorial Epidemiologists, and other state health and labor departments for their contribu-tions in developing, maintaining, and publicizing the Occupational Health Indicators.
Contributors Barbara Materna, PhD, CIH, Chief, Occupational Health Branch Robert Harrison, MD, MPH, Chief, Occupational Health Surveillance and Evaluation Program Kathleen Attfield, ScD Gail Bateson, MS John Beckman, BS Christine Dobson, ScD Jennifer Flattery, MPH Rebecca Jackson, MPH Lauren Joe, MPH Paula Johnson, PhD, MPH Susan Payne, MA Faith Raider, MA Laura Styles, MPH Joyce Ycasas, MPH

State of California—Health and Human Services Agency
California Department of Public Health
KAREN L. SMITH, MD, MPH EDMUND G. BROWN JR. Director and State Public Health Officer Governor
This report provides important data about the California workforce and the key “indicators” or
measures of how the work environment affects their health status. While overall rates of
work-related fatalities and injuries have continued to decrease in California over the past six
years, there clearly is much more work to be done to reduce the burden and cost to workers,
their families, and communities. Among the findings in this report:
Annually, more than 100,000 California workers lose work time after being injured at work,
and about 20,000 are hospitalized.
In 2013, 396 workers died from injuries sustained on the job, and Hispanic workers
accounted for 49% of the deaths. Many of these deaths are preventable through
improvements in workplace safety programs.
Over 1.7 million California workers are employed in high-risk occupations where the rate of
work-related injuries is more than twice the overall rate for U.S. industries.
Nearly 950,000 working adults report that their asthma was caused or made worse by their
exposures at work, representing a significant opportunity to reduce the overall burden of
asthma.
Over 350 workers are diagnosed with mesothelioma, and about 200 die of mesothelioma
and asbestosis each year – a legacy of the decades-old hazard of exposure to asbestos
dust.
Over 1,800 workers have blood lead levels at or above 10 micrograms per deciliter,
increasing their risk of kidney and heart disease, high blood pressure, and cognitive
damage.
The California Department of Public Health’s Occupational Branch – partnering with industry,
labor, academic institutions, health and safety professionals, Cal/OSHA, and many others –
strives to reduce hazards in California workplaces and prevent work-related injuries and
illnesses. We welcome your collaboration as we move forward together in this effort.
Robert Harrison, MD, MPH, Chief
Occupational Health Surveillance and Evaluation Program
Occupational Health Branch
California Department of Public Health
OCCUPATIONAL HEALTH BRANCH
850 Marina Bay Parkway, Bldg. P, 3rd
Fl., Richmond, CA 94804 Phone: (510) 620-5757 ● Fax: (510) 620-5743
www.cdph.ca.gov/ohb

4
Occupational Health Indicators • Occupational Health Branch • CA Department of Public Health
This page intentionally left blank.

Table of Contents
Introduction…………………………………………………………………………………………………………. 1
California employment demographics profile………………………………………………………. 3
Indicators:
Indicators of Occupational Mortality
Fatal work-related injuries……………………………………………………………………………….. 6
Fatal injuries among Hispanic/Latino workers………………………………………………..… 7
Pneumoconiosis mortality.……………………………………………….…………………….….…… 8
Indicators of Occupational Morbidity
Non-fatal injuries and illnesses reported by employers………………………….….…….. 10
Musculoskeletal disorders reported by employers…………………………………..………. 12
Amputations reported by employers…………………………………………………….…….…… 14
Amputations identified in state workers’ compensation systems…………….……… 15
Carpal tunnel syndrome cases in state workers’ compensation systems……..…… 16
Work-related hospitalizations…………………………………………………………………………… 17
Work-related severe traumatic injury hospitalizations……………………….……………. 18
Hospitalizations for work-related lower back disorders……………………..…………….. 19
Hospitalizations for work-related burns……………………………………………………..….... 21
Pneumoconiosis hospitalizations………………………………………………………..…..……….. 22
Occupational heat-related emergency department visits………………………..……….. 24
Work-related asthma……………………………………………………………………………..………... 25
Acute work-related pesticide poisonings reported to poison control………..……… 27
Incidence of malignant mesothelioma……………………………………………………..………. 28
Exposure and Hazard Indicators
Elevated blood lead levels among adults…………...………………………….….……………… 29
Workers employed in industries with high risk for occupational morbidity………. 32
Workers employed in occupations with high risk for occupational morbidity…… 34
Workers in occupations & industries with high risk for occupational mortality… 36

Table of Contents Continued
Intervention Indicators
Occupational health and safety professionals……………………………….…...….………… 38
OSHA enforcement activities………………………………………………….….…………………….. 43
Workers’ compensation awards……………………………………….……….………...………….. 45
Indicator data resources………………………………………………………………...………………...... 47

1
Introduction
Every year, thousands of California workers are injured on the job or become ill as a result of health hazards at work. These work-related injuries and illnesses result in substantial human and economic costs. California’s workers’ compensation benefits paid in 2013 alone totaled $12.1 billion. As large as this figure is, it represents only a fraction of the indirect and direct costs of work-related injuries and illnesses annually. Work-related injuries and illnesses can be prevented. Having the data necessary to understand the problem is the first step. A health indicator is a numerical value or statistic that helps us measure the state of health. Indicators can be tracked over time to tell us whether our health is getting better or worse, and they can be compared with other regional or national values. Using indicators over time can help us to track our progress toward improving health. This report includes Occupational Health Indicator data from 2008 through 2013. Data from subsequent years will be added to the Occupational Health Branch (OHB) website as they become available. OHB worked with several other states and the National Institute for Occupational Safety and Health (NIOSH) to develop a set of Occupational Health Indicators. These Indicators are used to measure work-related injuries, illnesses, exposures, or factors that can influence occupational health. Each Indicator was selected because it is important to public health and can be calculated using a data source that is readily available for most states. States, NIOSH, and the Council of State and Territorial Epidemiologists (CSTE) develop and pilot new Indicators periodically for national adoption. Some states create additional State-specific Indicators such as California’s new “Fatal Injuries Among Hispanic/Latino Workers” Indicator. OHB shares California Occupational Health Indicator data with interested parties, other states, and the federal government. We help other states learn to use the Occupational Health Indicators by partnering with them and maintaining detailed “how-to” guides on how to generate the Indicators. Finally, we use the Indicators and further analyses of these data sources to guide our efforts to prevent workplace injury and illness in California.
2
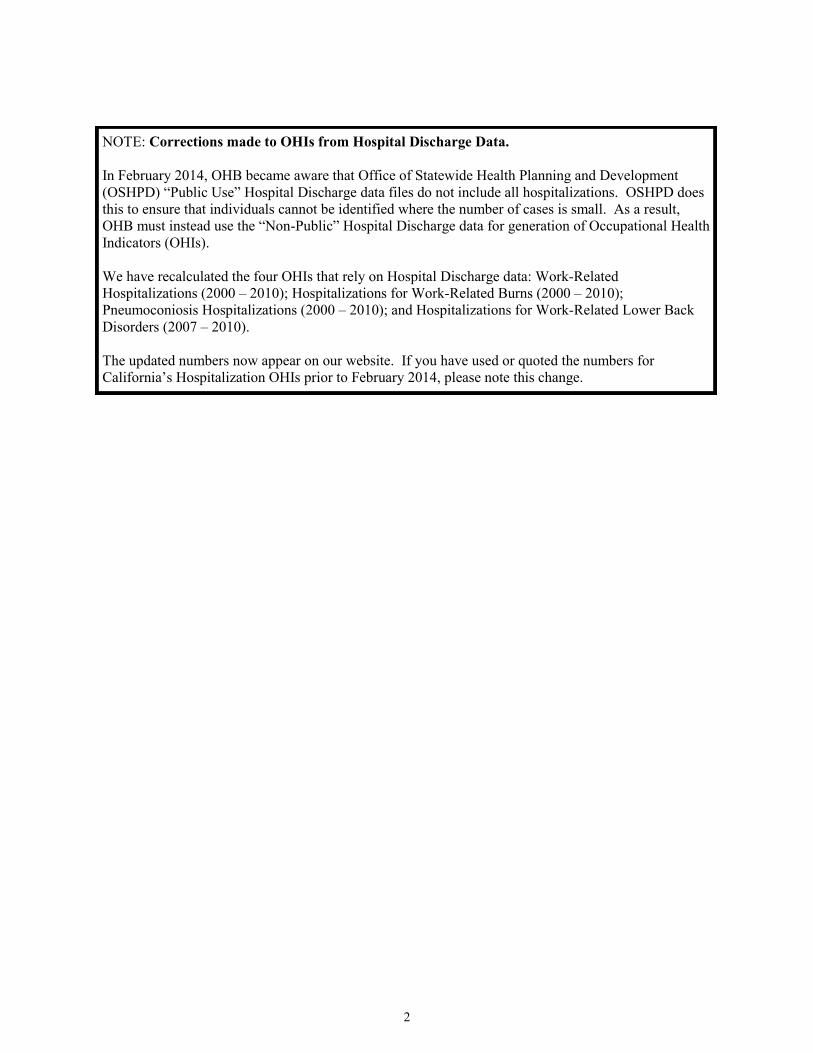
NOTE: Corrections made to OHIs from Hospital Discharge Data.
In February 2014, OHB became aware that Office of Statewide Health Planning and Development
(OSHPD) “Public Use” Hospital Discharge data files do not include all hospitalizations. OSHPD does
this to ensure that individuals cannot be identified where the number of cases is small. As a result,
OHB must instead use the “Non-Public” Hospital Discharge data for generation of Occupational Health
Indicators (OHIs).
We have recalculated the four OHIs that rely on Hospital Discharge data: Work-Related
Hospitalizations (2000 – 2010); Hospitalizations for Work-Related Burns (2000 – 2010);
Pneumoconiosis Hospitalizations (2000 – 2010); and Hospitalizations for Work-Related Lower Back
Disorders (2007 – 2010).
The updated numbers now appear on our website. If you have used or quoted the numbers for
California’s Hospitalization OHIs prior to February 2014, please note this change.

3
Occupational Health Indicators • Occupational Health Branch • CA Department of Public Health
California Employment
Demographics U.S.
Year
2008 2009 2010 2011 2012 2013 2013
Employed persons in millions 17.0 16.2 15.9 16.2 16.6 17.0 143.9
Percentage of civilian workforce
unemployed 7.1 11.3 12.2 11.6 10.4 8.9 7.4
Percentage of civilian employment
self-employed 9.3 8.8 9.4 9.1 9.0 9.0 6.5
Percentage of civilian employment
in part-time jobs 18.5 20.6 21.4 21.3 21.1 20.9 19.2
Percentage of civilian employment
by number of hours worked
<40 hours 33.4 38.6 36.5 36.2 35.8 34.3 33.7
40 hours 44.1 41.0 43.1 43.1 43.3 44.5 42.3
41+ hours 22.5 20.4 20.4 20.7 20.8 21.2 24.0
Percentage of civilian employment
by sex
Males 55.3 54.3 54.5 55.1 54.8 54.6 53.0
Females 44.7 45.7 45.5 44.9 45.2 45.4 47.0
Percentage of civilian employment
by age group
16 to 17 years 0.9 0.6 0.7 0.6 0.5 0.5 1.0
18 to 64 years 95.4 95.3 95.3 95.1 94.7 94.7 93.6
65+ years 3.7 4.1 4.0 4.4 4.8 4.9 5.3
Percentage of civilian employment
by race
White 78.3 78.1 77.5 77.7 75.5 74.7 80.2
Black 5.8 5.7 5.5 5.3 5.3 5.2 11.2
Other 16.0 16.1 16.9 17.0 19.2 20.1 8.6
Percentage of civilian employment
by Hispanic origin 33.5 33.2 34.1 35.0 35.9 35.9 15.6
California Employment Demographics Profile
Data Source: U.S. Bureau of Labor Statistics Current Population Survey Geographic Profiles of
Employment and Unemployment
4
Occupational Health Indicators • Occupational Health Branch • CA Department of Public Health
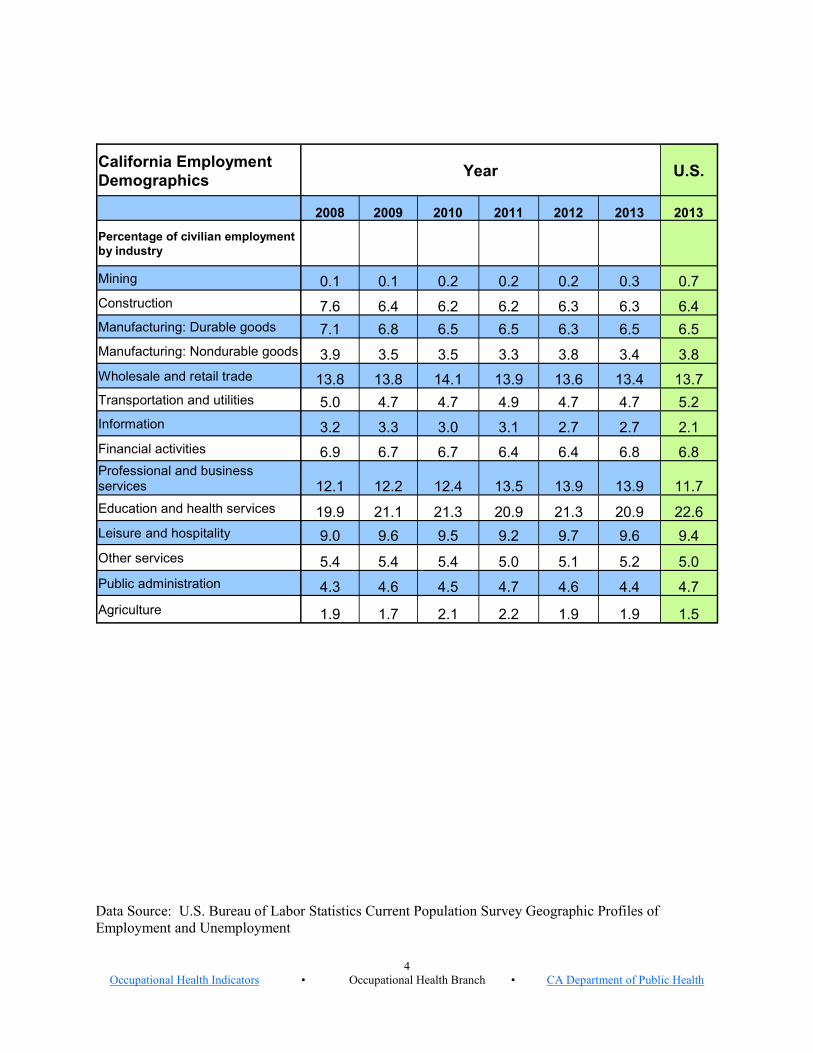
California Employment
Demographics Year U.S.
2008 2009 2010 2011 2012 2013 2013
Percentage of civilian employment
by industry
Mining 0.1 0.1 0.2 0.2 0.2 0.3 0.7
Construction 7.6 6.4 6.2 6.2 6.3 6.3 6.4
Manufacturing: Durable goods 7.1 6.8 6.5 6.5 6.3 6.5 6.5
Manufacturing: Nondurable goods 3.9 3.5 3.5 3.3 3.8 3.4 3.8
Wholesale and retail trade 13.8 13.8 14.1 13.9 13.6 13.4 13.7
Transportation and utilities 5.0 4.7 4.7 4.9 4.7 4.7 5.2
Information 3.2 3.3 3.0 3.1 2.7 2.7 2.1
Financial activities 6.9 6.7 6.7 6.4 6.4 6.8 6.8
Professional and business services 12.1 12.2 12.4 13.5 13.9 13.9 11.7
Education and health services 19.9 21.1 21.3 20.9 21.3 20.9 22.6
Leisure and hospitality 9.0 9.6 9.5 9.2 9.7 9.6 9.4
Other services 5.4 5.4 5.4 5.0 5.1 5.2 5.0
Public administration 4.3 4.6 4.5 4.7 4.6 4.4 4.7
Agriculture 1.9 1.7 2.1 2.2 1.9 1.9 1.5
Data Source: U.S. Bureau of Labor Statistics Current Population Survey Geographic Profiles of
Employment and Unemployment

5
Occupational Health Indicators • Occupational Health Branch • CA Department of Public Health
California Employment
Demographics Year U.S.
2008 2009 2010 2011 2012 2013 2013
Percentage of civilian employment
by occupation
Management, business, and financial operations 16.0 16.0 15.7 15.7 17.2 16.5 15.8
Professional and related occupations 21.6 22.2 22.5 22.3 22.1 22.6 22.2
Service occupations 17.1 18.2 18.2 17.7 18.2 18.6 18.0
Sales and related occupations 11.4 11.5 11.5 11.2 10.6 10.9 10.9
Office and administrative support 12.6 12.5 12.6 12.7 12.2 11.8 12.4
Farming, forestry, fishing 1.3 1.1 1.4 1.5 1.3 1.3 0.7
Construction and extraction 5.8 4.9 4.7 4.8 4.7 4.7 5.0 Installation, maintenance, and repair 3.2 3.1 3.1 3.1 3.0 2.9 3.4
Production 5.5 5.0 5.1 5.3 5.0 5.1 5.7
Transportation, material moving 5.6 5.4 5.2 5.7 5.6 5.6 6.1
Data Source: U.S. Bureau of Labor Statistics Current Population Survey Geographic Profiles of
Employment and Unemployment
6
Occupational Health Indicators • Occupational Health Branch • CA Department of Public Health
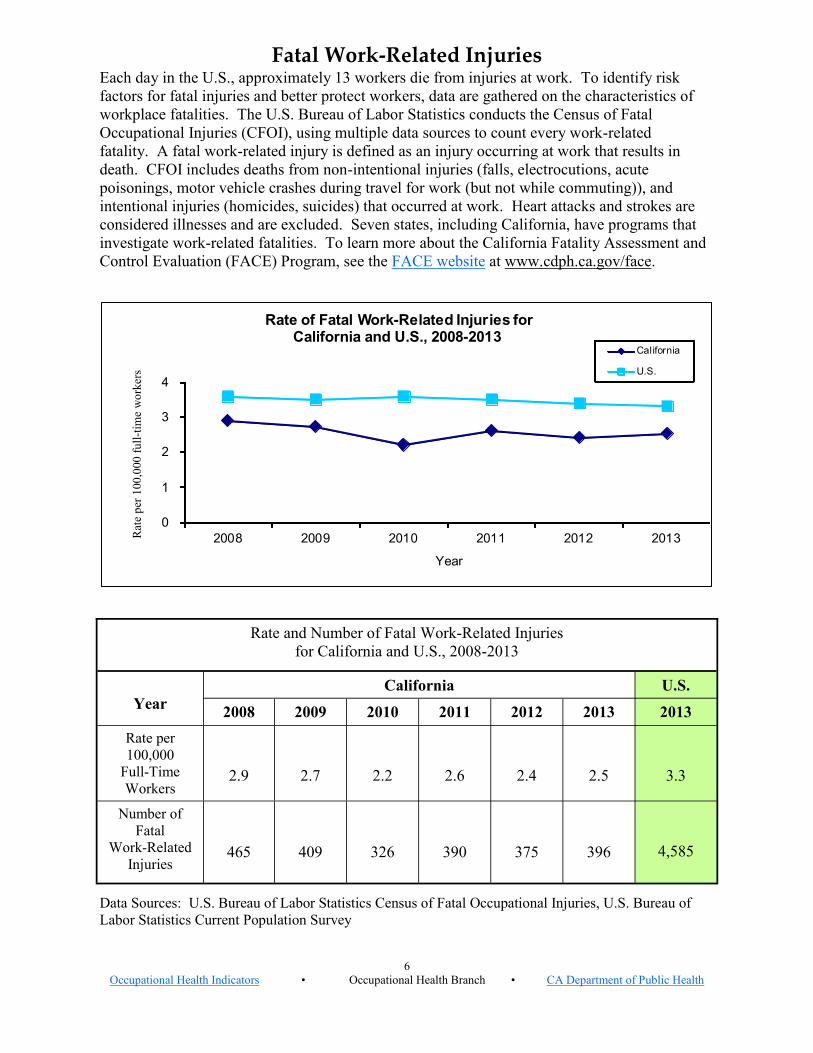
Fatal Work-Related Injuries Each day in the U.S., approximately 13 workers die from injuries at work. To identify risk
factors for fatal injuries and better protect workers, data are gathered on the characteristics of
workplace fatalities. The U.S. Bureau of Labor Statistics conducts the Census of Fatal
Occupational Injuries (CFOI), using multiple data sources to count every work-related
fatality. A fatal work-related injury is defined as an injury occurring at work that results in
death. CFOI includes deaths from non-intentional injuries (falls, electrocutions, acute
poisonings, motor vehicle crashes during travel for work (but not while commuting)), and
intentional injuries (homicides, suicides) that occurred at work. Heart attacks and strokes are
considered illnesses and are excluded. Seven states, including California, have programs that
investigate work-related fatalities. To learn more about the California Fatality Assessment and
Control Evaluation (FACE) Program, see the FACE website at www.cdph.ca.gov/face.
Data Sources: U.S. Bureau of Labor Statistics Census of Fatal Occupational Injuries, U.S. Bureau of
Labor Statistics Current Population Survey
Rate and Number of Fatal Work-Related Injuries
for California and U.S., 2008-2013
Year
U.S. California
2008 2009 2010 2011 2012 2013 2013
Rate per
100,000
Full-Time
Workers
2.9
2.7
2.2
2.6
2.4
2.5
3.3
Number of
Fatal
Work-Related
Injuries
465
409
326
390
375
396
4,585
0
1
2
3
4
2008 2009 2010 2011 2012 2013
Year
Rate of Fatal Work-Related Injuries for California and U.S., 2008-2013
California
U.S.
Rat
e p
er 1
00
,000
fu
ll-t
ime
wo
rker
s

7
Occupational Health Indicators • Occupational Health Branch • CA Department of Public Health
Fatal Injuries Among Hispanic/Latino Workers
Hispanic/Latino workers continue to be at increased risk of dying on the job. These vulnerable
workers have a disproportionate rate of injuries, illnesses, and fatalities in the workplace largely
because they work in dangerous industries, may be particularly vulnerable due to their
immigration status, and may be subject to employer exploitation. Many are foreign-born, do
not speak English, and are not informed about their rights on the job. The U.S. Census Bureau
defines ‘Hispanic or Latino’ as a person of Cuban, Mexican, Puerto Rican, South or Central
American, or other Spanish culture or origin regardless of race. This Indicator was developed
by the Occupational Health Branch as part of its focus on health equity.
Data Sources: Not an official product of the Census of Fatal Occupational Injuries (CFOI). Rates were
calculated using data from CFOI for the number of fatalities, and a count of workers taken from Table
14, Employment status of the civilian noninstitutionalized population, by sex, age, race, Hispanic or La-
tino ethnicity, and marital status, from the Geographic Profile of Employment and Unemployment, Esti-
mates for States. (http://www.bls.gov/opub/gp/pdf/gp13_14.pdf)
Incidence Rate and Number of Fatalities Among Hispanic/Latino Workers for California,
2008-2013
Year
U.S. California
2008 2009 2010 2011 2012 2013 2013
Rate of Work-
Related Fatalities
Among Hispanics
per 100,000
Hispanic /Latino
Employees
3.2
3.0
2.6
2.7
2.3
3.2
3.9
Number of Work-
Related Fatalities
Among Hispanics/
Latinos
180
161
142
154
137
194
817
0
1
2
3
4
5
2008 2009 2010 2011 2012 2013
Year
Annual Fatality Rate Among Hispanic/Latino Workersfor California, 2008-2013
Ca lifornia
U.S.
Rat
e p
er 1
00
,000
em
plo
yee
s

8
Occupational Health Indicators • Occupational Health Branch • CA Department of Public Health
Pneumoconiosis Mortality
Pneumoconiosis is term for lung diseases caused by the inhalation of mineral dust, nearly
always in a work setting. Most cases of pneumoconiosis develop only after many years of
exposure to agents such as asbestos or coal dust; thus they are usually diagnosed in older
individuals. These diseases are incurable and may ultimately result in death. Types of
pneumoconioses include silicosis, asbestosis, and coal workers’ pneumoconiosis. Death
certificates are used to estimate the number of deaths due to pneumoconiosis or with
pneumoconiosis as a contributing factor. The causes of death on death certificates may be
recorded or coded inaccurately or incompletely, resulting in an underestimate of mortality due
to pneumoconiosis. In addition, workers with these conditions may remain undiagnosed or die
of other causes. See also the Indicator “Pneumoconiosis Hospitalizations”.
Data Sources: California Department of Public Health Vital Records, U.S. Census Bureau Population
Estimates
0
5
10
15
2008 2009 2010 2011 2012 2013
Year
Age-Standardized* Rate of Pneumoconiosis Mortality for California and U.S., 2008-2013
California
U.S.
Age-Standardized Mortality Rate and Number of Pneumoconiosis Deaths
for California and U.S., 2008-2013
Year
U.S. California
2008 2009 2010 2011 2012 2013 2013
Age-Standardized*
Rate of Total
Pneumoconiosis
Mortality per
Million Residents
4.0
3.4
4.3
3.4
3.1
3.6
6.8
Number of
Pneumoconiosis
Deaths
115
91
119
95
91
97
1,859
Rat
e p
er m
illi
on
res
iden
ts
* Age-standardized rates provide an estimate of what the rates of each condition would be if the age
distribution in California were the same as the age distribution in the U.S. as a whole; this allows
comparison between states.

9
Occupational Health Indicators • Occupational Health Branch • CA Department of Public Health
Rate and Number of Coal Worker Pneumoconiosis, Asbestosis, Silicosis, and Unspecified
Pneumoconiosis Deaths for California and U.S., 2008-2013
Year
U.S. California
2008 2009 2010 2011 2012 2013 2013
Age-Standardized*
Rate of Coal Worker
Pneumoconiosis
Mortality per Million
Residents
N/A
0.2
0.4
0.3
0.4
0.3
1.2
Number of Coal
Worker
Pneumoconiosis
Deaths
<5
6
12
9
13
8
361
Age-Standardized*
Rate of Asbestosis
Mortality per Million
Residents
3.6
3.1
3.8
2.8
2.4
3.0
4.5
Number of
Asbestosis
Deaths
103
81
102
79
69
79
1,229
Age-Standardized*
Rate of Silicosis
Mortality per Million
Residents
0.2
N/A
N/A
N/A
0.3
0.3
0.3
Number of Silicosis
Deaths
5
<5
<5
<5
8
7
111
Age-Standardized*
Rate of Unspecified
Pneumoconiosis
Mortality per Million
Residents
0.2
N/A
N/A
N/A
N/A
N/A
0.5
Number of
Unspecified
Pneumoconiosis
Deaths
5
<5
<5
<5
1
N/A
170
Data Sources: California Department of Public Health Vital Records, U.S. Census Bureau Population
Estimates
* Age-standardized rates provide an estimate of what the rates of each condition would be if the age
distribution in California were the same as the age distribution in the U.S. as a whole; this allows
comparison between states.
10
Occupational Health Indicators • Occupational Health Branch • CA Department of Public Health
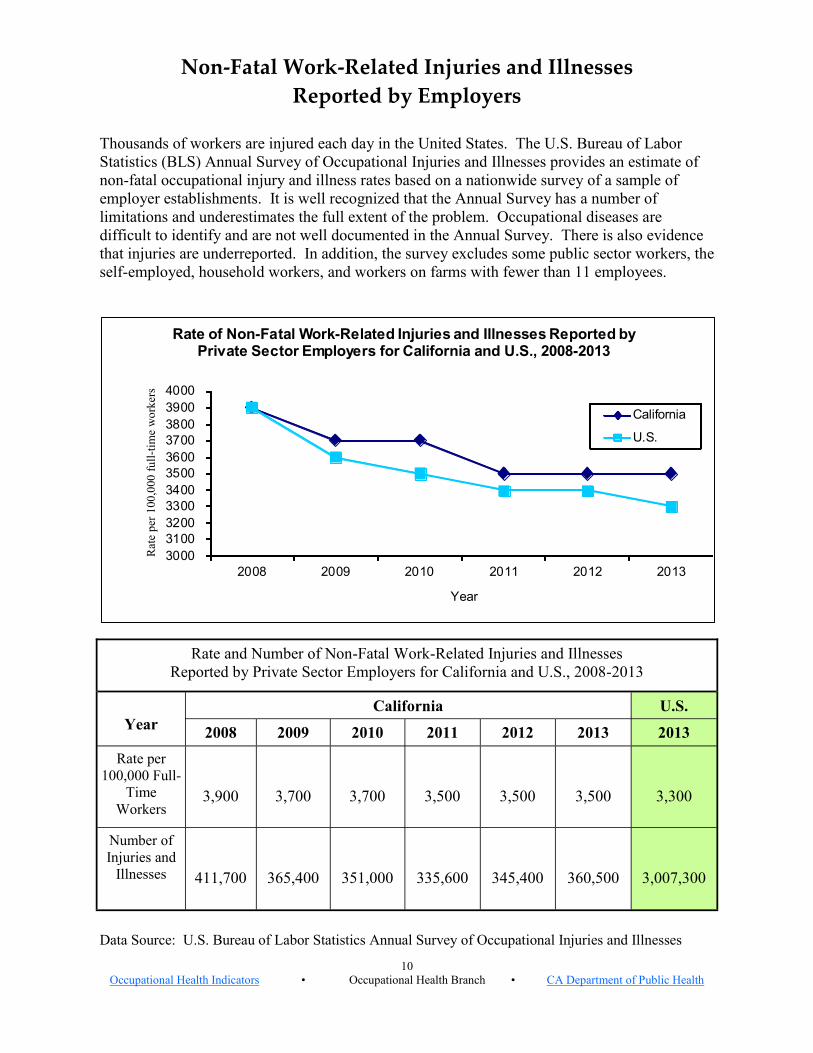
Non‐Fatal Work-Related Injuries and Illnesses
Reported by Employers
Thousands of workers are injured each day in the United States. The U.S. Bureau of Labor
Statistics (BLS) Annual Survey of Occupational Injuries and Illnesses provides an estimate of
non-fatal occupational injury and illness rates based on a nationwide survey of a sample of
employer establishments. It is well recognized that the Annual Survey has a number of
limitations and underestimates the full extent of the problem. Occupational diseases are
difficult to identify and are not well documented in the Annual Survey. There is also evidence
that injuries are underreported. In addition, the survey excludes some public sector workers, the
self-employed, household workers, and workers on farms with fewer than 11 employees.
Data Source: U.S. Bureau of Labor Statistics Annual Survey of Occupational Injuries and Illnesses
Rate and Number of Non-Fatal Work-Related Injuries and Illnesses
Reported by Private Sector Employers for California and U.S., 2008-2013
Year
U.S. California
2008 2009 2010 2011 2012 2013 2013
Rate per
100,000 Full-
Time
Workers
3,900
3,700
3,700
3,500
3,500
3,500
3,300
Number of
Injuries and
Illnesses
411,700
365,400
351,000
335,600
345,400
360,500
3,007,300
3000
3100
3200
3300
3400
3500
3600
3700
3800
3900
4000
2008 2009 2010 2011 2012 2013
Year
Rate of Non-Fatal Work-Related Injuries and Illnesses Reported by Private Sector Employers for California and U.S., 2008-2013
California
U.S.
Rat
e p
er 1
00
,000
fu
ll-t
ime
wo
rker
s
11
Occupational Health Indicators • Occupational Health Branch • CA Department of Public Health
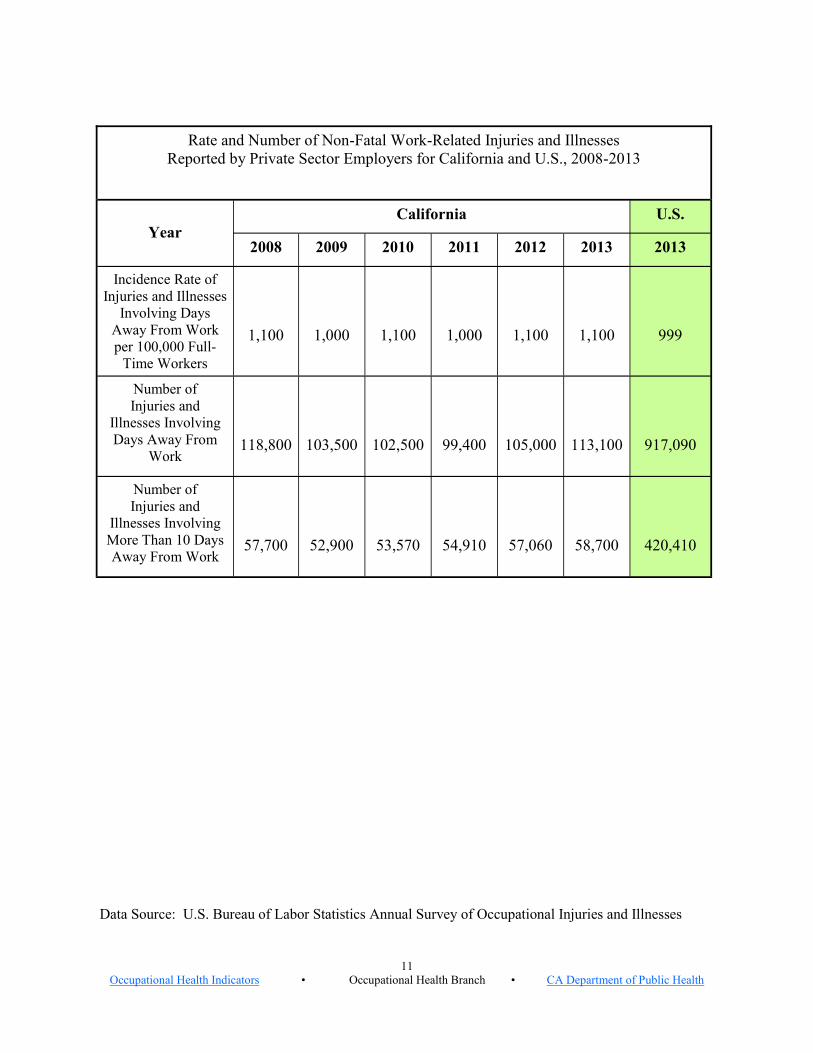
Rate and Number of Non-Fatal Work-Related Injuries and Illnesses
Reported by Private Sector Employers for California and U.S., 2008-2013
Year
U.S. California
2008 2009 2010 2011 2012 2013 2013
Incidence Rate of
Injuries and Illnesses
Involving Days
Away From Work
per 100,000 Full-
Time Workers
1,100
1,000
1,100
1,000
1,100
1,100
999
Number of
Injuries and
Illnesses Involving
Days Away From
Work
118,800
103,500
102,500
99,400
105,000
113,100
917,090
Number of
Injuries and
Illnesses Involving
More Than 10 Days
Away From Work
57,700
52,900
53,570
54,910
57,060
58,700
420,410
Data Source: U.S. Bureau of Labor Statistics Annual Survey of Occupational Injuries and Illnesses

12
Occupational Health Indicators • Occupational Health Branch • CA Department of Public Health
Musculoskeletal Disorders Reported by Employers
Work-related musculoskeletal disorders (MSDs) are some of the most common and costly
work-related health problems. MSDs are injuries or disorders of muscles, tendons, nerves,
ligaments, joints, or spinal discs that are caused or aggravated by work activities. These
injuries can significantly impact the ability of workers to perform their job and affect quality of
life both on and off the job. The majority of cases involve the back, neck, shoulders, or upper
extremities. The U.S. Bureau of Labor Statistics Annual Survey of Occupational Injuries and
Illnesses provides yearly estimates of work-related MSDs with days away from work. The
Annual Survey may underestimate the true number of MSDs due to underreporting and
exclusion of certain groups of workers. Furthermore, workers with MSDs may be treated by
their personal health care provider and not report these injuries to their employer, or they may
develop the disorder after leaving the employment responsible. See also the Indicators “Carpal
Tunnel Syndrome Cases Identified in State Workers’ Compensation Systems” and
“Hospitalizations for Work-Related Lower Back Disorders”.
Data Source: U.S. Bureau of Labor Statistics Annual Survey of Occupational Injuries and Illnesses
Rate and Number of Work-Related Musculoskeletal Disorders Involving Days Away From
Work Reported by Private Sector Employers for California and U.S., 2008-2013
Year
U.S. California
2008 2009 2010 2011 2012 2013 2013
Incidence Rate
per 100,000
Full-Time
Workers
262
286
317
385
409
415
335
Number of
Work-Related
MSDs
27,950
28,570
30,220
36,640
40,220
42,840
307,640
0
100
200
300
400
500
600
700
2008 2009 2010 2011 2012 2013
Year
Rate of Work-Related Musculosckeletal Disorders Involving Days
Away from Work Reported by Private Sector Employers for California and U.S., 2008-2013
California
U.S.
Rat
e p
er 1
00
,000
fu
ll-t
ime
wo
rker
s

13
Occupational Health Indicators • Occupational Health Branch • CA Department of Public Health
Rate and Number of Work-Related Musculoskeletal Disorders
Involving Days Away From Work Reported by Private Sector Employers for California and
U.S., 2008-2013
Year
U.S. California
2008 2009 2010 2011 2012 2013 2013
Incidence Rate of
MSD Cases
Involving the Neck,
Shoulder, and Upper
Extremities per
100,000 Full-Time
Workers
69
79
106
126
131
144
103
Number of MSDs of
the Neck, Shoulder,
and Upper
Extremities
7,420
7,840
10,210
12,080
12,820
14,850
94,620
Incidence Rate of
Carpal Tunnel
Syndrome Cases per
100,000 Full-Time
Workers
9.0
9.0
11.0
11.0
10.0
12.0
7.0
Number of Carpal
Tunnel Syndrome
Cases
970
880
1000
1,070
950
1,230
6,440
Incidence Rate of
MSD Cases
Involving the Back
per 100,000 Full-
Time Workers
140
135
140
160
164
150
137
Number of MSD
Cases Involving the
Back
14,890
13,480
13,320
15,290
16,130
15,510
126,070
Data Source: U.S. Bureau of Labor Statistics Annual Survey of Occupational Injuries and Illnesses

14
Occupational Health Indicators • Occupational Health Branch • CA Department of Public Health
Amputations Reported by Employers
Amputations are severe injuries that can result in a worker being unable to perform his or her
original job, resulting in reduced earning potential or permanent disability. An amputation is
defined as full or partial loss of a protruding body part – an arm, hand, finger, leg, foot, toe, ear,
or nose. The most common work-related amputation involves a finger. The U.S. Bureau of
Labor Statistics Annual Survey of Occupational Injuries and Illnesses provides yearly estimates
of the number and rate of work-related amputations that involve at least one day away from
work. The Annual Survey may underestimate the number of amputations due to underreporting
and exclusion of certain groups of workers. See also the Indicator “Amputations Identified in
State Workers’ Compensation Systems”.
Data Source: U.S. Bureau of Labor Statistics Annual Survey of Occupational Injuries and Illnesses
0
4
8
12
16
2008 2009 2010 2011 2012 2013
Year
Rate of Work-Related Amputations Involving Days Away From Work for California and U.S., 2008-2013
California
U.S.
Rate and Number of Work-Related Amputations Involving Days Away From Work
for California and U.S., 2008-2013
Year
U.S. California
2008 2009 2010 2011 2012 2013 2013
Rate per
100,000
Full-Time
Workers
6.0
3.0
5.0
3.0
2.0
3.0
7.0
Number of
Amputations
With Days
Away From
Work
630
340
470
310
200
310
6,160
Rat
e p
er 1
00
,000
fu
ll-t
ime
wo
rker
s

15
Occupational Health Indicators • Occupational Health Branch • CA Department of Public Health
Amputations Identified in State Workers’ Compensation
Systems
Amputations are severe injuries that can result in a worker being unable to perform his or her
original job, resulting in reduced earning potential or permanent disability. An amputation is
defined as full or partial loss of a protruding body part – an arm, hand, finger, leg, foot, toe, ear,
or nose. The most common work-related amputation involves a finger. The California
Workers’ Compensation Information System is used to identify claims filed for amputation
injuries, including lost time and medical claims. The number of amputations may be
undercounted, since some workers are not covered by workers’ compensation, and some
workers who are eligible do not file for workers’ compensation. Because of differences among
state workers’ compensation systems, national data are not available for this Indicator. See also
the Indicator “Amputations Reported by Employers”.
Data Sources: California Workers’ Compensation Information System, National Academy of Social
Insurance (NASI)
0
1
2
3
4
5
6
2008 2009 2010 2011 2012 2013
Year
Rate of Work-Related Amputations Filed With State Workers' Compensation for California, 2008-2013
California
Rat
e p
er 1
00
,000
co
ver
ed
wo
rker
s
Rate and Number of Work-Related Amputations Filed with State Workers’ Compensation
for California, 2008-2013
Year
U.S. California
2008 2009 2010 2011 2012 2013 2013
Rate per
100,000
Covered
Workers
5.4
4.7
4.6
4.2
3.9
4.2
N/A
Number of
Work-Related
Amputations
821
671
646
596
567
630
N/A
16
Occupational Health Indicators • Occupational Health Branch • CA Department of Public Health
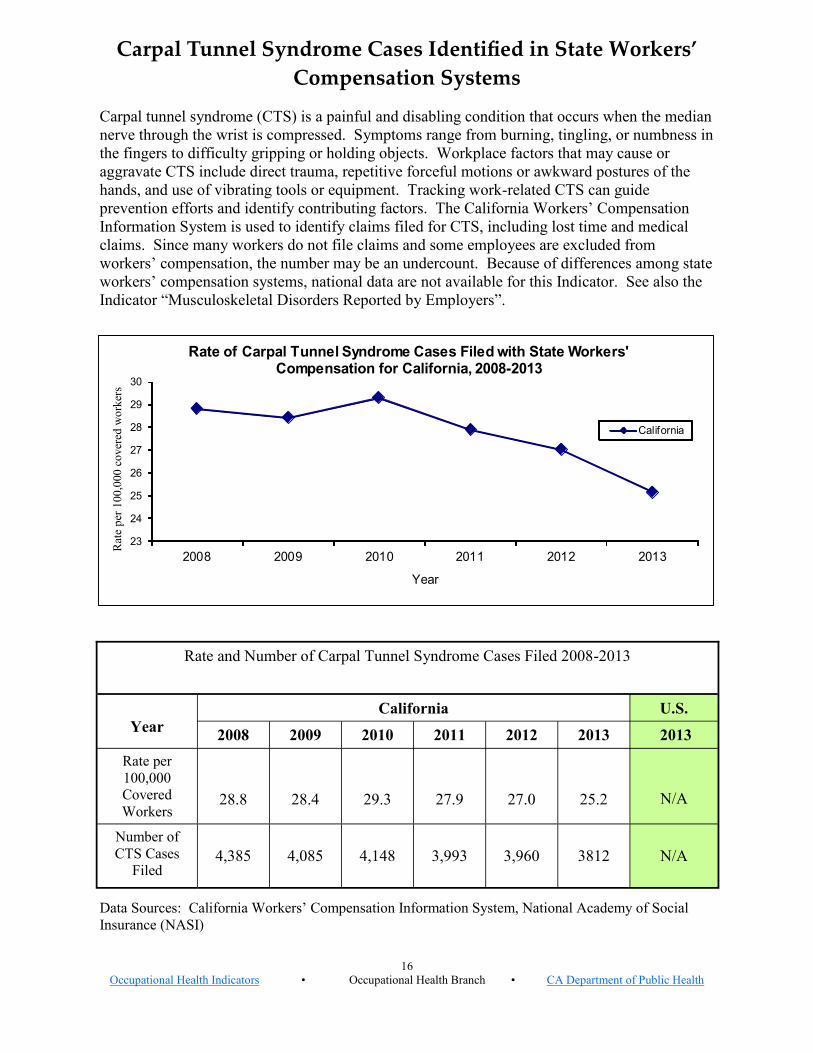
Carpal Tunnel Syndrome Cases Identified in State Workers’
Compensation Systems
Carpal tunnel syndrome (CTS) is a painful and disabling condition that occurs when the median
nerve through the wrist is compressed. Symptoms range from burning, tingling, or numbness in
the fingers to difficulty gripping or holding objects. Workplace factors that may cause or
aggravate CTS include direct trauma, repetitive forceful motions or awkward postures of the
hands, and use of vibrating tools or equipment. Tracking work-related CTS can guide
prevention efforts and identify contributing factors. The California Workers’ Compensation
Information System is used to identify claims filed for CTS, including lost time and medical
claims. Since many workers do not file claims and some employees are excluded from
workers’ compensation, the number may be an undercount. Because of differences among state
workers’ compensation systems, national data are not available for this Indicator. See also the
Indicator “Musculoskeletal Disorders Reported by Employers”.
Data Sources: California Workers’ Compensation Information System, National Academy of Social
Insurance (NASI)
Rate and Number of Carpal Tunnel Syndrome Cases Filed 2008-2013
Year
U.S. California
2008 2009 2010 2011 2012 2013 2013
Rate per
100,000
Covered
Workers
28.8
28.4
29.3
27.9
27.0
25.2
N/A
Number of
CTS Cases
Filed 4,385 4,085 4,148 3,993 3,960 3812 N/A
23
24
25
26
27
28
29
30
2008 2009 2010 2011 2012 2013
Year
Rate of Carpal Tunnel Syndrome Cases Filed with State Workers' Compensation for California, 2008-2013
California
Rat
e p
er 1
00
,000
co
ver
ed w
ork
ers

17
Occupational Health Indicators • Occupational Health Branch • CA Department of Public Health
Work-Related Hospitalizations
Workers who are hospitalized due to injuries and illnesses caused by work suffer some of the
most serious and costly adverse work-related health outcomes. Hospital discharge data from
non-federal acute care hospitals are used to calculate the number of work-related
hospitalizations per year by counting the individuals whose care was paid for by workers’
compensation. Since many people with work-related illnesses and injuries do not file for
workers’ compensation, or are not covered by workers’ compensation (e.g., self-employed
individuals), the true numbers of hospitalizations due to a work-related injury or illness are
likely to be undercounted. Most identified work-related hospitalizations are for treatment of
musculoskeletal disorders or acute injuries, rather than illnesses.
Data Sources: Office of Statewide Health Planning and Development Non-Public Hospital Discharge
Data, U.S. Bureau of Labor Statistics Current Population Survey
Rate and Number of Work-Related Hospitalizations
for California and U.S., 2008-2013
Year
U.S. California
2008 2009 2010 2011 2012 2013 2013
Rate per
100,000
Full-Time
Workers
138.0
135.7
137.1
133.3
127.2
117.4
N/A
Number of
Hospitaliza-
tions
23,529
21,965
21,898
21,643
21,063
19,952
N/A
0
20
40
60
80
100
120
140
160
2008 2009 2010 2011 2012 2013
Year
Rate of Work-Related Hospitalizations for California and U.S., 2008-2013
California
U.S.
Rat
e p
er 1
00
,000
fu
ll-t
ime
wo
rker
s

18
Occupational Health Indicators • Occupational Health Branch • CA Department of Public Health
Work-Related Severe Traumatic Injury Hospitalizations Workers who are hospitalized due to severe traumatic injuries caused by work suffer some of
the most serious and costly adverse work-related health outcomes. Hospital discharge data
from non-federal acute care hospitals are used to calculate the number of severe traumatic
work-related injury hospitalizations per year by counting the individuals whose care was paid
for by workers’ compensation. Many of these incidents are preventable and can result in costly,
permanent and disabling injuries with long-term disability. Cal/OSHA requires employers to
immediately report to the nearest District Office any case of serious work-related injury,
defined as involving a hospital stay for more than 24 hours. This Indicator was developed by
the states and added starting in 2012.
Incidence Rate and Number of Work-Related Severe Traumatic Injury Hospitalizations,
for California, 2012-2013
Year
U.S. California
2008 2009 2010 2011 2012 2013 2013
Rate of Work-
Related Severe
Traumatic Injury
Hospitalizations
per 100,000
Employees
N/A
N/A
N/A
N/A
8.9
8.6
N/A
Number of Work-
Related Severe
Traumatic Injury
Hospitalizations
N/A
N/A
N/A
N/A
1,475
1,469
N/A
7
8
9
10
2008 2009 2010 2011 2012 2013
Year
Work-Related Severe Traumatic Injury Hospitalizations
for California, 2008-2013
California
Rat
e p
er 1
00
,000
em
plo
yee
s
Data Sources: Office of Statewide Health Planning and Development Non-Public Hospital Discharge
Data, U.S. Bureau of Labor Statistics Current Population Survey

19
Occupational Health Indicators • Occupational Health Branch • CA Department of Public Health
Hospitalizations for Work-Related Lower Back Disorders
Hospitalizations for work-related lower back disorders have serious and costly effects, from
high medical bills to reduced work performance and lost productivity. Lower back pain is a
common disorder among the general population. An estimated two-thirds of lower back
disorder cases are related to work activities. Hospital discharge data from non-federal acute
care hospitals are used to identify lower back disorder hospitalizations that are paid for by
workers’ compensation. The number of hospitalizations for work-related lower back disorders
is likely to be undercounted, since not all workers are eligible for workers’ compensation, and
there may be inaccuracies in identifying payment source. This Indicator was developed by the
states and added starting in 2007.
Data Sources: Office of Statewide Health Planning and Development Non-Public Hospital Discharge
Data, U.S. Bureau of Labor Statistics Current Population Survey
Incidence Rate and Number of Hospitalizations for Work-Related Lower Back Disorders
for California and U.S., 2008-2013
Year
U.S. California
2008 2009 2010 2011 2012 2013 2013
Rate of Work-
Related Lower
Back Disorder
Hospitalizations
per 100,000
Employees
32.3
33.1
33.5
31.6
28.7
27.9
N/A
Number of Work-
Related Lower
Back Disorder
Hospitalizations
5,506
5,364
5,359
5,124
4,750
4,741
N/A
0
5
10
15
20
25
30
35
40
2008 2009 2010 2011 2012 2013
Year
Annual Rate of Lower Back Disorder Hospitalizations forCalifornia and U.S., 2008-2013
California
U.S.
Rat
e p
er 1
00
,000
em
plo
yee
s
20
Occupational Health Indicators • Occupational Health Branch • CA Department of Public Health
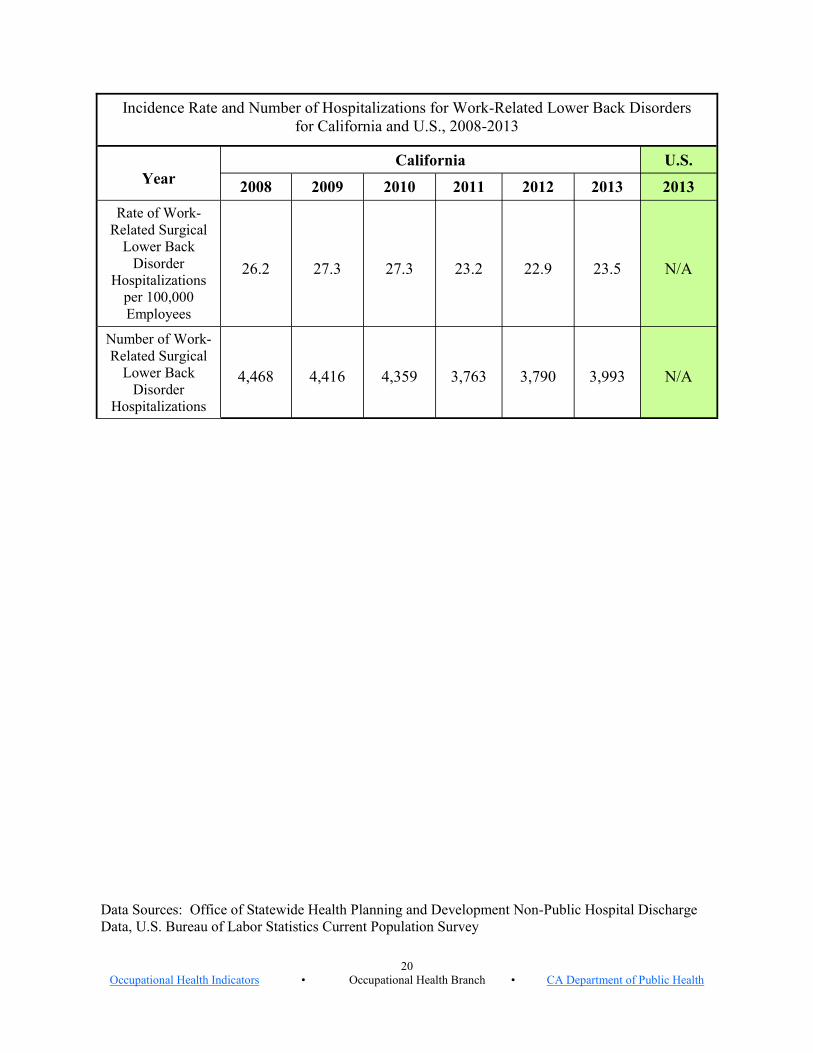
Incidence Rate and Number of Hospitalizations for Work-Related Lower Back Disorders
for California and U.S., 2008-2013
Year
U.S. California
2008 2009 2010 2011 2012 2013 2013
Rate of Work-
Related Surgical
Lower Back
Disorder
Hospitalizations
per 100,000
Employees
26.2
27.3
27.3
23.2
22.9
23.5
N/A
Number of Work-
Related Surgical
Lower Back
Disorder
Hospitalizations
4,468
4,416
4,359
3,763
3,790
3,993
N/A
Data Sources: Office of Statewide Health Planning and Development Non-Public Hospital Discharge
Data, U.S. Bureau of Labor Statistics Current Population Survey
21
Occupational Health Indicators • Occupational Health Branch • CA Department of Public Health
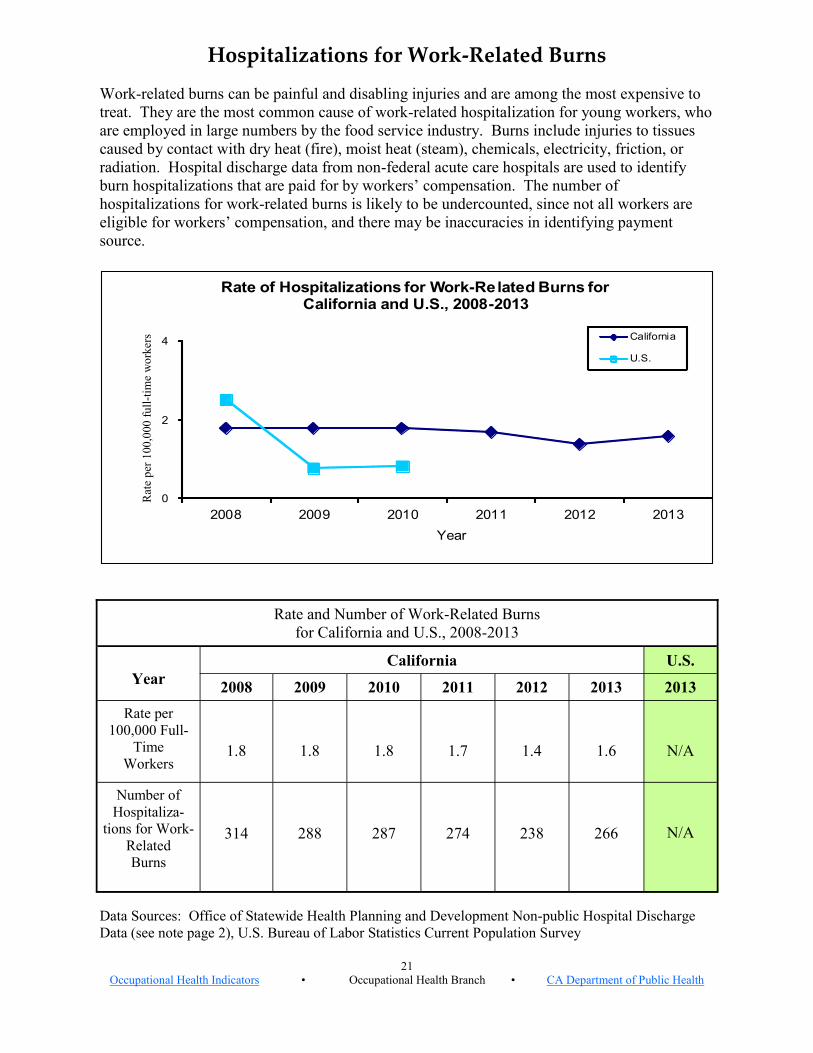
Hospitalizations for Work-Related Burns
Work-related burns can be painful and disabling injuries and are among the most expensive to
treat. They are the most common cause of work-related hospitalization for young workers, who
are employed in large numbers by the food service industry. Burns include injuries to tissues
caused by contact with dry heat (fire), moist heat (steam), chemicals, electricity, friction, or
radiation. Hospital discharge data from non-federal acute care hospitals are used to identify
burn hospitalizations that are paid for by workers’ compensation. The number of
hospitalizations for work-related burns is likely to be undercounted, since not all workers are
eligible for workers’ compensation, and there may be inaccuracies in identifying payment
source.
Data Sources: Office of Statewide Health Planning and Development Non-public Hospital Discharge
Data (see note page 2), U.S. Bureau of Labor Statistics Current Population Survey
Rate and Number of Work-Related Burns
for California and U.S., 2008-2013
Year
U.S. California
2008 2009 2010 2011 2012 2013 2013
Rate per
100,000 Full-
Time
Workers
1.8
1.8
1.8
1.7
1.4
1.6
N/A
Number of
Hospitaliza-
tions for Work-
Related
Burns
314
288
287
274
238
266
N/A
0
2
4
2008 2009 2010 2011 2012 2013
Year
Rate of Hospitalizations for Work-Related Burns for California and U.S., 2008-2013
California
U.S.
Rat
e p
er 1
00
,000
fu
ll-t
ime
wo
rker
s

22
Occupational Health Indicators • Occupational Health Branch • CA Department of Public Health
Pneumoconiosis Hospitalizations
Pneumoconiosis is a term for lung diseases caused by the inhalation of mineral dust, nearly
always in a work setting. Most cases of pneumoconiosis develop only after many years of
exposure to agents such as asbestos or coal dust; thus they are usually diagnosed in older
individuals. These diseases are incurable and may ultimately result in death. Types of
pneumoconioses include silicosis, asbestosis, and coal workers’ pneumoconiosis. Hospital
discharges with primary or contributing diagnoses of any of the types of pneumoconiosis are
used to calculate the number of hospitalizations among persons aged 15 or older. These data
probably underestimate pneumoconiosis cases because not all workers with that condition are
hospitalized. Furthermore, patients may be hospitalized with pneumoconiosis in a state other
than where they acquired it. Since pneumoconioses are generally diagnosed long after exposure
to the causative agent, current hospitalizations may not reflect current occupational conditions.
See also the Indicator “Pneumoconiosis Mortality”.
Data Sources: Office of Statewide Health Planning and Development Non-Public Hospital Discharge
Data, U.S. Bureau of Labor Statistics Current Population Survey
Age-Standardized* Rate and Number of Pneumoconiosis Hospitalizations
for California and U.S., 2008-2013
Year
U.S. California
2008 2009 2010 2011 2012 2013 2013
Age-Standardized*
Rate of Total
Pneumoconiosis
Hospitalizations per
Million
Residents
64.2
61.0
55.2
53.2
47.0
43.0
N/A
Number of
Pneumoconiosis
Hospitalizations
1,680
1,627
1,507
1,492
1,371
1,287
N/A
0
20
40
60
80
100
120
2008 2009 2010 2011 2012 2013
Year
Age-Standardized* Rate of Pneumoconiosis Hospitalizations for California and U.S., 2008-2013
California
U.S.
Rat
e p
er m
illi
on
res
iden
ts
* Age-standardized rates provide an estimate of what the rates of each condition would be if the age
distribution in California were the same as the age distribution in the U.S. as a whole; this allows
comparison between states.

23
Occupational Health Indicators • Occupational Health Branch • CA Department of Public Health
Age-Standardized* Rate and Number of Coal Worker Pneumoconiosis, Asbestosis,
Silicosis, and Unspecified Pneumoconiosis Hospitalizations
for California and U.S., 2008-2013
Year
U.S. California
2008 2009 2010 2011 2012 2013 2013
Age-Standardized*
Rate of Coal Worker
Pneumoconiosis
Hospitalizations per
Million Residents
3.3
3.1
2.2
2.5
2.3
1.6
N/A
Number of Coal
Worker
Pneumoconiosis
Hospitalizations
90
84
63
73
69
51
N/A
Age-Standardized*
Rate of Asbestosis
Hospitalizations per
Million Residents
56.1
53.5
49.7
46.4
40.6
37.4
N/A
Number of
Asbestosis
Hospitalizations
1,461
1,423
1,351
1,293
1,184
1,113
N/A
Age-Standardized*
Rate of Silicosis
Hospitalizations per
Million Residents
3.3
2.4
1.7
2.6
2.8
2.4
N/A
Number of
Silicosis
Hospitalizations
88
65
48
78
84
73
N/A
Age-Standardized*
Rate of Unspecified
Pneumoconiosis
Hospitalizations per
Million Residents
1.5
2.0
1.6
1.7
1.1
1.6
N/A
Number of
Unspecified
Pneumoconiosis
Hospitalizations
41
55
45
48
34
50
N/A
Data Sources: Office of Statewide Health Planning and Development Non-Public Hospital
Discharge Data, U.S. Bureau of Labor Statistics Current Population Survey
* Age-standardized rates provide an estimate of what the rates of each condition would be if the age
distribution in California were the same as the age distribution in the U.S. as a whole; this allows
comparison between states.
24
Occupational Health Indicators • Occupational Health Branch • CA Department of Public Health
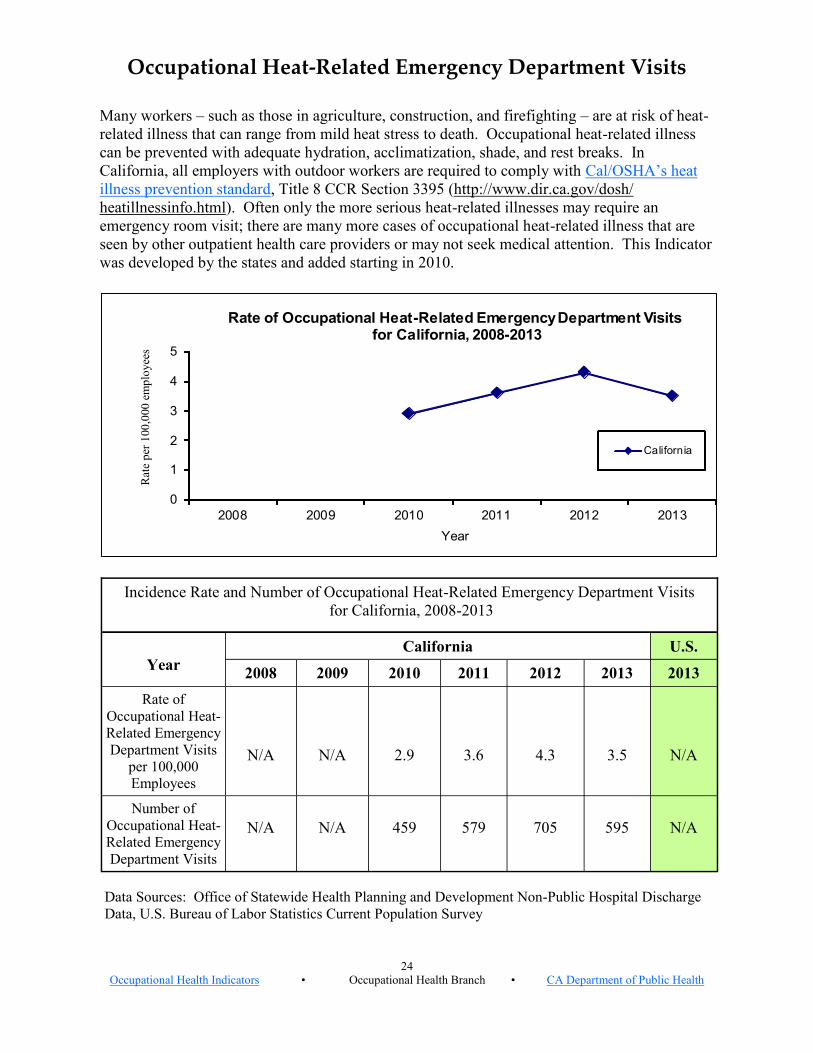
Occupational Heat-Related Emergency Department Visits Many workers – such as those in agriculture, construction, and firefighting – are at risk of heat-
related illness that can range from mild heat stress to death. Occupational heat-related illness
can be prevented with adequate hydration, acclimatization, shade, and rest breaks. In
California, all employers with outdoor workers are required to comply with Cal/OSHA’s heat
illness prevention standard, Title 8 CCR Section 3395 (http://www.dir.ca.gov/dosh/
heatillnessinfo.html). Often only the more serious heat-related illnesses may require an
emergency room visit; there are many more cases of occupational heat-related illness that are
seen by other outpatient health care providers or may not seek medical attention. This Indicator
was developed by the states and added starting in 2010.
Incidence Rate and Number of Occupational Heat-Related Emergency Department Visits
for California, 2008-2013
Year
U.S. California
2008 2009 2010 2011 2012 2013 2013
Rate of
Occupational Heat-
Related Emergency
Department Visits
per 100,000
Employees
N/A
N/A
2.9
3.6
4.3
3.5
N/A
Number of
Occupational Heat-
Related Emergency
Department Visits
N/A
N/A
459
579
705
595
N/A
0
1
2
3
4
5
2008 2009 2010 2011 2012 2013
Year
Rate of Occupational Heat-Related Emergency Department Visitsfor California, 2008-2013
California
Rat
e p
er 1
00
,000
em
plo
yee
s
Data Sources: Office of Statewide Health Planning and Development Non-Public Hospital Discharge
Data, U.S. Bureau of Labor Statistics Current Population Survey
25
Occupational Health Indicators • Occupational Health Branch • CA Department of Public Health
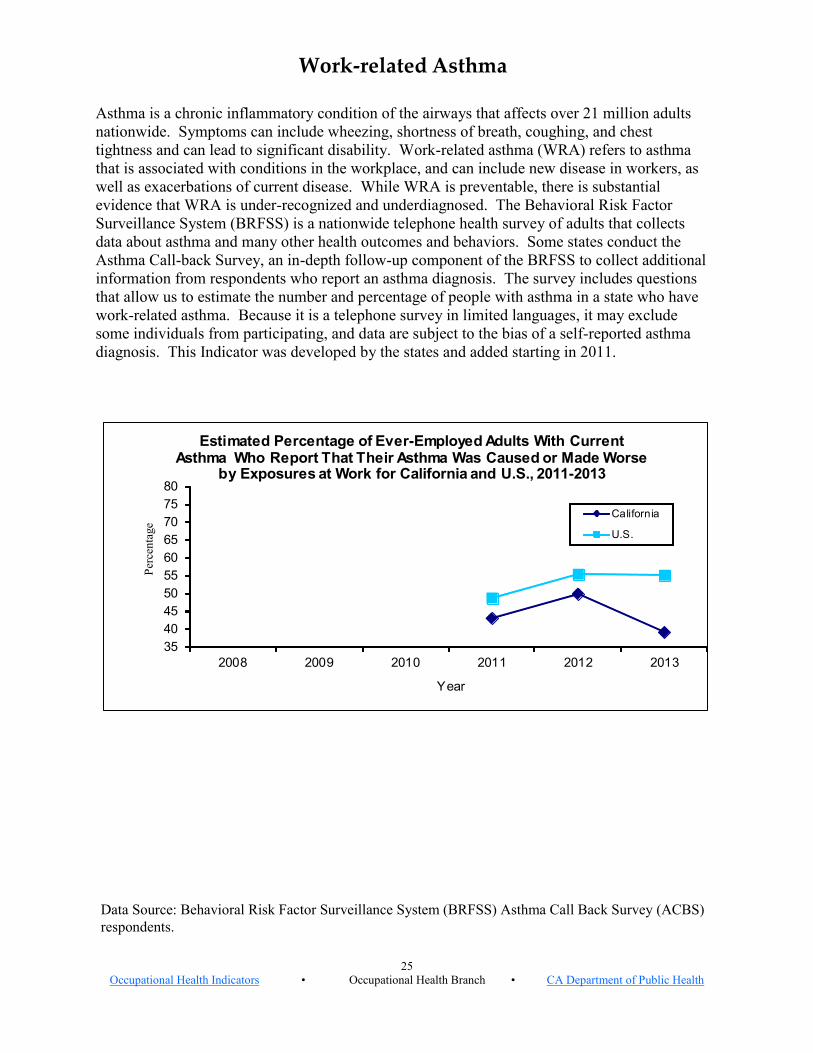
Work-related Asthma
Asthma is a chronic inflammatory condition of the airways that affects over 21 million adults
nationwide. Symptoms can include wheezing, shortness of breath, coughing, and chest
tightness and can lead to significant disability. Work-related asthma (WRA) refers to asthma
that is associated with conditions in the workplace, and can include new disease in workers, as
well as exacerbations of current disease. While WRA is preventable, there is substantial
evidence that WRA is under-recognized and underdiagnosed. The Behavioral Risk Factor
Surveillance System (BRFSS) is a nationwide telephone health survey of adults that collects
data about asthma and many other health outcomes and behaviors. Some states conduct the
Asthma Call-back Survey, an in-depth follow-up component of the BRFSS to collect additional
information from respondents who report an asthma diagnosis. The survey includes questions
that allow us to estimate the number and percentage of people with asthma in a state who have
work-related asthma. Because it is a telephone survey in limited languages, it may exclude
some individuals from participating, and data are subject to the bias of a self-reported asthma
diagnosis. This Indicator was developed by the states and added starting in 2011.
Data Source: Behavioral Risk Factor Surveillance System (BRFSS) Asthma Call Back Survey (ACBS)
respondents.
35
40
45
50
55
60
65
70
75
80
2008 2009 2010 2011 2012 2013
Year
Estimated Percentage of Ever-Employed Adults With Current Asthma Who Report That Their Asthma Was Caused or Made Worse
by Exposures at Work for California and U.S., 2011-2013
California
U.S.
Per
cen
tage

26
Occupational Health Indicators • Occupational Health Branch • CA Department of Public Health
Asthma Among Adults Caused or Made Worse by Work
for California and U.S., 2011-2013
Year
U.S. California
2008 2009 2010 2011 2012 2013 2013
Weighted Estimate
of the Number of
Ever-Employed
Adults With
Current Asthma
Who Report That
Their Asthma Was
Caused or Made
Worse By
Exposures at
Work
N/A
N/A
N/A
1,033,035
1,390,066
946,014
10,438,354
Estimated
Percentage of Ever
-Employed Adults
With Current
Asthma Who
Report That Their
Asthma Was
Caused or Made
Worse By
Exposures at
Work
N/A
N/A
N/A
43
50
39
55
Data Sources: Office of Statewide Health Planning and Development Non-Public Hospital Discharge
Data, U.S. Bureau of Labor Statistics Current Population Survey

27
Occupational Health Indicators • Occupational Health Branch • CA Department of Public Health
Acute Work-Related Pesticide Poisonings Reported
to Poison Control Centers
According to the U.S. EPA, between 20,000 and 40,000 workers are poisoned by pesticides
each year. Agricultural workers and pesticide applicators are at greatest risk for the more
severe pesticide poisonings. Some of these cases are reported to poison control centers (PCCs),
which gather information about the exposed worker and the pesticide. Calls to PCCs have been
estimated to capture only approximately 10% of acute work-related pesticide illness cases.
Twelve states, including California, have active programs that track acute occupational
pesticide illness using additional data sources; see the Occupational Pesticide Illness Prevention
Program website (http://www.cdph.ca.gov/pesticides). These data do not reflect adverse health
effects in workers related to chronic, long-term exposure to pesticides.
*Data before 2010 should not be compared with data from 2010 and later. Unlike the later data the pre-2010 data do not include
cases involving intentional misuse of a pesticide, and those exposed to one of the following pesticide types: disinfectant
industrial cleaner; bromine water/shock treatment; chlorine water/shock treatment; other type of insecticide/pesticide; or
unknown type of insecticide/pesticide.
0
1
2
3
2008 2009 2010 2011 2012 2013
Year
Rate of Acute Work-Related Pesticide Poisonings Reported to Poison Control Centers for California and U.S., 2008-2013
California
U.S.
Rate and Number of Acute Work-Related Pesticide Poisonings Reported to Poison Control
Centers for California and U.S., 2008-2013
Year
U.S. California
2008 2009 2010* 2011* 2012* 2013* 2013
Rate per
100,000
Employed
0.9
0.8
1.4
1.5
1.3
1.4
1.8
Number of
Work-
Related
Pesticide
Poisonings
151
128
217
244
217
229
2,631
Rat
e p
er 1
00
,000
em
plo
yed
Data Source: American Association of Poison Control Centers (AAPCC), U.S. Bureau of Labor
Statistics Current Population Survey

28
Occupational Health Indicators • Occupational Health Branch • CA Department of Public Health
Incidence of Malignant Mesothelioma
Mesothelioma is a rare but highly fatal cancer of the thin membranes surrounding the chest
cavity or abdominal cavity. The only well-established risk factor for mesothelioma is exposure
to asbestos fibers. Prior asbestos exposure, primarily in the workplace, has been reported in 62
to 85 percent of all mesothelioma cases. Mesothelioma is a disease of long latency, typically
with 20-40 years between exposure and onset of disease. The California Cancer Registry
collects data on newly diagnosed cancer cases. Since some cases of mesothelioma are not due
to work-related exposure, and Cancer Registry completeness varies, these data may over- or
underestimate the true incidence of work-related malignant mesothelioma.
Data Sources: State of California Cancer Registry, U.S. Census Bureau Population Estimates
Age-Standardized* Incidence Rate and Number of Malignant Mesothelioma Cases
for California and U.S., 2008-2013
Year
U.S. California
2008 2009 2010 2011 2012 2013 2013
Age-Standardized*
Rate of Malignant
Mesothelioma per
Million Residents
11.7
13.8
10.6
11.5
11.3
11.6
11.7
Number of
Malignant
Mesothelioma
Cases
311
373
292
332
330
362
3,114
0
2
4
6
8
10
12
14
16
18
20
2008 2009 2010 2011 2012 2013
Year
Age-Standardized* Incidence Rate of Malignant Mesothelioma for California and U.S., 2008-2013
California
U.S.
* Age-standardized rates provide an estimate of what the rates of each condition would be if the age
distribution in California were the same as the age distribution in the U.S. as a whole; this allows
comparison between states.
Rat
e p
er m
illi
on
res
iden
ts

29
Occupational Health Indicators • Occupational Health Branch • CA Department of Public Health
Elevated Blood Lead Levels Among Adults
Despite being a well-known and preventable illness, lead poisoning remains a significant
problem for many adults in California. Most lead exposure in adults is from the workplace.
Lead exposure at work occurs in a variety of industries, and overexposure to lead can cause
anemia, nervous system or kidney damage, high blood pressure, decreased fertility, and
miscarriage. Lead from work can also be brought home on a worker’s clothing or shoes, and
can cause health damage to family members.
The blood lead level (BLL) is the best biological indicator of recent lead exposure, and most
states require laboratories to report BLL results. A BLL of 5 µg/dL is now considered
“elevated”, and the current Healthy People 2020 goal is to reduce the proportion of adults with
BLLs at or above 10 µg/dL.* Cal/OSHA requires that employers regularly monitor the BLLs of
lead-exposed workers. New information about health effects at lower BLLs shows that workers
are not adequately protected under the current OSHA standards, which are based on health
information that is over 30 years old.
The true number of Californians with elevated BLLs is likely even greater than reported, as not
all employers in lead-using workplaces provide the required BLL testing. Approximately 30
states, including California, have active programs that track adult BLLs; see the Occupational
Lead Poisoning Prevention Program website (http://www.cdph.ca.gov/olppp).
Data Sources: State of California Occupational Lead Poisoning Prevention Program (OLPPP),
U.S. Bureau of Labor Statistics Current Population Survey
0
500
1000
1500
2000
2500
3000
3500
2008 2009 2010 2011 2012 2013
Year
Number of Adults** Reported with Elevated (> 10 µg/dL) BLLs for California, 2008-2013
California
*In 2015, the National Institute for Occupational Safety and Health lowered its definition of “elevated
BLL” to 5 µg/dL due to emerging science on health effects at lower BLLs.
** Because determining whether BLLs are work-related can be difficult, this Indicator reports BLLs in
all adults, not just workers.
Nu
mb
er o
f ad
ult
s

30
Occupational Health Indicators • Occupational Health Branch • CA Department of Public Health
Data Sources: State of California Occupational Lead Poisoning Prevention Program (OLPPP),
U.S. Bureau of Labor Statistics Current Population Survey
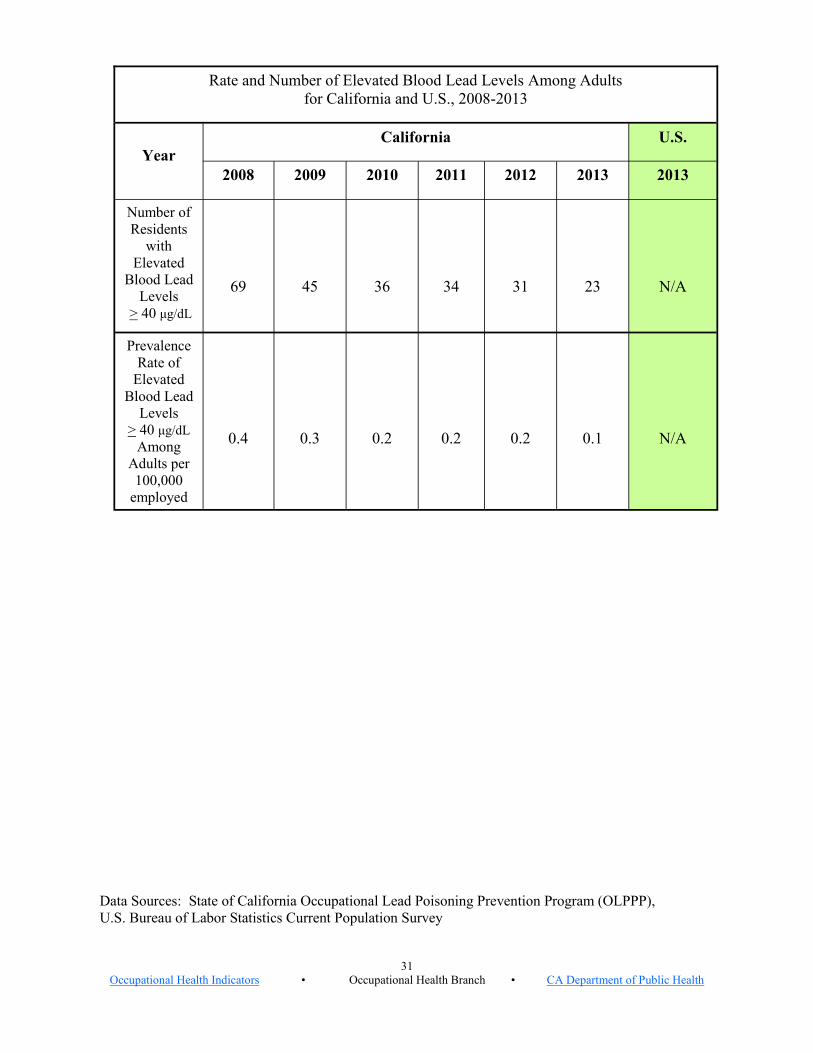
Rate and Number of Elevated Blood Lead Levels Among Adults
for California and U.S., 2008-2013
Year
California U.S.
2008 2009 2010 2011 2012 2013 2013
Number of
Residents with
Elevated Blood
Lead Levels
> 10 μg/dL
2,244
1,982
1,716
1,787
1,789
1,803
18,036
Prevalence Rate
of
Elevated Blood
Lead Levels
> 10 μg/dL
Among Adults
per 100,000
employed
13.2
12.2
10.7
11.0
10.8
6.1
19.0
Number of
Residents with
Elevated Blood
Lead Levels
> 25 μg/dL
370
318
236
228
220
191
4,836
Prevalence Rate
of
Elevated Blood
Lead Levels
> 25 μg/dL
Among Adults
per 100,000
employed
2.2
2.0
1.5
1.4
1.3
0.6
4.9
31
Occupational Health Indicators • Occupational Health Branch • CA Department of Public Health
Data Sources: State of California Occupational Lead Poisoning Prevention Program (OLPPP),
U.S. Bureau of Labor Statistics Current Population Survey
Rate and Number of Elevated Blood Lead Levels Among Adults
for California and U.S., 2008-2013
California U.S.
Year
2008 2009 2010 2011 2012 2013 2013
Number of
Residents
with
Elevated
Blood Lead
Levels
> 40 μg/dL
69
45
36
34
31
23
N/A
Prevalence
Rate of
Elevated
Blood Lead
Levels
> 40 μg/dL
Among
Adults per
100,000
employed
0.4
0.3
0.2
0.2
0.2
0.1
N/A
32
Occupational Health Indicators • Occupational Health Branch • CA Department of Public Health
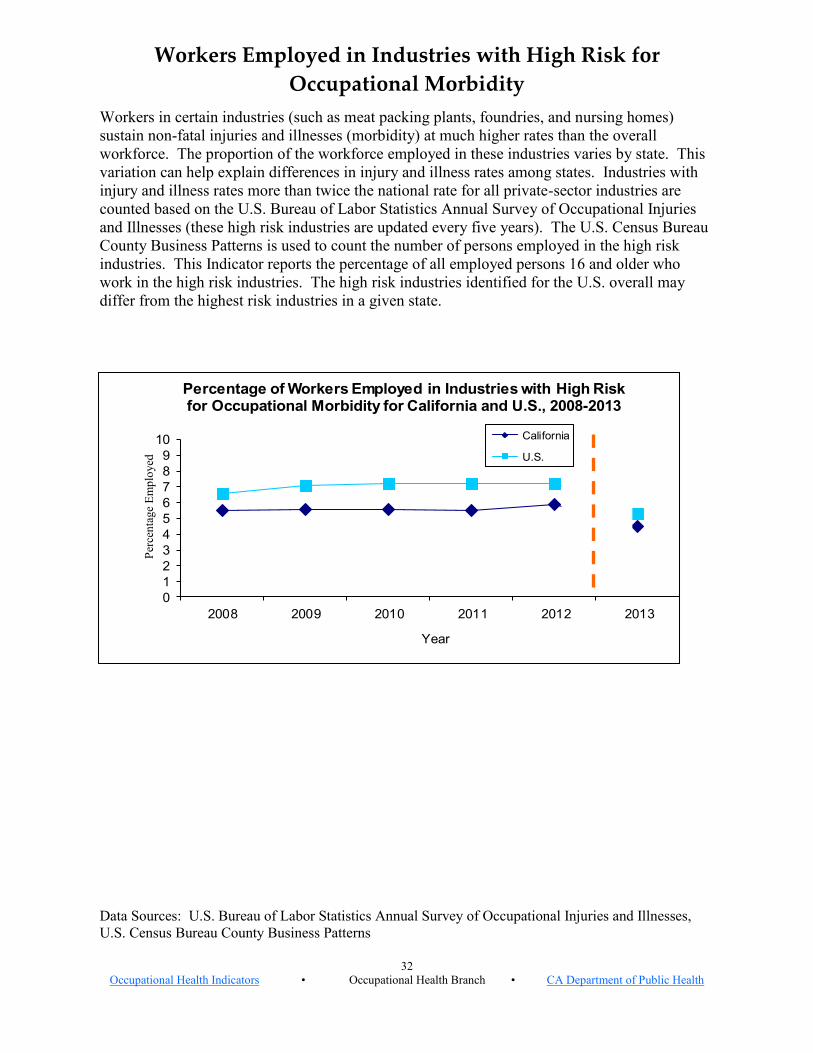
Workers Employed in Industries with High Risk for
Occupational Morbidity
Workers in certain industries (such as meat packing plants, foundries, and nursing homes)
sustain non-fatal injuries and illnesses (morbidity) at much higher rates than the overall
workforce. The proportion of the workforce employed in these industries varies by state. This
variation can help explain differences in injury and illness rates among states. Industries with
injury and illness rates more than twice the national rate for all private-sector industries are
counted based on the U.S. Bureau of Labor Statistics Annual Survey of Occupational Injuries
and Illnesses (these high risk industries are updated every five years). The U.S. Census Bureau
County Business Patterns is used to count the number of persons employed in the high risk
industries. This Indicator reports the percentage of all employed persons 16 and older who
work in the high risk industries. The high risk industries identified for the U.S. overall may
differ from the highest risk industries in a given state.
Data Sources: U.S. Bureau of Labor Statistics Annual Survey of Occupational Injuries and Illnesses,
U.S. Census Bureau County Business Patterns
0
1
2
3
4
5
6
7
8
9
10
2008 2009 2010 2011 2012 2013
Year
Percentage of Workers Employed in Industries with High Risk for Occupational Morbidity for California and U.S., 2008-2013
California
U.S.
Per
cen
tage
Em
plo
yed

33
Occupational Health Indicators • Occupational Health Branch • CA Department of Public Health
Percentage and Number of Workers Employed in Industries With
High Risk for Morbidity for California and U.S., 2008-2013
Year
U.S. California
20081 20091 20101 20111 20121 20132 20132
Percentage
of Workers
Employed in
Industries
With High
Risk for
Morbidity
5.5
5.6
5.6
5.6
5.9
4.5
5.3
Number of
Workers
Employed in
Industries
With High
Risk for
Morbidity
758,719
714,562
698,383
707,002
768,995
601,448
6,409,798
Data Sources: U.S. Bureau of Labor Statistics Annual Survey of Occupational Injuries and Illnesses,
U.S. Census Bureau County Business Patterns
1Technical note: The 55 high risk industries selected for this Indicator had injury and illness rates greater than 7.8
cases per 100 full-time workers - more than twice the overall national injury and illness rates, as estimated by the
U.S. Bureau of Labor Statistics Survey of Occupational Injuries and Illnesses, 2008.
2Technical note: In 2014, 54 industries had occupational injury and illness rates of more than double the
national rate, or 6.4 cases per 100 full-time workers or higher. For this Indicator (2013-2017), these industries are
classified as high risk industries and they accounted for 6.3 million workers in the United States (5.3% of the
private sector non-farm wage and salary employment).
34
Occupational Health Indicators • Occupational Health Branch • CA Department of Public Health
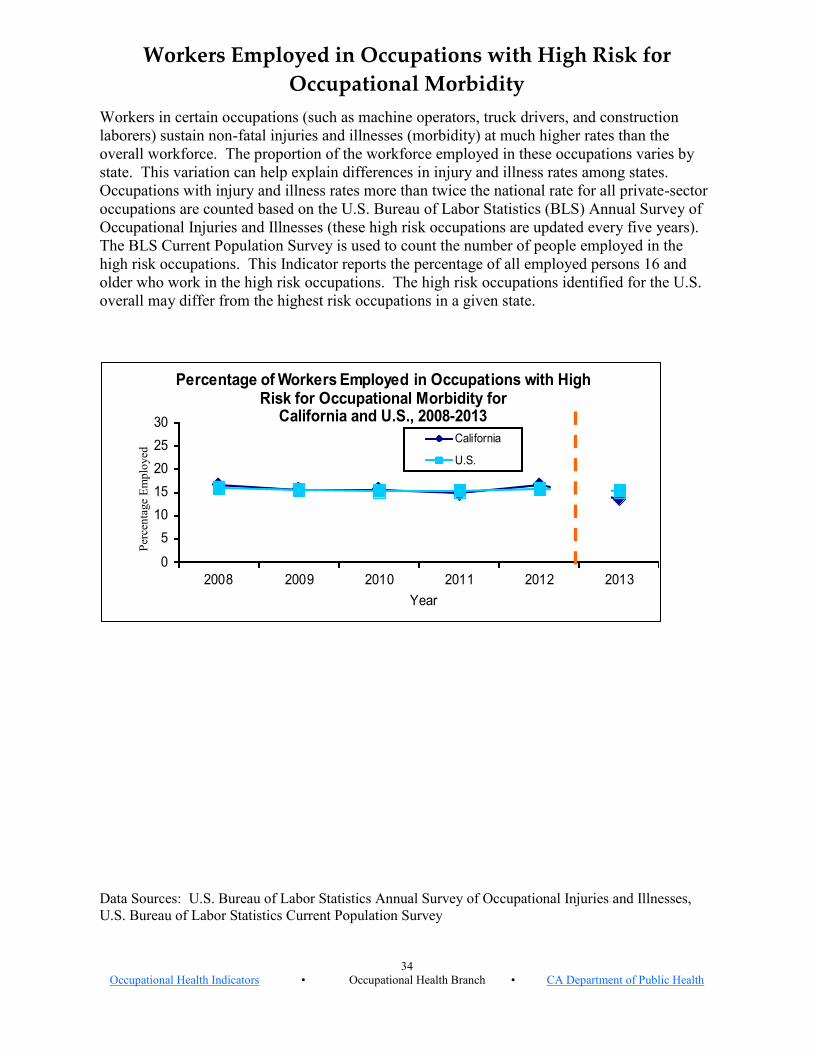
Workers Employed in Occupations with High Risk for
Occupational Morbidity
Workers in certain occupations (such as machine operators, truck drivers, and construction
laborers) sustain non-fatal injuries and illnesses (morbidity) at much higher rates than the
overall workforce. The proportion of the workforce employed in these occupations varies by
state. This variation can help explain differences in injury and illness rates among states.
Occupations with injury and illness rates more than twice the national rate for all private-sector
occupations are counted based on the U.S. Bureau of Labor Statistics (BLS) Annual Survey of
Occupational Injuries and Illnesses (these high risk occupations are updated every five years).
The BLS Current Population Survey is used to count the number of people employed in the
high risk occupations. This Indicator reports the percentage of all employed persons 16 and
older who work in the high risk occupations. The high risk occupations identified for the U.S.
overall may differ from the highest risk occupations in a given state.
Data Sources: U.S. Bureau of Labor Statistics Annual Survey of Occupational Injuries and Illnesses,
U.S. Bureau of Labor Statistics Current Population Survey
0
5
10
15
20
25
30
2008 2009 2010 2011 2012 2013
Year
Percentage of Workers Employed in Occupations with High Risk for Occupational Morbidity for
California and U.S., 2008-2013
California
U.S.
Per
cen
tage
Em
plo
yed

35
Occupational Health Indicators • Occupational Health Branch • CA Department of Public Health
Percentage and Number of Workers Employed in Occupations With
High Risk for Morbidity for California and U.S., 2008-2013
Year
U.S. California
20081 20091 20101 20111 20121 20132 20132
Percentage of
Workers
Employed in
Occupations
With High
Risk for
Morbidity
16.5
15.6
15.5
14.9
16.5
13.8
15.4
Number of
Workers
Employed in
Occupations
With High
Risk for
Morbidity
2,063,163
1,848,720
1,740,331
1,723,133
1,991,205
1,714,465
18,002,277
Data Sources: U.S. Bureau of Labor Statistics Annual Survey of Occupational Injuries and Illnesses,
U.S. Bureau of Labor Statistics Current Population Survey
1Technical note: The 61 high risk occupations selected for this Indicator had injury and illness rates that exceed 2.2
cases per 100 full-time workers – twice the overall national injury and illness rates, as estimated by the U.S. Bu-
reau of Labor Statistics Survey of Occupational Injuries and Illnesses, 2008.
2Technical note: The 49 high risk occupations selected for this Indicator (2013-2017) had private sector injury and
illness rates that exceed 1.9 cases per 100 full-time workers – twice the overall national injury and illness rates, as
estimated by the U.S. Bureau of Labor Statistics Survey of Occupational Injuries and Illnesses, 2014.
36
Occupational Health Indicators • Occupational Health Branch • CA Department of Public Health
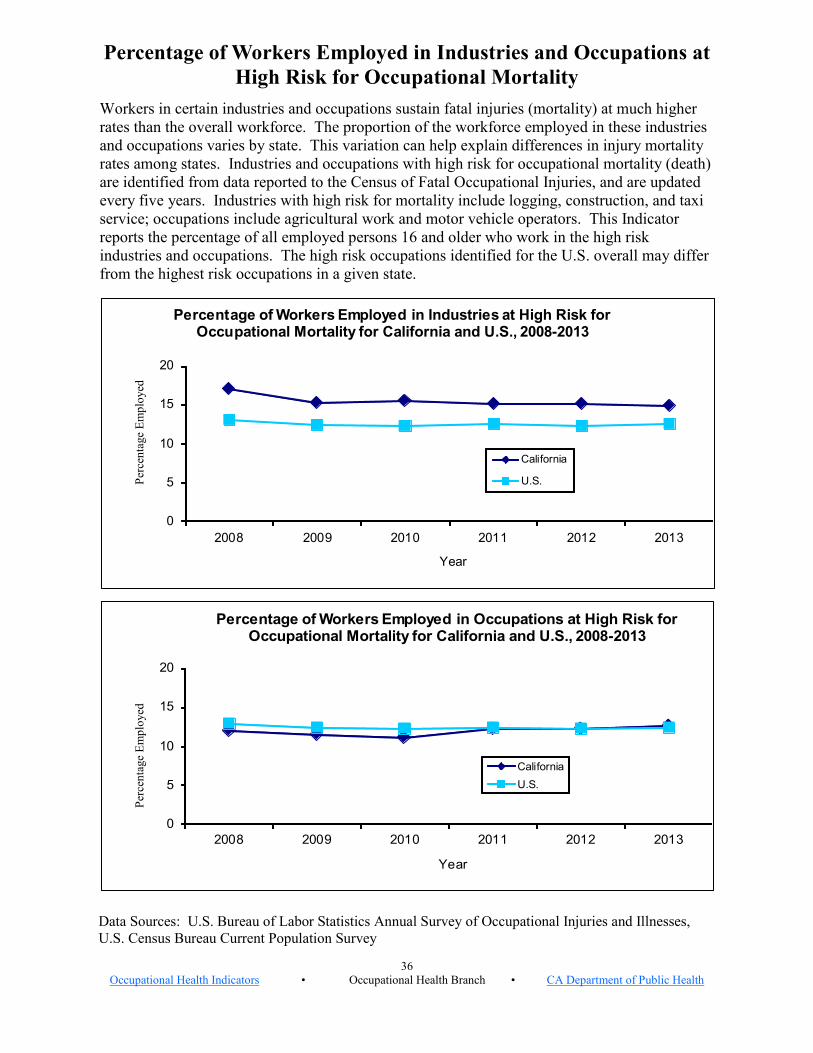
Percentage of Workers Employed in Industries and Occupations at
High Risk for Occupational Mortality
Workers in certain industries and occupations sustain fatal injuries (mortality) at much higher
rates than the overall workforce. The proportion of the workforce employed in these industries
and occupations varies by state. This variation can help explain differences in injury mortality
rates among states. Industries and occupations with high risk for occupational mortality (death)
are identified from data reported to the Census of Fatal Occupational Injuries, and are updated
every five years. Industries with high risk for mortality include logging, construction, and taxi
service; occupations include agricultural work and motor vehicle operators. This Indicator
reports the percentage of all employed persons 16 and older who work in the high risk
industries and occupations. The high risk occupations identified for the U.S. overall may differ
from the highest risk occupations in a given state.
Data Sources: U.S. Bureau of Labor Statistics Annual Survey of Occupational Injuries and Illnesses,
U.S. Census Bureau Current Population Survey
0
5
10
15
20
2008 2009 2010 2011 2012 2013
Year
Percentage of Workers Employed in Industries at High Risk for Occupational Mortality for California and U.S., 2008-2013
California
U.S.
0
5
10
15
20
2008 2009 2010 2011 2012 2013
Year
Percentage of Workers Employed in Occupations at High Risk for Occupational Mortality for California and U.S., 2008-2013
California
U.S.
Per
cen
tage
Em
plo
yed
P
erce
nta
ge
Em
plo
yed

37
Occupational Health Indicators • Occupational Health Branch • CA Department of Public Health
Percentage and Number of Workers Employed in Industries and Occupations With
High Risk for Mortality for California and U.S., 2008-2013
Year
U.S. California
20081 20091 20101 20111 20121 20131 20131
Percentage of
Workers
Employed in
Industries
With High
Risk for
Mortality
17.1
15.3
15.5
15.1
15.1
14.9
15.4
Number of
Workers
Employed in
Industries
With High
Risk for
Mortality
2,498,429
2,124,625
2,104,412
2,216,492
2,136,617
2,164,870
19,070,007
Percentage of
Workers
Employed in
Occupations
With High
Risk for
Mortality
12.1
11.5
11.2
12.3
12.3
12.7
12.5
Number of
Workers
Employed in
Occupations
With High
Risk for
Mortality
1,766,964
1,599,795
1,522,748
1,801,602
1,741,726
1,851,941
15,442,987
Data Sources: U.S. Bureau of Labor Statistics Annual Survey of Occupational Injuries and Illnesses,
U.S. Census Bureau Current Population Survey
1Technical note: The 40 industries selected for this Indicator have fatality rates greater than 7.5 deaths per 100,000
workers or higher, and employed approximately 20.6 million workers (16.6% of the private sector
employment), but account for 64% of the occupational fatalities in 2008. The 65 occupations selected for this
Indicator have fatality rates of 7.5 deaths per 100,000 workers or higher. These occupations account for
approximately 16.1 million workers in the U.S. (13% of the private sector employment), but 66% of the
occupational fatalities in 2008.
38
Occupational Health Indicators • Occupational Health Branch • CA Department of Public Health
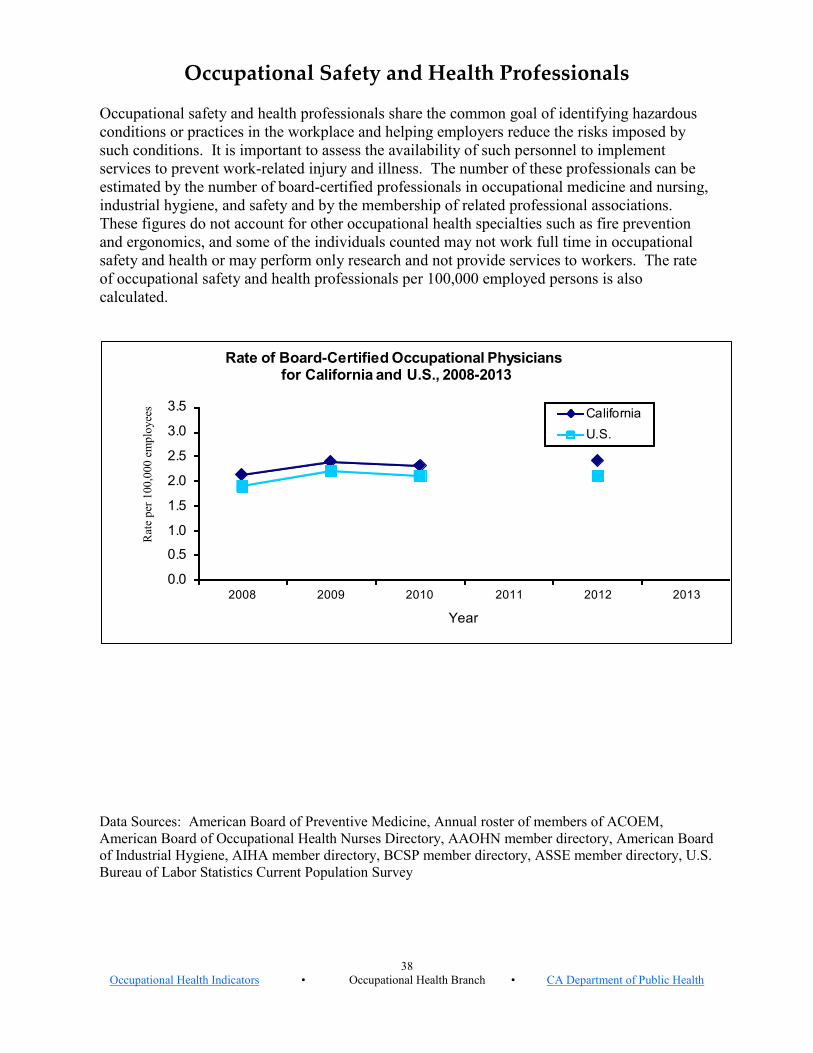
Occupational Safety and Health Professionals
Occupational safety and health professionals share the common goal of identifying hazardous
conditions or practices in the workplace and helping employers reduce the risks imposed by
such conditions. It is important to assess the availability of such personnel to implement
services to prevent work-related injury and illness. The number of these professionals can be
estimated by the number of board-certified professionals in occupational medicine and nursing,
industrial hygiene, and safety and by the membership of related professional associations.
These figures do not account for other occupational health specialties such as fire prevention
and ergonomics, and some of the individuals counted may not work full time in occupational
safety and health or may perform only research and not provide services to workers. The rate
of occupational safety and health professionals per 100,000 employed persons is also
calculated.
Data Sources: American Board of Preventive Medicine, Annual roster of members of ACOEM,
American Board of Occupational Health Nurses Directory, AAOHN member directory, American Board
of Industrial Hygiene, AIHA member directory, BCSP member directory, ASSE member directory, U.S.
Bureau of Labor Statistics Current Population Survey
0.0
0.5
1.0
1.5
2.0
2.5
3.0
3.5
2008 2009 2010 2011 2012 2013
Year
Rate of Board-Certified Occupational Physiciansfor California and U.S., 2008-2013
California
U.S.
Rat
e p
er 1
00
,000
em
plo
yee
s
39
Occupational Health Indicators • Occupational Health Branch • CA Department of Public Health
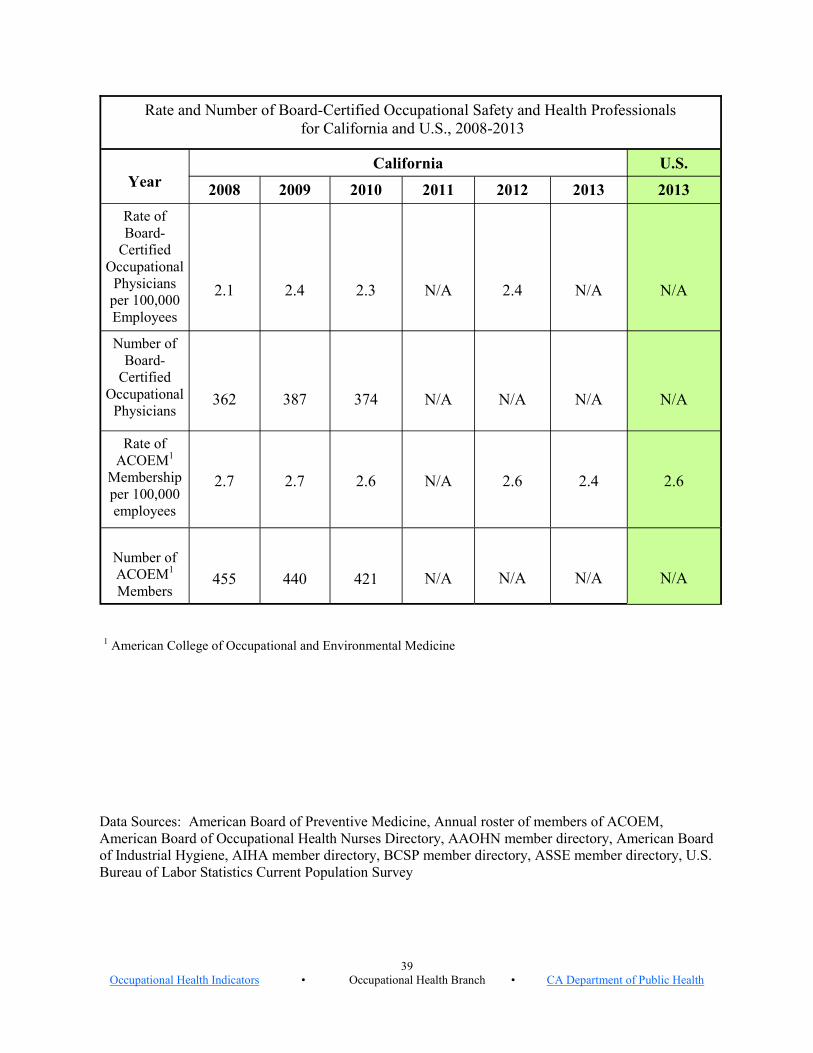
Rate and Number of Board-Certified Occupational Safety and Health Professionals
for California and U.S., 2008-2013
Year
U.S. California
2008 2009 2010 2011 2012 2013 2013
Rate of
Board-
Certified
Occupational
Physicians
per 100,000
Employees
2.1
2.4
2.3
N/A
2.4
N/A
N/A
Number of
Board-
Certified
Occupational
Physicians
362
387
374
N/A
N/A
N/A
N/A
Rate of
ACOEM1
Membership
per 100,000
employees
2.7
2.7
2.6
N/A
2.6
2.4
2.6
Number of
ACOEM1
Members
455
440
421
N/A
N/A
N/A
N/A
Data Sources: American Board of Preventive Medicine, Annual roster of members of ACOEM,
American Board of Occupational Health Nurses Directory, AAOHN member directory, American Board
of Industrial Hygiene, AIHA member directory, BCSP member directory, ASSE member directory, U.S.
Bureau of Labor Statistics Current Population Survey
1 American College of Occupational and Environmental Medicine

40
Occupational Health Indicators • Occupational Health Branch • CA Department of Public Health
Rate and Number of Board-Certified Occupational Safety and Health Professionals
for California and U.S., 2008-2013
Year
California U.S.
2008 2009 2010 2011 2012 2013 2013
Rate of
Board-
Certified
Occupational
Health
Registered
Nurses per
100,000
Employees
2.3
2.4
2.4
N/A
N/A
1.9
3.1
Number of
Board-
Certified
Occupational
Health
Registered
Nurses
389
394
382
N/A
N/A
N/A
N/A
Rate of
AAOHN1
Membership per
100,000
Employees
2.8
2.6
N/A
N/A
1.6
N/A
N/A
Number of
AAOHN1
Members
470
414
N/A
N/A
N/A
N/A
N/A
Data Sources: American Board of Preventive Medicine, Annual roster of members of ACOEM,
American Board of Occupational Health Nurses Directory, AAOHN member directory, American Board
of Industrial Hygiene, AIHA member directory, BCSP member directory, ASSE member directory, U.S.
Bureau of Labor Statistics Current Population Survey
1 American Association of Occupational Health Nurses
41
Occupational Health Indicators • Occupational Health Branch • CA Department of Public Health
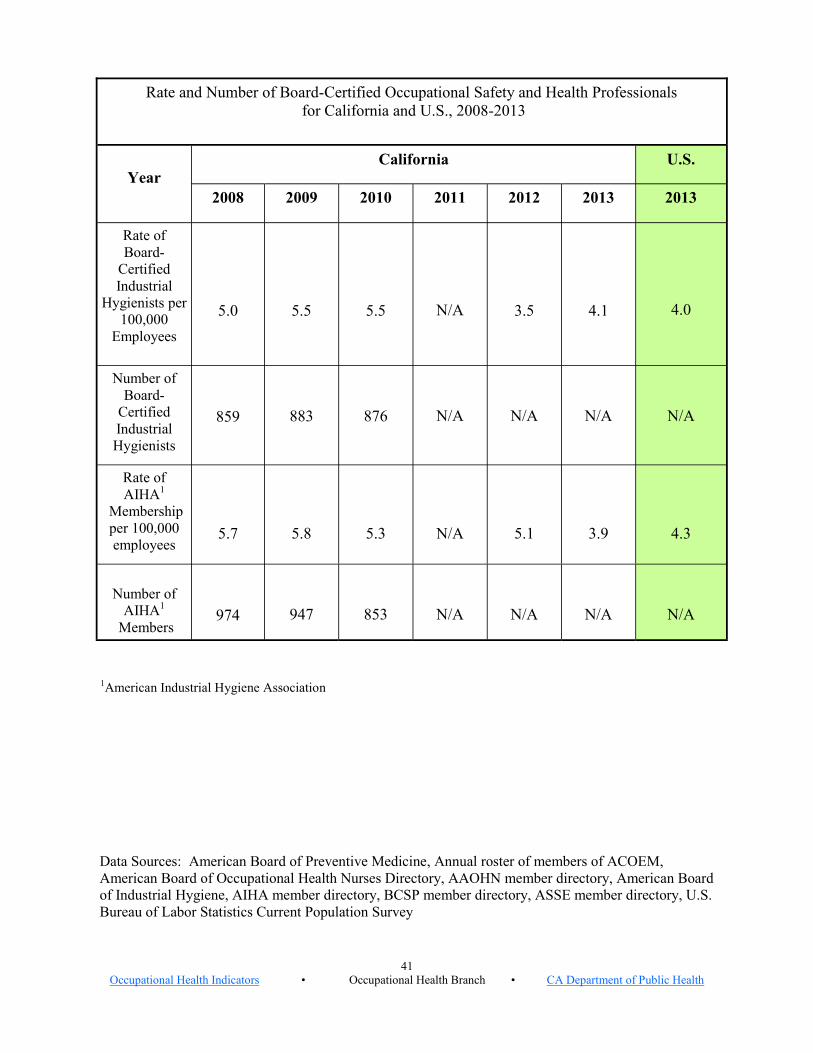
Rate and Number of Board-Certified Occupational Safety and Health Professionals
for California and U.S., 2008-2013
Year
California U.S.
2008 2009 2010 2011 2012 2013 2013
Rate of
Board-
Certified
Industrial
Hygienists per
100,000
Employees
5.0
5.5
5.5
N/A
3.5
4.1
4.0
Number of
Board-
Certified
Industrial
Hygienists
859
883
876
N/A
N/A
N/A
N/A
Rate of
AIHA1
Membership
per 100,000
employees
5.7
5.8
5.3
N/A
5.1
3.9
4.3
Number of
AIHA1
Members
974
947
853
N/A
N/A
N/A
N/A
Data Sources: American Board of Preventive Medicine, Annual roster of members of ACOEM,
American Board of Occupational Health Nurses Directory, AAOHN member directory, American Board
of Industrial Hygiene, AIHA member directory, BCSP member directory, ASSE member directory, U.S.
Bureau of Labor Statistics Current Population Survey
1American Industrial Hygiene Association

42
Occupational Health Indicators • Occupational Health Branch • CA Department of Public Health
Rate and Number of Board-Certified Occupational Safety and Health Professionals
for California and U.S., 2008-2013
Year
California U.S.
2008 2009 2010 2011 2012 2013 2013
Rate of
Board-
Certified
Safety
Professionals
per 100,000
Employees
6.2
6.8
7.1
N/A
7.3
7.2
9.5
Number of
Board-
Certified
Safety
Professionals
1,049
1,099
1,135
N/A
N/A
N/A
N/A
Rate of
ASSE1
Membership
per 100,000
Employees
17.7
16.9
17.8
N/A
17.7
18.4
22.9
Number of
ASSE1
Members
3,016
2,739
2,838
N/A
N/A
N/A
N/A
Data Sources: American Board of Preventive Medicine, Annual roster of members of the ACOEM,
American Board of Occupational Health Nurses Directory, AAOHN member directory, American Board
of Industrial Hygiene, AIHA member directory, BCSP member directory, ASSE member directory, U.S.
Bureau of Labor Statistics Current Population Survey
1American Society of Safety Engineers
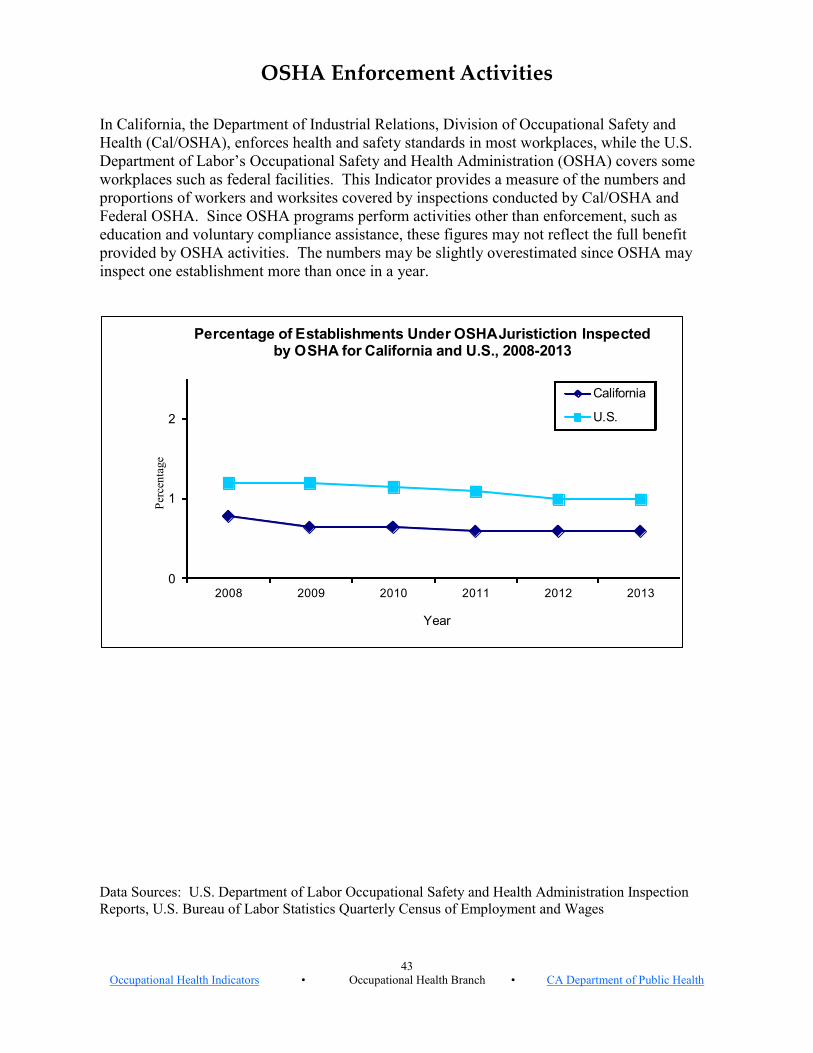
43
Occupational Health Indicators • Occupational Health Branch • CA Department of Public Health
OSHA Enforcement Activities
In California, the Department of Industrial Relations, Division of Occupational Safety and
Health (Cal/OSHA), enforces health and safety standards in most workplaces, while the U.S.
Department of Labor’s Occupational Safety and Health Administration (OSHA) covers some
workplaces such as federal facilities. This Indicator provides a measure of the numbers and
proportions of workers and worksites covered by inspections conducted by Cal/OSHA and
Federal OSHA. Since OSHA programs perform activities other than enforcement, such as
education and voluntary compliance assistance, these figures may not reflect the full benefit
provided by OSHA activities. The numbers may be slightly overestimated since OSHA may
inspect one establishment more than once in a year.
Data Sources: U.S. Department of Labor Occupational Safety and Health Administration Inspection
Reports, U.S. Bureau of Labor Statistics Quarterly Census of Employment and Wages
0
1
2
2008 2009 2010 2011 2012 2013
Year
Percentage of Establishments Under OSHA Juristiction Inspected by OSHA for California and U.S., 2008-2013
California
U.S.
Per
cen
tage
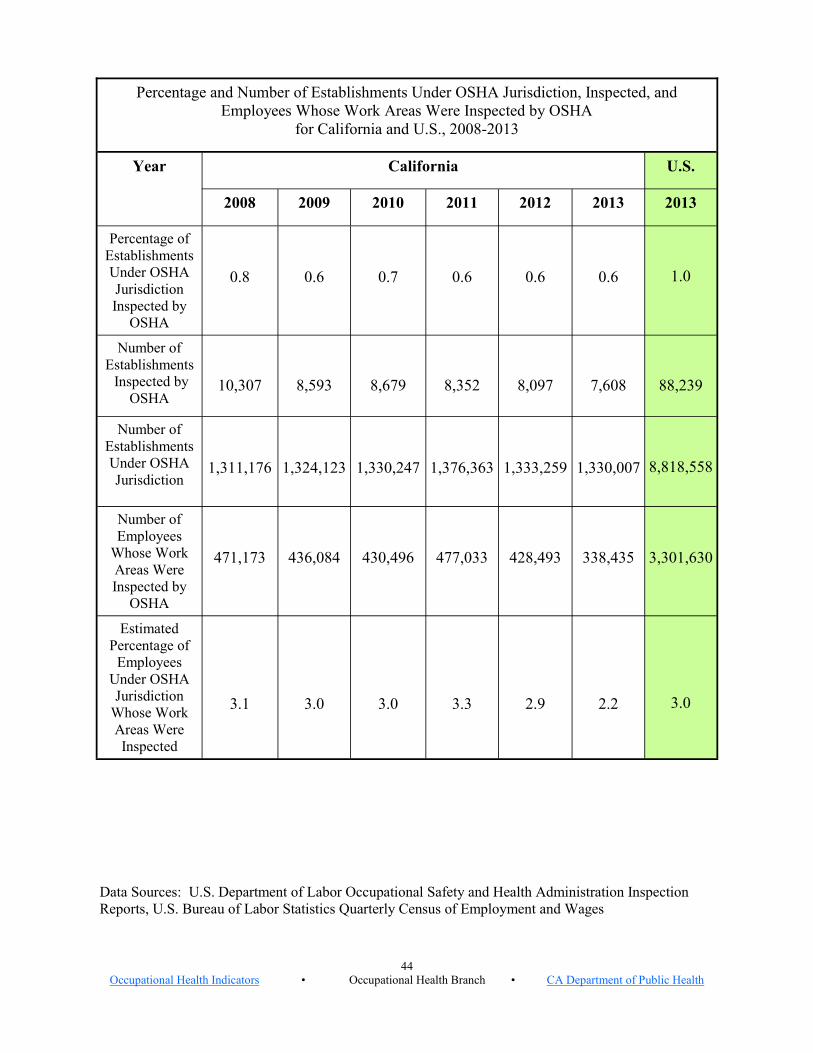
44
Occupational Health Indicators • Occupational Health Branch • CA Department of Public Health
Percentage and Number of Establishments Under OSHA Jurisdiction, Inspected, and
Employees Whose Work Areas Were Inspected by OSHA
for California and U.S., 2008-2013
Year California U.S.
2008 2009 2010 2011 2012 2013 2013
Percentage of
Establishments
Under OSHA
Jurisdiction
Inspected by
OSHA
0.8
0.6
0.7
0.6
0.6
0.6
1.0
Number of
Establishments
Inspected by
OSHA
10,307
8,593
8,679
8,352
8,097
7,608
88,239
Number of
Establishments
Under OSHA
Jurisdiction
1,311,176
1,324,123
1,330,247
1,376,363
1,333,259
1,330,007
8,818,558
Number of
Employees
Whose Work
Areas Were
Inspected by
OSHA
471,173
436,084
430,496
477,033
428,493
338,435
3,301,630
Estimated
Percentage of
Employees
Under OSHA
Jurisdiction
Whose Work
Areas Were
Inspected
3.1
3.0
3.0
3.3
2.9
2.2
3.0
Data Sources: U.S. Department of Labor Occupational Safety and Health Administration Inspection
Reports, U.S. Bureau of Labor Statistics Quarterly Census of Employment and Wages

45
Occupational Health Indicators • Occupational Health Branch • CA Department of Public Health
Data Source: National Academy of Social Insurance (NASI)
0
10
20
30
40
50
60
70
2008 2009 2010 2011 2012 2013
Year
Total Workers' Compensation Benefits Paid in California and U.S., 2008-2013
California
U.S.
Workers’ Compensation Awards
State workers’ compensation programs were developed to provide guaranteed compensation for
work-related injuries or illnesses while limiting the liability exposure of employers. Workers’
compensation provides benefits to partially replace lost wages, pay for medical expenses
associated with an injury or illness, and provide survivor benefits in the case of a death. The
total dollar amount of benefits paid annually is calculated using data from the National
Academy of Social Insurance, which also provides the number of workers covered by workers’
compensation. This Indicator also reports the average amount paid per worker if the total cost
is averaged over all workers covered by the workers’ compensation system. While the amount
of benefits paid helps define the direct financial cost of work-related injuries and illnesses, it
does not reflect their true burden. Indirect costs to the employer and worker are not taken into
account. In addition, some workers who are eligible for benefits do not file. Finally, several
types of workers may not be covered by state workers’ compensation systems, including the
self-employed, domestic workers, federal employees, and railroad, longshore, and maritime
workers.
$ B
illi
on
s

46
Occupational Health Indicators • Occupational Health Branch • CA Department of Public Health
Total Workers’ Compensation Benefits Paid and Average per Covered Worker
for California and U.S., 2008-2013
Year
California U.S.
2008 2009 2010 2011 2012 2013 2013
Total Amount of
Workers’
Compensation
Benefits Paid in
Billions
$9.4
$9.3
$9.4
$10.5
$11.5
$12.1
$63.6
Average Amount
of Workers’
Compensation
Benefits Paid per
Covered Worker1
$618
$648
$663
$732
$784
$799
$491
Data Source: National Academy of Social Insurance (NASI)
1 All workers in the state who are eligible for compensation should they sustain work-related injuries or illnesses are
considered “covered” workers.

47
Occupational Health Indicators • Occupational Health Branch • CA Department of Public Health
Indicator data resources
Occupational Health Indicators: A Guide for Tracking Occupational Health Conditions and Their Determinants – “how-to” guide for states on generating Occupational Health Indicators (Council of State and Territorial Epidemiologists/CSTE, updated 2016)
(http://c.ymcdn.com/sites/www.cste.org/resource/resmgr/OHIndicators2/2016_Version_OHI_Guidance_Ma.pdf)
Council of State and Territorial Epidemiologists (CSTE) Occupational Health Indicators – website that provides other states’ and national data
(http://www.cste.org/group/OHIndicators)
Data Sources Used to Calculate Occupational Health Indicators – adapted from 2005 CSTE report
(https://www.cdph.ca.gov/Programs/CCDPHP/DEODC/OHB/CDPH%20Document%20Library/DataSourceDescription.pdf)
Guidelines for State Occupational Public Health Programs – National Institute for Occupational Safety and Health (NIOSH)-CSTE document (2008)
(http://www.cdc.gov/niosh/docs/2008-148/pdfs/2008-148.pdf)
Indicators for Occupational Health Surveillance – MMWR article (Centers for Disease Control, 2007)
(http://www.cdc.gov/mmwr/preview/mmwrhtml/rr5601a1.htm)
NIOSH Workplace Data and Statistics Gateway – NIOSH data website
(http://www.cdc.gov/niosh/data/)
NIOSH Workplace Health and Safety tracking publications and resources – NIOSH website
(http://www.cdc.gov/niosh/topics/surveillance/survpubs.html)
Occupational Health Indicators from 13 Pilot States for 2000 – CSTE report (2005)
(http://c.ymcdn.com/sites/www.cste.org/resource/resmgr/OccupationalHealth/CSTEOHIndicators.pdf)
State-based Occupational Health Surveillance Clearinghouse – NIOSH website listing state publications, including Indicators reports (http://wwwn.cdc.gov/niosh-survapps/statedocs/)
http://c.ymcdn.com/sites/www.cste.org/resource/resmgr/OHIndicators2/2016_Version_OHI_Guidance_Ma.pdf