Alicia N. Aarnio , Nuria Calvet , David Acreman & Xiao Che · 2 Aarnio et al. et al. (2015) is able...
37
The Astrophysical Journal Preprint typeset using L A T E X style emulateapj v. 12/16/11 HIGH CADENCE, HIGH RESOLUTION SPECTROSCOPIC OBSERVATIONS OF HERBIG STARS HD 98922 AND V1295 AQUILA Alicia N. Aarnio 1* , John D. Monnier 1 , Tim J. Harries 2 , Stefan Kraus 2 , Nuria Calvet 1 , David Acreman 2 & Xiao Che 1 (Accepted 20 August 2017) ABSTRACT Recent observational work has indicated mechanisms for accretion and outflow in Herbig Ae/Be star-disk systems may differ from magnetospheric accretion as it is thought to occur in T Tauri star-disk systems. In this work, we assess the temporal evolution of spectral lines probing accretion and mass loss in Herbig Ae/Be systems and test for consistency with the magnetospheric accretion paradigm. For two Herbig Ae/Be stars, HD 98922 (B9e) and V1295 Aql (A2e), we have gathered multi- epoch (∼years) and high cadence (∼minutes) high resolution optical spectra to probe a wide range of kinematic processes. Employing a line equivalent width evolution correlation metric introduced here, we identify species co-evolving (indicative of common line origin) via novel visualization. We interferometrically constrain often problematically degenerate parameters, inclination and inner disk radius, allowing us to focus on the structure of the wind, magnetosphere, and inner gaseous disk in radiative transfer models. Over all timescales sampled, the strongest variability occurs within the blueshifted absorption components of the Balmer series lines; the strength of variability increases with the cadence of the observations. Finally, high resolution spectra allow us to probe substructure within the Balmer series’ blueshifted absorption components: we observe static, low-velocity features and time-evolving features at higher velocities. Overall we find the observed line morphologies and variability are inconsistent with a scaled-up T Tauri magnetospheric accretion scenario. We suggest that as magnetic field structure and strength change dramatically with increasing stellar mass from T Tauri to Herbig Ae/Be stars, so too may accretion and outflow processes. 1. INTRODUCTION Herbig Ae/Be (HAeBe) stars are the high mass (∼2- 10 M ) pre-main sequence counterparts of T Tauri stars (TTS). Classically defined, they are spectral type A or earlier, show emission lines in their spectra, lie in obscured regions, and illuminate surrounding nebulos- ity (Herbig 1960). Being similar in evolutionary state and observed phenomena, these systems have often been treated as scaled-up TTS, magnetospherically accreting via strong, extended dipolar magnetic field components. Indeed, in some cases, magnetospheric accretion (MA) has been able to successfully reproduce observed spec- tral line profiles (Muzerolle et al. 2004). Recent spec- tropolarimetric surveys, however, have found a very low (∼10%) detection rate for magnetic fields on Herbig Ae/Be stars (Wade et al. 2007; Alecian et al. 2013c), and those detected have weaker dipole components than observed in TTS (∼100 G in HAeBe, as opposed to ∼1 kG for TTS). Indeed, moving to higher mass in the Hertzsprung-Russell diagram, the dipole moment is seen to weaken, and higher order moments dominate the over- all field structure (Gregory et al. 2012); this effectively truncates the “reach” of the stellar magnetosphere in star-disk interaction and distributes the accretion foot- points about the stellar surface in a less-ordered manner. At the same time, it has been shown that the few 1 Department of Astronomy, University of Michigan, 311 West Hall, 1085 S. University Ave., Ann Arbor, MI 48109 2 Department of Physics and Astronomy, University of Exeter, Stocker Road, Exeter EX4 4QL, UK * Now a Hale Fellow at the University of Colorado Boulder, 8665 Discovery Drive, Boulder, CO 80303 HAeBe stars with magnetic field detections are slower ro- tators than their non-magnetic counterparts, indicating effective braking has taken place somehow (Alecian et al. 2013b). In higher mass HAeBe systems (>5M ), Ale- cian et al. (2013b) showed substantial angular momen- tum loss occurs as they contract to the main sequence; the authors suggest increased wind mass loss as the driver of this. Mendigut´ ıa et al. (2011b) showed a clear break in the dependence of accretion indicators (Balmer excess, Hα line width) as a function of stellar mass, with Ae stars resembling TTS and Be stars not. Spectrointerferometric results have indicated that for late-type HAeBe systems, Brγ line emission is originating from within a few stellar radii of the star, consistent with a magnetospheric ac- cretion paradigm (Kraus et al. 2008a,b; Ellerbroek et al. 2015). For earlier-type Herbigs, however, the origin of line emission is ∼1-6 au, consistent with a disk or X- wind (e.g., Weigelt et al. 2011; Kurosawa et al. 2016). Unfortunately, only a few systems have been observed via this technique. While this is suggestive that later-type Herbigs accrete magnetospherically while earlier types accrete via differ- ent mechanisms (supported by spectropolarimetric ob- servations of Vink et al. 2002), ambiguity remains: Kraus et al. (2008b) observe Brγ emission from within the dust sublimation radius in all of their targets regardless of spectral type, and these radii could be consistent with magnetospheric accretion, a stellar wind, or an X-wind. In only one case do Kraus et al. (2008b) suggest the com- pact Brγ emission line region, in concert with accretion indicators, to be likely indicating magnetospheric accre- tion: HD 98922. The modeling work of Caratti o Garatti
Transcript of Alicia N. Aarnio , Nuria Calvet , David Acreman & Xiao Che · 2 Aarnio et al. et al. (2015) is able...

The Astrophysical JournalPreprint typeset using LATEX style emulateapj v. 12/16/11
HIGH CADENCE, HIGH RESOLUTION SPECTROSCOPIC OBSERVATIONS OF HERBIG STARS HD 98922AND V1295 AQUILA
Alicia N. Aarnio1*, John D. Monnier1, Tim J. Harries2, Stefan Kraus2, Nuria Calvet1, David Acreman2 & XiaoChe1
(Accepted 20 August 2017)
ABSTRACT
Recent observational work has indicated mechanisms for accretion and outflow in Herbig Ae/Bestar-disk systems may differ from magnetospheric accretion as it is thought to occur in T Tauristar-disk systems. In this work, we assess the temporal evolution of spectral lines probing accretionand mass loss in Herbig Ae/Be systems and test for consistency with the magnetospheric accretionparadigm. For two Herbig Ae/Be stars, HD 98922 (B9e) and V1295 Aql (A2e), we have gathered multi-epoch (∼years) and high cadence (∼minutes) high resolution optical spectra to probe a wide rangeof kinematic processes. Employing a line equivalent width evolution correlation metric introducedhere, we identify species co-evolving (indicative of common line origin) via novel visualization. Weinterferometrically constrain often problematically degenerate parameters, inclination and inner diskradius, allowing us to focus on the structure of the wind, magnetosphere, and inner gaseous disk inradiative transfer models. Over all timescales sampled, the strongest variability occurs within theblueshifted absorption components of the Balmer series lines; the strength of variability increaseswith the cadence of the observations. Finally, high resolution spectra allow us to probe substructurewithin the Balmer series’ blueshifted absorption components: we observe static, low-velocity featuresand time-evolving features at higher velocities. Overall we find the observed line morphologies andvariability are inconsistent with a scaled-up T Tauri magnetospheric accretion scenario. We suggestthat as magnetic field structure and strength change dramatically with increasing stellar mass fromT Tauri to Herbig Ae/Be stars, so too may accretion and outflow processes.
1. INTRODUCTION
Herbig Ae/Be (HAeBe) stars are the high mass (∼2-10 M�) pre-main sequence counterparts of T Tauri stars(TTS). Classically defined, they are spectral type Aor earlier, show emission lines in their spectra, lie inobscured regions, and illuminate surrounding nebulos-ity (Herbig 1960). Being similar in evolutionary stateand observed phenomena, these systems have often beentreated as scaled-up TTS, magnetospherically accretingvia strong, extended dipolar magnetic field components.Indeed, in some cases, magnetospheric accretion (MA)has been able to successfully reproduce observed spec-tral line profiles (Muzerolle et al. 2004). Recent spec-tropolarimetric surveys, however, have found a very low(∼10%) detection rate for magnetic fields on HerbigAe/Be stars (Wade et al. 2007; Alecian et al. 2013c),and those detected have weaker dipole components thanobserved in TTS (∼100 G in HAeBe, as opposed to∼1 kG for TTS). Indeed, moving to higher mass in theHertzsprung-Russell diagram, the dipole moment is seento weaken, and higher order moments dominate the over-all field structure (Gregory et al. 2012); this effectivelytruncates the “reach” of the stellar magnetosphere instar-disk interaction and distributes the accretion foot-points about the stellar surface in a less-ordered manner.
At the same time, it has been shown that the few
1 Department of Astronomy, University of Michigan, 311 WestHall, 1085 S. University Ave., Ann Arbor, MI 48109
2 Department of Physics and Astronomy, University of Exeter,Stocker Road, Exeter EX4 4QL, UK
* Now a Hale Fellow at the University of Colorado Boulder,8665 Discovery Drive, Boulder, CO 80303
HAeBe stars with magnetic field detections are slower ro-tators than their non-magnetic counterparts, indicatingeffective braking has taken place somehow (Alecian et al.2013b). In higher mass HAeBe systems (>5 M�), Ale-cian et al. (2013b) showed substantial angular momen-tum loss occurs as they contract to the main sequence;the authors suggest increased wind mass loss as the driverof this. Mendigutıa et al. (2011b) showed a clear breakin the dependence of accretion indicators (Balmer excess,Hα line width) as a function of stellar mass, with Ae starsresembling TTS and Be stars not. Spectrointerferometricresults have indicated that for late-type HAeBe systems,Brγ line emission is originating from within a few stellarradii of the star, consistent with a magnetospheric ac-cretion paradigm (Kraus et al. 2008a,b; Ellerbroek et al.2015). For earlier-type Herbigs, however, the origin ofline emission is ∼1-6 au, consistent with a disk or X-wind (e.g., Weigelt et al. 2011; Kurosawa et al. 2016).Unfortunately, only a few systems have been observedvia this technique.
While this is suggestive that later-type Herbigs accretemagnetospherically while earlier types accrete via differ-ent mechanisms (supported by spectropolarimetric ob-servations of Vink et al. 2002), ambiguity remains: Krauset al. (2008b) observe Brγ emission from within the dustsublimation radius in all of their targets regardless ofspectral type, and these radii could be consistent withmagnetospheric accretion, a stellar wind, or an X-wind.In only one case do Kraus et al. (2008b) suggest the com-pact Brγ emission line region, in concert with accretionindicators, to be likely indicating magnetospheric accre-tion: HD 98922. The modeling work of Caratti o Garatti
2 Aarnio et al.
et al. (2015) is able to successfully reproduce the Brγemission as originating from a disk wind launched over∼0.1-1 au and a mass loss rate of 2x10⁻⁷M� yr−1.
These observations counter the scaled up T Tauri mag-netospheric accretion paradigm of a strong, extendeddipole interacting with circumstellar material, and inconcert with a lack of magnetic field detections in theseobjects, indicate a need to expand upon our picture ofstar-disk interaction in HAeBe systems.
Observations done in the time domain, sampling arange of dynamical timescales across the system, arecritical for disentangling episodic, periodic (linked torotation), and large-scale (disk-driven) processes’ effecton observables, especially given the degeneracy in lineformation mechanisms. Using high resolution, highsignal-to-noise optical spectra, we compare the mass fluxwithin two star-disk systems on both short and longtimescales with the goal of determining whether relation-ships exist between accretion and outflow processes, onwhat timescales these happen, and whether the obser-vations are consistent with the magnetospheric accretionparadigm as envisaged for lower mass pre-main sequencestars.
In Section 2 we describe our target selection and obser-vations, and in Section 3 we describe our analysis of thedata. Sections 4 and 5 share results and conclusions, andin Appendices A, B, and C, we present an atlas of ourspectra, radiative transfer models, and further details ofour correlation analysis methods.
2. TARGET SELECTION AND OBSERVATIONS
From 2006 to 2013, we conducted an optical spectro-scopic observational campaign of a sample of ∼60 HAeBestars. Our target sample consists of stars for which weeither already have interferometric data or targets thatwould be suitable for interferometric observation (i.e.,bright; ∼V < 14, H < 8). These targets are ideal formodeling as the interferometric data break degeneraciesthat create ambiguity in interpretation (e.g., inclinationand inner disk radius). Over the course of gatheringdata, we observed 13 objects at multiple epochs; two ofthese, V1295 Aql and HD 98922, were followed up on in2013 with high cadence time series observations. V1295Aql and HD 98922 were chosen for follow up observationbecause they occupy and extend into the range of stellarmasses (2.9 and 5.0M�, respectively) in which trends inmass accretion rate and line luminosity break from thoseobserved in TTS (Mendigutıa et al. 2011b). Also of par-ticular interest, these stars represent magnetic V1295 Aqland non-magnetic HD 98922 examples to compare andcontrast.
Our optical spectra were taken with MIKE (Bernsteinet al. 2003), the Magellan Inamori Kyocera Echelle, across-dispersed double echelle spectrograph. The blueside of MIKE covers a ∼3200−5000A range, and thered chip spans ∼4900−10000A; using the narrowest slit,0.”35, the resolving powers of the blue and red sidesare R∼80,000 and R∼65,000, respectively. Within thiswavelength range, we simultaneously capture many well-studied MA and outflow tracing lines, including theBalmer discontinuity, Hydrogen Balmer series lines, NaD doublet, He I 5876A line, Ca II infrared triplet, and[O I] 6300A line.
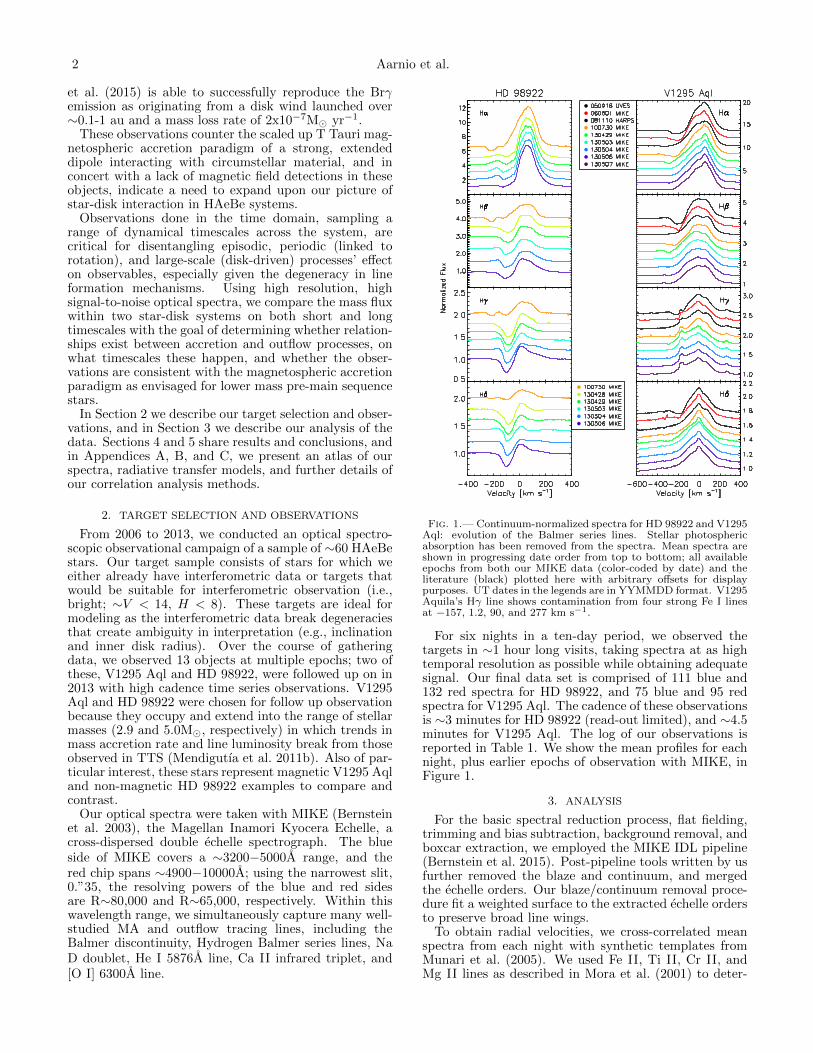
Fig. 1.— Continuum-normalized spectra for HD 98922 and V1295Aql: evolution of the Balmer series lines. Stellar photosphericabsorption has been removed from the spectra. Mean spectra areshown in progressing date order from top to bottom; all availableepochs from both our MIKE data (color-coded by date) and theliterature (black) plotted here with arbitrary offsets for displaypurposes. UT dates in the legends are in YYMMDD format. V1295Aquila’s Hγ line shows contamination from four strong Fe I linesat −157, 1.2, 90, and 277 km s−1.
For six nights in a ten-day period, we observed thetargets in ∼1 hour long visits, taking spectra at as hightemporal resolution as possible while obtaining adequatesignal. Our final data set is comprised of 111 blue and132 red spectra for HD 98922, and 75 blue and 95 redspectra for V1295 Aql. The cadence of these observationsis ∼3 minutes for HD 98922 (read-out limited), and ∼4.5minutes for V1295 Aql. The log of our observations isreported in Table 1. We show the mean profiles for eachnight, plus earlier epochs of observation with MIKE, inFigure 1.
3. ANALYSIS
For the basic spectral reduction process, flat fielding,trimming and bias subtraction, background removal, andboxcar extraction, we employed the MIKE IDL pipeline(Bernstein et al. 2015). Post-pipeline tools written by usfurther removed the blaze and continuum, and mergedthe echelle orders. Our blaze/continuum removal proce-dure fit a weighted surface to the extracted echelle ordersto preserve broad line wings.
To obtain radial velocities, we cross-correlated meanspectra from each night with synthetic templates fromMunari et al. (2005). We used Fe II, Ti II, Cr II, andMg II lines as described in Mora et al. (2001) to deter-
Time-Series Spectroscopy of HD 98922 and V1295 Aql 3
TABLE 1Time series observing log
Object UT Start Blue/Red Integration AirmassID [hh:mm:ss] Side Time [s]
2005 September 18, UVES archival spectraV1295 Aql 01:25:49.04 6650−10250A 200 · · ·V1295 Aql 01:25:53.13 3044−3916A 360 · · ·V1295 Aql 01:25:53.13 3732−4999A 175 · · ·V1295 Aql 01:34:59.91 4726−6835A 160 · · ·
2006 August 01, 1” slit, 1x3 binning, slow readoutV1295 Aql 07:53:32 B 50 2.325V1295 Aql 07:57:19 B 25 2.392V1295 Aql 07:58:38 B 25 2.416V1295 Aql 07:53:33 R 50 2.325V1295 Aql 07:57:19 R 25 2.392V1295 Aql 07:58:45 R 25 2.418V1295 Aql 08:03:22 R 50 2.509
2008 November 10, HARPS archival spectraV1295 Aql 23:48:09 3781−6912A 600 1.527V1295 Aql 23:58:42 3781−6912A 600 1.586
2008 November 11, HARPS archival spectraV1295 Aql 00:09:15 3781−6912A 600 1.653V1295 Aql 00:19:47 3781−6912A 600 1.730V1295 Aql 00:30:19 3781−6912A 600 1.819V1295 Aql 00:40:52 3781−6912A 600 1.922V1295 Aql 00:51:25 3781−6912A 600 2.042V1295 Aql 01:01:58 3781−6912A 600 2.185
2010 July 30, 1x1 binning, fast readoutHD 98922 23:40:52 B 15 1.564HD 98922 23:45:49 B 80 1.588HD 98922 23:48:49 B 80 1.604HD 98922 23:51:56 B 80 1.621HD 98922 23:54:53 B 80 1.637HD 98922 23:40:54 R 15 1.564HD 98922 23:45:50 R 40 1.588HD 98922 23:47:52 R 40 1.599HD 98922 23:50:12 R 40 1.611HD 98922 23:53:19 R 40 1.628HD 98922 23:56:20 R 40 1.645
· · · Table can be viewed in full in online data · · ·
Note. — Multi-epoch and time-series observations of HD 98922 andV1295 Aquila. All data are MIKE spectra, unless otherwise indicated.Time-series spectra were generally taken in sets of four integrations, withThAr lamps taken between sets.
mine the vsini for each star. Finally, we removed stel-lar photospheric absorption by subtracting a continuum-normalized, high-resolution synthetic spectrum (Munariet al. 2005).
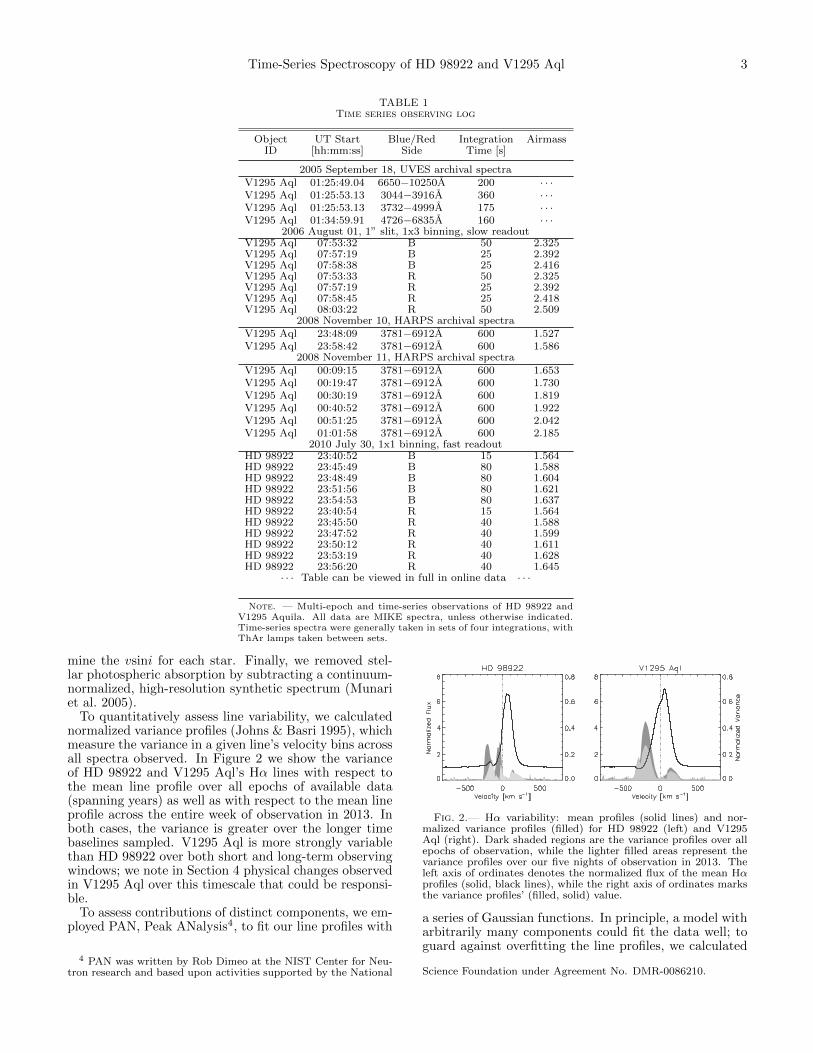
To quantitatively assess line variability, we calculatednormalized variance profiles (Johns & Basri 1995), whichmeasure the variance in a given line’s velocity bins acrossall spectra observed. In Figure 2 we show the varianceof HD 98922 and V1295 Aql’s Hα lines with respect tothe mean line profile over all epochs of available data(spanning years) as well as with respect to the mean lineprofile across the entire week of observation in 2013. Inboth cases, the variance is greater over the longer timebaselines sampled. V1295 Aql is more strongly variablethan HD 98922 over both short and long-term observingwindows; we note in Section 4 physical changes observedin V1295 Aql over this timescale that could be responsi-ble.
To assess contributions of distinct components, we em-ployed PAN, Peak ANalysis4, to fit our line profiles with
4 PAN was written by Rob Dimeo at the NIST Center for Neu-tron research and based upon activities supported by the National
Fig. 2.— Hα variability: mean profiles (solid lines) and nor-malized variance profiles (filled) for HD 98922 (left) and V1295Aql (right). Dark shaded regions are the variance profiles over allepochs of observation, while the lighter filled areas represent thevariance profiles over our five nights of observation in 2013. Theleft axis of ordinates denotes the normalized flux of the mean Hαprofiles (solid, black lines), while the right axis of ordinates marksthe variance profiles’ (filled, solid) value.
a series of Gaussian functions. In principle, a model witharbitrarily many components could fit the data well; toguard against overfitting the line profiles, we calculated
Science Foundation under Agreement No. DMR-0086210.
4 Aarnio et al.
the F-statistic of each fit and did not add additionalcomponents if they did not statistically significantly im-prove the fit. In the case of Hα, the line complexityand strength made fits with relatively few componentsindistinguishable from one another; in these cases, weproceeded with as few components as possible to obtaina qualitatively good fit. As an arbitrarily large numberof Gaussian components could certainly reduce the χ2
value of the fit, we rely on the F-statistic to ensure weare not overfitting and only refer to the emission and ab-sorption components in general terms. Within the PANgui, in order to avoid unrealistic and spuriously large(though statistically equivalent) component fits, we setlimits on the Gaussian components’ widths, areas, andcentral wavelengths; in cases where components weak-ened to non-detection, these components’ areas are al-lowed to go to 0. If any parameter reached the imposedlimit, we re-expanded the allowed range and re-fit. Wepresent examples of fits to the Hα profiles of HD 98922and V1295 Aql in Appendix C.
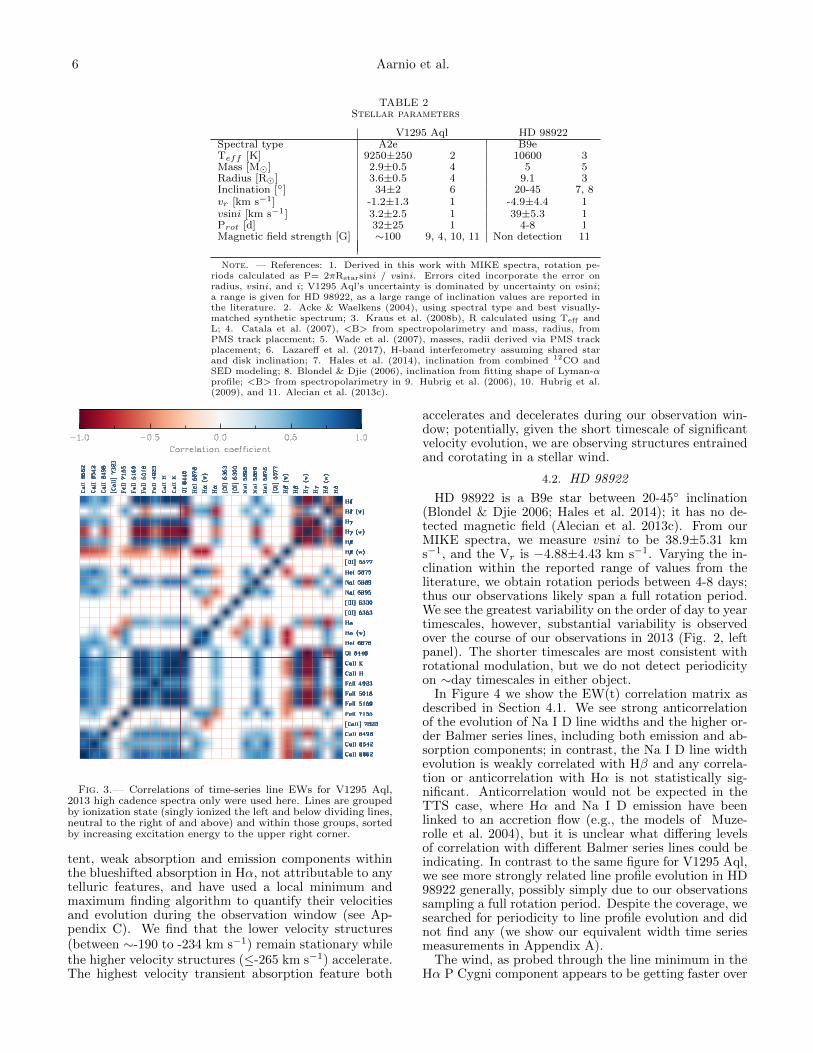
Having fit our spectral lines, we then measured theequivalent widths (EWs) of the emission and wind ab-sorption components of 26 species and calculate thecorrelation of their variability relative to one another:should we see strongly correlated or anti-correlated be-haviors, it could be indicative of a common timescale forevolution of the line feature and thus potentially a com-mon origin. The correlation coefficient we employ hereis Spearman’s ρ (Press et al. 1992); we note that thisstatistic gauges linear relationships between monotoni-cally increasing quantities; this is not always the casewith our data. When the data are significantly non-monotonic, however, the coefficient approaches zero andthe two-sided significance is large (here, we use 10−3 asa cutoff), meaning it is probable that unrelated variablescould produce this level of correlation and thus it is notstatistically significant. These results are shown in Fig-ures 3 and 4.
Finally, we have run preliminary fiducial radiativetransfer models using the TORUS code (Transport OfRadiation Under Sobolev/Stokes; Harries 2000). Weemploy a simple dipolar field geometry, a split-monopolestyle disk wind (Knigge et al. 1995; Long & Knigge 2002),and calculate line transport in the Balmer series to com-pare to observations. We describe details of the parame-ter choices and model physics in Appendix B and discussgeneral findings in the following sections.
4. RESULTS
Over the broad wavelength range observed with MIKE,we have detected and measured the permitted transitionsof Hα, Hβ, Hγ, Hδ, He I 5875A, Na I 5889A, Na I 5895A,He I 6678A, O I 8446A, Ca II IR triplet (8498A, 8542A,8662A), O I 7772A, Fe II (42) multiplet (4923A, 5018A,5169A), and Ca II H and K (3933A, 3968A). We havealso detected and measured the forbidden transitions of[O I] 5577A, [O I] 6300A, [O I] 6363A, [Ca II] 7323A, [FeII] 7155A. At MIKE’s high resolution, we note a wealthof substructure in the blueshifted line absorption wingsobserved, including three distinct velocity minima withinthe P Cygni profile in Hα for HD 98922 (we explore thissubstructure further in Section 4.2). Plots of these tran-sitions can be found in Appendix A.
Assuming the observed Balmer jump excess and Brγemission are produced via MA, accretion rates havebeen estimated for both V1295 Aql (∼10−5 M� yr−1,Mendigutıa et al. 2011b) and HD 98922 (∼10−6M� yr−1,Garcia Lopez et al. 2006). In contrast to accreting TTS,we do not see any redshifted absorption; Hartmann et al.(1994) note that at the high velocities found in accre-tion flows Hα can thermalize, thereby filling in the tell-tale inverse P Cygni absorption. If present, however,we should observe redshifted absorption in the higherorder Balmer lines as they do not thermalize; for nei-ther object do we see redshifted absorption indicative ofmagnetospheric accretion-related infall in any transitionwe observed. Cauley & Johns-Krull (2014) observed theHe 10830A transition in V1295 Aql and also noted onlyblueshifted absorption. In our fiducial TORUS modelsfor both stars, we are unable to produce any line profileinvoking MA that does not have an inverse P Cygni pro-file in all of the Balmer lines (see Appendix B for furtherdetail).
We do not observe a high velocity component of the[O I] 6300A line frequently seen in TTS systems (e.g.,Hartigan et al. 1995), and thus have not estimated windmass loss rates. In HAeBe systems, this feature is rare:Acke et al. (2005) pointed out that in their sample of49 HAeBe stars, only 3 showed any high velocity [O I]6300A feature.
Variability in spectral lines is related to the emittingor absorbing volume being probed by the line and itsdynamical properties. At the shortest timescales, of or-der minutes to hours, we are probing regions close to thestellar surface: accretion flows, the launching region of astellar wind, episodic mass loss and the rotational modu-lation of any of these events. Longer timescales, of orderdays to weeks, probe regions between the star and disk,from corotation to fractions of an au. In these regions,we may observe variability related to extended magne-tospheric structure, hot gaseous inner disk components,and magnetospheric ejections (cf. Ferreira et al. 2006;Ferreira 2013). The longest timescales, of order monthsto years, probe inner disk Keplerian orbital times.
While we do note low, ∼5% level, variability over thecourse of our hour-long observations, the strongest vari-ability we observe occurs on timescales of days or longer;years for V1295 Aql. In both objects, the most variabil-ity on any timescale occurs in the blueshifted absorptioncomponents. In contrast to TTS variability observations,we see little change in the overall emission level or the redwings of our lines; what variability we observe in the redline wings appears to be due to modest overall changein the width of the line (consistent with the results ofMendigutıa et al. 2011a). The most dramatic spectrum-to-spectrum changes occur on the longest time baselinesavailable to us, over years, and are dramatic shifts in theblueshifted absorption component velocity. Studies ofline profile variability in TTS and IMTTS (e.g., Johns &Basri 1995; Costigan et al. 2014; Sousa et al. 2016) havefound substantial amounts of variability across the lineprofile, including at redshifted velocities. Nguyen et al.(2009) and Costigan et al. (2014) find variability in TTSand Herbig Ae stars saturates at the rotation period.
Quantitatively assessing variability over the full set ofobservations, Figures 3 and 4 readily allow for compari-

Time-Series Spectroscopy of HD 98922 and V1295 Aql 5
son between V1295 Aql and HD 98922. Each square inthe diagram represents how any given two line compo-nents evolve in time with respect to each other; for refer-ence, we show specific examples in Appendix C. In bothstars, singly ionized species show more variability, bothanti- and correlated with other singly ionized species,than the neutrals during the ∼10 day long period sam-pled. This implies the singly ionized species originate ina compact region evolving on short timescales. We alsosee that in both stars species in the same multiplet, e.g.,Fe II (42), have positively correlated time evolving be-havior, as expected under an assumption of a commonorigin of these lines. Similarly, lines of the same multi-plet share common time-series evolution when comparedwith other lines. Interestingly, in V1295 Aql, the emis-sion and absorption components of lines with P-Cygniprofiles show anticorrelated time evolution, whereas thecomponents evolve together for HD 98922. Unlike whatis seen in HD 98922, for V1295 Aql we note little correla-tion between forbidden line evolution and the neutral andsingly-ionized species selected; we note that our methodis insensitive to potential time delays, this method is bi-ased toward short timescale co-evolution. In forthcomingwork, we will use radiative transfer modeling to explorefurther the conditions that would cause anticorrelatedversus correlated evolution of components in the sameline.
4.1. V1295 Aql
In Table 2, we summarize stellar parameters for V1295Aql. Its magnetic field, ∼100G, has been detected andconfirmed by multiple authors over several years (Ale-cian et al. 2013c; Hubrig et al. 2006, 2009; Catala et al.2007) and one non-detection was reported by Wadeet al. (2007). As described in Section 3, from ourMIKE spectra we measure vr = -1.2±1.3 km s−1 andvsini =3.19±2.45 km s−1, consistent with Alecian et al.(2013c). With these parameters and assuming star anddisk share an inclination of 34±2◦ (Lazareff et al. 2017),we derive a rotation period of ∼32d. As Alecian et al.(2013b) note, the handful of magnetic HAeBe stars ob-served are also slow rotators, consistent with V1295 Aql’sapparently very slow rotation rate.
For the observations spanning multiple years, we seethe P Cygni absorption is consistently growing weaker.In our first nights of data, in 2005 and 2006, blueshiftedabsorption is detectable in Hα, Hβ, Hγ and Hδ, but canonly be seen in Hα and Hβ thereafter (Fig. 1); simul-taneously, the emission component’s EW is also growingweaker. The Ca II infrared triplet is also dramaticallyweakening, as are the Na I D lines. The Ca II H andK lines, notable for their complex structure (cf. Pogodinet al. 2005, and references therein), are not seen to varymuch on night-to-night timescales, or within any givennight (this is consistent with previous observations; inIn Appendix A we show plots of all of these lines). Ale-cian et al. (2013a) note spectropolarimetric changes in-dicating V1295 Aql had a stable, aligned dipole over ob-servations from 2004-2009, but in 2011-2012, variabilitywas observed, indicating a change in the star’s magneticfield structure. In 2005 and 2006 data, we see broadP-Cygni absorption, and in 2008 data, we only note aweak, higher velocity absorption feature. In 2010, abroad, multi-trough component appears, only to have
disappeared again by our 2013 data taken for this work.The correlation between magnetic field structure and theHα profiles is unclear, but we note in the epochs withweak absorption, the emission component’s width hasbroadened, possibly filling in underlying absorption.
[O I] 6300A in particular is of interest, as its driv-ing mechanism remains unclear. Using multi-epoch data,Corcoran & Ray (1998) noted a relationship between the[O I] emission and presence of near-IR excess; they sug-gested the IR excess was indicative of accretion. Linecomponent analysis of our time-series data finds the Hαwind absorption component is weakly anticorrelated withthe [O I] emission: over the period of observation, the [OI] 6300A emission line grew stronger as the wind absorp-tion in Hα grew weaker. To quantitatively assess the linecomponents’ evolution, we calculated Spearman’s corre-lation coefficient for time-series equivalent widths: com-paring [O I] emission and blueshifted absorption in Hα,the test statistic ρ is -0.39 with a significance of 8x10⁻⁵;this is to say the likelihood of a spurious correlation isvery small, and this is a statistically significant result. Incontrast, ρ for the emission component of Hα and the [OI] EW is -0.09 with a significance of 0.37, which does notfall below the adopted 10−3 threshold for significance.
The timescales on which the blueshifted absorption inHα and Hβ varies, ∼1 day, are more consistent with re-gions close to the star; the velocity center of the absorp-tion is consistent with the (de-projected) stellar escapevelocity, ∼300 km s−1. Indeed, earlier authors have sug-gested the narrow line widths and line symmetry suggestheating at the base of a stellar wind launching region asthe origin of metallic line emission (Catala et al. 2007).Asymmetries in these metallic lines are attributed to ob-scuration of the emitting region by the wind (Pogodinet al. 2005). At the relatively low system inclination,a high degree of collimation/small opening angle wouldbe necessary in order for material to be present alongthe line of sight; this is easier to accomplish with a stel-lar wind than a disk wind. Indeed, our initial radiativetransfer models, which include only a disk wind, fail toreproduce blueshifted absorption for the interferometricsystem inclination (models detailed in Appendix B). In-terestingly, we observe that as the wind absorption weak-ens, the [O I] emission strengthens. We suggest one pos-sible physical interpretation for this anticorrelated EWevolution invoking star-disk interaction. Assuming theabsorption is done by a compact wind originating nearthe star and that the observed [O I] emission originatesin the disk surface layer, as the wind becomes less loadedwith mass (weakening absorption), the emitting layer ofthe disk can remain low enough density that [O I] is ableto spontaneously de-excite rather than being continuallycollisionally excited (thus strengthening emission). Atvelocities of a few hundred km s−1, wind material wouldtake ∼half a day to travel ∼0.1 au, making this scenarioconsistent with our observations.
While we do see significant variability within a singlenight of our observations of V1295 Aql, unfortunately,our data do not cover a sufficiently long time baselineto establish whether there is any periodicity to the vari-ability that could be attributed to rotational modula-tion (periodicity has been seen in CTTS, cf. Johns &Basri 1995, and references therein). We observe persis-
6 Aarnio et al.
TABLE 2Stellar parameters
V1295 Aql HD 98922Spectral type A2e B9eTeff [K] 9250±250 2 10600 3Mass [M�] 2.9±0.5 4 5 5Radius [R�] 3.6±0.5 4 9.1 3Inclination [◦] 34±2 6 20-45 7, 8vr [km s−1] -1.2±1.3 1 -4.9±4.4 1vsini [km s−1] 3.2±2.5 1 39±5.3 1Prot [d] 32±25 1 4-8 1Magnetic field strength [G] ∼100 9, 4, 10, 11 Non detection 11
Note. — References: 1. Derived in this work with MIKE spectra, rotation pe-riods calculated as P= 2πRstarsini / vsini. Errors cited incorporate the error onradius, vsini, and i; V1295 Aql’s uncertainty is dominated by uncertainty on vsini;a range is given for HD 98922, as a large range of inclination values are reported inthe literature. 2. Acke & Waelkens (2004), using spectral type and best visually-matched synthetic spectrum; 3. Kraus et al. (2008b), R calculated using Teff andL; 4. Catala et al. (2007), <B> from spectropolarimetry and mass, radius, fromPMS track placement; 5. Wade et al. (2007), masses, radii derived via PMS trackplacement; 6. Lazareff et al. (2017), H-band interferometry assuming shared starand disk inclination; 7. Hales et al. (2014), inclination from combined 12CO andSED modeling; 8. Blondel & Djie (2006), inclination from fitting shape of Lyman-αprofile; <B> from spectropolarimetry in 9. Hubrig et al. (2006), 10. Hubrig et al.(2009), and 11. Alecian et al. (2013c).
Fig. 3.— Correlations of time-series line EWs for V1295 Aql,2013 high cadence spectra only were used here. Lines are groupedby ionization state (singly ionized the left and below dividing lines,neutral to the right of and above) and within those groups, sortedby increasing excitation energy to the upper right corner.
tent, weak absorption and emission components withinthe blueshifted absorption in Hα, not attributable to anytelluric features, and have used a local minimum andmaximum finding algorithm to quantify their velocitiesand evolution during the observation window (see Ap-pendix C). We find that the lower velocity structures(between ∼-190 to -234 km s−1) remain stationary whilethe higher velocity structures (≤-265 km s−1) accelerate.The highest velocity transient absorption feature both
accelerates and decelerates during our observation win-dow; potentially, given the short timescale of significantvelocity evolution, we are observing structures entrainedand corotating in a stellar wind.
4.2. HD 98922
HD 98922 is a B9e star between 20-45◦ inclination(Blondel & Djie 2006; Hales et al. 2014); it has no de-tected magnetic field (Alecian et al. 2013c). From ourMIKE spectra, we measure vsini to be 38.9±5.31 kms−1, and the Vr is −4.88±4.43 km s−1. Varying the in-clination within the reported range of values from theliterature, we obtain rotation periods between 4-8 days;thus our observations likely span a full rotation period.We see the greatest variability on the order of day to yeartimescales, however, substantial variability is observedover the course of our observations in 2013 (Fig. 2, leftpanel). The shorter timescales are most consistent withrotational modulation, but we do not detect periodicityon ∼day timescales in either object.
In Figure 4 we show the EW(t) correlation matrix asdescribed in Section 4.1. We see strong anticorrelationof the evolution of Na I D line widths and the higher or-der Balmer series lines, including both emission and ab-sorption components; in contrast, the Na I D line widthevolution is weakly correlated with Hβ and any correla-tion or anticorrelation with Hα is not statistically sig-nificant. Anticorrelation would not be expected in theTTS case, where Hα and Na I D emission have beenlinked to an accretion flow (e.g., the models of Muze-rolle et al. 2004), but it is unclear what differing levelsof correlation with different Balmer series lines could beindicating. In contrast to the same figure for V1295 Aql,we see more strongly related line profile evolution in HD98922 generally, possibly simply due to our observationssampling a full rotation period. Despite the coverage, wesearched for periodicity to line profile evolution and didnot find any (we show our equivalent width time seriesmeasurements in Appendix A).
The wind, as probed through the line minimum in theHα P Cygni component appears to be getting faster over

Time-Series Spectroscopy of HD 98922 and V1295 Aql 7
Fig. 4.— Correlations of time-series line EWs for HD 98922.
the course of observation. We note, however, the diffi-culty in modeling the wind as our high-resolution dataallow us to see at least three distinct velocity minimain the P Cygni profile. Similar to the distinct weak ab-sorption features in V1295 Aql, the lower velocity com-ponents (∼-50 to -100 km s−1) in HD 98922 are staticduring our observations while the higher velocity com-ponents (∼-125 to -175 km s−1) accelerate. When thevelocity of the component doing the strongest absorbingis slow, during our 2013 MIKE observations, we see PCygni absorption in the Na D lines; in the earlier epochof MIKE data from 2010, when the wind is a factor of 2faster (Fig. 1, upper left panel), there is no blueshiftedabsorption in the Na D lines. This is potentially prob-ing mass loading in a wind and corresponding changesin the density gradient in the acceleration region: whenthe wind is slower, the density gradient is steeper towardthe base of the launch region, causing the observed ab-sorption in Na I. Powell et al. (2012) noted this in FUOri, observing a 1.8d lag in variability between Na I andthe blueshifted absorption in Hα; unfortunately, we lacktemporal coverage in the earlier epoch of V1295 Aql datato search for a similar effect.
5. DISCUSSION
We have conducted a high cadence, time-series surveyof two Herbig Ae/Be stars. Combining these new datawith earlier observations by our team and archival spec-tra, we find strong variability in spectral line profiles onthe longer timescales sampled: years, months, and days.We see very weak modulation on the shortest timescalessampled, ∼minutes. In all timescales, the strongest vari-ability occurs in the blueshifted absorption componentsof the spectral lines. The lack of strong variability inlines’ emission components as well as an absence of in-verse P Cygni profiles is in distinct discord with our
modeling efforts based on a dipolar magnetospheric ac-cretion geometry. Given the lack of magnetic field detec-tions in Herbig Ae/Be stars as well as the evidence forhigher-order moments dominating global magnetic fieldstructure as stellar mass increases (Gregory et al. 2012),the observed accretion in both systems may be takingplace via higher-order magnetic field structure, a bound-ary layer, or at a novel magnetospheric inclination withrespect to the rotation axis (i.e., misaligned).
In the case of V1295 Aql, the system inclinationand variability on shorter than inner disk Kepleriantimescales point to a stellar or X-wind originating closeto the star, not a farther-out disk wind, as playing a rolein generating the observed spectral lines. Catala et al.(2007) suggest the acceleration region at the base of astellar wind as the origin of narrow metallic emissionlines. Our magnetospheric accretion+disk wind modeland the stellar wind model of Catala et al. (2007) demon-strate that a compact stellar wind acceleration region anda magnetosphere can produce the same emission profile;difficulty arises in how the blueshifted absorption is pro-duced. Interferometric evidence for low system inclina-tion makes it highly unusual that we observe as muchvariability in the blueward absorption components; in-deed, our disk wind model cannot reproduce the observedabsorption at such low system inclination. Observationsby Alecian et al. (2013a) during overlapping epochs indi-cate the structure of the stellar magnetic field itself haschanged, lending further support to material closer to thestar being responsible for variations in line morphology.Potentially further evidencing a stellar wind, we observeanticorrelated evolution of the blueshifted absorption inHα and [O I] 6300A emission (i.e., as the Hα blueshiftedabsorption weakens, the [O I] emission strengthens) thatmay indicate a decrease in outflow sufficiently lowers thedensity in upper disk layers to enhance forbidden lineemission; correlation is not seen when comparing theemission component of Hα to [O I]. Further, the Fe II(42) emission line, suggested by Catala et al. (2007) to beforming in a stellar wind, has positively correlated evo-lution with the emission components of all Balmer serieslines. Lastly, the velocity structure of the blueshiftedabsorption in Hα is consistent with obscuring materialmoving at or faster than stellar escape velocity.
Our observations span the full rotation period of HD98922; over this timescale, one may observe accretionflows moving in and out of the line of sight, modulat-ing observed flux in spectral lines. We do observe strongvariability in line profiles over this time, but do not findperiodicity in the evolution of line equivalent widths. Asin the case of V1295 Aql, the lack of any inverse P Cygniprofile or variability on that side of the line, despite ourfull sampling of the stellar rotation period, is problem-atic for a canonical magnetospheric accretion paradigm.Unlike V1295 Aql, HD 98922 is at an intermediate in-clination and the blueshifted absorption can be readilyreproduced via disk wind. We see anticorrelation of theNa I D lines’ evolution and Hδ and Hγ, but weak cor-relation with Hβ and no significant correlation with Hα;the significance of this is unclear, but positive correlationwould be expected were all the lines to originate in anaccretion flow.
Models of disk winds have recently begun to take into

8 Aarnio et al.
account the disk magnetic field. Of particular import tothe HAeBe case, the models of Bai & Stone (2013) showthat in the presence of a strong FUV field, the wind massloss rate is boosted; an FUV flux increase of an orderof magnitude increases the mass loss rate by a factorof 3. In developing a picture of accretion and outflowfor intermediate to higher mass protostars, the winds–both stellar and disk in origin–will likely be critical tounderstand, playing a dominant role in the system massflux.
For the two systems studied here, it is another interest-ing point of contrast that in one case, the time evolutionof emission and absorption components in the same lineprofile are apparently unrelated (V1295 Aql) while in theother, they are strongly correlated (HD 98922). Broadly,the differing evolution of lines in the same multiplet orseries that would be expected to co-evolve underscore theneed for rigorous definitions of line components due tothe potential for overlapping temporal and spatial prop-erties. The ambiguity of line profiles, e.g., the degener-acy in emission line production by an extended magne-tosphere versus a pure P-Cygni spherical wind (i.e., ourmodeling of the Hα line of V1295 Aql) calls for morerigorous, multi-component models that include asymme-try. High resolution, high cadence spectroscopy revealsspectral line structure on fine velocity/spatial and tem-poral scales while ∼nightly visits and multi-epoch datademonstrate rotational and longer-term system evolu-tion, both of which are necessary to inform models ofevolving modes of accretion and outflow with increasingstellar mass.
A. N. A. would like to acknowledge the support ofNASA Origins of Solar Systems grant NNX09AB87G toJ. D. M. and NSF AAG F034342 to A. N. A. and J. D. M.The authors thank B. P. Brown for computational con-tributions; models were calculated with support of theNASA High End Computing (HEC) Program throughthe NASA Advanced Supercomputing (NAS) Division atAmes Research Center on Pleiades with allocation GIDs1647. S. K. acknowledges support from a STFC Ruther-ford fellowship (ST/J004030/1) and ERC Starting Grant(Grant Agreement No. 639889). We also express appre-ciation for observations taken for this program by AjayTannirkulam, Xiao Che, Stefan Kraus, Mario Mateo,Keren Sharon and Traci Johnson. Finally, the authorsthank an anonymous referee for thorough comment andsuggestions that improved the manuscript.

Time-Series Spectroscopy of HD 98922 and V1295 Aql 9
APPENDIX
A. SPECTRAL ATLAS
Here we show spectra of all species discussed in the text for V1295 Aql (Figs. 5- 26 and HD 98922 (Figs. 27-48).The figures are in order of appearance in the correlation matrices (Figs. 3 and 4): singly ionized species first andneutrals second, sorted in order of increasing excitation potential within those groups.
V1295 Aquila
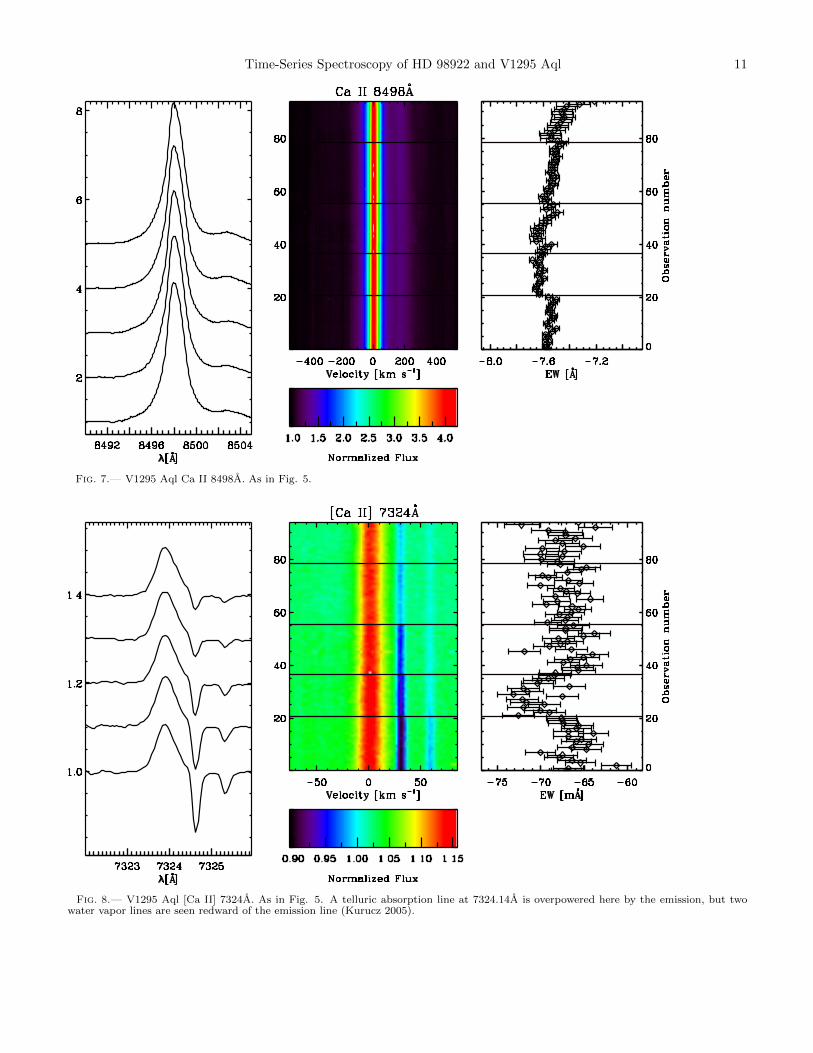
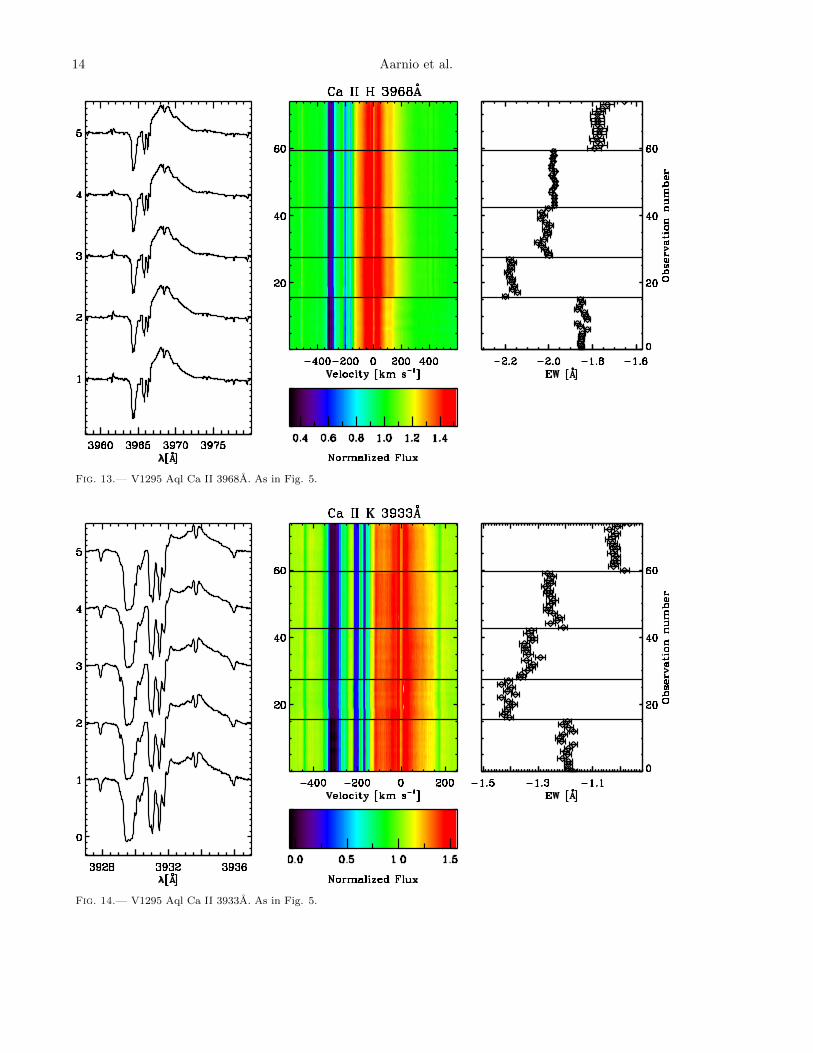
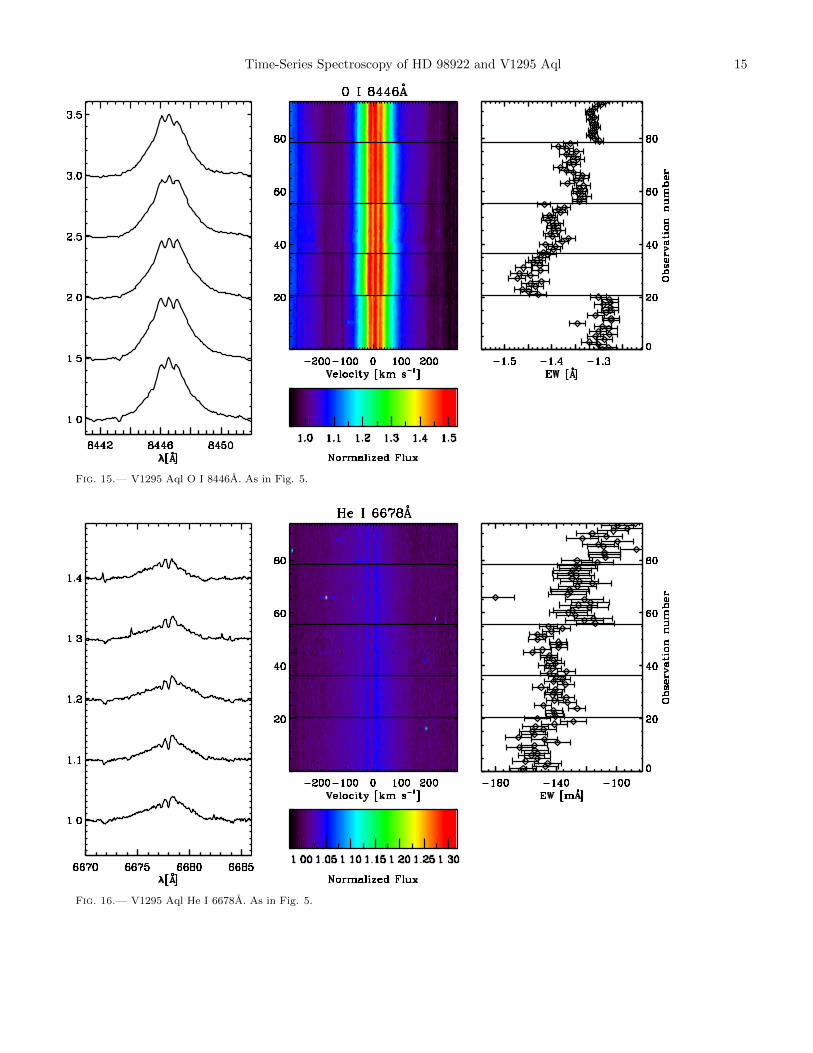
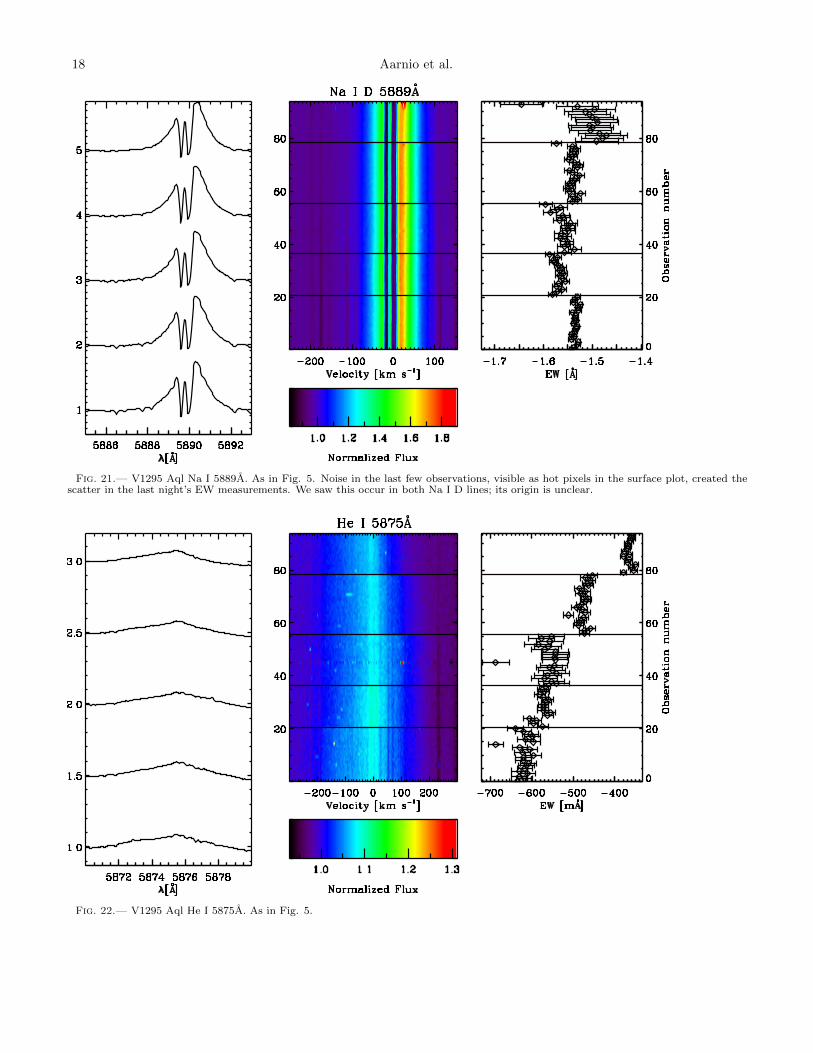
Fig. 5.— V1295 Aql Ca II 8662A. Left panel: Average line profiles for each of the five nights of high cadence observation, increasing intime from bottom to top: UT130429, UT130503, UT130504, UT130506, UT130507. Spectra are continuum normalized, their photosphericcomponents removed, and arbitrary y-axis offsets are applied for display purposes. Middle panel: surface plot showing every spectrumobserved, ascending time order from bottom to top. Spectra are continuum normalized, their photospheric components removed, and acolor scale is shown in bar below figure. Each night is separated by a horizontal line. Right panel: measured equivalent widths as a functionof time. Unless otherwise indicated, total line equivalent widths are shown (including both emission and absorption components). Abscissareversed to indicate decreasing emission line strength to the right. Error bars indicate RMS of measurements within a single night.

10 Aarnio et al.
Fig. 6.— V1295 Aql Ca II 8542A. As in Fig. 5.
Time-Series Spectroscopy of HD 98922 and V1295 Aql 11
Fig. 7.— V1295 Aql Ca II 8498A. As in Fig. 5.
Fig. 8.— V1295 Aql [Ca II] 7324A. As in Fig. 5. A telluric absorption line at 7324.14A is overpowered here by the emission, but twowater vapor lines are seen redward of the emission line (Kurucz 2005).

12 Aarnio et al.
Fig. 9.— V1295 Aql Fe II 7155A. As in Fig. 5. A telluric line at 7156.3A is clearly seen to vary from night to night (Catanzaro 1997).
Fig. 10.— V1295 Aql Fe II 5169A. As in Fig. 5.

Time-Series Spectroscopy of HD 98922 and V1295 Aql 13
Fig. 11.— V1295 Aql Fe II 5018A. As in Fig. 5.
Fig. 12.— V1295 Aql Fe II 4923A. As in Fig. 5. Poor seeing on the third night, as well as the line being on the edge of the MIKE redchip, contribute to the scatter in EW.
14 Aarnio et al.
Fig. 13.— V1295 Aql Ca II 3968A. As in Fig. 5.
Fig. 14.— V1295 Aql Ca II 3933A. As in Fig. 5.
Time-Series Spectroscopy of HD 98922 and V1295 Aql 15
Fig. 15.— V1295 Aql O I 8446A. As in Fig. 5.
Fig. 16.— V1295 Aql He I 6678A. As in Fig. 5.

16 Aarnio et al.
Fig. 17.— V1295 Aql Hα. As in Fig. 5. Here, we show just the fit emission components’ EW for plot scaling purposes.
Fig. 18.— V1295 Aql [O I] 6363A. As in Fig. 5.

Time-Series Spectroscopy of HD 98922 and V1295 Aql 17
Fig. 19.— V1295 Aql [O I] 6300A. As in Fig. 5.
Fig. 20.— V1295 Aql Na I 5895A. As in Fig. 5. Noise in the last few observations, visible as hot pixels in the surface plot, created thescatter in the last night’s EW measurements. We saw this occur in both Na I D lines; its origin is unclear.
18 Aarnio et al.
Fig. 21.— V1295 Aql Na I 5889A. As in Fig. 5. Noise in the last few observations, visible as hot pixels in the surface plot, created thescatter in the last night’s EW measurements. We saw this occur in both Na I D lines; its origin is unclear.
Fig. 22.— V1295 Aql He I 5875A. As in Fig. 5.

Time-Series Spectroscopy of HD 98922 and V1295 Aql 19
Fig. 23.— V1295 Aql O I 5578A. As in Fig. 5. We suggest this line, due to its weakness and night to night variability (unlike otherforbidden lines we observe which don’t vary much), could simply be airglow (Louistisserand et al. 1987) and neither stellar nor circumstellarin origin.
Fig. 24.— V1295 Aql Hβ. As in Fig. 5. Here, we show just the fit emission components’ EW for plot scaling purposes.

20 Aarnio et al.
Fig. 25.— V1295 Aql Hγ. As in Fig. 5. Here, we show just the fit emission components’ EW for plot scaling purposes.
Fig. 26.— V1295 Aql Hδ. As in Fig. 5. Here, we show just the fit emission components’ EW for plot scaling purposes.

Time-Series Spectroscopy of HD 98922 and V1295 Aql 21
HD 98922
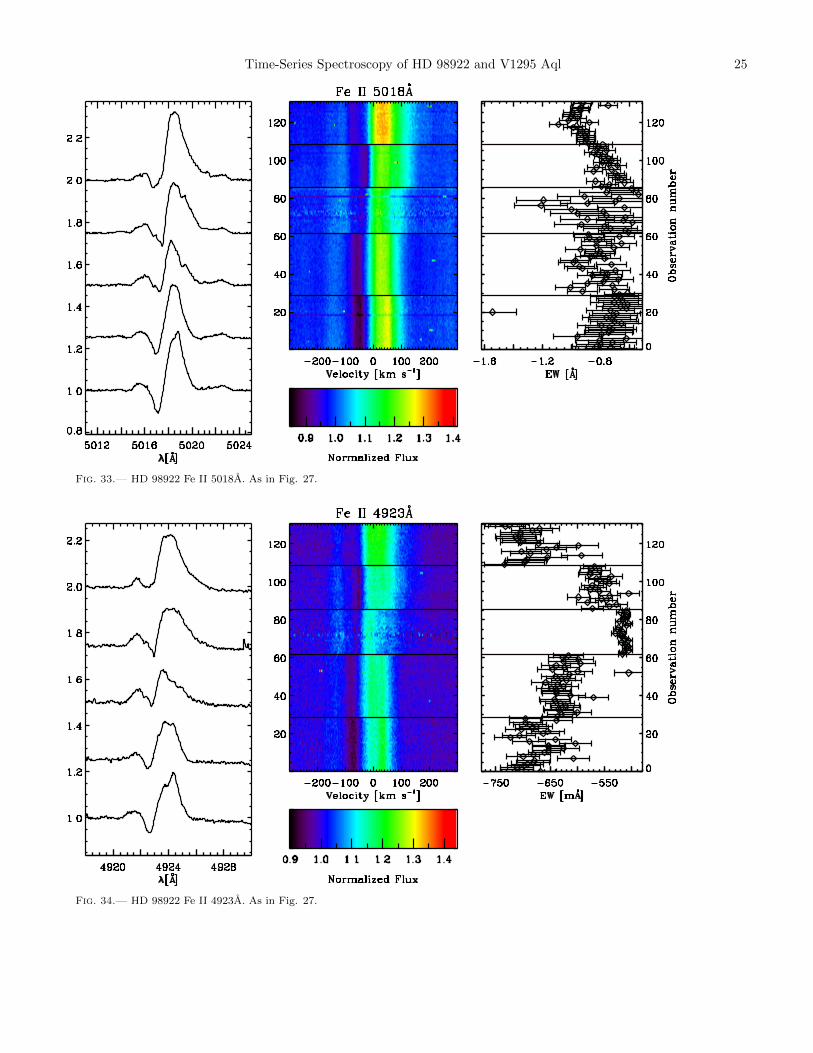
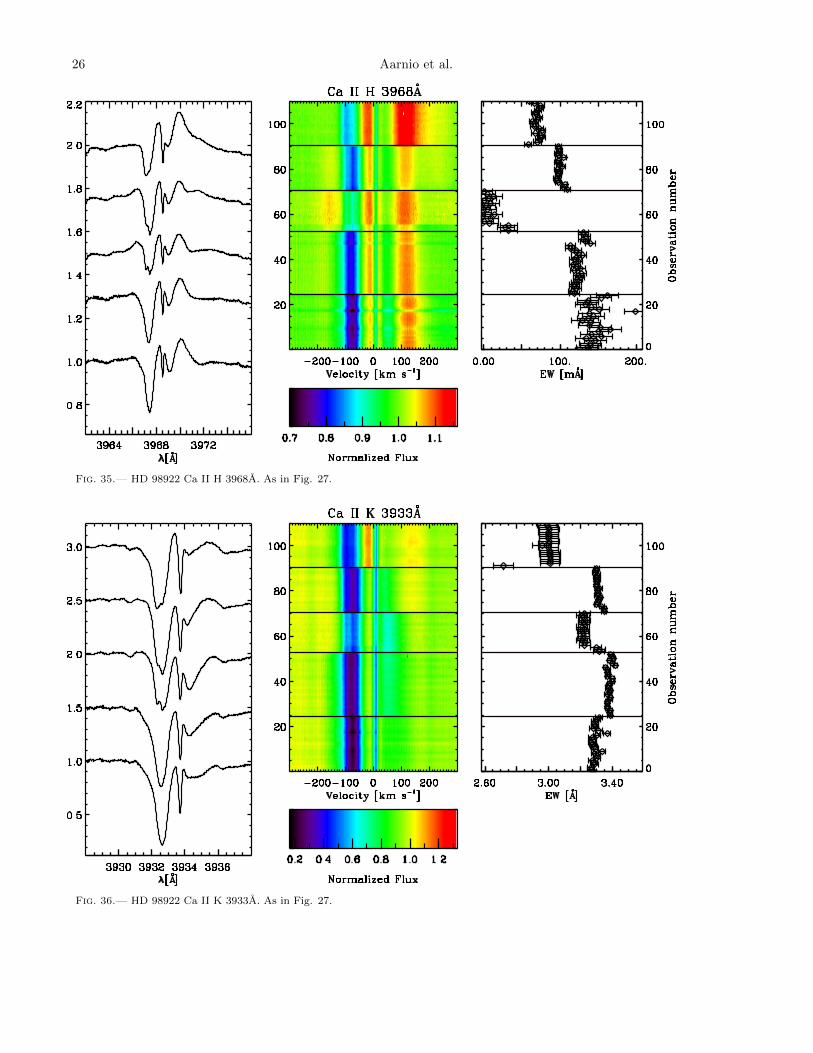
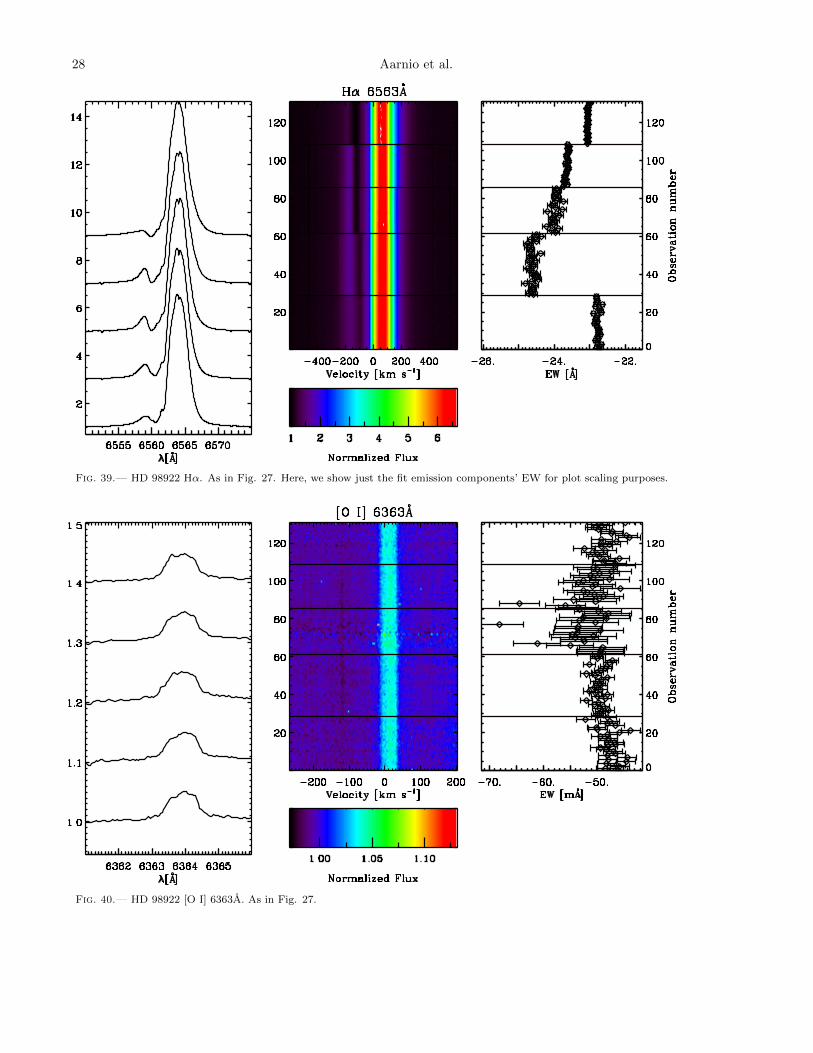
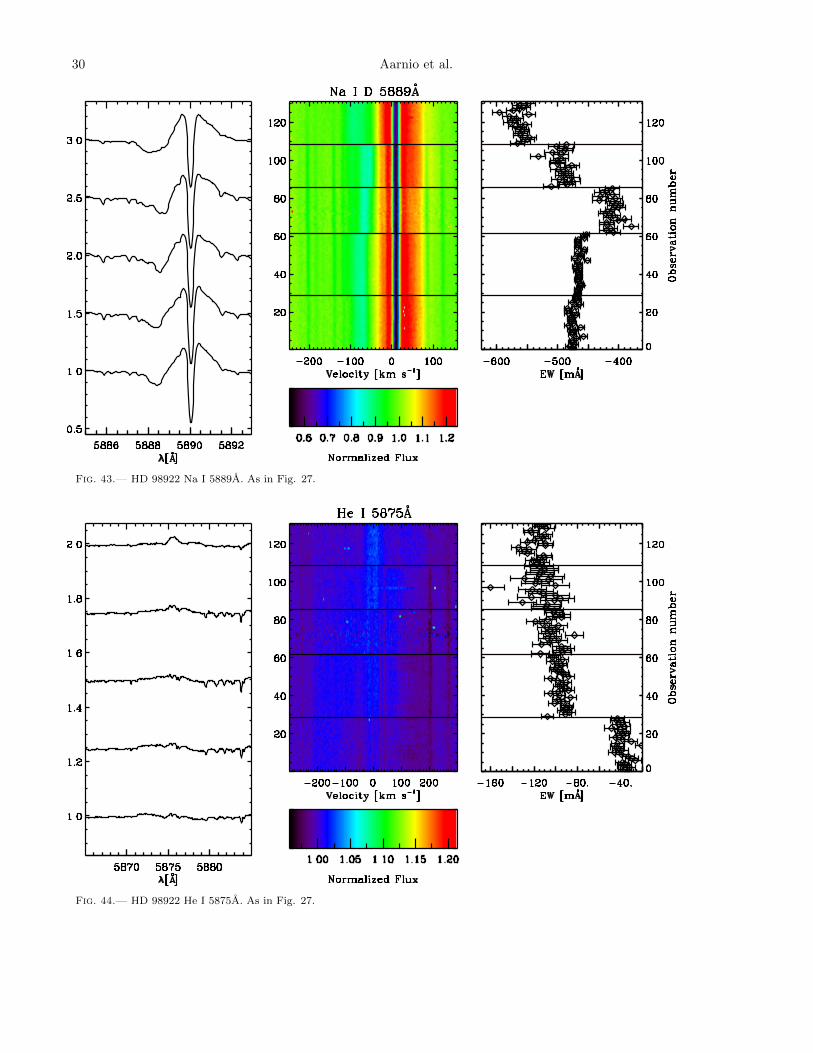
Fig. 27.— Left panel: Average line profiles for each of the five nights of high cadence observation, increasing in time from bottom to top:UT130428, UT130429, UT130503, UT130504, UT130506. Spectra are continuum normalized, their photospheric components removed, andarbitrary y-axis offsets are applied for display purposes. Middle panel: surface plot showing every spectrum observed, ascending time orderfrom bottom to top. Spectra are continuum normalized, their photospheric components removed, and a color scale is shown in bar belowfigure. Each night is separated by a horizontal line. Right panel: measured equivalent widths as a function of time. Unless otherwiseindicated, total line equivalent widths are shown (including both emission and absorption components). Abscissa reversed to indicatedecreasing emission line strength to the right. Error bars indicate RMS of measurements within a single night.

22 Aarnio et al.
Fig. 28.— HD 98922 Ca II 8542A. As in Fig. 27.

Time-Series Spectroscopy of HD 98922 and V1295 Aql 23
Fig. 29.— HD 98922 Ca II 8498A. As in Fig. 27.
Fig. 30.— HD 98922 [Ca II] 7324A. As in Fig. 27. Two water vapor lines are seen superimposed on the line and redward of it (Kurucz2005). Here we show only the emission component EW.

24 Aarnio et al.
Fig. 31.— HD 98922 Fe II 7155A. As in Fig. 27. There is a telluric absorption line at 7156.27A (Catanzaro 1997). Here we show onlythe emission component EW.
Fig. 32.— HD 98922 Fe II 5169A. As in Fig. 27.
Time-Series Spectroscopy of HD 98922 and V1295 Aql 25
Fig. 33.— HD 98922 Fe II 5018A. As in Fig. 27.
Fig. 34.— HD 98922 Fe II 4923A. As in Fig. 27.
26 Aarnio et al.
Fig. 35.— HD 98922 Ca II H 3968A. As in Fig. 27.
Fig. 36.— HD 98922 Ca II K 3933A. As in Fig. 27.

Time-Series Spectroscopy of HD 98922 and V1295 Aql 27
Fig. 37.— HD 98922 O I 8446A. As in Fig. 27.
Fig. 38.— HD 98922 He I 6678A. As in Fig. 27.
28 Aarnio et al.
Fig. 39.— HD 98922 Hα. As in Fig. 27. Here, we show just the fit emission components’ EW for plot scaling purposes.
Fig. 40.— HD 98922 [O I] 6363A. As in Fig. 27.

Time-Series Spectroscopy of HD 98922 and V1295 Aql 29
Fig. 41.— HD 98922 [O I] 6300A. As in Fig. 27.
Fig. 42.— HD 98922 Na I 5895A. As in Fig. 27.
30 Aarnio et al.
Fig. 43.— HD 98922 Na I 5889A. As in Fig. 27.
Fig. 44.— HD 98922 He I 5875A. As in Fig. 27.

Time-Series Spectroscopy of HD 98922 and V1295 Aql 31
Fig. 45.— HD 98922 O I 5578A. As in Fig. 27. Due to its persistence, we suggest the weak, broad emission line is stellar or circumstellarin origin. The narrow component that arises and fluctuates within the third night we believe to be airglow (Louistisserand et al. 1987).
Fig. 46.— HD 98922 Hβ. As in Fig. 27. Here, we show just the fit emission components’ EW for plot scaling purposes.

32 Aarnio et al.
Fig. 47.— HD 98922 Hγ. As in Fig. 27. Here, we show just the fit emission components’ EW for plot scaling purposes.
Fig. 48.— HD 98922 Hδ. As in Fig. 27. Here, we show just the fit emission components’ EW for plot scaling purposes.

Time-Series Spectroscopy of HD 98922 and V1295 Aql 33
TABLE 3Adopted TORUS model parameters
V1295 Aql HD 98922System inclination [◦] 10, 34 45
Herbig-like T Tauri-like Herbig-like T Tauri-like
Magnetosphere parametersRinner [R∗] 1.0 3.0 · · · 3.0Router [R∗] 1.3 4.4 · · · 4.1Tmax [K] 8000 8000 · · · 8000Macc [M� yr−1] 10−5 10−7, 10−8 · · · 10−6
Disk wind parametersMwind [M� yr−1] 10−8 10−7
Twind [K] 8000 8000Rinner [R∗] 4.4 4.1Router [R∗] 10 10, 20θ [◦] 30 30
Note. — Key parameters of the magnetosphere and disk wind for our models ofV1295 Aql and HD 98922. Adopted stellar parameters appear in Table 2. We have as-sumed a magnetospheric temperature structure as described in Hartmann et al. (1994),defining Tmax for both stars as 8000 K. We assume an isothermal disk wind, and θis the wind half-opening angle with respect to the stellar rotation axis. For all windmodels, we set wind acceleration parameter β to 0.2 and the acceleration length scaleto 10 times the inner wind launching radius (cf. Kurosawa et al. 2006, and referencestherein). References and derivation of these values discussed in sections devoted toeach star.
B. TORUS MODELS OF V1295 AQUILA AND HD 98922
Model setup
As a means for exploring mechanisms for line formation in the systems we observed, we have calculated line transferwith TORUS for systems comprised of a star, magnetosphere, disk, and disk wind. The modular framework of TORUSas applied to star+disk systems is described in more detail in Kurosawa et al. (2006); we highlight salient details for ourHerbig AeBe-specific application below. Our TORUS models calculate level populations by solving the rate equationsfor Hydrogen assuming non-LTE conditions. Doppler broadening is applied to the line profiles assuming turbulentvelocity in the flow of 20 km s−1; pressure broadening as formulated in Muzerolle et al. (2001) is also applied and isthe dominant broadening mechanism for the lines we study here.
The radial extent at which a dipolar field of a given strength can hold off infall (Koenigl 1991), rT , is expressed(using the formulation of Hartmann 1998) as:
rTR∗
= 3.7B4/73 M
−2/7−7 M
−1/71/2 R
5/72 ; (B1)
where B3 is the magnetic field strength in units of kG, M−7 is the mass accretion rate in units of 10−7 M� yr−1, M1/2
is the stellar mass in units of 0.5 M�, and R2 is the stellar radius in units of 2 R�.For a fiducial case, we use parameters for the one object we study here with a detected magnetic field, V1295 Aql.
For its measured ∼100 G field, stellar parameters as reported in Table 2 and an observationally determined accretionrate of ∼10−5 M� yr−1 (Mendigutıa et al. 2011b) this magnetospheric radius is 0.32 R∗. To compare this to a TTauri-like case, we also compute models with magnetospheres truncated where a 1kG field would imply. For HD98922 it is 4.1 R∗, and for V1295 Aql, we have tested various accretion rates and their corresponding magnetospherictruncation radii; we discuss our preferred lower accretion rate (10−7 and 10−8 M� yr−1) models with magnetospherestruncated at 4.4 R∗ below. For both stars, we set the inner edge of the dust disk to their respective sublimation radiiand the disk wind half-opening angle to 30◦ with respect to the stellar rotation axis; interior to this is an opticallythick gaseous disk component that extends to the magnetosphere edge where the disk wind launches.
In Table 3, we summarize key parameters adopted in our models and discuss for each star below how they werechosen and the impact on the line profiles of their adjustment. In Fig. 49, we show calculated Hα and Hβ line profilesfor cases we refer to as “Herbig-like” (with small/no magnetospheres) and “T Tauri-like” (with magnetospheres derivedassuming 1kG fields). Overall, we found a magnetospheric component necessary to produce the observed emission linesbut note other choices that could mimic this effect.
V1295 Aql
Very narrow photospheric lines and little modulation of photometric and spectropolarimetric signals indicate eitherlow inclination or a very long rotation period for V1295 Aql (Eisner et al. 2004; Isella et al. 2006; Catala et al. 2007).Interferometric values reported in the literature poorly constrain system inclination: 12-65◦ values are gotten (thoughthe sparse u− v coverage of both Eisner et al. 2004 and Isella et al. 2006 does not permit ruling out a pole-on view orbinarity) while Ragland et al. (2012) derive a highly inclined 72◦. For our TORUS models, we adopt 34◦ from analysisof new PIONIER data Lazareff et al. (2017) and assess the line profile structure’s dependence on inclination.

34 Aarnio et al.
Assuming an accretion rate of 10−5 M� yr−1 and magnetic field strength of 100 G, we derive a magnetosphericextent of 0.32 R∗. In this “Herbig-like” model, we find weak contribution to the line profile (Figure 49, upper leftpanel); emission and absorption components at ∼10% of the continuum level are much weaker than observed in ourspectra. At 10◦ inclination, higher velocity blueshifted material is all that is observed of the magnetospheric emission,its peak overlapping with the broad, faster, wind emission in Hα but readily visible at ∼ −70 km s−1 in Hβ. At aninclination of 34◦, more of the accretion stream is visible–notably, the low-velocity material–and a distinct emissionpeak is seen near 0 km s−1. In Figure 49 (upper left panel), we show a potentially unrealistically low disk wind massloss rate given the high stellar accretion rate adopted; our purpose here is to visually isolate the profile of the samewind component used in the T Tauri-like case for demonstration. We note that at higher disk wind mass loss rates,e.g. at 10% of the mass accretion rate, the disk wind itself is redshifted from line center and dominates the overallemission profile, its peak stronger than is observed in our data.
To model a T Tauri-like case, we tested an extended dipolar magnetosphere reaching from 3-4.4 R∗. We performedtests for various inner magnetospheric radii and accretion rates to then reproduce the overall emission strength andvelocity width observed in our spectra and assessed line profiles at various potential system inclination angles. Wefound a more modest mass accretion rate of 10−7 M� yr−1, a couple orders of magnitude lower than that reported inthe literature, and an outer magnetospheric radius of 4.4 R∗ (calculated assuming 1kG field) was able to reproducecomparable emission in the modeled lines to our observations (Figure 49, top right panel; black solid/dashed lineprofiles). A higher mass accretion rate as reported in the literature from a study not done in the same epoch asour observations combined with a more extended magnetosphere as is modeled here produced stronger emission thanwe observed; interestingly, for the parameter spaces we explored, lower accretion rates of ∼10−7−10−8M� yr−1 andsmaller magnetospheric sizes produce strikingly similar profiles to our observations.
In Figure 49, upper right panel, red solid and dashed lines, we show the exact same model with an accretion rateone order of magnitude lower (10−8 M� yr−1) and note the line profile peak asymmetry shift from higher on the blueside of the line to higher on the red side of the line and an overall decrease in line strength more consistent withour observations. Generally, we find in our models that higher accretion rates and more extended magnetospheres(i.e., with inner radii set closer to the star) produce more symmetric profiles about the line’s peak flux while morecompact magnetospheres generate asymmetric peaks. These asymmetries manifest at low accretion rates as thedistinctive, narrow, enhanced redward emission peak shape like observed in V1295 Aql. Uncertainty in the Balmerexcess measurement (the difference in flux in the U and B bands) of 0.1-0.2 dex can lead to one to two orders ofmagnitude uncertainty in the accretion rate, making our models’ low accretion rates consistent with the measurements.The line profiles observed by us during this epoch indicate it is highly unlikely either object observed is in a high massaccretion rate regime, as the line wings are relatively narrow (±200 km s−1) and the continuum opacity is not high
enough to have driven the lines into absorption (e.g., the high temperature, high M models in Muzerolle et al. 2001).Finally, we also note the stellar mass cited by Mendigutıa et al. (2011b) is a factor of 2 higher than our adopted value;a revised stellar mass would likely lead to a lower mass accretion rate derived via the accretion shock models.
While the structure in the Hα emission profile is highly suggestive, we are only able to produce the line profile atrelatively low system inclinations ranging from 10◦-34◦. Even so, the models’ redshifted absorption is not presentin the observed spectra and we are unable to reproduce the blueshifted absorption observed. Since we have usedan unrealistically large magnetosphere as a fiducial model (when the 100 G field strength and high measured massaccretion rate implies a <1 R∗ extent), a substantial fraction of the emission could be originating from a hot, innergaseous disk or a spherically symmetric wind launched from within a few stellar radii of the star. Indeed, Catalaet al. (2007) were able to model the Hα line using a stellar wind and note the similarity between the observed profileand a familiar P Cygni profile. This is to say there is a substantial degeneracy in modeling these line profiles: astellar wind with a compact launch/emission region can mimic the appearance of a magnetosphere. Modeling of thesesystems requires information about the stellar magnetic field to break these degeneracies. Finally, at the low systeminclination at which a magnetosphere closest matches the emission line profile, in order to produce the observedblueshifted absorption, a disk wind launching angle steeper than the critical angle beyond which a flow cannot beinitiated (e.g., 30◦ from the disk normal vector Blandford & Payne 1982) would need be invoked. We tested variousdisk wind geometries, varying the half-opening angle from 30◦-45◦ and the width of the wind launching region (whichthen changes the density along the line of sight) and even for the most shallow half-opening angle and narrowest casetested (shown in Figure 49), no blueshifted absorption was produced. Thus, we conclude a stellar wind scenario ismore consistent with all of the data available to us.
HD 98922
In Figure 49 we present “Herbig-like” and “T Tauri-like” models of HD 98922 in the left and right bottom panelsrespectively; the left panel is simply the same model as in the right, but with the magnetosphere component turnedoff.
For HD 98922, we performed a similar calculation of the magnetospheric truncation radius assuming a TTS-like, 1kGfield and adopting a mass accretion rate of rate of 10−6 M� yr−1 (Garcia Lopez et al. 2006); these parameters set theouter magnetospheric radius to 4.1 R∗. We initially adopted parameters from the literature for the disk wind, includingan isothermal temperature of 10,000 K (Caratti o Garatti et al. 2015) and a disk wind mass loss rate of 10−7 M�yr−1, an order of magnitude lower than the accretion rate (consistent with the model of Caratti o Garatti et al. 2015).In these models, we also initially chose a system inclination of 20◦ and disk wind half opening angle (with respect to

Time-Series Spectroscopy of HD 98922 and V1295 Aql 35
Fig. 49.— Our TORUS model spectra comparing small/no magnetosphere models (“HAeBe-like,” left column) and extended magneto-spheres assuming 1kG fields (“T Tauri-like,” right column) for V1295 Aql (top row) and HD 98922 (bottom row). We present Hα (solid)and Hβ (dot-dashed) profiles; for V1295 Aql, we show the effect of system inclination and mass accretion rate choice on the line profiles,and for HD 98922 we demonstrate how the size of the wind launching region effects absorption depth. For the T Tauri-like cases, an inverseP Cygni profile is present in Hα and becomes readily apparent in the Hβ profiles, in disagreement with the observed spectra at all epochs.Model parameters are summarized in Table 3.
the stellar rotation axis, assumed to be perpendicular to the disk) of 30◦ as done by Caratti o Garatti et al. (2015),but find the disk wind does not provide enough opacity along the line of sight and thus doesn’t produce blueshiftedabsorption observed in our spectra. In the models shown here, therefore, we adopt the 45◦ system inclination reportedby Blondel & Djie (2006). We found at this steeper inclination a 10,000 K disk wind still did not absorb; we adjustedthe wind temperature until it did begin to absorb at 8000 K and have set the temperature to that value in all modelsshown here. We note an even cooler still 7000 K disk wind produces very deep absorption, to ∼0.01% of the continuumlevel, which we do not observe an any epoch of our spectra.
At its slightly higher system inclination, we are easily able to produce blueshifted absorption in the HD 98922 modelswith a disk wind. In Figure 49 (bottom two panels), we show the effect of changing the disk wind launching regionwidth on the depth of the absorption profile. A narrower launch region increases density along the line of sight andproduces deeper absorption. This effect can be mimicked by altering the system inclination or the mass loss rate. Wehave calculated observationally and physically motivated models without a magnetosphere, as would be suggested bythe non-detection of this object in spectropolarimetric surveys, but found no combination of disk wind or hot innerdisk components able to produce substantial emission above the continuum level; indeed, the disk wind itself producesa multiply-peaked profile not observed in any line in our spectra (Figure 49, lower left panel).
Our T Tauri-like line profile models for HD 98922 (Fig. 49) are better able to reproduce observations than in the caseof V1295 Aql, though we find the depth of the disk wind absorption highly dependent on the disk wind launching regionextent. Additionally, with a symmetric disk wind, we are unable to reproduce the multiple absorption components andsubstructure observed in our spectra. This model, while it coarsely resembles our data, includes a magnetosphere andits attendant inverse P Cygni absorption which is not physically realistic given the magnetic field non-detection statusof HD 98922. It is unclear what could be producing the observed emission, though a source spatially compact and
36 Aarnio et al.
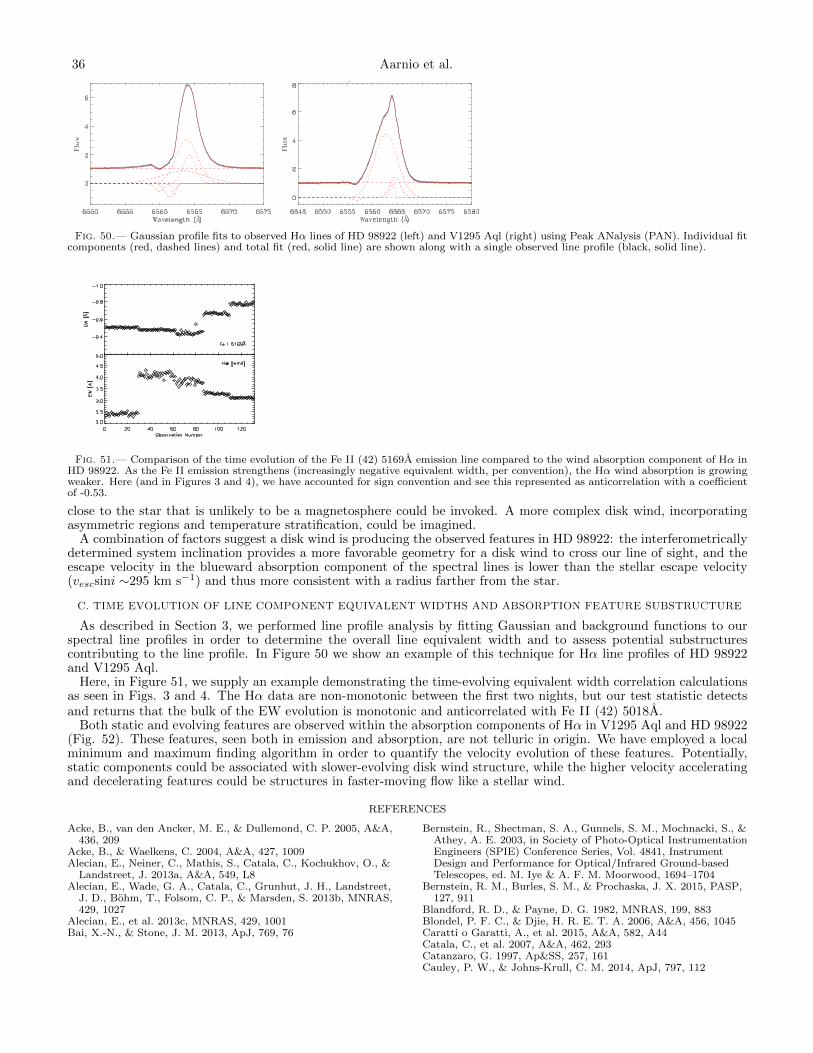
Fig. 50.— Gaussian profile fits to observed Hα lines of HD 98922 (left) and V1295 Aql (right) using Peak ANalysis (PAN). Individual fitcomponents (red, dashed lines) and total fit (red, solid line) are shown along with a single observed line profile (black, solid line).
Fig. 51.— Comparison of the time evolution of the Fe II (42) 5169A emission line compared to the wind absorption component of Hα inHD 98922. As the Fe II emission strengthens (increasingly negative equivalent width, per convention), the Hα wind absorption is growingweaker. Here (and in Figures 3 and 4), we have accounted for sign convention and see this represented as anticorrelation with a coefficientof -0.53.
close to the star that is unlikely to be a magnetosphere could be invoked. A more complex disk wind, incorporatingasymmetric regions and temperature stratification, could be imagined.
A combination of factors suggest a disk wind is producing the observed features in HD 98922: the interferometricallydetermined system inclination provides a more favorable geometry for a disk wind to cross our line of sight, and theescape velocity in the blueward absorption component of the spectral lines is lower than the stellar escape velocity(vescsini ∼295 km s−1) and thus more consistent with a radius farther from the star.
C. TIME EVOLUTION OF LINE COMPONENT EQUIVALENT WIDTHS AND ABSORPTION FEATURE SUBSTRUCTURE
As described in Section 3, we performed line profile analysis by fitting Gaussian and background functions to ourspectral line profiles in order to determine the overall line equivalent width and to assess potential substructurescontributing to the line profile. In Figure 50 we show an example of this technique for Hα line profiles of HD 98922and V1295 Aql.
Here, in Figure 51, we supply an example demonstrating the time-evolving equivalent width correlation calculationsas seen in Figs. 3 and 4. The Hα data are non-monotonic between the first two nights, but our test statistic detectsand returns that the bulk of the EW evolution is monotonic and anticorrelated with Fe II (42) 5018A.
Both static and evolving features are observed within the absorption components of Hα in V1295 Aql and HD 98922(Fig. 52). These features, seen both in emission and absorption, are not telluric in origin. We have employed a localminimum and maximum finding algorithm in order to quantify the velocity evolution of these features. Potentially,static components could be associated with slower-evolving disk wind structure, while the higher velocity acceleratingand decelerating features could be structures in faster-moving flow like a stellar wind.
REFERENCES
Acke, B., van den Ancker, M. E., & Dullemond, C. P. 2005, A&A,436, 209
Acke, B., & Waelkens, C. 2004, A&A, 427, 1009Alecian, E., Neiner, C., Mathis, S., Catala, C., Kochukhov, O., &
Landstreet, J. 2013a, A&A, 549, L8Alecian, E., Wade, G. A., Catala, C., Grunhut, J. H., Landstreet,
J. D., Bohm, T., Folsom, C. P., & Marsden, S. 2013b, MNRAS,429, 1027
Alecian, E., et al. 2013c, MNRAS, 429, 1001Bai, X.-N., & Stone, J. M. 2013, ApJ, 769, 76
Bernstein, R., Shectman, S. A., Gunnels, S. M., Mochnacki, S., &Athey, A. E. 2003, in Society of Photo-Optical InstrumentationEngineers (SPIE) Conference Series, Vol. 4841, InstrumentDesign and Performance for Optical/Infrared Ground-basedTelescopes, ed. M. Iye & A. F. M. Moorwood, 1694–1704
Bernstein, R. M., Burles, S. M., & Prochaska, J. X. 2015, PASP,127, 911
Blandford, R. D., & Payne, D. G. 1982, MNRAS, 199, 883Blondel, P. F. C., & Djie, H. R. E. T. A. 2006, A&A, 456, 1045Caratti o Garatti, A., et al. 2015, A&A, 582, A44Catala, C., et al. 2007, A&A, 462, 293Catanzaro, G. 1997, Ap&SS, 257, 161Cauley, P. W., & Johns-Krull, C. M. 2014, ApJ, 797, 112

Time-Series Spectroscopy of HD 98922 and V1295 Aql 37
Fig. 52.— Tracing weak absorption (black contours) and emission components (orange contours) within the blueshifted absorption of HD98922 (left) and V1295 Aql (right). While noise does interfere with the tracing of these weak features, several distinct velocity componentspersist over multiple nights of observation (demarcated by horizontal lines), either remaining static at one velocity or evolving over thecourse of our observations.
Corcoran, M., & Ray, T. P. 1998, A&A, 331, 147Costigan, G., Vink, J. S., Scholz, A., Ray, T., & Testi, L. 2014,
MNRAS, 440, 3444Eisner, J. A., Lane, B. F., Hillenbrand, L. A., Akeson, R. L., &
Sargent, A. I. 2004, ApJ, 613, 1049Ellerbroek, L. E., et al. 2015, A&A, 573, A77Ferreira, J. 2013, in EAS Publications Series, Vol. 62, EAS
Publications Series, 169–225Ferreira, J., Dougados, C., & Cabrit, S. 2006, A&A, 453, 785Garcia Lopez, R., Natta, A., Testi, L., & Habart, E. 2006, A&A,
459, 837Gregory, S. G., Donati, J.-F., Morin, J., Hussain, G. A. J.,
Mayne, N. J., Hillenbrand, L. A., & Jardine, M. 2012, ApJ,755, 97
Hales, A. S., et al. 2014, AJ, 148, 47Harries, T. J. 2000, MNRAS, 315, 722Hartigan, P., Edwards, S., & Ghandour, L. 1995, ApJ, 452, 736Hartmann, L. 1998, Cambridge Astrophysics Series, 32Hartmann, L., Hewett, R., & Calvet, N. 1994, ApJ, 426, 669Herbig, G. H. 1960, ApJS, 4, 337Hubrig, S., Yudin, R. V., Scholler, M., & Pogodin, M. A. 2006,
A&A, 446, 1089Hubrig, S., et al. 2009, A&A, 502, 283Isella, A., Testi, L., & Natta, A. 2006, A&A, 451, 951Johns, C. M., & Basri, G. 1995, AJ, 109, 2800Knigge, C., Woods, J. A., & Drew, J. E. 1995, MNRAS, 273, 225Koenigl, A. 1991, ApJ, 370, L39Kraus, S., Preibisch, T., & Ohnaka, K. 2008a, ApJ, 676, 490Kraus, S., et al. 2008b, A&A, 489, 1157Kurosawa, R., Harries, T. J., & Symington, N. H. 2006, MNRAS,
370, 580Kurosawa, R., et al. 2016, MNRAS, 457, 2236Kurucz, R. L. 2005, Memorie della Societa Astronomica Italiana
Supplementi, 8, 189
Lazareff, B., et al. 2017, A&A, 599, A85Long, K. S., & Knigge, C. 2002, ApJ, 579, 725Louistisserand, S., Bucher, A., Koutchmy, S., & Lamy, P. 1987,
A&AS, 68, 539Mendigutıa, I., Eiroa, C., Montesinos, B., Mora, A., Oudmaijer,
R. D., Merın, B., & Meeus, G. 2011a, A&A, 529, A34Mendigutıa, I., Calvet, N., Montesinos, B., Mora, A., Muzerolle,
J., Eiroa, C., Oudmaijer, R. D., & Merın, B. 2011b, A&A, 535,A99
Mora, A., et al. 2001, A&A, 378, 116Munari, U., Sordo, R., Castelli, F., & Zwitter, T. 2005, A&A,
442, 1127Muzerolle, J., Calvet, N., & Hartmann, L. 2001, ApJ, 550, 944Muzerolle, J., D’Alessio, P., Calvet, N., & Hartmann, L. 2004,
ApJ, 617, 406Nguyen, D. C., Scholz, A., van Kerkwijk, M. H., Jayawardhana,
R., & Brandeker, A. 2009, ApJ, 694, L153Pogodin, M. A., Franco, G. A. P., & Lopes, D. F. 2005, A&A,
438, 239
Powell, S. L., Irwin, M., Bouvier, J., & Clarke, C. J. 2012,MNRAS, 426, 3315
Press, W. H., Teukolsky, S. A., Vetterling, W. T., & Flannery,B. P. 1992, Numerical recipes in FORTRAN. The art ofscientific computing, 634
Ragland, S., et al. 2012, ApJ, 746, 126Sousa, A. P., et al. 2016, A&A, 586, A47Vink, J. S., Drew, J. E., Harries, T. J., & Oudmaijer, R. D. 2002,
MNRAS, 337, 356Wade, G. A., Bagnulo, S., Drouin, D., Landstreet, J. D., &
Monin, D. 2007, MNRAS, 376, 1145Weigelt, G., et al. 2011, A&A, 527, A103