Alibaba Jeffrries
130
RMB Prev. 2014A Prev. 2015E Prev. 2016E Prev. 2017E Rev. (MM) -- 52,504.0 -- 76,812.0 -- 105,040.0 -- 132,115.0 Chg (% YoY) -- 52.1% -- 46.3% -- 36.7% -- 25.8% Operating Profit -- 29,392.0 -- 34,486.0 -- 46,382.0 -- 58,467.0 EBITDA (MM) -- 30,731.0 -- 36,242.0 -- 48,850.0 -- 61,855.0 Net Profit Non- GAAP -- 27,610.0 -- 31,489.0 -- 45,060.0 -- 58,541.0 BV/Share -- 17.50 -- 53.00 -- 70.25 -- 93.20 EPS Growth -- 103.9% -- 7.9% -- 41.6% -- 29.9% EPS FY Dec -- $1.90 -- $2.06 -- $2.92 -- $3.79 FY P/E 50.4x 46.5x 32.8x 25.3x Price Performance SEP-14 OCT-14 100 95 90 85 80 COMPANY NOTE Initiating Coverage CHN | Technology | Internet 27 October 2014 Alibaba (BABA) The Powerful E-Commerce Ecosystem Connecting Half of China; Initiate at Buy EQUITY RESEARCH CHINA BUY Price target $118.00 Price $95.76 Financial Summary Book Value (MM): Rmb40,818.0 Book Value/Share: Rmb17.50 Net Debt (MM): (Rmb2,557) Return on Avg. Equity: 106.5% Long-Term Debt (MM): Rmb30,711.0 Cash & ST Invest. (MM): Rmb43,632.0 Market Data 52 Week Range: $99.70 - $82.81 Total Entprs. Value (MM): $238,140.2 Market Cap. (MM): $238,557.3 Insider Ownership: 12.8% Institutional Ownership: 54.6% Shares Out. (MM): 2,491.2 Float (MM): NA Avg. Daily Vol.: NA Cynthia Meng * Equity Analyst +852 3743 8033 [email protected] Brian Pitz § Equity Analyst (212) 336-7413 [email protected] Brian Fitzgerald § Equity Analyst (212) 284-2491 [email protected] Karen Chan * Equity Associate +852 3743 8017 [email protected] Nick Wang * Equity Associate +852 3743 8059 [email protected] Qin Wang * Equity Associate +852 3743 8016 [email protected] * Jefferies Hong Kong Limited § Jefferies LLC Key Takeaway China's changing Internet user demographics and mobile development support our favorable view on e-Commerce for the next decade. Alibaba is the largest Chinese ecommerce player, with 80%+ GMV market share, but is only selling to less than 25% of the population now. We estimate well over half of Chinese population will be shopping on Alibaba’s platforms in 10 years. Initiate with Buy; PT USD118. Changing demographics & mobile support ecommerce in the next decade. As discussed in our sector note, "A Taste of Domestic Consumption: The Unleashing of China's E-Commerce Power" published on Sept 19, 2014, China’s e-Commerce growth for the next decade benefit from: 1) changing Internet user demographics towards 30+ year old age groups; 2) accelerating structural shift to online from traditional retail; 3) Chinese government’s massive support for urbanization and domestic consumption; 4) proliferation of affordable smart devices; 5) improving wireless and transport infrastructures in lower tier and rural markets, and 6) rising consumer demand for better quality, design & fashion, authenticity and timely delivery. Growth driven by mix shift towards Tmall, and improving mobile monetization. We expect Alibaba, as the largest e-Commerce player, to sell to well over half of the Chinese population in 10 years, up from less than 25% now. We estimate FY14-17E revenue CAGR of 36%, driven by continued commission revenues from Tmall. Alibaba’s mobile GMV accounted for 32.8% of total GMV in FY1Q15, +21pcpt YoY. We expect the mobile monetization rate to narrow the gap with that of PC. Cross-border e-Commerce provides upside for long-term growth. Addressing the growing appetite for foreign brands among Chinese consumers, Tmall Global lowers the cost, delivery time and language barriers in cross-border online shopping, which is expected to reach an RMB1trn market size by 2018. Our scenario analysis shows a 5-12% upside to our CY16 revenue estimate. Its recently launched ePass payment service allows U.S. retailers to reach Chinese online shoppers. Valuation/Risks Our PT of USD118 is derived from 10-year DCF based on a long-term EBIT margin of 43%, terminal growth rate of 5.5% and WACC of 10.2%, implying a CY16 P/E of 32.5x, 1.4% premium to global e-Commerce peer average of 32x, 20.4% premium to China e-Commerce peer group. Risks: limited ability to influence corporate matters by individual shareholders and potential conflict of interest arising from the company’s corporate structure. Jefferies does and seeks to do business with companies covered in its research reports. As a result, investors should be aware that Jefferies may have a conflict of interest that could affect the objectivity of this report. Investors should consider this report as only a single factor in making their investment decision. Please see analyst certifications, important disclosure information, and information regarding the status of non-US analysts on pages 126 to 130 of this report.
-
Upload
cartigayan -
Category
Documents
-
view
75 -
download
27
description
Inititating
Transcript of Alibaba Jeffrries

RMB Prev. 2014A Prev. 2015E Prev. 2016E Prev. 2017E
Rev. (MM) -- 52,504.0 -- 76,812.0 -- 105,040.0 -- 132,115.0
Chg (% YoY) -- 52.1% -- 46.3% -- 36.7% -- 25.8%
Operating Profit -- 29,392.0 -- 34,486.0 -- 46,382.0 -- 58,467.0
EBITDA (MM) -- 30,731.0 -- 36,242.0 -- 48,850.0 -- 61,855.0
Net Profit Non-GAAP
-- 27,610.0 -- 31,489.0 -- 45,060.0 -- 58,541.0
BV/Share -- 17.50 -- 53.00 -- 70.25 -- 93.20
EPS Growth -- 103.9% -- 7.9% -- 41.6% -- 29.9%
EPS
FY Dec -- $1.90 -- $2.06 -- $2.92 -- $3.79
FY P/E 50.4x 46.5x 32.8x 25.3x
Price Performance
SEP-14 OCT-14
100
95
90
85
80
COMPANY NOTE
Initiating Coverage
CHN | Technology | Internet 27 October 2014
Alibaba (BABA)The Powerful E-Commerce EcosystemConnecting Half of China; Initiate at Buy
EQU
ITY R
ESEARC
H C
HIN
A
BUYPrice target $118.00
Price $95.76
Financial SummaryBook Value (MM): Rmb40,818.0Book Value/Share: Rmb17.50Net Debt (MM): (Rmb2,557)Return on Avg. Equity: 106.5%Long-Term Debt (MM): Rmb30,711.0Cash & ST Invest. (MM): Rmb43,632.0
Market Data52 Week Range: $99.70 - $82.81Total Entprs. Value (MM): $238,140.2Market Cap. (MM): $238,557.3Insider Ownership: 12.8%Institutional Ownership: 54.6%Shares Out. (MM): 2,491.2Float (MM): NAAvg. Daily Vol.: NA
Cynthia Meng *Equity Analyst
+852 3743 8033 [email protected] Pitz §
Equity Analyst(212) 336-7413 [email protected]
Brian Fitzgerald §Equity Analyst
(212) 284-2491 [email protected] Chan *
Equity Associate+852 3743 8017 [email protected]
Nick Wang *Equity Associate
+852 3743 8059 [email protected] Wang *
Equity Associate+852 3743 8016 [email protected]
* Jefferies Hong Kong Limited § Jefferies LLC
Key Takeaway
China's changing Internet user demographics and mobile developmentsupport our favorable view on e-Commerce for the next decade. Alibaba is thelargest Chinese ecommerce player, with 80%+ GMV market share, but is onlyselling to less than 25% of the population now. We estimate well over half ofChinese population will be shopping on Alibaba’s platforms in 10 years. Initiatewith Buy; PT USD118.
Changing demographics & mobile support ecommerce in the next decade. Asdiscussed in our sector note, "A Taste of Domestic Consumption: The Unleashing of China'sE-Commerce Power" published on Sept 19, 2014, China’s e-Commerce growth for thenext decade benefit from: 1) changing Internet user demographics towards 30+ year oldage groups; 2) accelerating structural shift to online from traditional retail; 3) Chinesegovernment’s massive support for urbanization and domestic consumption; 4) proliferationof affordable smart devices; 5) improving wireless and transport infrastructures in lowertier and rural markets, and 6) rising consumer demand for better quality, design & fashion,authenticity and timely delivery.
Growth driven by mix shift towards Tmall, and improving mobile monetization.We expect Alibaba, as the largest e-Commerce player, to sell to well over half of theChinese population in 10 years, up from less than 25% now. We estimate FY14-17E revenueCAGR of 36%, driven by continued commission revenues from Tmall. Alibaba’s mobileGMV accounted for 32.8% of total GMV in FY1Q15, +21pcpt YoY. We expect the mobilemonetization rate to narrow the gap with that of PC.
Cross-border e-Commerce provides upside for long-term growth. Addressing thegrowing appetite for foreign brands among Chinese consumers, Tmall Global lowers thecost, delivery time and language barriers in cross-border online shopping, which is expectedto reach an RMB1trn market size by 2018. Our scenario analysis shows a 5-12% upside toour CY16 revenue estimate. Its recently launched ePass payment service allows U.S. retailersto reach Chinese online shoppers.
Valuation/RisksOur PT of USD118 is derived from 10-year DCF based on a long-term EBIT margin of 43%,terminal growth rate of 5.5% and WACC of 10.2%, implying a CY16 P/E of 32.5x, 1.4%premium to global e-Commerce peer average of 32x, 20.4% premium to China e-Commercepeer group. Risks: limited ability to influence corporate matters by individual shareholdersand potential conflict of interest arising from the company’s corporate structure.
Jefferies does and seeks to do business with companies covered in its research reports. As a result, investors should be aware that Jefferies may have aconflict of interest that could affect the objectivity of this report. Investors should consider this report as only a single factor in making their investmentdecision. Please see analyst certifications, important disclosure information, and information regarding the status of non-US analysts on pages 126 to130 of this report.
Long Term Financial Model Drivers
LT Earnings CAGR 28%
Organic Revenue Growth 36%
Acquisition Contribution 0%
Operating Margin Expansion -12%
Note: our LT earnings CAGR & organic revenue
growth is annualised growth from FY14-17E.
Operating margin expansion calculated from
FY14-17E.
Other Considerations
China’s online retail sales market is
expected to reach RMB2.8trn in 2014,
+45.8% YoY, according to iResearch. We
estimate the market size to further grow to
RMB6.5trn in 2018, with a 2013-2018
CAGR of 28%, based on which, e-
Commerce sales is expected to account
for 10.4% of total retail sales in 2014 and
16.6% in 2018.
1 Year Forward P/E
Source: Bloomberg, Jefferies
70
75
80
85
90
95
100
Share price
38x
36x
34x
32x
30x
Founded in 1999, Alibaba is the largest online and mobile commerce company in the
world in terms of GMV in 2013, according to IDC. The company operates its marketplaces
as a platform for third parties, and does not engage in direct sales, compete with its
merchants or hold inventory. Alibaba operates Taobao Marketplace and Tmall, the no.1
C2C and B2C platform in China by GMV respectively, according to iResearch.
Stronger-than-expected mobile
monetization
Successful execution of cross-border e-
Commerce business
Deepening lower-tier city/rural
penetration
Economic benefits from growing
Internet finance business of Small and
Micro Financial Services Company
Catalysts
Target Investment Thesis
GMV continues to grow strongly,
particularly on Tmall, driven by
continued active customer acquisition
Mobile growth continues to outpace
that of PC
Maintain leadership in China’s e-
Commerce market
PT of USD118 derived from DCF based
on WACC of 10.2%, terminal growth
rate of 5.5% and long-term EBIT margin
of 43%
Upside Scenario
Stronger-than-expected GMV growth
driven by successful execution of
lower-tier city penetration and cross-
border business
M-Commerce shows stronger-than-
expected growth.
PT of USD143 derived from DCF based
on WACC of 10%, terminal growth rate
of 6% and long-term EBIT margin of
47.3%
Downside Scenario
GMV growth slows down as a result of
market share loss to competitors
Execution of cross-border business and
mobile e-Commerce growth are below
expectation.
PT of USD75 derived from DCF based
on WACC of 11.5%, terminal growth
rate of 4% and long-term EBIT margin
of 37.8%
Long Term Analysis
Scenarios
Group CY15 P/E
Source: Bloomberg, Jefferies.
35.3x40.1x
82.1x
16.0x
0x
10x
20x
30x
40x
50x
60x
70x
80x
90x
Alibaba Vipshop Amazon eBay
Earnings Growth vs P/E
Source: Bloomberg, Jefferies.
Alibaba
Vipshop
eBay
Amazon
0%
50%
100%
150%
0.0x 20.0x 40.0x 60.0x 80.0x 100.0x
Recommendation / Price Target
Ticker Rec. PT
BABA US Buy USD118
VIPS US Buy USD280
JD US Buy USD38
AMZN US Buy USD380
EBAY US Hold USD55 N.A. N.A.
Company Description
THE LO
NG
VIE
W
Peer Group
Alibaba Group
BUY: USD118 Price Target
BABA
Initiating Coverage
27 October 2014
page 2 of 130 , Equity Analyst, +852 3743 8033, [email protected] Meng
Please see important disclosure information on pages 126 - 130 of this report.
Table of Contents
Investment Summary p.5
Valuation and Risks p.6
Changing Demographics and Mobile Support E-Commerce in the Next Decade p.11
Alibaba - The Powerful E-Commerce Ecosystem Connecting Half of China p.25
Business Model and Segment Revenue p.27
A Strong Self-reinforcing Network Effect p.33
Extending Mobile Leadership p.53
Building the Largest Ecosystem p.63
Expanding Cross-Border E-Commerce p.83
Company Background p.91
Corporate & Shareholding Structure p.92
Partnership System p.94
Small and Micro Financial Services Company p.98
Management Team p.100
Financial Statements p.102
Appendix p.116
FY2Q15 Results Preview p.117
M&A Investment Summary p.120
BABA
Initiating Coverage
27 October 2014
page 3 of 130 , Equity Analyst, +852 3743 8033, [email protected] Meng
Please see important disclosure information on pages 126 - 130 of this report.

This page is intentionally kept blank
BABA
Initiating Coverage
27 October 2014
page 4 of 130 , Equity Analyst, +852 3743 8033, [email protected] Meng
Please see important disclosure information on pages 126 - 130 of this report.
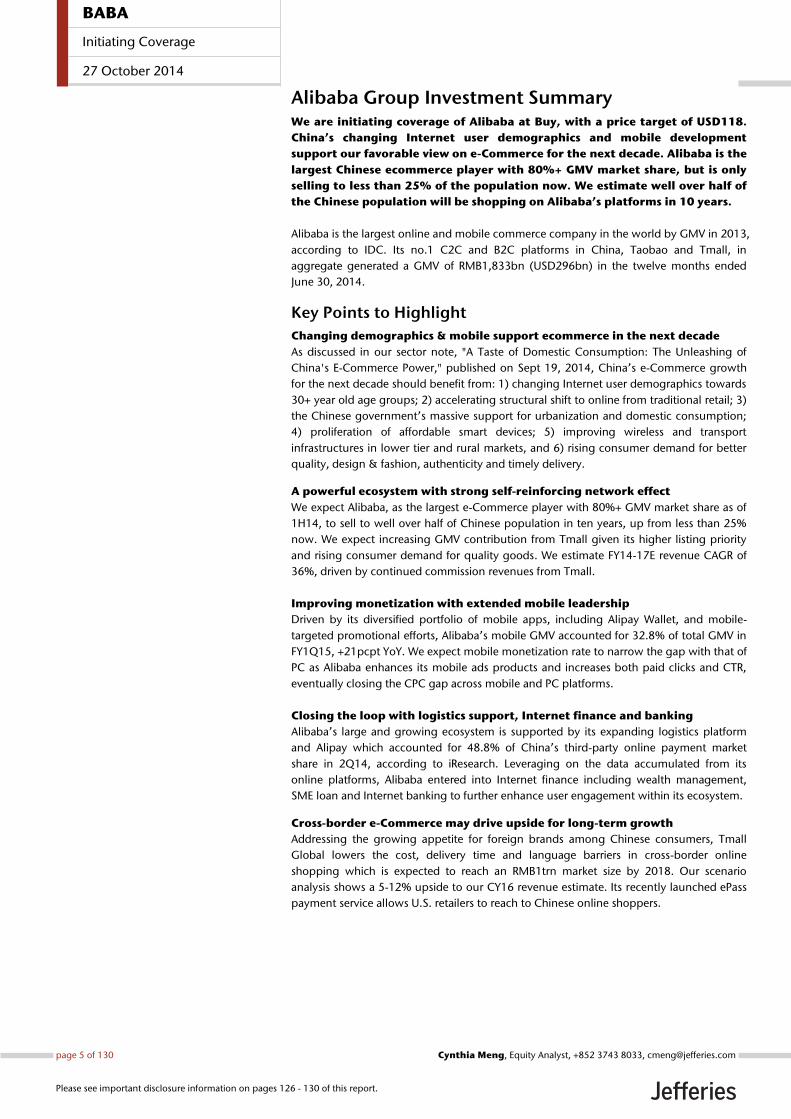
Alibaba Group Investment Summary We are initiating coverage of Alibaba at Buy, with a price target of USD118.
China’s changing Internet user demographics and mobile development
support our favorable view on e-Commerce for the next decade. Alibaba is the
largest Chinese ecommerce player with 80%+ GMV market share, but is only
selling to less than 25% of the population now. We estimate well over half of
the Chinese population will be shopping on Alibaba’s platforms in 10 years.
Alibaba is the largest online and mobile commerce company in the world by GMV in 2013,
according to IDC. Its no.1 C2C and B2C platforms in China, Taobao and Tmall, in
aggregate generated a GMV of RMB1,833bn (USD296bn) in the twelve months ended
June 30, 2014.
Key Points to Highlight
Changing demographics & mobile support ecommerce in the next decade
As discussed in our sector note, "A Taste of Domestic Consumption: The Unleashing of
China's E-Commerce Power," published on Sept 19, 2014, China’s e-Commerce growth
for the next decade should benefit from: 1) changing Internet user demographics towards
30+ year old age groups; 2) accelerating structural shift to online from traditional retail; 3)
the Chinese government’s massive support for urbanization and domestic consumption;
4) proliferation of affordable smart devices; 5) improving wireless and transport
infrastructures in lower tier and rural markets, and 6) rising consumer demand for better
quality, design & fashion, authenticity and timely delivery.
A powerful ecosystem with strong self-reinforcing network effect
We expect Alibaba, as the largest e-Commerce player with 80%+ GMV market share as of
1H14, to sell to well over half of Chinese population in ten years, up from less than 25%
now. We expect increasing GMV contribution from Tmall given its higher listing priority
and rising consumer demand for quality goods. We estimate FY14-17E revenue CAGR of
36%, driven by continued commission revenues from Tmall.
Improving monetization with extended mobile leadership
Driven by its diversified portfolio of mobile apps, including Alipay Wallet, and mobile-
targeted promotional efforts, Alibaba’s mobile GMV accounted for 32.8% of total GMV in
FY1Q15, +21pcpt YoY. We expect mobile monetization rate to narrow the gap with that of
PC as Alibaba enhances its mobile ads products and increases both paid clicks and CTR,
eventually closing the CPC gap across mobile and PC platforms.
Closing the loop with logistics support, Internet finance and banking
Alibaba’s large and growing ecosystem is supported by its expanding logistics platform
and Alipay which accounted for 48.8% of China’s third-party online payment market
share in 2Q14, according to iResearch. Leveraging on the data accumulated from its
online platforms, Alibaba entered into Internet finance including wealth management,
SME loan and Internet banking to further enhance user engagement within its ecosystem.
Cross-border e-Commerce may drive upside for long-term growth
Addressing the growing appetite for foreign brands among Chinese consumers, Tmall
Global lowers the cost, delivery time and language barriers in cross-border online
shopping which is expected to reach an RMB1trn market size by 2018. Our scenario
analysis shows a 5-12% upside to our CY16 revenue estimate. Its recently launched ePass
payment service allows U.S. retailers to reach to Chinese online shoppers.
BABA
Initiating Coverage
27 October 2014
page 5 of 130 , Equity Analyst, +852 3743 8033, [email protected] Meng
Please see important disclosure information on pages 126 - 130 of this report.
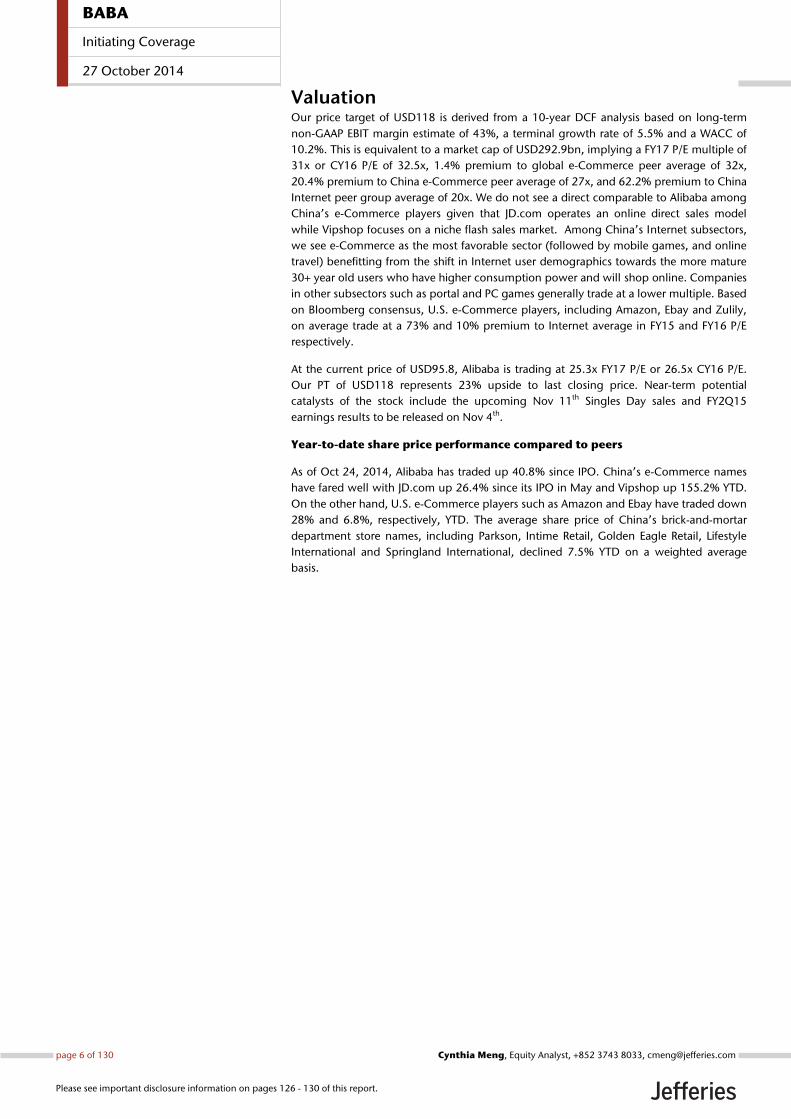
Valuation Our price target of USD118 is derived from a 10-year DCF analysis based on long-term
non-GAAP EBIT margin estimate of 43%, a terminal growth rate of 5.5% and a WACC of
10.2%. This is equivalent to a market cap of USD292.9bn, implying a FY17 P/E multiple of
31x or CY16 P/E of 32.5x, 1.4% premium to global e-Commerce peer average of 32x,
20.4% premium to China e-Commerce peer average of 27x, and 62.2% premium to China
Internet peer group average of 20x. We do not see a direct comparable to Alibaba among
China’s e-Commerce players given that JD.com operates an online direct sales model
while Vipshop focuses on a niche flash sales market. Among China’s Internet subsectors,
we see e-Commerce as the most favorable sector (followed by mobile games, and online
travel) benefitting from the shift in Internet user demographics towards the more mature
30+ year old users who have higher consumption power and will shop online. Companies
in other subsectors such as portal and PC games generally trade at a lower multiple. Based
on Bloomberg consensus, U.S. e-Commerce players, including Amazon, Ebay and Zulily,
on average trade at a 73% and 10% premium to Internet average in FY15 and FY16 P/E
respectively.
At the current price of USD95.8, Alibaba is trading at 25.3x FY17 P/E or 26.5x CY16 P/E.
Our PT of USD118 represents 23% upside to last closing price. Near-term potential
catalysts of the stock include the upcoming Nov 11th Singles Day sales and FY2Q15
earnings results to be released on Nov 4th.
Year-to-date share price performance compared to peers
As of Oct 24, 2014, Alibaba has traded up 40.8% since IPO. China’s e-Commerce names
have fared well with JD.com up 26.4% since its IPO in May and Vipshop up 155.2% YTD.
On the other hand, U.S. e-Commerce players such as Amazon and Ebay have traded down
28% and 6.8%, respectively, YTD. The average share price of China’s brick-and-mortar
department store names, including Parkson, Intime Retail, Golden Eagle Retail, Lifestyle
International and Springland International, declined 7.5% YTD on a weighted average
basis.
BABA
Initiating Coverage
27 October 2014
page 6 of 130 , Equity Analyst, +852 3743 8033, [email protected] Meng
Please see important disclosure information on pages 126 - 130 of this report.
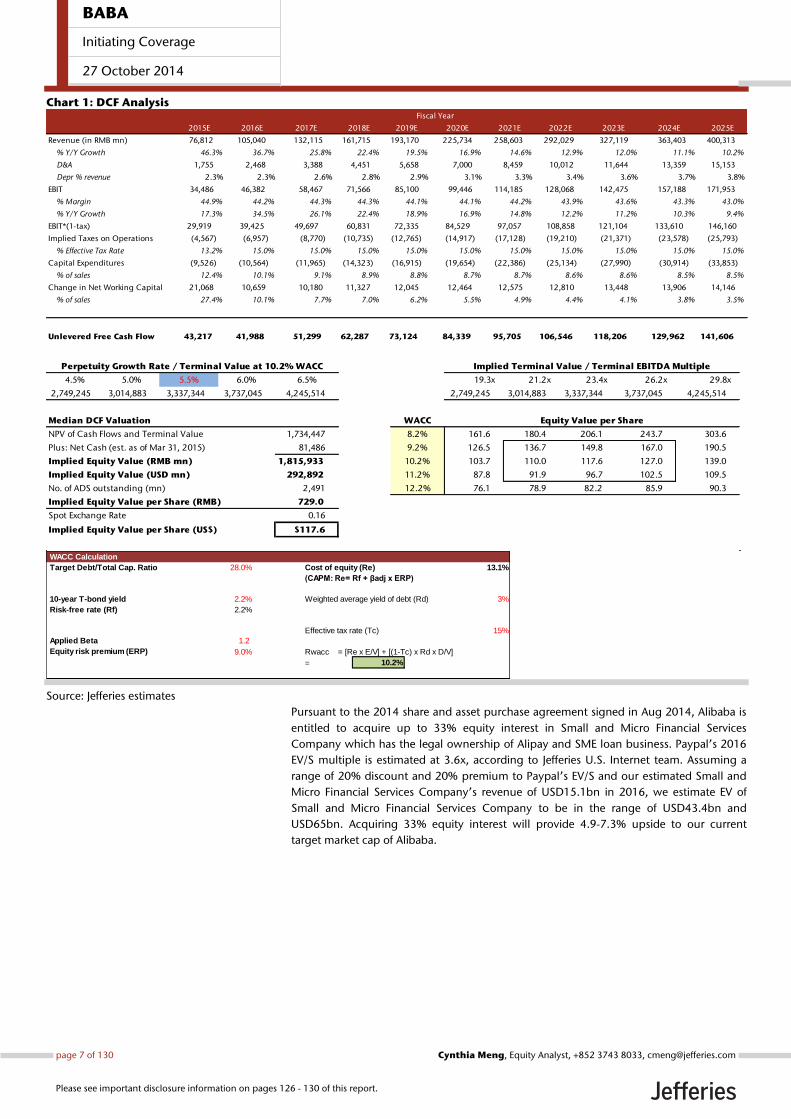
Chart 1: DCF Analysis
Source: Jefferies estimates
Pursuant to the 2014 share and asset purchase agreement signed in Aug 2014, Alibaba is
entitled to acquire up to 33% equity interest in Small and Micro Financial Services
Company which has the legal ownership of Alipay and SME loan business. Paypal’s 2016
EV/S multiple is estimated at 3.6x, according to Jefferies U.S. Internet team. Assuming a
range of 20% discount and 20% premium to Paypal’s EV/S and our estimated Small and
Micro Financial Services Company’s revenue of USD15.1bn in 2016, we estimate EV of
Small and Micro Financial Services Company to be in the range of USD43.4bn and
USD65bn. Acquiring 33% equity interest will provide 4.9-7.3% upside to our current
target market cap of Alibaba.
2015E 2016E 2017E 2018E 2019E 2020E 2021E 2022E 2023E 2024E 2025E
Revenue (in RMB mn) 76,812 105,040 132,115 161,715 193,170 225,734 258,603 292,029 327,119 363,403 400,313
% Y/Y Growth 46.3% 36.7% 25.8% 22.4% 19.5% 16.9% 14.6% 12.9% 12.0% 11.1% 10.2%
D&A 1,755 2,468 3,388 4,451 5,658 7,000 8,459 10,012 11,644 13,359 15,153
Depr % revenue 2.3% 2.3% 2.6% 2.8% 2.9% 3.1% 3.3% 3.4% 3.6% 3.7% 3.8%
EBIT 34,486 46,382 58,467 71,566 85,100 99,446 114,185 128,068 142,475 157,188 171,953
% Margin 44.9% 44.2% 44.3% 44.3% 44.1% 44.1% 44.2% 43.9% 43.6% 43.3% 43.0%
% Y/Y Growth 17.3% 34.5% 26.1% 22.4% 18.9% 16.9% 14.8% 12.2% 11.2% 10.3% 9.4%
EBIT*(1-tax) 29,919 39,425 49,697 60,831 72,335 84,529 97,057 108,858 121,104 133,610 146,160
Implied Taxes on Operations (4,567) (6,957) (8,770) (10,735) (12,765) (14,917) (17,128) (19,210) (21,371) (23,578) (25,793)
% Effective Tax Rate 13.2% 15.0% 15.0% 15.0% 15.0% 15.0% 15.0% 15.0% 15.0% 15.0% 15.0%
Capital Expenditures (9,526) (10,564) (11,965) (14,323) (16,915) (19,654) (22,386) (25,134) (27,990) (30,914) (33,853)
% of sales 12.4% 10.1% 9.1% 8.9% 8.8% 8.7% 8.7% 8.6% 8.6% 8.5% 8.5%
Change in Net Working Capital 21,068 10,659 10,180 11,327 12,045 12,464 12,575 12,810 13,448 13,906 14,146
% of sales 27.4% 10.1% 7.7% 7.0% 6.2% 5.5% 4.9% 4.4% 4.1% 3.8% 3.5%
Unlevered Free Cash Flow 43,217 41,988 51,299 62,287 73,124 84,339 95,705 106,546 118,206 129,962 141,606
Fiscal Year
Perpetuity Growth Rate / Terminal Value at 10.2% WACC Implied Terminal Value / Terminal EBITDA Multiple
4.5% 5.0% 5.5% 6.0% 6.5% 19.3x 21.2x 23.4x 26.2x 29.8x
2,749,245 3,014,883 3,337,344 3,737,045 4,245,514 2,749,245 3,014,883 3,337,344 3,737,045 4,245,514
Median DCF Valuation WACC Equity Value per Share
NPV of Cash Flows and Terminal Value 1,734,447 8.2% 161.6 180.4 206.1 243.7 303.6
Plus: Net Cash (est. as of Mar 31, 2015) 81,486 9.2% 126.5 136.7 149.8 167.0 190.5
Implied Equity Value (RMB mn) 1,815,933 10.2% 103.7 110.0 117.6 127.0 139.0
Implied Equity Value (USD mn) 292,892 11.2% 87.8 91.9 96.7 102.5 109.5
No. of ADS outstanding (mn) 2,491 12.2% 76.1 78.9 82.2 85.9 90.3
Implied Equity Value per Share (RMB) 729.0
Spot Exchange Rate 0.16
Implied Equity Value per Share (US$) $117.6
WACC Calculation
Target Debt/Total Cap. Ratio 28.0% Cost of equity (Re) 13.1%
(CAPM: Re= Rf + βadj x ERP)
10-year T-bond yield 2.2% Weighted average yield of debt (Rd) 3%
Risk-free rate (Rf) 2.2%
Effective tax rate (Tc) 15%
Applied Beta 1.2
Equity risk premium (ERP) 9.0% Rwacc = [Re x E/V] + [(1-Tc) x Rd x D/V]
= 10.2%
BABA
Initiating Coverage
27 October 2014
page 7 of 130 , Equity Analyst, +852 3743 8033, [email protected] Meng
Please see important disclosure information on pages 126 - 130 of this report.
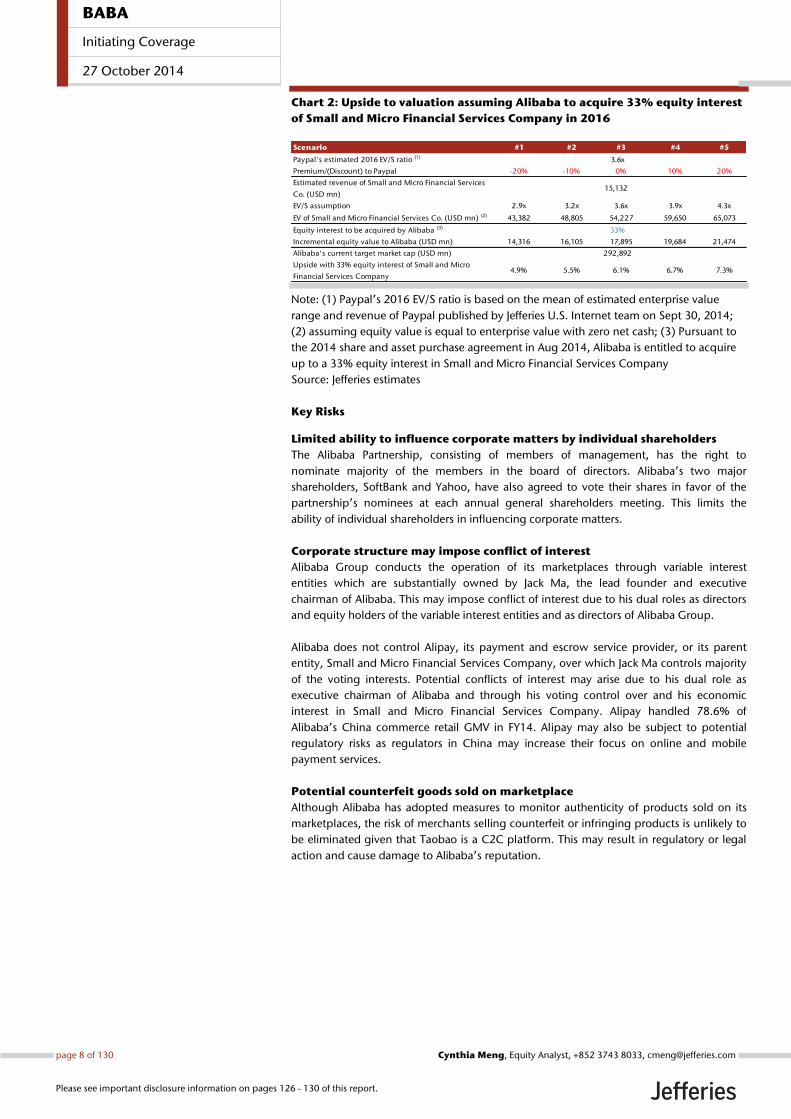
Chart 2: Upside to valuation assuming Alibaba to acquire 33% equity interest
of Small and Micro Financial Services Company in 2016
Note: (1) Paypal’s 2016 EV/S ratio is based on the mean of estimated enterprise value
range and revenue of Paypal published by Jefferies U.S. Internet team on Sept 30, 2014;
(2) assuming equity value is equal to enterprise value with zero net cash; (3) Pursuant to
the 2014 share and asset purchase agreement in Aug 2014, Alibaba is entitled to acquire
up to a 33% equity interest in Small and Micro Financial Services Company
Source: Jefferies estimates
Key Risks
Limited ability to influence corporate matters by individual shareholders
The Alibaba Partnership, consisting of members of management, has the right to
nominate majority of the members in the board of directors. Alibaba’s two major
shareholders, SoftBank and Yahoo, have also agreed to vote their shares in favor of the
partnership’s nominees at each annual general shareholders meeting. This limits the
ability of individual shareholders in influencing corporate matters.
Corporate structure may impose conflict of interest
Alibaba Group conducts the operation of its marketplaces through variable interest
entities which are substantially owned by Jack Ma, the lead founder and executive
chairman of Alibaba. This may impose conflict of interest due to his dual roles as directors
and equity holders of the variable interest entities and as directors of Alibaba Group.
Alibaba does not control Alipay, its payment and escrow service provider, or its parent
entity, Small and Micro Financial Services Company, over which Jack Ma controls majority
of the voting interests. Potential conflicts of interest may arise due to his dual role as
executive chairman of Alibaba and through his voting control over and his economic
interest in Small and Micro Financial Services Company. Alipay handled 78.6% of
Alibaba’s China commerce retail GMV in FY14. Alipay may also be subject to potential
regulatory risks as regulators in China may increase their focus on online and mobile
payment services.
Potential counterfeit goods sold on marketplace
Although Alibaba has adopted measures to monitor authenticity of products sold on its
marketplaces, the risk of merchants selling counterfeit or infringing products is unlikely to
be eliminated given that Taobao is a C2C platform. This may result in regulatory or legal
action and cause damage to Alibaba’s reputation.
Scenario #1 #2 #3 #4 #5
Paypal's estimated 2016 EV/S ratio (1)
Premium/(Discount) to Paypal -20% -10% 0% 10% 20%
Estimated revenue of Small and Micro Financial Services
Co. (USD mn)
EV/S assumption 2.9x 3.2x 3.6x 3.9x 4.3x
EV of Small and Micro Financial Services Co. (USD mn) (2) 43,382 48,805 54,227 59,650 65,073
Equity interest to be acquired by Alibaba (3)
Incremental equity value to Alibaba (USD mn) 14,316 16,105 17,895 19,684 21,474
Alibaba's current target market cap (USD mn)
Upside with 33% equity interest of Small and Micro
Financial Services Company4.9% 5.5% 6.1% 6.7% 7.3%
3.6x
33%
292,892
15,132
BABA
Initiating Coverage
27 October 2014
page 8 of 130 , Equity Analyst, +852 3743 8033, [email protected] Meng
Please see important disclosure information on pages 126 - 130 of this report.
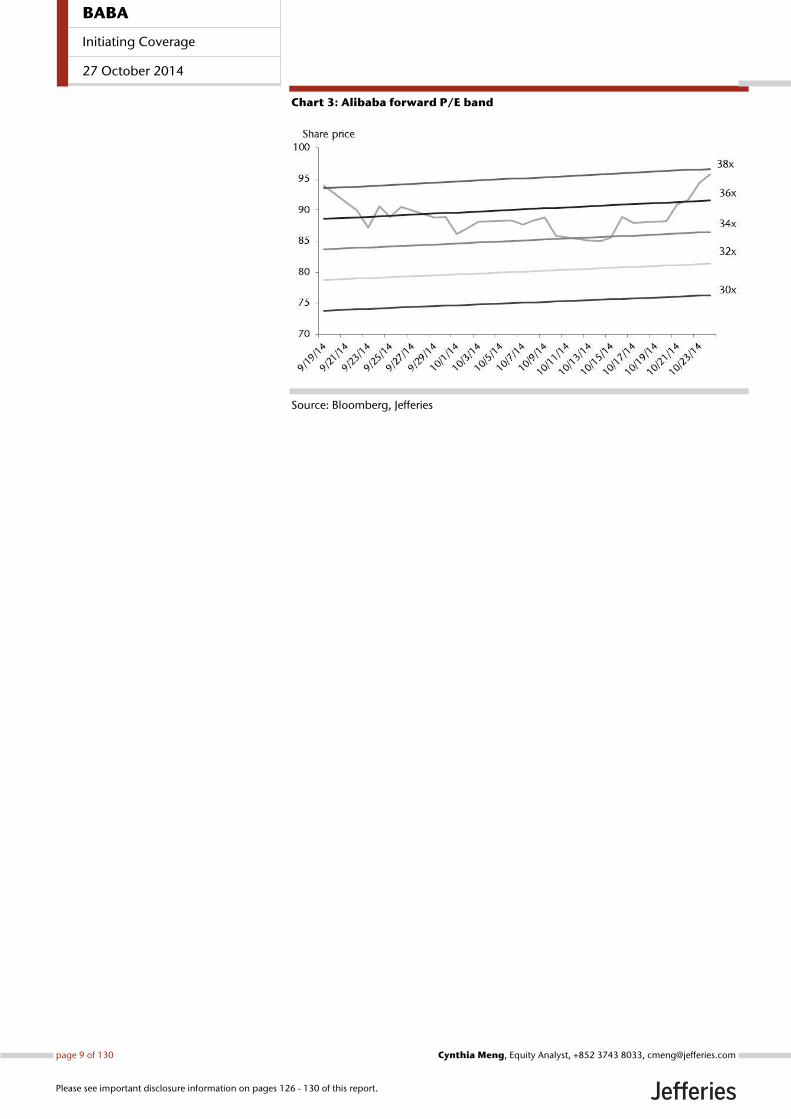
Chart 3: Alibaba forward P/E band
Source: Bloomberg, Jefferies
BABA
Initiating Coverage
27 October 2014
page 9 of 130 , Equity Analyst, +852 3743 8033, [email protected] Meng
Please see important disclosure information on pages 126 - 130 of this report.
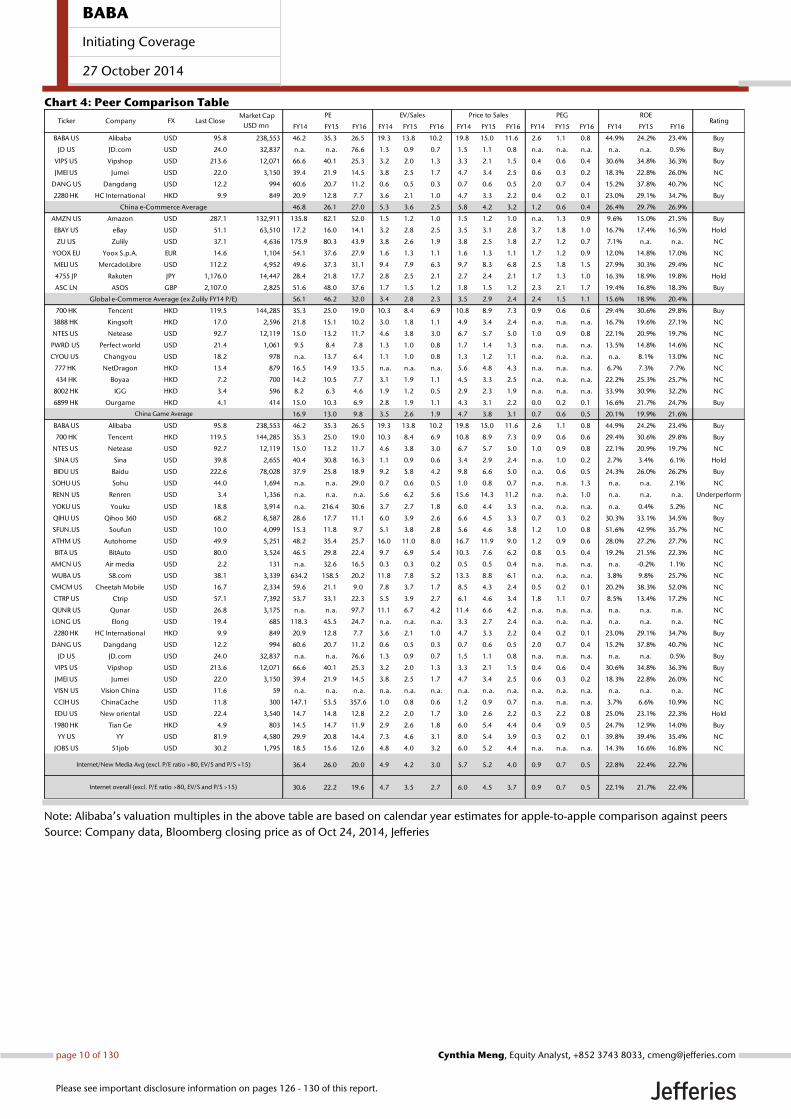
Chart 4: Peer Comparison Table
Note: Alibaba’s valuation multiples in the above table are based on calendar year estimates for apple-to-apple comparison against peers
Source: Company data, Bloomberg closing price as of Oct 24, 2014, Jefferies
FY14 FY15 FY16 FY14 FY15 FY16 FY14 FY15 FY16 FY14 FY15 FY16 FY14 FY15 FY16
BABA US Alibaba USD 95.8 238,553 46.2 35.3 26.5 19.3 13.8 10.2 19.8 15.0 11.6 2.6 1.1 0.8 44.9% 24.2% 23.4% Buy
JD US JD.com USD 24.0 32,837 n.a. n.a. 76.6 1.3 0.9 0.7 1.5 1.1 0.8 n.a. n.a. n.a. n.a. n.a. 0.5% Buy
VIPS US Vipshop USD 213.6 12,071 66.6 40.1 25.3 3.2 2.0 1.3 3.3 2.1 1.5 0.4 0.6 0.4 30.6% 34.8% 36.3% Buy
JMEI US Jumei USD 22.0 3,150 39.4 21.9 14.5 3.8 2.5 1.7 4.7 3.4 2.5 0.6 0.3 0.2 18.3% 22.8% 26.0% NC
DANG US Dangdang USD 12.2 994 60.6 20.7 11.2 0.6 0.5 0.3 0.7 0.6 0.5 2.0 0.7 0.4 15.2% 37.8% 40.7% NC
2280 HK HC International HKD 9.9 849 20.9 12.8 7.7 3.6 2.1 1.0 4.7 3.3 2.2 0.4 0.2 0.1 23.0% 29.1% 34.7% Buy
46.8 26.1 27.0 5.3 3.6 2.5 5.8 4.2 3.2 1.2 0.6 0.4 26.4% 29.7% 26.9%
AMZN US Amazon USD 287.1 132,911 135.8 82.1 52.0 1.5 1.2 1.0 1.5 1.2 1.0 n.a. 1.3 0.9 9.6% 15.0% 21.5% Buy
EBAY US eBay USD 51.1 63,510 17.2 16.0 14.1 3.2 2.8 2.5 3.5 3.1 2.8 3.7 1.8 1.0 16.7% 17.4% 16.5% Hold
ZU US Zulily USD 37.1 4,636 175.9 80.3 43.9 3.8 2.6 1.9 3.8 2.5 1.8 2.7 1.2 0.7 7.1% n.a. n.a. NC
YOOX EU Yoox S.p.A. EUR 14.6 1,104 54.1 37.6 27.9 1.6 1.3 1.1 1.6 1.3 1.1 1.7 1.2 0.9 12.0% 14.8% 17.0% NC
MELI US MercadoLibre USD 112.2 4,952 49.6 37.3 31.1 9.4 7.9 6.3 9.7 8.3 6.8 2.5 1.8 1.5 27.9% 30.3% 29.4% NC
4755 JP Rakuten JPY 1,176.0 14,447 28.4 21.8 17.7 2.8 2.5 2.1 2.7 2.4 2.1 1.7 1.3 1.0 16.3% 18.9% 19.8% Hold
ASC LN ASOS GBP 2,107.0 2,825 51.6 48.0 37.6 1.7 1.5 1.2 1.8 1.5 1.2 2.3 2.1 1.7 19.4% 16.8% 18.3% Buy
56.1 46.2 32.0 3.4 2.8 2.3 3.5 2.9 2.4 2.4 1.5 1.1 15.6% 18.9% 20.4%
700 HK Tencent HKD 119.5 144,285 35.3 25.0 19.0 10.3 8.4 6.9 10.8 8.9 7.3 0.9 0.6 0.6 29.4% 30.6% 29.8% Buy
3888 HK Kingsoft HKD 17.0 2,596 21.8 15.1 10.2 3.0 1.8 1.1 4.9 3.4 2.4 n.a. n.a. n.a. 16.7% 19.6% 27.1% NC
NTES US Netease USD 92.7 12,119 15.0 13.2 11.7 4.6 3.8 3.0 6.7 5.7 5.0 1.0 0.9 0.8 22.1% 20.9% 19.7% NC
PWRD US Perfect world USD 21.4 1,061 9.5 8.4 7.8 1.3 1.0 0.8 1.7 1.4 1.3 n.a. n.a. n.a. 13.5% 14.8% 14.6% NC
CYOU US Changyou USD 18.2 978 n.a. 13.7 6.4 1.1 1.0 0.8 1.3 1.2 1.1 n.a. n.a. n.a. n.a. 8.1% 13.0% NC
777 HK NetDragon HKD 13.4 879 16.5 14.9 13.5 n.a. n.a. n.a. 5.6 4.8 4.3 n.a. n.a. n.a. 6.7% 7.3% 7.7% NC
434 HK Boyaa HKD 7.2 700 14.2 10.5 7.7 3.1 1.9 1.1 4.5 3.3 2.5 n.a. n.a. n.a. 22.2% 25.3% 25.7% NC
8002 HK IGG HKD 3.4 596 8.2 6.3 4.6 1.9 1.2 0.5 2.9 2.3 1.9 n.a. n.a. n.a. 33.9% 30.9% 32.2% NC
6899 HK Ourgame HKD 4.1 414 15.0 10.3 6.9 2.8 1.9 1.1 4.3 3.1 2.2 0.0 0.2 0.1 16.6% 21.7% 24.7% Buy
16.9 13.0 9.8 3.5 2.6 1.9 4.7 3.8 3.1 0.7 0.6 0.5 20.1% 19.9% 21.6%
BABA US Alibaba USD 95.8 238,553 46.2 35.3 26.5 19.3 13.8 10.2 19.8 15.0 11.6 2.6 1.1 0.8 44.9% 24.2% 23.4% Buy
700 HK Tencent HKD 119.5 144,285 35.3 25.0 19.0 10.3 8.4 6.9 10.8 8.9 7.3 0.9 0.6 0.6 29.4% 30.6% 29.8% Buy
NTES US Netease USD 92.7 12,119 15.0 13.2 11.7 4.6 3.8 3.0 6.7 5.7 5.0 1.0 0.9 0.8 22.1% 20.9% 19.7% NC
SINA US Sina USD 39.8 2,655 40.4 30.8 16.3 1.1 0.9 0.6 3.4 2.9 2.4 n.a. 1.0 0.2 2.7% 3.4% 6.1% Hold
BIDU US Baidu USD 222.6 78,028 37.9 25.8 18.9 9.2 5.8 4.2 9.8 6.6 5.0 n.a. 0.6 0.5 24.3% 26.0% 26.2% Buy
SOHU US Sohu USD 44.0 1,694 n.a. n.a. 29.0 0.7 0.6 0.5 1.0 0.8 0.7 n.a. n.a. 1.3 n.a. n.a. 2.1% NC
RENN US Renren USD 3.4 1,356 n.a. n.a. n.a. 5.6 6.2 5.6 15.6 14.3 11.2 n.a. n.a. 1.0 n.a. n.a. n.a. Underperform
YOKU US Youku USD 18.8 3,914 n.a. 216.4 30.6 3.7 2.7 1.8 6.0 4.4 3.3 n.a. n.a. n.a. n.a. 0.4% 5.2% NC
QIHU US Qihoo 360 USD 68.2 8,587 28.6 17.7 11.1 6.0 3.9 2.6 6.6 4.5 3.3 0.7 0.3 0.2 30.3% 33.1% 34.5% Buy
SFUN.US Soufun USD 10.0 4,099 15.3 11.8 9.7 5.1 3.8 2.8 5.6 4.6 3.8 1.2 1.0 0.8 51.6% 42.9% 35.7% NC
ATHM US Autohome USD 49.9 5,251 48.2 35.4 25.7 16.0 11.0 8.0 16.7 11.9 9.0 1.2 0.9 0.6 28.0% 27.2% 27.7% NC
BITA US BitAuto USD 80.0 3,524 46.5 29.8 22.4 9.7 6.9 5.4 10.3 7.6 6.2 0.8 0.5 0.4 19.2% 21.5% 22.3% NC
AMCN US Air media USD 2.2 131 n.a. 32.6 16.5 0.3 0.3 0.2 0.5 0.5 0.4 n.a. n.a. n.a. n.a. -0.2% 1.1% NC
WUBA US 58.com USD 38.1 3,339 634.2 158.5 20.2 11.8 7.8 5.2 13.3 8.8 6.1 n.a. n.a. n.a. 3.8% 9.8% 25.7% NC
CMCM US Cheetah Mobile USD 16.7 2,334 59.6 21.1 9.0 7.8 3.7 1.7 8.5 4.3 2.4 0.5 0.2 0.1 20.2% 38.3% 52.0% NC
CTRP US Ctrip USD 57.1 7,392 53.7 33.1 22.3 5.5 3.9 2.7 6.1 4.6 3.4 1.8 1.1 0.7 8.5% 13.4% 17.2% NC
QUNR US Qunar USD 26.8 3,175 n.a. n.a. 97.7 11.1 6.7 4.2 11.4 6.6 4.2 n.a. n.a. n.a. n.a. n.a. n.a. NC
LONG US Elong USD 19.4 685 118.3 45.5 24.7 n.a. n.a. n.a. 3.3 2.7 2.4 n.a. n.a. n.a. n.a. n.a. n.a. NC
2280 HK HC International HKD 9.9 849 20.9 12.8 7.7 3.6 2.1 1.0 4.7 3.3 2.2 0.4 0.2 0.1 23.0% 29.1% 34.7% Buy
DANG US Dangdang USD 12.2 994 60.6 20.7 11.2 0.6 0.5 0.3 0.7 0.6 0.5 2.0 0.7 0.4 15.2% 37.8% 40.7% NC
JD US JD.com USD 24.0 32,837 n.a. n.a. 76.6 1.3 0.9 0.7 1.5 1.1 0.8 n.a. n.a. n.a. n.a. n.a. 0.5% Buy
VIPS US Vipshop USD 213.6 12,071 66.6 40.1 25.3 3.2 2.0 1.3 3.3 2.1 1.5 0.4 0.6 0.4 30.6% 34.8% 36.3% Buy
JMEI US Jumei USD 22.0 3,150 39.4 21.9 14.5 3.8 2.5 1.7 4.7 3.4 2.5 0.6 0.3 0.2 18.3% 22.8% 26.0% NC
VISN US Vision China USD 11.6 59 n.a. n.a. n.a. n.a. n.a. n.a. n.a. n.a. n.a. n.a. n.a. n.a. n.a. n.a. n.a. NC
CCIH US ChinaCache USD 11.8 300 147.1 53.5 357.6 1.0 0.8 0.6 1.2 0.9 0.7 n.a. n.a. n.a. 3.7% 6.6% 10.9% NC
EDU US New oriental USD 22.4 3,540 14.7 14.8 12.8 2.2 2.0 1.7 3.0 2.6 2.2 0.3 2.2 0.8 25.0% 23.1% 22.3% Hold
1980 HK Tian Ge HKD 4.9 803 14.5 14.7 11.9 2.9 2.6 1.8 6.0 5.4 4.4 0.4 0.9 0.5 24.7% 12.9% 14.0% Buy
YY US YY USD 81.9 4,580 29.9 20.8 14.4 7.3 4.6 3.1 8.0 5.4 3.9 0.3 0.2 0.1 39.8% 39.4% 35.4% NC
JOBS US 51job USD 30.2 1,795 18.5 15.6 12.6 4.8 4.0 3.2 6.0 5.2 4.4 n.a. n.a. n.a. 14.3% 16.6% 16.8% NC
36.4 26.0 20.0 4.9 4.2 3.0 5.7 5.2 4.0 0.9 0.7 0.5 22.8% 22.4% 22.7%
30.6 22.2 19.6 4.7 3.5 2.7 6.0 4.5 3.7 0.9 0.7 0.5 22.1% 21.7% 22.4%
Rating PE EV/Sales Price to Sales PEG ROE
Ticker Company FX Last Close Market Cap
USD mn
China e-Commerce Average
Global e-Commerce Average (ex Zulily FY14 P/E)
China Game Average
Internet/New Media Avg (excl. P/E ratio >80, EV/S and P/S >15)
Internet overall (excl. P/E ratio >80, EV/S and P/S >15)
BABA
Initiating Coverage
27 October 2014
page 10 of 130 , Equity Analyst, +852 3743 8033, [email protected] Meng
Please see important disclosure information on pages 126 - 130 of this report.

Changing Demographics and Mobile Support E-Commerce in the Next Decade
China’s e-Commerce market is forecast to grow at a 2013-2018 CAGR of 28%, accounting
for 10.4% of total retail sales in 2014. As discussed in our sector note, “A Taste of
Domestic Consumption: The Unleashing of China’s E-Commerce Power” published on
Sept 19, 2014, China’s e-Commerce growth is driven by secular trends including
urbanization and increasing household income, rising smartphone and Internet
penetration, the mix shift towards more mature Internet user demographics, as well as
improving communications and transportation infrastructure.
In this section, we discuss the following:
1. Favorable government policy and increasing urbanization drives domestic
consumption as household income rises.
2. Our analysis shows that China's Internet users aged 30+ years will account for
54% of total Internet users by 2018, up from 33% in 2008, and 81% of the
240mn new incremental Internet users will be 30+ years old. Internet
demographics mix shift to more 30+ year old age groups indicates huge
opportunities in e-Commerce as these users adopt online shopping.
3. China’s relatively low penetration of consumption, Internet, e-Commerce and
online shoppers compared to developed countries suggests ample room for
growth.
4. Given the proliferation of affordable smart devices, improving wireless 3G and
4G coverage and user experience, expected further data pricing declines due to
LTE promotions by the telcos, we believe that m-Commerce is still at very early
stage of monetization.
5. Accelerating structural shift to online from traditional retail. According to
linkshop.cn’s 1H14 survey, the revenues of 73 surveyed offline retailers showed
only moderate YoY growth. In the department store category, 34 out of the 54
surveyed stores posted revenue decline with average sales down by 2% YoY in
1H14.
BABA
Initiating Coverage
27 October 2014
page 11 of 130 , Equity Analyst, +852 3743 8033, [email protected] Meng
Please see important disclosure information on pages 126 - 130 of this report.

Changing Demographics and Mobile Support E-Commerce in the Next Decade
China’s online retail sales market is expected to reach RMB2.8trn in 2014, +45.8% YoY,
accounting for 10.4% of total retail sales. We estimate the market size to further grow to
RMB6.5trn in 2018, with a 2013-2018 CAGR of 28%. In our view, China’s e-Commerce
growth is driven by secular trends including urbanization and increasing household
income, the mix shift towards more mature Internet user demographics, rising
smartphone and Internet penetration as well as improving communications and
transportation infrastructure. This leads to accelerating structural shift to online from
traditional retail.
Chart 5: China online retail sales (2007A-2018E)
Source: iResearch (2007A-2017E) as of Jul 2014, Jefferies estimates (2018E)
Chart 6: China online retail sales structure (2008A-2018E)
Source: iResearch (2008A-2017E) as of Jul 2014, Jefferies estimates (2018E)
China’s online retail sales market is
expected to reach RMB2.8trn in
2014, +45.8% YoY, accounting for
10.4% of total retail sales.
We estimate the market size to
further grow to RMB6.5trn in 2018,
with a 2013-2018 CAGR of 28%.
B2C market is estimated to account
for 48% of total online retail sales in
2014 and 62% in 2018.
BABA
Initiating Coverage
27 October 2014
page 12 of 130 , Equity Analyst, +852 3743 8033, [email protected] Meng
Please see important disclosure information on pages 126 - 130 of this report.
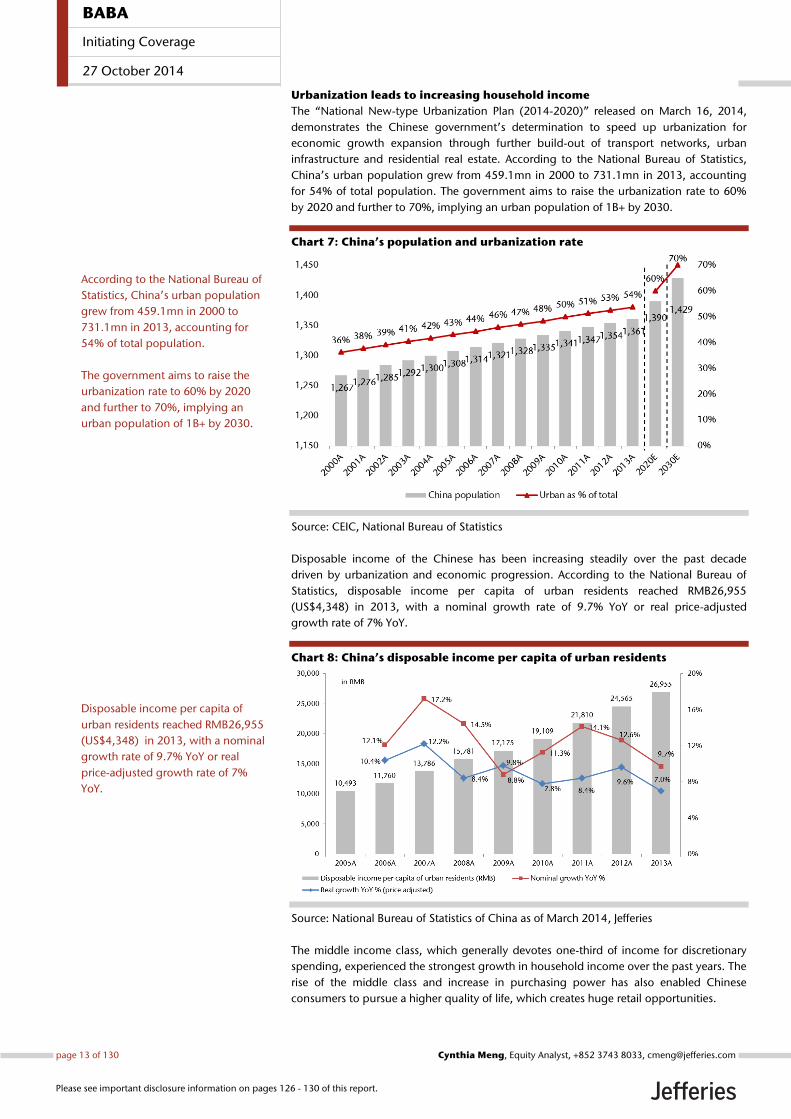
Urbanization leads to increasing household income
The “National New-type Urbanization Plan (2014-2020)” released on March 16, 2014,
demonstrates the Chinese government’s determination to speed up urbanization for
economic growth expansion through further build-out of transport networks, urban
infrastructure and residential real estate. According to the National Bureau of Statistics,
China’s urban population grew from 459.1mn in 2000 to 731.1mn in 2013, accounting
for 54% of total population. The government aims to raise the urbanization rate to 60%
by 2020 and further to 70%, implying an urban population of 1B+ by 2030.
Chart 7: China’s population and urbanization rate
Source: CEIC, National Bureau of Statistics
Disposable income of the Chinese has been increasing steadily over the past decade
driven by urbanization and economic progression. According to the National Bureau of
Statistics, disposable income per capita of urban residents reached RMB26,955
(US$4,348) in 2013, with a nominal growth rate of 9.7% YoY or real price-adjusted
growth rate of 7% YoY.
Chart 8: China’s disposable income per capita of urban residents
Source: National Bureau of Statistics of China as of March 2014, Jefferies
The middle income class, which generally devotes one-third of income for discretionary
spending, experienced the strongest growth in household income over the past years. The
rise of the middle class and increase in purchasing power has also enabled Chinese
consumers to pursue a higher quality of life, which creates huge retail opportunities.
Disposable income per capita of
urban residents reached RMB26,955
(US$4,348) in 2013, with a nominal
growth rate of 9.7% YoY or real
price-adjusted growth rate of 7%
YoY.
According to the National Bureau of
Statistics, China’s urban population
grew from 459.1mn in 2000 to
731.1mn in 2013, accounting for
54% of total population.
The government aims to raise the
urbanization rate to 60% by 2020
and further to 70%, implying an
urban population of 1B+ by 2030.
BABA
Initiating Coverage
27 October 2014
page 13 of 130 , Equity Analyst, +852 3743 8033, [email protected] Meng
Please see important disclosure information on pages 126 - 130 of this report.
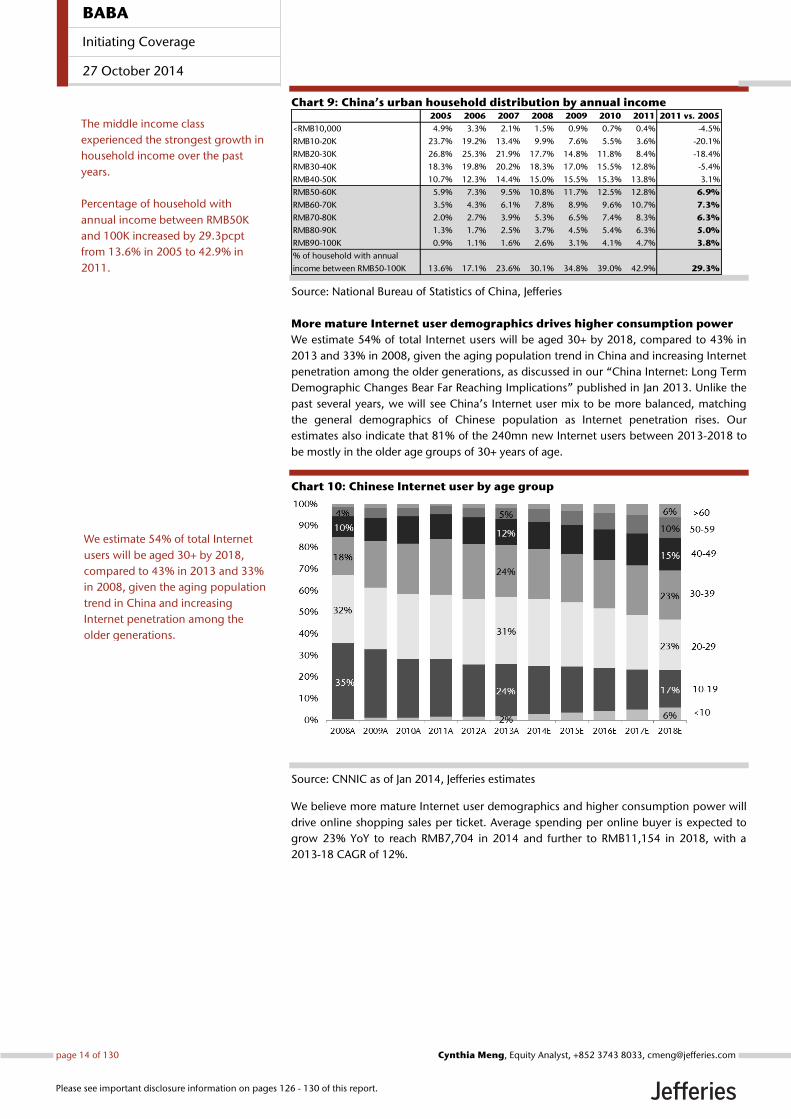
Chart 9: China’s urban household distribution by annual income
Source: National Bureau of Statistics of China, Jefferies
More mature Internet user demographics drives higher consumption power
We estimate 54% of total Internet users will be aged 30+ by 2018, compared to 43% in
2013 and 33% in 2008, given the aging population trend in China and increasing Internet
penetration among the older generations, as discussed in our “China Internet: Long Term
Demographic Changes Bear Far Reaching Implications” published in Jan 2013. Unlike the
past several years, we will see China’s Internet user mix to be more balanced, matching
the general demographics of Chinese population as Internet penetration rises. Our
estimates also indicate that 81% of the 240mn new Internet users between 2013-2018 to
be mostly in the older age groups of 30+ years of age.
Chart 10: Chinese Internet user by age group
Source: CNNIC as of Jan 2014, Jefferies estimates
We believe more mature Internet user demographics and higher consumption power will
drive online shopping sales per ticket. Average spending per online buyer is expected to
grow 23% YoY to reach RMB7,704 in 2014 and further to RMB11,154 in 2018, with a
2013-18 CAGR of 12%.
2005 2006 2007 2008 2009 2010 2011 2011 vs. 2005
<RMB10,000 4.9% 3.3% 2.1% 1.5% 0.9% 0.7% 0.4% -4.5%
RMB10-20K 23.7% 19.2% 13.4% 9.9% 7.6% 5.5% 3.6% -20.1%
RMB20-30K 26.8% 25.3% 21.9% 17.7% 14.8% 11.8% 8.4% -18.4%
RMB30-40K 18.3% 19.8% 20.2% 18.3% 17.0% 15.5% 12.8% -5.4%
RMB40-50K 10.7% 12.3% 14.4% 15.0% 15.5% 15.3% 13.8% 3.1%
RMB50-60K 5.9% 7.3% 9.5% 10.8% 11.7% 12.5% 12.8% 6.9%
RMB60-70K 3.5% 4.3% 6.1% 7.8% 8.9% 9.6% 10.7% 7.3%
RMB70-80K 2.0% 2.7% 3.9% 5.3% 6.5% 7.4% 8.3% 6.3%
RMB80-90K 1.3% 1.7% 2.5% 3.7% 4.5% 5.4% 6.3% 5.0%
RMB90-100K 0.9% 1.1% 1.6% 2.6% 3.1% 4.1% 4.7% 3.8%
% of household with annual
income between RMB50-100K 13.6% 17.1% 23.6% 30.1% 34.8% 39.0% 42.9% 29.3%
The middle income class
experienced the strongest growth in
household income over the past
years.
Percentage of household with
annual income between RMB50K
and 100K increased by 29.3pcpt
from 13.6% in 2005 to 42.9% in
2011.
We estimate 54% of total Internet
users will be aged 30+ by 2018,
compared to 43% in 2013 and 33%
in 2008, given the aging population
trend in China and increasing
Internet penetration among the
older generations.
BABA
Initiating Coverage
27 October 2014
page 14 of 130 , Equity Analyst, +852 3743 8033, [email protected] Meng
Please see important disclosure information on pages 126 - 130 of this report.
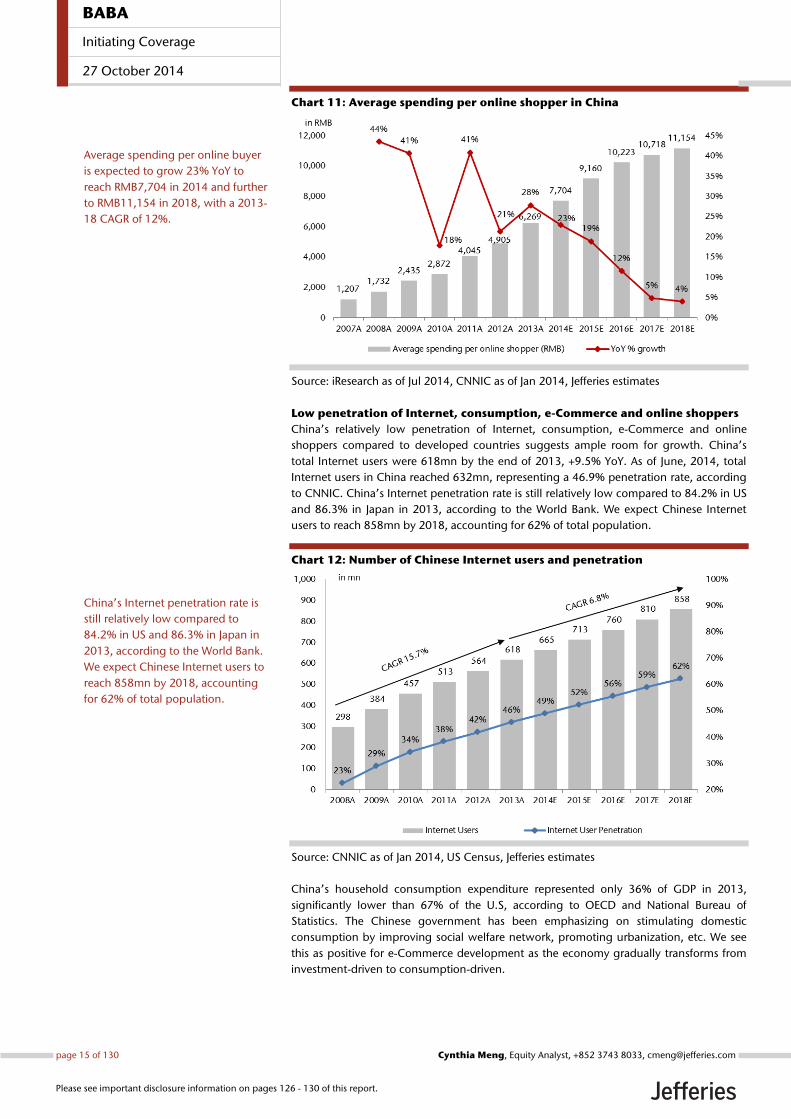
Chart 11: Average spending per online shopper in China
Source: iResearch as of Jul 2014, CNNIC as of Jan 2014, Jefferies estimates
Low penetration of Internet, consumption, e-Commerce and online shoppers
China’s relatively low penetration of Internet, consumption, e-Commerce and online
shoppers compared to developed countries suggests ample room for growth. China’s
total Internet users were 618mn by the end of 2013, +9.5% YoY. As of June, 2014, total
Internet users in China reached 632mn, representing a 46.9% penetration rate, according
to CNNIC. China’s Internet penetration rate is still relatively low compared to 84.2% in US
and 86.3% in Japan in 2013, according to the World Bank. We expect Chinese Internet
users to reach 858mn by 2018, accounting for 62% of total population.
Chart 12: Number of Chinese Internet users and penetration
Source: CNNIC as of Jan 2014, US Census, Jefferies estimates
China’s household consumption expenditure represented only 36% of GDP in 2013,
significantly lower than 67% of the U.S, according to OECD and National Bureau of
Statistics. The Chinese government has been emphasizing on stimulating domestic
consumption by improving social welfare network, promoting urbanization, etc. We see
this as positive for e-Commerce development as the economy gradually transforms from
investment-driven to consumption-driven.
Average spending per online buyer
is expected to grow 23% YoY to
reach RMB7,704 in 2014 and further
to RMB11,154 in 2018, with a 2013-
18 CAGR of 12%.
China’s Internet penetration rate is
still relatively low compared to
84.2% in US and 86.3% in Japan in
2013, according to the World Bank.
We expect Chinese Internet users to
reach 858mn by 2018, accounting
for 62% of total population.
BABA
Initiating Coverage
27 October 2014
page 15 of 130 , Equity Analyst, +852 3743 8033, [email protected] Meng
Please see important disclosure information on pages 126 - 130 of this report.
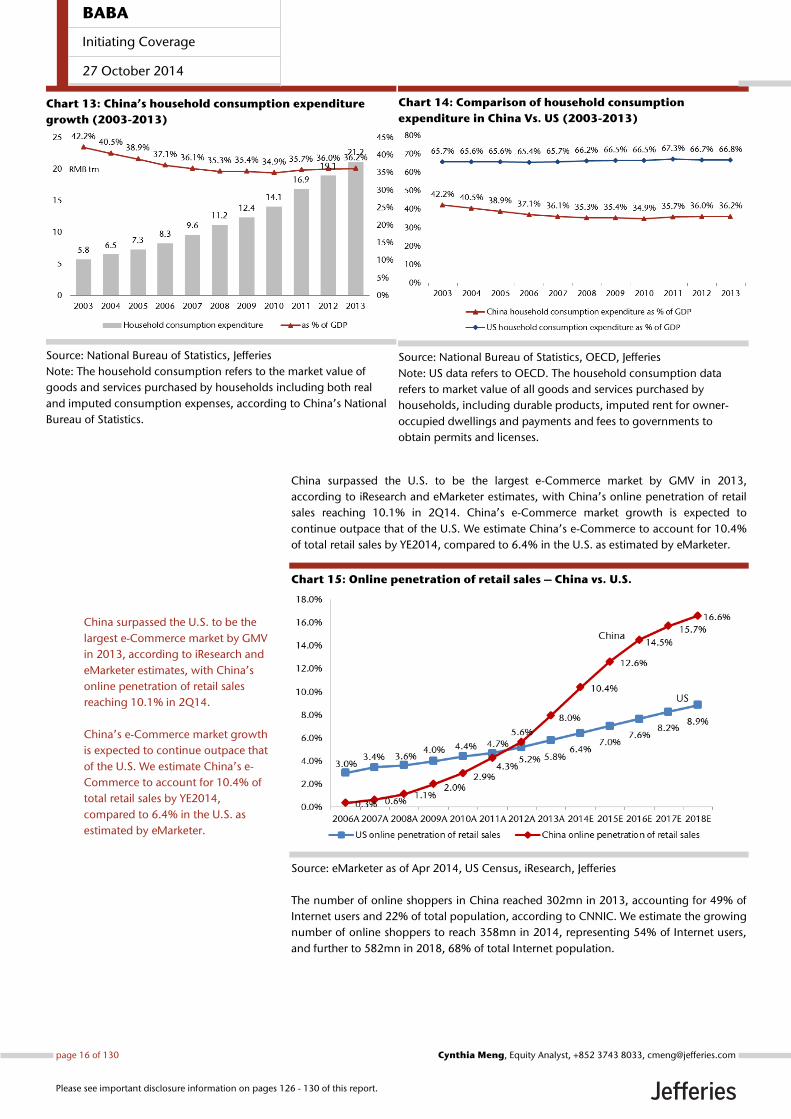
Chart 13: China’s household consumption expenditure
growth (2003-2013)
Source: National Bureau of Statistics, Jefferies
Note: The household consumption refers to the market value of
goods and services purchased by households including both real
and imputed consumption expenses, according to China’s National
Bureau of Statistics.
Chart 14: Comparison of household consumption
expenditure in China Vs. US (2003-2013)
Source: National Bureau of Statistics, OECD, Jefferies
Note: US data refers to OECD. The household consumption data
refers to market value of all goods and services purchased by
households, including durable products, imputed rent for owner-
occupied dwellings and payments and fees to governments to
obtain permits and licenses.
China surpassed the U.S. to be the largest e-Commerce market by GMV in 2013,
according to iResearch and eMarketer estimates, with China’s online penetration of retail
sales reaching 10.1% in 2Q14. China’s e-Commerce market growth is expected to
continue outpace that of the U.S. We estimate China’s e-Commerce to account for 10.4%
of total retail sales by YE2014, compared to 6.4% in the U.S. as estimated by eMarketer.
Chart 15: Online penetration of retail sales – China vs. U.S.
Source: eMarketer as of Apr 2014, US Census, iResearch, Jefferies
The number of online shoppers in China reached 302mn in 2013, accounting for 49% of
Internet users and 22% of total population, according to CNNIC. We estimate the growing
number of online shoppers to reach 358mn in 2014, representing 54% of Internet users,
and further to 582mn in 2018, 68% of total Internet population.
China surpassed the U.S. to be the
largest e-Commerce market by GMV
in 2013, according to iResearch and
eMarketer estimates, with China’s
online penetration of retail sales
reaching 10.1% in 2Q14.
China’s e-Commerce market growth
is expected to continue outpace that
of the U.S. We estimate China’s e-
Commerce to account for 10.4% of
total retail sales by YE2014,
compared to 6.4% in the U.S. as
estimated by eMarketer.
BABA
Initiating Coverage
27 October 2014
page 16 of 130 , Equity Analyst, +852 3743 8033, [email protected] Meng
Please see important disclosure information on pages 126 - 130 of this report.
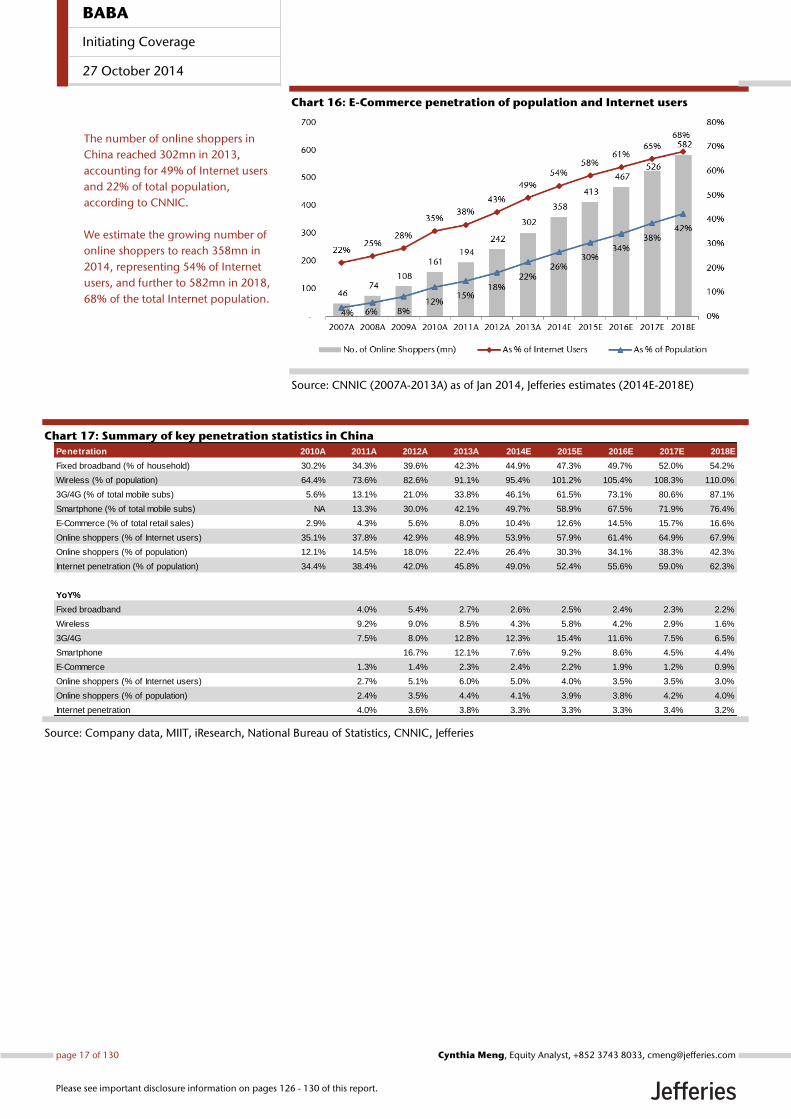
Chart 16: E-Commerce penetration of population and Internet users
Source: CNNIC (2007A-2013A) as of Jan 2014, Jefferies estimates (2014E-2018E)
Chart 17: Summary of key penetration statistics in China
Source: Company data, MIIT, iResearch, National Bureau of Statistics, CNNIC, Jefferies
Penetration 2010A 2011A 2012A 2013A 2014E 2015E 2016E 2017E 2018E
Fixed broadband (% of household) 30.2% 34.3% 39.6% 42.3% 44.9% 47.3% 49.7% 52.0% 54.2%
Wireless (% of population) 64.4% 73.6% 82.6% 91.1% 95.4% 101.2% 105.4% 108.3% 110.0%
3G/4G (% of total mobile subs) 5.6% 13.1% 21.0% 33.8% 46.1% 61.5% 73.1% 80.6% 87.1%
Smartphone (% of total mobile subs) NA 13.3% 30.0% 42.1% 49.7% 58.9% 67.5% 71.9% 76.4%
E-Commerce (% of total retail sales) 2.9% 4.3% 5.6% 8.0% 10.4% 12.6% 14.5% 15.7% 16.6%
Online shoppers (% of Internet users) 35.1% 37.8% 42.9% 48.9% 53.9% 57.9% 61.4% 64.9% 67.9%
Online shoppers (% of population) 12.1% 14.5% 18.0% 22.4% 26.4% 30.3% 34.1% 38.3% 42.3%
Internet penetration (% of population) 34.4% 38.4% 42.0% 45.8% 49.0% 52.4% 55.6% 59.0% 62.3%
YoY%
Fixed broadband 4.0% 5.4% 2.7% 2.6% 2.5% 2.4% 2.3% 2.2%
Wireless 9.2% 9.0% 8.5% 4.3% 5.8% 4.2% 2.9% 1.6%
3G/4G 7.5% 8.0% 12.8% 12.3% 15.4% 11.6% 7.5% 6.5%
Smartphone 16.7% 12.1% 7.6% 9.2% 8.6% 4.5% 4.4%
E-Commerce 1.3% 1.4% 2.3% 2.4% 2.2% 1.9% 1.2% 0.9%
Online shoppers (% of Internet users) 2.7% 5.1% 6.0% 5.0% 4.0% 3.5% 3.5% 3.0%
Online shoppers (% of population) 2.4% 3.5% 4.4% 4.1% 3.9% 3.8% 4.2% 4.0%
Internet penetration 4.0% 3.6% 3.8% 3.3% 3.3% 3.3% 3.4% 3.2%
The number of online shoppers in
China reached 302mn in 2013,
accounting for 49% of Internet users
and 22% of total population,
according to CNNIC.
We estimate the growing number of
online shoppers to reach 358mn in
2014, representing 54% of Internet
users, and further to 582mn in 2018,
68% of the total Internet population.
BABA
Initiating Coverage
27 October 2014
page 17 of 130 , Equity Analyst, +852 3743 8033, [email protected] Meng
Please see important disclosure information on pages 126 - 130 of this report.
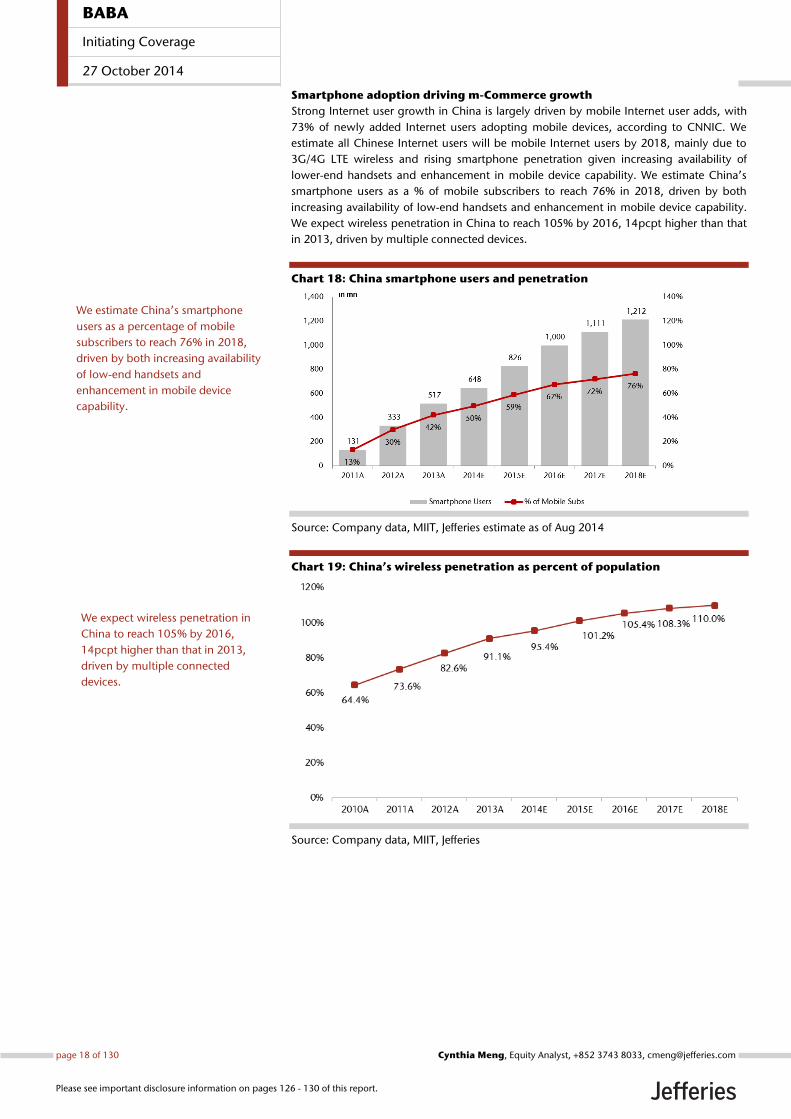
Smartphone adoption driving m-Commerce growth
Strong Internet user growth in China is largely driven by mobile Internet user adds, with
73% of newly added Internet users adopting mobile devices, according to CNNIC. We
estimate all Chinese Internet users will be mobile Internet users by 2018, mainly due to
3G/4G LTE wireless and rising smartphone penetration given increasing availability of
lower-end handsets and enhancement in mobile device capability. We estimate China’s
smartphone users as a % of mobile subscribers to reach 76% in 2018, driven by both
increasing availability of low-end handsets and enhancement in mobile device capability.
We expect wireless penetration in China to reach 105% by 2016, 14pcpt higher than that
in 2013, driven by multiple connected devices.
Chart 18: China smartphone users and penetration
Source: Company data, MIIT, Jefferies estimate as of Aug 2014
Chart 19: China’s wireless penetration as percent of population
Source: Company data, MIIT, Jefferies
We estimate China’s smartphone
users as a percentage of mobile
subscribers to reach 76% in 2018,
driven by both increasing availability
of low-end handsets and
enhancement in mobile device
capability.
We expect wireless penetration in
China to reach 105% by 2016,
14pcpt higher than that in 2013,
driven by multiple connected
devices.
BABA
Initiating Coverage
27 October 2014
page 18 of 130 , Equity Analyst, +852 3743 8033, [email protected] Meng
Please see important disclosure information on pages 126 - 130 of this report.
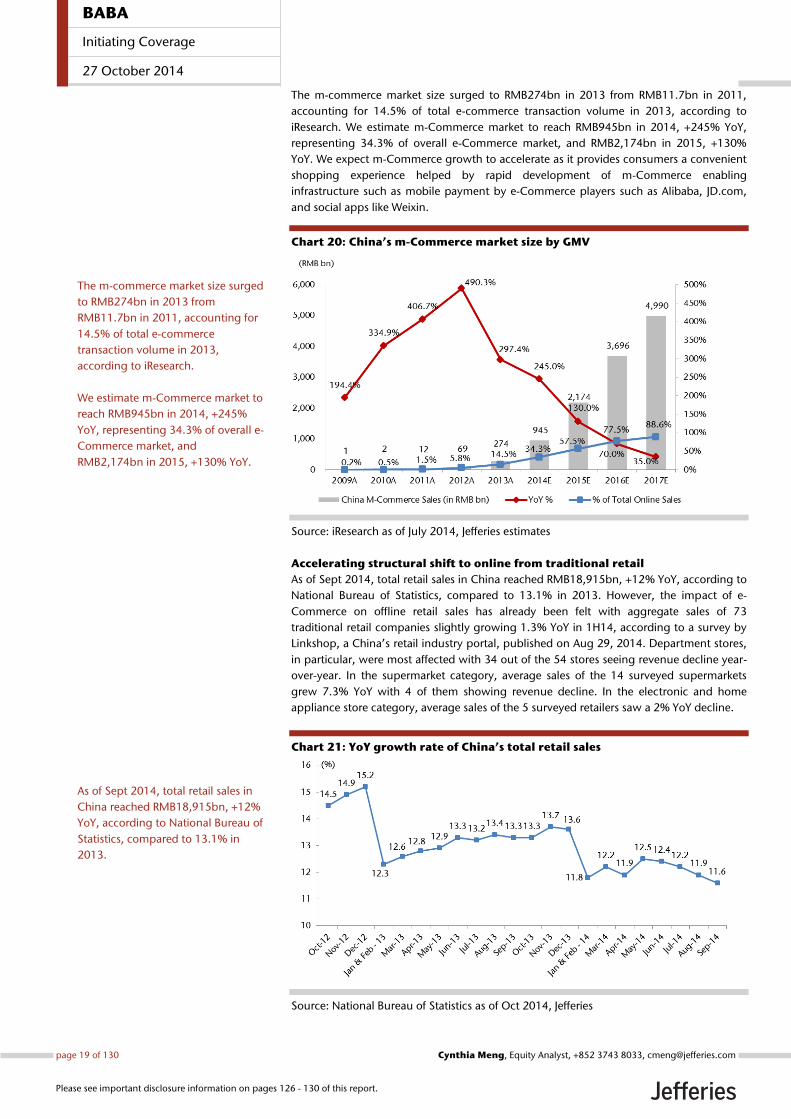
The m-commerce market size surged to RMB274bn in 2013 from RMB11.7bn in 2011,
accounting for 14.5% of total e-commerce transaction volume in 2013, according to
iResearch. We estimate m-Commerce market to reach RMB945bn in 2014, +245% YoY,
representing 34.3% of overall e-Commerce market, and RMB2,174bn in 2015, +130%
YoY. We expect m-Commerce growth to accelerate as it provides consumers a convenient
shopping experience helped by rapid development of m-Commerce enabling
infrastructure such as mobile payment by e-Commerce players such as Alibaba, JD.com,
and social apps like Weixin.
Chart 20: China’s m-Commerce market size by GMV
Source: iResearch as of July 2014, Jefferies estimates
Accelerating structural shift to online from traditional retail
As of Sept 2014, total retail sales in China reached RMB18,915bn, +12% YoY, according to
National Bureau of Statistics, compared to 13.1% in 2013. However, the impact of e-
Commerce on offline retail sales has already been felt with aggregate sales of 73
traditional retail companies slightly growing 1.3% YoY in 1H14, according to a survey by
Linkshop, a China’s retail industry portal, published on Aug 29, 2014. Department stores,
in particular, were most affected with 34 out of the 54 stores seeing revenue decline year-
over-year. In the supermarket category, average sales of the 14 surveyed supermarkets
grew 7.3% YoY with 4 of them showing revenue decline. In the electronic and home
appliance store category, average sales of the 5 surveyed retailers saw a 2% YoY decline.
Chart 21: YoY growth rate of China’s total retail sales
Source: National Bureau of Statistics as of Oct 2014, Jefferies
The m-commerce market size surged
to RMB274bn in 2013 from
RMB11.7bn in 2011, accounting for
14.5% of total e-commerce
transaction volume in 2013,
according to iResearch.
We estimate m-Commerce market to
reach RMB945bn in 2014, +245%
YoY, representing 34.3% of overall e-
Commerce market, and
RMB2,174bn in 2015, +130% YoY.
As of Sept 2014, total retail sales in
China reached RMB18,915bn, +12%
YoY, according to National Bureau of
Statistics, compared to 13.1% in
2013.
BABA
Initiating Coverage
27 October 2014
page 19 of 130 , Equity Analyst, +852 3743 8033, [email protected] Meng
Please see important disclosure information on pages 126 - 130 of this report.
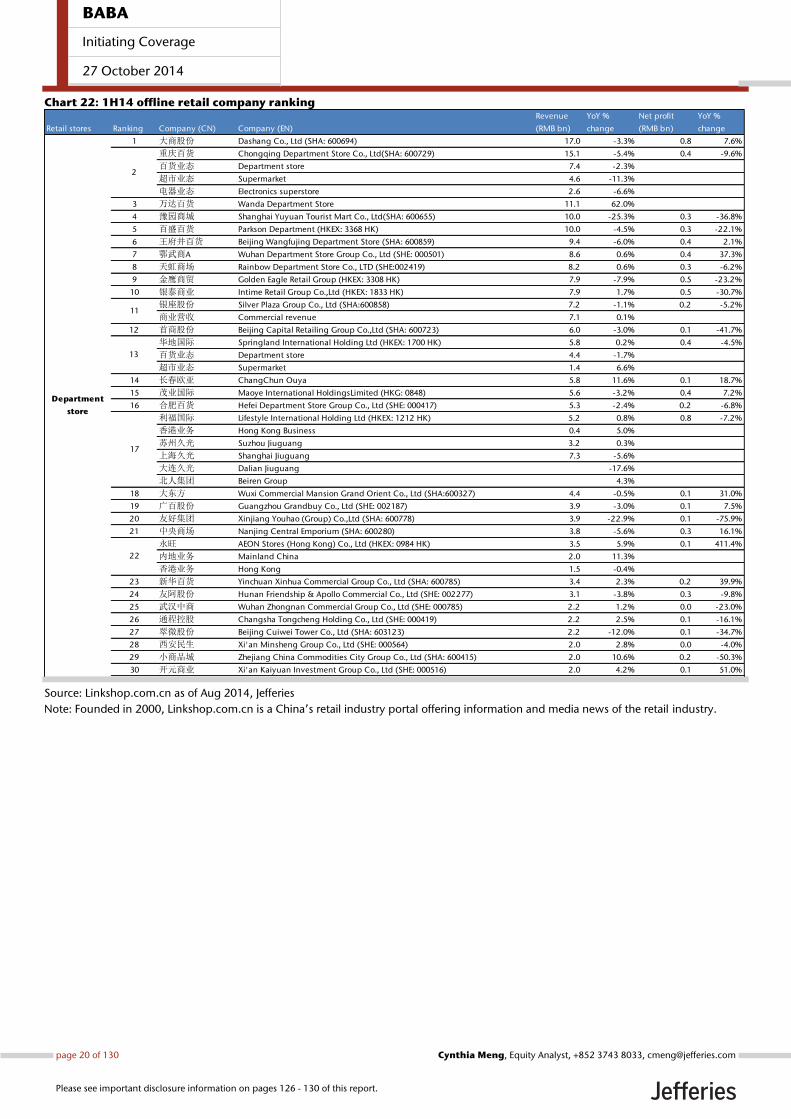
Chart 22: 1H14 offline retail company ranking
Source: Linkshop.com.cn as of Aug 2014, Jefferies
Note: Founded in 2000, Linkshop.com.cn is a China’s retail industry portal offering information and media news of the retail industry.
Retail stores Ranking Company (CN) Company (EN)
Revenue
(RMB bn)
YoY %
change
Net profit
(RMB bn)
YoY %
change
1 大商股份 Dashang Co., Ltd (SHA: 600694) 17.0 -3.3% 0.8 7.6%
重庆百货 Chongqing Department Store Co., Ltd(SHA: 600729) 15.1 -5.4% 0.4 -9.6%
百货业态 Department store 7.4 -2.3%
超市业态 Supermarket 4.6 -11.3%
电器业态 Electronics superstore 2.6 -6.6%
3 万达百货 Wanda Department Store 11.1 62.0%
4 豫园商城 Shanghai Yuyuan Tourist Mart Co., Ltd(SHA: 600655) 10.0 -25.3% 0.3 -36.8%
5 百盛百货 Parkson Department (HKEX: 3368 HK) 10.0 -4.5% 0.3 -22.1%
6 王府井百货 Beijing Wangfujing Department Store (SHA: 600859) 9.4 -6.0% 0.4 2.1%
7 鄂武商A Wuhan Department Store Group Co., Ltd (SHE: 000501) 8.6 0.6% 0.4 37.3%
8 天虹商场 Rainbow Department Store Co., LTD (SHE:002419) 8.2 0.6% 0.3 -6.2%
9 金鹰商贸 Golden Eagle Retail Group (HKEX: 3308 HK) 7.9 -7.9% 0.5 -23.2%
10 银泰商业 Intime Retail Group Co.,Ltd (HKEX: 1833 HK) 7.9 1.7% 0.5 -30.7%
银座股份 Silver Plaza Group Co., Ltd (SHA:600858) 7.2 -1.1% 0.2 -5.2%
商业营收 Commercial revenue 7.1 0.1%
12 首商股份 Beijing Capital Retailing Group Co.,Ltd (SHA: 600723) 6.0 -3.0% 0.1 -41.7%
华地国际 Springland International Holding Ltd (HKEX: 1700 HK) 5.8 0.2% 0.4 -4.5%
百货业态 Department store 4.4 -1.7%
超市业态 Supermarket 1.4 6.6%
14 长春欧亚 ChangChun Ouya 5.8 11.6% 0.1 18.7%
15 茂业国际 Maoye International HoldingsLimited (HKG: 0848) 5.6 -3.2% 0.4 7.2%
16 合肥百货 Hefei Department Store Group Co., Ltd (SHE: 000417) 5.3 -2.4% 0.2 -6.8%
利福国际 Lifestyle International Holding Ltd (HKEX: 1212 HK) 5.2 0.8% 0.8 -7.2%
香港业务 Hong Kong Business 0.4 5.0%
苏州久光 Suzhou Jiuguang 3.2 0.3%
上海久光 Shanghai Jiuguang 7.3 -5.6%
大连久光 Dalian Jiuguang -17.6%
北人集团 Beiren Group 4.3%
18 大东方 Wuxi Commercial Mansion Grand Orient Co., Ltd (SHA:600327) 4.4 -0.5% 0.1 31.0%
19 广百股份 Guangzhou Grandbuy Co., Ltd (SHE: 002187) 3.9 -3.0% 0.1 7.5%
20 友好集团 Xinjiang Youhao (Group) Co.,Ltd (SHA: 600778) 3.9 -22.9% 0.1 -75.9%
21 中央商场 Nanjing Central Emporium (SHA: 600280) 3.8 -5.6% 0.3 16.1%
永旺 AEON Stores (Hong Kong) Co., Ltd (HKEX: 0984 HK) 3.5 5.9% 0.1 411.4%
内地业务 Mainland China 2.0 11.3%
香港业务 Hong Kong 1.5 -0.4%
23 新华百货 Yinchuan Xinhua Commercial Group Co., Ltd (SHA: 600785) 3.4 2.3% 0.2 39.9%
24 友阿股份 Hunan Friendship & Apollo Commercial Co., Ltd (SHE: 002277) 3.1 -3.8% 0.3 -9.8%
25 武汉中商 Wuhan Zhongnan Commercial Group Co., Ltd (SHE: 000785) 2.2 1.2% 0.0 -23.0%
26 通程控股 Changsha Tongcheng Holding Co., Ltd (SHE: 000419) 2.2 2.5% 0.1 -16.1%
27 翠微股份 Beijing Cuiwei Tower Co., Ltd (SHA: 603123) 2.2 -12.0% 0.1 -34.7%
28 西安民生 Xi'an Minsheng Group Co., Ltd (SHE: 000564) 2.0 2.8% 0.0 -4.0%
29 小商品城 Zhejiang China Commodities City Group Co., Ltd (SHA: 600415) 2.0 10.6% 0.2 -50.3%
30 开元商业 Xi'an Kaiyuan Investment Group Co., Ltd (SHE: 000516) 2.0 4.2% 0.1 51.0%
2
13
17
22
11
Department
store
BABA
Initiating Coverage
27 October 2014
page 20 of 130 , Equity Analyst, +852 3743 8033, [email protected] Meng
Please see important disclosure information on pages 126 - 130 of this report.
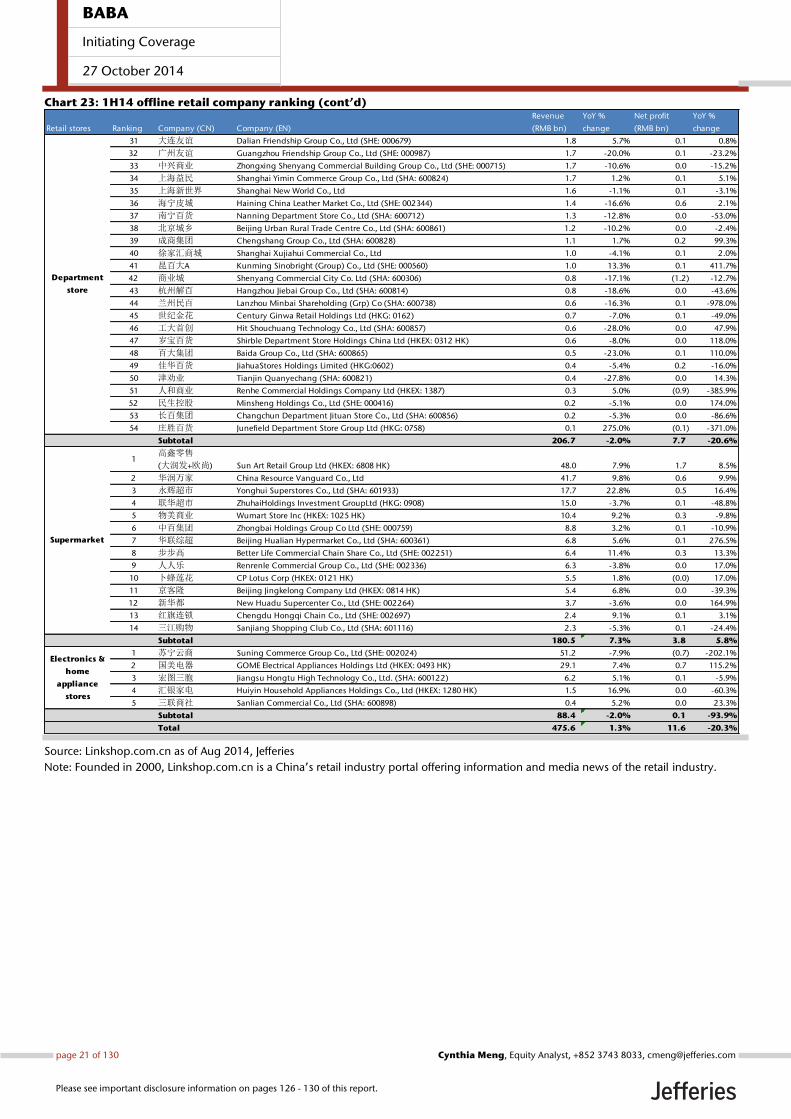
Chart 23: 1H14 offline retail company ranking (cont’d)
Source: Linkshop.com.cn as of Aug 2014, Jefferies
Note: Founded in 2000, Linkshop.com.cn is a China’s retail industry portal offering information and media news of the retail industry.
Retail stores Ranking Company (CN) Company (EN)
Revenue
(RMB bn)
YoY %
change
Net profit
(RMB bn)
YoY %
change
31 大连友谊 Dalian Friendship Group Co., Ltd (SHE: 000679) 1.8 5.7% 0.1 0.8%
32 广州友谊 Guangzhou Friendship Group Co., Ltd (SHE: 000987) 1.7 -20.0% 0.1 -23.2%
33 中兴商业 Zhongxing Shenyang Commercial Building Group Co., Ltd (SHE: 000715) 1.7 -10.6% 0.0 -15.2%
34 上海益民 Shanghai Yimin Commerce Group Co., Ltd (SHA: 600824) 1.7 1.2% 0.1 5.1%
35 上海新世界 Shanghai New World Co., Ltd 1.6 -1.1% 0.1 -3.1%
36 海宁皮城 Haining China Leather Market Co., Ltd (SHE: 002344) 1.4 -16.6% 0.6 2.1%
37 南宁百货 Nanning Department Store Co., Ltd (SHA: 600712) 1.3 -12.8% 0.0 -53.0%
38 北京城乡 Beijing Urban Rural Trade Centre Co., Ltd (SHA: 600861) 1.2 -10.2% 0.0 -2.4%
39 成商集团 Chengshang Group Co., Ltd (SHA: 600828) 1.1 1.7% 0.2 99.3%
40 徐家汇商城 Shanghai Xujiahui Commercial Co., Ltd 1.0 -4.1% 0.1 2.0%
41 昆百大A Kunming Sinobright (Group) Co., Ltd (SHE: 000560) 1.0 13.3% 0.1 411.7%
42 商业城 Shenyang Commercial City Co. Ltd (SHA: 600306) 0.8 -17.1% (1.2) -12.7%
43 杭州解百 Hangzhou Jiebai Group Co., Ltd (SHA: 600814) 0.8 -18.6% 0.0 -43.6%
44 兰州民百 Lanzhou Minbai Shareholding (Grp) Co (SHA: 600738) 0.6 -16.3% 0.1 -978.0%
45 世纪金花 Century Ginwa Retail Holdings Ltd (HKG: 0162) 0.7 -7.0% 0.1 -49.0%
46 工大首创 Hit Shouchuang Technology Co., Ltd (SHA: 600857) 0.6 -28.0% 0.0 47.9%
47 岁宝百货 Shirble Department Store Holdings China Ltd (HKEX: 0312 HK) 0.6 -8.0% 0.0 118.0%
48 百大集团 Baida Group Co., Ltd (SHA: 600865) 0.5 -23.0% 0.1 110.0%
49 佳华百货 JiahuaStores Holdings Limited (HKG:0602) 0.4 -5.4% 0.2 -16.0%
50 津劝业 Tianjin Quanyechang (SHA: 600821) 0.4 -27.8% 0.0 14.3%
51 人和商业 Renhe Commercial Holdings Company Ltd (HKEX: 1387) 0.3 5.0% (0.9) -385.9%
52 民生控股 Minsheng Holdings Co., Ltd (SHE: 000416) 0.2 -5.1% 0.0 174.0%
53 长百集团 Changchun Department Jituan Store Co., Ltd (SHA: 600856) 0.2 -5.3% 0.0 -86.6%
54 庄胜百货 Junefield Department Store Group Ltd (HKG: 0758) 0.1 275.0% (0.1) -371.0%
Subtotal 206.7 -2.0% 7.7 -20.6%
1高鑫零售
(大润发+欧尚) Sun Art Retail Group Ltd (HKEX: 6808 HK) 48.0 7.9% 1.7 8.5%
2 华润万家 China Resource Vanguard Co., Ltd 41.7 9.8% 0.6 9.9%
3 永辉超市 Yonghui Superstores Co., Ltd (SHA: 601933) 17.7 22.8% 0.5 16.4%
4 联华超市 ZhuhaiHoldings Investment GroupLtd (HKG: 0908) 15.0 -3.7% 0.1 -48.8%
5 物美商业 Wumart Store Inc (HKEX: 1025 HK) 10.4 9.2% 0.3 -9.8%
6 中百集团 Zhongbai Holdings Group Co Ltd (SHE: 000759) 8.8 3.2% 0.1 -10.9%
7 华联综超 Beijing Hualian Hypermarket Co., Ltd (SHA: 600361) 6.8 5.6% 0.1 276.5%
8 步步高 Better Life Commercial Chain Share Co., Ltd (SHE: 002251) 6.4 11.4% 0.3 13.3%
9 人人乐 Renrenle Commercial Group Co., Ltd (SHE: 002336) 6.3 -3.8% 0.0 17.0%
10 卜蜂莲花 CP Lotus Corp (HKEX: 0121 HK) 5.5 1.8% (0.0) 17.0%
11 京客隆 Beijing Jingkelong Company Ltd (HKEX: 0814 HK) 5.4 6.8% 0.0 -39.3%
12 新华都 New Huadu Supercenter Co., Ltd (SHE: 002264) 3.7 -3.6% 0.0 164.9%
13 红旗连锁 Chengdu Hongqi Chain Co., Ltd (SHE: 002697) 2.4 9.1% 0.1 3.1%
14 三江购物 Sanjiang Shopping Club Co., Ltd (SHA: 601116) 2.3 -5.3% 0.1 -24.4%
Subtotal 180.5 7.3% 3.8 5.8%
1 苏宁云商 Suning Commerce Group Co., Ltd (SHE: 002024) 51.2 -7.9% (0.7) -202.1%
2 国美电器 GOME Electrical Appliances Holdings Ltd (HKEX: 0493 HK) 29.1 7.4% 0.7 115.2%
3 宏图三胞 Jiangsu Hongtu High Technology Co., Ltd. (SHA: 600122) 6.2 5.1% 0.1 -5.9%
4 汇银家电 Huiyin Household Appliances Holdings Co., Ltd (HKEX: 1280 HK) 1.5 16.9% 0.0 -60.3%
5 三联商社 Sanlian Commercial Co., Ltd (SHA: 600898) 0.4 5.2% 0.0 23.3%
Subtotal 88.4 -2.0% 0.1 -93.9%
Total 475.6 1.3% 11.6 -20.3%
Electronics &
home
appliance
stores
Supermarket
Department
store
BABA
Initiating Coverage
27 October 2014
page 21 of 130 , Equity Analyst, +852 3743 8033, [email protected] Meng
Please see important disclosure information on pages 126 - 130 of this report.
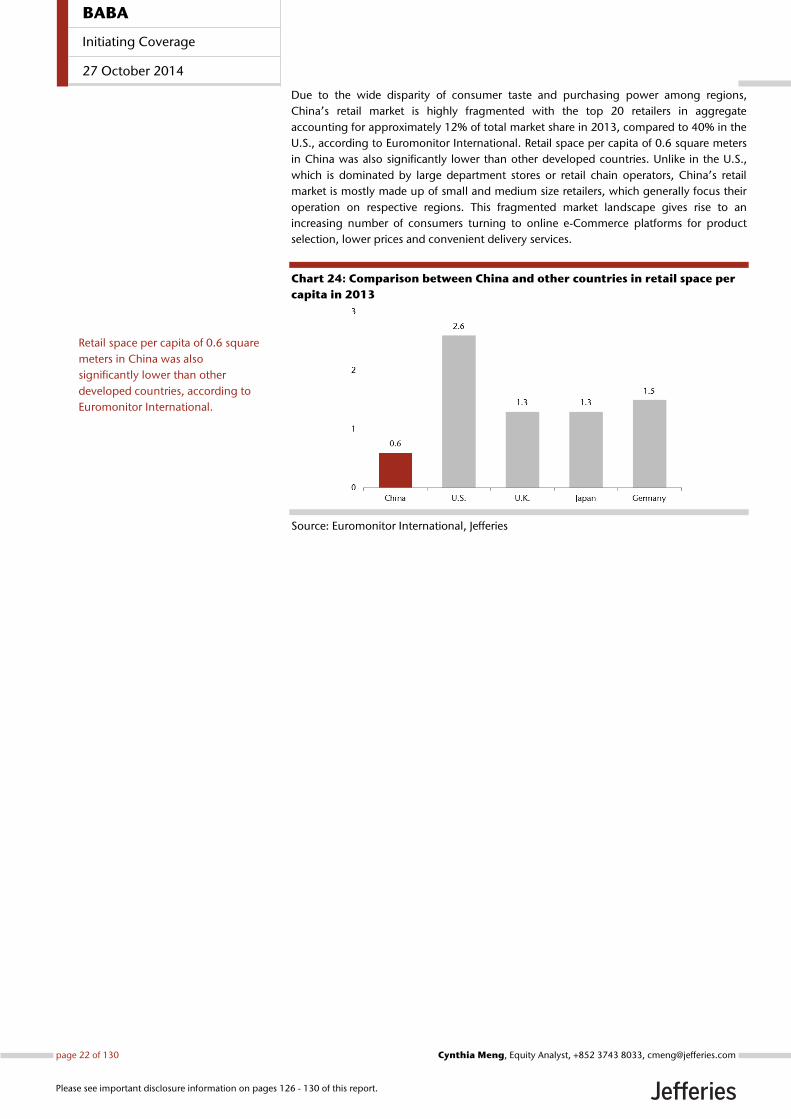
Due to the wide disparity of consumer taste and purchasing power among regions,
China’s retail market is highly fragmented with the top 20 retailers in aggregate
accounting for approximately 12% of total market share in 2013, compared to 40% in the
U.S., according to Euromonitor International. Retail space per capita of 0.6 square meters
in China was also significantly lower than other developed countries. Unlike in the U.S.,
which is dominated by large department stores or retail chain operators, China’s retail
market is mostly made up of small and medium size retailers, which generally focus their
operation on respective regions. This fragmented market landscape gives rise to an
increasing number of consumers turning to online e-Commerce platforms for product
selection, lower prices and convenient delivery services.
Chart 24: Comparison between China and other countries in retail space per
capita in 2013
Source: Euromonitor International, Jefferies
Retail space per capita of 0.6 square
meters in China was also
significantly lower than other
developed countries, according to
Euromonitor International.
BABA
Initiating Coverage
27 October 2014
page 22 of 130 , Equity Analyst, +852 3743 8033, [email protected] Meng
Please see important disclosure information on pages 126 - 130 of this report.
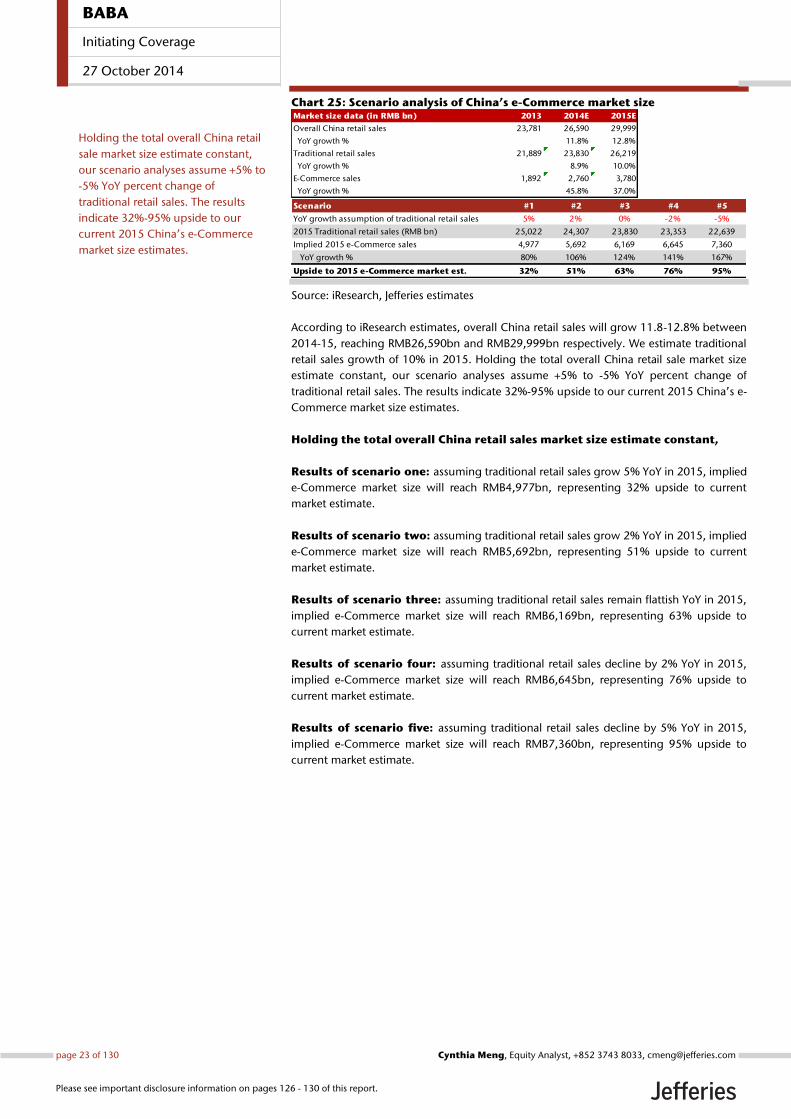
Chart 25: Scenario analysis of China’s e-Commerce market size
Source: iResearch, Jefferies estimates
According to iResearch estimates, overall China retail sales will grow 11.8-12.8% between
2014-15, reaching RMB26,590bn and RMB29,999bn respectively. We estimate traditional
retail sales growth of 10% in 2015. Holding the total overall China retail sale market size
estimate constant, our scenario analyses assume +5% to -5% YoY percent change of
traditional retail sales. The results indicate 32%-95% upside to our current 2015 China’s e-
Commerce market size estimates.
Holding the total overall China retail sales market size estimate constant,
Results of scenario one: assuming traditional retail sales grow 5% YoY in 2015, implied
e-Commerce market size will reach RMB4,977bn, representing 32% upside to current
market estimate.
Results of scenario two: assuming traditional retail sales grow 2% YoY in 2015, implied
e-Commerce market size will reach RMB5,692bn, representing 51% upside to current
market estimate.
Results of scenario three: assuming traditional retail sales remain flattish YoY in 2015,
implied e-Commerce market size will reach RMB6,169bn, representing 63% upside to
current market estimate.
Results of scenario four: assuming traditional retail sales decline by 2% YoY in 2015,
implied e-Commerce market size will reach RMB6,645bn, representing 76% upside to
current market estimate.
Results of scenario five: assuming traditional retail sales decline by 5% YoY in 2015,
implied e-Commerce market size will reach RMB7,360bn, representing 95% upside to
current market estimate.
Market size data (in RMB bn) 2013 2014E 2015E
Overall China retail sales 23,781 26,590 29,999
YoY growth % 11.8% 12.8%
Traditional retail sales 21,889 23,830 26,219
YoY growth % 8.9% 10.0%
E-Commerce sales 1,892 2,760 3,780
YoY growth % 45.8% 37.0%
Scenario #1 #2 #3 #4 #5
YoY growth assumption of traditional retail sales 5% 2% 0% -2% -5%
2015 Traditional retail sales (RMB bn) 25,022 24,307 23,830 23,353 22,639
Implied 2015 e-Commerce sales 4,977 5,692 6,169 6,645 7,360
YoY growth % 80% 106% 124% 141% 167%
Upside to 2015 e-Commerce market est. 32% 51% 63% 76% 95%
Holding the total overall China retail
sale market size estimate constant,
our scenario analyses assume +5% to
-5% YoY percent change of
traditional retail sales. The results
indicate 32%-95% upside to our
current 2015 China’s e-Commerce
market size estimates.
BABA
Initiating Coverage
27 October 2014
page 23 of 130 , Equity Analyst, +852 3743 8033, [email protected] Meng
Please see important disclosure information on pages 126 - 130 of this report.
This page is intentionally kept blank
BABA
Initiating Coverage
27 October 2014
page 24 of 130 , Equity Analyst, +852 3743 8033, [email protected] Meng
Please see important disclosure information on pages 126 - 130 of this report.
Alibaba - The Powerful E-Commerce Ecosystem Connecting Half of China
BABA
Initiating Coverage
27 October 2014
page 25 of 130 , Equity Analyst, +852 3743 8033, [email protected] Meng
Please see important disclosure information on pages 126 - 130 of this report.

This page is intentionally kept blank
BABA
Initiating Coverage
27 October 2014
page 26 of 130 , Equity Analyst, +852 3743 8033, [email protected] Meng
Please see important disclosure information on pages 126 - 130 of this report.
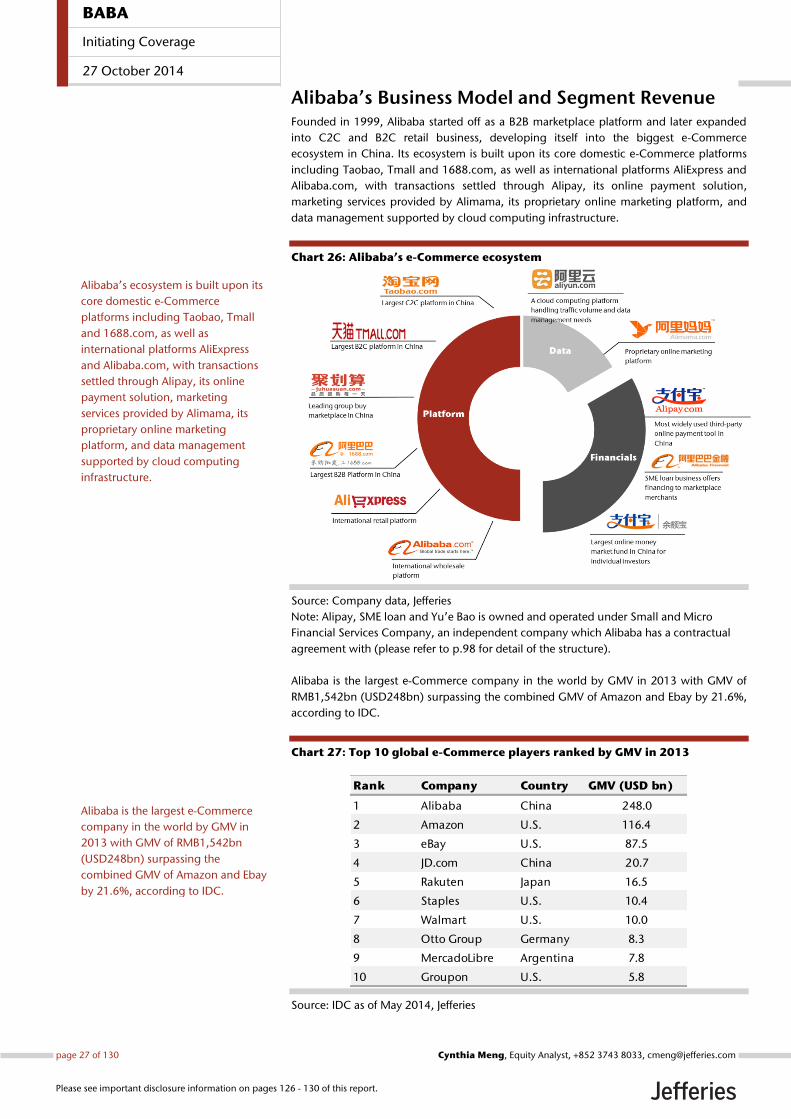
Alibaba’s Business Model and Segment Revenue Founded in 1999, Alibaba started off as a B2B marketplace platform and later expanded
into C2C and B2C retail business, developing itself into the biggest e-Commerce
ecosystem in China. Its ecosystem is built upon its core domestic e-Commerce platforms
including Taobao, Tmall and 1688.com, as well as international platforms AliExpress and
Alibaba.com, with transactions settled through Alipay, its online payment solution,
marketing services provided by Alimama, its proprietary online marketing platform, and
data management supported by cloud computing infrastructure.
Chart 26: Alibaba’s e-Commerce ecosystem
Source: Company data, Jefferies
Note: Alipay, SME loan and Yu’e Bao is owned and operated under Small and Micro
Financial Services Company, an independent company which Alibaba has a contractual
agreement with (please refer to p.98 for detail of the structure).
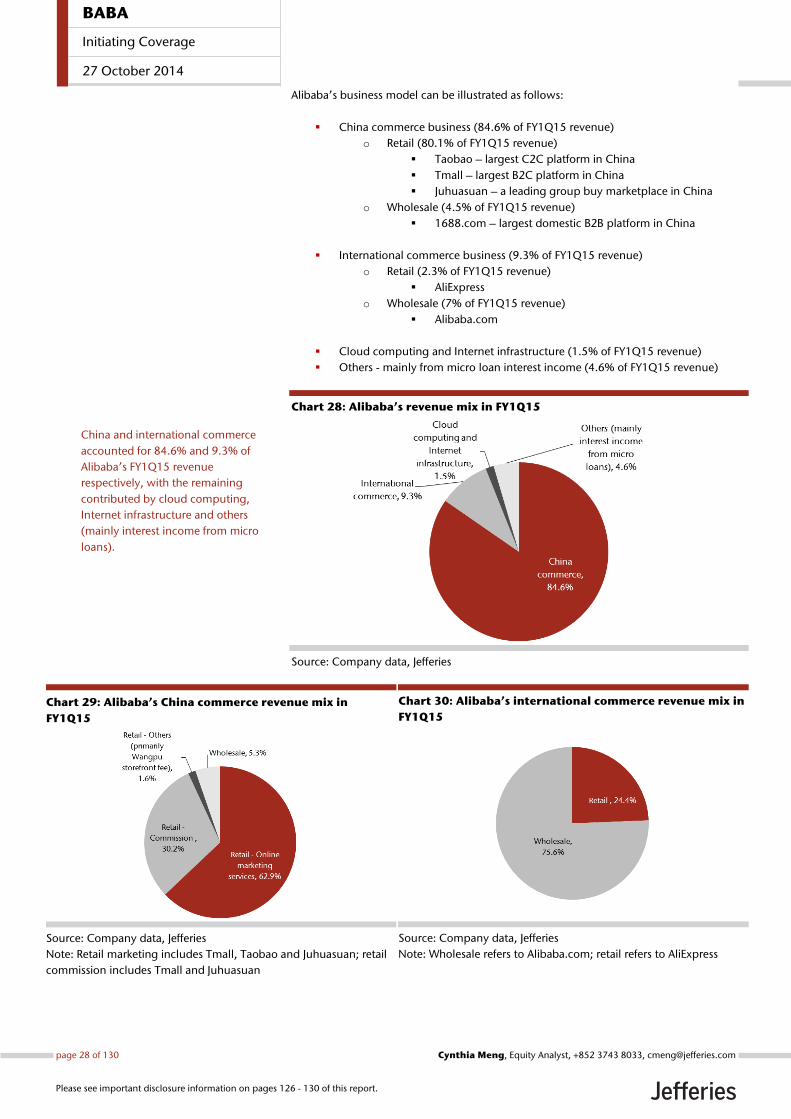
Alibaba is the largest e-Commerce company in the world by GMV in 2013 with GMV of
RMB1,542bn (USD248bn) surpassing the combined GMV of Amazon and Ebay by 21.6%,
according to IDC.
Chart 27: Top 10 global e-Commerce players ranked by GMV in 2013
Source: IDC as of May 2014, Jefferies
Rank Company Country GMV (USD bn)
1 Alibaba China 248.0
2 Amazon U.S. 116.4
3 eBay U.S. 87.5
4 JD.com China 20.7
5 Rakuten Japan 16.5
6 Staples U.S. 10.4
7 Walmart U.S. 10.0
8 Otto Group Germany 8.3
9 MercadoLibre Argentina 7.8
10 Groupon U.S. 5.8
Alibaba’s ecosystem is built upon its
core domestic e-Commerce
platforms including Taobao, Tmall
and 1688.com, as well as
international platforms AliExpress
and Alibaba.com, with transactions
settled through Alipay, its online
payment solution, marketing
services provided by Alimama, its
proprietary online marketing
platform, and data management
supported by cloud computing
infrastructure.
Alibaba is the largest e-Commerce
company in the world by GMV in
2013 with GMV of RMB1,542bn
(USD248bn) surpassing the
combined GMV of Amazon and Ebay
by 21.6%, according to IDC.
BABA
Initiating Coverage
27 October 2014
page 27 of 130 , Equity Analyst, +852 3743 8033, [email protected] Meng
Please see important disclosure information on pages 126 - 130 of this report.
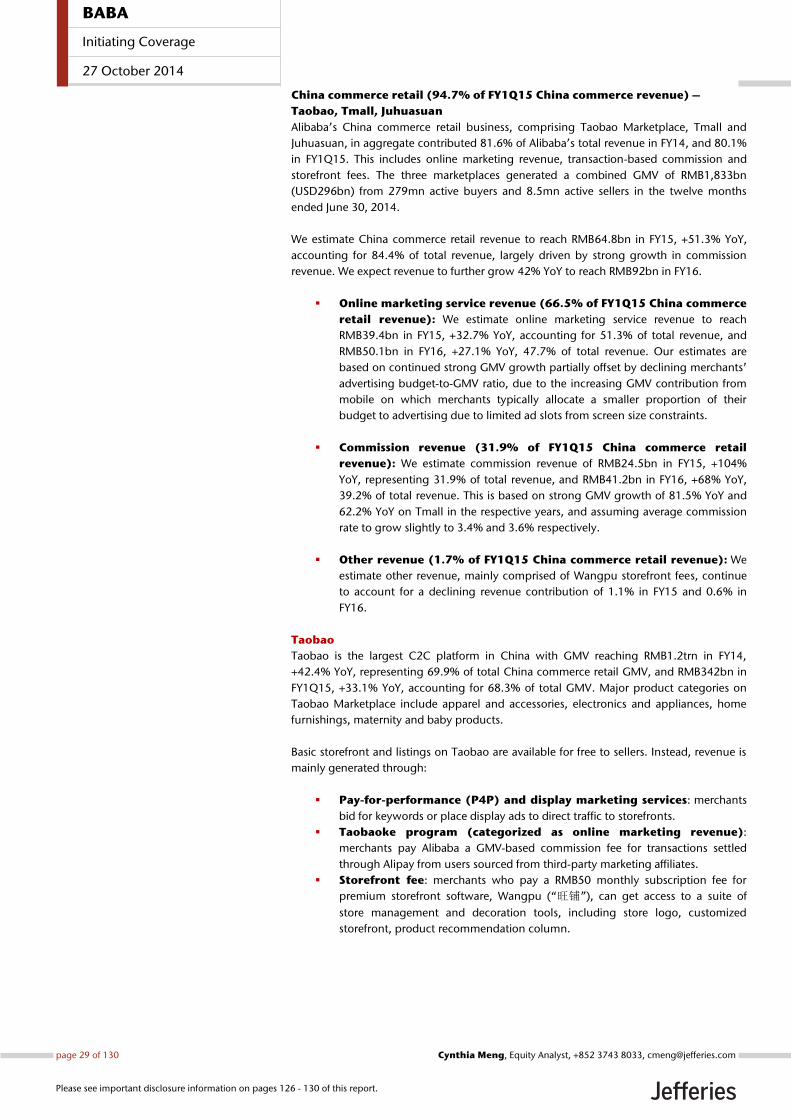
Alibaba’s business model can be illustrated as follows:
China commerce business (84.6% of FY1Q15 revenue)
o Retail (80.1% of FY1Q15 revenue)
Taobao – largest C2C platform in China
Tmall – largest B2C platform in China
Juhuasuan – a leading group buy marketplace in China
o Wholesale (4.5% of FY1Q15 revenue)
1688.com – largest domestic B2B platform in China
International commerce business (9.3% of FY1Q15 revenue)
o Retail (2.3% of FY1Q15 revenue)
AliExpress
o Wholesale (7% of FY1Q15 revenue)
Alibaba.com
Cloud computing and Internet infrastructure (1.5% of FY1Q15 revenue)
Others - mainly from micro loan interest income (4.6% of FY1Q15 revenue)
Chart 28: Alibaba’s revenue mix in FY1Q15
Source: Company data, Jefferies
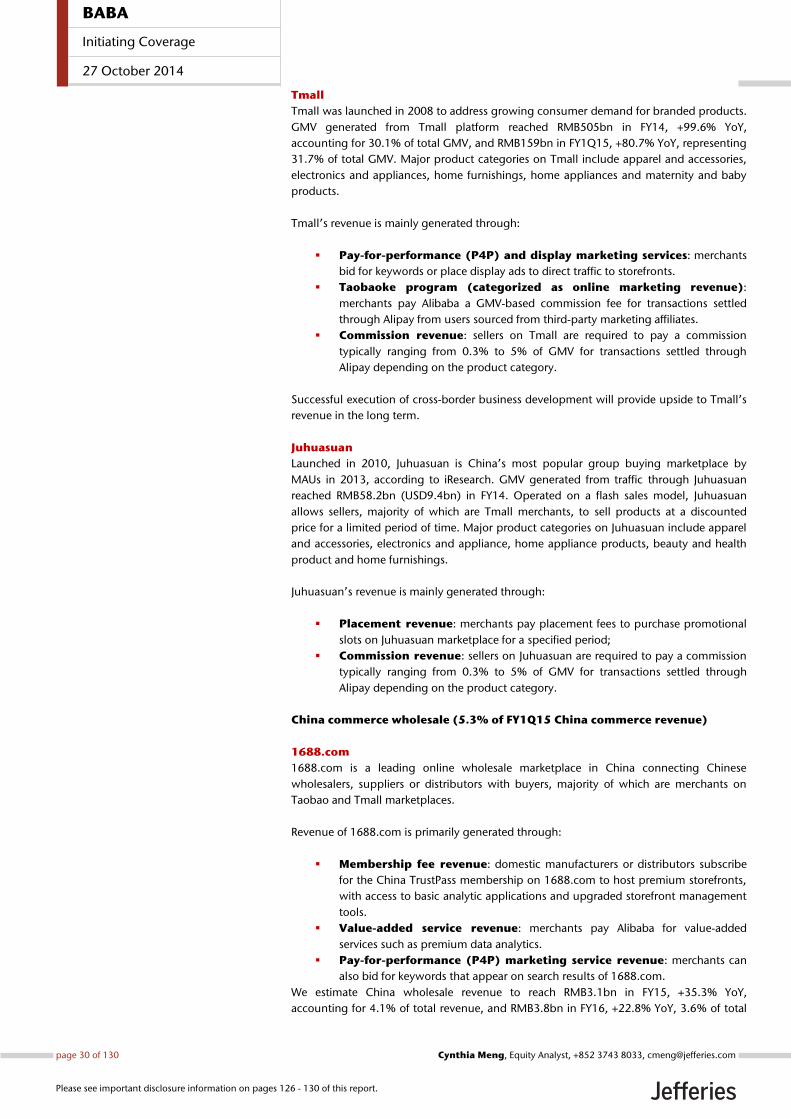
Chart 29: Alibaba’s China commerce revenue mix in
FY1Q15
Source: Company data, Jefferies
Note: Retail marketing includes Tmall, Taobao and Juhuasuan; retail
commission includes Tmall and Juhuasuan
Chart 30: Alibaba’s international commerce revenue mix in
FY1Q15
Source: Company data, Jefferies
Note: Wholesale refers to Alibaba.com; retail refers to AliExpress
China and international commerce
accounted for 84.6% and 9.3% of
Alibaba’s FY1Q15 revenue
respectively, with the remaining
contributed by cloud computing,
Internet infrastructure and others
(mainly interest income from micro
loans).
BABA
Initiating Coverage
27 October 2014
page 28 of 130 , Equity Analyst, +852 3743 8033, [email protected] Meng
Please see important disclosure information on pages 126 - 130 of this report.
China commerce retail (94.7% of FY1Q15 China commerce revenue) –
Taobao, Tmall, Juhuasuan
Alibaba’s China commerce retail business, comprising Taobao Marketplace, Tmall and
Juhuasuan, in aggregate contributed 81.6% of Alibaba’s total revenue in FY14, and 80.1%
in FY1Q15. This includes online marketing revenue, transaction-based commission and
storefront fees. The three marketplaces generated a combined GMV of RMB1,833bn
(USD296bn) from 279mn active buyers and 8.5mn active sellers in the twelve months
ended June 30, 2014.
We estimate China commerce retail revenue to reach RMB64.8bn in FY15, +51.3% YoY,
accounting for 84.4% of total revenue, largely driven by strong growth in commission
revenue. We expect revenue to further grow 42% YoY to reach RMB92bn in FY16.
Online marketing service revenue (66.5% of FY1Q15 China commerce
retail revenue): We estimate online marketing service revenue to reach
RMB39.4bn in FY15, +32.7% YoY, accounting for 51.3% of total revenue, and
RMB50.1bn in FY16, +27.1% YoY, 47.7% of total revenue. Our estimates are
based on continued strong GMV growth partially offset by declining merchants’
advertising budget-to-GMV ratio, due to the increasing GMV contribution from
mobile on which merchants typically allocate a smaller proportion of their
budget to advertising due to limited ad slots from screen size constraints.
Commission revenue (31.9% of FY1Q15 China commerce retail
revenue): We estimate commission revenue of RMB24.5bn in FY15, +104%
YoY, representing 31.9% of total revenue, and RMB41.2bn in FY16, +68% YoY,
39.2% of total revenue. This is based on strong GMV growth of 81.5% YoY and
62.2% YoY on Tmall in the respective years, and assuming average commission
rate to grow slightly to 3.4% and 3.6% respectively.
Other revenue (1.7% of FY1Q15 China commerce retail revenue): We
estimate other revenue, mainly comprised of Wangpu storefront fees, continue
to account for a declining revenue contribution of 1.1% in FY15 and 0.6% in
FY16.
Taobao
Taobao is the largest C2C platform in China with GMV reaching RMB1.2trn in FY14,
+42.4% YoY, representing 69.9% of total China commerce retail GMV, and RMB342bn in
FY1Q15, +33.1% YoY, accounting for 68.3% of total GMV. Major product categories on
Taobao Marketplace include apparel and accessories, electronics and appliances, home
furnishings, maternity and baby products.
Basic storefront and listings on Taobao are available for free to sellers. Instead, revenue is
mainly generated through:
Pay-for-performance (P4P) and display marketing services: merchants
bid for keywords or place display ads to direct traffic to storefronts.
Taobaoke program (categorized as online marketing revenue):
merchants pay Alibaba a GMV-based commission fee for transactions settled
through Alipay from users sourced from third-party marketing affiliates.
Storefront fee: merchants who pay a RMB50 monthly subscription fee for
premium storefront software, Wangpu (“旺铺”), can get access to a suite of
store management and decoration tools, including store logo, customized
storefront, product recommendation column.
BABA
Initiating Coverage
27 October 2014
page 29 of 130 , Equity Analyst, +852 3743 8033, [email protected] Meng
Please see important disclosure information on pages 126 - 130 of this report.
Tmall
Tmall was launched in 2008 to address growing consumer demand for branded products.
GMV generated from Tmall platform reached RMB505bn in FY14, +99.6% YoY,
accounting for 30.1% of total GMV, and RMB159bn in FY1Q15, +80.7% YoY, representing
31.7% of total GMV. Major product categories on Tmall include apparel and accessories,
electronics and appliances, home furnishings, home appliances and maternity and baby
products.
Tmall’s revenue is mainly generated through:
Pay-for-performance (P4P) and display marketing services: merchants
bid for keywords or place display ads to direct traffic to storefronts.
Taobaoke program (categorized as online marketing revenue):
merchants pay Alibaba a GMV-based commission fee for transactions settled
through Alipay from users sourced from third-party marketing affiliates.
Commission revenue: sellers on Tmall are required to pay a commission
typically ranging from 0.3% to 5% of GMV for transactions settled through
Alipay depending on the product category.
Successful execution of cross-border business development will provide upside to Tmall’s
revenue in the long term.
Juhuasuan
Launched in 2010, Juhuasuan is China’s most popular group buying marketplace by
MAUs in 2013, according to iResearch. GMV generated from traffic through Juhuasuan
reached RMB58.2bn (USD9.4bn) in FY14. Operated on a flash sales model, Juhuasuan
allows sellers, majority of which are Tmall merchants, to sell products at a discounted
price for a limited period of time. Major product categories on Juhuasuan include apparel
and accessories, electronics and appliance, home appliance products, beauty and health
product and home furnishings.
Juhuasuan’s revenue is mainly generated through:
Placement revenue: merchants pay placement fees to purchase promotional
slots on Juhuasuan marketplace for a specified period;
Commission revenue: sellers on Juhuasuan are required to pay a commission
typically ranging from 0.3% to 5% of GMV for transactions settled through
Alipay depending on the product category.
China commerce wholesale (5.3% of FY1Q15 China commerce revenue)
1688.com
1688.com is a leading online wholesale marketplace in China connecting Chinese
wholesalers, suppliers or distributors with buyers, majority of which are merchants on
Taobao and Tmall marketplaces.
Revenue of 1688.com is primarily generated through:
Membership fee revenue: domestic manufacturers or distributors subscribe
for the China TrustPass membership on 1688.com to host premium storefronts,
with access to basic analytic applications and upgraded storefront management
tools.
Value-added service revenue: merchants pay Alibaba for value-added
services such as premium data analytics.
Pay-for-performance (P4P) marketing service revenue: merchants can
also bid for keywords that appear on search results of 1688.com.
We estimate China wholesale revenue to reach RMB3.1bn in FY15, +35.3% YoY,
accounting for 4.1% of total revenue, and RMB3.8bn in FY16, +22.8% YoY, 3.6% of total
BABA
Initiating Coverage
27 October 2014
page 30 of 130 , Equity Analyst, +852 3743 8033, [email protected] Meng
Please see important disclosure information on pages 126 - 130 of this report.
revenue. This is mainly supported by solid growth of marketing revenue as well as paying
members subscribing to China TrustPass.
International commerce wholesale (75.6% of FY1Q15 international
commerce revenue)
Alibaba.com (international B2B)
Launched in 1999, Alibaba.com is the first online commerce platform and China’s largest
global online wholesale marketplace by revenue in 2013, according to iResearch. Sellers
on Alibaba.com are typically manufacturers and distributors based in China and other
manufacturing countries such as India, Pakistan, the US and Japan. Buyers are generally
SMEs engaged in the import and export business, trade agents, and wholesalers, retailers
and manufacturing companies.
Revenue of Alibaba.com is primarily generated through:
Membership fee revenue: global manufacturers or distributors subscribe for
the Gold Supplier membership on Alibaba.com to host premium storefronts,
with product listings on the marketplace.
Value-added service revenue: merchants pay Alibaba a value-added service
fee for import/export business solutions such as product showcase, custom
clearance and value-added tax refund.
Pay-for-performance (P4P) marketing service revenue: merchants can
also bid for keywords that appear on search results of Alibaba.com.
We estimate international wholesale revenue to reach RMB4.7bn in FY15, +20.5% YoY,
representing 6.1% of total revenue, mainly supported by growth in number of paying
members.
International commerce retail (24.4% of FY1Q15 international commerce
revenue)
AliExpress
Launched in 2010, AliExpress is a global consumer marketplace that allows Chinese
manufacturers and exporters to reach overseas consumers, including Russia, Eastern
Europe and South America.
Revenue of AliExpress is primarily generated through:
Commission revenue: sellers on AliExpress are required to pay a 5%
commission fee based on GMV settled through Alipay.
Third-party marketing affiliate program: merchants pay Alibaba a fee in
addition to the 5% commission for transactions settled through Alipay from
users sourced from third-party marketing affiliates.
We estimate international retail revenue to reach RMB1.8bn in FY15, +96.9% YoY,
representing 2.4% of total revenue, driven by solid growth in both commission and
marketing revenue, assuming a stable commission rate of 5%.
BABA
Initiating Coverage
27 October 2014
page 31 of 130 , Equity Analyst, +852 3743 8033, [email protected] Meng
Please see important disclosure information on pages 126 - 130 of this report.
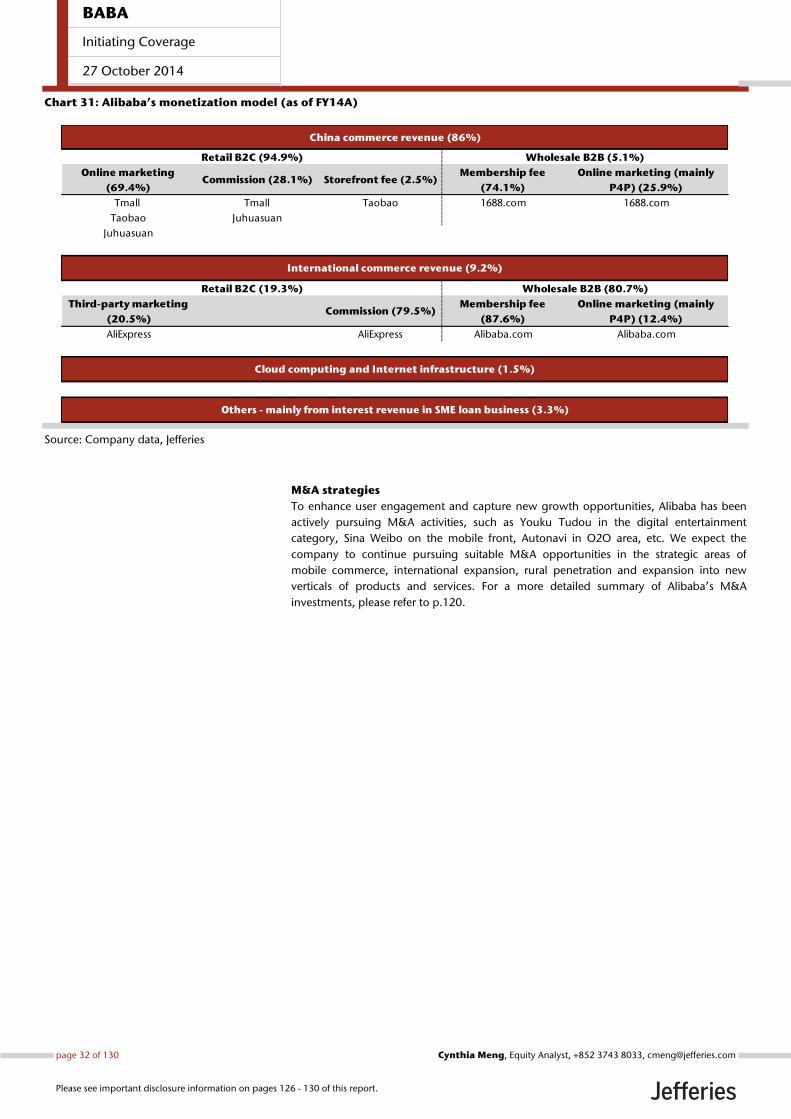
Chart 31: Alibaba’s monetization model (as of FY14A)
Source: Company data, Jefferies
M&A strategies
To enhance user engagement and capture new growth opportunities, Alibaba has been
actively pursuing M&A activities, such as Youku Tudou in the digital entertainment
category, Sina Weibo on the mobile front, Autonavi in O2O area, etc. We expect the
company to continue pursuing suitable M&A opportunities in the strategic areas of
mobile commerce, international expansion, rural penetration and expansion into new
verticals of products and services. For a more detailed summary of Alibaba’s M&A
investments, please refer to p.120.
Online marketing
(69.4%)Commission (28.1%) Storefront fee (2.5%)
Membership fee
(74.1%)
Online marketing (mainly
P4P) (25.9%)
Tmall Tmall Taobao 1688.com 1688.com
Taobao Juhuasuan
Juhuasuan
Third-party marketing
(20.5%)Commission (79.5%)
Membership fee
(87.6%)
Online marketing (mainly
P4P) (12.4%)
AliExpress AliExpress Alibaba.com Alibaba.com
Retail B2C (94.9%) Wholesale B2B (5.1%)
China commerce revenue (86%)
International commerce revenue (9.2%)
Retail B2C (19.3%) Wholesale B2B (80.7%)
Cloud computing and Internet infrastructure (1.5%)
Others - mainly from interest revenue in SME loan business (3.3%)
BABA
Initiating Coverage
27 October 2014
page 32 of 130 , Equity Analyst, +852 3743 8033, [email protected] Meng
Please see important disclosure information on pages 126 - 130 of this report.
A Strong Self-reinforcing Network Effect Alibaba, the largest e-Commerce ecosystem in China, has an overall online shopping (B2C
+ C2C) market share of 80.7% in 1H14, according to iResearch. Consumers, merchants
and third-party service providers, including marketing affiliates and logistics partners,
participate in Alibaba’s huge ecosystem to buy products, source materials and do
business, hence creating a strong self-reinforcing network effect.
Alibaba mainly monetizes through online marketing and commission revenue from its
three China commerce retail marketplaces including Taobao, Tmall and Juhuasuan, which
in aggregate accounted for 82% of FY14 revenue, and 80% of FY1Q15 revenue. We
currently estimate China commerce retail revenue to reach RMB64.8bn in FY15, +51.3%
YoY, accounting for 84.4% of total revenue, largely driven by strong growth in
commission revenue. We expect revenue to further grow 42% YoY to reach RMB92bn in
FY16.
In this section, we discuss the following:
1. We expect to see increasing GMV contribution from Tmall, the leading B2C
player in China with 57.3% market share in 2Q14, given rising consumer
demand for product quality, after-sales services and increasing promotional
efforts by brands. Higher priority of Tmall products over Taobao in search result
listing, regardless of initial login site, also helps increase Tmall merchants’
exposure among consumers. We see the increasing GMV contribution from
Tmall as positive for driving continuous revenue growth and PC monetization
rate given that merchants have to pay transaction-based commission in addition
to online marketing fees.
2. Taobao’s C2C model allows individuals and small enterprises, particularly in
lower tier cities, to offer a wide diversity of competitively priced products
through their online stores, hence generating huge user traffic and high user
stickiness. Alibaba recently announced a rural expansion plan to meet the
underserved demand in rural areas which only accounted for 8.3% of Taobao
GMV in 2Q14.
3. Juhuasuan, the largest online group buying marketplace in China, will shift
towards a high-end brand-focused flash sales model. We believe successful
execution of the flash sales business will depend on Juhuasuan’s ability in
bringing aboard well-known brands and monitoring product quality.
4. 1688.com, Alibaba’s leading domestic B2B platform, serves as a wholesale
sourcing channel for Taobao and Tmall merchants and hence, drives synergies
across its wholesale and retail marketplaces.
5. Alimama, Alibaba’s proprietary online marketing platform, offers pay-for-
performance (P4P) marketing, display advertising and Taobaoke program
(display ads on third-party affiliate partners’ websites) through the Taobao Ad
Network and Exchange (TANX). We expect advertising revenue growth to
moderate given increasing GMV contribution from mobile on which merchants
typically allocate a smaller proportion of their budget to advertising due to
limited ad slots given screen size constraints. Enhancing mobile-based marketing
products will help narrow the CPC gap between PC and mobile over time.
BABA
Initiating Coverage
27 October 2014
page 33 of 130 , Equity Analyst, +852 3743 8033, [email protected] Meng
Please see important disclosure information on pages 126 - 130 of this report.
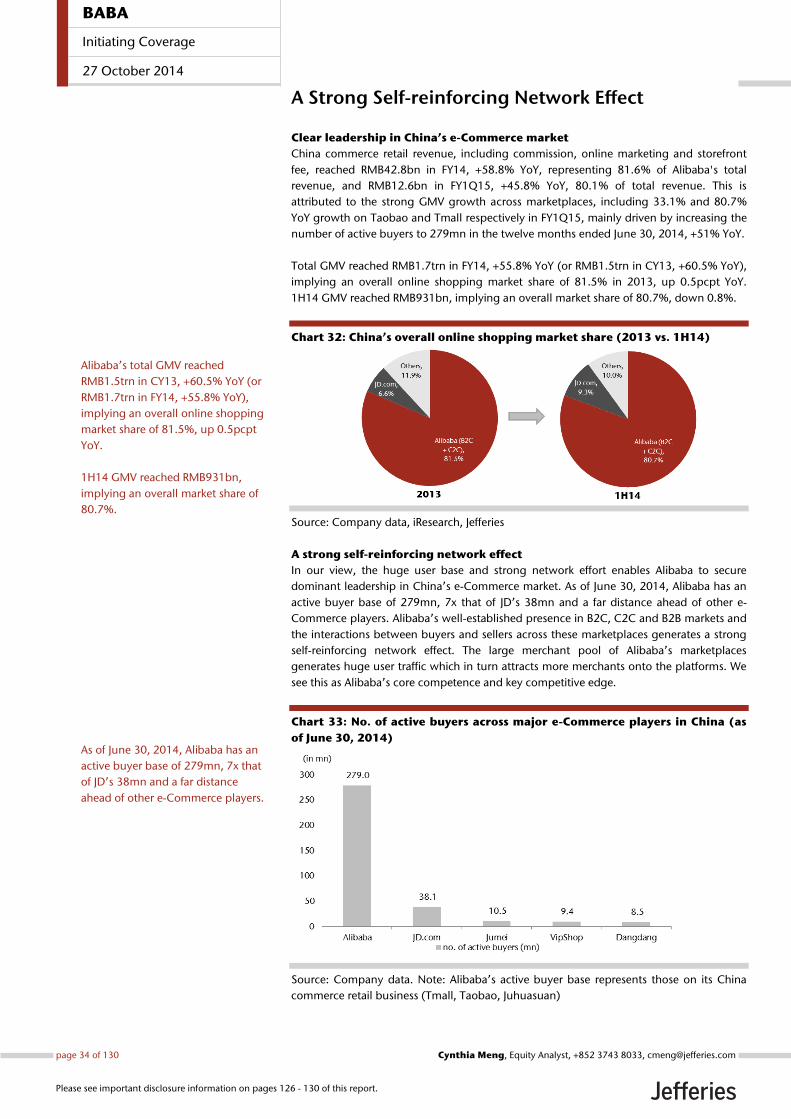
A Strong Self-reinforcing Network Effect
Clear leadership in China’s e-Commerce market
China commerce retail revenue, including commission, online marketing and storefront
fee, reached RMB42.8bn in FY14, +58.8% YoY, representing 81.6% of Alibaba's total
revenue, and RMB12.6bn in FY1Q15, +45.8% YoY, 80.1% of total revenue. This is
attributed to the strong GMV growth across marketplaces, including 33.1% and 80.7%
YoY growth on Taobao and Tmall respectively in FY1Q15, mainly driven by increasing the
number of active buyers to 279mn in the twelve months ended June 30, 2014, +51% YoY.
Total GMV reached RMB1.7trn in FY14, +55.8% YoY (or RMB1.5trn in CY13, +60.5% YoY),
implying an overall online shopping market share of 81.5% in 2013, up 0.5pcpt YoY.
1H14 GMV reached RMB931bn, implying an overall market share of 80.7%, down 0.8%.
Chart 32: China’s overall online shopping market share (2013 vs. 1H14)
Source: Company data, iResearch, Jefferies
A strong self-reinforcing network effect
In our view, the huge user base and strong network effort enables Alibaba to secure
dominant leadership in China’s e-Commerce market. As of June 30, 2014, Alibaba has an
active buyer base of 279mn, 7x that of JD’s 38mn and a far distance ahead of other e-
Commerce players. Alibaba’s well-established presence in B2C, C2C and B2B markets and
the interactions between buyers and sellers across these marketplaces generates a strong
self-reinforcing network effect. The large merchant pool of Alibaba’s marketplaces
generates huge user traffic which in turn attracts more merchants onto the platforms. We
see this as Alibaba’s core competence and key competitive edge.
Chart 33: No. of active buyers across major e-Commerce players in China (as
of June 30, 2014)
Source: Company data. Note: Alibaba’s active buyer base represents those on its China
commerce retail business (Tmall, Taobao, Juhuasuan)
Alibaba’s total GMV reached
RMB1.5trn in CY13, +60.5% YoY (or
RMB1.7trn in FY14, +55.8% YoY),
implying an overall online shopping
market share of 81.5%, up 0.5pcpt
YoY.
1H14 GMV reached RMB931bn,
implying an overall market share of
80.7%.
As of June 30, 2014, Alibaba has an
active buyer base of 279mn, 7x that
of JD’s 38mn and a far distance
ahead of other e-Commerce players.
BABA
Initiating Coverage
27 October 2014
page 34 of 130 , Equity Analyst, +852 3743 8033, [email protected] Meng
Please see important disclosure information on pages 126 - 130 of this report.
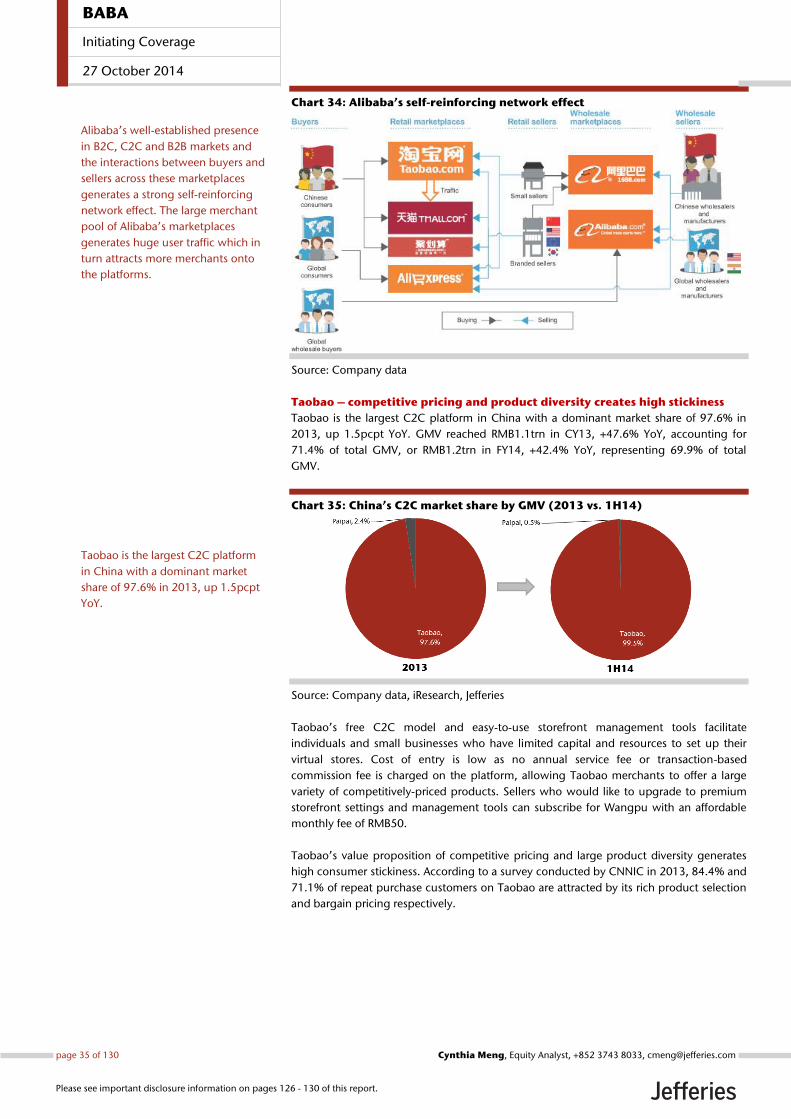
Chart 34: Alibaba’s self-reinforcing network effect
Source: Company data
Taobao – competitive pricing and product diversity creates high stickiness
Taobao is the largest C2C platform in China with a dominant market share of 97.6% in
2013, up 1.5pcpt YoY. GMV reached RMB1.1trn in CY13, +47.6% YoY, accounting for
71.4% of total GMV, or RMB1.2trn in FY14, +42.4% YoY, representing 69.9% of total
GMV.
Chart 35: China’s C2C market share by GMV (2013 vs. 1H14)
Source: Company data, iResearch, Jefferies
Taobao’s free C2C model and easy-to-use storefront management tools facilitate
individuals and small businesses who have limited capital and resources to set up their
virtual stores. Cost of entry is low as no annual service fee or transaction-based
commission fee is charged on the platform, allowing Taobao merchants to offer a large
variety of competitively-priced products. Sellers who would like to upgrade to premium
storefront settings and management tools can subscribe for Wangpu with an affordable
monthly fee of RMB50.
Taobao’s value proposition of competitive pricing and large product diversity generates
high consumer stickiness. According to a survey conducted by CNNIC in 2013, 84.4% and
71.1% of repeat purchase customers on Taobao are attracted by its rich product selection
and bargain pricing respectively.
Taobao is the largest C2C platform
in China with a dominant market
share of 97.6% in 2013, up 1.5pcpt
YoY.
Alibaba’s well-established presence
in B2C, C2C and B2B markets and
the interactions between buyers and
sellers across these marketplaces
generates a strong self-reinforcing
network effect. The large merchant
pool of Alibaba’s marketplaces
generates huge user traffic which in
turn attracts more merchants onto
the platforms.
BABA
Initiating Coverage
27 October 2014
page 35 of 130 , Equity Analyst, +852 3743 8033, [email protected] Meng
Please see important disclosure information on pages 126 - 130 of this report.
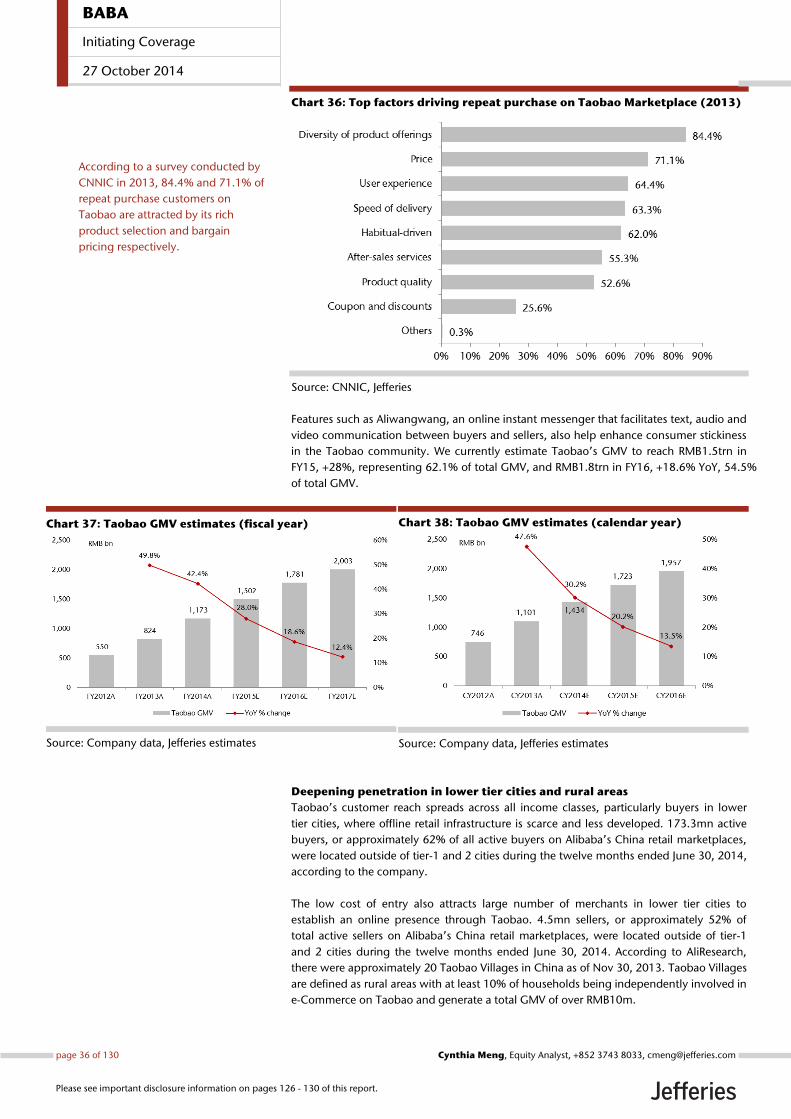
Chart 36: Top factors driving repeat purchase on Taobao Marketplace (2013)
Source: CNNIC, Jefferies
Features such as Aliwangwang, an online instant messenger that facilitates text, audio and
video communication between buyers and sellers, also help enhance consumer stickiness
in the Taobao community. We currently estimate Taobao’s GMV to reach RMB1.5trn in
FY15, +28%, representing 62.1% of total GMV, and RMB1.8trn in FY16, +18.6% YoY, 54.5%
of total GMV.
Chart 37: Taobao GMV estimates (fiscal year)
Source: Company data, Jefferies estimates
Chart 38: Taobao GMV estimates (calendar year)
Source: Company data, Jefferies estimates
Deepening penetration in lower tier cities and rural areas
Taobao’s customer reach spreads across all income classes, particularly buyers in lower
tier cities, where offline retail infrastructure is scarce and less developed. 173.3mn active
buyers, or approximately 62% of all active buyers on Alibaba’s China retail marketplaces,
were located outside of tier-1 and 2 cities during the twelve months ended June 30, 2014,
according to the company.
The low cost of entry also attracts large number of merchants in lower tier cities to
establish an online presence through Taobao. 4.5mn sellers, or approximately 52% of
total active sellers on Alibaba’s China retail marketplaces, were located outside of tier-1
and 2 cities during the twelve months ended June 30, 2014. According to AliResearch,
there were approximately 20 Taobao Villages in China as of Nov 30, 2013. Taobao Villages
are defined as rural areas with at least 10% of households being independently involved in
e-Commerce on Taobao and generate a total GMV of over RMB10m.
According to a survey conducted by
CNNIC in 2013, 84.4% and 71.1% of
repeat purchase customers on
Taobao are attracted by its rich
product selection and bargain
pricing respectively.
BABA
Initiating Coverage
27 October 2014
page 36 of 130 , Equity Analyst, +852 3743 8033, [email protected] Meng
Please see important disclosure information on pages 126 - 130 of this report.
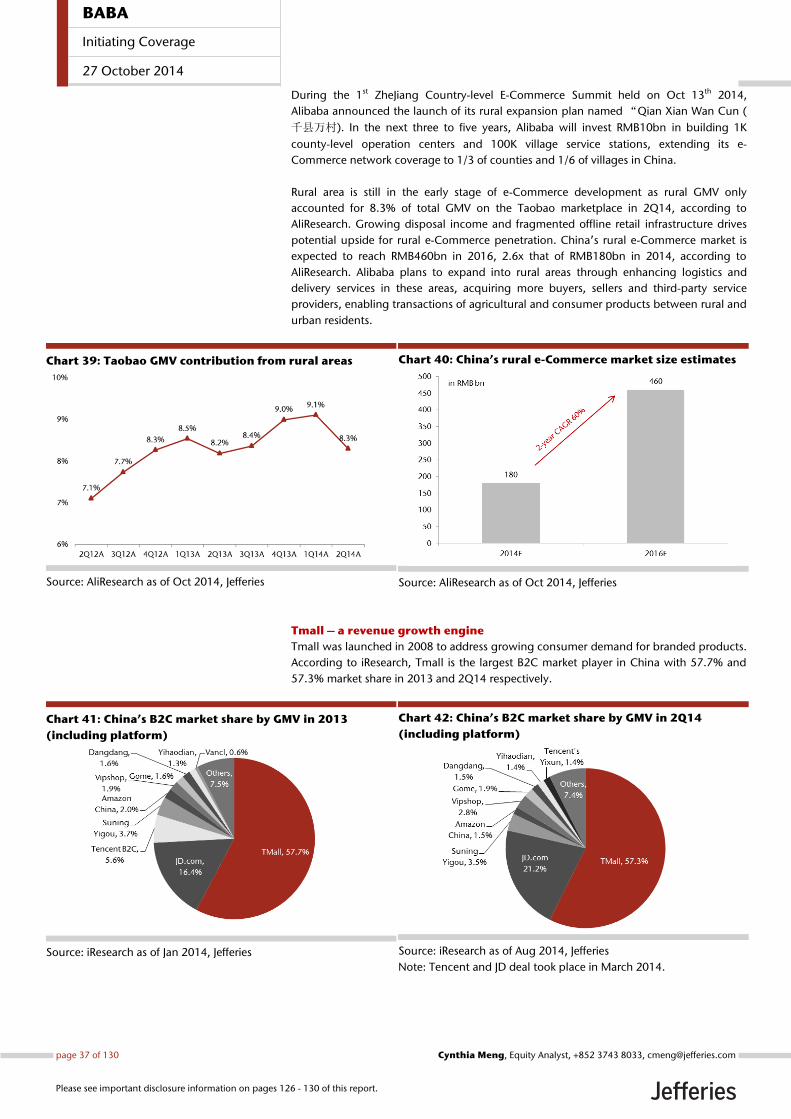
During the 1st ZheJiang Country-level E-Commerce Summit held on Oct 13th 2014,
Alibaba announced the launch of its rural expansion plan named “Qian Xian Wan Cun (
千县万村). In the next three to five years, Alibaba will invest RMB10bn in building 1K
county-level operation centers and 100K village service stations, extending its e-
Commerce network coverage to 1/3 of counties and 1/6 of villages in China.
Rural area is still in the early stage of e-Commerce development as rural GMV only
accounted for 8.3% of total GMV on the Taobao marketplace in 2Q14, according to
AliResearch. Growing disposal income and fragmented offline retail infrastructure drives
potential upside for rural e-Commerce penetration. China’s rural e-Commerce market is
expected to reach RMB460bn in 2016, 2.6x that of RMB180bn in 2014, according to
AliResearch. Alibaba plans to expand into rural areas through enhancing logistics and
delivery services in these areas, acquiring more buyers, sellers and third-party service
providers, enabling transactions of agricultural and consumer products between rural and
urban residents.
Chart 39: Taobao GMV contribution from rural areas
Source: AliResearch as of Oct 2014, Jefferies
Chart 40: China’s rural e-Commerce market size estimates
Source: AliResearch as of Oct 2014, Jefferies
Tmall – a revenue growth engine
Tmall was launched in 2008 to address growing consumer demand for branded products.
According to iResearch, Tmall is the largest B2C market player in China with 57.7% and
57.3% market share in 2013 and 2Q14 respectively.
Chart 41: China’s B2C market share by GMV in 2013
(including platform)
Source: iResearch as of Jan 2014, Jefferies
Chart 42: China’s B2C market share by GMV in 2Q14
(including platform)
Source: iResearch as of Aug 2014, Jefferies
Note: Tencent and JD deal took place in March 2014.
BABA
Initiating Coverage
27 October 2014
page 37 of 130 , Equity Analyst, +852 3743 8033, [email protected] Meng
Please see important disclosure information on pages 126 - 130 of this report.
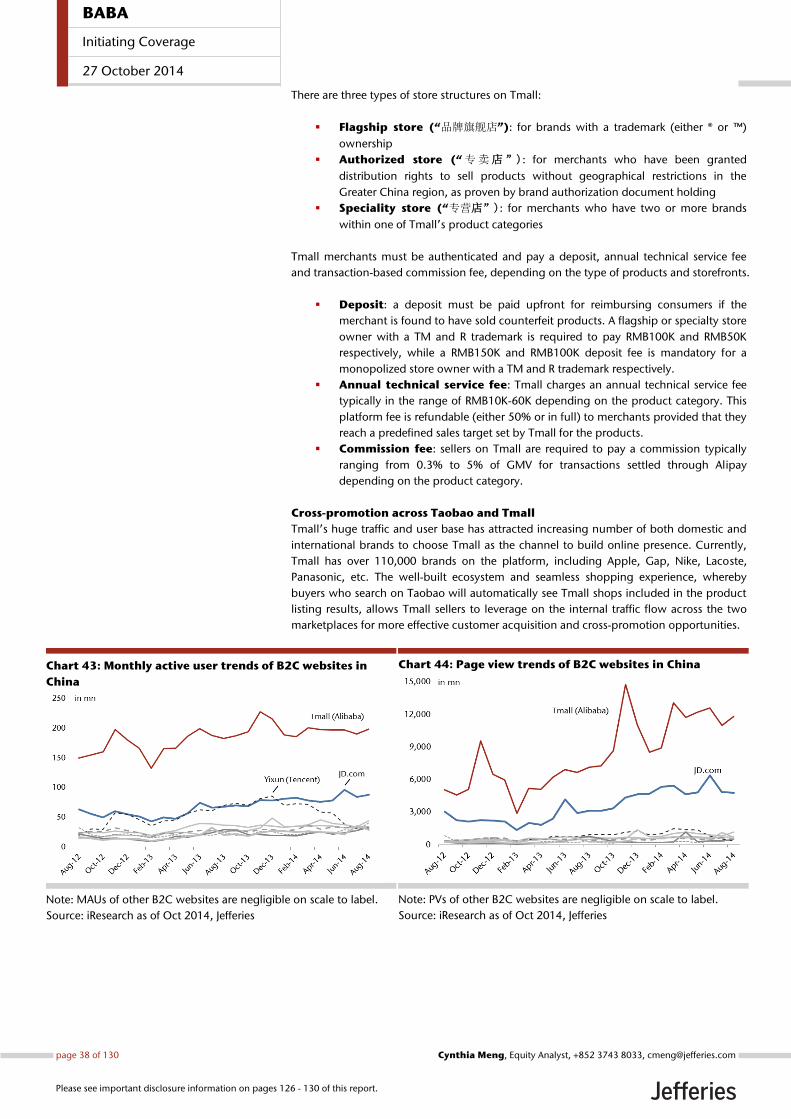
There are three types of store structures on Tmall:
Flagship store (“品牌旗舰店”): for brands with a trademark (either ® or ™)
ownership
Authorized store (“专卖店”): for merchants who have been granted
distribution rights to sell products without geographical restrictions in the
Greater China region, as proven by brand authorization document holding
Speciality store (“专营店”): for merchants who have two or more brands
within one of Tmall’s product categories
Tmall merchants must be authenticated and pay a deposit, annual technical service fee
and transaction-based commission fee, depending on the type of products and storefronts.
Deposit: a deposit must be paid upfront for reimbursing consumers if the
merchant is found to have sold counterfeit products. A flagship or specialty store
owner with a TM and R trademark is required to pay RMB100K and RMB50K
respectively, while a RMB150K and RMB100K deposit fee is mandatory for a
monopolized store owner with a TM and R trademark respectively.
Annual technical service fee: Tmall charges an annual technical service fee
typically in the range of RMB10K-60K depending on the product category. This
platform fee is refundable (either 50% or in full) to merchants provided that they
reach a predefined sales target set by Tmall for the products.
Commission fee: sellers on Tmall are required to pay a commission typically
ranging from 0.3% to 5% of GMV for transactions settled through Alipay
depending on the product category.
Cross-promotion across Taobao and Tmall
Tmall’s huge traffic and user base has attracted increasing number of both domestic and
international brands to choose Tmall as the channel to build online presence. Currently,
Tmall has over 110,000 brands on the platform, including Apple, Gap, Nike, Lacoste,
Panasonic, etc. The well-built ecosystem and seamless shopping experience, whereby
buyers who search on Taobao will automatically see Tmall shops included in the product
listing results, allows Tmall sellers to leverage on the internal traffic flow across the two
marketplaces for more effective customer acquisition and cross-promotion opportunities.
Chart 43: Monthly active user trends of B2C websites in
China
Note: MAUs of other B2C websites are negligible on scale to label.
Source: iResearch as of Oct 2014, Jefferies
Chart 44: Page view trends of B2C websites in China
Note: PVs of other B2C websites are negligible on scale to label.
Source: iResearch as of Oct 2014, Jefferies
BABA
Initiating Coverage
27 October 2014
page 38 of 130 , Equity Analyst, +852 3743 8033, [email protected] Meng
Please see important disclosure information on pages 126 - 130 of this report.
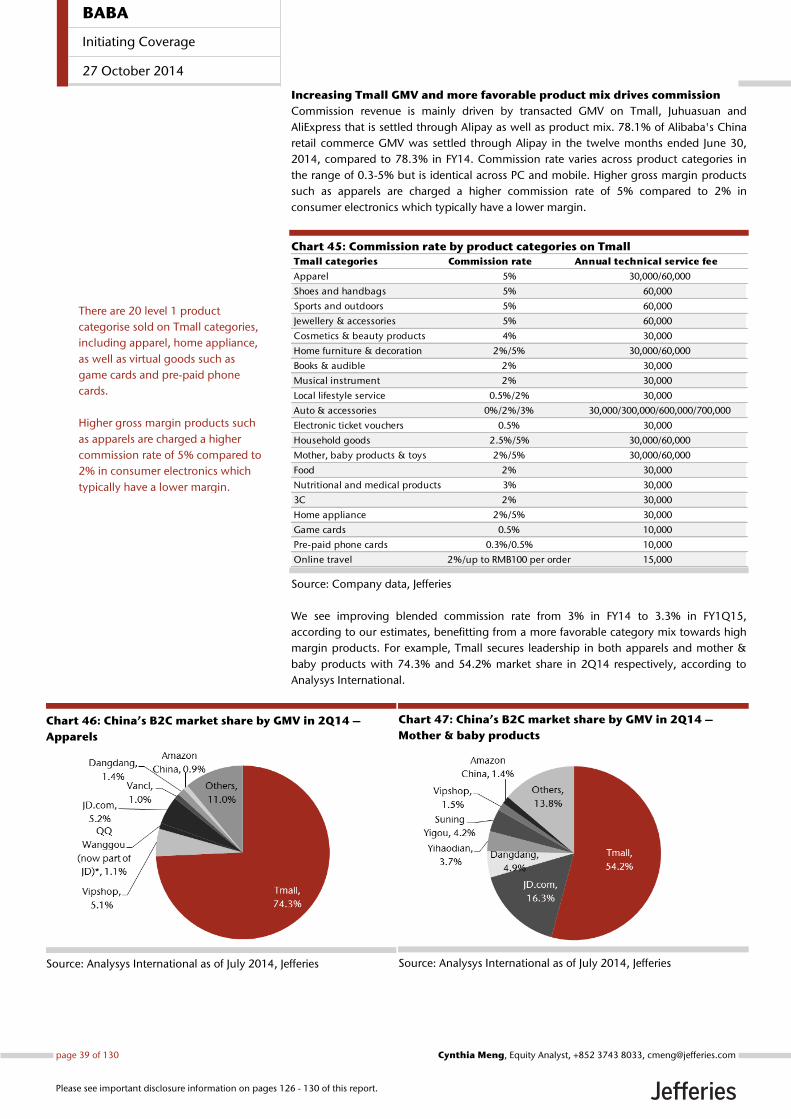
Increasing Tmall GMV and more favorable product mix drives commission
Commission revenue is mainly driven by transacted GMV on Tmall, Juhuasuan and
AliExpress that is settled through Alipay as well as product mix. 78.1% of Alibaba's China
retail commerce GMV was settled through Alipay in the twelve months ended June 30,
2014, compared to 78.3% in FY14. Commission rate varies across product categories in
the range of 0.3-5% but is identical across PC and mobile. Higher gross margin products
such as apparels are charged a higher commission rate of 5% compared to 2% in
consumer electronics which typically have a lower margin.
Chart 45: Commission rate by product categories on Tmall
Source: Company data, Jefferies
We see improving blended commission rate from 3% in FY14 to 3.3% in FY1Q15,
according to our estimates, benefitting from a more favorable category mix towards high
margin products. For example, Tmall secures leadership in both apparels and mother &
baby products with 74.3% and 54.2% market share in 2Q14 respectively, according to
Analysys International.
Chart 46: China’s B2C market share by GMV in 2Q14 –
Apparels
Source: Analysys International as of July 2014, Jefferies
Chart 47: China’s B2C market share by GMV in 2Q14 –
Mother & baby products
Source: Analysys International as of July 2014, Jefferies
Tmall categories Commission rate Annual technical service fee
Apparel 5% 30,000/60,000
Shoes and handbags 5% 60,000
Sports and outdoors 5% 60,000
Jewellery & accessories 5% 60,000
Cosmetics & beauty products 4% 30,000
Home furniture & decoration 2%/5% 30,000/60,000
Books & audible 2% 30,000
Musical instrument 2% 30,000
Local lifestyle service 0.5%/2% 30,000
Auto & accessories 0%/2%/3% 30,000/300,000/600,000/700,000
Electronic ticket vouchers 0.5% 30,000
Household goods 2.5%/5% 30,000/60,000
Mother, baby products & toys 2%/5% 30,000/60,000
Food 2% 30,000
Nutritional and medical products 3% 30,000
3C 2% 30,000
Home appliance 2%/5% 30,000
Game cards 0.5% 10,000
Pre-paid phone cards 0.3%/0.5% 10,000
Online travel 2%/up to RMB100 per order 15,000
There are 20 level 1 product
categorise sold on Tmall categories,
including apparel, home appliance,
as well as virtual goods such as
game cards and pre-paid phone
cards.
Higher gross margin products such
as apparels are charged a higher
commission rate of 5% compared to
2% in consumer electronics which
typically have a lower margin.
BABA
Initiating Coverage
27 October 2014
page 39 of 130 , Equity Analyst, +852 3743 8033, [email protected] Meng
Please see important disclosure information on pages 126 - 130 of this report.
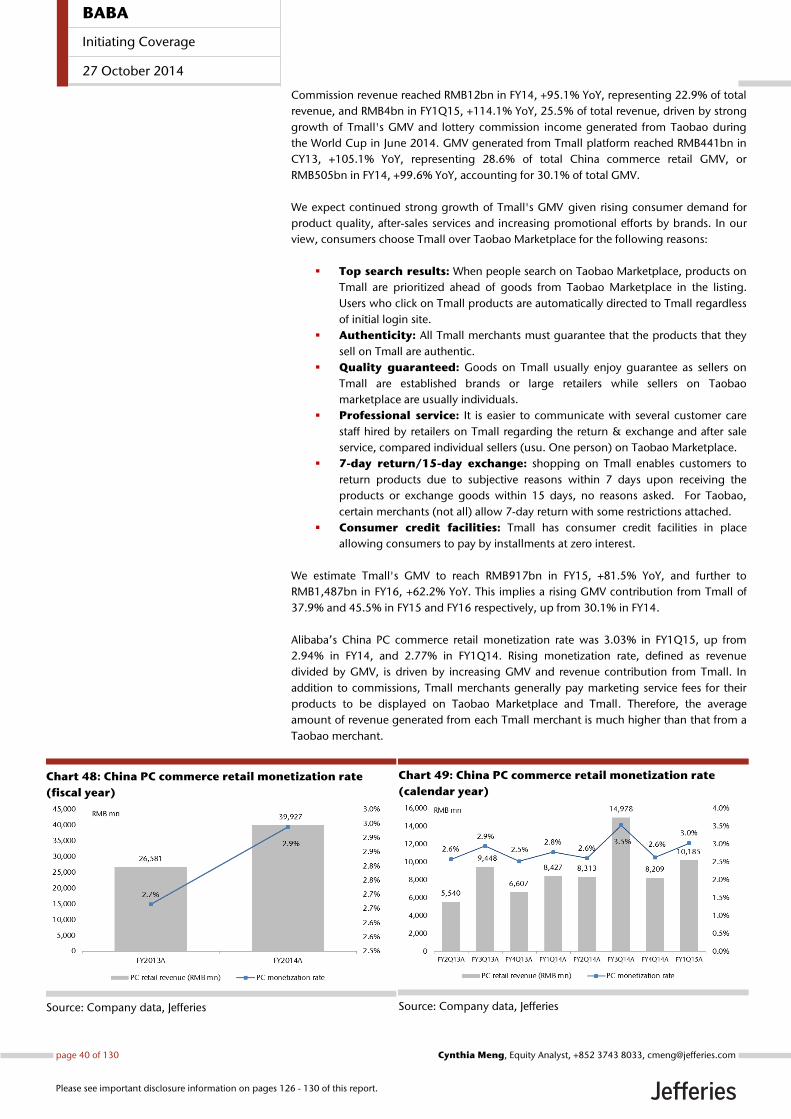
Commission revenue reached RMB12bn in FY14, +95.1% YoY, representing 22.9% of total
revenue, and RMB4bn in FY1Q15, +114.1% YoY, 25.5% of total revenue, driven by strong
growth of Tmall's GMV and lottery commission income generated from Taobao during
the World Cup in June 2014. GMV generated from Tmall platform reached RMB441bn in
CY13, +105.1% YoY, representing 28.6% of total China commerce retail GMV, or
RMB505bn in FY14, +99.6% YoY, accounting for 30.1% of total GMV.
We expect continued strong growth of Tmall's GMV given rising consumer demand for
product quality, after-sales services and increasing promotional efforts by brands. In our
view, consumers choose Tmall over Taobao Marketplace for the following reasons:
Top search results: When people search on Taobao Marketplace, products on
Tmall are prioritized ahead of goods from Taobao Marketplace in the listing.
Users who click on Tmall products are automatically directed to Tmall regardless
of initial login site.
Authenticity: All Tmall merchants must guarantee that the products that they
sell on Tmall are authentic.
Quality guaranteed: Goods on Tmall usually enjoy guarantee as sellers on
Tmall are established brands or large retailers while sellers on Taobao
marketplace are usually individuals.
Professional service: It is easier to communicate with several customer care
staff hired by retailers on Tmall regarding the return & exchange and after sale
service, compared individual sellers (usu. One person) on Taobao Marketplace.
7-day return/15-day exchange: shopping on Tmall enables customers to
return products due to subjective reasons within 7 days upon receiving the
products or exchange goods within 15 days, no reasons asked. For Taobao,
certain merchants (not all) allow 7-day return with some restrictions attached.
Consumer credit facilities: Tmall has consumer credit facilities in place
allowing consumers to pay by installments at zero interest.
We estimate Tmall's GMV to reach RMB917bn in FY15, +81.5% YoY, and further to
RMB1,487bn in FY16, +62.2% YoY. This implies a rising GMV contribution from Tmall of
37.9% and 45.5% in FY15 and FY16 respectively, up from 30.1% in FY14.
Alibaba’s China PC commerce retail monetization rate was 3.03% in FY1Q15, up from
2.94% in FY14, and 2.77% in FY1Q14. Rising monetization rate, defined as revenue
divided by GMV, is driven by increasing GMV and revenue contribution from Tmall. In
addition to commissions, Tmall merchants generally pay marketing service fees for their
products to be displayed on Taobao Marketplace and Tmall. Therefore, the average
amount of revenue generated from each Tmall merchant is much higher than that from a
Taobao merchant.
Chart 48: China PC commerce retail monetization rate
(fiscal year)
Source: Company data, Jefferies
Chart 49: China PC commerce retail monetization rate
(calendar year)
Source: Company data, Jefferies
BABA
Initiating Coverage
27 October 2014
page 40 of 130 , Equity Analyst, +852 3743 8033, [email protected] Meng
Please see important disclosure information on pages 126 - 130 of this report.
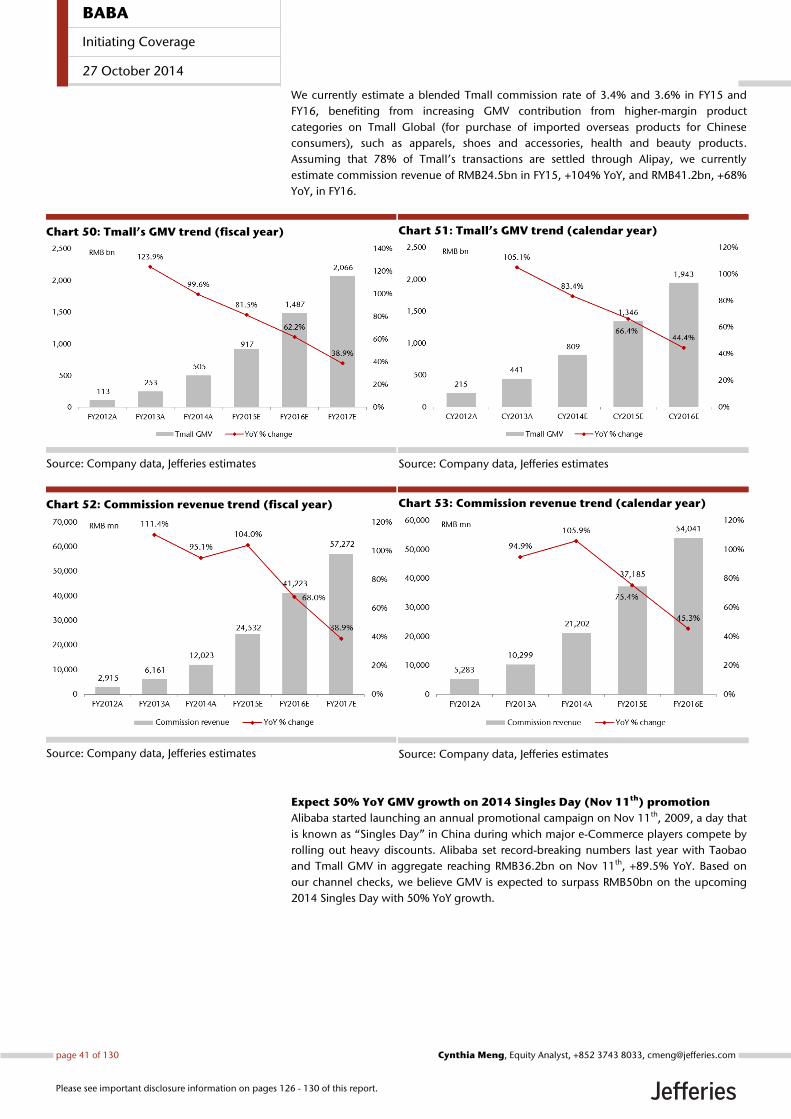
We currently estimate a blended Tmall commission rate of 3.4% and 3.6% in FY15 and
FY16, benefiting from increasing GMV contribution from higher-margin product
categories on Tmall Global (for purchase of imported overseas products for Chinese
consumers), such as apparels, shoes and accessories, health and beauty products.
Assuming that 78% of Tmall’s transactions are settled through Alipay, we currently
estimate commission revenue of RMB24.5bn in FY15, +104% YoY, and RMB41.2bn, +68%
YoY, in FY16.
Chart 50: Tmall’s GMV trend (fiscal year)
Source: Company data, Jefferies estimates
Chart 51: Tmall’s GMV trend (calendar year)
Source: Company data, Jefferies estimates
Chart 52: Commission revenue trend (fiscal year)
Source: Company data, Jefferies estimates
Chart 53: Commission revenue trend (calendar year)
Source: Company data, Jefferies estimates
Expect 50% YoY GMV growth on 2014 Singles Day (Nov 11th) promotion
Alibaba started launching an annual promotional campaign on Nov 11th, 2009, a day that
is known as “Singles Day” in China during which major e-Commerce players compete by
rolling out heavy discounts. Alibaba set record-breaking numbers last year with Taobao
and Tmall GMV in aggregate reaching RMB36.2bn on Nov 11th, +89.5% YoY. Based on
our channel checks, we believe GMV is expected to surpass RMB50bn on the upcoming
2014 Singles Day with 50% YoY growth.
BABA
Initiating Coverage
27 October 2014
page 41 of 130 , Equity Analyst, +852 3743 8033, [email protected] Meng
Please see important disclosure information on pages 126 - 130 of this report.
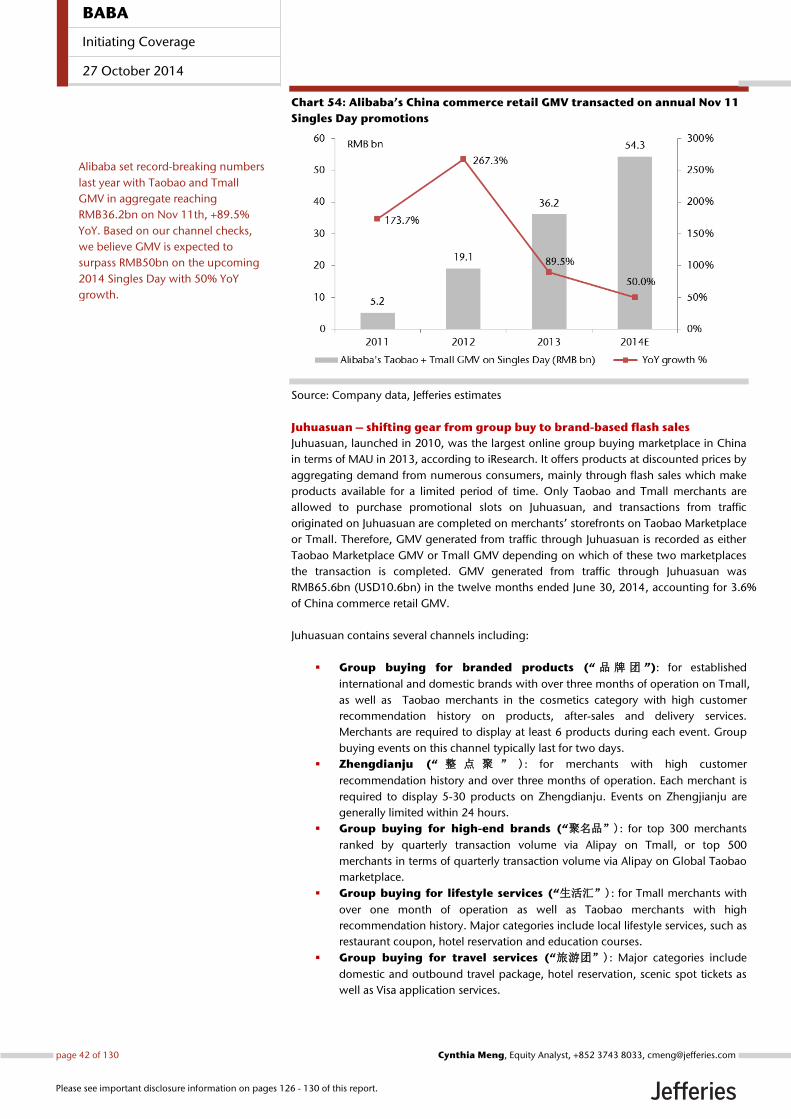
Chart 54: Alibaba’s China commerce retail GMV transacted on annual Nov 11
Singles Day promotions
Source: Company data, Jefferies estimates
Juhuasuan – shifting gear from group buy to brand-based flash sales
Juhuasuan, launched in 2010, was the largest online group buying marketplace in China
in terms of MAU in 2013, according to iResearch. It offers products at discounted prices by
aggregating demand from numerous consumers, mainly through flash sales which make
products available for a limited period of time. Only Taobao and Tmall merchants are
allowed to purchase promotional slots on Juhuasuan, and transactions from traffic
originated on Juhuasuan are completed on merchants’ storefronts on Taobao Marketplace
or Tmall. Therefore, GMV generated from traffic through Juhuasuan is recorded as either
Taobao Marketplace GMV or Tmall GMV depending on which of these two marketplaces
the transaction is completed. GMV generated from traffic through Juhuasuan was
RMB65.6bn (USD10.6bn) in the twelve months ended June 30, 2014, accounting for 3.6%
of China commerce retail GMV.
Juhuasuan contains several channels including:
Group buying for branded products (“ 品 牌 团 ”): for established
international and domestic brands with over three months of operation on Tmall,
as well as Taobao merchants in the cosmetics category with high customer
recommendation history on products, after-sales and delivery services.
Merchants are required to display at least 6 products during each event. Group
buying events on this channel typically last for two days.
Zhengdianju (“ 整 点 聚 ” ): for merchants with high customer
recommendation history and over three months of operation. Each merchant is
required to display 5-30 products on Zhengdianju. Events on Zhengjianju are
generally limited within 24 hours.
Group buying for high-end brands (“聚名品”): for top 300 merchants
ranked by quarterly transaction volume via Alipay on Tmall, or top 500
merchants in terms of quarterly transaction volume via Alipay on Global Taobao
marketplace.
Group buying for lifestyle services (“生活汇”): for Tmall merchants with
over one month of operation as well as Taobao merchants with high
recommendation history. Major categories include local lifestyle services, such as
restaurant coupon, hotel reservation and education courses.
Group buying for travel services (“旅游团”): Major categories include
domestic and outbound travel package, hotel reservation, scenic spot tickets as
well as Visa application services.
Alibaba set record-breaking numbers
last year with Taobao and Tmall
GMV in aggregate reaching
RMB36.2bn on Nov 11th, +89.5%
YoY. Based on our channel checks,
we believe GMV is expected to
surpass RMB50bn on the upcoming
2014 Singles Day with 50% YoY
growth.
BABA
Initiating Coverage
27 October 2014
page 42 of 130 , Equity Analyst, +852 3743 8033, [email protected] Meng
Please see important disclosure information on pages 126 - 130 of this report.
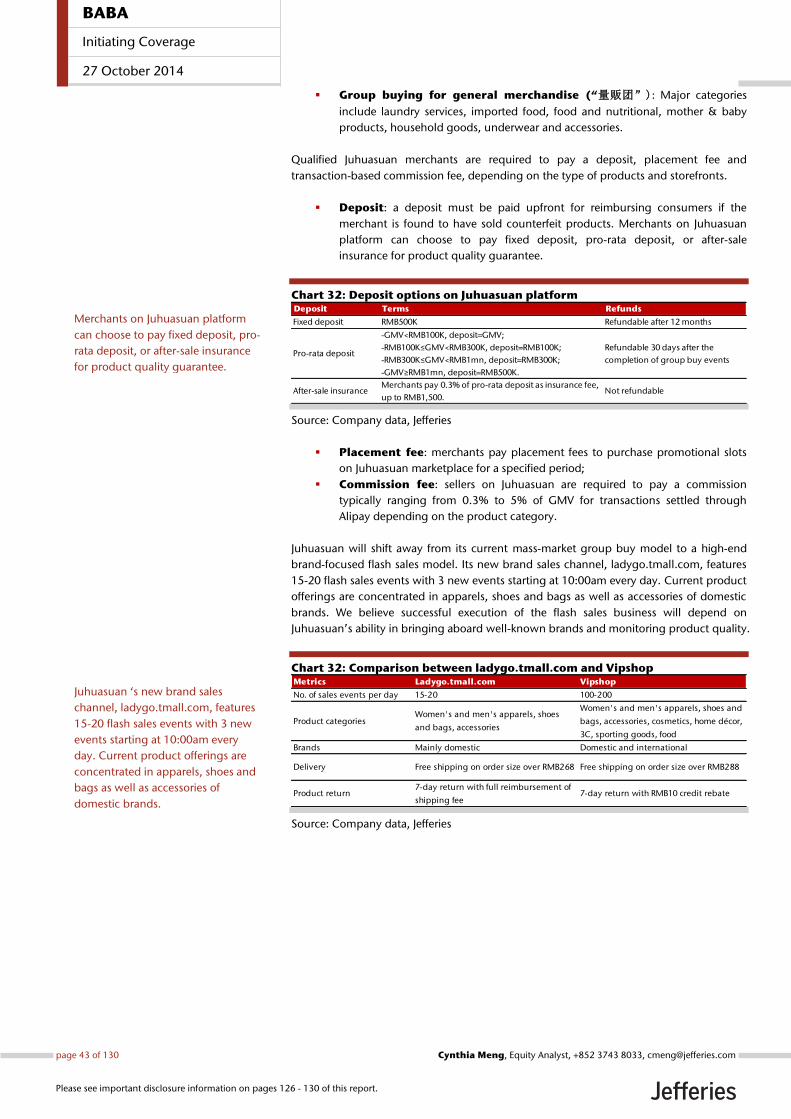
Group buying for general merchandise (“量贩团”): Major categories
include laundry services, imported food, food and nutritional, mother & baby
products, household goods, underwear and accessories.
Qualified Juhuasuan merchants are required to pay a deposit, placement fee and
transaction-based commission fee, depending on the type of products and storefronts.
Deposit: a deposit must be paid upfront for reimbursing consumers if the
merchant is found to have sold counterfeit products. Merchants on Juhuasuan
platform can choose to pay fixed deposit, pro-rata deposit, or after-sale
insurance for product quality guarantee.
Chart 32: Deposit options on Juhuasuan platform
Source: Company data, Jefferies
Placement fee: merchants pay placement fees to purchase promotional slots
on Juhuasuan marketplace for a specified period;
Commission fee: sellers on Juhuasuan are required to pay a commission
typically ranging from 0.3% to 5% of GMV for transactions settled through
Alipay depending on the product category.
Juhuasuan will shift away from its current mass-market group buy model to a high-end
brand-focused flash sales model. Its new brand sales channel, ladygo.tmall.com, features
15-20 flash sales events with 3 new events starting at 10:00am every day. Current product
offerings are concentrated in apparels, shoes and bags as well as accessories of domestic
brands. We believe successful execution of the flash sales business will depend on
Juhuasuan’s ability in bringing aboard well-known brands and monitoring product quality.
Chart 32: Comparison between ladygo.tmall.com and Vipshop
Source: Company data, Jefferies
Deposit Terms Refunds
Fixed deposit RMB500K Refundable after 12 months
Pro-rata deposit
-GMV<RMB100K, deposit=GMV;
-RMB100K≤GMV<RMB300K, deposit=RMB100K;
-RMB300K≤GMV<RMB1mn, deposit=RMB300K;
-GMV≥RMB1mn, deposit=RMB500K.
Refundable 30 days after the
completion of group buy events
After-sale insuranceMerchants pay 0.3% of pro-rata deposit as insurance fee,
up to RMB1,500.Not refundable
Metrics Ladygo.tmall.com Vipshop
No. of sales events per day 15-20 100-200
Product categoriesWomen's and men's apparels, shoes
and bags, accessories
Women's and men's apparels, shoes and
bags, accessories, cosmetics, home décor,
3C, sporting goods, food
Brands Mainly domestic Domestic and international
Delivery Free shipping on order size over RMB268 Free shipping on order size over RMB288
Product return7-day return with full reimbursement of
shipping fee7-day return with RMB10 credit rebate
Merchants on Juhuasuan platform
can choose to pay fixed deposit, pro-
rata deposit, or after-sale insurance
for product quality guarantee.
Juhuasuan ‘s new brand sales
channel, ladygo.tmall.com, features
15-20 flash sales events with 3 new
events starting at 10:00am every
day. Current product offerings are
concentrated in apparels, shoes and
bags as well as accessories of
domestic brands.
BABA
Initiating Coverage
27 October 2014
page 43 of 130 , Equity Analyst, +852 3743 8033, [email protected] Meng
Please see important disclosure information on pages 126 - 130 of this report.
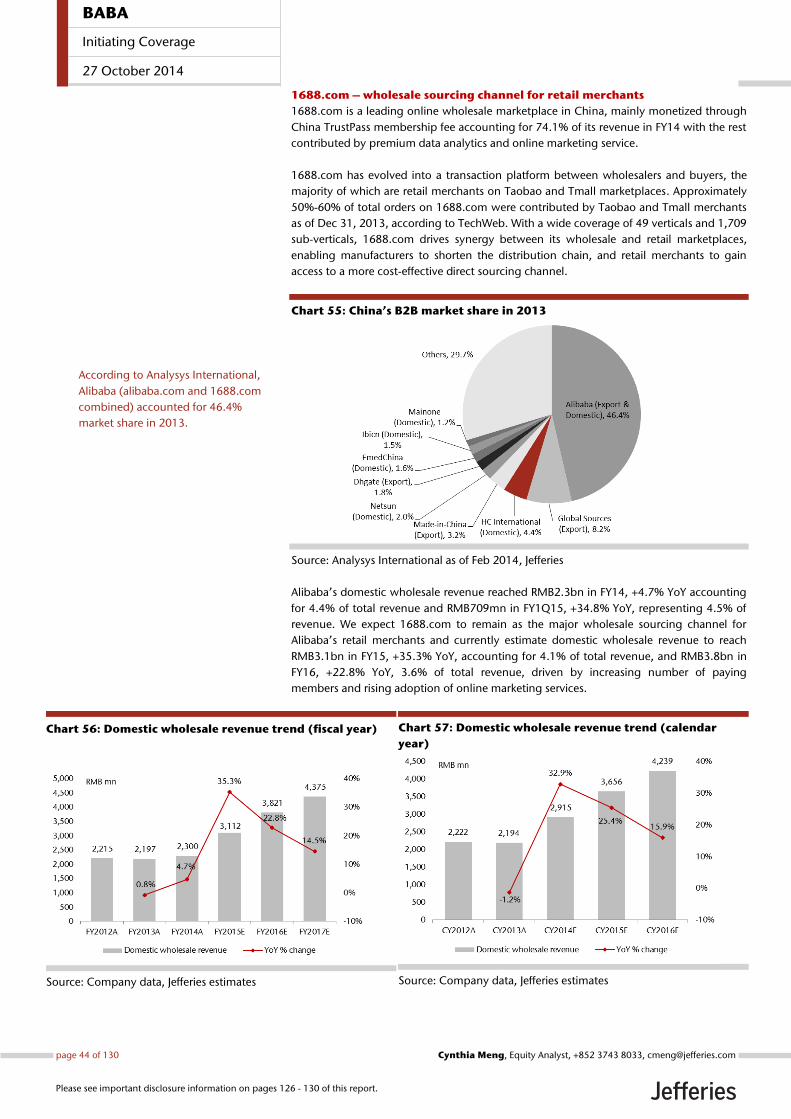
1688.com – wholesale sourcing channel for retail merchants
1688.com is a leading online wholesale marketplace in China, mainly monetized through
China TrustPass membership fee accounting for 74.1% of its revenue in FY14 with the rest
contributed by premium data analytics and online marketing service.
1688.com has evolved into a transaction platform between wholesalers and buyers, the
majority of which are retail merchants on Taobao and Tmall marketplaces. Approximately
50%-60% of total orders on 1688.com were contributed by Taobao and Tmall merchants
as of Dec 31, 2013, according to TechWeb. With a wide coverage of 49 verticals and 1,709
sub-verticals, 1688.com drives synergy between its wholesale and retail marketplaces,
enabling manufacturers to shorten the distribution chain, and retail merchants to gain
access to a more cost-effective direct sourcing channel.
Chart 55: China’s B2B market share in 2013
Source: Analysys International as of Feb 2014, Jefferies
Alibaba’s domestic wholesale revenue reached RMB2.3bn in FY14, +4.7% YoY accounting
for 4.4% of total revenue and RMB709mn in FY1Q15, +34.8% YoY, representing 4.5% of
revenue. We expect 1688.com to remain as the major wholesale sourcing channel for
Alibaba’s retail merchants and currently estimate domestic wholesale revenue to reach
RMB3.1bn in FY15, +35.3% YoY, accounting for 4.1% of total revenue, and RMB3.8bn in
FY16, +22.8% YoY, 3.6% of total revenue, driven by increasing number of paying
members and rising adoption of online marketing services.
Chart 56: Domestic wholesale revenue trend (fiscal year)
Source: Company data, Jefferies estimates
Chart 57: Domestic wholesale revenue trend (calendar
year)
Source: Company data, Jefferies estimates
According to Analysys International,
Alibaba (alibaba.com and 1688.com
combined) accounted for 46.4%
market share in 2013.
BABA
Initiating Coverage
27 October 2014
page 44 of 130 , Equity Analyst, +852 3743 8033, [email protected] Meng
Please see important disclosure information on pages 126 - 130 of this report.
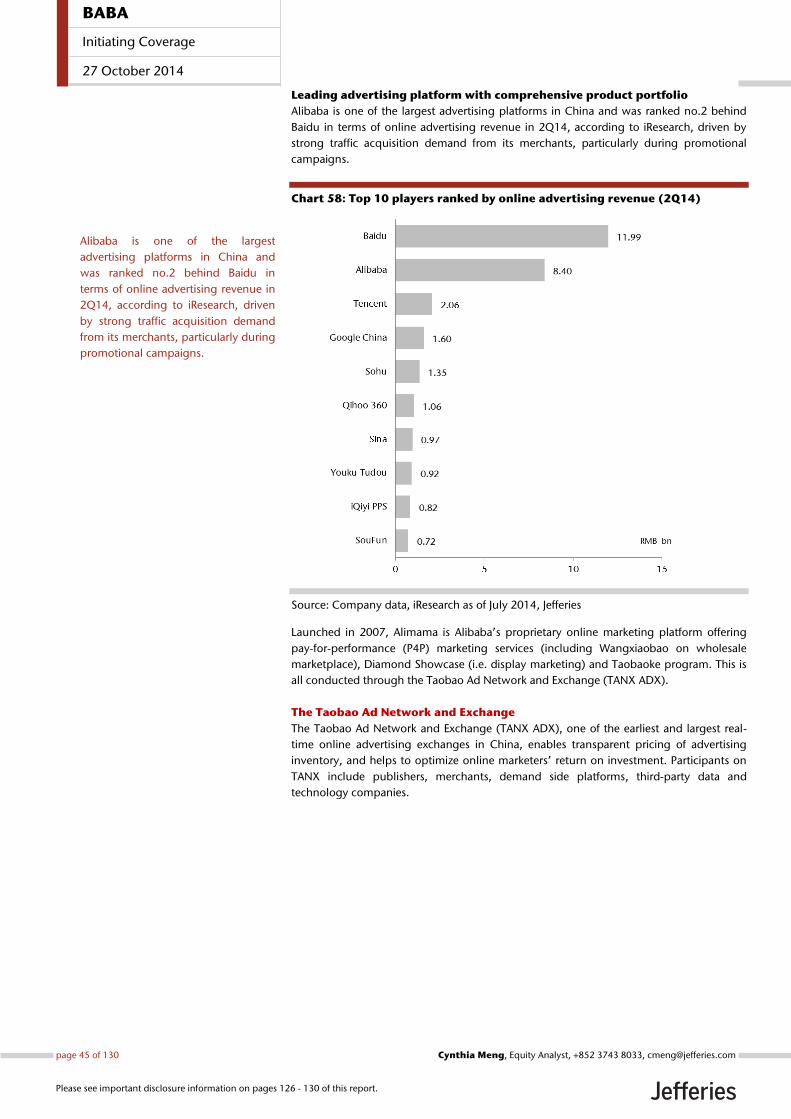
Leading advertising platform with comprehensive product portfolio
Alibaba is one of the largest advertising platforms in China and was ranked no.2 behind
Baidu in terms of online advertising revenue in 2Q14, according to iResearch, driven by
strong traffic acquisition demand from its merchants, particularly during promotional
campaigns.
Chart 58: Top 10 players ranked by online advertising revenue (2Q14)
Source: Company data, iResearch as of July 2014, Jefferies
Launched in 2007, Alimama is Alibaba’s proprietary online marketing platform offering
pay-for-performance (P4P) marketing services (including Wangxiaobao on wholesale
marketplace), Diamond Showcase (i.e. display marketing) and Taobaoke program. This is
all conducted through the Taobao Ad Network and Exchange (TANX ADX).
The Taobao Ad Network and Exchange
The Taobao Ad Network and Exchange (TANX ADX), one of the earliest and largest real-
time online advertising exchanges in China, enables transparent pricing of advertising
inventory, and helps to optimize online marketers’ return on investment. Participants on
TANX include publishers, merchants, demand side platforms, third-party data and
technology companies.
Alibaba is one of the largest
advertising platforms in China and
was ranked no.2 behind Baidu in
terms of online advertising revenue in
2Q14, according to iResearch, driven
by strong traffic acquisition demand
from its merchants, particularly during
promotional campaigns.
BABA
Initiating Coverage
27 October 2014
page 45 of 130 , Equity Analyst, +852 3743 8033, [email protected] Meng
Please see important disclosure information on pages 126 - 130 of this report.
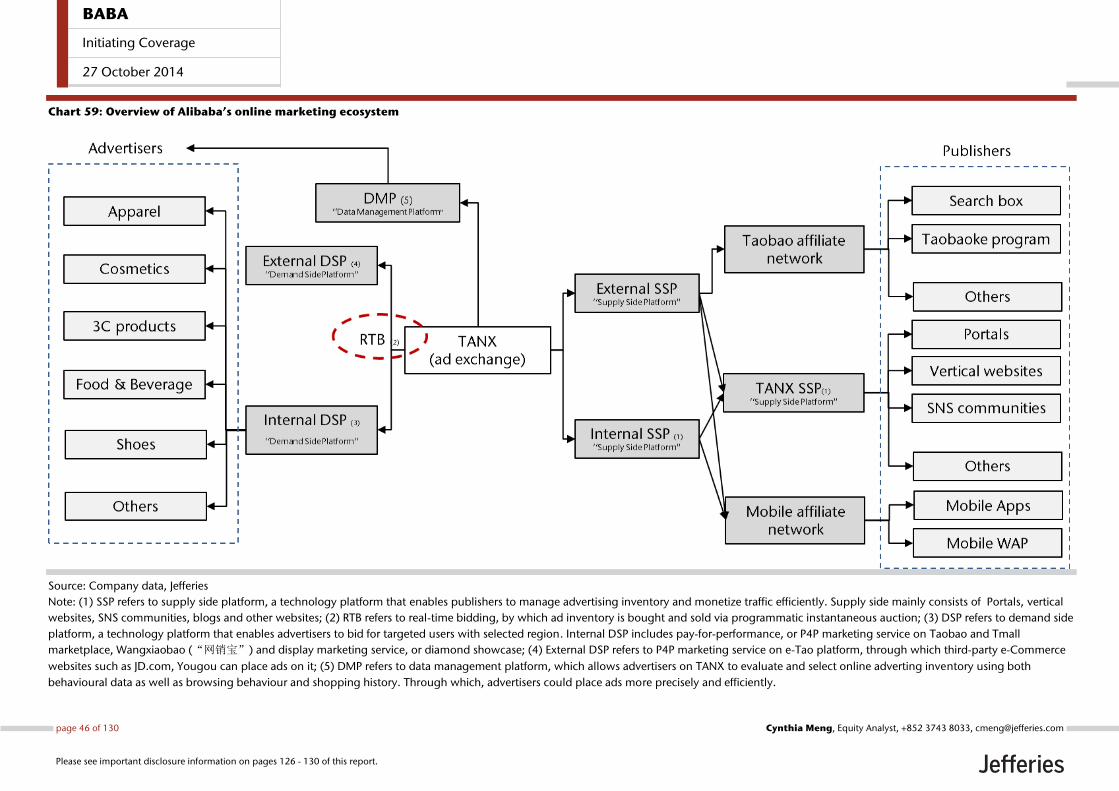
Chart 59: Overview of Alibaba’s online marketing ecosystem
Source: Company data, Jefferies
Note: (1) SSP refers to supply side platform, a technology platform that enables publishers to manage advertising inventory and monetize traffic efficiently. Supply side mainly consists of Portals, vertical
websites, SNS communities, blogs and other websites; (2) RTB refers to real-time bidding, by which ad inventory is bought and sold via programmatic instantaneous auction; (3) DSP refers to demand side
platform, a technology platform that enables advertisers to bid for targeted users with selected region. Internal DSP includes pay-for-performance, or P4P marketing service on Taobao and Tmall
marketplace, Wangxiaobao (“网销宝”) and display marketing service, or diamond showcase; (4) External DSP refers to P4P marketing service on e-Tao platform, through which third-party e-Commerce
websites such as JD.com, Yougou can place ads on it; (5) DMP refers to data management platform, which allows advertisers on TANX to evaluate and select online adverting inventory using both
behavioural data as well as browsing behaviour and shopping history. Through which, advertisers could place ads more precisely and efficiently.
BABA
Initiating Coverage
27 October 2014
page 46 of 130 , Equity Analyst, +852 3743 8033, [email protected] Meng
Please see important disclosure information on pages 126 - 130 of this report.
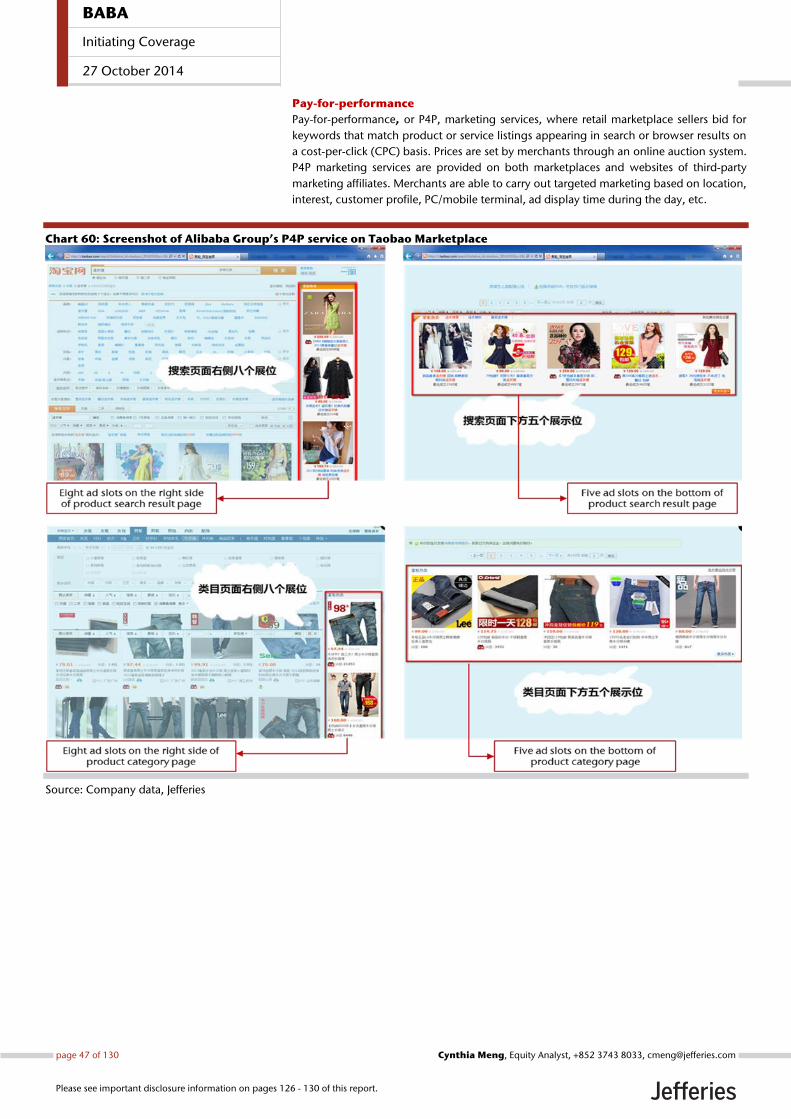
Pay-for-performance
Pay-for-performance, or P4P, marketing services, where retail marketplace sellers bid for
keywords that match product or service listings appearing in search or browser results on
a cost-per-click (CPC) basis. Prices are set by merchants through an online auction system.
P4P marketing services are provided on both marketplaces and websites of third-party
marketing affiliates. Merchants are able to carry out targeted marketing based on location,
interest, customer profile, PC/mobile terminal, ad display time during the day, etc.
Chart 60: Screenshot of Alibaba Group’s P4P service on Taobao Marketplace
Source: Company data, Jefferies
BABA
Initiating Coverage
27 October 2014
page 47 of 130 , Equity Analyst, +852 3743 8033, [email protected] Meng
Please see important disclosure information on pages 126 - 130 of this report.
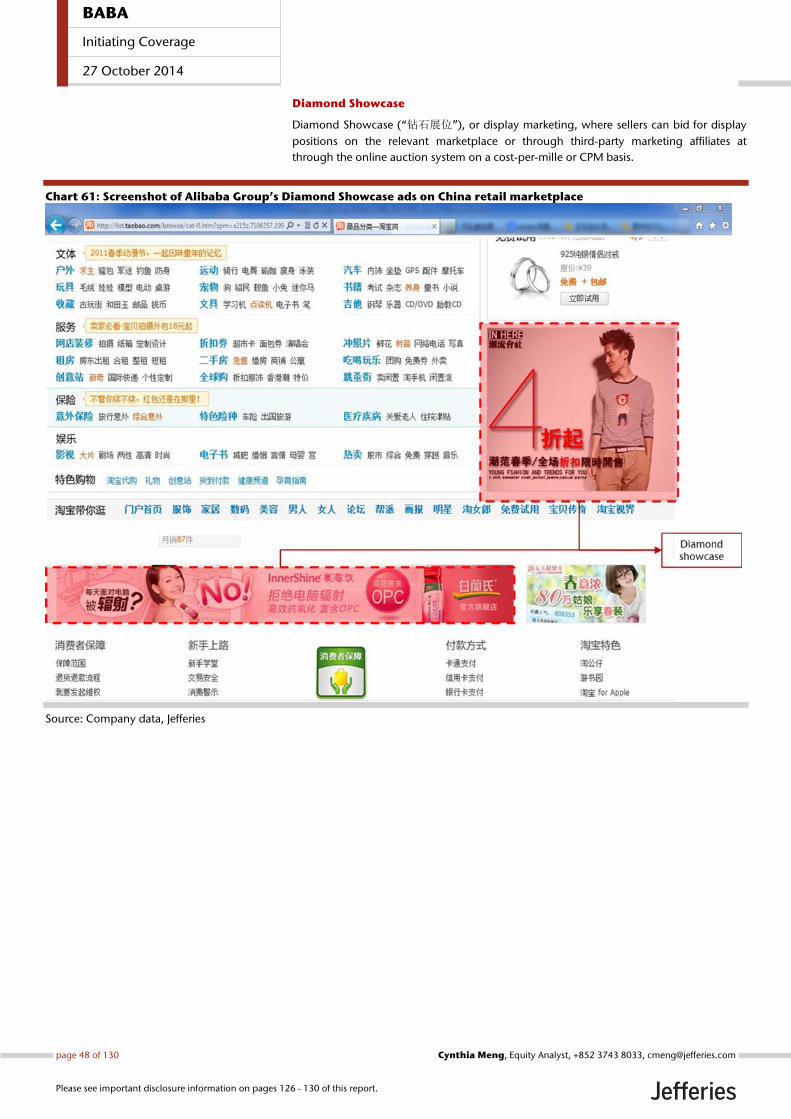
Diamond Showcase
Diamond Showcase (“钻石展位”), or display marketing, where sellers can bid for display
positions on the relevant marketplace or through third-party marketing affiliates at
through the online auction system on a cost-per-mille or CPM basis.
Chart 61: Screenshot of Alibaba Group’s Diamond Showcase ads on China retail marketplace
Source: Company data, Jefferies
BABA
Initiating Coverage
27 October 2014
page 48 of 130 , Equity Analyst, +852 3743 8033, [email protected] Meng
Please see important disclosure information on pages 126 - 130 of this report.
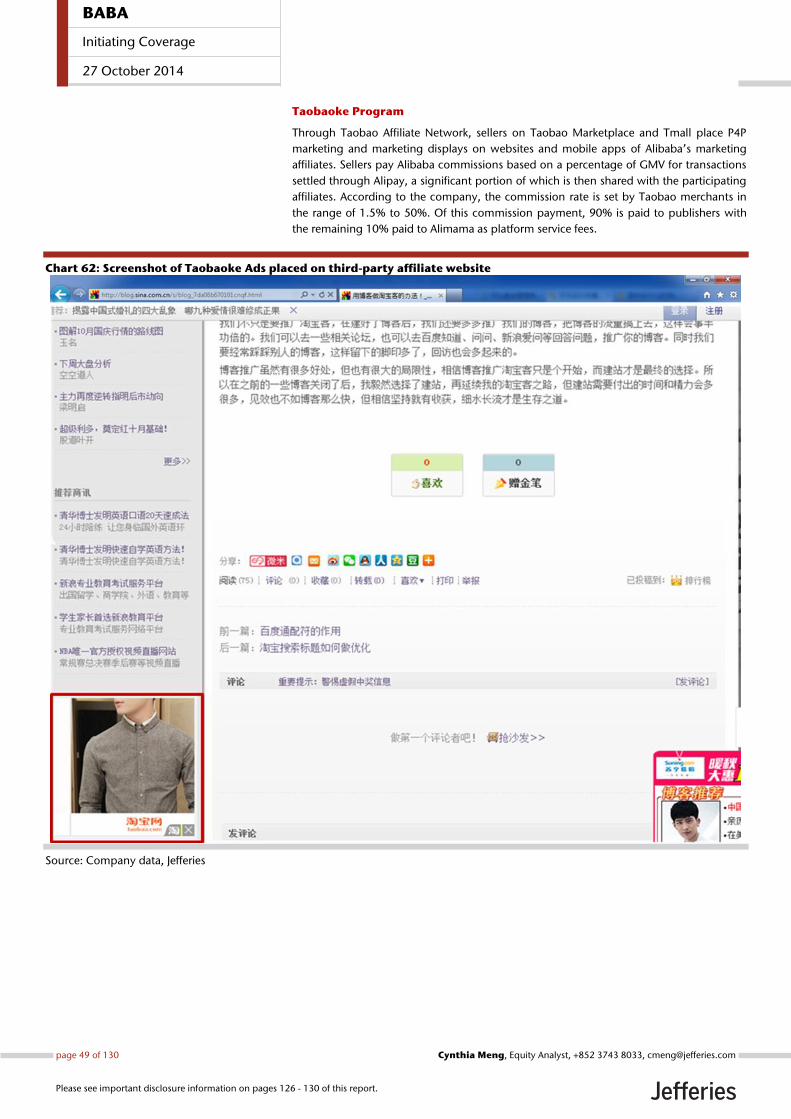
Taobaoke Program
Through Taobao Affiliate Network, sellers on Taobao Marketplace and Tmall place P4P
marketing and marketing displays on websites and mobile apps of Alibaba’s marketing
affiliates. Sellers pay Alibaba commissions based on a percentage of GMV for transactions
settled through Alipay, a significant portion of which is then shared with the participating
affiliates. According to the company, the commission rate is set by Taobao merchants in
the range of 1.5% to 50%. Of this commission payment, 90% is paid to publishers with
the remaining 10% paid to Alimama as platform service fees.
Chart 62: Screenshot of Taobaoke Ads placed on third-party affiliate website
Source: Company data, Jefferies
BABA
Initiating Coverage
27 October 2014
page 49 of 130 , Equity Analyst, +852 3743 8033, [email protected] Meng
Please see important disclosure information on pages 126 - 130 of this report.
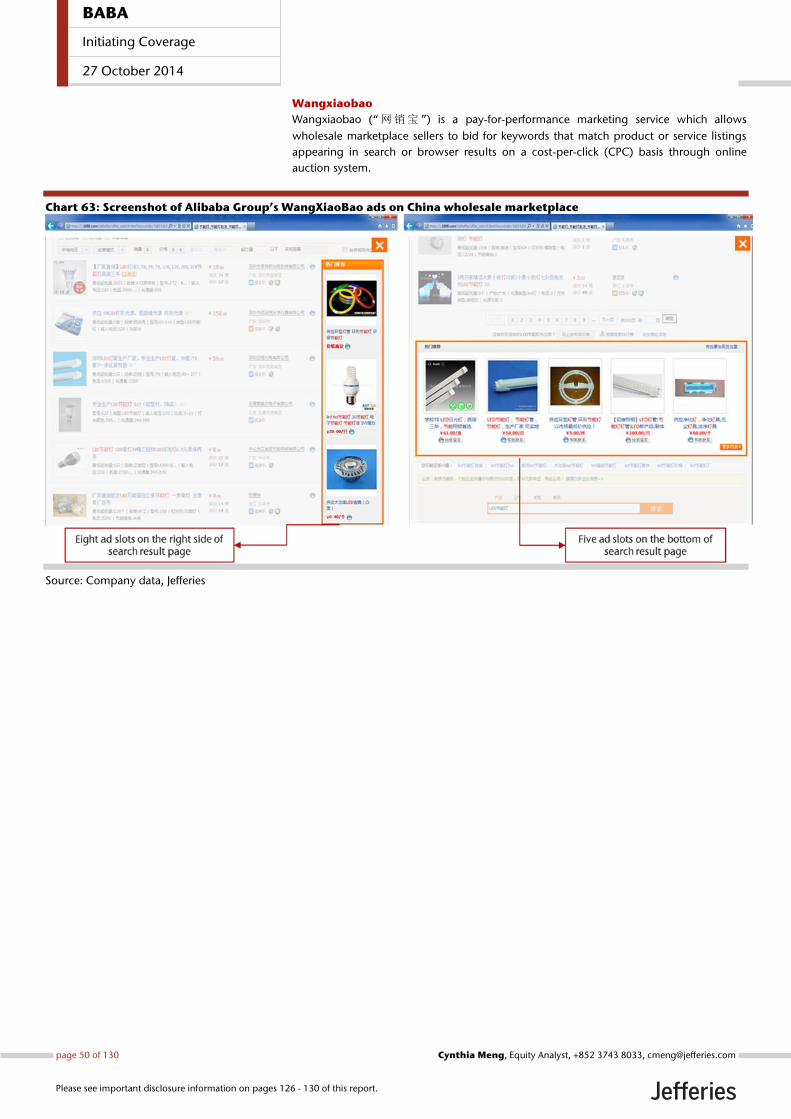
Wangxiaobao
Wangxiaobao (“网销宝 ”) is a pay-for-performance marketing service which allows
wholesale marketplace sellers to bid for keywords that match product or service listings
appearing in search or browser results on a cost-per-click (CPC) basis through online
auction system.
Chart 63: Screenshot of Alibaba Group’s WangXiaoBao ads on China wholesale marketplace
Source: Company data, Jefferies
BABA
Initiating Coverage
27 October 2014
page 50 of 130 , Equity Analyst, +852 3743 8033, [email protected] Meng
Please see important disclosure information on pages 126 - 130 of this report.
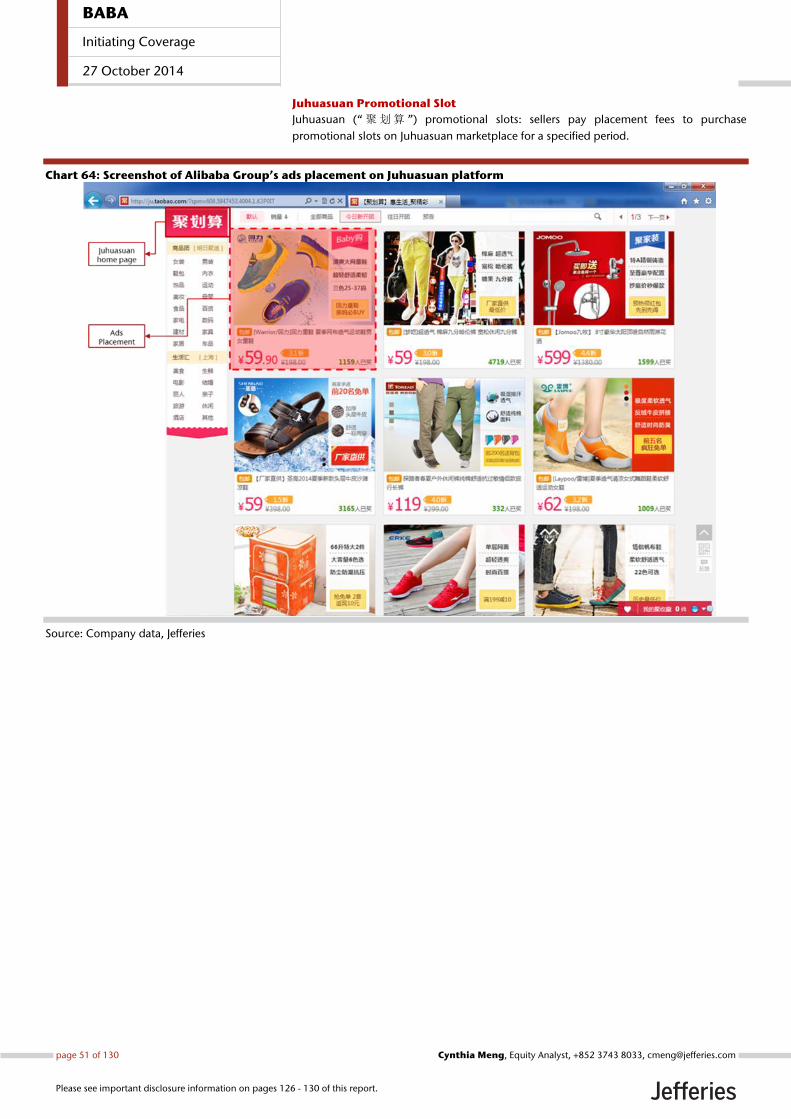
Juhuasuan Promotional Slot
Juhuasuan (“ 聚划算 ”) promotional slots: sellers pay placement fees to purchase
promotional slots on Juhuasuan marketplace for a specified period.
Chart 64: Screenshot of Alibaba Group’s ads placement on Juhuasuan platform
Source: Company data, Jefferies
BABA
Initiating Coverage
27 October 2014
page 51 of 130 , Equity Analyst, +852 3743 8033, [email protected] Meng
Please see important disclosure information on pages 126 - 130 of this report.
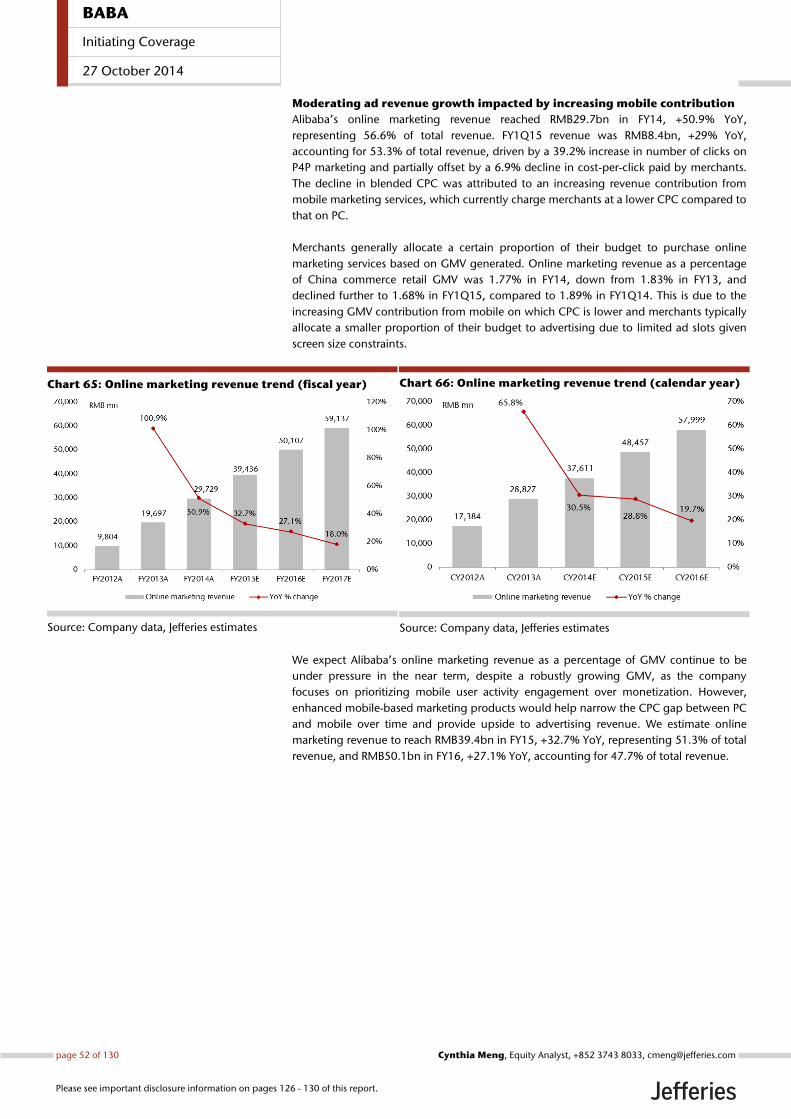
Moderating ad revenue growth impacted by increasing mobile contribution
Alibaba’s online marketing revenue reached RMB29.7bn in FY14, +50.9% YoY,
representing 56.6% of total revenue. FY1Q15 revenue was RMB8.4bn, +29% YoY,
accounting for 53.3% of total revenue, driven by a 39.2% increase in number of clicks on
P4P marketing and partially offset by a 6.9% decline in cost-per-click paid by merchants.
The decline in blended CPC was attributed to an increasing revenue contribution from
mobile marketing services, which currently charge merchants at a lower CPC compared to
that on PC.
Merchants generally allocate a certain proportion of their budget to purchase online
marketing services based on GMV generated. Online marketing revenue as a percentage
of China commerce retail GMV was 1.77% in FY14, down from 1.83% in FY13, and
declined further to 1.68% in FY1Q15, compared to 1.89% in FY1Q14. This is due to the
increasing GMV contribution from mobile on which CPC is lower and merchants typically
allocate a smaller proportion of their budget to advertising due to limited ad slots given
screen size constraints.
Chart 65: Online marketing revenue trend (fiscal year)
Source: Company data, Jefferies estimates
Chart 66: Online marketing revenue trend (calendar year)
Source: Company data, Jefferies estimates
We expect Alibaba’s online marketing revenue as a percentage of GMV continue to be
under pressure in the near term, despite a robustly growing GMV, as the company
focuses on prioritizing mobile user activity engagement over monetization. However,
enhanced mobile-based marketing products would help narrow the CPC gap between PC
and mobile over time and provide upside to advertising revenue. We estimate online
marketing revenue to reach RMB39.4bn in FY15, +32.7% YoY, representing 51.3% of total
revenue, and RMB50.1bn in FY16, +27.1% YoY, accounting for 47.7% of total revenue.
BABA
Initiating Coverage
27 October 2014
page 52 of 130 , Equity Analyst, +852 3743 8033, [email protected] Meng
Please see important disclosure information on pages 126 - 130 of this report.
Extending Mobile Leadership Benefiting from the proliferation of affordable smartphones and its established customer
reach in lower tier cities where offline shopping facilities are less developed, Alibaba led
China’s m-Commerce market accounting for 84.2% of total mobile retail GMV in 2Q14,
according to iResearch.
In this section, we discuss the following:
1. Alibaba has amassed a large mobile user base and traffic with its diversified
mobile app portfolio, including its widely used Alipay mobile payment app.
Alibaba saw surging mobile GMV which accounted for 32.8% of total GMV in
FY1Q15, up 21pcpt YoY. We estimate mobile GMV to reach RMB1,068bn in
FY15, +235.4% YoY, representing 44.2% of total GMV, up 25.2pcpt YoY.
2. Alibaba’s mobile monetization rate was 0.91% in FY14, much lower than 2.94%
on PC due to the lagging advertising monetization on mobile compared to PC.
Given the inherent monetization hurdles in mobile ad including limited screen
size and balance of user experience, we expect mobile monetization rate to
remain at a discount to PC in the near term. However, we expect better mobile-
based marketing products and wider adoption among merchants should help
narrow the CPC and hence, monetization gap between the two terminals. We
currently estimate mobile revenue of RMB19.7bn in F15, +576.6% YoY,
representing 30.3% of China commerce retail revenue and implying a
monetization rate of 1.84%, up 0.93pcpt YoY.
3. Alibaba’s various mobile investments, including UCWeb, Weibo and TangoMe,
help expand its mobile user base through major mobile traffic gateways such as
browser, SNS and instant messaging.
BABA
Initiating Coverage
27 October 2014
page 53 of 130 , Equity Analyst, +852 3743 8033, [email protected] Meng
Please see important disclosure information on pages 126 - 130 of this report.
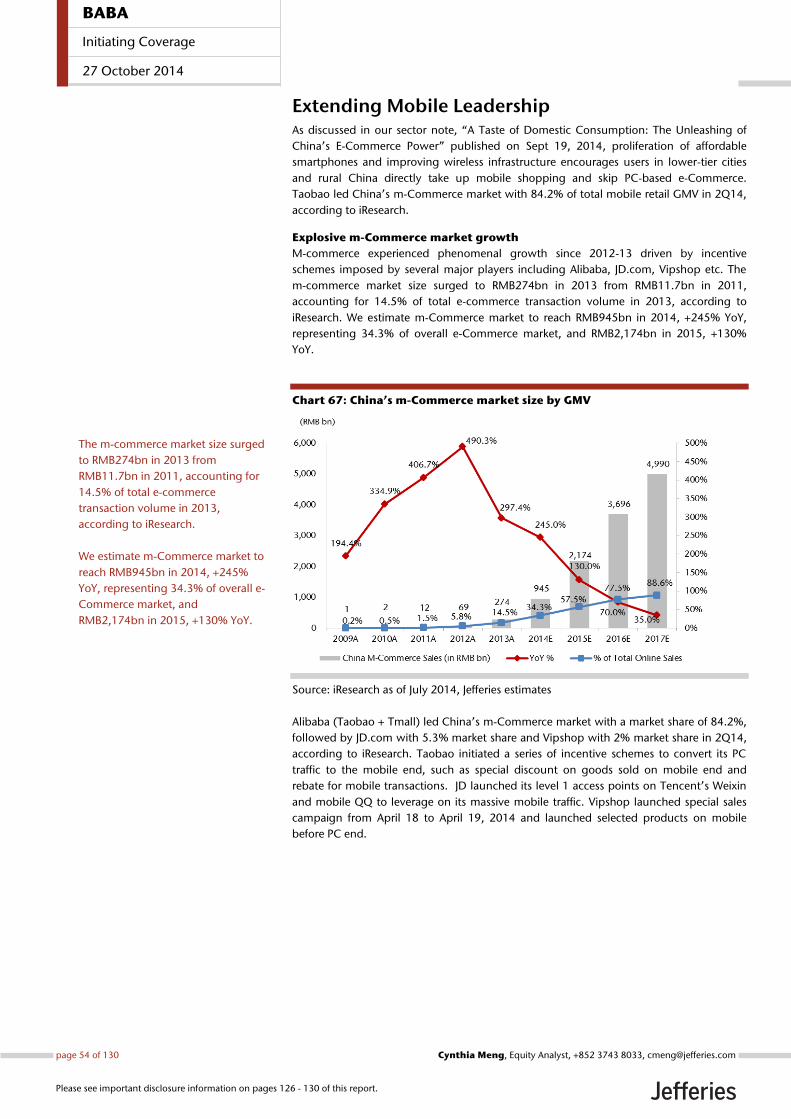
Extending Mobile Leadership As discussed in our sector note, “A Taste of Domestic Consumption: The Unleashing of
China’s E-Commerce Power” published on Sept 19, 2014, proliferation of affordable
smartphones and improving wireless infrastructure encourages users in lower-tier cities
and rural China directly take up mobile shopping and skip PC-based e-Commerce.
Taobao led China’s m-Commerce market with 84.2% of total mobile retail GMV in 2Q14,
according to iResearch.
Explosive m-Commerce market growth
M-commerce experienced phenomenal growth since 2012-13 driven by incentive
schemes imposed by several major players including Alibaba, JD.com, Vipshop etc. The
m-commerce market size surged to RMB274bn in 2013 from RMB11.7bn in 2011,
accounting for 14.5% of total e-commerce transaction volume in 2013, according to
iResearch. We estimate m-Commerce market to reach RMB945bn in 2014, +245% YoY,
representing 34.3% of overall e-Commerce market, and RMB2,174bn in 2015, +130%
YoY.
Chart 67: China’s m-Commerce market size by GMV
Source: iResearch as of July 2014, Jefferies estimates
Alibaba (Taobao + Tmall) led China’s m-Commerce market with a market share of 84.2%,
followed by JD.com with 5.3% market share and Vipshop with 2% market share in 2Q14,
according to iResearch. Taobao initiated a series of incentive schemes to convert its PC
traffic to the mobile end, such as special discount on goods sold on mobile end and
rebate for mobile transactions. JD launched its level 1 access points on Tencent’s Weixin
and mobile QQ to leverage on its massive mobile traffic. Vipshop launched special sales
campaign from April 18 to April 19, 2014 and launched selected products on mobile
before PC end.
The m-commerce market size surged
to RMB274bn in 2013 from
RMB11.7bn in 2011, accounting for
14.5% of total e-commerce
transaction volume in 2013,
according to iResearch.
We estimate m-Commerce market to
reach RMB945bn in 2014, +245%
YoY, representing 34.3% of overall e-
Commerce market, and
RMB2,174bn in 2015, +130% YoY.
BABA
Initiating Coverage
27 October 2014
page 54 of 130 , Equity Analyst, +852 3743 8033, [email protected] Meng
Please see important disclosure information on pages 126 - 130 of this report.
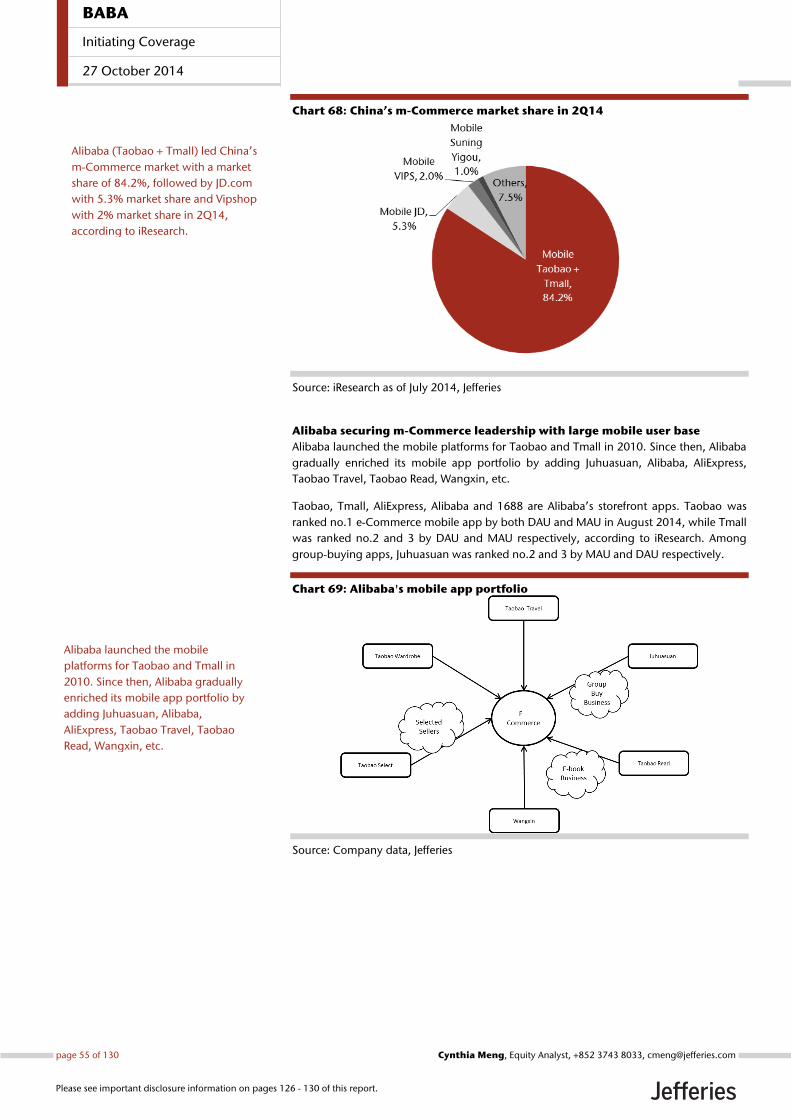
Chart 68: China’s m-Commerce market share in 2Q14
Source: iResearch as of July 2014, Jefferies
Alibaba securing m-Commerce leadership with large mobile user base
Alibaba launched the mobile platforms for Taobao and Tmall in 2010. Since then, Alibaba
gradually enriched its mobile app portfolio by adding Juhuasuan, Alibaba, AliExpress,
Taobao Travel, Taobao Read, Wangxin, etc.
Taobao, Tmall, AliExpress, Alibaba and 1688 are Alibaba’s storefront apps. Taobao was
ranked no.1 e-Commerce mobile app by both DAU and MAU in August 2014, while Tmall
was ranked no.2 and 3 by DAU and MAU respectively, according to iResearch. Among
group-buying apps, Juhuasuan was ranked no.2 and 3 by MAU and DAU respectively.
Chart 69: Alibaba's mobile app portfolio
Source: Company data, Jefferies
Alibaba (Taobao + Tmall) led China’s
m-Commerce market with a market
share of 84.2%, followed by JD.com
with 5.3% market share and Vipshop
with 2% market share in 2Q14,
according to iResearch.
Alibaba launched the mobile
platforms for Taobao and Tmall in
2010. Since then, Alibaba gradually
enriched its mobile app portfolio by
adding Juhuasuan, Alibaba,
AliExpress, Taobao Travel, Taobao
Read, Wangxin, etc.
BABA
Initiating Coverage
27 October 2014
page 55 of 130 , Equity Analyst, +852 3743 8033, [email protected] Meng
Please see important disclosure information on pages 126 - 130 of this report.
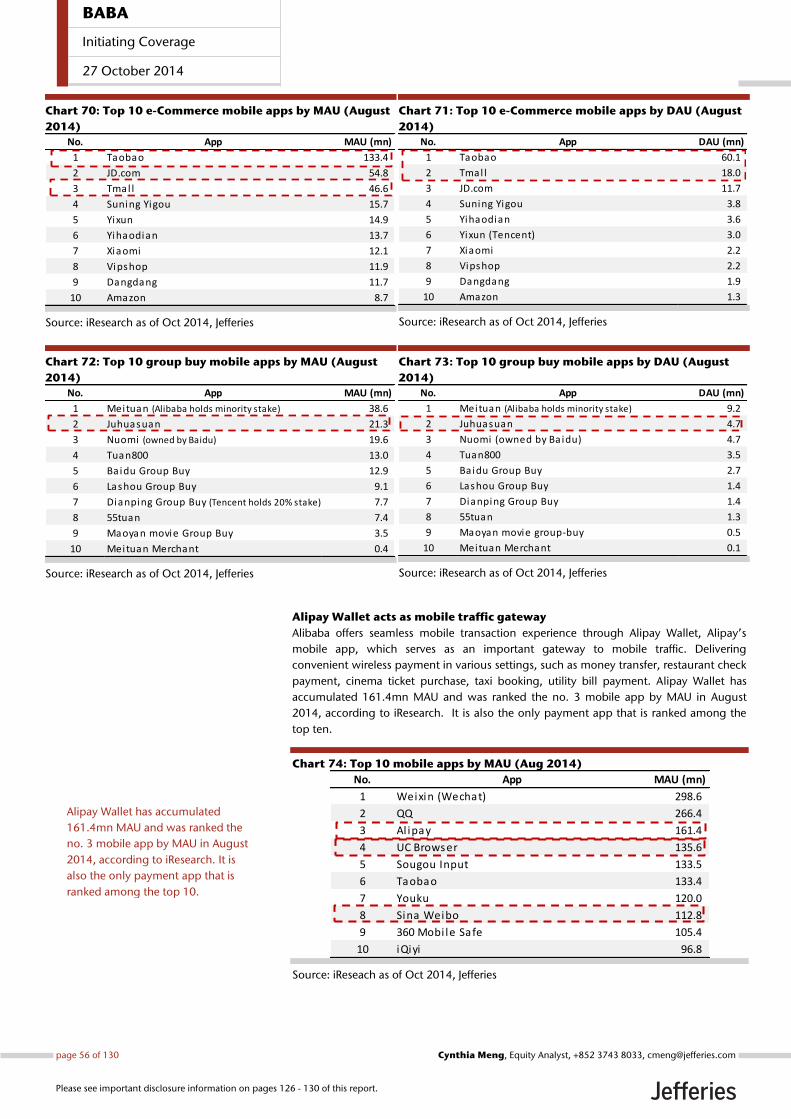
Chart 70: Top 10 e-Commerce mobile apps by MAU (August
2014)
Source: iResearch as of Oct 2014, Jefferies
Chart 71: Top 10 e-Commerce mobile apps by DAU (August
2014)
Source: iResearch as of Oct 2014, Jefferies
Chart 72: Top 10 group buy mobile apps by MAU (August
2014)
Source: iResearch as of Oct 2014, Jefferies
Chart 73: Top 10 group buy mobile apps by DAU (August
2014)
Source: iResearch as of Oct 2014, Jefferies
Alipay Wallet acts as mobile traffic gateway
Alibaba offers seamless mobile transaction experience through Alipay Wallet, Alipay’s
mobile app, which serves as an important gateway to mobile traffic. Delivering
convenient wireless payment in various settings, such as money transfer, restaurant check
payment, cinema ticket purchase, taxi booking, utility bill payment. Alipay Wallet has
accumulated 161.4mn MAU and was ranked the no. 3 mobile app by MAU in August
2014, according to iResearch. It is also the only payment app that is ranked among the
top ten.
Chart 74: Top 10 mobile apps by MAU (Aug 2014)
Source: iReseach as of Oct 2014, Jefferies
No. App MAU (mn)
1 Taobao 133.4
2 JD.com 54.8
3 Tmal l 46.6
4 Suning Yigou 15.7
5 Yixun 14.9
6 Yihaodian 13.7
7 Xiaomi 12.1
8 Vipshop 11.9
9 Dangdang 11.7
10 Amazon 8.7
No. App DAU (mn)
1 Taobao 60.1
2 Tmal l 18.0
3 JD.com 11.7
4 Suning Yigou 3.8
5 Yihaodian 3.6
6 Yixun (Tencent) 3.0
7 Xiaomi 2.2
8 Vipshop 2.2
9 Dangdang 1.9
10 Amazon 1.3
No. App MAU (mn)
1 Meituan (Alibaba holds minority stake) 38.6
2 Juhuasuan 21.3
3 Nuomi (owned by Baidu) 19.6
4 Tuan800 13.0
5 Baidu Group Buy 12.9
6 Lashou Group Buy 9.1
7 Dianping Group Buy (Tencent holds 20% stake) 7.7
8 55tuan 7.4
9 Maoyan movie Group Buy 3.5
10 Meituan Merchant 0.4
No. App DAU (mn)
1 Meituan (Alibaba holds minority stake) 9.2
2 Juhuasuan 4.7
3 Nuomi (owned by Baidu) 4.7
4 Tuan800 3.5
5 Baidu Group Buy 2.7
6 Lashou Group Buy 1.4
7 Dianping Group Buy 1.4
8 55tuan 1.3
9 Maoyan movie group-buy 0.5
10 Meituan Merchant 0.1
No. App MAU (mn)
1 Weixin (Wechat) 298.6
2 QQ 266.4
3 Al ipay 161.4
4 UC Browser 135.6
5 Sougou Input 133.5
6 Taobao 133.4
7 Youku 120.0
8 Sina Weibo 112.8
9 360 Mobi le Safe 105.4
10 iQiyi 96.8
Alipay Wallet has accumulated
161.4mn MAU and was ranked the
no. 3 mobile app by MAU in August
2014, according to iResearch. It is
also the only payment app that is
ranked among the top 10.
BABA
Initiating Coverage
27 October 2014
page 56 of 130 , Equity Analyst, +852 3743 8033, [email protected] Meng
Please see important disclosure information on pages 126 - 130 of this report.
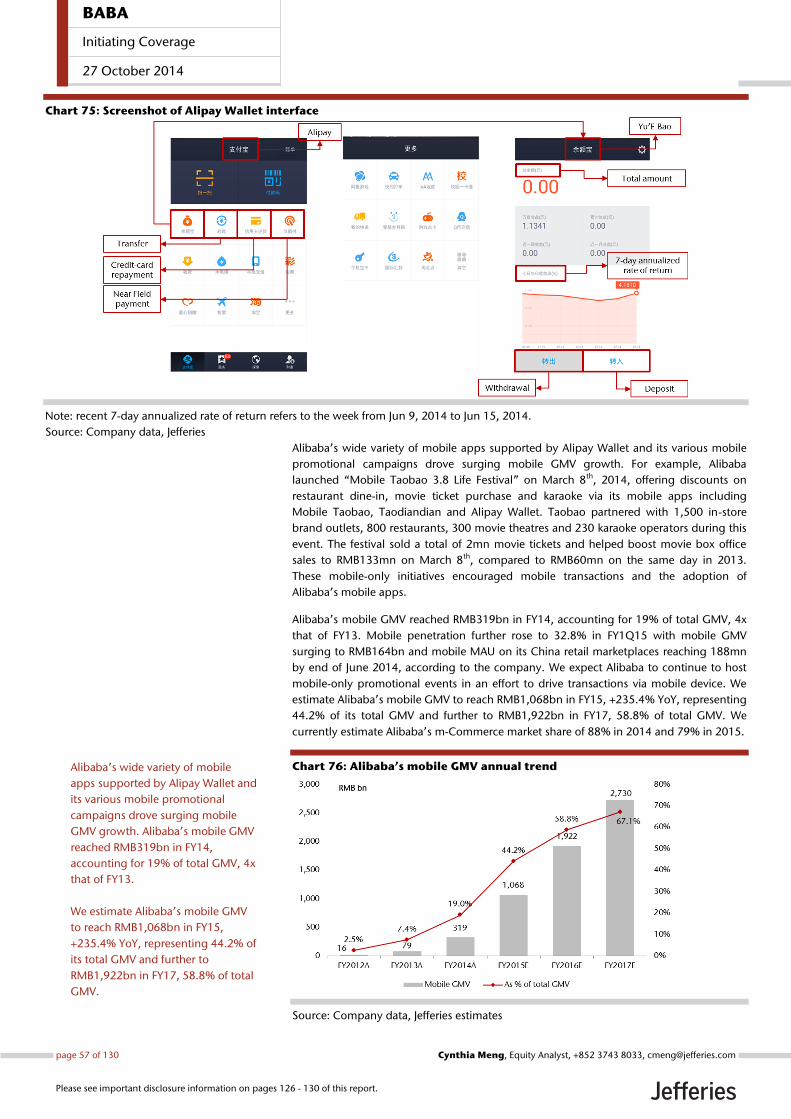
Chart 75: Screenshot of Alipay Wallet interface
Note: recent 7-day annualized rate of return refers to the week from Jun 9, 2014 to Jun 15, 2014.
Source: Company data, Jefferies
Alibaba’s wide variety of mobile apps supported by Alipay Wallet and its various mobile
promotional campaigns drove surging mobile GMV growth. For example, Alibaba
launched “Mobile Taobao 3.8 Life Festival” on March 8th, 2014, offering discounts on
restaurant dine-in, movie ticket purchase and karaoke via its mobile apps including
Mobile Taobao, Taodiandian and Alipay Wallet. Taobao partnered with 1,500 in-store
brand outlets, 800 restaurants, 300 movie theatres and 230 karaoke operators during this
event. The festival sold a total of 2mn movie tickets and helped boost movie box office
sales to RMB133mn on March 8th, compared to RMB60mn on the same day in 2013.
These mobile-only initiatives encouraged mobile transactions and the adoption of
Alibaba’s mobile apps.
Alibaba’s mobile GMV reached RMB319bn in FY14, accounting for 19% of total GMV, 4x
that of FY13. Mobile penetration further rose to 32.8% in FY1Q15 with mobile GMV
surging to RMB164bn and mobile MAU on its China retail marketplaces reaching 188mn
by end of June 2014, according to the company. We expect Alibaba to continue to host
mobile-only promotional events in an effort to drive transactions via mobile device. We
estimate Alibaba’s mobile GMV to reach RMB1,068bn in FY15, +235.4% YoY, representing
44.2% of its total GMV and further to RMB1,922bn in FY17, 58.8% of total GMV. We
currently estimate Alibaba’s m-Commerce market share of 88% in 2014 and 79% in 2015.
Chart 76: Alibaba’s mobile GMV annual trend
Source: Company data, Jefferies estimates
Alibaba’s wide variety of mobile
apps supported by Alipay Wallet and
its various mobile promotional
campaigns drove surging mobile
GMV growth. Alibaba’s mobile GMV
reached RMB319bn in FY14,
accounting for 19% of total GMV, 4x
that of FY13.
We estimate Alibaba’s mobile GMV
to reach RMB1,068bn in FY15,
+235.4% YoY, representing 44.2% of
its total GMV and further to
RMB1,922bn in FY17, 58.8% of total
GMV.
BABA
Initiating Coverage
27 October 2014
page 57 of 130 , Equity Analyst, +852 3743 8033, [email protected] Meng
Please see important disclosure information on pages 126 - 130 of this report.
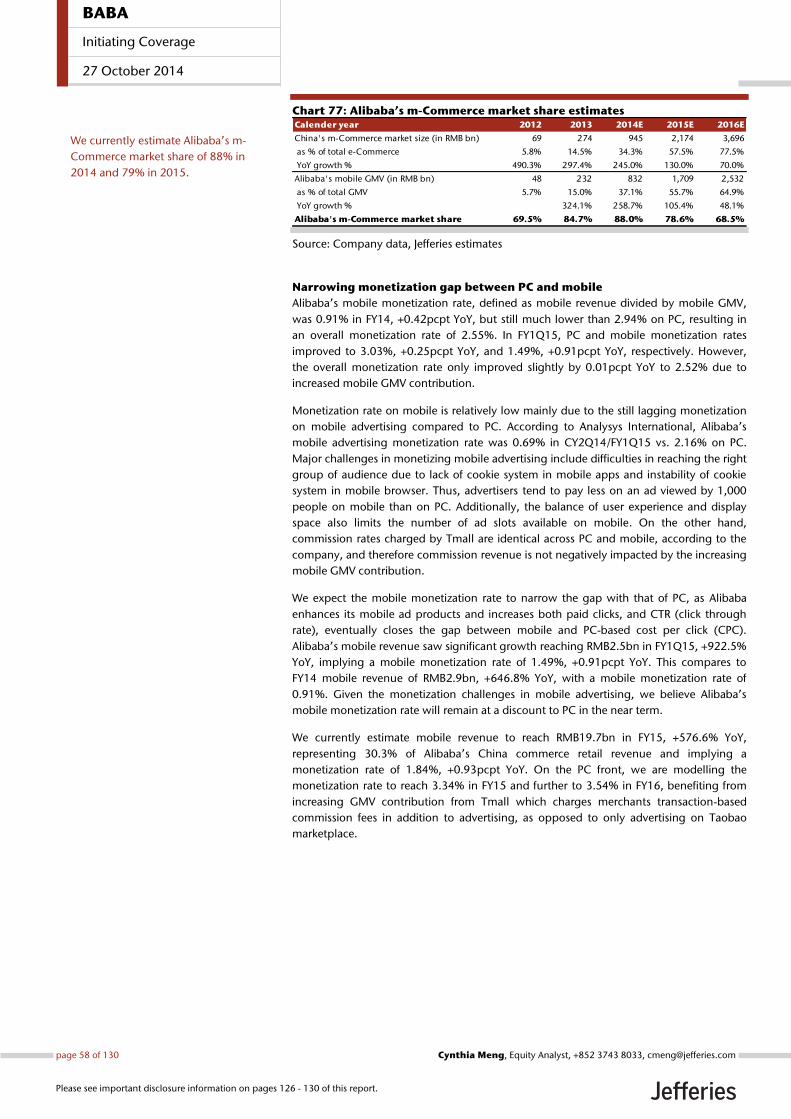
Chart 77: Alibaba’s m-Commerce market share estimates
Source: Company data, Jefferies estimates
Narrowing monetization gap between PC and mobile
Alibaba’s mobile monetization rate, defined as mobile revenue divided by mobile GMV,
was 0.91% in FY14, +0.42pcpt YoY, but still much lower than 2.94% on PC, resulting in
an overall monetization rate of 2.55%. In FY1Q15, PC and mobile monetization rates
improved to 3.03%, +0.25pcpt YoY, and 1.49%, +0.91pcpt YoY, respectively. However,
the overall monetization rate only improved slightly by 0.01pcpt YoY to 2.52% due to
increased mobile GMV contribution.
Monetization rate on mobile is relatively low mainly due to the still lagging monetization
on mobile advertising compared to PC. According to Analysys International, Alibaba’s
mobile advertising monetization rate was 0.69% in CY2Q14/FY1Q15 vs. 2.16% on PC.
Major challenges in monetizing mobile advertising include difficulties in reaching the right
group of audience due to lack of cookie system in mobile apps and instability of cookie
system in mobile browser. Thus, advertisers tend to pay less on an ad viewed by 1,000
people on mobile than on PC. Additionally, the balance of user experience and display
space also limits the number of ad slots available on mobile. On the other hand,
commission rates charged by Tmall are identical across PC and mobile, according to the
company, and therefore commission revenue is not negatively impacted by the increasing
mobile GMV contribution.
We expect the mobile monetization rate to narrow the gap with that of PC, as Alibaba
enhances its mobile ad products and increases both paid clicks, and CTR (click through
rate), eventually closes the gap between mobile and PC-based cost per click (CPC).
Alibaba’s mobile revenue saw significant growth reaching RMB2.5bn in FY1Q15, +922.5%
YoY, implying a mobile monetization rate of 1.49%, +0.91pcpt YoY. This compares to
FY14 mobile revenue of RMB2.9bn, +646.8% YoY, with a mobile monetization rate of
0.91%. Given the monetization challenges in mobile advertising, we believe Alibaba’s
mobile monetization rate will remain at a discount to PC in the near term.
We currently estimate mobile revenue to reach RMB19.7bn in FY15, +576.6% YoY,
representing 30.3% of Alibaba’s China commerce retail revenue and implying a
monetization rate of 1.84%, +0.93pcpt YoY. On the PC front, we are modelling the
monetization rate to reach 3.34% in FY15 and further to 3.54% in FY16, benefiting from
increasing GMV contribution from Tmall which charges merchants transaction-based
commission fees in addition to advertising, as opposed to only advertising on Taobao
marketplace.
Calender year 2012 2013 2014E 2015E 2016E
China's m-Commerce market size (in RMB bn) 69 274 945 2,174 3,696
as % of total e-Commerce 5.8% 14.5% 34.3% 57.5% 77.5%
YoY growth % 490.3% 297.4% 245.0% 130.0% 70.0%
Alibaba's mobile GMV (in RMB bn) 48 232 832 1,709 2,532
as % of total GMV 5.7% 15.0% 37.1% 55.7% 64.9%
YoY growth % 324.1% 258.7% 105.4% 48.1%
Alibaba's m-Commerce market share 69.5% 84.7% 88.0% 78.6% 68.5%
We currently estimate Alibaba’s m-
Commerce market share of 88% in
2014 and 79% in 2015.
BABA
Initiating Coverage
27 October 2014
page 58 of 130 , Equity Analyst, +852 3743 8033, [email protected] Meng
Please see important disclosure information on pages 126 - 130 of this report.
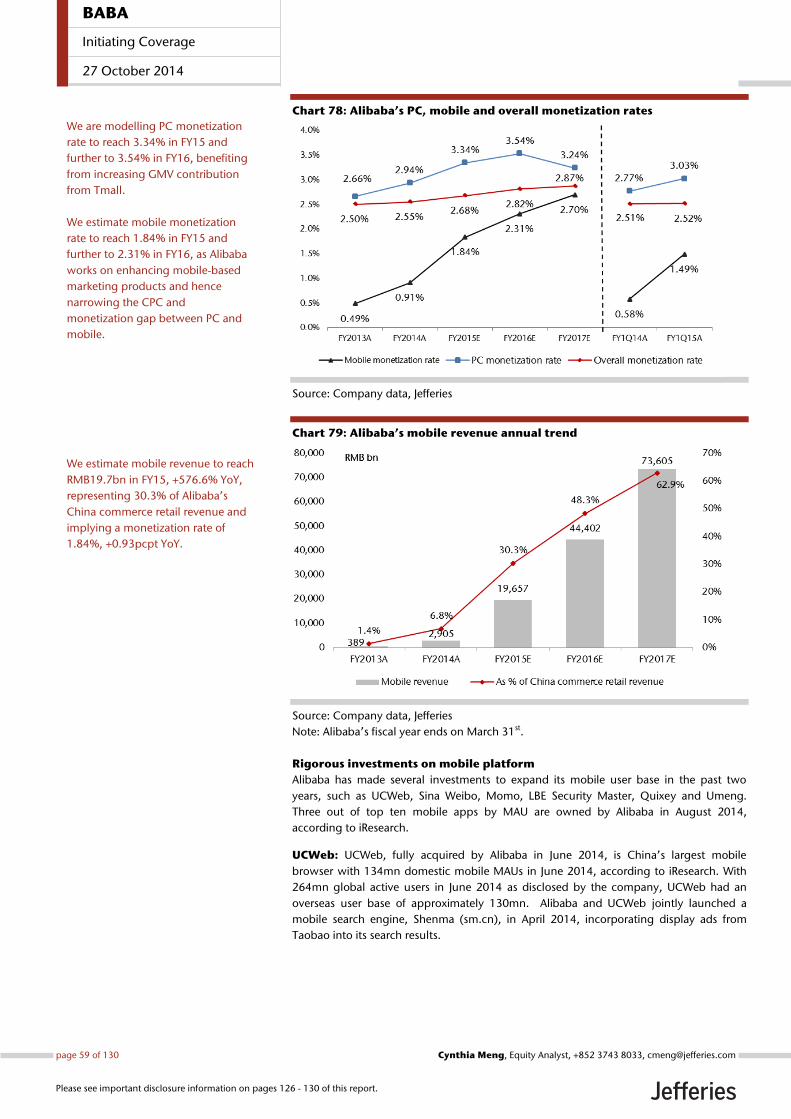
Chart 78: Alibaba’s PC, mobile and overall monetization rates
Source: Company data, Jefferies
Chart 79: Alibaba’s mobile revenue annual trend
Source: Company data, Jefferies
Note: Alibaba’s fiscal year ends on March 31st.
Rigorous investments on mobile platform
Alibaba has made several investments to expand its mobile user base in the past two
years, such as UCWeb, Sina Weibo, Momo, LBE Security Master, Quixey and Umeng.
Three out of top ten mobile apps by MAU are owned by Alibaba in August 2014,
according to iResearch.
UCWeb: UCWeb, fully acquired by Alibaba in June 2014, is China’s largest mobile
browser with 134mn domestic mobile MAUs in June 2014, according to iResearch. With
264mn global active users in June 2014 as disclosed by the company, UCWeb had an
overseas user base of approximately 130mn. Alibaba and UCWeb jointly launched a
mobile search engine, Shenma (sm.cn), in April 2014, incorporating display ads from
Taobao into its search results.
We are modelling PC monetization
rate to reach 3.34% in FY15 and
further to 3.54% in FY16, benefiting
from increasing GMV contribution
from Tmall.
We estimate mobile monetization
rate to reach 1.84% in FY15 and
further to 2.31% in FY16, as Alibaba
works on enhancing mobile-based
marketing products and hence
narrowing the CPC and
monetization gap between PC and
mobile.
We estimate mobile revenue to reach
RMB19.7bn in FY15, +576.6% YoY,
representing 30.3% of Alibaba’s
China commerce retail revenue and
implying a monetization rate of
1.84%, +0.93pcpt YoY.
BABA
Initiating Coverage
27 October 2014
page 59 of 130 , Equity Analyst, +852 3743 8033, [email protected] Meng
Please see important disclosure information on pages 126 - 130 of this report.
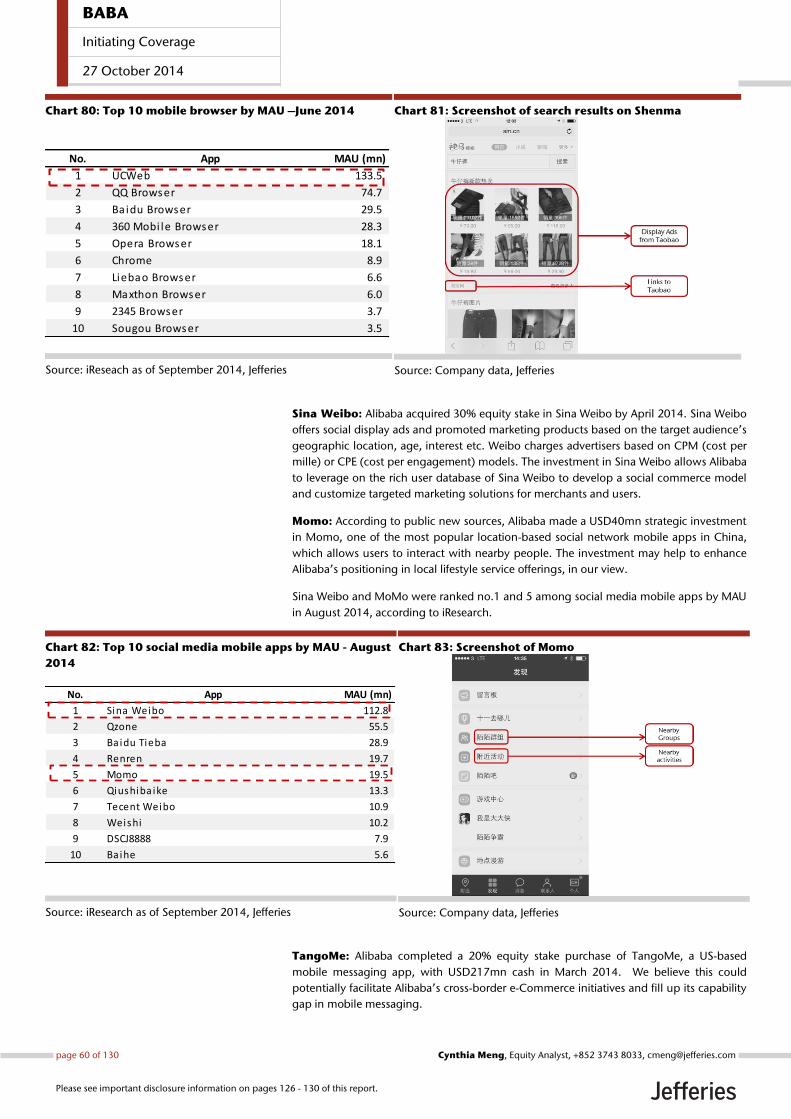
Chart 80: Top 10 mobile browser by MAU –June 2014
Source: iReseach as of September 2014, Jefferies
Chart 81: Screenshot of search results on Shenma
Source: Company data, Jefferies
Sina Weibo: Alibaba acquired 30% equity stake in Sina Weibo by April 2014. Sina Weibo
offers social display ads and promoted marketing products based on the target audience’s
geographic location, age, interest etc. Weibo charges advertisers based on CPM (cost per
mille) or CPE (cost per engagement) models. The investment in Sina Weibo allows Alibaba
to leverage on the rich user database of Sina Weibo to develop a social commerce model
and customize targeted marketing solutions for merchants and users.
Momo: According to public new sources, Alibaba made a USD40mn strategic investment
in Momo, one of the most popular location-based social network mobile apps in China,
which allows users to interact with nearby people. The investment may help to enhance
Alibaba’s positioning in local lifestyle service offerings, in our view.
Sina Weibo and MoMo were ranked no.1 and 5 among social media mobile apps by MAU
in August 2014, according to iResearch.
Chart 82: Top 10 social media mobile apps by MAU - August
2014
Source: iResearch as of September 2014, Jefferies
Chart 83: Screenshot of Momo
Source: Company data, Jefferies
TangoMe: Alibaba completed a 20% equity stake purchase of TangoMe, a US-based
mobile messaging app, with USD217mn cash in March 2014. We believe this could
potentially facilitate Alibaba’s cross-border e-Commerce initiatives and fill up its capability
gap in mobile messaging.
No. App MAU (mn)
1 UCWeb 133.5
2 QQ Browser 74.7
3 Baidu Browser 29.5
4 360 Mobi le Browser 28.3
5 Opera Browser 18.1
6 Chrome 8.9
7 Liebao Browser 6.6
8 Maxthon Browser 6.0
9 2345 Browser 3.7
10 Sougou Browser 3.5
No. App MAU (mn)
1 Sina Weibo 112.8
2 Qzone 55.5
3 Baidu Tieba 28.9
4 Renren 19.7
5 Momo 19.5
6 Qiushibaike 13.3
7 Tecent Weibo 10.9
8 Weishi 10.2
9 DSCJ8888 7.9
10 Baihe 5.6
BABA
Initiating Coverage
27 October 2014
page 60 of 130 , Equity Analyst, +852 3743 8033, [email protected] Meng
Please see important disclosure information on pages 126 - 130 of this report.
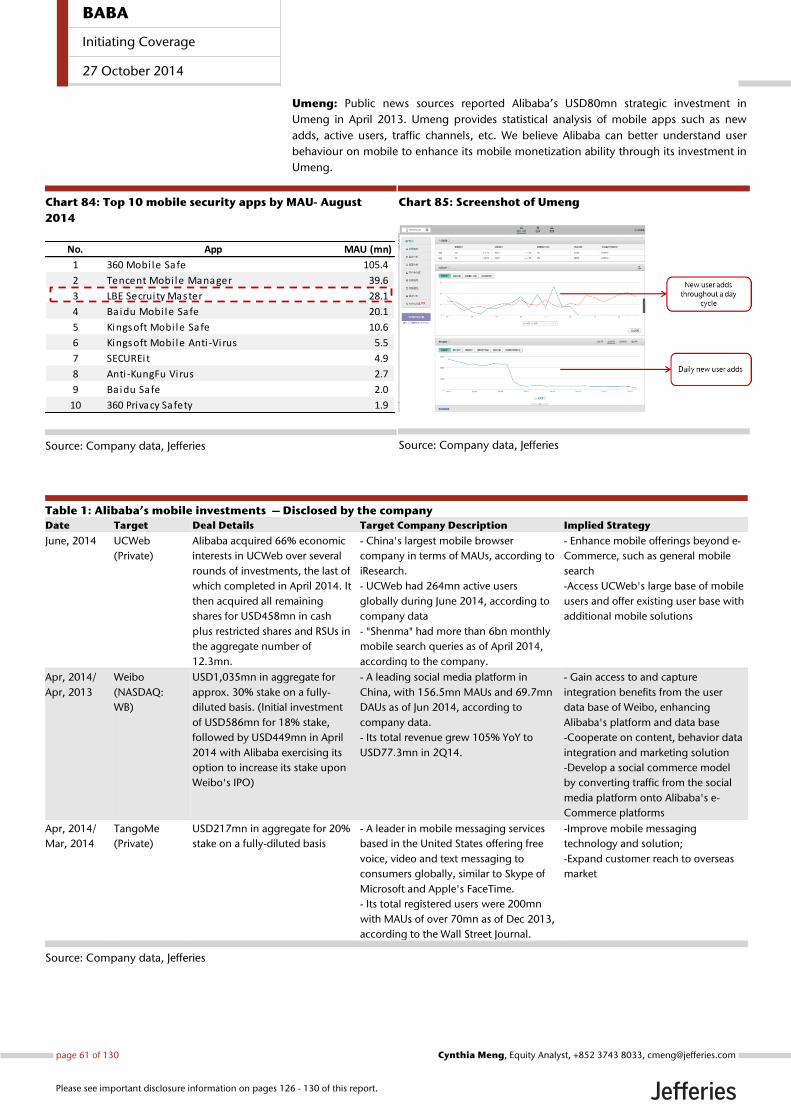
Umeng: Public news sources reported Alibaba’s USD80mn strategic investment in
Umeng in April 2013. Umeng provides statistical analysis of mobile apps such as new
adds, active users, traffic channels, etc. We believe Alibaba can better understand user
behaviour on mobile to enhance its mobile monetization ability through its investment in
Umeng.
Chart 84: Top 10 mobile security apps by MAU- August
2014
Source: Company data, Jefferies
Chart 85: Screenshot of Umeng
Source: Company data, Jefferies
Table 1: Alibaba’s mobile investments – Disclosed by the company
Date Target Deal Details Target Company Description Implied Strategy
June, 2014 UCWeb
(Private)
Alibaba acquired 66% economic
interests in UCWeb over several
rounds of investments, the last of
which completed in April 2014. It
then acquired all remaining
shares for USD458mn in cash
plus restricted shares and RSUs in
the aggregate number of
12.3mn.
- China's largest mobile browser
company in terms of MAUs, according to
iResearch.
- UCWeb had 264mn active users
globally during June 2014, according to
company data
- "Shenma" had more than 6bn monthly
mobile search queries as of April 2014,
according to the company.
- Enhance mobile offerings beyond e-
Commerce, such as general mobile
search
-Access UCWeb's large base of mobile
users and offer existing user base with
additional mobile solutions
Apr, 2014/
Apr, 2013
(NASDAQ:
WB)
USD1,035mn in aggregate for
approx. 30% stake on a fully-
diluted basis. (Initial investment
of USD586mn for 18% stake,
followed by USD449mn in April
2014 with Alibaba exercising its
option to increase its stake upon
Weibo's IPO)
- A leading social media platform in
China, with 156.5mn MAUs and 69.7mn
DAUs as of Jun 2014, according to
company data.
- Its total revenue grew 105% YoY to
USD77.3mn in 2Q14.
- Gain access to and capture
integration benefits from the user
data base of Weibo, enhancing
Alibaba's platform and data base
-Cooperate on content, behavior data
integration and marketing solution
-Develop a social commerce model
by converting traffic from the social
media platform onto Alibaba's e-
Commerce platforms
Apr, 2014/
Mar, 2014
TangoMe
(Private)
USD217mn in aggregate for 20%
stake on a fully-diluted basis
- A leader in mobile messaging services
based in the United States offering free
voice, video and text messaging to
consumers globally, similar to Skype of
Microsoft and Apple's FaceTime.
- Its total registered users were 200mn
with MAUs of over 70mn as of Dec 2013,
according to the Wall Street Journal.
-Improve mobile messaging
technology and solution;
-Expand customer reach to overseas
market
Source: Company data, Jefferies
No. App MAU (mn)
1 360 Mobi le Safe 105.4
2 Tencent Mobi le Manager 39.6
3 LBE Secruity Master 28.1
4 Baidu Mobi le Safe 20.1
5 Kingsoft Mobi le Safe 10.6
6 Kingsoft Mobi le Anti -Virus 5.5
7 SECUREit 4.9
8 Anti -KungFu Virus 2.7
9 Baidu Safe 2.0
10 360 Privacy Safety 1.9
BABA
Initiating Coverage
27 October 2014
page 61 of 130 , Equity Analyst, +852 3743 8033, [email protected] Meng
Please see important disclosure information on pages 126 - 130 of this report.
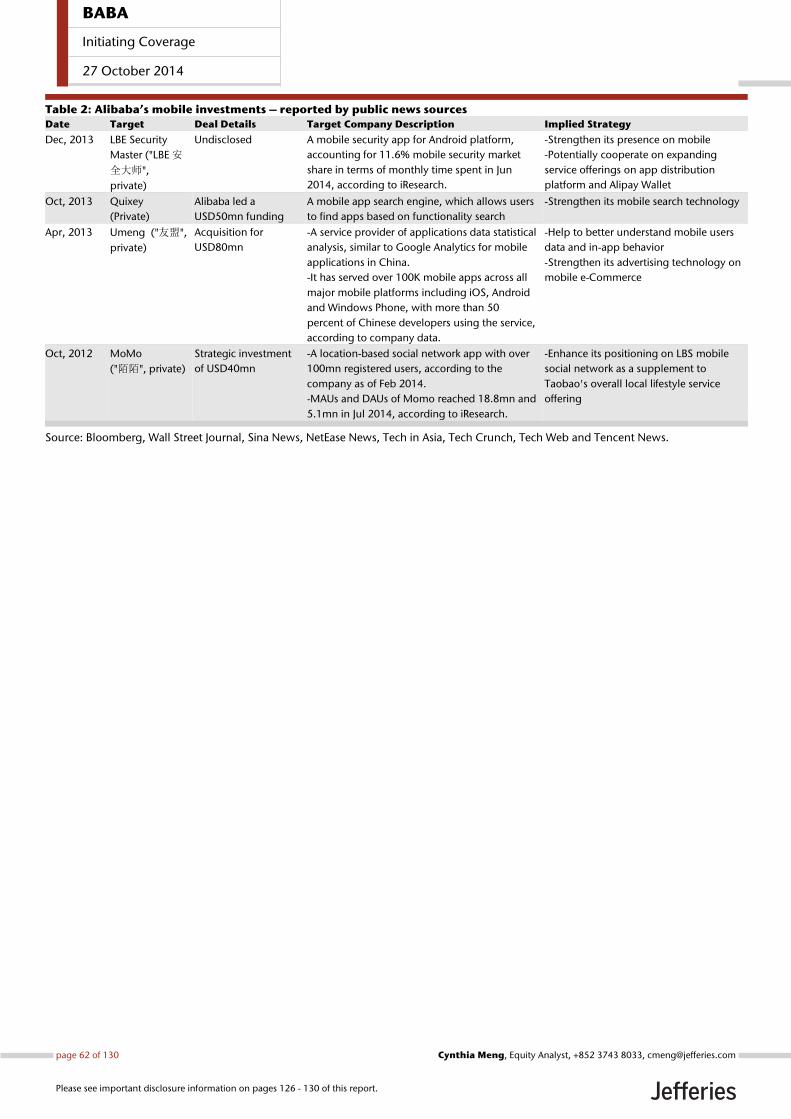
Table 2: Alibaba’s mobile investments – reported by public news sources
Date Target Deal Details Target Company Description Implied Strategy
Dec, 2013 LBE Security
Master ("LBE 安
全大师",
private)
Undisclosed A mobile security app for Android platform,
accounting for 11.6% mobile security market
share in terms of monthly time spent in Jun
2014, according to iResearch.
-Strengthen its presence on mobile
-Potentially cooperate on expanding
service offerings on app distribution
platform and Alipay Wallet
Oct, 2013 Quixey
(Private)
Alibaba led a
USD50mn funding
A mobile app search engine, which allows users
to find apps based on functionality search
-Strengthen its mobile search technology
Apr, 2013 Umeng ("友盟",
private)
Acquisition for
USD80mn
-A service provider of applications data statistical
analysis, similar to Google Analytics for mobile
applications in China.
-It has served over 100K mobile apps across all
major mobile platforms including iOS, Android
and Windows Phone, with more than 50
percent of Chinese developers using the service,
according to company data.
-Help to better understand mobile users
data and in-app behavior
-Strengthen its advertising technology on
mobile e-Commerce
Oct, 2012 MoMo
("陌陌", private)
Strategic investment
of USD40mn
-A location-based social network app with over
100mn registered users, according to the
company as of Feb 2014.
-MAUs and DAUs of Momo reached 18.8mn and
5.1mn in Jul 2014, according to iResearch.
-Enhance its positioning on LBS mobile
social network as a supplement to
Taobao's overall local lifestyle service
offering
Source: Bloomberg, Wall Street Journal, Sina News, NetEase News, Tech in Asia, Tech Crunch, Tech Web and Tencent News.
BABA
Initiating Coverage
27 October 2014
page 62 of 130 , Equity Analyst, +852 3743 8033, [email protected] Meng
Please see important disclosure information on pages 126 - 130 of this report.
Building the Largest Ecosystem Alibaba’s large and growing ecosystem is supported by its expanding logistics platform,
payment settlement services and Internet finance business.
In this section, we discuss the following:
1. Investing in Smart Logistics: Alibaba’s China retail marketplace generated
5bn packages in 2013, accounting for 54.4% of total package delivery in China.
In order to meet increasing delivery demands and strengthen its overseas
logistics solution for cross-border e-Commerce opportunities, Alibaba has been
stepping up investment effort in expanding its logistics platform, including
China Smart Logistics, Haier/Goodaymart and Singapore Post.
2. Alipay: As a core component of Alibaba’s ecosystem, Alipay provides secure
and convenient online payment services for buyers and sellers as well as a
stream of applications touching different aspects of consumers’ daily lives.
Alipay accounted for 48.8% market share of China’s third-party online payment
and 79.9% on the mobile front in 2Q14, according to iResearch.
3. Internet finance: Leveraging on the data and credit history accumulated from
its online platforms, Alibaba, through Small and Micro Financial Services
Company, pushes into Internet finance including wealth management, SME
loan and Internet banking to further enhance user engagement within its
ecosystem. Its money market fund product, Yu’e Bao, accounted for 98% of
AUM managed by Tianhong Asset Management, making it the largest asset
management company in China in 1H14.
4. New verticals: Alibaba is making inroads into new verticals such as healthcare,
digital media & entertainment and local lifestyle services to capture growth
opportunities and build out its O2O ecosystem.
BABA
Initiating Coverage
27 October 2014
page 63 of 130 , Equity Analyst, +852 3743 8033, [email protected] Meng
Please see important disclosure information on pages 126 - 130 of this report.
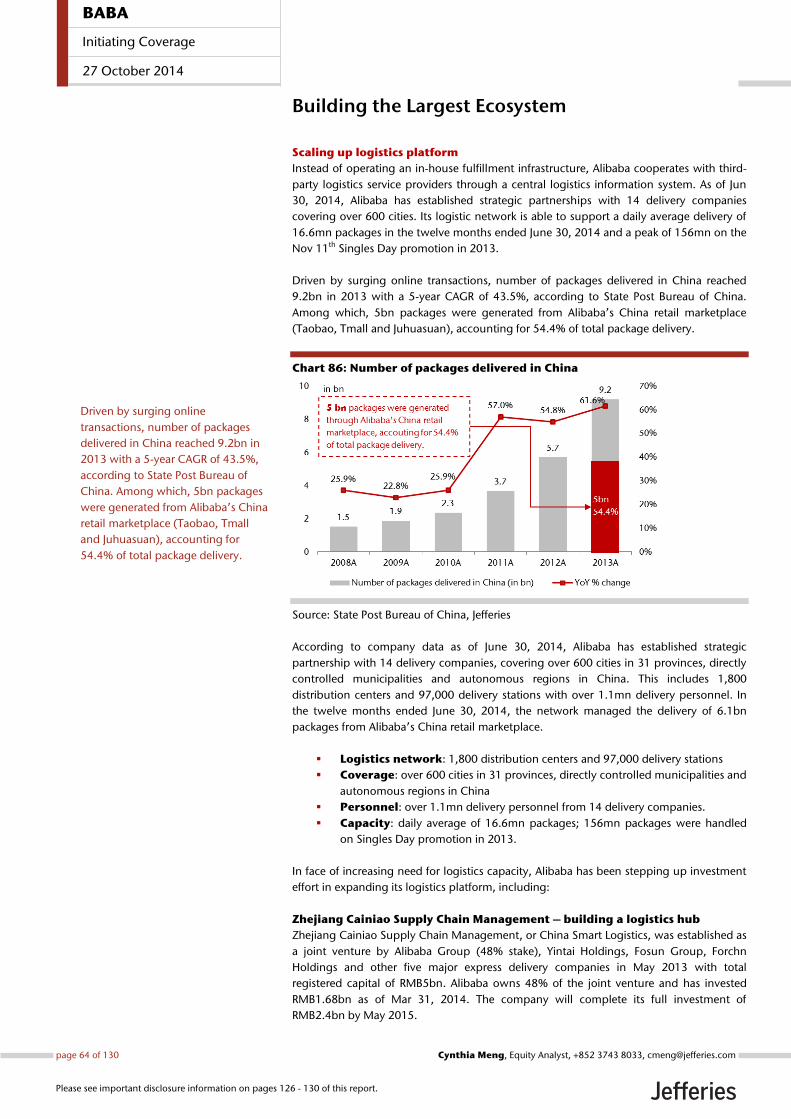
Building the Largest Ecosystem
Scaling up logistics platform
Instead of operating an in-house fulfillment infrastructure, Alibaba cooperates with third-
party logistics service providers through a central logistics information system. As of Jun
30, 2014, Alibaba has established strategic partnerships with 14 delivery companies
covering over 600 cities. Its logistic network is able to support a daily average delivery of
16.6mn packages in the twelve months ended June 30, 2014 and a peak of 156mn on the
Nov 11th Singles Day promotion in 2013.
Driven by surging online transactions, number of packages delivered in China reached
9.2bn in 2013 with a 5-year CAGR of 43.5%, according to State Post Bureau of China.
Among which, 5bn packages were generated from Alibaba’s China retail marketplace
(Taobao, Tmall and Juhuasuan), accounting for 54.4% of total package delivery.
Chart 86: Number of packages delivered in China
Source: State Post Bureau of China, Jefferies
According to company data as of June 30, 2014, Alibaba has established strategic
partnership with 14 delivery companies, covering over 600 cities in 31 provinces, directly
controlled municipalities and autonomous regions in China. This includes 1,800
distribution centers and 97,000 delivery stations with over 1.1mn delivery personnel. In
the twelve months ended June 30, 2014, the network managed the delivery of 6.1bn
packages from Alibaba’s China retail marketplace.
Logistics network: 1,800 distribution centers and 97,000 delivery stations
Coverage: over 600 cities in 31 provinces, directly controlled municipalities and
autonomous regions in China
Personnel: over 1.1mn delivery personnel from 14 delivery companies.
Capacity: daily average of 16.6mn packages; 156mn packages were handled
on Singles Day promotion in 2013.
In face of increasing need for logistics capacity, Alibaba has been stepping up investment
effort in expanding its logistics platform, including:
Zhejiang Cainiao Supply Chain Management – building a logistics hub
Zhejiang Cainiao Supply Chain Management, or China Smart Logistics, was established as
a joint venture by Alibaba Group (48% stake), Yintai Holdings, Fosun Group, Forchn
Holdings and other five major express delivery companies in May 2013 with total
registered capital of RMB5bn. Alibaba owns 48% of the joint venture and has invested
RMB1.68bn as of Mar 31, 2014. The company will complete its full investment of
RMB2.4bn by May 2015.
Driven by surging online
transactions, number of packages
delivered in China reached 9.2bn in
2013 with a 5-year CAGR of 43.5%,
according to State Post Bureau of
China. Among which, 5bn packages
were generated from Alibaba’s China
retail marketplace (Taobao, Tmall
and Juhuasuan), accounting for
54.4% of total package delivery.
BABA
Initiating Coverage
27 October 2014
page 64 of 130 , Equity Analyst, +852 3743 8033, [email protected] Meng
Please see important disclosure information on pages 126 - 130 of this report.
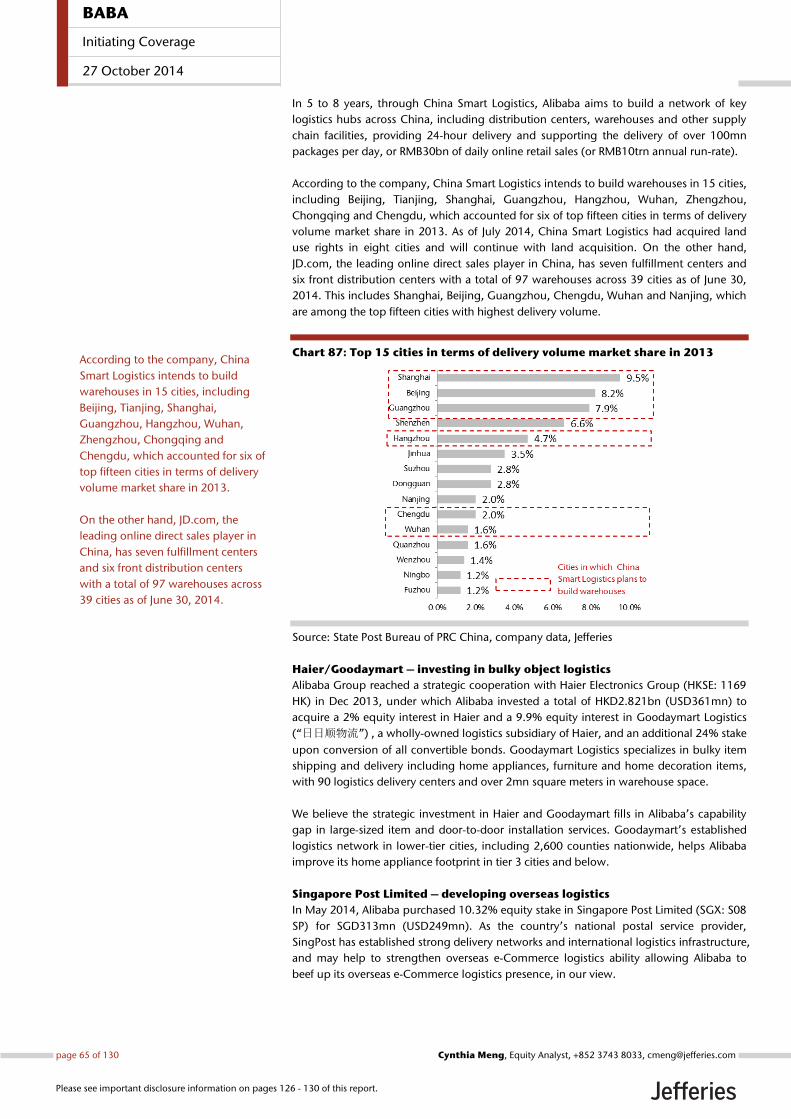
In 5 to 8 years, through China Smart Logistics, Alibaba aims to build a network of key
logistics hubs across China, including distribution centers, warehouses and other supply
chain facilities, providing 24-hour delivery and supporting the delivery of over 100mn
packages per day, or RMB30bn of daily online retail sales (or RMB10trn annual run-rate).
According to the company, China Smart Logistics intends to build warehouses in 15 cities,
including Beijing, Tianjing, Shanghai, Guangzhou, Hangzhou, Wuhan, Zhengzhou,
Chongqing and Chengdu, which accounted for six of top fifteen cities in terms of delivery
volume market share in 2013. As of July 2014, China Smart Logistics had acquired land
use rights in eight cities and will continue with land acquisition. On the other hand,
JD.com, the leading online direct sales player in China, has seven fulfillment centers and
six front distribution centers with a total of 97 warehouses across 39 cities as of June 30,
2014. This includes Shanghai, Beijing, Guangzhou, Chengdu, Wuhan and Nanjing, which
are among the top fifteen cities with highest delivery volume.
Chart 87: Top 15 cities in terms of delivery volume market share in 2013
Source: State Post Bureau of PRC China, company data, Jefferies
Haier/Goodaymart – investing in bulky object logistics
Alibaba Group reached a strategic cooperation with Haier Electronics Group (HKSE: 1169
HK) in Dec 2013, under which Alibaba invested a total of HKD2.821bn (USD361mn) to
acquire a 2% equity interest in Haier and a 9.9% equity interest in Goodaymart Logistics
(“日日顺物流”) , a wholly-owned logistics subsidiary of Haier, and an additional 24% stake
upon conversion of all convertible bonds. Goodaymart Logistics specializes in bulky item
shipping and delivery including home appliances, furniture and home decoration items,
with 90 logistics delivery centers and over 2mn square meters in warehouse space.
We believe the strategic investment in Haier and Goodaymart fills in Alibaba’s capability
gap in large-sized item and door-to-door installation services. Goodaymart’s established
logistics network in lower-tier cities, including 2,600 counties nationwide, helps Alibaba
improve its home appliance footprint in tier 3 cities and below.
Singapore Post Limited – developing overseas logistics
In May 2014, Alibaba purchased 10.32% equity stake in Singapore Post Limited (SGX: S08
SP) for SGD313mn (USD249mn). As the country’s national postal service provider,
SingPost has established strong delivery networks and international logistics infrastructure,
and may help to strengthen overseas e-Commerce logistics ability allowing Alibaba to
beef up its overseas e-Commerce logistics presence, in our view.
According to the company, China
Smart Logistics intends to build
warehouses in 15 cities, including
Beijing, Tianjing, Shanghai,
Guangzhou, Hangzhou, Wuhan,
Zhengzhou, Chongqing and
Chengdu, which accounted for six of
top fifteen cities in terms of delivery
volume market share in 2013.
On the other hand, JD.com, the
leading online direct sales player in
China, has seven fulfillment centers
and six front distribution centers
with a total of 97 warehouses across
39 cities as of June 30, 2014.
BABA
Initiating Coverage
27 October 2014
page 65 of 130 , Equity Analyst, +852 3743 8033, [email protected] Meng
Please see important disclosure information on pages 126 - 130 of this report.
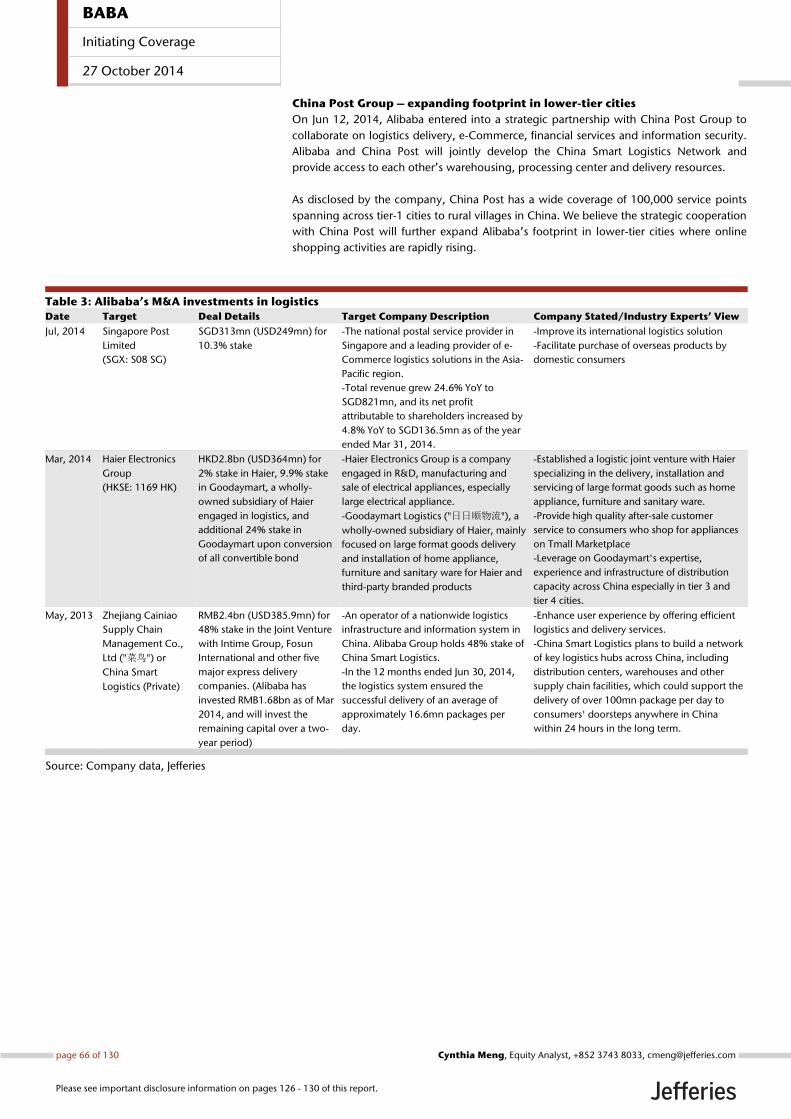
China Post Group – expanding footprint in lower-tier cities
On Jun 12, 2014, Alibaba entered into a strategic partnership with China Post Group to
collaborate on logistics delivery, e-Commerce, financial services and information security.
Alibaba and China Post will jointly develop the China Smart Logistics Network and
provide access to each other’s warehousing, processing center and delivery resources.
As disclosed by the company, China Post has a wide coverage of 100,000 service points
spanning across tier-1 cities to rural villages in China. We believe the strategic cooperation
with China Post will further expand Alibaba’s footprint in lower-tier cities where online
shopping activities are rapidly rising.
Table 3: Alibaba’s M&A investments in logistics
Date Target Deal Details Target Company Description Company Stated/Industry Experts’ View
Jul, 2014 Singapore Post
Limited
(SGX: S08 SG)
SGD313mn (USD249mn) for
10.3% stake
-The national postal service provider in
Singapore and a leading provider of e-
Commerce logistics solutions in the Asia-
Pacific region.
-Total revenue grew 24.6% YoY to
SGD821mn, and its net profit
attributable to shareholders increased by
4.8% YoY to SGD136.5mn as of the year
ended Mar 31, 2014.
-Improve its international logistics solution
-Facilitate purchase of overseas products by
domestic consumers
Mar, 2014 Haier Electronics
Group
(HKSE: 1169 HK)
HKD2.8bn (USD364mn) for
2% stake in Haier, 9.9% stake
in Goodaymart, a wholly-
owned subsidiary of Haier
engaged in logistics, and
additional 24% stake in
Goodaymart upon conversion
of all convertible bond
-Haier Electronics Group is a company
engaged in R&D, manufacturing and
sale of electrical appliances, especially
large electrical appliance.
-Goodaymart Logistics ("日日顺物流"), a
wholly-owned subsidiary of Haier, mainly
focused on large format goods delivery
and installation of home appliance,
furniture and sanitary ware for Haier and
third-party branded products
-Established a logistic joint venture with Haier
specializing in the delivery, installation and
servicing of large format goods such as home
appliance, furniture and sanitary ware.
-Provide high quality after-sale customer
service to consumers who shop for appliances
on Tmall Marketplace
-Leverage on Goodaymart's expertise,
experience and infrastructure of distribution
capacity across China especially in tier 3 and
tier 4 cities.
May, 2013 Zhejiang Cainiao
Supply Chain
Management Co.,
Ltd ("菜鸟") or
China Smart
Logistics (Private)
RMB2.4bn (USD385.9mn) for
48% stake in the Joint Venture
with Intime Group, Fosun
International and other five
major express delivery
companies. (Alibaba has
invested RMB1.68bn as of Mar
2014, and will invest the
remaining capital over a two-
year period)
-An operator of a nationwide logistics
infrastructure and information system in
China. Alibaba Group holds 48% stake of
China Smart Logistics.
-In the 12 months ended Jun 30, 2014,
the logistics system ensured the
successful delivery of an average of
approximately 16.6mn packages per
day.
-Enhance user experience by offering efficient
logistics and delivery services.
-China Smart Logistics plans to build a network
of key logistics hubs across China, including
distribution centers, warehouses and other
supply chain facilities, which could support the
delivery of over 100mn package per day to
consumers' doorsteps anywhere in China
within 24 hours in the long term.
Source: Company data, Jefferies
BABA
Initiating Coverage
27 October 2014
page 66 of 130 , Equity Analyst, +852 3743 8033, [email protected] Meng
Please see important disclosure information on pages 126 - 130 of this report.
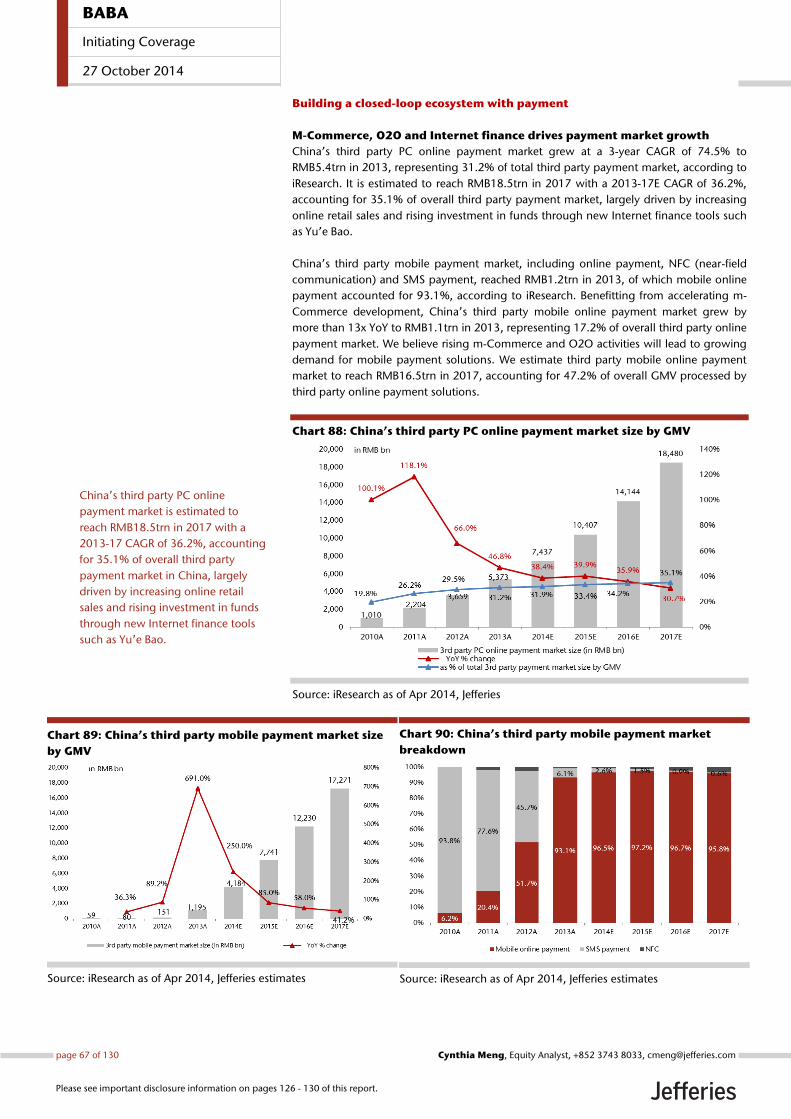
Building a closed-loop ecosystem with payment
M-Commerce, O2O and Internet finance drives payment market growth
China’s third party PC online payment market grew at a 3-year CAGR of 74.5% to
RMB5.4trn in 2013, representing 31.2% of total third party payment market, according to
iResearch. It is estimated to reach RMB18.5trn in 2017 with a 2013-17E CAGR of 36.2%,
accounting for 35.1% of overall third party payment market, largely driven by increasing
online retail sales and rising investment in funds through new Internet finance tools such
as Yu’e Bao.
China’s third party mobile payment market, including online payment, NFC (near-field
communication) and SMS payment, reached RMB1.2trn in 2013, of which mobile online
payment accounted for 93.1%, according to iResearch. Benefitting from accelerating m-
Commerce development, China’s third party mobile online payment market grew by
more than 13x YoY to RMB1.1trn in 2013, representing 17.2% of overall third party online
payment market. We believe rising m-Commerce and O2O activities will lead to growing
demand for mobile payment solutions. We estimate third party mobile online payment
market to reach RMB16.5trn in 2017, accounting for 47.2% of overall GMV processed by
third party online payment solutions.
Chart 88: China’s third party PC online payment market size by GMV
Source: iResearch as of Apr 2014, Jefferies
Chart 89: China’s third party mobile payment market size
by GMV
Source: iResearch as of Apr 2014, Jefferies estimates
Chart 90: China’s third party mobile payment market
breakdown
Source: iResearch as of Apr 2014, Jefferies estimates
China’s third party PC online
payment market is estimated to
reach RMB18.5trn in 2017 with a
2013-17 CAGR of 36.2%, accounting
for 35.1% of overall third party
payment market in China, largely
driven by increasing online retail
sales and rising investment in funds
through new Internet finance tools
such as Yu’e Bao.
BABA
Initiating Coverage
27 October 2014
page 67 of 130 , Equity Analyst, +852 3743 8033, [email protected] Meng
Please see important disclosure information on pages 126 - 130 of this report.
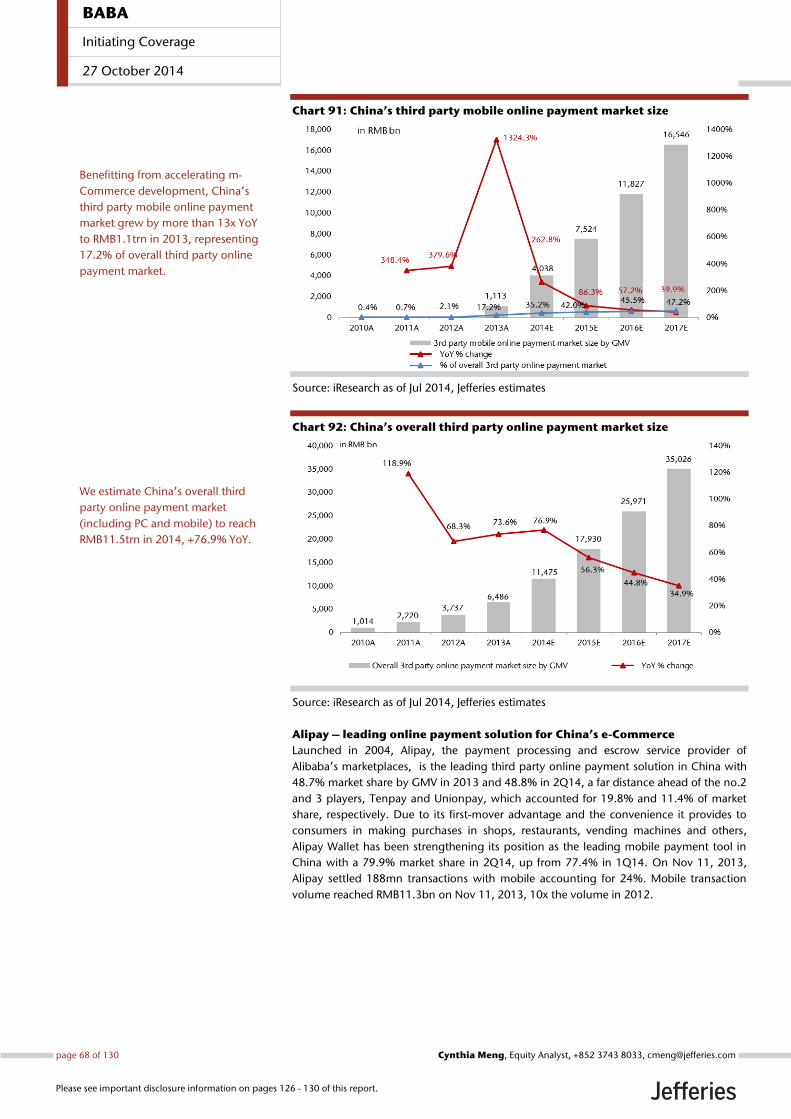
Chart 91: China’s third party mobile online payment market size
Source: iResearch as of Jul 2014, Jefferies estimates
Chart 92: China’s overall third party online payment market size
Source: iResearch as of Jul 2014, Jefferies estimates
Alipay – leading online payment solution for China’s e-Commerce
Launched in 2004, Alipay, the payment processing and escrow service provider of
Alibaba’s marketplaces, is the leading third party online payment solution in China with
48.7% market share by GMV in 2013 and 48.8% in 2Q14, a far distance ahead of the no.2
and 3 players, Tenpay and Unionpay, which accounted for 19.8% and 11.4% of market
share, respectively. Due to its first-mover advantage and the convenience it provides to
consumers in making purchases in shops, restaurants, vending machines and others,
Alipay Wallet has been strengthening its position as the leading mobile payment tool in
China with a 79.9% market share in 2Q14, up from 77.4% in 1Q14. On Nov 11, 2013,
Alipay settled 188mn transactions with mobile accounting for 24%. Mobile transaction
volume reached RMB11.3bn on Nov 11, 2013, 10x the volume in 2012.
Benefitting from accelerating m-
Commerce development, China’s
third party mobile online payment
market grew by more than 13x YoY
to RMB1.1trn in 2013, representing
17.2% of overall third party online
payment market.
We estimate China’s overall third
party online payment market
(including PC and mobile) to reach
RMB11.5trn in 2014, +76.9% YoY.
BABA
Initiating Coverage
27 October 2014
page 68 of 130 , Equity Analyst, +852 3743 8033, [email protected] Meng
Please see important disclosure information on pages 126 - 130 of this report.
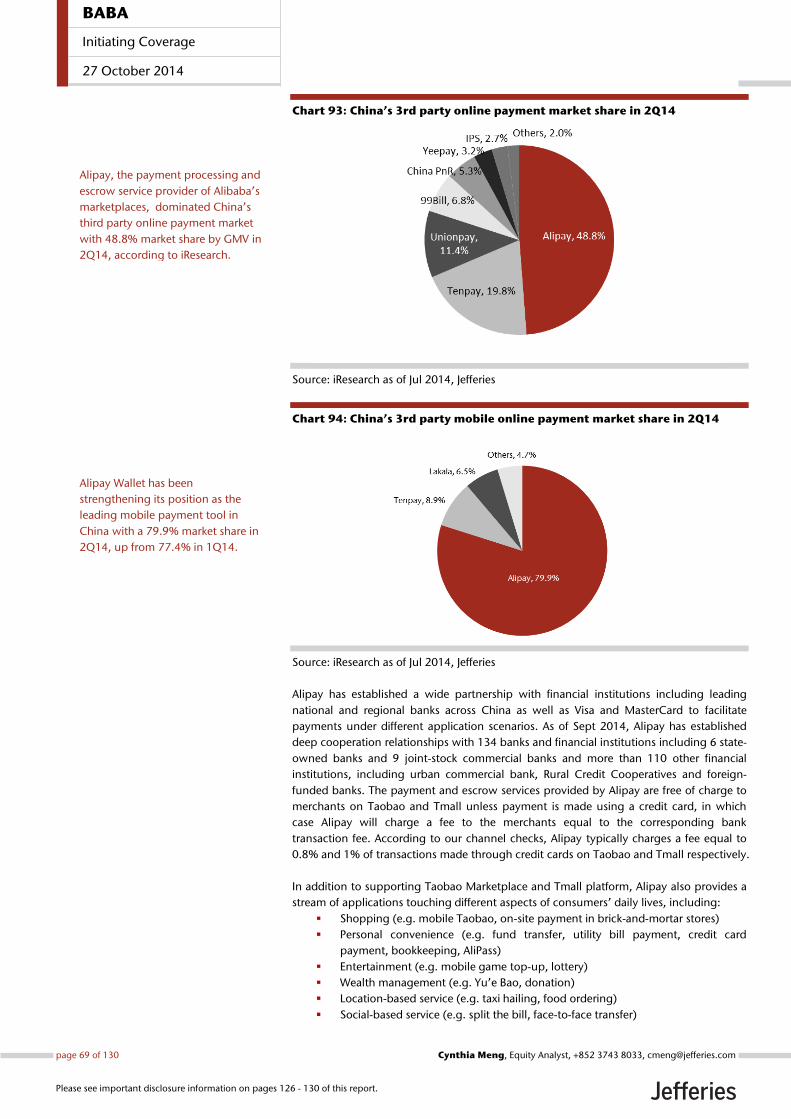
Chart 93: China’s 3rd party online payment market share in 2Q14
Source: iResearch as of Jul 2014, Jefferies
Chart 94: China’s 3rd party mobile online payment market share in 2Q14
Source: iResearch as of Jul 2014, Jefferies
Alipay has established a wide partnership with financial institutions including leading
national and regional banks across China as well as Visa and MasterCard to facilitate
payments under different application scenarios. As of Sept 2014, Alipay has established
deep cooperation relationships with 134 banks and financial institutions including 6 state-
owned banks and 9 joint-stock commercial banks and more than 110 other financial
institutions, including urban commercial bank, Rural Credit Cooperatives and foreign-
funded banks. The payment and escrow services provided by Alipay are free of charge to
merchants on Taobao and Tmall unless payment is made using a credit card, in which
case Alipay will charge a fee to the merchants equal to the corresponding bank
transaction fee. According to our channel checks, Alipay typically charges a fee equal to
0.8% and 1% of transactions made through credit cards on Taobao and Tmall respectively.
In addition to supporting Taobao Marketplace and Tmall platform, Alipay also provides a
stream of applications touching different aspects of consumers’ daily lives, including:
Shopping (e.g. mobile Taobao, on-site payment in brick-and-mortar stores)
Personal convenience (e.g. fund transfer, utility bill payment, credit card
payment, bookkeeping, AliPass)
Entertainment (e.g. mobile game top-up, lottery)
Wealth management (e.g. Yu’e Bao, donation)
Location-based service (e.g. taxi hailing, food ordering)
Social-based service (e.g. split the bill, face-to-face transfer)
Alipay, the payment processing and
escrow service provider of Alibaba’s
marketplaces, dominated China’s
third party online payment market
with 48.8% market share by GMV in
2Q14, according to iResearch.
Alipay Wallet has been
strengthening its position as the
leading mobile payment tool in
China with a 79.9% market share in
2Q14, up from 77.4% in 1Q14.
BABA
Initiating Coverage
27 October 2014
page 69 of 130 , Equity Analyst, +852 3743 8033, [email protected] Meng
Please see important disclosure information on pages 126 - 130 of this report.
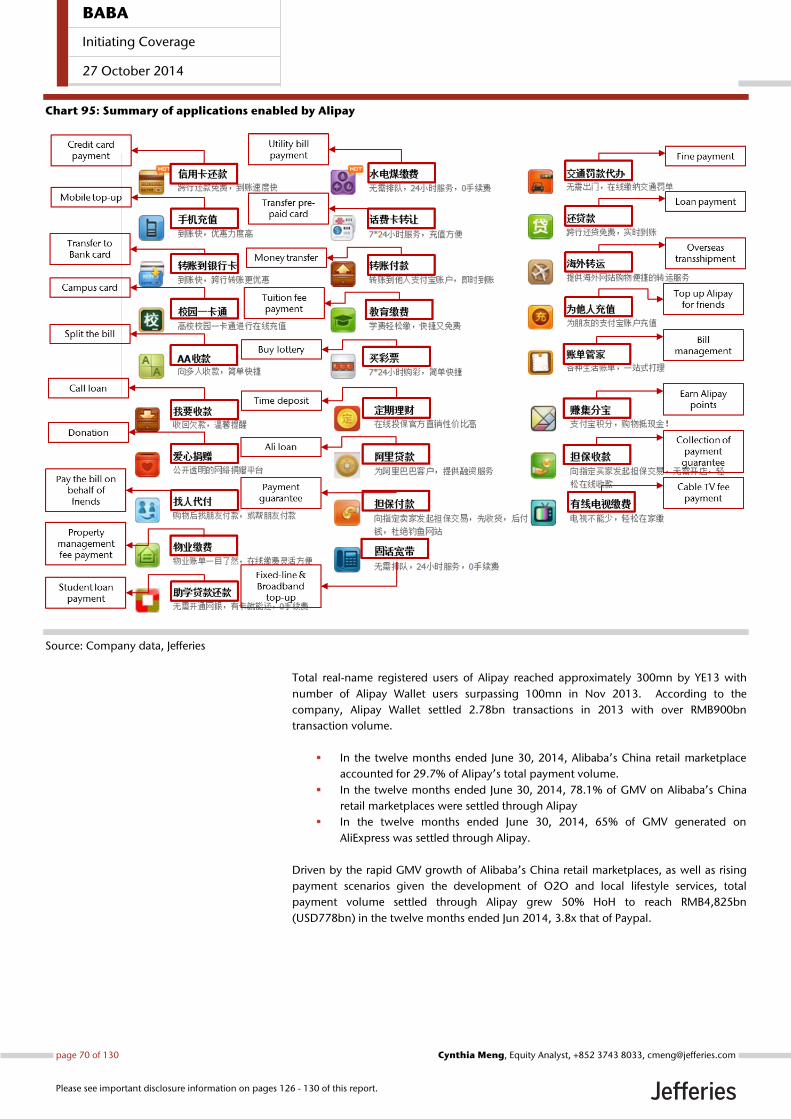
Chart 95: Summary of applications enabled by Alipay
Source: Company data, Jefferies
Total real-name registered users of Alipay reached approximately 300mn by YE13 with
number of Alipay Wallet users surpassing 100mn in Nov 2013. According to the
company, Alipay Wallet settled 2.78bn transactions in 2013 with over RMB900bn
transaction volume.
In the twelve months ended June 30, 2014, Alibaba’s China retail marketplace
accounted for 29.7% of Alipay’s total payment volume.
In the twelve months ended June 30, 2014, 78.1% of GMV on Alibaba’s China
retail marketplaces were settled through Alipay
In the twelve months ended June 30, 2014, 65% of GMV generated on
AliExpress was settled through Alipay.
Driven by the rapid GMV growth of Alibaba’s China retail marketplaces, as well as rising
payment scenarios given the development of O2O and local lifestyle services, total
payment volume settled through Alipay grew 50% HoH to reach RMB4,825bn
(USD778bn) in the twelve months ended Jun 2014, 3.8x that of Paypal.
BABA
Initiating Coverage
27 October 2014
page 70 of 130 , Equity Analyst, +852 3743 8033, [email protected] Meng
Please see important disclosure information on pages 126 - 130 of this report.

Chart 96: Operation metrics comparison across payment tools
Source: Company data, Jefferies Note: (1) no. of registered accounts is defined as the no. of accounts as of the end of the specified period. Among the 800mn Alipay's registered accounts, 300mn are
registered with real names. PayPal's registered accounts refer to active registered accounts. (2) Alipay’s commission rate refers to the fees charged to merchants
(excluding Alibaba’s marketplaces) who use Alipay as online payment tool on their platforms. Commission rate ranges from 0.7%-1.2% on PC and 1.8%-2% on mobile.
(3) PayPal’s commission rate is calculated by dividing total revenue by total payment volume.
Given the large user base of Alipay, third party websites such as Vipshop have also
adopted Alipay as one of their online payment solutions. Compared to 0.18-0.19%
charged to internal merchants, Alipay charges merchants outside of its Alibaba
marketplaces a commission fee ranging from 0.7%-1.2% on PC and 1.8%-2% on mobile,
depending on the total transaction volume settled through Alipay within the year. This
rate is much lower compared to Paypal’s implied commission rate of 3.5% as of June
2014. Alipay also provides an annual payment package offering discounted commission
rates to merchants upon making a prepayment.
Chart 97: Commission charged to merchants (excluding Alibaba’s
marketplaces) based on GMV settled through Alipay on PC
Source: Company data, Jefferies
Chart 98: Commission charged to merchants (excluding Alibaba’s
marketplaces) based on GMV settled through Alipay on mobile
Source: Company data, Jefferies
Chart 99: Annual payment package available for merchants (excluding
Alibaba’s marketplaces) based on GMV settled through Alipay on PC
Source: Company data, Jefferies
Note: Any additional transaction volume above the maximum allowance will be charged a
1.2% commission rate
Twelve months ended as of Dec-13 Jun-14 Dec-13 Jun-14 Dec-13 Jun-14
No. of registered accounts (mn) 800 (1) n.a. 143 152 >200 n.a.
Total payment volume (in USD bn) 519 778 180 203 n.a. n.a.
Commission rate 0.7%-2%(2) 0.7%-2% 3.7% (3) 3.5% 1% 1%
Mobile as % of total payment volume 27.9% n.a. 15.0% n.a. n.a. n.a.
Alipay PayPal TenPay
Transaction Volume (RMB) Commission rate
0-60K 1.2%
60K-500K 1.0%
500K-1mn 0.9%
1mn-2mn 0.8%
Above 2mn 0.7%
Transaction Volume (RMB) Commission rate
0-1mn 2.0%
Above 1mn 1.8%
Prepayment (RMB) Transaction volume(RMB) Commission rate
600 60K 1.0%
1,800 200K 0.9%
3,600 450K 0.8%
Compared to 0.18-0.19% charged to
internal merchants, Alipay charges
merchants outside of its Alibaba’s
marketplaces a commission fee
ranging from 0.7%-1.2% on PC,
according to company data.
Alipay also provides annual payment
package offering discounted
commission rate to merchants upon
making a prepayment.
Alipay charges merchants outside of
its Alibaba marketplaces a
commission fee ranging from 1.8%-
2% on mobile, according to
company data.
BABA
Initiating Coverage
27 October 2014
page 71 of 130 , Equity Analyst, +852 3743 8033, [email protected] Meng
Please see important disclosure information on pages 126 - 130 of this report.
Alipay Commercial agreement & intellectual property and software
technology services agreement
Pursuant to the Alipay commercial agreement, Alipay provides payment processing
services to Alibaba Group and its subsidiaries in return for a fee on preferential terms to
Alibaba. Fees paid by Alibaba to Alipay amounted to RMB1.3bn, RMB1.6bn, RMB2.3bn
and RMB740mn in FY12, FY13, FY14 and the three months ended June 30, 2014
respectively, implying a payment fee of approximately 0.18% as a percentage of payment
volume settled through Alipay on Alibaba’s China retail marketplaces in FY14.
Pursuant to an intellectual property and software technology services agreement, Alipay
pays Alibaba royalty fees and software technology service fees equal to the sum of an
expense reimbursement plus 49.9% of the consolidated pre-tax income of Alipay. As
disclosed by the company, Alipay paid a royalty and software technology service fee to
Alibaba of RMB27mn, RMB277mn, RMB1,764mn and RMB527mn in FY12, FY13, FY14
and the three months ended June 30, 2014 respectively.
2011 Framework agreement
Upon the occurrence of certain liquidity events of Alipay (including an initial public
offering, a transfer of 37.5% or more of the equity interests of Alipay or a sale of all or
substantially all assets of Alipay), Small and Micro Financial Services Company will pay
Alibaba Group an amount equal to 37.5% of the equity value of Alipay with a minimum
payment of USD2bn and a maximum payment of USD6bn.
If a liquidity event does not occur by the tenth anniversary of July 29, 2011, Alibaba
Group will have the right to demand Alipay effect a liquidity event provided that the
equity or enterprise value of Alipay at such time exceeds USD1bn. If Alibaba demands a
liquidity event and unless the liquidity event is effected by means of a 37.5% or more
equity interest transfer of Alipay, the minimum amount of USD2bn will not be applicable.
2014 Share and asset purchase agreement (SAPA) & amended Alipay
intellectual property and software technology services agreement
On August 12, 2014, Alibaba entered into a share and asset purchase agreement and
restructured the relationships with Small and Micro Financial Services Company and its
wholly owned subsidiary Alipay. The 2011 framework agreement was terminated.
Alibaba agreed to dispose of the SME loan business to Small and Micro Financial
Services Company in exchange for cash consideration and annual fees for seven
years. Alibaba Group will receive an annual fee equal to 2.5% of the average
daily balance of SME loans from 2015 to 2017; and fixed annual fee equal to the
2017 annual fee from 2018 to 2021. The disposal allows the company to focus
on the core e-commerce businesses and eliminates the direct risks of carrying a
loan portfolio on balance sheet, such as credit defaults, capital adequacy,
leverage and regulatory requirements associated with a loan.
The USD6bn cap on the liquidity event payment under the 2011 framework
agreement has been removed, but Alibaba will still be entitled to a payment of
37.5% of the equity value of Small and Micro Financial Services Company.
The profit share has been restructured that the base of profits was expanded
from the pre-tax income of only Alipay to the pre-tax income of all of the
businesses of Small and Micro Financial Services Company, while the profit
sharing percentage has been reduced to 37.5% from 49.9%.
Upon the IPO of Small and Micro Financial Services Company, Alibaba is entitled
to receive a payment equal to 37.5% of the equity value of Small and Micro
Financial Services Company until Alibaba acquire a full 33% equity interest.
BABA
Initiating Coverage
27 October 2014
page 72 of 130 , Equity Analyst, +852 3743 8033, [email protected] Meng
Please see important disclosure information on pages 126 - 130 of this report.
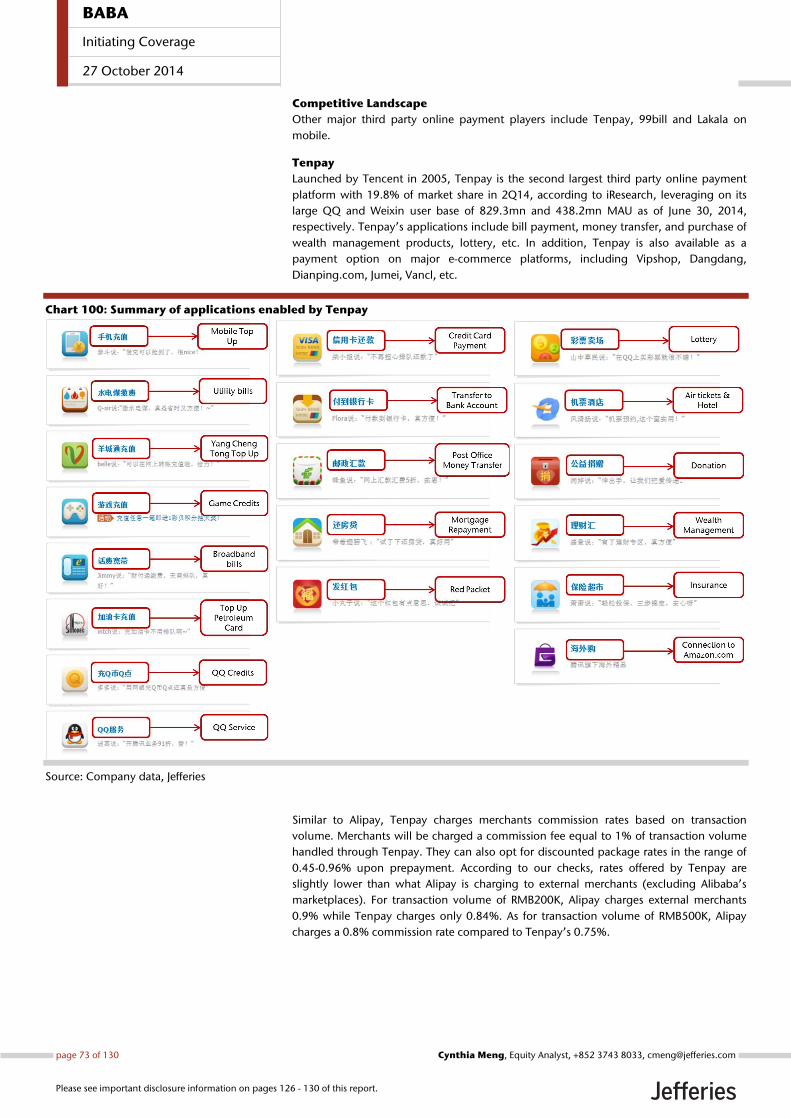
Competitive Landscape
Other major third party online payment players include Tenpay, 99bill and Lakala on
mobile.
Tenpay
Launched by Tencent in 2005, Tenpay is the second largest third party online payment
platform with 19.8% of market share in 2Q14, according to iResearch, leveraging on its
large QQ and Weixin user base of 829.3mn and 438.2mn MAU as of June 30, 2014,
respectively. Tenpay’s applications include bill payment, money transfer, and purchase of
wealth management products, lottery, etc. In addition, Tenpay is also available as a
payment option on major e-commerce platforms, including Vipshop, Dangdang,
Dianping.com, Jumei, Vancl, etc.
Chart 100: Summary of applications enabled by Tenpay
Source: Company data, Jefferies
Similar to Alipay, Tenpay charges merchants commission rates based on transaction
volume. Merchants will be charged a commission fee equal to 1% of transaction volume
handled through Tenpay. They can also opt for discounted package rates in the range of
0.45-0.96% upon prepayment. According to our checks, rates offered by Tenpay are
slightly lower than what Alipay is charging to external merchants (excluding Alibaba’s
marketplaces). For transaction volume of RMB200K, Alipay charges external merchants
0.9% while Tenpay charges only 0.84%. As for transaction volume of RMB500K, Alipay
charges a 0.8% commission rate compared to Tenpay’s 0.75%.
BABA
Initiating Coverage
27 October 2014
page 73 of 130 , Equity Analyst, +852 3743 8033, [email protected] Meng
Please see important disclosure information on pages 126 - 130 of this report.
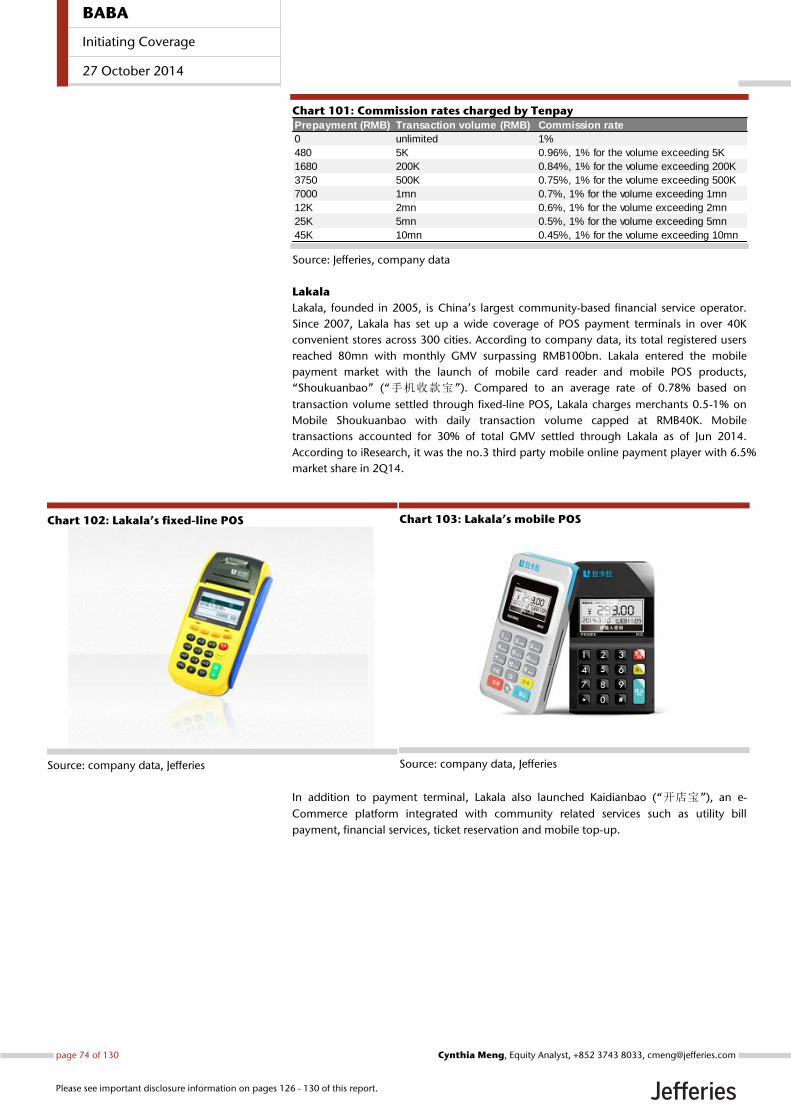
Chart 101: Commission rates charged by Tenpay
Source: Jefferies, company data
Lakala
Lakala, founded in 2005, is China’s largest community-based financial service operator.
Since 2007, Lakala has set up a wide coverage of POS payment terminals in over 40K
convenient stores across 300 cities. According to company data, its total registered users
reached 80mn with monthly GMV surpassing RMB100bn. Lakala entered the mobile
payment market with the launch of mobile card reader and mobile POS products,
“Shoukuanbao” (“手机收款宝”). Compared to an average rate of 0.78% based on
transaction volume settled through fixed-line POS, Lakala charges merchants 0.5-1% on
Mobile Shoukuanbao with daily transaction volume capped at RMB40K. Mobile
transactions accounted for 30% of total GMV settled through Lakala as of Jun 2014.
According to iResearch, it was the no.3 third party mobile online payment player with 6.5%
market share in 2Q14.
Chart 102: Lakala’s fixed-line POS
Source: company data, Jefferies
Chart 103: Lakala’s mobile POS
Source: company data, Jefferies
In addition to payment terminal, Lakala also launched Kaidianbao (“开店宝”), an e-
Commerce platform integrated with community related services such as utility bill
payment, financial services, ticket reservation and mobile top-up.
Prepayment (RMB) Transaction volume (RMB) Commission rate
0 unlimited 1%
480 5K 0.96%, 1% for the volume exceeding 5K
1680 200K 0.84%, 1% for the volume exceeding 200K
3750 500K 0.75%, 1% for the volume exceeding 500K
7000 1mn 0.7%, 1% for the volume exceeding 1mn
12K 2mn 0.6%, 1% for the volume exceeding 2mn
25K 5mn 0.5%, 1% for the volume exceeding 5mn
45K 10mn 0.45%, 1% for the volume exceeding 10mn
BABA
Initiating Coverage
27 October 2014
page 74 of 130 , Equity Analyst, +852 3743 8033, [email protected] Meng
Please see important disclosure information on pages 126 - 130 of this report.
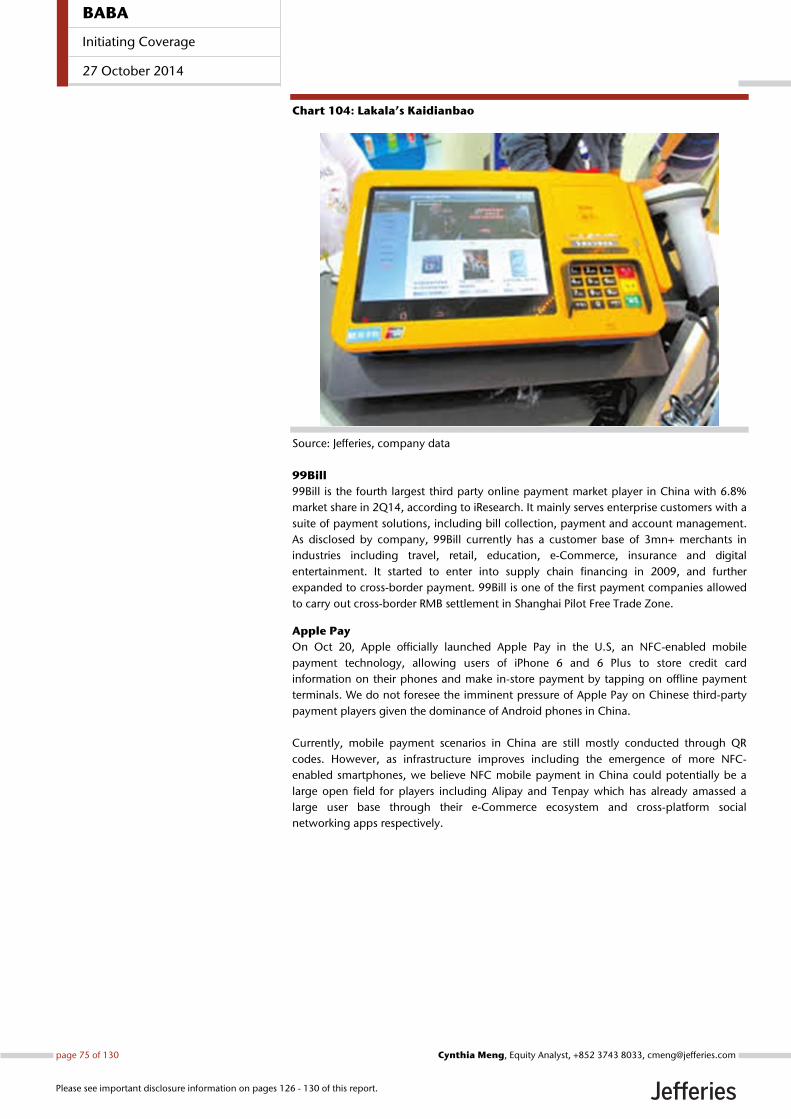
Chart 104: Lakala’s Kaidianbao
Source: Jefferies, company data
99Bill
99Bill is the fourth largest third party online payment market player in China with 6.8%
market share in 2Q14, according to iResearch. It mainly serves enterprise customers with a
suite of payment solutions, including bill collection, payment and account management.
As disclosed by company, 99Bill currently has a customer base of 3mn+ merchants in
industries including travel, retail, education, e-Commerce, insurance and digital
entertainment. It started to enter into supply chain financing in 2009, and further
expanded to cross-border payment. 99Bill is one of the first payment companies allowed
to carry out cross-border RMB settlement in Shanghai Pilot Free Trade Zone.
Apple Pay
On Oct 20, Apple officially launched Apple Pay in the U.S, an NFC-enabled mobile
payment technology, allowing users of iPhone 6 and 6 Plus to store credit card
information on their phones and make in-store payment by tapping on offline payment
terminals. We do not foresee the imminent pressure of Apple Pay on Chinese third-party
payment players given the dominance of Android phones in China.
Currently, mobile payment scenarios in China are still mostly conducted through QR
codes. However, as infrastructure improves including the emergence of more NFC-
enabled smartphones, we believe NFC mobile payment in China could potentially be a
large open field for players including Alipay and Tenpay which has already amassed a
large user base through their e-Commerce ecosystem and cross-platform social
networking apps respectively.
BABA
Initiating Coverage
27 October 2014
page 75 of 130 , Equity Analyst, +852 3743 8033, [email protected] Meng
Please see important disclosure information on pages 126 - 130 of this report.
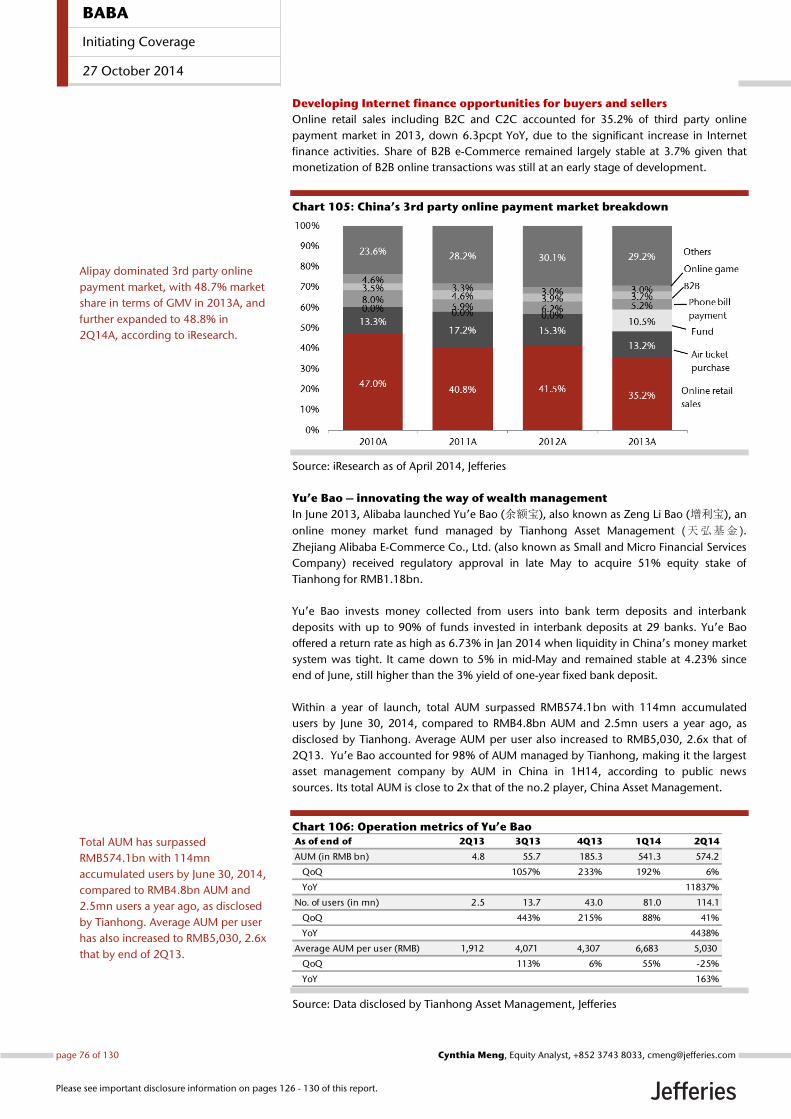
Developing Internet finance opportunities for buyers and sellers
Online retail sales including B2C and C2C accounted for 35.2% of third party online
payment market in 2013, down 6.3pcpt YoY, due to the significant increase in Internet
finance activities. Share of B2B e-Commerce remained largely stable at 3.7% given that
monetization of B2B online transactions was still at an early stage of development.
Chart 105: China’s 3rd party online payment market breakdown
Source: iResearch as of April 2014, Jefferies
Yu’e Bao – innovating the way of wealth management
In June 2013, Alibaba launched Yu’e Bao (余额宝), also known as Zeng Li Bao (增利宝), an
online money market fund managed by Tianhong Asset Management (天弘基金 ).
Zhejiang Alibaba E-Commerce Co., Ltd. (also known as Small and Micro Financial Services
Company) received regulatory approval in late May to acquire 51% equity stake of
Tianhong for RMB1.18bn.
Yu’e Bao invests money collected from users into bank term deposits and interbank
deposits with up to 90% of funds invested in interbank deposits at 29 banks. Yu’e Bao
offered a return rate as high as 6.73% in Jan 2014 when liquidity in China’s money market
system was tight. It came down to 5% in mid-May and remained stable at 4.23% since
end of June, still higher than the 3% yield of one-year fixed bank deposit.
Within a year of launch, total AUM surpassed RMB574.1bn with 114mn accumulated
users by June 30, 2014, compared to RMB4.8bn AUM and 2.5mn users a year ago, as
disclosed by Tianhong. Average AUM per user also increased to RMB5,030, 2.6x that of
2Q13. Yu’e Bao accounted for 98% of AUM managed by Tianhong, making it the largest
asset management company by AUM in China in 1H14, according to public news
sources. Its total AUM is close to 2x that of the no.2 player, China Asset Management.
Chart 106: Operation metrics of Yu’e Bao
Source: Data disclosed by Tianhong Asset Management, Jefferies
As of end of 2Q13 3Q13 4Q13 1Q14 2Q14
AUM (in RMB bn) 4.8 55.7 185.3 541.3 574.2
QoQ 1057% 233% 192% 6%
YoY 11837%
No. of users (in mn) 2.5 13.7 43.0 81.0 114.1
QoQ 443% 215% 88% 41%
YoY 4438%
Average AUM per user (RMB) 1,912 4,071 4,307 6,683 5,030
QoQ 113% 6% 55% -25%
YoY 163%
Total AUM has surpassed
RMB574.1bn with 114mn
accumulated users by June 30, 2014,
compared to RMB4.8bn AUM and
2.5mn users a year ago, as disclosed
by Tianhong. Average AUM per user
has also increased to RMB5,030, 2.6x
that by end of 2Q13.
Alipay dominated 3rd party online
payment market, with 48.7% market
share in terms of GMV in 2013A, and
further expanded to 48.8% in
2Q14A, according to iResearch.
BABA
Initiating Coverage
27 October 2014
page 76 of 130 , Equity Analyst, +852 3743 8033, [email protected] Meng
Please see important disclosure information on pages 126 - 130 of this report.
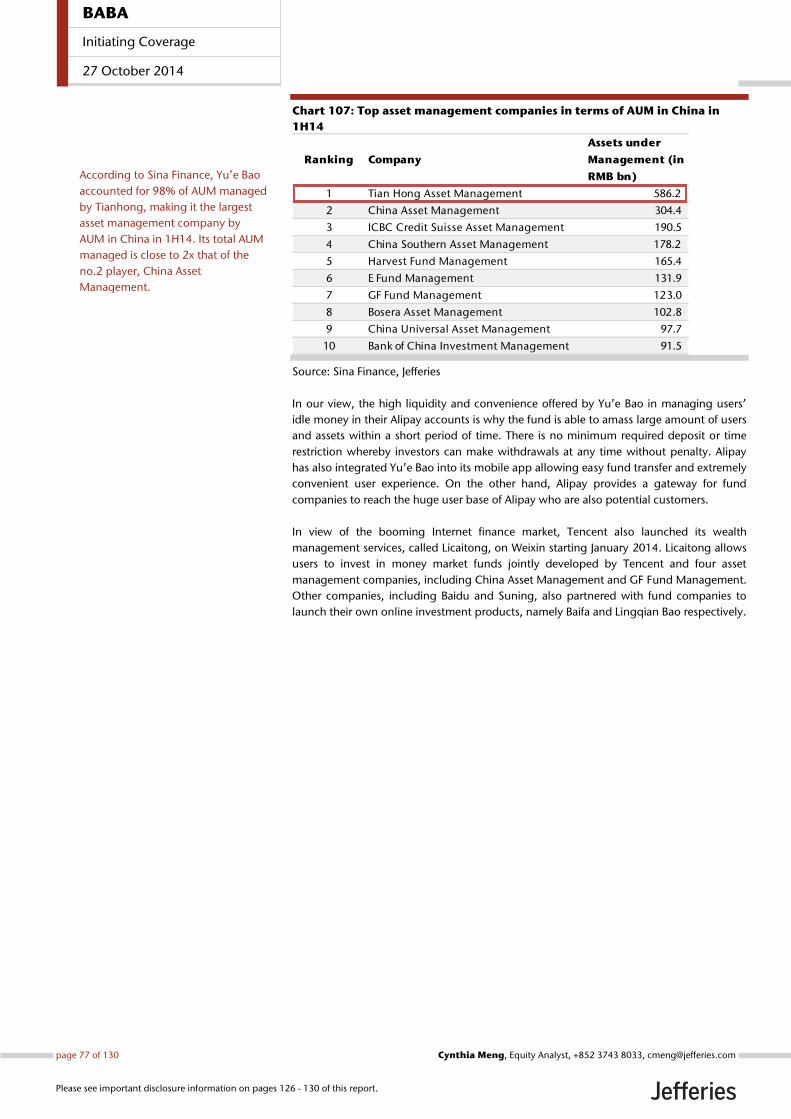
Chart 107: Top asset management companies in terms of AUM in China in
1H14
Source: Sina Finance, Jefferies
In our view, the high liquidity and convenience offered by Yu’e Bao in managing users’
idle money in their Alipay accounts is why the fund is able to amass large amount of users
and assets within a short period of time. There is no minimum required deposit or time
restriction whereby investors can make withdrawals at any time without penalty. Alipay
has also integrated Yu’e Bao into its mobile app allowing easy fund transfer and extremely
convenient user experience. On the other hand, Alipay provides a gateway for fund
companies to reach the huge user base of Alipay who are also potential customers.
In view of the booming Internet finance market, Tencent also launched its wealth
management services, called Licaitong, on Weixin starting January 2014. Licaitong allows
users to invest in money market funds jointly developed by Tencent and four asset
management companies, including China Asset Management and GF Fund Management.
Other companies, including Baidu and Suning, also partnered with fund companies to
launch their own online investment products, namely Baifa and Lingqian Bao respectively.
Ranking Company
Assets under
Management (in
RMB bn)
1 Tian Hong Asset Management 586.2
2 China Asset Management 304.4
3 ICBC Credit Suisse Asset Management 190.5
4 China Southern Asset Management 178.2
5 Harvest Fund Management 165.4
6 E Fund Management 131.9
7 GF Fund Management 123.0
8 Bosera Asset Management 102.8
9 China Universal Asset Management 97.7
10 Bank of China Investment Management 91.5
According to Sina Finance, Yu’e Bao
accounted for 98% of AUM managed
by Tianhong, making it the largest
asset management company by
AUM in China in 1H14. Its total AUM
managed is close to 2x that of the
no.2 player, China Asset
Management.
BABA
Initiating Coverage
27 October 2014
page 77 of 130 , Equity Analyst, +852 3743 8033, [email protected] Meng
Please see important disclosure information on pages 126 - 130 of this report.
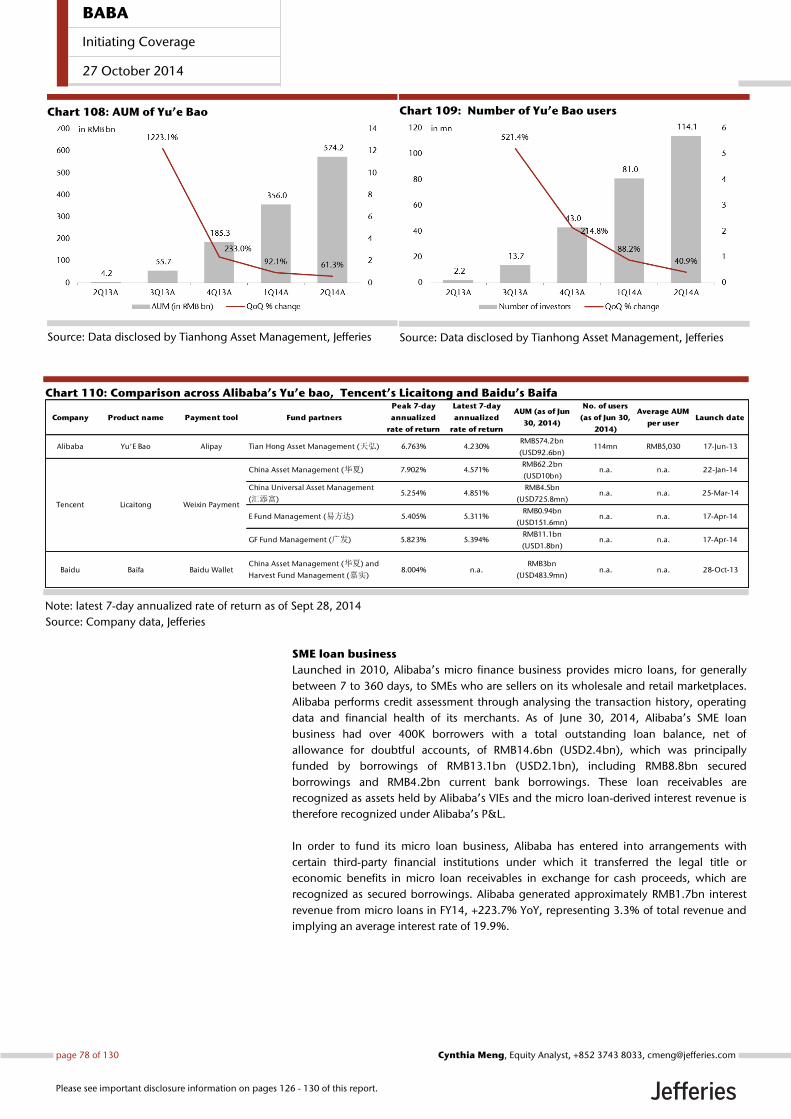
Chart 108: AUM of Yu’e Bao
Source: Data disclosed by Tianhong Asset Management, Jefferies
Chart 109: Number of Yu’e Bao users
Source: Data disclosed by Tianhong Asset Management, Jefferies
Chart 110: Comparison across Alibaba’s Yu’e bao, Tencent’s Licaitong and Baidu’s Baifa
Note: latest 7-day annualized rate of return as of Sept 28, 2014
Source: Company data, Jefferies
SME loan business
Launched in 2010, Alibaba’s micro finance business provides micro loans, for generally
between 7 to 360 days, to SMEs who are sellers on its wholesale and retail marketplaces.
Alibaba performs credit assessment through analysing the transaction history, operating
data and financial health of its merchants. As of June 30, 2014, Alibaba’s SME loan
business had over 400K borrowers with a total outstanding loan balance, net of
allowance for doubtful accounts, of RMB14.6bn (USD2.4bn), which was principally
funded by borrowings of RMB13.1bn (USD2.1bn), including RMB8.8bn secured
borrowings and RMB4.2bn current bank borrowings. These loan receivables are
recognized as assets held by Alibaba’s VIEs and the micro loan-derived interest revenue is
therefore recognized under Alibaba’s P&L.
In order to fund its micro loan business, Alibaba has entered into arrangements with
certain third-party financial institutions under which it transferred the legal title or
economic benefits in micro loan receivables in exchange for cash proceeds, which are
recognized as secured borrowings. Alibaba generated approximately RMB1.7bn interest
revenue from micro loans in FY14, +223.7% YoY, representing 3.3% of total revenue and
implying an average interest rate of 19.9%.
Company Product name Payment tool Fund partners
Peak 7-day
annualized
rate of return
Latest 7-day
annualized
rate of return
AUM (as of Jun
30, 2014)
No. of users
(as of Jun 30,
2014)
Average AUM
per userLaunch date
Alibaba Yu'E Bao Alipay Tian Hong Asset Management (天弘) 6.763% 4.230%RMB574.2bn
(USD92.6bn)114mn RMB5,030 17-Jun-13
China Asset Management (华夏) 7.902% 4.571%RMB62.2bn
(USD10bn)n.a. n.a. 22-Jan-14
China Universal Asset Management
(汇添富)5.254% 4.851%
RMB4.5bn
(USD725.8mn)n.a. n.a. 25-Mar-14
E Fund Management (易方达) 5.405% 5.311%RMB0.94bn
(USD151.6mn)n.a. n.a. 17-Apr-14
GF Fund Management (广发) 5.823% 5.394%RMB11.1bn
(USD1.8bn)n.a. n.a. 17-Apr-14
Baidu Baifa Baidu WalletChina Asset Management (华夏) and
Harvest Fund Management (嘉实)8.004% n.a.
RMB3bn
(USD483.9mn)n.a. n.a. 28-Oct-13
Tencent Licaitong Weixin Payment
BABA
Initiating Coverage
27 October 2014
page 78 of 130 , Equity Analyst, +852 3743 8033, [email protected] Meng
Please see important disclosure information on pages 126 - 130 of this report.
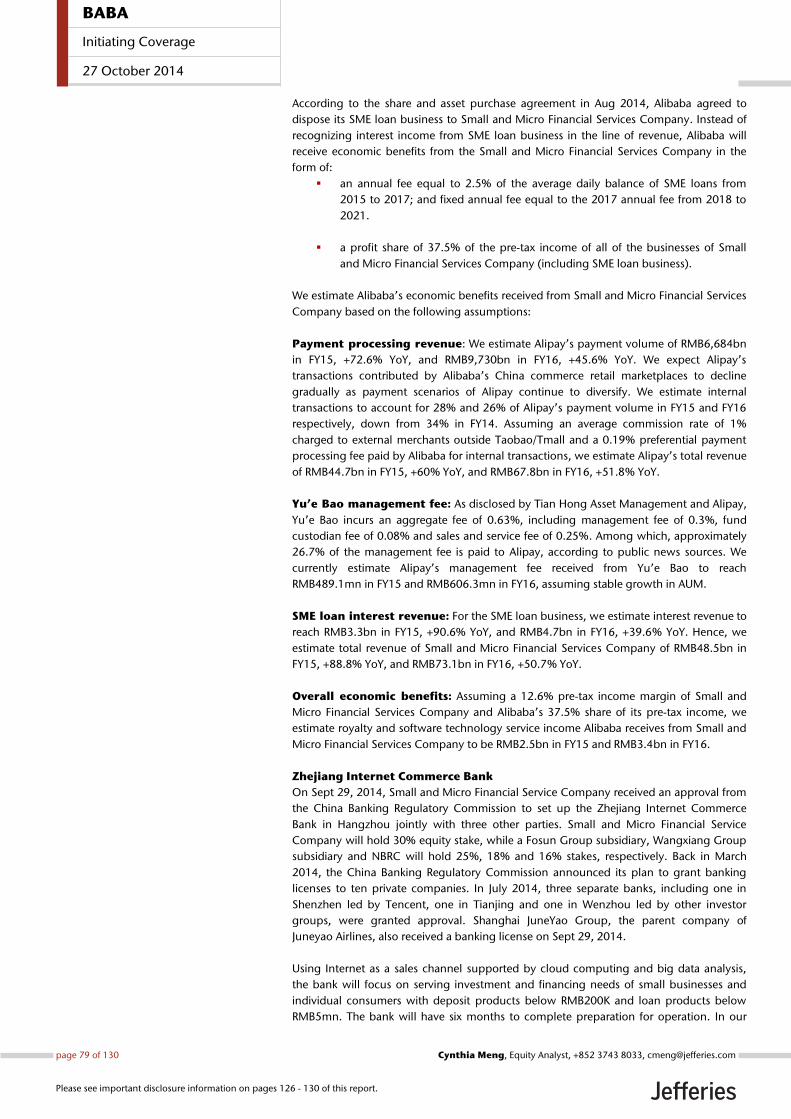
According to the share and asset purchase agreement in Aug 2014, Alibaba agreed to
dispose its SME loan business to Small and Micro Financial Services Company. Instead of
recognizing interest income from SME loan business in the line of revenue, Alibaba will
receive economic benefits from the Small and Micro Financial Services Company in the
form of:
an annual fee equal to 2.5% of the average daily balance of SME loans from
2015 to 2017; and fixed annual fee equal to the 2017 annual fee from 2018 to
2021.
a profit share of 37.5% of the pre-tax income of all of the businesses of Small
and Micro Financial Services Company (including SME loan business).
We estimate Alibaba’s economic benefits received from Small and Micro Financial Services
Company based on the following assumptions:
Payment processing revenue: We estimate Alipay’s payment volume of RMB6,684bn
in FY15, +72.6% YoY, and RMB9,730bn in FY16, +45.6% YoY. We expect Alipay’s
transactions contributed by Alibaba’s China commerce retail marketplaces to decline
gradually as payment scenarios of Alipay continue to diversify. We estimate internal
transactions to account for 28% and 26% of Alipay’s payment volume in FY15 and FY16
respectively, down from 34% in FY14. Assuming an average commission rate of 1%
charged to external merchants outside Taobao/Tmall and a 0.19% preferential payment
processing fee paid by Alibaba for internal transactions, we estimate Alipay’s total revenue
of RMB44.7bn in FY15, +60% YoY, and RMB67.8bn in FY16, +51.8% YoY.
Yu’e Bao management fee: As disclosed by Tian Hong Asset Management and Alipay,
Yu’e Bao incurs an aggregate fee of 0.63%, including management fee of 0.3%, fund
custodian fee of 0.08% and sales and service fee of 0.25%. Among which, approximately
26.7% of the management fee is paid to Alipay, according to public news sources. We
currently estimate Alipay’s management fee received from Yu’e Bao to reach
RMB489.1mn in FY15 and RMB606.3mn in FY16, assuming stable growth in AUM.
SME loan interest revenue: For the SME loan business, we estimate interest revenue to
reach RMB3.3bn in FY15, +90.6% YoY, and RMB4.7bn in FY16, +39.6% YoY. Hence, we
estimate total revenue of Small and Micro Financial Services Company of RMB48.5bn in
FY15, +88.8% YoY, and RMB73.1bn in FY16, +50.7% YoY.
Overall economic benefits: Assuming a 12.6% pre-tax income margin of Small and
Micro Financial Services Company and Alibaba’s 37.5% share of its pre-tax income, we
estimate royalty and software technology service income Alibaba receives from Small and
Micro Financial Services Company to be RMB2.5bn in FY15 and RMB3.4bn in FY16.
Zhejiang Internet Commerce Bank
On Sept 29, 2014, Small and Micro Financial Service Company received an approval from
the China Banking Regulatory Commission to set up the Zhejiang Internet Commerce
Bank in Hangzhou jointly with three other parties. Small and Micro Financial Service
Company will hold 30% equity stake, while a Fosun Group subsidiary, Wangxiang Group
subsidiary and NBRC will hold 25%, 18% and 16% stakes, respectively. Back in March
2014, the China Banking Regulatory Commission announced its plan to grant banking
licenses to ten private companies. In July 2014, three separate banks, including one in
Shenzhen led by Tencent, one in Tianjing and one in Wenzhou led by other investor
groups, were granted approval. Shanghai JuneYao Group, the parent company of
Juneyao Airlines, also received a banking license on Sept 29, 2014.
Using Internet as a sales channel supported by cloud computing and big data analysis,
the bank will focus on serving investment and financing needs of small businesses and
individual consumers with deposit products below RMB200K and loan products below
RMB5mn. The bank will have six months to complete preparation for operation. In our
BABA
Initiating Coverage
27 October 2014
page 79 of 130 , Equity Analyst, +852 3743 8033, [email protected] Meng
Please see important disclosure information on pages 126 - 130 of this report.
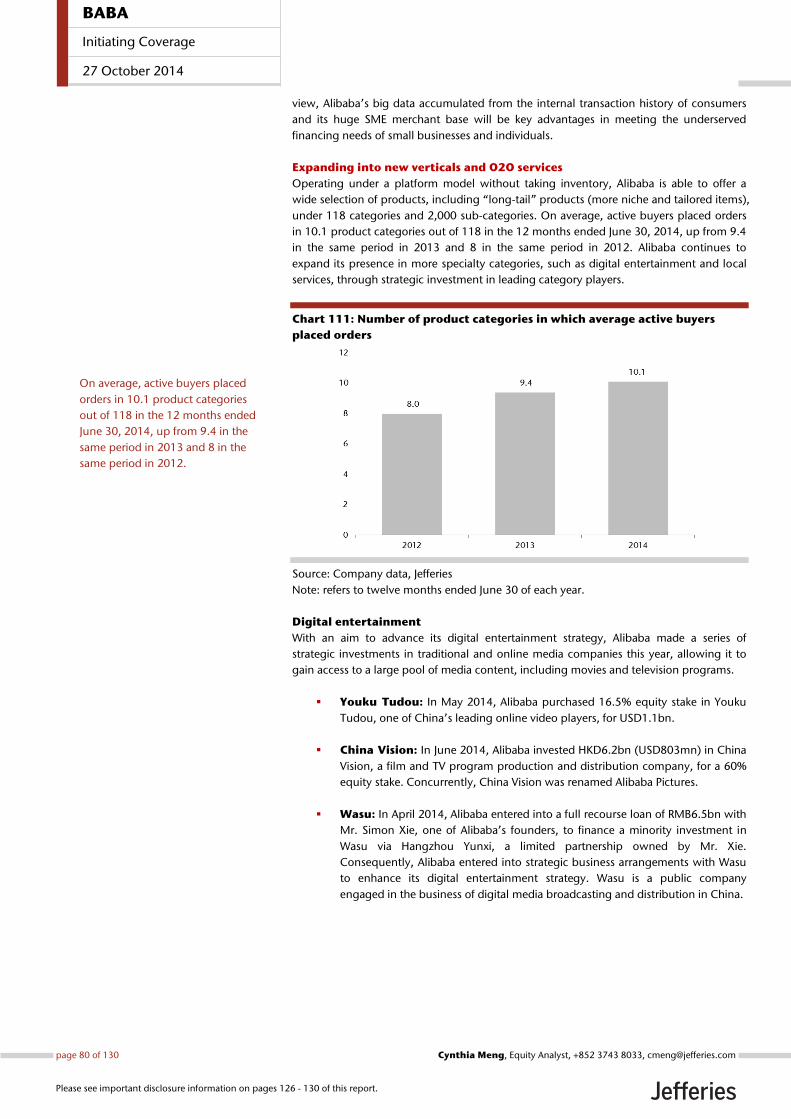
view, Alibaba’s big data accumulated from the internal transaction history of consumers
and its huge SME merchant base will be key advantages in meeting the underserved
financing needs of small businesses and individuals.
Expanding into new verticals and O2O services
Operating under a platform model without taking inventory, Alibaba is able to offer a
wide selection of products, including “long-tail” products (more niche and tailored items),
under 118 categories and 2,000 sub-categories. On average, active buyers placed orders
in 10.1 product categories out of 118 in the 12 months ended June 30, 2014, up from 9.4
in the same period in 2013 and 8 in the same period in 2012. Alibaba continues to
expand its presence in more specialty categories, such as digital entertainment and local
services, through strategic investment in leading category players.
Chart 111: Number of product categories in which average active buyers
placed orders
Source: Company data, Jefferies
Note: refers to twelve months ended June 30 of each year.
Digital entertainment
With an aim to advance its digital entertainment strategy, Alibaba made a series of
strategic investments in traditional and online media companies this year, allowing it to
gain access to a large pool of media content, including movies and television programs.
Youku Tudou: In May 2014, Alibaba purchased 16.5% equity stake in Youku
Tudou, one of China’s leading online video players, for USD1.1bn.
China Vision: In June 2014, Alibaba invested HKD6.2bn (USD803mn) in China
Vision, a film and TV program production and distribution company, for a 60%
equity stake. Concurrently, China Vision was renamed Alibaba Pictures.
Wasu: In April 2014, Alibaba entered into a full recourse loan of RMB6.5bn with
Mr. Simon Xie, one of Alibaba’s founders, to finance a minority investment in
Wasu via Hangzhou Yunxi, a limited partnership owned by Mr. Xie.
Consequently, Alibaba entered into strategic business arrangements with Wasu
to enhance its digital entertainment strategy. Wasu is a public company
engaged in the business of digital media broadcasting and distribution in China.
On average, active buyers placed
orders in 10.1 product categories
out of 118 in the 12 months ended
June 30, 2014, up from 9.4 in the
same period in 2013 and 8 in the
same period in 2012.
BABA
Initiating Coverage
27 October 2014
page 80 of 130 , Equity Analyst, +852 3743 8033, [email protected] Meng
Please see important disclosure information on pages 126 - 130 of this report.
Healthcare
Alibaba gained a foothold in the healthcare sector through its investment in CITIC 21CN, a
leading developer of product identification, authentication and tracking systems for
pharmaceuticals and medical products in China earlier this year. As part of the “Future
Hospital” initiative, Alibaba aims to enhance the efficiency of hospital operation, including
EHR and prescription, through Alipay and its cloud computing platform.
CITIC 21: In April 2014, Alibaba acquired a 38% interest in CITIC 21 for
HKD932mn (USD120.3mn). Yunfeng Capital, a private equity firm co-founded
by Jack Ma, acquired another 16% stake resulting in an aggregate stake
purchase of 54% for HKD1.33bn (USD171mn). The two companies jointly
developed and launched an app in July that allows users to verify drug
authenticity through barcode scanning combining CITIC 21CN’s drug data and
Alibaba’s cloud computing and big data technology. As of Sept 4, 2014, the
company was renamed as Alibaba Health Information Technology Ltd.
Travel
Alibaba made its first investment post-IPO in Beijing Shiji Information Technology, a
technology software and service provider for hotel management, allowing the company
to explore synergy between Taobao Travel, Alibaba’s travel platform, and the hotel
information data & customer base of Shiji.
Shiji: On Sept 28, 2014, Alibaba acquired a 15% stake in Beijing Shiji
Information Technology with RMB2.8bn (USD457mn). Alibaba will integrate the
backend management system of Taobao Travel with the hotel information
management system of Shiji. According to Shiji, its customer base covers 90% of
China’s five-star hotels. The large hotel customer base of Shiji will allow Alibaba
to explore potential O2O opportunities in the travel industry, in our view.
O2O
Alibaba continues to beef up its local service offering and capability by accessing massive
location data and offline local merchant base through its investments.
Autonavi: In April 2014, Alibaba fully acquired Autonavi, a leading digital map
and navigation provider in China, for USD1bn, in addition to its existing 28%
stake purchased back in May 2013. This helps enhance Alibaba’s location-based
service offerings to its mobile users leveraging on Autonavi’s mapping
technology. Its data has already been integrated into Alibaba’s Taobao Diandian
to provide a location-based food ordering service.
Intime: In July 2014, Alibaba acquired a 9.9% equity stake and convertible
bonds which upon conversion would translate into an additional 16% stake in
Intime, a leading department store and shopping mall operator. Alibaba and
Intime established a joint venture in July 2014, in which Alibaba invested
USD13mn for an 80.1% equity stake, to develop an O2O business related to
shopping malls, department stores and supermarkets. The two companies
cooperate in developing an “offline-to-online” multi-channel retailing model
that enables users to purchase online inventory through mobile devices while
shopping in physical stores.
BABA
Initiating Coverage
27 October 2014
page 81 of 130 , Equity Analyst, +852 3743 8033, [email protected] Meng
Please see important disclosure information on pages 126 - 130 of this report.

This page is intentionally kept blank
BABA
Initiating Coverage
27 October 2014
page 82 of 130 , Equity Analyst, +852 3743 8033, [email protected] Meng
Please see important disclosure information on pages 126 - 130 of this report.
Expanding Cross-Border E-Commerce To satisfy the growing appetite for foreign brands among Chinese consumers and
Chinese manufacturing goods among global wholesale buyers, Alibaba has been
expanding its cross-border sales initiatives through Tmall Global, Alibaba.com and
AliExpress.
In this section, we discuss the following:
1. Tmall Global helps to connect international retailers with Chinese consumers by
lowering the cost, delivery time and language barriers in overseas online
shopping, while facilitating merchants who do not have a physical presence in
China with its Alipay international payment settlement and shipment services.
2. On Oct 15, 2014, Alipay launched ePass, a new payment processing service for
Chinese consumers to make direct purchase on U.S. retail websites. In our view,
this significantly lowers the barrier for overseas merchants in reaching the
300mn+ Chinese online shoppers, while unlocking the purchasing power of
Chinese consumers, particularly young professionals, who have a huge demand
for foreign brands.
3. Alibaba.com, a leading overseas wholesale platform, allows manufacturers and
distributors based in China to reach global customers through the integration of
OneTouch’s comprehensive import/export outsourcing services.
4. Alibaba is also making forays into international retail market through AliExpress,
its global consumer marketplace, and 11 Main, its U.S. shopping site. According
to Nielsen, China is the second largest cross-border online shopping destination
in U.S., UK and Brazil.
BABA
Initiating Coverage
27 October 2014
page 83 of 130 , Equity Analyst, +852 3743 8033, [email protected] Meng
Please see important disclosure information on pages 126 - 130 of this report.
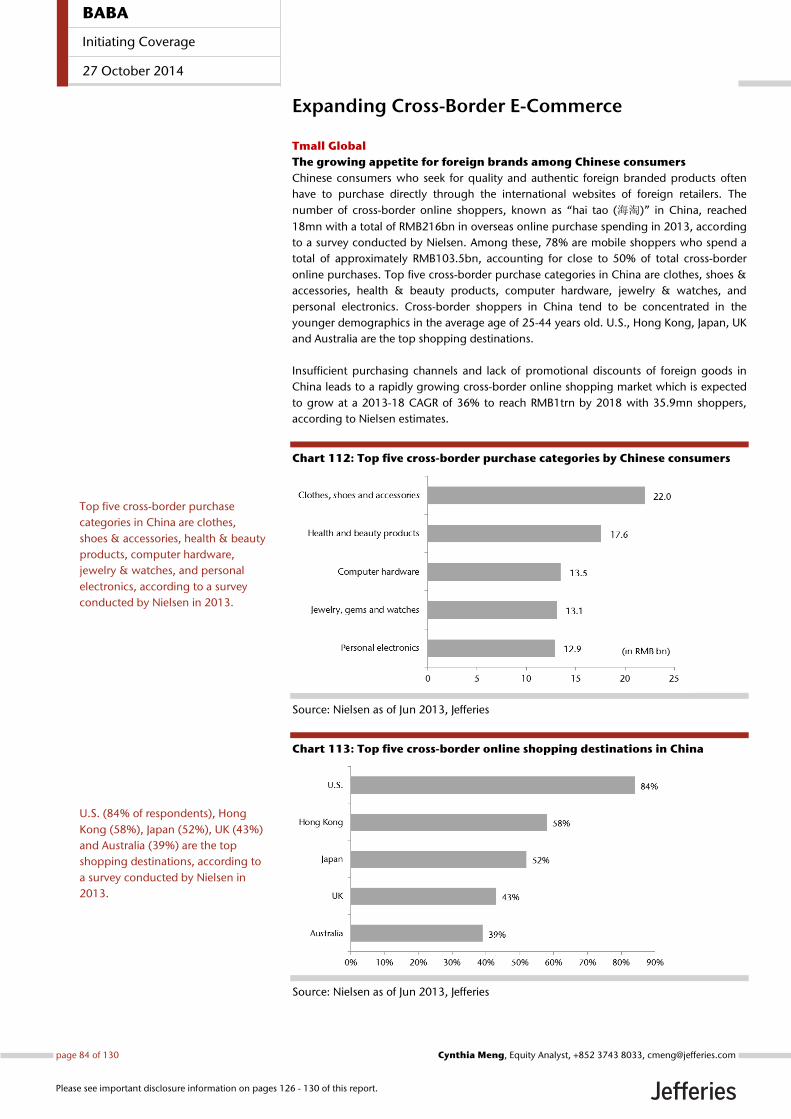
Expanding Cross-Border E-Commerce
Tmall Global
The growing appetite for foreign brands among Chinese consumers
Chinese consumers who seek for quality and authentic foreign branded products often
have to purchase directly through the international websites of foreign retailers. The
number of cross-border online shoppers, known as “hai tao (海淘)” in China, reached
18mn with a total of RMB216bn in overseas online purchase spending in 2013, according
to a survey conducted by Nielsen. Among these, 78% are mobile shoppers who spend a
total of approximately RMB103.5bn, accounting for close to 50% of total cross-border
online purchases. Top five cross-border purchase categories in China are clothes, shoes &
accessories, health & beauty products, computer hardware, jewelry & watches, and
personal electronics. Cross-border shoppers in China tend to be concentrated in the
younger demographics in the average age of 25-44 years old. U.S., Hong Kong, Japan, UK
and Australia are the top shopping destinations.
Insufficient purchasing channels and lack of promotional discounts of foreign goods in
China leads to a rapidly growing cross-border online shopping market which is expected
to grow at a 2013-18 CAGR of 36% to reach RMB1trn by 2018 with 35.9mn shoppers,
according to Nielsen estimates.
Chart 112: Top five cross-border purchase categories by Chinese consumers
Source: Nielsen as of Jun 2013, Jefferies
Chart 113: Top five cross-border online shopping destinations in China
Source: Nielsen as of Jun 2013, Jefferies
Top five cross-border purchase
categories in China are clothes,
shoes & accessories, health & beauty
products, computer hardware,
jewelry & watches, and personal
electronics, according to a survey
conducted by Nielsen in 2013.
U.S. (84% of respondents), Hong
Kong (58%), Japan (52%), UK (43%)
and Australia (39%) are the top
shopping destinations, according to
a survey conducted by Nielsen in
2013.
BABA
Initiating Coverage
27 October 2014
page 84 of 130 , Equity Analyst, +852 3743 8033, [email protected] Meng
Please see important disclosure information on pages 126 - 130 of this report.
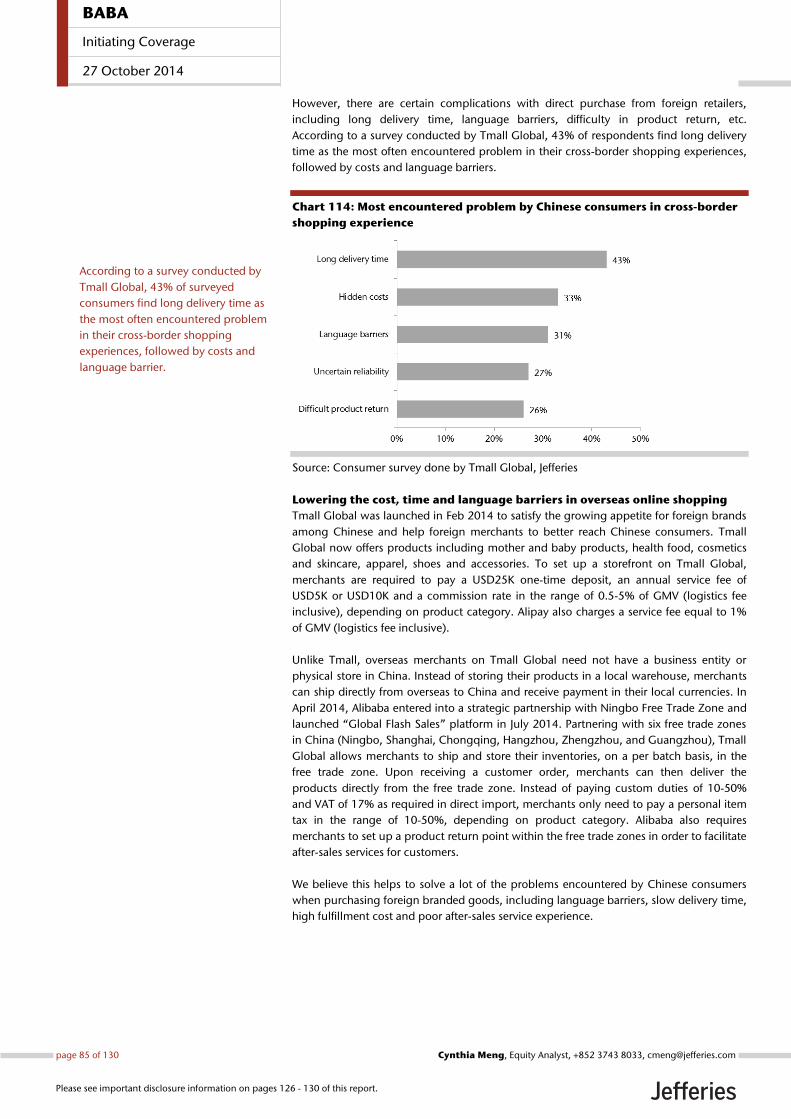
However, there are certain complications with direct purchase from foreign retailers,
including long delivery time, language barriers, difficulty in product return, etc.
According to a survey conducted by Tmall Global, 43% of respondents find long delivery
time as the most often encountered problem in their cross-border shopping experiences,
followed by costs and language barriers.
Chart 114: Most encountered problem by Chinese consumers in cross-border
shopping experience
Source: Consumer survey done by Tmall Global, Jefferies
Lowering the cost, time and language barriers in overseas online shopping
Tmall Global was launched in Feb 2014 to satisfy the growing appetite for foreign brands
among Chinese and help foreign merchants to better reach Chinese consumers. Tmall
Global now offers products including mother and baby products, health food, cosmetics
and skincare, apparel, shoes and accessories. To set up a storefront on Tmall Global,
merchants are required to pay a USD25K one-time deposit, an annual service fee of
USD5K or USD10K and a commission rate in the range of 0.5-5% of GMV (logistics fee
inclusive), depending on product category. Alipay also charges a service fee equal to 1%
of GMV (logistics fee inclusive).
Unlike Tmall, overseas merchants on Tmall Global need not have a business entity or
physical store in China. Instead of storing their products in a local warehouse, merchants
can ship directly from overseas to China and receive payment in their local currencies. In
April 2014, Alibaba entered into a strategic partnership with Ningbo Free Trade Zone and
launched “Global Flash Sales” platform in July 2014. Partnering with six free trade zones
in China (Ningbo, Shanghai, Chongqing, Hangzhou, Zhengzhou, and Guangzhou), Tmall
Global allows merchants to ship and store their inventories, on a per batch basis, in the
free trade zone. Upon receiving a customer order, merchants can then deliver the
products directly from the free trade zone. Instead of paying custom duties of 10-50%
and VAT of 17% as required in direct import, merchants only need to pay a personal item
tax in the range of 10-50%, depending on product category. Alibaba also requires
merchants to set up a product return point within the free trade zones in order to facilitate
after-sales services for customers.
We believe this helps to solve a lot of the problems encountered by Chinese consumers
when purchasing foreign branded goods, including language barriers, slow delivery time,
high fulfillment cost and poor after-sales service experience.
According to a survey conducted by
Tmall Global, 43% of surveyed
consumers find long delivery time as
the most often encountered problem
in their cross-border shopping
experiences, followed by costs and
language barrier.
BABA
Initiating Coverage
27 October 2014
page 85 of 130 , Equity Analyst, +852 3743 8033, [email protected] Meng
Please see important disclosure information on pages 126 - 130 of this report.
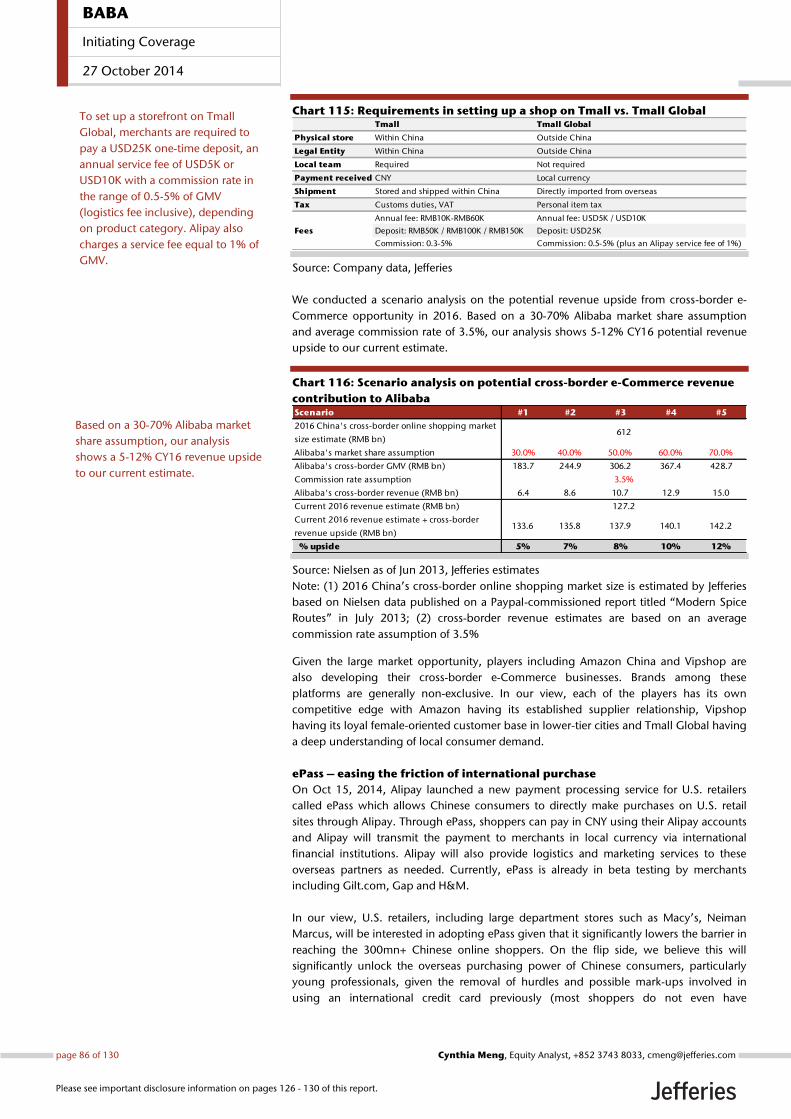
Chart 115: Requirements in setting up a shop on Tmall vs. Tmall Global
Source: Company data, Jefferies
We conducted a scenario analysis on the potential revenue upside from cross-border e-
Commerce opportunity in 2016. Based on a 30-70% Alibaba market share assumption
and average commission rate of 3.5%, our analysis shows 5-12% CY16 potential revenue
upside to our current estimate.
Chart 116: Scenario analysis on potential cross-border e-Commerce revenue
contribution to Alibaba
Source: Nielsen as of Jun 2013, Jefferies estimates
Note: (1) 2016 China’s cross-border online shopping market size is estimated by Jefferies
based on Nielsen data published on a Paypal-commissioned report titled “Modern Spice
Routes” in July 2013; (2) cross-border revenue estimates are based on an average
commission rate assumption of 3.5%
Given the large market opportunity, players including Amazon China and Vipshop are
also developing their cross-border e-Commerce businesses. Brands among these
platforms are generally non-exclusive. In our view, each of the players has its own
competitive edge with Amazon having its established supplier relationship, Vipshop
having its loyal female-oriented customer base in lower-tier cities and Tmall Global having
a deep understanding of local consumer demand.
ePass – easing the friction of international purchase
On Oct 15, 2014, Alipay launched a new payment processing service for U.S. retailers
called ePass which allows Chinese consumers to directly make purchases on U.S. retail
sites through Alipay. Through ePass, shoppers can pay in CNY using their Alipay accounts
and Alipay will transmit the payment to merchants in local currency via international
financial institutions. Alipay will also provide logistics and marketing services to these
overseas partners as needed. Currently, ePass is already in beta testing by merchants
including Gilt.com, Gap and H&M.
In our view, U.S. retailers, including large department stores such as Macy’s, Neiman
Marcus, will be interested in adopting ePass given that it significantly lowers the barrier in
reaching the 300mn+ Chinese online shoppers. On the flip side, we believe this will
significantly unlock the overseas purchasing power of Chinese consumers, particularly
young professionals, given the removal of hurdles and possible mark-ups involved in
using an international credit card previously (most shoppers do not even have
Tmall Tmall Global
Physical store Within China Outside China
Legal Entity Within China Outside China
Local team Required Not required
Payment received CNY Local currency
Shipment Stored and shipped within China Directly imported from overseas
Tax Customs duties, VAT Personal item tax
Annual fee: RMB10K-RMB60K Annual fee: USD5K / USD10K
Deposit: RMB50K / RMB100K / RMB150K Deposit: USD25K
Commission: 0.3-5% Commission: 0.5-5% (plus an Alipay service fee of 1%)
Fees
Scenario #1 #2 #3 #4 #5
2016 China's cross-border online shopping market
size estimate (RMB bn)
Alibaba's market share assumption 30.0% 40.0% 50.0% 60.0% 70.0%
Alibaba's cross-border GMV (RMB bn) 183.7 244.9 306.2 367.4 428.7
Commission rate assumption
Alibaba's cross-border revenue (RMB bn) 6.4 8.6 10.7 12.9 15.0
Current 2016 revenue estimate (RMB bn)
Current 2016 revenue estimate + cross-border
revenue upside (RMB bn)133.6 135.8 137.9 140.1 142.2
% upside 5% 7% 8% 10% 12%
612
127.2
3.5%
To set up a storefront on Tmall
Global, merchants are required to
pay a USD25K one-time deposit, an
annual service fee of USD5K or
USD10K with a commission rate in
the range of 0.5-5% of GMV
(logistics fee inclusive), depending
on product category. Alipay also
charges a service fee equal to 1% of
GMV.
Based on a 30-70% Alibaba market
share assumption, our analysis
shows a 5-12% CY16 revenue upside
to our current estimate.
BABA
Initiating Coverage
27 October 2014
page 86 of 130 , Equity Analyst, +852 3743 8033, [email protected] Meng
Please see important disclosure information on pages 126 - 130 of this report.
international credit cards). By taking a certain percentage of the transaction as service
fees, Alipay will benefit from incremental revenue contribution from the launch of ePass.
Alibaba.com
Connecting China’s SMEs with global wholesale buyers
Launched in 1999, Alibaba.com is Alibaba’s first online commerce platform and the
leading global online wholesale platform in China by revenue in 2013, according to
iResearch. Alibaba.com helps to connect global wholesale buyers with Chinese
wholesalers and manufacturers. Major product categories on the platform include
consumer electronics, machinery and apparel. Alibaba.com monetizes mainly through
membership subscription fees, accounting for 87.6% of global wholesale marketplace
revenue in FY14 or 86.4% in FY1Q15, with the rest contributed by P4P online marketing.
The Gold Supplier membership service allows merchants to host premium storefronts
with upgraded storefront management tools, custom clearance, VAT refund and other
import/export business solutions.
Building a global B2B ecosystem with transaction data
In order to improve its one-stop exports service offering, Alibaba completed the
acquisition of ShenZhen OneTouch (深圳一达通) in May 2014. OneTouch, founded in
2001, is the first platform in China engaged in providing import and export business
process outsourcing service for SMEs. According to China National Customs Information
Center, OneTouch was ranked No.4 in terms of values of exports among general trade
enterprises in China in 2013. In our view, the acquisition of OneTouch helps to enhance
customer stickiness on Alibaba.com by providing comprehensive export-related service
solutions for SMEs including customs clearance, logistics, cargo insurance, currency
exchange, tax refund, financing and certification, etc.
The competitive edge of Chinese exporters is gradually diminished given rising labor and
raw material costs. Outsourcing business process to integrated export-service platform
like OneTouch allows exporters to save on logistics and financing costs. By providing
banks with information such as transaction records, OneTouch is also able to secure
cheaper financing for small and mid-sized exporters, of which the company will take 1-1.5%
of the monthly interest as service fee. These products, jointly developed with Bank of
China, include financing for orders, packing loan under letter of credit, loan on credit and
foreign exchange value preservation. In order to aggregate more transaction data and
gain better loan terms from banks, Alibaba.com launched a rebate program in May 2014
offering up to RMB0.03 for every USD1 in export value handled through OneTouch to
attract more paying members onto its platform. As a longer term strategy, Alibaba.com
hopes to leverage on these transaction data to build up a B2B export-focused credit
system for providing trade financing to small businesses.
Revenue generated from Alibaba global wholesale marketplace grew 3.8% YoY to
RMB3.9bn, representing 7.5% of total revenue in FY14, and RMB1.1bn in FY1Q15, +18.4%
YoY. We expect global wholesale marketplace revenue growth to be mainly driven by
increasing number of paying members. We estimate revenue of RMB4.7bn in FY15, +20.5%
YoY, and RMB5.3bn in FY16, +11.7% YoY.
BABA
Initiating Coverage
27 October 2014
page 87 of 130 , Equity Analyst, +852 3743 8033, [email protected] Meng
Please see important disclosure information on pages 126 - 130 of this report.
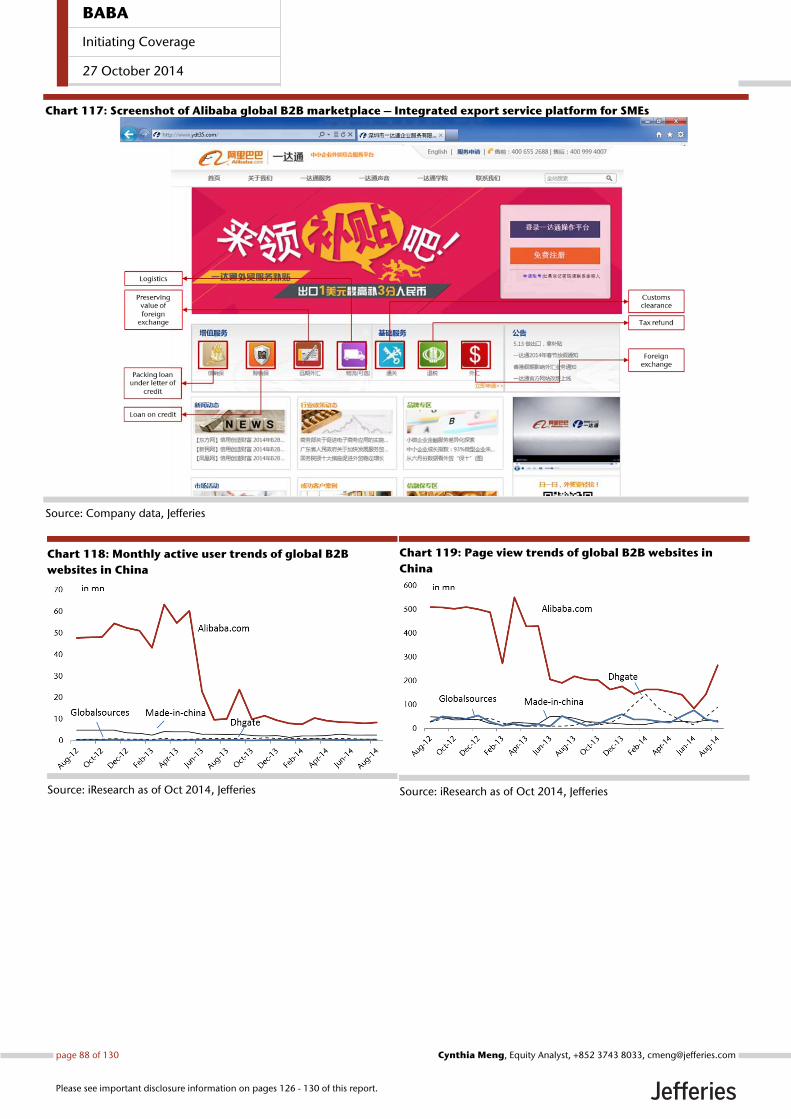
Chart 117: Screenshot of Alibaba global B2B marketplace – Integrated export service platform for SMEs
Source: Company data, Jefferies
Chart 118: Monthly active user trends of global B2B
websites in China
Source: iResearch as of Oct 2014, Jefferies
Chart 119: Page view trends of global B2B websites in
China
Source: iResearch as of Oct 2014, Jefferies
BABA
Initiating Coverage
27 October 2014
page 88 of 130 , Equity Analyst, +852 3743 8033, [email protected] Meng
Please see important disclosure information on pages 126 - 130 of this report.
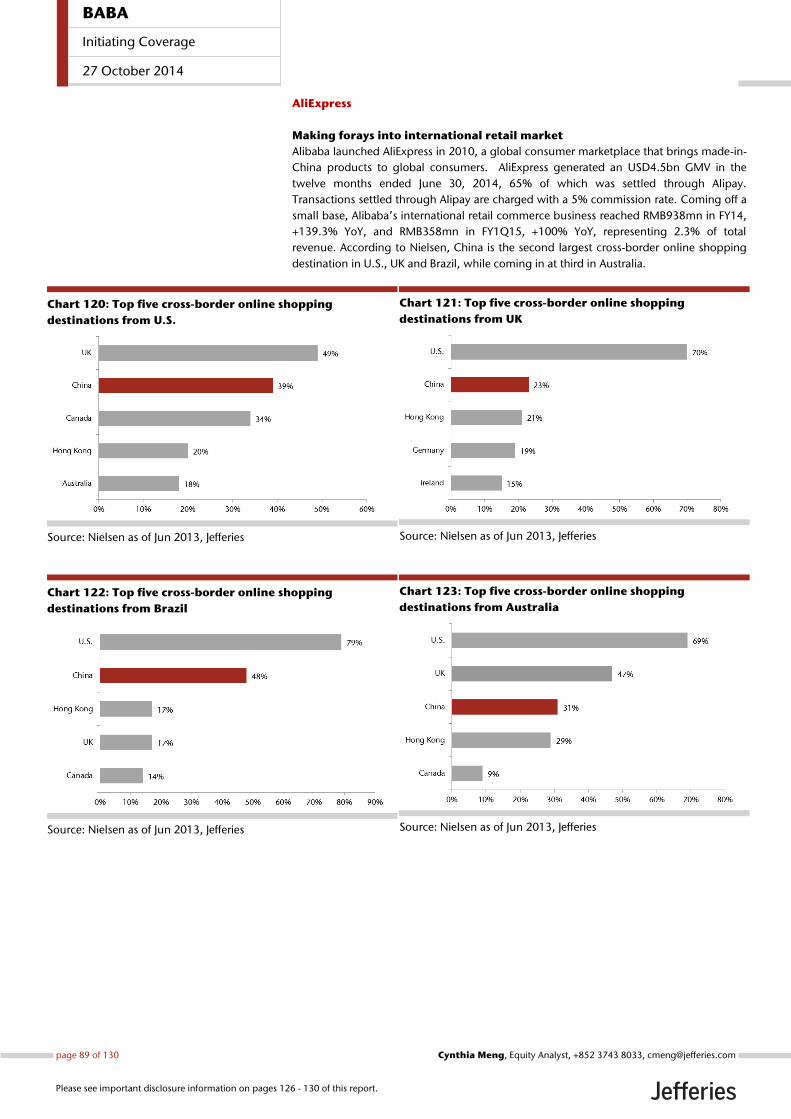
AliExpress
Making forays into international retail market
Alibaba launched AliExpress in 2010, a global consumer marketplace that brings made-in-
China products to global consumers. AliExpress generated an USD4.5bn GMV in the
twelve months ended June 30, 2014, 65% of which was settled through Alipay.
Transactions settled through Alipay are charged with a 5% commission rate. Coming off a
small base, Alibaba’s international retail commerce business reached RMB938mn in FY14,
+139.3% YoY, and RMB358mn in FY1Q15, +100% YoY, representing 2.3% of total
revenue. According to Nielsen, China is the second largest cross-border online shopping
destination in U.S., UK and Brazil, while coming in at third in Australia.
Chart 120: Top five cross-border online shopping
destinations from U.S.
Source: Nielsen as of Jun 2013, Jefferies
Chart 121: Top five cross-border online shopping
destinations from UK
Source: Nielsen as of Jun 2013, Jefferies
Chart 122: Top five cross-border online shopping
destinations from Brazil
Source: Nielsen as of Jun 2013, Jefferies
Chart 123: Top five cross-border online shopping
destinations from Australia
Source: Nielsen as of Jun 2013, Jefferies
BABA
Initiating Coverage
27 October 2014
page 89 of 130 , Equity Analyst, +852 3743 8033, [email protected] Meng
Please see important disclosure information on pages 126 - 130 of this report.
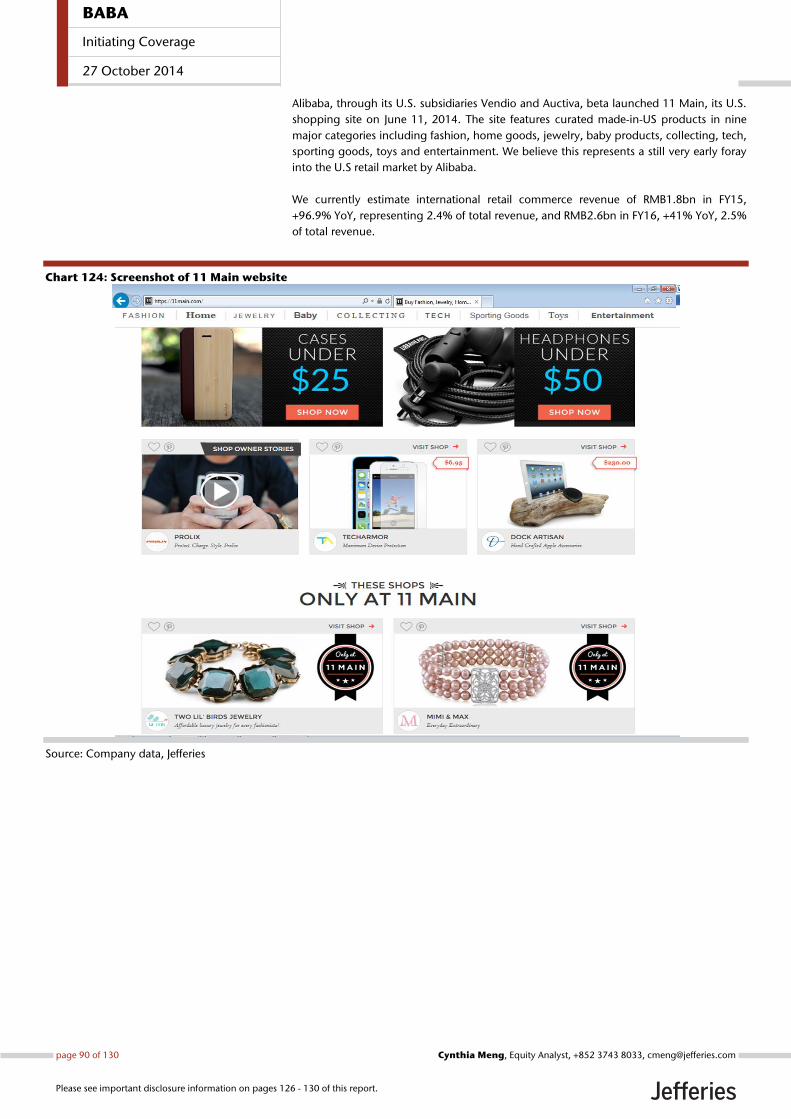
Alibaba, through its U.S. subsidiaries Vendio and Auctiva, beta launched 11 Main, its U.S.
shopping site on June 11, 2014. The site features curated made-in-US products in nine
major categories including fashion, home goods, jewelry, baby products, collecting, tech,
sporting goods, toys and entertainment. We believe this represents a still very early foray
into the U.S retail market by Alibaba.
We currently estimate international retail commerce revenue of RMB1.8bn in FY15,
+96.9% YoY, representing 2.4% of total revenue, and RMB2.6bn in FY16, +41% YoY, 2.5%
of total revenue.
Chart 124: Screenshot of 11 Main website
Source: Company data, Jefferies
BABA
Initiating Coverage
27 October 2014
page 90 of 130 , Equity Analyst, +852 3743 8033, [email protected] Meng
Please see important disclosure information on pages 126 - 130 of this report.
Company Background
Company Description Founded in 1999, Alibaba is the largest online and mobile commerce company in the
world in terms of GMV in 2013, according to IDC. The company operates its marketplaces
as a platform for third parties, and does not engage in direct sales, compete with its
merchants or hold inventory. Alibaba operates Taobao Marketplace and Tmall, the no.1
C2C and B2C platform in China by GMV respectively, according to iResearch. The
company generated RMB1,833bn (USD296bn) GMV on its China retail marketplaces from
279mn active buyers and 8.5mn active sellers in the twelve months ended June 30, 2014.
Alibaba mainly generates its revenue from online marketing services, commissions on
transactions and fees for online services.
Alibaba started trading under the ticker “BABA” on NYSE on Sept 19, 2014.
BABA
Initiating Coverage
27 October 2014
page 91 of 130 , Equity Analyst, +852 3743 8033, [email protected] Meng
Please see important disclosure information on pages 126 - 130 of this report.
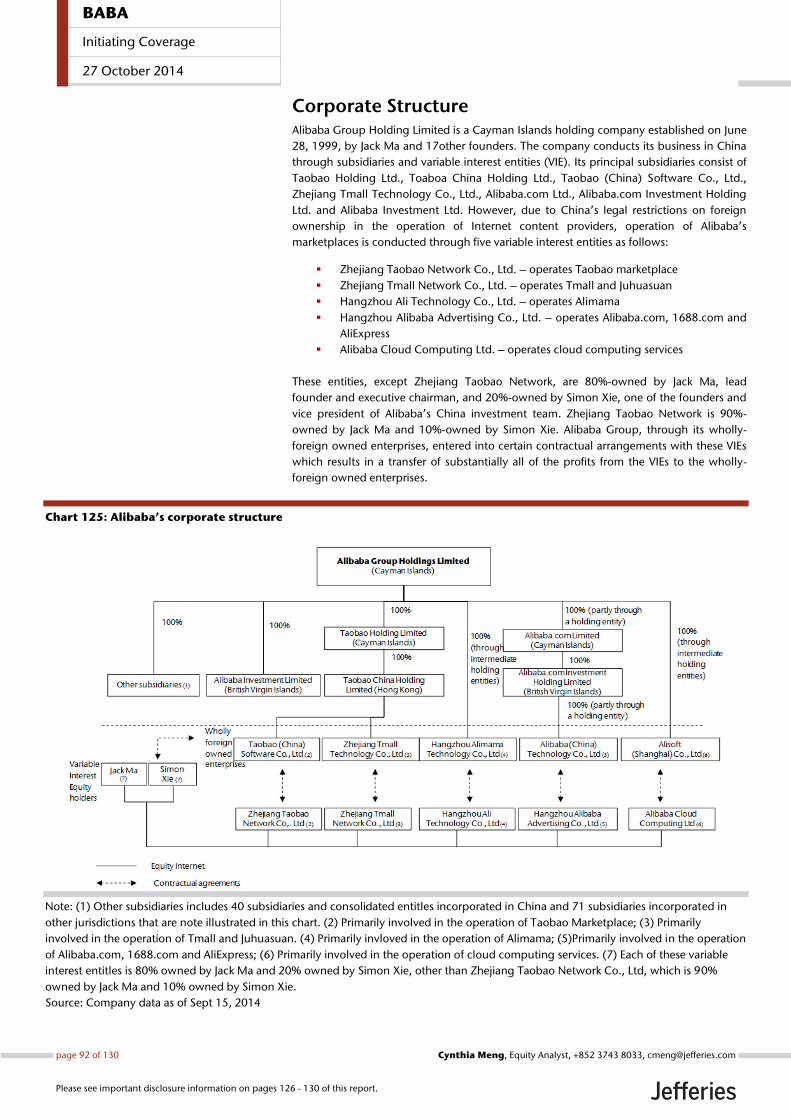
Corporate Structure Alibaba Group Holding Limited is a Cayman Islands holding company established on June
28, 1999, by Jack Ma and 17other founders. The company conducts its business in China
through subsidiaries and variable interest entities (VIE). Its principal subsidiaries consist of
Taobao Holding Ltd., Toaboa China Holding Ltd., Taobao (China) Software Co., Ltd.,
Zhejiang Tmall Technology Co., Ltd., Alibaba.com Ltd., Alibaba.com Investment Holding
Ltd. and Alibaba Investment Ltd. However, due to China’s legal restrictions on foreign
ownership in the operation of Internet content providers, operation of Alibaba’s
marketplaces is conducted through five variable interest entities as follows:
Zhejiang Taobao Network Co., Ltd. – operates Taobao marketplace
Zhejiang Tmall Network Co., Ltd. – operates Tmall and Juhuasuan
Hangzhou Ali Technology Co., Ltd. – operates Alimama
Hangzhou Alibaba Advertising Co., Ltd. – operates Alibaba.com, 1688.com and
AliExpress
Alibaba Cloud Computing Ltd. – operates cloud computing services
These entities, except Zhejiang Taobao Network, are 80%-owned by Jack Ma, lead
founder and executive chairman, and 20%-owned by Simon Xie, one of the founders and
vice president of Alibaba’s China investment team. Zhejiang Taobao Network is 90%-
owned by Jack Ma and 10%-owned by Simon Xie. Alibaba Group, through its wholly-
foreign owned enterprises, entered into certain contractual arrangements with these VIEs
which results in a transfer of substantially all of the profits from the VIEs to the wholly-
foreign owned enterprises.
Chart 125: Alibaba’s corporate structure
Note: (1) Other subsidiaries includes 40 subsidiaries and consolidated entitles incorporated in China and 71 subsidiaries incorporated in
other jurisdictions that are note illustrated in this chart. (2) Primarily involved in the operation of Taobao Marketplace; (3) Primarily
involved in the operation of Tmall and Juhuasuan. (4) Primarily invloved in the operation of Alimama; (5)Primarily involved in the operation
of Alibaba.com, 1688.com and AliExpress; (6) Primarily involved in the operation of cloud computing services. (7) Each of these variable
interest entitles is 80% owned by Jack Ma and 20% owned by Simon Xie, other than Zhejiang Taobao Network Co., Ltd, which is 90%
owned by Jack Ma and 10% owned by Simon Xie.
Source: Company data as of Sept 15, 2014
BABA
Initiating Coverage
27 October 2014
page 92 of 130 , Equity Analyst, +852 3743 8033, [email protected] Meng
Please see important disclosure information on pages 126 - 130 of this report.
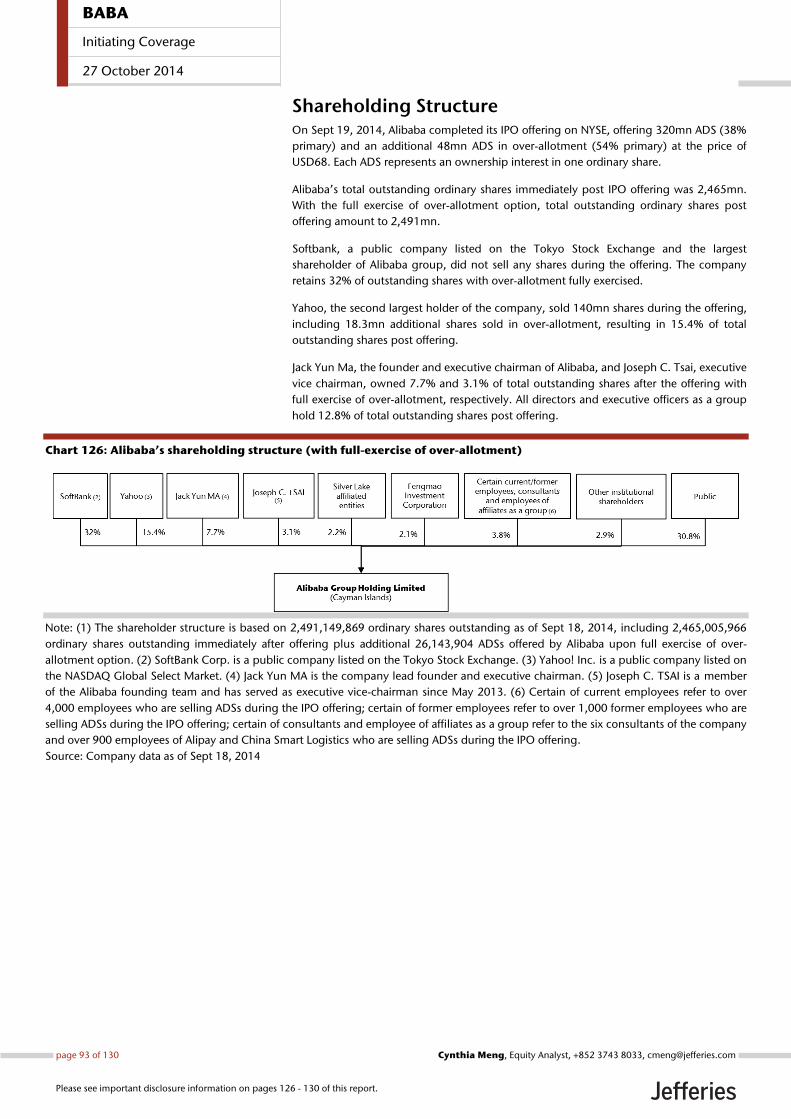
Shareholding Structure On Sept 19, 2014, Alibaba completed its IPO offering on NYSE, offering 320mn ADS (38%
primary) and an additional 48mn ADS in over-allotment (54% primary) at the price of
USD68. Each ADS represents an ownership interest in one ordinary share.
Alibaba’s total outstanding ordinary shares immediately post IPO offering was 2,465mn.
With the full exercise of over-allotment option, total outstanding ordinary shares post
offering amount to 2,491mn.
Softbank, a public company listed on the Tokyo Stock Exchange and the largest
shareholder of Alibaba group, did not sell any shares during the offering. The company
retains 32% of outstanding shares with over-allotment fully exercised.
Yahoo, the second largest holder of the company, sold 140mn shares during the offering,
including 18.3mn additional shares sold in over-allotment, resulting in 15.4% of total
outstanding shares post offering.
Jack Yun Ma, the founder and executive chairman of Alibaba, and Joseph C. Tsai, executive
vice chairman, owned 7.7% and 3.1% of total outstanding shares after the offering with
full exercise of over-allotment, respectively. All directors and executive officers as a group
hold 12.8% of total outstanding shares post offering.
Chart 126: Alibaba’s shareholding structure (with full-exercise of over-allotment)
Note: (1) The shareholder structure is based on 2,491,149,869 ordinary shares outstanding as of Sept 18, 2014, including 2,465,005,966
ordinary shares outstanding immediately after offering plus additional 26,143,904 ADSs offered by Alibaba upon full exercise of over-
allotment option. (2) SoftBank Corp. is a public company listed on the Tokyo Stock Exchange. (3) Yahoo! Inc. is a public company listed on
the NASDAQ Global Select Market. (4) Jack Yun MA is the company lead founder and executive chairman. (5) Joseph C. TSAI is a member
of the Alibaba founding team and has served as executive vice-chairman since May 2013. (6) Certain of current employees refer to over
4,000 employees who are selling ADSs during the IPO offering; certain of former employees refer to over 1,000 former employees who are
selling ADSs during the IPO offering; certain of consultants and employee of affiliates as a group refer to the six consultants of the company
and over 900 employees of Alipay and China Smart Logistics who are selling ADSs during the IPO offering.
Source: Company data as of Sept 18, 2014
BABA
Initiating Coverage
27 October 2014
page 93 of 130 , Equity Analyst, +852 3743 8033, [email protected] Meng
Please see important disclosure information on pages 126 - 130 of this report.
Partnership System
The Alibaba Partnership
The Alibaba Partnership currently is comprised of 30 members including 24 members of
Alibaba’s management, 4 members of management of Small and Micro Financial Services
Company and 1 member of management of China Smart Logistics. Two members of
Alibaba’s management serve as members of Small and Micro Financial Services Company
as well. Existing partners nominate candidates, who have been serving in Alibaba Group,
its affiliates and/or Alipay for not less than five years, to the partnership committee.
Election of new partners is held annually and requires the approval of at least 75% of all of
the partners.
Removal of partners
Partners retire from the partnership when they cease employment with Alibaba Group, its
affiliates or Alipay, except continuity partners who may remain as partners until they elect
to retire from the partnership, die or are incapacitated or are removed as partners. Any
partner, including continuity partners, may be removed upon the vote of a simple
majority of all partners for violations of certain standards.
Partnership committee
The partnership committee must consist of at least five partners and is currently
comprised of Jack Ma, Joe Tsai, Jonathan Lu, Lucy Peng and Ming Zeng. The Committee is
responsible for administering partner elections and allocating annual cash bonus.
Partnership committee members serve for a term of three years and may serve multiple
terms. Elections of committee members are held once every three years.
Equity interest holding requirement for partners
Alibaba requires each partner to retain at least 60% of the equity interests (including
unvested shares and shares underlying vested and unvested awards) that they held on the
starting date of three-year period. Following the initial three-year holding period and for
so long as he or she remains a partner, a partner is required to retain at least 40% of the
equity interests (including unvested shares and shares underlying vested and unvested
awards) that he or she held on the starting date of the initial three-year holding period. As
of Sept 15, 2014, the partners directly and indirectly hold an aggregate of approximately
349,859,983 ordinary shares (including unvested shares and shares underlying vested
and unvested awards).
BABA
Initiating Coverage
27 October 2014
page 94 of 130 , Equity Analyst, +852 3743 8033, [email protected] Meng
Please see important disclosure information on pages 126 - 130 of this report.
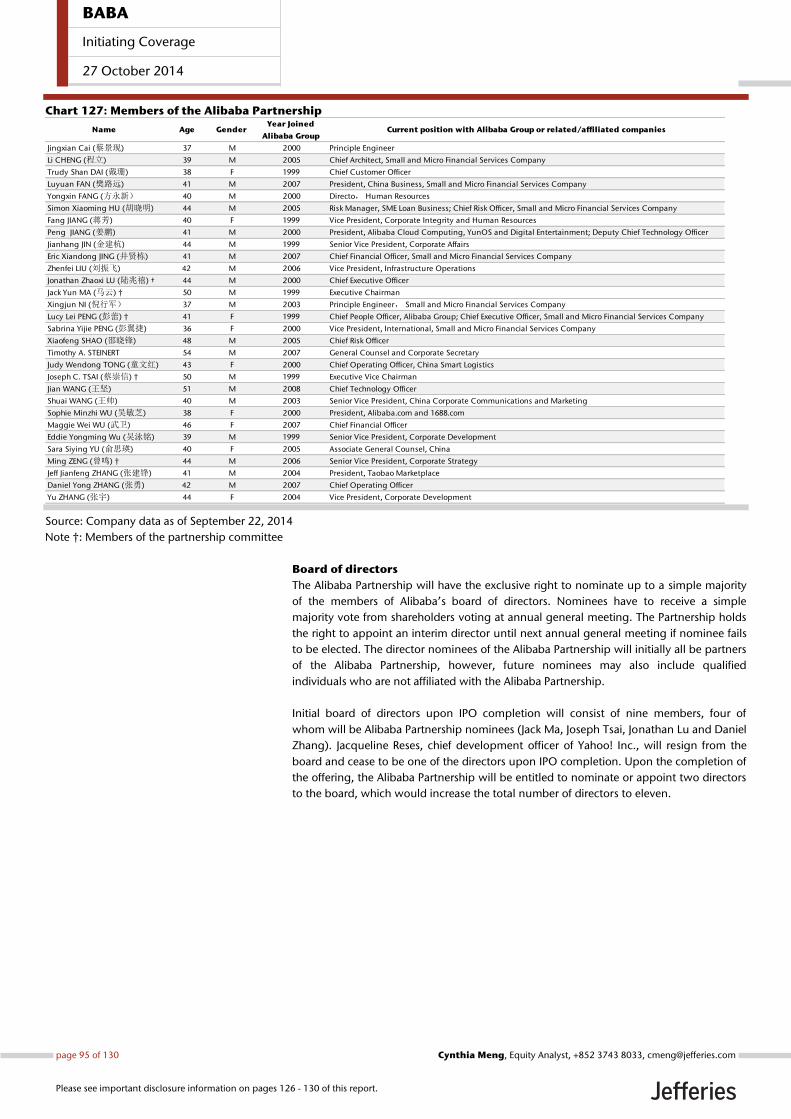
Chart 127: Members of the Alibaba Partnership
Source: Company data as of September 22, 2014
Note †: Members of the partnership committee
Board of directors
The Alibaba Partnership will have the exclusive right to nominate up to a simple majority
of the members of Alibaba’s board of directors. Nominees have to receive a simple
majority vote from shareholders voting at annual general meeting. The Partnership holds
the right to appoint an interim director until next annual general meeting if nominee fails
to be elected. The director nominees of the Alibaba Partnership will initially all be partners
of the Alibaba Partnership, however, future nominees may also include qualified
individuals who are not affiliated with the Alibaba Partnership.
Initial board of directors upon IPO completion will consist of nine members, four of
whom will be Alibaba Partnership nominees (Jack Ma, Joseph Tsai, Jonathan Lu and Daniel
Zhang). Jacqueline Reses, chief development officer of Yahoo! Inc., will resign from the
board and cease to be one of the directors upon IPO completion. Upon the completion of
the offering, the Alibaba Partnership will be entitled to nominate or appoint two directors
to the board, which would increase the total number of directors to eleven.
Name Age Gender Year Joined
Alibaba GroupCurrent position with Alibaba Group or related/affiliated companies
Jingxian Cai (蔡景现) 37 M 2000 Principle Engineer
Li CHENG (程立) 39 M 2005 Chief Architect, Small and Micro Financial Services Company
Trudy Shan DAI (戴珊) 38 F 1999 Chief Customer Officer
Luyuan FAN (樊路远) 41 M 2007 President, China Business, Small and Micro Financial Services Company
Yongxin FANG (方永新) 40 M 2000 Directo, Human Resources
Simon Xiaoming HU (胡晓明) 44 M 2005 Risk Manager, SME Loan Business; Chief Risk Officer, Small and Micro Financial Services Company
Fang JIANG (蒋芳) 40 F 1999 Vice President, Corporate Integrity and Human Resources
Peng JIANG (姜鹏) 41 M 2000 President, Alibaba Cloud Computing, YunOS and Digital Entertainment; Deputy Chief Technology Officer
Jianhang JIN (金建杭) 44 M 1999 Senior Vice President, Corporate Affairs
Eric Xiandong JING (井贤栋) 41 M 2007 Chief Financial Officer, Small and Micro Financial Services Company
Zhenfei LIU (刘振飞) 42 M 2006 Vice President, Infrastructure Operations
Jonathan Zhaoxi LU (陆兆禧) † 44 M 2000 Chief Executive Officer
Jack Yun MA (马云) † 50 M 1999 Executive Chairman
Xingjun NI (倪行军) 37 M 2003 Principle Engineer, Small and Micro Financial Services Company
Lucy Lei PENG (彭蕾) † 41 F 1999 Chief People Officer, Alibaba Group; Chief Executive Officer, Small and Micro Financial Services Company
Sabrina Yijie PENG (彭翼捷) 36 F 2000 Vice President, International, Small and Micro Financial Services Company
Xiaofeng SHAO (邵晓锋) 48 M 2005 Chief Risk Officer
Timothy A. STEINERT 54 M 2007 General Counsel and Corporate Secretary
Judy Wendong TONG (童文红) 43 F 2000 Chief Operating Officer, China Smart Logistics
Joseph C. TSAI (蔡崇信) † 50 M 1999 Executive Vice Chairman
Jian WANG (王坚) 51 M 2008 Chief Technology Officer
Shuai WANG (王帅) 40 M 2003 Senior Vice President, China Corporate Communications and Marketing
Sophie Minzhi WU (吴敏芝) 38 F 2000 President, Alibaba.com and 1688.com
Maggie Wei WU (武卫) 46 F 2007 Chief Financial Officer
Eddie Yongming Wu (吴泳铭) 39 M 1999 Senior Vice President, Corporate Development
Sara Siying YU (俞思瑛) 40 F 2005 Associate General Counsel, China
Ming ZENG (曾鸣) † 44 M 2006 Senior Vice President, Corporate Strategy
Jeff Jianfeng ZHANG (张建锋) 41 M 2004 President, Taobao Marketplace
Daniel Yong ZHANG (张勇) 42 M 2007 Chief Operating Officer
Yu ZHANG (张宇) 44 F 2004 Vice President, Corporate Development
BABA
Initiating Coverage
27 October 2014
page 95 of 130 , Equity Analyst, +852 3743 8033, [email protected] Meng
Please see important disclosure information on pages 126 - 130 of this report.
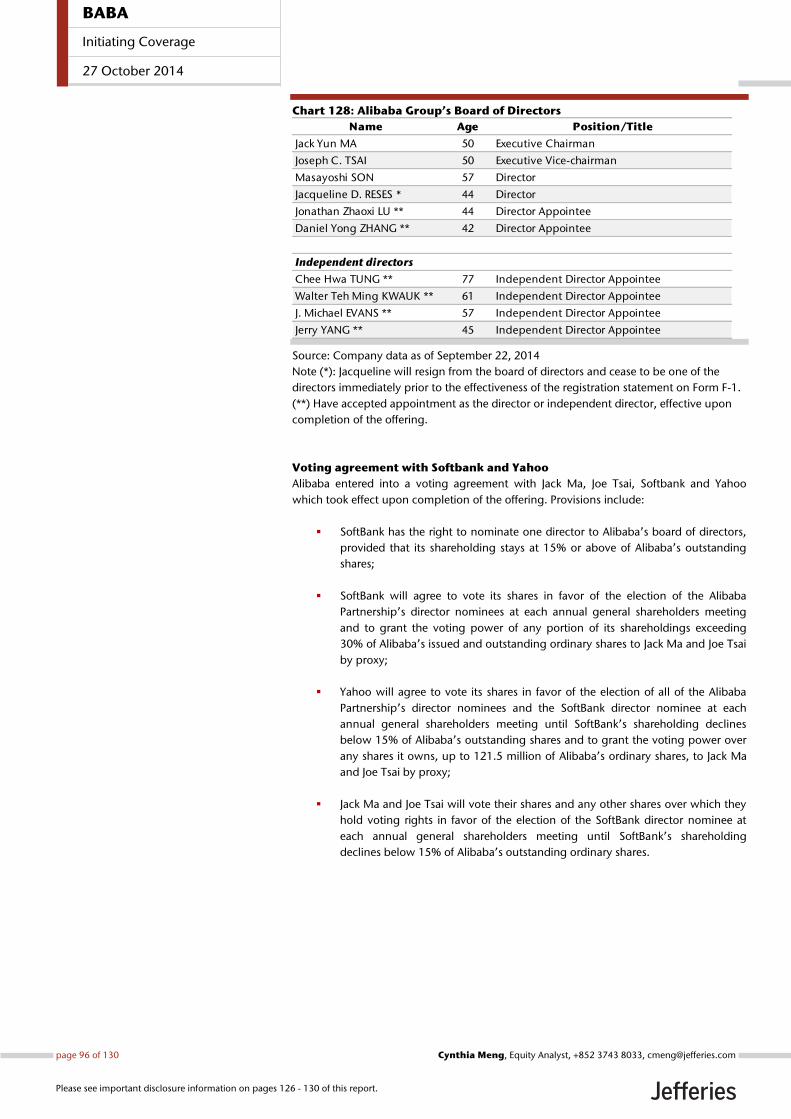
Chart 128: Alibaba Group’s Board of Directors
Source: Company data as of September 22, 2014
Note (*): Jacqueline will resign from the board of directors and cease to be one of the
directors immediately prior to the effectiveness of the registration statement on Form F-1.
(**) Have accepted appointment as the director or independent director, effective upon
completion of the offering.
Voting agreement with Softbank and Yahoo
Alibaba entered into a voting agreement with Jack Ma, Joe Tsai, Softbank and Yahoo
which took effect upon completion of the offering. Provisions include:
SoftBank has the right to nominate one director to Alibaba’s board of directors,
provided that its shareholding stays at 15% or above of Alibaba’s outstanding
shares;
SoftBank will agree to vote its shares in favor of the election of the Alibaba
Partnership’s director nominees at each annual general shareholders meeting
and to grant the voting power of any portion of its shareholdings exceeding
30% of Alibaba’s issued and outstanding ordinary shares to Jack Ma and Joe Tsai
by proxy;
Yahoo will agree to vote its shares in favor of the election of all of the Alibaba
Partnership’s director nominees and the SoftBank director nominee at each
annual general shareholders meeting until SoftBank’s shareholding declines
below 15% of Alibaba’s outstanding shares and to grant the voting power over
any shares it owns, up to 121.5 million of Alibaba’s ordinary shares, to Jack Ma
and Joe Tsai by proxy;
Jack Ma and Joe Tsai will vote their shares and any other shares over which they
hold voting rights in favor of the election of the SoftBank director nominee at
each annual general shareholders meeting until SoftBank’s shareholding
declines below 15% of Alibaba’s outstanding ordinary shares.
Name Age Position/Title
Jack Yun MA 50 Executive Chairman
Joseph C. TSAI 50 Executive Vice-chairman
Masayoshi SON 57 Director
Jacqueline D. RESES * 44 Director
Jonathan Zhaoxi LU ** 44 Director Appointee
Daniel Yong ZHANG ** 42 Director Appointee
Independent directors
Chee Hwa TUNG ** 77 Independent Director Appointee
Walter Teh Ming KWAUK ** 61 Independent Director Appointee
J. Michael EVANS ** 57 Independent Director Appointee
Jerry YANG ** 45 Independent Director Appointee
BABA
Initiating Coverage
27 October 2014
page 96 of 130 , Equity Analyst, +852 3743 8033, [email protected] Meng
Please see important disclosure information on pages 126 - 130 of this report.
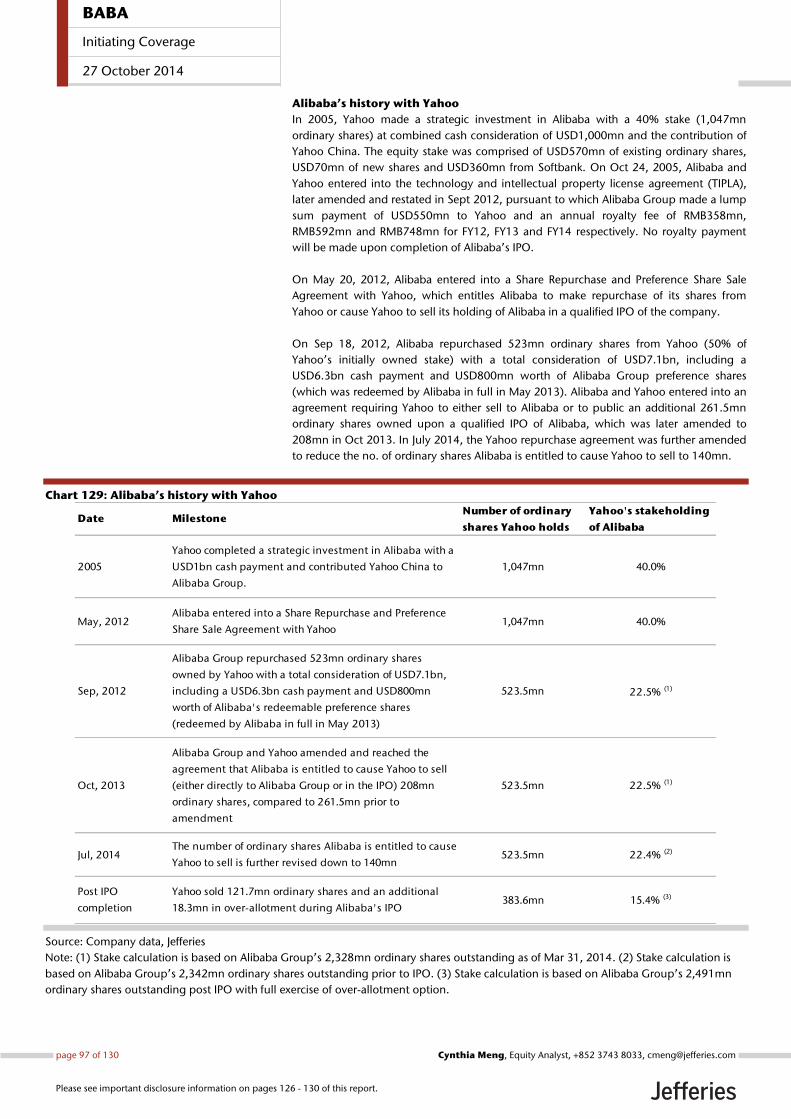
Alibaba’s history with Yahoo In 2005, Yahoo made a strategic investment in Alibaba with a 40% stake (1,047mn
ordinary shares) at combined cash consideration of USD1,000mn and the contribution of
Yahoo China. The equity stake was comprised of USD570mn of existing ordinary shares,
USD70mn of new shares and USD360mn from Softbank. On Oct 24, 2005, Alibaba and
Yahoo entered into the technology and intellectual property license agreement (TIPLA),
later amended and restated in Sept 2012, pursuant to which Alibaba Group made a lump
sum payment of USD550mn to Yahoo and an annual royalty fee of RMB358mn,
RMB592mn and RMB748mn for FY12, FY13 and FY14 respectively. No royalty payment
will be made upon completion of Alibaba’s IPO.
On May 20, 2012, Alibaba entered into a Share Repurchase and Preference Share Sale
Agreement with Yahoo, which entitles Alibaba to make repurchase of its shares from
Yahoo or cause Yahoo to sell its holding of Alibaba in a qualified IPO of the company.
On Sep 18, 2012, Alibaba repurchased 523mn ordinary shares from Yahoo (50% of
Yahoo’s initially owned stake) with a total consideration of USD7.1bn, including a
USD6.3bn cash payment and USD800mn worth of Alibaba Group preference shares
(which was redeemed by Alibaba in full in May 2013). Alibaba and Yahoo entered into an
agreement requiring Yahoo to either sell to Alibaba or to public an additional 261.5mn
ordinary shares owned upon a qualified IPO of Alibaba, which was later amended to
208mn in Oct 2013. In July 2014, the Yahoo repurchase agreement was further amended
to reduce the no. of ordinary shares Alibaba is entitled to cause Yahoo to sell to 140mn.
Chart 129: Alibaba’s history with Yahoo
Source: Company data, Jefferies
Note: (1) Stake calculation is based on Alibaba Group’s 2,328mn ordinary shares outstanding as of Mar 31, 2014. (2) Stake calculation is
based on Alibaba Group’s 2,342mn ordinary shares outstanding prior to IPO. (3) Stake calculation is based on Alibaba Group’s 2,491mn
ordinary shares outstanding post IPO with full exercise of over-allotment option.
Date MilestoneNumber of ordinary
shares Yahoo holds
Yahoo's stakeholding
of Alibaba
2005
Yahoo completed a strategic investment in Alibaba with a
USD1bn cash payment and contributed Yahoo China to
Alibaba Group.
1,047mn 40.0%
May, 2012Alibaba entered into a Share Repurchase and Preference
Share Sale Agreement with Yahoo1,047mn 40.0%
Sep, 2012
Alibaba Group repurchased 523mn ordinary shares
owned by Yahoo with a total consideration of USD7.1bn,
including a USD6.3bn cash payment and USD800mn
worth of Alibaba's redeemable preference shares
(redeemed by Alibaba in full in May 2013)
523.5mn 22.5% (1)
Oct, 2013
Alibaba Group and Yahoo amended and reached the
agreement that Alibaba is entitled to cause Yahoo to sell
(either directly to Alibaba Group or in the IPO) 208mn
ordinary shares, compared to 261.5mn prior to
amendment
523.5mn 22.5% (1)
Jul, 2014The number of ordinary shares Alibaba is entitled to cause
Yahoo to sell is further revised down to 140mn523.5mn 22.4% (2)
Post IPO
completion
Yahoo sold 121.7mn ordinary shares and an additional
18.3mn in over-allotment during Alibaba's IPO383.6mn 15.4% (3)
BABA
Initiating Coverage
27 October 2014
page 97 of 130 , Equity Analyst, +852 3743 8033, [email protected] Meng
Please see important disclosure information on pages 126 - 130 of this report.
Small and Micro Financial Services Company
Ownership structure
Alipay was established in Dec 2004 to operate Alibaba’s payment services and later
restructured as a separate domestic PRC-owned entity in order to obtain a payment
business license from the PBOC. Accordingly, Alibaba divested all of its interest and
control over Alipay which resulted in deconsolidation of Alipay from its financial
statements starting from CY1Q11. Upon divestiture, Jack Ma held a 46% equity stake of
Zhejiang Alibaba E-Commerce Co., Ltd. (also known as Small and Micro Financial Services
Company), Alipay’s parent entity, followed by 12% by Simon Xie and 42% by Hangzhou
Junao Equity Investment Partnership, interests of which are held by certain members of
the Alibaba partnership.
The ownership structure of Small and Micro Financial Services Company was recently
changed and currently Hangzhou Junhan Equity Investment Partnership holds 58% of
equity stake with the rest held by Junao. Interests in Junhan are owned by Jack Ma, Simon
Xie and other employees of Alibaba Group as well as Small and Micro Financial Services
Company. Jack Ma has committed to reduce his interest in Small and Micro Financial
Services Company over time to 8.9% or below. The company intends to raise equity
capital from domestic Chinese investors in the future and the shareholding of Junao and
Junhan will be correspondingly reduced through dilution. However, the combined
ownership of Jack Ma, Junao and Junhan will continue to constitute the majority of
outstanding shares of the company. In terms of voting right, Jack Ma, as the general
partner of Junao and Junhan, is able to exercise the voting power on behalf of both
entities as shareholders in Small and Micro Financial Services Company, which implies
that he will continue to control majority of voting interests in the company.
2011 Framework agreement
Upon the occurrence of certain liquidity events of Alipay (including an initial public
offering, a transfer of 37.5% or more of the equity interests of Alipay or a sale of all or
substantially all assets of Alipay), Small and Micro Financial Services Company will pay
Alibaba Group an amount equal to 37.5% of the equity value of Alipay with a minimum
payment of USD2bn and a maximum payment of USD6bn.
If a liquidity event does not occur by the tenth anniversary of July 29, 2011, Alibaba
Group will have the right to demand Alipay to effect a liquidity event provided that the
equity or enterprise value of Alipay at such time exceeds USD1bn. If Alibaba demands a
liquidity event and unless the liquidity event is effected by means of a 37.5% or more
equity interest transfer of Alipay, the minimum amount of USD2bn will not be applicable.
Alipay Commercial agreement & intellectual property and software
technology services agreement
Pursuant to the Alipay commercial agreement, Alipay provides payment processing
services to Alibaba Group and its subsidiaries in return for a fee on preferential terms to
Alibaba. Fees paid by Alibaba to Alipay amounted to RMB1.3bn, RMB1.6bn, RMB2.3bn
and RMB740mn in FY12, FY13, FY14 and the three months ended June 30, 2014
respectively.
Pursuant to an intellectual property and software technology services agreement, Alipay
pays Alibaba royalty fees and software technology service fees equal to the sum of an
expense reimbursement plus 49.9% of the consolidated pre-tax income of Alipay. As
disclosed by the company, Alipay paid a royalty and software technology service fee to
Alibaba of RMB27mn, RMB277mn, RMB1,764mn and RMB527mn in FY12, FY13, FY14
and the three months ended June 30, 2014 respectively.
BABA
Initiating Coverage
27 October 2014
page 98 of 130 , Equity Analyst, +852 3743 8033, [email protected] Meng
Please see important disclosure information on pages 126 - 130 of this report.
2014 Share and asset purchase agreement (SAPA) & amended Alipay
intellectual property and software technology services agreement
On August 12, 2014, the company entered into a share and asset purchase agreement
(2014 SAPA), and accordingly restructured the relationships with Small and Micro
Financial Services Company and its wholly owned subsidiary Alipay. The 2011 framework
agreement was terminated.
Alibaba Group agreed to dispose of the SME loan business to Small and Micro
Financial Services Company in exchange for cash consideration and annual fees
for seven years. Alibaba Group will receive an annual fee equal to 2.5% of the
average daily balance of SME loans from 2015 to 2017; and fixed annual fee
equal to the 2017 annual fee from 2018 to 2021. The disposition allows the
company to focus on the core e-commerce businesses and eliminates the direct
risks and disadvantages of carrying a loan portfolio on balance sheet, such as the
direct risks of credit defaults, capital adequacy, leverage and regulatory
requirements associated with a loan.
The cap of USD6 bn on the liquidity event payment under the 2011 framework
agreement has been removed. Under the restructured agreement, the Company
will still be entitled to a payment equal to 37.5% of the equity value of Small
and Micro Financial Services Company.
The profit share has been restructured that the base of profits was expanded
from the pre-tax income of only Alipay to the pre-tax income of all of the
businesses of Small and Micro Financial Services Company, while the profit
sharing percentage has been reduced to 37.5% from 49.9%.
Upon a qualified IPO of Small and Micro Financial Services Company, Alibaba is
entitled to receive a payment equal to 37.5% of the equity value of Small and
Micro Financial Services Company until Alibaba acquires a full 33% equity
interest.
BABA
Initiating Coverage
27 October 2014
page 99 of 130 , Equity Analyst, +852 3743 8033, [email protected] Meng
Please see important disclosure information on pages 126 - 130 of this report.
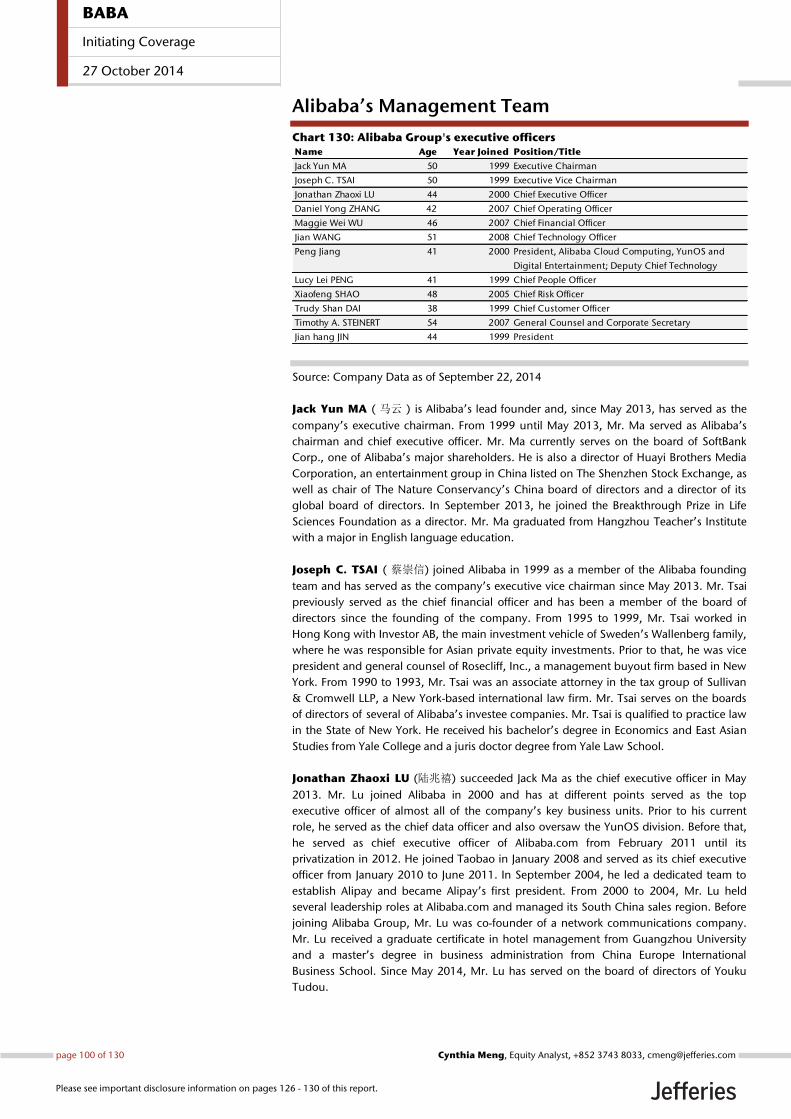
Alibaba’s Management Team
Chart 130: Alibaba Group's executive officers
Source: Company Data as of September 22, 2014
Jack Yun MA ( 马云 ) is Alibaba’s lead founder and, since May 2013, has served as the
company’s executive chairman. From 1999 until May 2013, Mr. Ma served as Alibaba’s
chairman and chief executive officer. Mr. Ma currently serves on the board of SoftBank
Corp., one of Alibaba’s major shareholders. He is also a director of Huayi Brothers Media
Corporation, an entertainment group in China listed on The Shenzhen Stock Exchange, as
well as chair of The Nature Conservancy’s China board of directors and a director of its
global board of directors. In September 2013, he joined the Breakthrough Prize in Life
Sciences Foundation as a director. Mr. Ma graduated from Hangzhou Teacher’s Institute
with a major in English language education.
Joseph C. TSAI ( 蔡崇信) joined Alibaba in 1999 as a member of the Alibaba founding
team and has served as the company’s executive vice chairman since May 2013. Mr. Tsai
previously served as the chief financial officer and has been a member of the board of
directors since the founding of the company. From 1995 to 1999, Mr. Tsai worked in
Hong Kong with Investor AB, the main investment vehicle of Sweden’s Wallenberg family,
where he was responsible for Asian private equity investments. Prior to that, he was vice
president and general counsel of Rosecliff, Inc., a management buyout firm based in New
York. From 1990 to 1993, Mr. Tsai was an associate attorney in the tax group of Sullivan
& Cromwell LLP, a New York-based international law firm. Mr. Tsai serves on the boards
of directors of several of Alibaba’s investee companies. Mr. Tsai is qualified to practice law
in the State of New York. He received his bachelor’s degree in Economics and East Asian
Studies from Yale College and a juris doctor degree from Yale Law School.
Jonathan Zhaoxi LU (陆兆禧) succeeded Jack Ma as the chief executive officer in May
2013. Mr. Lu joined Alibaba in 2000 and has at different points served as the top
executive officer of almost all of the company’s key business units. Prior to his current
role, he served as the chief data officer and also oversaw the YunOS division. Before that,
he served as chief executive officer of Alibaba.com from February 2011 until its
privatization in 2012. He joined Taobao in January 2008 and served as its chief executive
officer from January 2010 to June 2011. In September 2004, he led a dedicated team to
establish Alipay and became Alipay’s first president. From 2000 to 2004, Mr. Lu held
several leadership roles at Alibaba.com and managed its South China sales region. Before
joining Alibaba Group, Mr. Lu was co-founder of a network communications company.
Mr. Lu received a graduate certificate in hotel management from Guangzhou University
and a master’s degree in business administration from China Europe International
Business School. Since May 2014, Mr. Lu has served on the board of directors of Youku
Tudou.
Name Age Year Joined Position/Title
Jack Yun MA 50 1999 Executive Chairman
Joseph C. TSAI 50 1999 Executive Vice Chairman
Jonathan Zhaoxi LU 44 2000 Chief Executive Officer
Daniel Yong ZHANG 42 2007 Chief Operating Officer
Maggie Wei WU 46 2007 Chief Financial Officer
Jian WANG 51 2008 Chief Technology Officer
Peng Jiang 41 2000 President, Alibaba Cloud Computing, YunOS and
Digital Entertainment; Deputy Chief Technology
Lucy Lei PENG 41 1999 Chief People Officer
Xiaofeng SHAO 48 2005 Chief Risk Officer
Trudy Shan DAI 38 1999 Chief Customer Officer
Timothy A. STEINERT 54 2007 General Counsel and Corporate Secretary
Jian hang JIN 44 1999 President
BABA
Initiating Coverage
27 October 2014
page 100 of 130 , Equity Analyst, +852 3743 8033, [email protected] Meng
Please see important disclosure information on pages 126 - 130 of this report.
Maggie Wei WU ( 武卫) has been the chief financial officer since May 2013. Ms. Wu
served as the deputy chief financial officer from October 2011 to May 2013. Ms. Wu
joined the company in July 2007 as chief financial officer of Alibaba.com and was
responsible for instituting Alibaba.com’s financial systems and organization leading up to
its initial public offering in Hong Kong in November of that year, as well as co-leading the
privatization of Alibaba.com in 2012. She was voted best CFO in FinanceAsia’s annual poll
for Asia’s Best Managed Companies in 2010. Before joining the company, Ms. Wu was an
audit partner at KPMG in Beijing. In her 15 years with KPMG, she was lead audit partner
for the initial public offerings and audits of several major large-cap Chinese companies
listed in international capital markets and provided audit and advisory services to major
multinational corporations operating in China. Ms. Wu is a member of the Association of
Chartered Certified Accountants (ACCA) and a member of the Chinese Institute of
Certified Public Accountants. She received a bachelor’s degree in accounting from Capital
University of Economics and Business.
BABA
Initiating Coverage
27 October 2014
page 101 of 130 , Equity Analyst, +852 3743 8033, [email protected] Meng
Please see important disclosure information on pages 126 - 130 of this report.
Financial Statements
Income Statement We estimate Alibaba’s total revenue to reach RMB76.8bn, +46.3% YoY, in FY15, and
RMB105bn, +36.7% YoY, in FY16. We currently estimate FY14-17 revenue CAGR of 36%.
We expect total GMV to reach RMB2.4bn in FY15, +44.1% YoY, with Tmall accounting for
37.9% and the rest contributed by Taobao. We estimate FY16 total GMV of RMB3.3bn,
+35.1% YoY.
China commerce: We estimate China commerce sales to grow 50.5% YoY to
RMB67.9bn in FY15, representing 88.4% of total revenue, and 41.1% YoY to RMB95.8bn
in FY16, 91.2% of total revenue, mainly driven by growth in core retail marketplace
businesses.
Retail (Taobao, Tmall, Juhuasuan): We estimate China’s retail revenue to
reach RMB64.8bn in FY15, +51.3% YoY, accounting for 84.4% of total revenue,
largely driven by strong growth in commission revenue. We expect revenue to
further grow 42% YoY to reach RMB92bn in FY16.
Online marketing services: We estimate online marketing service
revenue to reach RMB39.4bn in FY15, +32.7% YoY, accounting for
51.3% of total revenue, and RMB50.1bn in FY16, +27.1% YoY, 47.7%
of total revenue. Our estimates are based on continued strong growth
of GMV partially offset by declining merchants’ advertising budget-to-
GMV ratio, due to the increasing GMV contribution from mobile on
which merchants typically allocate a smaller proportion of their budget
to advertising due to the smaller screen of a mobile device.
Commission: We estimate commission revenue of RMB24.5bn in
FY15, +104% YoY, representing 31.9% of total revenue, and
RMB41.2bn in FY16, +68% YoY, 39.2% of total revenue. This is based
on strong growth of Tmall GMV of 81.5% YoY and 62.2% YoY in the
respective years, and assuming average commission rate at 3.4% and
3.6% respectively.
Others: We estimate other revenue, mainly comprised of Wangpu
storefront fees, continue to account for a declining revenue
contribution of 1.1% in FY15 and 0.6% in FY16.
Wholesale (1688.com): We estimate China wholesale revenue to reach
RMB3.1bn in FY15, +35.3% YoY, accounting for 4.1% of total revenue, and
RMB3.8bn in FY16, +22.8% YoY, 3.6% of total revenue. This is mainly supported
by solid growth of marketing revenue as well as paying members subscribing to
China TrustPass.
International commerce: We estimate FY15 international commerce revenue to reach
RMB6.6bn, up 35.3% YoY, representing 8.5% of total revenue, and RMB7.9bn, up 20%
YoY, in FY16.
Retail (AliExpress): We estimate international retail revenue to reach
RMB1.8bn in FY15, +96.9% YoY, representing 2.4% of total revenue, driven by
solid growth in both commission and marketing revenue, assuming a stable
commission rate of 5%.
Wholesale (Alibaba.com): We estimate international wholesale revenue to
reach RMB4.7bn in FY15, +20.5% YoY, representing 6.1% of total revenue,
mainly supported by growth in number of paying members.
BABA
Initiating Coverage
27 October 2014
page 102 of 130 , Equity Analyst, +852 3743 8033, [email protected] Meng
Please see important disclosure information on pages 126 - 130 of this report.
Cloud computing and Internet infrastructure: Alibaba offers a suite of cloud
computing services to its marketplace merchants and third-party customers. We estimate
cloud computing and Internet infrastructure revenue of RMB1.1bn, +38.3% YoY, in FY15
and RMB1.3bn, +25% YoY, in FY16.
Gross profit: We currently estimate non-GAAP gross margin to decline 9.1pcpt YoY to
67.7% in FY15 but slightly improve 0.3pcpt YoY to 68% in FY16, as Alibaba continues to
invest heavily in mobile, including but not limited to mobile rebates.
Operating profit: Non-GAAP operating margin improved 10.2pcpt YoY to 56% in FY14,
benefitting from economies of scale. However, we expect to see some margin pressure
this year, taking into consideration of increasing mobile investments (including rebates,
product development and marketing), as well as intensified competition. We are
modelling non-GAAP operating margin to decline 11.1pcpt YoY at 44.9% in FY15 and
0.7pcpt YoY to 44.2% in FY16. Scale-back of investments including rebate and R&D costs
could provide upside to margin in the longer term.
We expect increasing R&D dollar spending as Alibaba continues to focus on
existing and new product development efforts. We currently estimate product
development cost-to-sales ratio on a non-GAAP basis to be 10.4% and 11.3% in
FY15 and FY16, respectively, up from 8.2% in FY14.
We estimate sales and marketing expense-to-sales ratio to increase by 0.6pcpt
YoY to 8.9% in FY15 and 1pcpt YoY to 9.9% in FY16, driven by an increase in
advertising and promotional spending on China retail marketplaces and mobile
commerce.
EBITDA: We are modelling non-GAAP EBITDA margin to decline 11.3pcpt YoY to 47.2%
in FY15 and 0.7pcpt YoY to 46.5% in FY16.
Non-operating income from Small and Micro Financial Services Company:
According to the 2014 share and asset purchase agreement in Aug 2014, Alibaba is
entitled to a profit share of 37.5% of the pre-tax income of Small and Micro Financial
Services Company. We estimate total revenue of Small and Micro Financial Services
Company, including Alipay’s payment processing fee, Yu’e Bao management fee and
SME loan interest, to reach RMB48.5bn in FY15, +88.8% YoY, and RMB73.1bn in FY16,
+50.7% YoY. Assuming a 12.6% pre-tax income margin and Alibaba’s 37.5% profit share,
we estimate royalty and software technology service income Alibaba receives from Small
and Micro Financial Services Company to be RMB2.5bn in FY15 and RMB3.4bn in FY16.
Net profit: Overall, we estimate non-GAAP net profit to grow 14.1% YoY to RMB31.5bn
in FY15, implying a net margin decline of 11.6pcpt YoY to 41%. We estimate FY16 non-
GAAP net profit of RMB45.1bn, +43.1% YoY, with a net margin of 42.9%, +1.9pcpt YoY.
BABA
Initiating Coverage
27 October 2014
page 103 of 130 , Equity Analyst, +852 3743 8033, [email protected] Meng
Please see important disclosure information on pages 126 - 130 of this report.
Balance Sheet As of June 30, 2014, cash and cash equivalents and short-term investments amounted to
RMB57.9bn (USD9.3bn) with RMB62.1bn (USD10bn) debt, resulting in a net debt of
RMB4.2bn (USD682mn). Short-term investments mainly consist of fixed deposits with
maturities between three months and one year.
Alibaba raised a total of USD25bn at an offering price of USD68 with a total of 368mn
shares sold during the IPO in Sept 2014. Alibaba will not receive any proceeds from the
ADS sold by selling shareholders and hence, we estimate Alibaba received a net proceed
of USD10bn (RMB62bn) from the offering. Given the disposal of SME loan business to
Small and Micro Financial Service Company announced in Aug 2014, we expect its loan
receivables as well as current bank borrowing and secured borrowings that are used to
fund the corresponding business will be removed from the balance sheet.
We currently estimate net cash of RMB81.5bn (USD13.1bn) in FY15.
Cash Flow Statement Alibaba’s operating cash flow was RMB26.4bn in FY14 with free cash flow of RMB32.3bn,
factoring in purchase of property, equipment and intangible assets of RMB3.3bn, and
change in loan receivables of RMB9.2bn. We estimate a free cash flow of RMB21.6bn in
FY15, representing a 1.6% free cash flow yield, and RMB49.2bn in FY16 with a 3.6% free
cash flow yield.
Alibaba’s investing outflow was RMB33bn with total capex (including purchase of
property, equipment and intangible assets, acquisition of land use rights and construction
in progress) of RMB4.8bn in FY14, representing 9.1% of sales, mainly due to construction
of corporate campuses and office facilities in Hangzhou, Beijing and Shenzhen. We
estimate a capex to sales ratio of 12.4% (i.e., RMB9.5bn) in FY15 and 10.1% (i.e.,
RMB10.6bn) in FY16.
Cash provided by financing activities was RMB9.4bn in FY14.
BABA
Initiating Coverage
27 October 2014
page 104 of 130 , Equity Analyst, +852 3743 8033, [email protected] Meng
Please see important disclosure information on pages 126 - 130 of this report.
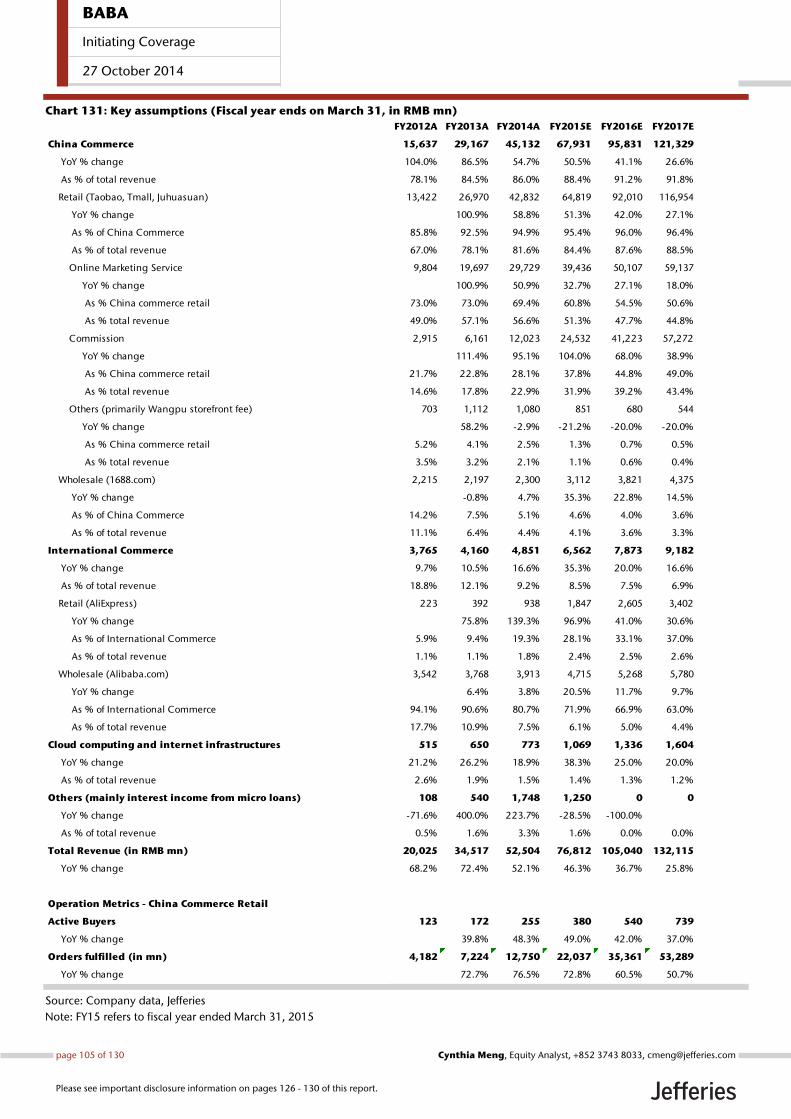
Chart 131: Key assumptions (Fiscal year ends on March 31, in RMB mn)
Source: Company data, Jefferies
Note: FY15 refers to fiscal year ended March 31, 2015
FY2012A FY2013A FY2014A FY2015E FY2016E FY2017E
China Commerce 15,637 29,167 45,132 67,931 95,831 121,329
YoY % change 104.0% 86.5% 54.7% 50.5% 41.1% 26.6%
As % of total revenue 78.1% 84.5% 86.0% 88.4% 91.2% 91.8%
Retail (Taobao, Tmall, Juhuasuan) 13,422 26,970 42,832 64,819 92,010 116,954
YoY % change 100.9% 58.8% 51.3% 42.0% 27.1%
As % of China Commerce 85.8% 92.5% 94.9% 95.4% 96.0% 96.4%
As % of total revenue 67.0% 78.1% 81.6% 84.4% 87.6% 88.5%
Online Marketing Service 9,804 19,697 29,729 39,436 50,107 59,137
YoY % change 100.9% 50.9% 32.7% 27.1% 18.0%
As % China commerce retail 73.0% 73.0% 69.4% 60.8% 54.5% 50.6%
As % total revenue 49.0% 57.1% 56.6% 51.3% 47.7% 44.8%
Commission 2,915 6,161 12,023 24,532 41,223 57,272
YoY % change 111.4% 95.1% 104.0% 68.0% 38.9%
As % China commerce retail 21.7% 22.8% 28.1% 37.8% 44.8% 49.0%
As % total revenue 14.6% 17.8% 22.9% 31.9% 39.2% 43.4%
Others (primarily Wangpu storefront fee) 703 1,112 1,080 851 680 544
YoY % change 58.2% -2.9% -21.2% -20.0% -20.0%
As % China commerce retail 5.2% 4.1% 2.5% 1.3% 0.7% 0.5%
As % total revenue 3.5% 3.2% 2.1% 1.1% 0.6% 0.4%
Wholesale (1688.com) 2,215 2,197 2,300 3,112 3,821 4,375
YoY % change -0.8% 4.7% 35.3% 22.8% 14.5%
As % of China Commerce 14.2% 7.5% 5.1% 4.6% 4.0% 3.6%
As % of total revenue 11.1% 6.4% 4.4% 4.1% 3.6% 3.3%
International Commerce 3,765 4,160 4,851 6,562 7,873 9,182
YoY % change 9.7% 10.5% 16.6% 35.3% 20.0% 16.6%
As % of total revenue 18.8% 12.1% 9.2% 8.5% 7.5% 6.9%
Retail (AliExpress) 223 392 938 1,847 2,605 3,402
YoY % change 75.8% 139.3% 96.9% 41.0% 30.6%
As % of International Commerce 5.9% 9.4% 19.3% 28.1% 33.1% 37.0%
As % of total revenue 1.1% 1.1% 1.8% 2.4% 2.5% 2.6%
Wholesale (Alibaba.com) 3,542 3,768 3,913 4,715 5,268 5,780
YoY % change 6.4% 3.8% 20.5% 11.7% 9.7%
As % of International Commerce 94.1% 90.6% 80.7% 71.9% 66.9% 63.0%
As % of total revenue 17.7% 10.9% 7.5% 6.1% 5.0% 4.4%
Cloud computing and internet infrastructures 515 650 773 1,069 1,336 1,604
YoY % change 21.2% 26.2% 18.9% 38.3% 25.0% 20.0%
As % of total revenue 2.6% 1.9% 1.5% 1.4% 1.3% 1.2%
Others (mainly interest income from micro loans) 108 540 1,748 1,250 0 0
YoY % change -71.6% 400.0% 223.7% -28.5% -100.0%
As % of total revenue 0.5% 1.6% 3.3% 1.6% 0.0% 0.0%
Total Revenue (in RMB mn) 20,025 34,517 52,504 76,812 105,040 132,115
YoY % change 68.2% 72.4% 52.1% 46.3% 36.7% 25.8%
Operation Metrics - China Commerce Retail
Active Buyers 123 172 255 380 540 739
YoY % change 39.8% 48.3% 49.0% 42.0% 37.0%
Orders fulfilled (in mn) 4,182 7,224 12,750 22,037 35,361 53,289
YoY % change 72.7% 76.5% 72.8% 60.5% 50.7%
BABA
Initiating Coverage
27 October 2014
page 105 of 130 , Equity Analyst, +852 3743 8033, [email protected] Meng
Please see important disclosure information on pages 126 - 130 of this report.

Chart 132: Key assumptions (Fiscal year ends on March 31, in RMB mn) (cont’d)
Source: Company data, Jefferies
Note: FY15 refers to fiscal year ended March 31, 2015
GMV Metrics - China Commerce Retail FY2012A FY2013A FY2014A FY2015E FY2016E FY2017E
Total GMV (in RMB bn) 663 1,077 1,678 2,418 3,268 4,069
YoY % change 62.4% 55.8% 44.1% 35.1% 24.5%
Taobao Marketplace GMV 550 824 1,173 1,502 1,781 2,003
YoY % change 49.8% 42.4% 28.0% 18.6% 12.4%
% of Total GMV 83.0% 76.5% 69.9% 62.1% 54.5% 49.2%
Tmall GMV 113 253 505 917 1,487 2,066
YoY % change 123.9% 99.6% 81.5% 62.2% 38.9%
% of Total GMV 17.0% 23.5% 30.1% 37.9% 45.5% 50.8%
Overall monetization rate 2.02% 2.50% 2.55% 2.68% 2.82% 2.87%
Commission rate 3.0% 3.0% 3.0% 3.4% 3.6% 3.6%
Mobile GMV (in RMB bn) 16 79 319 1,068 1,922 2,730
YoY % change 386.9% 300.9% 235.4% 79.9% 42.1%
% of Total GMV 2.5% 7.4% 19.0% 44.2% 58.8% 67.1%
Mobile Revenue (in RMB mn) - 389 2,905 19,657 44,402 73,605
YoY % change 646.8% 576.6% 125.9% 65.8%
As % of China Commerce retail revenue 1.4% 6.8% 30.3% 48.3% 62.9%
Mobile Monetization rate 0.49% 0.91% 1.84% 2.31% 2.70%
YoY % change 0.5% 0.4% 0.9% 0.5% 0.4%
PC GMV (in RMB bn) 647 998 1,359 1,350 1,346 1,338
YoY % change 54.3% 36.3% -0.7% -0.3% -0.6%
% of Total GMV 97.5% 92.6% 81.0% 55.8% 41.2% 32.9%
PC Revenue (in RMB mn) - 26,581 39,927 45,162 47,608 43,349
YoY % change 50.2% 13.1% 5.4% -8.9%
As % of China Commerce retail revenue 98.6% 93.2% 69.7% 51.7% 37.1%
PC Monetization rate 2.66% 2.94% 3.34% 3.54% 3.24%
YoY % change 2.7% 0.3% 0.4% 0.2% -0.3%
Non-GAAP expenses as % of revenue
Cost of revenue 30.3% 27.1% 23.3% 32.3% 32.0% 30.0%
Product development expenses 12.9% 9.6% 8.2% 10.4% 11.3% 11.8%
Sales and marketing expenses 14.6% 10.1% 8.3% 8.9% 9.9% 11.7%
General and administrative expenses 9.5% 7.5% 4.3% 3.4% 2.7% 2.2%
Gross Profit 6,554 9,719 13,369 27,970 37,413 44,434
YoY % change 48.3% 37.6% 109.2% 33.8% 18.8%
Non-GAAP Gross Profit 13,953 25,180 40,289 51,979 71,427 92,480
YoY % change 80.5% 60.0% 29.0% 37.4% 29.5%
Operating profit 5,015 10,751 24,920 28,255 37,960 47,703
YoY % change 114.4% 131.8% 13.4% 34.3% 25.7%
Non-GAAP Operating profit 6,559 15,802 29,392 34,486 46,382 58,467
YoY % change 140.9% 86.0% 17.3% 34.5% 26.1%
Net Profit 4,665 8,649 23,403 31,157 35,777 46,676
YoY % change 85.4% 170.6% 33.1% 14.8% 30.5%
Non-GAAP Net Profit 9,154 13,869 27,610 31,489 45,060 58,541
YoY % change 229.5% 51.5% 99.1% 14.1% 43.1% 29.9%
Net Cash (net debt) 20,461 4,776 2,557 81,486 130,309 191,652
GAAP Gross Margin 67.3% 71.8% 74.5% 63.6% 64.4% 66.4%
GAAP Operating Margin 25.0% 31.1% 47.5% 36.8% 36.1% 36.1%
GAAP Net Margin 21.1% 24.7% 44.4% 40.5% 34.1% 35.3%
Non-GAAP Gross Margin 69.7% 72.9% 76.7% 67.7% 68.0% 70.0%
Non-GAAP Operating Margin 32.8% 45.8% 56.0% 44.9% 44.2% 44.3%
Non-GAAP EBITDA Margin 36.3% 48.1% 58.5% 47.2% 46.5% 46.8%
Non-GAAP Net Margin 45.7% 40.2% 52.6% 41.0% 42.9% 44.3%
Capex as % of revenue 10.8% 7.3% 9.1% 12.4% 10.1% 9.1%
BABA
Initiating Coverage
27 October 2014
page 106 of 130 , Equity Analyst, +852 3743 8033, [email protected] Meng
Please see important disclosure information on pages 126 - 130 of this report.
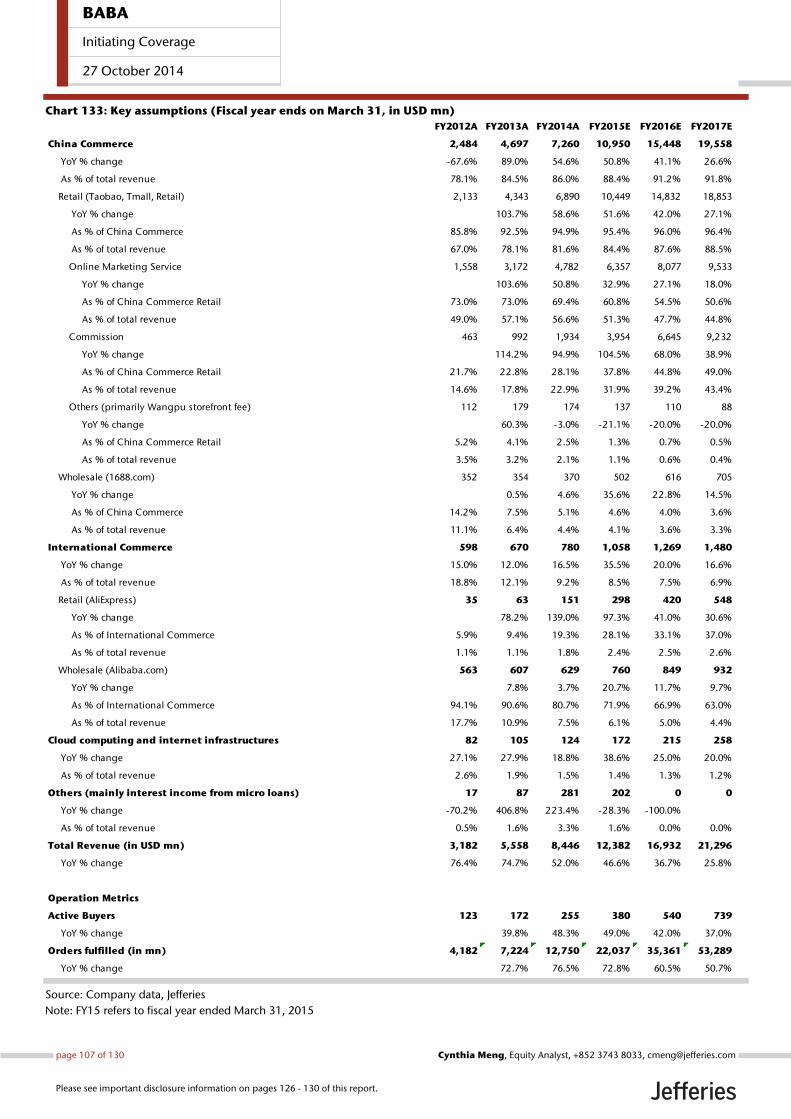
Chart 133: Key assumptions (Fiscal year ends on March 31, in USD mn)
Source: Company data, Jefferies
Note: FY15 refers to fiscal year ended March 31, 2015
FY2012A FY2013A FY2014A FY2015E FY2016E FY2017E
China Commerce 2,484 4,697 7,260 10,950 15,448 19,558
YoY % change -67.6% 89.0% 54.6% 50.8% 41.1% 26.6%
As % of total revenue 78.1% 84.5% 86.0% 88.4% 91.2% 91.8%
Retail (Taobao, Tmall, Retail) 2,133 4,343 6,890 10,449 14,832 18,853
YoY % change 103.7% 58.6% 51.6% 42.0% 27.1%
As % of China Commerce 85.8% 92.5% 94.9% 95.4% 96.0% 96.4%
As % of total revenue 67.0% 78.1% 81.6% 84.4% 87.6% 88.5%
Online Marketing Service 1,558 3,172 4,782 6,357 8,077 9,533
YoY % change 103.6% 50.8% 32.9% 27.1% 18.0%
As % of China Commerce Retail 73.0% 73.0% 69.4% 60.8% 54.5% 50.6%
As % of total revenue 49.0% 57.1% 56.6% 51.3% 47.7% 44.8%
Commission 463 992 1,934 3,954 6,645 9,232
YoY % change 114.2% 94.9% 104.5% 68.0% 38.9%
As % of China Commerce Retail 21.7% 22.8% 28.1% 37.8% 44.8% 49.0%
As % of total revenue 14.6% 17.8% 22.9% 31.9% 39.2% 43.4%
Others (primarily Wangpu storefront fee) 112 179 174 137 110 88
YoY % change 60.3% -3.0% -21.1% -20.0% -20.0%
As % of China Commerce Retail 5.2% 4.1% 2.5% 1.3% 0.7% 0.5%
As % of total revenue 3.5% 3.2% 2.1% 1.1% 0.6% 0.4%
Wholesale (1688.com) 352 354 370 502 616 705
YoY % change 0.5% 4.6% 35.6% 22.8% 14.5%
As % of China Commerce 14.2% 7.5% 5.1% 4.6% 4.0% 3.6%
As % of total revenue 11.1% 6.4% 4.4% 4.1% 3.6% 3.3%
International Commerce 598 670 780 1,058 1,269 1,480
YoY % change 15.0% 12.0% 16.5% 35.5% 20.0% 16.6%
As % of total revenue 18.8% 12.1% 9.2% 8.5% 7.5% 6.9%
Retail (AliExpress) 35 63 151 298 420 548
YoY % change 78.2% 139.0% 97.3% 41.0% 30.6%
As % of International Commerce 5.9% 9.4% 19.3% 28.1% 33.1% 37.0%
As % of total revenue 1.1% 1.1% 1.8% 2.4% 2.5% 2.6%
Wholesale (Alibaba.com) 563 607 629 760 849 932
YoY % change 7.8% 3.7% 20.7% 11.7% 9.7%
As % of International Commerce 94.1% 90.6% 80.7% 71.9% 66.9% 63.0%
As % of total revenue 17.7% 10.9% 7.5% 6.1% 5.0% 4.4%
Cloud computing and internet infrastructures 82 105 124 172 215 258
YoY % change 27.1% 27.9% 18.8% 38.6% 25.0% 20.0%
As % of total revenue 2.6% 1.9% 1.5% 1.4% 1.3% 1.2%
Others (mainly interest income from micro loans) 17 87 281 202 0 0
YoY % change -70.2% 406.8% 223.4% -28.3% -100.0%
As % of total revenue 0.5% 1.6% 3.3% 1.6% 0.0% 0.0%
Total Revenue (in USD mn) 3,182 5,558 8,446 12,382 16,932 21,296
YoY % change 76.4% 74.7% 52.0% 46.6% 36.7% 25.8%
Operation Metrics
Active Buyers 123 172 255 380 540 739
YoY % change 39.8% 48.3% 49.0% 42.0% 37.0%
Orders fulfilled (in mn) 4,182 7,224 12,750 22,037 35,361 53,289
YoY % change 72.7% 76.5% 72.8% 60.5% 50.7%
BABA
Initiating Coverage
27 October 2014
page 107 of 130 , Equity Analyst, +852 3743 8033, [email protected] Meng
Please see important disclosure information on pages 126 - 130 of this report.
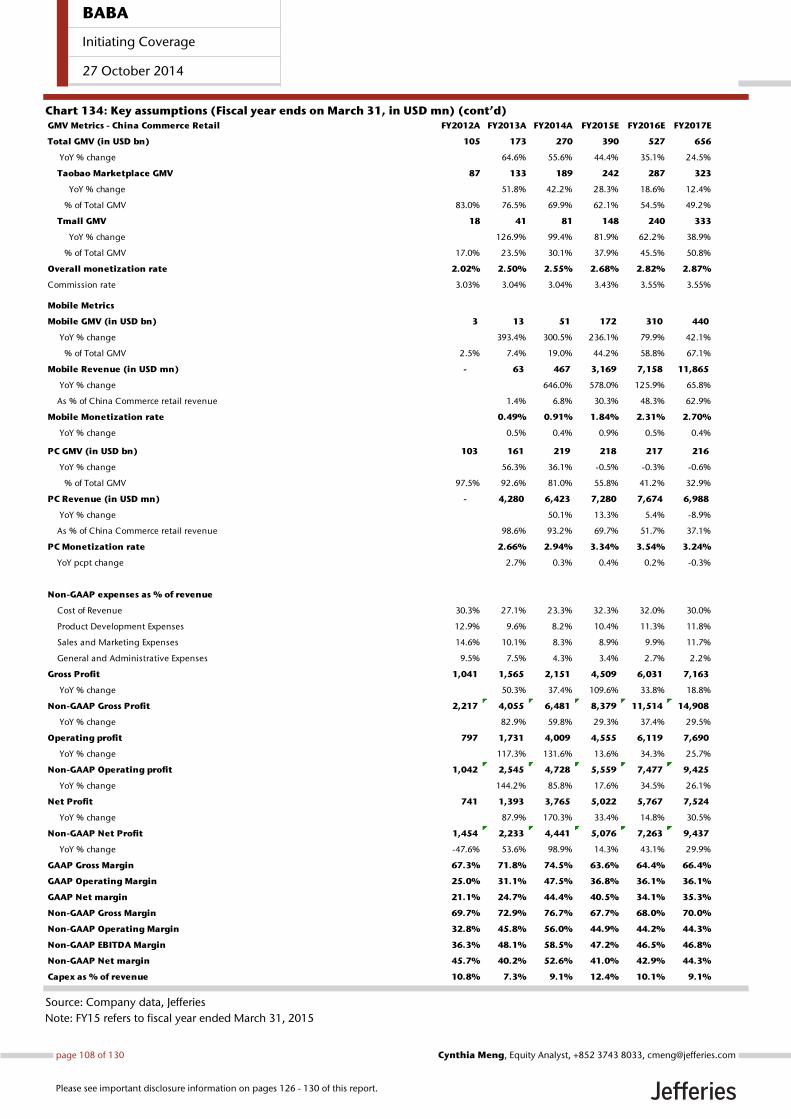
Chart 134: Key assumptions (Fiscal year ends on March 31, in USD mn) (cont’d)
Source: Company data, Jefferies
Note: FY15 refers to fiscal year ended March 31, 2015
GMV Metrics - China Commerce Retail FY2012A FY2013A FY2014A FY2015E FY2016E FY2017E
Total GMV (in USD bn) 105 173 270 390 527 656
YoY % change 64.6% 55.6% 44.4% 35.1% 24.5%
Taobao Marketplace GMV 87 133 189 242 287 323
YoY % change 51.8% 42.2% 28.3% 18.6% 12.4%
% of Total GMV 83.0% 76.5% 69.9% 62.1% 54.5% 49.2%
Tmall GMV 18 41 81 148 240 333
YoY % change 126.9% 99.4% 81.9% 62.2% 38.9%
% of Total GMV 17.0% 23.5% 30.1% 37.9% 45.5% 50.8%
Overall monetization rate 2.02% 2.50% 2.55% 2.68% 2.82% 2.87%
Commission rate 3.03% 3.04% 3.04% 3.43% 3.55% 3.55%
Mobile Metrics
Mobile GMV (in USD bn) 3 13 51 172 310 440
YoY % change 393.4% 300.5% 236.1% 79.9% 42.1%
% of Total GMV 2.5% 7.4% 19.0% 44.2% 58.8% 67.1%
Mobile Revenue (in USD mn) - 63 467 3,169 7,158 11,865
YoY % change 646.0% 578.0% 125.9% 65.8%
As % of China Commerce retail revenue 1.4% 6.8% 30.3% 48.3% 62.9%
Mobile Monetization rate 0.49% 0.91% 1.84% 2.31% 2.70%
YoY % change 0.5% 0.4% 0.9% 0.5% 0.4%
PC GMV (in USD bn) 103 161 219 218 217 216
YoY % change 56.3% 36.1% -0.5% -0.3% -0.6%
% of Total GMV 97.5% 92.6% 81.0% 55.8% 41.2% 32.9%
PC Revenue (in USD mn) - 4,280 6,423 7,280 7,674 6,988
YoY % change 50.1% 13.3% 5.4% -8.9%
As % of China Commerce retail revenue 98.6% 93.2% 69.7% 51.7% 37.1%
PC Monetization rate 2.66% 2.94% 3.34% 3.54% 3.24%
YoY pcpt change 2.7% 0.3% 0.4% 0.2% -0.3%
Non-GAAP expenses as % of revenue
Cost of Revenue 30.3% 27.1% 23.3% 32.3% 32.0% 30.0%
Product Development Expenses 12.9% 9.6% 8.2% 10.4% 11.3% 11.8%
Sales and Marketing Expenses 14.6% 10.1% 8.3% 8.9% 9.9% 11.7%
General and Administrative Expenses 9.5% 7.5% 4.3% 3.4% 2.7% 2.2%
Gross Profit 1,041 1,565 2,151 4,509 6,031 7,163
YoY % change 50.3% 37.4% 109.6% 33.8% 18.8%
Non-GAAP Gross Profit 2,217 4,055 6,481 8,379 11,514 14,908
YoY % change 82.9% 59.8% 29.3% 37.4% 29.5%
Operating profit 797 1,731 4,009 4,555 6,119 7,690
YoY % change 117.3% 131.6% 13.6% 34.3% 25.7%
Non-GAAP Operating profit 1,042 2,545 4,728 5,559 7,477 9,425
YoY % change 144.2% 85.8% 17.6% 34.5% 26.1%
Net Profit 741 1,393 3,765 5,022 5,767 7,524
YoY % change 87.9% 170.3% 33.4% 14.8% 30.5%
Non-GAAP Net Profit 1,454 2,233 4,441 5,076 7,263 9,437
YoY % change -47.6% 53.6% 98.9% 14.3% 43.1% 29.9%
GAAP Gross Margin 67.3% 71.8% 74.5% 63.6% 64.4% 66.4%
GAAP Operating Margin 25.0% 31.1% 47.5% 36.8% 36.1% 36.1%
GAAP Net margin 21.1% 24.7% 44.4% 40.5% 34.1% 35.3%
Non-GAAP Gross Margin 69.7% 72.9% 76.7% 67.7% 68.0% 70.0%
Non-GAAP Operating Margin 32.8% 45.8% 56.0% 44.9% 44.2% 44.3%
Non-GAAP EBITDA Margin 36.3% 48.1% 58.5% 47.2% 46.5% 46.8%
Non-GAAP Net margin 45.7% 40.2% 52.6% 41.0% 42.9% 44.3%
Capex as % of revenue 10.8% 7.3% 9.1% 12.4% 10.1% 9.1%
BABA
Initiating Coverage
27 October 2014
page 108 of 130 , Equity Analyst, +852 3743 8033, [email protected] Meng
Please see important disclosure information on pages 126 - 130 of this report.
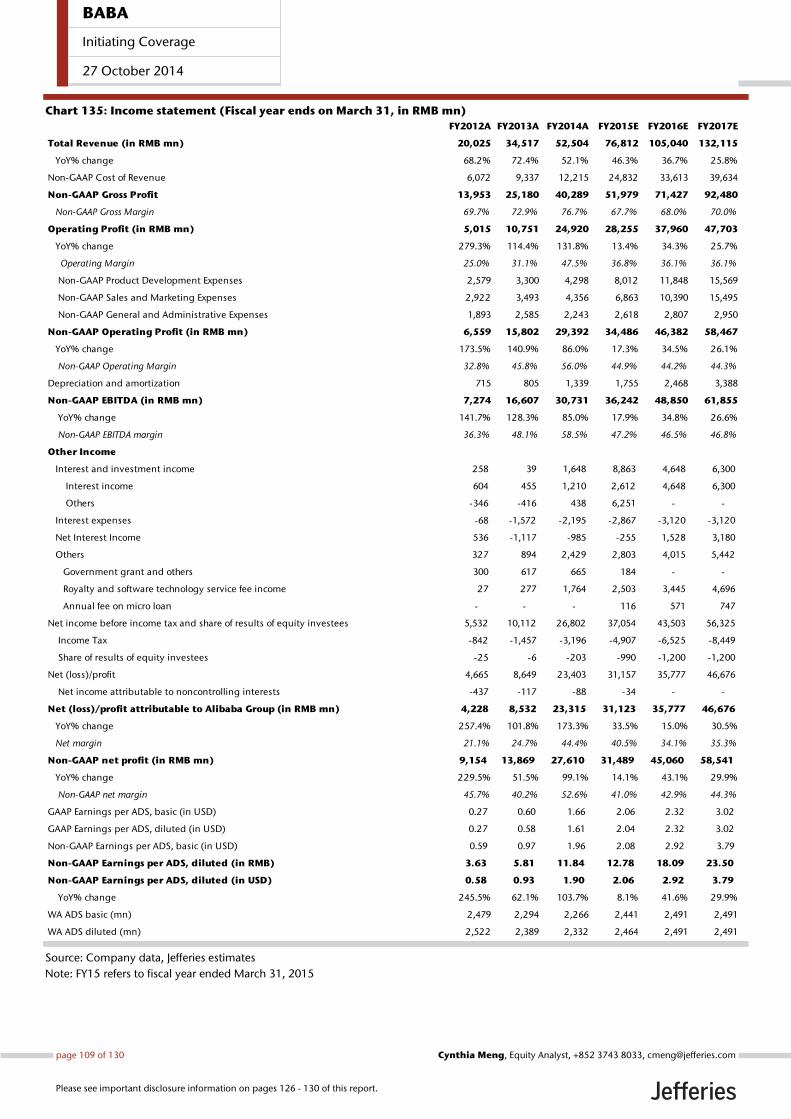
Chart 135: Income statement (Fiscal year ends on March 31, in RMB mn)
Source: Company data, Jefferies estimates
Note: FY15 refers to fiscal year ended March 31, 2015
FY2012A FY2013A FY2014A FY2015E FY2016E FY2017E
Total Revenue (in RMB mn) 20,025 34,517 52,504 76,812 105,040 132,115
YoY% change 68.2% 72.4% 52.1% 46.3% 36.7% 25.8%
Non-GAAP Cost of Revenue 6,072 9,337 12,215 24,832 33,613 39,634
Non-GAAP Gross Profit 13,953 25,180 40,289 51,979 71,427 92,480
Non-GAAP Gross Margin 69.7% 72.9% 76.7% 67.7% 68.0% 70.0%
Operating Profit (in RMB mn) 5,015 10,751 24,920 28,255 37,960 47,703
YoY% change 279.3% 114.4% 131.8% 13.4% 34.3% 25.7%
Operating Margin 25.0% 31.1% 47.5% 36.8% 36.1% 36.1%
Non-GAAP Product Development Expenses 2,579 3,300 4,298 8,012 11,848 15,569
Non-GAAP Sales and Marketing Expenses 2,922 3,493 4,356 6,863 10,390 15,495
Non-GAAP General and Administrative Expenses 1,893 2,585 2,243 2,618 2,807 2,950
Non-GAAP Operating Profit (in RMB mn) 6,559 15,802 29,392 34,486 46,382 58,467
YoY% change 173.5% 140.9% 86.0% 17.3% 34.5% 26.1%
Non-GAAP Operating Margin 32.8% 45.8% 56.0% 44.9% 44.2% 44.3%
Depreciation and amortization 715 805 1,339 1,755 2,468 3,388
Non-GAAP EBITDA (in RMB mn) 7,274 16,607 30,731 36,242 48,850 61,855
YoY% change 141.7% 128.3% 85.0% 17.9% 34.8% 26.6%
Non-GAAP EBITDA margin 36.3% 48.1% 58.5% 47.2% 46.5% 46.8%
Other Income
Interest and investment income 258 39 1,648 8,863 4,648 6,300
Interest income 604 455 1,210 2,612 4,648 6,300
Others -346 -416 438 6,251 - -
Interest expenses -68 -1,572 -2,195 -2,867 -3,120 -3,120
Net Interest Income 536 -1,117 -985 -255 1,528 3,180
Others 327 894 2,429 2,803 4,015 5,442
Government grant and others 300 617 665 184 - -
Royalty and software technology service fee income 27 277 1,764 2,503 3,445 4,696
Annual fee on micro loan - - - 116 571 747
Net income before income tax and share of results of equity investees 5,532 10,112 26,802 37,054 43,503 56,325
Income Tax -842 -1,457 -3,196 -4,907 -6,525 -8,449
Share of results of equity investees -25 -6 -203 -990 -1,200 -1,200
Net (loss)/profit 4,665 8,649 23,403 31,157 35,777 46,676
Net income attributable to noncontrolling interests -437 -117 -88 -34 - -
Net (loss)/profit attributable to Alibaba Group (in RMB mn) 4,228 8,532 23,315 31,123 35,777 46,676
YoY% change 257.4% 101.8% 173.3% 33.5% 15.0% 30.5%
Net margin 21.1% 24.7% 44.4% 40.5% 34.1% 35.3%
Non-GAAP net profit (in RMB mn) 9,154 13,869 27,610 31,489 45,060 58,541
YoY% change 229.5% 51.5% 99.1% 14.1% 43.1% 29.9%
Non-GAAP net margin 45.7% 40.2% 52.6% 41.0% 42.9% 44.3%
GAAP Earnings per ADS, basic (in USD) 0.27 0.60 1.66 2.06 2.32 3.02
GAAP Earnings per ADS, diluted (in USD) 0.27 0.58 1.61 2.04 2.32 3.02
Non-GAAP Earnings per ADS, basic (in USD) 0.59 0.97 1.96 2.08 2.92 3.79
Non-GAAP Earnings per ADS, diluted (in RMB) 3.63 5.81 11.84 12.78 18.09 23.50
Non-GAAP Earnings per ADS, diluted (in USD) 0.58 0.93 1.90 2.06 2.92 3.79
YoY% change 245.5% 62.1% 103.7% 8.1% 41.6% 29.9%
WA ADS basic (mn) 2,479 2,294 2,266 2,441 2,491 2,491
WA ADS diluted (mn) 2,522 2,389 2,332 2,464 2,491 2,491
BABA
Initiating Coverage
27 October 2014
page 109 of 130 , Equity Analyst, +852 3743 8033, [email protected] Meng
Please see important disclosure information on pages 126 - 130 of this report.
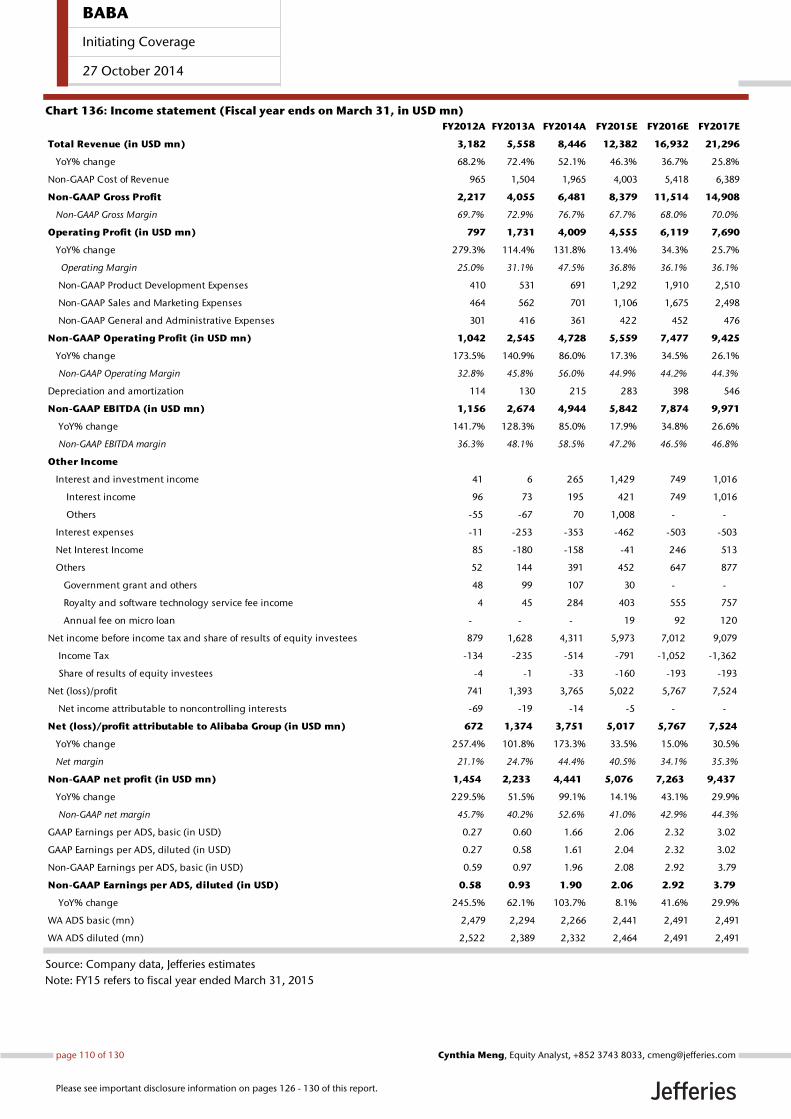
Chart 136: Income statement (Fiscal year ends on March 31, in USD mn)
Source: Company data, Jefferies estimates
Note: FY15 refers to fiscal year ended March 31, 2015
FY2012A FY2013A FY2014A FY2015E FY2016E FY2017E
Total Revenue (in USD mn) 3,182 5,558 8,446 12,382 16,932 21,296
YoY% change 68.2% 72.4% 52.1% 46.3% 36.7% 25.8%
Non-GAAP Cost of Revenue 965 1,504 1,965 4,003 5,418 6,389
Non-GAAP Gross Profit 2,217 4,055 6,481 8,379 11,514 14,908
Non-GAAP Gross Margin 69.7% 72.9% 76.7% 67.7% 68.0% 70.0%
Operating Profit (in USD mn) 797 1,731 4,009 4,555 6,119 7,690
YoY% change 279.3% 114.4% 131.8% 13.4% 34.3% 25.7%
Operating Margin 25.0% 31.1% 47.5% 36.8% 36.1% 36.1%
Non-GAAP Product Development Expenses 410 531 691 1,292 1,910 2,510
Non-GAAP Sales and Marketing Expenses 464 562 701 1,106 1,675 2,498
Non-GAAP General and Administrative Expenses 301 416 361 422 452 476
Non-GAAP Operating Profit (in USD mn) 1,042 2,545 4,728 5,559 7,477 9,425
YoY% change 173.5% 140.9% 86.0% 17.3% 34.5% 26.1%
Non-GAAP Operating Margin 32.8% 45.8% 56.0% 44.9% 44.2% 44.3%
Depreciation and amortization 114 130 215 283 398 546
Non-GAAP EBITDA (in USD mn) 1,156 2,674 4,944 5,842 7,874 9,971
YoY% change 141.7% 128.3% 85.0% 17.9% 34.8% 26.6%
Non-GAAP EBITDA margin 36.3% 48.1% 58.5% 47.2% 46.5% 46.8%
Other Income
Interest and investment income 41 6 265 1,429 749 1,016
Interest income 96 73 195 421 749 1,016
Others -55 -67 70 1,008 - -
Interest expenses -11 -253 -353 -462 -503 -503
Net Interest Income 85 -180 -158 -41 246 513
Others 52 144 391 452 647 877
Government grant and others 48 99 107 30 - -
Royalty and software technology service fee income 4 45 284 403 555 757
Annual fee on micro loan - - - 19 92 120
Net income before income tax and share of results of equity investees 879 1,628 4,311 5,973 7,012 9,079
Income Tax -134 -235 -514 -791 -1,052 -1,362
Share of results of equity investees -4 -1 -33 -160 -193 -193
Net (loss)/profit 741 1,393 3,765 5,022 5,767 7,524
Net income attributable to noncontrolling interests -69 -19 -14 -5 - -
Net (loss)/profit attributable to Alibaba Group (in USD mn) 672 1,374 3,751 5,017 5,767 7,524
YoY% change 257.4% 101.8% 173.3% 33.5% 15.0% 30.5%
Net margin 21.1% 24.7% 44.4% 40.5% 34.1% 35.3%
Non-GAAP net profit (in USD mn) 1,454 2,233 4,441 5,076 7,263 9,437
YoY% change 229.5% 51.5% 99.1% 14.1% 43.1% 29.9%
Non-GAAP net margin 45.7% 40.2% 52.6% 41.0% 42.9% 44.3%
GAAP Earnings per ADS, basic (in USD) 0.27 0.60 1.66 2.06 2.32 3.02
GAAP Earnings per ADS, diluted (in USD) 0.27 0.58 1.61 2.04 2.32 3.02
Non-GAAP Earnings per ADS, basic (in USD) 0.59 0.97 1.96 2.08 2.92 3.79
Non-GAAP Earnings per ADS, diluted (in USD) 0.58 0.93 1.90 2.06 2.92 3.79
YoY% change 245.5% 62.1% 103.7% 8.1% 41.6% 29.9%
WA ADS basic (mn) 2,479 2,294 2,266 2,441 2,491 2,491
WA ADS diluted (mn) 2,522 2,389 2,332 2,464 2,491 2,491
BABA
Initiating Coverage
27 October 2014
page 110 of 130 , Equity Analyst, +852 3743 8033, [email protected] Meng
Please see important disclosure information on pages 126 - 130 of this report.
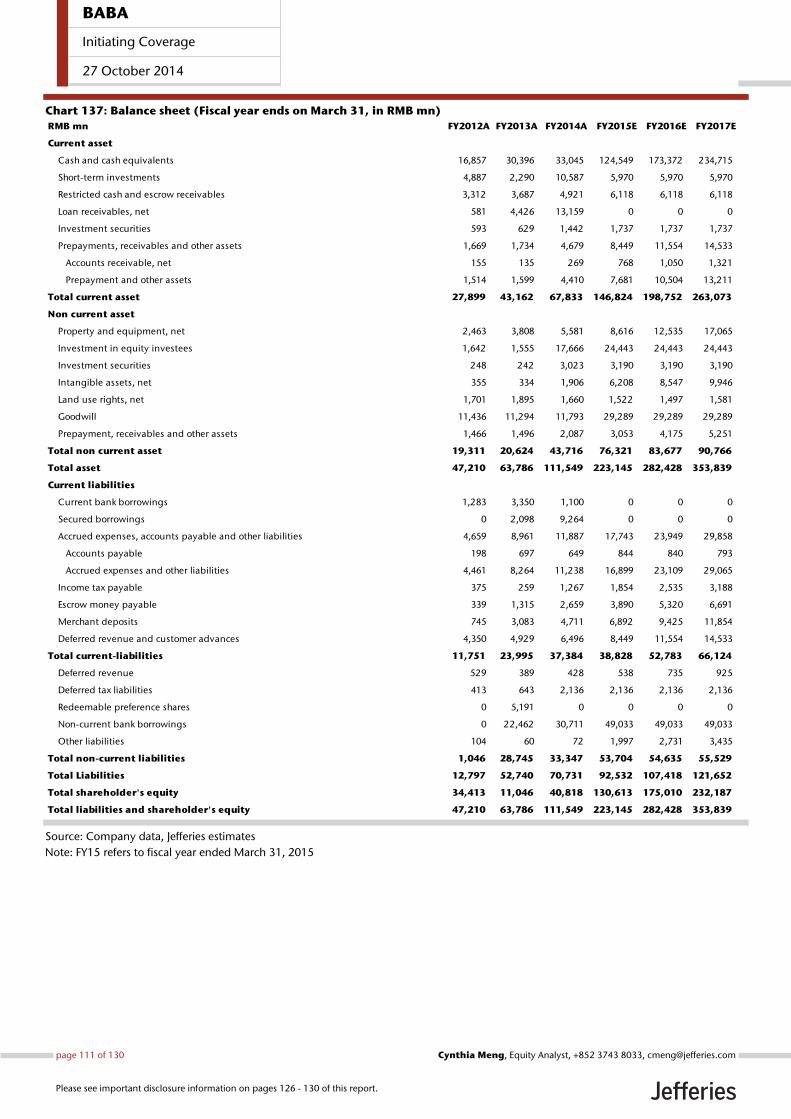
Chart 137: Balance sheet (Fiscal year ends on March 31, in RMB mn)
Source: Company data, Jefferies estimates
Note: FY15 refers to fiscal year ended March 31, 2015
RMB mn FY2012A FY2013A FY2014A FY2015E FY2016E FY2017E
Current asset
Cash and cash equivalents 16,857 30,396 33,045 124,549 173,372 234,715
Short-term investments 4,887 2,290 10,587 5,970 5,970 5,970
Restricted cash and escrow receivables 3,312 3,687 4,921 6,118 6,118 6,118
Loan receivables, net 581 4,426 13,159 0 0 0
Investment securities 593 629 1,442 1,737 1,737 1,737
Prepayments, receivables and other assets 1,669 1,734 4,679 8,449 11,554 14,533
Accounts receivable, net 155 135 269 768 1,050 1,321
Prepayment and other assets 1,514 1,599 4,410 7,681 10,504 13,211
Total current asset 27,899 43,162 67,833 146,824 198,752 263,073
Non current asset
Property and equipment, net 2,463 3,808 5,581 8,616 12,535 17,065
Investment in equity investees 1,642 1,555 17,666 24,443 24,443 24,443
Investment securities 248 242 3,023 3,190 3,190 3,190
Intangible assets, net 355 334 1,906 6,208 8,547 9,946
Land use rights, net 1,701 1,895 1,660 1,522 1,497 1,581
Goodwill 11,436 11,294 11,793 29,289 29,289 29,289
Prepayment, receivables and other assets 1,466 1,496 2,087 3,053 4,175 5,251
Total non current asset 19,311 20,624 43,716 76,321 83,677 90,766
Total asset 47,210 63,786 111,549 223,145 282,428 353,839
Current liabilities
Current bank borrowings 1,283 3,350 1,100 0 0 0
Secured borrowings 0 2,098 9,264 0 0 0
Accrued expenses, accounts payable and other liabilities 4,659 8,961 11,887 17,743 23,949 29,858
Accounts payable 198 697 649 844 840 793
Accrued expenses and other liabilities 4,461 8,264 11,238 16,899 23,109 29,065
Income tax payable 375 259 1,267 1,854 2,535 3,188
Escrow money payable 339 1,315 2,659 3,890 5,320 6,691
Merchant deposits 745 3,083 4,711 6,892 9,425 11,854
Deferred revenue and customer advances 4,350 4,929 6,496 8,449 11,554 14,533
Total current-liabilities 11,751 23,995 37,384 38,828 52,783 66,124
Deferred revenue 529 389 428 538 735 925
Deferred tax liabilities 413 643 2,136 2,136 2,136 2,136
Redeemable preference shares 0 5,191 0 0 0 0
Non-current bank borrowings 0 22,462 30,711 49,033 49,033 49,033
Other liabilities 104 60 72 1,997 2,731 3,435
Total non-current liabilities 1,046 28,745 33,347 53,704 54,635 55,529
Total Liabilities 12,797 52,740 70,731 92,532 107,418 121,652
Total shareholder's equity 34,413 11,046 40,818 130,613 175,010 232,187
Total liabilities and shareholder's equity 47,210 63,786 111,549 223,145 282,428 353,839
BABA
Initiating Coverage
27 October 2014
page 111 of 130 , Equity Analyst, +852 3743 8033, [email protected] Meng
Please see important disclosure information on pages 126 - 130 of this report.
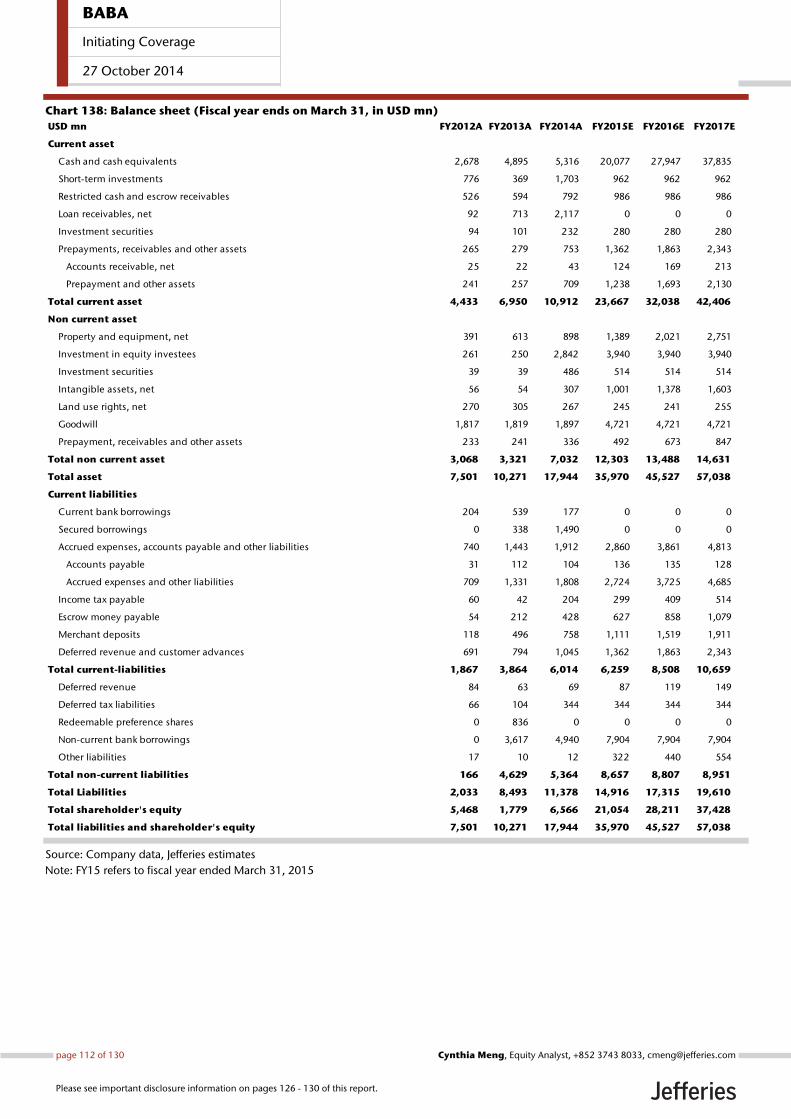
Chart 138: Balance sheet (Fiscal year ends on March 31, in USD mn)
Source: Company data, Jefferies estimates
Note: FY15 refers to fiscal year ended March 31, 2015
USD mn FY2012A FY2013A FY2014A FY2015E FY2016E FY2017E
Current asset
Cash and cash equivalents 2,678 4,895 5,316 20,077 27,947 37,835
Short-term investments 776 369 1,703 962 962 962
Restricted cash and escrow receivables 526 594 792 986 986 986
Loan receivables, net 92 713 2,117 0 0 0
Investment securities 94 101 232 280 280 280
Prepayments, receivables and other assets 265 279 753 1,362 1,863 2,343
Accounts receivable, net 25 22 43 124 169 213
Prepayment and other assets 241 257 709 1,238 1,693 2,130
Total current asset 4,433 6,950 10,912 23,667 32,038 42,406
Non current asset
Property and equipment, net 391 613 898 1,389 2,021 2,751
Investment in equity investees 261 250 2,842 3,940 3,940 3,940
Investment securities 39 39 486 514 514 514
Intangible assets, net 56 54 307 1,001 1,378 1,603
Land use rights, net 270 305 267 245 241 255
Goodwill 1,817 1,819 1,897 4,721 4,721 4,721
Prepayment, receivables and other assets 233 241 336 492 673 847
Total non current asset 3,068 3,321 7,032 12,303 13,488 14,631
Total asset 7,501 10,271 17,944 35,970 45,527 57,038
Current liabilities
Current bank borrowings 204 539 177 0 0 0
Secured borrowings 0 338 1,490 0 0 0
Accrued expenses, accounts payable and other liabilities 740 1,443 1,912 2,860 3,861 4,813
Accounts payable 31 112 104 136 135 128
Accrued expenses and other liabilities 709 1,331 1,808 2,724 3,725 4,685
Income tax payable 60 42 204 299 409 514
Escrow money payable 54 212 428 627 858 1,079
Merchant deposits 118 496 758 1,111 1,519 1,911
Deferred revenue and customer advances 691 794 1,045 1,362 1,863 2,343
Total current-liabilities 1,867 3,864 6,014 6,259 8,508 10,659
Deferred revenue 84 63 69 87 119 149
Deferred tax liabilities 66 104 344 344 344 344
Redeemable preference shares 0 836 0 0 0 0
Non-current bank borrowings 0 3,617 4,940 7,904 7,904 7,904
Other liabilities 17 10 12 322 440 554
Total non-current liabilities 166 4,629 5,364 8,657 8,807 8,951
Total Liabilities 2,033 8,493 11,378 14,916 17,315 19,610
Total shareholder's equity 5,468 1,779 6,566 21,054 28,211 37,428
Total liabilities and shareholder's equity 7,501 10,271 17,944 35,970 45,527 57,038
BABA
Initiating Coverage
27 October 2014
page 112 of 130 , Equity Analyst, +852 3743 8033, [email protected] Meng
Please see important disclosure information on pages 126 - 130 of this report.
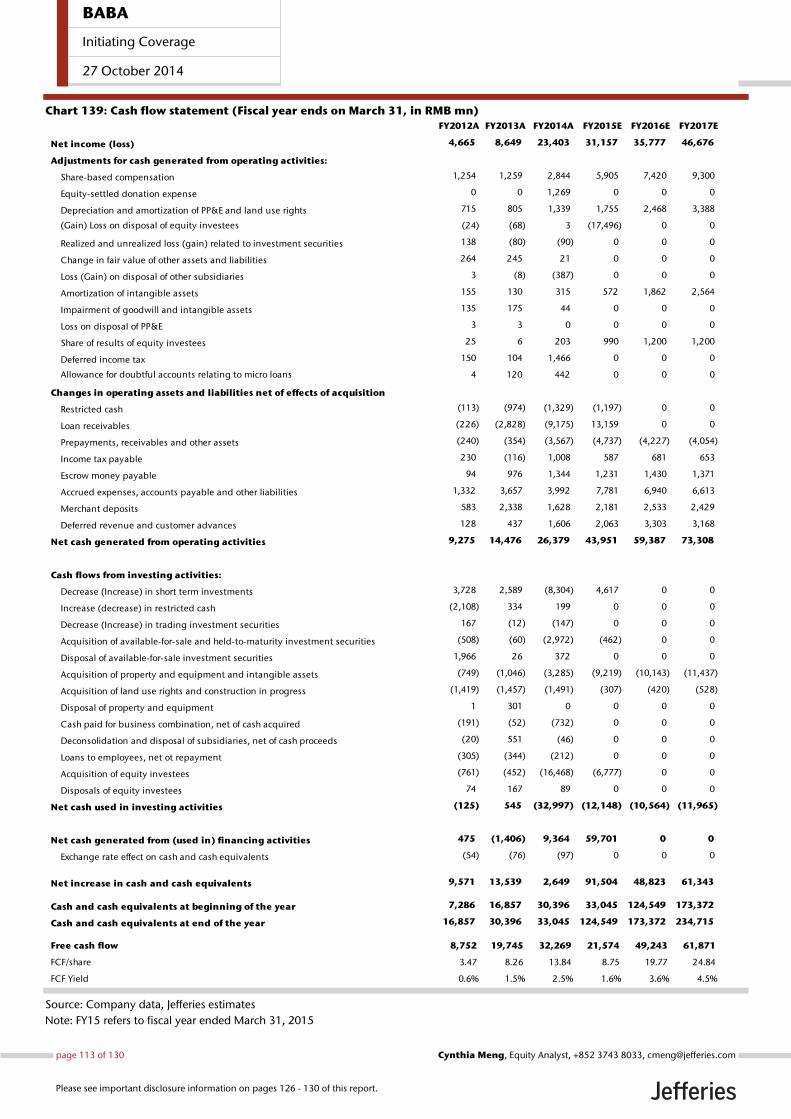
Chart 139: Cash flow statement (Fiscal year ends on March 31, in RMB mn)
Source: Company data, Jefferies estimates
Note: FY15 refers to fiscal year ended March 31, 2015
FY2012A FY2013A FY2014A FY2015E FY2016E FY2017E
Net income (loss) 4,665 8,649 23,403 31,157 35,777 46,676
Adjustments for cash generated from operating activities:
Share-based compensation 1,254 1,259 2,844 5,905 7,420 9,300
Equity-settled donation expense 0 0 1,269 0 0 0
Depreciation and amortization of PP&E and land use rights 715 805 1,339 1,755 2,468 3,388
(Gain) Loss on disposal of equity investees (24) (68) 3 (17,496) 0 0
Realized and unrealized loss (gain) related to investment securities 138 (80) (90) 0 0 0
Change in fair value of other assets and liabilities 264 245 21 0 0 0
Loss (Gain) on disposal of other subsidiaries 3 (8) (387) 0 0 0
Amortization of intangible assets 155 130 315 572 1,862 2,564
Impairment of goodwill and intangible assets 135 175 44 0 0 0
Loss on disposal of PP&E 3 3 0 0 0 0
Share of results of equity investees 25 6 203 990 1,200 1,200
Deferred income tax 150 104 1,466 0 0 0
Allowance for doubtful accounts relating to micro loans 4 120 442 0 0 0
Changes in operating assets and liabilities net of effects of acquisition
Restricted cash (113) (974) (1,329) (1,197) 0 0
Loan receivables (226) (2,828) (9,175) 13,159 0 0
Prepayments, receivables and other assets (240) (354) (3,567) (4,737) (4,227) (4,054)
Income tax payable 230 (116) 1,008 587 681 653
Escrow money payable 94 976 1,344 1,231 1,430 1,371
Accrued expenses, accounts payable and other liabilities 1,332 3,657 3,992 7,781 6,940 6,613
Merchant deposits 583 2,338 1,628 2,181 2,533 2,429
Deferred revenue and customer advances 128 437 1,606 2,063 3,303 3,168
Net cash generated from operating activities 9,275 14,476 26,379 43,951 59,387 73,308
Cash flows from investing activities:
Decrease (Increase) in short term investments 3,728 2,589 (8,304) 4,617 0 0
Increase (decrease) in restricted cash (2,108) 334 199 0 0 0
Decrease (Increase) in trading investment securities 167 (12) (147) 0 0 0
Acquisition of available-for-sale and held-to-maturity investment securities (508) (60) (2,972) (462) 0 0
Disposal of available-for-sale investment securities 1,966 26 372 0 0 0
Acquisition of property and equipment and intangible assets (749) (1,046) (3,285) (9,219) (10,143) (11,437)
Acquisition of land use rights and construction in progress (1,419) (1,457) (1,491) (307) (420) (528)
Disposal of property and equipment 1 301 0 0 0 0
Cash paid for business combination, net of cash acquired (191) (52) (732) 0 0 0
Deconsolidation and disposal of subsidiaries, net of cash proceeds (20) 551 (46) 0 0 0
Loans to employees, net ot repayment (305) (344) (212) 0 0 0
Acquisition of equity investees (761) (452) (16,468) (6,777) 0 0
Disposals of equity investees 74 167 89 0 0 0
Net cash used in investing activities (125) 545 (32,997) (12,148) (10,564) (11,965)
Net cash generated from (used in) financing activities 475 (1,406) 9,364 59,701 0 0
Exchange rate effect on cash and cash equivalents (54) (76) (97) 0 0 0
Net increase in cash and cash equivalents 9,571 13,539 2,649 91,504 48,823 61,343
Cash and cash equivalents at beginning of the year 7,286 16,857 30,396 33,045 124,549 173,372
Cash and cash equivalents at end of the year 16,857 30,396 33,045 124,549 173,372 234,715
Free cash flow 8,752 19,745 32,269 21,574 49,243 61,871
FCF/share 3.47 8.26 13.84 8.75 19.77 24.84
FCF Yield 0.6% 1.5% 2.5% 1.6% 3.6% 4.5%
BABA
Initiating Coverage
27 October 2014
page 113 of 130 , Equity Analyst, +852 3743 8033, [email protected] Meng
Please see important disclosure information on pages 126 - 130 of this report.
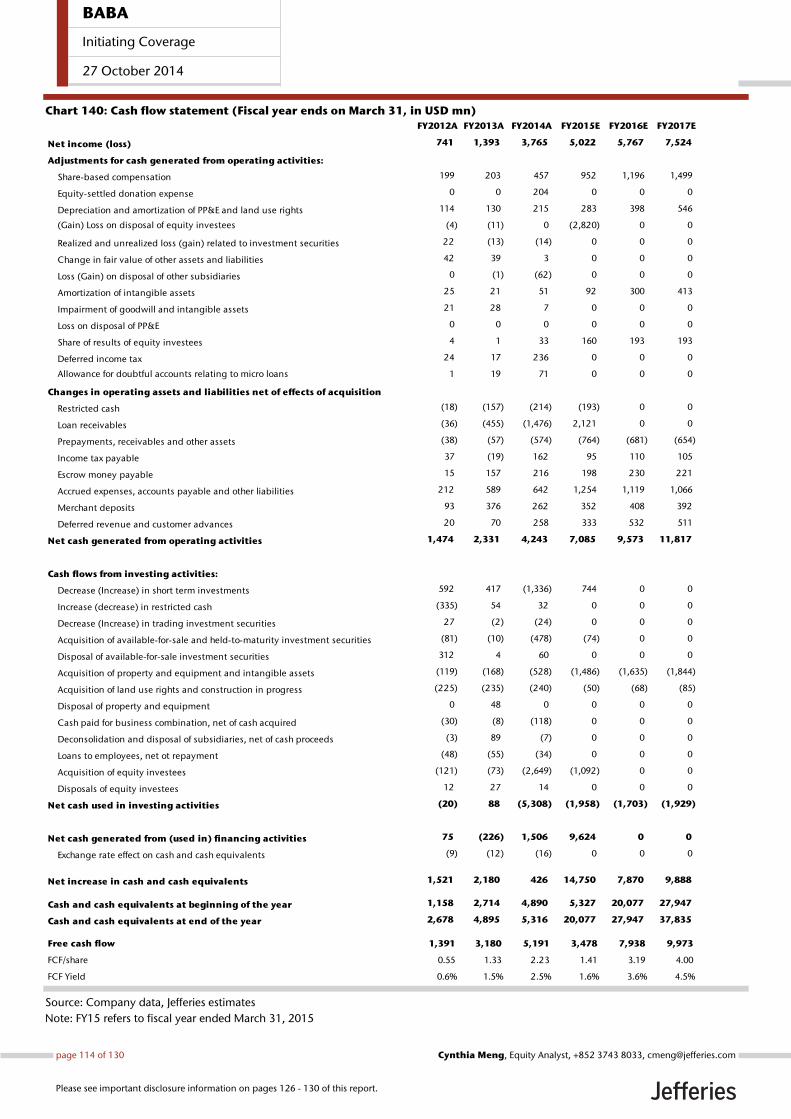
Chart 140: Cash flow statement (Fiscal year ends on March 31, in USD mn)
Source: Company data, Jefferies estimates
Note: FY15 refers to fiscal year ended March 31, 2015
FY2012A FY2013A FY2014A FY2015E FY2016E FY2017E
Net income (loss) 741 1,393 3,765 5,022 5,767 7,524
Adjustments for cash generated from operating activities:
Share-based compensation 199 203 457 952 1,196 1,499
Equity-settled donation expense 0 0 204 0 0 0
Depreciation and amortization of PP&E and land use rights 114 130 215 283 398 546
(Gain) Loss on disposal of equity investees (4) (11) 0 (2,820) 0 0
Realized and unrealized loss (gain) related to investment securities 22 (13) (14) 0 0 0
Change in fair value of other assets and liabilities 42 39 3 0 0 0
Loss (Gain) on disposal of other subsidiaries 0 (1) (62) 0 0 0
Amortization of intangible assets 25 21 51 92 300 413
Impairment of goodwill and intangible assets 21 28 7 0 0 0
Loss on disposal of PP&E 0 0 0 0 0 0
Share of results of equity investees 4 1 33 160 193 193
Deferred income tax 24 17 236 0 0 0
Allowance for doubtful accounts relating to micro loans 1 19 71 0 0 0
Changes in operating assets and liabilities net of effects of acquisition
Restricted cash (18) (157) (214) (193) 0 0
Loan receivables (36) (455) (1,476) 2,121 0 0
Prepayments, receivables and other assets (38) (57) (574) (764) (681) (654)
Income tax payable 37 (19) 162 95 110 105
Escrow money payable 15 157 216 198 230 221
Accrued expenses, accounts payable and other liabilities 212 589 642 1,254 1,119 1,066
Merchant deposits 93 376 262 352 408 392
Deferred revenue and customer advances 20 70 258 333 532 511
Net cash generated from operating activities 1,474 2,331 4,243 7,085 9,573 11,817
Cash flows from investing activities:
Decrease (Increase) in short term investments 592 417 (1,336) 744 0 0
Increase (decrease) in restricted cash (335) 54 32 0 0 0
Decrease (Increase) in trading investment securities 27 (2) (24) 0 0 0
Acquisition of available-for-sale and held-to-maturity investment securities (81) (10) (478) (74) 0 0
Disposal of available-for-sale investment securities 312 4 60 0 0 0
Acquisition of property and equipment and intangible assets (119) (168) (528) (1,486) (1,635) (1,844)
Acquisition of land use rights and construction in progress (225) (235) (240) (50) (68) (85)
Disposal of property and equipment 0 48 0 0 0 0
Cash paid for business combination, net of cash acquired (30) (8) (118) 0 0 0
Deconsolidation and disposal of subsidiaries, net of cash proceeds (3) 89 (7) 0 0 0
Loans to employees, net ot repayment (48) (55) (34) 0 0 0
Acquisition of equity investees (121) (73) (2,649) (1,092) 0 0
Disposals of equity investees 12 27 14 0 0 0
Net cash used in investing activities (20) 88 (5,308) (1,958) (1,703) (1,929)
Net cash generated from (used in) financing activities 75 (226) 1,506 9,624 0 0
Exchange rate effect on cash and cash equivalents (9) (12) (16) 0 0 0
Net increase in cash and cash equivalents 1,521 2,180 426 14,750 7,870 9,888
Cash and cash equivalents at beginning of the year 1,158 2,714 4,890 5,327 20,077 27,947
Cash and cash equivalents at end of the year 2,678 4,895 5,316 20,077 27,947 37,835
Free cash flow 1,391 3,180 5,191 3,478 7,938 9,973
FCF/share 0.55 1.33 2.23 1.41 3.19 4.00
FCF Yield 0.6% 1.5% 2.5% 1.6% 3.6% 4.5%
BABA
Initiating Coverage
27 October 2014
page 114 of 130 , Equity Analyst, +852 3743 8033, [email protected] Meng
Please see important disclosure information on pages 126 - 130 of this report.
This page is intentionally kept blank
BABA
Initiating Coverage
27 October 2014
page 115 of 130 , Equity Analyst, +852 3743 8033, [email protected] Meng
Please see important disclosure information on pages 126 - 130 of this report.
Appendix
BABA
Initiating Coverage
27 October 2014
page 116 of 130 , Equity Analyst, +852 3743 8033, [email protected] Meng
Please see important disclosure information on pages 126 - 130 of this report.
FY2Q15 (CY3Q14) Results Preview Alibaba is expected to announce FY2Q15 results on November 4, 2014 at 7:30am U.S.
Eastern Time / 8:30pm Hong Kong Time.
Dial-in information:
U.S. Toll-free: 1 (844) 421-0599
Hong Kong: (852) 3011-4522
International: 1 (716) 247-5797
Conference ID: 24286757
We estimate total revenue to reach RMB16bn, +46.3% YoY, driven by continued solid
growth in China commerce, as well as rapid growth of interest income from micro loans.
We expect China commerce retail revenue to grow 48.6% YoY to RMB12.8bn, driven by
strong commission revenue growth.
We expect total GMV to reach RMB541bn in FY2Q15, +44.5% YoY, driven by rapid
growth of Tmall GMV.
We forecast Alibaba Group to post a RMB10.6bn non-GAAP gross profit and RMB5.4bn
non-GAAP operating profit in FY2Q15, implying a non-GAAP gross margin of 66%,
-8.7pcpt QoQ, and non-GAAP operating margin of 43.7%, -8pcpt QoQ.
FY2Q15 non-GAAP net income should reach RMB6.4bn, with a net margin of 40.2%,
-6.2pcpt QoQ, based on our estimates.
BABA
Initiating Coverage
27 October 2014
page 117 of 130 , Equity Analyst, +852 3743 8033, [email protected] Meng
Please see important disclosure information on pages 126 - 130 of this report.
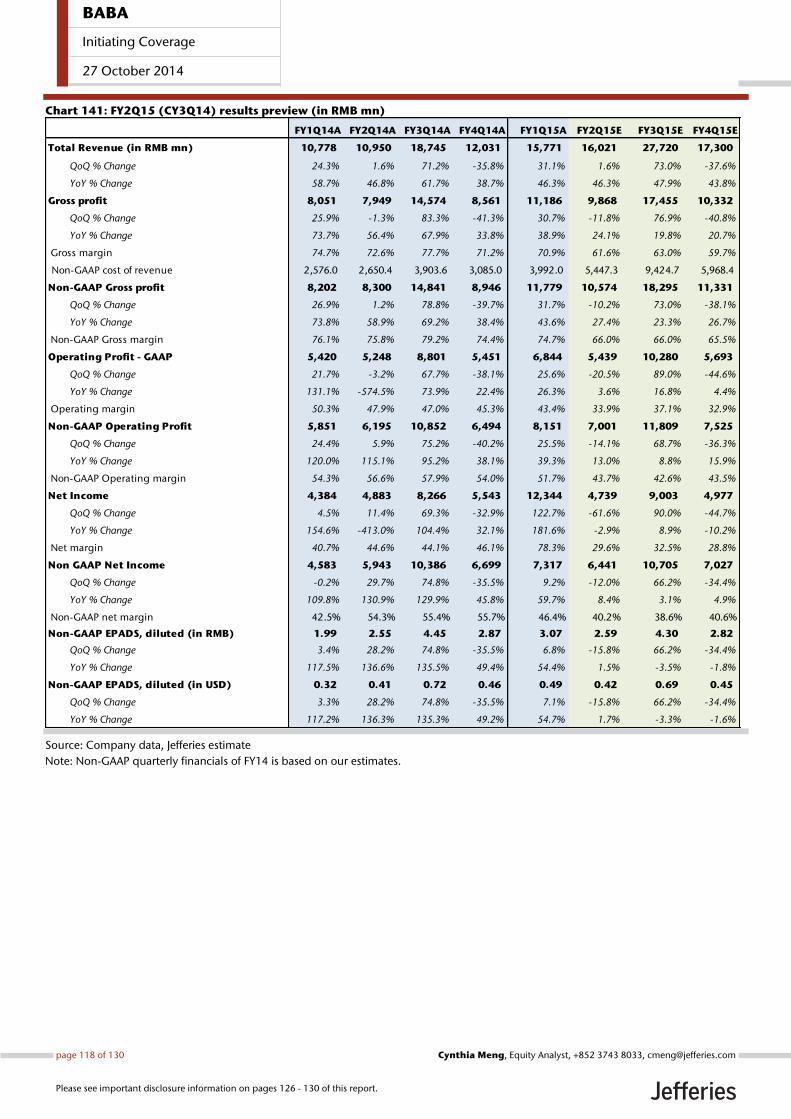
Chart 141: FY2Q15 (CY3Q14) results preview (in RMB mn)
Source: Company data, Jefferies estimate
Note: Non-GAAP quarterly financials of FY14 is based on our estimates.
FY1Q14A FY2Q14A FY3Q14A FY4Q14A FY1Q15A FY2Q15E FY3Q15E FY4Q15E
Total Revenue (in RMB mn) 10,778 10,950 18,745 12,031 15,771 16,021 27,720 17,300
QoQ % Change 24.3% 1.6% 71.2% -35.8% 31.1% 1.6% 73.0% -37.6%
YoY % Change 58.7% 46.8% 61.7% 38.7% 46.3% 46.3% 47.9% 43.8%
Gross profit 8,051 7,949 14,574 8,561 11,186 9,868 17,455 10,332
QoQ % Change 25.9% -1.3% 83.3% -41.3% 30.7% -11.8% 76.9% -40.8%
YoY % Change 73.7% 56.4% 67.9% 33.8% 38.9% 24.1% 19.8% 20.7%
Gross margin 74.7% 72.6% 77.7% 71.2% 70.9% 61.6% 63.0% 59.7%
Non-GAAP cost of revenue 2,576.0 2,650.4 3,903.6 3,085.0 3,992.0 5,447.3 9,424.7 5,968.4
Non-GAAP Gross profit 8,202 8,300 14,841 8,946 11,779 10,574 18,295 11,331
QoQ % Change 26.9% 1.2% 78.8% -39.7% 31.7% -10.2% 73.0% -38.1%
YoY % Change 73.8% 58.9% 69.2% 38.4% 43.6% 27.4% 23.3% 26.7%
Non-GAAP Gross margin 76.1% 75.8% 79.2% 74.4% 74.7% 66.0% 66.0% 65.5%
Operating Profit - GAAP 5,420 5,248 8,801 5,451 6,844 5,439 10,280 5,693
QoQ % Change 21.7% -3.2% 67.7% -38.1% 25.6% -20.5% 89.0% -44.6%
YoY % Change 131.1% -574.5% 73.9% 22.4% 26.3% 3.6% 16.8% 4.4%
Operating margin 50.3% 47.9% 47.0% 45.3% 43.4% 33.9% 37.1% 32.9%
Non-GAAP Operating Profit 5,851 6,195 10,852 6,494 8,151 7,001 11,809 7,525
QoQ % Change 24.4% 5.9% 75.2% -40.2% 25.5% -14.1% 68.7% -36.3%
YoY % Change 120.0% 115.1% 95.2% 38.1% 39.3% 13.0% 8.8% 15.9%
Non-GAAP Operating margin 54.3% 56.6% 57.9% 54.0% 51.7% 43.7% 42.6% 43.5%
Net Income 4,384 4,883 8,266 5,543 12,344 4,739 9,003 4,977
QoQ % Change 4.5% 11.4% 69.3% -32.9% 122.7% -61.6% 90.0% -44.7%
YoY % Change 154.6% -413.0% 104.4% 32.1% 181.6% -2.9% 8.9% -10.2%
Net margin 40.7% 44.6% 44.1% 46.1% 78.3% 29.6% 32.5% 28.8%
Non GAAP Net Income 4,583 5,943 10,386 6,699 7,317 6,441 10,705 7,027
QoQ % Change -0.2% 29.7% 74.8% -35.5% 9.2% -12.0% 66.2% -34.4%
YoY % Change 109.8% 130.9% 129.9% 45.8% 59.7% 8.4% 3.1% 4.9%
Non-GAAP net margin 42.5% 54.3% 55.4% 55.7% 46.4% 40.2% 38.6% 40.6%
Non-GAAP EPADS, diluted (in RMB) 1.99 2.55 4.45 2.87 3.07 2.59 4.30 2.82
QoQ % Change 3.4% 28.2% 74.8% -35.5% 6.8% -15.8% 66.2% -34.4%
YoY % Change 117.5% 136.6% 135.5% 49.4% 54.4% 1.5% -3.5% -1.8%
Non-GAAP EPADS, diluted (in USD) 0.32 0.41 0.72 0.46 0.49 0.42 0.69 0.45
QoQ % Change 3.3% 28.2% 74.8% -35.5% 7.1% -15.8% 66.2% -34.4%
YoY % Change 117.2% 136.3% 135.3% 49.2% 54.7% 1.7% -3.3% -1.6%
BABA
Initiating Coverage
27 October 2014
page 118 of 130 , Equity Analyst, +852 3743 8033, [email protected] Meng
Please see important disclosure information on pages 126 - 130 of this report.
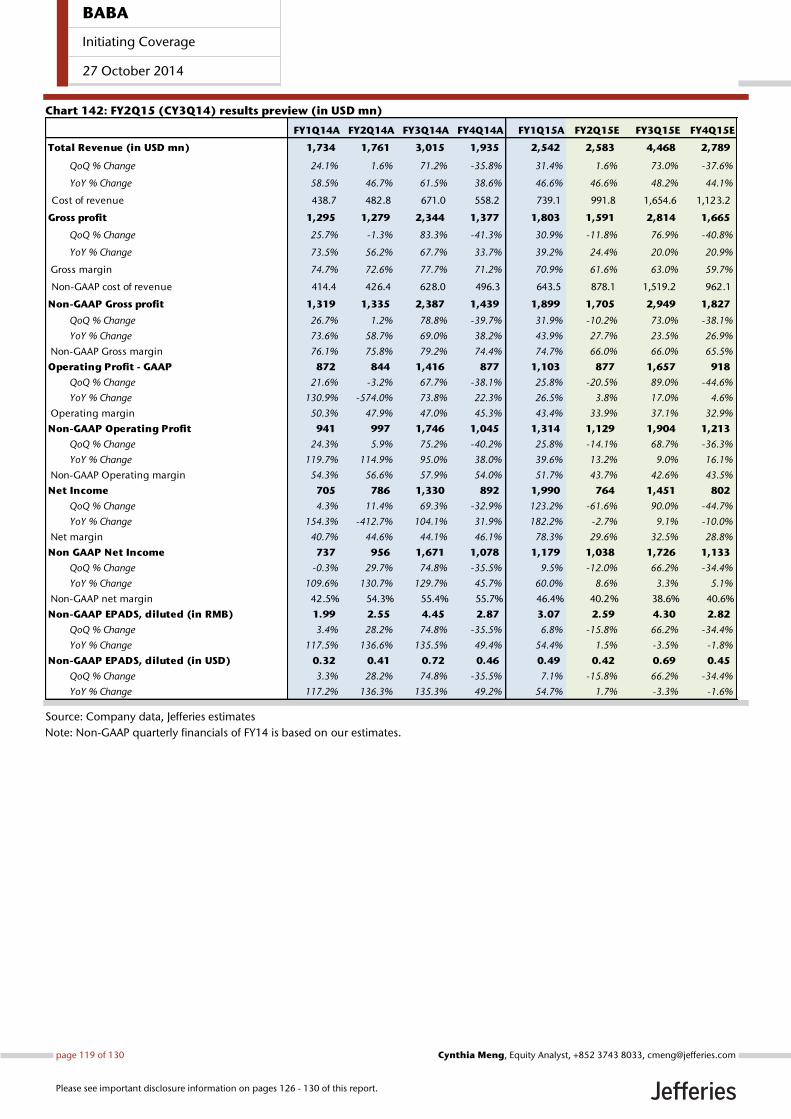
Chart 142: FY2Q15 (CY3Q14) results preview (in USD mn)
Source: Company data, Jefferies estimates
Note: Non-GAAP quarterly financials of FY14 is based on our estimates.
FY1Q14A FY2Q14A FY3Q14A FY4Q14A FY1Q15A FY2Q15E FY3Q15E FY4Q15E
Total Revenue (in USD mn) 1,734 1,761 3,015 1,935 2,542 2,583 4,468 2,789
QoQ % Change 24.1% 1.6% 71.2% -35.8% 31.4% 1.6% 73.0% -37.6%
YoY % Change 58.5% 46.7% 61.5% 38.6% 46.6% 46.6% 48.2% 44.1%
Cost of revenue 438.7 482.8 671.0 558.2 739.1 991.8 1,654.6 1,123.2
Gross profit 1,295 1,279 2,344 1,377 1,803 1,591 2,814 1,665
QoQ % Change 25.7% -1.3% 83.3% -41.3% 30.9% -11.8% 76.9% -40.8%
YoY % Change 73.5% 56.2% 67.7% 33.7% 39.2% 24.4% 20.0% 20.9%
Gross margin 74.7% 72.6% 77.7% 71.2% 70.9% 61.6% 63.0% 59.7%
Non-GAAP cost of revenue 414.4 426.4 628.0 496.3 643.5 878.1 1,519.2 962.1
Non-GAAP Gross profit 1,319 1,335 2,387 1,439 1,899 1,705 2,949 1,827
QoQ % Change 26.7% 1.2% 78.8% -39.7% 31.9% -10.2% 73.0% -38.1%
YoY % Change 73.6% 58.7% 69.0% 38.2% 43.9% 27.7% 23.5% 26.9%
Non-GAAP Gross margin 76.1% 75.8% 79.2% 74.4% 74.7% 66.0% 66.0% 65.5%
Operating Profit - GAAP 872 844 1,416 877 1,103 877 1,657 918
QoQ % Change 21.6% -3.2% 67.7% -38.1% 25.8% -20.5% 89.0% -44.6%
YoY % Change 130.9% -574.0% 73.8% 22.3% 26.5% 3.8% 17.0% 4.6%
Operating margin 50.3% 47.9% 47.0% 45.3% 43.4% 33.9% 37.1% 32.9%
Non-GAAP Operating Profit 941 997 1,746 1,045 1,314 1,129 1,904 1,213
QoQ % Change 24.3% 5.9% 75.2% -40.2% 25.8% -14.1% 68.7% -36.3%
YoY % Change 119.7% 114.9% 95.0% 38.0% 39.6% 13.2% 9.0% 16.1%
Non-GAAP Operating margin 54.3% 56.6% 57.9% 54.0% 51.7% 43.7% 42.6% 43.5%
Net Income 705 786 1,330 892 1,990 764 1,451 802
QoQ % Change 4.3% 11.4% 69.3% -32.9% 123.2% -61.6% 90.0% -44.7%
YoY % Change 154.3% -412.7% 104.1% 31.9% 182.2% -2.7% 9.1% -10.0%
Net margin 40.7% 44.6% 44.1% 46.1% 78.3% 29.6% 32.5% 28.8%
Non GAAP Net Income 737 956 1,671 1,078 1,179 1,038 1,726 1,133
QoQ % Change -0.3% 29.7% 74.8% -35.5% 9.5% -12.0% 66.2% -34.4%
YoY % Change 109.6% 130.7% 129.7% 45.7% 60.0% 8.6% 3.3% 5.1%
Non-GAAP net margin 42.5% 54.3% 55.4% 55.7% 46.4% 40.2% 38.6% 40.6%
Non-GAAP EPADS, diluted (in RMB) 1.99 2.55 4.45 2.87 3.07 2.59 4.30 2.82
QoQ % Change 3.4% 28.2% 74.8% -35.5% 6.8% -15.8% 66.2% -34.4%
YoY % Change 117.5% 136.6% 135.5% 49.4% 54.4% 1.5% -3.5% -1.8%
Non-GAAP EPADS, diluted (in USD) 0.32 0.41 0.72 0.46 0.49 0.42 0.69 0.45
QoQ % Change 3.3% 28.2% 74.8% -35.5% 7.1% -15.8% 66.2% -34.4%
YoY % Change 117.2% 136.3% 135.3% 49.2% 54.7% 1.7% -3.3% -1.6%
BABA
Initiating Coverage
27 October 2014
page 119 of 130 , Equity Analyst, +852 3743 8033, [email protected] Meng
Please see important disclosure information on pages 126 - 130 of this report.
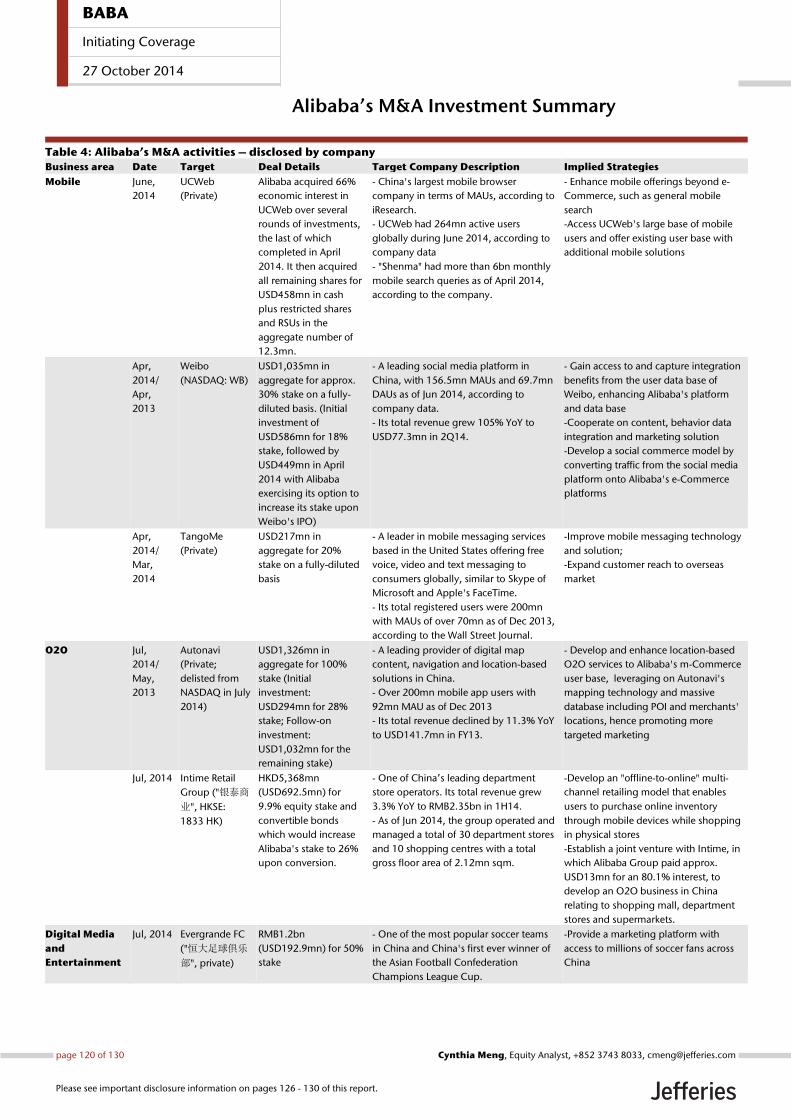
Alibaba’s M&A Investment Summary
Table 4: Alibaba’s M&A activities – disclosed by company
Business area Date Target Deal Details Target Company Description Implied Strategies
Mobile June,
2014
UCWeb
(Private)
Alibaba acquired 66%
economic interest in
UCWeb over several
rounds of investments,
the last of which
completed in April
2014. It then acquired
all remaining shares for
USD458mn in cash
plus restricted shares
and RSUs in the
aggregate number of
12.3mn.
- China's largest mobile browser
company in terms of MAUs, according to
iResearch.
- UCWeb had 264mn active users
globally during June 2014, according to
company data
- "Shenma" had more than 6bn monthly
mobile search queries as of April 2014,
according to the company.
- Enhance mobile offerings beyond e-
Commerce, such as general mobile
search
-Access UCWeb's large base of mobile
users and offer existing user base with
additional mobile solutions
Apr,
2014/
Apr,
2013
(NASDAQ: WB)
USD1,035mn in
aggregate for approx.
30% stake on a fully-
diluted basis. (Initial
investment of
USD586mn for 18%
stake, followed by
USD449mn in April
2014 with Alibaba
exercising its option to
increase its stake upon
Weibo's IPO)
- A leading social media platform in
China, with 156.5mn MAUs and 69.7mn
DAUs as of Jun 2014, according to
company data.
- Its total revenue grew 105% YoY to
USD77.3mn in 2Q14.
- Gain access to and capture integration
benefits from the user data base of
Weibo, enhancing Alibaba's platform
and data base
-Cooperate on content, behavior data
integration and marketing solution
-Develop a social commerce model by
converting traffic from the social media
platform onto Alibaba's e-Commerce
platforms
Apr,
2014/
Mar,
2014
TangoMe
(Private)
USD217mn in
aggregate for 20%
stake on a fully-diluted
basis
- A leader in mobile messaging services
based in the United States offering free
voice, video and text messaging to
consumers globally, similar to Skype of
Microsoft and Apple's FaceTime.
- Its total registered users were 200mn
with MAUs of over 70mn as of Dec 2013,
according to the Wall Street Journal.
-Improve mobile messaging technology
and solution;
-Expand customer reach to overseas
market
O2O Jul,
2014/
May,
2013
Autonavi
(Private;
delisted from
NASDAQ in July
2014)
USD1,326mn in
aggregate for 100%
stake (Initial
investment:
USD294mn for 28%
stake; Follow-on
investment:
USD1,032mn for the
remaining stake)
- A leading provider of digital map
content, navigation and location-based
solutions in China.
- Over 200mn mobile app users with
92mn MAU as of Dec 2013
- Its total revenue declined by 11.3% YoY
to USD141.7mn in FY13.
- Develop and enhance location-based
O2O services to Alibaba's m-Commerce
user base, leveraging on Autonavi's
mapping technology and massive
database including POI and merchants'
locations, hence promoting more
targeted marketing
Jul, 2014 Intime Retail
Group ("银泰商
业", HKSE:
1833 HK)
HKD5,368mn
(USD692.5mn) for
9.9% equity stake and
convertible bonds
which would increase
Alibaba's stake to 26%
upon conversion.
- One of China’s leading department
store operators. Its total revenue grew
3.3% YoY to RMB2.35bn in 1H14.
- As of Jun 2014, the group operated and
managed a total of 30 department stores
and 10 shopping centres with a total
gross floor area of 2.12mn sqm.
-Develop an "offline-to-online" multi-
channel retailing model that enables
users to purchase online inventory
through mobile devices while shopping
in physical stores
-Establish a joint venture with Intime, in
which Alibaba Group paid approx.
USD13mn for an 80.1% interest, to
develop an O2O business in China
relating to shopping mall, department
stores and supermarkets.
Digital Media
and
Entertainment
Jul, 2014 Evergrande FC
("恒大足球俱乐
部", private)
RMB1.2bn
(USD192.9mn) for 50%
stake
- One of the most popular soccer teams
in China and China's first ever winner of
the Asian Football Confederation
Champions League Cup.
-Provide a marketing platform with
access to millions of soccer fans across
China
BABA
Initiating Coverage
27 October 2014
page 120 of 130 , Equity Analyst, +852 3743 8033, [email protected] Meng
Please see important disclosure information on pages 126 - 130 of this report.
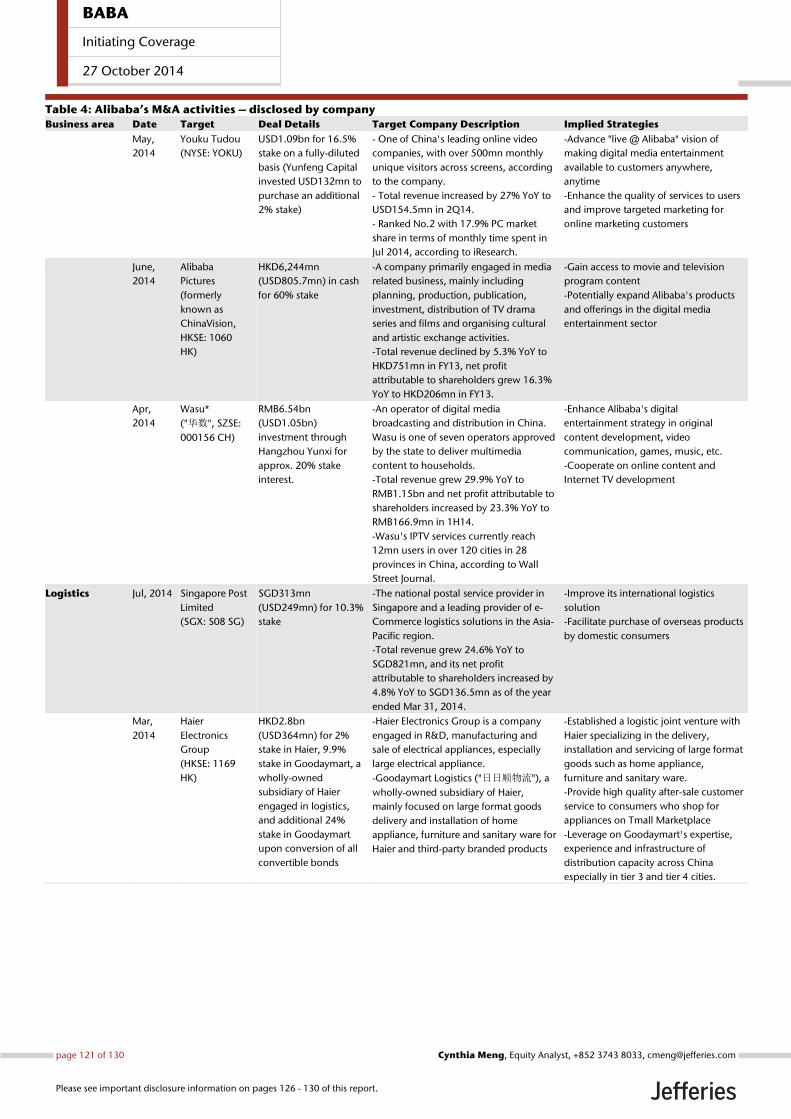
Table 4: Alibaba’s M&A activities – disclosed by company
Business area Date Target Deal Details Target Company Description Implied Strategies
May,
2014
Youku Tudou
(NYSE: YOKU)
USD1.09bn for 16.5%
stake on a fully-diluted
basis (Yunfeng Capital
invested USD132mn to
purchase an additional
2% stake)
- One of China's leading online video
companies, with over 500mn monthly
unique visitors across screens, according
to the company.
- Total revenue increased by 27% YoY to
USD154.5mn in 2Q14.
- Ranked No.2 with 17.9% PC market
share in terms of monthly time spent in
Jul 2014, according to iResearch.
-Advance "live @ Alibaba" vision of
making digital media entertainment
available to customers anywhere,
anytime
-Enhance the quality of services to users
and improve targeted marketing for
online marketing customers
June,
2014
Alibaba
Pictures
(formerly
known as
ChinaVision,
HKSE: 1060
HK)
HKD6,244mn
(USD805.7mn) in cash
for 60% stake
-A company primarily engaged in media
related business, mainly including
planning, production, publication,
investment, distribution of TV drama
series and films and organising cultural
and artistic exchange activities.
-Total revenue declined by 5.3% YoY to
HKD751mn in FY13, net profit
attributable to shareholders grew 16.3%
YoY to HKD206mn in FY13.
-Gain access to movie and television
program content
-Potentially expand Alibaba's products
and offerings in the digital media
entertainment sector
Apr,
2014
Wasu*
("华数", SZSE:
000156 CH)
RMB6.54bn
(USD1.05bn)
investment through
Hangzhou Yunxi for
approx. 20% stake
interest.
-An operator of digital media
broadcasting and distribution in China.
Wasu is one of seven operators approved
by the state to deliver multimedia
content to households.
-Total revenue grew 29.9% YoY to
RMB1.15bn and net profit attributable to
shareholders increased by 23.3% YoY to
RMB166.9mn in 1H14.
-Wasu's IPTV services currently reach
12mn users in over 120 cities in 28
provinces in China, according to Wall
Street Journal.
-Enhance Alibaba's digital
entertainment strategy in original
content development, video
communication, games, music, etc.
-Cooperate on online content and
Internet TV development
Logistics Jul, 2014 Singapore Post
Limited
(SGX: S08 SG)
SGD313mn
(USD249mn) for 10.3%
stake
-The national postal service provider in
Singapore and a leading provider of e-
Commerce logistics solutions in the Asia-
Pacific region.
-Total revenue grew 24.6% YoY to
SGD821mn, and its net profit
attributable to shareholders increased by
4.8% YoY to SGD136.5mn as of the year
ended Mar 31, 2014.
-Improve its international logistics
solution
-Facilitate purchase of overseas products
by domestic consumers
Mar,
2014
Haier
Electronics
Group
(HKSE: 1169
HK)
HKD2.8bn
(USD364mn) for 2%
stake in Haier, 9.9%
stake in Goodaymart, a
wholly-owned
subsidiary of Haier
engaged in logistics,
and additional 24%
stake in Goodaymart
upon conversion of all
convertible bonds
-Haier Electronics Group is a company
engaged in R&D, manufacturing and
sale of electrical appliances, especially
large electrical appliance.
-Goodaymart Logistics ("日日顺物流"), a
wholly-owned subsidiary of Haier,
mainly focused on large format goods
delivery and installation of home
appliance, furniture and sanitary ware for
Haier and third-party branded products
-Established a logistic joint venture with
Haier specializing in the delivery,
installation and servicing of large format
goods such as home appliance,
furniture and sanitary ware.
-Provide high quality after-sale customer
service to consumers who shop for
appliances on Tmall Marketplace
-Leverage on Goodaymart's expertise,
experience and infrastructure of
distribution capacity across China
especially in tier 3 and tier 4 cities.
BABA
Initiating Coverage
27 October 2014
page 121 of 130 , Equity Analyst, +852 3743 8033, [email protected] Meng
Please see important disclosure information on pages 126 - 130 of this report.

Table 4: Alibaba’s M&A activities – disclosed by company
Business area Date Target Deal Details Target Company Description Implied Strategies
May,
2013
Zhejiang
Cainiao Supply
Chain
Management
Co, Ltd ("菜鸟")
or China Smart
Logistics
(Private)
RMB2.4bn
(USD385.9mn) for 48%
stake in the Joint
Venture with Intime
Group, Fosun
International and other
five major express
delivery companies.
(Alibaba has invested
RMB1.68bn as of Mar
2014, and will invest
the remaining capital
over a two-year period)
-An operator of a nationwide logistics
infrastructure and information system in
China. Alibaba Group holds 48% stake of
China Smart Logistics.
-In the 12 months ended Jun 30, 2014,
the logistics system ensured the
successful delivery of an average of
approximately 16.6mn packages per
day.
-Enhance user experience by offering
efficient logistics and delivery services.
-China Smart Logistics plans to build a
network of key logistics hubs across
China, including distribution centers,
warehouses and other supply chain
facilities, which could support the
delivery of over 100mn packages per
day to consumers' doorsteps anywhere
in China within 24 hours in the long
term.
e-Commerce
infrastructure
and service
May,
2014/
Nov,
2010
Shenzhen
OneTouch
Business
Services ("深圳
一达通",
private)
Approx. RMB1.35bn
(USD217mn) in
aggregate for 100%
stake acquisition.
(Initial investment:
approx. RMB560mn for
65% stake; Follow-on
investment:
RMB790mn for the
remaining stake.)
-OneTouch is a provider of
comprehensive export-related services
tailored to the needs of small business in
China.
-Shenzhen OneTouch was ranked No.5
in terms of exported value among
general trade enterprises in 2013 in
China, behind Huawei and ZTE,
according to China National Customs
Information Center.
-Provide comprehensive export-related
service to SMEs, including customs
clearance, logistics, cargo insurance,
currency exchange, tax refund,
financing and certification, etc.
Overseas Mar,
2014
ShopRunner
(Private)
USD202mn for 39%
stake interest
-A company that operates a members-
only service for online shoppers in US,
offering free 2-day shipping with no
minimum order.
-The e-Commerce platform has more
than 1mn members and offers two-day
delivery for retailers, according to Wall
Street Journal.
-Enable Chinese consumers to shop for
authentic American products directly.
-Develop cross-border commerce
opportunities.
Healthcare Apr,
2014
CITIC 21
(HKSE: 0241
HK)
HKD932mn
(USD120.3mn) for 38%
stake interest. (Yunfeng
Capital acquired
another 16% stake in
CITIC 21 in the amount
of HKD395mn)
-A leading developer of product
identification, authentication and
tracking systems for pharmaceuticals and
medical products in China.
-Total revenue grew 279% YoY to
HKD60.2mn for the year ended Mar 31,
2014. Total profit grew by 389.4% YoY
to HKD9.6mn for the year ended Mar 31,
2014.
-Explore e-Commerce opportunities in
the pharmaceutical and healthcare
categories.
-Foster consumer trust through the sale
of genuine pharmaceuticals through the
company's verification and
authentication technology.
Source: Company data, Jefferies.
BABA
Initiating Coverage
27 October 2014
page 122 of 130 , Equity Analyst, +852 3743 8033, [email protected] Meng
Please see important disclosure information on pages 126 - 130 of this report.
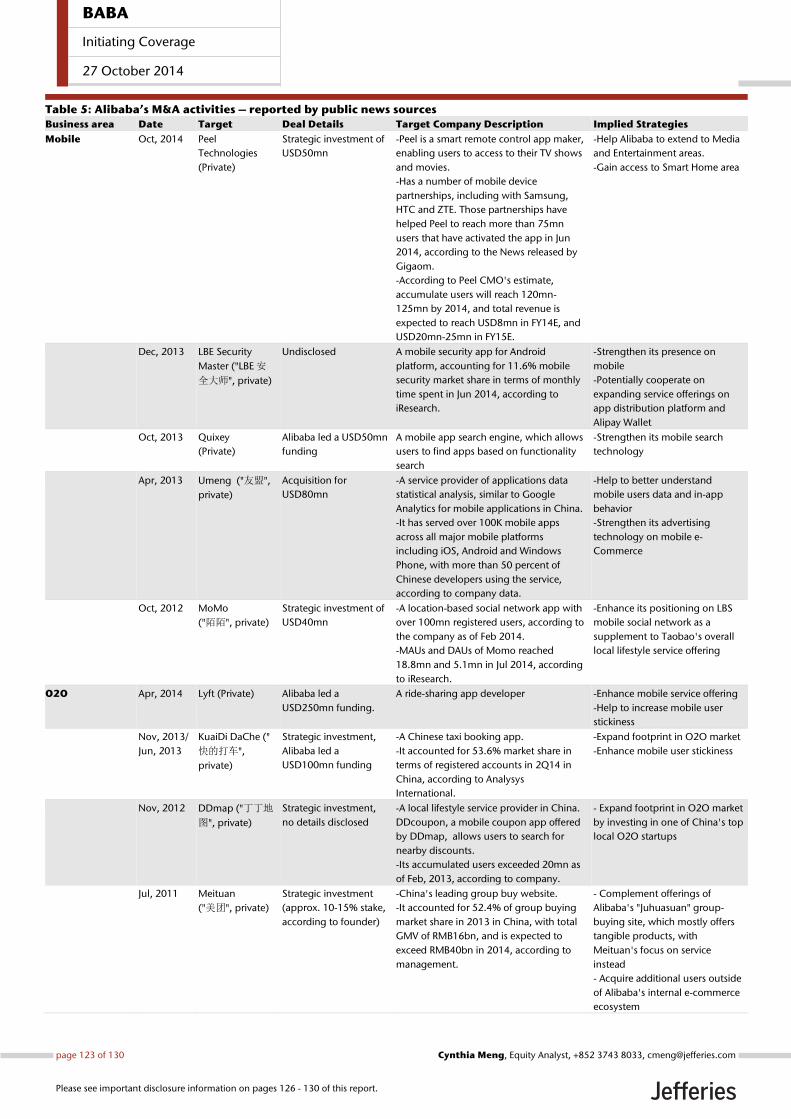
Table 5: Alibaba’s M&A activities – reported by public news sources
Business area Date Target Deal Details Target Company Description Implied Strategies
Mobile Oct, 2014 Peel
Technologies
(Private)
Strategic investment of
USD50mn
-Peel is a smart remote control app maker,
enabling users to access to their TV shows
and movies.
-Has a number of mobile device
partnerships, including with Samsung,
HTC and ZTE. Those partnerships have
helped Peel to reach more than 75mn
users that have activated the app in Jun
2014, according to the News released by
Gigaom.
-According to Peel CMO's estimate,
accumulate users will reach 120mn-
125mn by 2014, and total revenue is
expected to reach USD8mn in FY14E, and
USD20mn-25mn in FY15E.
-Help Alibaba to extend to Media
and Entertainment areas.
-Gain access to Smart Home area
Dec, 2013 LBE Security
Master ("LBE 安
全大师", private)
Undisclosed A mobile security app for Android
platform, accounting for 11.6% mobile
security market share in terms of monthly
time spent in Jun 2014, according to
iResearch.
-Strengthen its presence on
mobile
-Potentially cooperate on
expanding service offerings on
app distribution platform and
Alipay Wallet
Oct, 2013 Quixey
(Private)
Alibaba led a USD50mn
funding
A mobile app search engine, which allows
users to find apps based on functionality
search
-Strengthen its mobile search
technology
Apr, 2013 Umeng ("友盟",
private)
Acquisition for
USD80mn
-A service provider of applications data
statistical analysis, similar to Google
Analytics for mobile applications in China.
-It has served over 100K mobile apps
across all major mobile platforms
including iOS, Android and Windows
Phone, with more than 50 percent of
Chinese developers using the service,
according to company data.
-Help to better understand
mobile users data and in-app
behavior
-Strengthen its advertising
technology on mobile e-
Commerce
Oct, 2012 MoMo
("陌陌", private)
Strategic investment of
USD40mn
-A location-based social network app with
over 100mn registered users, according to
the company as of Feb 2014.
-MAUs and DAUs of Momo reached
18.8mn and 5.1mn in Jul 2014, according
to iResearch.
-Enhance its positioning on LBS
mobile social network as a
supplement to Taobao's overall
local lifestyle service offering
O2O Apr, 2014 Lyft (Private) Alibaba led a
USD250mn funding.
A ride-sharing app developer -Enhance mobile service offering
-Help to increase mobile user
stickiness
Nov, 2013/
Jun, 2013
KuaiDi DaChe ("
快的打车",
private)
Strategic investment,
Alibaba led a
USD100mn funding
-A Chinese taxi booking app.
-It accounted for 53.6% market share in
terms of registered accounts in 2Q14 in
China, according to Analysys
International.
-Expand footprint in O2O market
-Enhance mobile user stickiness
Nov, 2012 DDmap ("丁丁地
图", private)
Strategic investment,
no details disclosed
-A local lifestyle service provider in China.
DDcoupon, a mobile coupon app offered
by DDmap, allows users to search for
nearby discounts.
-Its accumulated users exceeded 20mn as
of Feb, 2013, according to company.
- Expand footprint in O2O market
by investing in one of China's top
local O2O startups
Jul, 2011 Meituan
("美团", private)
Strategic investment
(approx. 10-15% stake,
according to founder)
-China's leading group buy website.
-It accounted for 52.4% of group buying
market share in 2013 in China, with total
GMV of RMB16bn, and is expected to
exceed RMB40bn in 2014, according to
management.
- Complement offerings of
Alibaba's "Juhuasuan" group-
buying site, which mostly offers
tangible products, with
Meituan's focus on service
instead
- Acquire additional users outside
of Alibaba's internal e-commerce
ecosystem
BABA
Initiating Coverage
27 October 2014
page 123 of 130 , Equity Analyst, +852 3743 8033, [email protected] Meng
Please see important disclosure information on pages 126 - 130 of this report.
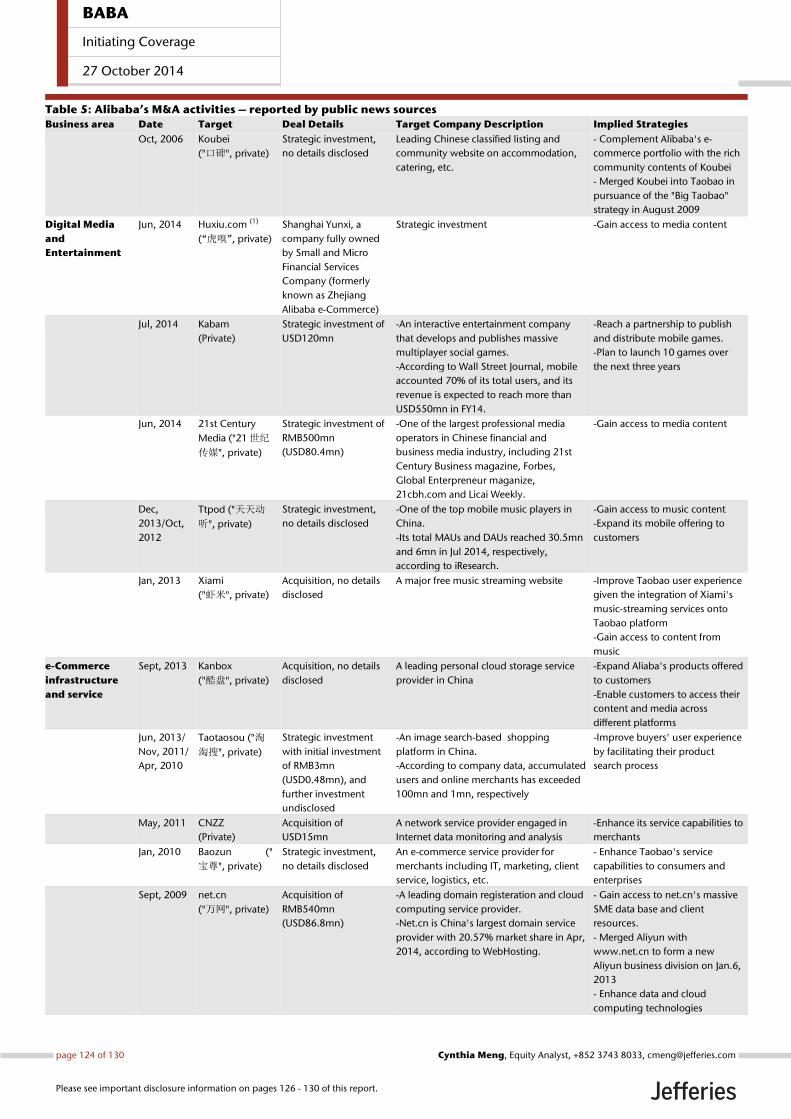
Table 5: Alibaba’s M&A activities – reported by public news sources
Business area Date Target Deal Details Target Company Description Implied Strategies
Oct, 2006 Koubei
("口碑", private)
Strategic investment,
no details disclosed
Leading Chinese classified listing and
community website on accommodation,
catering, etc.
- Complement Alibaba's e-
commerce portfolio with the rich
community contents of Koubei
- Merged Koubei into Taobao in
pursuance of the "Big Taobao"
strategy in August 2009
Digital Media
and
Entertainment
Jun, 2014 Huxiu.com (1)
(“虎嗅”, private)
Shanghai Yunxi, a
company fully owned
by Small and Micro
Financial Services
Company (formerly
known as Zhejiang
Alibaba e-Commerce)
Strategic investment -Gain access to media content
Jul, 2014 Kabam
(Private)
Strategic investment of
USD120mn
-An interactive entertainment company
that develops and publishes massive
multiplayer social games.
-According to Wall Street Journal, mobile
accounted 70% of its total users, and its
revenue is expected to reach more than
USD550mn in FY14.
-Reach a partnership to publish
and distribute mobile games.
-Plan to launch 10 games over
the next three years
Jun, 2014 21st Century
Media ("21 世纪
传媒", private)
Strategic investment of
RMB500mn
(USD80.4mn)
-One of the largest professional media
operators in Chinese financial and
business media industry, including 21st
Century Business magazine, Forbes,
Global Enterpreneur maganize,
21cbh.com and Licai Weekly.
-Gain access to media content
Dec,
2013/Oct,
2012
Ttpod ("天天动
听", private)
Strategic investment,
no details disclosed
-One of the top mobile music players in
China.
-Its total MAUs and DAUs reached 30.5mn
and 6mn in Jul 2014, respectively,
according to iResearch.
-Gain access to music content
-Expand its mobile offering to
customers
Jan, 2013 Xiami
("虾米", private)
Acquisition, no details
disclosed
A major free music streaming website -Improve Taobao user experience
given the integration of Xiami's
music-streaming services onto
Taobao platform
-Gain access to content from
music
e-Commerce
infrastructure
and service
Sept, 2013 Kanbox
("酷盘", private)
Acquisition, no details
disclosed
A leading personal cloud storage service
provider in China
-Expand Aliaba's products offered
to customers
-Enable customers to access their
content and media across
different platforms
Jun, 2013/
Nov, 2011/
Apr, 2010
Taotaosou ("淘
淘搜", private)
Strategic investment
with initial investment
of RMB3mn
(USD0.48mn), and
further investment
undisclosed
-An image search-based shopping
platform in China.
-According to company data, accumulated
users and online merchants has exceeded
100mn and 1mn, respectively
-Improve buyers' user experience
by facilitating their product
search process
May, 2011 CNZZ
(Private)
Acquisition of
USD15mn
A network service provider engaged in
Internet data monitoring and analysis
-Enhance its service capabilities to
merchants
Jan, 2010 Baozun ("
宝尊", private)
Strategic investment,
no details disclosed
An e-commerce service provider for
merchants including IT, marketing, client
service, logistics, etc.
- Enhance Taobao's service
capabilities to consumers and
enterprises
Sept, 2009 net.cn
("万网", private)
Acquisition of
RMB540mn
(USD86.8mn)
-A leading domain registeration and cloud
computing service provider.
-Net.cn is China's largest domain service
provider with 20.57% market share in Apr,
2014, according to WebHosting.
- Gain access to net.cn's massive
SME data base and client
resources.
- Merged Aliyun with
www.net.cn to form a new
Aliyun business division on Jan.6,
2013
- Enhance data and cloud
computing technologies
BABA
Initiating Coverage
27 October 2014
page 124 of 130 , Equity Analyst, +852 3743 8033, [email protected] Meng
Please see important disclosure information on pages 126 - 130 of this report.
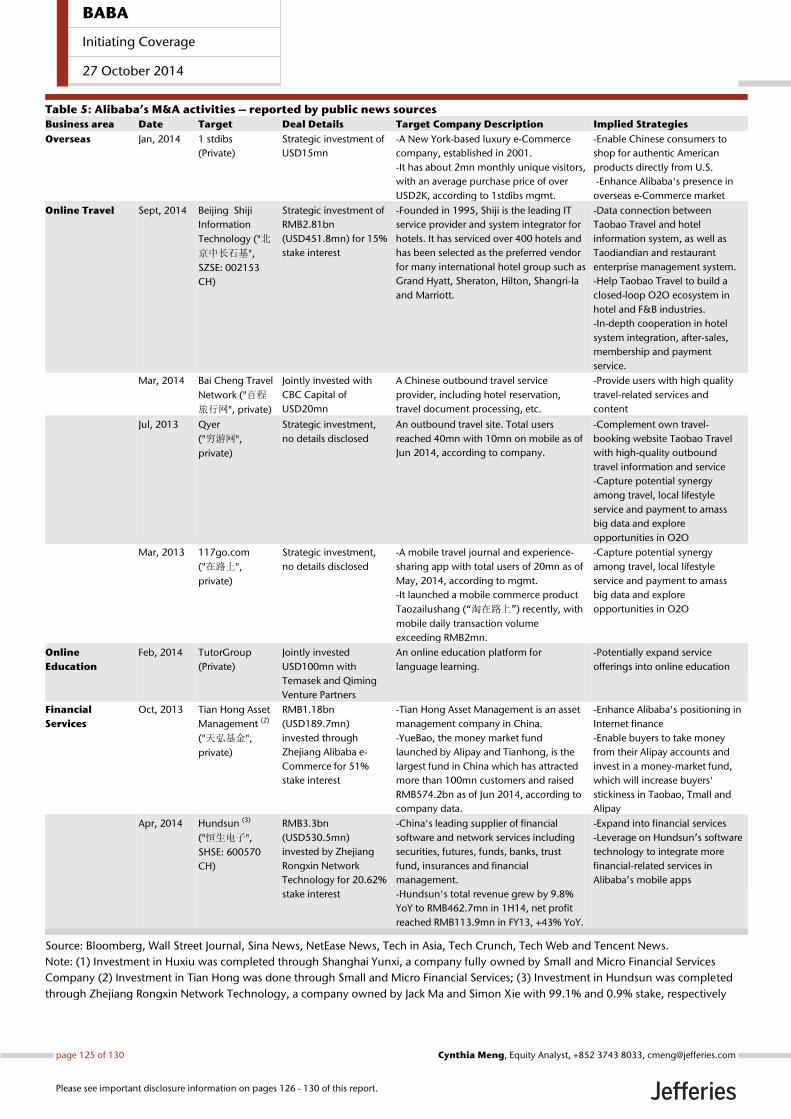
Table 5: Alibaba’s M&A activities – reported by public news sources
Business area Date Target Deal Details Target Company Description Implied Strategies
Overseas Jan, 2014 1 stdibs
(Private)
Strategic investment of
USD15mn
-A New York-based luxury e-Commerce
company, established in 2001.
-It has about 2mn monthly unique visitors,
with an average purchase price of over
USD2K, according to 1stdibs mgmt.
-Enable Chinese consumers to
shop for authentic American
products directly from U.S.
-Enhance Alibaba's presence in
overseas e-Commerce market
Online Travel Sept, 2014 Beijing Shiji
Information
Technology ("北
京中长石基",
SZSE: 002153
CH)
Strategic investment of
RMB2.81bn
(USD451.8mn) for 15%
stake interest
-Founded in 1995, Shiji is the leading IT
service provider and system integrator for
hotels. It has serviced over 400 hotels and
has been selected as the preferred vendor
for many international hotel group such as
Grand Hyatt, Sheraton, Hilton, Shangri-la
and Marriott.
-Data connection between
Taobao Travel and hotel
information system, as well as
Taodiandian and restaurant
enterprise management system.
-Help Taobao Travel to build a
closed-loop O2O ecosystem in
hotel and F&B industries.
-In-depth cooperation in hotel
system integration, after-sales,
membership and payment
service.
Mar, 2014 Bai Cheng Travel
Network ("百程
旅行网", private)
Jointly invested with
CBC Capital of
USD20mn
A Chinese outbound travel service
provider, including hotel reservation,
travel document processing, etc.
-Provide users with high quality
travel-related services and
content
Jul, 2013 Qyer
("穷游网",
private)
Strategic investment,
no details disclosed
An outbound travel site. Total users
reached 40mn with 10mn on mobile as of
Jun 2014, according to company.
-Complement own travel-
booking website Taobao Travel
with high-quality outbound
travel information and service
-Capture potential synergy
among travel, local lifestyle
service and payment to amass
big data and explore
opportunities in O2O
Mar, 2013 117go.com
("在路上",
private)
Strategic investment,
no details disclosed
-A mobile travel journal and experience-
sharing app with total users of 20mn as of
May, 2014, according to mgmt.
-It launched a mobile commerce product
Taozailushang (“淘在路上”) recently, with
mobile daily transaction volume
exceeding RMB2mn.
-Capture potential synergy
among travel, local lifestyle
service and payment to amass
big data and explore
opportunities in O2O
Online
Education
Feb, 2014 TutorGroup
(Private)
Jointly invested
USD100mn with
Temasek and Qiming
Venture Partners
An online education platform for
language learning.
-Potentially expand service
offerings into online education
Financial
Services
Oct, 2013 Tian Hong Asset
Management (2)
("天弘基金",
private)
RMB1.18bn
(USD189.7mn)
invested through
Zhejiang Alibaba e-
Commerce for 51%
stake interest
-Tian Hong Asset Management is an asset
management company in China.
-YueBao, the money market fund
launched by Alipay and Tianhong, is the
largest fund in China which has attracted
more than 100mn customers and raised
RMB574.2bn as of Jun 2014, according to
company data.
-Enhance Alibaba's positioning in
Internet finance
-Enable buyers to take money
from their Alipay accounts and
invest in a money-market fund,
which will increase buyers'
stickiness in Taobao, Tmall and
Alipay
Apr, 2014 Hundsun (3)
("恒生电子",
SHSE: 600570
CH)
RMB3.3bn
(USD530.5mn)
invested by Zhejiang
Rongxin Network
Technology for 20.62%
stake interest
-China's leading supplier of financial
software and network services including
securities, futures, funds, banks, trust
fund, insurances and financial
management.
-Hundsun's total revenue grew by 9.8%
YoY to RMB462.7mn in 1H14, net profit
reached RMB113.9mn in FY13, +43% YoY.
-Expand into financial services
-Leverage on Hundsun’s software
technology to integrate more
financial-related services in
Alibaba’s mobile apps
Source: Bloomberg, Wall Street Journal, Sina News, NetEase News, Tech in Asia, Tech Crunch, Tech Web and Tencent News.
Note: (1) Investment in Huxiu was completed through Shanghai Yunxi, a company fully owned by Small and Micro Financial Services
Company (2) Investment in Tian Hong was done through Small and Micro Financial Services; (3) Investment in Hundsun was completed
through Zhejiang Rongxin Network Technology, a company owned by Jack Ma and Simon Xie with 99.1% and 0.9% stake, respectively
BABA
Initiating Coverage
27 October 2014
page 125 of 130 , Equity Analyst, +852 3743 8033, [email protected] Meng
Please see important disclosure information on pages 126 - 130 of this report.
Company Description
Alibaba is the largest online and mobile commerce company in the world in terms of gross merchandise volume in 2013, according toindustry sources. The company operates its marketplaces as a platform for third parties, and does not engage in direct sales, compete withits merchants or hold inventory.
Analyst Certification:I, Cynthia Meng, certify that all of the views expressed in this research report accurately reflect my personal views about the subject security(ies) andsubject company(ies). I also certify that no part of my compensation was, is, or will be, directly or indirectly, related to the specific recommendationsor views expressed in this research report.I, Brian Pitz, certify that all of the views expressed in this research report accurately reflect my personal views about the subject security(ies) and subjectcompany(ies). I also certify that no part of my compensation was, is, or will be, directly or indirectly, related to the specific recommendations or viewsexpressed in this research report.I, Brian Fitzgerald, certify that all of the views expressed in this research report accurately reflect my personal views about the subject security(ies) andsubject company(ies). I also certify that no part of my compensation was, is, or will be, directly or indirectly, related to the specific recommendationsor views expressed in this research report.I, Karen Chan, certify that all of the views expressed in this research report accurately reflect my personal views about the subject security(ies) andsubject company(ies). I also certify that no part of my compensation was, is, or will be, directly or indirectly, related to the specific recommendationsor views expressed in this research report.I, Nick Wang, certify that all of the views expressed in this research report accurately reflect my personal views about the subject security(ies) andsubject company(ies). I also certify that no part of my compensation was, is, or will be, directly or indirectly, related to the specific recommendationsor views expressed in this research report.I, Qin Wang, certify that all of the views expressed in this research report accurately reflect my personal views about the subject security(ies) andsubject company(ies). I also certify that no part of my compensation was, is, or will be, directly or indirectly, related to the specific recommendationsor views expressed in this research report.Registration of non-US analysts: Cynthia Meng is employed by Jefferies Hong Kong Limited, a non-US affiliate of Jefferies LLC and is not registered/qualified as a research analyst with FINRA. This analyst(s) may not be an associated person of Jefferies LLC, a FINRA member firm, and therefore maynot be subject to the NASD Rule 2711 and Incorporated NYSE Rule 472 restrictions on communications with a subject company, public appearancesand trading securities held by a research analyst.
Registration of non-US analysts: Karen Chan is employed by Jefferies Hong Kong Limited, a non-US affiliate of Jefferies LLC and is not registered/qualified as a research analyst with FINRA. This analyst(s) may not be an associated person of Jefferies LLC, a FINRA member firm, and therefore maynot be subject to the NASD Rule 2711 and Incorporated NYSE Rule 472 restrictions on communications with a subject company, public appearancesand trading securities held by a research analyst.
Registration of non-US analysts: Nick Wang is employed by Jefferies Hong Kong Limited, a non-US affiliate of Jefferies LLC and is not registered/qualified as a research analyst with FINRA. This analyst(s) may not be an associated person of Jefferies LLC, a FINRA member firm, and therefore maynot be subject to the NASD Rule 2711 and Incorporated NYSE Rule 472 restrictions on communications with a subject company, public appearancesand trading securities held by a research analyst.
Registration of non-US analysts: Qin Wang is employed by Jefferies Hong Kong Limited, a non-US affiliate of Jefferies LLC and is not registered/qualified as a research analyst with FINRA. This analyst(s) may not be an associated person of Jefferies LLC, a FINRA member firm, and therefore maynot be subject to the NASD Rule 2711 and Incorporated NYSE Rule 472 restrictions on communications with a subject company, public appearancesand trading securities held by a research analyst.
As is the case with all Jefferies employees, the analyst(s) responsible for the coverage of the financial instruments discussed in this report receivescompensation based in part on the overall performance of the firm, including investment banking income. We seek to update our research asappropriate, but various regulations may prevent us from doing so. Aside from certain industry reports published on a periodic basis, the large majorityof reports are published at irregular intervals as appropriate in the analyst's judgement.
Company Specific DisclosuresFor Important Disclosure information on companies recommended in this report, please visit our website at https://javatar.bluematrix.com/sellside/Disclosures.action or call 212.284.2300.
Meanings of Jefferies RatingsBuy - Describes stocks that we expect to provide a total return (price appreciation plus yield) of 15% or more within a 12-month period.Hold - Describes stocks that we expect to provide a total return (price appreciation plus yield) of plus 15% or minus 10% within a 12-month period.Underperform - Describes stocks that we expect to provide a total negative return (price appreciation plus yield) of 10% or more within a 12-monthperiod.The expected total return (price appreciation plus yield) for Buy rated stocks with an average stock price consistently below $10 is 20% or more withina 12-month period as these companies are typically more volatile than the overall stock market. For Hold rated stocks with an average stock priceconsistently below $10, the expected total return (price appreciation plus yield) is plus or minus 20% within a 12-month period. For Underperformrated stocks with an average stock price consistently below $10, the expected total return (price appreciation plus yield) is minus 20% within a 12-month period.
BABA
Initiating Coverage
27 October 2014
page 126 of 130 , Equity Analyst, +852 3743 8033, [email protected] Meng
Please see important disclosure information on pages 126 - 130 of this report.
NR - The investment rating and price target have been temporarily suspended. Such suspensions are in compliance with applicable regulations and/or Jefferies policies.CS - Coverage Suspended. Jefferies has suspended coverage of this company.NC - Not covered. Jefferies does not cover this company.Restricted - Describes issuers where, in conjunction with Jefferies engagement in certain transactions, company policy or applicable securitiesregulations prohibit certain types of communications, including investment recommendations.Monitor - Describes stocks whose company fundamentals and financials are being monitored, and for which no financial projections or opinions onthe investment merits of the company are provided.
Valuation MethodologyJefferies' methodology for assigning ratings may include the following: market capitalization, maturity, growth/value, volatility and expected totalreturn over the next 12 months. The price targets are based on several methodologies, which may include, but are not restricted to, analyses of marketrisk, growth rate, revenue stream, discounted cash flow (DCF), EBITDA, EPS, cash flow (CF), free cash flow (FCF), EV/EBITDA, P/E, PE/growth, P/CF,P/FCF, premium (discount)/average group EV/EBITDA, premium (discount)/average group P/E, sum of the parts, net asset value, dividend returns,and return on equity (ROE) over the next 12 months.
Jefferies Franchise PicksJefferies Franchise Picks include stock selections from among the best stock ideas from our equity analysts over a 12 month period. Stock selectionis based on fundamental analysis and may take into account other factors such as analyst conviction, differentiated analysis, a favorable risk/rewardratio and investment themes that Jefferies analysts are recommending. Jefferies Franchise Picks will include only Buy rated stocks and the numbercan vary depending on analyst recommendations for inclusion. Stocks will be added as new opportunities arise and removed when the reason forinclusion changes, the stock has met its desired return, if it is no longer rated Buy and/or if it underperforms the S&P by 15% or more since inclusion.Franchise Picks are not intended to represent a recommended portfolio of stocks and is not sector based, but we may note where we believe a Pickfalls within an investment style such as growth or value.
Risk which may impede the achievement of our Price TargetThis report was prepared for general circulation and does not provide investment recommendations specific to individual investors. As such, thefinancial instruments discussed in this report may not be suitable for all investors and investors must make their own investment decisions basedupon their specific investment objectives and financial situation utilizing their own financial advisors as they deem necessary. Past performance ofthe financial instruments recommended in this report should not be taken as an indication or guarantee of future results. The price, value of, andincome from, any of the financial instruments mentioned in this report can rise as well as fall and may be affected by changes in economic, financialand political factors. If a financial instrument is denominated in a currency other than the investor's home currency, a change in exchange rates mayadversely affect the price of, value of, or income derived from the financial instrument described in this report. In addition, investors in securities suchas ADRs, whose values are affected by the currency of the underlying security, effectively assume currency risk.
Other Companies Mentioned in This Report• Alibaba Group Holding Limited (BABA: $95.76, BUY)• Amazon.com, Inc (AMZN: $287.06, BUY)• Baidu Inc. (BIDU: $222.55, BUY)• eBay, Inc. (EBAY: $51.12, HOLD)• HC International Inc. (2280 HK: HK$9.94, BUY)• JD.com, Inc. (JD: $24.02, BUY)• Ourgame International Holdings (6899 HK: HK$4.10, BUY)• Qihoo 360 (QIHU: $68.19, BUY)• Renren Inc. (RENN: $3.41, UNDERPERFORM)• Sina Corp. (SINA: $39.84, HOLD)• Tencent Holdings Ltd. (700 HK: HK$119.50, BUY)• Tian Ge Interactive Holdings (1980 HK: HK$4.93, BUY)• Vipshop Holdings Limited (VIPS: $213.59, BUY)
BABA
Initiating Coverage
27 October 2014
page 127 of 130 , Equity Analyst, +852 3743 8033, [email protected] Meng
Please see important disclosure information on pages 126 - 130 of this report.

Distribution of RatingsIB Serv./Past 12 Mos.
Rating Count Percent Count Percent
BUY 1008 52.26% 263 26.09%HOLD 781 40.49% 139 17.80%UNDERPERFORM 140 7.26% 6 4.29%
BABA
Initiating Coverage
27 October 2014
page 128 of 130 , Equity Analyst, +852 3743 8033, [email protected] Meng
Please see important disclosure information on pages 126 - 130 of this report.
Other Important Disclosures
Jefferies Equity Research refers to research reports produced by analysts employed by one of the following Jefferies Group LLC (“Jefferies”) groupcompanies:
United States: Jefferies LLC which is an SEC registered firm and a member of FINRA.
United Kingdom: Jefferies International Limited, which is authorized and regulated by the Financial Conduct Authority; registered in England andWales No. 1978621; registered office: Vintners Place, 68 Upper Thames Street, London EC4V 3BJ; telephone +44 (0)20 7029 8000; facsimile +44 (0)207029 8010.
Hong Kong: Jefferies Hong Kong Limited, which is licensed by the Securities and Futures Commission of Hong Kong with CE number ATS546; locatedat Suite 2201, 22nd Floor, Cheung Kong Center, 2 Queen’s Road Central, Hong Kong.
Singapore: Jefferies Singapore Limited, which is licensed by the Monetary Authority of Singapore; located at 80 Raffles Place #15-20, UOB Plaza 2,Singapore 048624, telephone: +65 6551 3950.
Japan: Jefferies (Japan) Limited, Tokyo Branch, which is a securities company registered by the Financial Services Agency of Japan and is a memberof the Japan Securities Dealers Association; located at Hibiya Marine Bldg, 3F, 1-5-1 Yuraku-cho, Chiyoda-ku, Tokyo 100-0006; telephone +813 52516100; facsimile +813 5251 6101.
India: Jefferies India Private Limited (CIN - U74140MH2007PTC200509), which is licensed by the Securities and Exchange Board of India as a MerchantBanker (INM000011443) and a Stock Broker with Bombay Stock Exchange Limited (INB011491033) and National Stock Exchange of India Limited(INB231491037) in the Capital Market Segment; located at 42/43, 2 North Avenue, Maker Maxity, Bandra-Kurla Complex, Bandra (East) Mumbai 400051, India; Tel +91 22 4356 6000.
This material has been prepared by Jefferies employing appropriate expertise, and in the belief that it is fair and not misleading. The information setforth herein was obtained from sources believed to be reliable, but has not been independently verified by Jefferies. Therefore, except for any obligationunder applicable rules we do not guarantee its accuracy. Additional and supporting information is available upon request. Unless prohibited by theprovisions of Regulation S of the U.S. Securities Act of 1933, this material is distributed in the United States ("US"), by Jefferies LLC, a US-registeredbroker-dealer, which accepts responsibility for its contents in accordance with the provisions of Rule 15a-6, under the US Securities Exchange Act of1934. Transactions by or on behalf of any US person may only be effected through Jefferies LLC. In the United Kingdom and European EconomicArea this report is issued and/or approved for distribution by Jefferies International Limited and is intended for use only by persons who have, or havebeen assessed as having, suitable professional experience and expertise, or by persons to whom it can be otherwise lawfully distributed. JefferiesInternational Limited has adopted a conflicts management policy in connection with the preparation and publication of research, the details of whichare available upon request in writing to the Compliance Officer. Jefferies International Limited may allow its analysts to undertake private consultancywork. Jefferies International Limited’s conflicts management policy sets out the arrangements Jefferies International Limited employs to manage anypotential conflicts of interest that may arise as a result of such consultancy work. For Canadian investors, this material is intended for use only byprofessional or institutional investors. None of the investments or investment services mentioned or described herein is available to other personsor to anyone in Canada who is not a "Designated Institution" as defined by the Securities Act (Ontario). In Singapore, Jefferies Singapore Limited isregulated by the Monetary Authority of Singapore. For investors in the Republic of Singapore, this material is provided by Jefferies Singapore Limitedpursuant to Regulation 32C of the Financial Advisers Regulations. The material contained in this document is intended solely for accredited, expert orinstitutional investors, as defined under the Securities and Futures Act (Cap. 289 of Singapore). If there are any matters arising from, or in connectionwith this material, please contact Jefferies Singapore Limited, located at 80 Raffles Place #15-20, UOB Plaza 2, Singapore 048624, telephone: +656551 3950. In Japan this material is issued and distributed by Jefferies (Japan) Limited to institutional investors only. In Hong Kong, this report isissued and approved by Jefferies Hong Kong Limited and is intended for use only by professional investors as defined in the Hong Kong Securities andFutures Ordinance and its subsidiary legislation. In the Republic of China (Taiwan), this report should not be distributed. The research in relation tothis report is conducted outside the PRC. This report does not constitute an offer to sell or the solicitation of an offer to buy any securities in the PRC.PRC investors shall have the relevant qualifications to invest in such securities and shall be responsible for obtaining all relevant approvals, licenses,verifications and/or registrations from the relevant governmental authorities themselves. In India this report is made available by Jefferies India PrivateLimited. In Australia this information is issued solely by Jefferies International Limited and is directed solely at wholesale clients within the meaning ofthe Corporations Act 2001 of Australia (the "Act") in connection with their consideration of any investment or investment service that is the subject ofthis document. Any offer or issue that is the subject of this document does not require, and this document is not, a disclosure document or productdisclosure statement within the meaning of the Act. Jefferies International Limited is authorised and regulated by the Financial Conduct Authorityunder the laws of the United Kingdom, which differ from Australian laws. Jefferies International Limited has obtained relief under Australian Securitiesand Investments Commission Class Order 03/1099, which conditionally exempts it from holding an Australian financial services licence under theAct in respect of the provision of certain financial services to wholesale clients. Recipients of this document in any other jurisdictions should informthemselves about and observe any applicable legal requirements in relation to the receipt of this document.
This report is not an offer or solicitation of an offer to buy or sell any security or derivative instrument, or to make any investment. Any opinion orestimate constitutes the preparer's best judgment as of the date of preparation, and is subject to change without notice. Jefferies assumes no obligationto maintain or update this report based on subsequent information and events. Jefferies, its associates or affiliates, and its respective officers, directors,and employees may have long or short positions in, or may buy or sell any of the securities, derivative instruments or other investments mentioned ordescribed herein, either as agent or as principal for their own account. Upon request Jefferies may provide specialized research products or servicesto certain customers focusing on the prospects for individual covered stocks as compared to other covered stocks over varying time horizons orunder differing market conditions. While the views expressed in these situations may not always be directionally consistent with the long-term viewsexpressed in the analyst's published research, the analyst has a reasonable basis and any inconsistencies can be reasonably explained. This materialdoes not constitute a personal recommendation or take into account the particular investment objectives, financial situations, or needs of individualclients. Clients should consider whether any advice or recommendation in this report is suitable for their particular circumstances and, if appropriate,seek professional advice, including tax advice. The price and value of the investments referred to herein and the income from them may fluctuate. Pastperformance is not a guide to future performance, future returns are not guaranteed, and a loss of original capital may occur. Fluctuations in exchangerates could have adverse effects on the value or price of, or income derived from, certain investments. This report has been prepared independently ofany issuer of securities mentioned herein and not in connection with any proposed offering of securities or as agent of any issuer of securities. Noneof Jefferies, any of its affiliates or its research analysts has any authority whatsoever to make any representations or warranty on behalf of the issuer(s).Jefferies policy prohibits research personnel from disclosing a recommendation, investment rating, or investment thesis for review by an issuer prior
BABA
Initiating Coverage
27 October 2014
page 129 of 130 , Equity Analyst, +852 3743 8033, [email protected] Meng
Please see important disclosure information on pages 126 - 130 of this report.
to the publication of a research report containing such rating, recommendation or investment thesis. Any comments or statements made herein arethose of the author(s) and may differ from the views of Jefferies.
This report may contain information obtained from third parties, including ratings from credit ratings agencies such as Standard & Poor’s. Reproductionand distribution of third party content in any form is prohibited except with the prior written permission of the related third party. Third party contentproviders do not guarantee the accuracy, completeness, timeliness or availability of any information, including ratings, and are not responsible forany errors or omissions (negligent or otherwise), regardless of the cause, or for the results obtained from the use of such content. Third party contentproviders give no express or implied warranties, including, but not limited to, any warranties of merchantability or fitness for a particular purpose oruse. Third party content providers shall not be liable for any direct, indirect, incidental, exemplary, compensatory, punitive, special or consequentialdamages, costs, expenses, legal fees, or losses (including lost income or profits and opportunity costs) in connection with any use of their content,including ratings. Credit ratings are statements of opinions and are not statements of fact or recommendations to purchase, hold or sell securities. Theydo not address the suitability of securities or the suitability of securities for investment purposes, and should not be relied on as investment advice.
Jefferies research reports are disseminated and available primarily electronically, and, in some cases, in printed form. Electronic research issimultaneously available to all clients. This report or any portion hereof may not be reprinted, sold or redistributed without the written consent ofJefferies. Neither Jefferies nor any officer nor employee of Jefferies accepts any liability whatsoever for any direct, indirect or consequential damagesor losses arising from any use of this report or its contents.
For Important Disclosure information, please visit our website at https://javatar.bluematrix.com/sellside/Disclosures.action or call 1.888.JEFFERIES
© 2014 Jefferies Group LLC
BABA
Initiating Coverage
27 October 2014
page 130 of 130 , Equity Analyst, +852 3743 8033, [email protected] Meng
Please see important disclosure information on pages 126 - 130 of this report.