Alhashemi et al
12
African Journal of Biotechnology Vol. 10(9), pp. 1625-1636, 28 February, 2011 Available online at http://www.academic journals.org/AJB ISSN 1684–5315 © 2011 Acade mic Journals Full Length Research Paper Accumulation and bioaccessibility of trace elements in wetland sediments Azamalsadat Hosseini Alhashemi 1 *, Abdol Reza Karbassi 2 , Bahram Hassanzadeh Kiabi 3 , Seyed Massoud Monavari 1 and Mohammad Bagher Nabavi 4 1 Department of Environmental Science, Graduate School of Environment and Energy, Science and Research Campus, Islamic Azad University, Tehran, Iran. 2 Graduate Faculty of Environment, University of Tehran, P.O.Box 14155-6135, Tehran, Iran. 3 Department of Marine Biology, Faculty of Biological Sciences, Shahid Beheshti Universit y, G.C., Tehran, Iran. 4 Marine Ecobiology Faculty, University of Marine Science and Technology, Khorramshahr, Iran. Accepted 2 September, 2010 Accumulation of trace metals in sediment can cause severe ecological impacts. In this study, determination of elemental concentrations in water and sediment was done. Shadegan wetland is one of the most important wetlands in southwest of Iran and is among the Ramsar-listed wetlands. Wastewaters from industries, urban activities and agricultural run off are released into this unique wetland in the region. In the present investigation, 12 sampling stations were selected for water and sediment collection in Shadegan wetland during winter, 2009. Physico-chemical parameters such as pH, electrical conductivity (EC), turbidity and salinity of water and pH, EC, total organic materials (TOM), grain size fraction and elements (Al, Ca, Cd, Co, Cr, Cu, Fe, Mg, Mn, Ni, Pb, V and Zn) in sediments were measured. Also, macrobenthos communities were identified in sediments due to their important role in ecosystem health. Subsequently, lithogenous and anthropogenic portions of trace metals in sediment, trace elements bioaccessibility, along with I geo and I POLL indices were measured. According to obtained results, trace elements including Cu (39.5%), Pb (26%), Cr (24.1%), Cd (16.4%) and Zn (13.6%) had highest anthropogenic portion in study area. The two pollution indices used in the present investigation (I geo and I POLL ) are indicative of different pollution intensity in Shadegan aquatic environment. The low pollution intensity values computed by I geo might be acceptable for metals that have low anthropogenic values (less than 15% of their total concentrations). But higher anthropogenic values (16 to almost 40% of total concentration) for other studied metals show that an I POLL pollution intensity formula is more reliable. Moreover, bioaccessibility concentrations amount for Ni, V, Pb and Co had strong and positive meaningful relationship with Cu, Cr and Cd. Key words: Heavy metals, accumulation, aquatic environment, I POLL index, Shadegan wetland. INTRODUCTION The toxicity of heavy metals has long been of great concern since it is very important to the health of people and ecology (Feng et al., 2008). Metals in essential and non-essential forms are naturally persistent in the environment; they accumulate in nature especially in sediments. The toxicity of metals is highly influenced by *Corresponding author. Email: [email protected]. Tel/Fax: 00982144831223. geochemical factors that influence metal bioavailability (Fairbrother et al., 2007; David et al., 2007). Priju and Narayana (2007) showed metal enrichment in top 20 cm of sediment core from Vembanad Lake. Heavy metal pollution was reported for Mengkabong Lagoon as a result of human activities (Praveena et al., 2008). Geochemical reactivity of surficial and core sediment in a tropical mangrove ecosystem was reported by Geetha et al. (2008). They concluded that the top 5 cm of aquatic sediment is very reactive. Chibunda (2009) and Chibunda et al. (2010) reported the inhibition o f larva growth due to
-
Upload
shylesh-nair -
Category
Documents
-
view
218 -
download
0
Transcript of Alhashemi et al

8/3/2019 Alhashemi et al
http://slidepdf.com/reader/full/alhashemi-et-al 1/12
African Journal of Biotechnology Vol. 10(9), pp. 1625-1636, 28 February, 2011Available online at http://www.academicjournals.org/AJBISSN 1684–5315 © 2011 Academic Journals
Full Length Research Paper
Accumulation and bioaccessibility of trace elements inwetland sediments
Azamalsadat Hosseini Alhashemi1*, Abdol Reza Karbassi2, Bahram Hassanzadeh Kiabi3,Seyed Massoud Monavari1 and Mohammad Bagher Nabavi4
1Department of Environmental Science, Graduate School of Environment and Energy, Science and Research Campus,
Islamic Azad University, Tehran, Iran.2Graduate Faculty of Environment, University of Tehran, P.O.Box 14155-6135, Tehran, Iran.
3Department of Marine Biology, Faculty of Biological Sciences, Shahid Beheshti University, G.C., Tehran, Iran.
4Marine Ecobiology Faculty, University of Marine Science and Technology, Khorramshahr, Iran.
Accepted 2 September, 2010
Accumulation of trace metals in sediment can cause severe ecological impacts. In this study,determination of elemental concentrations in water and sediment was done. Shadegan wetland is oneof the most important wetlands in southwest of Iran and is among the Ramsar-listed wetlands.Wastewaters from industries, urban activities and agricultural run off are released into this uniquewetland in the region. In the present investigation, 12 sampling stations were selected for water andsediment collection in Shadegan wetland during winter, 2009. Physico-chemical parameters such aspH, electrical conductivity (EC), turbidity and salinity of water and pH, EC, total organic materials(TOM), grain size fraction and elements (Al, Ca, Cd, Co, Cr, Cu, Fe, Mg, Mn, Ni, Pb, V and Zn) insediments were measured. Also, macrobenthos communities were identified in sediments due to theirimportant role in ecosystem health. Subsequently, lithogenous and anthropogenic portions of tracemetals in sediment, trace elements bioaccessibility, along with Igeo and IPOLL indices were measured.According to obtained results, trace elements including Cu (39.5%), Pb (26%), Cr (24.1%), Cd (16.4%)and Zn (13.6%) had highest anthropogenic portion in study area. The two pollution indices used in thepresent investigation (Igeo and IPOLL) are indicative of different pollution intensity in Shadegan aquaticenvironment. The low pollution intensity values computed by Igeo might be acceptable for metals thathave low anthropogenic values (less than 15% of their total concentrations). But higher anthropogenicvalues (16 to almost 40% of total concentration) for other studied metals show that an I POLL pollutionintensity formula is more reliable. Moreover, bioaccessibility concentrations amount for Ni, V, Pb andCo had strong and positive meaningful relationship with Cu, Cr and Cd.
Key words: Heavy metals, accumulation, aquatic environment, IPOLL index, Shadegan wetland.
INTRODUCTION
The toxicity of heavy metals has long been of greatconcern since it is very important to the health of peopleand ecology (Feng et al., 2008). Metals in essential andnon-essential forms are naturally persistent in theenvironment; they accumulate in nature especially insediments. The toxicity of metals is highly influenced by
*Corresponding author. Email: [email protected]/Fax: 00982144831223.
geochemical factors that influence metal bioavailability(Fairbrother et al., 2007; David et al., 2007). Priju andNarayana (2007) showed metal enrichment in top 20 cmof sediment core from Vembanad Lake. Heavy metapollution was reported for Mengkabong Lagoon as aresult of human activities (Praveena et al., 2008)Geochemical reactivity of surficial and core sediment in atropical mangrove ecosystem was reported by Geetha eal. (2008). They concluded that the top 5 cm of aquaticsediment is very reactive. Chibunda (2009) and Chibundaet al. (2010) reported the inhibition of larva growth due to

8/3/2019 Alhashemi et al
http://slidepdf.com/reader/full/alhashemi-et-al 2/12
1626 Afr. J. Biotechnol.
the presence of Hg in aquatic sediments of Africa. Grainsize is another important factor governing distributions ofheavy metals (Zhipeng et al., 2009; Sundararajan andNatesan, 2010). Also, heavy metals can bioconcentrateand bioaccumulate in the food chain and contribute tochronic toxicity (Ahmad et al., 2010). The inorganic pollu-
tants entering water bodies originate from natural andanthropogenic sources (Mdegela et al., 2009) but theoccurrence of heavy metals in the environment mainlyresults from anthropogenic activities (Zhipeng et al.,2009).
Heavy metals have a potential to contaminate soil andwater, which can be dispersed and accumulated in plantsand animals, and taken in by humans through consu-mption (Wcislo et al., 2002). Sediments, which play boththe source and sink roles, are very important inevaluating the pollution level of heavy metals (Zhipeng etal., 2009; Al-Juboury 2009). Heavy metal contaminationof sediments can critically degrade aquatic systems(Charkhabi et al., 2005). Their release from the sedimentcan make them enter the aquatic ecosystems and bringabout severe problems (Mohammed and Markert, 2006).Despite the differences in toxic effects of the metals, theirconcentrations are reliable indicators of ecosystem health(Singh et al., 2005). Aquatic organisms can bioaccu-mulate, biomagnificate or biotransfer certain metals toconcentrations high enough to bring about harmful effects(Naimo, 1995, Opuene et al., 2008).
In the aquatic environment, sediments have a high sto-rage capacity for contaminants. In the hydrological cycle,less than 0.1% of the metals are actually dissolved in thewater and more than 99.9% are stored in sediments andsoils (Karbassi et al., 2007; Pradit et al., 2009).
Sediments frequently contain higher concentrations ofpollutants. They act as carriers and possible sources ofpollution due to the fact that heavy metals are notpermanently fixed by them and can be released back tothe water by changes in environmental conditions, there-fore they may become sufficiently polluted to disruptnatural biological communities. Contaminated sedimentsare known to be responsible for degradation of waterquality in the natural waters especially in the shallow andenclosed water systems (Toluna et al., 2001; Venugopalet al., 2009) such as wetlands.
The wetland is an important habitat for many kinds ofwildlife (He and Lu, 2001). Wetland habitats contain a
multitude of ecological niches and support a wide varietyof flora and fauna with different ecological functions.Wetlands provide a diversity of habitats for wildlife whichmay include many rare, threatened and endangeredspecies (EPW, 2004). Invertebrate communities areimportant in terms of environmental monitoring biodiv-ersity and ecosystem health. Benthic communities havefrequently been employed in environmental monitoringand assessment of heavy metal, with demonstratedchanges in macro benthic community structure andcomposition in response to pollutant impacts (Macfarlaneand Booth, 2001).
Contamination of aquatic systems from heavy metalshas been an urgent problem worldwide. Spatial surveysof metal contaminant concentrations in sediments are animportant step in understanding and regulating the fateand transport of these contaminants, and distribution othese pollutants is critical for environmental managemen
and decision-making (Liu et al., 2006; Christine et al.2004).To evaluate the heavy metal burden in the environmen
and their impact on the ecosystem, it is usually notsufficient to measure only total concentrations, becausethe mobility, bioavailability and toxicity of metals dependnot only on their total concentrations but also on thegeochemical fractions in which they occur. Also, most ofthe researchers have now realized that the toxicity ofheavy metals has much to do with the bioavailability andnot total concentration (Feng et al., 2008).
In this study, Shadegan wetland is selected for determination of trace elements in sediments and identification onatural and anthropogenic sources shares because otrace elements transfer in upper levels of food chains thatcan contribute to toxic levels. Also, some animals andplants species that live in this wetland ecosystem arelisted in the International Union for Conservation oNature (IUCN) red list. For this purpose Cr, Cd, Cu, ZnPb, Fe, Al, Mn, Ni, V, Co and Mg were measured in thestudy area. In addition to the above, the determination ofthe following parameters were carried out in this studySediment physical structure, trace elements concentration in sediment and water, lithogenous and anthropogenic portion of metals, concentration of bio-accessibilityof trace elements, distribution of macrobenthos community and total organic materials (TOM) in all sediments
modification of IPOLL pollution intensity index andstatistical analysis of relationships amongst differenparameters in Shadegan wetland.
MATERIALS AND METHODS
Study area and sampling stations
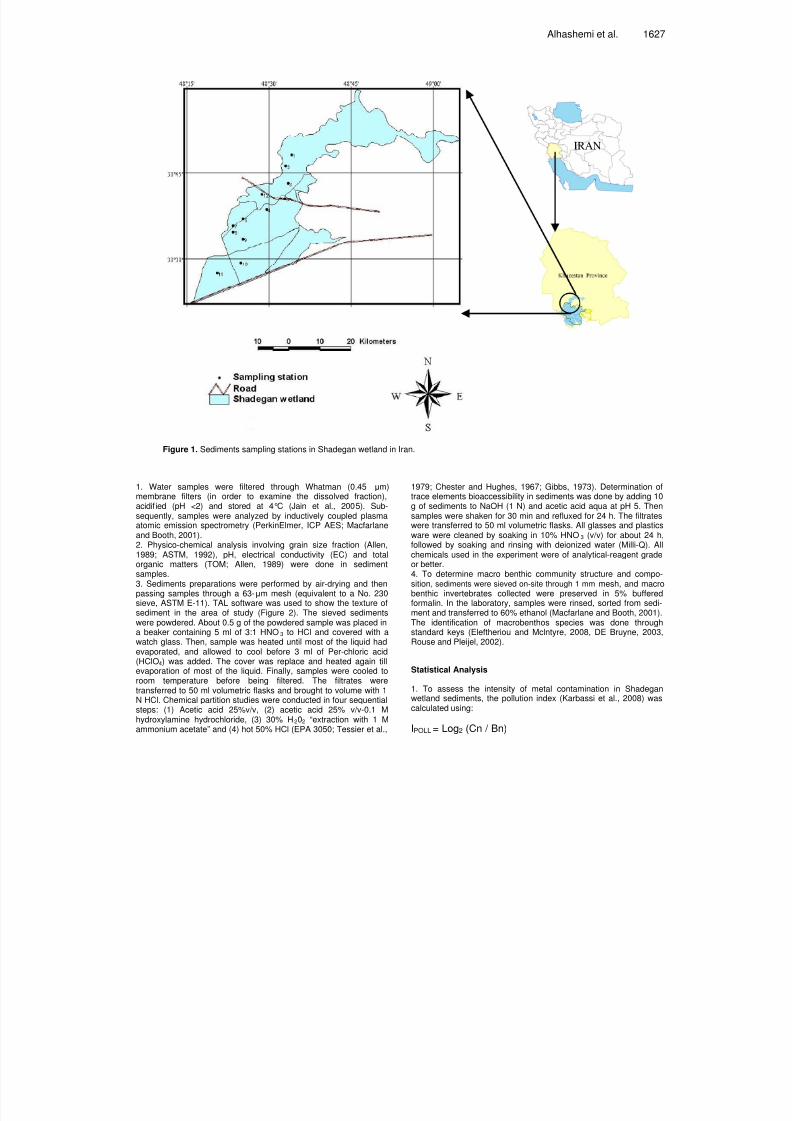
Shadegan wetland is one of the most important wetlands that islocated in southwest of Iran. It has a very important role of conser-ving fauna and flora in this area. A lot of polluting industries such aspetrochemical complexes (about 10 petrochemical complexes)release their wastewater in this wetland. Also, urban and agriculturerun-off pour into this aquatic ecosystem. In this study, 12 sedimentssampling stations were selected. Figure 1 shows Shadegan wetl-and location in Iran and sediments sampling stations in the area ostudy.
Analytical methods
Sediment and water sampling was done during winter, 2009Surface sediment was collected using a Peterson grab sampler. Inthe same site, two replicate samples for benthic invertebrate com-munity assessment were collected. After transportation of samplesto laboratory under quality control standards, main parameters weremeasured as follows:
8/3/2019 Alhashemi et al
http://slidepdf.com/reader/full/alhashemi-et-al 3/12
Alhashemi et al. 1627
IRAN
Figure 1. Sediments sampling stations in Shadegan wetland in Iran.
1. Water samples were filtered through Whatman (0.45 m)membrane filters (in order to examine the dissolved fraction),acidif ied (pH <2) and stored at 4°C (Jain et al., 2005). Sub-sequently, samples were analyzed by inductively coupled plasmaatomic emission spectrometry (PerkinElmer, ICP AES; Macfarlaneand Booth, 2001).2. Physico-chemical analysis involving grain size fraction (Allen,1989; ASTM, 1992), pH, electrical conductivity (EC) and totalorganic matters (TOM; Allen, 1989) were done in sedimentsamples.3. Sediments preparations were performed by air-drying and thenpassing samples through a 63-m mesh (equivalent to a No. 230
sieve, ASTM E-11). TAL software was used to show the texture ofsediment in the area of study (Figure 2). The sieved sedimentswere powdered. About 0.5 g of the powdered sample was placed ina beaker containing 5 ml of 3:1 HNO3 to HCl and covered with awatch glass. Then, sample was heated until most of the liquid hadevaporated, and allowed to cool before 3 ml of Per-chloric acid(HClO4) was added. The cover was replace and heated again tillevaporation of most of the liquid. Finally, samples were cooled toroom temperature before being filtered. The filtrates weretransferred to 50 ml volumetric flasks and brought to volume with 1N HCl. Chemical partition studies were conducted in four sequentialsteps: (1) Acetic acid 25%v/v, (2) acetic acid 25% v/v-0.1 Mhydroxylamine hydrochloride, (3) 30% H202 “extraction with 1 Mammonium acetate” and (4) hot 50% HCl (EPA 3050; Tessier et al.,
1979; Chester and Hughes, 1967; Gibbs, 1973). Determination otrace elements bioaccessibility in sediments was done by adding 10g of sediments to NaOH (1 N) and acetic acid aqua at pH 5. Thensamples were shaken for 30 min and refluxed for 24 h. The filtrateswere transferred to 50 ml volumetric flasks. All glasses and plasticsware were cleaned by soaking in 10% HNO3 (v/v) for about 24 hfollowed by soaking and rinsing with deionized water (Milli-Q). Alchemicals used in the experiment were of analytical-reagent gradeor better.4. To determine macro benthic community structure and composition, sediments were sieved on-site through 1 mm mesh, and macrobenthic invertebrates collected were preserved in 5% buffered
formalin. In the laboratory, samples were rinsed, sorted from sedi-ment and transferred to 60% ethanol (Macfarlane and Booth, 2001)The identification of macrobenthos species was done throughstandard keys (Eleftheriou and Mclntyre, 2008, DE Bruyne, 2003Rouse and Pleijel, 2002).
Statistical Analysis
1. To assess the intensity of metal contamination in Shadeganwetland sediments, the pollution index (Karbassi et al., 2008) wascalculated using:
IPOLL = Log2 (Cn / Bn)
8/3/2019 Alhashemi et al
http://slidepdf.com/reader/full/alhashemi-et-al 4/12
1628 Afr. J. Biotechnol.
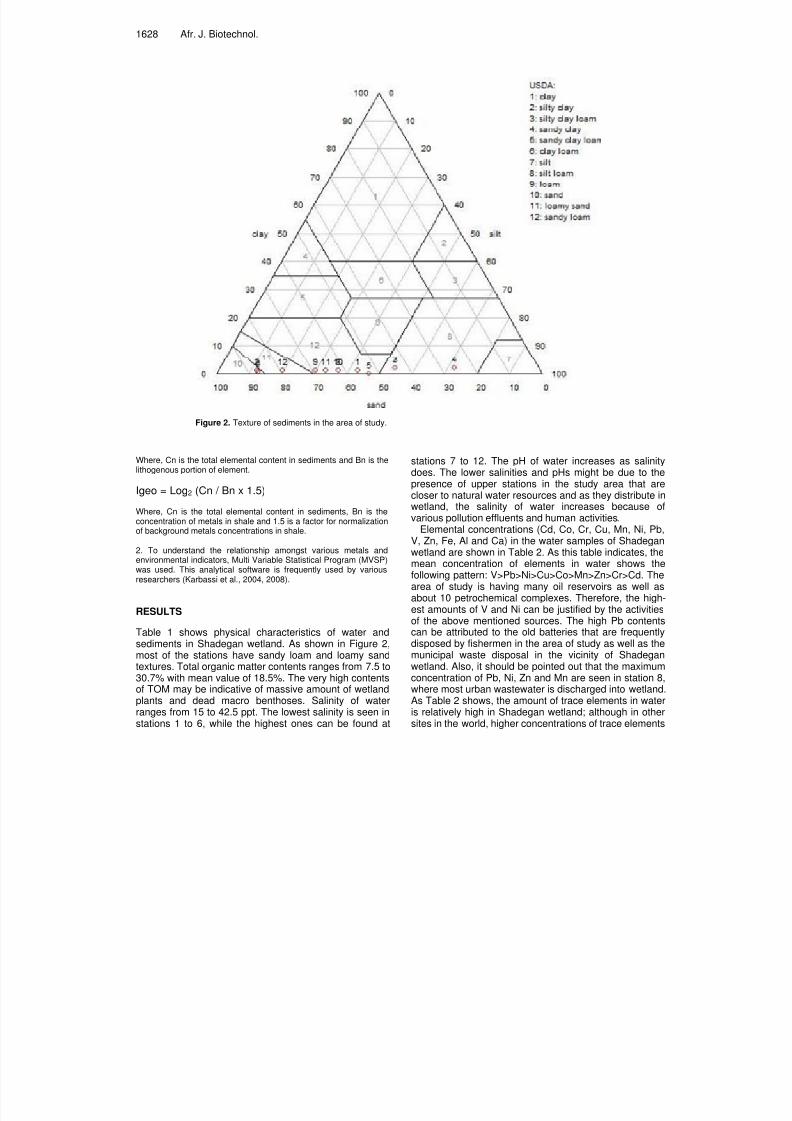
Figure 2. Texture of sediments in the area of study.
Where, Cn is the total elemental content in sediments and Bn is thelithogenous portion of element.
Igeo = Log2 (Cn / Bn x 1.5)
Where, Cn is the total elemental content in sediments, Bn is theconcentration of metals in shale and 1.5 is a factor for normalizationof background metals concentrations in shale.
2. To understand the relationship amongst various metals andenvironmental indicators, Multi Variable Statistical Program (MVSP)was used. This analytical software is frequently used by variousresearchers (Karbassi et al., 2004, 2008).
RESULTS
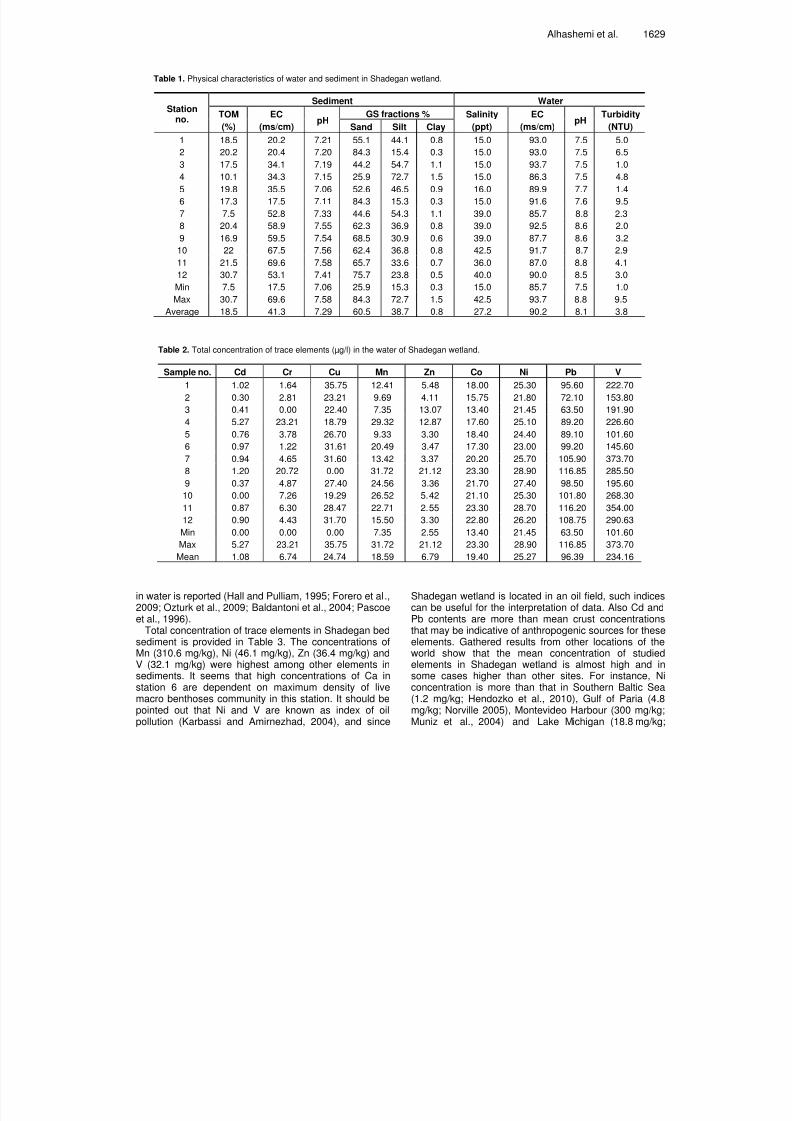
Table 1 shows physical characteristics of water andsediments in Shadegan wetland. As shown in Figure 2,most of the stations have sandy loam and loamy sandtextures. Total organic matter contents ranges from 7.5 to30.7% with mean value of 18.5%. The very high contentsof TOM may be indicative of massive amount of wetlandplants and dead macro benthoses. Salinity of waterranges from 15 to 42.5 ppt. The lowest salinity is seen instations 1 to 6, while the highest ones can be found at
stations 7 to 12. The pH of water increases as salinitydoes. The lower salinities and pHs might be due to thepresence of upper stations in the study area that arecloser to natural water resources and as they distribute inwetland, the salinity of water increases because ovarious pollution effluents and human activities.
Elemental concentrations (Cd, Co, Cr, Cu, Mn, Ni, PbV, Zn, Fe, Al and Ca) in the water samples of Shadeganwetland are shown in Table 2. As this table indicates, themean concentration of elements in water shows thefollowing pattern: V>Pb>Ni>Cu>Co>Mn>Zn>Cr>Cd. Thearea of study is having many oil reservoirs as well asabout 10 petrochemical complexes. Therefore, the high
est amounts of V and Ni can be justified by the activitiesof the above mentioned sources. The high Pb contentscan be attributed to the old batteries that are frequentlydisposed by fishermen in the area of study as well as themunicipal waste disposal in the vicinity of Shadeganwetland. Also, it should be pointed out that the maximumconcentration of Pb, Ni, Zn and Mn are seen in station 8where most urban wastewater is discharged into wetlandAs Table 2 shows, the amount of trace elements in wateis relatively high in Shadegan wetland; although in othersites in the world, higher concentrations of trace elements
8/3/2019 Alhashemi et al
http://slidepdf.com/reader/full/alhashemi-et-al 5/12
Alhashemi et al. 1629
Table 1. Physical characteristics of water and sediment in Shadegan wetland.
Stationno.
Sediment Water
TOM
(%)
EC
(ms/cm)pH
GS fractions % Salinity
(ppt)
EC
(ms/cm)pH
Turbidity
(NTU)Sand Silt Clay
1 18.5 20.2 7.21 55.1 44.1 0.8 15.0 93.0 7.5 5.0
2 20.2 20.4 7.20 84.3 15.4 0.3 15.0 93.0 7.5 6.53 17.5 34.1 7.19 44.2 54.7 1.1 15.0 93.7 7.5 1.0
4 10.1 34.3 7.15 25.9 72.7 1.5 15.0 86.3 7.5 4.8
5 19.8 35.5 7.06 52.6 46.5 0.9 16.0 89.9 7.7 1.4
6 17.3 17.5 7.11 84.3 15.3 0.3 15.0 91.6 7.6 9.5
7 7.5 52.8 7.33 44.6 54.3 1.1 39.0 85.7 8.8 2.3
8 20.4 58.9 7.55 62.3 36.9 0.8 39.0 92.5 8.6 2.0
9 16.9 59.5 7.54 68.5 30.9 0.6 39.0 87.7 8.6 3.2
10 22 67.5 7.56 62.4 36.8 0.8 42.5 91.7 8.7 2.9
11 21.5 69.6 7.58 65.7 33.6 0.7 36.0 87.0 8.8 4.1
12 30.7 53.1 7.41 75.7 23.8 0.5 40.0 90.0 8.5 3.0
Min 7.5 17.5 7.06 25.9 15.3 0.3 15.0 85.7 7.5 1.0
Max 30.7 69.6 7.58 84.3 72.7 1.5 42.5 93.7 8.8 9.5Average 18.5 41.3 7.29 60.5 38.7 0.8 27.2 90.2 8.1 3.8
Table 2. Total concentration of trace elements (µg/l) in the water of Shadegan wetland.
Sample no. Cd Cr Cu Mn Zn Co Ni Pb V
1 1.02 1.64 35.75 12.41 5.48 18.00 25.30 95.60 222.70
2 0.30 2.81 23.21 9.69 4.11 15.75 21.80 72.10 153.80
3 0.41 0.00 22.40 7.35 13.07 13.40 21.45 63.50 191.90
4 5.27 23.21 18.79 29.32 12.87 17.60 25.10 89.20 226.60
5 0.76 3.78 26.70 9.33 3.30 18.40 24.40 89.10 101.60
6 0.97 1.22 31.61 20.49 3.47 17.30 23.00 99.20 145.60
7 0.94 4.65 31.60 13.42 3.37 20.20 25.70 105.90 373.70
8 1.20 20.72 0.00 31.72 21.12 23.30 28.90 116.85 285.50
9 0.37 4.87 27.40 24.56 3.36 21.70 27.40 98.50 195.60
10 0.00 7.26 19.29 26.52 5.42 21.10 25.30 101.80 268.30
11 0.87 6.30 28.47 22.71 2.55 23.30 28.70 116.20 354.00
12 0.90 4.43 31.70 15.50 3.30 22.80 26.20 108.75 290.63
Min 0.00 0.00 0.00 7.35 2.55 13.40 21.45 63.50 101.60
Max 5.27 23.21 35.75 31.72 21.12 23.30 28.90 116.85 373.70
Mean 1.08 6.74 24.74 18.59 6.79 19.40 25.27 96.39 234.16
in water is reported (Hall and Pulliam, 1995; Forero et al.,
2009; Ozturk et al., 2009; Baldantoni et al., 2004; Pascoeet al., 1996).
Total concentration of trace elements in Shadegan bedsediment is provided in Table 3. The concentrations ofMn (310.6 mg/kg), Ni (46.1 mg/kg), Zn (36.4 mg/kg) andV (32.1 mg/kg) were highest among other elements insediments. It seems that high concentrations of Ca instation 6 are dependent on maximum density of livemacro benthoses community in this station. It should bepointed out that Ni and V are known as index of oilpollution (Karbassi and Amirnezhad, 2004), and since
Shadegan wetland is located in an oil field, such indices
can be useful for the interpretation of data. Also Cd andPb contents are more than mean crust concentrationsthat may be indicative of anthropogenic sources for theseelements. Gathered results from other locations of theworld show that the mean concentration of studiedelements in Shadegan wetland is almost high and insome cases higher than other sites. For instance, Nconcentration is more than that in Southern Baltic Sea(1.2 mg/kg; Hendozko et al., 2010), Gulf of Paria (4.8mg/kg; Norville 2005), Montevideo Harbour (300 mg/kgMuniz et al., 2004) and Lake Michigan (18.8 mg/kg

8/3/2019 Alhashemi et al
http://slidepdf.com/reader/full/alhashemi-et-al 6/12
1630 Afr. J. Biotechnol.
Table 3. Total concentration of trace elements in Shadegan wetland sediments.
Station no.Cd Cr Cu Co Mn Ni Pb V Zn Ca Al Fe
mg/kg %
1 4.9 7.4 18.3 10.8 222.0 58.1 11.3 31.7 33.7 1.4 1.8 1.9
2 5.0 8.1 28.3 14.1 340.0 74.0 16.4 50.6 39.1 2.2 2.7 2.4
3 5.0 9.4 33.8 17.4 420.1 24.7 18.8 58.8 44.4 2.3 3.1 3.24 4.9 7.4 18.9 12.1 332.2 33.5 16.1 31.5 37.4 1.5 2.3 2.2
5 4.8 7.8 20.1 11.9 292.3 79.2 15.7 43.8 33.9 1.3 2 2.3
6 5.5 7.2 14.7 9.9 306.7 62.5 16.1 30.5 29.6 9.4 1.6 1.8
7 4.8 49.1 4.9 10.2 353.4 66.1 10.4 29.0 96.3 1.9 2.2 1.9
8 3.8 2.1 6.0 7.0 335.3 40.5 12.7 24.8 25.7 2 2.1 1.2
9 3.8 13.4 4.6 8.9 365.2 50.1 13.3 23.4 35.2 2.2 2.1 1.5
10 3.8 24.4 13.0 7.4 304.6 31.7 12.2 21.9 30.9 2 1.6 0.1
11 4.9 5.8 6.4 3.8 302.6 17.8 10.7 19.0 12.4 2.4 1.1 0.6
12 4.7 6.3 8.3 5.8 153.1 27.6 17.2 20.5 18.8 2.6 1.3 0.9
Min 3.8 2.1 4.6 3.8 153.1 17.8 10.4 19.0 12.4 1.3 1.1 0.1
Max 5.5 49.1 33.8 17.4 420.1 79.2 18.8 58.8 96.3 9.4 3.1 3.2
Mean 4.7 12.4 14.8 9.9 310.6 47.1 14.2 32.1 36.4 2.6 2.0 1.7Mean crusta
0.3 100 25 50 - 75 14 135 75 4.1 8.2 4.6
aBowen, 1979.
Table 4. Bioaccessibility concentration of trace elements (mg/kg) in Shadegan sediments.
Station no. Cd Cr Cu Co Mn Ni Pb Zn V Ca Mg
1 0.23 0.29 0.34 0.10 7.55 0.14 0.33 0.23 0.57 16.97 5.44
2 0.23 0.28 0.35 0.11 4.71 0.15 0.35 0.20 0.61 12.70 5.31
3 0.23 0.28 0.34 0.09 7.48 0.13 0.33 0.17 0.70 12.93 5.47
4 0.23 0.18 0.25 0.11 0.33 0.13 0.52 0.17 0.81 16.55 9.01
5 0.23 0.28 0.35 0.10 6.93 0.12 0.25 0.18 0.65 16.20 9.47
6 0.23 0.29 0.35 0.11 6.20 0.15 0.00 0.16 0.71 17.15 7.23
7 0.23 0.30 0.37 0.37 3.66 0.28 0.92 0.15 1.95 14.85 8.58
8 0.23 0.34 0.42 0.82 5.21 0.73 3.43 0.15 3.98 16.45 7.99
9 0.25 0.33 0.51 0.79 5.84 0.92 5.12 0.18 3.92 12.25 3.87
10 0.22 0.26 0.27 0.05 22.66 0.09 0.14 0.29 0.48 16.43 8.47
11 0.23 0.26 0.27 0.10 16.18 0.11 0.45 0.26 0.80 14.85 8.44
12 0.22 0.26 0.26 0.11 13.00 0.13 0.57 0.27 0.78 19.50 8.28
Min 0.22 0.18 0.25 0.05 0.33 0.09 0.00 0.15 0.48 12.25 3.87
Max 0.25 0.34 0.51 0.82 22.66 0.92 5.12 0.29 3.98 19.50 9.47
Mean 0.23 0.28 0.34 0.24 8.31 0.26 1.03 0.20 1.33 15.57 7.30
Carter et al., 2006). Also, Cd content is higher than that inQatar and Bahrain coastal sediments (0.9 and 0.18mg/kg respectively; Mora et al., 2004). Accumulation ofCo in Shadegan sediment is more than other sites(Hendozko et al., 2010; Mora et al., 2004). In addition, Vand Mn concentrations are significantly higher than othersites near Persian Gulf and Oman Sea (Mora et al.,2004). But in Milltown Reservoir Wetland, the concen-tration of Zn (1426 mg/kg; Pascoe et al., 1996) is higherthan that of the study area. Generally, it seems thatrelease of various contaminants such as industrial,
agricultural and urban waste waters in Shadeganwetland, led to high accumulation of most of the studiedtrace elements than other sites in the world.
Generally, bioaccessibility of trace elements in sediment are low except for Ca (15.57 mg/kg), Mg (7.30mg/kg), Mn (8.31 mg/kg), V (1.33 mg/kg) and Pb (1.03mg/kg) (Table 4). The higher concentrations of Ca, Mgand Mn may not pose environmental risks since they areconsidered as essential elements for the growth of organisms (Freitas et al., 2006). The results of the three-stepchemical partitioning for trace elements are shown in

8/3/2019 Alhashemi et al
http://slidepdf.com/reader/full/alhashemi-et-al 7/12

8/3/2019 Alhashemi et al
http://slidepdf.com/reader/full/alhashemi-et-al 8/12
1632 Afr. J. Biotechnol.
Table 6. Comparison of anthropogenic portion of trace elements in Shadegan sediments (% of anthropogenic to totalcontents of metals in bulk digestion).
Station no. Cd Cr Co Cu Mn Ni Pb V Zn
1 22.4 24.3 0.0 16.1 0.0 0.0 39.1 3.1 9.8
2 14.0 27.2 0.0 7.6 0.0 0.0 15.5 1.5 3.6
3 12.0 18.1 0.0 0.9 0.0 7.3 7.7 1.1 0.94 14.3 32.4 0.0 10.4 0.0 0.0 12.4 7.5 87.4
5 14.6 25.6 0.0 10.4 0.0 0.0 24.8 0.7 10.0
6 16.4 31.9 0.0 15.3 0.5 0.0 21.0 3.4 5.7
7 14.6 4.5 0.0 86.7 0.0 0.0 37.1 3.9 0.0
8 21.1 85.7 0.0 87.7 0.0 0.0 25.3 9.7 9.7
9 21.1 9.7 0.0 88.4 0.0 0.0 39.7 2.8 4.5
10 18.8 6.1 4.9 60.5 0.0 0.0 32.4 11.6 7.8
11 12.2 12.1 5.3 49.3 4.3 0.0 25.9 10.2 16.9
12 14.9 11.1 0.6 39.9 0.0 0.0 31.1 16.9 6.9
Min 12.0 4.5 0.0 0.9 0.0 0.0 7.7 0.7 0.0
Max 22.4 85.7 5.3 88.4 4.3 7.3 39.7 16.9 87.4
Mean 16.4 24.1 0.9 39.5 0.4 0.6 26.0 6.0 13.6
0
5
10
15
20
25
30
35
40
45
Cd Mn Ni Cr Zn Pb Cu Co V
A n t h r o p o g e n i c p o r t i o n ( % )
.
Figure 3. Anthropogenic percentage of trace elements in bed sediments of Shadegan wetland.
show higher values for Mn and therefore higher pollutionintensity is found by IPOLL.
DISCUSSION
Figure 4 shows relationships between metals andphysical parameters in the water of Shadegan wetland. Itis clear that Co, Ni, Pb and V are strongly related to pH
and salinity characteristics in water (cluster "B"). Cluster"A" shows similar relationships amongst Cd, Cr, Mn andZn in water of Shadegan wetland. Also, turbidity and Cuhave same behavior although this is quiet weak. Base onbioaccessibility cluster analysis, most of the traceelements (Pb, Ni, V, Co, Cu, Cr and Cd) have samebehavior and positive strong relation (cluster "A"). Ireveals that increase in pollution discharge in the studyarea can enhance adsorption of trace elements in

8/3/2019 Alhashemi et al
http://slidepdf.com/reader/full/alhashemi-et-al 9/12
Alhashemi et al. 1633
Table 7. Number of collected macro benthoses in sediments of Shadegan wetland.
Macrobenthos Station no.
1 2 3 4 5 6 7 8 9 12
Chironomidae 3 31 13 11 0 130 13 0 10 15
Strachoda 0 15 16 3 0 17 0 0 0 1
Nematoda 0 20 0 0 1 2 0 0 0 0Oligochaete 0 6 0 2 0 87 0 0 0 0
Dead Gastropoda 350 100 100 50 200 80 0 50 30 0
Dead Strachoda 0 0 500 30 150 100 0 0 0 300
Sum 353 172 629 96 351 416 13 50 40 316
Table 8. Comparison of different pollution indices in Shadegan wetland sediments.
Trace element Cd Cr Cu Co Mn Ni Pb V Zn
Igeo 3.4 0.0 0.0 0.0 0.0 0.0 0.0 0.0 0.0
IPOLL 2.6 2.9 2.2 0.00 8 7.9 2.0 4.4 3.0
Figure 4. Dendogram of cluster analysis amongst trace elements in water of Shadegan wetland.
organisms. Relationship amongst different trace elementsin sediments is shown in Figure 5. Cluster "B" involvingCu, Co, V, Fe, Al and Pb have a significant similarity co-efficient and same behavior. In addition, Mn has positivemeaningful relationship by other elements in cluster "B"but this is relatively weak. Also, Ca and Cd have positiverelation with each other in cluster "A" but in cluster "C", Crand Zn have strong positive meaningful relationship.Moreover, Figure 5 reveals that TOM (cluster "D") doesnot have any relation with other parameters. Figure 6
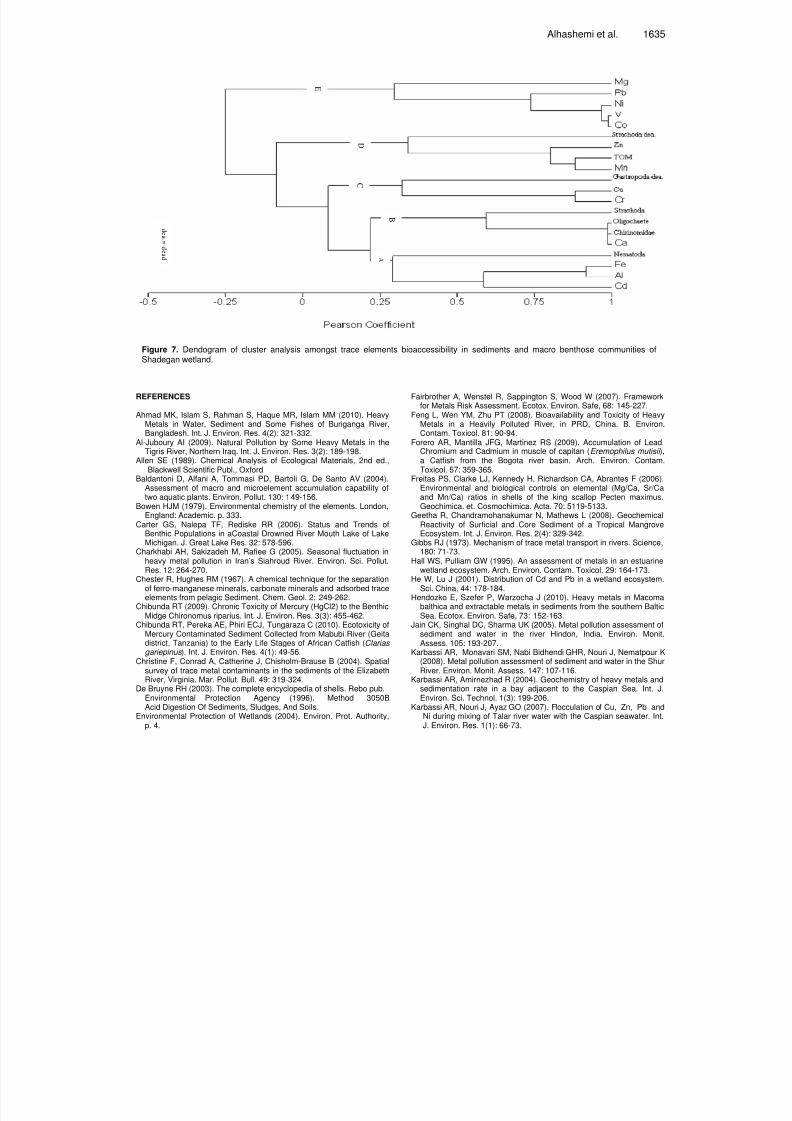
presents the cluster analysis of trace elements bioaccessibility in sediments of Shadegan wetland. Traceelements of cluster "A" have high positive relationship toeach others. Beside, cluster "C" shows that Zn and Mnhave positive meaningful relationships with TOM. Alsoas Figure 7 shows, Strachoda, Chironomidae and Oligo-chaete are related to Ca accumulation in sediments(cluster "B"). Based on clusters "C" and "D", deadStrachoda and Gastropoda are linked to Cu and Cr andZn, TOM and Mn, respectively. Beside, Nematoda has

8/3/2019 Alhashemi et al
http://slidepdf.com/reader/full/alhashemi-et-al 10/12
1634 Afr. J. Biotechnol.
Figure 5. Dendogram of cluster analysis amongst trace elements in sediments of Shadegan wetland.
A
B
C
D
Figure 6. Dendogram of cluster analysis for trace elements bioaccessibility in sediments of Shadegan wetland.
positive relationship with Fe, Al and Cd (cluster "A"),probably, because Shadegan benthic invertebrates aresensitive to other pollution sources such as toxicmaterials and oil contaminants.
To sum up the findings, we concluded that the textureof sediments in the Shadegan wetland falls within sandyloam and silt loam. The salinity of water ranges from 15to 42.5 ppt. The general pattern of dissolved elementalconcentrations (V>Pb>Ni>Cu>Co>Mn>Zn>Cr>Cd) doesnot show any anomaly.
Calcium contents of sediments are highlydependent onthe density of macro benthos community. The low con-centrations of calcium could be indicative of lower
biological productivity in the area of study. The results othe present investigation clearly showed that comparisonof metals in the sediment with mean crust cannot furnishuseful information. The obtained results clearly show thatoil pollution has led to severe pollution in the wetlandThe results of the present study also show that IPOL
index can be effectively used to show environmentapollution more meaningfully. Since IPOLL uses backgroundconcentrations of metals within the area of study, itprovides better results than other pollution indicesThough cluster analysis is an efficient tool to know theinter relationship amongst various parameters, it fails toprovide quantitative information.
8/3/2019 Alhashemi et al
http://slidepdf.com/reader/full/alhashemi-et-al 11/12
Alhashemi et al. 1635
A
B
C
D
E
d e a .=
d e a d
Figure 7. Dendogram of cluster analysis amongst trace elements bioaccessibility in sediments and macro benthose communities ofShadegan wetland.
REFERENCES
Ahmad MK, Islam S, Rahman S, Haque MR, Islam MM (2010). HeavyMetals in Water, Sediment and Some Fishes of Buriganga River,Bangladesh. Int. J. Environ. Res. 4(2): 321-332.
Al-Juboury AI (2009). Natural Pollution by Some Heavy Metals in the
Tigris River, Northern Iraq. Int. J. Environ. Res. 3(2): 189-198.Allen SE (1989). Chemical Analysis of Ecological Materials, 2nd ed.,Blackwell Scientific Publ., Oxford.
Baldantoni D, Alfani A, Tommasi PD, Bartoli G, De Santo AV (2004).Assessment of macro and microelement accumulation capability oftwo aquatic plants. Environ. Pollut. 130: 149-156.
Bowen HJM (1979). Environmental chemistry of the elements. London,England: Academic. p. 333.
Carter GS, Nalepa TF, Rediske RR (2006). Status and Trends ofBenthic Populations in aCoastal Drowned River Mouth Lake of LakeMichigan. J. Great Lake Res. 32: 578-596.
Charkhabi AH, Sakizadeh M, Rafiee G (2005). Seasonal fluctuation inheavy metal pollution in Iran’s Siahroud River. Environ. Sci. Pollut.Res. 12: 264-270.
Chester R, Hughes RM (1967). A chemical technique for the separationof ferro-manganese minerals, carbonate minerals and adsorbed traceelements from pelagic Sediment. Chem. Geol. 2: 249-262.
Chibunda RT (2009). Chronic Toxicity of Mercury (HgCl2) to the BenthicMidge Chironomus riparius. Int. J. Environ. Res. 3(3): 455-462.
Chibunda RT, Pereka AE, Phiri ECJ, Tungaraza C (2010). Ecotoxicity ofMercury Contaminated Sediment Collected from Mabubi River (Geitadistrict, Tanzania) to the Early Life Stages of African Catfish (Clarias gariepinus ). Int. J. Environ. Res. 4(1): 49-56.
Christine F, Conrad A, Catherine J, Chisholm-Brause B (2004). Spatialsurvey of trace metal contaminants in the sediments of the ElizabethRiver, Virginia. Mar. Pollut. Bull. 49: 319-324.
De Bruyne RH (2003). The complete encyclopedia of shells. Rebo pub.Environmental Protection Agency (1996). Method 3050BAcid Digestion Of Sediments, Sludges, And Soils.
Environmental Protection of Wetlands (2004). Environ. Prot. Authority,p. 4.
Fairbrother A, Wenstel R, Sappington S, Wood W (2007). Frameworkfor Metals Risk Assessment. Ecotox. Environ. Safe, 68: 145-227.
Feng L, Wen YM, Zhu PT (2008). Bioavailability and Toxicity of HeavyMetals in a Heavily Polluted River, in PRD, China. B. EnvironContam. Toxicol. 81: 90-94.
Forero AR, Mantilla JFG, Martinez RS (2009). Accumulation of Lead
Chromium and Cadmium in muscle of capitan (Eremophilus mutisii )a Catfish from the Bogota river basin. Arch. Environ. ContamToxicol. 57: 359-365.
Freitas PS, Clarke LJ, Kennedy H, Richardson CA, Abrantes F (2006)Environmental and biological controls on elemental (Mg/Ca, Sr/Caand Mn/Ca) ratios in shells of the king scallop Pecten maximusGeochimica. et. Cosmochimica. Acta. 70: 5119-5133.
Geetha R, Chandramohanakumar N, Mathews L (2008). GeochemicaReactivity of Surficial and Core Sediment of a Tropical MangroveEcosystem. Int. J. Environ. Res. 2(4): 329-342.
Gibbs RJ (1973). Mechanism of trace metal transport in rivers. Science180: 71-73.
Hall WS, Pulliam GW (1995). An assessment of metals in an estuarinewetland ecosystem. Arch. Environ. Contam. Toxicol. 29: 164-173.
He W, Lu J (2001). Distribution of Cd and Pb in a wetland ecosystemSci. China, 44: 178-184.
Hendozko E, Szefer P, Warzocha J (2010). Heavy metals in Macoma
balthica and extractable metals in sediments from the southern BalticSea. Ecotox. Environ. Safe, 73: 152-163.
Jain CK, Singhal DC, Sharma UK (2005). Metal pollution assessment ofsediment and water in the river Hindon, India. Environ. MonitAssess. 105: 193-207.
Karbassi AR, Monavari SM, Nabi Bidhendi GHR, Nouri J, Nematpour K(2008). Metal pollution assessment of sediment and water in the ShuRiver. Environ. Monit. Assess. 147: 107-116.
Karbassi AR, Amirnezhad R (2004). Geochemistry of heavy metals andsedimentation rate in a bay adjacent to the Caspian Sea. Int. JEnviron. Sci. Technol. 1(3): 199-206.
Karbassi AR, Nouri J, Ayaz GO (2007). Flocculation of Cu, Zn, Pb andNi during mixing of Talar river water with the Caspian seawater. IntJ. Environ. Res. 1(1): 66-73.

8/3/2019 Alhashemi et al
http://slidepdf.com/reader/full/alhashemi-et-al 12/12
1636 Afr. J. Biotechnol.
Leftherio A, Mclntyre A (2008). Methods for the study of marinebenthos. Wiley-Blackwell pub.
Li F, Wei XG, Yu GH, Wen YM, He SY, Zhang L, Luo HP, Huang YY,Ren LL (2006). The investigation on the present situations of heavymetal pollution of sediments in Foshan Waterway. Adm. Tech.Environ. Monit. 18: 12-18.
Liu XM, Wu JJ, Xu JM (2006). Characterizing the risk assessment ofheavy metals and sampling uncertainty analysis in paddy field by
geostatistics and GIS. Environ. Pollut. 141: 257-264.Macfarlane GR, Booth DJ (2001). Estuarine macro benthic community
structure in the Hawkesbury river, Australia: relationships withsediment physicochemical and anthropogenic parameters. Environ.Monit. Assess. 72: 51-78.
Mdegela RH, Braathen M, Pereka AE, Mosha RD, Sandvik M, SkaareJU (2009). Heavy Metals and Organochlorine Residues in Water,Sediments, and Fish in Aquatic Ecosystems in Urban and Peri-UrbanAreas in Tanzania. Water Air Soil Pollut. 203: 369-379.
Mohammed MH, Markert B (2006). Toxicity of heavy metals onScenedesmus quadricauda (Turp.) de Brebisson in batch cultures.Environ. Sci. Pollut. Res. 13: 98-104.
Mora S, Fowler SW, Wyse E, Azemard S (2004). Distribution of heavymetals in marine bivalves, fish and coastal sediments in the Gulf andGulf of Oman. Mar. Pollut. Bull. 49: 410-424.
Muniz P, Danulat E, Yannicelli B, Garcia-Alonso J, Medina G, BicegoMC (2004). Assessment of contamination by heavy metals andpetroleum hydrocarbons in sediments of Montevideo Harbour(Uruguay). Environ. Int. 29: 1019-1028.
Naimo TJ (1995). A review of the effects of heavy-metals on freshwatermussels. Ecotoxicology, 4: 341-362.
Norville W (2005). Spatial distribution of heavy metals in sediments fromthe Gulf of Paria, Trinidad. Int. J. Trop. Biol. 53: 33-40.
Opuene K, Okafor EC, Agbozu E (2008). Partitioning Characteristics ofHeavy Metals in a Non-Tidal Freshwater Ecosystem. Int. J. Environ.Res. 2(3): 285-290.
Ozturk M, Ozozen G, Minareci O, Minareci E (2009). Determination ofheavy metals in fish, water and sediments of Avsar dam lake inTurkey. Iranian J. Environ. Heal. Sci. 6: 73-80.
Pascoe GA, Blanchet RJ, Linder G (1996). Food chain analysis ofexposures and risks to wildlife at a metals-contaminated wetland.Arch. Environ. Contam. 30: 306-318.
Pradit S, Wattayakorn G, Angsupanich S, Baeyens W, Leermakers M
(2009). Distribution of Trace Elements in Sediments and Biota ofSongkhla Lake, Southern Thailand. Water Air Soil Pollut. 22 MAY.
Praveena SM, Ahmed A, Radojevic M, Abdullah MH, Aris AZ (2008)Heavy Metals in Mangrove Surface Sediment of MengkabongLagoon, Sabah: Multivariate and Geo-Accumulation IndexApproaches. Int. J. Environ. Res. 2(2): 139-148.
Priju CP, Narayana AC (2007). Heavy and Trace Metals in VembanadLake Sediments. Int. J. Environ. Res. 1(4): 280-289.
Rouse GW, Pleijel F (2002). Polychaetes. Oxford university press.Singh KP, Mohan D, Singh VK, Malik A (2005). Studies on distribution
and fractionation of heavy metals in Gomti river sediments-a tributaryof the Ganges, India. J. Hydrol. (Amst). 312: 14-27.
Sundararajan M, Natesan U (2010). Environmental Significance inRecent Sediments Along Bay of Bengal and Palk Strait, East Coasof India: A Geochemical Approach. Int. J. Environ. Res. 4(1): 99-120.
Tessier A, Campell PGC, Bisson M (1979). Sequential extractionprocedure for the speciation of partition of particulate trace metalsAnal. Chem. 51: 844-851.
Toluna LG, Okaya OS, Gainesb AF, Tolayc M, Tuefekceia H, KoratlodN (2001). The pollution status and the toxicity of surface sediments inIzmit Bay (Marmara Sea), Turkey. Environ. Int. 26 : 63-168.
Venugopal T, Giridharan L, Jayaprakash M (2009). Characterizationand Risk Assessment Studies of Bed Sediments of River Adyar-AnApplication of Speciation Study. Int. J. Environ. Res. 3(4): 581-598.
Wcislo E, Ioven D, Kucharski R, Szdzuj J (2002). Human health riskassessment case study: an abandoned metal smelter site in PolandChemosphere, 47: 507-515.
Zhipeng H, Jinming S, Naixing Z, Peng Z, Yayan X (2009). Variationcharacteristics and ecological risk of heavy metals in the southYellow Sea surface sediments. Environ. Monit. Assess. 157: 515528.