Algorithm for Size Statistic and Clustering of Block Image...
5
Algorithm for Size Statistic and Clustering of Block Image Sequences Li Cong 1, a , Zou Shaoli 2, b 1 No 106 Jiweit Road, School of Electrical Engineering, University of Jinan, Jinan, China 2 No 5 Shanda Road, A judge in Shandong Training College, Jinan, China a [email protected], b [email protected] Keywords: Shot blasting machine; Programmable logic controller; Ethernet; Kingview; Monitoring Abstract: The statistic algorithm for image processing, block clustering and block size is proposed according to the block image sequences. For complicated and regular distribution block image. Firstly, we get the binary picture, and calculate the ratio of the edge and ground and the maximum distance between the two edges by the pixel scanning method, then we can get the data sample of the size and block size distribution at the same time. Secondly, using the improved nearest neighbor algorithm[5], we get the block size classification, and the percentage of each regional size in the whole area. Computer emulate result proved that this method meets the demands of the real-time image processing better for its advantage as follows: the small calculation, the high precision. The algorithm will lay a solid foundation for the operating mode analysis and automatic control. 1. Introduction There need a real-time observation of the melting or calcination dynamic process of some material, in order to take analysis or corresponding parameter control. For instance, we need immediate understanding the quantity and size of the clinker caking in the cement rotary kiln calcination process, Because the quality of cement products not only related to the changes of material sintering temperature, but also related to the quantity and size of the clinker caking, and the quantity and size of the clinker caking mainly depends on the raw material ratio and appropriate mineral composition and petrographic structure .However, these processes especially like the cement rotary kiln calcination process is a very complicated production process, it is hard to establish mathematical model, and its particle size detection problems are also difficult to solve. We can use popular soft measurement technology[1] and computer vision detection technology to take block sintering images[2], which including abundant production condition information—the ratio of the edge and ground, block distribution state, then by using the image processing technology, based on identification principle to get characteristic quantity[3-4], which play a decisive role in production condition. On the base of the accumulation of a great number of statistic data, we can establish quality prediction model, and then realize the quality optimization control of the process. The Purpose and motivation of the statistic algorithm for the block image sequences clustering and block size distribution is obvious. On the base of the accumulation of the distribution law of the block, the author acquire the simulation image of in the furnace caking with CCD in laboratory (as shown in Fig.1), and get the algorithm to solve block size distribution after repeated research and Advances in Computer, Signals and Systems (2016) 1: 18-22 Clausius Scientific Press, Canada 18
Transcript of Algorithm for Size Statistic and Clustering of Block Image...
Algorithm for Size Statistic and Clustering of Block Image Sequences
Li Cong1, a, Zou Shaoli2, b 1No 106 Jiweit Road, School of Electrical Engineering, University of Jinan, Jinan, China
2No 5 Shanda Road, A judge in Shandong Training College, Jinan, China a [email protected], b [email protected]
Keywords: Shot blasting machine; Programmable logic controller; Ethernet; Kingview; Monitoring
Abstract: The statistic algorithm for image processing, block clustering and block size is proposed according to the block image sequences. For complicated and regular distribution block image. Firstly, we get the binary picture, and calculate the ratio of the edge and ground and the maximum distance between the two edges by the pixel scanning method, then we can get the data sample of the size and block size distribution at the same time. Secondly, using the improved nearest neighbor algorithm[5], we get the block size classification, and the percentage of each regional size in the whole area. Computer emulate result proved that this method meets the demands of the real-time image processing better for its advantage as follows: the small calculation, the high precision. The algorithm will lay a solid foundation for the operating mode analysis and automatic control.
1. Introduction
There need a real-time observation of the melting or calcination dynamic process of somematerial, in order to take analysis or corresponding parameter control. For instance, we need immediate understanding the quantity and size of the clinker caking in the cement rotary kiln calcination process, Because the quality of cement products not only related to the changes of material sintering temperature, but also related to the quantity and size of the clinker caking, and the quantity and size of the clinker caking mainly depends on the raw material ratio and appropriate mineral composition and petrographic structure .However, these processes especially like the cement rotary kiln calcination process is a very complicated production process, it is hard to establish mathematical model, and its particle size detection problems are also difficult to solve. We can use popular soft measurement technology[1] and computer vision detection technology to take block sintering images[2], which including abundant production condition information—the ratio of the edge and ground, block distribution state, then by using the image processing technology, based on identification principle to get characteristic quantity[3-4], which play a decisive role in production condition. On the base of the accumulation of a great number of statistic data, we can establish quality prediction model, and then realize the quality optimization control of the process.
The Purpose and motivation of the statistic algorithm for the block image sequences clustering and block size distribution is obvious. On the base of the accumulation of the distribution law of the block, the author acquire the simulation image of in the furnace caking with CCD in laboratory (as shown in Fig.1), and get the algorithm to solve block size distribution after repeated research and
Advances in Computer, Signals and Systems (2016) 1: 18-22 Clausius Scientific Press, Canada
18

argumentatsample of ground andusing the imdemands othe high sp
2. Edge E
We can
assumed th
We need
There astatistical edifferent kicertain objlong. Freegeometry s
Chain cintricate, wtrack edge accuracy isimprove thpartition frclustering obtain the
3. Block C
3.1 Duty R
We get tWe set
N (columnumber of
tion. This pthe edge byd the data smproved ne
of the real-tipeed, the hig
Extraction A
n carry on b
hat the input
d to extract
are many edge detectinds of diffect; howev
eman chain shape of arbcode methowhich is hig
by Freemas lower. In he operatiorom the densituation ofclustering s
Clustering
Ratio
the binary ithe width o
mn). Firstlyf edge pixel
paper based y the methosample of thearest neighime image pgh precision
Algorithm
binary proc
t image is
edge conto
edge detection methodferential opeer it can’t mcode is a
bitrary shapd need edg
ghly discontan chain cod
the actual on speed. Fnsity of pix
f each area. situation by
and Size S
images in Fiof the imagey san the iml points of
on the actuod of scannihe distance hbor to. Comprocessing bn, strong pra
Research
cessing for
),( jiM , the
our after got
Fig.1. Sim
ction method, relaxationerator, etc. Tmeet the dem
better mete in the ima
ge is continutinuous, crode, but also situation, w
For the regxel point thFor irregulaoperation. T
Statistical A
ig.2 (a), thre as L , themage from each scanni
ual proposeing with spbetween th
mputer emubetter for itsacticality an
image after
e output im
t the binary
mulation cak
ods, such n-labeling, These methmands of ththod to obtage by discrnuous closedossing and o
easy to cauwe set the bgular imagehat duty ratar image weThe targets
Algorithm
rough the bie height as Htop to bott
ing line iP .
d the methoecific step,
hem; Get thulate result ps advantagend so on.
r choose th
age is ,( jiY
image.
king image
as energy surface fitt
hods have rehe on-line dtain size, itrete data. d curve, hooverlappinguse ambiguiblock imagee we solve tio of edge e consider tof them are
narization oH , the imatom, left toThrough th
od and algoand get thee block claproved that e as follows
he correct th
) ,then: iY ,(
concentratting operatoemarkable detection if tt is a basic
owever, the . It is not onity in edge re partition i
the classifand backg
he whole ime unified.
of the Fig.2.aging latticeo right in tuhese we can
orithm that ge ratio of th
assification this metho
: the small c
threshold va
M
Mj
0
1),
tion filterinor, Marr opdetection effthe runningc method to
edge of thnly time-corecognitionin advance fication of ground, andmage as a p
.(b) e of image urn, calculan get the du
get the datahe edge andand size byd meets thecalculation,
alue t. It is
tjiM
tjiM
),(
),(
ng method,perator, andffect for one time is tooo represent
he caking isonsuming ton so that the
in order tothe caking
d obtain theartition and
as M (row)ate the totaluty ratio of
a d y e ,
s
, d e o t
s o e o g e d
) l f
19
edge and
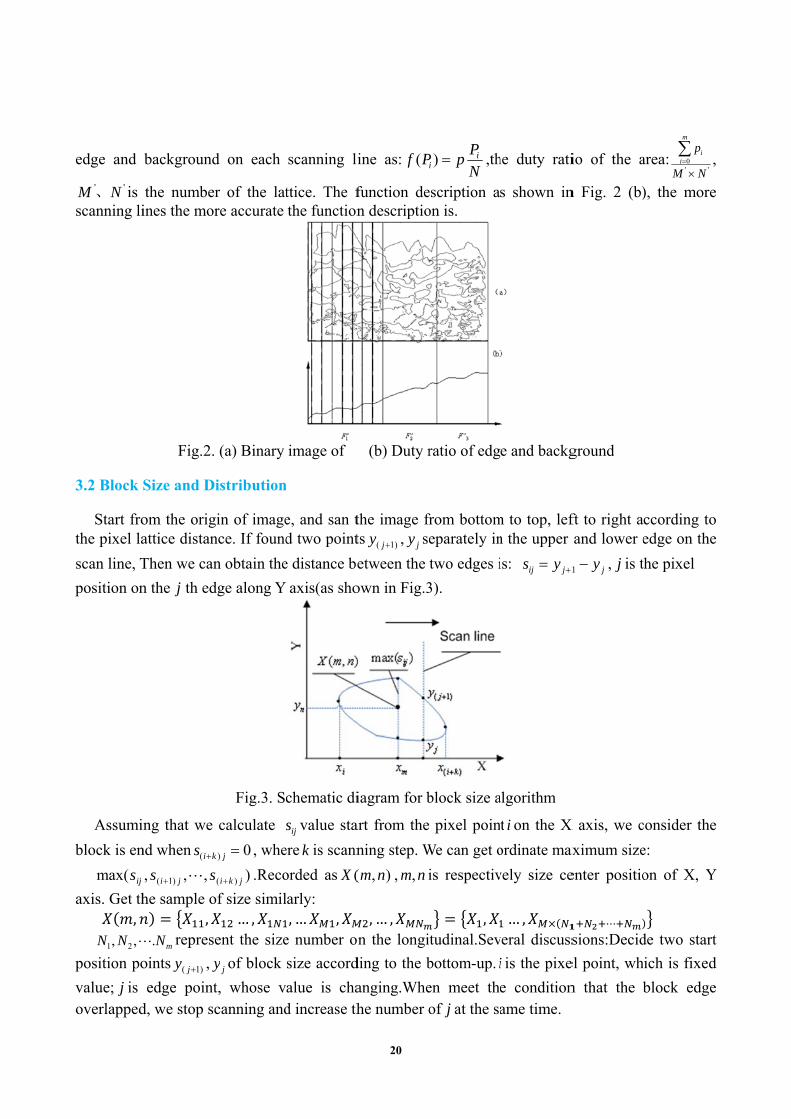
'' NM 、 is scanning li
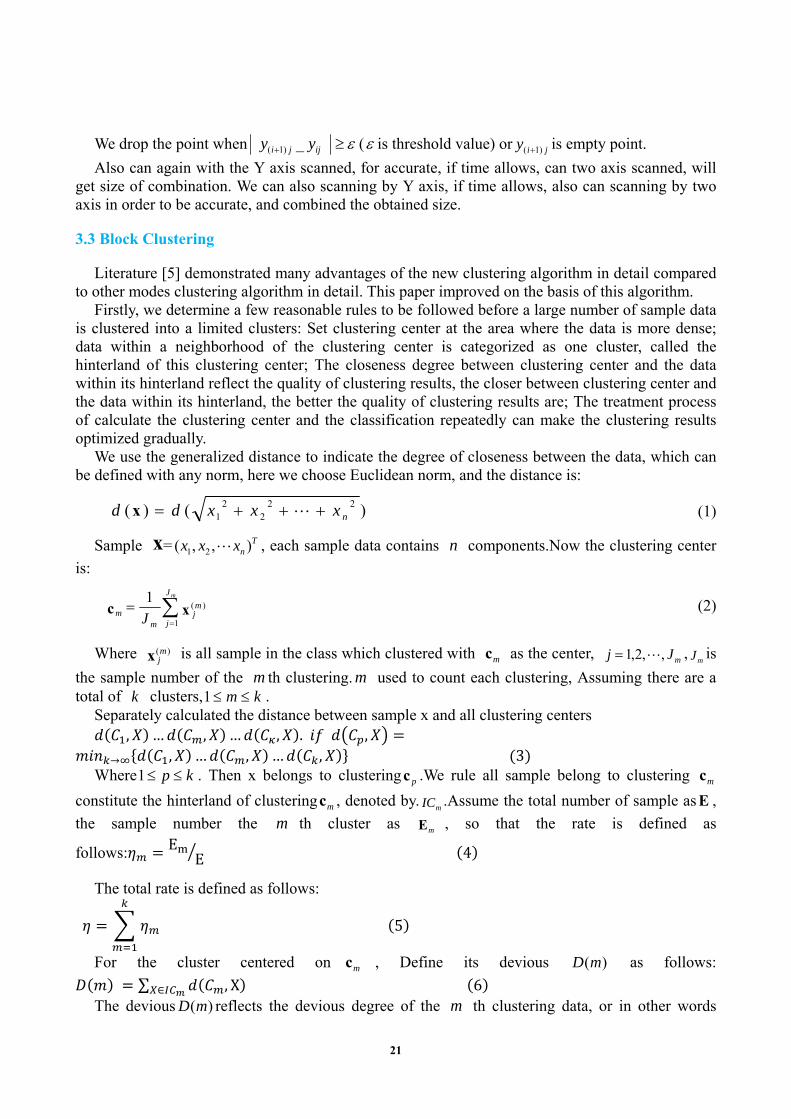
3.2 Block
Start frothe pixel la
scan line, T
position on
Assumi
block is en
max( ijs
axis. Get th ,
NN ,, 21 position po
value; j is overlapped
background
the numbeines the mor
Fig.2.
Size and D
om the origattice distan
Then we can
n the j th ed
ng that we
nd when ( kis
,,, )1( ji ss he sample o
,
mN. repres
oints )1( jy , y
edge pointd, we stop sc
d on each
r of the latre accurate
(a) Binary
istribution
gin of imagence. If found
n obtain the
dge along Y
Fig.3. S
calculate s
0) jk , whe
))( jkis .Reco
of size simil… ,
ent the size
jy of block
t, whose vcanning and
scanning li
ttice. The fthe function
image of
n
e, and san td two point
e distance be
axis(as sho
chematic di
ijs value sta
ere k is scann
orded as (X
larly: , … ,
e number o
size accord
alue is chad increase th
ine as: Pf (
function den descriptio
(b) Duty r
the image frts )1( jy , jy se
etween the
own in Fig.3
iagram for b
art from the
ning step. W
),( nm , nm, i
, … ,n the longi
ding to the b
anging.Whehe number o
N
PpP i
i ) ,th
escription aon is.
ratio of edg
from bottomeparately in
two edges i
3).
block size a
e pixel poin
We can get o
is respectiv
,itudinal.Sev
bottom-up. i
en meet theof j at the sa
he duty rati
s shown in
e and backg
m to top, lefn the upper
is: jij ys 1
algorithm
t i on the X
ordinate max
vely size ce
… ,veral discuss
i is the pixe
e conditioname time.
io of the a
n Fig. 2 (b)
ground
ft to right aand lower e
jy1 , j is t
X axis, we c
aximum size
enter positio
⋯
sions:Decid
el point, wh
n that the b
area:''
0
NM
pm
ii
,
), the more
ccording toedge on the
the pixel
consider the
e:
on of X, Y
de two start
ich is fixed
block edge
,
e
o e
e
Y
t
d
e
20
We drop the point when ijji yy _)1( ( is threshold value) or jiy )1( is empty point.
Also can again with the Y axis scanned, for accurate, if time allows, can two axis scanned, will get size of combination. We can also scanning by Y axis, if time allows, also can scanning by two axis in order to be accurate, and combined the obtained size.
3.3 Block Clustering
Literature [5] demonstrated many advantages of the new clustering algorithm in detail compared to other modes clustering algorithm in detail. This paper improved on the basis of this algorithm.
Firstly, we determine a few reasonable rules to be followed before a large number of sample data is clustered into a limited clusters: Set clustering center at the area where the data is more dense; data within a neighborhood of the clustering center is categorized as one cluster, called the hinterland of this clustering center; The closeness degree between clustering center and the data within its hinterland reflect the quality of clustering results, the closer between clustering center and the data within its hinterland, the better the quality of clustering results are; The treatment process of calculate the clustering center and the classification repeatedly can make the clustering results optimized gradually.
We use the generalized distance to indicate the degree of closeness between the data, which can be defined with any norm, here we choose Euclidean norm, and the distance is:
)()( 222
21 nxxxdd x (1)
Sample x= Tnxxx ),,( 21 , each sample data contains n components.Now the clustering center
is:
1
1
)(
mJ
j
mj
mm J
xc (2)
Where x )(mj is all sample in the class which clustered with mc as the center, mJj ,,2,1 ,
mJ is
the sample number of the m th clustering. m used to count each clustering, Assuming there are a total of k clusters, km 1 .
Separately calculated the distance between sample x and all clustering centers , … , … , . ,
→ , … , … , 3 Where kp 1 . Then x belongs to clustering pc .We rule all sample belong to clustering mc
constitute the hinterland of clustering mc , denoted by.mIC .Assume the total number of sample as E ,
the sample number the m th cluster as mE , so that the rate is defined as
follows: EE 4
The total rate is defined as follows:
5
For the cluster centered on mc , Define its devious )(mD as follows:
∑ , Χ∈ 6 The devious )(mD reflects the devious degree of the m th clustering data, or in other words
21
compact degree.The total devious D is defined as follows:
7
The smaller the total devious D is, the more compact the cluster is, and thus the better the quality of clustering result is.The clustering process: Firstly, select the points distance minimum between each other as the clustering center, and classified the samples within its certain range into its hinterland. Then choose the points distance minimum between each other as the clustering center from residual samples, and determine its hinterland. Samples have already been processed will not be considered when continue to choose clustering center and the classification. The points have a larger distance between each other will not get together. Repeat the above process until all samples are clustered. This clustering method can avoid the cluster focus on local area, The samples have a larger distance between each other will be forced to get together when the number of cluster is limited, which make the total devious very large, so that largely avoided the cluster fall into local solution. We need to make adjustments to further reduce the total devious after the initial clustering is finished, and maximize the total rate. Firstly, calculate the center of each cluster, secondly, calculate the distance between all samples and the center of each cluster and reclassified all samples according to the principle of formula (3). Adjust the clustering repeatedly until the total devious no longer decreased significantly and the total rate is maximum.
4. The experimental results
We get a image sequence by shooting continuously in a certain time interval. Process each picture in this sequence respectively according to the above.We conducted field simulation in the laboratory. Material stones replaced by standard concrete experiment stones, each distribution rate of the stones whose size is around the 50mm, 35mm and 20mm is 20%, 30% and 50%. We change the position of different size block properly.the adopted 20 picture constitute a set of image sequence.The extraction results of the size in 20 pictures are basically similar. We classify the stones into three clusters (can also divide them into several kinds, or take treat accordingly treatment after segmenting the images are segmented when there are longitudinal and transverse block partition at the same time).The statistical result is that stones size is 42.3mm, 37mm and 16mm respectively. The rate of the major medium and small stones in the whole area is that: 50mm (40-55mm) caking quantity is 24.3%, 35mm (25-40mm) caking quantity is 26.2%, 20mm (15-25mm) caking quantity accounts for 45.1%. The results are satisfactory compared with the actual results. Other depth algorithm needs further improvement.
References
[1] CAO Peng-Fei, LUO Xiong-Lin. Wiener Structure Based Modeling and Identifying of Soft Sensor Systems[J]. Acta Automatica Sinica. 2014,40(10):2179-2192.
[2] Wu Xiao-xun. A Study on Burning State Recognition of Clinker Based on Burning Zone Image[D]. Shen yang: North eastern University June 2014.
[3] LIU Jin-Xin, ZHU Yun-Long, SHEN Zhe, et al. Hybrid Recognition Method for Burning Zone Condition of Rotary Kiln[J]. Acta Automatica Sinica. 2012,38(7):1153-1161.
[4] SHI Pei-yuan, DENG Tingquan. Fuzzy-based color recognition and its application in image retrieval. Computer Engineering and Applications[J], 2013, 49(18):138-141.
[5] Li Cong, Zhang Yong, Gao Zhi. A new clustering algorithm [J]. Pattem Recognition and Aitificial Intelligence. 1999,12(2):205-208.
22


![Document Clustering using Improved K-means Algorithm · means algorithm [4] presented how ontological domains are used in clustering documents. Improved document clustering algorithm](https://static.fdocuments.net/doc/165x107/5fa98bfc29d9331b0b2a1030/document-clustering-using-improved-k-means-algorithm-means-algorithm-4-presented.jpg)