Algebra 2 Outliers - Bremen High School District 228 / … · · 2017-05-12... Given the data set...
22
Outliers Algebra 2 Standard Deviation Measures of Central Tendency (Mean, Median, Mode) Normal Distribution (Bell Curves)
-
Upload
truongdien -
Category
Documents
-
view
214 -
download
1
Transcript of Algebra 2 Outliers - Bremen High School District 228 / … · · 2017-05-12... Given the data set...

Outliers
Algebra 2
Standard Deviation
Measures of Central Tendency (Mean, Median, Mode)
Normal Distribution (Bell Curves)
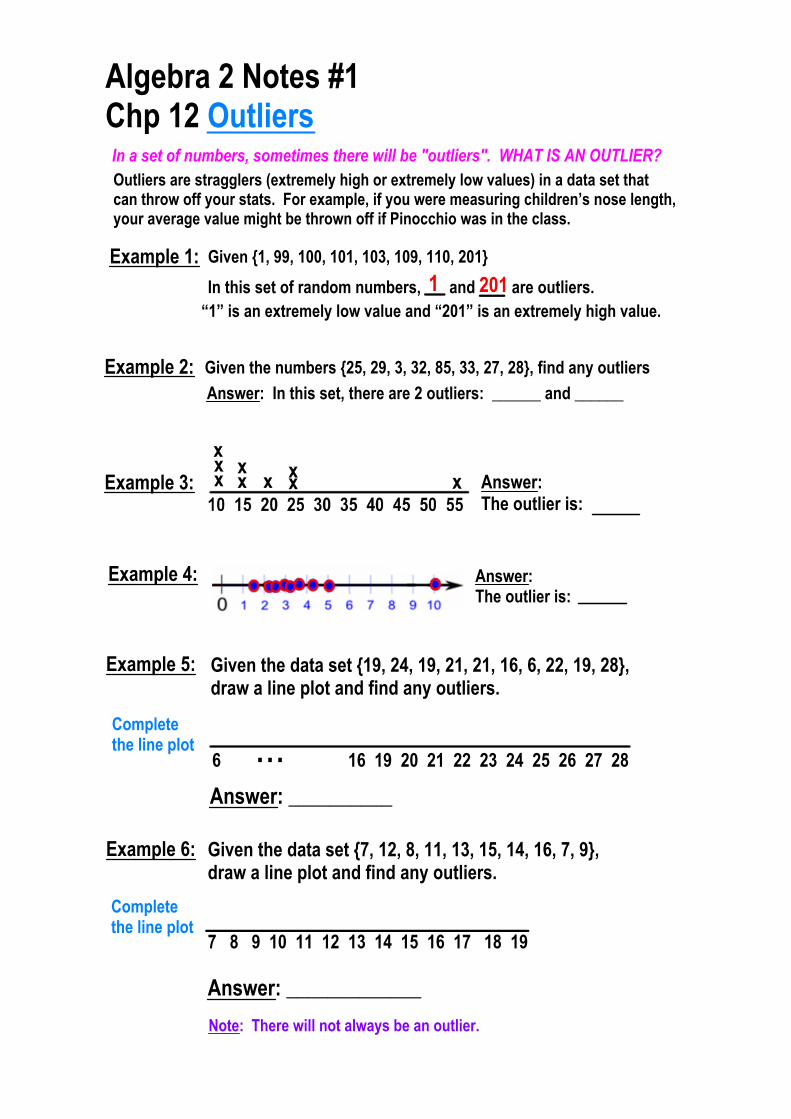
Algebra 2 Notes #1Chp 12 OutliersIn a set of numbers, sometimes there will be "outliers". WHAT IS AN OUTLIER?
Example 1:
Example 2: Given the numbers {25, 29, 3, 32, 85, 33, 27, 28}, find any outliersAnswer: In this set, there are 2 outliers: ______ and ______
Example 3:
Example 4:
Given the data set {19, 24, 19, 21, 21, 16, 6, 22, 19, 28}, draw a line plot and find any outliers.
Example 6: Given the data set {7, 12, 8, 11, 13, 15, 14, 16, 7, 9}, draw a line plot and find any outliers.
Answer: __________
Answer: _____________
6 16 19 20 21 22 23 24 25 26 27 28
7 8 9 10 11 12 13 14 15 16 17 18 19
Complete the line plot
Complete the line plot
Outliers are stragglers (extremely high or extremely low values) in a data set that can throw off your stats. For example, if you were measuring children’s nose length, your average value might be thrown off if Pinocchio was in the class.
Note: There will not always be an outlier.
In this set of random numbers, and are outliers.
Answer: The outlier is:
Answer: The outlier is:
Example 5:
1 201Given {1, 99, 100, 101, 103, 109, 110, 201}
“1” is an extremely low value and “201” is an extremely high value.
...

Measures of Central TendencyStatistics is the branch of mathematics that deals with the collection, organization, analysis, and interpretation of numerical data. The following are 3 commonly used statistics, commonly known as measures of central tendency:
1. The MEAN, or average, of n numbers is the sum of the numbers divided by n.
The mean is denoted by , which is read as "xbar." For the data x1, x2, x3, ..., xn the mean is x = x1+x2+x3+ ...+xn
na) What is the mean of the numbers 8, 9, 13, and 18?
2. The MEDIAN of n numbers is the middle number when the numbers are
written in order (from least to greatest). If there are 2 middle numbers, you will have to find the mean.a) What is the median of the
3. The MODE of n numbers is the number of numbers that occur most frequently.
What is the mode of the
There may be one mode, no mode, or more than one mode.
What is the mode of the numbers 2, 8, 7, 13, and 9?
numbers 5, 8, 9, 13, and 9? What is the mode of the numbers 15, 8, 6, 15, and 6?
Measures of Central Tendency tell you what the center of the data is. Other commonly used statistics are called Measures of Dispersion. They tell you how spread out the data numbers are. One simple measure of dispersion is the RANGE, which is the difference between the greatest data value and the least data value. (Range = highest # lowest#)
In statistics, dispersion is the extent to which a distribution of numbers is stretched or squeezed. Common examples of measures of statistical dispersion are the variance, standard deviation, and interquartile range.
x
numbers 5, 8, 9, 13, and 18? b) What is the median of the
numbers 5, 8, 9, 10, 13, and 18?

How to complete "Finding Mean" Worksheet.The first 2 problems from the worksheet are shown below. Complete these same 2 problems on your worksheet and continue showing the same work for the rest of the problems. Also, complete the puzzle at the bottom of the worksheet. Remember to round answers to the nearest tenth.

Data can be "distributed" (spread out) in different ways. It can spread out more on the right, more on the left, or it can be all jumbled up.
Normal Distribution/Bell Curve/Standard Deviation
But there are many cases where the data tends to be around a central value with no bias left or right, and it gets close to a "Normal Distribution" like this:
Many things closely follow a Normal Distribution:> heights of people > blood pressure > marks on a test
>
> symmetry about the center.
(if you can draw a line down the center of the picture and get 2 similar halves, it's symmetrical.)
Half of the data values (50%) are less than the mean (the average of all the numbers)
Half of the data values (50%) are greater than the mean (the average of all the numbers)
>
>
The Normal Distribution (Bell Curve) has the following attributes:
"Bell Curve" This distribution curve is often called a "Bell Curve" because it looks like a bell.
Normal Distribution
mean = median = mode
We say the data is "normally distributed."
The bell curve is seen in tests like the ACT and SAT. The bulk of students will score the average (C). Smaller numbers of students will score a B or D, and an even smaller percentage of students will score an A or an E. This creates a distribution that resembles a bell (hence the nickname), or bell curve.
MeanMedianMode
Algebra 2 Chp 12 Notes #2

Normal Distributions/Bell Curves/Standard Deviation
This bell curve or "normal distribution"curve tells you what percentage of your data falls within a certain number of standard deviations from the mean (the average of the set):
Note: Areas under this curve can also be represented as percentages. Areas under this curve can also represent probabilities.
• 68% of the data falls within one standard deviation of the mean.
• 95% of the data falls within two standard deviations of the mean.
• 99.7% of the data falls within three standard deviations of the mean.
x = mean (average of the data set)
2(.0015)+2(.0235)+2(.135)+2(.34)= 1=100% (of the data given)
The Standard Deviation is a measure of how spread out numbers are within a set of data values. The Greek letter sigma, , denotes standard deviation.
(.34+.34 = .68 = 68%) 68% of data values are within 1 standard deviation ( ) of the mean
σ
+σ‐σ
+1 +2 +33 2 1
68%
+σ
+2σ‐2σ
(.135+.34+.34 +.135 = .95 = 95%) 95% of data values are within 2 standard deviations ( ) of the mean
+2σ
95%
Normal Distribution Curve(Bell Curve)
+3σ‐3σ
(.0235+.135+.34+.34 +.135+.0235 = .997 = 99.7%) 99.7% of data values are within 3 standard deviations ( ) of the mean
+3σ99.7%

1. What percent of the area under a normal curve lies within
a. 1 standard deviation of the mean?
b. within 2 standard deviations of the mean?
c. within 3 standard deviations of the mean?
Give the percent of the area under a normal curve represented by the shaded region.
3. ______
7. ______
4. ______
8. ______
9. ______
5. ______ 10. ______
6. ______ 11. ______
2. ______
abc

How to Compute the mean( ) and standard deviation( ):σx
Estimate the standard deviation of each graph:
1.______
2.______ 4.______
3.______
60 65 70 75 80 85 90
68 72 76 80 84 88 92
77 80 83 86 89 92 95
53 58 63 68 73 78 83
Enter the data values (use the following buttons) 2nd STAT 1VAR 2VAR ENTER DATA
Type in each number, then press the down arrow key to get to x2 and repeat as necessary. To find the answers, press STAT VARYou will see the following: n: this is how many numbers there are in the set x: this is the mean (average) Sx: (ignore this one) x: this is the standard deviationσ
To exit STAT Mode:
Compute the mean( ) and standard deviation( ) of each. Round answers to the nearest tenth:
x σ
5. {5, 7, 9, 11, 15} 6. {20, 21, 20, 24, 27}
1
To stay in STAT Mode and enter a new data set:2nd STAT 1VAR 2VAR CLRDATA ENTER DATA x1=
x1=
or
x = σ
(mean)
(standard deviation) =x =
σ =
x

9. {4, 7, 16, 24, 33} 10. {30, 35, 31, 38}
11. {26, 27, 20, 22, 20} 12. {42, 36, 42, 37, 51}
7. {2, 5, 3, 6, 10} 8. {15, 12, 17, 22, 25, 27, 20}
1

Test scores are normally distributed with a mean of 70% (C average) and a standard deviation of 10%.Approximately how many students scored an A or B in a class of:
Approximately how many students scored a B in a class of:
17) 20 students 18) 50 students
13) 25 students 14) 38 students 15) 20 students 16) 50 students
Approximately how many students scored an A in a class of:
19) 20 students 20) 50 students
Approximately how many students scored a D in a class of:
21) 20 students 22) 50 students
Approximately how many students scored an E in a class of:
23) 20 students 24) 50 students
1

A normal distribution has a mean of 62 and a standard deviation of 4. Find the probability (keep in decimal form) that a randomly selected xvalue is in the given interval.
25) between 58 and 66
26) between 62 and 74
27) between 50 and 70 28) 62 or greater
29) between 8 and 12
30) between 7 and 13
31) between 8 and 11 32) 12 or greater
A normal distribution has a mean of 10 and a standard deviation of 1. Find the probability (keep in decimal form) that a randomly selected xvalue is in the given interval.
1

Outliers
Algebra 2
Standard Deviation
Measures of Central Tendency (Mean, Median, Mode)
Normal Distribution (Bell Curves)

Algebra 2 Notes #1Chp 12 OutliersIn a set of numbers, sometimes there will be "outliers". WHAT IS AN OUTLIER?
Example 1:
Example 2: Given the numbers {25, 29, 3, 32, 85, 33, 27, 28}, find any outliersAnswer: In this set, there are 2 outliers: ______ and ______
Example 3:
Example 4:
Given the data set {19, 24, 19, 21, 21, 16, 6, 22, 19, 28}, draw a line plot and find any outliers.
Example 6: Given the data set {7, 12, 8, 11, 13, 15, 14, 16, 7, 9}, draw a line plot and find any outliers.
Answer: __________
Answer: _____________
6 16 19 20 21 22 23 24 25 26 27 28
7 8 9 10 11 12 13 14 15 16 17 18 19
Complete the line plot
Complete the line plot
Outliers are stragglers (extremely high or extremely low values) in a data set that can throw off your stats. For example, if you were measuring children’s nose length, your average value might be thrown off if Pinocchio was in the class.
Note: There will not always be an outlier.
In this set of random numbers, and are outliers.
Answer: The outlier is:
Answer: The outlier is:
Example 5:
1 201Given {1, 99, 100, 101, 103, 109, 110, 201}
“1” is an extremely low value and “201” is an extremely high value.
...28

Measures of Central TendencyStatistics is the branch of mathematics that deals with the collection, organization, analysis, and interpretation of numerical data. The following are 3 commonly used statistics, commonly known as measures of central tendency:
1. The MEAN, or average, of n numbers is the sum of the numbers divided by n.
The mean is denoted by , which is read as "xbar." For the data x1, x2, x3, ..., xn the mean is x = x1+x2+x3+ ...+xn
na) What is the mean of the numbers 8, 9, 13, and 18?
2. The MEDIAN of n numbers is the middle number when the numbers are
written in order (from least to greatest). If there are 2 middle numbers, you will have to find the mean.
a) What is the median of the
3. The MODE of n numbers is the number of numbers that occur most frequently.
What is the mode of the
There may be one mode, no mode, or more than one mode.
What is the mode of the numbers 2, 8, 7, 13, and 9?
numbers 5, 8, 9, 13, and 9? What is the mode of the numbers 15, 8, 6, 15, and 6?
Measures of Central Tendency tell you what the center of the data is. Other commonly used statistics are called Measures of Dispersion. They tell you how spread out the data numbers are. One simple measure of dispersion is the RANGE, which is the difference between the greatest data value and the least data value. (Range = highest # lowest#)
In statistics, dispersion is the extent to which a distribution of numbers is stretched or squeezed. Common examples of measures of statistical dispersion are the variance, standard deviation, and interquartile range.
x
numbers 5, 8, 9, 13, and 18? b) What is the median of the
numbers 5, 8, 9, 10, 13, and 18?
median =median = 9

How to complete "Finding Mean" Worksheet.The first 2 problems from the worksheet are shown below. Complete these same 2 problems on your worksheet and continue showing the same work for the rest of the problems. Also, complete the puzzle at the bottom of the worksheet. Remember to round answers to the nearest tenth.
485.612

Data can be "distributed" (spread out) in different ways. It can spread out more on the right, more on the left, or it can be all jumbled up.
Normal Distribution/Bell Curve/Standard Deviation
But there are many cases where the data tends to be around a central value with no bias left or right, and it gets close to a "Normal Distribution" like this:
Many things closely follow a Normal Distribution:> heights of people > blood pressure > marks on a test
>
> symmetry about the center.
(if you can draw a line down the center of the picture and get 2 similar halves, it's symmetrical.)
Half of the data values (50%) are less than the mean (the average of all the numbers)
Half of the data values (50%) are greater than the mean (the average of all the numbers)
>
>
The Normal Distribution (Bell Curve) has the following attributes:
"Bell Curve" This distribution curve is often called a "Bell Curve" because it looks like a bell.
Normal Distribution
mean = median = mode
We say the data is "normally distributed."
The bell curve is seen in tests like the ACT and SAT. The bulk of students will score the average (C). Smaller numbers of students will score a B or D, and an even smaller percentage of students will score an A or an E. This creates a distribution that resembles a bell (hence the nickname), or bell curve.
MeanMedianMode
Algebra 2 Chp 12 Notes #2

Normal Distributions/Bell Curves/Standard Deviation
This bell curve or "normal distribution"curve tells you what percentage of your data falls within a certain number of standard deviations from the mean (the average of the set):
Note: Areas under this curve can also be represented as percentages. Areas under this curve can also represent probabilities.
• 68% of the data falls within one standard deviation of the mean.
• 95% of the data falls within two standard deviations of the mean.
• 99.7% of the data falls within three standard deviations of the mean.
x = mean (average of the data set)
2(.0015)+2(.0235)+2(.135)+2(.34)= 1=100% (of the data given)
The Standard Deviation is a measure of how spread out numbers are within a set of data values. The Greek letter sigma, , denotes standard deviation.
(.34+.34 = .68 = 68%) 68% of data values are within 1 standard deviation ( ) of the mean
σ
+σ‐σ
+1 +2 +33 2 1
68%
+σ
+2σ‐2σ
(.135+.34+.34 +.135 = .95 = 95%) 95% of data values are within 2 standard deviations ( ) of the mean
+2σ
95%
Normal Distribution Curve(Bell Curve)
+3σ‐3σ
(.0235+.135+.34+.34 +.135+.0235 = .997 = 99.7%) 99.7% of data values are within 3 standard deviations ( ) of the mean
+3σ99.7%

1. What percent of the area under a normal curve lies within
a. 1 standard deviation of the mean?
b. within 2 standard deviations of the mean?
c. within 3 standard deviations of the mean?
Give the percent of the area under a normal curve represented by the shaded region.
3. ______
7. ______
4. ______
8. ______
9. ______
5. ______ 10. ______
6. ______ 11. ______
2. ______
.34+.135+.0235+.0015=0.5=50%
.34+.135=.475=47.5%
.0015+.0235=.025=2.5%
.135+.0235=.1585=15.85%
.135+.34+.34+.135=.95=95%
.0235+.135=.1585=15.85%
.135+.135=.27=27%
.34+.135+.0235=.4985=49.85%
.34+.34=.68=68%
.135+.34+.135=.61=61%
.34+.34=.68= 68%
95% 99.7%
50%
47.5%
2.5%
15.85%
95%
15.85%
27%
49.85%
68%
61%

How to Compute the mean( ) and standard deviation( ):σx
Estimate the standard deviation of each graph:
1.______
2.______ 4.______
3.______
60 65 70 75 80 85 90
68 72 76 80 84 88 92
77 80 83 86 89 92 95
53 58 63 68 73 78 83
Enter the data values (use the following buttons) 2nd STAT 1VAR 2VAR ENTER DATA
Type in each number, then press the down arrow key to get to x2 and repeat as necessary. To find the answers, press STAT VARYou will see the following: n: this is how many numbers there are in the set x: this is the mean (average) Sx: (ignore this one) x: this is the standard deviationσ
To exit STAT Mode:
Compute the mean( ) and standard deviation( ) of each. Round answers to the nearest tenth:
x σ
5. {5, 7, 9, 11, 15} 6. {20, 21, 20, 24, 27}
1
To stay in STAT Mode and enter a new data set:2nd STAT 1VAR 2VAR CLRDATA ENTER DATA x1=
x1=
or
x = σ
(mean)
(standard deviation) =x = σ =
47 5
22.42.7

9. {4, 7, 16, 24, 33} 10. {30, 35, 31, 38}
11. {26, 27, 20, 22, 20} 12. {42, 36, 42, 37, 51}
7. {2, 5, 3, 6, 10} 8. {15, 12, 17, 22, 25, 27, 20} 5.22.8

Test scores are normally distributed with a mean of 70% (C average) and a standard deviation of 10%.Approximately how many students scored an A or B in a class of:
Approximately how many students scored a B in a class of:
17) 20 students 18) 50 students
13) 25 students 14) 38 students 15) 20 students 16) 50 students
Approximately how many students scored an A in a class of:
19) 20 students 20) 50 students
Approximately how many students scored a D in a class of:
21) 20 students 22) 50 students
Approximately how many students scored an E in a class of:
23) 20 students 24) 50 students
1

A normal distribution has a mean of 62 and a standard deviation of 4. Find the probability (keep in decimal form) that a randomly selected xvalue is in the given interval.
25) between 58 and 66
26) between 62 and 74
27) between 50 and 70 28) 62 or greater
29) between 8 and 12
30) between 7 and 13
31) between 8 and 11 32) 12 or greater
A normal distribution has a mean of 10 and a standard deviation of 1. Find the probability (keep in decimal form) that a randomly selected xvalue is in the given interval.
1
.34+.135+.0235 = .4985
.34+.135+.0235+.0015 = .5
.34+.34= .68
.135+.34+.34+.135 = .95
.0235+.135+.34+.34+.135+.0235= .997
.135+.34+.34 = .815
.0235+.0015= .025