Algebra 1 Unit 2A: Systems of Equations & Inequalities ... · Algebra 1 Unit 2A: Systems of...
24
Algebra 1 Unit 2A: Systems of Equations & Inequalities Notes 1 Unit 2A:Equations & Inequalities After completion of this unit, you will be able to… Learning Target #1: Creating and Solving Linear Equations Solve one, two, and multi-step equations (variables on both sides) Justify the steps for solving a linear equation Create and solve an equation from a context Learning Target #2: Creating and Solving Linear Inequalities Solve and graph a linear inequality Create and solve an inequality from a context Name and graph a compound inequality Give solutions for a compound inequality Learning Target #3: Isolating a Variable Solve a literal equation (multiple variables) for a specified variable Use a Formula to Solve Problems Unit 2A:Equations & Inequalities Learning Target #4: Creating and Solving Systems of Equations Identify the solution to a system from a graph or table Graph systems of equations Determine solutions to a system of equations Use a graphing calculator to solve a system of equations Use substitution & elimination to solve a system of equations Determine the best method for solving a systems of equations Apply systems to real world contexts Learning Target #5: Creating and Solving Systems of Inequalities Graph linear inequalities & systems of linear inequalities Create a linear inequality or system of inequalities from a graph Determine the solution to a linear inequality or system of inequalities Determine if a given solution is a solution to an inequality or system of inequalities Apply inequalities to real world contexts Monday Tuesday Wednesday Thursday Friday 25 th Day 1 – Solve 1, 2 & Multi-Step Equations 28 th Day 2 – Solving Equations with Fractions & Justifying Solving 29 th Day 3 – Graphing & Solving Inequalities 30 th Day 4 – Creating Equations & Inequalities from a Context 31 st Day 5 – Solving For a Variable Quiz on Solving Equations 1 st Day 6 – Graphing Systems of Equations 4 th Day 7 – Solving Systems of Equations by Substitution 5 th Day 8 – Solving Systems of Equations by Elimination 6 th Day 9 – Real World Applications Systems of Equations 7 th Day 10 – More Real World Applications Systems of Equations Quiz 8 th Day 11 – Graphing Inequalities & Systems of Inequalities 11 th Unit 2A Test Review 12 th Unit 2A Test
Transcript of Algebra 1 Unit 2A: Systems of Equations & Inequalities ... · Algebra 1 Unit 2A: Systems of...

Algebra 1 Unit 2A: Systems of Equations & Inequalities Notes
1
Unit 2A:Equations & Inequalities
After completion of this unit, you will be able to… Learning Target #1: Creating and Solving Linear Equations
Solve one, two, and multi-step equations (variables on both sides)
Justify the steps for solving a linear equation
Create and solve an equation from a context
Learning Target #2: Creating and Solving Linear Inequalities
Solve and graph a linear inequality
Create and solve an inequality from a context
Name and graph a compound inequality
Give solutions for a compound inequality
Learning Target #3: Isolating a Variable
Solve a literal equation (multiple variables) for a specified variable
Use a Formula to Solve Problems
Unit 2A:Equations & Inequalities Learning Target #4: Creating and Solving Systems of Equations
Identify the solution to a system from a graph or table
Graph systems of equations
Determine solutions to a system of equations
Use a graphing calculator to solve a system of equations
Use substitution & elimination to solve a system of equations
Determine the best method for solving a systems of equations
Apply systems to real world contexts
Learning Target #5: Creating and Solving Systems of Inequalities
Graph linear inequalities & systems of linear inequalities
Create a linear inequality or system of inequalities from a graph
Determine the solution to a linear inequality or system of inequalities
Determine if a given solution is a solution to an inequality or system of inequalities
Apply inequalities to real world contexts
Monday Tuesday Wednesday Thursday Friday
25th
Day 1 – Solve 1, 2 &
Multi-Step Equations
28th
Day 2 – Solving
Equations with
Fractions & Justifying
Solving
29th
Day 3 – Graphing &
Solving Inequalities
30th
Day 4 – Creating
Equations &
Inequalities from a
Context
31st
Day 5 – Solving For a
Variable
Quiz on Solving
Equations
1st
Day 6 – Graphing
Systems of Equations
4th
Day 7 – Solving
Systems of Equations
by Substitution
5th
Day 8 – Solving
Systems of Equations
by Elimination
6th
Day 9 – Real World
Applications Systems
of Equations
7th
Day 10 – More Real
World Applications
Systems of
Equations Quiz
8th
Day 11 – Graphing
Inequalities &
Systems of
Inequalities
11th
Unit 2A Test Review
12th
Unit 2A Test
Algebra 1 Unit 2A: Systems of Equations & Inequalities Notes
17
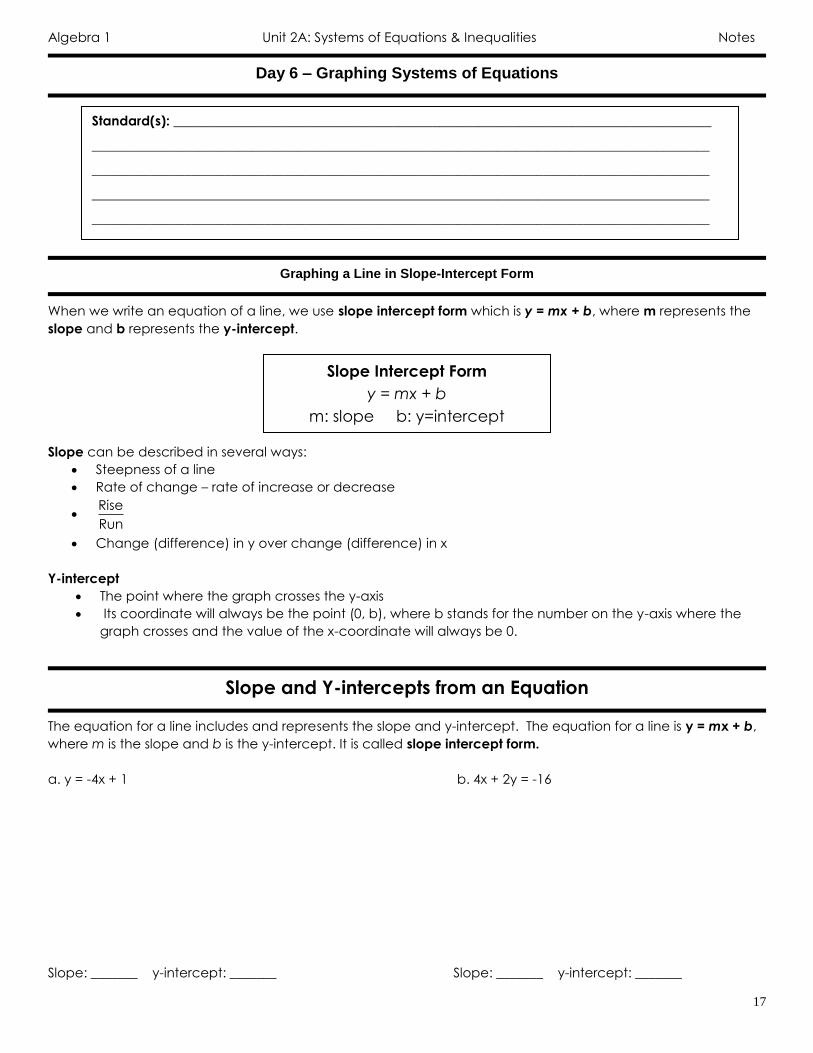
Day 6 – Graphing Systems of Equations
Graphing a Line in Slope-Intercept Form
When we write an equation of a line, we use slope intercept form which is y = mx + b, where m represents the
slope and b represents the y-intercept.
Slope can be described in several ways:
Steepness of a line
Rate of change – rate of increase or decrease
Rise
Run
Change (difference) in y over change (difference) in x
Y-intercept
The point where the graph crosses the y-axis
Its coordinate will always be the point (0, b), where b stands for the number on the y-axis where the
graph crosses and the value of the x-coordinate will always be 0.
Slope and Y-intercepts from an Equation
The equation for a line includes and represents the slope and y-intercept. The equation for a line is y = mx + b,
where m is the slope and b is the y-intercept. It is called slope intercept form.
a. y = -4x + 1 b. 4x + 2y = -16
Slope: _______ y-intercept: _______ Slope: _______ y-intercept: _______
Standard(s): _________________________________________________________________________________
_____________________________________________________________________________________________
_____________________________________________________________________________________________
_____________________________________________________________________________________________
_____________________________________________________________________________________________
Slope Intercept Form
y = mx + b
m: slope b: y=intercept

Algebra 1 Unit 2A: Systems of Equations & Inequalities Notes
18
Graphing Linear Functions
When you graph equations, you have to be able to identify the slope and y-intercept from the equation.
Step 1: Solve for y (if necessary)
Step 2. Plot the y-intercept.
Step 3: From the y-intercept, use the slope to calculate
another point on the graph.
Step 4: Connect the points with a ruler or straightedge.
Ex. Graph the following lines:
A. y = −2
3𝑥 + 4 m = _______ b = _______ -3x + y = 2 m = _______ b = _______
Graphing Horizontal and Vertical Lines
Ex. y = 4 Ex. x = -2
-8 -6 -4 -2 2 4 6 8
-8
-6
-4
-2
2
4
6
8
-8 -6 -4 -2 2 4 6 8
-8
-6
-4
-2
2
4
6
8
Slope = 𝒄𝒉𝒂𝒏𝒈𝒆 𝒊𝒏 𝒚
𝒄𝒉𝒂𝒏𝒈𝒆 𝒊𝒏 𝒙 =
+ ↑ − ↓
+→ − ←
-8 -6 -4 -2 2 4 6 8
-8
-6
-4
-2
2
4
6
8
-8 -6 -4 -2 2 4 6 8
-8
-6
-4
-2
2
4
6
8

Algebra 1 Unit 2A: Systems of Equations & Inequalities Notes
19
Solving Systems of Equations by Graphing
Two or more linear equations in the same variable form a system of equations.
Example:
A solution to a system is an ordered pair (x, y) that makes each equation in the system a true statement. A
solution is also the point where the two equations intersect each other on a graph.
Example: Find the solution of the linear equation and check your answer.
Examples: Check whether the ordered pair is a solution of the system of linear equations.
Ex. (1, 1) Ex. (-2, 4)
2x + y = 3 4x + y = -4
x – 2y = -1 -x – y = 1
Practice: Tell how many solutions the systems of equations has. If it has one solution, name the solution.
Identify Solutions to a System from a Table
Remember, that the solution to a system of equations is where the two lines intersect each other. The point of
the intersection is the solution. The solution is where the x-value (input) produces the same y-value (output) for
both equations. Using the tables below, identify the solution.
a. b.
Algebra 1 Unit 2A: Systems of Equations & Inequalities Notes
20
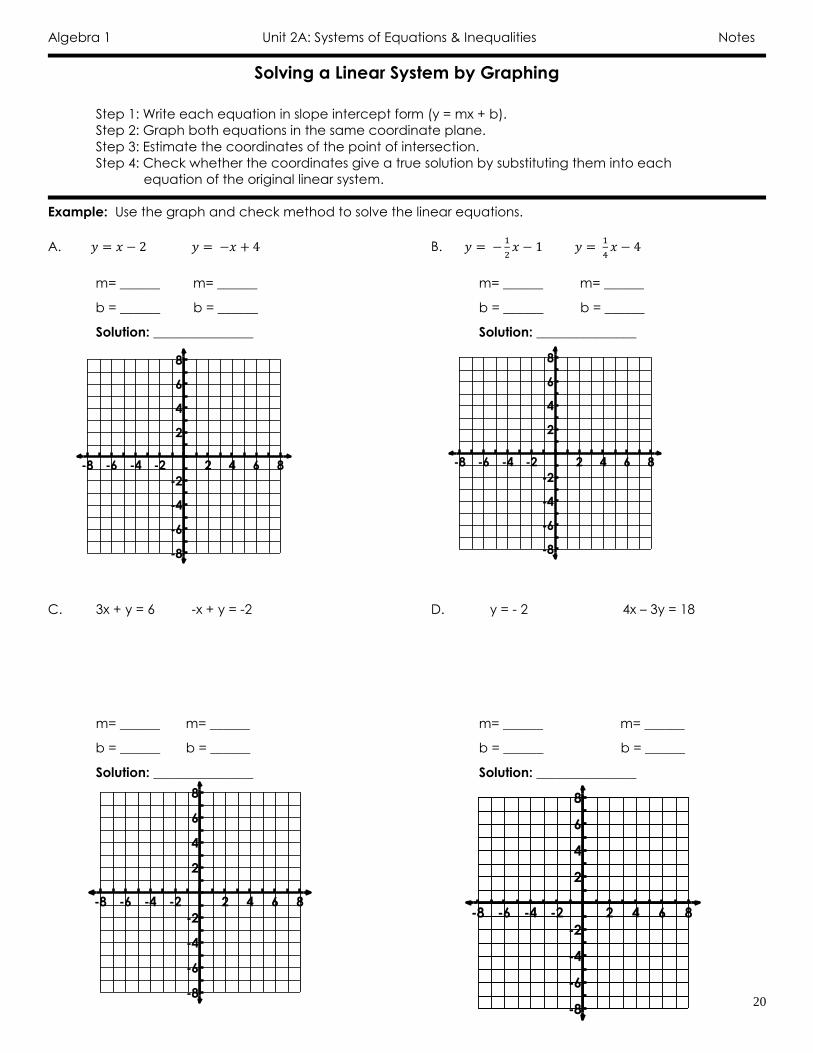
Solving a Linear System by Graphing
Step 1: Write each equation in slope intercept form (y = mx + b).
Step 2: Graph both equations in the same coordinate plane.
Step 3: Estimate the coordinates of the point of intersection.
Step 4: Check whether the coordinates give a true solution by substituting them into each
equation of the original linear system.
Example: Use the graph and check method to solve the linear equations.
A. 𝑦 = 𝑥 − 2 𝑦 = −𝑥 + 4 B. 𝑦 = −1
2𝑥 − 1 𝑦 =
1
4𝑥 − 4
m= ______ m= ______ m= ______ m= ______
b = ______ b = ______ b = ______ b = ______
Solution: _______________ Solution: _______________
C. 3x + y = 6 -x + y = -2 D. y = - 2 4x – 3y = 18
m= ______ m= ______ m= ______ m= ______
b = ______ b = ______ b = ______ b = ______
Solution: _______________ Solution: _______________
-8 -6 -4 -2 2 4 6 8
-8
-6
-4
-2
2
4
6
8
-8 -6 -4 -2 2 4 6 8
-8
-6
-4
-2
2
4
6
8
-8 -6 -4 -2 2 4 6 8
-8
-6
-4
-2
2
4
6
8
-8 -6 -4 -2 2 4 6 8
-8
-6
-4
-2
2
4
6
8
Algebra 1 Unit 2A: Systems of Equations & Inequalities Notes
21
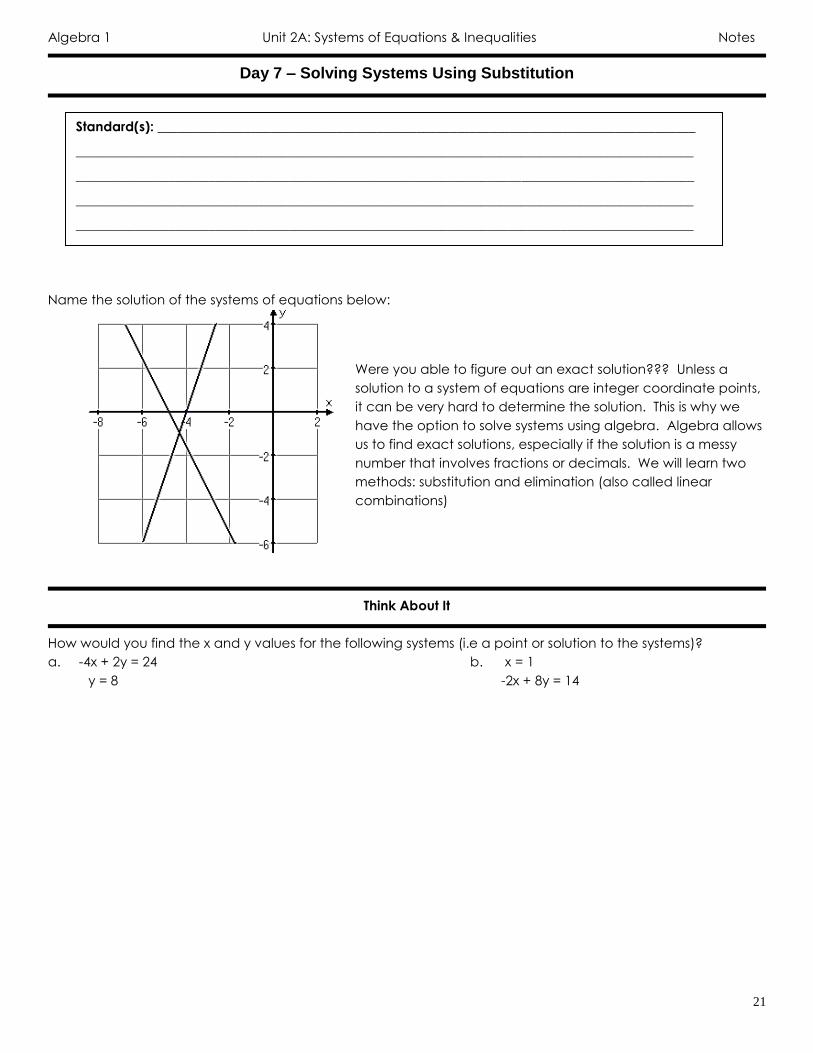
Day 7 – Solving Systems Using Substitution
Name the solution of the systems of equations below:
Were you able to figure out an exact solution??? Unless a
solution to a system of equations are integer coordinate points,
it can be very hard to determine the solution. This is why we
have the option to solve systems using algebra. Algebra allows
us to find exact solutions, especially if the solution is a messy
number that involves fractions or decimals. We will learn two
methods: substitution and elimination (also called linear
combinations)
Think About It
How would you find the x and y values for the following systems (i.e a point or solution to the systems)?
a. -4x + 2y = 24 b. x = 1
y = 8 -2x + 8y = 14
Standard(s): _________________________________________________________________________________
_____________________________________________________________________________________________
_____________________________________________________________________________________________
_____________________________________________________________________________________________
_____________________________________________________________________________________________

Algebra 1 Unit 2A: Systems of Equations & Inequalities Notes
22
Steps for Solving a System by Substitution
Example:
y = x + 1
2x + y = -2
Step 1: Select the
equation that already
has a variable isolated.
Step 2: Substitute the
expression from Step 1
into the other equation
for the variable you
isolated in step 1 and
solve for the other
variable.
Step 3: Substitute the
value from Step 2 into the
revised equation from
Step 1 and solve for the
other variable. Create a
point from your solutions.
Step 4: Check the
solution in each of the
original equations.
Example 1: Solve the system below:
2x + 2y = 3
x = 4y -1
Solution:
Algebra 1 Unit 2A: Systems of Equations & Inequalities Notes
23
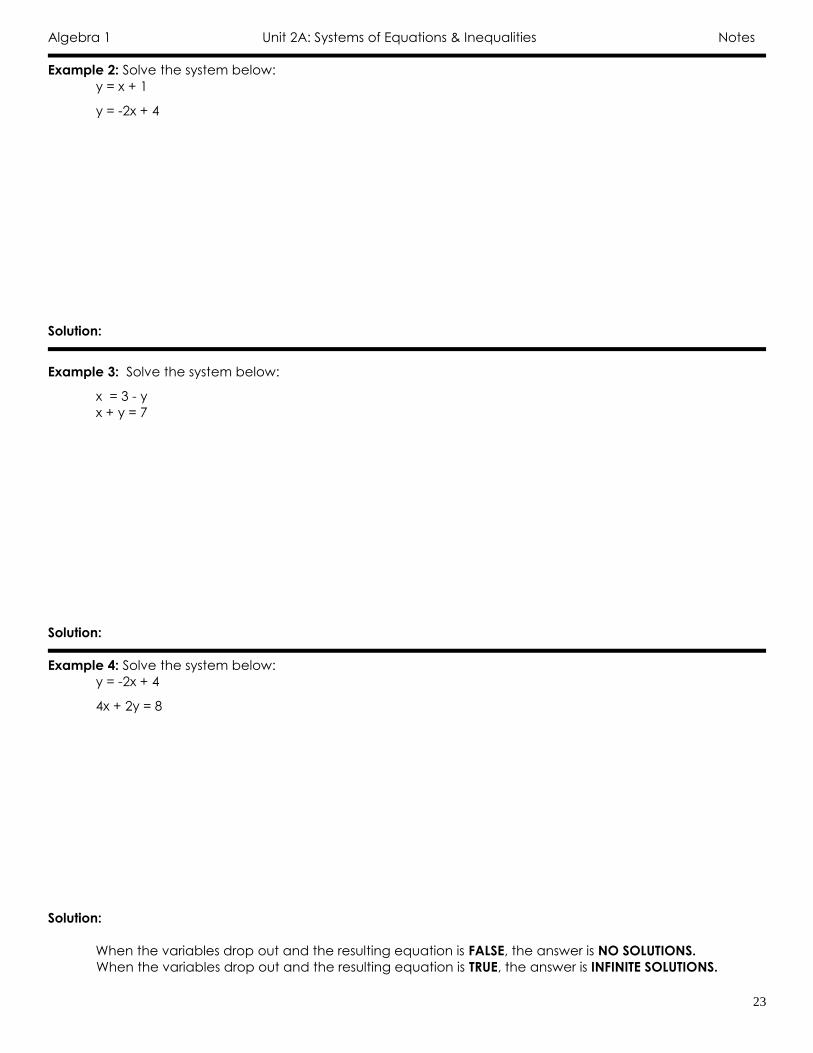
Example 2: Solve the system below:
y = x + 1
y = -2x + 4
Solution:
Example 3: Solve the system below:
x = 3 - y
x + y = 7
Solution:
Example 4: Solve the system below:
y = -2x + 4
4x + 2y = 8
Solution:
When the variables drop out and the resulting equation is FALSE, the answer is NO SOLUTIONS.
When the variables drop out and the resulting equation is TRUE, the answer is INFINITE SOLUTIONS.
Algebra 1 Unit 2A: Systems of Equations & Inequalities Notes
24
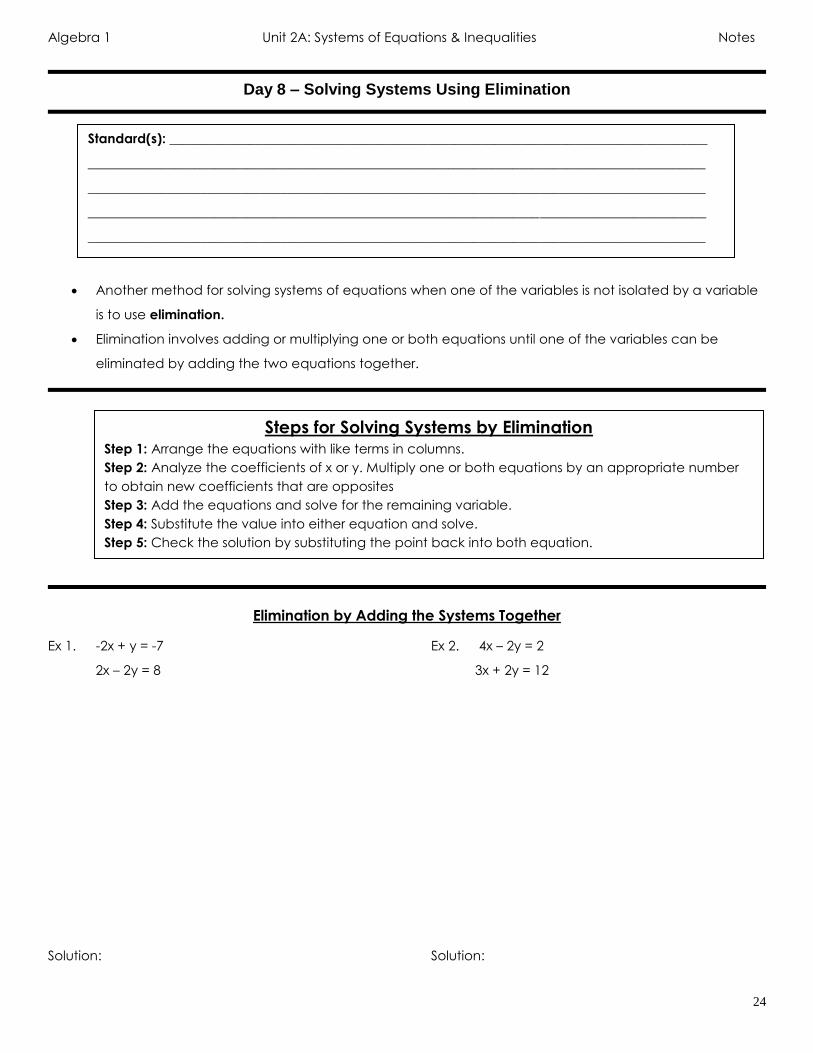
Day 8 – Solving Systems Using Elimination
Another method for solving systems of equations when one of the variables is not isolated by a variable
is to use elimination.
Elimination involves adding or multiplying one or both equations until one of the variables can be
eliminated by adding the two equations together.
Elimination by Adding the Systems Together
Ex 1. -2x + y = -7 Ex 2. 4x – 2y = 2
2x – 2y = 8 3x + 2y = 12
Solution: Solution:
Steps for Solving Systems by Elimination Step 1: Arrange the equations with like terms in columns.
Step 2: Analyze the coefficients of x or y. Multiply one or both equations by an appropriate number
to obtain new coefficients that are opposites
Step 3: Add the equations and solve for the remaining variable.
Step 4: Substitute the value into either equation and solve.
Step 5: Check the solution by substituting the point back into both equation.
Standard(s): _________________________________________________________________________________
_____________________________________________________________________________________________
_____________________________________________________________________________________________
_____________________________________________________________________________________________
_____________________________________________________________________________________________

Algebra 1 Unit 2A: Systems of Equations & Inequalities Notes
25
Elimination by Rearranging and Adding the Systems Together
Ex 3. 8x = -16 - y Ex 4. 2x + y = 8
3x – y = 5 – y = 3 + 2x
Solution: Solution:
Elimination by Multiplying the Equations and Then Adding the Equations Together
Ex 5. x + 12y = -15 Ex 6. 6x + 8y = 12
-2x – 6y = -6 2x – 5y = -19
Solution: Solution:

Algebra 1 Unit 2A: Systems of Equations & Inequalities Notes
26
Elimination by Multiplying Both Equations by a Constant and then Adding
a. 5x – 4y = -1 b. -6x + 12y = -6
8x + 7y = -15 -5x + 10y = -5
Solution: Solution:
Number of Solutions
1 Solution Infinitely Many Solutions No Solution
So
lvin
g M
eth
od
s
Gra
ph
ing
When graphed, the 2 lines
intersect once.
When graphed, the 2 lines
lie on top of one another.
When graphed, the 2 lines are
strictly parallel.
Su
bst
itu
tio
n
When using either substitution or
elimination, you should get a
value for either x or y. You should
be able to find the other value by
substituting either x or y back into
the original equation.
When using either substitution or
elimination, you will get an
equation that has no variable and
is always true.
For example: 2=2 or -5=-5
When using either substitution or
elimination, you will get an
equation that has no variable and
is never true.
For example: 0=6 or -2=4
Elim
ina
tio
n

Algebra 1 Unit 2A: Systems of Equations & Inequalities Notes
27
Day 9 – Real World Applications of Systems
Problem Solving with Substitution
Example 1: Loren’s marble jar contains plain marbles and colored marbles. If there are 32 more plain marbles
than colored marbles, and there are 180 marbles total, how many of each kind of marble does she have?
a. Define your variables (what two things are you comparing?)
b. Create two equations to describe the scenario.
Equation 1: _______________________ (relationship between plain and colored marbles)
Equation 2: _______________________ (number of marbles total)
c. Solve the system:
Example 2: A bride to be had already finished assembling 16 wedding favors when the maid of honor came
into the room for help. The bride assembles at a rate of 2 favors per minute. In contrast, the maid of honor
works at a speed of 3 favors per minute. Eventually, they will both have assembled the same number of favors.
How many favors will each have made? How long did it take?
a. Define your variables (what two things are you comparing?)
b. Create two equations to describe the scenario.
Equation 1: _______________________ (bride’s rate)
Equation 2: _______________________ (maid of honor’s rate)
c. Solve the system:
Standard(s): _________________________________________________________________________________
_____________________________________________________________________________________________
_____________________________________________________________________________________________
_____________________________________________________________________________________________
_____________________________________________________________________________________________

Algebra 1 Unit 2A: Systems of Equations & Inequalities Notes
28
Problem Solving with Elimination
1. Love Street is have a sale on jewelry and hair accessories. You can buy 5 pieces of jewelry and 6 hair
accessories for 34.50 or 2 pieces of jewelry and 16 hair accessories for $33.00. This can be modeled by the
equations: 5x 8y 34.50
2x 16y 33.00
. How much is each piece of jewelry and hair accessories?
a. What does x and y represent? d. Solve the system of equations:
b. Explain what the first equation represents:
c. Explain what the second equation represents:
2. A test has twenty questions worth 100 points. The test consists of True/False questions worth 3 points each and
multiple choice questions worth 11 points each. This can be modeled byx y 20
3x 11y 100
. How many multiple
choice and True/False questions are on the test?
a. What does x and y represent? d. Solve the system of equations:
b. Explain what the first equation represents:
c. Explain what the second equation represents:

Algebra 1 Unit 2A: Systems of Equations & Inequalities Notes
29
How Many Solutions to the System?
Method One Solution No Solutions Infinite Solutions
Gra
ph
ing
Best to use when:
Both equations are in slope
intercept form.
(y = mx + b)
EX: y = 3x – 1
y = -x + 4
Solutions are integer
coordinate points (no
decimals or fractions)
Solution is the point of
intersection.
Different Slope
Different y-intercept
Lines are parallel and
do not intersect.
(Slopes are equal)
Same Slope
Different y-intercept
Lines are identical
and intersect at every
point.
Same Slope
Same y-intercept
(Same Equations)
Su
bs
titu
tio
n
Best to use when:
One equation has been
solved for a variable or both
equations are solved for the
same variable.
EX: y = 2x + 1 or y = 3x - 1
3x – 2y = 10 y = -x + 4
After substituting and
simplifying, you will be
left with:
x = #
y = #
Solution will take the
form of (x, y)
After substituting,
variables will form
zero pairs and you will
be left with a FALSE
equation.
3 = 6
After substituting,
variables will form
zero pairs and will
leave you with a TRUE
equation.
4 = 4
Elim
ina
tio
n
Best to use when:
Both equations are in
standard form.
(Ax + By = C)
Coefficients of variables are
opposites.
3x + 6y = 5
-3x – 8y = 2
Equations can be easily
made into opposites using
multiplication.
-2(4x + 2y = 5)
8x – 6y = -5
After eliminating and
simplifying, you will be
left with:
x = #
y = #
Solution will take the
form of (x, y)
After eliminating,
variables will form
zero pairs and you will
be left with a FALSE
equation.
0 = 5
After eliminating,
variables will form
zero pairs and will
leave you with a TRUE
equation.
0 = 0
Algebra 1 Unit 2A: Systems of Equations & Inequalities Notes
30
Day 10 – Real World Applications of Systems (More Practice)
Scenario 1: The admission fee for the county fair includes parking, amusement rides, and admission to all
commercial, agricultural, and judging exhibits. The cost for general admission is $7 and the price for children is
$4. There were 449 people who attended the fair on Thursday. The admission fees collected amounted to
$2768. How many children and adults attended the fair?
Scenario 2: Ms. Ross told her class that tomorrow’s math test will have 20 questions and be worth 100 points. The
multiple choice questions will be 3 points each and the open ended response questions will be 8 points each.
Determine how many multiple choice and open ended response questions are on the test.
Standard(s): _________________________________________________________________________________
_____________________________________________________________________________________________
_____________________________________________________________________________________________
_____________________________________________________________________________________________
_____________________________________________________________________________________________

Algebra 1 Unit 2A: Systems of Equations & Inequalities Notes
31
Scenario 3: The Strauss family is deciding between two lawn care services. Green Lawn charges a $49 startup
fee, plus $29 per month. Grass Team charges a $25 startup fee, plus $37 per month.
a. In how many months will both lawn care services costs the same? What will that cost be?
b. If the family will use the service for only 6 months, which is the better option? Explain.
Scenario 4: The following graph shows the cost for going to two different skating rinks.
a. When is it cheaper to go to Roller Rink A?
b. When it is cheaper to go to Roller Rink B?
c. When does it cost the same to go to either roller rink?

Algebra 1 Unit 2A: Systems of Equations & Inequalities Notes
32
Profits, Costs, and Break Even Points
Production Cost
The cost incurred when manufacturing a good or providing a service
Income
Money earned from the sale of goods or services
Profit
Production Cost – Income
When income is higher than production costs, you make a ____________
When income is lower than production costs, you make a ____________
Break Even-Point
The point where Production Costs = Income
Can be found by finding the intersection of the two lines (x, y)
The x-coordinate of the break-even point represents how many of an item you need to make and sell to
break-even
The y-coordinate of the break-even point represents how much the company spent making the item
and then selling the item
Practice 1: Find the break-even point for the following graphs. How many of each item will the company need
to sell to make a profit?
Practice 2: The cost to take pictures at a school dance is $200 for the photographer and $3 per print. The
dance committee decides to charge $5 per print. How many pictures need to be taken for the dance
committee to break-even? How many pictures need to be taken to make a profit?
Point of Intersection: ___________________
Break Even Point:
They need to sell at least _________
basketballs to make a profit.

Algebra 1 Unit 2A: Systems of Equations & Inequalities Notes
33
Day 11 – Graphing Linear Inequalities
A linear inequality is similar to an equation as you learned before, but the equal sign is replaced with an
inequality symbol. A solution to an inequality is any ordered pair that makes the inequality true.
Ex. Tell whether the ordered pair is a solution to the inequality.
(7, 3); y < 2x – 3 (4, 5); y < x + 1 (4, 5); y ≤ x + 1
A linear inequality describes a region of a coordinate plane called a half-plane. All the points in the shaded
region are solutions of the linear inequality. The boundary line is the line of the equation you graph.
Ex. Graph the inequality: Ex. Graph the inequality:
Symbol Type of Line Shading
< Dashed Below boundary line
> Dashed Above boundary line
≤ Solid Below boundary line
≥ Solid Above boundary line
Graphing Linear Inequalities
Step 1: Solve the inequality for y (if necessary).
Step 2: Graph the boundary line using a solid line for ≤ or ≥ OR a dashed line for < or >.
Step 3:
If the inequality is > or ≥, shade above the boundary line
If the inequality is < or ≤, shade below the boundary line
OR
Select a test point and substitute it into linear inequality.
If the test point gives you a true inequality, you shade the region where the test point is located.
If the test point gives you a false inequality, you shade the region where the test point is NOT
located.
Standard(s): _________________________________________________________________________________
_____________________________________________________________________________________________
_____________________________________________________________________________________________
_____________________________________________________________________________________________
_____________________________________________________________________________________________

Algebra 1 Unit 2A: Systems of Equations & Inequalities Notes
34
Practice Graphing Linear Inequalities
a. y < 3x + 4 b. 4x – 3y > 12
Test Point: Test Point:
Naming Linear Inequalities
What information do you need to look at to name a linear inequality from a graph?
___________________________________
___________________________________
___________________________________
___________________________________
Practice: Name each linear inequality from the graph:
a. b.
-8 -6 -4 -2 2 4 6 8
-8
-6
-4
-2
2
4
6
8
-8 -6 -4 -2 2 4 6 8
-8
-6
-4
-2
2
4
6
8
Foundations of Algebra Unit 2A: Systems of Equations & Inequalities Notes
35
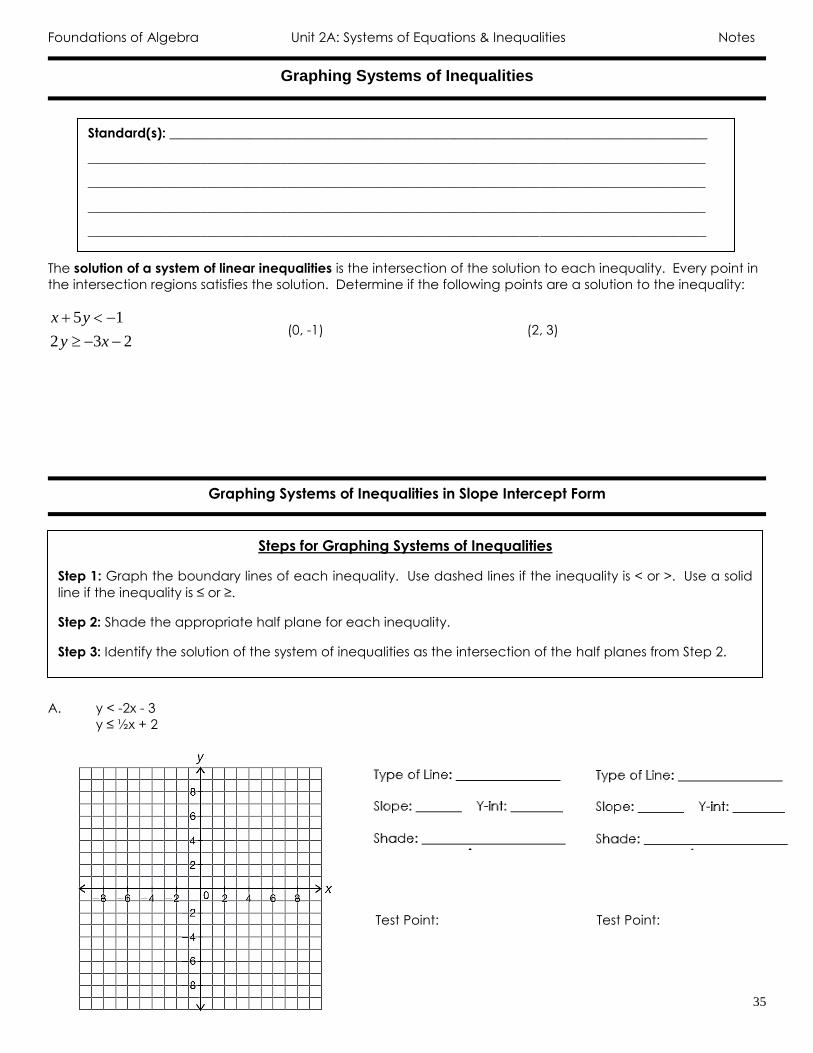
Graphing Systems of Inequalities
The solution of a system of linear inequalities is the intersection of the solution to each inequality. Every point in
the intersection regions satisfies the solution. Determine if the following points are a solution to the inequality:
5 1
2 3 2
x y
y x
(0, -1) (2, 3)
Graphing Systems of Inequalities in Slope Intercept Form
A. y < -2x - 3
y ≤ ½x + 2
Test Point: Test Point:
Steps for Graphing Systems of Inequalities
Step 1: Graph the boundary lines of each inequality. Use dashed lines if the inequality is < or >. Use a solid
line if the inequality is ≤ or ≥.
Step 2: Shade the appropriate half plane for each inequality.
Step 3: Identify the solution of the system of inequalities as the intersection of the half planes from Step 2.
Standard(s): _________________________________________________________________________________
_____________________________________________________________________________________________
_____________________________________________________________________________________________
_____________________________________________________________________________________________
_____________________________________________________________________________________________
Foundations of Algebra Unit 2A: Systems of Equations & Inequalities Notes
36
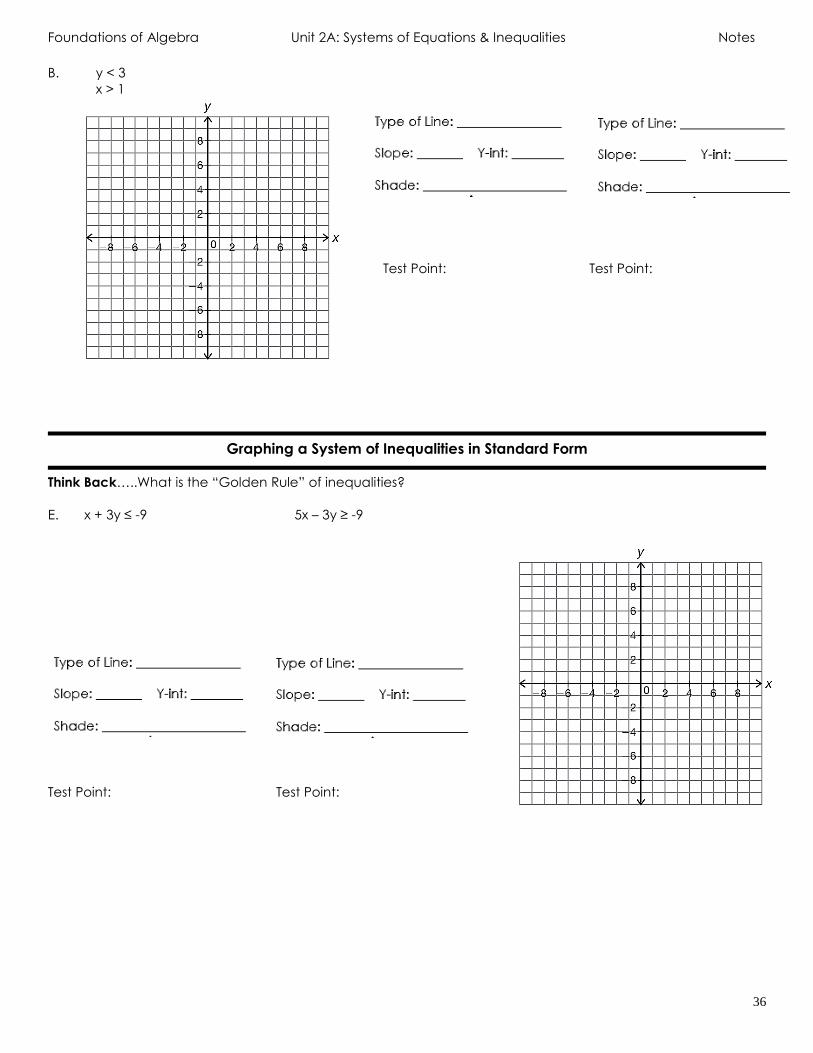
B. y < 3
x > 1
Test Point: Test Point:
Graphing a System of Inequalities in Standard Form
Think Back…..What is the “Golden Rule” of inequalities?
E. x + 3y ≤ -9 5x – 3y ≥ -9
Test Point: Test Point:

Foundations of Algebra Unit 2A: Systems of Equations & Inequalities Notes
37
Warning…Potential Misconception!!!
Do you think the point (-1, 3) is a solution to the inequality?
Create a System of Inequalities from a Graph
What information do you need to look at to name a system of inequalities from a graph?
___________________________________
___________________________________
___________________________________
___________________________________
Practice: Name each system of inequalities from the graph:
Line 1: _______________________________ Line 1: _______________________________
Line 2: _______________________________ Line 2: _______________________________
Determining Solutions Located on a Boundary Line
If a point lies on a solid line, it is ______________________________________.
If a point lies on a dashed line, it is _____________________________________.
It must be true or a solution for both inequalities/boundary lines to be a solution!

Foundations of Algebra Unit 2A: Systems of Equations & Inequalities Notes
38
Day 12 – Systems of Inequalities Applications
Review: Graph the systems of inequalities:
a.
Problem Solving with Linear Inequalities
Example 1: Noah plays football. His team’s goal is to score at
least 24 points per game. A touchdown is worth 6 points and a
field goal is worth 3 points. Noah’s league does not allow the
teams to try for the extra point after a touchdown. The inequality
6x + 3y ≥ 24 represents the possible ways Noah’s team could
score points to reach their goal.
a. Graph the inequality on the graph.
b. Are the following combinations solutions to the problem
situation? Use your graph AND algebra to answer the following:
1. 2 touchdowns and 1 field goal
2. 1 touchdown and 5 field goals 3. 3 touchdowns and 3 field goals
Standard(s): _________________________________________________________________________________
_____________________________________________________________________________________________
_____________________________________________________________________________________________
_____________________________________________________________________________________________
_____________________________________________________________________________________________

Foundations of Algebra Unit 2A: Systems of Equations & Inequalities Notes
39
Creating Systems of Inequalities
Write a system of inequalities to describe each scenario.
a. Jamal runs the bouncy house a festival. The bouncy house can hold a maximum of 1200 pounds at one
time. He estimates that adults weight approximately 200 pounds and children under 16 weight approximately
100 pounds. For 1 four minute session of bounce time, Jamal charges adults $3 each and children $2 each.
Jamal hopes to make at least $18 for each session.
Define your variables:
Write a system of inequalities
Inequality 1: ___________________________ describes ____________________________________
Inequality 2: ___________________________ describes ____________________________________
If 4 adults and 5 children are in 1 session, will that be a solution to the inequalities?
If 2 adults and 7 children are in 1 session, will that be a solution to the inequalities?
b. Charles works at a movie theater selling tickets. The theater has 300 seats and charges $7.50 for adults and
$5.50 for children. The theater expects to make at least $1500 for each showing.
Define your variables:
Write a system of inequalities
Inequality 1: ___________________________ describes ____________________________________
Inequality 2: ___________________________ describes ____________________________________
If 150 adults and 180 children attend, will that be a solution to the inequalities?
If 175 adults and 105 children attend, will that be a solution to the inequalities?