Algebra 1 - standards.ospi.k12.wa.usstandards.ospi.k12.wa.us/.../Mathematics/HS_Algebra1.pdf ·...
23
Algebra 1, Geometry, Algebra 2 July 2008 8 Washington State K–12 Mathematics Standards Algebra 1 A1.1. Core Content: Solving Problems (Algebra) Students learn to solve many new types of problems in Algebra 1, and this first core content area highlights the types of problems students will be able to solve after they master the concepts and skills in this course. Students are introduced to several types of functions, including exponential and functions defined piecewise, and they spend considerable time with linear and quadratic functions. Each type of function included in Algebra I provides students a tool to solve yet another class of problems. They learn that specific functions model situations described in word problems, and so functions are used to solve various types of problems. The ability to determine functions and write equations that represent problems is an important mathematical skill in itself, Many problems that initially appear to be very different from each other can actually be represented by identical equations. Students encounter this important and unifying principle of algebra—that the same algebraic techniques can be applied to a wide variety of different situations. Performance Expectation Explanatory Comments and Examples Students are expected to: A1.1.A Select and justify functions and equations to model and solve problems. Students can analyze the rate of change of a function represented with a table or graph to determine if the function is linear. Students also analyze common ratios to determine if the function is exponential. After selecting a function to model a situation, students describe appropriate domain restrictions. They use the function to solve the problem and interpret the solution in the context of the original situation. Examples: • A cup is 6 cm tall, including a 1.1 cm lip. Find a function that represents the height of a stack of cups in terms of the number of cups in the stack. Find a function that represents the number of cups in a stack of a given height. • For the month of July, Michelle will be dog-sitting for her very wealthy, but eccentric, neighbor, Mrs. Buffett. Mrs. Buffett offers Michelle two different salary plans: — Plan 1: $100 per day for the 31 days of the month. — Plan 2: $1 for July 1, $2 for July 2, $4 for July 3, and so on, with the daily rate doubling each day. a. Write functions that model the amount of money Michelle will earn each day on Plan 1 and Plan 2. Justify the functions you wrote. b. State an appropriate domain for each of the models based on the context. c. Which plan should Michelle choose to maximize her earnings? Justify your recommendation mathematically.
-
Upload
trinhnguyet -
Category
Documents
-
view
222 -
download
0
Transcript of Algebra 1 - standards.ospi.k12.wa.usstandards.ospi.k12.wa.us/.../Mathematics/HS_Algebra1.pdf ·...

Algebra 1, Geometry, Algebra 2 July 2008 8 Washington State K–12 Mathematics Standards
Algebra 1 A1.1. Core Content: Solving Problems (Algebra)
Students learn to solve many new types of problems in Algebra 1, and this first core content area highlights the types of problems students will be able to solve after they master the concepts and skills in this course. Students are introduced to several types of functions, including exponential and functions defined piecewise, and they spend considerable time with linear and quadratic functions. Each type of function included in Algebra I provides students a tool to solve yet another class of problems. They learn that specific functions model situations described in word problems, and so functions are used to solve various types of problems. The ability to determine functions and write equations that represent problems is an important mathematical skill in itself, Many problems that initially appear to be very different from each other can actually be represented by identical equations. Students encounter this important and unifying principle of algebra—that the same algebraic techniques can be applied to a wide variety of different situations.
Performance Expectation Explanatory Comments and Examples Students are expected to:
A1.1.A Select and justify functions and equations to model and solve problems.
Students can analyze the rate of change of a function represented with a table or graph to determine if the function is linear. Students also analyze common ratios to determine if the function is exponential.
After selecting a function to model a situation, students describe appropriate domain restrictions. They use the function to solve the problem and interpret the solution in the context of the original situation.
Examples:
• A cup is 6 cm tall, including a 1.1 cm lip. Find a function that represents the height of a stack of cups in terms of the number of cups in the stack. Find a function that represents the number of cups in a stack of a given height.
• For the month of July, Michelle will be dog-sitting for her very wealthy, but eccentric, neighbor, Mrs. Buffett. Mrs. Buffett offers Michelle two different salary plans:
— Plan 1: $100 per day for the 31 days of the month.
— Plan 2: $1 for July 1, $2 for July 2, $4 for July 3, and so on, with the daily rate doubling each day.
a. Write functions that model the amount of money Michelle will earn each day on Plan 1 and Plan 2. Justify the functions you wrote.
b. State an appropriate domain for each of the models based on the context.
c. Which plan should Michelle choose to maximize her earnings? Justify your recommendation mathematically.

July 2008 Algebra 1, Geometry, Algebra 2 Washington State K–12 Mathematics Standards 9
Performance Expectation Explanatory Comments and Examples Students are expected to:
d. Extension: Write an algebraic function for the cumulative pay for each plan based on the number of days worked.
A1.1.B Solve problems that can be represented by linear functions, equations, and inequalities.
It is mathematically important to represent a word problem as an equation. Students must analyze the situation and find a way to represent it mathematically. After solving the equation, students think about the solution in terms of the original problem.
Examples:
• The assistant pizza maker makes 6 pizzas an hour. The master pizza maker makes 10 pizzas an hour but starts baking two hours later than his assistant. Together, they must make 92 pizzas. How many hours from when the assistant starts baking will it take?
What is a general equation, in function form, that could be used to determine the number of pizzas that can be made in two or more hours?
• A swimming pool holds 375,000 liters of water. Two large hoses are used to fill the pool. The first hose fills at the rate of 1,500 liters per hour and the second hose fills at the rate of 2,000 liters per hour. How many hours does it take to fill the pool completely?
A1.1.C Solve problems that can be represented by a system of two linear equations or inequalities.
Examples:
• An airplane flies from Baltimore to Seattle (assume a distance of 2,400 miles) in 7 hours, but the return flight takes only 4
1
2
hours. The air speed of the plane is the
same in both directions. How many miles per hour does the plane fly with respect to the wind? What is the wind speed in miles per hour?
• A coffee shop employee has one cup of 85% milk (the rest is chocolate) and another cup of 60% milk (the rest is chocolate). He wants to make one cup of 70% milk How much of the 85% milk and 60% milk should he mix together to make the 70% milk?
• Two plumbing companies charge different rates for their service. Clyde’s Plumbing Company charges a $75-per-visit fee that includes one hour of labor plus $45 dollars per hour after the first hour. We-Unclog-It Plumbers charges a $100-per-visit fee that includes one hour of labor plus $40 per hour after the first hour. For how many hours of plumbing work would Clyde’s be less expensive than We-Unclog-It?
Note: Although this context is discrete, students can model it with continuous linear functions.

Algebra 1, Geometry, Algebra 2 July 2008 10 Washington State K–12 Mathematics Standards
Performance Expectation Explanatory Comments and Examples Students are expected to:
A1.1.D Solve problems that can be represented by quadratic functions and equations.
Examples:
• Find the solutions to the simultaneous equations y = x + 2 and y = x2.
• If you throw a ball straight up (with initial height of 4 feet) at 10 feet per second, how long will it take to fall back to the starting point? The function h(t) = -16t2 + v0t + h0 describes the height, h in feet, of an object after t seconds, with initial velocity v0 and initial height h0.
• Joe owns a small plot of land 20 feet by 30 feet. He wants to double the area by increasing both the length and the width, keeping the dimensions in the same proportion as the original. What will be the new length and width?
• What two consecutive numbers, when multiplied together, give the first number plus 16? Write the equation that represents the situation.
A1.1.E Solve problems that can be represented by exponential functions and equations.
Students approximate solutions with graphs or tables, check solutions numerically, and when possible, solve problems exactly.
Examples:
• E. coli bacteria reproduce by a simple process called binary fission—each cell increases in size and divides into two cells. In the laboratory, E. coli bacteria divide approximately every 15 minutes. A new E. coli culture is started with 1 cell.
a. Find a function that models the E. coli population size at the end of each 15-minute interval. Justify the function you found.
b. State an appropriate domain for the model based on the context.
c. After what 15-minute interval will you have at least 500 bacteria?
• Estimate the solution to 2x = 16,384

July 2008 Algebra 1, Geometry, Algebra 2 Washington State K–12 Mathematics Standards 11
Algebra 1 A1.2. Core Content: Numbers, expressions, and operations (Numbers, Operations, Algebra)
Students see the number system extended to the real numbers represented by the number line. They work with integer exponents, scientific notation, and radicals, and use variables and expressions to solve problems from purely mathematical as well as applied contexts. They build on their understanding of computation using arithmetic operations and properties and expand this understanding to include the symbolic language of algebra. Students demonstrate this ability to write and manipulate a wide variety of algebraic expressions throughout high school mathematics as they apply algebraic procedures to solve problems.
Performance Expectation Explanatory Comments and Examples Students are expected to:
A1.2.A Know the relationship between real numbers and the number line, and compare and order real numbers with and without the number line.
Although a formal definition of real numbers is beyond the scope of Algebra 1, students learn that every point on the number line represents a real number, either rational or irrational, and that every real number has its unique point on the number line. They locate, compare, and order real numbers on the number line.
Real numbers include those written in scientific notation or expressed as fractions, decimals, exponentials, or roots.
Examples:
• Without using a calculator, order the following on the number line:
82 , 3π, 8.9, 9,
37
4
, 9.3 × 100
• A star’s color gives an indication of its temperature and age. The chart shows four types of stars and the lowest temperature of each type.
List the temperatures in order from lowest to highest.

Algebra 1, Geometry, Algebra 2 July 2008 12 Washington State K–12 Mathematics Standards
Performance Expectation Explanatory Comments and Examples Students are expected to:
A1.2.B Recognize the multiple uses of variables, determine all possible values of variables that satisfy prescribed conditions, and evaluate algebraic expressions that involve variables.
Students learn to use letters as variables and in other ways that increase in sophistication throughout high school. For example, students learn that letters can be used:
• To represent fixed and temporarily unknown values in equations, such as 3x + 2 = 5;
• To express identities, such as x + x = 2x for all x;
• As attributes in formulas, such as A = lw;
• As constants such as a, b, and c in the equation y = ax2 + bx + c;
• As parameters in equations, such as the m and b for the family of functions defined by y = mx + b;
• To represent varying quantities, such as x in f(x) = 5x;
• To represent functions, such as f in f(x) = 5x; and
• To represent specific numbers, such as π.
Expressions include those involving polynomials, radicals, absolute values, and integer exponents.
Examples:
• For what values of a and n, where n is an integer greater than 0, is an always negative?
• For what values of a is
1
a
an integer?
• For what values of a is 5 – a defined?
• For what values of a is -a always positive?
A1.2.C Interpret and use integer exponents and square and cube roots, and apply the laws and properties of exponents to simplify and evaluate exponential expressions.
Examples:
• 2-3 =
1
23
•
2-23
25
223
-35
2=
35
245
•
a-2b
2c
a2b
-3c
2=
b5
a4c
• 8 = 2• 2• 2 = 2 2
• a •b3
= a3
• b3

July 2008 Algebra 1, Geometry, Algebra 2 Washington State K–12 Mathematics Standards 13
Performance Expectation Explanatory Comments and Examples Students are expected to:
A1.2.D Determine whether approximations or exact values of real numbers are appropriate, depending on the context, and justify the selection.
Decimal approximations of numbers are sometimes used in applications such as carpentry or engineering, while at other times, these applications may require exact values. Students should understand the difference and know that the appropriate approximation depends upon the necessary degree of precision needed in given situations.
For example, 1.414 is an approximation and not an exact
solution to the equation x2 – 2 = 0, but 2 is an exact solution to this equation.
Example:
• Using a common engineering formula, an engineering student represented the maximum safe load of a bridge to be 1000(99 – 70 2 ) tons. He
used 1.41 as the approximation for 2 in his calculations. When the bridge was built and tested in a computer simulation to verify its maximum weight-bearing load, it collapsed! The student had estimated the bridge would hold ten times the weight that was applied to it when it collapsed.
— Calculate the weight that the student thought the bridge could bear using 1.41 as the estimate for
2 .
— Calculate other weight values using estimates of
2 that have more decimal places. What might be a reasonable degree of precision required to know how much weight the bridge can handle safely? Justify your answer.
A1.2.E Use algebraic properties to factor and combine like terms in polynomials.
Algebraic properties include the commutative, associative, and distributive properties.
Factoring includes:
• Factoring a monomial from a polynomial, such as 4x2 + 6x = 2x(2x + 3);
• Factoring the difference of two squares, such as 36x2 – 25y2 = (6x + 5y)(6x – 5y) and x4 – y4 = (x + y)(x – y)(x2 + y2);
• Factoring perfect square trinomials, such as x2 + 6xy + 9y2 = (x + 3y)2;
• Factoring quadratic trinomials such as x2 + 5x + 4 = (x + 4)(x + 1); and

Algebra 1, Geometry, Algebra 2 July 2008 14 Washington State K–12 Mathematics Standards
Performance Expectation Explanatory Comments and Examples Students are expected to:
• Factoring trinomials that can be expressed as the product of a constant and a trinomial, such as 0.5x2 – 2.5x – 7 = 0.5(x + 2)(x – 7).
A1.2.F Add, subtract, multiply, and divide polynomials.
Write algebraic expressions in equivalent forms using algebraic properties to perform the four arithmetic operations with polynomials.
Students should recognize that expressions are essentially sums, products, differences, or quotients. For example, the sum 2x2 + 4x can be written as a product, 2x(x + 2).
Examples:
• (3x2 – 4x + 5) + (-x2 + x – 4) + (2x2 + 2x + 1)
• (2x2 – 4) – (x2 + 3x – 3)
•
2x2
9•
6
2x4
•
x2 – 2x – 3
x +1

July 2008 Algebra 1, Geometry, Algebra 2 Washington State K–12 Mathematics Standards 15
Algebra 1 A1.3. Core Content: Characteristics and behaviors of functions (Algebra)
Students formalize and deepen their understanding of functions, the defining characteristics and uses of functions, and the mathematical language used to describe functions. They learn that functions are often specified by an equation of the form y = f(x), where any allowable x-value yields a unique y-value. While Algebra 1 has a particular focus on linear and quadratic equations and systems of equations, students also learn about exponential functions and those that can be defined piecewise, particularly step functions and functions that contain the absolute value of an expression. Students learn about the representations and basic transformations of these functions and the practical and mathematical limitations that must be considered when working with functions and when using functions to model situations.
Performance Expectation Explanatory Comments and Examples Students are expected to:
A1.3.A Determine whether a relationship is a function and identify the domain, range, roots, and independent and dependent variables.
Functions studied in Algebra 1 include linear, quadratic, exponential, and those defined piecewise (including step functions and those that contain the absolute value of an expression).
Given a problem situation, students should describe further restrictions on the domain of a function that are appropriate for the problem context.
Examples:
• Which of the following are functions? Explain why or why not.
— The age in years of each student in your math class and each student’s shoe size.
— The number of degrees a person rotates a spigot and the volume of water that comes out of the spigot.
• A function f(n) = 60n is used to model the distance in miles traveled by a car traveling 60 miles per hour in n hours. Identify the domain and range of this function. What restrictions on the domain of this function should be considered for the model to correctly reflect the situation?
• What is the domain of f(x) = 5 ! x ?
• Which of the following equations, inequalities, or graphs determine y as a function of x?
— y = 2
— x = 3
— y = |x|

Algebra 1, Geometry, Algebra 2 July 2008 16 Washington State K–12 Mathematics Standards
Performance Expectation Explanatory Comments and Examples Students are expected to:
—
y =x + 3, x ! 1
x " 2, x > 1
#$%&
— x2 + y2 = 1
A1.3.B Represent a function with a symbolic expression, as a graph, in a table, and using words, and make connections among these representations.
This expectation applies each time a new class (family) of functions is encountered. In Algebra 1, students should be introduced to a variety of additional functions that include
expressions such as x3, x ,
1
x
, and absolute values. They
will study these functions in depth in subsequent courses.
Students should know that f(x) =
a
x
represents an inverse
variation. Students begin to describe the graph of a function from its symbolic expression, and use key characteristics of the graph of a function to infer properties of the related symbolic expression.
Translating among these various representations of functions is an important way to demonstrate conceptual understanding of functions.
Students learn that each representation has particular advantages and limitations. For example, a graph shows the shape of a function, but not exact values. They also learn that a table of values may not uniquely determine a single function without some specification of the nature of that function (e.g., it is quadratic).
A1.3.C Evaluate f(x) at a (i.e., f(a)) and solve for x in the equation f(x) = b.
Functions may be described and evaluated with symbolic expressions, tables, graphs, or verbal descriptions.
Students should distinguish between solving for f(x) and evaluating a function at x.
July 2008 Algebra 1, Geometry, Algebra 2 Washington State K–12 Mathematics Standards 17
Performance Expectation Explanatory Comments and Examples Students are expected to:
Example:
• Roses-R-Red sells its roses for $0.75 per stem and charges a $20 delivery fee per order.
— What is the cost of having 10 roses delivered?
— How many roses can you have delivered for $65?

Algebra 1, Geometry, Algebra 2 July 2008 18 Washington State K–12 Mathematics Standards
Algebra 1 A1.4. Core Content: Linear functions, equations, and inequalities (Algebra)
Students understand that linear functions can be used to model situations involving a constant rate of change. They build on the work done in middle school to solve sets of linear equations and inequalities in two variables, learning to interpret the intersection of the lines as the solution. While the focus is on solving equations, students also learn graphical and numerical methods for approximating solutions to equations. They use linear functions to analyze relationships, represent and model problems, and answer questions. These algebraic skills are applied in other Core Content areas across high school courses.
Performance Expectation Explanatory Comments and Examples Students are expected to:
A1.4.A Write and solve linear equations and inequalities in one variable.
This expectation includes the use of absolute values in the equations and inequalities.
Examples:
• Write an absolute value equation or inequality for
— all the numbers 2 units from 7, and
— all the numbers that are more than b units from a.
• Solve |x – 6| ≤ 4 and locate the solution on the number line.
• Write an equation or inequality that has
— no real solutions;
— infinite numbers of real solutions; and
— exactly one real solution.
• Solve for x in 2(x – 3) + 4x = 15 + 2x.
• Solve 8.5 < 3x + 2 ≤ 9.7 and locate the solution on the number line.
A1.4.B Write and graph an equation for a line given the slope and the y-intercept, the slope and a point on the line, or two points on the line, and translate between forms of linear equations.
Linear equations may be written in slope-intercept, point-slope, and standard form.
Examples:
• Find an equation for a line with y-intercept equal to 2 and slope equal to 3.
• Find an equation for a line with a slope of 2 that goes through the point (1, 1).
• Find an equation for a line that goes through the points (-3, 5) and (6, -2).
July 2008 Algebra 1, Geometry, Algebra 2 Washington State K–12 Mathematics Standards 19
Performance Expectation Explanatory Comments and Examples Students are expected to:
• For each of the following, use only the equation (without sketching the graph) to describe the graph.
— y = 2x + 3
— y – 7 = 2(x – 2)
• Write the equation 3x + 2y = 5 in slope intercept form.
• Write the equation y – 1 = 2(x – 2) in standard form.
A1.4.C Identify and interpret the slope and intercepts of a linear function, including equations for parallel and perpendicular lines.
Examples:
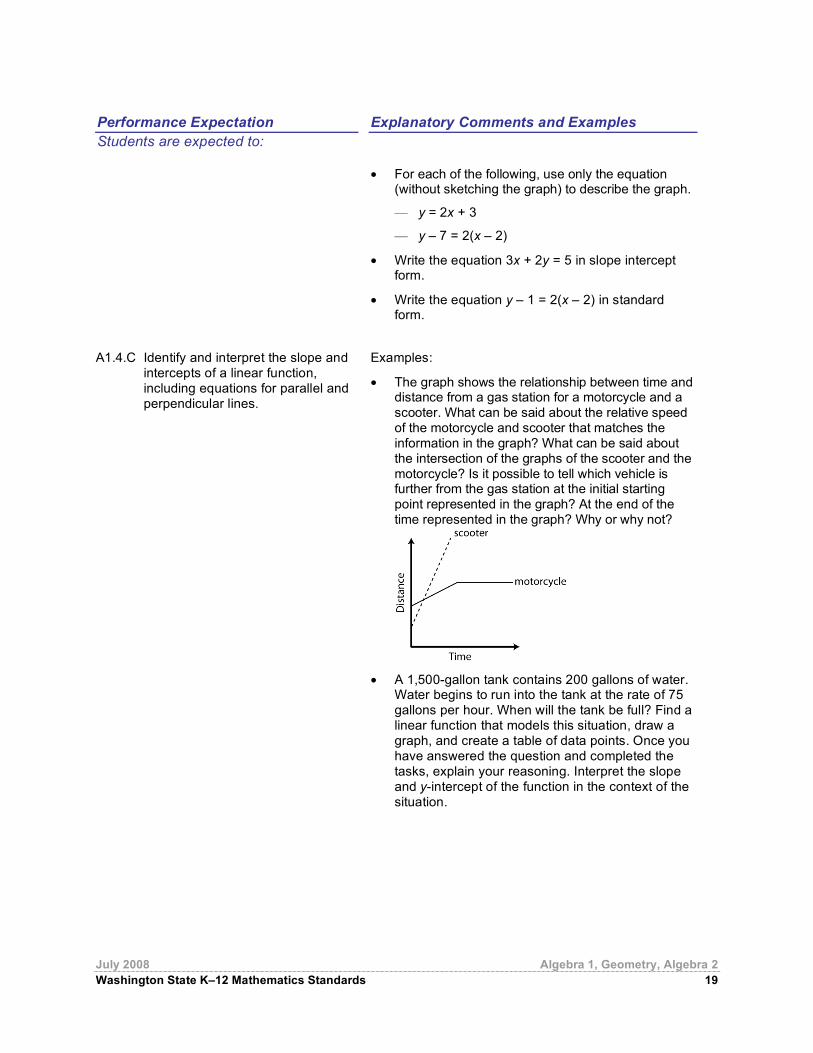
• The graph shows the relationship between time and distance from a gas station for a motorcycle and a scooter. What can be said about the relative speed of the motorcycle and scooter that matches the information in the graph? What can be said about the intersection of the graphs of the scooter and the motorcycle? Is it possible to tell which vehicle is further from the gas station at the initial starting point represented in the graph? At the end of the time represented in the graph? Why or why not?
• A 1,500-gallon tank contains 200 gallons of water.
Water begins to run into the tank at the rate of 75 gallons per hour. When will the tank be full? Find a linear function that models this situation, draw a graph, and create a table of data points. Once you have answered the question and completed the tasks, explain your reasoning. Interpret the slope and y-intercept of the function in the context of the situation.

Algebra 1, Geometry, Algebra 2 July 2008 20 Washington State K–12 Mathematics Standards
Performance Expectation Explanatory Comments and Examples Students are expected to:
• Given that the figure below is a square, find the slope of the perpendicular sides AB and BC. Describe the relationship between the two slopes.
A1.4.D Write and solve systems of two linear equations and inequalities in two variables.
Students solve both symbolic and word problems, understanding that the solution to a problem is given by the coordinates of the intersection of the two lines when the lines are graphed in the same coordinate plane.
Examples:
• Solve the following simultaneous linear equations algebraically:
— -2x + y = 2
— x + y = -1
• Graph the above two linear equations on the same coordinate plane and use the graph to verify the algebraic solution.
• An academic team is going to a state mathematics competition. There are 30 people going on the trip. There are 5 people who can drive and 2 types of vehicles, vans and cars. A van seats 8 people, and a car seats 4 people, including drivers. How many vans and cars does the team need for the trip? Explain your reasoning.
Let v = number of vans and c = number of cars.
v + c ≤ 5
8v + 4c > 30

July 2008 Algebra 1, Geometry, Algebra 2 Washington State K–12 Mathematics Standards 21
Performance Expectation Explanatory Comments and Examples Students are expected to:
A1.4.E Describe how changes in the parameters of linear functions and functions containing an absolute value of a linear expression affect their graphs and the relationships they represent.
In the case of a linear function y = f(x), expressed in slope-intercept form (y = mx + b), m and b are parameters. Students should know that f(x) = kx represents a direct variation (proportional relationship).
Examples:
• Graph a function of the form f(x) = kx, describe the effect that changes on k have on the graph and on f(x), and answer questions that arise in proportional situations.
• A gas station’s 10,000-gallon underground storage tank contains 1,000 gallons of gasoline. Tanker trucks pump gasoline into the tank at a rate of 400 gallons per minute. How long will it take to fill the tank? Find a function that represents this situation and then graph the function. If the flow rate increases from 400 to 500 gallons per minute, how will the graph of the function change? If the initial amount of gasoline in the tank changes from 1,000 to 2,000 gallons, how will the graph of the function change?
• Compare and contrast the functions y = 3|x| and
y = –
1
3x .

Algebra 1, Geometry, Algebra 2 July 2008 22 Washington State K–12 Mathematics Standards
Algebra 1 A1.5. Core Content: Quadratic functions and equations (Algebra)
Students study quadratic functions and their graphs, and solve quadratic equations with real roots in Algebra 1. They use quadratic functions to represent and model problems and answer questions in situations that are modeled by these functions. Students solve quadratic equations by factoring and computing with polynomials. The important mathematical technique of completing the square is developed enough so that the quadratic formula can be derived.
Performance Expectation Explanatory Comments and Examples Students are expected to:
A1.5.A Represent a quadratic function with a symbolic expression, as a graph, in a table, and with a description, and make connections among the representations.
Example:
• Kendre and Tyra built a tennis ball cannon that launches tennis balls straight up in the air at an initial velocity of 50 feet per second. The mouth of the cannon is 2 feet off the ground. The function h(t) = -16t2 + 50t + 2 describes the height, h, in feet, of the ball t seconds after the launch.
Make a table from the function. Then use the table to sketch a graph of the height of the tennis ball as a function of time into the launch. Give a verbal description of the graph. How high was the ball after 1 second? When does it reach this height again?
A1.5.B Sketch the graph of a quadratic function, describe the effects that changes in the parameters have on the graph, and interpret the x-intercepts as solutions to a quadratic equation.
Note that in Algebra 1, the parameter b in the term bx in the quadratic form ax2 + bx + c is not often used to provide useful information about the characteristics of the graph.
Parameters considered most useful are:
• a and c in f(x) = ax2 + c
• a, h, and k in f(x) = a(x – h)2 + k, and
• a, r, and s in f(x) = a(x – r)(x – s)
Example:
• A particular quadratic function can be expressed in the following two ways:
f(x) = -(x – 3)2 + 1 f(x) = -(x – 2)(x – 4)
— What information about the graph can be directly inferred from each of these forms? Explain your reasoning.
— Sketch the graph of this function, showing the roots.

July 2008 Algebra 1, Geometry, Algebra 2 Washington State K–12 Mathematics Standards 23
Performance Expectation Explanatory Comments and Examples Students are expected to:
A1.5.C Solve quadratic equations that can be factored as (ax + b)(cx + d) where a, b, c, and d are integers.
Students learn to efficiently solve quadratic equations by recognizing and using the simplest factoring methods, including recognizing special quadratics as squares and differences of squares.
Examples:
• 2x2 + x – 3 = 0; (x – 1)(2x + 3) = 0; x = 1,
!3
2
• 4x2 + 6x = 0; 2x(2x + 3) = 0; x = 0,
–3
2
• 36x2 – 25 = 0; (6x + 5)(6x – 5) = 0; x =
±5
6
• x2 + 6x + 9 = 0; (x + 3)2 = 0; x = –3
A1.5.D Solve quadratic equations that have real roots by completing the square and by using the quadratic formula.
Students solve those equations that are not easily factored by completing the square and by using the quadratic formula. Completing the square should also be used to derive the quadratic formula.
Students learn how to determine if there are two, one, or no real solutions.
Examples:
• Complete the square to solve x2 + 4x = 13. x2 + 4x – 13 = 0
x2 + 4x + 4 = 17
(x + 2)2 = 17
x + 2 = ± 17
x = -2 ± 17
x ≈ 2.12, -6.12
• Use the quadratic formula to solve 4x2 – 2x = 5.
x =–b ± b
2–4ac
2a
x =–(–2) ± (–2)2 –4(4 • –5)
2(4)
x =2 ± 84
8
x =2 ± 2 21
8
x =1± 21
4
x ≈ 1.40, -0.90
Algebra 1, Geometry, Algebra 2 July 2008 24 Washington State K–12 Mathematics Standards
Algebra 1 A1.6. Core Content: Data and distributions (Data/Statistics/Probability)
Students select mathematical models for data sets and use those models to represent, describe, and compare data sets. They analyze data to determine the relationship between two variables and make and defend appropriate predictions, conjectures, and generalizations. Students understand limitations of conclusions based on results of a study or experiment and recognize common misconceptions and misrepresentations in interpreting conclusions.
Performance Expectation Explanatory Comments and Examples Students are expected to:
A1.6.A Use and evaluate the accuracy of summary statistics to describe and compare data sets.
A univariate set of data identifies data on a single variable, such as shoe size.
This expectation extends what students have learned in earlier grades to include evaluation and justification. They both compute and evaluate the appropriateness of measure of center and spread (range and interquartile range) and use these measures to accurately compare data sets. Students will draw appropriate conclusions through the use of statistical measures of center, frequency, and spread, combined with graphical displays.
Examples:
• The local minor league baseball team has a salary dispute. Players claim they are being underpaid, but managers disagree.
— Bearing in mind that a few top players earn salaries that are quite high, would it be in the managers’ best interest to use the mean or median when quoting the “average” salary of the team? Why?
— What would be in the players’ best interest?
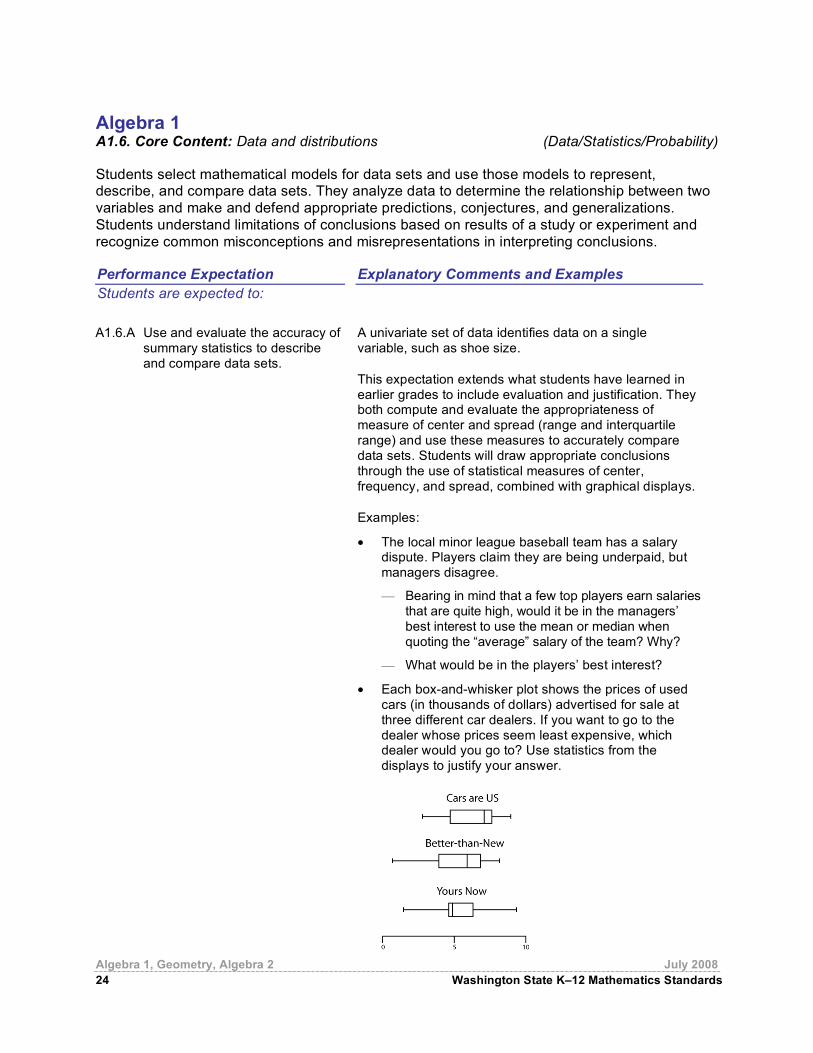
• Each box-and-whisker plot shows the prices of used cars (in thousands of dollars) advertised for sale at three different car dealers. If you want to go to the dealer whose prices seem least expensive, which dealer would you go to? Use statistics from the displays to justify your answer.

July 2008 Algebra 1, Geometry, Algebra 2 Washington State K–12 Mathematics Standards 25
Performance Expectation Explanatory Comments and Examples Students are expected to:
A1.6.B Make valid inferences and draw conclusions based on data.
Determine whether arguments based on data confuse association with causation. Evaluate the reasonableness of and make judgments about statistical claims, reports, studies, and conclusions.
Example:
• Mr. Shapiro found that the amount of time his students spent doing mathematics homework is positively correlated with test grades in his class. He concluded that doing homework makes students' test scores higher. Is this conclusion justified? Explain any flaws in Mr. Shapiro's reasoning.
A1.6.C Describe how linear transformations affect the center and spread of univariate data.
Examples:
• A company decides to give every one of its employees a $5,000 raise. What happens to the mean and standard deviation of the salaries as a result?
• A company decides to double each of its employee’s salaries. What happens to the mean and standard deviation of the salaries as a result?
A1.6.D Find the equation of a linear function that best fits bivariate data that are linearly related, interpret the slope and y-intercept of the line, and use the equation to make predictions.
A bivariate set of data presents data on two variables, such as shoe size and height.
In high school, the emphasis is on using a line of best fit to interpret data and on students making judgments about whether a bivariate data set can be modeled with a linear function. Students can use various methods, including technology, to obtain a line of best fit.
Making predictions involves both interpolating and extrapolating from the original data set.
Students need to be able to evaluate the quality of their predictions, recognizing that extrapolation is based on the assumption that the trend indicated continues beyond the unknown data.

Algebra 1, Geometry, Algebra 2 July 2008 26 Washington State K–12 Mathematics Standards
Performance Expectation Explanatory Comments and Examples Students are expected to:
A1.6.E Describe the correlation of data in scatterplots in terms of strong or weak and positive or negative.
Examples:
• Which words—strong or weak, positive or negative—could be used to describe the correlation shown in the sample scatterplot below?

July 2008 Algebra 1, Geometry, Algebra 2 Washington State K–12 Mathematics Standards 27
Algebra 1 A1.7. Additional Key Content (Algebra)
Students develop a basic understanding of arithmetic and geometric sequences and of exponential functions, including their graphs and other representations. They use exponential functions to analyze relationships, represent and model problems, and answer questions in situations that are modeled by these nonlinear functions. Students learn graphical and numerical methods for approximating solutions to exponential equations. Students interpret the meaning of problem solutions and explain limitations related to solutions.
Performance Expectation Explanatory Comments and Examples Students are expected to:
A1.7.A Sketch the graph for an exponential function of the form y = abn where n is an integer, describe the effects that changes in the parameters a and b have on the graph, and answer questions that arise in situations modeled by exponential functions.
Examples:
• Sketch the graph of y = 2n by hand.
• You have won a door prize and are given a choice between two options:
$150 invested for 10 years at 4% compounded annually.
$200 invested for 10 years at 3% compounded annually.
— How much is each worth at the end of each year of the investment periods?
— Are the two investments ever equal in value? Which will you choose?
A1.7.B Find and approximate solutions to exponential equations.
Students can approximate solutions using graphs or tables with and without technology.
A1.7.C Express arithmetic and geometric sequences in both explicit and recursive forms, translate between the two forms, explain how rate of change is represented in each form, and use the forms to find specific terms in the sequence.
Examples:
• Write a recursive formula for the arithmetic sequence 5, 9, 13, 17, . . . What is the slope of the line that contains the points associated with these values and their position in the sequence? How is the slope of the line related to the sequence?
• Given that u(0) = 3 and u(n + 1) = u(n) + 7 when n is a positive integer,
a. find u(5);
b. find n so that u(n) = 361; and
c. find a formula for u(n).
• Write a recursive formula for the geometric sequence 5, 10, 20, 40, . . . and determine the 100th term.

Algebra 1, Geometry, Algebra 2 July 2008 28 Washington State K–12 Mathematics Standards
Performance Expectation Explanatory Comments and Examples Students are expected to:
• Given that u(0) = 2 and u(n + 1) = 3u(n),
a. find u(4), and
b. find a formula for u(n).
A1.7.D Solve an equation involving several variables by expressing one variable in terms of the others.
Examples:
• Solve A = p + prt for p.
• Solve V = πr2h for h or for r.

July 2008 Algebra 1, Geometry, Algebra 2 Washington State K–12 Mathematics Standards 29
Algebra 1 A1.8. Core Processes: Reasoning, problem solving, and communication
Students formalize the development of reasoning in Algebra 1 as they use algebra and the properties of number systems to develop valid mathematical arguments, make and prove conjectures, and find counterexamples to refute false statements, using correct mathematical language, terms, and symbols in all situations. They extend the problem-solving practices developed in earlier grades and apply them to more challenging problems, including problems related to mathematical and applied situations. Students formalize a coherent problem-solving process in which they analyze the situation to determine the question(s) to be answered, synthesize given information, and identify implicit and explicit assumptions that have been made. They examine their solution(s) to determine reasonableness, accuracy, and meaning in the context of the original problem. The mathematical thinking, reasoning, and problem-solving processes students learn in high school mathematics can be used throughout their lives as they deal with a world in which an increasing amount of information is presented in quantitative ways and more and more occupations and fields of study rely on mathematics.
Performance Expectation Explanatory Comments and Examples (applies to all expectations)
Students are expected to:
A1.8.A Analyze a problem situation and represent it mathematically.
A1.8.B Select and apply strategies to solve problems.
A1.8.C Evaluate a solution for reasonableness, verify its accuracy, and interpret the solution in the context of the original problem.
A1.8.D Generalize a solution strategy for a single problem to a class of related problems, and apply a strategy for a class of related problems to solve specific problems.
A1.8.E Read and interpret diagrams, graphs, and text containing the symbols, language, and conventions of mathematics.
A1.8.F Summarize mathematical ideas with precision and efficiency for a given audience and purpose.
Examples:
• Three teams of students independently conducted experiments to relate the rebound height of a ball to the rebound number. The table gives the average of the teams’ results.
Construct a scatterplot of the data, and describe the function that relates the height of the ball to the rebound number. Predict the rebound height of the ball on the tenth rebound. Justify your answer.

Algebra 1, Geometry, Algebra 2 July 2008 30 Washington State K–12 Mathematics Standards
Performance Expectation Explanatory Comments and Examples (applies to all expectations)
Students are expected to:
A1.8.G Synthesize information to draw conclusions, and evaluate the arguments and conclusions of others.
A1.8.H Use inductive reasoning about algebra and the properties of numbers to make conjectures, and use deductive reasoning to prove or disprove conjectures.
• Prove (a + b)2 = a2 + 2ab + b2.
• A student writes (x + 3)2 = x2 + 9. Explain why this is incorrect.
• Prove formally that the sum of two odd numbers is always even.