Algae under Uncertainty: The Future of the Algal Biodiesel ... · Algae under Uncertainty: The...
25
Preprint Cambridge Centre for Computational Chemical Engineering ISSN 1473 – 4273 Algae under Uncertainty: The Future of the Algal Biodiesel Economy George P.E. Brownbridge 1 , Pooya Azadi 1 , Andrew Smallbone 2 , Amit Bhave 2 , Benjamin J. Taylor 1 , Markus Kraft 1 released: 9 May 2013 1 Department of Chemical Engineering and Biotechnology University of Cambridge New Museums Site Pembroke Street Cambridge, CB2 3RA United Kingdom E-mail: [email protected] 2 cmcl innovations Sheraton House Castle Park Cambridge, CB3 0AX United Kingdom Preprint No. 126 Keywords: Algae, Biodiesel, Techno-Economic Assessment, Uncertainty, HDMR
Transcript of Algae under Uncertainty: The Future of the Algal Biodiesel ... · Algae under Uncertainty: The...
Algae under Uncertainty: The Future of the Algal Biodiesel Economy
Preprint Cambridge Centre for Computational Chemical Engineering ISSN 1473 – 4273
Algae under Uncertainty: The Future of the AlgalBiodiesel Economy
George P.E. Brownbridge1, Pooya Azadi1, Andrew Smallbone2, Amit
Bhave2, Benjamin J. Taylor1, Markus Kraft1
released: 9 May 2013
1 Department of Chemical Engineeringand BiotechnologyUniversity of CambridgeNew Museums SitePembroke StreetCambridge, CB2 3RAUnited KingdomE-mail: [email protected]
2 cmcl innovationsSheraton HouseCastle ParkCambridge, CB3 0AXUnited Kingdom
Preprint No. 126
Keywords: Algae, Biodiesel, Techno-Economic Assessment, Uncertainty, HDMR

Edited by
CoMoGROUP
Computational Modelling GroupDepartment of Chemical Engineering and BiotechnologyUniversity of CambridgeNew Museums SitePembroke StreetCambridge CB2 3RAUnited Kingdom
Fax: + 44 (0)1223 334796E-Mail: [email protected] Wide Web: http://como.cheng.cam.ac.uk/
Abstract
We present a techno-economic assessment of algae-derived biodiesel under eco-nomic and technical uncertainties currently associated with the development of algalbiorefineries. The proposed plant is comprised of photobioreactor (PBR), harvest-ing and oil extraction, oil esterification, and integrated gasification/Fischer-Tropschunits, and a concentrated solar power (CSP) system to provide the biorefinery withdecarbonised electricity. The global sensitivity analysis was performed using a HighDimensional Model Representation (HDMR) method. It was found that, consideringreasonable ranges over which each parameter can vary, the sensitivity of the biodieselproduction cost to the key input parameters decreases in the following order: algaeoil content > algae annual productivity per unit area > plant production capacity >carbon price increase rate. It was also found that the Return on Investment (ROI)is highly sensitive to the algae oil content, and to a lesser extent to the algae annualproductivity, crude oil price and price increase rate, plant production capacity, andcarbon price increase rate. For a large scale plant (100,000 tonnes of biodiesel peryear) the production cost of biodiesel is likely to be between £0.8 to £1.6 per kg. Theanalysis herein presented should be of interests to researchers and decision makersin the energy, environment and agricultural sectors.
1
Contents
1 Introduction 3
2 Methodology 7
2.1 Algae Conversion Process . . . . . . . . . . . . . . . . . . . . . . . . . 7
2.2 Global Sensitivity Analysis using HDMR . . . . . . . . . . . . . . . . . 12
2.3 Uncertainty Analysis . . . . . . . . . . . . . . . . . . . . . . . . . . . . 13
3 Results 14
3.1 Global Sensitivity Analysis . . . . . . . . . . . . . . . . . . . . . . . . . 14
3.2 Uncertainty Analysis . . . . . . . . . . . . . . . . . . . . . . . . . . . . 16
4 Conclusions 18
References 22
2
Nomenclature
CAPEX Capital Expenditure (£)CSP Concentrated Solar PowerFT Fischer-TropschGHG Greenhouse GasHDMR High Dimensional Model RepresentationICE Internal Combustion EngineLCA Life Cycle AssessmentMC Monte CarloOPEX Operating Expenditure (£/year)PBR PhotobioreactorQRS Quasi-Random SamplingROI Return on InvestmentWTW Well-to-Wheelφ Economies of Scale Exponent
1 Introduction
Global warming induced by anthropogenic greenhouse gas (GHG) emissions is currentlyone of the major concerns facing the world today. Furthermore, decline in the supplyof conventional fossil fuels has increased exploitation of unconventional carbon-intensiveresources such as tar sands which, in turn, will further increase the concentration of green-house gases in the atmosphere [11]. Production of biofuels with lower life cycle carbonfootprints would help to simultaneously address both issues of GHG emission and thedecline in fossil resources in a sustainable manner [6].
Beside the lignocellulosic biomass such as forest and agricultural residues, microalgaehave been identified as a versatile biomass feedstock upon which future biorefineries canbe established [8]. Microalgae fulfil all the prerequisites of a sustainable biofuel feed-stock: they have enormous annual productivity, low demands for fresh water and nutri-ents as they can be fed with wastewater, and minimal indirect emissions due to land-usechange as they can be grown on marginal lands [20]. Nevertheless, there are still severaltechnical challenges holding back the large scale production of liquid algal biofuels in aneconomic and environmentally-benign manner, the majority of which are related to thehigh energy and carbon intensities of the cultivation and conversion processes.
The technical process of algal biodiesel production includes several different technologycomponents: algal growth, algae dewatering, oil extraction, oil esterification, and a pro-cess for the conversion of the oil-extracted algae. Here, we briefly overview the primaryissues associated with the economic viability of algal biorefineries.
Algae cultivation method: The algae growth systems are primarily limited to two types:open pond raceways and photobioreactors (PBRs). Generally, the biomass yields fromPBRs are higher than from open pond raceways; albeit, only at the price of higher capital
3
and operating costs [19]. The latter is due to the higher electricity consumption need tomaintain turbulence in the narrow tubing. However, the PBR cultivation system is alsoless vulnerable to undesirable microorganisms that may attack the algae culture.
Annual biomass productivity and oil content: Generally, the annual yield of algal cropsranges from 50 to 150 tonnes of dry biomass per hectare. The annual algae productivityprimarily depends on algae strain, solar irradiance, temperature, nutrients availability, andgrowth system. The algae lipid content usually increases if cultivated under nitrogen-deficient conditions. However, the inverse relationship between the lipid content andthe annual productivity somewhat offsets the total amount of oil produced annually [8].Furthermore, due to the presence of nitrogen, phosphorous, and sulphur heteroatoms inalgal oil, only about 80 wt% of the oil can be used for biodiesel production [8].
Carbon and nutrients: The required carbon for algae growth can be provided by bubblingflue gas from external sources into the growth medium, or alternatively via utilisation ofwastewater which not only provides the algae farm with a source of carbon and water butalso partially or fully offsets the fertiliser demand. In the latter case, the treated watershould be also considered as a product beside the produced biodiesel, as in this case thealgae production essentially eliminates the need for the treatment of the wastewater. Inthis study, however, we assumed the carbon is provided by flue gas from an adjacentpower plant and the revenue that can be generated from the treatment of wastewater wasexcluded from the analysis.
Harvesting and oil extraction: A major challenge concerning the production of algal bio-fuels in an economical and environmentally-benign manner is the low concentration of thefeedstock which is typically between 0.05–2 wt%. The initial feedstock can be effectivelyconcentrated up to nearly 10 wt% using physical precipitation methods with low energydemands (e.g. clarifiers). However, due to small particle sizes and water-like density,further dewatering and drying of the microalgae slurries is significantly energy and car-bon intensive. Therefore, it is likely that the technologies that directly fractionate and/orconvert dilute microalgae slurry can offer inherent advantages over the conventional pro-cesses such as oil extraction from dried feedstock [7]. Regardless of the utilisation of adry or wet extraction method, the algae oil can be converted into biodiesel at high yieldsvia transesterification process.
Conversion strategy for oil-extracted algae: In a biofuel-only algae conversion strategy,three scenarios are plausible with respect to the conversion of the oil-extracted algae, eachof which can prove more viable depending on the upstream harvesting and oil extractionprocesses and several other factors: a) They can be combusted in boilers to generateprocess heat and electricity, b) They can be converted to biogas using anaerobic digestion,and c) They can be gasified to produce syngas, which can be subsequently fed to Fischer-Tropsch (FT) to produce more diesel fuel or burnt in gas turbines to generate electricity.Based on our previous analysis [23], we considered an integrated gasification-FT plant toconvert the residues into synthetic diesel and naphtha.
Life cycle carbon footprint: The well-to-wheel (WTW) carbon footprint of a biofueldetermines to what extend its widespread use can help countries to reach their GHG re-duction targets. Therefore, the carbon credit given to any biofuel producer, amongst theother factors, should be proportional to the difference between the carbon footprints of the
4
biofuel and fossil fuel to be displaced. A life cycle inventory for the WTW carbon foot-print of algal biodiesel includes a credit for the sequestrated carbon dioxide, and GHGemissions from on-site activities and processes, embedded emissions in the raw materialsand commodities (e.g. fertilisers, methanol, glycerol, and plant constructing materials),electricity generation, and the combustion of the biofuel in ICE. Only with a proper ac-counting of all these factors one can assess the potential of algae-derived biodiesel inmitigating the GHG emissions.
Electricity: The source of electricity and the process electricity demand considerably af-fect the economics and the carbon footprint of the produced algal biodiesel [21]. Conse-quently, beside implementation of less electricity-intensive processes, decarbonisation ofthe electricity can greatly suppress the adverse environmental impacts of algal biorefiner-ies and would allow for the realisation of the full advantages of algae-derived biofuels.Given that the algae farms will be primarily located in the areas with high daily hours ofsunshine, the use of solar power seems to be an inherently good choice. In our analy-sis presented herein, we assumed the process electricity is provided by an adjacent plantusing concentrated solar power (CSP) via parabolic trough mirrors.
Other economic factors: The total production capacity of the plant is expected to havea considerable effect on the biofuel production cost due to the non-linear changes in theplant’s capital expenditure (CAPEX) and operating expenditure (OPEX) with size. Fur-thermore, the profitability of a biorefinery is heavily dependent on the commodity prices(e.g. cruide oil, carbon, and fertilizer) over the lifetime of the plant. These issues alongwith the other economic assumptions made in this study are discussed in more detail inthe methodology, Section 2.
Given the wide range of the suggested solutions for addressing the challenges of algalbiofuel production, along with the likely enhancements in the annual algae productivityand lipid content in the future, the economics of algal biorefineries are currently associatedwith extensive uncertainties. Consequently, models that take into account the technicaland economic uncertainties surrounding algal biorefineries are highly useful and can beemployed to shed light on the viability of such plants in the future.
A summary of selected techno-economic studies for the production of algal biodiesel aregiven in Table 1. From the values listed in this table, one can see that the differencesin the technical and economic assumptions behind the algae production and conversionprocess can result in almost one order of magnitude difference in the final price of theproduct, which in turn highlights the need for a systematic study of the algae economy.Furthermore, although the economy of algal bioproducts has been extensively studied inthe literature, very little is known about the relative importance of the key technical andeconomic factors with respect to the economy of algal biorefineries. Sensitivity analysisallows researchers and decision makers to qualitatively measure the importance of differ-ent factors with regard to the outputs they are concerned with. Local sensitivity analysiscalculates effect of the input parameters only about a given point and usually just the linearcomponent. Global sensitivity analysis however calculates the effect of the input param-eters over the whole parameter space, which means that it not only takes into accountthe inherent uncertainties in the input parameters but also potential non-linearities andcontributions due to interactions between input parameters. In this paper we use a Quasi-Random Sampling High Dimensional Model Representation (QRS-HDMR) method to
5
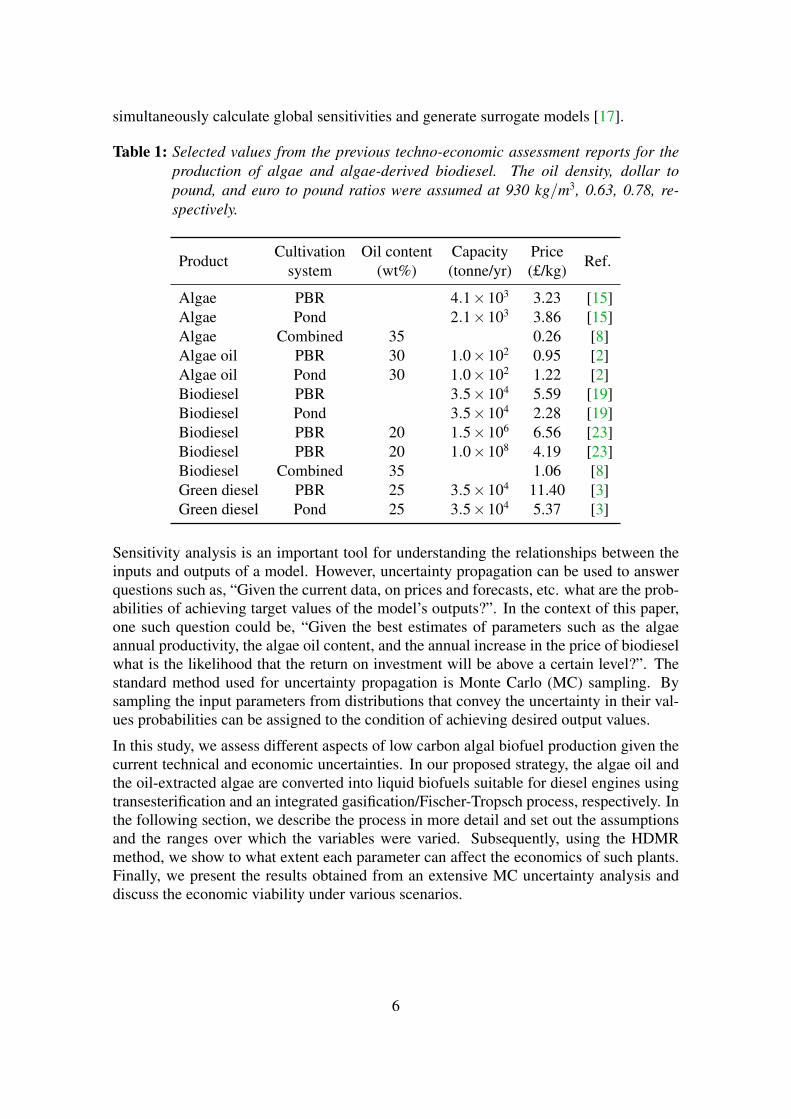
simultaneously calculate global sensitivities and generate surrogate models [17].
Table 1: Selected values from the previous techno-economic assessment reports for theproduction of algae and algae-derived biodiesel. The oil density, dollar topound, and euro to pound ratios were assumed at 930 kg/m3, 0.63, 0.78, re-spectively.
ProductCultivation Oil content Capacity Price
Ref.system (wt%) (tonne/yr) (£/kg)
Algae PBR 4.1×10³ 3.23 [15]Algae Pond 2.1×10³ 3.86 [15]Algae Combined 35 0.26 [8]Algae oil PBR 30 1.0×10² 0.95 [2]Algae oil Pond 30 1.0×10² 1.22 [2]Biodiesel PBR 3.5×10⁴ 5.59 [19]Biodiesel Pond 3.5×10⁴ 2.28 [19]Biodiesel PBR 20 1.5×10⁶ 6.56 [23]Biodiesel PBR 20 1.0×10⁸ 4.19 [23]Biodiesel Combined 35 1.06 [8]Green diesel PBR 25 3.5×10⁴ 11.40 [3]Green diesel Pond 25 3.5×10⁴ 5.37 [3]
Sensitivity analysis is an important tool for understanding the relationships between theinputs and outputs of a model. However, uncertainty propagation can be used to answerquestions such as, “Given the current data, on prices and forecasts, etc. what are the prob-abilities of achieving target values of the model’s outputs?”. In the context of this paper,one such question could be, “Given the best estimates of parameters such as the algaeannual productivity, the algae oil content, and the annual increase in the price of biodieselwhat is the likelihood that the return on investment will be above a certain level?”. Thestandard method used for uncertainty propagation is Monte Carlo (MC) sampling. Bysampling the input parameters from distributions that convey the uncertainty in their val-ues probabilities can be assigned to the condition of achieving desired output values.
In this study, we assess different aspects of low carbon algal biofuel production given thecurrent technical and economic uncertainties. In our proposed strategy, the algae oil andthe oil-extracted algae are converted into liquid biofuels suitable for diesel engines usingtransesterification and an integrated gasification/Fischer-Tropsch process, respectively. Inthe following section, we describe the process in more detail and set out the assumptionsand the ranges over which the variables were varied. Subsequently, using the HDMRmethod, we show to what extent each parameter can affect the economics of such plants.Finally, we present the results obtained from an extensive MC uncertainty analysis anddiscuss the economic viability under various scenarios.
6

2 Methodology
2.1 Algae Conversion Process
A schematic process flow diagram of the algal biodiesel plant considered in the modelis depicted in Figure 1. The main feedstocks and products of the key process units, forthe production of 1 kg algal diesel, are given in Table 2. The algae is grown in the PBRsusing carbon dioxide from an adjacent power plant. In the described process, 2.6 kg dryalgae is needed to produce 1 kg algal diesel, of which 0.8 kg is produced via lipid transes-terification and 0.2 kg is produced via gasification of the oil-extracted algae followed byFischer-Tropsch process. This would approximately require 5.3 kg of CO2 from the fluegas. Considering typical CO2 concentrations in the flue gases of a gas-fired power plants(i.e. ∼15 wt%), nearly 35 kg of flue gas is required to obtain 1 kg biodiesel. In the processconsidered in this study, the dilute algae culture is fed to a wet harvesting system in which95% of its water is removed [16]. The lipids are then separated using conventional sol-vent extraction process to allow for direct conversion into biodiesel via transesterification,in which 1 kg lipids and 0.1 kg methanol are reacted to yield 1 kg biodiesel and 0.1 kgcrude glycerol. Furthermore, it was assumed that 100% of the algae lipid is converted tomethyl esters suitable for ICEs. The oil-extracted algae mass undergoes gasification fol-lowed by the Fischer-Tropsch reaction to generate synthetic diesel and naphtha, throughthe intermediate formation of syngas. Herein, we use the term algal diesel to collectivelyrefer to the combined biodiesel and synthetic diesel produced via transesterification andFischer-Tropsch, respectively. The mass ratio of synthetic diesel and naphtha obtainedfrom FT process is approximately 2.3. Furthermore, it was assumed that the market valueof diesel and naphtha over the lifetime of the plant is consistently equal to 75% and 67.5%,respectively, of the crude oil price at that time.
algae farm
CO2 & fertilizer/ wastewater
cold fluid
hot fluid
CSP
esterification
residue
harvesting& extraction
gasification & FT
MeOH glycerol
biodiesel
synthetic diesel
naphtha
power generation
Figure 1: Schematic process diagram of the algal biorefinery considered in this study.
As mentioned earlier, the cost and carbon footprint of electricity can significantly affectthe economics and environmental footprints of algal diesel, respectively. Since the algaefarms should ideally be built in areas with high annual solar radiation, the utilisation ofsolar energy for providing the thermal and electricity demands of the biomass conversionprocess can potentially be a suitable option [1, 23]. Hence, given the level technologymaturity and its ability to continuously generate power over the entire day, we assumedthat a parabolic trough CSP plant with thermal energy storage system is used to meet
7
the electricity requirements of the biorefinery. As the rate of photosynthesis and algaegrowth over night is substantially lower compared to the day time, a less extensive level ofmixing is adequate to maintain optimal growth; which in turn, would reduce the electricitydemand of the plant during that period. Considering the cost associated with the energystorage in molten salt CSP plants, a CSP plant integrated with algal biorefinery would bemore cost effective due to the reduced need for energy storage.
In order to perform the global sensitivity analysis, we systematically varied the key inputparameters over the ranges given in Table 4. In our view, the ranges considered here rep-resent plausible values for such parameters over the plant lifetime, which was assumed tobe 30 years. Strictly speaking, some of the parameters given in this table are somewhatdependent on each other; however, any correlations among these parameters were notconsidered in the analysis and they were treated as independent variables. Furthermore,there can be a level of uncertainty surrounding the performance of each technology de-pending upon the nature of the inputs (climate, future energy prices, etc.). Whilst the baseassumption is that the technology performance is 100% the standard deviations applied tothe productivities accounts for both potential inefficiencies as well as potential increasesin efficiency, as listed in Table 5.
The commodity prices used in this assessment are defined as the price when the plant isconstructed. The price in subsequent years is then calculated using a percentage annualincrease. The only price that is not increased in this way is that of carbon which is partiallycontrolled by governments and is predicted to increase at an approximately constant rateuntil 2050 [4]. The carbon credit was calculated based on the stoichiometry of dieselcombustion (i.e. 3.1 kg CO2/kg diesel), and assuming that the heating value of biodieselis 88% of that of the petroleum diesel [24].
The estimated CAPEX and OPEX associated with the production of 1 kg of algal dieselfor each of the major processes is provided in Table 3. It is important to note that althoughthese values are normalised to 1 kg final algal diesel product they have been calculatedfrom quotes for actual industrial-scale units. These quotes were scaled appropriately whencalculating the values for a specific plant production capacity. The annual unit capacityfor each of these units are also given in the table. The CAPEX of CSP plant as well as thecorresponding OPEX to CAPEX ratio was obtained from [13]. The CAPEX of PBR andoil extraction unit and the specific electricity demand per unit were quoted from SubitecGmbH, Stuttgart, Germany [22], and OriginOil, Los Angeles, USA [16], respectively.The OPEX of PBR and oil extraction units were calculated based on the sum of the labourcost and maintenance, the latter of which was assumed to be equal to 2% of the CAPEX.The labour costs were estimated assuming one employee for the PBR and the extractionunits installed in 10 ha. The annual salary per employee and overhead were assumed at£22,000 per year and 60%, respectively. The allocation ratio of the labour cost betweenthe PBR and oil extraction was considered to be 2:1. The data for the transesterifica-tion and gasification-FT plants were quoted from NiTech, Edinburgh, Scotland [14], andRentech, USA [18]. Fertiliser price and the increase rate forecast were taken from [12].Furthermore, current and future carbon prices were calculated from [4]. The indirectcosts such as engineering, installation, start up, and project contingencies are assumed tobe 20% of the facility investment [10].
The economic analysis herein presented is based on the following assumptions: 25%
8

corporate tax rate (based on UK corporate tax rate for 2012 [5]), 5% annual depreciationrate for the equipments, and 0% cash flow discount rate which represents the minimumbiodiesel production cost that one may obtain from such plants. The annual depreciationamount was used as the capital allowance of that year and subtracted from the taxableprofits with unused allowance being carried into the next year.
The economies of scale exponent, φ , controls how the price of bulk purchases of the unitsare discounted. If the capital cost of one plant unit, with a capacity Qunit, is Cunit then thecapital cost C a plant of that type with a capacity Qdemand can be calculated as
C =Cunit
(Qdemand
Qunit
)φ
. (1)
In this paper φ was set to a value of 0.8 for all technologies. One should realise that Qunit
refers to the CAPEX values quoted for the unit sizes listed in Table 3.
The plant Return on Investment (ROI) is defined as follow:
ROI(%) =Total Profits
Total CAPEX×100 , (2)
where the total profit is calculated as the cumulative profit gained over the time spanconsidered. The algal diesel production cost is calculated by subtracting the sum of grossprofits from the bi-products (naphtha and carbon sequestration) as well as the relevant cap-ital allowance from the total costs and dividing that by the total amount of algal biodieselproduced, all over the lifetime of the plant.
9
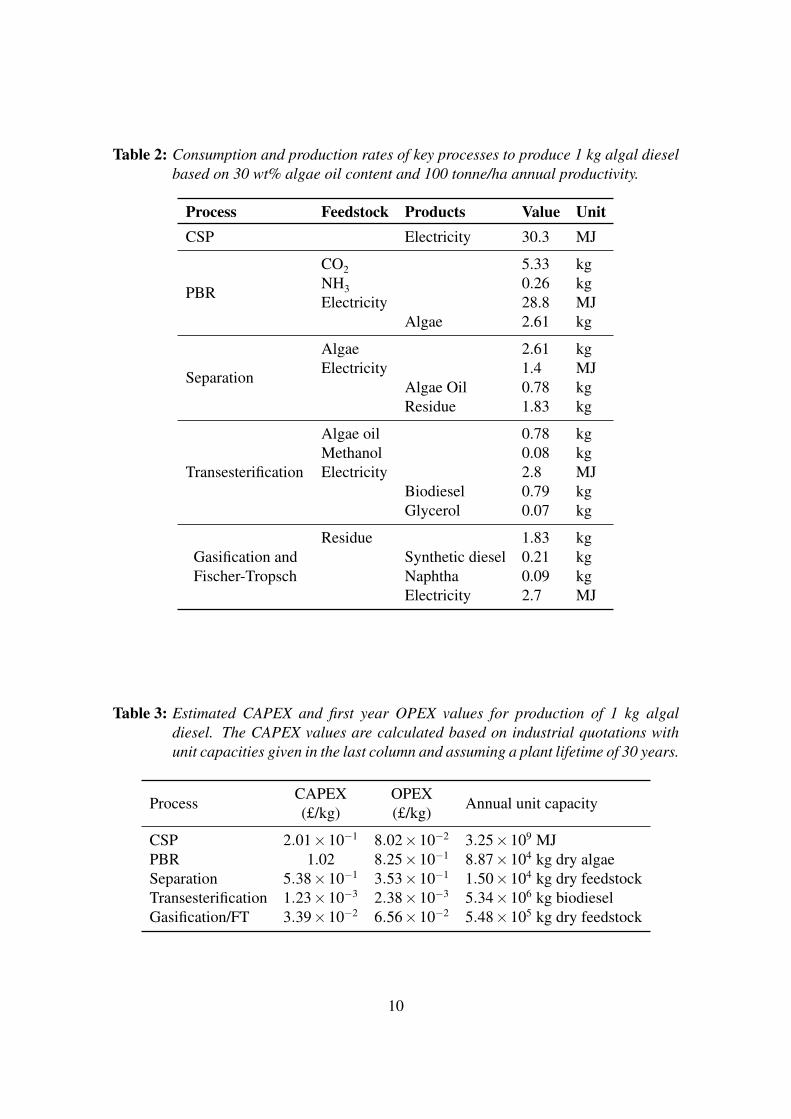
Table 2: Consumption and production rates of key processes to produce 1 kg algal dieselbased on 30 wt% algae oil content and 100 tonne/ha annual productivity.
Process Feedstock Products Value UnitCSP Electricity 30.3 MJ
PBR
CO2 5.33 kgNH3 0.26 kgElectricity 28.8 MJ
Algae 2.61 kg
Separation
Algae 2.61 kgElectricity 1.4 MJ
Algae Oil 0.78 kgResidue 1.83 kg
Transesterification
Algae oil 0.78 kgMethanol 0.08 kgElectricity 2.8 MJ
Biodiesel 0.79 kgGlycerol 0.07 kg
Gasification andFischer-Tropsch
Residue 1.83 kgSynthetic diesel 0.21 kgNaphtha 0.09 kgElectricity 2.7 MJ
Table 3: Estimated CAPEX and first year OPEX values for production of 1 kg algaldiesel. The CAPEX values are calculated based on industrial quotations withunit capacities given in the last column and assuming a plant lifetime of 30 years.
ProcessCAPEX OPEX
Annual unit capacity(£/kg) (£/kg)
CSP 2.01×10⁻¹ 8.02×10⁻² 3.25×10⁹ MJPBR 1.02 8.25×10⁻¹ 8.87×10⁴ kg dry algaeSeparation 5.38×10⁻¹ 3.53×10⁻¹ 1.50×10⁴ kg dry feedstockTransesterification 1.23×10⁻³ 2.38×10⁻³ 5.34×10⁶ kg biodieselGasification/FT 3.39×10⁻² 6.56×10⁻² 5.48×10⁵ kg dry feedstock
10
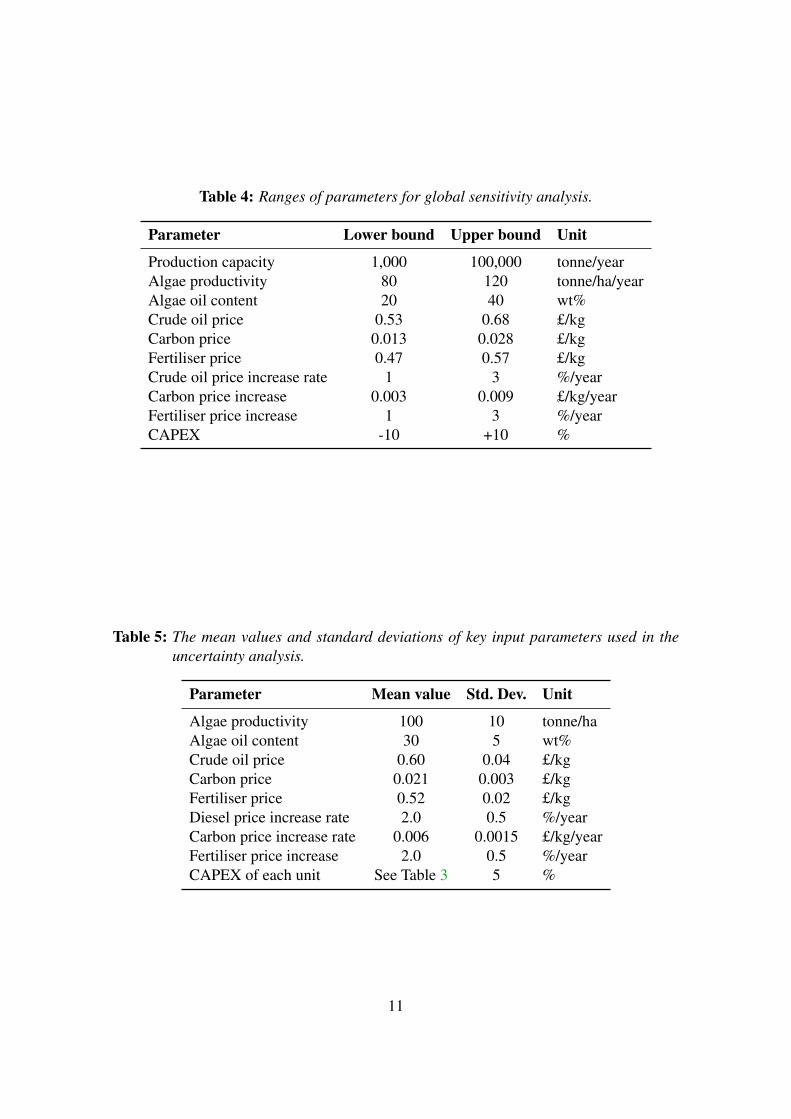
Table 4: Ranges of parameters for global sensitivity analysis.
Parameter Lower bound Upper bound Unit
Production capacity 1,000 100,000 tonne/yearAlgae productivity 80 120 tonne/ha/yearAlgae oil content 20 40 wt%Crude oil price 0.53 0.68 £/kgCarbon price 0.013 0.028 £/kgFertiliser price 0.47 0.57 £/kgCrude oil price increase rate 1 3 %/yearCarbon price increase 0.003 0.009 £/kg/yearFertiliser price increase 1 3 %/yearCAPEX -10 +10 %
Table 5: The mean values and standard deviations of key input parameters used in theuncertainty analysis.
Parameter Mean value Std. Dev. Unit
Algae productivity 100 10 tonne/haAlgae oil content 30 5 wt%Crude oil price 0.60 0.04 £/kgCarbon price 0.021 0.003 £/kgFertiliser price 0.52 0.02 £/kgDiesel price increase rate 2.0 0.5 %/yearCarbon price increase rate 0.006 0.0015 £/kg/yearFertiliser price increase 2.0 0.5 %/yearCAPEX of each unit See Table 3 5 %
11

2.2 Global Sensitivity Analysis using HDMR
When assessing a techno-economic model it is often useful to know the relative effect ofeach input parameter on the output parameters. Such information can be obtained througha sensitivity analysis on the model. This analysis can be used to direct research towardstechnologies and advancements that will have the greatest effect on the overall economicviability of an algae to biodiesel plant. A specific example could be a research group de-veloping new strains of algae may want to know whether it is more economically sensibleto focus on getting a higher annual productivity or a greater oil content in the new strain.Another example would be an investor who is interested in an algae to biodiesel plant butwants to know which process in the plant has the greatest potential to contribute towardsreducing the biodiesel production cost so that they can focus their efforts on finding amore cost effective technology for that process. The advantage of the global sensitivityanalysis implemented here is that unlike the more commonly used methods which calcu-late sensitivity locally using finite differences, the sensitivities that are calculated take intoaccount the global variation in the outputs over the whole space of input variables. Thismeans that magnitude of the range over which each parameter is varied has a direct effecton the sensitivity to that parameter.
In this paper global sensitivities are calculated from the coefficients of a High Dimen-sional Model Representation (HDMR) [17]. Each output from the model, y, for examplebiodiesel production cost, can be represented by a function, f (x), of the model’s inputs,x, such as annual algae productivity, oil content, etc. The main feature of HDMR is thedecomposition of the full function into a sum of functions that only depend on subsets ofthe input variables such that:
y = f (x) = f0 +N
∑i=1
fi (xi)+N
∑i=1
N
∑j=i+1
fi j (xi,x j)+ . . .+ f12...N(x1,x2, . . . ,xN) , (3)
where N is the number of input parameters, i and j index the input parameters, and f0 is themean value of f (x). The expansion given in (3) has a finite number of terms and exactlyrepresents f (x), however for most practical applications terms containing functions ofmore than two input parameters can often be ignored due to their negligible contributionscompared to the lower order terms [9, 17]. Therefore for most models/data the truncatedapproximation
y ≈ f (x) = f0 +N
∑i=1
fi (xi)+N
∑i=1
N
∑j=i+1
fi j (xi,x j) , (4)
is sufficient. Whilst it is possible to evaluate each of these terms using direct numericalintegration a more efficient method is to approximate the functions fi(xi) and fi j(xi,x j)with analytic functions [9]. In this paper orthogonal polynomials are used due to the easeof their calculation and broad applicability.
The separation of the contributions from each individual input parameter and each combi-nation of parameters allows to calculate the global sensitivities. It has been described byRabitz and Alıs [17] that the contribution of each term in (4), σ 2
i and σ 2i j, to the variance
12

of the output parameter can be related to the total variance by
σ2f =
N
∑i=1
∫ 1
−1f 2i (xi)dxi +
N
∑i=1
N
∑j=i+1
∫ 1
−1
∫ 1
−1f 2i j (xi,x j)dxidx j (5a)
=N
∑i=1
σ2i +
N
∑i=1
N
∑j=i+1
σ2i j . (5b)
The sensitivities, Si and Si j, can then be calculated by dividing by the total variance σ 2f to
get
Si =σ 2
i
σ 2f
and Si j =σ 2
i j
σ 2f. (6)
These global sensitivities can then be used to assess which input parameters are mostinfluential on the variance of each of the output parameters. The HDMR models are alsoeasy to plot allowing the user to visualise the effects of each parameter and their combinedeffects. Also due to the simple polynomial form of the HDMR models they can be usedas surrogate models to perform further, evaluation intensive, analyses.
These surrogate models are generally faster to evaluate than the original model and allowrapid dynamic data visualisation as well as the option to perform more computationallyintensive analyses.
2.3 Uncertainty Analysis
The global sensitivity analysis is useful for determining the relative importance of theinput parameters in highly non-linear system. The HDMR results can be also used toinvestigate the effect of an input parameter while the effect of all other inputs have beenaveraged out over their specified range. Monte Carlo (MC) simulations of the forwarduncertainty propagation differs from HDMR in the way that the sampling from the inputdomains are carried out: the HDMR presented here considers a uniform probability overthe entire range of the input whereas the sampling in MC simulation happens through aprobability function which determine the mean value and standard deviation of the input.In other words, MC simulation is more effective if the mean values of the input parametersare approximately known but there is likelihood that these values vary around the meanvalue. An example of this would be that a given strain of algae might be quoted as having aalgae annual productivity of 100 tonne/ha but due to variations in growing conditions andother factors the actual productivity may be slightly different from this value. Uncertaintypropagation can be performed to quantitatively assess the effects of such uncertainty inthe input domain on the expected values of the outputs (e.g. biodiesel production cost andROI).
Having estimated the probability distributions of the outputs, it is then possible to generatethe associated cumulative distributions from which the probabilities of different scenar-ios can be calculated. For example the cumulative distribution for biodiesel productioncost can be used to calculate the probability that, given the uncertainty in the inputs, thebiodiesel production cost will be less than a given amount.
13

3 Results
In this section, we will first present the results obtained from the global sensitivity analysisin which the relative contributions of key input parameters to the economic viability ofthe described algal biorefinery are determined. Subsequently, we will demonstrate to whatextent algae oil content, annual productivity, carbon price increase rate, and PBR CAPEXaffect the algal diesel production cost with various production capacities. Finally, we willdiscuss how current economic and technical uncertainties can affect the profitability of adiesel-only algal biorefinery over its lifetime (e.g. 30 years).
3.1 Global Sensitivity Analysis
The global sensitivities of the economics of the algae conversion constructed upon thestrategy schemed in Figure 1 to the key input parameters were studied using the HDMRmethod. There are a number of parameters that can serve as the model output, amongwhich we focused on algal diesel production cost and 5- and 30-year ROI. It is worthmentioning that the algal diesel production cost is dependent on the crude oil and carbonprices as the revenue generated from the process byproducts (i.e. naphtha and sequestratedcarbon) is subtracted from the actual cost to obtain the net production cost of the algaldiesel. The ROI depends on both algal diesel production cost and the selling price ofall products, including algal diesel, naphtha, and carbon. However, strictly speaking, thevalues associated with most of the capital and operating costs are inevitably dependent onthe fossil energy prices to a variable extent. The input parameters along with the rangesover which the value of each input parameters was allowed to vary can be seen in Table 4.Since the HDMR model separately incorporates the CAPEX of each process unit listed inTable 3, there are total of 14 independent inputs to the model. Due to the global natureof this sensitivity analysis the exact range over which each parameter is varied directlyaffects the sensitivity to that parameter. We note that in reality there is a slight negativecorrelation between algae oil content and algae annual productivity for a given productionconfiguration and algae strain [8]. Nonetheless, the highly scattered paired values ofalgae oil content and annual productivity in the literature allows them to be consideredas independent variables, particulary as no specific strain of algae was considered in theanalysis.
The global sensitivities of the overall algae-derived diesel production cost to the majorinputs are shown in Figure 2. It was found that the production cost of algae-deriveddiesel is most sensitive to the algae oil content, primarily due to the substantial differ-ences between the process efficiencies and costs of the two routes to convert the oil andoil-extracted algae into diesel (i.e. esterification and gasification-FT, respectively). Thesecond most influential factor in the production cost was the algae annual productivity,mainly because it would considerably alter the number of PBR units and the solar powerplant capacity simultaneously. Other significant factors included carbon price increaserate, plant production capacity, and PBR CAPEX. Moreover, none of the second-ordersensitivities appeared to have a sizeable impact on the production cost.
The global sensitivity of 5- and 30-year ROI to the key input parameters are depicted in
14
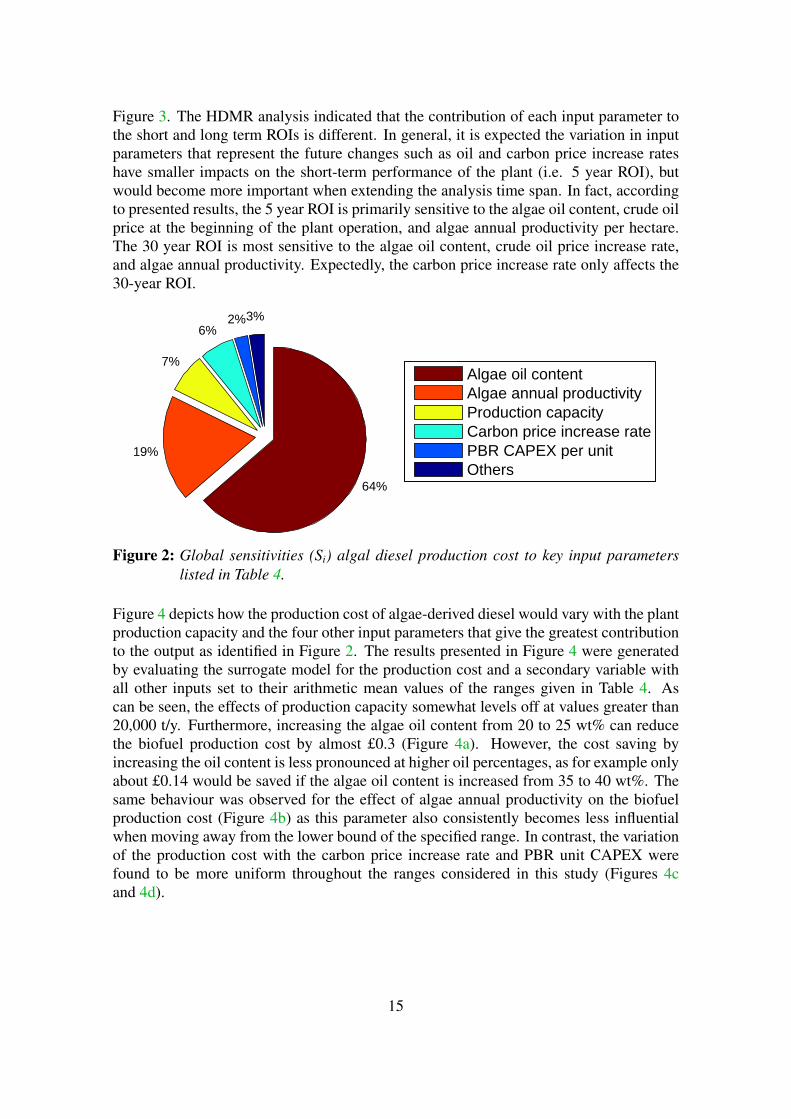
Figure 3. The HDMR analysis indicated that the contribution of each input parameter tothe short and long term ROIs is different. In general, it is expected the variation in inputparameters that represent the future changes such as oil and carbon price increase rateshave smaller impacts on the short-term performance of the plant (i.e. 5 year ROI), butwould become more important when extending the analysis time span. In fact, accordingto presented results, the 5 year ROI is primarily sensitive to the algae oil content, crude oilprice at the beginning of the plant operation, and algae annual productivity per hectare.The 30 year ROI is most sensitive to the algae oil content, crude oil price increase rate,and algae annual productivity. Expectedly, the carbon price increase rate only affects the30-year ROI.
3%2%6%
7%
19%
64%
Algae oil contentAlgae annual productivityProduction capacityCarbon price increase ratePBR CAPEX per unitOthers
Figure 2: Global sensitivities (Si) algal diesel production cost to key input parameterslisted in Table 4.
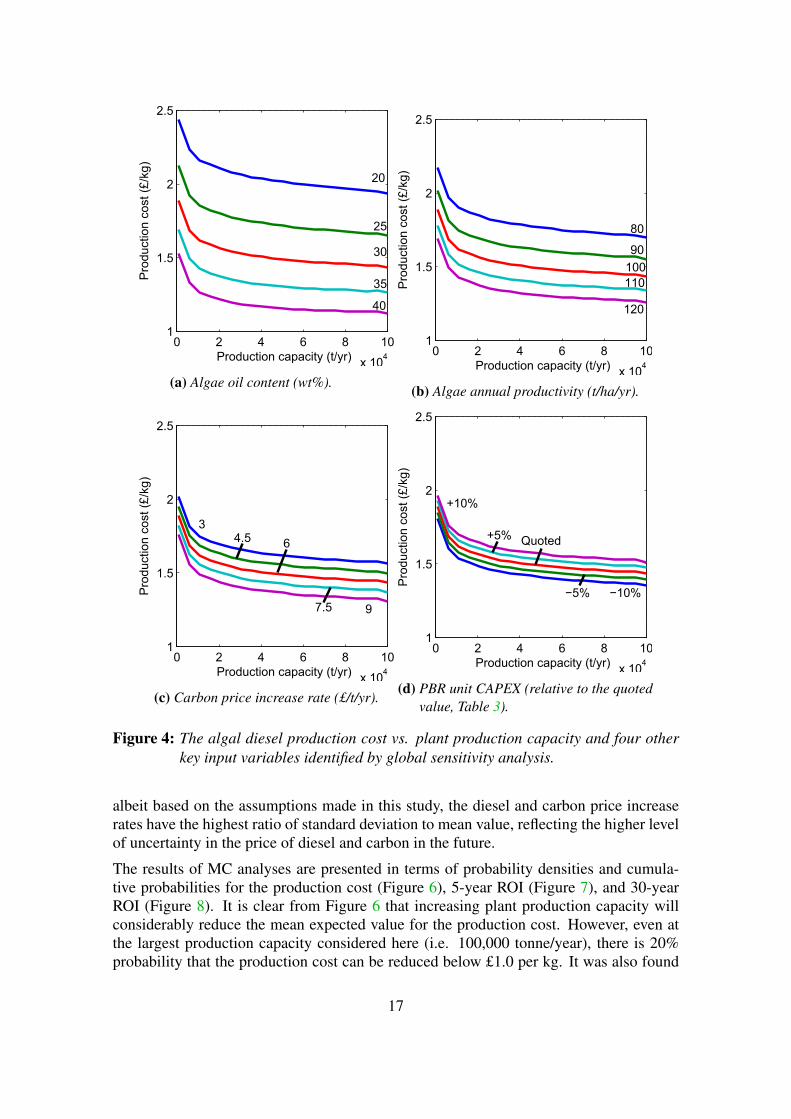
Figure 4 depicts how the production cost of algae-derived diesel would vary with the plantproduction capacity and the four other input parameters that give the greatest contributionto the output as identified in Figure 2. The results presented in Figure 4 were generatedby evaluating the surrogate model for the production cost and a secondary variable withall other inputs set to their arithmetic mean values of the ranges given in Table 4. Ascan be seen, the effects of production capacity somewhat levels off at values greater than20,000 t/y. Furthermore, increasing the algae oil content from 20 to 25 wt% can reducethe biofuel production cost by almost £0.3 (Figure 4a). However, the cost saving byincreasing the oil content is less pronounced at higher oil percentages, as for example onlyabout £0.14 would be saved if the algae oil content is increased from 35 to 40 wt%. Thesame behaviour was observed for the effect of algae annual productivity on the biofuelproduction cost (Figure 4b) as this parameter also consistently becomes less influentialwhen moving away from the lower bound of the specified range. In contrast, the variationof the production cost with the carbon price increase rate and PBR unit CAPEX werefound to be more uniform throughout the ranges considered in this study (Figures 4cand 4d).
15

3%<1%<1%2%
5%
15%
17%
57%
(a)
4%1%4%
7%
10%
12%
18%
43%
(b)
Algae oil contentAlgae annual productivityCrude oil priceCrude oil price increase rateProduction capacityCarbon price increase ratePBR CAPEX per unitOthers
Figure 3: Global sensitivities (Si) of ROI to key input parameters listed in Table 4 for a)5 years, and b) 30 years. The order in the key was calculated from the averageof the two sensitivities.
3.2 Uncertainty Analysis
In this section, we present the results of Monte Carlo uncertainty analysis on the economicfeasibility of the described algal biorefinery. These results help to provide a better under-standing of how the current uncertainties surrounding the algae conversion processes canaffect the cost of algal biofuel production; and in a more general scope, how these uncer-tainties affect the economic viability of such algal biorefineries. To this end, we assumeda normal probability distribution for each of the 14 parameters listed in Table 5 centredaround their mean values. The mean of each parameter corresponds to a reasonable cur-rent estimate of its value, and the standard deviation represents the uncertainty associatedwith that value. The plant production capacity was treated as a known input with no asso-ciated uncertainty and the analysis was run three times with its value set to 1,000, 10,000,and 100,000 tonnes of biodiesel per year. Figure 5 shows the probability densities of themajor input parameters to the model with the means and standard deviations given in Ta-ble 5. These parameters (i.e. annual productivity, oil content, crude oil price and its annualincrease rate, PBR CAPEX, and carbon price increase rate) have been previously identi-fied as the most important inputs in the HDMR analysis (see Figures 2 & 3). The width ofeach curve in Figure 5 is normalised by the mean value of the parameter. This shows that,
16
0 2 4 6 8 10
x 104
1
1.5
2
2.5
20
25
30
35
40
Production capacity (t/yr)
Pro
duct
ion
cost
(£/k
g)
(a) Algae oil content (wt%).
0 2 4 6 8 10
x 104
1
1.5
2
2.5
80
90100110
120
Production capacity (t/yr)
Pro
duct
ion
cost
(£/k
g)(b) Algae annual productivity (t/ha/yr).
0 2 4 6 8 10
x 104
1
1.5
2
2.5
34.5 6
7.5 9
Production capacity (t/yr)
Pro
duct
ion
cost
(£/k
g)
(c) Carbon price increase rate (£/t/yr).
0 2 4 6 8 10
x 104
1
1.5
2
2.5
−10%−5%
Quoted+5%
+10%
Production capacity (t/yr)
Pro
duct
ion
cost
(£/k
g)
(d) PBR unit CAPEX (relative to the quotedvalue, Table 3).
Figure 4: The algal diesel production cost vs. plant production capacity and four otherkey input variables identified by global sensitivity analysis.
albeit based on the assumptions made in this study, the diesel and carbon price increaserates have the highest ratio of standard deviation to mean value, reflecting the higher levelof uncertainty in the price of diesel and carbon in the future.
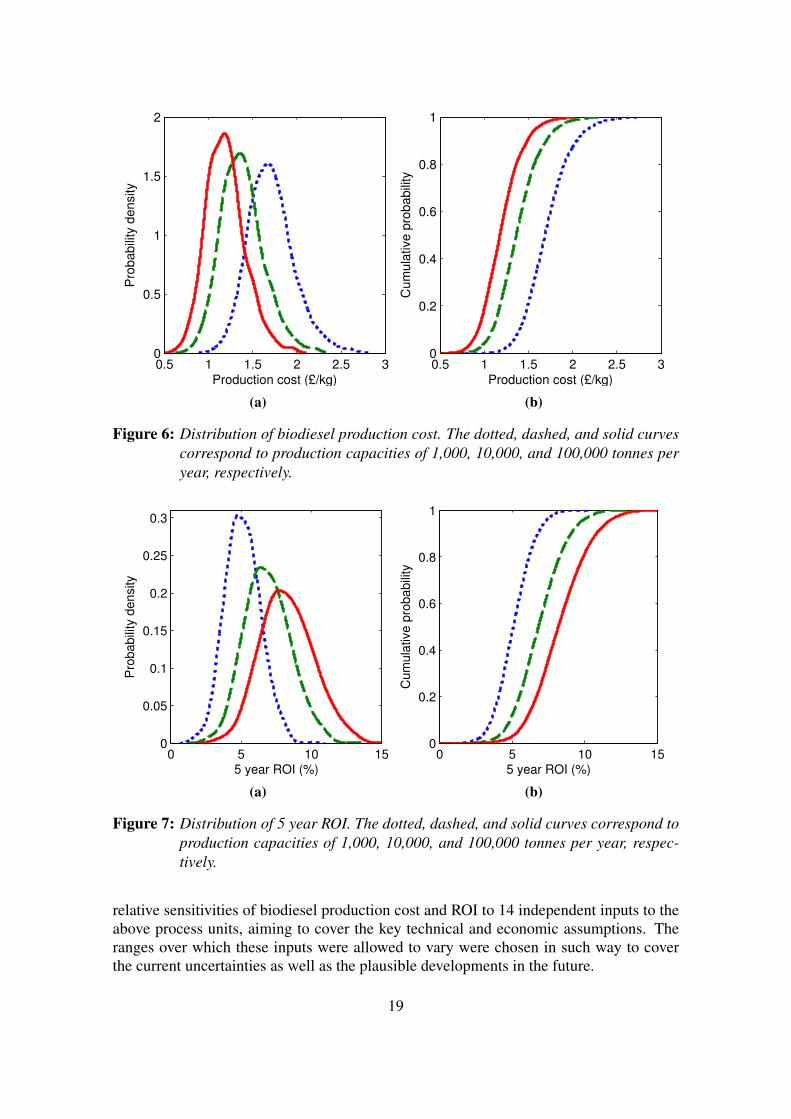
The results of MC analyses are presented in terms of probability densities and cumula-tive probabilities for the production cost (Figure 6), 5-year ROI (Figure 7), and 30-yearROI (Figure 8). It is clear from Figure 6 that increasing plant production capacity willconsiderably reduce the mean expected value for the production cost. However, even atthe largest production capacity considered here (i.e. 100,000 tonne/year), there is 20%probability that the production cost can be reduced below £1.0 per kg. It was also found
17

that for a average-sized plant (e.g. 10,000 tonne/year), there is 50% probability that theproduction cost of algae-derived diesel exceeds £1.3 per kg.
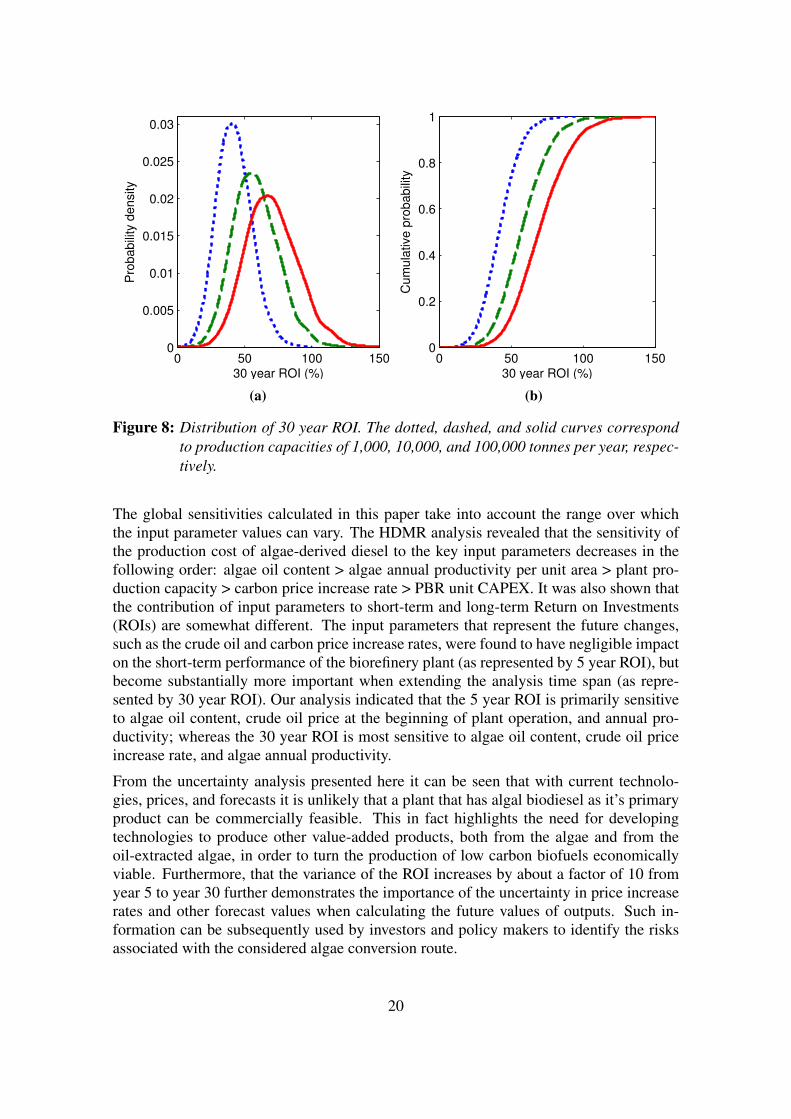
The probability results for 5- and 30-year ROI in Figures 7 and 8 suggest that the plantproduction capacity has a similar effect on the ROI probability over both time periods.The probability of a higher ROI over either period increases significantly when increasingthe plant production capacity. It is also evident that the uncertainty in the value of 30-yearROI is around a factor of ten greater than that of the 5-year ROI.
0
1
2
3
4
5
6
7
0 1 2 3 4 5 6 7
Prob
abili
ty d
ensi
ty
Algae annual productivity
PBR unit CAPEX
Algae oil content
Crude oil price
Crude oil price increase rate
Carbon price increase rate
Figure 5: Normal distributions of the most important inputs identified in the global sen-sitivity analysis. In order to allow comparison of the relative uncertaintyof different inputs, the probability densities N (µ,σ 2) are transformed toN (0,σ 2/µ2) and shown from −3σ/µ to +3σ/µ .
4 Conclusions
We developed a techno-economic model for the assessment of algae-derived biodieselproduction under economic and technical uncertainties currently associated with algalbiorefineries. The proposed strategy was comprised of photobioreactor (PBR), harvesting,oil extraction, oil esterification, and integrated gasification/Fischer-Tropsch units. In orderto fully realise the environmental benefits of algal biofuels, a concentrated solar power(CSP) system was considered to provide the biorefinery with decarbonised electricity.High Dimensional Model Representation (HDMR) method was implemented to study the
18
0.5 1 1.5 2 2.5 30
0.5
1
1.5
2
Production cost (£/kg)
Pro
ba
bili
ty d
en
sity
(a)
0.5 1 1.5 2 2.5 30
0.2
0.4
0.6
0.8
1
Production cost (£/kg)
Cu
mu
lative
pro
ba
bili
ty(b)
Figure 6: Distribution of biodiesel production cost. The dotted, dashed, and solid curvescorrespond to production capacities of 1,000, 10,000, and 100,000 tonnes peryear, respectively.
0 5 10 150
0.05
0.1
0.15
0.2
0.25
0.3
5 year ROI (%)
Pro
ba
bili
ty d
en
sity
(a)
0 5 10 150
0.2
0.4
0.6
0.8
1
5 year ROI (%)
Cu
mu
lative
pro
ba
bili
ty
(b)
Figure 7: Distribution of 5 year ROI. The dotted, dashed, and solid curves correspond toproduction capacities of 1,000, 10,000, and 100,000 tonnes per year, respec-tively.
relative sensitivities of biodiesel production cost and ROI to 14 independent inputs to theabove process units, aiming to cover the key technical and economic assumptions. Theranges over which these inputs were allowed to vary were chosen in such way to coverthe current uncertainties as well as the plausible developments in the future.
19
0 50 100 1500
0.005
0.01
0.015
0.02
0.025
0.03
30 year ROI (%)
Pro
babili
ty d
ensity
(a)
0 50 100 1500
0.2
0.4
0.6
0.8
1
30 year ROI (%)
Cum
ula
tive p
robabili
ty(b)
Figure 8: Distribution of 30 year ROI. The dotted, dashed, and solid curves correspondto production capacities of 1,000, 10,000, and 100,000 tonnes per year, respec-tively.
The global sensitivities calculated in this paper take into account the range over whichthe input parameter values can vary. The HDMR analysis revealed that the sensitivity ofthe production cost of algae-derived diesel to the key input parameters decreases in thefollowing order: algae oil content > algae annual productivity per unit area > plant pro-duction capacity > carbon price increase rate > PBR unit CAPEX. It was also shown thatthe contribution of input parameters to short-term and long-term Return on Investments(ROIs) are somewhat different. The input parameters that represent the future changes,such as the crude oil and carbon price increase rates, were found to have negligible impacton the short-term performance of the biorefinery plant (as represented by 5 year ROI), butbecome substantially more important when extending the analysis time span (as repre-sented by 30 year ROI). Our analysis indicated that the 5 year ROI is primarily sensitiveto algae oil content, crude oil price at the beginning of plant operation, and annual pro-ductivity; whereas the 30 year ROI is most sensitive to algae oil content, crude oil priceincrease rate, and algae annual productivity.
From the uncertainty analysis presented here it can be seen that with current technolo-gies, prices, and forecasts it is unlikely that a plant that has algal biodiesel as it’s primaryproduct can be commercially feasible. This in fact highlights the need for developingtechnologies to produce other value-added products, both from the algae and from theoil-extracted algae, in order to turn the production of low carbon biofuels economicallyviable. Furthermore, that the variance of the ROI increases by about a factor of 10 fromyear 5 to year 30 further demonstrates the importance of the uncertainty in price increaserates and other forecast values when calculating the future values of outputs. Such in-formation can be subsequently used by investors and policy makers to identify the risksassociated with the considered algae conversion route.
20

Acknowledgements
Part of this work was funded by the Technology Strategy Board (TSB) grant programme,“Carbon Abatement Technologies, Phase 2 competition for collaborative R& D and fea-sibility”, Grant No. TS/J004553. The Technology Strategy Board is an executive bodyestablished by the United Kingdom Government to drive innovation. It promotes and in-vests in research, development and the exploitation of science, technology and new ideasfor the benefit of business, increasing sustainable economic growth in the UK and im-proving quality of life. The authors are thankful to Dr. Sebastian Mosbach and Dr. JethroAkroyd for their generous help throughout this project.
21

References
[1] P. Azadi. An integrated approach for the production of hydrogen and methaneby catalytic hydrothermal glycerol reforming coupled with parabolic trough so-lar thermal collectors. Int J Hydrogen Energ, 37(23):17691–17700, 2012.doi:10.1016/j.ijhydene.2012.08.045.
[2] Y. Chisti. Biodiesel from microalgae. Biotechnol Adv, 25(3):294–306, 2007.doi:10.1016/j.biotechadv.2007.02.001.
[3] R. Davis, A. Aden, and P. T. Pienkos. Techno-economic analysis of au-totrophic microalgae for fuel production. Appl Energy, 88:3524–3531, 2011.doi:10.1016/j.apenergy.2011.04.018.
[4] Department of Energy and Climate Change. Carbon valuation in UK policy ap-praisal: A revised approach. Technical report, 2009.
[5] HMRC. Corporation tax rates, May 2011. URL http://www.hmrc.gov.uk/rates/corp.htm. Accessed Nov 13, 2012.
[6] O. R. Inderwildi and D. A. King. Quo vadis biofuels? Energy Environ Sci, 2:343–346, 2009. doi:10.1039/B822951C.
[7] L. Lardon, A. Hélias, B. Sialve, J.-P. Steyer, and O. Bernard. Life-cycle assessmentof biodiesel production from microalgae. Environ Sci Technol, 43(17):6475–6481,2009. doi:10.1021/es900705j.
[8] P. J. le B. Williams and L. M. L. Laurens. Microalgae as biodiesel & biomassfeedstocks: Review & analysis of the biochemistry, energetics & economics. EnergyEnviron Sci, 3:554–590, 2010. doi:10.1039/B924978H.
[9] G. Li, S.-W. Wang, and H. Rabitz. Practical approaches to construct RS-HDMR component functions. J Phys Chem A, 106(37):8721–8733, 2002.doi:10.1021/jp014567t.
[10] F. Mueller-Langer, E. Tzimas, M. Kaltschmitt, and S. Peteves. Techno-economicassessment of hydrogen production processes for the hydrogen economy for theshort and medium term. Int J Hydrogen Energy, 32(16):3797–3810, 2007.doi:10.1016/j.ijhydene.2007.05.027.
[11] J. Murray and D. King. Climate policy: Oil’s tipping point has passed. Nature, 481(7382):433–435, 2012. doi:10.1038/481433a.
[12] National Agricultural Statistics Service. 2012 Minnesota agricultural statistics.Technical report, 2012. URL http://www.nass.usda.gov/Statistics_by_State/Minnesota/Publications/Annual_Statistical_Bulletin/2012/Whole%20Book.pdf.
22
[13] National Renewable Energy Laboratory. Assessment of parabolic trough and powertower solar technology cost and performance forecasts. Technical report, NationalRenewable Energy Laboratory, 2003.
[14] NiTech Solutions. URL http://www.nitechsolutions.co.uk/. accessed Nov13, 2012.
[15] N.-H. Norsker, M. J. Barbosa, M. H. Vermuë, and R. H. Wijffels. Microalgal pro-duction — a close look at the economics. Biotechnol Adv, 29(1):24–27, 2011.doi:10.1016/j.biotechadv.2010.08.005.
[16] OriginOil. Strategies for utilizing whole algae biomass. In Pacific West BiomassConference & Trade Show, Jan. 2012. URL http://www.originoil.com/pdf/OriginOil_Pacific_West_Biomass_Conference. Accessed Nov 13, 2012.
[17] H. Rabitz and Ö. F. Alıs. General foundations of high-dimensional model represen-tations. J Math Chem, 25:197–233, 1999. doi:10.1023/A:1019188517934.
[18] Rentech. URL http://rentechinc.com/rentech-process.php. accessedNov 13, 2012.
[19] J. W. Richardson, M. D. Johnson, and J. L. Outlaw. Economic comparisonof open pond raceways to photo bio-reactors for profitable production of al-gae for transportation fuels in the southwest. Algal Res, 1(1):93–100, 2012.doi:10.1016/j.algal.2012.04.001.
[20] T. Searchinger, R. Heimlich, R. A. Houghton, F. Dong, A. Elobeid, J. Fabiosa,S. Tokgoz, D. Hayes, and T.-H. Yu. Use of u.s. croplands for biofuels increasesgreenhouse gases through emissions from land-use change. Int S Techn Pol Inn, 319(5867):1238–1240, 2008. doi:10.1126/science.1151861.
[21] T. Shirvani, X. Yan, O. R. Inderwildi, P. P. Edwards, and D. A. King. Life cycleenergy and greenhouse gas analysis for algae-derived biodiesel. Energy Environ Sci,4:3773–3778, 2011. doi:10.1039/C1EE01791H.
[22] Subitec. Sustainable biotechnology. URL http://en.subitec.com/. accessedNov 13, 2012.
[23] B. Taylor, N. Xiao, J. Sikorski, M. Yong, T. Harris, T. Helme, A. Small-bone, A. Bhave, and M. Kraft. Techno-economic assessment of carbon-negative algal biodiesel for transport solutions. Appl Energy, 106:262–274, 2013.doi:10.1016/j.apenergy.2013.01.065.
[24] J. Xue, T. E. Grift, and A. C. Hansen. Effect of biodiesel on engine per-formances and emissions. Renew Sustain Energy Rev, 15(2):1098–1116, 2011.doi:10.1016/j.rser.2010.11.016.
23