Alexander JanLondon School of Economics – MSc Urban & Regional Planning 28 January 2013 Road...
80
Alexander Jan London School of Economics – MSc Urban & Regional Planning 28 January 2013 Road pricing in England: has its time finally come?
-
Upload
moriah-bury -
Category
Documents
-
view
214 -
download
0
Transcript of Alexander JanLondon School of Economics – MSc Urban & Regional Planning 28 January 2013 Road...

Alexander Jan London School of Economics – MSc Urban & Regional Planning
28 January 2013
Road pricing in England: has its time finally come?

2
Agenda
Historical context
The problem as was
The problem looking forward
Experience from London
Government proposals
Concluding thoughts

3
Historical context
“It is impossible to spend any time on the study of the future of traffic in towns without at once being appalled by the magnitude of the emergency that is coming upon us. We are nourishing at immense cost a monster of great potential destructiveness, and yet we love him dearly. To refuse to accept the challenge it presents would be an act of defeatism”
HMSO, Penguin Books, Traffic in Towns The Specially shortened edition of the Buchanan Report, Penguin Books, London, 1964

4
Historical context “We think the public can justifiably demand
to be fully informed about the possibilities of adapting towns to motor traffic before there is any question of applying restrictive measures.”
HMSO, Penguin Books, Traffic in Towns The Specially shortened edition of the Buchanan Report, Penguin Books, London, 1964

5
That was then….
Traffic in towns
DfT, Transport Statistics Great Britain, London, 2012

6
A seven fold increase in vehicles since the 1950s…
DfT, Transport Statistics Great Britain, London, 2012
Traffic in towns

7
Brixton Town Centre – post redevelopment, seen from the motorwaywww.cbrd.co.uk
Brixton in the snow. “We’re still loving snowy SW9!”© urban7, 2nd/3rd Feb, 2009
Brixton….

8
Finchley Road, Belsize Park….
www.cbrd.co.uk

9
The problem…
Congestion
Pollution
Economic impacts
Accidents
Quality of life
(Competiveness, growth, employment?)

10
The problem
“Despite the government’s efforts, the deterioration in the network is noticeable. Congestion already costs the UK economy up to £8bn each year and without measures to tackle this, the figure could riseto £22bn a year by 2025.”
Source: CBI, Bold thinking A model to fund our future roads, London, 2012

11
Well, may be not worse, just more complicated…

12
UK context: long term traffic forecasts
80
100
120
140
160
180
200
220
240
260
Inde
x (1
980
= 10
0) Historical traffic
Forecast traffic
Source: Department for Transport

13
UK context: long term congestion forecasts
0
100
200
300
400
500
600
700
800
900
Commuters Employer's Business
Education and Personal Business
Home based Recreation
and Holiday
Non home based
Recreation and Holiday
LGVs HGVs
Tot
al L
ost T
ime
(mill
ion
hour
s)
2003 2015 2025 2035
Source: Department for Transport

14
Some things have got better…
DfT, Transport Statistics Great Britain, London, 2012

15
…in environmental terms…
In: Johnson et al, Fuel for Thought , RAC Foundation, Institute for Fiscal Studies, London, 2012

16
But with unintended consequences….?
In: Johnson et al, Fuel for Thought , RAC Foundation, Institute for Fiscal Studies, London, 2012

17
The government has done well out of the motorist...
DfT, Transport Statistics Great Britain, London, 2012

18
But the motorist has learned….
Johnson et al, Fuel for Thought , RAC Foundation, Institute for Fiscal Studies, London, 2012

19
…to fight back….
Johnson et al, Fuel for Thought , RAC Foundation, Institute for Fiscal Studies, London, 2012
“Overall, one cannot help but think that the current levels of motoring taxationhave little to do with either sound revenue-raising principles or external costarguments. Rather, they are an accident of history by which the governmentraises as much as it can get away with.”

20
Looking forward, problem is changing…
Fuel duty and Vehicle Excise Duty (VED) contribute c. £38 billion a year, some 7% of all the Exchequer’s income.
44 % more traffic by 2035…. but revenue from motoring taxation is set to drop by £13 billion a year by 2029 to £25 billion
Key driver has been fuel efficiency of vehicles (Govt climate change policy)
Congestion set to get worse
Less than one third of this money is spent on national and local roads
Major population growth and ageing assets means more expenditure to “standstill”

21
Experience from London Introduced by Ken Livingstone, February 2003, if driving
within central London between 7 a.m. and 6.30 p.m. on a weekday
July 2005 rose to £8, increased to current level £10
Within a year, day-time average speed increased to 16.7 km/h from 14.3 km/h (c17% improvement)
Car traffic decreased 34%, trucks 7% and vans 5%
Charge was not really on congestion: “greener” vehicle discounts allowed motorists to drive for free
Public opposition turned to public support!
Tenth anniversary this year….

22
Success, but a one-off?
Congestion charge introduced February 2003
DfT, Transport Statistics Great Britain, London, 2012

23
But overall scheme has produced mixed results? Costly… c. 50% of revenues spend on running the system (2006/07
~ £252m vs costs of £130m); 40%+ of revenues came from enforcement charges
Downing Street on-line petition (2007)
Western extension removed by Boris Johnson (December 2010)
Big “no” vote in Greater Manchester (78.8%) (April 2010)
Whilst traffic volumes are lower, congestion has crept back up… (2007 levels close to 2002)
Cities have not rushed to replicate the scheme
London mayor(s) wary about introducing London wide user charging…

24
Further change any time soon?
“And yet no government has really solved the problem of how to finance the infrastructure we need within the public spending constraints we have.”
Finally, on top of the failures of vision and of financing, there's been a simple failure of nerve.”
No government has acted with the necessary determination to blast through the vested interests and bureaucratic hurdles in order to provide what the long-term national interest demands.”
To put it crudely, we've become good in Britain at sweating old assets.”
Prime minister, David Cameron, March 2012

25
“Road tolling is one option - but we are only considering this for new, not existing, capacity.”
Why is it that other infrastructure - for example water - is funded by private sector…but roads in Britain call on the public finances for funding?”
That's why I have asked the Department for Transport and the Treasury to carry out a feasibility study of new ownership and financing models for the national roads system and to report progress to me in the Autumn.”
Let me be clear: this is not about mass tolling - and as I've said, we're not tolling existing roads...it's about getting more out of the money that motorists already pay.”
Prime minister, David Cameron, March 2012

26
UK: Investment backlog
96 unfunded projects identified, including for local authorities.
Cost estimates available for 77 of them, totalling £10.7bn billion.
Weighted average BCR of 3.6 where known, but some as high as 10.
Some clusters of projects around regions or corridors.
Source: Arup

27
UK context: international comparison
Country reviewedWorld Economic Forum
highways ranking
France 1
Portugal 5
Spain 11
Canada 14
USA 20
Australia 34
UK 26Source: World Economic Forum

28
International experience: investment trends
Source: OECD
0
2,000
4,000
6,000
8,000
10,000
12,000
14,000
€m
illio
ns
p.a
. (20
09 v
alu
es)
Historical highways investment in countries reviewed
Australia
Canada
France
Portugal
Spain
UK

29
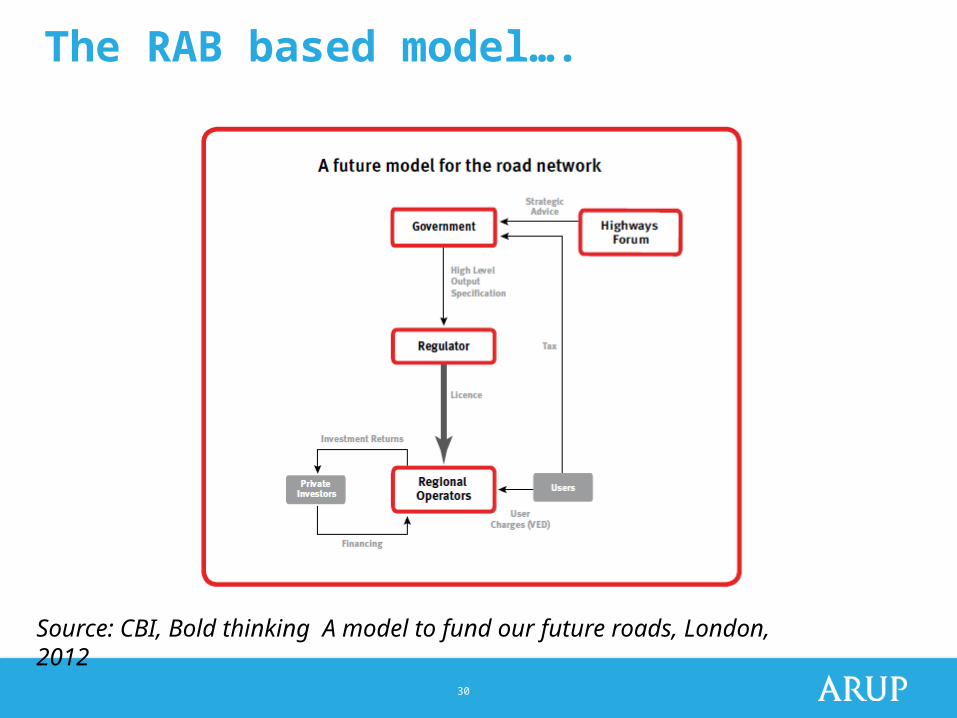
Government way forward?
Giving the sector a revenue stream - a proportion of Vehicle Excise Duty?
A change to the HA’s corporate status or break up into regions….
So called “RAB” model to attract investment
Independent regulation of the sector, with customer service obligations (water)
30
The RAB based model….
Source: CBI, Bold thinking A model to fund our future roads, London, 2012

31
Conclusions
Problem of congestion is persistent and likely to get worse (return of economic growth, population increase)
Other policy factors now in play (declining source of general taxation for government)
Some indication that Government is considering reform (including a user charge) for motorways but nervousness over public acceptability (Downing Street petition)
Strong investor appetite – could raise significant revenues for HMT…
Brings into focus the question of what are our roads for?

32
“End of the free green run... now hybrid cars will have to pay congestion charge too”
London Evening Standard, 28 January 2013

Discussion and questions

34
Recommendations: projects
Potential for user charging on major schemes (e.g. Dartford and A14).
Innovation within PPPs (e.g. a more constructive public-private interface, and allocation of traffic risk).
Local innovation to allow authorities and other bodies more flexibility in funding priority schemes.

35
Recommendations: policy
Acknowledge the funding challenge.
Longer term strategy to address growing demand.
Stable, long term funding to support investment.
Regionalisation / localism.

36
UK context: policy and budgets
IUK providing focus at heart of government on long term infrastructure challenges.
Investment in economic infrastructure prioritised at CSR 2010.
But cuts to investment budgets for HA and local transport major projects.
Is investment in our highways sector being overlooked?

37
UK context: highways investment
HA pioneered use of PPPs for highways, since copied and modified by the rest of the world.
M6 toll and river crossings are isolated examples of tolling.
Strategic road network highly dependent on central government for funding.
Contrasts with other parts of the infrastructure sector.

38
UK context: sector investment backlog
96 unfunded projects identified, including for local authorities.
Cost estimates available for 77 of them, totalling £10.7bn billion.
Weighted average BCR of 3.6 where known, but some as high as 10.
Some clusters of projects around regions or corridors.
Source: Arup

39
UK context: sector investment backlog
Source: Arup; DfT data
0 2 4 6 8 10 120
200
400
600
800
1,000
1,200
Costs and BCRs for unfunded projects
BCRs
£ m
illio
ns,
201
0 va
lues
£32,000

40
UK context: investment backlog...contd
Source: Department for Transport data, Arup analysis
1,749
3,947
917
1,129
1,175
Breakdown of project types, by value (£ millions, 2010 values) Widenings
New connections
Junction improvements
Managed Motorways
Other

41
UK context: some questions
How important is investment in our strategic road network, compared with other priorities?
Why is our approach to funding highways so different from other infrastructure sectors?
What happened to the UK Government’s enthusiasm for highways PPPs?
Why does the M6 toll remain a one-off?

International experience

43
International experience: key differences
Investment trends and investment planning
Roles of central and regional / state governments
Attitudes towards private finance
User charging

44
International experience: investment planning
Longer term investment planning for highways in comparator countries:
- Australian Nation Building Economic Stimulus Plan
- Building Canada Fund
- Investment planning cycles built into privatised French networks
- Spain’s 15 year Infrastructure Plan

45
International experience: roles of central and regional / state government
Central governments typically provide funding support (e.g. Australia, Canada, USA).
State / regional governments lead most procurements (most notably Spain).
Picture in France more complex, but significant devolution through privatisation of sub-regional networks.

46
International experience: attitudes towards private finance
Strong support for PPP in comparators.
Commercial models similar to those used in the UK, but note significance of different accounting rules.
Relationships between public and private sector appear more constructive (e.g. Spain and France).
Government bodies actively promote PPPs (e.g. European PPP Expertise Centre, PPP Canada, FHWA Office of Innovative Programme Delivery).

47
International experience: user charging
Longer and more extensive history of tolling strategic networks in European comparators.
Use of tolling growing in the US and Canada.
Some high profile financial failures (e.g. In Australia).
Revenue stream allows sector to fund its own development.

48
International experience: investor appetite
Separate markets for brownfield and greenfield projects.
Lenders reluctant to take full volume risk, particularly for greenfield projects. Some notable failures...
Governments acting to reduce private sector risk exposure.
New projects less likely to be delivered as direct tolls.
2010
Technical and commercial adviser to CVC Capital
Partners in the acquisition of 23% of the shareholdings of Abertis, operator of 10,000 km of highways in Spain, France and South America
2010
Technical adviser to DIF Infrastructure in the
acquisition of shareholdings in two tolled bridge projects
owned by NTR in Ireland.
€1.72bn
Technical and commercial adviser to Eiser Infrastructure in
the acquisition of 49% stakes from Sacyr in two shadow toll
roads and two transport interchanges in, Spain
€47M 2010Price confidential

Lessons learned and recommendations

50
Lessons learned: recap and summary of differences
Congestion is forecast to increase significantly, and there is a large investment backlog.
Businesses rank our roads network as poorer than most developed countries.
Governance of the strategic network is relatively centralised.
The sector does not generate and retain significant revenues.
The private sector has a limited role, and government is relatively pessimistic about the potential of PPPs.

51
Recommendations: projects
Potential for user charging on major schemes (e.g. Dartford and A14).
Innovation within PPPs (e.g. a more constructive public-private interface, and allocation of traffic risk).
Local innovation to allow authorities and other bodies more flexibility in funding priority schemes.

52
Recommendations: strategic reform
Giving the sector a revenue stream (e.g. user charges or hypothecation of VED).
A change to the HA’s corporate status.
Independent regulation of the sector, with customer service obligations.
A move away from central planning.
http://www.cbi.org.uk/media-centre/press-releases/2012/10/gear-change-can-accelerate-the-uk-towards-a-21st-century-road-network/

Spare slides

54
Discussion and questions: some suggested themes...
Should the funding gap provide an impetus to new thinking?
What role do we see for the private sector in highways investment?
Is the UK regulated utility model the right one for roads?
Who should draw up a strategy for roads?

55
Further information
http://www.racfoundation.org/assets/rac_foundation/content/downloadables/providing_and_funding_strategic_roads-arup-071111.pdf
www.arup.com

56
Vehicle Excise Duty revenues have almost doubled between 1987 and 2011 whereas the
increase in the revenue from fuel duty has more than tripled.
As well as the £26.9 billion collected in fuel duty in 2011, there was an additional £5.4 billion
collected in VAT on fuel duty. Over the same period the RPI has more than
doubled.

57
Carbon
DfT, Transport Statistics Great Britain, London, 2012

58
King’s Cross as it could have been….
www.cbrd.co.uk

59
RACF/IFS 61/120

60
RACF/IFS 56/71

61

62

63
But overall scheme has produced mixed results? Typically 50% of revenues spend on running the system (2006/07 - £252m vs costs of £130m)
TfL's annual report for 2006–7 shows that revenues from the congestion charge were £252.4m over the financial year, representing 8.5% of TfL's annual revenues.
More than half of this was spent on the cost of running the toll system, at £130.1 million. Once other charges were deducted, the congestion charge brought in an
annual operating net income of £89.1m for TfL.[145] This income compares with TfL's total revenue from bus and tube fares of £2,269.4m, or 76.6% of revenue
before costs, or grants from central government of £2,390.3 million.
The initial operating revenues from the congestion charge did not reach the levels that were originally expected. Within six months of the start of the scheme, the
reduction in traffic had been such that TfL were predicting a £65 million revenue shortfall.[146]
By law, all surpluses raised must be reinvested into London's transport infrastructure; at the start of the scheme it was anticipated that this would be around
£200 million.[147][148] According to a report issued in February 2007, the initial costs of setting up the scheme were £161.7 million,[148] with an annual operating cost
of about £115m anticipated.[149] Total revenues over the first three and a half years had been £677.4 million, with TfL reporting a surplus over operating costs of
£189.7 million.[148] The Bow Group, compiled from TfL data estimated that by 2007 the project had only returned a modest £10 million profit.[52]
Although Parliament has limited the amount that authorities can borrow, for some time it had been speculated that the regular income obtained from the
congestion charge and other revenues could be used to securitise a bond issue that finances other transport projects across London.[150] TfL issued their first bond
for £200 million in 2005, to be repaid at 5% interest over 30 years. TfL plans to borrow £3.1 billion more to fund a 5-year transport programme across London,
including works on London Underground and road safety schemes.[151]
Revenues (£m) provisional 2004/5[14] 2005/6[90] 2006/7[15] Standard daily vehicle charges (currently £10) 98 121 125 Enforcement income 72 65 55 Fleet vehicle daily
charges (currently £7) 17 19 27 Resident vehicles (currently £4 per week) 2 2 6 Other income 2 Total revenues 190 210 213 Total operation and administration costs
(92) (88) (90) Net revenues 97 122 123 Expenditure (% of operating revenue) 2004/5[14] 2006/7[15] Bus network improvements (incl. vehicles, garages & shelters)
80% 82% Road and bridge maintenance & upgrades 11% Road safety (incl. research & campaigns) 11% 4% Walking & cycling programmes & publicity 6%
2.5% Distribution and freight (incl. review of a London lorry ban) 1% "Safer routes to schools" initiative

64
Revenues (£m) provisional 2004/5[14] 2005/6[90] 2006/7[15]
Standard daily vehicle charges (currently £10) 98 121 125
Enforcement income 72 65 55
Fleet vehicle daily charges (currently £7) 17 19 27
Resident vehicles (currently £4 per week) 2 2 6
Other income 2
Total revenues 190 210 213
Total operation and administration costs (92) (88) (90)
Net revenues 97 122 123
London, including works on London Underground and road safety schemes.151

65

66

67
Page 38 (53) in January 2011 (though charging hours now end at 6 p.m.). Exemptions from
the scheme exist for a number of vehicles including taxis, motorcycles, bicycles,
buses, disabled badge holders, emergency vehicles and some vehicles that
run on alternative fuel. Additionally, residents living in the zone receive a 90%
discount. The charge raised £158.1 million in 2010, net of operating costs (TfL,�
2011a). These revenues are hypothecated towards the improvement of public
transport in London, as is required by the Greater London Authority Act 1999.
The original zone comprised an area bounded by the Inner Ring Road,
covering approximately eight square miles. In February 2007, this was
extended to include additional parts of Westminster, Kensington and Chelsea.
This ‘Western extension’ was abolished in December 2010, returning the zone
to its original area.
The effect of the scheme on traffic levels and congestion is quite difficult to
determine. The most recent estimates come from Transport for London (TfL,
2008) suggesting that traffic in 2007 was around 18% lower in the central
congestion zone relative to pre-charging levels (and 36% lower for car traffic).
However, congestion levels in 2007 appeared to be no lower than they were
in 2002 (though they were cut during 2003 to 2006) – though of course to fully
assess the impact of the charge requires us to estimate the counterfactual level
of congestion in its absence. TfL (2008) suggests that congestion was lower
in 2007 than it would have been without the charge, after taking into account
factors such as an increased level of road maintenance work and changes
to traffic signal timings. Unfortunately, the 2008 report was the last available
– they are no longer published annually by TfL. Instead, information on
congestion is included as part of a wider annual report on transport in London.
The most recent (TfL, 2011b) suggests that removing the Western extension
increased traffic entering that area by about 8%, and congestion by about 3%.

68
RACF IFS (61/76)


70
Government proposalsAnd yet no government has really solved the problem of how to finance the infrastructure we need within the public spending constraints we have.Finally, on top of the failures of vision and of financing, there's been a simple failure of nerve.No government has acted with the necessary determination to blast through the vested interests and bureaucratic hurdles in order to provide what the long-term national interest demands.To put it crudely, we've become good in Britain at sweating old assets.But if you do that for too long, there's a price to pay.It's not enough just to keep the existing infrastructure going.We need to build - as other countries are building - the completely new infrastructure we need for the future.And on top of all this we haven't focused - as other countries focus - on ensuring that investment in infrastructure helps business at home.That's not about picking winners.It's about helping British companies to be winners.We haven't done anything like enough to help grow British expertise and jobs in building not only the infrastructure we need here, but in booming markets overseas.Now, after all these years of failure, compromise and lack of ambition, the reckoning is upon us.

71
Government proposalsAnd yet no government has really solved the problem of how to finance the infrastructure we need within the public spending constraints we have.Finally, on top of the failures of vision and of financing, there's been a simple failure of nerve.No government has acted with the necessary determination to blast through the vested interests and bureaucratic hurdles in order to provide what the long-term national interest demands.To put it crudely, we've become good in Britain at sweating old assets.But if you do that for too long, there's a price to pay.It's not enough just to keep the existing infrastructure going.We need to build - as other countries are building - the completely new infrastructure we need for the future.And on top of all this we haven't focused - as other countries focus - on ensuring that investment in infrastructure helps business at home.That's not about picking winners.It's about helping British companies to be winners.We haven't done anything like enough to help grow British expertise and jobs in building not only the infrastructure we need here, but in booming markets overseas.Now, after all these years of failure, compromise and lack of ambition, the reckoning is upon us.

72
Has it changed? - a perfect storm for policymakers
The report discusses in detail the second line of argument as to how motoring
taxes might be structured: rather than simply raising revenue, taxes should
reflect the various economic and social impacts that the use of vehicles has
on other road users and the community at large. These impacts include traffic
congestion, accidents, visual intrusion, noise and air pollution, and greenhouse
gas emissions.2
‘Revenue raising’ and ‘paying the external costs’ are quite distinct principles.
The amount of tax gathered under a revenue-raising regime might bear no
particular relation to the yield that reflects external economic, environmental
and social impacts.

73
Has it changed? - a perfect storm for policymakers
On top of the 14p for carbon you can reasonably add to fuel duty elements
corresponding to external costs such as air pollution. But then you have
a problem: by far the most costly damage inflicted by road users is traffic
congestion. This is not directly related to the amount of fuel used, and hence it
is hard to justify factoring it into fuel duty. Traffic congestion varies enormously
by time and place. Thus no single, universal rate of fuel duty can be regarded
as appropriate for all. The IFS estimates that at the current rate of duty, about
half of all vehicle miles are taxed too highly – many of them on uncongested
rural roads; one quarter are taxed about right; and the remainder are charged
too little – in some congested urban locations, far too little.

74
Has it changed? - a perfect storm for policymakers
The IFS is driven to the conclusion that if the ‘paying the external costs’
justification is to be sustained then a significant portion of current fuel duty
must be replaced by some form of ‘pay-as-you-go’ charge based on distance
driven in congested conditions. Such a charge moderates demand, and
therefore reduces congestion. There is a net overall gain, and the economic
value of the road is increased. The amount of revenue is determined by the
characteristics of the road and the level of demand for use of it. But this begs
the question: who gets the benefit of the use of the revenue?

75
Future trends….
Major shift in funding towards China, Asia, South America
Constraints on affordability, especially from state funding sources next 10+ years? Some
increasing role for the private sector. Some continued resistance to real tolls (Europe, US)
Elsewhere in the world, “long march” of highways likely to continue – less reluctance to toll
(key to demand management…) so globally more “user pays” projects
Sustained interest from longer term investors (pensions etc) - attractive asset class (matching
of liabilities…)
Impact of technology on payment mechanisms and traffic demand - more sophisticated, user
friendly, intelligent. Better use of existing assets…
Environmental issues: a continuing challenge as car ownership increases. Rate of growth
likely to outstrip technological improvements in energy efficiency, emissions etc?
Extent of change will vary dramatically by global region.
Today, in London, we travel at around 6 miles per hour – the standard set by the horse and cart
over a hundred years ago... plus ça change….

76
It should be noted that the congestion charge does not explicitly target
congestion. Motorists who pay it have unlimited use of roads within the
zone
during that day. Therefore, the charge does not take into account the
distance
driven, the location, or the time (within the specified hours) of the
journey.
Motorists who cause a greater congestion externality through driving
greater
distances at busier times are charged the same amount as other drivers
causing smaller external costs.

77
But good railways are only part of the answer on transport.
We need good roads, too.
Again, the problem's clear: we don't have enough capacity in places of key demand.
There's nothing green about a traffic jam - and gridlock holds the economy back.
So here's what we should do.
Yes, move passengers and heavy goods onto rail.
But also widen pinch points, add lanes to motorways by using the hard shoulder to increase
capacity and dual overcrowded A-roads.
The massive programme announced during last year's Growth Review made a good start.
But how do we do more, when , frankly, there isn't enough money?
We need to look at innovative approaches to the funding of our national roads - to increase
investment to reduce congestion.

78
Road tolling is one option - but we are only considering this for new, not existing, capacity.
For example, we're looking at how improvements to the A14 could be part funded through tolling.
But we now need to be more ambitious.
Why is it that other infrastructure - for example water - is funded by private sector capital through privately owned,
independently regulated, utilities but roads in Britain call on the public finances for funding?
We need to look urgently at the options for getting large-scale private investment into the national roads network - from
sovereign wealth funds, pension funds, and other investors.
That's why I have asked the Department for Transport and the Treasury to carry out a feasibility study of new ownership
and financing models for the national roads system and to report progress to me in the Autumn.
Let me be clear: this is not about mass tolling - and as I've said, we're not tolling existing roads...
...it's about getting more out of the money that motorists already pay.

79
Recommendations: policy
Acknowledge the funding challenge.
Longer term strategy to address growing demand.
Stable, long term funding to support investment.
Regionalisation / localism.

UK context


![Prima Pagina · 2017. 3. 16. · 11 12 14 16 19 21 24 29 MSC MSC Ji[han MSC MSC Jilhan MSC Jilhan AS Venus MSC Jilhan Tongan MSC MSC ]ilhan AS Venus MSC MSC Jilhan AS Venus AS Venus](https://static.fdocuments.net/doc/165x107/60ea7428e144a50de815ab4a/prima-pagina-2017-3-16-11-12-14-16-19-21-24-29-msc-msc-jihan-msc-msc-jilhan.jpg)