Alex Shy presentation for WVAGP2016
30
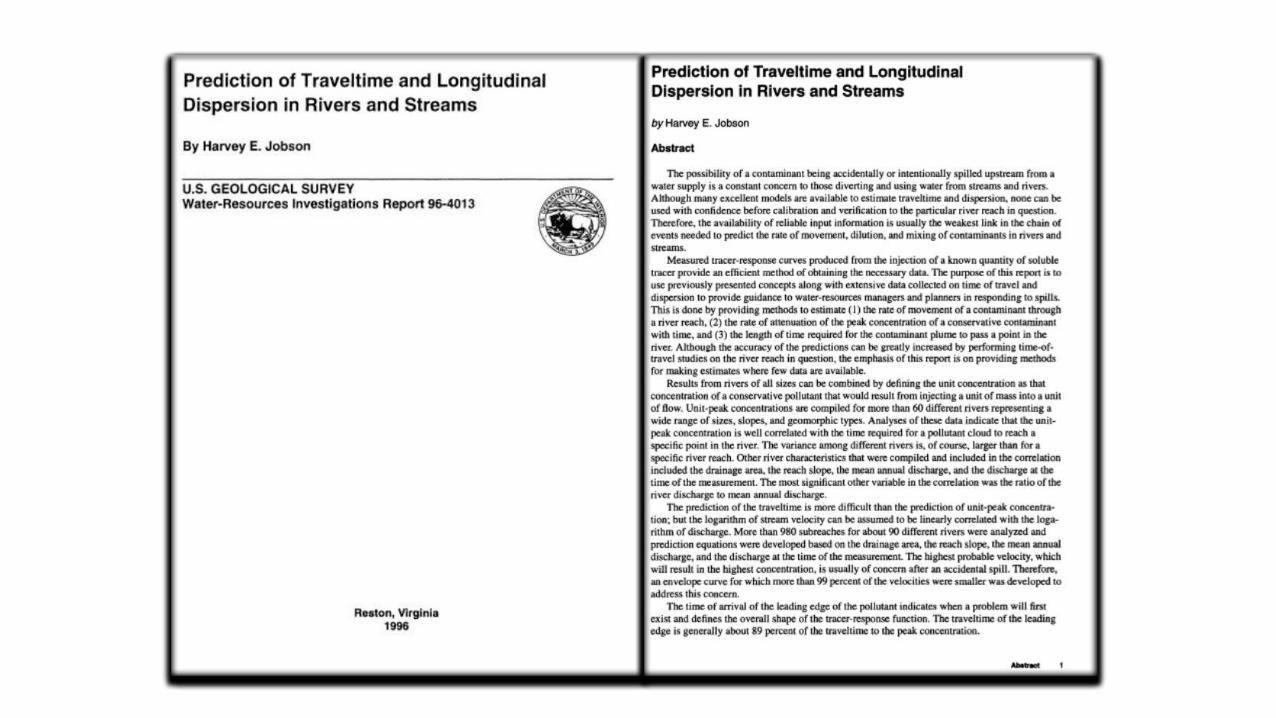
Real Time Water Flow Model for Delineating Zones of Critical Concern Alex Shy School of Natural Resources – Davis College West Virginia University 2016 West Virginia GIS Conference
Transcript of Alex Shy presentation for WVAGP2016
Real Time Water Flow Model for Delineating
Zones of Critical ConcernAlex Shy
School of Natural Resources – Davis CollegeWest Virginia University
2016 West Virginia GIS Conference
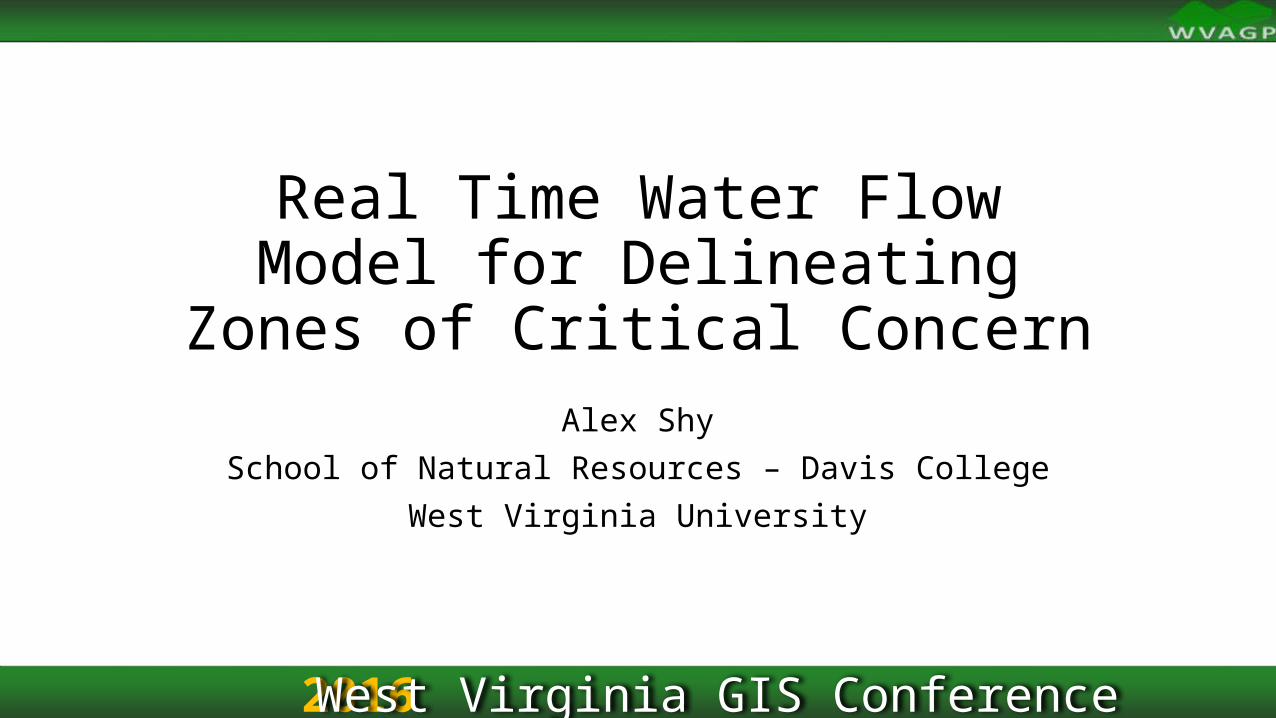
Instream Time of Travel
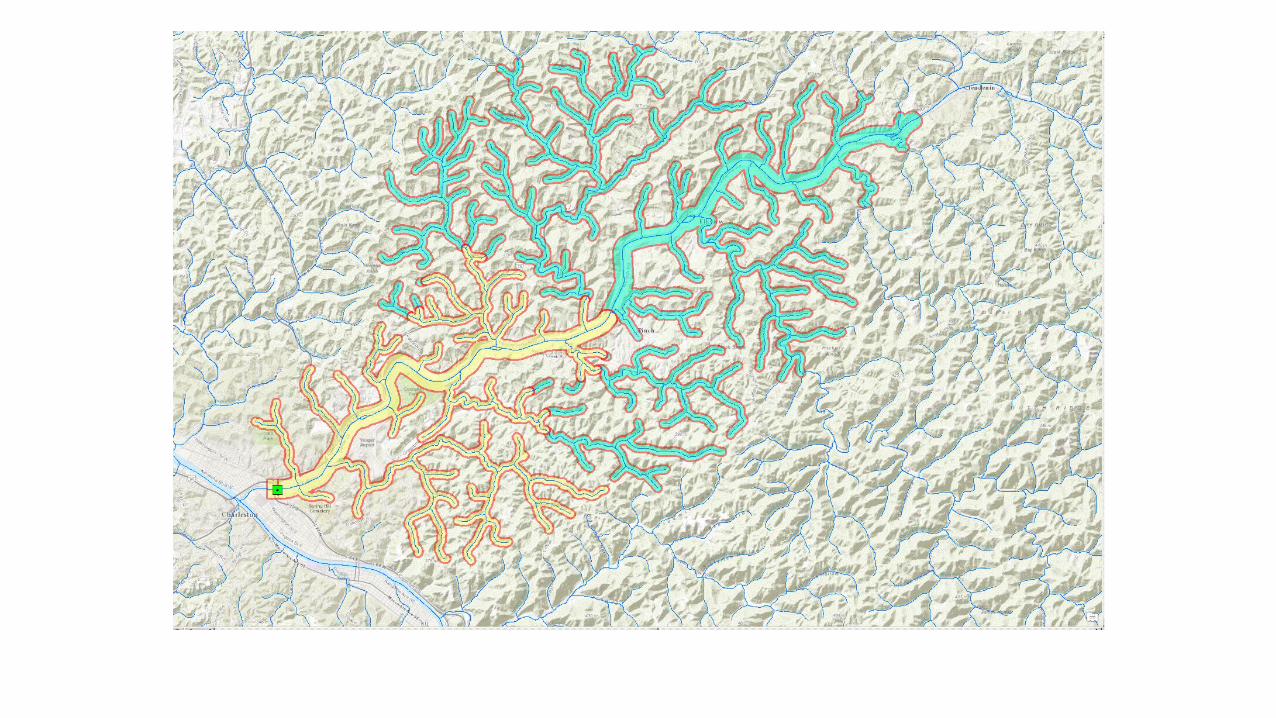
Zones of Critical Concern – WV Bureau of Public Health and WVDEP
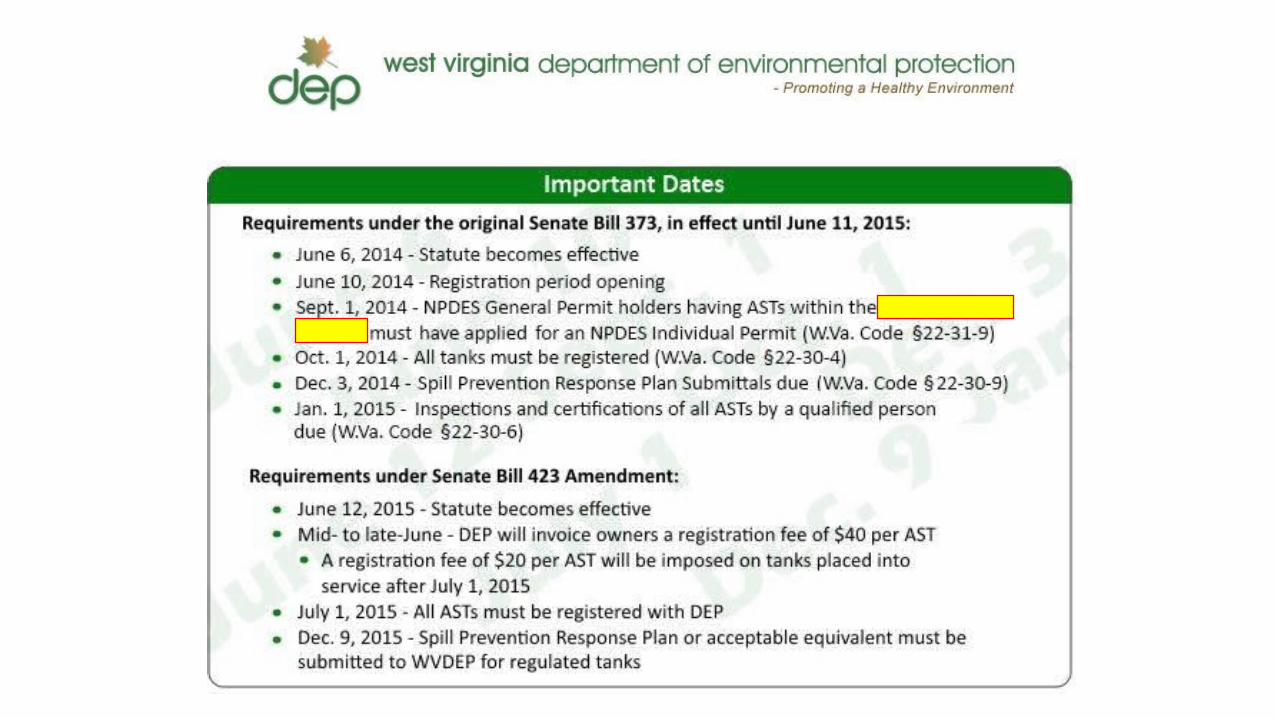
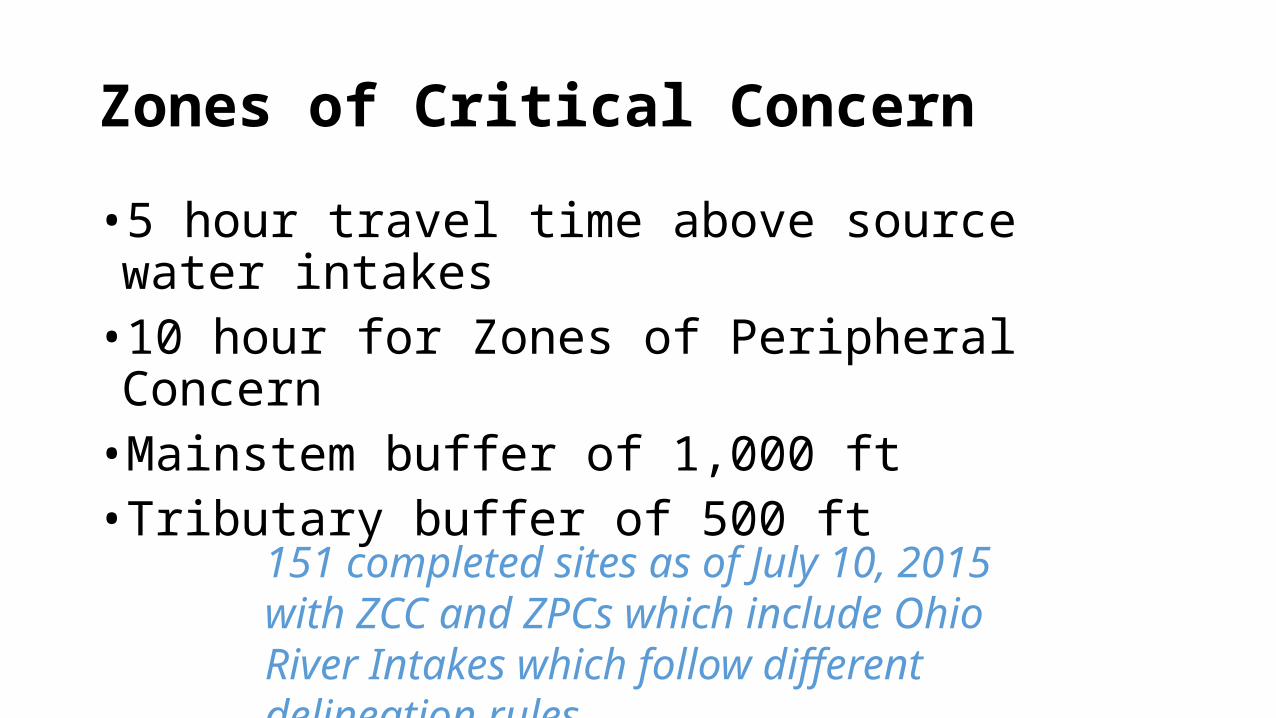
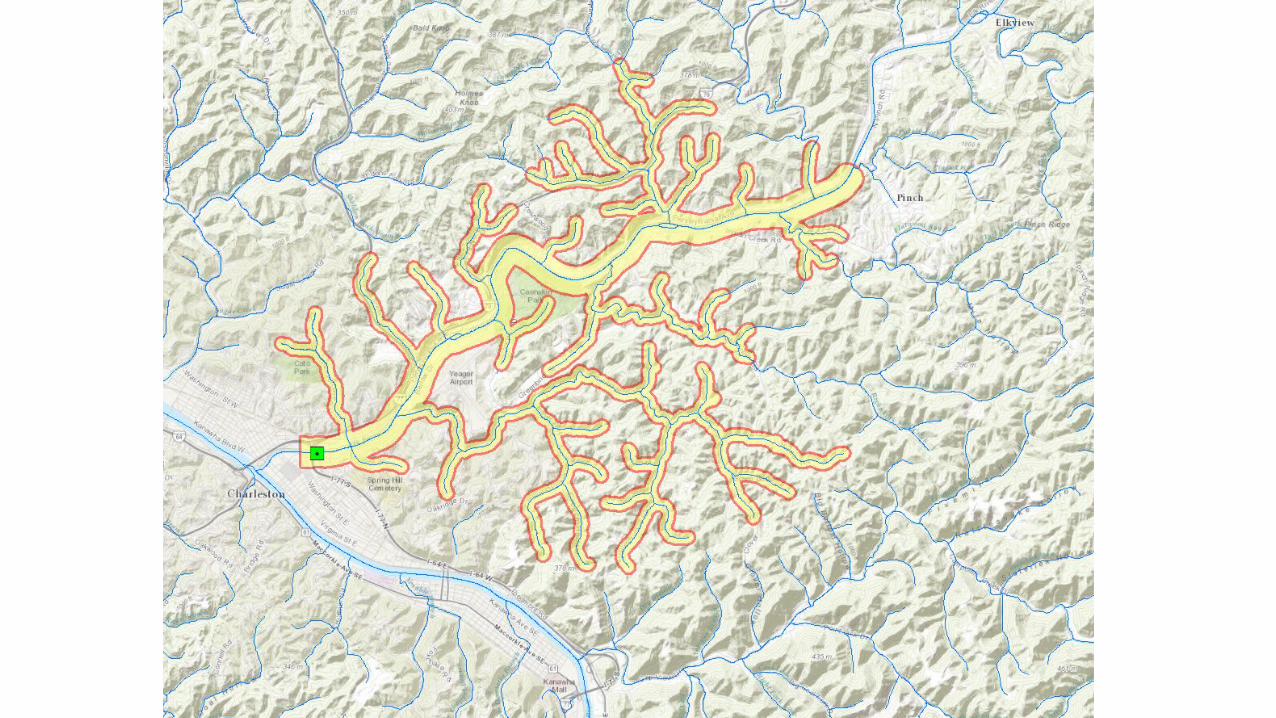
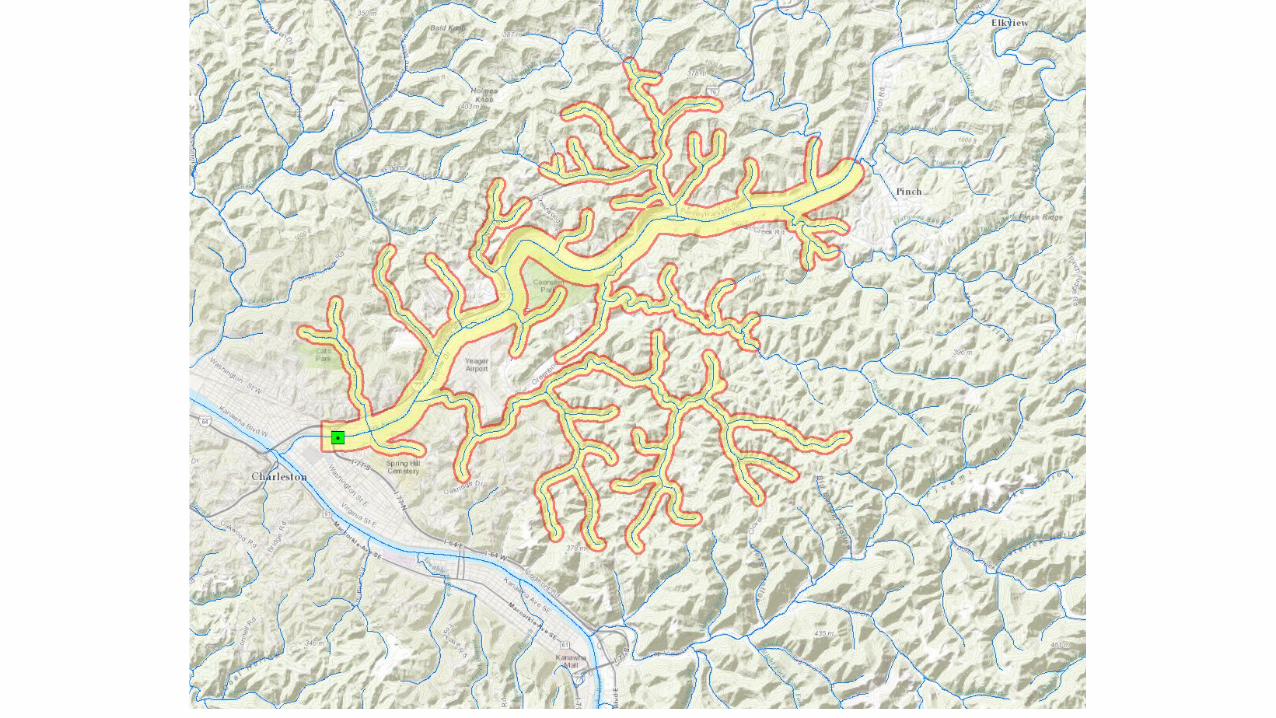
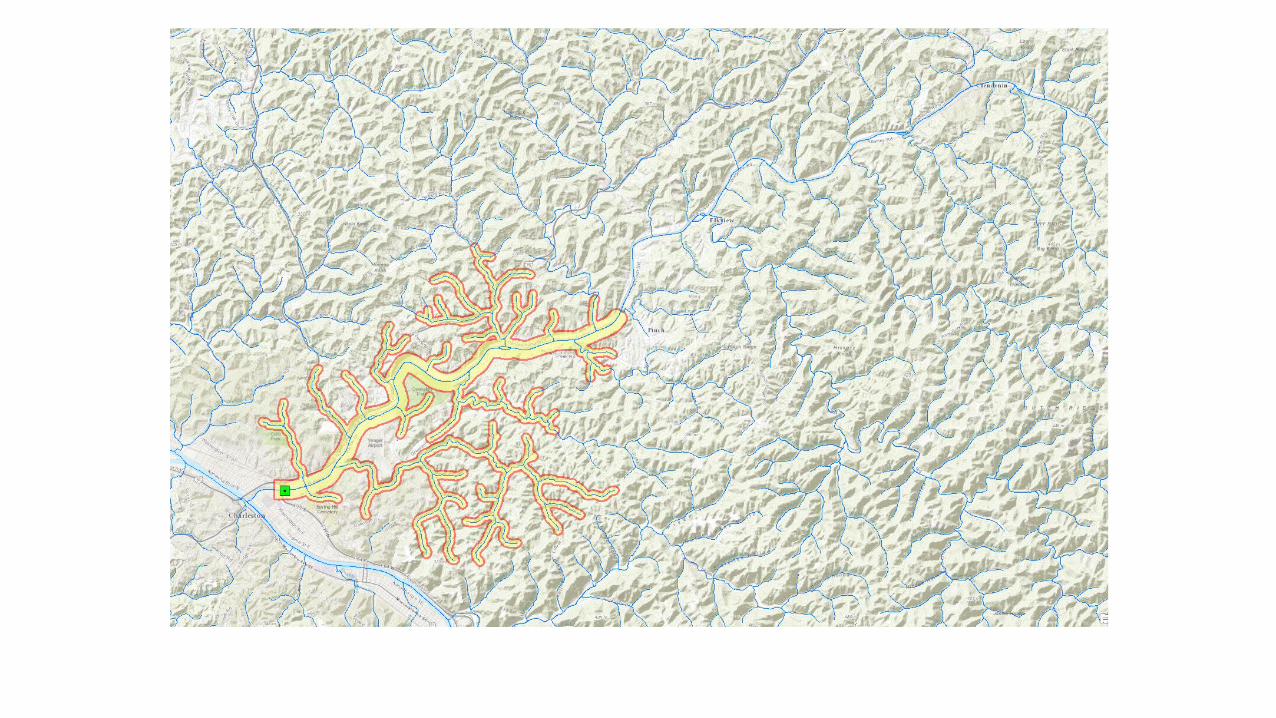
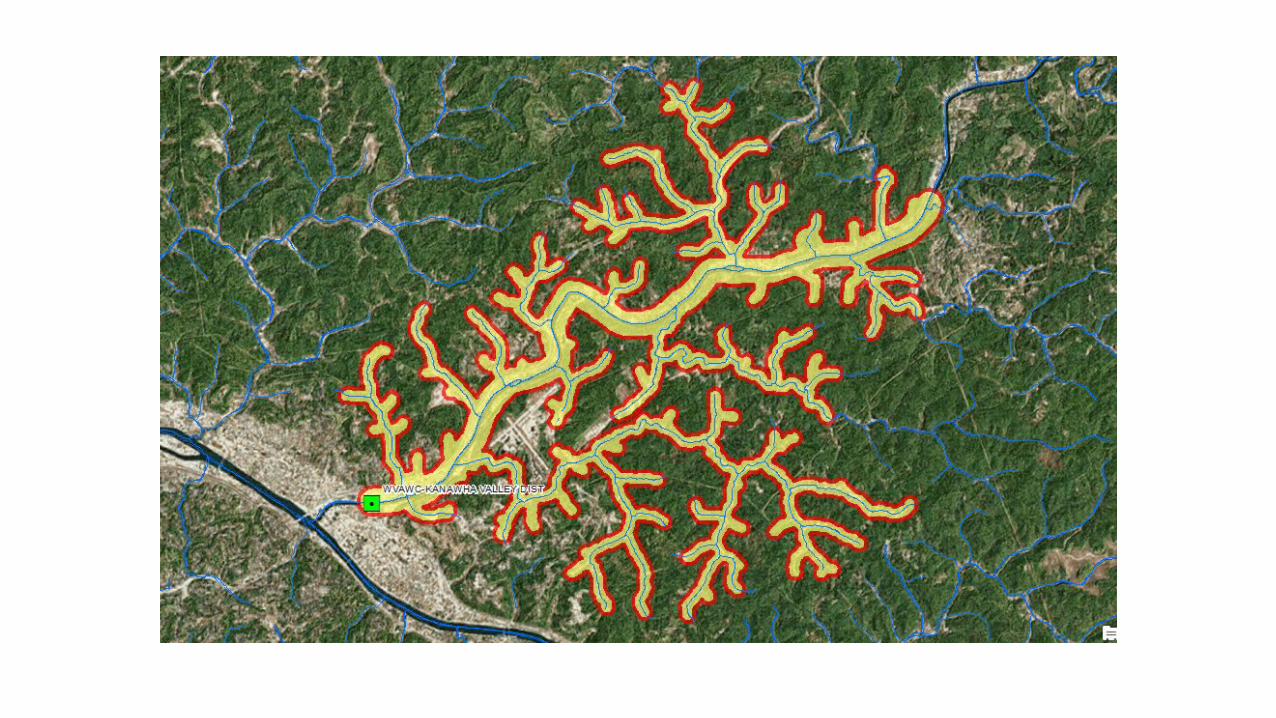
Zones of Critical Concern• 5 hour travel time above source water intakes• 10 hour for Zones of Peripheral Concern• Mainstem buffer of 1,000 ft• Tributary buffer of 500 ft
151 completed sites as of July 10, 2015 with ZCC and ZPCs which include Ohio River Intakes which follow different delineation rules
Methods
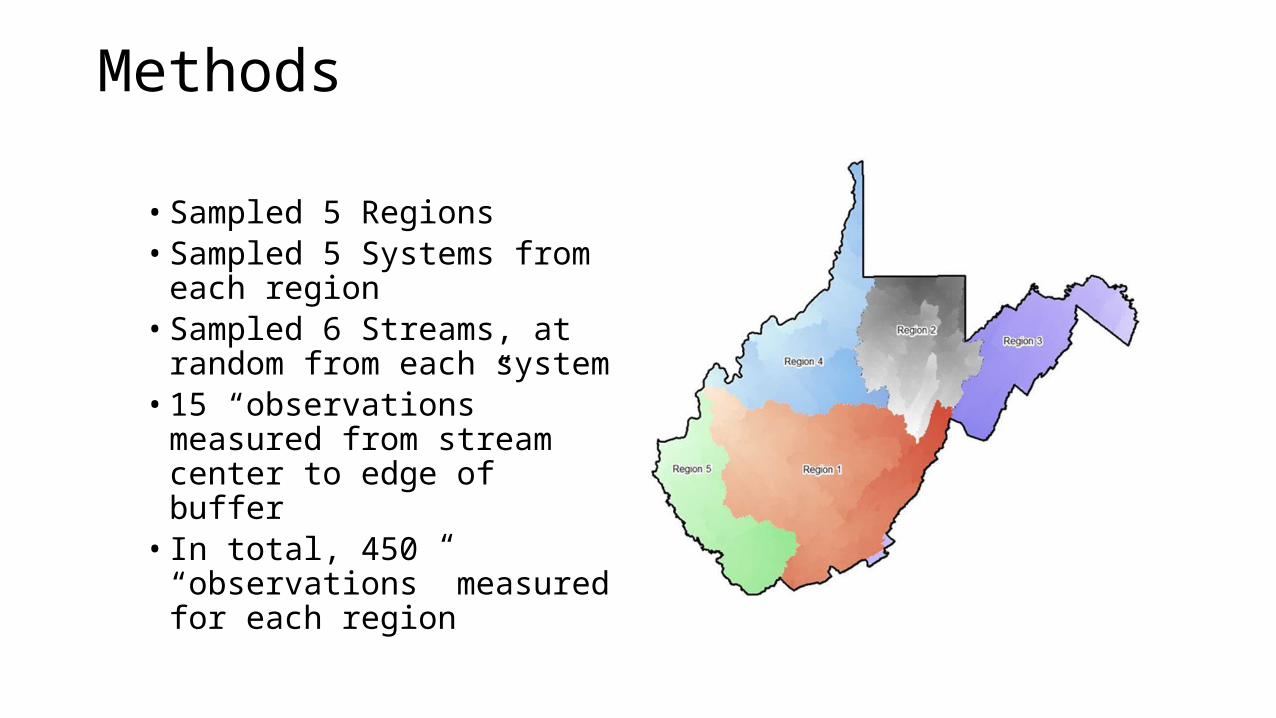
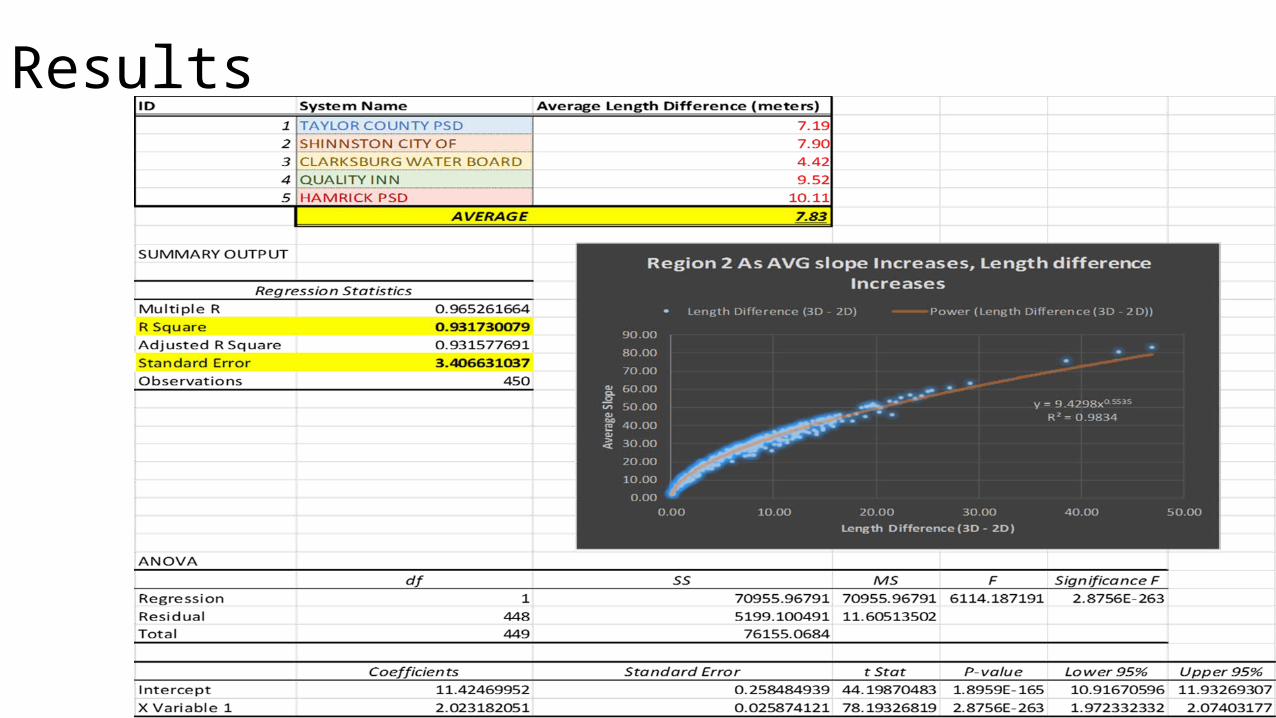
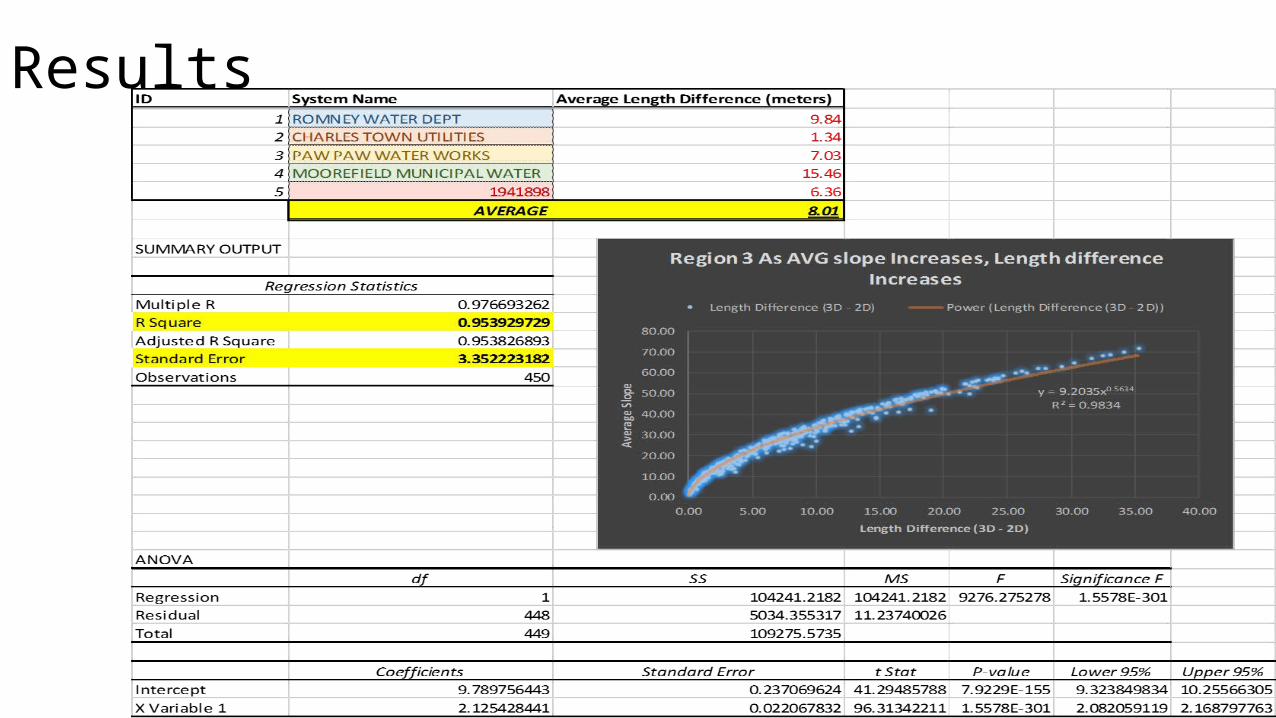
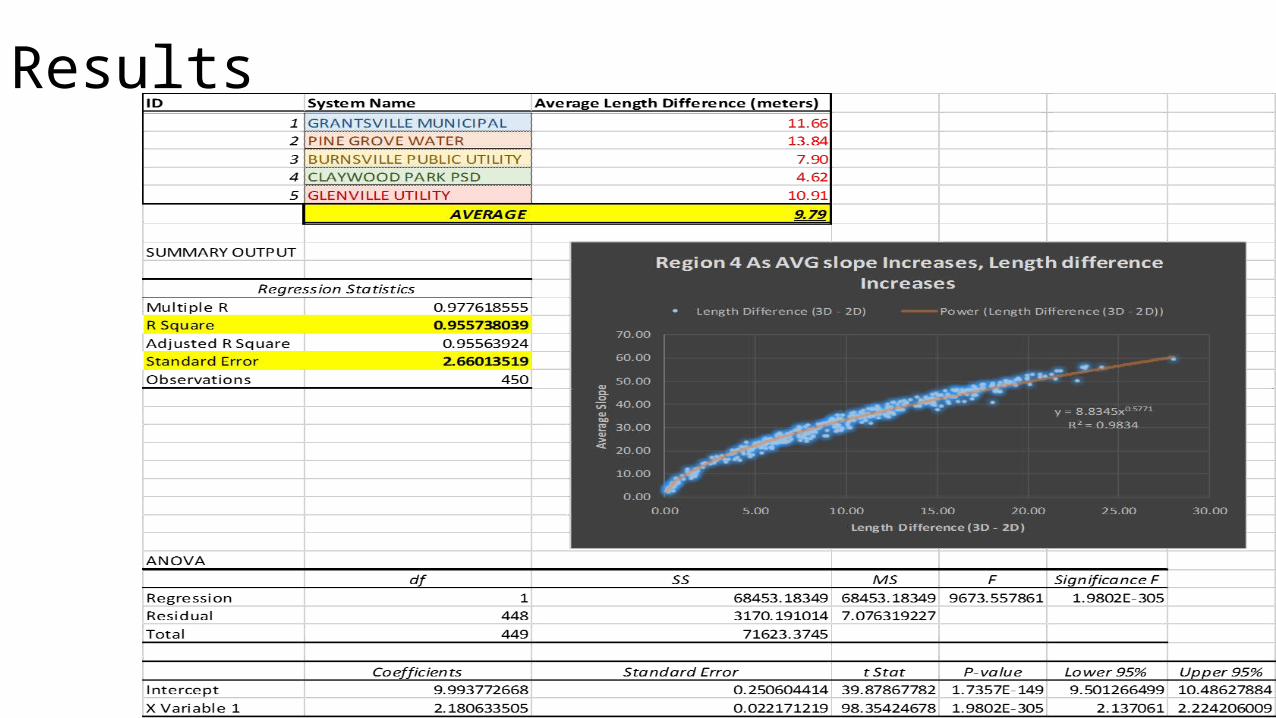
• Sampled 5 Regions • Sampled 5 Systems from each
region• Sampled 6 Streams, at random
from each system• 15 “observations” measured from
stream center to edge of buffer • In total, 450 “observations”
measured for each region
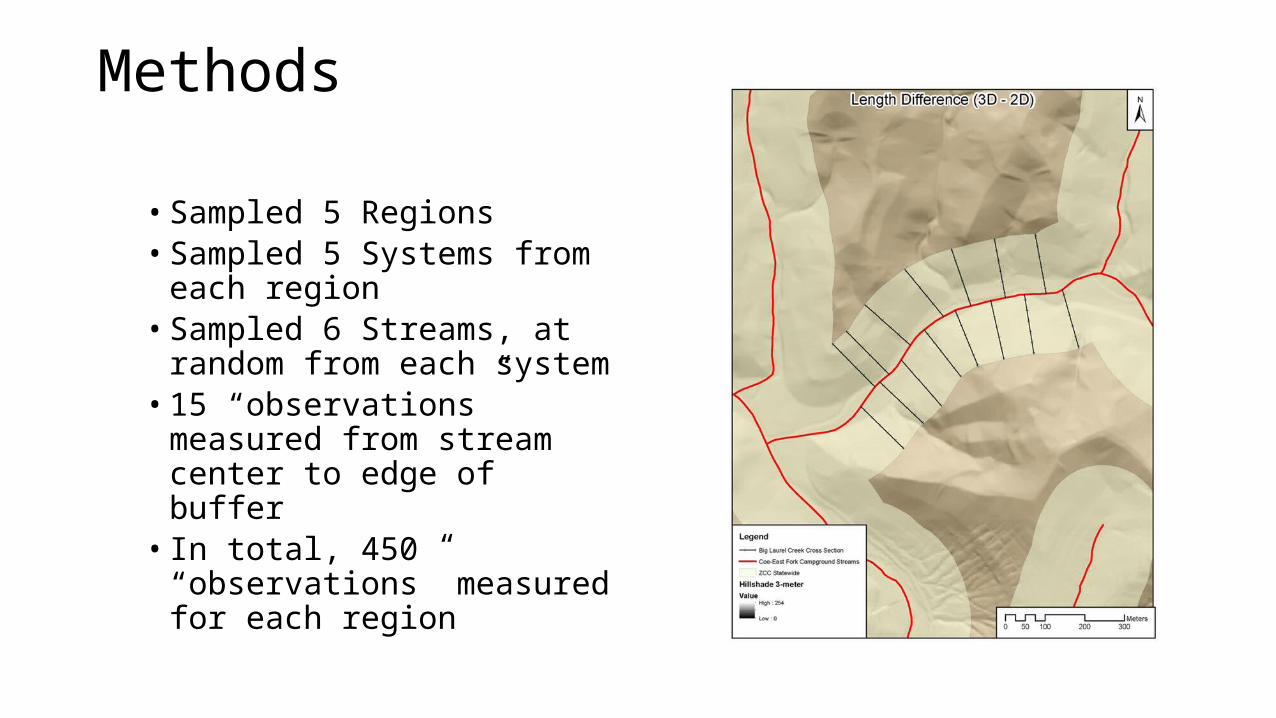
Methods
• Sampled 5 Regions • Sampled 5 Systems from each
region• Sampled 6 Streams, at random
from each system• 15 “observations” measured from
stream center to edge of buffer • In total, 450 “observations”
measured for each region
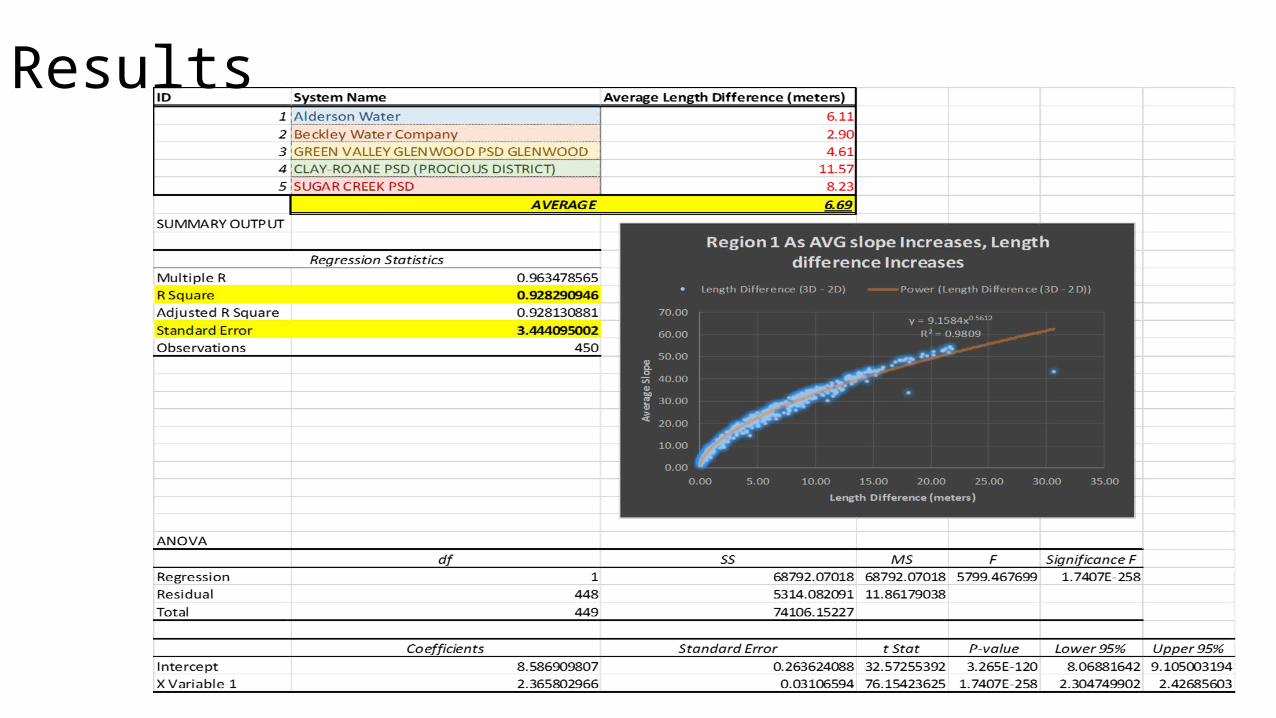
Results
Results
Results
Results
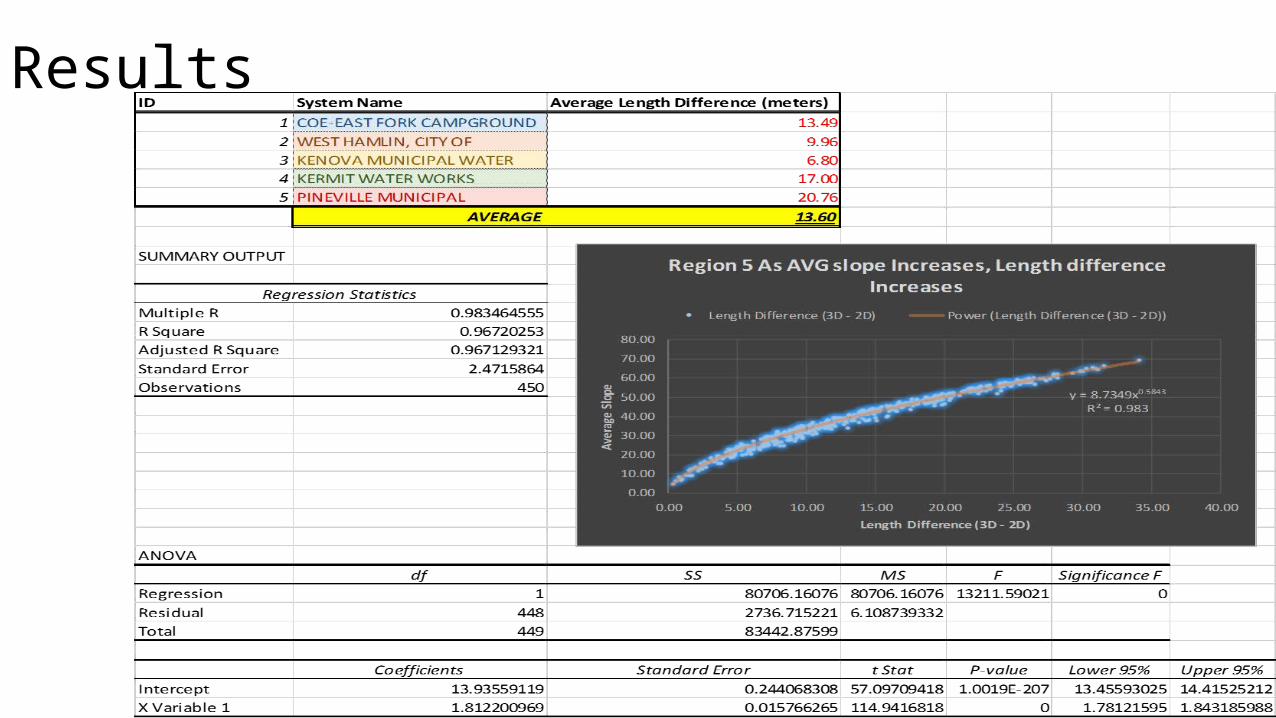
Results
Travel time estimation
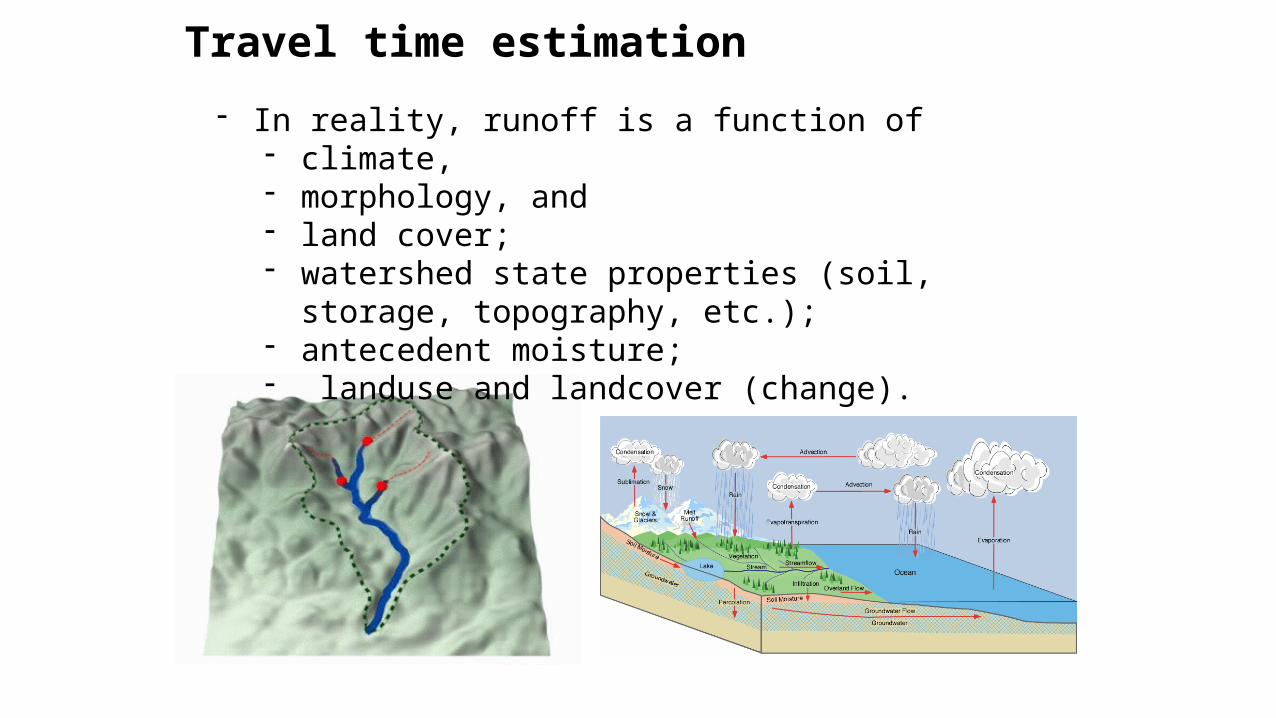
- In reality, runoff is a function of - climate, - morphology, and - land cover; - watershed state properties (soil, storage, topography, etc.); - antecedent moisture;- landuse and landcover (change).
Travel time estimation
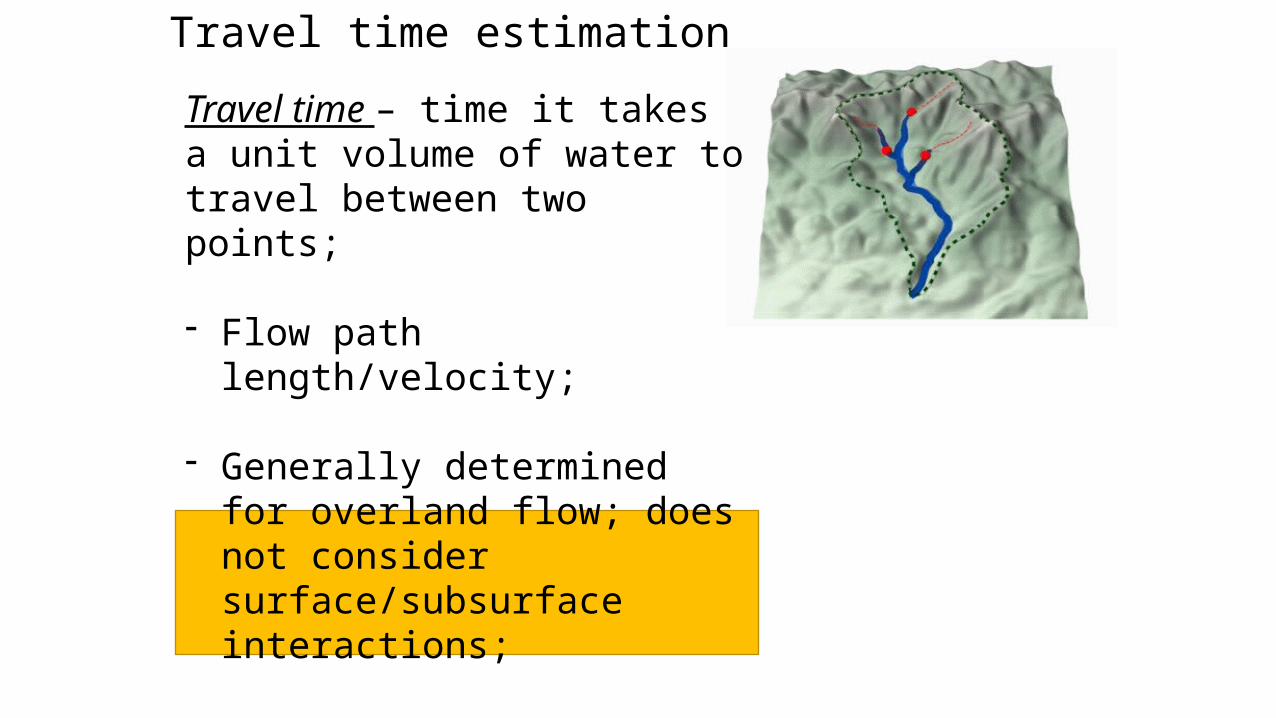
Travel time – time it takes a unit volume of water to travel between two points;
- Flow path length/velocity;
- Generally determined for overland flow; does not consider surface/subsurface interactions;
- Therefore, sheetflow moving in response to gradient (topography).
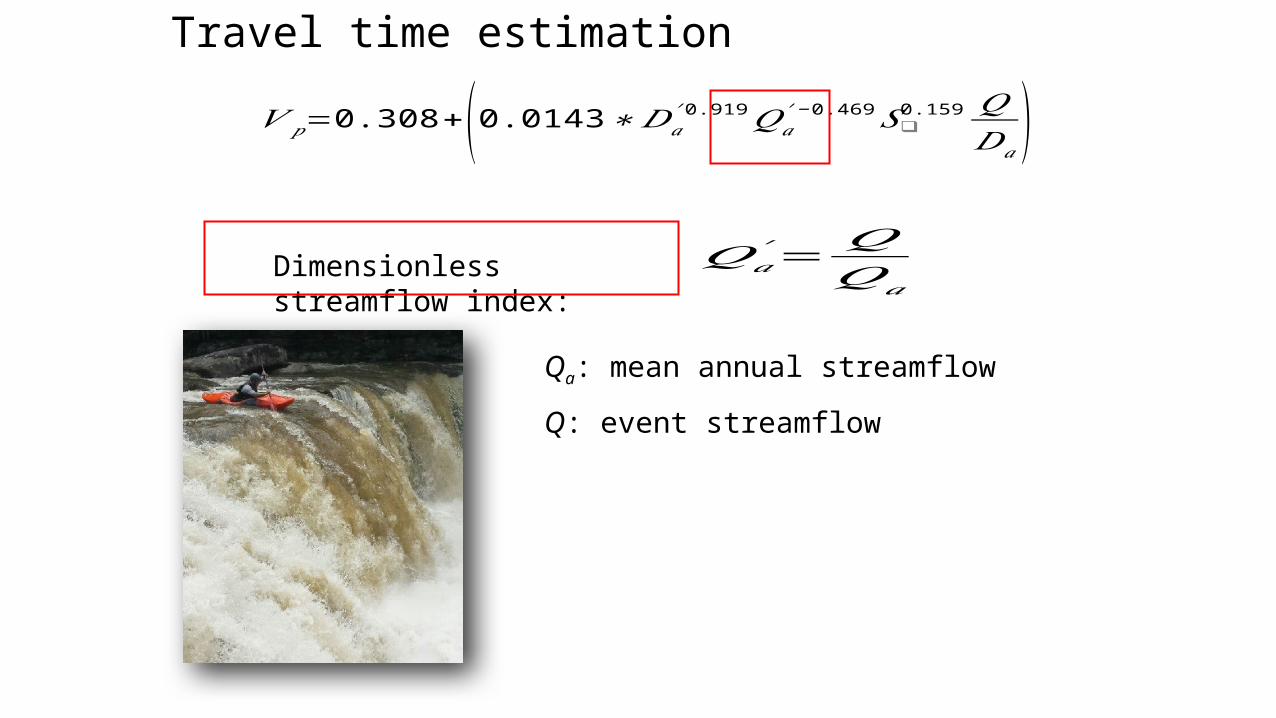
𝑉 𝑝=0.308+(0.0143∗𝐷𝑎′0.919𝑄𝑎
′ −0.469𝑆❑0.159 𝑄
𝐷𝑎 )
𝑄𝑎′ =
𝑄𝑄𝑎
Dimensionless streamflow index:
Qa: mean annual streamflow
Travel time estimation
Q: event streamflow
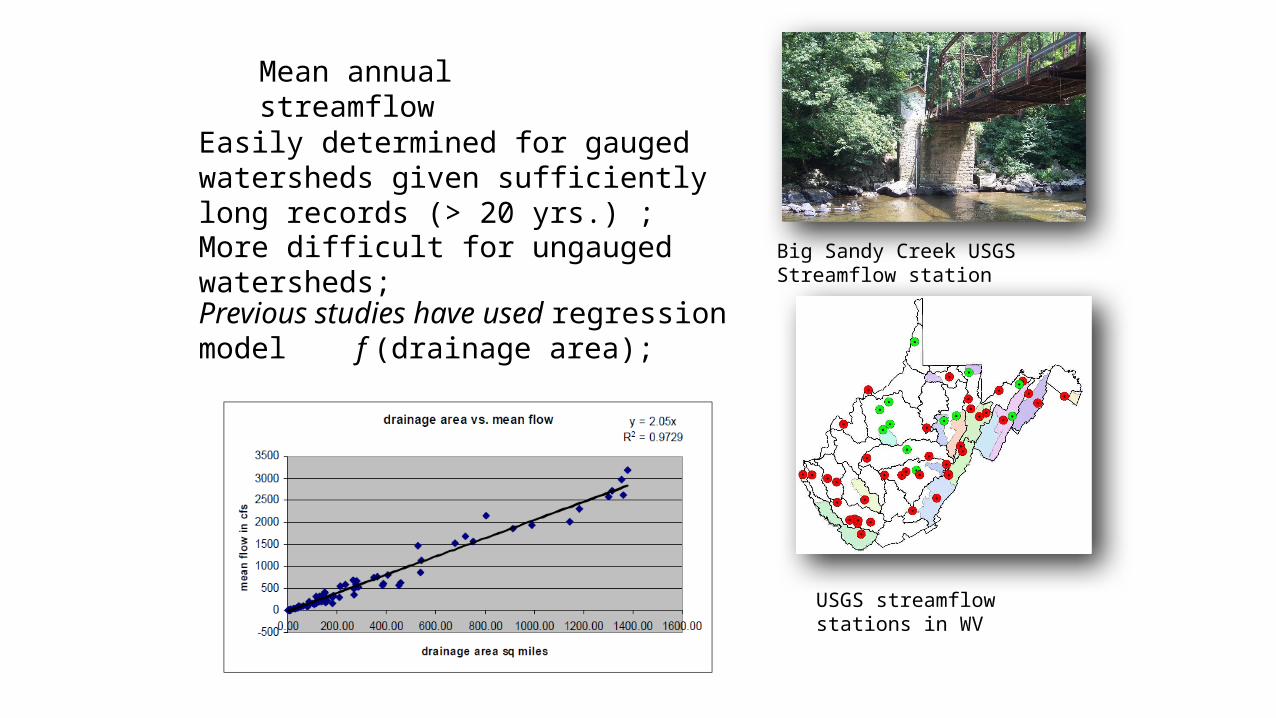
Mean annual streamflow
Easily determined for gauged watersheds given sufficiently long records (> 20 yrs.) ;
Big Sandy Creek USGS Streamflow station
USGS streamflow stations in WV
More difficult for ungauged watersheds;
Previous studies have used regression model f (drainage area);
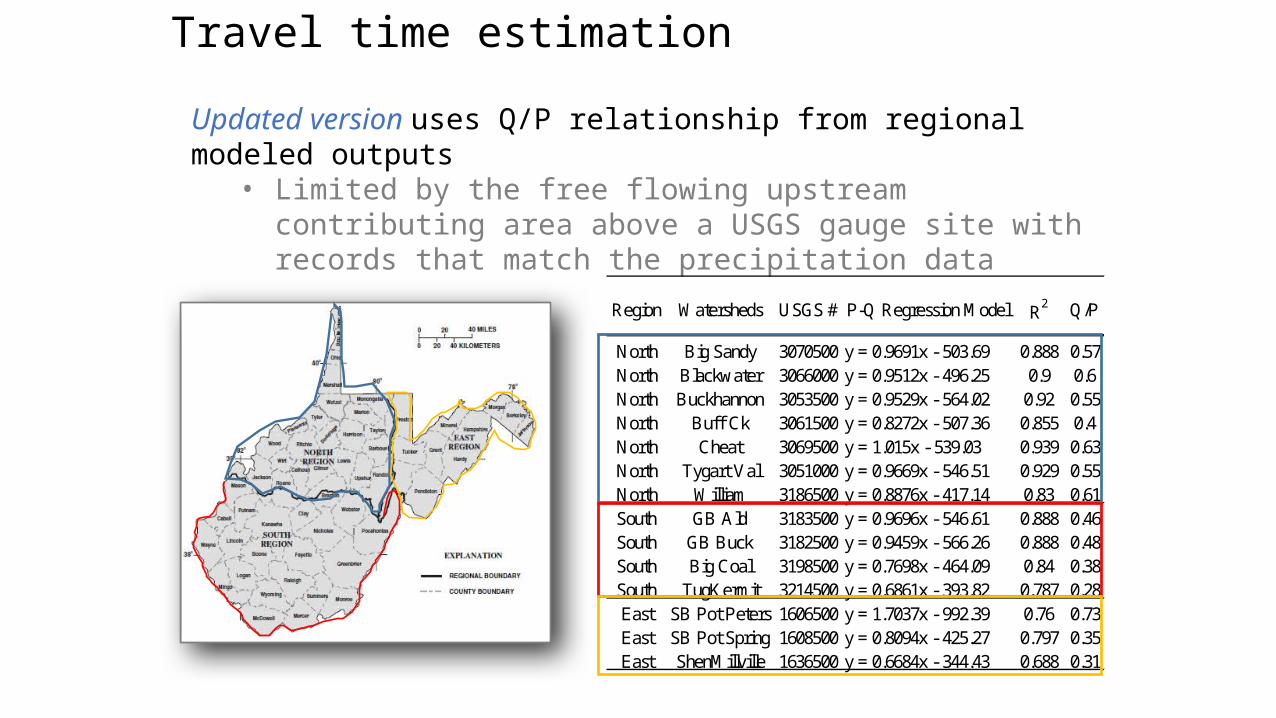
Travel time estimation
Updated version uses Q/P relationship from regional modeled outputs• Limited by the free flowing upstream contributing area above a USGS
gauge site with records that match the precipitation data
Region Watersheds USGS # P-Q Regression Model R2 Q/P
North Big Sandy 3070500 y = 0.9691x - 503.69 0.888 0.57North Blackwater 3066000 y = 0.9512x - 496.25 0.9 0.6North Buckhannon 3053500 y = 0.9529x - 564.02 0.92 0.55North Buff Ck 3061500 y = 0.8272x - 507.36 0.855 0.4North Cheat 3069500 y = 1.015x - 539.03 0.939 0.63North Tygart Val 3051000 y = 0.9669x - 546.51 0.929 0.55North William 3186500 y = 0.8876x - 417.14 0.83 0.61South GB Ald 3183500 y = 0.9696x - 546.61 0.888 0.46South GB Buck 3182500 y = 0.9459x - 566.26 0.888 0.48South Big Coal 3198500 y = 0.7698x - 464.09 0.84 0.38South TugKermit 3214500 y = 0.6861x - 393.82 0.787 0.28East SB Pot Peters 1606500 y = 1.7037x - 992.39 0.76 0.73East SB Pot Spring 1608500 y = 0.8094x - 425.27 0.797 0.35East ShenMillville 1636500 y = 0.6684x - 344.43 0.688 0.31
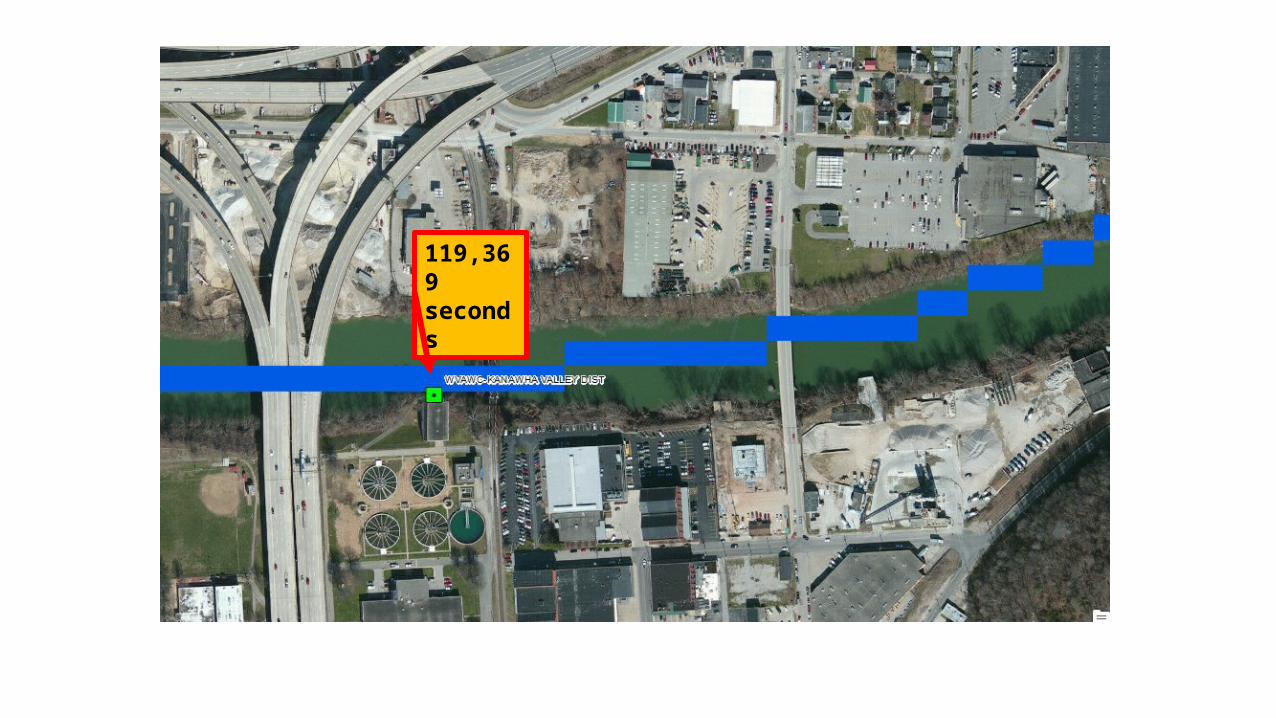
119,369 seconds
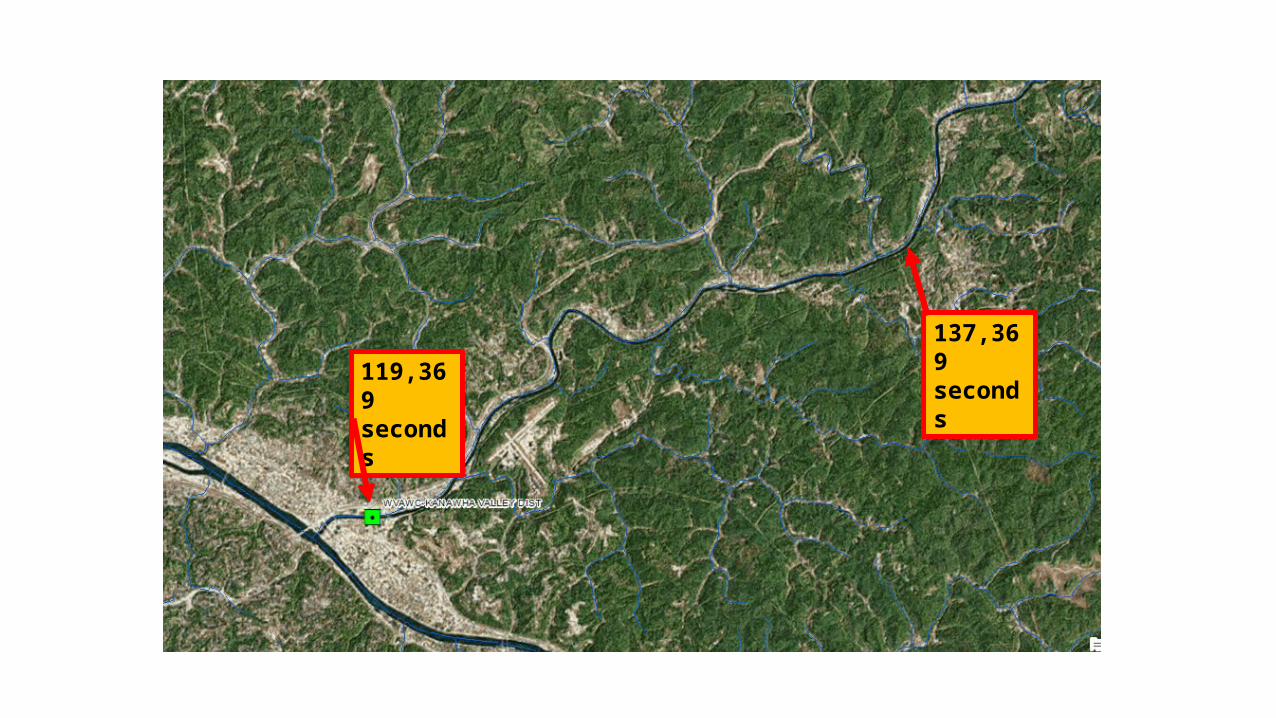
119,369 seconds
137,369 seconds
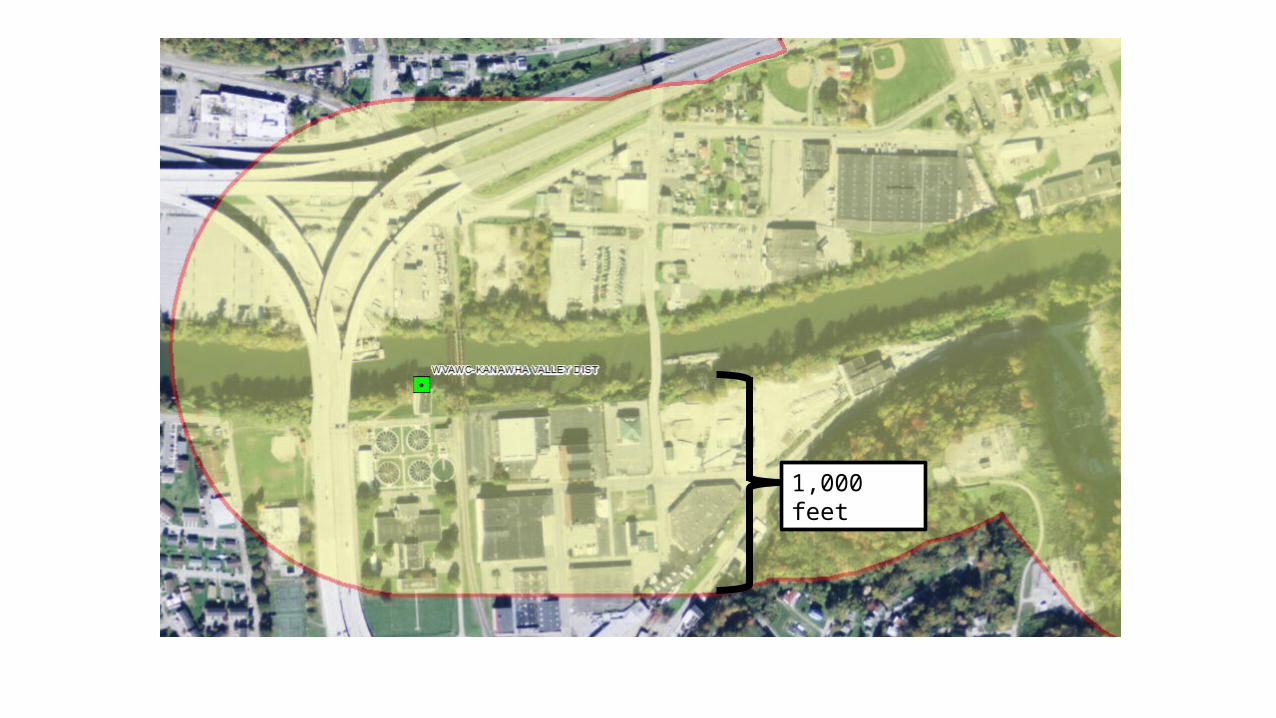
1,000 feet
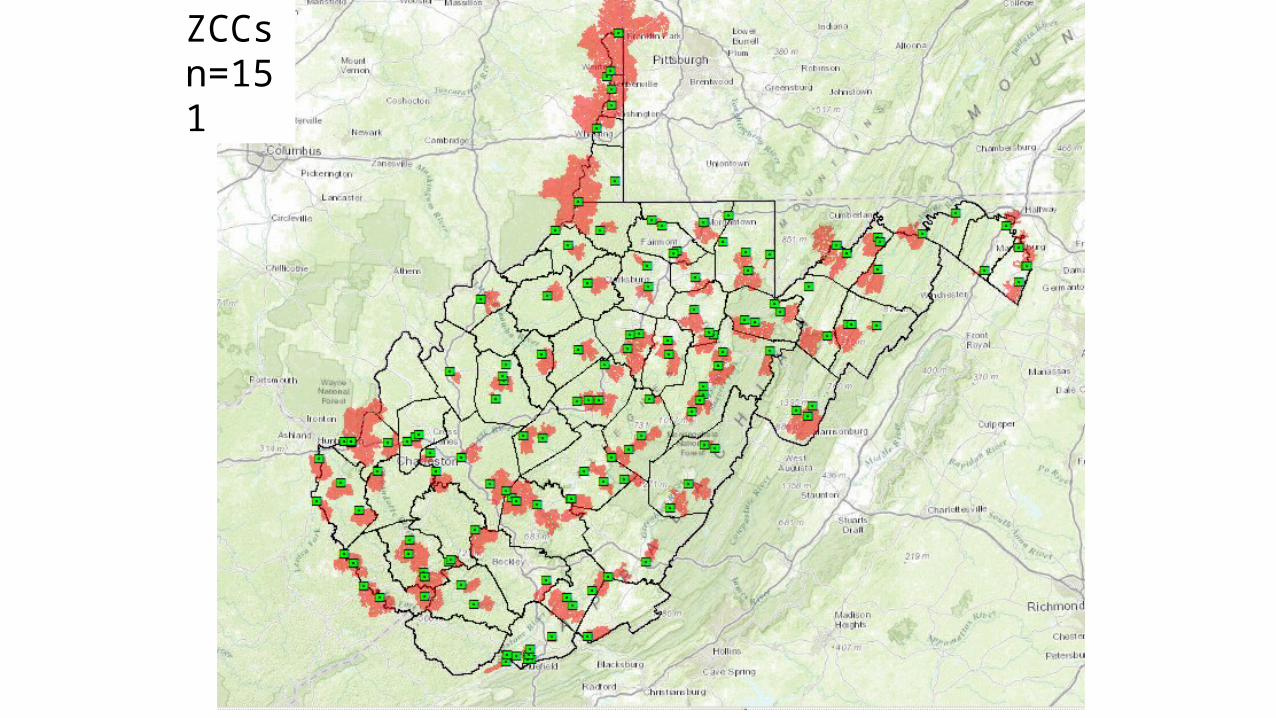
ZCCsn=151
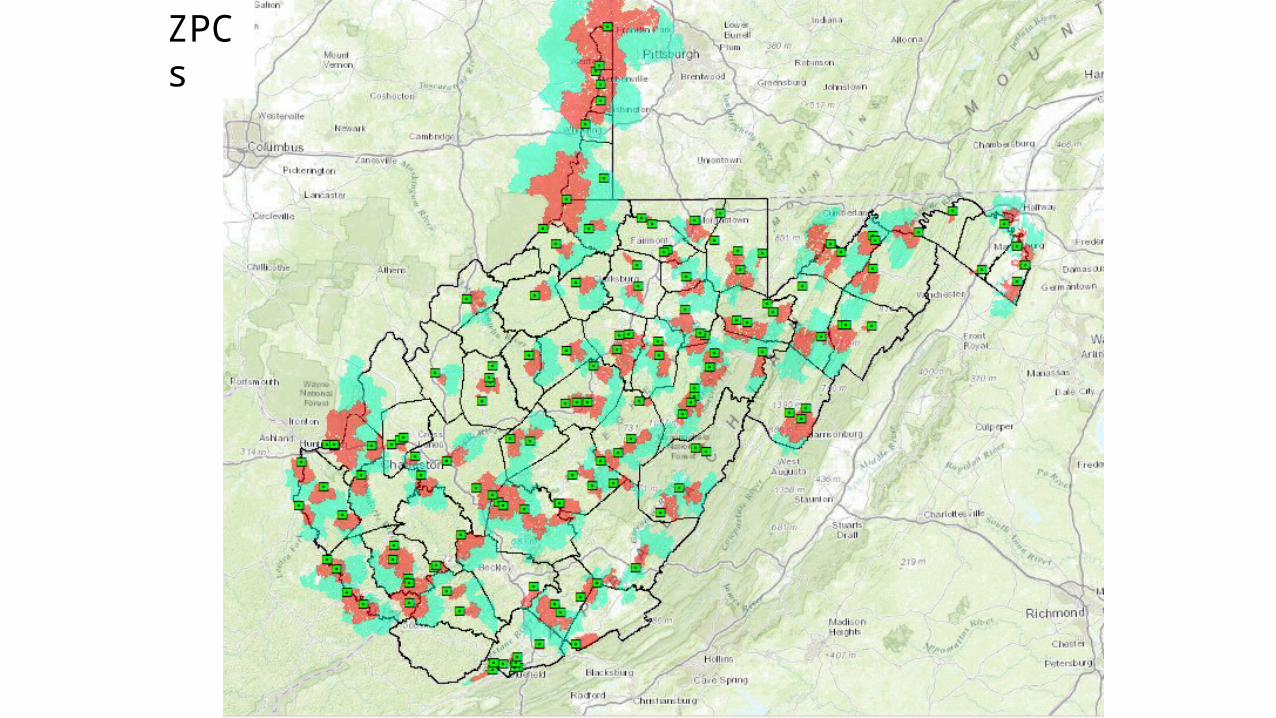
ZPCs
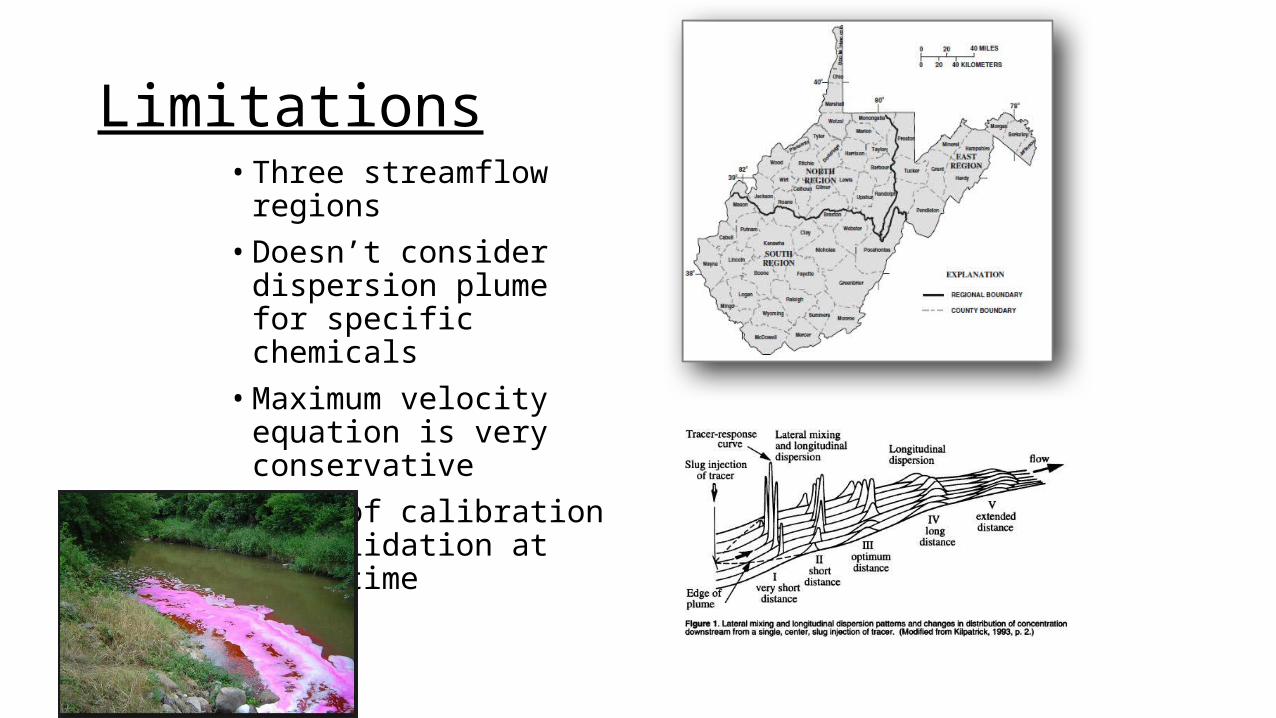
Limitations• Three streamflow regions• Doesn’t consider dispersion
plume for specific chemicals
• Maximum velocity equation is very conservative
• Lack of calibration or validation at this time