Alebel B. Weldesilassie, and Ethiopian Development ...
49
1 A Critical Assessment of Urban Land Leasehold System in Ethiopia Alebel B. Weldesilassie, and Berihu Assefa Gebrehiwot Ethiopian Development Research Institute [email protected] Paper prepared for presentation at the “2017 WORLD BANK CONFERENCE ON LAND AND POVERTY” The World Bank - Washington DC, March 20-24, 2017 Copyright 2017 by author(s). All rights reserved. Readers may make verbatim copies of this document for non-commercial purposes by any means, provided that this copyright notice appears on all such copies.
Transcript of Alebel B. Weldesilassie, and Ethiopian Development ...
1
A Critical Assessment of Urban Land Leasehold System in Ethiopia
Alebel B. Weldesilassie, and Berihu Assefa Gebrehiwot
Ethiopian Development Research Institute
Paper prepared for presentation at the
“2017 WORLD BANK CONFERENCE ON LAND AND POVERTY”
The World Bank - Washington DC, March 20-24, 2017
Copyright 2017 by author(s). All rights reserved. Readers may make verbatim copies of this
document for non-commercial purposes by any means, provided that this copyright notice
appears on all such copies.
2
ABSTRACT
The land management and governance system can be the underlying cause for materializing the
opportunity or face the challenge of rapid urbanization. The urban land lease policy of Ethiopia is
considered the most influential factor that determine whether there exists unhealthy, haphazard
and unbalanced investment environment in the cities. Since land is constitutionally stated owned,
it lays the foundation for acquiring ‘land use right’ through auction or negotiation. The paper
critically reviews the policy and its institutional arrangement. It quantitatively analyzed the
fundamental factors that drive the value of land developers place on urban land for investment
using the land auctions data obtained from Addis Ababa City Administration. Base price, plot size,
location and grade and auction period have significant effect on land value in the city. Plot use
type and developers’ capital have mixed effect. Our findings suggest that the implementation of
the land lease policy still requires reexamination of constraints and opportunities with the aim of
devising appropriate measures and strategies for action towards sustainable urbanization. The
institutional mechanism should be designed to provide ‘appropriate’ incentive for developers and
accountability for bureaucrats. It should also help to facilitate cities to transition from dependence on
revenue from land sale to modern taxation, and consider the capability of the rural citizens, who are
expected to displace as urbanization progresses, to access the opportunities and their entitlements for
integration into cities throughout the urbanization process.
Key Words: Urban land lease policy, Developers’ willingness to Pay, Land Auction, OLS
estimation
3
Contents ABSTRACT .................................................................................................................................................. 2
1. INTRODUCTION ................................................................................................................................ 4
2. ORGANIZATION OF THE REPORT ................................................................................................. 6
3. LITERATURE REVIEW ..................................................................................................................... 6
3.1. URBAN LAND POLICY AND MANAGEMENT ...................................................................... 6
3.2. LAND LEASE SYSTEM IN URBAN ETHIOPIA ...................................................................... 8
4. METHODOLOGY ............................................................................................................................. 14
4.1. DATA ......................................................................................................................................... 14
4.2. ESTIMATION ............................................................................................................................ 14
5. STUDY RESULTS ............................................................................................................................. 16
5.1. THE PERFORMANCE OF LAND AUCTION IN URBAN ETHIOPIA .................................. 16
5.2. LAND PRICE DEVELOPMENT ............................................................................................... 21
5.3. MARKUP PRICE OF PLOT OF LAND .................................................................................... 23
5.4. DRIVING FACTORS OF LAND VALUE ................................................................................ 24
6. SUMMARY AND CONCLUSION .................................................................................................... 27
REFERENCE .............................................................................................................................................. 29
4
1. INTRODUCTION
Ethiopia's transition to a market oriented economy began with the installation of the new Government in
1991 and the introduction of an economic development agenda aimed at achieving macroeconomic
stabilization and growth. In this development agenda, investment has been considered as an engine of
growth and generates economic benefit. Since then major policy and institutional reforms have been
established to promote investment in the country.
A critical step is the ratification of the constitution in 1995 which holds that all land in Ethiopia falls under
government ownership but provides for ‘use rights’ to individuals, groups (communal holdings), and private
entities. It separates the right to use land from the ownership of the land, which allowed the state to continue
to own the land (means of production) while creating a tradable claim on land, the 'use right'. Following
this, various policies are formulated that aim to promote investment and urban development. Among these,
the Urban Land Development and Management Policy and Strategy formulated in 2013, proclamation No.
818/2014 that establish the foundation for urban landholding registration, proclamation 455/2005 that
guides the expropriation of land holdings for public purposes and payment of compensation and
proclamation No. 721/2011 that serves as a directive for urban lands lease holding are the key institutional
arrangement that have direct implication for promoting private sector investment in Ethiopia. These reforms
affirm that no land can be obtained or transferred other than on a leasehold basis. They also issue the
authority to sell land and determine the terms of redevelopment to the nine Regional Governments and two
city administrations.
A number of studies have been made on the land lease policy in Ethiopia (Zelalem Yirga (2014); World
Bank (2014); Zemen (2013); Belachew (2010); Bacry Yusuf (2009); Alebel and Genanew (2007a;
2007b). The studies revealed that the effect of such reforms are of interesting issue for policy makers,
development partners, scholars and the private sector. On one side of the argument, since the reforms, there
has been substantial improvements in Addis Ababa, capital city and seat of African Union and other
international organization. The city, which has been characterized by dilapidated structures, congestion,
environmental related problems and poor urban image, shortage of and low quality infrastructure, and basic
services, is now in better conditions than ten years ago. The study by the World Bank revealed that land
leasing becomes the major sources of revenue for infrastructure development for cities in Ethiopia. Besides,
unlike the period before ten years, during which the city has increasingly been expanding haphazardly, its
development has started to be implemented with well-prepared plan and well-coordinated manner. On the
5
other side of the argument, there are well observed shortcomings since the experience shows that the
reforms give little concern for sustainable expansion possibilities and only adds inefficiencies in land
utilization. For instance, the lease value is not reflected in the payments for the duration of the lease.
Corruption, non-transparency and unfairness have reigned in the system and, created a means of exploiting
the system by a few urban speculators and brokers. The revenue from land is less than the true value of land
due to absence of market oriented land lease transfer mechanism and the lease system is exposed to
speculation. The lease policy not only restricts the right to transfer use right but also that it is not linked
with the urban development strategy of the country.
More importantly, the urban land lease policy ignores the demand side of urban land management, which
is an essential element in promoting investment, and thereby, enhancing the contribution of cities for
economic growth. There is a marked gap between the demand for basic services and the supply of those
amenities by the City Administration to keep pace with the expectations emanating from the scale of change
the City undergoes. Moreover, urban land for investment has emerged as a key bottleneck. Evidence
revealed that many investors, who got discouraged or cancelled their investment plans in Addis Ababa,
attribute their attrition largely to the lack of access to industrial land. The demand for investment land in
Addis Ababa has been quite big and did not show improvement. A survey report by the Foreign Investment
Advisory Service (2001), for instance, indicated that the costs of acquiring an appropriate piece of land in
the City are prohibitive. Based on a recent administrative data, it is estimated that about 6000 investors are
in a waiting list requesting land for investment as of June 2016. This does not only discourage private
investment (and thereby employment opportunities for the many unemployed and educated youth) but also
that when coupled with the limited supply of land, it has created distortions in the land and rental market
and price hike. The study by the World Bank group on urbanization in Ethiopia revealed that access to jobs,
infrastructure and services, and housing are the three key gaps for urbanization failing to meet the demands
of growing numbers of urban residents. In sum, the land lease policy is considered the most influential
factor for the unhealthy, haphazard and unbalanced investment environment in the City.
The implication is that the limitations of the land lease policy still requires reexamination of constraints and
opportunities with the aim of devising appropriate measures and strategies for action. To this end, the paper
analyzed both the supply and demand side of the land lease policy in Ethiopia. With the aim of
understanding the supply side of land governance for investment, the paper tries to critically review the
land lease policy, its institutional arrangement as well as governance system. Since pricing of land is the
6
key component of an appropriate incentive for balanced and coordinated investment and understanding the
demand side of investment, the paper quantitatively analyzed the fundamental importance of the value the
investors place on land characteristics. The studies by Zelalem Yirga (2014); World Bank (2014); Zemen
(2013); Belachew (2010); Bacry Yusuf (2009) are made based on qualitative analyses. Even if the findings
and conclusions from such studies are open to debate since they are based on qualitative information which
are subject to individual judgments, they are important since they pose important questions that need to be
addressed quantitatively. The only exception is the study made by Alebel and Genanew (2007) who used
urban land auction data. However, their study covers only for the period 1994/95 and 2002/03. Our study
also fills such gap.
2. ORGANIZATION OF THE REPORT
Including the introduction section the paper is into six sections. The next section discusses a review of the
literature on urban land management. Section four discusses the methodology used in this study including
the data and estimation techniques. Section five discusses the result on the performance of the land lease
system in the study areas and the key factors that determine the value of land in urban Ethiopia, taking
Addis Ababa, the capital city of the country, as a case study. Finally, section six concludes.
3. LITERATURE REVIEW
3.1. URBAN LAND POLICY AND MANAGEMENT
Land holds a unique and pivotal position in social, political, environmental and economic theory. It is of
central importance to country’s urbanization, economic growth and social stability. Land not only stands at
the center of human culture and institutions, it is also required directly or indirectly in the production of all
goods and services. Land's uniqueness stems from its fixed supply and immobility. Therefore, the nature of
property right towards land is very crucial in the process of economic growth and poverty reduction.
Deininger, et al (2003) argues that well defined and secure land rights are critical to provide incentives for
investment and sustainable resource management, facilitate the low cost transfer of land and credit access
as the rural non-farm economy develops. It is, therefore, essential to briefly discuss urban land policy since
its property right crucially determines mode of its management and administration.
7
Land Policy describes an official statement by a government of its intentions and plans regarding the
conservation, use, and allocation of land, but does not have the force of law”. It expresses political choices
concerning the distribution of power and interests in land between the state and its citizens as well as
determines rights of access to and use of land related resources. Land policy commonly aims to achieve
equity, enhances investment, attain assurance of developers or investors, and may consider cultural as well
as environmental sustainability. Aesthetic value also considers in land policy formulation. Thus, land policy
not only promotes security and social stability but also serves as a bases for economic development. The
realization of land policy objectives requires different institutional arrangements that facilitates land
administration activities, land information management as well as facilitating organization and
management. Both theoretical and empirical evidences revealed that urban land policy is a complex
undertaking and not only vary by country but also that such policy must involve a large number of policies
instruments, carefully designed to be mutually supportive (Doebelej, 1987). The debate on urban land
policy fundamentally originates whether or not it should be private or public ownership. Deininger and
Chamorro (2002) stated that even if the principle of private ownership is considered to be largely valid,
experience has shown negative consequences of unrestricted private ownership of land. As a result, public
land ownership, as opposed to private freeholds, became popular, for example, in many former socialist
countries, especially in the 1960s and 1970s (Hong and Bourassa, 2003; Nega, 2005). On the other hand,
experience has repeatedly shown that in many countries state ownership of land has conductive to
mismanagement, underutilization of resources, and corruption (Deininger, 2003).The implication is that
urban land epitomizes the classic conflict between equity and efficiency.
One of the unique features of land is that demand is the sole determinant of land value. Given the type of
property rights, this feature of land influences the efficient management of the land through its effect on the
value of land, the price paid annually for the exclusive right (a monopoly) to use a certain location, piece
of land or other natural resource. Changes in land rent and land taxes have no impact on the supply of land,
because the land supply is fixed and cannot be significantly expanded. Since land is fixed in supply, as
more land is demanded by people, the rent will increase proportionally. Land rent results from the desire
made by everyone who lives within a community to use land.
Economic rent is the only source of revenue that could be taken for community purposes without having
any negative effect on the productive potential of the economy. When a community captures land rent for
public purposes, both efficiency and equity are realized. Sale of land or land rights has the advantage of
8
producing revenue quickly and being easier to administer than betterment taxes, land re-adjustment
schemes, or universal property taxation. For example, the study by the World Bank revealed that many
cities in China have financed half or more of their very high urban infrastructure investment levels directly
from land leasing, while borrowing against the value of land on their balance sheets to finance much of the
remainder (George E. Peterson, 2006). The same study also indicated that since land is publicly owned in
Ethiopia, ‘land leasing has become the single largest source of municipal revenue in Ethiopia, overtaking
the traditionally largest source of revenue, the local fee and tax items covered in Regional Tariff
Proclamations’ in Ethiopia (George E. Peterson, 2006). The study shows that the revenue from land lease
ranges from 21% to 45% of total revenue of the cities under study and 77% to 145% of their total capital
spending. Though the cities more than double land-leasing revenue in 2004-2005, leasing has introduced
an unprecedented degree of volatility in their own-source revenues. However, the study also indicated that
use of land leasing as source of revenue can also introduces a new set of risks that can profoundly affect
fiscal management. The cities are unable to obtain revenue growth from other sources, which risks their
future recurrent budgets from other sources.
Many factors contribute to the value of land. Physical attributes of land are one of the key factors that
contribute to land value. These include quality of location, lot size, topography, access to basic social
services and infrastructures, environmental features such as absence of bad smells, noise, etc. The
regulation that governs land management and administration such as the type and amount of taxation,
zoning and building laws, planning and restrictions are also key determinant of land value. The social
factors include population growth or decline, changes in family sizes, typical ages, and attitudes toward law
and order, prestige and education levels. The economic forces include value and income levels, growth and
new construction, vacancy and availability of land. It is the influences of these forces, expressed
independently and in relationship to one another that help the people and the assessor measure value of
land.
3.2. LAND LEASE SYSTEM IN URBAN ETHIOPIA
In Ethiopia, land is constitutionally state owned. The Constitution provides that the right of ownership of
all rural and urban land is exclusively vested in the State and in the peoples of Ethiopia. As a result, land
can be acquired through lease hold system. There are various arguments for adopting land lease system.
Some of the key advantages of this system include it is advantageous for achieving efficient land use
planning; and encourages investors and investment since when the price of land is to be paid in a form of a
9
lease rent, the initial investment will be small and it gives the investor additional capital to invest on
construction. It is also advantageous since it gives the possibility to reclaim land from leaseholders when it
is required for other purposes. In the leasehold system, it is certainly less expensive and easier to take land
back than when it is in private ownership. Besides, appropriation of future land price increases by the public
and distributing it to society is easier under lease hold system. One of the advantages of retaining land in
public ownership is to have the increase in land values accrue to the community at large and make it easier
to allocate land to other uses at some time in the future. When a municipality grants the use of land under
a leasehold system, it reserves the right to claim substantial proportion of future increments in the capital
value of land at the end or in the middle of the contract.
As stated above, in Ethiopia, land is constitutionally states owned, and developers have the right to use the
land that they acquire through lease holding. A number of proclamations and regulations have been
formulated that determines the value of urban land and to facilitate investment in business, residential and
other uses. A number of studies have been made on the land lease policy in Ethiopia (Zelalem Yirga
(2014); Zemen (2013); Belachew (2010); Bacry Yusuf (2009); Alebel and Genanew (2007a;
2007b). Zelalem (2014) conducted a review of the various proclamations related to urban land
lease policy in Ethiopia. Based on a review of the different land lease regulations, the author tried
to identify gaps, inconsistencies and ambiguities in the urban land lease regulations as well as the
constraints and challenges that impede their effective implementations. Yusuf (2009) conducted a
study on the land lease policy in Addis Ababa, the study by Belachew focuses on urban land policy
in Addis Ababa and Amhara regional state. The study by Bacry Yusuf et al (2009) qualitatively
evaluates the performance of the urban land management system and identifying issues and
problems underlying the gap between supply and demand. The study is made based on review of
concepts and policy documents. Similar study is also conducted by Zemen (2013) focuses on the
land transaction aspect of the land tenure system in Ethiopia based on review of documents. These
studies are made using qualitative information and review of documents. However, even if the
findings and conclusions from such studies are open to debate since they are based on qualitative
information which are subject to individual judgments, they are important since they pose
important questions that need to be addressed quantitatively. A more rigorous quantitative studies
on the urban land lease system in Ethiopia is made by Alebel and Genanew (2007a; 2007b). They
10
used the land lease auction data to analyze investors’ willingness to pay for a plot of land in Addis
Ababa for the period 1994/95 – 2002/03.
In order to realize the constitutional article, the government of Ethiopia formulated various
proclamations related to urban land use. Proclamation No. 80/1993 is the first proclamation related
to urban land lease system enacted in Ethiopia since the reform 1991. Following this, the country
has enacted Proclamations 271/2002; and 721/2011 in 2002 and 2011, respectively. These
proclamations can be cited as the Urban Lands Lease Holding Proclamation No. 80/1993,
271/2002; and 721/2011, respectively1. These different proclamations are not only constitutionally
founded, they have also social and economic goals that are expected to be achieved through their
effective implementation. At the heart of these proclamations sustainable rapid economic growth
through appropriate land administration that is efficient and responsive to the growing demand for
land resource as well as good governance that requires efficient, effective, equitable and well-
functioning land and land property markets are key concepts. The proclamations aim to realize
robust free market economy and building of transparent and accountable land administration
system that ensures the rights and obligations of the lessor and the lessee. These objectives are
expected to be realized through the role of the proclamations in enhancing investment (economic
growth), improvement in housing and infrastructure (equity) through revenue collection (capital
mobilization), regulated expansion and/or restrict the informal expansion of cities (social
objective).
Accordingly, the lease policy states that the right to use urban land by lease is permitted to realize
the common interest and development of the people. In this regard, the lease policy is expected to
address the development challenges in urban Ethiopia. Evidences revealed that the key challenges
in urban Ethiopia include, among others, lack of affordable and decent houses, unemployment,
infrastructure such as water supply and sanitation, and poor waste management. According to the
World Bank study, the fundamental causes for these development problems in urban areas of
Ethiopia are land management, governance and municipal finance (World Bank, 2015).
1 The proclamations are applicable to all urban centers within Ethiopia with little difference for Addis Ababa.
11
In relation to realizing good governance, the lease system is expected to be implemented through
adherence to transparency and accountability so as to address the prevailing problems of corruption
and ensure impartiality in the lease tender and land delivery system. One of the most important
aspects of the lease policy is that priority should be given to the interest of public and urban centers
in the urban land delivery system so as to ensure rapid urban development and equitable benefits
of citizens.
The effective implementation of the regulations is directly related to the key features of these
regulations which can be explained from the contents of the regulations. Each regulations
explicitly defines the scope of application, property rights related to transfer, mortgaging,
compensation, and associated duties, ways of acquiring new development land, manner of fixing
rates and modalities of lease fee payment, and duration of lease period. As stated in the
proclamation 721/2014, grace period is determined based on the type of development or service
of plot of land as well as the conclusion of the lease contract and completion of construction period.
The same regulation also clearly indicated that a lessee may transfer his leasehold right or use it
as collateral or capital contribution to the extent of the lease amount already paid. He can transfer
prior to commencement or half completion of construction. However, the period of urban land
lease shall vary depending on the level of urban development and sector of development activity
or the type of service. For instance, residential plots have 99 years of lease period, 70 years for
industry, 60 years for commercial use but business like urban agriculture has only 15 years of lease
period. 15 years for urban agriculture. However, the lease period may be renewed upon expiry on
the bases of the prevailing benchmark lease price and other requirements. Once the developer
wines, he/she is expected to pay a down payment not less than 5% and the remaining balance
during the lease payment period which takes into consideration the payback period of the
investment. The remaining balance of the lease amount shall be paid on the bases of equal annual
installment during the payment term. Interest shall be paid on the remaining balance as per the
prevailing interest rate on loan offered by commercial bank of Ethiopia. Penalty fee will be
imposed for failure to pay the annual payment based on the Bank’s defaulting debtor
12
While the rational for adopting the different proclamations is constitutionally founded, and have
common social and economic objectives, each regulation has its own specific problems the
regulation intends to address. Review of the Proclamation No. 80/1993, indicates that the
regulation is being applied only to urban land permitted to be held by lease. Since the proclamation
was not applicable to an urban land held by other means prior thereto, it created ambiguity.
Because it allowed the co-existence of the land acquired by permit or informally prior to the
proclamation, on the one hand, and formally acquired through leasehold systems. This problem
has been addressed by proclamation No. 272/2002, which declared that any urban land held by the
permit system, the lease-hold system, or by any other means prior thereto should be under lease
system. Besides, the proclamation is also intended to meet the ever increasing demand for land,
reduce unfair allocation of land and control illegal settlements that have been prevailed in urban
areas of the country. Proclamation No. 721/2011 has emphasized that any urban land which has
not been under leasehold system shall be permitted to be held only by lease system. The
proclamation also addressed issues that are not covered in the previous two land lease regulations.
These issues include failure to push permit holders to make annual rent payments for use rights,
the absence of formalizing informal tenure, and consolidation of the permit and leasehold tenure
systems. The intent is to create uniformity of the informal settlement of the old possessions with
the new, consolidated leasehold system. The new proclamation clearly states that lease payments
are provided when informal land settlements are unified with old possessions and are merged with
newly leased lands. The effect of transfer of land right or the status of a landholding, in the event
of the above two situations, is a “lease benchmark price2”
In sum, a critical examination of the policy and institutional arrangement of the land acquisition system for
investment revealed that at least three main modes of access to land for business purposes are practiced in
urban Ethiopia (Proclamation No 721/2011; Regulation No.14/2004; Regulation No.4/1994; Regulation
No.3/1994). These include rent from private source, lease hold and public allotment. There are both
advantages and shortcomings of each options. For instance, while the land rental market is characterized
2 The lease benchmark price is defined as the threshold price determined by taking into account the cost of infrastructural development, demolition cost as well as compensation to be paid to displaced persons in case of built up areas and other relevant factors
13
by very expensive prices and uncertain contracts, the main problem with lease hold arrangement is that the
land supplied for bid is very limited, and hence is quite competitive and expensive for investors. There are
also implementation problems in transferring to lessees. Even if public allotment has an advantage of being
quite cheap, cities have quite limited land that they can allot. It is thus uncertain as it takes a long time to
decide whether an applicant gets land or not, usually up to 2 years.
Given the skyrocketed land prices in options 1 and 2, Ethiopia uses land as a key instrument and incentive
to attract investments by providing free or subsidized land access (option 3). Private leasing of land or
premise (option 1) is extremely expensive and unregulated. Rental cost constitutes a large part of firms’
costs, which renders them uncompetitive. Leasing from private providers also creates a big uncertainty
because the landlords frequently increase rental price or force the tenants to leave the premises giving
several reasons. There is also uncertainty about the legality of the lease/rent. Price setting is up to the land
lord. Landlords often force the tenants to pay down payment for extended period of time, which reduces
the working capital available for the investors. There appears no efficient contractual arrangement that
binds both the supplier and customer. More importantly, the private rental is not an option for many
manufacturing activities that require large tracts of land.
On the other hand, lease-hold system suffers from corruption and lack of transparency. The size of land that
is available in each tender is very small in comparison to the demand. The limited land supply coupled with
discretionary power of government officials to restrict, tighten or widen access to land creates a large rent;
thus, attract more speculators into the bid. The administration is not able to differentiate the speculators
from the genuine investors. The bid process is largely dominated by the speculators, which tend to
increasingly bid with high prices, which crowds out the genuine investors. The speculators retain the land
for some time and resell the use right of the land at even higher prices. This has proven to be discouraging
to the genuine investors and the productive sectors. According to World Bank (2012) study land allocation
is the second most area of corruption in Ethiopia following customs services. The most corrupt activity in
the land sector occurs at the implementation stage suggesting that the level of corruption is influenced by
the way policy and legislation are formulated and enforced.
14
4. METHODOLOGY
4.1. DATA
We used data from the land transactions made through tender in Addis Ababa for the period between
2013/14 and 2016/17. The Addis Ababa city administration has supplied land through 24 rounds of bid
during this period. The data on all rounds of auctions are made available from the Land Bank and Transfer
Office of the city administration. It is responsible to run auctions of plots of land prepared for different
development activities in expansion and renewal areas by registering in the bank. The office provides
information on completed land lease transactions and new land lease listings to the public through its
website on a regular basis. While the office provides basic information about the plots of land available for
auction, bidders are required to reveal their personal information including their full name, residence and
nationality using the bid form prepared by the office when they applied for the tender. The tender contains
basic information about the plot including area code, location of the plot (both sub city and wereda), area
size in square meter, type of plot use, minimum building requirement, and benchmark price per meter square
in Ethiopian Birr, lease payment completion period and lease period. Bidders offer price per square meter,
initial down payment in percent and total lease price of the plot they bid for.
More than 3000 plots were auctioned between round 5 and round 24 during the period between 2013/14
and 2016/17, for which the information is available in the office’s website. Compared to the number of
auctions between 1994/95 and 2002/03, during which the city administration made available more than
7000 plots of land for auction in 43 rounds of auction (Alebel and Genanew, 2007), the city administration
auctioned less than half number of plots with in the last 19 rounds of auctions.
In addition to the land transaction data, we used relevant official policy and regulation documents from the
Addis Ababa municipality and federal offices as secondary sources. We mainly review the land lease
holding regulations. Moreover, other relevant data are extracted from the recent land lease implantation and
land market report of the city Administration.
4.2. ESTIMATION
The data contains a good set of variables to estimate a multivariate econometric model that enable us to
understand the relative strengths of the characteristic variables on the bidders decision to offer for a
particular plot of land. For each land lease transaction, the Land Bank and Transfer Office of the city
15
administration maintains detailed information on the plots of land tendered for bid. The office made
available the plot/area code with its basic information during tender announcement and also after the
announcement of the winner for each round with names of the first and second winners and their respective
offered prices. Therefore, before we run the regression, we link the information available for each area code
before and after the tender using ‘area code’ as unique variable. Thus, for each area code in each bid round,
we have information on base price, winning price for first and second rank bidders, plot size in meter square,
plot location, plot grade, land use type, capital requirement for construction, minimum down payment,
grace period, lease period, name of first winning bidder, and name of second winning bidder. Accordingly,
over the study period, the city administration supplied 3038 plots of land for auction distributed all over the
ten sub cities. Of these, 67% of the plots are sold at their respective round bid time when they are tendered,
and the rest could not be leased out at the time when they are tendered.3 This will enable us to conduct
detail quantitative analyses using descriptive and econometric analyses to understand the key feature of
land market and the key determinates of price of land in Addis Ababa city.
We examine the determinants of land value in Addis Ababa using the econometric model specified in
equation one below. Our dataset enables us to estimate the equation using the Ordinary Least Squares (OLS)
method.
MUPi = i + ij ij
j
J
S.
1
+ i .......................................... 1
Where MUPi is the markup of the price offered by bidder i over the bench mark or floor price of the
specific plot he/she is competing, and are parameters of the model, Sij is a set of j auction plot
characteristic/explanatory variables (as specified in the table 1), and i is prediction errors. Yuming and
Stephen (2001) used a similar OLS specification in their study to analyze government land auctions in Hong
Kong to detect economic profits that land developers are able to earn on their land acquisitions. They used
OLS regression, among others, to regress abnormal returns of land developers against auction site
characteristics.
3 There could be various reason for the cancellation of a tender. Perhaps, it could be that the number of bidders per
plot is less than three, in which case the tender should be cancelled or lack of information. According to the urban
land leasehold policy, a bid should be cancelled if less than three bidders participated in the round of tender. Lack of
information which could be due to affordability, residents’ perception on the high competitiveness of the land auction
market in city or speculation on the land price by the so called ‘middle men’.
16
We measure value of land using a markup price of a plot of land per square meter. The markup price of
a plot of land is the difference between the winning price, which is the price of a plot per meter
square provided by the winner and the bench mark price. As stated previously, the bench mark
price is determined by the city administration. One of the key parameters that the municipality
uses to determine the bench mark price for a plot of land per meter square is plot grade. The city
administration ranks plots based on their location, access to infrastructure, and numbers of stories
per building, development cost of the area and land use. It is, therefore, important to analyze
whether or not developers/bidders consider plot grade when they determine plot value. Based on
the lease policy, the bench mark price is updated at least every two years to reflect current
condition. See Table 1 for the definition and measurement for the variables included in the estimation.
The interpretation of the results from the quantitative data is enriched by supplementing with the qualitative
information gathered from key informants from policy making, and private domestic investment.
INSERT TABLE 1
5. STUDY RESULTS
5.1. THE PERFORMANCE OF LAND AUCTION IN URBAN ETHIOPIA
As stated in the lease holding of urban land regulation, city administration or regional states release
public land for private developers through allotment or the auction of land leases. Each regional state can
establish appropriate body which has the power to administer, develop urban land and advertise lease
tender. The Land Banking and Transfer Office of Addis Ababa city administration is mandated to
transfer plots of land through tender or allotment. The office first demarcates all plots of land not
possessed by anybody, demarcates, issues uniform parcel number and keeps proper information in
digital and plan format about the plots before the auction. Besides, it protects the plot until the land
is transferred to the beneficiary. The office is also responsible to run auction of plots of land
prepared for different development activities in expansion and renewal areas by registering in the
bank. It also prepares the land lease bid offer form, which a bidder should buy from the office, fill
and submit it to the office during the tender period. The form contains four sections in addition to
its heading and bid round number. In the first section, bidders are expected to fill their personal

17
information including their full name, residence and nationality. In the second section, basic
information of the plot is described including area code, location of the plot (both sub city and
wereda), area size in square meter, type of plot use, minimum building requirement, and
benchmark price per meter square in Ethiopian Birr, lease payment completion period and lease
period. The third section of the form is left for bidders to fill their offers for the plot of land they
bid for including price per square meter, initial down payment in percent and total lease price of
the plot. The prices should be filled both in figure and words so as to avoid any confusions during
writing. In the last section, bidders should indicate whether or not they have attached bid bond and
any other documents such as official delegation, if needed. After the winner is announced based
on highest price offered per square meter and percentage of down payment; the office concludes
lease contract with the winner; hands over the land, and collects lease payment based on the lease
contract from the winner.
Plots of land are released for auction openly at the government's benchmark or floor price and the bidders
submit their offer for a particular site in a closed envelope. The auctions are open to all interested developers
and there are no restrictions on the eligibility of bidders. Each auction site has specific land use parameters
to be made public through media and to be posted on the City's bi-weekly newspaper Addis Lisan. The
location (sub city), type of development, floor price, lease period, lease payment period, lease grace period,
etc. for each auction site are made accessible to the bidders. Land auctions in the City, therefore, can be
characterized as common value auctions in that the developers' valuations of the sites are based on the same
land use parameters and the same underlying market conditions.
Currently government auction floor prices in Addis Ababa are set based on the development condition of
the specific site. This condition gives weights to the topography of the site (slope, soil type and
texture/morphology, bearing capacity, hydrology, etc.), its existing and planned engineering and economic
infrastructures (road, drainage, sewerage, electricity, transportation and communication, water, business
area, etc.), its access to social and administrative infrastructures (health, education, police stations, fire-
extinguishing, stations, sport and recreation, worship place, green areas, etc.), housing condition (function,
typology and condition, etc. of the house), and urban plan of the city (land use and function, and building
blocks). Moreover, the floor price of a specific plot in the city depends whether the plot is in the Central
Business District (CBD): areas with access to transport and communication that attract more people and
18
socio-economic activities, Zone of Transition (TRZ): areas in between the CBD and SUR, and Suburban
and Urban-Rural Fringes (SUR): areas that are good for residence. Accordingly, plots in the city are graded
in 5 levels and the auction floor price of a plot in the city is set as in Table 1 (See Appendices).
According to the lease hold regulation, in addition to the bench mark price, the tender should at
least contain information on plot size, land use type, grace period and minimum capital
requirement. These are determined by the city administration. Grace period is determined based
on the type of development or service of plot of land as well as the conclusion of the lease contract
and completion of construction period. The completion of the construction period is from one to
two years depending on the size of the construction. This can be extended up to two years for small
and to five years for large construction projects. The lessee has the right to transfer or pledging the
leasehold. He/she can use it as collateral or capital contribution to the extent of the lease amount
already paid. He/she has also the right to transfer prior to the commencement or half completion
of construction. Moreover, based on the regulation, period of urban land lease varies depending
on the level of urban development and sector of development activity or the type of service. It will
be 99 years for residential housing, science and technology, research; 15 years for urban
agriculture. However, in Addis Ababa, the lease period is 90 for social, 70 years for industry, 60
years for commerce and others. Even if the city administration sets the minimum amount of the
down payment and includes in the bid announcement, bidders should also state the amount of the
down payment since it is also one of the key criteria for selection of the winner. The regulation
states that the amount of down payment may not be less than 10% of the total lease amount of
urban land. While the offered price per plot of land per meter by the winner accounts 80% of the
total score, the down payment accounts 20%. The lease period may be renewed upon expiry on
the bases of the prevailing benchmark lease price and other requirements. Once the bidder wins,
after the end of the grace period, he/she has to pay the remaining amount within the specified
payment period, which takes into consideration the payback period of the investment. Based on
the regulation, the remaining balance of the lease amount should be paid on the bases of equal
annual installment during the payment term. Otherwise, the winner will be forced to pay including
the interest on the remaining balance as per the prevailing interest rate on loan offered by
19
commercial bank of Ethiopia. Penalty fee will be imposed for failure to pay the annual payment
based on the Bank’s defaulting debtor.
While the city administration presented more than 3000 plots of land over the period between December
2013/14 and October 2016/17, it transferred a total land size of 1,070,528 M2, divided in to 2621 number
of plots, through auction for the same period. Of the total number of plots already transferred, 50% and
41% is allocated for mixed and residential use through auctions, respectively. While about 8% allocated for
business, the rest allocated for different purposes (Figure 1 and Figure 2). Though mixed use accounts half
of the total plot size supplied for auction, the average size per plot is largest for social use (2487.143 meter
square per plot), followed by plot used for business development (746.1 meter square per plot). When we
look at the trends in number of plots supplied over the bid round from 5 to 24, our result shows that the
highest number of plots is supplied during round 7, 13 and 20. The number of plots supplied for auction are
242 in round 7; 238 and 230 in round 13 and 20, respectively (Figure 3). The smallest number of plots
auctioned is observed in round 12, 16 and 18, during which below 100 plots were auctioned.
INSERT FIGURE 1
INSERT FIGURE 2
INSERT FIGURE 3
When we look into the distribution of number of plots by location4, the largest land size supplied for auction
is from Bole sub city, followed by Akaki Kaliti, during the period from December 2013/14 to October
2016/17, during which the city administration has supplied land through 19 number of bid round (Figure
4). Table 2 also shows the distribution of plots of land available for auction in each of the ten sub cities,
which also takes similar pattern over all rounds of bids. The number of plots is highest in Bole sub city,
followed by Akaki kaliti sub city. Small number of plots are supplied from Arada and Kirkos sub cities
where only 2 and 6 number of plots are supplied over the last 19 rounds of bid respectively (Figure 5).
INSERT FIGURE 4
INSERT FIGURE 5
INSERT TABLE 2
4 Addis Ababa city administration is currently divided in to ten sub cities. Each sub city is divided into
weredas/districts, which are the lowest administrative structure of the city.
20
While the trend in land supplied for auction and leased shows similar trends, there is no substantial change
in supply of number of plots of land though there size of land generally decreases in recent rounds (Figure
6). Whether this creates the capacity of the city to supply insufficient serviced land or due to a decline in
land stock for auction is an important issue since it may induce informal development due to high unmet
demand. On the other hand, the information on size of land supplied for auction and leased of the city shows
that not all land supplied by the city is leased in round 7 and 12. Figure 7 and 8 show the land size and
number of plots available for auction and actually sold in each round, respectively.
INSERT FIGURE 6
INSERT FIGURE 7
INSERT FIGURE 8
Figure 9 shows the ratio of number of plots available for auction to number of plots actually sold over all
bid round in the city between 2006 to 2009 E.C. While about 97% of the plots available for auction in all
round are actually sold, disaggregating this result by bid round revealed different story. About 37% and
39% of the plots available for auction in round 7 and 12 are actually sold, respectively. The same result was
also obtained by Alebel and Genanew (2007) who conducted the performance of the land auction market
for the city. Their study found that only 15 percent of the available plots were sold each year. It seems that
the land auction market is performing better in terms of market clearing over the last one decade compared
to the market over the period 1994/95 and 2002/03. When we look into the service type for which the land
is supplied for auction in these two rounds, one can see that 55% and 77% of the land supplied for auction
were for mixed use. See table 3. Figure 6 also shows the trends in supplied land for auction and land size
leased in each round. However one cannot conclude from such trends since the number of bidders for a
particular plot of land matters a lot for insufficiency of supplying serviced land. In this regard, a study made
by Alebel and Genanew (2003) revealed that the average number of bidders per plot were 14 and it has
been increasing over the period 1999/00 to 2002/03. The same study, however, shows that the ratio of the
number of bidders to number of available plots varies by type of plot use. The study made by the World
Bank shows that number of bidders for a plot of land ranges from 10 to 12.
INSERT 5 – 9
INSERT TABLE 3
21
5.2. LAND PRICE DEVELOPMENT
The above discussion focuses on the supply side of the land auction market in Addis Ababa. However, in
economic sense, the most important indicator is the trends in the price of land, which shows the
efficiency/inefficiency of the land management system in the city. In this regard, the evidence shows that
trends in real price of land per meter square shows a general increase (figure 10) though the median base
price shows a modest decreasing trend (figure 11). In real term, the median price of a plot of land per square
meter is Birr 8,357.38. It generally increased from Birr 8,481.42 in bid round five in 2013/14 E.C to Birr
12,348.03 in bid round number twenty four in October 2016/175. Table 4 shows the nominal average price
per square meter of a plot of land in the city. The median base price or floor price for the plot of land has
shown a slight decline from Birr 154.28 in bid round five to Birr 138.13 in bid number twenty four. Figure
10 shows the real and nominal average price for a plot of land per meter square in the city over the auction
period. Figure 11 shows the trend in real base price per plot of land over the period between December
2013/14 and October 2016/17.
INSERT TABLE 4
INSERT FIGURE 10
INSERT FIGURE 11
A detail investigation of the price of plot of land in the different location of the city revealed that the most
expensive plot is located in Addis Ketema sub-city compared to other parts of the city. As it can be seen
from figure 12, the median price for a plot of land is Birr 150,500 per meter square. The second most
expensive location is Lideta sub city where the median price for a meter square plot of land is Birr 63,600.
Perhaps, the expensiveness of a plot of land could be due to the fact that these two locations are relatively
most developed and central part of the city compared to other places. It could also be perhaps due to the
fact that the number of plots available for auction is very small. Only 6 and 13 plots of lands are made
available for auction in Lideta and Addis Ketema over the 19 rounds of bid, respectively. The lowest price
is observed in Akakai Kaliti, where the median price for a plot of land is Birr 9,012.25 per meter square.
Higher proportions of the plots are made available for auctions in Bole sub city, where about 43% of the
plots are made available for auction over the period between 2013/14 and 2016/17. Akaki Kaliti, Yeka and
Kolfe sub cities are the second, third and fourth locations in terms of proportions of plots of land auctioned.
About 27%, 13% and 10% of the plots of land are made available for auction over the same period in these
5 Birr is the name for Ethiopian currency. Currently, one Birr is about USD $23
22
sub cities, respectively. See figure 13. The median price for a square meter of plot of land is Birr 11,318
in Bole, Birr 9,012.25 in Akaki Kaliti, Birr 12,231 in Yeka and Birr 16,251 in Kolfe sub city. Figure 14
shows trends for median price of plot per square meter in five locations of the city over the study period
between December 2013/14 and October 2016/17. Overall, price increases were most pronounced in the
central parts of the city and less pronounced in the southern parts of the city.
INSERT FIGURE 12
INSERT FIGURE 13
INSERT FIGURE 14
While location and number of plots available have crucial role in the price of a plot of land, the type of plot
use also determines its price. Our study also investigated the price for a plot of land by disaggregating in to
its different uses. As stated previously the city administration made available plots of lands for mixed use,
residential, business and other uses such as school, health as well as for apartment uses. It seems that the
unconditional average price of plot of land varies by land use type. Figure 15 shows the trends in real
median price of plot of land for the different use of plot of land over the study period.
As it can be seen from the figure the real median price for mixed use plot per square meter increased from
Birr 5902.3 in bid round five in 2013/14 to Birr 10,184.6 in bid round 24 in 2016/17. Similarly, the real
median price of plot per square meter for business and residential use increased from Birr 4573.9 and Birr
9,063.8 to Birr 6,123.5 and Birr 15,276 over the same period, respectively. Real median price for plot of
land for different use has generally increased in response to the rising demand, more competitive allocation
procedures and higher development cost in Addis Ababa city. Over the study period, the lowest increase is
observed for business use plots, followed by residential use. Higher increment is observed for mixed use
plots. Our study revealed that from 2013/14 to 2016/17, the prices for mixed, business and residential use
rose by 73%, 34% and 69%, respectively. It seems that the price of plot of land for business use fluctuates
more frequently compared to price of plot of land for mixed use though the price for the later exhibits
steeper. Table 5 shows the nominal average price for plot of land by use type in the city for the period
between December 201314 and October 2016/17. Table 6 shows detail information on the winning and
markup prices of plot of land per meter square, and area size allocated by different use of plot of land for
all bid round.
23
INSERT FIGURE 15
INSERT TABLE 5
5.3. MARKUP PRICE OF PLOT OF LAND
This section describes the variation in the auction land markup prices offered by bidders over the period
between December 2013/14 and October 2016/17 or from auction round 5 to 24 against certain characteristics
of the land auction market in the city. We calculated markup price as the difference between the amount
bidders offered for a plot of land and the floor price of the plot. This is the revealed value for a plot of land
offered by developers. As it can be seen from Table 6 the mean markup price of plot of land per M2 offered
for plots that are made available for the different purposes is Birr 13,825.17, with standard deviation of Birr
16,425.21 and very high range between the minimum Birr 330 and the maximum of Birr 353,965 offer.
INSERT TABLE 6
However, this figure varies by type of land use and plot grade. Table 7 and 8 shows the markup price per
square meter of plot of land by plot use type and plot grade. Mixed use plots have a median markup price of
Birr 11,411.95 whilst the markup price for residential and business use plots is Birr 11,948 and 10,994.5,
respectively. It looks that there is high variation in the price of plots used for business compared to plots for
mixed and residential use. While the price variation among value of plots used for business is Birr 56,123.15,
it is 8,065.55 and 6,164.38 for mixed and residential use, respectively. The result shows that there is high
competition for mixed and residential use plots compared to plots for business use.
INSERT TABLE 7
The mean markup price offered by bidders for the different plot grades is shown in Table 8. Grade III2 plots
is the highest value, which has a median price of Birr 15,932, with standard deviation of Birr 10,811.5. The
average markup price for Grade III4 plots, on the other hand, is the lowest (Birr 10,909). Moreover, the
highest difference between the minimum and maximum offer is observed for Grade III2 plots (Birr 58,400)
while a lowest range (Birr 36,621) is observed for Grade III3.
INSERT TABLE 8
24
In order to understand whether or not there is variation in the value of land across the different location of
the city, we have also examined the markup price for a plot of land in each sub city (Table 9). More than 98
percent of the plots available for auction comes from five sub cities including Akaki - Kaliti, Yeka, Nifas –
Silik, Kolfe and Bole. The table shows that markup price for a plot of land is highest in Nifas – Silk, followed
by Kolfe. The corresponding markup price in these sub cities is Birr 16,597.5 and 16,362. In Nifas – Silk,
the markup price ranges from a minimum of Birr 3300.99 to Birr 61,701 whereas in Kolfe it ranges from a
minimum of Birr 3301 to Birr 48,626 per square meter. The lowest markup price is observed in Akaki –
Kaliti sub city where a plot of land is valued at a median price of 8,805.2, with a standard deviation of Birr
3,479.95.
INSERT TABLE 9
Figure 16 and 17 shows trends in markup price across the different number of auction rounds and the different
use of plot of land in Addis Ababa. As it can be seen from figure 16, markup price variation is observed over
the different period of auctions. Though the figure does not show a steady increase in markup price of a plot
of land over the different auction periods, it generally increased from the fifth auction round to the twenty -
fourth round. Likewise, markup price for a plot of land not only vary by use of plot of land but also that it
varied over the auction period within similar use of plot of land (Figure 17).
INSERT FIGURE 16
INSERT FIGURE 17
In general, the above description suggests that the auction land markup price offered by bidders varies across
the different characteristics of the auction land. In particular, it varies across the types of use of the plot, plot
grades and plot location. The description also suggests that there is a marked difference between the
minimum and maximum markup price that bidders are offering for a plot.
5.4. DRIVING FACTORS OF LAND VALUE
As stated in the introductory section, the city manages the land as means of revenue so as to provide basic
services including municipal services, infrastructure development such as road, electricity, water and
sanitation supply, sewerage and wastewater treatment as well as affordable houses to the poor through the
25
low cost housing program. Whether or not the city manages the land in an efficient way is one of the key
policy questions that requires evidence based information to decision makers. This means that it is essential
to investigate whether the city administration allocates land through the lease system creates inefficiency
or not. The competitiveness of bidding at the auctions and hence the price land developers offer for a
particular site in an auction is individual and is affected by observed and unobserved characteristics of the
site. This section describes the key determinants of markup price for a plot of land in Addis Ababa. We
used the regression model specified in section 3 for estimating its determinants. Multivariate analysis can
give better information and greater insight into the factors that affect bidders’ willingness to offer for
auction plot. The final results of the multivariate analysis are presented based on the Ordinary Least Square
regression model. Such a presentation helps to examine whether or not there is a systematic relationship
between developers’ willingness to pay, as measured by their markup price, on the one side, and the
characteristics of the auctioned plot of land, on the other side. The estimation results are presented in Table
10 and 11.
Table 10 presents the descriptive statistics for the variables included in the regression. As it can be seen
from the table the mean markup price for a plot of land per square meter is Birr 13,825.2 with a standard
deviation of 16,425.2. The mean winning price and base price per square meter of plot of land is 13,409.9
and 217.9, respectively. The average size of a plot of land available for auction is 408.4 meter square. While
bidders are required to deposit 15.8 percent of the bid amount they offer for the plot of land they are willing
to bid, the winners offered on average 16.1 percent of the winning price. While winners are required to
complete the total amount of the lease within 34 years, the mean average of grace period for the winner to
be relieved from starting to pay the lease is two years. The average lease period for the plot of land is 76
years, with a minimum and maximum lease period of 60 and 99 years, respectively. Bidders are required
to demonstrate on average Birr 466,001.5 as their investment or development capacity for the plot of land
they bid. This ranges from a minimum of Birr 12,376.8 and maximum amount of Birr 1,820,000.
INSERT TABLE 10
Our model estimated the determinants of markup price for a plot of land on 2036 number plots of
observations and their associated characteristics. Table 11 shows the OLS regression result. The result of
the R-square shows that the explanatory variables are able to explain 60 percent of the key factors that
bidders consider when they decide to determine the value of plot of land they bid for, which is the markup
26
price for the plot of land. Our result shows that assuming all factors being constant, plot of land has high
value in the city regardless of its characteristic features as it can be seen from the coefficient of the constant
term, which is positive and statistically highly significant at least at 1%. The floor price is found to have
significant and positive effect on the markup price for a plot of land, indicating that the higher the value for
the base price the higher for the markup price, suggesting that the determination of the base price should be
given due consideration as it affects the markup price. In this case the city administration takes into
consideration certain parameters such as plot grade, last auction price per meter square, access to basic
services, etc when determining he floor price for a plot of land available for auction. However, whether it
reflects the objective of the administration to provide land, which may vary from investment oriented to
distributional or poverty reducing oriented targets when supplying the land for auction. Our result also
shows that land value has been found to have an increasing trend from time to time. The coefficient for bid
round is found to have positive and significant (at least at 1% probability level) effect on the markup price
for a plot of land in the city. Our descriptive result also shows similar result. The same is true for size of
plot of land available for auction. Area size has positive and significant effect at least at 1% significance
level on the markup price. We looked at whether or not the size of plot of land will have an inverted U
shape effect by including the square of area size in the regression. As it can be seen from the table, though
size has still positive effect on markup price, the degree of its effect declines as the size increases. The
square of plot size has a modest effect at 5% significance level. This suggests the need to give due
consideration in determining the size of the plot of land available for auction as at certain point the value
for land provided by bidders may not reflect the actual or equilibrium price. It looks that location of plot of
land has significant effect (at least at 5% significance level) in Addis Ketema, Lideta and Arada sub cities.
These sub cities are located in the central and most developed part of the city where access to basic social
services and infrastructure are well developed. The other locations such as Akaki Kaliti, Bole and Yeka has
not significant effect on the markup price of plot of land. Most of the expansion areas of the city physical
area is made in these sub cities, and, thus, plots of land are made available from these expansion parts of
the sub cities. The result on plot grade indicates that compared to grade six plots, all plots except grade two
plots have significantly higher markup value in the city. However, plots with grade four have more value
than other grades compared to grade six plots. The OLS estimation result shows that the coefficients for
dummies for plot use type have the same positive sign for mixed use, residential use and business use.
However, none of the variables are found to have significant effect on markup price in our model. That is
bidders decision to offer for auction land is not importantly affected whether or not the auction plot is for
mixed, residential or business use or other uses. Finally, the available auction price data on down payment
27
and capital have no statistically significant effect on markup price in Addis Ababa at least at 10%
significance level for the auction rounds from 5th to twenty – fourth or over the period between December
2006 and October 2009 E.C.
INSERT TABLE 11
6. SUMMARY AND CONCLUSION
Ethiopia recently experiences rapid urbanization rate. This can be an opportunity or a challenge,
depending on how well the country manages urbanization. The land management and governance
system can be the underlying cause for materializing the opportunity or face the challenge. In this
regard, since land is constitutionally state owned, one can only acquire land use right and cannot
own it. The land lease policy of the country is considered the most influential factor that determine
whether or not there exists unhealthy, haphazard and unbalanced investment environment in the
cities. It lays the foundation for providing land use right for investment or any other development
through auction or negotiation. To this end, the paper critically reviews the land lease policy and
its institutional arrangement. Specifically, since understanding the demand side of any investment
is crucial, the paper quantitatively analyzed the fundamental factors that drive the value of land
developers place on urban land for investment. The land auctions data obtained from the Land
Bank and Transfer office of Addis Ababa City Administration for the period between 2013 and
2016/17 is descriptively and econometrically analyzed.
The study identified serious gaps in the enforcement that include reliance on unpublished and easily
changed directives, lack of real system to record rights and restrictions, ignorance of the master plan
particularly green areas and roads in favor of private use. Our empirical result revealed that base price,
plot size and grade, time of auction and residential use have significant and positive effect on land
value in the city. Plots located in southern expansion part of the city have lower value compared
to central and other part of the city. On the other hand, capital, which is theoretically an important
factor for investment, has only modest effect. Land use type has mixed effect, depending on the
type of land use. Moreover, plot location has no statistically significant effect on land value. Our
study also revealed that the auction land markup price offered by investors varies across the different
28
characteristics of the auction land. In particular, it varies across the types of investment sector the plot is
meant for, plot grades, its distance from the main center and its access to basic services. The description
also suggests that there is a marked difference between the minimum and maximum markup price that
investors are offering for a plot. Moreover, the auction land markup price offer by bidders has mixed effect.
It has negative sign but positive sign when the plot size reaches certain size. The sign of the coefficient for
bench mark/ floor price variable is positive and significant, indicating that developers are willing to offer
more for the plots with higher site value. Plot use type has also mixed effect. Plots with residential use have
higher value compared to mixed or business use plots. The results imply that even if domestic investors are
more willing to provide higher value for plot of land that can fit with land size for productive investment,
they are investing in less productive sector (that generates less employment) such as real estate. This
suggests that the lease policy need to create incentives for domestic investors who are willing to invest in
productive sector such as the manufacturing since this is the policy priority of the government. In this study,
we also argue that the land scarcity in urban Ethiopia, especially Addis Ababa is triggered by inefficiencies
in the land markets, particularly in the lease-hold system Ethiopia is implementing.
The result of the coefficient of the variable bench mark price has important implication. Based on the
leasehold regulation, a bench mark price is determined on the bases of each urban center in accordance with
regulations issued by the respective regions and city administration. It is updated at least every two years
to reflect current condition. Our result shows that there is significant difference in markup price of plot of
land from round to round. Given that more than one rounds of bid are tendered in one year, there is little
justification to update the markup price at least once in two years. On the other hand, the benchmark price
is also found to have significant positive effect in markup price of plot of land. These two results suggest
that the municipality is not earning revenue from land whose value is determined based on market. The
other important implication arises from the result on the coefficient of the variable for grace period. Grace
period is determined based on the type of development or service of plot of land as well as the conclusion
of the lease contract and completion of construction period. Our result shows that grace period has negative
sign and significant effect on markup price. This means that plots that have designed for
development/service that requires longer construction period or the longer for the conclusion of lease
contract the less the markup price. This implies that if developers assume that the contract conclusion period
is longer due to lack of transparency or corruption, then they attach lower value to minimize the transaction
cost due to unnecessary delay in contract conclusion. It means that the municipality loses revenue due to
corruption.
29
Overall our findings suggest that the implementation of the land lease policy still requires
reexamination of constraints and opportunities with the aim of devising appropriate measures and
strategies for action towards sustainable urbanization. The country is experiencing one of the fastest
urbanization rate during the last decade. In this regard, appropriate institutional mechanisms to provide
‘appropriate’ incentive for domestic investment, governance system for accountability not only in the
determination of land use type and in land sales revenue utilization need to be in place. It should also
recalibrate to help facilitate cities to transition from dependence on revenue from land sale to modern
taxation. Besides, in addition to clarifying their property rights on land assets, it should consider the
capability of the rural citizens, who are expected to displace as urbanization progresses, to access the
opportunities and their entitlements for integration into cities throughout the urbanization process.
REFERENCE
Abraham W. 1995. “Urban Land in Transition: Policy, Problems and Prospects. The case of Addis Ababa.
M.Sc. Thesis. Rotterdam, the Netherlands.
Addis Negatit Gazeta of the government of Addis Ababa. 2004. “Regulation No 14/2004: Regulation to
prevent Illegal Expansion and Possession of Lands in Addis Ababa City Government.
Addis Negatit Gazeta of Region 14 Administration. 1994. “Urban Lands Lease Holding Regulation
No.3/1994,” Berhanena Selam Printing Press, Addis Ababa.
------------------------.1994. “Rent Holding of Urban Land and the fixing of Rate of Rent Regulations
No.4/1994,” Berhanena Selam Printing Press, Addis Ababa.
Alebel Bayrau and Genanew Bekele (2007b). “Investors willingness to pay for urban land in Addis Ababa”
Conference proceedings of the Fourth International Conference on Ethiopian Development Studies
(4th ICEDS) on THE CHALLENGES AND OPPORTUNITIES FOR PEACE & DEVELOPMENT
IN ETHIOPIA & THE HORN OF AFRICA, August 2-4, 2007, 2000 Schneider Hall, Haworth
College of Business, Western Michigan University, Kalamazoo, USA.
Bacry Yusuf, Sileshi Tefera and Admit Zerihun (2009) ‘LAND LEASE POLICY IN ADDIS
ABABA’ Produced and distributed by the Addis Ababa Chamber of Commerce and Sectoral
Associations with financial support from the Swedish Agency for International Development
Cooperation, Sida
30
Belachew Yirsaw (2010), ‘Urban Land Lease Policy of Ethiopie: Case Study on Addis Ababa and
Lease Towns of Amhara National Regional State’ FIG Congress 2010 Facing the Challenges –
Building the Capacity, Sydney, Australia, 11-16 April 2010
Bohn, Peter. 1972. “Estimating Demand for Public Goods: an experiment”. European Economic Review
vol. 3.
Deininger, K. (2003) Land policies for growth and poverty reduction. World Bank Policy Research
Report series. Washington, D.C. World Bank; Oxford and New York: Oxford University
Press.
Deininger, K. and Chamorro. C. (2002) Investment and Income Effects of Land: The Case of
Nicaragua. World Bank Policy Research Working Paper No. 2752
Deininger, K and Jin, S. (2006). Tenure Security and Land-Related Investment: Evidence from
Ethiopia. European Economic Review 50 (5): 1245-77.
Federal Democratic Republic of Ethiopia. 2002. “Re-enactment of Urban Land Lease Holding
Proclamation N0. 272/2002”. Negarit Gazeta, Berhanena Selam Printing Press. Addis
Ababa, Ethiopia.
Federal Democratic Republic of Ethiopia. (1995) Proclamation of the Constitution of the Federal
Democratic Republic of Ethiopia, proclamation No. 1/1995. Addis Ababa Berhan ena Selam
Printing press.
Federal Negarit Gazeta (2011). Proclamation No. 721/2011: A proclamation to Provide for Lease Holding
of Urban Land.
Foreign Investment Advisory Service. 2001. “Ethiopia Foreign Investment Promotion Strategy
Framework”. Washington, D.C., USA.
George E. Peterson (2006). LAND LEASING AND LAND SALE AS AN INFRASTRUCTURE
FINANCING OPTION, World Bank Policy Research Working Paper 4043, November 2006
Hong, Y and Bourassa, S. (2003). Why Public leasehold? Issues and concepts. In: Hong, Yu- Hung
/ Bourassa, Steven (editors). Leasing Public Land – Policy debates and International
Experiences. Page 3 – 38.
Jones G. and Ward P.M. 1994. “Methodology for Land and Housing Market Analyses: Measuring the Price
and supply of Urban Land Market: Insights on Source,” UCL Press.
Ministry of Works and Urban Development. 1994. Strategy Paper for Housing, Urban development and
Construction, Addis Ababa.
---------------------. 1997. “Land and Housing Market Assessment,” Revised Final Version. Addis Ababa,
31
Ethiopia.
National Urban Planning Institute and PADCO WAAS International PLC. 1997. Land and Housing Market
Assessment. Addis Ababa, Ethiopia.
Negarit Gazeta of the Transitional Government of Ethiopia. (1993) urban land lease holding
Proclamation No.80/1993, BerhanenaSelam printing press, Addis Ababa
Transitional Government of Ethiopia. 1993. “Urban Land Lease Holding Proclamation No. 80/1993”.
Negarit Gazeta, Berhanena Selam Printing Press. Addis Ababa, Ethiopa.
Office for the Revision of Addis Ababa Master Plan (ORAAMP). 2001. “Addis Ababa In Action: Progress
Through Partnership. City Development Plan, 2001-2010. Addis Ababa, Ethiopia.
Office for the Revision of Addis Ababa Master Plan (ORAAMP). ----- “Balance Improvement and Growth
in Addis Ababa,” Addis Ababa, Ethiopia.
Federal Negarit Gazeta (2011). Proclamation No. 721/2011: A proclamation to Provide for Lease Holding
of Urban Land.
Sevkiye S. T. 2003. “The Use of Land Acquisition Methods in Turkish Urban Areas” . FIG Working Week
2003; Paris, France.
Weidong Qu and Xiaolong Liu (undated), ‘Assessing the Performance of Chinese Land Lease Auctions:
Evidence from Beijing’
The World Bank, 1994. Bank wide review of involuntary Resettlement(1986-93), Washington, D.C.
World Bank. (1978) ‘Urban land policy issues and opportunities’, staff working paper No. 283 vol.
1 and 2, World Bank, Washington D.C, p.13
Yuming F. and Stephen C., 2001. “Examining Competition in Land Market: An Application of Event Study
to Land Auctions in Hong Kong”, Department of Real Estate and Urban Land Economics, University
of Wisconsin.
Yuming et. al. 1999. “Land Use Rights, Government Land Supply, and the Pattern of Redevelopment in
Shanghai”, International Real Estate Review, Vol.2 No
Zelalem Yirga ADAMU, (2014) ‘Critical Analysis of Ethiopian Urban Land Lease Policy Reform
Since Early 1990s’
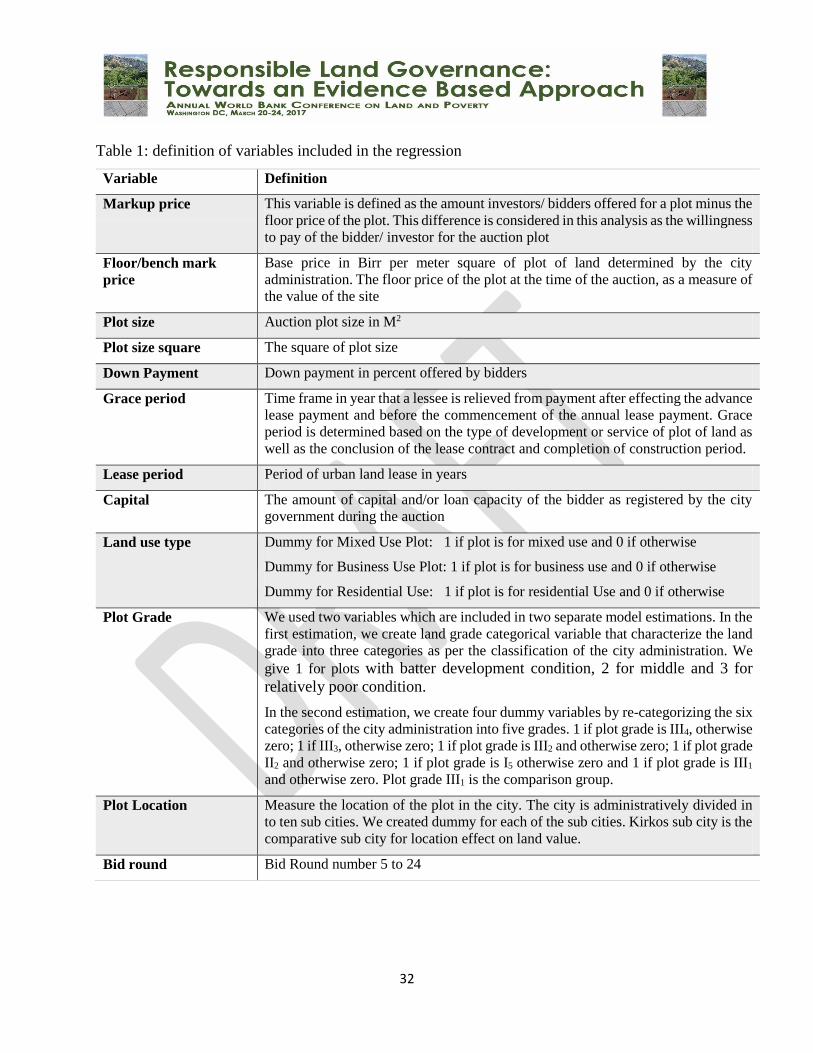
32
Table 1: definition of variables included in the regression
Variable Definition
Markup price This variable is defined as the amount investors/ bidders offered for a plot minus the
floor price of the plot. This difference is considered in this analysis as the willingness
to pay of the bidder/ investor for the auction plot
Floor/bench mark
price
Base price in Birr per meter square of plot of land determined by the city
administration. The floor price of the plot at the time of the auction, as a measure of
the value of the site
Plot size Auction plot size in M2
Plot size square The square of plot size
Down Payment Down payment in percent offered by bidders
Grace period Time frame in year that a lessee is relieved from payment after effecting the advance
lease payment and before the commencement of the annual lease payment. Grace
period is determined based on the type of development or service of plot of land as
well as the conclusion of the lease contract and completion of construction period.
Lease period Period of urban land lease in years
Capital The amount of capital and/or loan capacity of the bidder as registered by the city
government during the auction
Land use type Dummy for Mixed Use Plot: 1 if plot is for mixed use and 0 if otherwise
Dummy for Business Use Plot: 1 if plot is for business use and 0 if otherwise
Dummy for Residential Use: 1 if plot is for residential Use and 0 if otherwise
Plot Grade We used two variables which are included in two separate model estimations. In the
first estimation, we create land grade categorical variable that characterize the land
grade into three categories as per the classification of the city administration. We
give 1 for plots with batter development condition, 2 for middle and 3 for
relatively poor condition.
In the second estimation, we create four dummy variables by re-categorizing the six
categories of the city administration into five grades. 1 if plot grade is III4, otherwise
zero; 1 if III3, otherwise zero; 1 if plot grade is III2 and otherwise zero; 1 if plot grade
II2 and otherwise zero; 1 if plot grade is I5 otherwise zero and 1 if plot grade is III1
and otherwise zero. Plot grade III1 is the comparison group.
Plot Location Measure the location of the plot in the city. The city is administratively divided in
to ten sub cities. We created dummy for each of the sub cities. Kirkos sub city is the
comparative sub city for location effect on land value.
Bid round Bid Round number 5 to 24
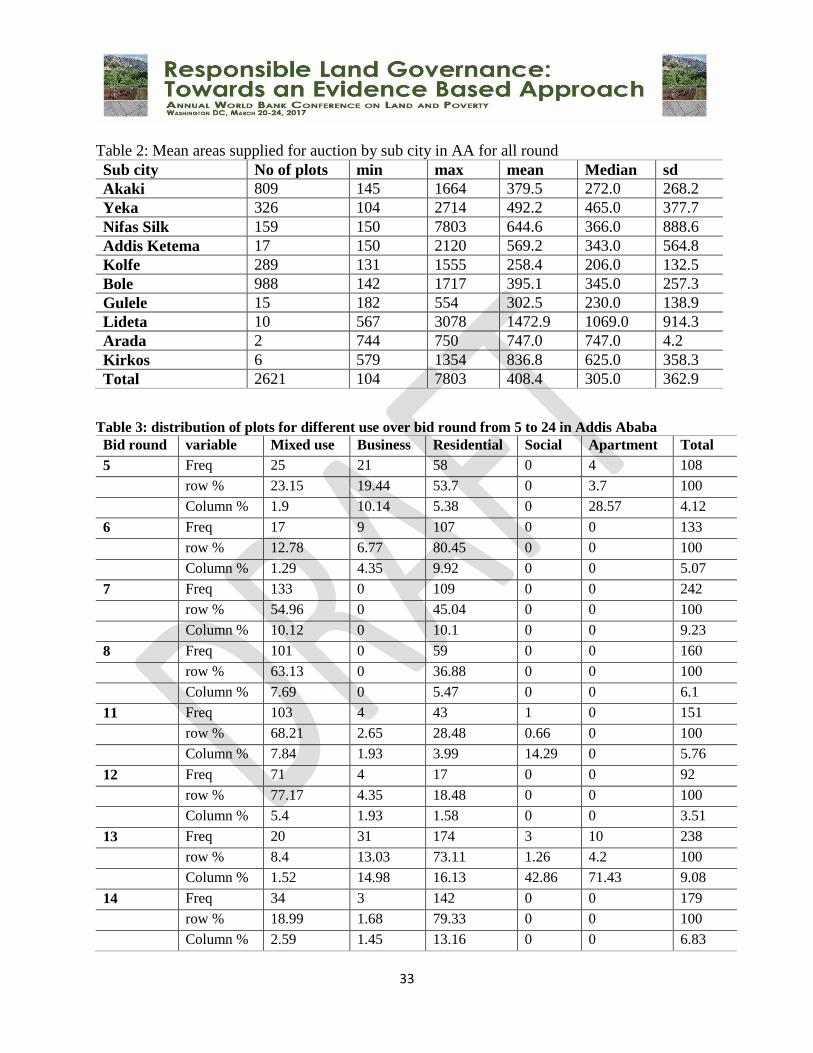
33
Table 2: Mean areas supplied for auction by sub city in AA for all round
Sub city No of plots min max mean Median sd
Akaki 809 145 1664 379.5 272.0 268.2
Yeka 326 104 2714 492.2 465.0 377.7
Nifas Silk 159 150 7803 644.6 366.0 888.6
Addis Ketema 17 150 2120 569.2 343.0 564.8
Kolfe 289 131 1555 258.4 206.0 132.5
Bole 988 142 1717 395.1 345.0 257.3
Gulele 15 182 554 302.5 230.0 138.9
Lideta 10 567 3078 1472.9 1069.0 914.3
Arada 2 744 750 747.0 747.0 4.2
Kirkos 6 579 1354 836.8 625.0 358.3
Total 2621 104 7803 408.4 305.0 362.9
Table 3: distribution of plots for different use over bid round from 5 to 24 in Addis Ababa
Bid round variable Mixed use Business Residential Social Apartment Total
5 Freq 25 21 58 0 4 108
row % 23.15 19.44 53.7 0 3.7 100
Column % 1.9 10.14 5.38 0 28.57 4.12
6 Freq 17 9 107 0 0 133
row % 12.78 6.77 80.45 0 0 100
Column % 1.29 4.35 9.92 0 0 5.07
7 Freq 133 0 109 0 0 242
row % 54.96 0 45.04 0 0 100
Column % 10.12 0 10.1 0 0 9.23
8 Freq 101 0 59 0 0 160
row % 63.13 0 36.88 0 0 100
Column % 7.69 0 5.47 0 0 6.1
11 Freq 103 4 43 1 0 151
row % 68.21 2.65 28.48 0.66 0 100
Column % 7.84 1.93 3.99 14.29 0 5.76
12 Freq 71 4 17 0 0 92
row % 77.17 4.35 18.48 0 0 100
Column % 5.4 1.93 1.58 0 0 3.51
13 Freq 20 31 174 3 10 238
row % 8.4 13.03 73.11 1.26 4.2 100
Column % 1.52 14.98 16.13 42.86 71.43 9.08
14 Freq 34 3 142 0 0 179
row % 18.99 1.68 79.33 0 0 100
Column % 2.59 1.45 13.16 0 0 6.83
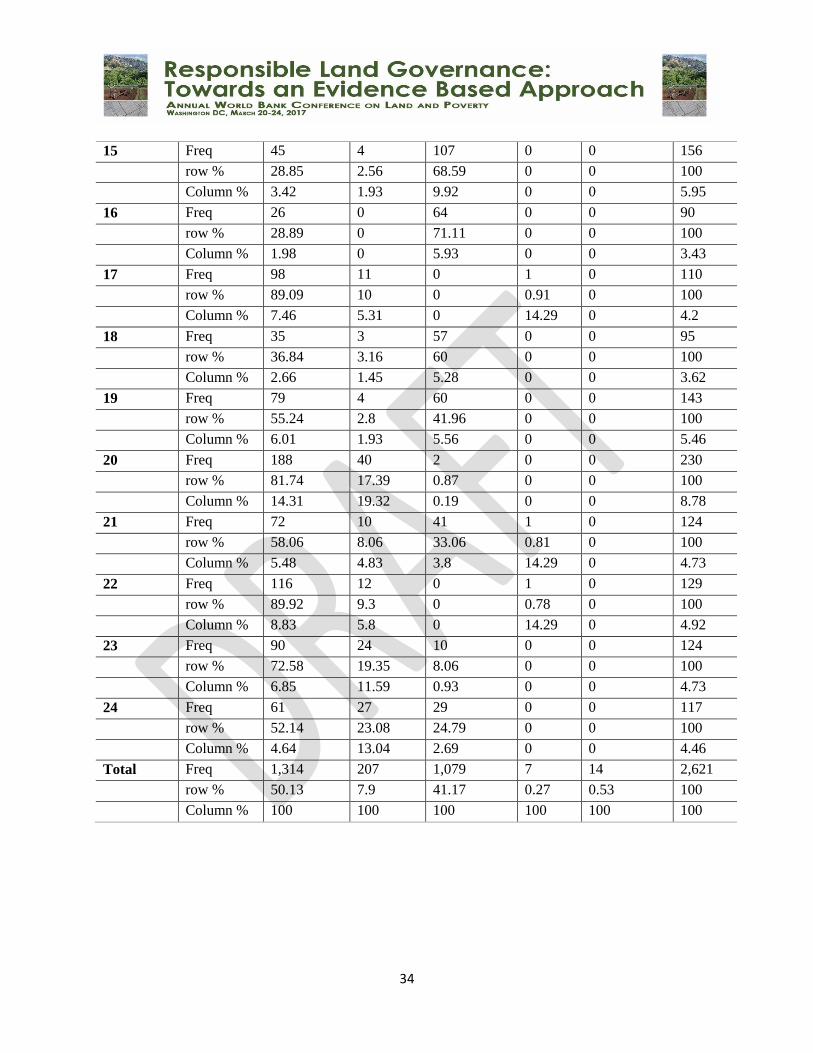
34
15 Freq 45 4 107 0 0 156
row % 28.85 2.56 68.59 0 0 100
Column % 3.42 1.93 9.92 0 0 5.95
16 Freq 26 0 64 0 0 90
row % 28.89 0 71.11 0 0 100
Column % 1.98 0 5.93 0 0 3.43
17 Freq 98 11 0 1 0 110
row % 89.09 10 0 0.91 0 100
Column % 7.46 5.31 0 14.29 0 4.2
18 Freq 35 3 57 0 0 95
row % 36.84 3.16 60 0 0 100
Column % 2.66 1.45 5.28 0 0 3.62
19 Freq 79 4 60 0 0 143
row % 55.24 2.8 41.96 0 0 100
Column % 6.01 1.93 5.56 0 0 5.46
20 Freq 188 40 2 0 0 230
row % 81.74 17.39 0.87 0 0 100
Column % 14.31 19.32 0.19 0 0 8.78
21 Freq 72 10 41 1 0 124
row % 58.06 8.06 33.06 0.81 0 100
Column % 5.48 4.83 3.8 14.29 0 4.73
22 Freq 116 12 0 1 0 129
row % 89.92 9.3 0 0.78 0 100
Column % 8.83 5.8 0 14.29 0 4.92
23 Freq 90 24 10 0 0 124
row % 72.58 19.35 8.06 0 0 100
Column % 6.85 11.59 0.93 0 0 4.73
24 Freq 61 27 29 0 0 117
row % 52.14 23.08 24.79 0 0 100
Column % 4.64 13.04 2.69 0 0 4.46
Total Freq 1,314 207 1,079 7 14 2,621
row % 50.13 7.9 41.17 0.27 0.53 100
Column % 100 100 100 100 100 100
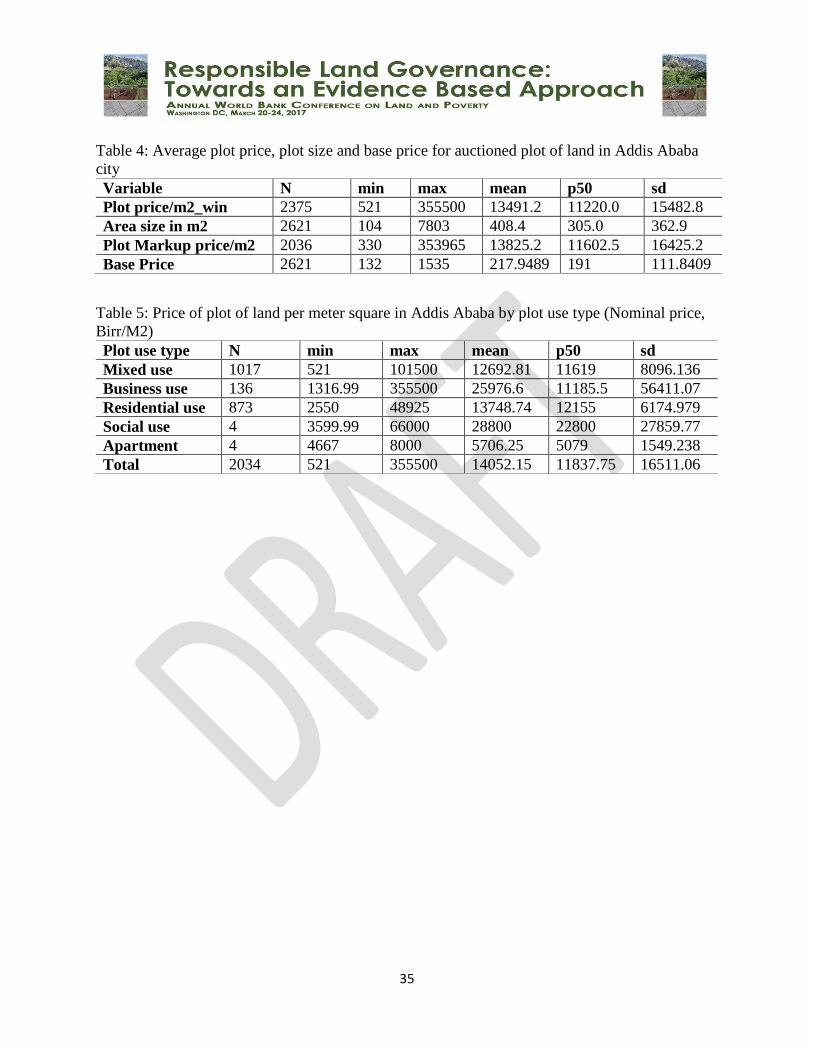
35
Table 4: Average plot price, plot size and base price for auctioned plot of land in Addis Ababa
city
Variable N min max mean p50 sd
Plot price/m2_win 2375 521 355500 13491.2 11220.0 15482.8
Area size in m2 2621 104 7803 408.4 305.0 362.9
Plot Markup price/m2 2036 330 353965 13825.2 11602.5 16425.2
Base Price 2621 132 1535 217.9489 191 111.8409
Table 5: Price of plot of land per meter square in Addis Ababa by plot use type (Nominal price,
Birr/M2)
Plot use type N min max mean p50 sd
Mixed use 1017 521 101500 12692.81 11619 8096.136
Business use 136 1316.99 355500 25976.6 11185.5 56411.07
Residential use 873 2550 48925 13748.74 12155 6174.979
Social use 4 3599.99 66000 28800 22800 27859.77
Apartment 4 4667 8000 5706.25 5079 1549.238
Total 2034 521 355500 14052.15 11837.75 16511.06
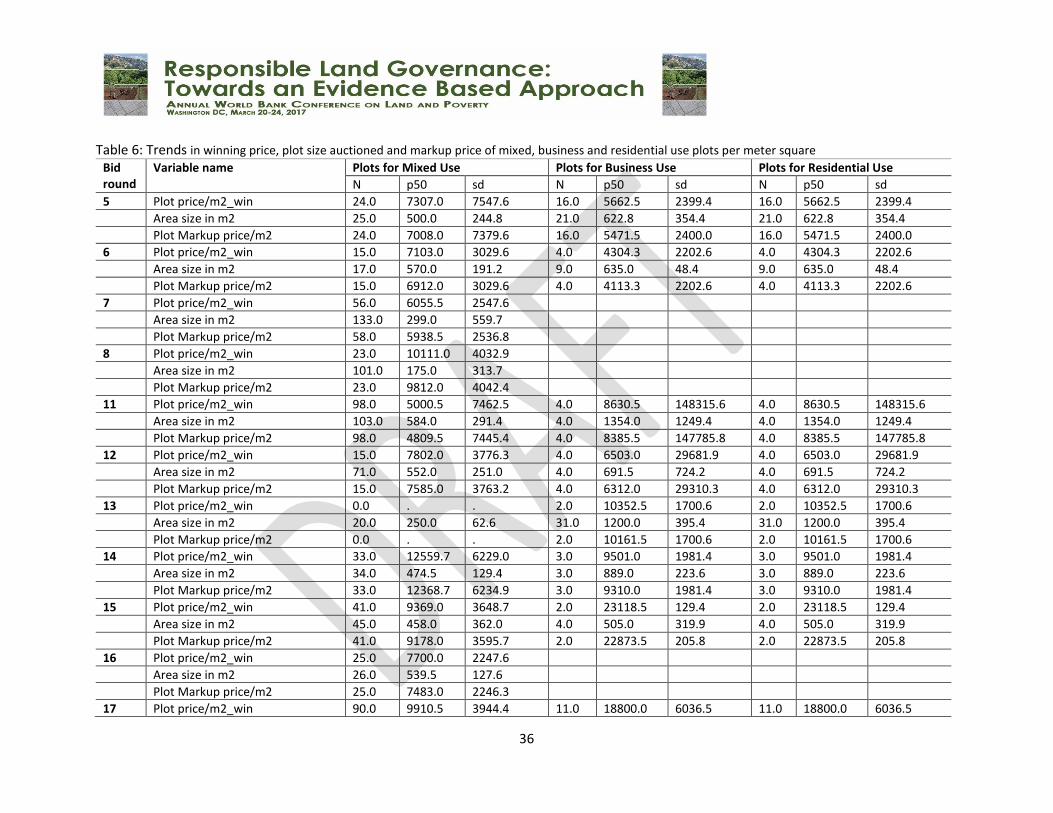
36
Table 6: Trends in winning price, plot size auctioned and markup price of mixed, business and residential use plots per meter square
Bid round
Variable name Plots for Mixed Use Plots for Business Use Plots for Residential Use
N p50 sd N p50 sd N p50 sd
5 Plot price/m2_win 24.0 7307.0 7547.6 16.0 5662.5 2399.4 16.0 5662.5 2399.4
Area size in m2 25.0 500.0 244.8 21.0 622.8 354.4 21.0 622.8 354.4
Plot Markup price/m2 24.0 7008.0 7379.6 16.0 5471.5 2400.0 16.0 5471.5 2400.0
6 Plot price/m2_win 15.0 7103.0 3029.6 4.0 4304.3 2202.6 4.0 4304.3 2202.6
Area size in m2 17.0 570.0 191.2 9.0 635.0 48.4 9.0 635.0 48.4
Plot Markup price/m2 15.0 6912.0 3029.6 4.0 4113.3 2202.6 4.0 4113.3 2202.6
7 Plot price/m2_win 56.0 6055.5 2547.6
Area size in m2 133.0 299.0 559.7
Plot Markup price/m2 58.0 5938.5 2536.8
8 Plot price/m2_win 23.0 10111.0 4032.9
Area size in m2 101.0 175.0 313.7
Plot Markup price/m2 23.0 9812.0 4042.4
11 Plot price/m2_win 98.0 5000.5 7462.5 4.0 8630.5 148315.6 4.0 8630.5 148315.6
Area size in m2 103.0 584.0 291.4 4.0 1354.0 1249.4 4.0 1354.0 1249.4
Plot Markup price/m2 98.0 4809.5 7445.4 4.0 8385.5 147785.8 4.0 8385.5 147785.8
12 Plot price/m2_win 15.0 7802.0 3776.3 4.0 6503.0 29681.9 4.0 6503.0 29681.9
Area size in m2 71.0 552.0 251.0 4.0 691.5 724.2 4.0 691.5 724.2
Plot Markup price/m2 15.0 7585.0 3763.2 4.0 6312.0 29310.3 4.0 6312.0 29310.3
13 Plot price/m2_win 0.0 . . 2.0 10352.5 1700.6 2.0 10352.5 1700.6
Area size in m2 20.0 250.0 62.6 31.0 1200.0 395.4 31.0 1200.0 395.4
Plot Markup price/m2 0.0 . . 2.0 10161.5 1700.6 2.0 10161.5 1700.6
14 Plot price/m2_win 33.0 12559.7 6229.0 3.0 9501.0 1981.4 3.0 9501.0 1981.4
Area size in m2 34.0 474.5 129.4 3.0 889.0 223.6 3.0 889.0 223.6
Plot Markup price/m2 33.0 12368.7 6234.9 3.0 9310.0 1981.4 3.0 9310.0 1981.4
15 Plot price/m2_win 41.0 9369.0 3648.7 2.0 23118.5 129.4 2.0 23118.5 129.4
Area size in m2 45.0 458.0 362.0 4.0 505.0 319.9 4.0 505.0 319.9
Plot Markup price/m2 41.0 9178.0 3595.7 2.0 22873.5 205.8 2.0 22873.5 205.8
16 Plot price/m2_win 25.0 7700.0 2247.6
Area size in m2 26.0 539.5 127.6
Plot Markup price/m2 25.0 7483.0 2246.3
17 Plot price/m2_win 90.0 9910.5 3944.4 11.0 18800.0 6036.5 11.0 18800.0 6036.5
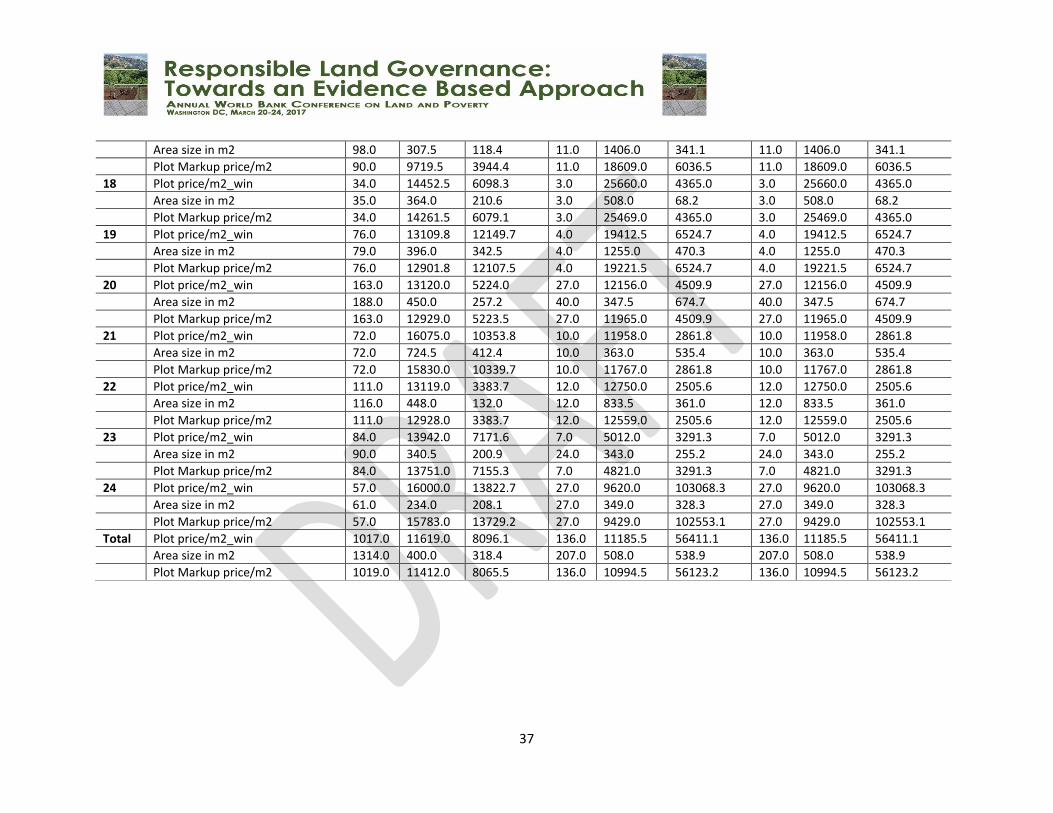
37
Area size in m2 98.0 307.5 118.4 11.0 1406.0 341.1 11.0 1406.0 341.1
Plot Markup price/m2 90.0 9719.5 3944.4 11.0 18609.0 6036.5 11.0 18609.0 6036.5
18 Plot price/m2_win 34.0 14452.5 6098.3 3.0 25660.0 4365.0 3.0 25660.0 4365.0
Area size in m2 35.0 364.0 210.6 3.0 508.0 68.2 3.0 508.0 68.2
Plot Markup price/m2 34.0 14261.5 6079.1 3.0 25469.0 4365.0 3.0 25469.0 4365.0
19 Plot price/m2_win 76.0 13109.8 12149.7 4.0 19412.5 6524.7 4.0 19412.5 6524.7
Area size in m2 79.0 396.0 342.5 4.0 1255.0 470.3 4.0 1255.0 470.3
Plot Markup price/m2 76.0 12901.8 12107.5 4.0 19221.5 6524.7 4.0 19221.5 6524.7
20 Plot price/m2_win 163.0 13120.0 5224.0 27.0 12156.0 4509.9 27.0 12156.0 4509.9
Area size in m2 188.0 450.0 257.2 40.0 347.5 674.7 40.0 347.5 674.7
Plot Markup price/m2 163.0 12929.0 5223.5 27.0 11965.0 4509.9 27.0 11965.0 4509.9
21 Plot price/m2_win 72.0 16075.0 10353.8 10.0 11958.0 2861.8 10.0 11958.0 2861.8
Area size in m2 72.0 724.5 412.4 10.0 363.0 535.4 10.0 363.0 535.4
Plot Markup price/m2 72.0 15830.0 10339.7 10.0 11767.0 2861.8 10.0 11767.0 2861.8
22 Plot price/m2_win 111.0 13119.0 3383.7 12.0 12750.0 2505.6 12.0 12750.0 2505.6
Area size in m2 116.0 448.0 132.0 12.0 833.5 361.0 12.0 833.5 361.0
Plot Markup price/m2 111.0 12928.0 3383.7 12.0 12559.0 2505.6 12.0 12559.0 2505.6
23 Plot price/m2_win 84.0 13942.0 7171.6 7.0 5012.0 3291.3 7.0 5012.0 3291.3
Area size in m2 90.0 340.5 200.9 24.0 343.0 255.2 24.0 343.0 255.2
Plot Markup price/m2 84.0 13751.0 7155.3 7.0 4821.0 3291.3 7.0 4821.0 3291.3
24 Plot price/m2_win 57.0 16000.0 13822.7 27.0 9620.0 103068.3 27.0 9620.0 103068.3
Area size in m2 61.0 234.0 208.1 27.0 349.0 328.3 27.0 349.0 328.3
Plot Markup price/m2 57.0 15783.0 13729.2 27.0 9429.0 102553.1 27.0 9429.0 102553.1
Total Plot price/m2_win 1017.0 11619.0 8096.1 136.0 11185.5 56411.1 136.0 11185.5 56411.1
Area size in m2 1314.0 400.0 318.4 207.0 508.0 538.9 207.0 508.0 538.9
Plot Markup price/m2 1019.0 11412.0 8065.5 136.0 10994.5 56123.2 136.0 10994.5 56123.2
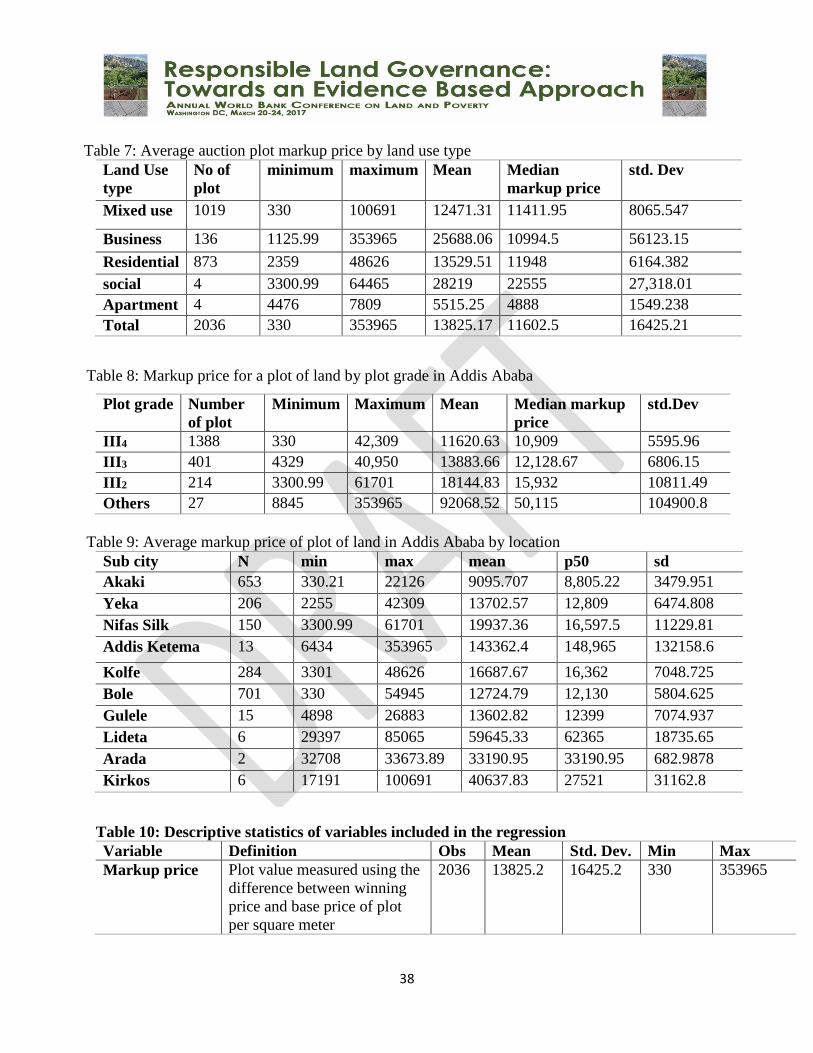
38
Table 7: Average auction plot markup price by land use type
Land Use
type
No of
plot
minimum maximum Mean Median
markup price
std. Dev
Mixed use 1019 330 100691 12471.31 11411.95 8065.547
Business 136 1125.99 353965 25688.06 10994.5 56123.15
Residential 873 2359 48626 13529.51 11948 6164.382
social 4 3300.99 64465 28219 22555 27,318.01
Apartment 4 4476 7809 5515.25 4888 1549.238
Total 2036 330 353965 13825.17 11602.5 16425.21
Table 8: Markup price for a plot of land by plot grade in Addis Ababa
Plot grade Number
of plot
Minimum Maximum Mean Median markup
price
std.Dev
III4 1388 330 42,309 11620.63 10,909 5595.96
III3 401 4329 40,950 13883.66 12,128.67 6806.15
III2 214 3300.99 61701 18144.83 15,932 10811.49
Others 27 8845 353965 92068.52 50,115 104900.8
Table 9: Average markup price of plot of land in Addis Ababa by location
Sub city N min max mean p50 sd
Akaki 653 330.21 22126 9095.707 8,805.22 3479.951
Yeka 206 2255 42309 13702.57 12,809 6474.808
Nifas Silk 150 3300.99 61701 19937.36 16,597.5 11229.81
Addis Ketema 13 6434 353965 143362.4 148,965 132158.6
Kolfe 284 3301 48626 16687.67 16,362 7048.725
Bole 701 330 54945 12724.79 12,130 5804.625
Gulele 15 4898 26883 13602.82 12399 7074.937
Lideta 6 29397 85065 59645.33 62365 18735.65
Arada 2 32708 33673.89 33190.95 33190.95 682.9878
Kirkos 6 17191 100691 40637.83 27521 31162.8
Table 10: Descriptive statistics of variables included in the regression
Variable Definition Obs Mean Std. Dev. Min Max
Markup price Plot value measured using the
difference between winning
price and base price of plot
per square meter
2036 13825.2 16425.2 330 353965
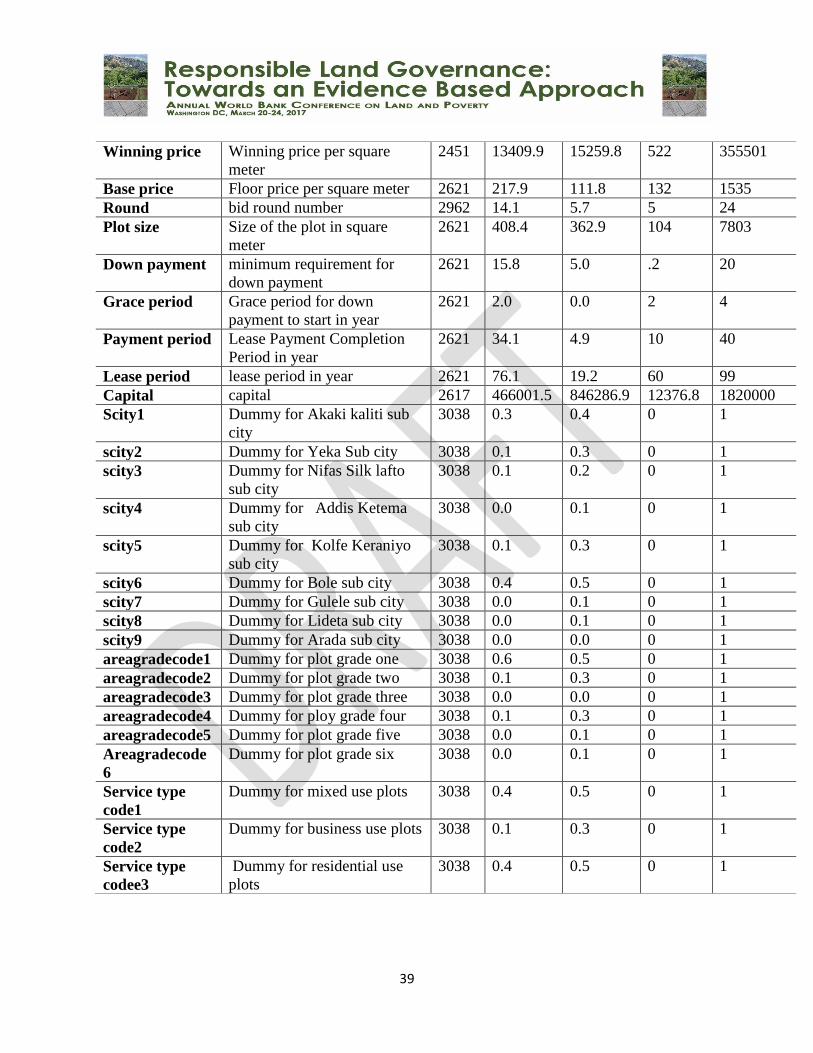
39
Winning price Winning price per square
meter
2451 13409.9 15259.8 522 355501
Base price Floor price per square meter 2621 217.9 111.8 132 1535
Round bid round number 2962 14.1 5.7 5 24
Plot size Size of the plot in square
meter
2621 408.4 362.9 104 7803
Down payment minimum requirement for
down payment
2621 15.8 5.0 .2 20
Grace period Grace period for down
payment to start in year
2621 2.0 0.0 2 4
Payment period Lease Payment Completion
Period in year
2621 34.1 4.9 10 40
Lease period lease period in year 2621 76.1 19.2 60 99
Capital capital 2617 466001.5 846286.9 12376.8 1820000
Scity1 Dummy for Akaki kaliti sub
city
3038 0.3 0.4 0 1
scity2 Dummy for Yeka Sub city 3038 0.1 0.3 0 1
scity3 Dummy for Nifas Silk lafto
sub city
3038 0.1 0.2 0 1
scity4 Dummy for Addis Ketema
sub city
3038 0.0 0.1 0 1
scity5 Dummy for Kolfe Keraniyo
sub city
3038 0.1 0.3 0 1
scity6 Dummy for Bole sub city 3038 0.4 0.5 0 1
scity7 Dummy for Gulele sub city 3038 0.0 0.1 0 1
scity8 Dummy for Lideta sub city 3038 0.0 0.1 0 1
scity9 Dummy for Arada sub city 3038 0.0 0.0 0 1
areagradecode1 Dummy for plot grade one 3038 0.6 0.5 0 1
areagradecode2 Dummy for plot grade two 3038 0.1 0.3 0 1
areagradecode3 Dummy for plot grade three 3038 0.0 0.0 0 1
areagradecode4 Dummy for ploy grade four 3038 0.1 0.3 0 1
areagradecode5 Dummy for plot grade five 3038 0.0 0.1 0 1
Areagradecode
6
Dummy for plot grade six 3038 0.0 0.1 0 1
Service type
code1
Dummy for mixed use plots 3038 0.4 0.5 0 1
Service type
code2
Dummy for business use plots 3038 0.1 0.3 0 1
Service type
codee3
Dummy for residential use
plots
3038 0.4 0.5 0 1
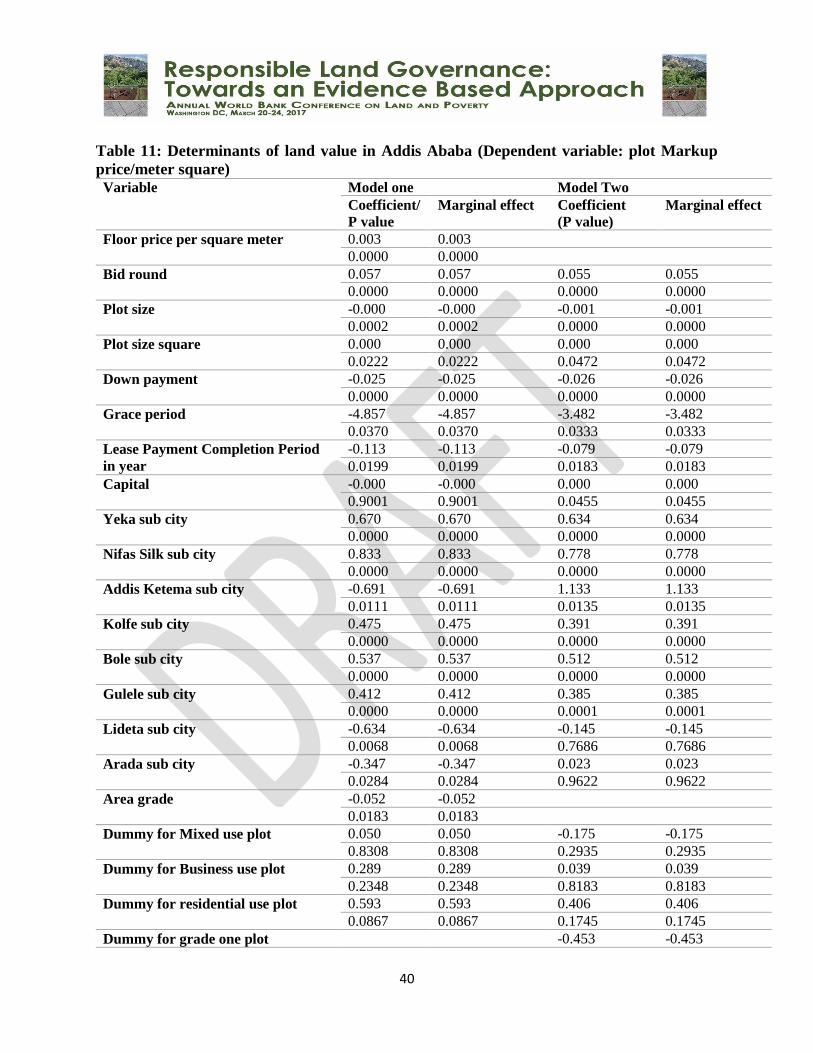
40
Table 11: Determinants of land value in Addis Ababa (Dependent variable: plot Markup
price/meter square)
Variable Model one Model Two
Coefficient/
P value
Marginal effect Coefficient
(P value)
Marginal effect
Floor price per square meter 0.003 0.003
0.0000 0.0000
Bid round 0.057 0.057 0.055 0.055
0.0000 0.0000 0.0000 0.0000
Plot size -0.000 -0.000 -0.001 -0.001
0.0002 0.0002 0.0000 0.0000
Plot size square 0.000 0.000 0.000 0.000
0.0222 0.0222 0.0472 0.0472
Down payment -0.025 -0.025 -0.026 -0.026
0.0000 0.0000 0.0000 0.0000
Grace period -4.857 -4.857 -3.482 -3.482
0.0370 0.0370 0.0333 0.0333
Lease Payment Completion Period
in year
-0.113 -0.113 -0.079 -0.079
0.0199 0.0199 0.0183 0.0183
Capital -0.000 -0.000 0.000 0.000
0.9001 0.9001 0.0455 0.0455
Yeka sub city 0.670 0.670 0.634 0.634
0.0000 0.0000 0.0000 0.0000
Nifas Silk sub city 0.833 0.833 0.778 0.778
0.0000 0.0000 0.0000 0.0000
Addis Ketema sub city -0.691 -0.691 1.133 1.133
0.0111 0.0111 0.0135 0.0135
Kolfe sub city 0.475 0.475 0.391 0.391
0.0000 0.0000 0.0000 0.0000
Bole sub city 0.537 0.537 0.512 0.512
0.0000 0.0000 0.0000 0.0000
Gulele sub city 0.412 0.412 0.385 0.385
0.0000 0.0000 0.0001 0.0001
Lideta sub city -0.634 -0.634 -0.145 -0.145
0.0068 0.0068 0.7686 0.7686
Arada sub city -0.347 -0.347 0.023 0.023
0.0284 0.0284 0.9622 0.9622
Area grade -0.052 -0.052
0.0183 0.0183
Dummy for Mixed use plot 0.050 0.050 -0.175 -0.175
0.8308 0.8308 0.2935 0.2935
Dummy for Business use plot 0.289 0.289 0.039 0.039
0.2348 0.2348 0.8183 0.8183
Dummy for residential use plot 0.593 0.593 0.406 0.406
0.0867 0.0867 0.1745 0.1745
Dummy for grade one plot -0.453 -0.453
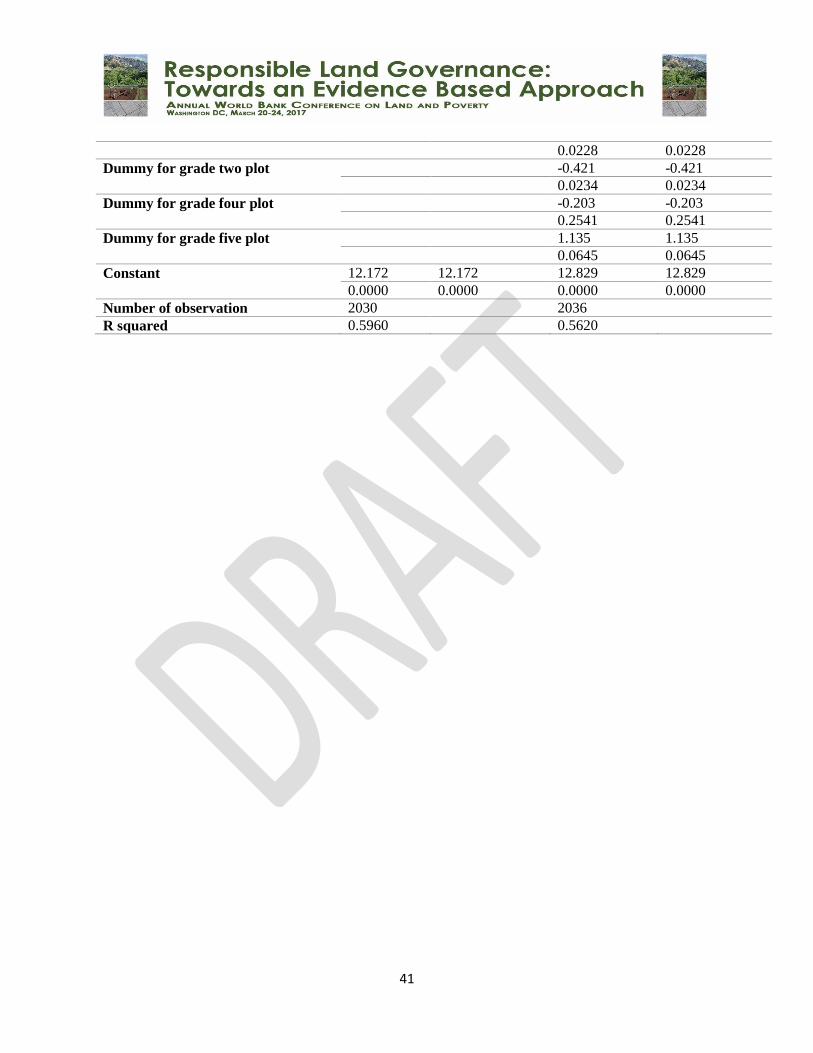
41
0.0228 0.0228
Dummy for grade two plot -0.421 -0.421
0.0234 0.0234
Dummy for grade four plot -0.203 -0.203
0.2541 0.2541
Dummy for grade five plot 1.135 1.135
0.0645 0.0645
Constant 12.172 12.172 12.829 12.829
0.0000 0.0000 0.0000 0.0000
Number of observation 2030 2036
R squared 0.5960 0.5620
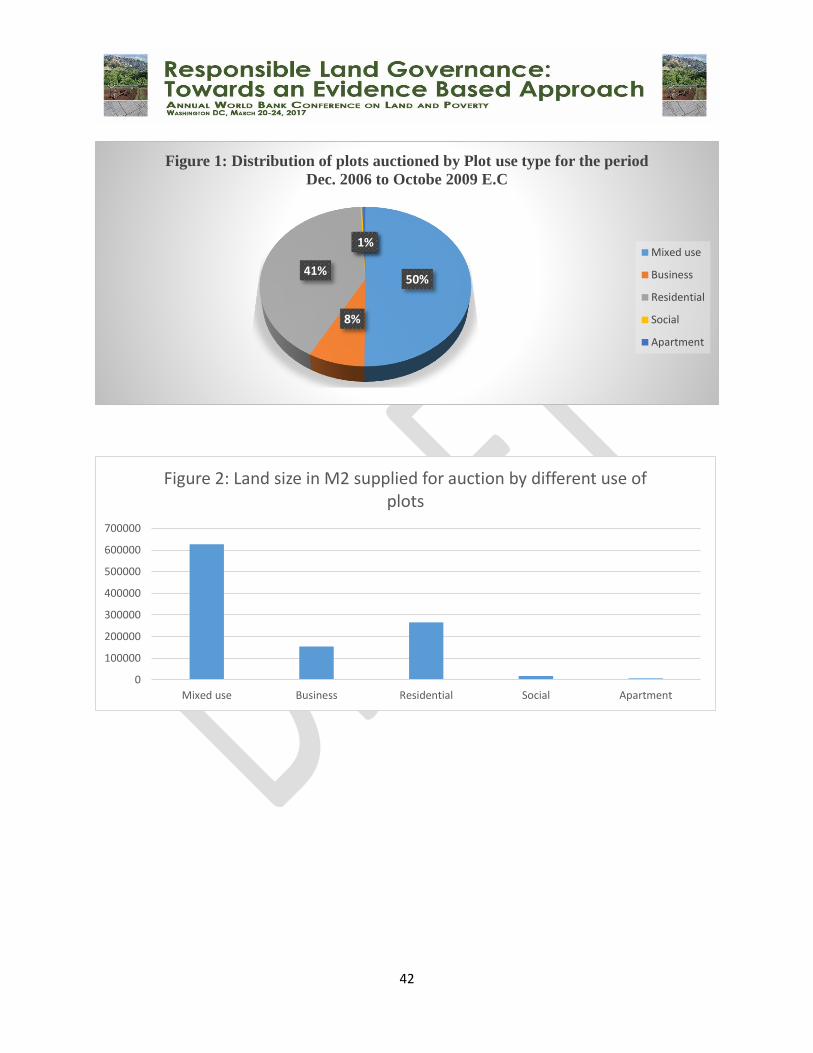
42
50%
8%
41%
0%1%
Figure 1: Distribution of plots auctioned by Plot use type for the period
Dec. 2006 to Octobe 2009 E.C
Mixed use
Business
Residential
Social
Apartment
0
100000
200000
300000
400000
500000
600000
700000
Mixed use Business Residential Social Apartment
Figure 2: Land size in M2 supplied for auction by different use of plots
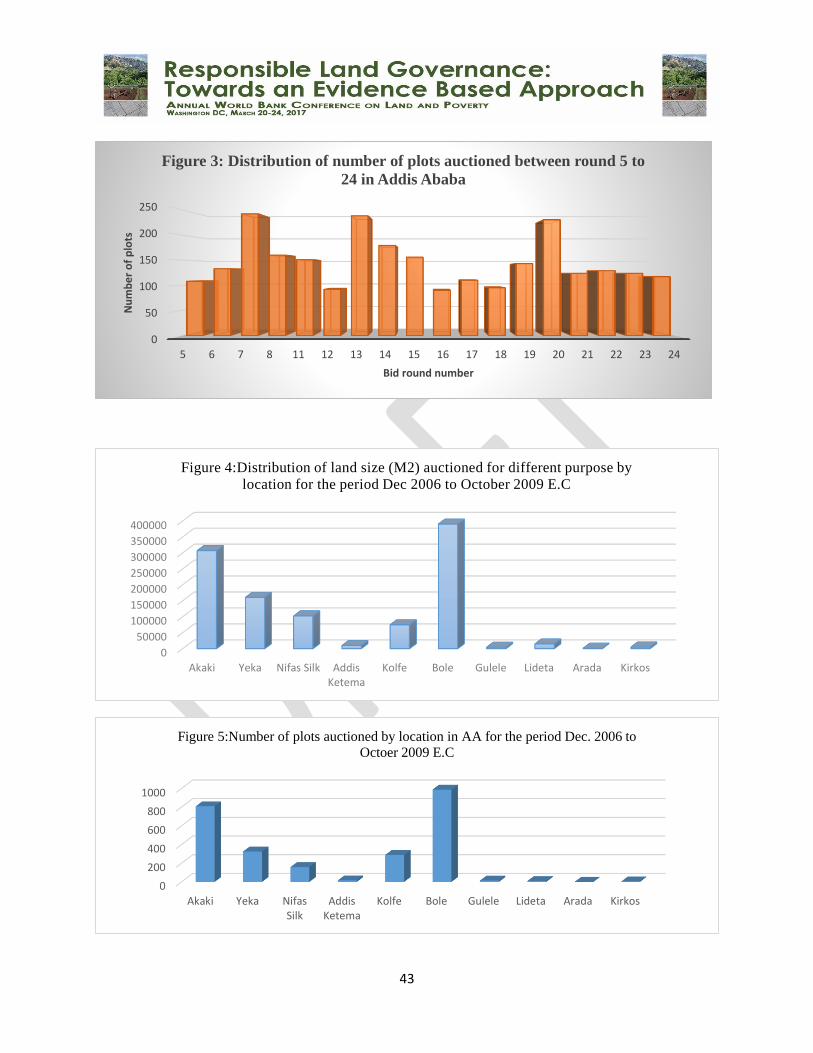
43
0
50
100
150
200
250
5 6 7 8 11 12 13 14 15 16 17 18 19 20 21 22 23 24
Nu
mb
er
of
plo
ts
Bid round number
Figure 3: Distribution of number of plots auctioned between round 5 to
24 in Addis Ababa
0
50000
100000
150000
200000
250000
300000
350000
400000
Akaki Yeka Nifas Silk AddisKetema
Kolfe Bole Gulele Lideta Arada Kirkos
Figure 4:Distribution of land size (M2) auctioned for different purpose by
location for the period Dec 2006 to October 2009 E.C
0
200
400
600
800
1000
Akaki Yeka NifasSilk
AddisKetema
Kolfe Bole Gulele Lideta Arada Kirkos
Figure 5:Number of plots auctioned by location in AA for the period Dec. 2006 to
Octoer 2009 E.C
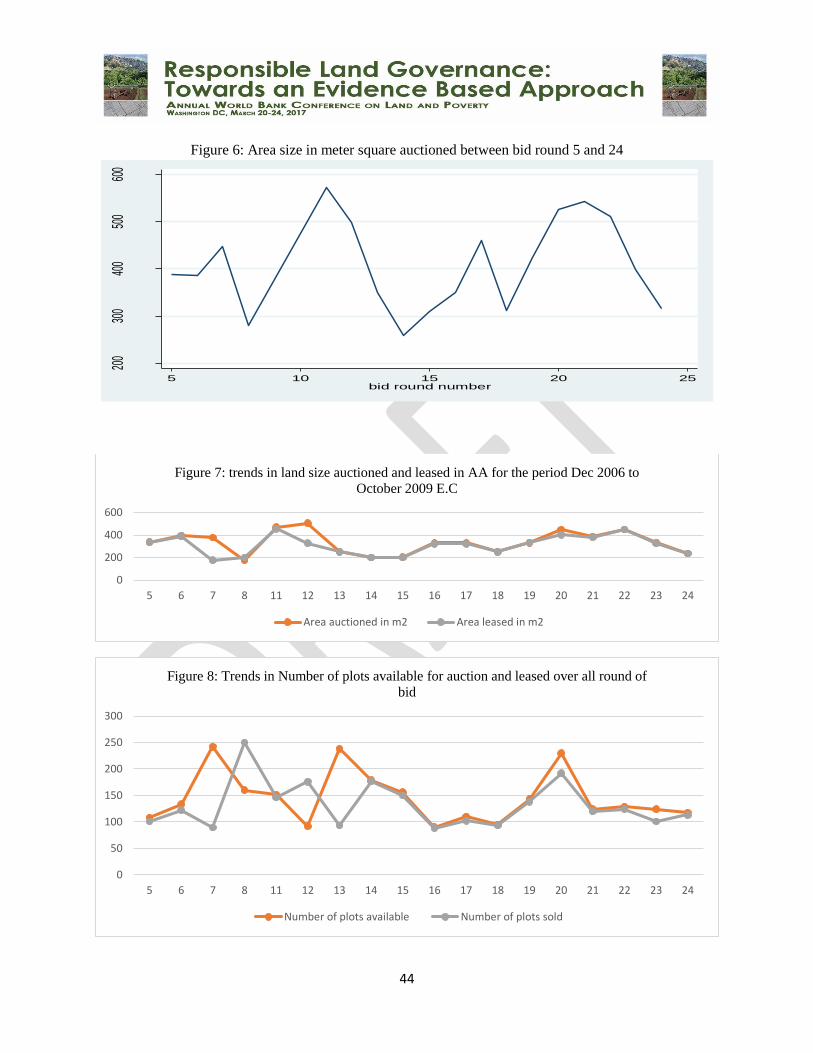
44
Figure 6: Area size in meter square auctioned between bid round 5 and 24
200
300
400
500
600
area
ssize
_m
5 10 15 20 25bid round number
0
200
400
600
5 6 7 8 11 12 13 14 15 16 17 18 19 20 21 22 23 24
Figure 7: trends in land size auctioned and leased in AA for the period Dec 2006 to
October 2009 E.C
Area auctioned in m2 Area leased in m2
0
50
100
150
200
250
300
5 6 7 8 11 12 13 14 15 16 17 18 19 20 21 22 23 24
Figure 8: Trends in Number of plots available for auction and leased over all round of
bid
Number of plots available Number of plots sold
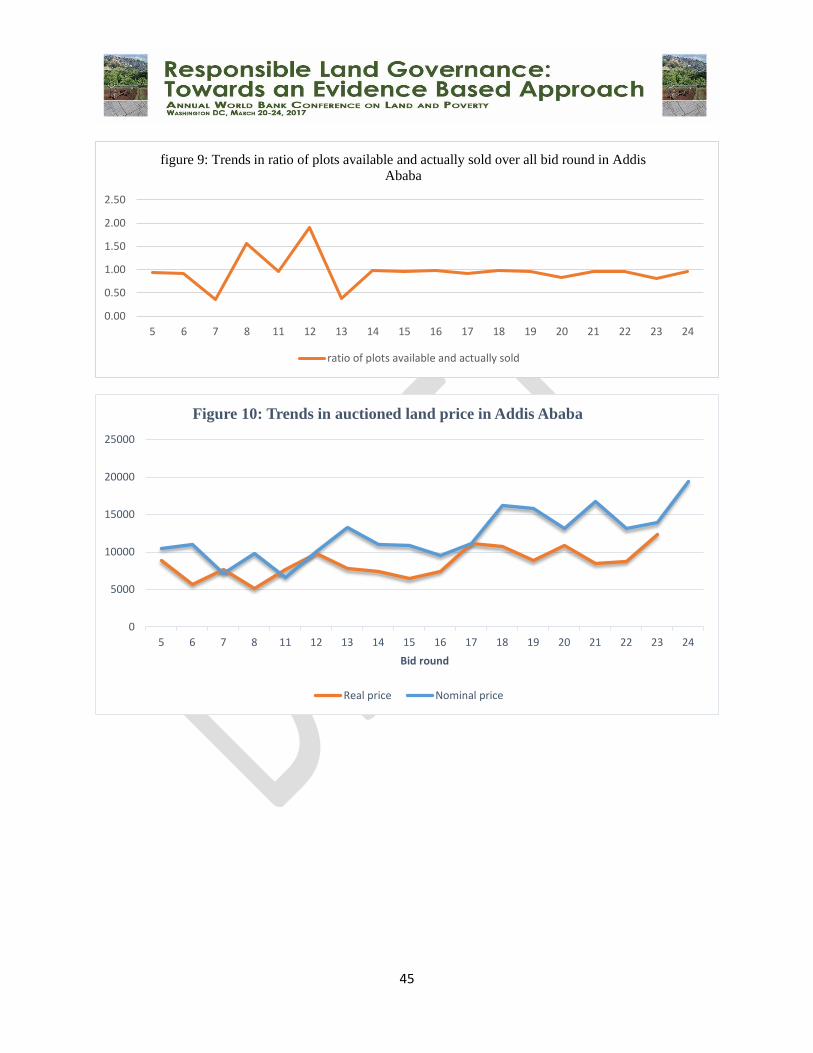
45
0.00
0.50
1.00
1.50
2.00
2.50
5 6 7 8 11 12 13 14 15 16 17 18 19 20 21 22 23 24
figure 9: Trends in ratio of plots available and actually sold over all bid round in Addis
Ababa
ratio of plots available and actually sold
0
5000
10000
15000
20000
25000
5 6 7 8 11 12 13 14 15 16 17 18 19 20 21 22 23 24
Bid round
Figure 10: Trends in auctioned land price in Addis Ababa
Real price Nominal price
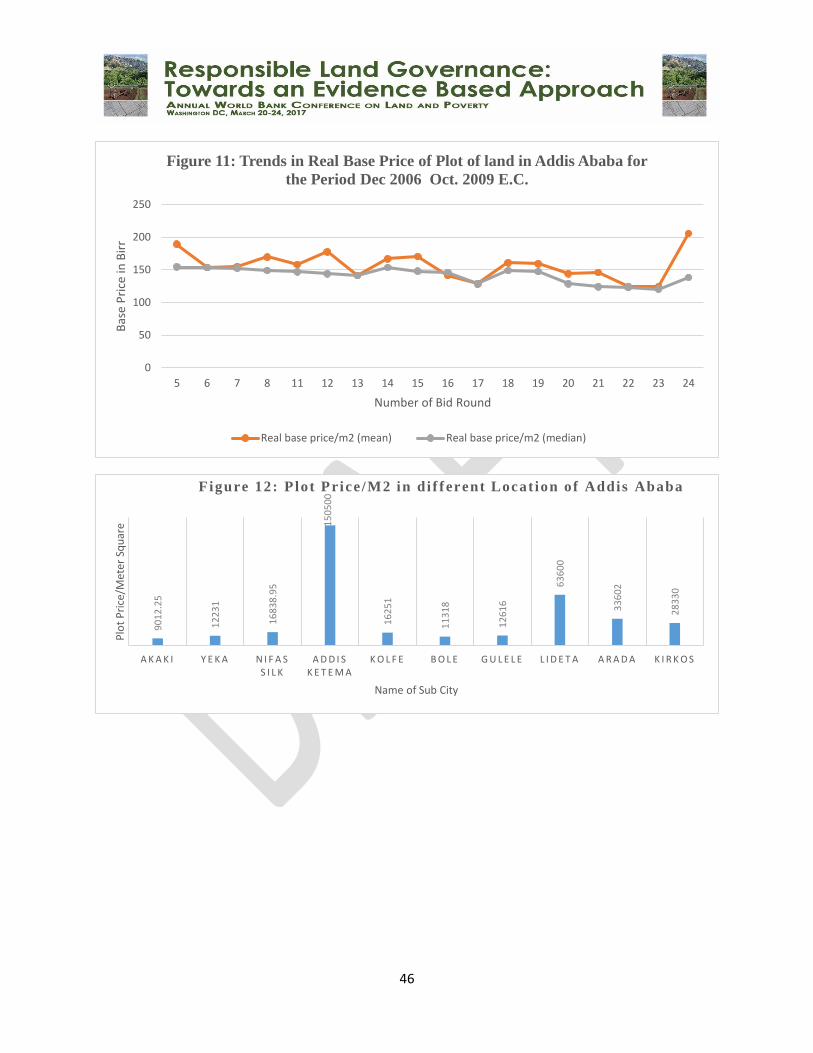
46
0
50
100
150
200
250
5 6 7 8 11 12 13 14 15 16 17 18 19 20 21 22 23 24
Bas
e P
rice
in B
irr
Number of Bid Round
Figure 11: Trends in Real Base Price of Plot of land in Addis Ababa for
the Period Dec 2006 Oct. 2009 E.C.
Real base price/m2 (mean) Real base price/m2 (median)
90
12
.25
12
23
1
16
83
8.9
5
15
05
00
16
25
1
11
31
8
12
61
6
63
60
0
33
60
2
28
33
0
A K A K I Y E K A N I F A S S I L K
A D D I S K E T E M A
K O L F E B O L E G U L E L E L I D E T A A R A D A K I R K O S
Plo
t P
rice
/Met
er S
qu
are
Name of Sub City
Figure 12: P lot Price /M2 in di f f erent Locat ion of Addis Ababa
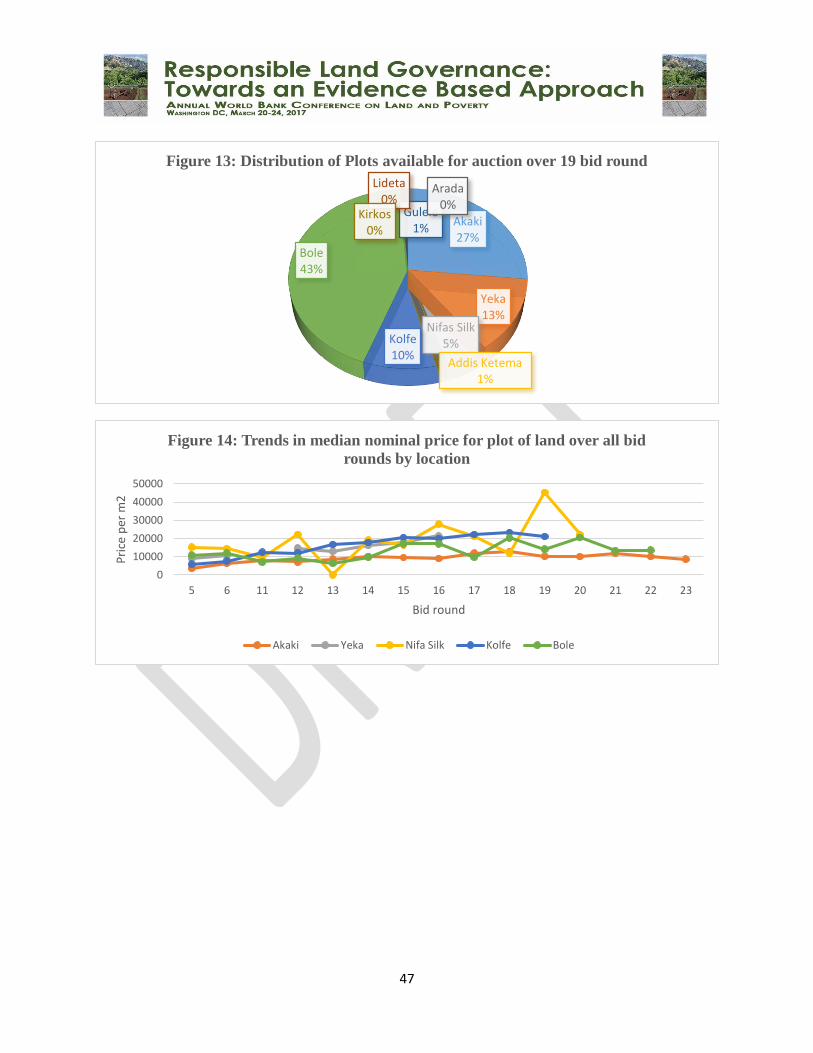
47
Akaki27%
Yeka13%
Nifas Silk5%
Addis Ketema1%
Kolfe10%
Bole43%
Gulele1%
Lideta0%
Arada0%
Kirkos0%
Figure 13: Distribution of Plots available for auction over 19 bid round
0
10000
20000
30000
40000
50000
5 6 11 12 13 14 15 16 17 18 19 20 21 22 23
Pri
ce p
er m
2
Bid round
Figure 14: Trends in median nominal price for plot of land over all bid
rounds by location
Akaki Yeka Nifa Silk Kolfe Bole
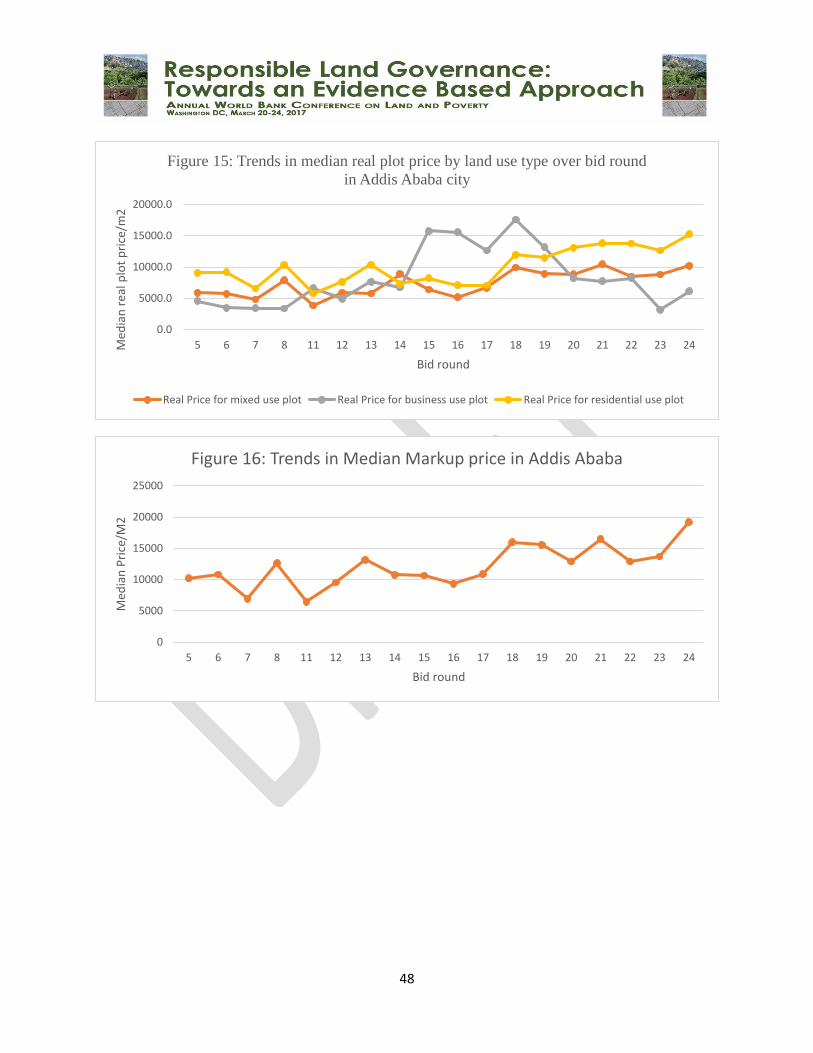
48
0.0
5000.0
10000.0
15000.0
20000.0
5 6 7 8 11 12 13 14 15 16 17 18 19 20 21 22 23 24Med
ian
rea
l plo
t p
rice
/m2
Bid round
Figure 15: Trends in median real plot price by land use type over bid round
in Addis Ababa city
Real Price for mixed use plot Real Price for business use plot Real Price for residential use plot
0
5000
10000
15000
20000
25000
5 6 7 8 11 12 13 14 15 16 17 18 19 20 21 22 23 24
Med
ian
Pri
ce/M
2
Bid round
Figure 16: Trends in Median Markup price in Addis Ababa
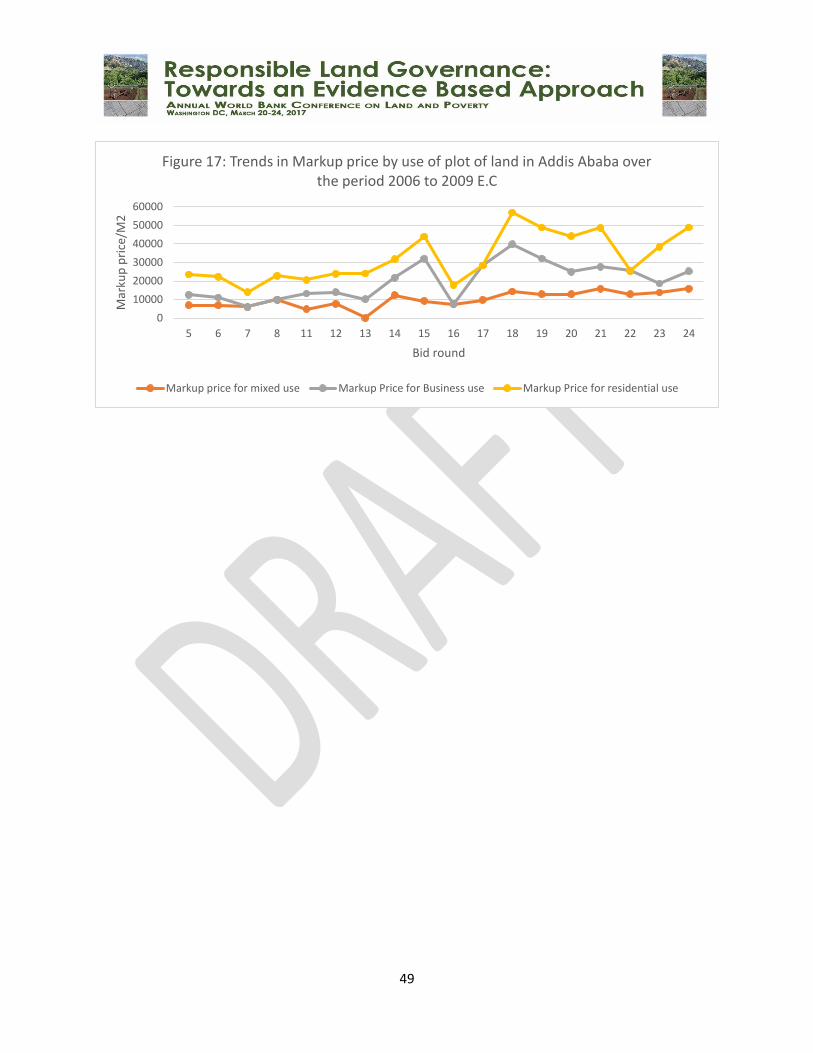
49
0
10000
20000
30000
40000
50000
60000
5 6 7 8 11 12 13 14 15 16 17 18 19 20 21 22 23 24
Mar
kup
pri
ce/M
2
Bid round
Figure 17: Trends in Markup price by use of plot of land in Addis Ababa over the period 2006 to 2009 E.C
Markup price for mixed use Markup Price for Business use Markup Price for residential use