Alcohol-attributable burden of disease and injury in New ... · Health Organization Global Burden...
179
i Alcohol-attributable burden of disease and injury in New Zealand: 2004 and 2007 Research report commissioned by the Health Promotion Agency July 2013
Transcript of Alcohol-attributable burden of disease and injury in New ... · Health Organization Global Burden...

i
Alcohol-attributable burden of disease and injury in New Zealand:
2004 and 2007
Research report commissioned by the Health Promotion Agency
July 2013

ii
Authors: Jennie Connor and Robyn Kydd (Department of Preventive and Social Medicine, University
of Otago), Kevin Shield and Jürgen Rehm (Centre for Addiction and Mental Health, Toronto; World
Health Organization Global Burden of Disease 2010 Risk Factors Collaborating Group).
ISBN: 978-1-927224-47-2 (print)
978-1-927224-48-9 (online)
Citation
Connor, J.,Kydd,R.,Shield,K.,Rehm, J. (2013). Alcohol-attributable burden of
disease and injury in New Zealand: 2004 and 2007, Research report commissioned by the
Health Promotion Agency. Wellington: Health Promotion Agency.
This document is available at: www.hpa.org.nz
Any queries regarding this report can be directed to the HPA at the following address:
Health Promotion Agency
Level 4, ASB House
101 The Terrace
Wellington 6011
PO Box 2142
Wellington 6140
New Zealand
June 2013

iii
ACKNOWLEDGEMENTS
The assistance of the following people is gratefully acknowledged: Sally Casswell, Taisia Huckle and
Ryan You (Centre for Social and Health Outcomes Research and Evaluation); Michael Roerecke,
Jayadeep Patra and Benjamin Taylor (Centre for Addiction and Mental Health, Toronto); and Deepa
Weerasekera, Niki Stefanogiannis, Jesse Kokaua and Chris Lewis (Ministry of Health).
Datasets and estimates were provided by: Centre for Social and Health Outcomes Research and
Evaluation (2003/04 Health Behaviours Survey – Alcohol Use; 2008/09 Alcohol’s Harm to Others
Survey); Ministry of Health (2007/08 New Zealand Alcohol and Drug Use Survey; 2006/07 New
Zealand Health Survey; 2007 and 2004 New Zealand mortality data; Te Rau Hinengaro: 2003/04 New
Zealand Mental Health Survey); and the Global Burden of Disease 2010 Risk Factors Collaborating
Group (relative risks for alcohol-attributable conditions; modelled injury alcohol-attributable fractions;
YLD estimates).
This study was commissioned by the Alcohol Advisory Council of New Zealand.a
DISCLAIMER
The observations, analysis, and viewpoints expressed in this report remain those of the authors and
shall not be attributed to the HPA.
a Since 1 July 2012 all the functions of the Alcohol Advisory Council (ALAC) have been carried out by the Health Promotion Agency (HPA).
iv
Table of Contents
ACKNOWLEDGEMENTS ...................................................................................................................... III
LIST OF FIGURES .............................................................................................................................. VII
LIST OF TABLES ............................................................................................................................... VIII
EXECUTIVE SUMMARY ........................................................................................................................ 1
INTRODUCTION ..................................................................................................................................... 9
METHODS: ALCOHOL-ATTRIBUTABLE MORTALITY (2004 & 2007) .............................................. 10
Summary .......................................................................................................................................... 10
Alcohol-attributable conditions and injuries ............................................................................... 12 Alcohol-related conditions .............................................................................................................. 12
Cardiovascular disorders ......................................................................................................... 14 Digestive disorders ................................................................................................................... 15
Alcohol-related injuries .................................................................................................................. 16
Mortality and alcohol consumption data ...................................................................................... 18 Population subgroups examined ................................................................................................... 18
Age groups ............................................................................................................................... 18 Ethnicity classification (Māori/non-Māori) ................................................................................ 18
New Zealand data .......................................................................................................................... 18 Mortality .................................................................................................................................... 18 Alcohol consumption categories used for analyses ................................................................. 19 Alcohol consumption estimates ............................................................................................... 20
Mortality alcohol-attributable fractions (AAFs) ........................................................................... 33 AAF calculation methods (by age/sex/ethnicity) ............................................................................ 34
AAFs for wholly alcohol-attributable conditions and injuries .................................................... 34 AAFs for partially alcohol-attributable conditions ..................................................................... 34 AAFs for partially alcohol-attributable injuries .......................................................................... 39
Mortality AAF estimates ................................................................................................................. 41 Alcohol-attributable condition AAFs ......................................................................................... 41 Alcohol-attributable injury AAFs ............................................................................................... 41
Calculating alcohol-attributable deaths and years of life lost (YLLs) ....................................... 48 Alcohol-attributable deaths ............................................................................................................ 48 Alcohol-attributable years of life lost (YLLs) .................................................................................. 48
METHODS: ALCOHOL-ATTRIBUTABLE DALYS (2004) ................................................................... 49
Summary .......................................................................................................................................... 49
Disability-adjusted life years (DALYs) .......................................................................................... 49
Differences in alcohol-attributable condition and injury categories between mortality and DALY analyses ................................................................................................................................ 50
Laryngeal cancer, cardiac arrhythmias, oesophageal varices, cholelithiasis, pancreatitis, and fetal alcohol syndrome ................................................................................................................... 50 Unipolar depressive disorders ....................................................................................................... 51 Stroke, ischaemic or haemorrhagic ............................................................................................... 51 Colon and rectum cancer ............................................................................................................... 52

v
Cirrhosis of the liver ....................................................................................................................... 53 Lower respiratory infections ........................................................................................................... 53 Poisonings ..................................................................................................................................... 53
Burden of disease and injury data ................................................................................................ 54 Population subgroups examined ................................................................................................... 54 New Zealand estimates (alcohol consumption and YLLs) ............................................................. 54
Alcohol consumption ................................................................................................................ 54 YLLs ......................................................................................................................................... 56
World Health Organization estimates ............................................................................................ 56 Deaths and YLLs ...................................................................................................................... 56 YLDs......................................................................................................................................... 57
Mortality and morbidity alcohol-attributable fractions (AAFs): For calculating alcohol-attributable DALYs .......................................................................................................................... 57
AAF calculation methods (by age/sex) .......................................................................................... 58 Wholly alcohol-attributable conditions and injuries .................................................................. 58 Partially alcohol-attributable conditions .................................................................................... 58 Partially alcohol-attributable injuries ........................................................................................ 60
Morbidity AAF estimates ................................................................................................................ 61 Alcohol-attributable condition and injury AAFs ......................................................................... 61
Calculating alcohol-attributable disability-adjusted life years (DALYs) .................................... 61
METHODOLOGICAL DEVELOPMENTS ............................................................................................. 64
Alcohol-attributable conditions ..................................................................................................... 64
Alcohol consumption estimates ................................................................................................... 64
Alcohol-attributable fraction calculations .................................................................................... 64 Unipolar depressive disorders ....................................................................................................... 64 Relative risk estimates ................................................................................................................... 65 Morbidity AAF estimates ................................................................................................................ 65 Incorporating drinking patterns into AAF calculations .................................................................... 66
2007 MORTALITY RESULTS ............................................................................................................... 69
Overview .......................................................................................................................................... 69
Mortality by sex (2007) ................................................................................................................... 69 Deaths ............................................................................................................................................ 69 Years of life lost .............................................................................................................................. 70
Mortality by sex/ethnicity subgroup (2007) .................................................................................. 72 Deaths ............................................................................................................................................ 72 Years of life lost .............................................................................................................................. 76
Mortality by age/sex subgroup (2007) .......................................................................................... 77 Deaths ............................................................................................................................................ 77
Mortality by age/ethnicity subgroup (2007) .................................................................................. 81 Deaths ............................................................................................................................................ 81 Years of life lost .............................................................................................................................. 82
Mortality by age/sex/ethnicity subgroup (2007) .......................................................................... 84
2004 MORTALITY RESULTS (BRIEF SUMMARY) ............................................................................. 85

vi
Overview .......................................................................................................................................... 85 Deaths ............................................................................................................................................ 85 YLLs ............................................................................................................................................... 88
2004 DISABILITY-ADJUSTED LIFE YEARS (DALYS) RESULTS ..................................................... 89
Overview .......................................................................................................................................... 89
DALYs by sex (2004) ....................................................................................................................... 89
DALYs by age/sex subgroup (2004) .............................................................................................. 96
Unipolar depressive disorders: Sensitivity analysis (2004) ..................................................... 100
DISCUSSION ...................................................................................................................................... 103
Key findings .................................................................................................................................. 103 2007 Alcohol-attributable mortality .............................................................................................. 103 2004 Alcohol-attributable disability-adjusted life years (DALYs) ................................................. 105
Study limitations ........................................................................................................................... 106
Comparison with previous analyses .......................................................................................... 110
Public health implications ........................................................................................................... 112
GLOSSARY OF ACRONYMS AND TERMS ...................................................................................... 115
APPENDICES ................................................................................................................................... 1168
Appendix A. Detailed information on ICD-10 codes and impact of alcohol for alcohol-related conditions listed in Table 1. ............................................................................................ 117
Appendix B. Variations from ICD codes used by Taylor et al.74 for alcohol-attributable injury calculations. ....................................................................................................................... 119
Appendix C. The effect of using alternative injury AAFs calculated by the Global Burden of Disease 2010 Risk Factors Collaborating Group: A sensitivity analysis. .......................... 120
Appendix D. Sample sizes and response rates for surveys with information about drinking during pregnancy. ......................................................................................................... 138
Appendix E. Estimates used to calculate the alcohol-attributable fractions for ischaemic heart disease by New Zealand age/sex/ethnicity subgroup. .................................................... 139
Appendix F. Proportions of deaths in the overall GBD ‘lower respiratory infections’ category that were due to partially alcohol-attributable causes. ............................................. 145
Appendix G. 2004 deaths in selected categories as reported by Statistics New Zealand and estimated by the World Health Organization: Total New Zealand population. ............... 146
Appendix H. Alcohol-attributable deaths by age/sex/ethnicity subgroup and cause (2004). ............................................................................................................................................. 147
Appendix I. Further results for 2004 alcohol-attributable mortality. ....................................... 151
REFERENCES .................................................................................................................................... 165

vii
LIST OF FIGURES
Figure 1: Sex and ethnic disparities were observed in the alcohol-attributable mortality
burden ........................................................................................................................................... 3
Figure 2: Population standardised alcohol-attributable deaths per 100,000 people, by sex
and ethnicity (0–79 years; 2007). .............................................................................................. 73
Figure 3: Number of condition and injury deaths attributable to alcohol consumption, by
age and sex (2007)...................................................................................................................... 79
Figure 4: Males: Causes of alcohol-attributable deaths, by age (2007). ....................................... 80
Figure 5: Females: Causes of alcohol-attributable deaths, by age (2007). ................................... 80
Figure 6: Number of Māori deaths caused and prevented by alcohol consumption, by age
(2007). .......................................................................................................................................... 81
Figure 7: Number of non-Māori deaths caused and prevented by alcohol consumption, by
age (2007). ................................................................................................................................... 82
Figure 8: Number of Māori YLLs caused and prevented by alcohol consumption, by age
(2007). .......................................................................................................................................... 82
Figure 9: Number of non-Māori YLLs caused and prevented by alcohol consumption, by
age (2007). ................................................................................................................................... 83
Figure 10: Age-specific rates of years of life lost due to alcohol consumption, by sex and
ethnicity (2007). .......................................................................................................................... 84
Figure 11: Age-specific rates of years of life lost due to alcohol consumption, by sex and
ethnicity (2004). .......................................................................................................................... 88
Figure 12: Males: Number of DALYs lost due to alcohol consumption, by cause category
(0–79 years; 2004). ..................................................................................................................... 93
Figure 13: Females: Number of DALYs lost due to alcohol consumption, by cause category
(0–79 years; 2004). ..................................................................................................................... 93
Figure 14: Males: 10 leading causes of DALYs lost due to alcohol consumption in New
Zealand (0–79 years; 2004). ....................................................................................................... 95
Figure 15: Females: 10 leading causes of DALYs lost due to alcohol consumption in New
Zealand (0–79 years; 2004). ....................................................................................................... 95
Figure 16: Number of male DALYs caused and prevented by alcohol consumption, by age
(2004). .......................................................................................................................................... 98
Figure 17: Number of female DALYs caused and prevented by alcohol consumption, by
age (2004). ................................................................................................................................... 98
Figure 18: Males: Causes of alcohol-attributable DALYs, by age (2004). ..................................... 99
Figure 19: Females: Causes of alcohol-attributable DALYs, by age (2004). ................................. 99

viii
LIST OF TABLES
Table 1: Top five causes of alcohol-attributed (AA) deaths (0-79 years; New Zealand 2007) ....... 5
Table 2: Top five causes of alcohol-attributable disability-adjusted life years (AA DALYs)
lost (0-79 years; New Zealand 2004). .......................................................................................... 6
Table 3: Categories of alcohol-related (non-injury) conditions. .................................................... 13
Table 4: New Zealand-based estimates of the proportion of fatal stroke subtypes, by age
and sex. ....................................................................................................................................... 15
Table 5: Wpr-A subregion estimates of the proportion of fatal stroke subtypes, by age. .......... 15
Table 6: Categories of alcohol-related injuries. ............................................................................... 17
Table 7: Estimated average volume of alcohol consumption for Māori and non-Māori males
(%), New Zealand 2004. .............................................................................................................. 21
Table 8. Estimated average volume of alcohol consumption for Māori and non-Māori
females (%), New Zealand 2004. ............................................................................................... 22
Table 9. Estimated average volume of alcohol consumption for Māori and non-Māori males
(%), New Zealand 2007. .............................................................................................................. 23
Table 10: Estimated average volume of alcohol consumption for Māori and non-Māori
females (%), New Zealand 2007. ............................................................................................... 24
Table 11: Estimated average volume of alcohol consumption during pregnancy for Māori
and non-Māori females (%), New Zealand 2004 and 2007. ..................................................... 30
Table 12: Categories of alcohol consumption data required for ischaemic heart disease
AAF calculations. ....................................................................................................................... 31
Table 13: Mortality relative risks for partially alcohol-attributable (non-injury) conditions,
excluding ischaemic heart disease. ......................................................................................... 36
Table 14: Mortality relative risks for ischaemic heart disease. ...................................................... 39
Table 15: 2004 mortality AAFs for (non-injury) conditions: Māori population. ............................ 42
Table 16: 2004 mortality AAFs for (non-injury) conditions: Non-Māori population. .................... 43
Table 17: 2007 mortality AAFs for (non-injury) conditions: Māori population. ............................ 44
Table 18: 2007 mortality AAFs for (non-injury) conditions: Non-Māori population.* ................... 45
Table 19: 2004 and 2007 mortality AAFs for injuries: Māori population. ...................................... 46
Table 20: 2004 and 2007 mortality AAFs for injuries: Non-Māori population. .............................. 47
Table 21: New Zealand-based estimates of the proportion of non-fatal stroke subtypes, by
age and sex. ................................................................................................................................ 51
Table 22: Wpr-A subregion estimates of the proportion of non-fatal stroke subtypes, by
age. .............................................................................................................................................. 52
Table 23: Proportions of incident cases of colon and rectum cancer for New Zealand, by
age and sex (2004)...................................................................................................................... 52
Table 24: Estimated average volume of alcohol consumption for New Zealand males and
females (%), 2004........................................................................................................................ 55
Table 25: Estimated average volume of alcohol consumption during pregnancy for New
Zealand females (%), 2004. ........................................................................................................ 56

ix
Table 26: Morbidity relative risks for partially alcohol-attributable (non-injury) conditions,
excluding ischaemic heart disease. ......................................................................................... 59
Table 27: Morbidity relative risks for ischaemic heart disease. ..................................................... 59
Table 28: 12-month prevalence of alcohol dependence for New Zealand (%), by age and sex
(2003/04). ..................................................................................................................................... 60
Table 29: 2004 morbidity AAFs for (non-injury) conditions: Total New Zealand population. ..... 62
Table 30: 2004 morbidity AAFs for injuries: Total New Zealand population. ............................... 63
Table 31: Top five causes of alcohol-attributable (AA) deaths, by sex (0–79 years; 2007). ........ 70
Table 32: Alcohol-attributable deaths due to cancer, other conditions, and injuries; by sex
(0–79 years; 2007). ..................................................................................................................... 70
Table 33: Male and female deaths prevented by alcohol consumption, by condition (0–79
years; 2007). ................................................................................................................................ 70
Table 34: Top five causes of alcohol-attributable years of life lost (AA YLLs), by sex (0–79
years; 2007). ................................................................................................................................ 71
Table 35: Alcohol-attributable YLLs due to cancer, other conditions, and injuries; by sex
(0–79 years; 2007). ..................................................................................................................... 71
Table 36: Male and female YLLs prevented by alcohol consumption, by condition (0–79
years; 2007). ................................................................................................................................ 71
Table 37: Top five causes of alcohol-attributable (AA) deaths, by sex and ethnicity (0–79
years; 2007). ................................................................................................................................ 72
Table 38: Alcohol-attributable deaths caused and prevented, by sex and ethnicity (0–79
years; 2007). ................................................................................................................................ 73
Table 39: Alcohol-attributable (AA) condition and injury deaths, by sex and ethnicity (0–79
years; 2007). ................................................................................................................................ 74
Table 40: Number of alcohol-attributable deaths for each condition and injury category, by
sex and ethnicity (0–79 years; 2007). ....................................................................................... 75
Table 41: Top five causes of alcohol-attributable years of life lost (AA YLLs), by sex and
ethnicity (0–79 years; 2007). ...................................................................................................... 76
Table 42: Alcohol-attributable years of life lost (YLLs) caused and prevented, by sex and
ethnicity (0–79 years; 2007). ...................................................................................................... 76
Table 43: Top five causes of alcohol-attributable (AA) deaths, by age and sex (2007). .............. 78
Table 44: Alcohol-attributable (AA) condition and injury deaths, by age and sex (2007). .......... 79
Table 45: Māori and non-Māori alcohol-attributable death rates, by age (2007). ......................... 82
Table 46: Number of alcohol-attributable deaths and years of life lost (YLLs); by age, sex
and ethnicity (2007). ................................................................................................................... 84
Table 47: Top five causes of alcohol-attributable (AA) deaths, by sex (0–79 years; 2004). ........ 85
Table 48: Alcohol-attributable deaths due to cancer, other conditions, and injuries; by sex
(0–79 years; 2004). ..................................................................................................................... 86
Table 49: Male and female deaths prevented by alcohol consumption, by condition (0–79
years; 2004). ................................................................................................................................ 86
Table 50: Top five causes of alcohol-attributable (AA) deaths, by age and sex (2004). .............. 87
Table 51: Alcohol-attributable disability-adjusted life years (AA DALYs) lost and prevented,
by sex (0–79 years; 2004). ......................................................................................................... 90

x
Table 52: Top five causes of alcohol-attributable disability-adjusted life years (AA DALYs)
lost, by sex (0–79 years; 2004). ................................................................................................. 90
Table 53: Alcohol-attributable DALYs lost due to cancer, other conditions, and injuries, by
sex (0–79 years; 2004). .............................................................................................................. 91
Table 54: Male and female DALYs prevented by alcohol consumption, by condition (0–79
years; 2004). ................................................................................................................................ 91
Table 55: Number of alcohol-attributable DALYs lost for each condition and injury
category, by sex (0–79 years; 2004). ........................................................................................ 94
Table 56: Top five causes of alcohol-attributable disability-adjusted life years (AA DALYs)
lost, by age and sex (2004). ....................................................................................................... 96
Table 57: Alcohol-attributable (AA) condition and injury DALYs lost, by age and sex (2004). .. 97
Table 58: Comparison of depression sensitivity analysis and main analysis: Alcohol-
attributable disability-adjusted life years (AA DALYs) lost, by sex (0–79 years; 2004). ... 100
Table 59: Comparison of depression sensitivity analysis and main analysis: Alcohol-
attributable disability-adjusted life years (AA DALYs) lost, by age and sex (2004). ......... 101
Table 60: Depression sensitivity analysis: Top five causes of alcohol-attributable disability-
adjusted life years (AA DALYs) lost in 15–29 year olds, by sex (2004). ............................. 101
Table 61: Depression sensitivity analysis: Top five causes of alcohol-attributable years
lived with disability (AA YLDs), by sex (0–79 years; 2004). ................................................. 102
Table 62: Depression sensitivity analysis: Top five causes of alcohol-attributable years
lived with disability (AA YLDs) in 15-44 year olds, by sex (2004). ...................................... 102

1
EXECUTIVE SUMMARY
INTRODUCTION
Estimates of the 2000/02 burden of death and disability due to alcohol consumption in New
Zealanders1 have been used widely by researchers and policymakers. In the eight years since the
previous estimates were published, more recent alcohol consumption data and burden estimation
methods have become available. This report, Alcohol-attributable burden of disease and injury in
New Zealand: 2004 and 2007, responds to the need for revised New Zealand estimates of death
and disability due to alcohol consumption.
The report is organised as follows:
Methods used to estimate the burden of death (2004 and 2007) and the burden of
death and disability (2004) due to alcohol consumption in New Zealanders aged 0–
79 years.
Developments in methods since the previous New Zealand burden of alcohol report
(NZBoA2000/02).
Deaths in 2004 and 2007 due to alcohol consumption, estimated as deaths and
years of life lost (YLLs) by age/sex/ethnicity (Māori/non-Māori) subgroups.
Combined death and disability in 2004 due to alcohol consumption, estimated as
disability-adjusted life years (DALYs) by age/sex subgroup.
Key findings, limitations, comparisons with previous analyses, and public health
implications.
METHODS
We used World Health Organization (WHO) comparative risk assessment (CRA) methods to measure
the impact of alcohol on the health of New Zealanders. The contribution of alcohol consumption to the
health burden was quantified for each age/sex/ethnicity subgroup and alcohol-related condition/injury
with alcohol-attributable fractions (AAFs) that were calculated by combining New Zealand alcohol
consumption data with the best available risk estimates. The mortality and morbidity AAFs estimated
the proportions of death and disability, respectively, that would have been prevented if alcohol
consumption was eliminated from a given subgroup. Death and disability due to alcohol consumption
were then estimated for New Zealand subgroups by applying the mortality AAFs to New Zealand
2004 and 2007 mortality data and morbidity AAFs to WHO’s 2004 disability estimates for New
Zealand.
Since the publication of the previous NZBoA2000/02 report,1 the Global Burden of Disease 2010 Risk
Factors Collaborating Group has revised some of the alcohol burden calculation methods.2 This
means that any differences in results between the reports are due to a combination of several factors

2
and must not be interpreted as having occurred solely due to changes in alcohol consumption of New
Zealanders. Some changes to the methods used in this report were:
The inclusion of four new causes of alcohol-attributable mortality and morbidity.
The use of alcohol consumption estimates from surveys with differing data collection
methods.
Limitation of the analysis to New Zealanders aged 0–79 years.
Considering abstainers and ex-drinkers separately.
The use of updated relative risk estimates to calculate AAFs.
The incorporation of drinking pattern data into ischaemic heart disease AAF
calculations.
KEY FINDINGS
The burden of mortality due to alcohol consumption in New Zealanders was estimated as deaths and
years of life lost (YLLs). The burden of morbidity (i.e. non-fatal impacts of alcohol consumption on
health) was incorporated in estimates of alcohol-attributable disability-adjusted life years (DALYs) that
combined the impact of alcohol on mortality (YLLs) and morbidity (years of life lived with a disability;
YLDs).
Alcohol is relevant to the health of adults of all ages. However, data on both alcohol consumption and
risk relationships in the age group of 80 years and over were considered too unreliable and
incomplete to estimate the mortality or DALY burden of alcohol. Therefore, all the results discussed
below are only for New Zealanders aged 0–79 years.
2007 Alcohol-attributable mortality
Overall, 802 deaths in New Zealanders aged 0–79 years were attributed to alcohol consumption in
2007, representing 5.4% of all deaths under 80 years old. These deaths represented 13,769 years of
life lost (YLLs) attributable to alcohol. Alcohol consumption was also estimated to prevent 351 deaths
but only 3,095 YLLs. The alcohol-attributable mortality estimates and key findings were similar in
2004.

3
Figure 1: Sex and ethnic disparities were observed in the alcohol-attributable mortality burden
0
5
10
15
20
0‐4 5‐14 15‐29 30‐44 45‐59 60‐69 70‐79
YLLs per 1000
age category
Rates of years of life lost (YLLs) due to alcohol consumption (New Zealand, 2007).
Māori Males
Māori Females
Non‐Māori Males
Non‐Māori Females
Men were more likely to be harmed by alcohol consumption than women.
Overall, the number of male deaths due to alcohol consumption (n = 537) was
double the number of deaths in women (n = 265) and the alcohol-attributable YLL
burden was 2.4 times higher in men (n = 9,720) than women (n = 4,049).
Alcohol consumption was estimated to cause 6.1% of all male deaths and 4.3% of all
female deaths.
In both Māori and non-Māori, men had more than double the standardised death
rates of women (adjusted for the effect of different age structures in sex/ethnicity
subgroups).
Alcohol-attributable mortality was higher in Māori than non-Māori.
The proportion of total annual deaths attributed to alcohol consumption was higher
for Māori men and women (8.3% and 5.7%) than non-Māori men and women (5.7%
and 4.0%).
The standardised alcohol-attributable death rate for Māori overall was 2.5 times the
rate for non-Māori.
The age/ethnicity-specific alcohol-attributable death and YLL rates for Māori were
more than 1.8 times the corresponding non-Māori rates for each age group.
o Māori males lost the most years of life due to alcohol consumption for almost
all age categories, with the rate of YLLs lost peaking in 15–29 year olds.

4
Injuries were responsible for a large share of the alcohol-attributable
mortality burden
Overall, injuries were responsible for:
52% of alcohol-attributable deaths in men (n = 280) and 25% of alcohol-attributable
deaths in women (n = 66).
73% of the alcohol-attributable YLLs in men (n = 7,066) and 42% of the YLLs in
women (n = 1,708).
Most sex and ethnic disparities in alcohol-attributable mortality were due to differences in injury
deaths.
Injuries were the dominant cause of alcohol-attributable deaths in adults aged 15–44 years.
For 15–29 year old males, 30–44 year old males and 15–29 year old females: more
than 90% of all alcohol-attributable deaths were due to injuries, and the five leading
causes of alcohol-attributable deaths were all injury categories.
There was a transition with increasing age from injuries causing most alcohol-attributable deaths in
younger adults (15–44 years) to conditions such as cancers and cardiovascular disorders being
responsible for a larger proportion of alcohol-attributable deaths in older age groups (45–79 years).
This transition was more apparent and occurred later in life for men than women.
Causes of alcohol‐attributable deaths by age (New Zealand, 2007).
0%
20%
40%
60%
80%
100%
15‐29 30‐44 45‐59 60‐69 70‐79
Females
0%
20%
40%
60%
80%
100%
15‐29 30‐44 45‐59 60‐69 70‐79
Males

5
Specific leading causes of alcohol-attributable mortality
Table 1: Top five causes of alcohol-attributed (AA) deaths (0-79 years; New Zealand 2007)
For Māori and non-Māori men:
Road traffic injuries were the most common cause of alcohol-attributable deaths.
Self-inflicted injuries, other unintentional injuries and alcoholic liver cirrhosis were
also among the leading causes of deaths due to alcohol consumption.
For Māori and non-Māori women:
Breast cancer was the most common cause of alcohol-attributable deaths.
Road traffic injuries, haemorrhagic stroke and alcoholic liver cirrhosis were also
among the leading causes of deaths due to alcohol consumption.
Road traffic injuries and self-inflicted injuries were the first and second specific leading causes of
alcohol-attributable deaths for 15–29 year old males, 30–44 year old males and 15–29 year old
females.
Alcoholic liver cirrhosis was a common cause of alcohol-attributable deaths for 30–69 year old
females and 45–69 year old males.
2004 Alcohol-attributable disability-adjusted life years (DALYs) Alcohol-attributable disability-adjusted life years (DALYs) were estimated for 2004, the most recent
year for which the required data were available from the WHO Global Burden of Disease study. One
lost DALY indicates the loss of one year of full health, as DALYs combine the time lost due to both
fatal and non-fatal events (i.e. years of life lost due to premature death (YLLs) and years of ‘healthy’
life lost due to disability (YLDs)).
Males% of
AA deaths Females% of
AA deaths
Māori (N = 124) Māori (N = 62)
Road traffic injuries 32.1% Female breast cancer 19.0%
Other unintentional injuries 13.1% Road traffic injuries 17.4%
Self-inflicted injuries 10.2% Ischaemic heart disease 16.3%
Alcoholic liver cirrhosis 5.7% Alcoholic liver cirrhosis 6.5%
Drownings 5.6% Haemorrhagic stroke 6.4%
Non-Māori (N = 414) Non-Māori (N = 203)
Road traffic injuries 15.8% Female breast cancer 29.3%
Alcoholic liver cirrhosis 13.3% Haemorrhagic stroke 12.2%
Self-inflicted injuries 10.6% Alcoholic liver cirrhosis 10.8%
Other unintentional injuries 7.6% Colon cancer 8.5%
Oesophagus cancer 7.4% Road traffic injuries 7.5%

6
Overall, 28,403 years of ‘healthy’ life (i.e. DALYs) lost in New Zealanders aged 0–79 years were
attributed to alcohol consumption in 2004, representing 6.5% of all DALYs lost in New Zealanders
under 80 years old. Alcohol consumption was estimated to prevent 6,538 DALYs.
Disparities between men and women were observed in the alcohol-
attributable DALY burden:
Men were more likely to be harmed by alcohol consumption than women.
The number of DALYs lost in men (n = 18,803) was double that of women (n =
9,601).
Alcohol consumption was estimated to cause 8.8% of all male DALYs and 4.3% of all
female DALYs.
The standardised rate of DALYs lost due to alcohol consumption was 2.1 times
higher in men than women.
ALCOHOL USE DISORDERS AND INJURIES WERE RESPONSIBLE FOR A LARGE PROPORTION OF THE ALCOHOL-ATTRIBUTABLE DALY BURDEN:
Table 2: Top five causes of alcohol-attributable disability-adjusted life years (AA DALYs) lost (0-79 years; New Zealand 2004).
Alcohol use disorders:
Overall, alcohol use disorders were the leading cause of alcohol-attributable DALYs
for both men (43%) and women (50%).
The contribution of alcohol use disorders to the DALY burden was almost entirely
due to non-fatal effects (i.e. YLDs).
Injuries:
Overall, injuries were responsible for 42% of the alcohol-attributable DALY burden in
men (n = 7,972) and 22% of the DALY burden in women (n = 2,109).
Injuries were the dominant cause of alcohol-attributable deaths and DALYs in young
adults. For 15–29 year olds, 89% of all alcohol-attributable DALYs in males and 74%
of all alcohol-attributable DALYs in females were due to injuries.
% of AA DALYs
% of AA DALYs
Males (N = 18803) Females (N = 9601)
Alcohol use disorders 42.5% Alcohol use disorders 50.0%
Road traffic injuries 18.8% Female breast cancer 12.2%
Self-inflicted injuries 7.8% Road traffic injuries 10.3%
Other unintentional injuries 6.5% Cirrhosis of the liver 4.3%
Cirrhosis of the liver 3.8% Other unintentional injuries 3.5%

7
Specific leading causes of alcohol-attributable DALYs:
Alcohol use disorders were the dominant cause of alcohol-attributable DALYs in men and women
over 30 years old.
Road traffic injuries were responsible for the largest proportion of alcohol-attributable DALYs in
15–29 year old males and females.
LIMITATIONS
Our analysis has important limitations that should be considered when interpreting or using the
estimates. These are detailed in the report. Caution is required when interpreting the preventive
effects of alcohol consumption (even at low levels of drinking). These effects need to be considered
alongside the greater alcohol-attributable health risks rather than in isolation, and the likely
overestimation of the effects due to inherent weaknesses in the research evidence needs to be kept
in mind. The findings in this report are not directly comparable with those of the previous report (i.e.
as a tool for monitoring the impact of changes in alcohol consumption) because the methodology
used to produce the estimates presented in the current report differs from the NZBoA2000/02
estimates in several major respects.
Despite the potential weaknesses and sources of uncertainty in our analysis, the updated methods we
used for this report resulted in burden estimates that are an improvement over those presented in the
previous NZBoA2000/02 report.
PUBLIC HEALTH IMPLICATIONS
Overall, this analysis shows that alcohol consumption is a major risk factor for burden of disease and
injury. No level of alcohol consumption is without risk, although high average consumption and
frequency of heavy drinking occasions are associated with the most risk of harm to the drinker and to
others.
The main messages from the previous report are upheld by the current analysis.
1. There are no health benefits of drinking before middle age, and benefits in later life
are uncertain.
2. The pattern of drinking is very important in determining the health effects of alcohol
consumption.
3. Injury is responsible for a large proportion of the alcohol burden: 43% of alcohol-
attributable deaths, 63% of years of life lost and 36% of DALYs lost due to alcohol.
4. There is a huge burden of disability due to alcohol use disorders that is not reflected
in mortality figures.
5. The health burden of alcohol falls inequitably on Māori.

8
6. The health of men as measured in this study is more affected by alcohol than the
health of women. This may not apply to health impacts that are outside the scope of
this study, such as harm from the drinking of others.
The effects of alcohol on public health are large enough to motivate population-wide interventions in
New Zealand and globally. We know more than ever about which strategies can successfully and
cost-effectively control alcohol-related harms. WHO’s Global strategy to reduce harmful use of alcohol
was ratified at the World Health Assembly in 2010, in order to coordinate an effective evidence-based
response.
A detailed set of recommendations to reduce alcohol-related harm in New Zealand, based on
international research evidence and tailored to the New Zealand policy environment, was put forward
by the New Zealand Law Commission at the conclusion of an extensive review in 2010.
Key elements of both the Global strategy and the Law Commission recommendations are a set of
synergistic changes to the regulation of alcohol that include:
Reducing the physical availability of alcohol.
Increasing the price of alcohol.
Reducing marketing and promotion of alcohol.
Lowering the legal blood alcohol concentration (BAC) limit for driving.
Raising the alcohol purchase age.

9
INTRODUCTION
The first comprehensive estimates of the ‘burden of death, disease and disability due to alcohol in
New Zealand’ were published in 2004 by the Alcohol Advisory Council of New Zealand.1 The
estimates in this previous report (NZBoA2000/02) were based on data from 2000 (mortality) and 2002
(disability-adjusted life years) and have since been widely used, for example by the New Zealand Law
Commission in reviewing the impacts of alcohol in New Zealand.3
In the eight years since the NZBoA2000/02 report was published, new alcohol consumption survey
data have been collected in New Zealand and there have been advances in several of the methods
used to estimate alcohol-attributable mortality and morbidity (i.e. death and disability). In view of these
changes and the perceived usefulness of New Zealand alcohol-attributable fraction and burden
estimates to researchers and policymakers, a revision is warranted.
The aim of this ALAC-funded project was to use the most current data and methods available to
calculate the following New Zealand estimates for mortality and morbidity due to alcohol-attributable
conditions and injuries:
Alcohol-attributable deaths and years of life lost (YLLs) for 2004 and 2007.
o by age/sex/ethnicity (Māori/non-Māori) subgroup.
Alcohol-attributable disability-adjusted life years (DALYs) for 2004.
o by age/sex subgroup.

10
METHODS: ALCOHOL-ATTRIBUTABLE MORTALITY (2004 &
2007)
SUMMARY
A number of steps were required to calculate the numbers and types of deaths caused by alcohol in
New Zealand during 2004 and 2007. The estimates presented in this report were facilitated by the use
of country-level burden of disease templates developed and provided by the
World Health Organization.
1. We identified which alcohol-attributable conditions and injuries to include (pages 12–
17).
2. We determined total New Zealand deaths due to these alcohol-attributable conditions
and injuries in 2004 and 2007 by age group, sex, and Māori/non-Māori ethnicity
(page 18).
3. For each alcohol-attributable condition category, we calculated mortality alcohol-
attributable fractions (AAFs) by age/sex/ethnicity subgroup.
Data requirements
a. We obtained New Zealand estimates for the following alcohol consumption
levels and patterns by age, sex and ethnicity; calculated best estimates for
pregnant and elderly subpopulations for whom limited data were available
(pages 18–32).
Volume of alcohol consumption
i. Prevalence of lifetime abstainers, ex-drinkers, and current drinkers.
ii. Average daily alcohol consumption.
Pattern of alcohol consumption
iii. Prevalence of people with irregular heavy drinking occasions for each
level of average daily alcohol consumption (for ischaemic heart disease
calculations).
b. For each age/sex/ethnicity subgroup, we obtained the best relative risk (RR)
estimates by alcohol-attributable condition (pages 35–39).
Calculations
c. AAFs for alcohol-related conditions were estimated for each age/sex/ethnicity
subgroup by combining the relative risk and alcohol consumption data;
ischaemic heart disease AAF calculations included additional alcohol
consumption categories and accounted for irregular heavy drinking patterns
(page 34).
4. For each alcohol-related injury category, we determined the best AAF estimates by
age/sex/ethnicity subgroup. We considered two different approaches for estimating
injury AAFs:

11
With the assistance of the Global Burden of Disease 2010 Risk Factors Collaborating
Group, we used detailed drinking pattern data from each age/sex/ethnicity subgroup
to model the AAFs for different types of injuries.
a. The face validity of the modelled GBD injury AAFs was poor for some New
Zealand subgroups, so we have described these methods and results as a
sensitivity analysis (see Appendix C).
b. We reviewed the sources of injury AAFs used in the previous NZBoA2000/02
report1 and sought new research evidence for updating these AAFs.
ii. There was little new evidence to inform changing the AAFs except for a
few minor modifications in the youngest age groups. Therefore, most of
the injury AAFs used in our main analysis were from the NZBoA2000/02
report (pages 39–41).
5. We applied AAF estimates to mortality data: deaths and years of life lost (pages 41–
48).

12
ALCOHOL-ATTRIBUTABLE CONDITIONS AND INJURIES
Alcohol-related conditions
Table 3 lists the conditions that are included in the mortality analyses of this report. The Global
Burden of Disease (GBD) 2010 Risk Factors Collaborating Group of the GBD 2005/2010 study
has identified these conditions as being either wholly or partially attributable to alcohol.2 One late
addition to the GBD 2010 Risk Factors Assessment for alcohol was the impact of alcohol on
worsening the disease course of HIV/AIDS, via higher non-adherence to antiretroviral
treatment.4,5 This change was made after we had finalised our estimates, and we considered that
the impact would have been very small in New Zealand, so we did not include it.
This list of conditions differs slightly from that used in 2004 New Zealand Burden of Alcohol report
(NZBoA2000/02), with the major difference being the addition of two types of cancer (colon and
rectum cancer) and two infectious diseases (tuberculosis and pneumonia). The identification and
quantification of these new causal relationships with alcohol was made possible by new evidence
from studies, systematic reviews and meta-analyses that have been published since the
NZBoA2000/02 report. Unless otherwise indicated in Appendix A, the ICD-10 codes that
correspond with each disease condition are consistent with those in the 2005 GBD Study
Operations Manual.6

13
Table 3: Categories of alcohol-related (non-injury) conditions.
Condition category ICD-10 codes Impact of alcohol
Cancers
Mouth and oropharyngeal cancers C00–C14 Detrimental
Oesophagus cancer C15 Detrimental
Colon cancer* C18 Detrimental
Rectum cancer* C19–C21 Detrimental
Liver cancer C22 Detrimental
Laryngeal cancer C32 Detrimental
Female breast cancer C50 Detrimental
Neuro-psychiatric disorders
Alcohol use disorders F10 Entirely caused by alcohol
Unipolar depressive disorders F32–F33, F34 Detrimental
Epilepsy G40–G41 Detrimental
Cardiovascular disorders
Hypertensive heart disease I10–I13 Mainly detrimental
Ischaemic heart disease I20–I25 Beneficial or detrimental
Cardiac arrhythmias I47–I48 Detrimental
Ischaemic stroke I60–I67,
I69
Beneficial or detrimental
Haemorrhagic stroke Detrimental
Digestive disorders
Oesophageal varices I85 Detrimental
Alcoholic liver cirrhosis K70 Entirely caused by alcohol
Cholelithiasis K80 Beneficial
Pancreatitis K85, K86 Detrimental
Conditions arising during pregnancy
Low birth weight P05–P07 Detrimental
Fetal alcohol syndrome Q86 Entirely caused by alcohol
Respiratory disorders
Tuberculosis* A15–A19, B90 Detrimental
Lower respiratory infections: pneumonia* J10–J18 Detrimental
Diabetes mellitus E10–E14 Beneficial or detrimental
* New category added since the NZBoA2000/02 report.

14
Cardiovascular disorders
Stroke, ischaemic or haemorrhagic
Issue: ICD-10 codes for stroke (I60–I67, I69) do not adequately discriminate between ischaemic and
haemorrhagic stroke subtypes. I69 (sequelae of cerebrovascular disease) is a particularly broad code
which includes deaths that originate from both ischaemic and haemorrhagic strokes. The proportion of
I69 deaths in New Zealand is substantial in relation to total stroke deaths, with I69 accounting for 13%
of all stroke deaths in both 2004 and 2007. Wpr-A estimates for age-specific proportions of fatal
ischaemic and haemorrhagic stroke were available from Lawes et al.7 However, the Wpr-A estimates
are not sex- or ethnicity-specific and the Wpr-A subregion comprised of a group of culturally and
geographically disparate countries (New Zealand, Australia, Brunei Darussalam, Japan and
Singapore).
Decision: We chose to calculate deaths due to ischaemic and haemorrhagic stroke subtypes by
applying local estimates of fatal stroke subtype proportions to total stroke mortality data.
Improvements to the broad Wpr-A estimates were made by using the calculation methods outlined by
Lawes et al.7 to estimate fatal stroke subtype proportions from New Zealand stroke incidence data
collected by the 2002–2003 Auckland Regional Community Stroke (ARCOS) study.8
Feigin et al. provided total (fatal and non-fatal) stroke subtype incidence estimates from the ARCOS
study,8 from which we were able to derive the proportions of total ischaemic and haemorrhagic
strokes for each age category (strokes of undetermined cause were excluded). These proportions
were then multiplied by the ‘gold standard’ one-month case-fatality rates of ischaemic and
haemorrhagic stroke used by Lawes et al. (14% and 45%, respectively),7 and divided by the
combined total of the resulting proportions to produce age-specific estimates of the relative
proportions of fatal ischaemic and haemorrhagic strokes. When these age-specific calculations were
performed separately by sex and ethnicity group, there were differences between sexes (higher
proportions of ischaemic stroke in all age categories of men compared to women) but ethnic
differences in age-specific stroke subtype proportions were minimal. For this reason, the same age-
and sex-specific proportions were used for both Māori and non-Māori calculations. The age
categories used by Feigin et al. differed from the age categories used in the present analysis, so their
age category midpoints were plotted against the calculated proportion estimates for ischaemic and
haemorrhagic strokes. The male and female plots both displayed a linear relationship between age
and stroke proportions with excellent fit (R ≥ 0.97), so these line formulae were used to compute sex-
specific stroke subtype proportions for the midpoints of the age categories used in our analyses.
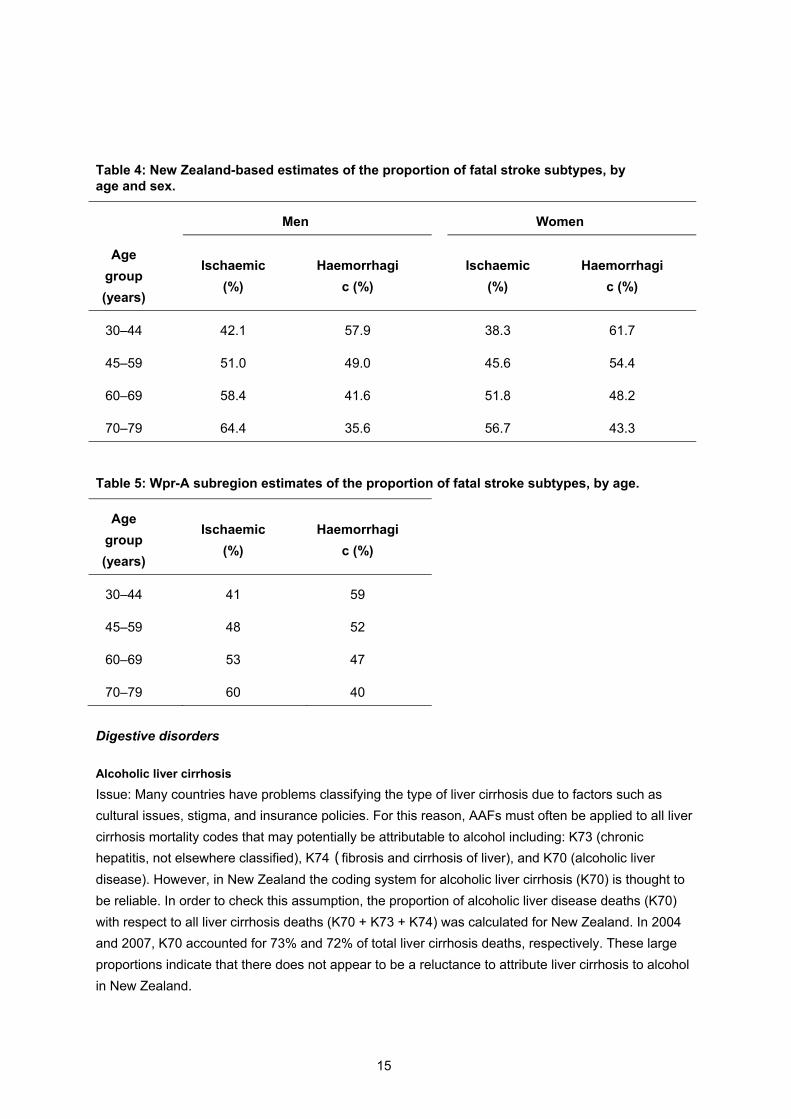
The final sex- and age-specific fatal stroke subtype proportions that were applied to total stroke (I60–
I67, I69) mortality data to calculate ischaemic and haemorrhagic stroke deaths in New Zealand during
2004 and 2007 are shown in Table 4. The proportions were similar to the Wpr-A estimates7 (see
Table 5) and they varied by age and sex in a way we expected.
15
Table 4: New Zealand-based estimates of the proportion of fatal stroke subtypes, by age and sex.
Men
Women
Age
group
(years)
Ischaemic
(%)
Haemorrhagi
c (%)
Ischaemic
(%)
Haemorrhagi
c (%)
30–44 42.1 57.9
38.3 61.7
45–59 51.0 49.0
45.6 54.4
60–69 58.4 41.6
51.8 48.2
70–79 64.4 35.6
56.7 43.3
Table 5: Wpr-A subregion estimates of the proportion of fatal stroke subtypes, by age.
Age
group
(years)
Ischaemic
(%)
Haemorrhagi
c (%)
30–44 41 59
45–59 48 52
60–69 53 47
70–79 60 40
Digestive disorders
Alcoholic liver cirrhosis
Issue: Many countries have problems classifying the type of liver cirrhosis due to factors such as
cultural issues, stigma, and insurance policies. For this reason, AAFs must often be applied to all liver
cirrhosis mortality codes that may potentially be attributable to alcohol including: K73 (chronic
hepatitis, not elsewhere classified), K74 (fibrosis and cirrhosis of liver), and K70 (alcoholic liver
disease). However, in New Zealand the coding system for alcoholic liver cirrhosis (K70) is thought to
be reliable. In order to check this assumption, the proportion of alcoholic liver disease deaths (K70)
with respect to all liver cirrhosis deaths (K70 + K73 + K74) was calculated for New Zealand. In 2004
and 2007, K70 accounted for 73% and 72% of total liver cirrhosis deaths, respectively. These large
proportions indicate that there does not appear to be a reluctance to attribute liver cirrhosis to alcohol
in New Zealand.
16
Decision: We used only K70 deaths to calculate alcohol-attributable deaths due to liver cirrhosis. This
will result in a conservative estimate and is consistent with the coding used in the NZBoA2000/02
report.
Oesophageal varices
Issue: There is no GBD 2005/2010 category.
Decision: We included oesophageal varices in our analyses because a large proportion of
oesophageal varices are due to liver cirrhosis. In accordance with the NZBoA2000/02 report methods,
relative risks for cirrhosis of the liver (K70, K73 and K74) were used to calculate AAFs for
oesophageal varices.
Alcohol-related injuries
Table 6 lists the injuries that are included in the mortality analyses of this report. Injury codes in Table
Error! Reference source not found. are consistent with the ICD-10 codes used in the
NZBoA2000/02 report with the exceptions of codes X00–X09, which were extracted from the ‘Other
unintentional injuries’ category to create a separate ‘Fire’ category. This resulted in a better match
with the injury categories used by Taylor et al.9 in their alcohol-attributable fraction (AAF) calculations
for global comparative risk assessments. Our variations from the ICD-10 codes used by Taylor et al.9
in their injury categories are detailed in Appendix B.

17
Table 6: Categories of alcohol-related injuries.
Injury category ICD-10 codes Impact of alcohol
Unintentional injuries
Road traffic injuries V02–V04, V09, V12–V14,
V19–V79, V86–V89, Y32, Y85
Detrimental
Alcohol poisonings X45, X65,* Y15
Non-alcohol
poisonings
X40–X44, X46–X49, Y10–
Y14, Y16–Y18
Detrimental
Falls W00–W19, Y30–Y31 Detrimental
Fires† X00–X09 Detrimental
Drownings W65–W74, Y21 Detrimental
Other unintentional
injuries
V01, V05–V06, V10–V11,
V15–V18, V80–V85, V90–
V99, W20–W64, W75–W99,
X10–X39, X50–X59, Y19–
Y20, Y22–Y29, Y86
Detrimental
Intentional injuries
Self-inflicted injuries X60–X64, X66–X84 Detrimental
Assault X85–Y09 Detrimental
Other intentional
injuries
Y35, Y87 Detrimental
* X65 deaths (intentional self-poisoning by and exposure to alcohol) were too uncommon to warrant their own injury category, so they were included in the ‘unintentional alcohol poisoning’ category for simplicity. † New category added since NZBoA2000/02 report.
Injuries of undetermined intent
Issue: The proportion of injuries recorded as ‘undetermined intent’ varies between countries.
Decision: In New Zealand, very few deaths were attributed to injuries of undetermined intent (21
deaths and 23 deaths in 2004 and 2007, respectively). We have therefore chosen to include these
deaths in the injury analyses in the interest of completeness (see Appendix B for details).

18
MORTALITY AND ALCOHOL CONSUMPTION DATA
Population subgroups examined
Age groups
All of the analyses in this report categorise the population into seven age groups: 0–4 years, 5–14,
15–29, 30–44, 45–59, 60–69, and 70–79. These age categorisations were chosen to be consistent
with the groups used by the World Health Organization (WHO). We did not estimate mortality or the
burden of disease and injury for people aged 80 years and older due to the unreliability of the
estimates of both relative risks and alcohol consumption for this age category.
Ethnicity classification (Māori/non-Māori)
This report has endeavoured to take an approach consistent with the Treaty of Waitangi by
conducting separate analyses for Māori and non-Māori where possible. Mortality analyses were
performed for Māori and non-Māori separately, with no other ethnic groups differentiated in these
analyses.
Denominator populations used in the calculation of rates are those derived for the appropriate year by
Statistics New Zealand from Census data. They rely on self-identification of ethnicity, and a hierarchy
of ethnic groups when multiple ethnic group affiliations are identified, to establish membership of the
Māori ethnic group. Thus, any person identifying with the Māori ethnic group is classified here as
Māori, and all others as non-Māori.
Numerator mortality data are from Statistics New Zealand for 2004 and 2007, which also uses self-
identification of ethnicity to establish prioritised ethnicity. In the past (1991–1994), mortality data have
been shown to underestimate Māori mortality due to data collection methods that resulted in high
levels of misclassification.10,11 However, a recent New Zealand Census-Mortality Study update
comparing 2001–2004 mortality and census data demonstrated close agreement between ethnic
group counts when either the ‘total’ or ‘prioritised’ definitions of ethnicity were used.12 This suggests
that the ethnic mortality rates calculated in this report should have little numerator-denominator bias.
Burden of disease and injury estimates (DALYs) were calculated for the total New Zealand adult
population due to the lack of ethnicity-specific burden data available from the WHO Global Burden of
Disease study.
New Zealand data
Mortality
Statistics New Zealand mortality data for the 2004 and 2007 New Zealand population were obtained
by sex, age group and ethnicity (Māori/non-Māori). Statistics New Zealand used prioritised ethnicity to
determine ethnicity from death registration data where people identified with multiple ethnic
groups.13,14 Therefore, all people who were identified as Māori (by funeral directors on the advice of
family members or other person assisting with the death registration) were classified as Māori, and
the non-Māori population included everyone else. Mortality data were defined by three-digit ICD-10
codes (International Classification of Diseases), with each death assigned to a single underlying

19
cause. This simplistic categorisation of deaths is a practical solution used by the GBD 2005/2010
study despite the fact that deaths are often the result of more complex multicausal pathways.
Alcohol consumption categories used for analyses
Alcohol-related conditions (excluding ischaemic heart disease and injuries)
The categories of average daily alcohol consumption used for the 2004 and 2007 analyses of alcohol-
related conditions in this report are based on the work of English et al.,15 and are consistent with
those used in the previous NZBoA2000/02 report1 and several other global and national burden
analyses.16-19 The cut points for the categories differ between men and women to reflect the fact that
women often experience higher risks of disease with lower levels of average alcohol consumption.
It has been recognised that ex-drinkers and lifetime abstainers have different risks of alcohol-related
disease and therefore differentiating between these two subgroups of abstainers is necessary for
estimating both the detrimental and beneficial effects of average alcohol consumption.2 Instead of
including all current abstainers together in a single category, as was the case in the previous report,
this analysis included ex-drinkers and lifetime abstainers as separate alcohol consumption categories.
Units: grams of pure alcohol per day.
Lifetime abstainers: 0
Ex-drinkers: 0
Drinking category I: Women 0.01–19.99 Men 0.01–39.99
Drinking category II: Women 20–39.99 Men 40–59.99
Drinking category III: Women 40+ Men 60+
Ischaemic heart disease
In comparison to the alcohol consumption categories used for analyses of other non-injury conditions,
the ischaemic heart disease analyses required more refined alcohol consumption categories. Identical
average alcohol consumption categories were used for both women and men, and proportions of
drinkers with irregular heavy drinking occasions (60+ grams of pure ‘alcohol per occasion’ at least
monthly, but not daily) were also calculated for each average consumption category. The categories
for both women and men are as follows:
Units: grams of pure alcohol per day. HDOs = heavy drinking occasions
Lifetime abstainers: 0
Ex-drinkers 0
Drinking category Ia: 0.01–19.99
Drinking category Ib: 0.01–19.99 (irregular HDOs)
Drinking category IIa: 20–39.99
Drinking category IIb: 20–39.99 (irregular HDOs)
Drinking category IIIa: 40–59.99
Drinking category IIIb: 40–59.99 (irregular HDOs)
Drinking category IV: 60+ (regular HDOs)

20
Injuries
Please see Appendix C for details about the alcohol consumption categories used by the GBD 2010
Risk Factors Collaborating Group to calculate injury alcohol-attributable fractions for use in our injury
sensitivity analysis.
Alcohol consumption estimates
Average daily alcohol consumption
A number of surveys have collected data on the prevalence of alcohol consumption in the New
Zealand population since the previous ‘Burden of death, disease and disability due to alcohol in New
Zealand report’ (NZBoA2000/02), including: 2003/04 Health Behaviours Survey – Alcohol Use
(HBS2003/04);20 Te Rau Hinengaro: 2003/04 New Zealand Mental Health Survey (NZMHS2003/04);21
2006/07 New Zealand Health Survey (NZHS2006/07);22 2007 Gender, Alcohol and Culture: An
International Survey – New Zealand (GENACIS2007);23,24 2007/08 New Zealand Alcohol and Drug
Use Survey (NZADUS2007/08);25 and 2008/09 SHORE’s Harm to Others Survey (HtO2008/09)
conducted by the Centre for Social and Health Outcomes Research and Evaluation (SHORE) and Te
Ropu Whariki (Massey University).26
Our analyses required estimates of the average grams of pure alcohol consumed per day, so we were
unable to use data from surveys that collected information about alcohol consumption data if it could
not be converted into these units (i.e. Alcohol Use Disorders Identification Test questions were used
for NZHS2006/07 and half of the NZMHS2003/04 survey participants, while the survey questions
used for the other half of NZMHS2003/04 participants resulted in only approximate estimates of
alcohol consumption).21,22 Although it was possible to estimate average alcohol consumption from the
GENACIS2007 survey data, we chose not to include GENACIS estimates in our analyses due to the
relatively small sample size (N = 1,925).23
We used data from HBS2003/04 and NZADUS2007/08 to estimate the unadjusted prevalence of
alcohol consumption categories by age, sex and ethnicity in 2004 and 2007, respectively. However,
these surveys only included participants up to age 65 years. Therefore, calculations for the
extrapolation of alcohol consumption prevalence estimates to the older age categories also included
survey data from HtO2008/09 (see ‘Alcohol consumption estimates for older age categories’ starting
on page 26 for details and rationale for these extrapolation methods). The 2004 and 2007 estimates
for the average daily volume of alcohol consumption by age/sex/ethnicity subgroups are shown in
Tables 7-10.
As detailed in the following text, several methodological differences exist between the two main
surveys used for estimating alcohol consumption in this report (HBS2003/04 and NZADUS2007/08).
The different methods used for survey participant selection, interviewing, and ethnicity determination
mean that comparisons between the 2004 and 2007 prevalence of alcohol consumption in
age/sex/ethnic subgroups of New Zealanders may not reflect only differences in consumption.

21
Table 7: Estimated average volume of alcohol consumption for Māori and non-Māori males (%), New Zealand 2004.
Alcohol
consumption
category
Age group (years)*
Grams
alcohol
per day
15–29† 30–44† 45–59† 60–69‡ 70–79‡
Māori
males
Abstainers 0 10.1 4.8 5.5 3.0 2.5
Ex-drinkers 0 4.3 12.1 18.9 20.1 20.3
I 0.01–39.99 52.0 66.5 64.0 65.4 68.8
II 40.00–
59 99 9.6 6.8 5.5 3.6 2.2
III 60+ 24.0 9.9 6.2 7.9 6.2
Non-
Māori
males
Abstainers 0 10.2 4.9 5.4 5.5 7.2
Ex-drinkers 0 2.8 5.0 7.7 8.7 9.7
I 0.01 –
39 99 58.5 75.9 73.2 74.0 73.1
II 40.00–
59 99 8.5 7.9 6.5 6.2 5.6
III 60+ 20.1 6.4 7.3 5.6 4.3
* Sums of age/sex/ethnicity subgroup proportions may not equal exactly 100% due to rounding. † Estimates from HBS2003/04. ‡ Extrapolated estimates from weighted averages of proportions from HBS2003/04, NZADUS2007/08 and HtO2008/09 surveys. See following report section: ‘Alcohol consumption estimates for older age categories’ for details about calculation methods and limitations of extrapolated estimates (i.e. high degree of uncertainty).

22
Table 8. Estimated average volume of alcohol consumption for Māori and non-Māori females (%), New Zealand 2004.
Alcohol
consumption
category
Age group (years)*
Grams
alcohol
per day
15–29† 30–44† 45–59† 60–69‡ 70–79‡
Māori
females
Abstainers 0 8.2 8.8 13.6 11.3 11.3
Ex-drinkers 0 7.7 17.7 19.2 31.0 44.4
I 0.01–
19 99 53.1 58.7 55.3 50.3 44.3
II 20.00–
39 99 13.5 8.5 5.8 6.1 0.0
III 40+ 17.6 6.3 6.2 1.3 0.0
Non-
Māori
females
Abstainers 0 12.1 8.7 10.6 13.0 19.5
Ex-drinkers 0 4.6 5.4 5.4 11.2 12.3
I 0.01–
19 99 62.0 70.6 68.1 65.0 60.1
II 20.00–
39 99 13.1 10.8 12.1 8.3 6.5
III 40+ 8.2 4.5 3.8 2.5 1.6
* Sums of age/sex/ethnicity subgroup proportions may not equal exactly 100% due to rounding. † Estimates from HBS2003/04. ‡ Extrapolated estimates from weighted averages of proportions from HBS2003/04, NZADUS2007/08 and HtO2008/09 surveys. See following report section: ‘Alcohol consumption estimates for older age categories’ for details about calculation methods and limitations of extrapolated estimates (i.e. high degree of uncertainty).

23
Table 9. Estimated average volume of alcohol consumption for Māori and non-Māori males (%), New Zealand 2007.
Alcohol
consumption
category
Age group (years)*
Grams
alcohol
per day 15–29† 30–44† 45–59† 60–69‡ 70–79‡
Māori
males
Abstainers 0 1.3 1.1 1.2 3.0 2.5
Ex-drinkers 0 5.8 9.2 27.2 20.1 20.3
I 0.01–39.99 60.2 63.4 53.7 65.4 68.8
II 40.00–
59.99 8.5 9.9 6.0 3.6 2.2
III 60+ 24.2 16.4 11.9 7.9 6.2
Non-
Māori
males
Abstainers 0 6.5 2.7 2.8 5.5 7.2
Ex-drinkers 0 8.0 7.7 9.4 8.7 9.7
I 0.01–39.99 64.4 70.8 76.4 74.0 73.1
II 40.00–
59.99 4.8 9.5 5.0 6.2 5.6
III 60+ 16.2 9.2 6.3 5.6 4.3
* Sums of age/sex/ethnicity subgroup proportions may not equal exactly 100% due to rounding. † Estimates from NZADUS2007/08. ‡ Extrapolated estimates from weighted averages of proportions from HBS2003/04, NZADUS2007/08 and HtO2008/09 surveys. See following report section: ‘Alcohol consumption estimates for older age categories’ for details about calculation methods and limitations of extrapolated estimates (i.e. high degree of uncertainty).

24
Table 10: Estimated average volume of alcohol consumption for Māori and non-Māori females (%), New Zealand 2007.
Alcohol
consumption
category
Age group (years)*
Grams
alcohol per
day
15–29† 30–44† 45–59† 60–69‡ 70–79‡
Māori
females
Abstainers 0 1.8 2.7 2.5 11.3 11.3
Ex-drinkers 0 10.9 13.6 21.4 31.0 44.4
I 0.01–19.99 53.5 64.9 66.2 50.3 44.3
II 20.00–39.99 12.4 9.9 3.2 6.1 0.0
III 40+ 21.4 8.8 6.7 1.3 0.0
Non-
Māori
females
Abstainers 0 9.0 6.6 5.8 13.0 19.5
Ex-drinkers 0 9.8 10.6 10.3 11.2 12.3
I 0.01 – 19.99 63.4 69.2 68.8 65.0 60.1
II 20.00–39.99 7.8 8.5 10.2 8.3 6.5
III 40+ 9.9 5.0 4.8 2.5 1.6
* Sums of age/sex/ethnicity subgroup proportions may not equal exactly 100% due to rounding. † Estimates from NZADUS2007/08. ‡ Extrapolated estimates from weighted averages of proportions from HBS2003/04, NZADUS2007/08 and HtO2008/09 surveys. See following report section: ‘Alcohol consumption estimates for older age categories’ for details about calculation methods and limitations of extrapolated estimates (i.e. high degree of uncertainty).

25
2003/04 Health Behaviours Survey – Alcohol Use (HBS2003/04)
HBS2003/04 was a cross-sectional population survey implemented by the Centre for Social and
Health Outcomes Research and Evaluation (SHORE), with funding from the New Zealand Ministry of
Health.20 It was conducted from September 2003 to August 2004 using an in-house computer-
assisted telephone interviewing system.
A stratified random sampling design based on the level of urbanisation and geographic regions was
used. The three sample frames used to obtain full coverage of the New Zealand population and an
increased sample of Māori respondents were: random digit dialling samples from both the general
population (5,469 non-Māori; 840 Māori) and a Māori screened sample (676 Māori), and a sample
from the full electoral roll of people with self-identified Māori ancestry (2,862 Māori). At least 10
attempts were made to contact each randomly selected telephone number, and for each individual
within a household a further random selection was used to determine if they were to participate in the
survey.
Data were collected from 9,847 New Zealand residents (4,378 Māori and 5,469 non-Māori) aged 12–
65 years living in private residential dwellings with a connected landline phone (overall weighted
response rate 59%).
To determine ethnicity, respondents were asked to identify a maximum of two ethnic groups to which
they belonged. Māori versus non-Māori ethnicity was determined using prioritised ethnicity, so that all
respondents who selected Māori as one of their ethnic groups were classified as Māori, while all other
respondents were classified as non-Māori.
Further details about the HBS2003/04 survey methods are described elsewhere.20
2007/08 New Zealand Alcohol and Drug Use Survey (NZADUS2007/08)
NZADUS2007/08 was a cross-sectional population survey implemented by the Ministry of Health.25 It
was conducted from August 2007 to April 2008 using face-to-face computer-assisted personal
interviews in respondents’ homes, with the sensitive questions about personal patterns of alcohol use
self-completed by the participants on a laptop computer using audio prompts.
A multi-stage, stratified, probability proportional to size random sampling design based on lists of
addresses within 2006 Census meshblocks was used (adjusted so that meshblocks with higher
concentrations of Māori and Pacific people had a greater chance of selection). Increased sampling of
Māori respondents was primarily achieved through a Māori and Pacific screened sample (households
with at least one adult of Māori or Pacific ethnicity). Up to eight attempts were made to contact each
randomly selected household, and the Kish grid method27 was used to select one eligible adult (if any)
from each household.
Data were collected from 6,784 New Zealand residents (1,825 Māori and 4,959 Non-Māori) aged 16–
64 years living in private residential dwellings (final weighted response rate 60%).

26
For selection of eligible adults in each household, the Statistics New Zealand Census 2006 ethnicity
question was used to obtain the ethnicities of household members by proxy from the person who
answered the door. Total response ethnicity was considered for each survey participant with each
person allocated to all ethnic groups they identified with, so that the total number of survey responses
for all ethnicities is greater than the total number of survey participants.28 This means that there is
some overlap in the survey participants who comprise the Māori and non-Māori subgroups, as people
who reported both Māori and non-Māori ethnic groups are counted once in each group.
Further details about the NZADUS2007/08 survey methods are available elsewhere.29
Alcohol consumption estimates for older age categories
Data sources
There is little alcohol consumption data available for older New Zealand residents and they comprise
a relatively small proportion of the population. Moreover, the surveys that do include people from
older age groups only obtain data from individuals who live in private dwellings, thereby excluding the
substantial proportion of older people who live in institutions and that are likely to have very different
alcohol consumption patterns. Despite these data constraints, it is important to include older people in
this analysis in order to account for the impact of alcohol on conditions that are common causes of
mortality and morbidity in older people, such as cardiovascular disorders.
The HBS2003/04 and NZADUS2007/08 surveys did not include people over 65 years of age. Due to
this limitation of our main datasets, directly measured alcohol consumption prevalence estimates
were not available for the two oldest age categories examined in this report: 60–69 years and 70–79
years. It was therefore necessary to incorporate additional survey data and methods to estimate the
prevalence of alcohol consumption in older age groups.
Estimates for alcohol consumption of older age groups were derived by combining and extrapolating
from the best data that were available for New Zealand from 2004 onwards. HtO2008/09a included
people up to 80 years of age, but the Māori estimates were based on very small sample sizes and
must therefore be interpreted with caution. NZMHS2003/04 and NZHS2006/07 both included older
survey participants and provided estimates for the prevalence of abstainers in older age groups.
However, the AUDIT survey questions used for all NZHS2006/07 participants and half of the
NZMHS2003/04 participants did not allow for the calculation of average alcohol consumption, while
the survey questions used for the other half of NZMHS2003/04 participants allowed only for rough
estimates of alcohol consumption.
a A cross-sectional general population survey conducted by the Centre for Social and Health Outcomes Research and Evaluation (SHORE) in 2008/09.26 An in-house computer-assisted telephone interviewing system was used to collect data from 3,068 New Zealand residents aged 12–80 years (response rate 64%).

27
The HtO2008/09 survey was conducted after 2007, meaning that the HtO2008/09 alcohol exposure
data does not temporally precede the years for which the alcohol-related health outcome data were
analysed (2004 and 2007). However, alcohol consumption in New Zealanders aged 16–64 years has
been shown as reasonably stable between 2000 and 2004,30 and 2004 and 2007.25 It is therefore
likely that there would be a similar stability in alcohol consumption by older drinkers across 2004 and
2007 and extending to 2008/09. Based on this assumption and the limitations of available survey data
(described above), we decided to extrapolate older age prevalence estimates by combining data from
HBS2003/04, NZADUS2007/08 and HtO2008/09. Older age category estimates from NZHS2006/07
and NZMHS2003/04 were used only for qualitative comparisons.
Estimation method
For age groups up to and including 60–69 years, overall prevalence estimates were calculated for
each age/sex/ethnicity subgroup by combining weighted estimates from HBS2003/04,
NZADUS2007/08 and HtO2008/09, with weights proportional to survey sample sizes. The 70–79 year
estimates were used directly from HtO2008/09 since it was the only survey with average alcohol
consumption data for this older age group.
These weighted prevalence estimates were then plotted against their age group midpoints, and
theoretically plausible best fit curves were determined for each alcohol consumption category within a
given sex/ethnicity subgroup. Prevalence estimates for the older age categories were then calculated
from each best fit model using age category midpoints and finally adjusted so that the sum of
prevalence estimates for all alcohol consumption levels was 100% for each age category.
The same older age extrapolated estimates were used for 2004 and 2007 data because the plots
used to derive the estimates were based on weighted averages derived from 2003/04, 2007/08 and
2008/09 survey datasets. As previously mentioned, alcohol consumption levels in older age groups
were most likely constant between 2004 and 2007. It was therefore important to avoid introducing
artificial differences between these years by calculating different estimates for older age groups,
especially given the degree of uncertainty inherent in any extrapolation method.
Results
The extrapolated estimates of alcohol consumption prevalence in older age categories (shown in the
final two columns of Tables 7-10) are largely consistent with the abstainer data available from
NZHS2006/07 and NZMHS2003/04, and broadly similar to the older age estimates of the
NZBoA2000/02 report which were based on combining data from five New Zealand studies.1 They
are, however, only rough approximations of alcohol consumption in the older age categories.
Although we have accepted this limitation in order to calculate estimates of the burden of alcohol for
New Zealanders in older age categories, it is important to emphasise the high degree of uncertainty
surrounding the estimates for older age categories, both in these prevalence tables and in the other
estimates and results presented for 60–69 and 70–79 year olds throughout this report.
Alcohol consumption estimates for pregnant women
The NZBoA2000/02 report based its estimates of alcohol consumption during pregnancy on a survey
of women who were registered with a specific Wellington maternity care provider.31 At 20–24 weeks of

28
gestation, the proportion of abstainers versus drinkers was determined by asking about alcohol
consumption during the previous week.31
Since publication of the NZBoA2000/02 report, several new surveys and studies have measured
alcohol consumption in pregnant New Zealand women.20,25,32,33 Most of the studies used population-
based stratified sampling methods with increased sampling of the Māori population, and data
collection was conducted by telephone or face-to-face25 interviews. Due to sample size limitations,
separate estimates for alcohol consumption during pregnancy by Māori and non-Māori women were
only available from NZADUS2007/08,25 while other studies simply stated that there were no significant
differences between the proportions of New Zealand Māori and New Zealand European32 or New
Zealand non-Māori20 women who drank any alcohol during their pregnancies. See Appendix D for a
summary of survey sample sizes and response rates.
Two studies asked women about their alcohol consumption while they were still pregnant20 or
immediately postpartum,33 while the others also included retrospective data about drinking during
each woman’s most recent pregnancy within the previous three25 or five32 years. The self-reported
survey questions used in these studies also varied substantially in terms of the detail collected about
the volume and pattern of drinking and the timing of alcohol consumption during the pregnancy. The
Ministry of Health’s Alcohol Use in New Zealand surveys (HBS2003/04 and NZADUS2007/08) asked
general questions about drinking during pregnancy. The 2003/04 Health Behaviours Survey asked
women who were currently pregnant whether they drank alcohol before their pregnancy (73.9% of
drinkers) and then asked the drinkers whether they had changed their way of drinking during their
pregnancy (23.5% of drinkers had not stopped drinking).20 The 2007/08 New Zealand Alcohol and
Drug Use Survey asked, “At any time when you were pregnant in the last three years, did you have
alcohol, even once?” (28.4% answered “yes”).25 More detailed information was collected by a 2005
Alcohol in Pregnancy study that differentiated between pregnant women who only drank before
realising they were pregnant (13.0%) versus those who drank some alcohol despite knowing they
were pregnant (39.6%).32 Detailed information on drinking volume, drinking patterns, and timing of
reduction in alcohol use during pregnancy was also collected by a Taranaki study of 100 immediately
postpartum women, with 28% of the women reporting some consumption of alcohol during their
pregnancy.33
Due to these different methods used to measure alcohol consumption during pregnancy, the overall
estimated proportions of New Zealand women who drank some alcohol during pregnancy vary widely
from 17.4% to 52.6% and are not directly comparable with each other.20,32,33 Further complicating this
issue is the scientific uncertainty that remains with regard to the specific timing and mechanism of
alcohol’s impact on the maternal and perinatal conditions of interest in this report (i.e. low birth weight
and fetal alcohol syndrome).34
Estimates of drinking pattern as measured by the frequency of heavy drinking occasions (i.e. binge
drinking episodes) in New Zealand women during pregnancy were provided by Parackal et al.,32 who
used ALAC’s definition of binge drinking for women under 18 years (5+ drinks at any one time) and 18
years and older (7+ drinks at any one time). This study showed that, while only 2.2% of women
reported at least one heavy drinking occasion (HDO) after becoming aware of their pregnancy, an

29
additional 17.6% reported HDOs before realising they were pregnant.32 Women in the youngest age
group (16–24 years) had significantly higher odds of HDOs during pregnancy than women of the older
age categories.32 Nine of the women in Ho and Jacquemard’s study group of 100 women reported
HDOs (defined as 4+ drinks on one occasion) during pregnancy, with five women reporting that they
drank three or more drinks on a typical drinking day during their pregnancy.33
As outlined in the NZBoA2000/02 report,1 drinking pattern (i.e. frequency of HDOs) is generally
believed to be a more significant factor than average alcohol consumption when considering the
adverse impact of drinking on pregnancy outcomes. However, it remains unclear precisely which
combination of alcohol exposures (i.e. volume, pattern and/or timing of alcohol consumption during
pregnancy) is most important in terms of alcohol’s impact on fetal development.34 In the global
comparative risk assessment, the relative risk estimates derived from the best evidence currently
available for the impact of alcohol on preterm birth complications are based on average daily alcohol
consumption levels during pregnancy, with moderate (20–39.99 g) and heavy (40+ g) drinking
increasing the risk of low birth weight (J. Rehm, personal communication).
We chose to use the NZADUS2007/08 prevalence estimates for average alcohol consumption during
pregnancy for both 2004 and 2007 calculations for several reasons including: (1) Māori/non-Māori
prevalence estimates were available; (2) prevalence estimates for age subgroups were available; and
(3) estimates were based on a large nationally representative sample of pregnant women (n = 948).
These estimates were similar to those reported by Ho and Jacquemard33 and to the estimates used in
the NZBoA2000/02 report (McLeod et al.).31 The NZADUS2007/08 survey question differentiated
between women who had abstained from consuming alcohol during pregnancy and women who had
consumed any alcohol while pregnant. When Parackal et al. specifically asked women to also report
whether they had consumed alcohol before realising they were pregnant, more than half of all women
admitted to drinking during their pregnancies.32 Parackal et al. also noted that younger women (16–24
years) were approximately twice as likely as women in any of the older age groups to consume
alcohol before realising they were pregnant.32 Although this indicates that the NZADUS2007/08 may
have underestimated the total prevalence of all levels and types of drinkers during pregnancy
(especially for the youngest age category), the NZADUS2007/08 probably captured more drinkers
than some other surveys (e.g. HBS2003/04) by specifically asking if the women had alcohol even
once during pregnancy.
In keeping with the methods used in the NZBoA2000/02 report, the overall proportions of women who
drank during pregnancy were divided across the three alcohol consumption categories according to
the distribution of alcohol consumption levels amongst women drinkers in the general New Zealand
population. Age/ethnicity subgroup proportions for this purpose were calculated from weighted
averages of HBS2003/04, NZADUS2007/08 and HtO2008/09 estimates. The adjusted estimates for
alcohol consumption during pregnancy are shown in Table11.

30
Table 11: Estimated average volume of alcohol consumption during pregnancy for Māori and non-Māori females (%), New Zealand 2004 and 2007.*
Alcohol
consumption
category
Age group (years)
Total
Grams alcohol
per day 15–29 30–44 15–44
Māori
females
Abstainers 0 69.9 67.7 68.9
I 0.01–19.99 18.6 25.3 21.1
II 20.00–39.99 4.6 3.9 4.2
III 40+ 6.9 3.1 5.8
Non-
Māori
females
Abstainers 0 76.9 69.0 72.2
I 0.01 – 19.99 17.5 25.6 22.1
II 20.00 – 39.99 3.0 3.6 3.4
III 40+ 2.6 1.8 2.4
* Estimates based on NZADUS2007/08 data, with distribution amongst the three alcohol consumption categories determined from weighted averages of HBS2003/04, NZADUS2007/08, and HtO2008/09 proportions for the general female population in each exposure group. Sums of age/ethnicity subgroup proportions may not equal exactly 100% due to rounding. See text for calculation details.
Prevalence of people with irregular heavy drinking occasions
Recent meta-analyses have established more refined approaches for calculating the complicated risk
relationships between alcohol consumption and ischaemic heart disease.35-37 These analyses clearly
demonstrate the importance of considering both the pattern and volume of alcohol consumption,35
and of separating ex-drinkers from the abstainer reference category when calculating the effects of
alcohol consumption on ischaemic heart disease.36-37 The data required to perform these calculations
for the New Zealand population are described below. For details of the calculation methods, please
see the ‘Methodological developments: Ischaemic heart disease’ section of this report (page 68).
Table 12 summarises the nine drinking categories for which prevalence data were required to
facilitate the ischaemic heart disease calculations. In contrast to the sex-specific alcohol consumption
categories that were used to calculate AAFs for other alcohol-related conditions, in the case of
ischaemic heart disease the same four alcohol consumption categories were used for both males and
females, and the proportions of drinkers with irregular heavy drinking occasions (60+ g of pure alcohol
per occasion at least monthly, but not daily) were calculated for each average consumption category.

31
Table 12: Categories of alcohol consumption data required for ischaemic heart disease AAF calculations.*
Alcohol
consumption
category
Grams
alcohol per
day
Irregular heavy
drinking
occasions?†
Abstainers 0 n/a
Ex-drinkers 0 n/a
Ia 0.01 – 19.99 No
Ib 0.01 – 19.99 Yes
IIa 20.00 – 39.99 No
IIb 20.00 – 39.99 Yes
IIIa 40.00 – 59.99 No
IIIb 40.00 – 59.99 Yes
IV 60+ n/a‡
* These prevalence estimates were obtained by age for all four sex/ethnicity subgroups. † 60+ g of pure alcohol per occasion at least monthly, with an average alcohol consumption of less than 60 g per day. ‡ All regular heavy drinkers.
Prevalence data for the drinking categories outlined in Table 12 were obtained from HBS2003/04 and
NZADUS2007/08 for 2004 and 2007 calculations, respectively. For women, NZADUS2007/08
measured the frequency of irregular heavy drinking occasions (HDOs) using 40+ g pure alcohol per
occasion as the cut off rather than 60+ g. This may result in some overestimation of heavy drinking
occasions for women where these NZADUS2007/08 data are applied.
Sample size weighted averages from HBS2003/04, NZADUS2007/08 and HtO2008/09 were used to
extrapolate prevalences for the older age categories in each sex/ethnicity subgroup using the steps
previously described in the ‘Alcohol consumption estimates for older age categories’ section (page
26). These extrapolated estimates for older age categories therefore also share the high level of
uncertainty previously discussed in the ‘Alcohol consumption estimates for older age categories’
section.
Estimates of the overall proportion of people with irregular HDOs within each of the four sex/ethnicity
subgroups were also required in order to adjust our data relative to the reference population used for
estimating the relative risks. Since the surveys we used did not include older people, we could not use
survey sample sizes to calculate the overall sex/ethnicity subgroup proportions of people with
irregular HDOs. For each sex/ethnicity subgroup, the age distribution of the survey participants from
15 to 59 years old was broadly similar to actual New Zealand population data. Therefore, in order to
calculate the overall proportions of people with irregular HDOs for each sex/ethnicity subgroup, we
applied the survey proportions of people with irregular HDOs in each age category (including the
proportions extrapolated for the older age categories) to the actual numbers of New Zealanders in
that age category for 2004 and 2007. Please see Table E-1 and Table E-2 in Appendix E for the

32
proportions of people with irregular HDOs in the meta-analysis studies (ie reference population) and
New Zealand sex/ethnicity subgroups, respectively. Appendix E also provides the alcohol
consumption prevalences for each New Zealand age/sex/ethnicity subgroup, with excess proportions
of people with irregular HDOs extracted from each category for the application of ischaemic heart
disease relative risks (Table E-3 and Table E-7).
Heavy drinking occasions
The following drinking pattern estimates were used by the Global Burden of Disease 2010 Risk
Factors Collaborating Group to calculate injury alcohol-attributable fractions for our injury sensitivity
analysis: ‘prevalence of people with heavy drinking occasions’; ‘average number of heavy drinking
occasions per week’; and ‘average number of drinks per heavy drinking occasion’ (see Appendix C for
this data and more details).
Adult per capita alcohol consumption
National adult per capita alcohol consumption data derived from aggregate production, sales, export
and import statistics are commonly regarded as the most accurate estimates for the overall volume of
alcohol consumption in a country.38,39 However, our analyses required disaggregated estimates (i.e.
by age/sex/ethnicity subgroups) that were only available from survey data. Most national alcohol
surveys markedly underestimate alcohol use relative to the national taxable alcohol available for
consumption, therefore requiring some method of adjustment so that the survey results are more in
line with the overall national level of per capita alcohol consumption.38 However, adjustment of survey
estimates is not considered necessary when survey coverage rates are 80% or greater (J. Rehm,
personal communication). Therefore, we examined the validity of our survey-based estimates of
average alcohol consumption by calculating the overall coverage rates for the surveys compared to
the taxable alcohol available for consumption during the same year. The derivation and limitations of
the Statistics New Zealand estimates of taxable alcohol available for consumption have been
discussed in detail elsewhere.39-41
The annual volumes of alcohol consumed by the total New Zealand population aged 15 years and
older in 2004 and 2007 were estimated from the volumes of alcohol consumption reported by drinkers
in the HBS2003/04 and NZADUS2007/08 surveys. For New Zealanders in the older age groups that
were not captured by these surveys, extrapolated alcohol consumption estimates derived from a
combination of survey data were used (see the ‘Alcohol consumption estimates for older age
categories’ section on page 26 for a detailed description of extrapolation methods). Per capita
consumption was then calculated by dividing the 2004 and 2007 estimates of annual alcohol
consumption volume by the total New Zealand resident population aged 15 years and over, using
Statistics New Zealand estimates as at 30 June of 2004 and 2007.
The overall per capita alcohol consumption estimates calculated from HBS2003/04 and
NZADUS2007/08 data was 8.3 litresa in both 2004 and 2007. Statistics New Zealand reported the
volume of pure alcohol available per head of population aged 15 years and over in New Zealand as
9.2 litresa in 200440 and 2007.41 Due to the high coverage rates of our survey-based alcohol
consumption estimates (i.e. both approximately 90%), we did not adjust them for our analyses.
a Rounded to two significant digits.

33
MORTALITY ALCOHOL-ATTRIBUTABLE FRACTIONS (AAFS)
For each alcohol-related condition and injury identified in Tables 3 and 6, the contribution of alcohol
consumption to mortality in New Zealand was quantified by calculating alcohol-attributable fractions
(AAFs) for each age/sex/ethnicity subgroup. The mortality alcohol attributable fraction (AAF) is the
proportion of deaths due to a specific condition or injury that would be prevented in a given subgroup
if alcohol consumption was eliminated. This can also be referred to as the population attributable
fraction (PAF) or population attributable risk (PAR) due to alcohol. For example, for a specific
condition and subgroup, an AAF of 20% means that 20% of the subgroup’s deaths due to that
condition would be eliminated if nobody in that subgroup had ever consumed alcohol. It must be
recognised that, even if the entire New Zealand population were to suddenly stop consuming alcohol,
the increased mortality risk of ex-drinkers compared to lifetime abstainers for many chronic conditions
means that the mortality risk due to alcohol consumption would not be completely eliminated.
Negative AAFs are also possible when alcohol consumption is protective for a given condition and
subgroup. This method of quantifying the contribution of alcohol to New Zealand’s mortality burden is
a necessary simplification, as most conditions and injuries are caused by multiple overlapping and
interacting risk factors.
Both average volume of alcohol consumption and episodes of intoxication have been shown to
influence alcohol-related burden of disease. Therefore the way in which the AAF for each condition is
estimated depends on whether the condition is due to acute or chronic use of alcohol and whether the
pattern of drinking has been established as an important determinant of the incidence of the condition.
In all cases the estimation of risk is made by comparison of ex-drinkers or drinkers (at various levels)
with abstainers. That is, zero is the theoretical minimum exposure to alcohol.
The effect of pattern of drinking may be underestimated in many conditions, as pattern information
has not been routinely collected in epidemiological studies. Conditions where the pattern of
consumption has been demonstrated to have an effect independently of average volume of alcohol
are ischaemic heart disease, fetal alcohol syndrome, unintentional injuries and intentional injuries.2
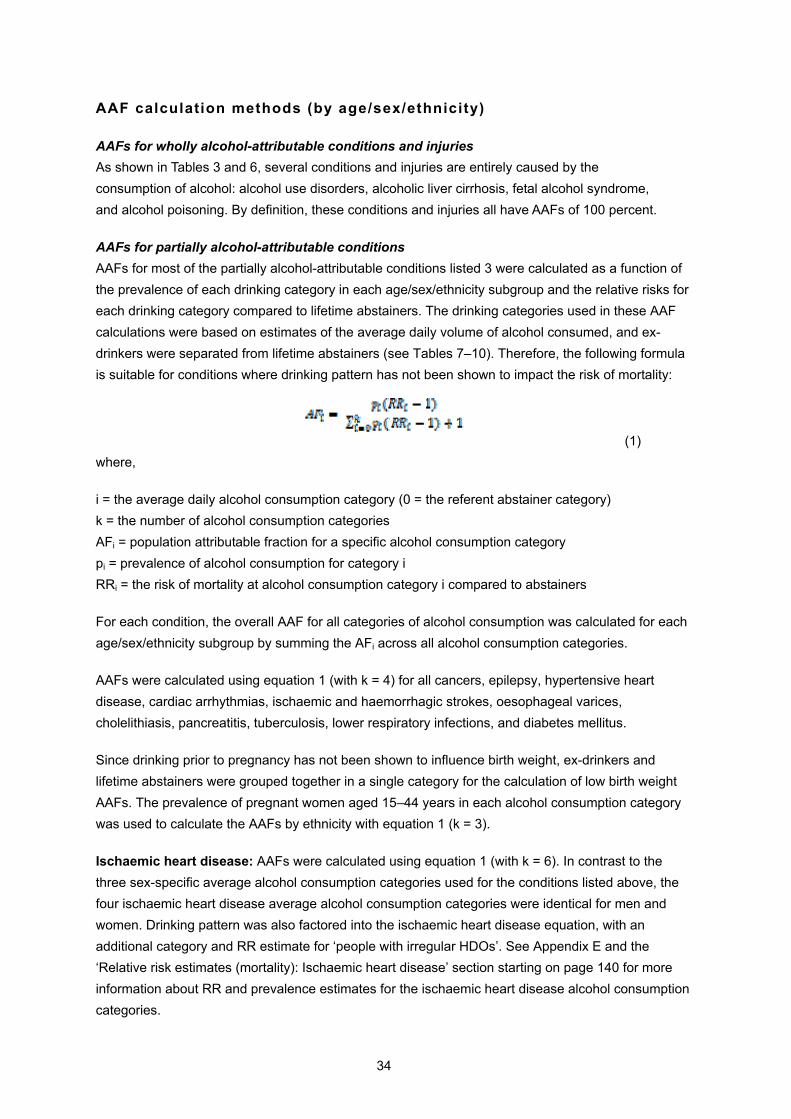
34
AAF calculation methods (by age/sex/ethnicity)
AAFs for wholly alcohol-attributable conditions and injuries
As shown in Tables 3 and 6, several conditions and injuries are entirely caused by the
consumption of alcohol: alcohol use disorders, alcoholic liver cirrhosis, fetal alcohol syndrome,
and alcohol poisoning. By definition, these conditions and injuries all have AAFs of 100 percent.
AAFs for partially alcohol-attributable conditions
AAFs for most of the partially alcohol-attributable conditions listed 3 were calculated as a function of
the prevalence of each drinking category in each age/sex/ethnicity subgroup and the relative risks for
each drinking category compared to lifetime abstainers. The drinking categories used in these AAF
calculations were based on estimates of the average daily volume of alcohol consumed, and ex-
drinkers were separated from lifetime abstainers (see Tables 7–10). Therefore, the following formula
is suitable for conditions where drinking pattern has not been shown to impact the risk of mortality:
(1)
where,
i = the average daily alcohol consumption category (0 = the referent abstainer category)
k = the number of alcohol consumption categories
AFi = population attributable fraction for a specific alcohol consumption category
pi = prevalence of alcohol consumption for category i
RRi = the risk of mortality at alcohol consumption category i compared to abstainers
For each condition, the overall AAF for all categories of alcohol consumption was calculated for each
age/sex/ethnicity subgroup by summing the AFi across all alcohol consumption categories.
AAFs were calculated using equation 1 (with k = 4) for all cancers, epilepsy, hypertensive heart
disease, cardiac arrhythmias, ischaemic and haemorrhagic strokes, oesophageal varices,
cholelithiasis, pancreatitis, tuberculosis, lower respiratory infections, and diabetes mellitus.
Since drinking prior to pregnancy has not been shown to influence birth weight, ex-drinkers and
lifetime abstainers were grouped together in a single category for the calculation of low birth weight
AAFs. The prevalence of pregnant women aged 15–44 years in each alcohol consumption category
was used to calculate the AAFs by ethnicity with equation 1 (k = 3).
Ischaemic heart disease: AAFs were calculated using equation 1 (with k = 6). In contrast to the
three sex-specific average alcohol consumption categories used for the conditions listed above, the
four ischaemic heart disease average alcohol consumption categories were identical for men and
women. Drinking pattern was also factored into the ischaemic heart disease equation, with an
additional category and RR estimate for ‘people with irregular HDOs’. See Appendix E and the
‘Relative risk estimates (mortality): Ischaemic heart disease’ section starting on page 140 for more
information about RR and prevalence estimates for the ischaemic heart disease alcohol consumption
categories.

35
Unipolar depressive disorders: AAFs were not estimated with equation 1. The relationship between
unipolar depressive disorders and alcohol consumption is complicated by a potentially bidirectional
causal pathway (i.e. depression can cause self-medication with alcohol and/or alcohol use can cause
depression) and genetic and environmental confounding factors that impact both depression and
alcohol consumption.2,17 During the first stage of updating the estimates for the alcohol-attributable
burden of mortality and morbidity for the GBD 2005/2010 study, Rehm et al. agreed that sufficient
evidence exists that some of the unipolar depression is caused by alcohol consumption.2 Despite this
general agreement, the GBD 2005/2010 study did not include unipolar depressive disorders as an
alcohol-attributable condition category due to the lack of available data for estimating RRs or AAFs.2,6
A previous approach proposed by Rehm et al. estimated AAFs of depressive disorders directly from
the prevalence of alcohol dependence in people aged ≥15 years in different subregions of the world.17
This analysis resulted in Wpr-A subregion AAFs for major depression of 3.84% for males and 1.31%
for females. In the absence of more accurate New Zealand-based AAF estimates, we applied these
Wpr-A AAFs to the 2004 and 2007 New Zealand mortality data. These calculations showed that no
unipolar depressive disorder deaths were attributable to alcohol in New Zealand, so we chose to omit
depression from the mortality analysis.
Relative risk estimates (mortality)
Table 13 shows the male and female relative risk values used in the mortality AAF calculations for
each partially alcohol-related condition, with lifetime abstainers as the reference group. These sex-
specific relative risk values for ex-drinkers and three levels of average daily alcohol consumption were
supplied by the Global Burden of Disease 2010 Risk Factors Collaborating Group.
As described in detail by Rehm et al.,2 these RRs were based on the best available estimates of each
alcohol-condition causal association, and were mainly derived from systematic literature reviews of
the most recent meta-analysis data available. The categorical relative risk estimates provided to us by
the GBD 2010 Risk Factors Collaborating Group were calculated based on the midpoint of each
alcohol consumption category using the continuous function of the respective meta-analyses cited in
Rehm et al.2 RRs for the open-ended consumption categories (i.e. 40+ and 60+ grams of alcohol per
day) were calculated by using the cut-off number plus 1.5 times the width of the previous consumption
category. For example, the RR for men who consumed 60+ grams of alcohol per day was estimated
using the value of 90g = [60g + 1.5 * (59.99g – 40g)].

36
Table 13: Mortality relative risks for partially alcohol-attributable (non-injury) conditions, excluding ischaemic heart disease.
Average daily alcohol consumption*
Males Females
Ex† I II III Ex† I II III
Cancers
Mouth and 1.21 1.66 3.11 4.70 1.44 1.30 2.08 3.40
Oesophagus cancer 1.21 1.30 1.93 2.65 1.44 1.14 1.48 2.05
Colon cancer 1.21 1.04 1.10 1.15 1.44 1.02 1.06 1.11
Rectum cancer 1.21 1.07 1.19 1.30 1.44 1.04 1.11 1.21
Liver cancer 1.21 1.15 1.40 1.61 1.44 1.08 1.23 1.44
Laryngeal cancer 1.21 1.33 2.02 2.82 1.44 1.15 1.53 2.16
Female breast cancer NA NA NA NA 1.44 1.09 1.30 1.62
Neuro-psychiatric disorders
Epilepsy 1 1.29 1.86 2.53 1.44 1.14 1.45 1.98
Cardiovascular disorders
Hypertensive heart 1 1.20 1.57 1.97 1.00 0.89 1.61 3.16
Cardiac arrhythmias 1 1.12 1.33 1.54 1.44 1.06 1.19 1.37
Ischaemic stroke 1 0.91 1.10 1.29 1.15 0.66 0.78 1.22
Haemorrhagic stroke 1 1.15 1.41 1.68 1.15 1.16 1.55 2.24
Digestive disorders
Oesophageal varices 1 1.76 4.06 8.17 6.50 2.82 5.97 11.20
Cholelithiasis 1.00 0.82 0.68 0.50 1.00 0.82 0.68 0.50
Pancreatitis 1.21 1.06 1.46 2.34 1.44 1.02 1.15 1.58
Conditions arising during
pregnancy
Low birth weight NA NA NA NA 1.00 1.00 1.35 2.11
Respiratory disorders
Tuberculosis 1.21 1.00 2.96 2.96 1.44 1.00 1.00 2.96
Lower respiratory
infections: pneumonia 1.21 1.10 1.27 1.43 1.44 1.05 1.15 1.30
Diabetes mellitus 1.18 0.87 0.95 1.11 1.14 0.68 0.62 1.41
* Alcohol consumption categories measured in average grams of pure alcohol consumed per day. Males: Ex: 0 g (ex-drinkers), I: 0.01−39.99 g, II: 40−59.99 g, and III: 60+ g. Females: Ex: 0 g (ex-drinkers), I: 0.01−19.99 g, II: 20−39.99 g, and III: 40+ g. † In keeping with the GBD 2005/2010 study methods,2 all-cause mortality relative risks for ex-drinkers were used for selected conditions where separate RRs were not computed (i.e. all cancers, epilepsy, cardiac arrhythmias, pancreatitis, tuberculosis, and lower respiratory infections: pneumonia). NA = Not applicable.

37
Each relative risk represents the ratio of the probability of an exposed person (i.e. drinker or ex-
drinker) dying from the condition compared to an unexposed person (i.e. lifetime abstainer), when all
other factors are equal. A relative risk of 1.00 means there is no difference in mortality risk between
people in a specific alcohol consumption category and abstainers, while relative risk values greater
than 1.00 mean that drinkers/ex-drinkers have an increased risk of mortality compared to abstainers,
and relative risk values less than 1.00 indicate that drinkers/ex-drinkers have a reduced risk of
mortality compared to abstainers. For example, Table 13 shows that female drinkers with daily
average consumptions of less than 20 grams of alcohol (consumption category I) are 1.3 times more
likely to die from mouth/oropharyngeal cancer than female abstainers, while female drinkers who
consume an average of 40 or more grams of alcohol per day (consumption category III) are 3.4 times
more likely to die from mouth/oropharyngeal cancer than female abstainers. Conversely, for
cholelithiasis (gallstones), females who drink 40+ grams of alcohol per day have a relative risk of
0.50, which means that the heaviest female drinkers are half as likely to die from cholelithiasis than
female abstainers.
As shown by equation 1, the impact of RR values on the AAF estimates for the age/sex/ethnicity
subgroups depends largely on the corresponding alcohol consumption category prevalences for each
subgroup. Large RRs for a given alcohol-condition relationship do not automatically result in large
AAFs, since very few deaths would be attributable to alcohol consumption if only a small proportion of
a given subgroup consumes alcohol at the level(s) for which the large RRs are applied. On the other
hand, if a large proportion of the subgroup consumes alcohol, even small RRs could result in large
AAFs.
Detrimental impact
For most alcohol-related conditions in both men and women, current and past alcohol consumption
has a detrimental impact on mortality compared to abstention. The magnitude of this negative impact
usually increases with the average daily volume of alcohol consumed, as shown in Table 13 by RR
values that increase with each level of alcohol consumption.
Beneficial impact
Cholelithiasis is the only condition for which all levels of current alcohol consumption have
consistently been found to confer protection compared to abstention, with 18−50% relative reductions
in risk of mortality due to cholelithiasis for both men and women.
Detrimental or beneficial impact
Diabetes mellitus: Compared to abstainers, men and women with the highest levels of average daily
alcohol consumption have an increased risk of death due to diabetes mellitus. Women who consume
more than 40 grams of alcohol per day are 1.41 times more likely to die from diabetes mellitus
compared to female abstainers, while men who drink more than 60 grams of alcohol per day are 1.11
times more likely to die from diabetes mellitus compared to male abstainers. Male and female ex-
drinkers also have an increased risk compared to lifetime abstainers. However, alcohol consumption
has a protective effect on diabetes mortality for all low- and medium-volume drinkers. The strength of
this beneficial association is largest in female drinkers, with reductions in mortality risk of

38
approximately one-third compared to female abstainers. The benefits experienced by male drinkers
compared to male abstainers are small (5–13%).
Hypertensive heart disease: As average daily alcohol consumption levels increase, so does the risk
of mortality from hypertensive heart disease in both men and women. The relative risks from this
strong association show that the heaviest male drinkers (60+ grams of alcohol per day) are twice as
likely to die from hypertensive heart disease compared to male abstainers, while the heaviest female
drinkers (40+ grams of alcohol per day) have more than a threefold increase in mortality risk
compared to female abstainers. The only exception to this pattern is a small reduction in risk (11%)
found in women who drink less than 20 grams of alcohol per day compared to abstainers.
Ischaemic stroke: Men and women with the highest levels of average daily alcohol consumption and
male and female ex-drinkers all experience increased risks of ischaemic stroke mortality compared to
abstainers. Males in consumption category II (40–59.99 grams of alcohol per day) also have a slightly
higher risk of death than abstainers, while men in consumption category I (0.01–39.99 grams of
alcohol per day) have a small reduction in risk (9%) of ischaemic stroke mortality compared to
abstainers. A protective effect is also found in the lowest and middle categories of female drinkers,
with 34% and 22% reductions in risk of dying from ischaemic stroke compared to female abstainers,
respectively.
Ischaemic heart disease: Table 14 shows the sex-specific relative risk values for ischaemic heart
disease mortality by average daily alcohol consumption, with lifetime abstainers as the reference
group. Drinking pattern was also accounted for when calculating the impact of alcohol on ischaemic
heart disease: a proportion of people with irregular heavy drinking occasions (people who consumed
over 60 grams of alcohol per drinking occasion at least monthly, but not daily) were assigned relative
risks of 1.00, since irregular heavy drinking occasions eliminate the beneficial impact of regular
alcohol consumption. For calculation details, please see the ‘Methodological developments:
Ischaemic heart disease’ section starting on page 68 and Appendix E.
As shown in Table 14, alcohol consumption has a detrimental impact on the risk of ischaemic heart
disease mortality for all former drinkers, with male and female ex-drinkers 1.21 and 1.39 times more
likely to die from ischaemic heart disease compared to male and female lifetime abstainers,
respectively. Women with regular heavy drinking occasions (average 60+ grams of alcohol per day)
are also at increased risk, as they are twice as likely to die from ischaemic heart disease compared to
female lifetime abstainers.
On the other hand, regular alcohol consumption has been associated with a reduced risk of ischaemic
heart disease mortality for all male drinkers, with mortality risk reductions of 12−23% compared to
male lifetime abstainers. Female drinkers who consume less than 60 grams of alcohol per day also
show a beneficial association between alcohol consumption and reduced ischaemic heart disease
mortality, with mortality risk reductions of 10−34% compared to female lifetime abstainers.

39
Table 14: Mortality relative risks for ischaemic heart disease.*
Average daily alcohol
consumption Males Females
Abstainers 1.00 1.00
Ex-drinkers† 1.21 1.39
0.01–19.99 g/day 0.86 0.88
20–39.99 g/day 0.79 0.66
40–59.99 g/day 0.88 0.90
60+ g/day 0.77 2.08
* RRs provided by Roerecke and Rehm.37 In addition to these RRs, people with irregular heavy drinking occasions were assigned RRs of 1.00 (see 0 for details). RR calculations used all available data points from meta-analysis studies that reported estimates stratified by sex and endpoint (mortality vs. morbidity). If multiple estimates per study were reported within any alcohol consumption category, those estimates were pre-pooled using fixed effect models. RRs based on current abstainer rather than long-term abstainer were adjusted to include the effect of ex-drinker for mortality estimates. The results presented are from random effect models. † RRs for ex-drinkers are from a separate analysis.2
AAFs for partially alcohol-attributable injuries
Derivation of AAFs for injuries required a different approach than for conditions, as injury risk is
impacted by drinking pattern as well as average daily alcohol consumption.
Injury AAFs for adults (15–79 years old)
We planned to estimate new injury AAFs using the most recent Global Burden of Disease (GBD)
modelling methods to incorporate New Zealand data on average alcohol consumption and detailed
drinking patterns for each age/sex/ethnicity-specific subgroup. However, the GBD methodology,
which has been optimised for the scale of World Health Organization sub-regions, did not perform
well with our country-level New Zealand data. In particular, the model did not appear robust to the
extreme drinking patterns in the younger New Zealand age categories. A limitation of using a single
approach for calculating injury AAFs for different countries is that injury AAFs are not only influenced
by alcohol consumption volumes and patterns, but also by the context in which drinking takes place.
For example, the proportion of alcohol-attributable motor vehicle accidents amongst young people
depends not only on drinking patterns, but also on the factors that lead to driving while drinking. Such
complex context-dependent factors vary from country to country and are difficult to quantify. Due to
the lack of external validity of the modelled AAFs for some groups, we decided to use locally derived
AAFs as for the previous report.
A literature search for recent New Zealand-based estimates of alcohol-related injury risk did not yield
new data from which to update the injury AAFs used in the previous NZBoA2000/02 report. The

40
alcohol-attributable road traffic injury (RTI) death estimates calculated with NZBoA2000/02 injury
AAFs were largely consistent with the numbers of alcohol-attributable RTI deaths derived directly from
routine 2003–2007 New Zealand data.42 In contrast, the use of GBD injury AAFs resulted in higher
numbers of alcohol-attributable RTI deaths and implausibly high AAFs for the younger age categories
that differed markedly from the age-specific AAFs calculated directly from New Zealand data.
Taking these issues into consideration, we used the NZBoA2000/02 age/sex/ethnicity-specific injury
AAF estimates1 for our main injury burden analyses, as they are the most reliable New Zealand injury
AAFs currently available. As in the NZBoA2000/02 report, we used a 1.5 multiplier to account for the
impact of ethnicity-specific drinking patterns on specific injury AAFs, a decision that was further
supported by the magnitude of ethnic differences present in the drinking pattern-dependent injury
AAFs calculated by the GBD 2010 Risk Factors Collaborating Group. Our injury burden analysis must
therefore be taken as conservative, since it only reflects changes in the absolute numbers of injuries
since 2000 and not changes in alcohol consumption volumes or patterns, or secular trends such as
the reductions in road traffic injury generally. However, we considered this a better option than having
most of the change in injury burden being the result of a different methodology that produces results
that are incongruent with local data.
A detailed description of how the injury AAFs were derived can be found in the NZBoA2000/02
report.1 In the interest of completeness, we also performed a sensitivity analysis using the injury AAFs
calculated by the GBD 2010 Risk Factors Collaborating Group (see Appendix C for injury sensitivity
analysis methods and results).
Injury AAFs for children (under 15 years old)
Similar to the previous NZBoA2000/02 report, the analysis of injury outcomes in people under 15
years of age was restricted to the secondary effects of drinking by another person. The consequences
of drinking in under 15 year olds were excluded since very few reliable epidemiological studies have
been conducted about the prevalence or risk of alcohol consumption in this age category.
Road traffic injuries and fires
Given the lack of reliable estimates of injury relative risks for children, AAFs for child deaths due to
road traffic injuries and fires (attributable to another person’s alcohol use) were calculated directly
using the best available New Zealand data.
For children under 15 years old, AAFs were estimated directly from New Zealand statistics that
showed that 20% of road traffic deaths were related to alcohol between 2003 and 2007 (data from the
New Zealand Crash Analysis System of Land Transport (now the NZ Transport Agency); adjusted for
under-reporting and under-measurement of alcohol).42 Since ethnicity information was not available
for these data, the 20% AAF was used for both Māori and non-Māori children.
For residential house fires causing death of children under 15 years old, data from 1997–2003
indicate that 24% of these deaths were secondary to alcohol use (BAC >0.08) by the person
responsible.43 Although ethnicity information was available for these data, accurate calculation of
separate AAFs for Māori and non-Māori children was not possible due to the small sample size (n =
10). The 24% AAF was therefore used for both Māori and non-Māori children.

41
Other unintentional injuries and assault
Updated AAF estimates were not available for the ‘other unintentional injuries’ or ‘assault’ categories,
so we used the same AAFs as the NZBoA2000/02 report for 0–14 year old males and females.1
Mortality AAF estimates
Although we have presented our AAF estimates as point estimates in this report, it is important to
understand that each of these estimates has an unquantified degree of uncertainty. As previously
discussed, AAFs are calculated with formulae that use the best estimates currently available for
relative risks and population alcohol consumption measures. Therefore, the accuracy of each AAF
estimate presented in this report depends on the availability and quality of both the relative risks and
alcohol consumption estimates used for its calculation. This is an unavoidable methodological
limitation common to all AAF estimates that has been discussed by the GBD 2010 Risk Factors
Collaborating Group.2
Alcohol-attributable condition AAFs
The 2004 and 2007 mortality alcohol-attributable fraction (AAF) estimates for conditions are shown for
each age/sex subgroup of Māori and non-Māori New Zealanders in Tables 15–18.
Alcohol-attributable injury AAFs
The mortality alcohol-attributable fraction (AAF) estimates for injuries are shown for each age/sex
subgroup of Māori and non-Māori New Zealanders in Tables 19–20.

42
Table 15: 2004 mortality AAFs for (non-injury) conditions: Māori population.*
Māori males Māori females
0–4 5–14 15–29 30–44 45–59 60–69 70–79 0–4 5–14 15–29 30–44 45–59 60–69 70–79
Mouth and oropharynx cancers 59.0% 49.3% 44.6% 45.6% 43.5% 43.2% 33.2% 31.6% 27.8% 24.7%
Oesophagus cancer 39.4% 31.1% 27.8% 28.7% 27.1% 26.4% 21.2% 20.4% 20.0% 20.5%
Colon cancer 7.0% 6.8% 7.4% 7.7% 7.5% 6.6% 9.2% 9.5% 13.1% 16.9%
Rectum cancer 12.0% 10.4% 10.3% 10.7% 10.3% 9.5% 10.8% 11.0% 14.1% 17.4%
Liver cancer 21.4% 17.6% 16.5% 17.0% 16.3% 15.4% 14.5% 14.3% 16.3% 18.6%
Laryngeal cancer 41.6% 33.0% 29.5% 30.4% 28.7% 28.1% 22.2% 21.3% 20.7% 20.8%
Female breast cancer 18.9% 16.4% 16.1% 17.3% 19.1%
Alcohol use disorders 100% 100% 100% 100% 100% 100% 100% 100% 100% 100% 100% 100% 100% 100%
Epilepsy 37.8% 29.8% 26.7% 27.6% 26.1% 25.4% 20.6% 19.8% 19.7% 20.4%
Hypertensive heart disease 28.2% 21.1% 18.0% 18.5% 17.3% 28.7% 10.9% 9.7% 0.9% -5.2%
Ischaemic heart disease -14.8% -11.1% -7.8% -8.0% -7.9% 5.5% 1.5% 2.1% 4.0% 10.9%
Cardiac arrhythmias 19.0% 15.4% 14.5% 15.0% 14.3% 13.5% 13.2% 13.1% 15.4% 18.1%
Ischaemic stroke 4.2% 1.2% 2.5% 3.0% 2.2% -19.2% -21.7% -18.9% -15.6% -9.2%
Haemorrhagic stroke 22.7% 18.9% 18.1% 18.8% 18.0% 28.0% 19.6% 18.4% 15.0% 12.0%
Oesophageal varices 70.7% 59.3% 53.6% 55.2% 52.2% 79.4% 75.6% 74.9% 75.3% 76.5%
Alcoholic liver cirrhosis 100% 100% 100% 100% 100% 100% 100% 100% 100% 100% 100% 100% 100% 100%
Cholelithiasis -32.3% -23.6% -19.6% -20.3% -19.3% -29.3% -19.6% -17.5% -13.2% -8.7%
Pancreatitis 28.9% 18.7% 15.8% 17.0% 15.2% 14.1% 12.0% 12.1% 13.9% 16.8%
Low birth weight 7.3% 7.3%
Fetal alcohol syndrome 100% 100% 100% 100% 100% 100% 100% 100% 100% 100% 100% 100% 100% 100%
Tuberculosis 40.0% 26.0% 21.1% 21.0% 17.1% 27.5% 16.8% 17.0% 14.0% 16.3%
Lower respiratory infections: pneumonia 16.0% 13.2% 12.7% 13.1% 12.6% 11.7% 12.2% 12.2% 14.8% 17.8%
Diabetes mellitus -3.7% -5.8% -4.4% -4.1% -4.6% -16.5% -20.8% -17.6% -16.0% -8.9%
* These AAFs were used for calculating 2004 alcohol-attributable deaths and YLLs. AAF estimates for 60+ years have more uncertainty due to smaller sample sizes and the use of extrapolated alcohol consumption estimates.
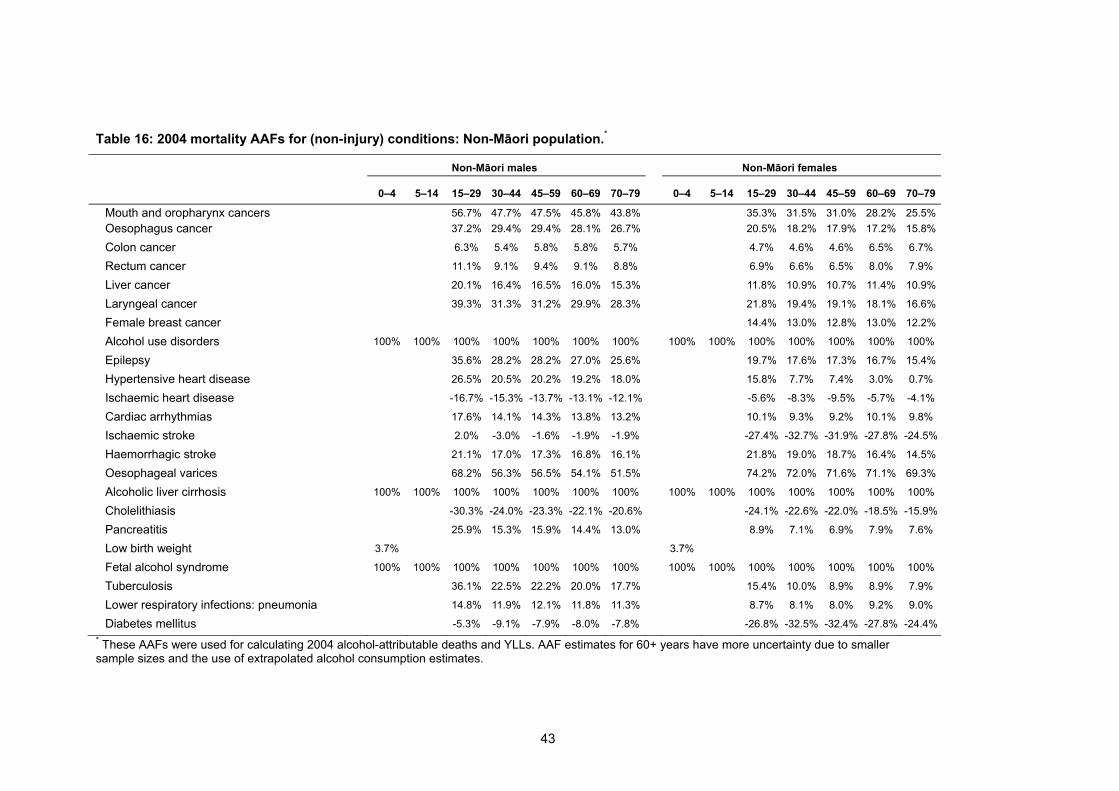
43
Table 16: 2004 mortality AAFs for (non-injury) conditions: Non-Māori population.*
Non-Māori males Non-Māori females
0–4 5–14 15–29 30–44 45–59 60–69 70–79 0–4 5–14 15–29 30–44 45–59 60–69 70–79
Mouth and oropharynx cancers 56.7% 47.7% 47.5% 45.8% 43.8% 35.3% 31.5% 31.0% 28.2% 25.5%
Oesophagus cancer 37.2% 29.4% 29.4% 28.1% 26.7% 20.5% 18.2% 17.9% 17.2% 15.8%
Colon cancer 6.3% 5.4% 5.8% 5.8% 5.7% 4.7% 4.6% 4.6% 6.5% 6.7%
Rectum cancer 11.1% 9.1% 9.4% 9.1% 8.8% 6.9% 6.6% 6.5% 8.0% 7.9%
Liver cancer 20.1% 16.4% 16.5% 16.0% 15.3% 11.8% 10.9% 10.7% 11.4% 10.9%
Laryngeal cancer 39.3% 31.3% 31.2% 29.9% 28.3% 21.8% 19.4% 19.1% 18.1% 16.6%
Female breast cancer 14.4% 13.0% 12.8% 13.0% 12.2%
Alcohol use disorders 100% 100% 100% 100% 100% 100% 100% 100% 100% 100% 100% 100% 100% 100%
Epilepsy 35.6% 28.2% 28.2% 27.0% 25.6% 19.7% 17.6% 17.3% 16.7% 15.4%
Hypertensive heart disease 26.5% 20.5% 20.2% 19.2% 18.0% 15.8% 7.7% 7.4% 3.0% 0.7%
Ischaemic heart disease -16.7% -15.3% -13.7% -13.1% -12.1% -5.6% -8.3% -9.5% -5.7% -4.1%
Cardiac arrhythmias 17.6% 14.1% 14.3% 13.8% 13.2% 10.1% 9.3% 9.2% 10.1% 9.8%
Ischaemic stroke 2.0% -3.0% -1.6% -1.9% -1.9% -27.4% -32.7% -31.9% -27.8% -24.5%
Haemorrhagic stroke 21.1% 17.0% 17.3% 16.8% 16.1% 21.8% 19.0% 18.7% 16.4% 14.5%
Oesophageal varices 68.2% 56.3% 56.5% 54.1% 51.5% 74.2% 72.0% 71.6% 71.1% 69.3%
Alcoholic liver cirrhosis 100% 100% 100% 100% 100% 100% 100% 100% 100% 100% 100% 100% 100% 100%
Cholelithiasis -30.3% -24.0% -23.3% -22.1% -20.6% -24.1% -22.6% -22.0% -18.5% -15.9%
Pancreatitis 25.9% 15.3% 15.9% 14.4% 13.0% 8.9% 7.1% 6.9% 7.9% 7.6%
Low birth weight 3.7% 3.7%
Fetal alcohol syndrome 100% 100% 100% 100% 100% 100% 100% 100% 100% 100% 100% 100% 100% 100%
Tuberculosis 36.1% 22.5% 22.2% 20.0% 17.7% 15.4% 10.0% 8.9% 8.9% 7.9%
Lower respiratory infections: pneumonia 14.8% 11.9% 12.1% 11.8% 11.3% 8.7% 8.1% 8.0% 9.2% 9.0%
Diabetes mellitus -5.3% -9.1% -7.9% -8.0% -7.8% -26.8% -32.5% -32.4% -27.8% -24.4%
* These AAFs were used for calculating 2004 alcohol-attributable deaths and YLLs. AAF estimates for 60+ years have more uncertainty due to smaller sample sizes and the use of extrapolated alcohol consumption estimates.

44
Table 17: 2007 mortality AAFs for (non-injury) conditions: Māori population.*
Māori males Māori females
0–4 5–14 15–29 30–44 45–59 60–69 70–79 0–4 5–14 15–29 30–44 45–59 60–69 70–79
Mouth and oropharynx cancers 59.7% 55.6% 49.4% 45.6% 43.5% 46.1% 36.4% 32.8% 27.8% 24.7%
Oesophagus cancer 40.2% 36.4% 32.0% 28.7% 27.1% 29.0% 22.5% 21.5% 20.0% 20.5%
Colon cancer 7.5% 7.3% 9.3% 7.7% 7.5% 8.2% 8.0% 10.4% 13.1% 16.9%
Rectum cancer 12.6% 11.8% 12.5% 10.7% 10.3% 11.2% 10.0% 11.9% 14.1% 17.4%
Liver cancer 22.2% 20.3% 19.1% 17.0% 16.3% 17.4% 14.5% 15.3% 16.3% 18.6%
Laryngeal cancer 42.4% 38.5% 33.8% 30.4% 28.7% 30.7% 23.8% 22.5% 20.7% 20.8%
Female breast cancer 21.1% 16.9% 17.1% 17.3% 19.1%
Alcohol use disorders 100% 100% 100% 100% 100% 100% 100% 100% 100% 100% 100% 100% 100% 100%
Epilepsy 38.6% 34.9% 30.8% 27.6% 26.1% 27.9% 21.8% 21.0% 19.7% 20.4%
Hypertensive heart disease 28.8% 25.5% 20.5% 18.5% 17.3% 32.3% 15.0% 8.3% 0.9% -5.2%
Ischaemic heart disease -16.0% -13.7% -5.7% -8.1% -8.0% 9.2% 1.2% 5.1% 4.0% 10.9%
Cardiac arrhythmias 19.7% 17.9% 17.2% 15.0% 14.3% 15.5% 13.0% 14.1% 15.4% 18.1%
Ischaemic stroke 3.9% 2.7% 7.4% 3.0% 2.2% -17.2% -25.7% -22.8% -15.6% -9.2%
Haemorrhagic stroke 23.5% 21.6% 21.5% 18.8% 18.0% 30.3% 22.2% 19.2% 15.0% 12.0%
Oesophageal varices 71.2% 66.5% 60.4% 55.2% 52.2% 81.4% 76.8% 76.3% 75.3% 76.5%
Alcoholic liver cirrhosis 100% 100% 100% 100% 100% 100% 100% 100% 100% 100% 100% 100% 100% 100%
Cholelithiasis -34.5% -29.5% -21.3% -20.3% -19.3% -32.1% -24.0% -19.5% -13.2% -8.7%
Pancreatitis 29.2% 24.5% 21.7% 17.0% 15.2% 16.6% 11.9% 12.9% 13.9% 16.8%
Low birth weight 7.3% 7.3%
Fetal alcohol syndrome 100% 100% 100% 100% 100% 100% 100% 100% 100% 100% 100% 100% 100% 100%
Tuberculosis 39.5% 34.8% 29.0% 21.0% 17.1% 31.9% 18.8% 18.4% 14.0% 16.3%
Lower respiratory infections: pneumonia
16.6% 15.3% 15.1% 13.1% 12.6% 13.6% 11.7% 13.2% 14.8% 17.8%
Diabetes mellitus -4.5% -5.3% -0.8% -4.1% -4.6% -13.5% -24.2% -20.5% -16.0% -8.9%
* These AAFs were used for calculating 2007 alcohol-attributable deaths and YLLs. AAF estimates for 60+ years have more uncertainty due to smaller sample sizes and the use of extrapolated alcohol consumption estimates.
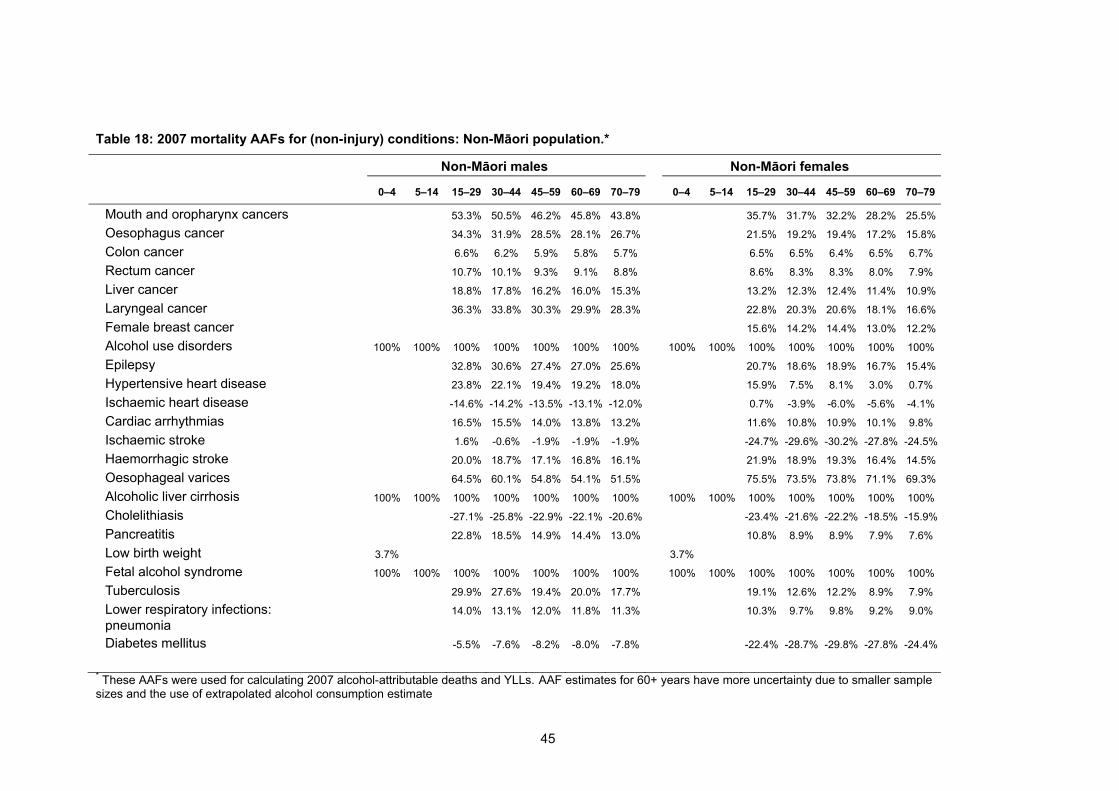
45
Table 18: 2007 mortality AAFs for (non-injury) conditions: Non-Māori population.*
Non-Māori males Non-Māori females
0–4 5–14 15–29 30–44 45–59 60–69 70–79 0–4 5–14 15–29 30–44 45–59 60–69 70–79
Mouth and oropharynx cancers 53.3% 50.5% 46.2% 45.8% 43.8% 35.7% 31.7% 32.2% 28.2% 25.5%
Oesophagus cancer 34.3% 31.9% 28.5% 28.1% 26.7% 21.5% 19.2% 19.4% 17.2% 15.8%
Colon cancer 6.6% 6.2% 5.9% 5.8% 5.7% 6.5% 6.5% 6.4% 6.5% 6.7%
Rectum cancer 10.7% 10.1% 9.3% 9.1% 8.8% 8.6% 8.3% 8.3% 8.0% 7.9%
Liver cancer 18.8% 17.8% 16.2% 16.0% 15.3% 13.2% 12.3% 12.4% 11.4% 10.9%
Laryngeal cancer 36.3% 33.8% 30.3% 29.9% 28.3% 22.8% 20.3% 20.6% 18.1% 16.6%
Female breast cancer 15.6% 14.2% 14.4% 13.0% 12.2%
Alcohol use disorders 100% 100% 100% 100% 100% 100% 100% 100% 100% 100% 100% 100% 100% 100%
Epilepsy 32.8% 30.6% 27.4% 27.0% 25.6% 20.7% 18.6% 18.9% 16.7% 15.4%
Hypertensive heart disease 23.8% 22.1% 19.4% 19.2% 18.0% 15.9% 7.5% 8.1% 3.0% 0.7%
Ischaemic heart disease -14.6% -14.2% -13.5% -13.1% -12.0% 0.7% -3.9% -6.0% -5.6% -4.1%
Cardiac arrhythmias 16.5% 15.5% 14.0% 13.8% 13.2% 11.6% 10.8% 10.9% 10.1% 9.8%
Ischaemic stroke 1.6% -0.6% -1.9% -1.9% -1.9% -24.7% -29.6% -30.2% -27.8% -24.5%
Haemorrhagic stroke 20.0% 18.7% 17.1% 16.8% 16.1% 21.9% 18.9% 19.3% 16.4% 14.5%
Oesophageal varices 64.5% 60.1% 54.8% 54.1% 51.5% 75.5% 73.5% 73.8% 71.1% 69.3%
Alcoholic liver cirrhosis 100% 100% 100% 100% 100% 100% 100% 100% 100% 100% 100% 100% 100% 100%
Cholelithiasis -27.1% -25.8% -22.9% -22.1% -20.6% -23.4% -21.6% -22.2% -18.5% -15.9%
Pancreatitis 22.8% 18.5% 14.9% 14.4% 13.0% 10.8% 8.9% 8.9% 7.9% 7.6%
Low birth weight 3.7% 3.7%
Fetal alcohol syndrome 100% 100% 100% 100% 100% 100% 100% 100% 100% 100% 100% 100% 100% 100%
Tuberculosis 29.9% 27.6% 19.4% 20.0% 17.7% 19.1% 12.6% 12.2% 8.9% 7.9%
Lower respiratory infections: pneumonia
14.0% 13.1% 12.0% 11.8% 11.3% 10.3% 9.7% 9.8% 9.2% 9.0%
Diabetes mellitus -5.5% -7.6% -8.2% -8.0% -7.8% -22.4% -28.7% -29.8% -27.8% -24.4%
* These AAFs were used for calculating 2007 alcohol-attributable deaths and YLLs. AAF estimates for 60+ years have more uncertainty due to smaller sample sizes and the use of extrapolated alcohol consumption estimate

46
Table 19: 2004 and 2007 mortality AAFs for injuries: Māori population.*
Māori males Māori females
0–4 5–14 15–29 30–44 45–59 60–69 70–79 0–4 5–14 15–29 30–44 45–59 60–69 70–79
Road traffic injuries 20.0% 20.0% 60.4% 58.7% 20.6% 13.7% 13.7% 20.0% 20.0% 36.8% 34.6% 10.8% 3.1% 3.1%
Alcohol poisonings 100% 100% 100% 100% 100% 100% 100% 100% 100% 100% 100% 100% 100% 100%
Non-alcohol poisonings 51.9% 28.6% 28.6% 28.6% 14.3% 39.9% 26.0% 26.0% 26.0% 12.1%
Falls 39.4% 39.4% 39.4% 30.4% 21.5% 24.3% 24.3% 24.3% 15.6% 6.9%
Fires 24.0% 24.0% 51.9% 51.9% 43.0% 43.0% 43.0% 24.0% 24.0% 39.9% 39.9% 32.9% 32.9% 32.9%
Drownings 46.5% 55.5% 55.5% 44.8% 44.8% 43.3% 52.0% 52.0% 41.6% 41.6%
Other unintentional injuries 28.6% 28.6% 51.9% 51.9% 43.0% 43.0% 43.0% 8.7% 8.7% 39.9% 39.9% 32.9% 32.9% 32.9%
Self-inflicted injuries 17.9% 17.9% 13.1% 13.1% 6.0% 11.6% 11.6% 9.2% 9.2% 5.8%
Assault 25.1% 25.1% 48.3% 48.3% 48.3% 48.3% 48.3% 24.3% 24.3% 46.8% 46.8% 46.8% 46.8% 46.8%
Other intentional injuries 23.9% 23.9% 23.9% 23.9% 11.9% 23.1% 23.1% 23.1% 23.1% 11.6%
* These AAFs were used for calculating 2004 and 2007 alcohol-attributable deaths and YLLs.

47
Table 20: 2004 and 2007 mortality AAFs for injuries: Non-Māori population.*
Non-Māori males Non-Māori females
0–4 5–14 15–29 30–44 45–59 60–69 70–79 0–4 5–14 15–29 30–44 45–59 60–69 70–79
Road traffic injuries 20.0% 20.0% 40.3% 39.1% 13.8% 9.1% 9.1% 20.0% 20.0% 24.6% 23.1% 7.2% 2.1% 2.1%
Alcohol poisonings 100% 100% 100% 100% 100% 100% 100% 100% 100% 100% 100% 100% 100% 100%
Non-alcohol poisonings 34.6% 19.1% 19.1% 19.1% 9.5% 26.6% 17.3% 17.3% 17.3% 8.1%
Falls 26.3% 26.3% 26.3% 20.3% 14.3% 16.2% 16.2% 16.2% 10.4% 4.6%
Fires 24.0% 24.0% 34.6% 34.6% 28.6% 28.6% 28.6% 24.0% 24.0% 26.6% 26.6% 21.9% 21.9% 21.9%
Drownings 31.0% 37.0% 37.0% 29.8% 29.8% 28.9% 34.7% 34.7% 27.7% 27.7%
Other unintentional injuries 19.1% 19.1% 34.6% 34.6% 28.6% 28.6% 28.6% 5.8% 5.8% 26.6% 26.6% 21.9% 21.9% 21.9%
Self-inflicted injuries 17.9% 17.9% 13.1% 13.1% 6.0% 11.6% 11.6% 9.2% 9.2% 5.8%
Assault 16.7% 16.7% 32.2% 32.2% 32.2% 32.2% 32.2% 16.2% 16.2% 31.2% 31.2% 31.2% 31.2% 31.2%
Other intentional injuries 23.9% 23.9% 23.9% 23.9% 11.9% 23.1% 23.1% 23.1% 23.1% 11.6%
* These AAFs were used for calculating 2004 and 2007 alcohol-attributable deaths and YLLs.

48
CALCULATING ALCOHOL-ATTRIBUTABLE DEATHS AND YEARS OF LIFE LOST (YLLS)
Alcohol-attributable deaths
To determine the number of deaths that were attributable to alcohol in New Zealand during 2004 and
2007, the mortality AAFs for each alcohol-related condition (2004: Tables 15 and 16; 2007: Tables 17
and 18) and injury (2004 and 2007: Tables 19 and 20) were multiplied by the total number of
corresponding cause-specific annual deaths in each age/sex/ethnicity subgroup. Alcohol-attributable
deaths due to low birth weight were calculated by applying the ethnicity-specific low birth weight
mortality AAFs to non-Māori and Māori deaths due to low birth weight (i.e. 0–4 years age category).
The absolute numbers of alcohol-attributable deaths in New Zealand are an important population
health indicator. However, other measures can incorporate additional information. Years of life lost
(YLLs) account for the fact that alcohol-attributable deaths due to some causes occur mainly in young
people (e.g. most injuries), while other causes mainly reduce the life expectancy of older people (e.g.
most cancers).44
Alcohol-attributable years of l ife lost (YLLs)
Alcohol-attributable YLLs are the years of life lost due to premature mortality caused by alcohol
consumption. We derived cause-specific YLLs from the New Zealand mortality data by multiplying the
number of alcohol-attributable deaths in each age/sex/ethnicity subgroup by the extra years of life
individuals in that age subgroup would have been expected to live if they had not consumed alcohol.
Our calculations used the ‘remaining life expectancy method’ outlined by Mathers et al., based on
Coale and Demeny West Level 26 and 25 model life tables with life expectancies at birth of 82.5
years for women and 80 for men.45 The method was applied to life expectancy calculations for both
Māori and non-Māori. Equation 2 shows the general approach used to calculate YLLs using life table
methods. For each age/sex subgroup and cause of death:
(2)
where N is the number of alcohol-attributable deaths due to a given cause and L is the life expectancy
for the corresponding age/sex category.46 Our YLL calculations also used 3% time-discounting and
age-weighting, methodologies that are consistent with recent Global Burden of Disease study
publications,47,48 other national-level burden of disease analyses,19,49 and the previous NZBoA2000/02
report.1
49
METHODS: ALCOHOL-ATTRIBUTABLE DALYS (2004)
SUMMARY
The previous methods section of this report calculated the numbers of deaths that were attributable to
alcohol in New Zealand during 2004 and 2007. The quantification of non-fatal alcohol-attributable
disability is an equally important component of our analysis, since some alcohol-related conditions
and injuries have long-term non-fatal consequences that are not captured by mortality estimates.
Several country-level and global burden of disease analyses have highlighted this as a particularly
important issue for neuro-psychiatric disorders since conditions such as alcohol use disorders and
unipolar depressive disorders have substantial impacts on population health despite their negligible
impacts on mortality.2,19,47,49,50
This section estimates the alcohol-attributable burden of disease and injury in New Zealand during
2004 only, because 2004 was the most recent year for which the estimates required for burden
calculations were available from the WHO Global Burden of Disease study. As described in detail in
the following section, we calculated the fatal and non-fatal health impacts of alcohol consumption for
each condition and injury, and then combined these impacts into a single summary measure.
As shown below, the alcohol-attributable burden of disease and injury in New Zealand was estimated
by age/sex subgroups but not by Māori and non-Māori ethnicity. This simplification was necessary
because the World Health Organization (WHO) 2004 Global Burden of Disease estimates that were
used as part of these analyses were not available for Māori and non-Māori separately.1
DISABILITY-ADJUSTED LIFE YEARS (DALYS)
The burden of disease and injury attributable to alcohol is quantified by using the disability-adjusted
life year (DALY), a standardised population health summary measure that combines morbidity and
mortality by estimating lost years of healthy life due to dying prematurely or to living with the negative
health consequences of alcohol.48 The DALY is the primary metric used by the WHO Global Burden
of Disease studies to assess and rank the burden of a wide variety of fatal and non-fatal population
health risk factors and outcomes.6 The WHO describes DALYs as “a measurement of the gap
between current health status and an ideal situation where everyone lives into old age, free of disease
and disability”, with zero alcohol use considered the ideal situation when calculating alcohol-
attributable DALYs.48
DALYs are calculated for each condition and injury by summing the alcohol-attributable years of life
lost due to premature death (YLLs) and the alcohol-attributable years of ‘healthy’ life lost due to living
in a state of poor health or disability (YLDs) as shown in equation 3 below:
(3)

50
For more details about our DALY data sources and calculations, please refer to the following sections:
‘Burden of disease and injury data’ (page 54) and ‘Calculating alcohol-attributable disability-adjusted
life years (DALYs)’ (page 61).
DIFFERENCES IN ALCOHOL-ATTRIBUTABLE CONDITION AND INJURY CATEGORIES BETWEEN MORTALITY AND DALY ANALYSES
Since our 2004 New Zealand alcohol-attributable burden of disease and injury calculations included
data received from the WHO Global Burden of Disease (GBD) study, only GBD categories of
conditions and injuries could be used for DALY calculations. This resulted in some differences from
the categories that were used to calculate alcohol-attributable deaths and YLLs from New Zealand
mortality data. See Table 3 (page 13) and Table 6 (page 17) for details about the condition and injury
categories used for mortality analyses.
The mortality analyses described in the first section of this report included minor New Zealand-
specific amendments to the ICD-10 codes that comprised the GBD condition and injury categories
(see Appendix A and Appendix B for detailed explanations). However, similar adjustments to the
specific ICD-10 codes used for each disease and injury category could not be made to the data that
was provided directly by the WHO for our alcohol-attributable burden of disease and injury
calculations.
The following text describes all other differences between condition and injury categories used for
DALY calculations and those previously used for mortality calculations (detailed in the ‘Methods:
Alcohol-attributable mortality (2004 & 2007)’ section). These differences were: the exclusion of six
condition categories; the inclusion of one new category in a sensitivity analysis (i.e. unipolar
depressive disorders); three instances where we adjusted WHO estimates to better match the
categories used in our mortality analyses (i.e. ischaemic and haemorrhagic stroke, colon and rectum
cancer, and lower respiratory infections); and two instances where we combined YLL and YLD
estimates that were based on slightly different categories since it was not possible to modify the WHO
estimates to match the more accurate categories used in our mortality analyses (i.e. cirrhosis of the
liver and poisoning).
Laryngeal cancer, cardiac arrhythmias, oesophageal varices,
cholelithiasis, pancreatit is, and fetal alcohol syndrome
The categories that were excluded from our burden of disease and injury analysis due to the absence
of corresponding GBD categories were: laryngeal cancer, cardiac arrhythmias, oesophageal varices,
cholelithiasis, pancreatitis, and fetal alcohol syndrome. These are the same categories that were
excluded from the DALY analyses of the NZBoA2000/02 report.
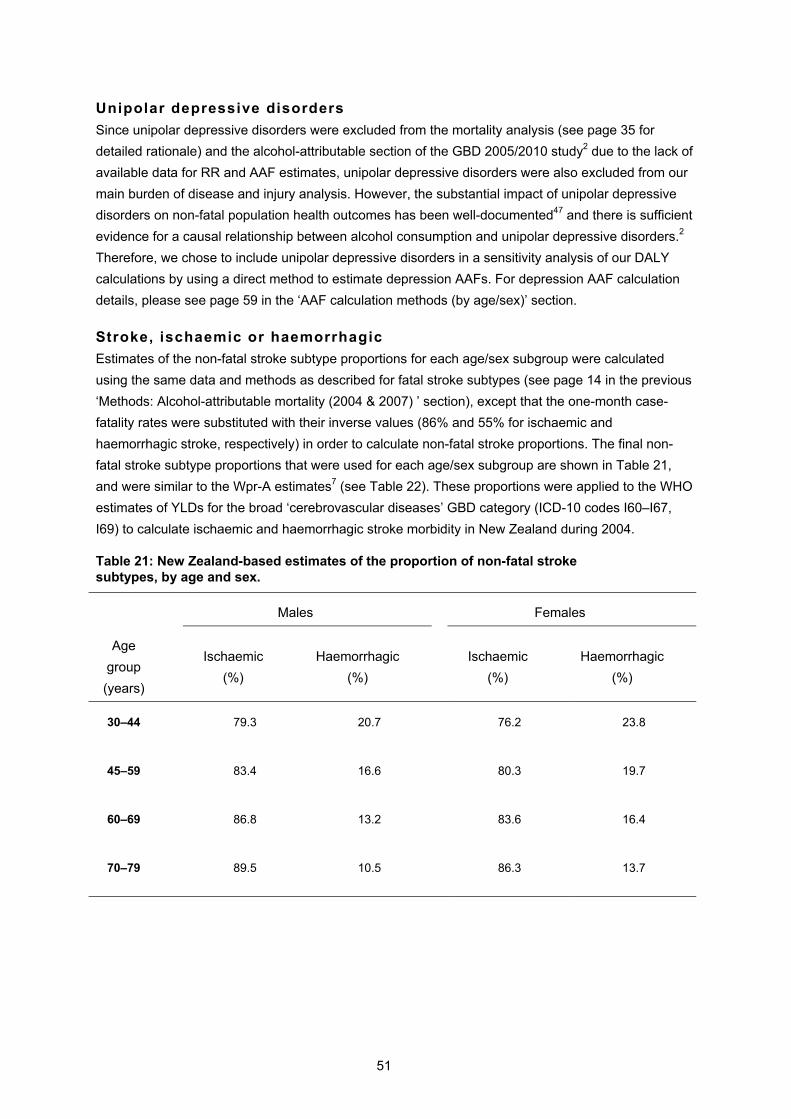
51
Unipolar depressive disorders
Since unipolar depressive disorders were excluded from the mortality analysis (see page 35 for
detailed rationale) and the alcohol-attributable section of the GBD 2005/2010 study2 due to the lack of
available data for RR and AAF estimates, unipolar depressive disorders were also excluded from our
main burden of disease and injury analysis. However, the substantial impact of unipolar depressive
disorders on non-fatal population health outcomes has been well-documented47 and there is sufficient
evidence for a causal relationship between alcohol consumption and unipolar depressive disorders.2
Therefore, we chose to include unipolar depressive disorders in a sensitivity analysis of our DALY
calculations by using a direct method to estimate depression AAFs. For depression AAF calculation
details, please see page 59 in the ‘AAF calculation methods (by age/sex)’ section.
Stroke, ischaemic or haemorrhagic
Estimates of the non-fatal stroke subtype proportions for each age/sex subgroup were calculated
using the same data and methods as described for fatal stroke subtypes (see page 14 in the previous
‘Methods: Alcohol-attributable mortality (2004 & 2007) ’ section), except that the one-month case-
fatality rates were substituted with their inverse values (86% and 55% for ischaemic and
haemorrhagic stroke, respectively) in order to calculate non-fatal stroke proportions. The final non-
fatal stroke subtype proportions that were used for each age/sex subgroup are shown in Table 21,
and were similar to the Wpr-A estimates7 (see Table 22). These proportions were applied to the WHO
estimates of YLDs for the broad ‘cerebrovascular diseases’ GBD category (ICD-10 codes I60–I67,
I69) to calculate ischaemic and haemorrhagic stroke morbidity in New Zealand during 2004.
Table 21: New Zealand-based estimates of the proportion of non-fatal stroke subtypes, by age and sex.
Males
Females
Age
group
(years)
Ischaemic
(%)
Haemorrhagic
(%)
Ischaemic
(%)
Haemorrhagic
(%)
30–44 79.3 20.7 76.2 23.8
45–59 83.4 16.6 80.3 19.7
60–69 86.8 13.2 83.6 16.4
70–79 89.5 10.5 86.3 13.7

52
Table 22: Wpr-A subregion estimates of the proportion of non-fatal stroke subtypes, by age.
Age group
(years)
Ischaemic
(%)
Haemorrhagic
(%)
30–44 78 22
45–59 82 18
60–69 85 15
70–79 88 12
Colon and rectum cancer
The GBD 2005/2010 study considers colon and rectum cancers together as a single category (ICD-10
codes C18–C21).6 Since we had access to specific RRs and therefore specific AAFs for colon cancer
and rectum cancer, the WHO New Zealand estimates from this broader ‘colon and rectum cancers’
category needed to be apportioned among our colon cancer and rectum cancer categories. The
following calculations were performed separately for each age/sex/ethnicity subgroup.
The WHO estimates of 2004 YLDs for the ‘colon and rectum cancers’ category were multiplied by the
relative proportions of incident colon cancer versus incident rectum cancer in New Zealand during
2004 (see Table 23).51 These calculations produced separate WHO YLD estimates for colon cancer
and rectum cancer to which their independent AAFs could be applied for the burden of disease and
injury calculations.
Table 23: Proportions of incident cases of colon and rectum cancer for New Zealand, by age and sex (2004).*
Age group (years)
15–29 30–44 45–59 60–69 70–79
Incident cases
Males
Colon cancer 75.0% 45.9% 44.0% 60.6% 66.7%
Rectum 25.0% 54.1% 56.0% 39.4% 33.3%
Females
Colon cancer 77.8% 62.5% 59.2% 67.0% 77.0%
Rectum 22.2% 37.5% 40.8% 33.0% 23.0%
* Proportions calculated from the incident cases of primary colon and rectum cancer diagnosed and reported to the New Zealand Cancer Registry in 2004.51

53
Cirrhosis of the l iver
Since the alcohol-attributable mortality analyses included only alcoholic liver cirrhosis (ICD-10 code
K70), 100% AAFs were used for the YLL calculations. However, the WHO YLD estimates used a
broader ‘cirrhosis of the liver’ category that also included non-alcoholic chronic hepatitis, fibrosis and
cirrhosis of the liver (ICD-10 codes: K70, K73–K74).6 Therefore, morbidity relative risk estimates for
this broader ‘cirrhosis of the liver’ category were used to calculate morbidity AAFs for the alcohol-
attributable YLD calculations (see Table 26 on page 59; RRs provided by the Global Burden of
Disease 2010 Risk Factors Collaborating Group).
Lower respiratory infections
The calculations in the alcohol-attributable mortality section were based on a subset (J10–J18) of the
ICD-10 codes included in the overall GBD ‘lower respiratory infections’ category (J09–J22, J85, P23).
In order to adjust for this substantial difference in categorisation, New Zealand mortality data were
used to calculate the proportion of lower respiratory infection deaths in the overall GBD category that
were due to partially alcohol-attributable causes:
(4)
This proportion was calculated separately for each age/sex subgroup by combining New Zealand
mortality data from 2004 and 2007 (necessary due to small numbers of deaths in several age/sex
subgroups). The proportions of lower respiratory infection deaths due to ICD-10 codes J10–J18
ranged from 85.7% to 100.0% for both men and women (see Appendix F).
All WHO YLD estimates for the broad GBD ‘lower respiratory infections’ category were then multiplied
by the corresponding proportions from Appendix F. This resulted in adjusted YLD estimates that were
specific to partially alcohol-attributable lower respiratory infections, to which we could apply the AAFs.
Poisonings
Our alcohol-attributable mortality analyses divided poisonings into two categories: alcohol poisonings
and non-alcohol poisonings (see Table 6 on page 17 for specific ICD-10 codes). However, the GBD
‘poisonings’ category used for the WHO DALY estimates included only accidental poisoning by and
exposure to non-alcoholic noxious substances (ICD-10 codes X40–X44, X46–X49).6
The three ICD-10 codes we categorised as ‘alcohol poisonings’ in the mortality section of this report
are not grouped together in the GBD cause categories. X45 (accidental poisoning by and exposure to
alcohol) is classified as a mental and behavioural disorder, X65 (intentional self-poisoning by and
exposure to alcohol) is classified as a self-inflicted injury, and Y15 (poisoning by and exposure to
alcohol, undetermined intent) is classified as an ill-defined ‘garbage code’.6 The eight ICD-10 codes
we previously categorised as ‘non-alcohol poisonings’ (Y10–Y14, Y16–Y18: poisoning by and
exposure to non-alcoholic noxious substances, undetermined intent) were similarly classified by the
GBD study as ill-defined ‘garbage codes’.6

54
Since these additional ICD-10 codes are dispersed among so many different GBD categories, it was
not possible to adjust the WHO estimates to better correspond with the poisoning categories used for
our mortality analyses. Instead, we calculated ‘poisoning’ DALYs by combining the New Zealand YLL
estimates (sum of YLLs from the ‘alcohol poisoning’ and ‘non-alcohol poisonings’ categories used in
our mortality analyses) with the WHO YLD estimates for the narrower GBD ‘poisonings’ category.
We chose to use the New Zealand YLL estimates since they were calculated from more accurate
mortality data than the WHO YLLs. When we compared the 2004 New Zealand mortality estimates
obtained from WHO and Statistics New Zealand, the total number of poisoning deaths estimated by
WHO (using the narrower GBD ‘poisonings’ category) accounted for approximately 70% of the total
number of alcohol and non-alcohol poisoning deaths reported by Statistics New Zealand.
As the WHO YLD estimates were based only on unintentional non-alcohol poisonings, they
underestimate the actual New Zealand YLDs caused by poisonings. However, these were the only
YLD estimates available at the time of this report. Furthermore, considering that the proportion of
alcohol-attributable YLDs due to poisonings in the NZBoA2000/02 report was less than 0.2% of
alcohol-attributable YLDs due to all causes, the impact on the final results should be negligible.
BURDEN OF DISEASE AND INJURY DATA
Population subgroups examined
2004 WHO burden of disease and injury data for New Zealand were available for the same
age/sex subgroups examined in our mortality analyses. However, we were unable to calculate the
alcohol-attributable burden of disease and injury separately for Māori and non-Māori subgroups
since ethnicity-specific WHO estimates were not available.
New Zealand estimates (alcohol consumption and YLLs)
Alcohol consumption
The 2004 New Zealand alcohol consumption prevalence estimates used for AAF calculations in our
alcohol-attributable mortality analyses were discussed in the previous ‘Mortality and alcohol
consumption data’ section (see Tables 7–10 and Table E-3–Table E-6 in Appendix E for these
original ethnicity-specific alcohol consumption prevalence estimates). WHO data limitations meant
that alcohol-attributable DALYs could not be calculated separately for Māori and non-Māori New
Zealanders, so morbidity AAFs were needed for the total New Zealand population (i.e. all ethnicities)
by age/sex subgroup for the year 2004.
The total population alcohol consumption prevalence estimates required for producing these total
New Zealand AAF estimates were calculated by using New Zealand census populations (as at 30
June 2004) for each age/sex/ethnicity subgroup to weight the 2004 Māori and non-Māori alcohol
consumption prevalence estimates. Since the New Zealand non-Māori population is significantly
larger than the Māori population in all age/sex subgroups, the total New Zealand prevalence
estimates used for the burden of disease analyses correspond closely with the non-Māori prevalence
estimates used in the previous mortality analyses. Māori alcohol consumption in the younger age

55
groups had the greatest influence on the total New Zealand estimates, as the ratio of Māori: non-
Māori New Zealanders increases considerably with age (i.e. 4.5:1 for 15–29 year olds, 9:1 for 45–59
year olds, and 20:1 for 70–79 year olds).
The 2004 total New Zealand population alcohol consumption prevalence estimates used to estimate
the AAFs for all conditions except ischaemic heart disease are shown in Table 24, while Table E-7
(Appendix E, page 144) details the total New Zealand estimates used for ischaemic heart disease
AAF calculations. The estimates for alcohol consumption during pregnancy for all New Zealand
women are shown in Table 25.
Table 24: Estimated average volume of alcohol consumption for New Zealand males and females (%), 2004.
Alcohol
consumption
category
Age group (years)*
Grams alcohol
per day 15–29† 3 0 – 4 4 † 4 5 – 5 9 † 60–69‡ 7 0 – 7 9 ‡
Males Abstainers 0 10.2 4.9 5.4 5.3 7.0
Ex-drinkers 0 3.0 6.0 8.8 9.5 10.2
I 0.01–39.99 57.3 74.6 72.3 73.4 72.9
II 40.00–59.99 8.7 7.7 6.4 6.0 5.5
III 60+ 20.8 6.8 7.1 5.8 4.4
Females Abstainers 0 11.4 8.7 10.9 12.9 19.1
Ex-drinkers 0 5.2 7.1 6.8 12.7 13.9
I 0.01–19.99 60.3 69.0 66.8 63.9 59.4
II 20.00–39.99 13.2 10.5 11.5 8.1 6.2
III 40+ 10.0 4.7 4.0 2.4 1.5
* All estimates weighted by 2004 population sizes of ethnic subgroups. Sums of age/sex/ethnicity subgroup proportions may not equal exactly 100% due to rounding. † Estimates from HBS2003/04. ‡ Extrapolated estimates from weighted averages of proportions from HBS2003/04, NZADUS2007/08 and HtO2008/09 surveys. See the report section: ‘Alcohol consumption estimates for older age categories’ on page 36 for details about calculation methods and limitations of extrapolated estimates (i.e. high degree of uncertainty).

56
Table 25: Estimated average volume of alcohol consumption during pregnancy for New Zealand females (%), 2004.*
Alcohol
consumption
category
Age group
(years)
Total
Grams alcohol per
day
15–29 30–44 15–44
Abstainers 0 74.8 68.9 71.6
I 0.01 – 19.99 18.4 25.5 21.9
II 20.00 – 39.99 3.4 3.7 3.5
III 40+ 3.4 1.9 3.0
* All estimates weighted by 2004 population sizes of ethnic subgroups. Sums of age/sex subgroup proportions may not equal exactly 100% due to rounding.
YLLs
Methods and results for the 2004 YLLs calculated from New Zealand data have been discussed
elsewhere (see the ‘Alcohol-attributable years of life lost (YLLs)’ methods section on page 48). All
modifications to condition and injury categories that were necessary when using New Zealand YLLs
for the burden of disease and injury calculations have also been previously detailed in the ‘Differences
in alcohol-attributable condition and injury categories between mortality and DALY analyses’ section
(starting on page 50).
Since alcohol-attributable DALYs could not be calculated by ethnicity, the ethnicity-specific alcohol-
attributable YLL results previously calculated from New Zealand 2004 mortality data were collapsed
into age/sex subgroups for use in the burden of disease and injury calculations. In this way, even
though the YLLs used in the DALY calculations could not be grouped by ethnicity, we were still able to
use the most accurate ethnicity-specific AAFs when calculating the alcohol-attributable YLLs from the
2004 New Zealand mortality data.
World Health Organization estimates
The age-weighting and time-discounting methodology used to calculate the WHO burden of disease
and injury estimates is described in the 2004 global health risks report,48 and is the same method
used to calculate YLLs from New Zealand data in the mortality section of this report (see page 48).
Deaths and YLLs
The WHO provided us with estimates of deaths, years of life lost (YLLs) and years lived with disability
(YLDs) for New Zealand for the most recent year available (2004). These estimates were provided for
the Global Burden of Disease categories of conditions and injuries, resulting in some differences from
the more specific cause categories used in our mortality analyses (please see the ‘Differences in
alcohol-attributable condition and injury categories between mortality and DALY analyses’ section
starting on page 50 for details about category differences).

57
Whereas the 2004 New Zealand YLLs were calculated directly from New Zealand ICD-10 coded
mortality data for 2004, the YLL estimates provided by the WHO were based on GBD estimates of
New Zealand deaths during 2004. WHO used New Zealand 2003 vital registration data from to derive
their estimates of New Zealand deaths by cause, age and sex for the year 2004.47 Further details of
methods used by the GBD to estimate mortality are described elsewhere.6,47
A comparison of Statistics New Zealand mortality data and WHO’s mortality estimates for New
Zealand showed that the numbers of deaths for the cause categories included in our report were very
similar between the two data sources (see Appendix G for detailed numbers). Since the Statistics
New Zealand mortality data coding allows for the use of more accurate cause categories, we decided
to use the Statistics New Zealand mortality data to estimate alcohol-attributable YLLs for our burden
of disease analysis.
YLDs
Morbidity due to incident cases of a given health condition can be measured by the number of years
lived with a disability or poor health (YLDs) due to that condition. For each age/sex subgroup and
cause of death, the general formula used to calculate YLDs is:
(5)
where I is the number of incident cases during the year of interest, D is the disability weight (ranging
from 0 to 1 to reflect the severity of the disability, where 0 is perfect health and 1 is death), and L is
the average duration of the disability in years.6 Equation 5 ignores the additional complications of 3%
time-discounting and age-weighting that were previously discussed for YLLs (see page 48) and for
which methodological details can be found elsewhere.47,48
The Global Burden of Disease and Risk Factors report describes YLD estimation as “the most
complex and time-consuming component of burden of disease analysis, because it requires
systematic assessments of the available evidence on incidence, prevalence, duration, and severity of
a wide range of conditions” (p. 73).52 Since these data are not currently readily available from New
Zealand sources, the calculation of YLDs is beyond the scope of this report. Therefore, we chose to
base our estimates of alcohol-attributable morbidity on the YLDs estimated by WHO for alcohol-
related conditions and injuries in New Zealand age/sex subgroups in 2004.
MORTALITY AND MORBIDITY ALCOHOL-ATTRIBUTABLE FRACTIONS (AAFS): FOR CALCULATING ALCOHOL-ATTRIBUTABLE DALYS
The 2004 burden of disease and injury due to alcohol was estimated for New Zealand as disability-
adjusted life years (DALYs). These were calculated by adding measures of alcohol-attributable
mortality (New Zealand YLLs) and alcohol-attributable morbidity (WHO YLDs). As mentioned
previously, these burden of disease and injury calculations could only be performed by age/sex
subgroup since ethnicity-specific estimates were not available from the World Health Organization.

58
AAF calculation methods (by age/sex)
Wholly alcohol-attributable conditions and injuries
As for the alcohol-attributable mortality analyses, conditions and injuries that are entirely caused by
the consumption of alcohol all have AAFs of 100 percent.
Partially alcohol-attributable conditions
AAF calculation methods have been described in the ‘Mortality alcohol-attributable fractions’ section
(starting on page 34). Mortality AAFs were calculated from alcohol consumption estimates for each
age/sex/ethnicity subgroup. However, since the WHO YLD estimates used in our DALY analyses
were available by age/sex subgroup (but not ethnicity), the morbidity AAFs were calculated from New
Zealand alcohol consumption estimates for each age/sex subgroup (these estimates are detailed in
Tables 24 and 25).
For several alcohol-related conditions, a differential impact of alcohol consumption has been shown
for mortality and morbidity outcomes, with the effects of alcohol mostly stronger and more harmful for
mortality than morbidity.2 The conditions for which the Global Burden of Disease 2010 Risk Factors
Collaborating Group provided sex-specific morbidity RRs to calculate morbidity alcohol-attributable
fractions (AAFs) were: ischaemic stroke and haemorrhagic stroke, cirrhosis of the liver, and ischaemic
heart disease. Following GBD methodology,53 the morbidity AAFs calculated from these morbidity
RRs were applied to YLDs to calculate alcohol-attributable morbidity due to each condition by age/sex
subgroup. For all other conditions for which separate morbidity RRs were not available, age/sex-
specific mortality AAFs were calculated and applied to YLDs as best available estimates of the
morbidity AAFs.
Relative risk estimates (mortality and morbidity)
The morbidity RR estimates used in the burden of disease AAF calculations that differed from the
mortality RRs used in the previous mortality AAF calculations are shown in Table 26 and Table 27.
Table 26 shows the sex-specific morbidity RRs for ischaemic stroke, haemorrhagic stroke, and
cirrhosis of the liver. In contrast to the previous alcohol-attributable mortality analyses that included
only alcoholic liver cirrhosis (ICD-10 code K70; 100% AAF), the RRs used to calculate the morbidity
AAFs for the broader GBD ‘cirrhosis of the liver’ category also include non-alcoholic chronic hepatitis,
fibrosis, and cirrhosis of the liver (ICD-10 codes K70, K73 and K74). Table 27 shows the morbidity
RRs for ischaemic heart disease in males and females.
Most conditions with different mortality and morbidity RRs showed more harmful associations with
alcohol for mortality. However, for the average alcohol consumption categories I and II, the female
morbidity RRs for ischaemic stroke were slightly less protective than the corresponding mortality RRs.
For ischaemic and haemorrhagic stroke, the difference between morbidity and mortality RRs was only
pronounced for females.

59
Table 26: Morbidity relative risks* for partially alcohol-attributable (non-injury) conditions, excluding ischaemic heart disease.
Average daily alcohol consumption†
Males Females
Ex I II III Ex I II III
Ischaemic stroke 1.33 0.90 1.08 1.25 1.15 0.82 0.89 1.08
Haemorrhagic stroke 1.33 1.17 1.47 1.78 1.15 0.68 0.90 1.32
Cirrhosis of the liver 1.31 1.41 2.33 3.55 6.50 2.12 3.64 5.74
* This table only includes RRs that differ from the mortality RRs previously detailed in Table 13 (see page 47). † Alcohol consumption categories measured in average grams of pure alcohol consumed per day. Males: Ex: 0 g (ex-drinkers), I: 0.01−39.99 g, II: 40−59.99 g, and III: 60+ g. Females: Ex: 0 g (ex-drinkers), I: 0.01−19.99 g, II: 20−39.99 g, and III: 40+ g.
Table 27: Morbidity relative risks for ischaemic heart disease.*
Average daily alcohol
consumption Males Females
Abstainers 1.00 1.00
Ex-drinkers† 0.99 1.11
0.01–19.99 g/day 0.75 0.68
20–39.99 g/day 0.70 0.62
40–59.99 g/day 0.76 0.81
60+ g/day 0.66 1.48
* RRs provided by Roerecke and Rehm.37 In addition to these RRs, excess proportions of people with irregular heavy drinking occasions were assigned RRs of 1.00 (see Appendix E for details). † RRs for ex-drinkers are from a separate analysis.2
Unipolar depressive disorders (for sensitivity analysis)
The 2004 Global Burden of Disease report showed that depression, despite being a mostly non-fatal
condition, made a substantial contribution to the global burden of disease.47 Unipolar depressive
disorders were the leading global cause of years lost due to disability (YLDs), and were also the
leading cause of burden of disease (DALYs) in high-income countries.47 Unipolar depressive
disorders were thus included in the previous NZBoA2000/02 report.1 However, depression has been
excluded from our main mortality and DALY analyses following the GBD alcohol group’s conclusion
that there are currently no validated approaches to calculate depression AAFs, and it has been

60
dropped from the GBD 2005/2010 study (J. Rehm, personal communication). Given that the
contribution of depression to the alcohol-attributable burden of disease is not contested, we chose to
include depression in a sensitivity analysis that used a direct method to estimate depression AAFs for
New Zealand. This allowed a rough estimate of alcohol-attributable YLDs caused by unipolar
depressive disorders to be calculated that is comparable with the estimate in the previous
NZBoA2000/02 report.
The comparative risk assessment group of the GBD 2000 study estimated depression AAFs from the
prevalence of alcohol dependence in different subregions of the world.17 Therefore, we calculated
New Zealand-specific depression AAF estimates by adjusting the Wpr-A subregion AAF estimates
(for 15 years and older) by the prevalence of alcohol dependence in New Zealand using the following
equation:
(6)
where,
AAF(Wpr-A) = 3.84% for men, and 1.31% for women
Prevalence of alcohol dependence(Wpr-A) = 3.12% for men, and 1.12% for women
Unipolar depressive disorder AAFs were calculated separately for each New Zealand age/sex
subgroup by using 12-month prevalence estimates of alcohol dependence provided by Te Rau
Hinengaro: The New Zealand Mental Health Survey (see Table 28) in equation 6.21
Table 28: 12-month prevalence of alcohol dependence* for New Zealand (%), by age and sex (2003/04).
Age group (years)
16–29 30–44 45–59 60–69 70–79
Males 4.21 1.68 0.74 0.03 0.00
Females 1.99 1.03 0.26 0.01 0.00
* The New Zealand Mental Health Survey used a nationally representative sample to determine the prevalence of alcohol dependence in 2003/04. Twelve-month prevalence was the proportion of people to have ever met criteria for alcohol dependence and to have experienced an episode or key symptoms in the 12 months before the interview. Survey interviews used the Composite International Diagnostic Interview (CIDI 3.0) structured questionnaire to make DSM-IV diagnoses of alcohol dependence.21
Partially alcohol-attributable injuries
Injury mortality AAFs were calculated by age/sex subgroup as the ratio of alcohol-attributable deaths
to annual deaths in each subgroup (Māori and non-Māori deaths combined). Mortality data from 2004
and 2007 were used since the ethnicity-specific AAFs were the same for both years.
As in the NZBoA2000/02 report, AAFs for adult non-fatal road traffic injuries were the same as for
fatal road traffic injuries (this decision was based on New Zealand data from the Auckland Car Crash
Injury Study).54 For children under 15 years old, morbidity AAFs for road traffic injuries were estimated

61
directly from New Zealand statistics that showed that 11% of total road traffic injuries in children were
related to alcohol between 2003 and 2007 (after adjustment for under-reporting and under-
measurement of alcohol).42 All non-road traffic injury morbidity AAFs were 4/9 of their corresponding
mortality AAFs (for both children and adults).17
Morbidity AAF estimates
Alcohol-attributable condition and injury AAFs
The 2004 morbidity alcohol-attributable fraction (AAF) estimates for male and female New Zealanders
are shown by age category in Table 29 (conditions) and Table 30 (injuries). These morbidity AAFs
were applied to WHO YLDs to calculate alcohol-attributable YLDs.
CALCULATING ALCOHOL-ATTRIBUTABLE DISABILITY-ADJUSTED LIFE YEARS (DALYS)
To determine the number of DALYs that were attributable to alcohol in New Zealand during 2004, we
performed the following calculations:
1. Alcohol-attributable YLLs
Mortality AAFs for each alcohol-related condition (Tables 15–18) and injury (Tables
19–20) were multiplied by the total number of corresponding YLLs (calculated from
2004 New Zealand data) in each age/sex/ethnicity subgroup. Māori and non-Māori
alcohol-attributable YLLs were then combined to produce alcohol-attributable YLLs
by age/sex subgroup.
2. Alcohol-attributable YLDs
Morbidity AAFs for each alcohol-related condition (Table 29) and injury (Table 30)
were multiplied by the total number of corresponding YLDs (calculated from 2004
World Health Organization data) in each age/sex subgroup.
3. Alcohol-attributable DALYs
Calculated by summing alcohol-attributable YLLs and alcohol-attributable YLDs
for each alcohol-related condition and age/sex subgroup.

62
Table 29: 2004 morbidity AAFs for (non-injury) conditions: Total New Zealand population.*
Males Females
0–4 5–14 15–29 30–44 45–59 60–69 70–79 0–4 5–14 15–29 30–44 45–59 60–69 70–79
Mouth and oropharyngeal cancers† 57.2% 47.9% 47.2% 45.7% 43.8% 36.9% 31.7% 31.1% 28.2% 25
Oesophagus cancer† 37.6% 29.7% 29.3% 28.2% 26.7% 21.7% 18.7% 18.2% 17.4% 16.0%
Colon cancer† 6.5% 5.6% 6.0% 6.0% 5.8% 5.0% 5.3% 5.1% 7.0% 7.2%
Rectum cancer† 11.3% 9.3% 9.5% 9.3% 8.9% 7.4% 7.2% 7.0% 8.5% 8.4%
Liver cancer† 20.3% 16.6% 16.5% 16.1% 15.4% 12.5% 11.4% 11.1% 11.8% 11.3%
Female breast cancer† 15.3% 13.5% 13.1% 13.3% 12.6%
Alcohol use disorders† 100% 100% 100% 100% 100% 100% 100% 100% 100% 100% 100% 100% 100% 100%
Unipolar depressive disorders‡ 5.2% 2.1% 0.9% 0.0% 0.0% 2.3% 1.2% 0.3% 0.0% 0.0%
Epilepsy† 36.0% 28.4% 28.1% 27.0% 25.6% 20.8% 18.1% 17.6% 17.0% 15.7%
Hypertensive heart disease† 26.8% 20.6% 20.0% 19.2% 18.0% 18.6% 8.2% 7.6% 2.8% 0.4%
Ischaemic heart disease -31.3% -31.0% -29.5% -29.2% -27.9% -27.3% -32.9% -33.5% -29.0% -25.2%
Ischaemic stroke 1.4% -3.0% -1.8% -2.0% -2.2% -11.8% -13.5% -13.3% -11.2% -9.8%
Haemorrhagic stroke 23.6% 18.9% 19.0% 18.5% 17.7% -20.3% -26.2% -25.7% -23.2% -20.8%
Cirrhosis of the liver (K70, K73 & K74) 47.0% 37.4% 37.0% 35.7% 33.8% 64.0% 62.4% 61.7% 63.5% 62.4%
Low birth weight† 4.3% 4.4%
Tuberculosis† 36.8% 23.0% 22.1% 20.1% 17.6% 17.9% 11.1% 9.8% 9.3% 8.3%
Lower respiratory infections: 15.0% 12.1% 12.2% 11.9% 11.3% 9.3% 8.7% 8.4% 9.7% 9.4%
Diabetes mellitus† -5.0% -8.6% -7.6% -7.7% -7.7% -24.8% -30.7% -30.7% -26.8% -23.6%
* These AAFs were used for calculating 2004 alcohol-attributable YLDs. AAF estimates for 60+ years have more uncertainty due to smaller sample sizes and the use of extrapolated alcohol consumption estimates. † Morbidity AAFs for these condition categories were calculated by using mortality RRs as best available estimates of morbidity RRs. ‡ Unipolar depressive disorder AAFs were only used for our sensitivity analysis.

63
Table 30: 2004 morbidity AAFs for injuries: Total New Zealand population.*
Males Females
0–4 5–14 15–29 30–44 45–59 60–69 70–79 0–4 5–14 15–29 30–44 45–59 60–69 70–79
Road traffic injuries 11.0% 11.0% 46.0% 45.8% 15.3% 9.6% 9.5% 11.0% 11.0% 28.4% 27.2% 7.7% 2.3% 2.3%
Non-alcohol 17.9% 9.4% 9.4% 9.9% 4.2% 15.5% 8.3% 7.9% 7.7% 3.6%
Falls 12.5% 13.2% 13.0% 9.5% 6.5% 7.2% 7.2% 8.1% 5.0% 2.1%
Fires 10.7% 10.7% 15.4% 19.2% 19.1% 17.0% 14.9% 10.7% 10.7% 11.8% 11.8% 12.2% 12.2% 9.8%
Drownings 15.0% 19.4% 19.4% 13.9% 13.3% 12.8% 19.3% 15.4% 12.3% 12.3%
Other unintentional 11.5% 10.1% 17.2% 17.0% 13.9% 13.9% 13.7% 3.4% 3.9% 13.3% 12.4% 10.9% 9.8% 9.8%
Self-inflicted injuries 8.0% 8.0% 5.8% 5.8% 2.7% 5.1% 5.1% 4.1% 4.1% 2.6%
Assault 8.4% 11.1% 17.4% 17.4% 16.0% 17.9% 14.3% 9.7% 7.2% 14.9% 15.9% 15.2% 13.9% 13.9%
Other intentional 10.6% 10.6% 10.6% 10.6% 5.3% 10.3% 10.3% 10.3% 10.3% 5.1%
* Except for road traffic injuries, injury morbidity AAFs were derived by multiplying the corresponding mortality AAFs by 4/9. These AAFs were used for calculating 2004 alcohol-attributable YLDs. AAF estimates for 60+ years have more uncertainty due to smaller sample sizes and the use of extrapolated alcohol consumption estimates. † See ‘Poisonings’ section starting on page 63 for a detailed explanation of why we were unable to use 100% AAFs for ‘alcohol poisonings’ in the YLD calculations.

64
METHODOLOGICAL DEVELOPMENTS
The estimates in this report were calculated with the best data sources and most up-to-date calculation
methods available to us at the time of writing. Our basic approach to calculating the impact of alcohol on
the health of New Zealanders was broadly similar to the approach used in the previous NZBoA2000/02
report.1 However, in the eight years since the publication of the NZBoA2000/02 report, the methods used
for calculating the alcohol-attributable burden of disease and injury have been undergoing constant
revision and scrutiny by the Global Burden of Disease 2010 Risk Factors Collaborating Group.2 This has
resulted in some changes to the methods used for the calculations compared to those used for the
NZBoA2000/02 report. Therefore, any differences in results between the reports are due to a combination
of several factors (see below) and must not be interpreted as having occurred solely due to changes in
alcohol consumption of New Zealanders.
Several of the main differences in methods between this report and the NZBoA2000/02 report are briefly
outlined below. The rationale for these methodological changes has been previously documented with
additional details and references in the relevant sections of this report.
ALCOHOL-ATTRIBUTABLE CONDITIONS
This report includes four alcohol-attributable conditions that were not included in the NZBoA2000/02
report: colon cancer, rectum cancer, tuberculosis, and pneumonia. See Table 3 on page 13 for ICD-10
coding details.
ALCOHOL CONSUMPTION ESTIMATES
The surveys used to estimate alcohol consumption for the NZBoA2000/02 report55 and the 2004 section
of this report20 were both conducted by the Centre for Social Health Outcomes Research and Evaluation
and used similar methods. However, the survey used to estimate alcohol consumption in 2007 for this
report25 was conducted by the Ministry of Health using different methods. This means that comparisons
between the prevalence of alcohol consumption in age/sex/ethnic subgroups of New Zealanders across
survey years may not reflect only differences in annual consumption but also methodological differences.
We did not include people aged 80 years and older in our analyses due to the unreliability of the
estimates of both alcohol consumption and relative risks for this age category, whereas this age category
was included in the NZBoA2000/02 report. This methodological difference means that many of the totals
presented in the results sections of the two reports are not directly comparable, especially for conditions
and injuries that are common in older age groups (e.g. cardiovascular conditions and falls).
ALCOHOL-ATTRIBUTABLE FRACTION CALCULATIONS
Unipolar depressive disorders
Depression was excluded from the main analyses in this report. However, we did perform a sensitivity
analysis that estimated morbidity AAFs for application to YLDs caused by unipolar depressive disorders.
Depression AAFs were calculated by adjusting Wpr-A depression AAF estimates17 by the proportion of

65
alcohol dependence in each New Zealand age/sex subgroup21 compared with the reported sex-specific
prevalence of alcohol dependence in Wpr-A. The 12-month New Zealand prevalence estimates of
alcohol-dependence were obtained from a 2003/04 nationally representative survey of New Zealanders
16 years and older (Te Rau Hinengaro: The New Zealand Mental Health Survey).21
In contrast, the best data available for estimating depression AAFs in the NZBoA2000/02 report were six-
month prevalence estimates of alcohol abuse and/or dependence for New Zealanders between 18 and
64 years old (from a small study conducted in Christchurch during 1986).1,56
Relative risk estimates
Alcohol consumption categories
The ‘abstainer’ reference category used in this report included only lifetime abstainers, with ex-drinkers
included as a separate alcohol consumption category to reflect the (usually) increased health risks of ex-
drinkers compared to lifetime abstainers.2 The NZBoA2000/02 report included ex-drinkers in the
abstainer reference category.
Updated relative risk estimates
Since the publication of the NZBoA2000/02 report, new systematic reviews and meta-analyses performed
as part of the Global Burden of Disease Risk Factors Assessment for alcohol have further clarified the
associations between alcohol and several conditions.2 This has resulted in a number of substantial
differences in the relative risk (RR) values used to calculate alcohol-attributable fractions. A detailed sex-
specific comparison of RR estimates used for each condition and alcohol consumption category is
beyond the scope of this report. However, some of the main changes to the RR estimates for a given
alcohol consumption category (without accounting for the impact of the inclusion of the additional ‘ex-
drinker’ category) include: mostly decreased RRs for cancers, cardiac arrhythmias, pancreatitis, epilepsy,
liver cirrhosis, and hypertensive heart disease; mostly increased RRs for haemorrhagic stroke; and more
protective RRs for diabetes at the lowest level of alcohol consumption with increased risk for the heaviest
drinkers. For more details, please compare the RR estimates in Table 9 (page 23) of the NZBoA2000/02
report with the RR estimates shown in Table 13 (page 36) and Table 14 (page 39) of this report.
Stroke (ischaemic or haemorrhagic)
In this report, we used specific ischaemic and haemorrhagic stroke relative risk estimates for mortality
and morbidity (see pages 14 and 51 for methods used to estimate specific stroke subtype proportions
from mortality and morbidity data). The NZBoA2000/02 report applied ‘total stroke’ relative risk estimates
to combined mortality data for all stroke subtypes.
Morbidity AAF estimates
Alcohol-attributable conditions
In this report, morbidity RRs were available for the calculation of specific morbidity AAFs for ischaemic
stroke and haemorrhagic stroke, cirrhosis of the liver, and ischaemic heart disease. For all other non-
injury conditions, mortality RRs were used as the best available estimates of morbidity RRs for the
morbidity AAF calculations. The NZBoA2000/02 report used only mortality RRs to calculate the best
available estimates of morbidity AAFs for all alcohol-attributable conditions.

66
Incorporating drinking patterns into AAF calculations
Summary
Both this report and the NZBoA2000/02 report used drinking pattern information (along with average
volume of alcohol consumption) in the AAF calculations for ischaemic heart disease and injuries.
However, the analytical methods used to incorporate the impact of drinking patterns differed markedly
between reports.
NZBoA2000/02
A ‘pattern of drinking’ scoring system developed by the Comparative risk assessment (CRA) group of the
2000 GBD study17 was used to classify the overall drinking pattern of Māori versus non-Māori populations
(see Table 1 on page 16 of the NZBoA2000/02 report). This classification system was used to allocate
different drinking pattern scores to non-Māori and Māori populations (pattern 2 and pattern 3,
respectively), where a higher pattern score indicates more health risks for a given average volume of
alcohol consumption.1 This difference in drinking pattern score was due to Māori males and females
scoring higher than their non-Māori counterparts on a single item in the WHO scoring system: usual
quantity of drinks per drinking session. As noted by the WHO alcohol CRA group, the application of a
single drinking pattern value to an entire population is an obvious oversimplification (i.e. instead of
accounting for the drinking pattern differences between age/sex/ethnicity subgroups in a given
population), but was deemed acceptable at the time due to the absence of any other better methods.17
Current report
We were able to incorporate drinking pattern information from specific age/sex/ethnicity subgroups into
our AAF calculations for ischaemic heart disease by using a methodology that has been developed by
the GBD 2010 Risk Factors Collaborating Group since the publication of the NZBoA2000/02 report.
Ischaemic heart disease
NZBoA2000/02
The broad Māori/non-Māori WHO drinking pattern scores did not account for the effect of different
drinking patterns of age/sex subgroups when estimating the complex impact of alcohol on ischaemic
heart disease. Therefore, the NZBoA2000/02 report instead chose to apply relative risks (derived by the
WHO alcohol CRA group from individual-level studies) to AAF calculations for both Māori and non-Māori
age/sex subgroups.1 This alternate approach proposed by the CRA group produced more conservative
burden of disease estimates (i.e. higher cardioprotective effects) since all levels of male and female
average alcohol consumption except the highest were considered protective, despite the fact that this
protective relationship has been repeatedly questioned.17
Country-level analyses by the WHO alcohol CRA group did not show a marked impact of alcohol on
ischaemic heart disease for countries with drinking pattern 2, whereas a detrimental alcohol impact had
been shown for males in pattern 3 countries.17 Therefore, in addition to the main NZBoA2000/02 analysis,
where identical relative risk estimates were used to calculate Māori and non-Māori AAFs, the
NZBoA2000/02 report also presented results from a sensitivity analysis which excluded any beneficial
effect of alcohol on ischaemic heart disease for the Māori population.1

67
Current report
Our AAF calculations for ischaemic heart disease used methods recently developed for the GBD
2005/2010 study. These methods are based on recent meta-analyses that examined the relationship
between ischaemic heart disease, average alcohol consumption,37 and irregular heavy drinking
occasions (HDOs),35 and also showed the importance of separating ex-drinkers from abstainer reference
groups.36 The authors (Roerecke and Rehm) calculated sex-specific relative risk values for use in our
study by using all available data points from the studies in the meta-analysis that provided sex-stratified
estimates37 and incorporated relative risks for ex-drinkers from a separate analysis.2 This resulted in sex-
specific relative risk values with lifetime abstainers as the reference category compared to ex-drinkers
and four levels of average daily alcohol consumption (see Table 14 on page 39).
Roerecke and Rehm have clearly demonstrated the effect of drinking pattern on ischaemic heart disease
risk, as the cardioprotective effect of mild to moderate average alcohol consumption (0.01–59.99 g/day)
ceased to exist when combined with irregular HDOs (60+ g of pure alcohol per occasion, at least monthly
but not daily).35 However, the RRs calculated by Roerecke and Rehm for our study did not distinguish
between regular drinkers and people with irregular HDOs for the mild to moderate consumption
categories (0.01–19.99 g/day, 20–39.99 g/day and 40–59.99 g/day).37 Therefore, to allow us to account
for the detrimental effect of irregular HDOs in our analyses, Roerecke calculated the sex-specific
proportions of people with irregular HDOs across several large studies used in their meta-analysis
(15.7% for men and 1.4% for women; see Appendix E for details).37 We assumed that these sex-specific
proportions were accurate overall indicators of people with irregular HDOs in the studies used to
calculate the RRs for average alcohol consumption. See Table E-2 (Appendix E) for a summary of the
overall proportions of people with irregular HDOs in the 2004 and 2007 New Zealand sex/ethnicity
subgroups. With the exception of 2004 non-Māori males, all New Zealand sex/ethnicity subgroups had
higher proportions of people with irregular HDOs than the corresponding sex-specific proportions from
the studies in the meta-analysis.
A relative risk of 1.0 (no cardioprotection compared to abstainers) was assigned to any excess
proportion of people with irregular HDOs that was present in New Zealand sex/ethnicity subgroups,
while the average consumption RRs were applied to the remainder of the drinkers. Conversely, when
the proportion of people with irregular HDOs in the meta-analysis studies was greater than that of a
New Zealand sex/ethnicity subgroup (i.e. 2004 non-Māori males), all people in the three average
alcohol consumption categories between 0.01 and 59.99 g/day had the average consumption RRs
applied to them. Since the proportion of people with irregular HDOs declined steadily with age in all
sex/ethnicity subgroups, this adjustment for the impact of drinking pattern on ischaemic heart disease
AAFs had the greatest impact on the younger age groups (which have very little ischaemic heart
disease) and very little impact on the older age groups (see Appendix E for details). By choosing to
assign RR = 1 only to the excess proportion of people with irregular HDOs, current evidence
suggests that the AAFs we calculated for ischaemic heart disease probably underestimate the
negative impact of irregular HDOs on ischaemic heart disease (M. Roerecke, personal
communication).

68
Injuries
NZBoA2000/02
AAFs for road traffic injuries were estimated directly from New Zealand data (1998/99 Auckland Car
Crash Injury Study).54 For all other injury categories, non-Māori AAF estimates were obtained from
Australian data and adjusted for the sex-specific differences in average per capita consumption between
New Zealand and Australia (no adjustment for drinking pattern was necessary since both countries are
classified as drinking pattern 2). To reflect the increased risk of acute injury mortality and morbidity in
Māori drinkers (pattern 3) versus non-Māori drinkers (pattern 2), all Māori injury AAF estimates were then
scaled up from the corresponding age/sex-specific non-Māori injury AAFs by a factor of 1.5.1 This scaling
factor was derived from the non-Māori and Māori injury AAFs calculated from the Auckland Car Crash
Injury Study.
Current report
The injury AAFs used in our main analyses were mostly similar to those used in the NZBoA2000/02
report (for detailed rationale and methods, see ‘AAFs for partially alcohol-attributable injuries’ starting on
page 39).
However, we have also included an injury burden sensitivity analysis that uses AAF calculation methods
that have been developed by the Global Burden of Disease 2010 Risk Factors Collaborating Group since
the NZBoA2000/02 report was written (see Appendix C for sensitivity analysis). The GBD injury AAF
model incorporates both average alcohol consumption estimates and the following drinking pattern
estimates: (1) prevalence of people with heavy drinking occasions (HDOs); (2) average number of HDOs
per week; and (3) average number of drinks per HDO. Therefore, injury AAFs are calculated separately
based on the drinking volumes and patterns found in each age/sex/ethnicity subgroup rather than relying
on crude adjustments based on drinking patterns of entire Māori and non-Māori populations.

69
2007 MORTALITY RESULTS
OVERVIEW
This section presents our estimates for alcohol-attributable deaths and years of life lost (YLLs) in
New Zealand during 2007. These mortality estimates are for New Zealanders aged 0–79 years, and are
reported by:
Sex (see page 69)
Sex/ethnicity (see page 72)
Age/sex (see page 77)
Age/ethnicity (see page 81)
Age/sex/ethnicity (see page 84).
Overall, 802 deaths in New Zealanders aged 0–79 years were attributed to alcohol consumption in 2007,
representing 5.4% of all deaths under 80 years old. These deaths represented 13,769 YLLs attributable
to alcohol.a Alcohol consumption was also estimated to prevent 351 deaths but only 3,095 YLLs. This
was because the preventive effects were confined to conditions in older adults, while many deaths
caused by alcohol occur in young people.
MORTALITY BY SEX (2007)
Deaths
For New Zealanders aged 0–79 years, the number of male deaths due to alcohol consumption (n = 537)
was double the number of deaths in women (n = 265).
Table 31 shows how the top five causes of alcohol-attributable deaths differed for male and female New
Zealanders. Road traffic injuries were the most common cause of alcohol-attributable deaths (n = 105) in
men, while alcohol-attributable breast cancer deaths (n = 71) were the leading cause of death due to
alcohol consumption in women. Alcoholic liver cirrhosis was among the most common causes of alcohol-
attributable death for both sexes. Table 32 shows how injuries (including unintentional and intentional)
were responsible for more than half of alcohol-attributable deaths in male New Zealanders, and most of
the difference between males and females.
a We were unable to calculate the proportions of New Zealand YLLs that were attributable to alcohol in 2007 because GBD YLL denominator data were not available for 2007. Please see Table I- in 0 for 2004 estimates of proportions of YLLs due to alcohol consumption.

70
Table 31: Top five causes of alcohol-attributable (AA) deaths, by sex (0–79 years; 2007).
Males% of AA deaths
(N = 537) Females% of AA deaths
(N = 265)
Road traffic injuries 19.6% Female breast cancer 26.9%
Alcoholic liver cirrhosis 11.5% Haemorrhagic stroke 10.8%
Self-inflicted injuries 10.5% Alcoholic liver cirrhosis 9.8%
Other unintentional injuries 8.9% Road traffic injuries 9.8%
Oesophagus cancer 6.3% Colon cancer 7.1% Table 32: Alcohol-attributable deaths due to cancer, other conditions, and injuries; by sex (0–79 years; 2007).
N % N % N %
Cancers 126 23.5% 117 44.1% 243 30.3%
Other conditions 132 24.5% 82 30.9% 213 26.6%
Injuries 280 52.1% 66 25.0% 346 43.1%
Total deathsMale deaths Female deaths
The numbers of deaths estimated to be prevented by low average volumes of alcohol consumption in
New Zealand are shown in Table 33. Of all male deaths prevented by drinking (n = 226), almost 90%
were due to alcohol drinking reducing the risk of ischaemic heart disease, while the deaths prevented by
female drinking (n = 125) were more evenly distributed between ischaemic heart disease, ischaemic
stroke, and diabetes.
Table 33: Male and female deaths prevented by alcohol consumption, by condition (0–79 years; 2007).
N % N % N %
Ischaemic heart disease 200 88.4% 25 20.1% 225 64.1%
Ischaemic stroke 5 2.0% 51 41.0% 56 15.8%
Diabetes 20 9.1% 47 37.8% 68 19.3%
Cholelithiasis 1 0.6% 1 1.2% 3 0.8%
Male deaths prevented
Female deaths prevented
Total deaths prevented
Years of life lost
Our years of life lost (YLL) estimates incorporated the impact of deaths at different ages (0–79 years) so
that deaths at younger ages resulted in more years of life lost than deaths at older ages. As shown
below, since injury deaths occur more often in younger age groups, injuries are responsible for an even
larger proportion of alcohol-attributable YLLs than for alcohol-attributable deaths.
The YLL estimates showed a greater disparity between sexes than previously shown for alcohol-
attributable deaths, with the alcohol-attributable YLL burden 2.4 times higher in men (n = 9,720) than
women (n = 4,049). Most of the leading causes of alcohol-attributable YLLs were similar to the leading
causes of alcohol-attributable deaths, as seen in Table 34. Road traffic injuries were responsible for
31.9% of alcohol-attributable YLLs in males (n = 3,103) and 19.7% in females (n = 797). For both males

71
and females, the proportion of alcohol-attributable burden due to self-inflicted injuries was higher for YLLs
than for deaths.
Table 34: Top five causes of alcohol-attributable years of life lost (AA YLLs), by sex (0–79 years; 2007).
Males% of AA YLLs
(N = 9720) Females% of AA YLLs
(N = 4049)
Road traffic injuries 31.9% Female breast cancer 23.1%
Self-inflicted injuries 14.4% Road traffic injuries 19.7%
Other unintentional injuries 10.9% Alcoholic liver cirrhosis 9.2%
Alcoholic liver cirrhosis 8.0% Self-inflicted injuries 7.0%
Drownings 4.0% Haemorrhagic stroke 6.7%
Table 35 shows that injuries accounted for two-thirds of all years of life lost due to alcohol consumption:
73% of male and 42% of female alcohol-attributable years of life lost.
Table 35: Alcohol-attributable YLLs due to cancer, other conditions, and injuries; by sex (0–79 years; 2007).
N % N % N %
Cancers 1162 12.0% 1374 33.9% 2536 18.4%
Other conditions 1491 15.3% 968 23.9% 2459 17.9%
Injuries 7066 72.7% 1708 42.2% 8774 63.7%
Male YLLs Female YLLs Total YLLs
YLLs prevented due to alcohol consumption are summarised in Table 36 by condition. The YLL
proportions are similar to the proportions of deaths prevented by alcohol consumption since most
mortality caused by these conditions occurs in older age groups.
Table 36: Male and female YLLs prevented by alcohol consumption, by condition (0–79 years; 2007).
N % N % N %
Ischaemic heart disease 1810 89.4% 191 17.9% 2002 64.7%
Ischaemic stroke 29 1.4% 411 38.5% 440 14.2%
Diabetes 174 8.6% 452 42.4% 626 20.2%
Cholelithiasis 12 0.6% 13 1.2% 25 0.8%
Male YLLs Female YLLs Total YLLs

72
MORTALITY BY SEX/ETHNICITY SUBGROUP (2007)
Deaths
The total number of alcohol-attributable deaths in males was approximately double the number of female
deaths for both Māori and non-Māori New Zealanders in 2007. The leading causes of alcohol-attributable
death were the same for both groups (Table 37). Road traffic injuries were the most common cause of
deaths in Māori and non-Māori males, while breast cancer was the most common cause in Māori and
non-Māori females.
There are several ethnic differences in ranking order and proportions of causes of alcohol-attributable
deaths (see Table 37). However, caution is advised when interpreting these figures due to small numbers
in many groups, particularly for Māori. Ischaemic heart disease emerged as the third leading cause of
alcohol-attributable deaths in Māori women. This was due to the relatively high proportions of older Māori
females who were ex-drinkers (see Appendix E, Table E-6 for detailed consumption data), as female ex-
drinkers are approximately 40% more likely to die from ischaemic heart disease compared to female
lifetime abstainers (see Table 14 on page 39 for mortality relative risks for ischaemic heart disease). This
result differs from all the other sex/ethnicity subgroups, for whom the net effect of alcohol consumption on
ischaemic heart disease deaths is estimated to be preventive (see Table 17 and Table 18 on pages 44
and 45 for 2007 ischaemic heart disease mortality AAFs by age/sex/ethnicity subgroup).
Table 37: Top five causes of alcohol-attributable (AA) deaths, by sex and ethnicity (0–79 years; 2007).
Males% of
AA deaths Females% of
AA deaths
Māori (N = 124) Māori (N = 62)
Road traffic injuries 32.1% Female breast cancer 19.0%
Other unintentional injuries 13.1% Road traffic injuries 17.4%
Self-inflicted injuries 10.2% Ischaemic heart disease 16.3%
Alcoholic liver cirrhosis 5.7% Alcoholic liver cirrhosis 6.5%
Drownings 5.6% Haemorrhagic stroke 6.4%
Non-Māori (N = 414) Non-Māori (N = 203)
Road traffic injuries 15.8% Female breast cancer 29.3%
Alcoholic liver cirrhosis 13.3% Haemorrhagic stroke 12.2%
Self-inflicted injuries 10.6% Alcoholic liver cirrhosis 10.8%
Other unintentional injuries 7.6% Colon cancer 8.5%
Oesophagus cancer 7.4% Road traffic injuries 7.5%
Māori men had the highest proportion of deaths in 2007 attributed to alcohol consumption (8.3%). In
contrast, 5.7% of all deaths in Māori women were attributed to alcohol, while alcohol consumption in non-
Māori men and women was responsible for 5.7% and 4.0% of their total annual deaths, respectively
(Table 38).

73
To enable direct comparisons of alcohol-attributable deaths by sex and ethnicity subgroups while
controlling for differences in age structure of the populations, we calculated standardised rates of
mortality per 100,000 people using the WHO world population57 as the standard population (see Table
38). The alcohol-attributable death rate for Māori overall was 2.5 times the rate for non-Māori when
standardisation had adjusted for the effect of differences in the age structures. In addition to the ethnic
disparity in alcohol-attributable deaths, Figure 2 illustrates how men of both ethnic groups had more than
double the standardised death rate of women.
Table 38: Alcohol-attributable deaths caused and prevented, by sex and ethnicity (0–79 years; 2007).
EthnicityDeaths caused
(count) % of all deathsDeaths caused
(rate*)Deaths
prevented
Males Māori 124 8.3% 46.5 28
Non-Māori 414 5.7% 19.0 198
Total 537 6.1% 22.7 226
Females Māori 62 5.7% 22.1 14
Non-Māori 203 4.0% 8.1 111
Total 265 4.3% 9.7 125
Total Māori 185 7.2% 33.8 42
Non-Māori 617 5.0% 13.5 309
Total 802 5.4% 16.1 351
* Rate per 100,000 age-standardised to WHO world population
Figure 2: Population standardised alcohol-attributable deaths per 100,000 people, by sex and ethnicity (0–79 years; 2007).
0
10
20
30
40
50
60
Māori Non‐Māori Total
Deaths per 100,000 people (0 to 79 years of age)
Males
Females
Total
Table 39 shows that sex and ethnic differences in alcohol-attributable deaths were mostly due to injury
deaths, whereas the proportions of condition deaths attributable to alcohol consumption did not vary
markedly by sex or ethnicity. The results in Table 39 also demonstrate the substantial contribution of
alcohol consumption to injury deaths in both sexes and ethnicities, with estimates of alcohol-attributable

74
injury deaths as a proportion of all injury deaths ranging from 14% in non-Māori females to 36% in Māori
males.
Table 39: Alcohol-attributable (AA) condition and injury deaths, by sex and ethnicity (0–79 years; 2007).
EthnicityConditions: AA deaths
caused
% of total condition
deaths
Injuries: AA deaths
caused
% of total injury deaths
Males Māori 34 2.8% 89 35.8%
Non-Māori 223 3.4% 191 24.2%
Total 258 3.3% 280 27.0%
Females Māori 39 4.0% 23 22.7%
Non-Māori 160 3.4% 43 14.2%
Total 199 3.5% 66 16.3%
Total Māori 73 3.3% 112 32.0%
Non-Māori 383 3.4% 234 21.4%
Total 456 3.4% 346 24.0%
Table 40 provides the estimated alcohol-attributable death numbers for 2007 by sex/ethnicity subgroup,
showing the differences within each specific condition and injury category.

75
Table 40: Number of alcohol-attributable deaths for each condition and injury category, by sex and ethnicity (0–79 years; 2007).*
Males Females All Males Females All Males Females All
Conditions
Mouth and oropharyngeal cancers 4 0 4 27 6 33 31 7 38
Oesophagus cancer 3 0 3 31 5 36 34 5 39
Colon cancer 1 2 2 15 17 33 16 19 35
Rectum cancer 2 0 3 16 8 24 18 9 26
Liver cancer 5 1 6 15 4 19 20 5 25
Laryngeal cancer 1 0 2 5 1 6 7 1 8
Female breast cancer 12 12 60 60 71 71
Alcohol use disorders 0 2 2 11 4 15 11 6 17
Epilepsy 1 0 1 7 3 10 8 3 11
Hypertensive heart disease 2 0 2 9 1 9 11 0 11
Ischaemic heart disease† -24 10 -14 -176 -25 -201 -200 -15 -215
Cardiac arrhythmias 1 0 1 1 1 2 2 1 3
Ischaemic stroke† 1 -4 -3 -5 -47 -52 -3 -51 -55
Haemorrhagic stroke 4 4 8 25 25 50 29 29 58
Oesophageal varices 0 0 0 1 0 1 1 0 1
Alcoholic liver cirrhosis 7 4 11 55 22 77 62 26 88
Cholelithiasis 0 0 0 -1 -1 -2 -1 -1 -3
Pancreatitis 0 0 1 1 1 2 2 1 3
Low birth weight 1 1 1 1 0 1 1 1 3
Fetal alcohol syndrome 0 0 0 0 0 0 0 0 0
Tuberculosis 0 0 0 1 0 1 1 1 2
Lower resp. infections: pneumonia 1 1 2 3 2 5 4 3 6
Diabetes mellitus -4 -10 -14 -17 -37 -54 -20 -47 -68
Injuries
Road traffic injuries 40 11 50 65 15 81 105 26 131
Alcohol poisonings 1 1 2 8 0 8 9 1 10
Non-alcohol poisonings 5 2 6 10 4 14 14 6 20
Falls 3 1 4 12 4 15 15 4 19
Fires 1 0 1 2 0 3 3 1 4
Drownings 7 1 8 11 1 12 18 2 20
Other unintentional injuries 16 2 18 32 6 38 48 8 56
Self-inflicted injuries 13 3 15 44 9 53 56 12 68
Assault 4 3 7 7 4 11 11 7 18
Other intentional injuries 0 0 0 1 0 1 1 0 1
Māori Non-Māori Total
* Totals may not exactly equal the sums of components. This is a result of the table estimates being rounded to the nearest whole number, while totals are calculated from actual estimates with several decimal places. † For ischaemic heart disease and ischaemic stroke, please note that totals are net deaths due to several instances where totals combine positive and negative numbers of deaths. Please see Appendix H for detailed alcohol-attributable death numbers for each age/sex/ethnicity subgroup.

76
Years of life lost
For both Māori and non-Māori, alcohol-attributable injuries contributed a larger proportion of alcohol-
attributable YLLs than alcohol-attributable deaths (Table 41). This is due to the lower average age of
death for injuries than for most other conditions.
Table 41: Top five causes of alcohol-attributable years of life lost (AA YLLs), by sex and ethnicity (0–79 years; 2007).
Males
% of AA YLLs Females
% of AA YLLs
Māori (N = 2888) Māori (N = 1165)
Road traffic injuries 41.1% Road traffic injuries 29.6%
Other unintentional injuries 14.2% Female breast cancer 14.2%
Self-inflicted injuries 12.3% Ischaemic heart disease 7.2%
Drownings 5.1% Violence 7.1%
Non-alcohol poisonings 4.4% Self-inflicted injuries 6.4%
Non-Māori (N = 6831) Non-Māori (N = 2885)
Road traffic injuries 28.1% Female breast cancer 26.7%
Self-inflicted injuries 15.3% Road traffic injuries 15.7%
Alcoholic liver cirrhosis 9.9% Alcoholic liver cirrhosis 10.8%
Other unintentional injuries 9.5% Haemorrhagic stroke 7.5%
Oesophagus cancer 3.9% Self-inflicted injuries 7.2%
Table 42 shows that the alcohol-attributable YLL rate for Māori overall was 2.6 times the non-Māori rate
when the differences in age structure had been adjusted for. This was similar to the magnitude of ethnic
disparity estimated for the standardised death rates. Sex differences were also present in standardised
YLL rates, with the rate of alcohol-attributable YLLs in Māori and non-Māori men 2.6 and 2.7 times the
corresponding female YLL rates, respectively (Table 42). These sex differences in YLL rates were larger
than those estimated for alcohol-attributable death rates.
Table 42: Alcohol-attributable years of life lost (YLLs) caused and prevented, by sex and ethnicity (0–79 years; 2007).
EthnicityYLLs caused
(count)YLLs caused
(rate)**YLLs
prevented
Males Māori 2888 1013 317
Non-Māori 6831 382 1708
Total 9720 478 2025
Females Māori 1165 389 166
Non-Māori 2885 140 903
Total 4049 177 1069
Total Māori 4053 688 483
Non-Māori 9716 260 2611
Total 13769 325 3095
**Rate per 100,000 age-standardised to WHO world population.
*We were unable to calculate the proportions of all YLLs that were attributable to alcohol because GBD YLL denominator data was not available for 2007.

77
MORTALITY BY AGE/SEX SUBGROUP (2007)
Deaths
Table 43 shows how the leading causes of alcohol-attributable deaths differed by age for male and
female New Zealanders. Injuries were the dominant cause of alcohol-attributable deaths in young adults,
with only injury categories included in the five leading causes of alcohol-attributable deaths in 15–29 year
old males, 30–44 year old males, and 15–29 year old females. For these three young adult subgroups,
road traffic injuries and self-inflicted injuries were the first and second specific leading causes of alcohol-
attributable deaths, with road traffic injuries responsible for more than half of the alcohol-attributable
deaths in 15–29 year old males (n = 58) and females (n = 14) and almost one-third of alcohol-attributable
deaths in 30–44 year old males (n = 33). Breast cancer was a leading cause of alcohol-attributable
deaths in women over 30 years old, while alcoholic liver cirrhosis was a common cause of alcohol-
attributable deaths in women older than 30 years and men older than 45 years.
Table 44 details the how the numbers of alcohol-attributable deaths caused by injuries and conditions
varied by age and sex. Injuries were responsible for most alcohol-attributable deaths in young adults, with
a transition in the older age groups to fewer alcohol-attributed injury deaths and more deaths due to
alcohol-attributable conditions. This transition from alcohol-attributable injury deaths to condition deaths
was more apparent and appeared later in life for men than women (Figure 3).

78
Table 43: Top five causes of alcohol-attributable (AA) deaths, by age and sex (2007).*
Males% of
AA deaths Females% of
AA deaths
15-29 years (N = 104) 15-29 years (N = 24)
Road traffic injuries 55.9% Road traffic injuries 58.0%
Self-inflicted injuries 17.8% Self-inflicted injuries 13.8%
Non-alcohol poisonings 6.0% Violence 9.6%
Other unintentional injuries 5.6% Other unintentional injuries 6.0%
Violence 4.6% Non-alcohol poisonings 4.9%
30-44 years (N = 98) 30-44 years (N = 38)
Road traffic injuries 33.9% Female breast cancer 22.8%
Self-inflicted injuries 22.8% Road traffic injuries 15.4%
Other unintentional injuries 15.7% Alcoholic liver cirrhosis 13.1%
Non-alcohol poisonings 5.2% Self-inflicted injuries 12.1%
Drownings 4.1% Haemorrhagic stroke 6.2%
45-59 years (N = 122) 45-59 years (N = 70)
Alcoholic liver cirrhosis 24.6% Female breast cancer 38.8%
Other unintentional injuries 9.9% Alcoholic liver cirrhosis 12.8%
Self-inflicted injuries 9.3% Haemorrhagic stroke 8.2%
Mouth and oropharyngeal cancers 6.1% Alcohol use disorders 4.3%
Liver cancer 6.0% Self-inflicted injuries 4.2%
60-69 years (N = 98) 60-69 years (N = 57)
Alcoholic liver cirrhosis 22.5% Female breast cancer 32.8%
Mouth and oropharyngeal cancers 12.6% Alcoholic liver cirrhosis 19.4%
Oesophagus cancer 11.8% Colon cancer 10.9%
Rectum cancer 7.1% Haemorrhagic stroke 8.8%
Haemorrhagic stroke 6.7% Rectum cancer 4.5%
70-79 years (N = 102) 70-79 years (N = 68)
Haemorrhagic stroke 15.4% Female breast cancer 23.8%
Oesophagus cancer 14.4% Haemorrhagic stroke 22.7%
Alcoholic liver cirrhosis 6.9% Colon cancer 13.9%
Colon cancer 7.6% Ischaemic heart disease 9.7%
Rectum cancer 7.2% Rectum cancer 4.8%
* There were too few alcohol-attributable deaths in male and female children (014 years) to rank by proportions.

79
Table 44: Alcohol-attributable (AA) condition and injury deaths, by age and sex (2007).
Age category (years)
AA deathscaused
% of total
deaths
Conditions: AA deaths
caused
Injuries: AA deaths
caused
Males 0-4 9 4.1% 1 8
5-14 4 7.9% 0 4
15-29 104 26.6% 2 102
30-44 98 16.2% 10 88
45-59 122 7.4% 73 49
60-69 98 4.6% 84 14
70-79 102 2.7% 87 14
Total 537 6.1% 258 280
Females 0-4 4 2.5% 1 3
5-14 2 5.9% 0 2
15-29 24 14.8% 1 23
30-44 38 8.9% 19 19
45-59 70 6.3% 58 12
60-69 57 3.8% 55 2
70-79 68 2.5% 64 4
Total 265 4.3% 199 66
Figure 3: Number of condition and injury deaths attributable to alcohol consumption, by age and sex (2007).
0
20
40
60
80
100
120
140
0‐4 5‐14 15‐29 30‐44 45‐59 60‐69 70‐79 0‐4 5‐14 15‐29 30‐44 45‐59 60‐69 70‐79
Males Females
Injury deaths
Condition deaths
We further examined the composition of the alcohol-attributable death burden by broad injury and
condition categories in adult males (figure 4) and females (Figure 5). These figures highlight the
prominent role of injuries in the youngest age groups (i.e. 98% and 94% of alcohol-attributable deaths in

80
15–29 year old males and females, respectively) and the increasing role of cancers and cardiovascular
disorders with age. For detailed lists of the specific conditions and injuries included within each broad
cause category, please see Table 3 on page 13 (conditions) and Table 6 on page 17 (injuries).
Figure 4: Males: Causes of alcohol-attributable deaths, by age (2007).
0%
10%
20%
30%
40%
50%
60%
70%
80%
90%
100%
15‐29 30‐44 45‐59 60‐69 70‐79
Cancers
Neuro‐psychiatric disorders
Cardiovascular disorders
Digestive disorders
Respiratory disorders
Unintentional injuries
Intentional injuries
Figure 5: Females: Causes of alcohol-attributable deaths, by age (2007).
0%
10%
20%
30%
40%
50%
60%
70%
80%
90%
100%
15‐29 30‐44 45‐59 60‐69 70‐79
Cancers
Neuro‐psychiatric disorders
Cardiovascular disorders
Digestive disorders
Respiratory disorders
Unintentional injuries
Intentional injuries
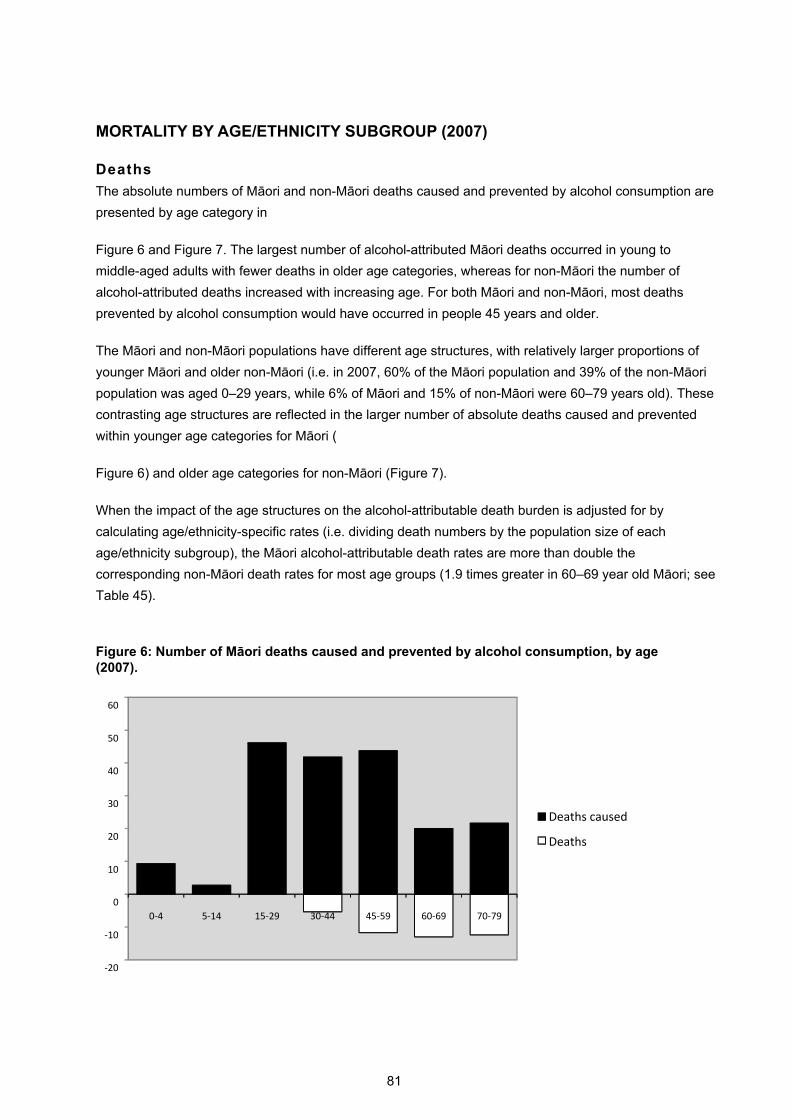
81
MORTALITY BY AGE/ETHNICITY SUBGROUP (2007)
Deaths
The absolute numbers of Māori and non-Māori deaths caused and prevented by alcohol consumption are
presented by age category in
Figure 6 and Figure 7. The largest number of alcohol-attributed Māori deaths occurred in young to
middle-aged adults with fewer deaths in older age categories, whereas for non-Māori the number of
alcohol-attributed deaths increased with increasing age. For both Māori and non-Māori, most deaths
prevented by alcohol consumption would have occurred in people 45 years and older.
The Māori and non-Māori populations have different age structures, with relatively larger proportions of
younger Māori and older non-Māori (i.e. in 2007, 60% of the Māori population and 39% of the non-Māori
population was aged 0–29 years, while 6% of Māori and 15% of non-Māori were 60–79 years old). These
contrasting age structures are reflected in the larger number of absolute deaths caused and prevented
within younger age categories for Māori (
Figure 6) and older age categories for non-Māori (Figure 7).
When the impact of the age structures on the alcohol-attributable death burden is adjusted for by
calculating age/ethnicity-specific rates (i.e. dividing death numbers by the population size of each
age/ethnicity subgroup), the Māori alcohol-attributable death rates are more than double the
corresponding non-Māori death rates for most age groups (1.9 times greater in 60–69 year old Māori; see
Table 45).
Figure 6: Number of Māori deaths caused and prevented by alcohol consumption, by age (2007).
‐20
‐10
0
10
20
30
40
50
60
0‐4 5‐14 15‐29 30‐44 45‐59 60‐69 70‐79
Deaths caused
Deaths

82
Figure 7: Number of non-Māori deaths caused and prevented by alcohol consumption, by age (2007).
Table 45: Māori and non-Māori alcohol-attributable death rates, by age (2007).
0-4 5-14 15-29 30-44 45-59 60-69 70-79
Deaths caused (rate*)
Māori 12 2 29 33 51 75 179
Non-Māori 2 1 12 12 20 40 69
Deaths prevented (rate*)
Māori 0 0 0 -4 -14 -49 -103
Non-Māori 0 0 0 -1 -8 -23 -76* Death rates per 100,000 using 2007 population numbers for each age/ethnicity subgroup as denominators.
Years of life lost
The impact of deaths at different ages was taken into account by calculating the alcohol-attributable
years of life lost (YLLs) by age/ethnicity subgroup. For both Māori (
Figure 8) and non-Māori (Figure 9), a higher proportion of the overall YLL burden was due to deaths in
younger age groups. Due to the older age structure of the non-Māori population, the pattern of alcohol-
attributable YLLs by age group was different from that seen for alcohol-attributable deaths (Figure 7), with
a decreasing contribution to the YLL burden with increasing age.
Figure 8: Number of Māori YLLs caused and prevented by alcohol consumption, by age (2007).
‐250
‐200
‐150
‐100
‐50
0
50
100
150
200
0‐4 5‐14 15‐29 30‐44 45‐59 60‐69 70‐79
Deaths caused
Deaths prevented

83
‐500
0
500
1000
1500
2000
0‐4 5‐14 15‐29 30‐44 45‐59 60‐69 70‐79
YLLs caused
YLLs prevented
Figure 9: Number of non-Māori YLLs caused and prevented by alcohol consumption, by age (2007).
‐2000
‐1000
0
1000
2000
3000
4000
0‐4 5‐14 15‐29 30‐44 45‐59 60‐69 70‐79
YLLs caused
YLLs prevented

84
MORTALITY BY AGE/SEX/ETHNICITY SUBGROUP (2007)
The absolute numbers of alcohol-attributable deaths and YLLs are presented in Table 46 by
age/sex/ethnicity subgroup.
Table 46: Number of alcohol-attributable deaths and years of life lost (YLLs); by age, sex and ethnicity (2007).
Ethnicity
Males Māori 6 (214) 2 (60) 35 (1196) 32 (816) 27 (452) 12 (107) 9 (43)
Non-Māori 3 (86) 2 (89) 69 (2343) 66 (1625) 94 (1460) 86 (782) 93 (445)
Totals 9 (300) 4 (149) 104 (3539) 98 (2441) 122 (1912) 98 (889) 102 (489)
Females Māori 3 (100) 1 (41) 11 (374) 9 (237) 16 (259) 8 (81) 13 (72)
Non-Māori 1 (51) 1 (52) 13 (460) 29 (696) 54 (861) 49 (466) 55 (298)
Total 4 (151) 2 (93) 24 (834) 38 (933) 70 (1120) 57 (548) 68 (370)
Total Māori 9 (314) 3 (101) 46 (1570) 42 (1053) 44 (711) 20 (189) 22 (115)
Non-Māori 4 (137) 4 (142) 83 (2804) 95 (2321) 148 (2321) 135 (1248) 149 (743)
Total 13 (451) 6 (242) 129 (4374) 136 (3374) 192 (3032) 155 (1437) 170 (859)
0-4 5-14 15-29 30-44 45-59 60-69 70-79
Figure 10 shows the numbers of YLLs attributed to alcohol per 1,000 people for each age/sex/ethnicity
subgroup. The age-specific rates of Māori YLLs lost were more than 1.8 times the corresponding non-
Māori rates for every age group. Compared to the other sex/ethnicity subgroups, Māori males lost the
most years of life per 1,000 people due to alcohol consumption for almost all age categories. This
contrast was particularly marked in the youngest adult age group, with the YLL rate of 15–29 year old
Māori males 2.3, 3.3 and 11.7 times higher than 15–29 year old non-Māori males, Māori females, and
non-Māori females, respectively.
Further details of 2007 Māori and non-Māori alcohol-attributable mortality by age/sex subgroup and
cause of death are provided in Appendix H (Table H-3 and Table H-4).
Figure 10: Age-specific rates of years of life lost due to alcohol consumption, by sex and ethnicity (2007).
0
5
10
15
20
0‐4 5‐14 15‐29 30‐44 45‐59 60‐69 70‐79
YLLs per 1000
age category
Māori Males
Māori Females
Non‐Māori Males
Non‐Māori Females

85
2004 MORTALITY RESULTS (BRIEF SUMMARY)
OVERVIEW
This section presents a brief summary of the alcohol-attributable deaths and years of life lost (YLL) in
New Zealand during 2004. These mortality estimates are for New Zealanders aged 0–79 years, and
further details (comparable with 2007 mortality tables and figures) are provided in Appendix I.
Overall, 787 deaths in New Zealanders aged 0–79 years were attributed to alcohol consumption in 2004,
representing 5.1% of all deaths under 80 years old. These deaths represented 13,605 YLLs attributable
to alcohol (8.0% of all YLLs: 9.6% of all male YLLs and 5.8% of all female YLLs). Alcohol consumption
was also estimated to prevent 405 deaths but only 3,433 YLLs. This was because the preventive effects
were confined to conditions in older adults, while many deaths caused by alcohol occur in young people.
The following tables and figures show the 2004 mortality results are similar to the 2007 mortality results
presented in the previous section. More ischaemic heart disease deaths were estimated to be prevented
(269 deaths) in 2004 than in 2007 (225 deaths) due to alcohol consumption. However, this difference was
mostly due to more ischaemic heart disease deaths occurring in non-Māori men and women during 2004
compared to 2007, rather than changes in alcohol consumption between years.
Deaths
For New Zealanders aged 0–79 years, the number of male deaths due to alcohol consumption (n = 521)
was double the number of deaths in women (n = 265). Table 47 shows how the top five causes of
alcohol-attributable deaths differed for male and female New Zealanders. Road traffic injuries were the
most common cause of alcohol-attributable deaths (n = 106) in men, while alcohol-attributable breast
cancer deaths (n = 67) were the leading cause of death due to alcohol consumption in women. Alcoholic
liver cirrhosis and haemorrhagic stroke were among the most common causes of alcohol-attributable
death for both sexes.
Table 48 shows how injuries (including unintentional and intentional) were responsible for more than half
of alcohol-attributable deaths in male New Zealanders, and most of the difference between males and
females.
Table 47: Top five causes of alcohol-attributable (AA) deaths, by sex (0–79 years; 2004).
Males% of AA deaths
(N = 521) Females% of AA deaths
(N = 265)
Road traffic injuries 20.3% Female breast cancer 25.1%
Self-inflicted injuries 11.0% Haemorrhagic stroke 12.0%
Alcoholic liver cirrhosis 10.7% Road traffic injuries 10.5%
Other unintentional injuries 7.8% Alcoholic liver cirrhosis 9.0%
Haemorrhagic stroke 6.0% Colon cancer 6.6%

86
Table 48: Alcohol-attributable deaths due to cancer, other conditions, and injuries; by sex (0–79 years; 2004).
N % N % N %
Cancers 109 20.9% 110 41.3% 218 27.8%
Other conditions 143 27.4% 89 33.4% 231 29.4%
Injuries 270 51.8% 67 25.3% 337 42.8%
Total deathsMale deaths Female deaths
The numbers of deaths estimated to be prevented by low average volumes of alcohol consumption in
New Zealand are shown in Table 49. Of all male deaths prevented by drinking (n = 259), more than 90%
were due to alcohol drinking reducing the risk of ischaemic heart disease, while the deaths prevented by
female drinking (n = 145) were more evenly distributed between ischaemic heart disease, ischaemic
stroke, and diabetes.
Table 49: Male and female deaths prevented by alcohol consumption, by condition (0–79 years; 2004).
N % N % N %
Ischaemic heart disease 233 89.9% 36 24.8% 269 66.5%
Ischaemic stroke 5 2.0% 59 40.6% 64 15.8%
Diabetes 20 7.6% 48 33.2% 68 16.7%
Cholelithiasis 1 0.6% 2 1.5% 4 0.9%
Male deaths prevented
Female deaths prevented
Total deaths prevented
Table 50 shows how the leading causes of alcohol-attributable deaths differed by age for male and
female New Zealanders. Injuries were the dominant cause of alcohol-attributable deaths in young adults,
with only injury categories included in the five leading causes of alcohol-attributable deaths in 15–29 year
old males, 30–44 year old males, and 15–29 year old females. For these three young adult subgroups,
road traffic injuries and self-inflicted injuries were the first and second specific leading causes of alcohol-
attributable deaths, with road traffic injuries responsible for more than half of the alcohol-attributable
deaths in 15–29 year old males (n = 60) and females (n = 14) and almost one-third of alcohol-attributable
deaths in 30–44 year old males (n = 31). Breast cancer was a leading cause of alcohol-attributable
deaths in women over 30 years old, while alcoholic liver cirrhosis was a common cause of alcohol-
attributable deaths in women older than 30 years and men older than 45 years.

87
Table 50: Top five causes of alcohol-attributable (AA) deaths, by age and sex (2004).*
Males% of
AA deaths Females% of
AA deaths
15-29 years (N = 115) 15-29 years (N = 25)
Road traffic injuries 52.1% Road traffic injuries 57.0%
Self-inflicted injuries 19.8% Self-inflicted injuries 16.9%
Other unintentional injuries 6.0% Non-alcohol poisonings 6.5%
Non-alcohol poisonings 4.4% Alcohol poisonings 4.1%
Drownings 4.2% Other unintentional injuries 3.8%
30-44 years (N = 100) 30-44 years (N = 39)
Road traffic injuries 31.3% Female breast cancer 25.9%
Self-inflicted injuries 20.6% Road traffic injuries 23.8%
Other unintentional injuries 13.0% Alcoholic liver cirrhosis 10.2%
Drownings 5.6% Self-inflicted injuries 9.7%
Falls 4.6% Alcohol use disorders 5.1%
45-59 years (N = 102) 45-59 years (N = 69)
Alcoholic liver cirrhosis 16.6% Female breast cancer 32.7%
Mouth and oropharyngeal cancers 9.6% Alcoholic liver cirrhosis 15.9%
Other unintentional injuries 9.4% Alcohol use disorders 8.7%
Self-inflicted injuries 9.1% Haemorrhagic stroke 7.4%
Road traffic injuries 8.3% Colon cancer 4.8%
60-69 years (N = 83) 60-69 years (N = 52)
Alcoholic liver cirrhosis 27.7% Female breast cancer 34.6%
Oesophagus cancer 12.2% Haemorrhagic stroke 13.0%
Mouth and oropharyngeal cancers 11.0% Colon cancer 10.4%
Haemorrhagic stroke 6.5% Alcoholic liver cirrhosis 7.7%
Rectum cancer 6.2% Rectum cancer 6.2%
70-79 years (N = 112) 70-79 years (N = 75)
Haemorrhagic stroke 17.0% Haemorrhagic stroke 25.0%
Alcohol use disorders 10.7% Female breast cancer 20.3%
Alcoholic liver cirrhosis 10.7% Colon cancer 11.3%
Oesophagus cancer 8.4% Ischaemic heart disease 8.3%
Mouth and oropharyngeal cancers 7.4% Alcoholic liver cirrhosis 6.7%
* There were too few alcohol-attributable deaths in male and female children (0–14 years) to rank by proportions.
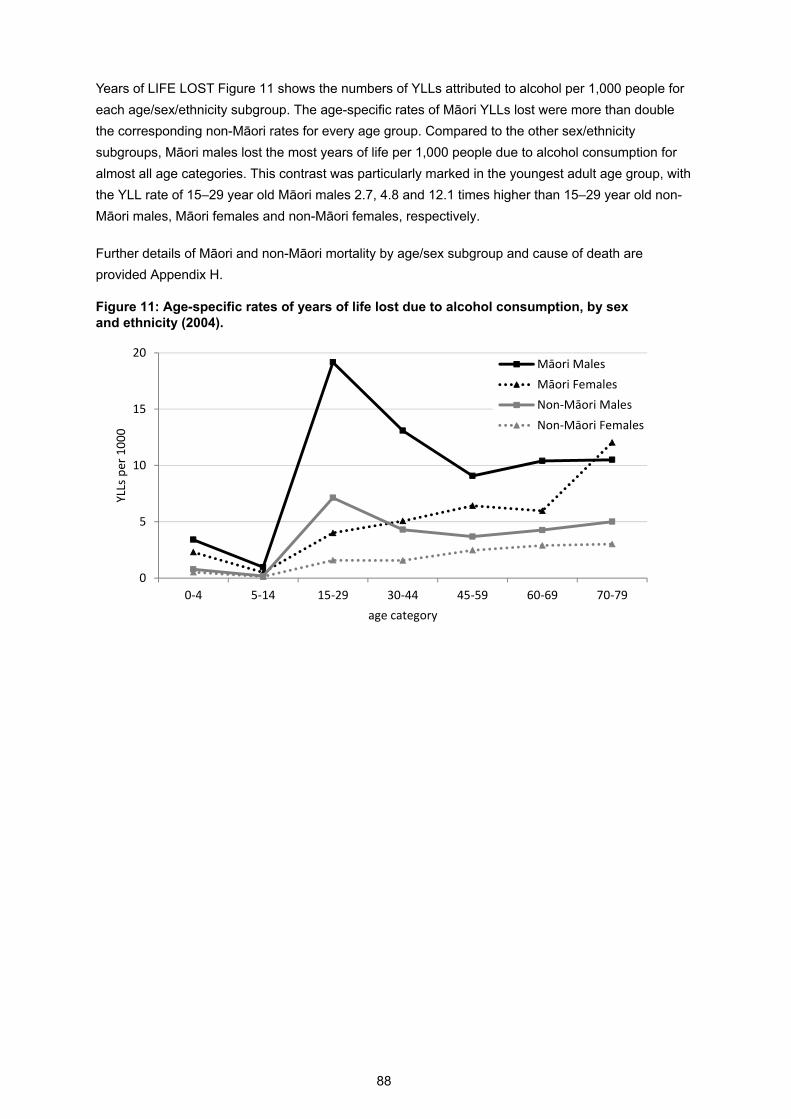
88
Years of LIFE LOST Figure 11 shows the numbers of YLLs attributed to alcohol per 1,000 people for
each age/sex/ethnicity subgroup. The age-specific rates of Māori YLLs lost were more than double
the corresponding non-Māori rates for every age group. Compared to the other sex/ethnicity
subgroups, Māori males lost the most years of life per 1,000 people due to alcohol consumption for
almost all age categories. This contrast was particularly marked in the youngest adult age group, with
the YLL rate of 15–29 year old Māori males 2.7, 4.8 and 12.1 times higher than 15–29 year old non-
Māori males, Māori females and non-Māori females, respectively.
Further details of Māori and non-Māori mortality by age/sex subgroup and cause of death are
provided Appendix H.
Figure 11: Age-specific rates of years of life lost due to alcohol consumption, by sex and ethnicity (2004).
0
5
10
15
20
0‐4 5‐14 15‐29 30‐44 45‐59 60‐69 70‐79
YLLs per 1000
age category
Māori Males
Māori Females
Non‐Māori Males
Non‐Māori Females

89
2004 DISABILITY-ADJUSTED LIFE YEARS (DALYS)
RESULTS
OVERVIEW
This section presents our alcohol-attributable disability-adjusted life year (DALY) estimates for New
Zealand during 2004, the most recent year for which the required data were available from the WHO
Global Burden of Disease study. As described previously in the ‘Methods: Alcohol-attributable DALYs
(2004) ’ section (starting on page 49), alcohol-attributable DALYs combined mortality and morbidity
due to alcohol consumption by adding the years of life lost due to premature death (YLLs) and the
years of ‘healthy’ life lost due to disability (YLDs). One DALY indicates the loss of one year of full
health,47 making it possible to express alcohol-attributable mortality and morbidity in the same units
(years of life). The use of DALYs as a more comprehensive measure of population health burden
allows for analyses that include health consequences that result in early deaths but little disability
(e.g.) drownings) alongside those that often result in disability but rarely cause deaths (e.g) alcohol
use disorders).
Alcohol-attributable DALY estimates are reported by:
Sex (see page 89)
Age/sex (see page 96)
Unipolar depressive disorders: Sensitivity analysis (see page 100).
We were unable to calculate the alcohol-attributable DALY burden for Māori and non-Māori
separately, since ethnicity-specific WHO Global Burden of Disease (GBD) study estimates for YLDs
were not available.
Since only GBD condition and injury categories could be used for DALY calculations, there were
several differences from the categories used in our alcohol-attributable mortality analysis (see
‘Differences in alcohol-attributable condition and injury categories between mortality and DALY
analyses’ starting on page 50 for details). The categories that were excluded from our DALY analysis
due to the absence of corresponding GBD categories were: laryngeal cancer, cardiac arrhythmias,
oesophageal varices, cholelithiasis, pancreatitis, and fetal alcohol syndrome.
Overall, 28,403 disability-adjusted life years in New Zealanders aged 0–79 years were attributed to
alcohol consumption in 2004, representing 6.5% of all DALYs lost. The total of 6,538 DALYs were
estimated to be prevented by alcohol consumption in New Zealanders under 80 years old.
DALYS BY SEX (2004)
When DALYs were used to measure the alcohol-attributable disease and injury burden for New
Zealanders aged 0–79 years, the burden in men was double that in women, while the number of
DALYs considered prevented by alcohol was almost the same (Table 51).

90
Table 51: Alcohol-attributable disability-adjusted life years (AA DALYs) lost and prevented, by sex (0–79 years; 2004).
AA DALYs lost (count)
% of all DALYs lost
AA DALYs lost (rate*)
AA DALYs prevented
Males 18,803 8.8% 933 3,482
Females 9,601 4.3% 435 3,057
Total 28,403 6.5% 680 6,538 * Rate per 100,000 age-standardised to WHO world population
While several of the leading causes of alcohol-attributable DALYs were also top causes of alcohol-
attributable deaths in males (i.e. road traffic injuries, self-inflicted injuries, and other unintentional
injuries) and females (i.e. breast cancer, road traffic injuries, and liver cirrhosis), alcohol use disorders
clearly emerged as the leading cause of alcohol-attributable DALYs for both sexes (Table 52). In
males, alcohol use disorders were responsible for more than twice the proportion of DALYs lost than
alcohol-attributable road traffic injuries. The relative contribution of alcohol use disorders to the overall
alcohol-attributable DALY burden was even greater in women, with the number of DALYs due to
alcohol use disorders more than four times the DALYs due to alcohol-attributable breast cancer or
road traffic injuries.
This major difference between our mortality and DALY results is partly due to differences in case-
fatality and duration of conditions, but mainly because the specific cause of death for people with
alcohol use disorders usually belongs to another category.
Table 52: Top five causes of alcohol-attributable disability-adjusted life years (AA DALYs) lost, by sex (0–79 years; 2004).
Males
% of AA DALYs(N = 18803) Females
% of AA DALYs(N = 9601)
Alcohol use disorders 42.5% Alcohol use disorders 50.0%
Road traffic injuries 18.8% Female breast cancer 12.2%
Self-inflicted injuries 7.8% Road traffic injuries 10.3%
Other unintentional injuries 6.5% Cirrhosis of the liver 4.3%
Cirrhosis of the liver 3.8% Other unintentional injuries 3.5%
Table 53 shows how using DALYs instead of mortality to measure the alcohol-attributable burden
changed the distribution of burden between major cause categories. A large proportion of the non-
fatal burden of alcohol is suffered by those living with heavy drinking (i.e. alcohol use disorders) rather
than suffering from a specific disease or injury.

91
Table 53: Alcohol-attributable DALYs lost due to cancer, other conditions, and injuries, by sex (0–79 years; 2004).
DALYs % DALYs % DALYs %
Cancers 1114 5.9% 1680 17.5% 2793 9.8%
Other conditions 9717 51.7% 5811 60.5% 15528 54.7%
Injuries 7972 42.4% 2109 22.0% 10081 35.5%
Males Females Total
The numbers of DALYs estimated as prevented by alcohol consumption in New Zealand are shown in
Table 54. The distribution of male DALYs prevented was similar to the distribution of prevented
deaths and YLLs. More differences between alcohol-attributable DALYs and deaths/YLLs prevented
were seen for female New Zealanders, with ischaemic stroke accounting for a smaller proportion and
diabetes mellitus responsible for a larger proportion of DALYs prevented, reflecting the long average
duration of diabetes compared with non-fatal stroke. DALYs prevented due to cholelithiasis could not
be included in this analysis since cholelithiasis is not a GBD cause category, so YLD estimates were
not available.
While haemorrhagic stroke was responsible for alcohol-attributable mortality, it appeared as a source
of female DALYs prevented by alcohol consumption (Table 54). This seemingly paradoxical result
occurred because, for women, morbidity AAFs were estimated as preventive for all age categories
(see Table 29 on page 62 for morbidity AAFs), based on preventive morbidity relative risks (i.e. RR <
1.0) for female drinkers with average daily alcohol consumptions of less than 40 grams of alcohol (see
Table 26 on page 59 for morbidity RR estimates). The majority of New Zealand females fell into this
alcohol consumption category for all age categories. However, when these YLDs prevented were
combined with YLLs caused, the net number of DALYs prevented was very small.
Table 54: Male and female DALYs prevented by alcohol consumption, by condition (0–79 years; 2004).
DALYs % DALYs % DALYs %
Ischaemic heart disease 3078 88.4% 884 28.9% 3962 60.6%
Ischaemic stroke 77 2.2% 741 24.2% 817 12.5%
Haemorrhagic stroke 0 0.0% 146 4.8% 146 2.2%
Hypertensive heart disease 0 0.0% 1 0.0% 1 0.0%
Diabetes mellitus 327 9.4% 1286 42.1% 1612 24.7%
Males Females Total
As previously mentioned, several categories were excluded from our DALY analysis due to the
absence of corresponding GBD categories (i.e. laryngeal cancer, cardiac arrhythmias, oesophageal
varices, cholelithiasis, pancreatitis, and fetal alcohol syndrome). Therefore, the specific conditions and
injuries within the broad cause categories used in Figures 12 and 13 differ slightly from those used in
the mortality analysis.

92
The cause categories used to calculate DALYs lost in Figures 12, 13, 18 and 19 included the
following specific conditions and injuries (for more details, please see ‘Differences in alcohol-
attributable condition and injury categories between mortality and DALY analyses’ on page 50):
Cancers: mouth and oropharyngeal cancers, oesophagus cancer, colon cancer,
rectum cancer, liver cancer and female breast cancer.
Neuro-psychiatric disorders: alcohol use disorders and epilepsy.
Cardiovascular disorders: hypertensive heart disease, ischaemic heart disease,
ischaemic stroke and haemorrhagic stroke.
Digestive disorders: cirrhosis of the liver.
Other conditions:
Conditions arising during pregnancy: low birth weight.
Respiratory disorders: tuberculosis and lower respiratory infections (pneumonia).
Unintentional injuries: road traffic injuries, poisonings, falls, fires, drownings and
other unintentional injuries.
Intentional injuries: self-inflicted injuries, assault and other intentional injuries.
Figures 12 and 13 illustrate the male and female DALYs lost due to alcohol consumption, showing
how YLLs and YLDs contributed to the overall number of DALYs for each cause category. Non-fatal
consequences of alcohol consumption (i.e. YLDs) were responsible for a higher proportion of the total
alcohol-attributable DALY burden in women (58%) than men (50%).
Males lost more DALYs due to alcohol consumption than females in every category except cancer,
where breast cancer resulted in more female DALYs. Figures 12 and 13 further demonstrate the
dominant role of neuro-psychiatric disorders in the male and female alcohol-attributable DALY
burden, which was almost entirely due to morbidity caused by alcohol use disorders. In males, injuries
were responsible for much of the remaining DALY burden, with unintentional and intentional injuries
responsible for 33% and 10% of alcohol-attributable DALYs, respectively. In females, unintentional
injuries and cancers were each responsible for 18% of the alcohol-attributable DALY burden, with less
than 5% of DALYs due to intentional injuries.

93
Figure 12: Males: Number of DALYs lost due to alcohol consumption, by cause category (0–79 years; 2004).
0.0 1.0 2.0 3.0 4.0 5.0 6.0 7.0 8.0 9.0
Neuro‐psychiatric disorders
Unintentional injuries
Intentional injuries
Cancers
Cirrhosis of the liver
Cardiovascular disorders
Other conditions
Alcohol‐attributable DALYs (in thousands)
YLLs
YLDs
Figure 13: Females: Number of DALYs lost due to alcohol consumption, by cause category (0–79 years; 2004).
0.0 1.0 2.0 3.0 4.0 5.0 6.0 7.0 8.0 9.0
Neuro‐psychiatric disorders
Unintentional injuries
Intentional injuries
Cancers
Cirrhosis of the liver
Cardiovascular disorders
Other conditions
Alcohol‐attributable DALYs (in thousands)
YLLs
YLDs

94
See Table 55 for the numbers of DALYs attributable to alcohol consumption by sex and cause.
Figures 14 and 15 present these DALYs for the 10 leading causes in men and women, again showing
the dominant role of alcohol use disorders and illustrating the relative contributions of YLLs and YLDs
within each condition and injury category.
Table 55: Number of alcohol-attributable DALYs lost for each condition and injury category, by sex (0–79 years; 2004).
DALYs % DALYs % DALYs %
Conditions
Mouth and oropharyngeal cancers 321 1.7% 85 0.9% 406 1.4%
Oesophagus cancer 298 1.6% 70 0.7% 368 1.3%
Colon cancer 149 0.8% 198 2.1% 347 1.2%
Rectum cancer 179 1.0% 108 1.1% 287 1.0%
Liver cancer 166 0.9% 45 0.5% 211 0.7%
Female breast cancer 1174 12.2% 1174 4.1%
Alcohol use disorders 7986 42.5% 4798 50.0% 12784 45.0%
Epilepsy 407 2.2% 135 1.4% 541 1.9%
Hypertensive heart disease 107 0.6% 23 0.2% 129 0.5%
Ischaemic heart disease 0 0.0% 60 0.6% 60 0.2%
Ischaemic stroke 6 0.0% 0 0.0% 6 0.0%
Haemorrhagic stroke 322 1.7% 276 2.9% 598 2.1%
Cirrhosis of the liver 713 3.8% 412 4.3% 1125 4.0%
Low birth weight 87 0.5% 77 0.8% 164 0.6%
Tuberculosis 45 0.2% 13 0.1% 57 0.2%
Lower resp. infections: pneumonia 45 0.2% 19 0.2% 64 0.2%
Injuries 0.0%
Road traffic injuries 3526 18.8% 989 10.3% 4515 15.9%
Poisonings 367 2.0% 204 2.1% 572 2.0%
Falls 559 3.0% 85 0.9% 644 2.3%
Fires 117 0.6% 34 0.4% 152 0.5%
Drownings 364 1.9% 48 0.5% 412 1.5%
Other unintentional injuries 1223 6.5% 340 3.5% 1563 5.5%
Self-inflicted injuries 1473 7.8% 297 3.1% 1770 6.2%
Assault 322 1.7% 108 1.1% 430 1.5%
Other intentional injuries 21 0.1% 4 0.0% 25 0.1%
Totals 18803 100.0% 9601 100.0% 28403 100.0%
Males Females Total

95
Figure 14: Males: 10 leading causes of DALYs lost due to alcohol consumption in New Zealand (0–79 years; 2004).
0.0 1.0 2.0 3.0 4.0 5.0 6.0 7.0 8.0 9.0
Alcohol use disorders
Road traffic injuries
Self‐inflicted injuries
Other unintentional injuries
Cirrhosis of the liver
Falls
Epilepsy
Poisonings
Drownings
Haemorrhagic stroke
Alcohol‐attributable DALYs (in thousands)
YLLs
YLDs
Figure 15: Females: 10 leading causes of DALYs lost due to alcohol consumption in New Zealand (0–79 years; 2004).
0.0 1.0 2.0 3.0 4.0 5.0 6.0 7.0 8.0 9.0
Alcohol use disorders
Female breast cancer
Road traffic injuries
Cirrhosis of the liver
Other unintentional injuries
Self‐inflicted injuries
Haemorrhagic stroke
Poisonings
Colon cancer
Epilepsy
Alcohol‐attributable DALYs (in thousands)
YLLs
YLDs
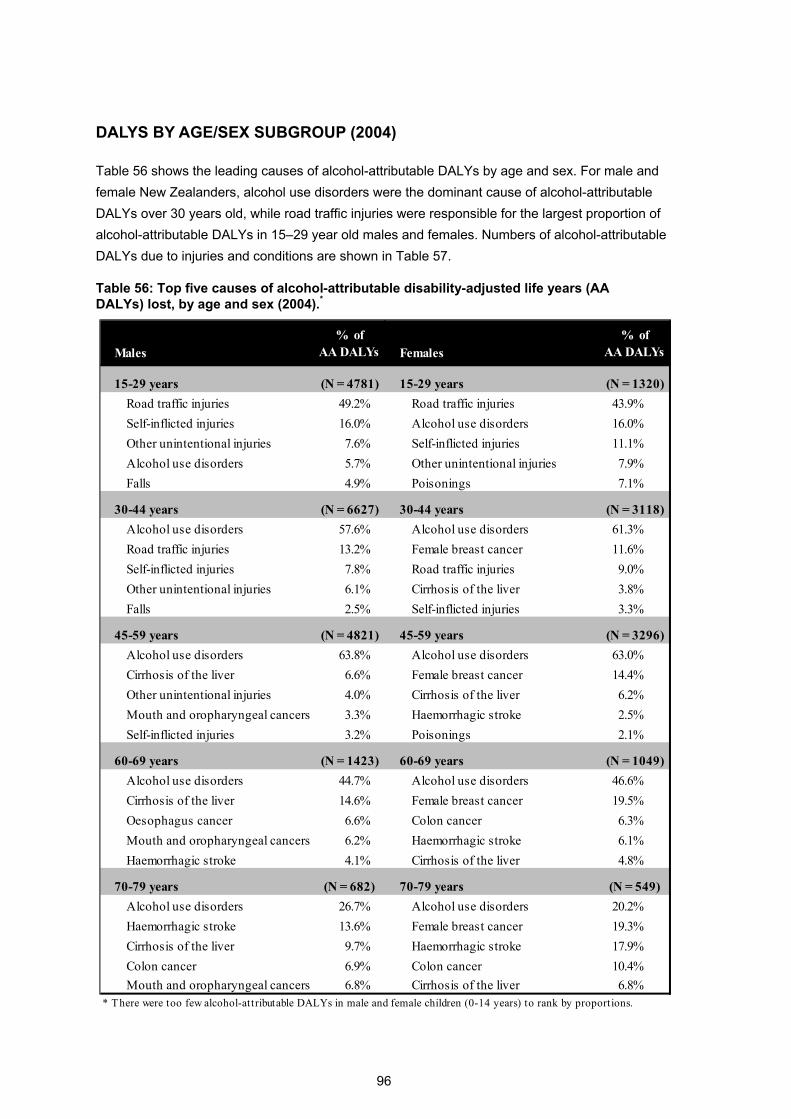
96
DALYS BY AGE/SEX SUBGROUP (2004)
Table 56 shows the leading causes of alcohol-attributable DALYs by age and sex. For male and
female New Zealanders, alcohol use disorders were the dominant cause of alcohol-attributable
DALYs over 30 years old, while road traffic injuries were responsible for the largest proportion of
alcohol-attributable DALYs in 15–29 year old males and females. Numbers of alcohol-attributable
DALYs due to injuries and conditions are shown in Table 57.
Table 56: Top five causes of alcohol-attributable disability-adjusted life years (AA DALYs) lost, by age and sex (2004).*
Males
% of AA DALYs Females
% of AA DALYs
15-29 years (N = 4781) 15-29 years (N = 1320)
Road traffic injuries 49.2% Road traffic injuries 43.9%
Self-inflicted injuries 16.0% Alcohol use disorders 16.0%
Other unintentional injuries 7.6% Self-inflicted injuries 11.1%
Alcohol use disorders 5.7% Other unintentional injuries 7.9%
Falls 4.9% Poisonings 7.1%
30-44 years (N = 6627) 30-44 years (N = 3118)
Alcohol use disorders 57.6% Alcohol use disorders 61.3%
Road traffic injuries 13.2% Female breast cancer 11.6%
Self-inflicted injuries 7.8% Road traffic injuries 9.0%
Other unintentional injuries 6.1% Cirrhosis of the liver 3.8%
Falls 2.5% Self-inflicted injuries 3.3%
45-59 years (N = 4821) 45-59 years (N = 3296)
Alcohol use disorders 63.8% Alcohol use disorders 63.0%
Cirrhosis of the liver 6.6% Female breast cancer 14.4%
Other unintentional injuries 4.0% Cirrhosis of the liver 6.2%
Mouth and oropharyngeal cancers 3.3% Haemorrhagic stroke 2.5%
Self-inflicted injuries 3.2% Poisonings 2.1%
60-69 years (N = 1423) 60-69 years (N = 1049)
Alcohol use disorders 44.7% Alcohol use disorders 46.6%
Cirrhosis of the liver 14.6% Female breast cancer 19.5%
Oesophagus cancer 6.6% Colon cancer 6.3%
Mouth and oropharyngeal cancers 6.2% Haemorrhagic stroke 6.1%
Haemorrhagic stroke 4.1% Cirrhosis of the liver 4.8%
70-79 years (N = 682) 70-79 years (N = 549)
Alcohol use disorders 26.7% Alcohol use disorders 20.2%
Haemorrhagic stroke 13.6% Female breast cancer 19.3%
Cirrhosis of the liver 9.7% Haemorrhagic stroke 17.9%
Colon cancer 6.9% Colon cancer 10.4%
Mouth and oropharyngeal cancers 6.8% Cirrhosis of the liver 6.8%* There were too few alcohol-attributable DALYs in male and female children (0-14 years) to rank by proportions.
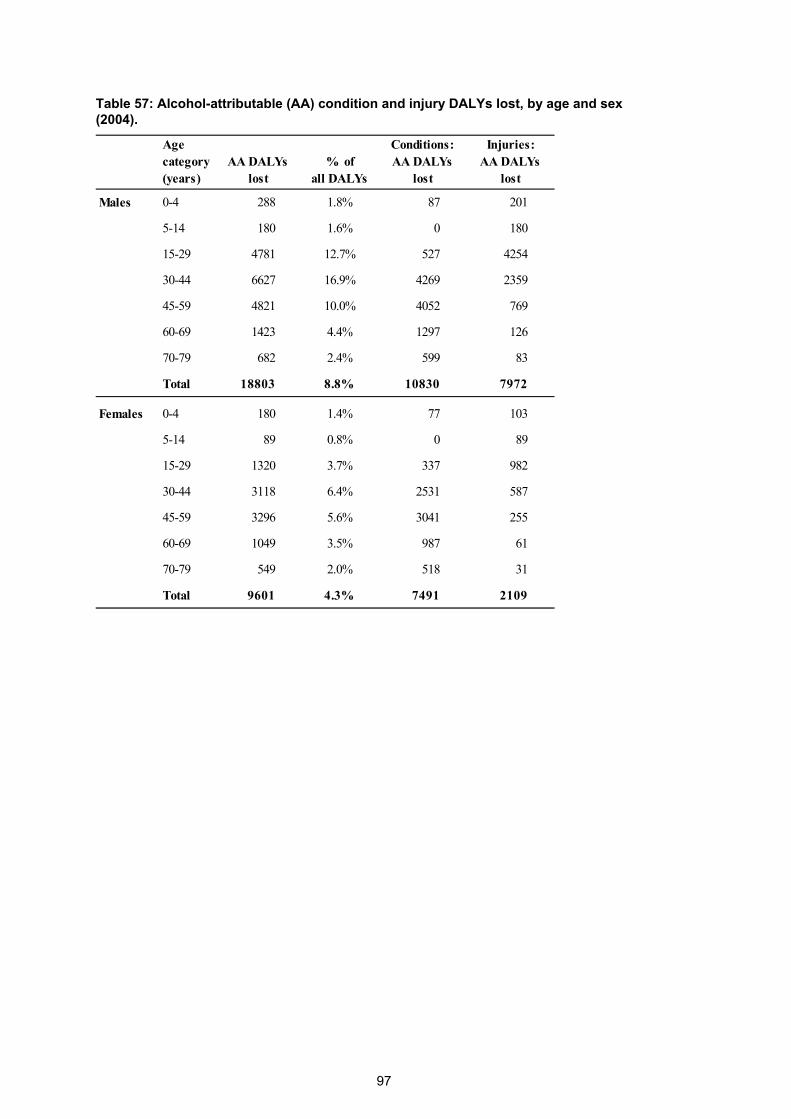
97
Table 57: Alcohol-attributable (AA) condition and injury DALYs lost, by age and sex (2004).
Age category (years)
AA DALYslost
% of all DALYs
Conditions: AA DALYs
lost
Injuries: AA DALYs
lost
Males 0-4 288 1.8% 87 201
5-14 180 1.6% 0 180
15-29 4781 12.7% 527 4254
30-44 6627 16.9% 4269 2359
45-59 4821 10.0% 4052 769
60-69 1423 4.4% 1297 126
70-79 682 2.4% 599 83
Total 18803 8.8% 10830 7972
Females 0-4 180 1.4% 77 103
5-14 89 0.8% 0 89
15-29 1320 3.7% 337 982
30-44 3118 6.4% 2531 587
45-59 3296 5.6% 3041 255
60-69 1049 3.5% 987 61
70-79 549 2.0% 518 31
Total 9601 4.3% 7491 2109

98
While the number of alcohol-attributable DALYs lost was substantially greater for men than women in
all age categories, similar numbers of DALYs were estimated as prevented in men and women (see
Figures 16 and 17).
Figure 16: Number of male DALYs caused and prevented by alcohol consumption, by age (2004).
‐2000
‐1000
0
1000
2000
3000
4000
5000
6000
7000
8000
0‐4 5‐14 15‐29 30‐44 45‐59 60‐69 70‐79
DALYs caused
DALYs prevented
Figure 17: Number of female DALYs caused and prevented by alcohol consumption, by age (2004).
‐2000
‐1000
0
1000
2000
3000
4000
5000
6000
7000
8000
0‐4 5‐14 15‐29 30‐44 45‐59 60‐69 70‐79
DALYs caused
DALYs prevented
The prominent role of neuro-psychiatric disorders in the DALY burden of middle-aged New
Zealanders is illustrated in Figures 18 and 19, with neuro-psychiatric disorders causing
approximately 60% of alcohol-attributable DALYs in 30–59 year old men and women. These
figures also show the large contribution of injuries to the alcohol-attributable DALY burden in
young adult New Zealanders, with alcohol-attributable injuries in 15–29 year olds responsible for

99
89% and 74% of male and female DALYs, respectively. Finally, the increasing role of cancers and
cardiovascular disorders with age is also evident, as seen for alcohol-attributable deaths.
Figure 18: Males: Causes of alcohol-attributable DALYs, by age (2004).
0%
10%
20%
30%
40%
50%
60%
70%
80%
90%
100%
15‐29 30‐44 45‐59 60‐69 70‐79
Cancers
Neuro‐psychiatric disorders
Cardiovascular disorders
Cirrhosis of the liver
Respiratory disorders
Unintentional injuries
Intentional injuries
Figure 19: Females: Causes of alcohol-attributable DALYs, by age (2004).
0%
10%
20%
30%
40%
50%
60%
70%
80%
90%
100%
15‐29 30‐44 45‐59 60‐69 70‐79
Cancers
Neuro‐psychiatric disorders
Cardiovascular disorders
Cirrhosis of the liver
Respiratory disorders
Unintentional injuries
Intentional injuries

100
UNIPOLAR DEPRESSIVE DISORDERS: SENSITIVITY ANALYSIS (2004)
Unipolar depressive disorders were excluded from the mortality analysis and the main disability-
adjusted life years (DALY) analysis due to inadequacy of the available data for estimating relative
risks for the complicated relationship between alcohol and depression (please see pages 35, 51 and
59 for more details about this decision). While the Global Burden of Disease 2010 Risk Factors
Collaborating Group has confirmed that alcohol consumption plays a causal role in some unipolar
depression, there is currently no established GBD method for quantifying the relationship between
alcohol consumption and depression.2
Since unipolar depressive disorders contribute substantially to the non-fatal burden of disease, we
performed a sensitivity analysis of our DALY calculations using direct estimates of depression AAFs
(see page 59 for depression AAF calculation details and Table 29 on page 62 for age/sex-specific
AAFs). The sensitivity analysis presented below demonstrates the impact of including depression as
an alcohol-related condition on the DALY results.
Overall, the sensitivity analysis estimated that unipolar depressive disorders due to alcohol
consumption were responsible for 299 DALYs in males and 249 DALYs in females (1.6% and 2.5% of
all male and female alcohol-attributable DALYs, respectively). Table 58 shows the sex-specific
alcohol-attributable DALY estimates from the sensitivity analysis (depression included in the
calculations) and the main analysis (depression excluded), while Table 59 contrasts estimates from
the two analyses by age/sex subgroup.
Table 58: Comparison of depression sensitivity analysis and main analysis: Alcohol-attributable disability-adjusted life years (AA DALYs) lost, by sex (0–79 years; 2004).
AA DALYs lost (count)
(results from main analysis)
% of all DALYs lost
(results from main analysis)
AA DALYs lost (rate*)
(results from main analysis)
Males 19,102 (18,803) 9.0% (8.8%) 949 (933)
Females 9,849 (9,601) 4.4% (4.3%) 448 (435)
Total 28,951 (28,403) 6.6% (6.5%) 695 (680)
* Rate per 100,000 age-standardised to WHO world population
The addition of alcohol-attributable depression DALYs translates into slightly higher overall estimates
of the proportions of all DALYs lost and the standardised rate of DALYs lost for males and females
(see Table 58). The age/sex-specific DALY estimates in Table 59 show how most of the alcohol-
attributable depression DALYs occur in 15–29 year old males and females (194 and 145 additional
DALYs lost, respectively), followed by 30–44 year olds (an increase of 84 male DALYs and 91 female
DALYs).

101
Table 59: Comparison of depression sensitivity analysis and main analysis: Alcohol-
attributable disability-adjusted life years (AA DALYs) lost, by age and sex (2004).
Age category (years)
AA DALYs
lost
(results from main analysis)
% of total
DALYs
(results from main analysis)
Males 0-4 288 (288) 1.8% (1.8%)
5-14 180 (180) 1.6% (1.6%)
15-29 4975 (4781) 13.3% (12.7%)
30-44 6711 (6627) 17.2% (16.9%)
45-59 4843 (4821) 10.1% (10.0%)
60-69 1423 (1423) 4.4% (4.4%)
70-79 682 (682) 2.4% (2.4%)
Total 19102 (18803) 9.0% (8.8%)
Females 0-4 180 (180) 1.4% (1.4%)
5-14 89 (89) 0.8% (0.8%)
15-29 1465 (1320) 4.1% (3.7%)
30-44 3209 (3118) 6.6% (6.4%)
45-59 3308 (3296) 5.6% (5.6%)
60-69 1049 (1049) 3.5% (3.5%)
70-79 549 (549) 2.0% (2.0%)
Total 9849 (9601) 4.4% (4.3%)
The sensitivity analysis ranked unipolar depressive disorders as the 8th and 13th highest specific
cause of alcohol-attributable DALYs for New Zealand females and males, respectively.
Table 60 shows how 10% of alcohol-attributable DALYs were due to depression in 15–29 year old
New Zealand females, with unipolar depressive disorders ranked as the fourth highest specific cause
of alcohol-attributable DALYs for this age/sex subgroup.
Table 60: Depression sensitivity analysis: Top five causes of alcohol-attributable disability-adjusted life years (AA DALYs) lost in 15–29 year olds, by sex (2004).
Males
% of AA DALYs Females
% of AA DALYs
15-29 years (N = 4975) 15-29 years (N = 1465)
Road traffic injuries 47.2% Road traffic injuries 39.6%
Self-inflicted injuries 15.4% Alcohol use disorders 14.4%
Other unintentional injuries 7.3% Self-inflicted injuries 10.0%
Alcohol use disorders 5.5% Unipolar depressive disorders 9.9%
Falls 4.7% Other unintentional injuries 7.2%

102
For the age groups with the highest prevalence of alcohol dependence (15–29 and 30–44 years), the
contribution of depression to the alcohol-attributable burden of disease was further demonstrated
when the YLD (years lived with disability) component of DALYs was examined separately. Table 61
shows how depression was in the top five overall causes of alcohol-attributable YLDs for both males
and females, while Table 62 demonstrates the high proportion of alcohol-attributable YLDs due to
depression in the 15–29 year old age group (18.0% and 23.7% of all alcohol-attributable YLDs in
males and females, respectively).
Table 61: Depression sensitivity analysis: Top five causes of alcohol-attributable years lived with disability (AA YLDs), by sex (0–79 years; 2004).
Males
% of AA YLDs(N = 9660) Females
% of AA YLDs(N = 5825)
Alcohol use disorders 80.8% Alcohol use disorders 79.3%
Road traffic injuries 4.7% Female breast cancer 4.9%
Other unintentional injuries 3.6% Unipolar depressive disorders 4.3%
Unipolar depressive disorders 3.1% Other unintentional injuries 3.1%
Falls 2.0% Road traffic injuries 2.5%
Table 62: Depression sensitivity analysis: Top five causes of alcohol-attributable years lived with disability (AA YLDs) in 15-44 year olds, by sex (2004).
Males
% of AA YLDs Females
% of AA YLDs
15-29 years (N = 1079) 15-29 years (N = 612)
Road traffic injuries 27.4% Alcohol use disorders 34.4%
Alcohol use disorders 22.2% Unipolar depressive disorders 23.7%
Unipolar depressive disorders 18.0% Road traffic injuries 14.6%
Other unintentional injuries 12.1% Other unintentional injuries 12.0%
Falls 9.2% Epilepsy 7.1%
30-44 years (N = 4274) 30-44 years (N = 2226)
Alcohol use disorders 89.4% Alcohol use disorders 83.3%
Road traffic injuries 2.7% Female breast cancer 5.4%
Other unintentional injuries 2.0% Unipolar depressive disorders 4.1%
Unipolar depressive disorders 1.9% Other unintentional injuries 2.3%
Falls 1.2% Road traffic injuries 1.6%

103
DISCUSSION
KEY FINDINGS
The burden of mortality due to alcohol consumption in New Zealanders was estimated as deaths and
years of life lost (YLLs). The burden of morbidity (i.e. non-fatal impacts of alcohol consumption on
health) was incorporated in estimates of alcohol-attributable disability-adjusted life years (DALYs) that
combined the impact of alcohol on mortality (YLLs) and morbidity (years of life lived with a disability;
YLDs).
Alcohol is relevant to the health of adults aged 80 years and over. However, data on both alcohol
consumption and risk relationships in this age group were considered too unreliable and incomplete to
estimate the mortality or DALY burden of alcohol. Therefore, all the results discussed below are only
for New Zealanders aged 0–79 years.
2007 Alcohol-attributable mortality
Overall, 802 deaths in New Zealanders aged 0–79 years were attributed to alcohol consumption in
2007, representing 5.4% of all deaths under 80 years old. These deaths represented 13,769 years of
life lost (YLLs) attributable to alcohol. Alcohol consumption was also estimated to prevent 351 deaths
but only 3,095 YLLs. The alcohol-attributable mortality estimates and key findings were similar in
2004.
Sex and ethnic disparities were observed in the alcohol-attributable mortality burden:
Men were more likely to be harmed by alcohol consumption than women.
Overall, the number of male deaths due to alcohol consumption (n = 537) was
double the number of deaths in women (n = 265) and the alcohol-attributable YLL
burden was 2.4 times higher in men (n = 9,720) than women (n = 4,049).
Alcohol consumption was estimated to cause 6.1% of all male deaths and 4.3% of all
female deaths.
In both Māori and non-Māori, men had more than double the standardised death
rates of women (adjusted for the effect of different age structures in sex/ethnicity
subgroups).
Alcohol-attributable mortality was higher in Māori than non-Māori.
The proportion of total annual deaths attributed to alcohol consumption was higher
for Māori men and women (8.3% and 5.7%) than non-Māori men and women (5.7%
and 4.0%).

104
The standardised alcohol-attributable death rate for Māori overall was 2.5 times the
rate for non-Māori.
The age/ethnicity-specific alcohol-attributable death and YLL rates for Māori were
more than 1.8 times the corresponding non-Māori rates for each age group.
Māori males lost the most years of life due to alcohol consumption for almost all age
categories, with the rate of YLLs lost peaking in 15–29 year olds.
Injuries were responsible for a large share of the alcohol-attributable mortality burden:
Overall, injuries were responsible for:
52% of alcohol-attributable deaths in men (n = 280) and 25% of alcohol-attributable
deaths in women (n = 66).
73% of the alcohol-attributable YLLs in men (n = 7,066) and 42% of the YLLs in
women (n = 1,708).
Most sex and ethnic disparities in alcohol-attributable mortality were due to differences in injury
deaths.
Injuries were the dominant cause of alcohol-attributable deaths in adults aged 15–44 years.
For 15–29 year old males, 30–44 year old males and 15–29 year old females: more
than 90% of all alcohol-attributable deaths were due to injuries, and the five leading
causes of alcohol-attributable deaths were all injury categories.
There was a transition with increasing age from injuries causing most alcohol-attributable deaths in
younger adults (15–44 years) to conditions such as cancers and cardiovascular disorders being
responsible for a larger proportion of alcohol-attributable deaths in older age groups (45–79 years).
This transition was more apparent and occurred later in life for men than women.
Specific leading causes of alcohol-attributable mortality:
For Māori and non-Māori men:
Road traffic injuries were the most common cause of alcohol-attributable deaths.
Self-inflicted injuries, other unintentional injuries and alcoholic liver cirrhosis were
also among the leading causes of deaths due to alcohol consumption.
For Māori and non-Māori women:
Breast cancer was the most common cause of alcohol-attributable deaths.
Road traffic injuries, haemorrhagic stroke and alcoholic liver cirrhosis were also
among the leading causes of deaths due to alcohol consumption.

105
Road traffic injuries and self-inflicted injuries were the first and second specific leading causes of
alcohol-attributable deaths for 15–29 year old males, 30–44 year old males and 15–29 year old
females.
Alcoholic liver cirrhosis was a common cause of alcohol-attributable deaths for 30–69 year old
females and 45–69 year old males.
2004 Alcohol-attributable disability-adjusted life years (DALYs)
Alcohol-attributable disability-adjusted life years (DALYs) were estimated for 2004, the most recent
year for which the required data were available from the WHO Global Burden of Disease study. One
lost DALY indicates the loss of one year of full health, as DALYs combine the time lost due to both
fatal and non-fatal events (i.e. years of life lost due to premature death (YLLs) and years of ‘healthy’
life lost due to disability (YLDs)).
Overall, 28,403 years of ‘healthy’ life (i.e. DALYs) lost in New Zealanders aged 0–79 years were
attributed to alcohol consumption in 2004, representing 6.5% of all DALYs lost in New Zealanders
under 80 years old. Alcohol consumption was estimated to prevent 6,538 DALYs.
Disparities between men and women were observed in the alcohol-attributable DALY
burden:
Men were more likely to be harmed by alcohol consumption than women.
The number of DALYs lost in men (n = 18,803) was double that of women (n =
9,601).
Alcohol consumption was estimated to cause 8.8% of all male DALYs and 4.3% of all
female DALYs.
The standardised rate of DALYs lost due to alcohol consumption was 2.1 times
higher in men than women.
Alcohol use disorders and injuries were responsible for a large proportion of the alcohol-
attributable DALY burden:
Alcohol use disorders:
Overall, alcohol use disorders were the leading cause of alcohol-attributable DALYs
for both men (43%) and women (50%).
The contribution of alcohol use disorders to the DALY burden was almost entirely
due to non-fatal effects (i.e. YLDs).
Injuries:
Overall, injuries were responsible for 42% of the alcohol-attributable DALY burden in
men (n = 7,972) and 22% of the DALY burden in women (n = 2,109).

106
Injuries were the dominant cause of alcohol-attributable deaths and DALYs in young
adults. For 15–29 year olds, 89% of all alcohol-attributable DALYs in males and 74%
of all alcohol-attributable DALYs in females were due to injuries.
Specific leading causes of alcohol-attributable DALYs:
Alcohol use disorders were the dominant cause of alcohol-attributable DALYs in men and women
over 30 years old.
Road traffic injuries were responsible for the largest proportion of alcohol-attributable DALYs in 15–29
year old males and females.
STUDY LIMITATIONS
This report used the most current data and methodologies available to calculate estimates of
mortality and morbidity due to alcohol-attributable conditions and injuries in New Zealand.
However, there are a number of important limitations associated with this analysis that should be
considered when interpreting or using the estimates within this report. Potential weaknesses are
summarised below and most have been previously mentioned in the report.
Alcohol consumption estimates
Alcohol consumption data were obtained from cross-sectional self-reported national population survey
estimates.
These may underestimate average alcohol consumption and the
prevalence/magnitude of heavy drinking occasions in the general New Zealand
population, due to socially desirable responses and because heavy drinkers are
likely to be under-represented.58
Alcohol consumption was estimated for respondents at the time of each survey.
Since mortality and morbidity outcomes were measured for the same years as the
survey data, the temporal relationship between alcohol consumption and impact is
unrealistic for chronic conditions. We were not able to examine the impact of
previous alcohol consumption (i.e. longitudinal changes in drinking) in this analysis.
New Zealanders who did not live in private dwellings (e.g. homeless or
institutionalised) were not included in the survey estimates and were likely to have
very different drinking habits than the general population. However, the impact of this
limitation on our results is expected to be small, since these subgroups comprise a
relatively small proportion of the total New Zealand population under 80 years old.
Several methodological differences between the two main surveys used for
estimating alcohol consumption mean that comparisons between the 2004 and 2007
alcohol consumption estimates may not reflect only differences in consumption.
We acknowledge that alcohol consumption patterns and therefore health burden due
to alcohol will vary by characteristics other than sex, age, and Māori/non-Māori

107
ethnicity. For example, there may be differences by region, rurality, or specific non-
Māori ethnicities, that have not been examined.
Higher degree of uncertainty for estimates of alcohol consumption in some subgroups.
Older age categories: Limited alcohol consumption data were available, and the
surveys we used for our main data sources only included participants up to 65 years
old. Alcohol consumption estimates for the two oldest age categories were therefore
estimated with additional survey data and extrapolation methods, increasing the level
of uncertainty surrounding these estimates (see ‘Alcohol consumption estimates for
older age categories’ on page 26).
Pregnant women: Limited alcohol consumption data were available (see ‘Alcohol
consumption estimates for pregnant women’ on page 27).
Māori: Due to smaller survey sample sizes for Māori (particularly in older age
categories and pregnant women), Māori alcohol consumption estimates are subject
to a higher degree of uncertainty.
Measurement of alcohol-attributable outcomes
The scope of this report is limited by its methodology to health conditions and injuries as defined by
the ICD-10 and Global Burden of Disease (GBD) 2005/2010 study.
Attributing each death to a single direct cause is a simplification which does not
account for the role of antecedent, underlying and/or overlapping causes. This could
under- or over-estimate the impact of alcohol on mortality. New Zealand mortality
data are also collated from several sources (i.e. death certificates from doctors and
coroners, post-mortem reports from private pathologists and hospitals, and death
registration forms from funeral directors), and the accuracy of causal attribution is
unknown.
Some alcohol-related conditions did not have sufficient epidemiological data to
calculate risk relations for the GBD 2010 Risk Factors Assessment for alcohol;2 we
were therefore unable to include them in our analysis.
o While the GBD 2010 Risk Factors Collaborating Group was unable to quantify
the impact of alcohol on unipolar depressive disorders, they agreed that a
causal relationship did exist. Given the large contribution of depression to
morbidity (i.e. DALYs), we have included a sensitivity analysis that uses direct
estimates of depression AAFs to roughly quantify alcohol-attributable DALYs
due to depression.
We were unable to include some important alcohol-attributable outcomes that have
been shown to contribute substantially to the health burden of alcohol in
New Zealand:59
o Social consequences of alcohol consumption: There is a large overlap
between the social and health consequences of alcohol consumption. Heavy

108
drinking often has an impact on the social functioning of drinkers, their
partners and children, and others, with consequent mental and physical health
effects which are not represented in a study of this kind.
o Harm due to other people’s alcohol consumption: We were only able to
estimate harm caused to people other than the drinker for road traffic injuries,
fires and drownings in 0–14 year olds, and assaults in all age categories.
Assumptions used for the YLL and YLD calculations influenced the results.
World Health Organization (WHO) age/sex-specific estimates of New Zealand
morbidity (YLDs) were used, since the required data were not readily available from
New Zealand sources. Since the WHO estimates were not ethnicity-specific, DALYs
could not be calculated separately for Māori and non-Māori.
Our results were influenced by our choice to use time-discounting and age-weighting for YLLs and
YLDs, the life table used to calculate YLLs, and the disability weights used by WHO for YLD
calculations. These are the standard methods used in recent GBD study publications,47,48 other
national-level burden of disease analyses,19,49 and the previous NZBoA2000/02 report.1
Quantification of relationships between alcohol consumption and health outcomes
The estimates of relative risks (RRs) and alcohol-attributable fractions (AAFs) that we used to quantify
the amount of alcohol-attributable mortality and morbidity have several sources of uncertainty.
While we used the best available relative risk estimates to calculate the AAFs, these
estimates are only as good as the best epidemiological studies that have been
performed to date, so there is potential for residual confounding and other sources of
error. This is a particular concern with respect to preventive effects because the
direction of expected confounding and biases would overestimate the magnitude of
the relative risk (i.e. overestimate protective effect), whereas the relative risks for
harmful effects are more likely to be underestimates.
Due to insufficient New Zealand epidemiological data, we depended heavily on risk
estimates from meta-analyses that included data from studies performed in other
countries. The generalisability of these estimates from the source populations to the
New Zealand population is an assumption; this limitation is common to all burden of
disease and injury studies.
RRs used to calculate AAFs were not age-specific.
Ideally, the calculation of mortality and morbidity risk estimates would be based on
data from studies that examine mortality and morbidity outcomes separately.
However, since such data are usually not available, adjustment factors are often
used instead.
For the injury sensitivity analysis, the GBD 2010 Risk Factors Collaborating Group
used the same RRs to calculate AAFs for all non-road traffic injuries since individual
meta-analyses were not possible due to the limited body of research on different
injury types.60

109
Due to our use of lifetime abstainers as a reference population, our results show the mortality and
morbidity burden due to all alcohol consumption. Future studies may wish to include other reference
populations in order to measure the potential reduction in harm under more realistic counterfactual
scenarios (e.g. if the New Zealand population were all regular light drinkers).61
Methodological limitations meant that we could only consider patterns of drinking in our calculations of
the alcohol-attributable burden due to ischaemic heart disease and injuries. However, it is likely that
drinking patterns also affect the development of other conditions.
We were not able to account for cultural or contextual differences that could modify the relationships
between alcohol consumption and health outcomes due to intoxication (e.g. intentional injuries).
Interpretation of results
The validity of comparisons between the results for some subgroups is limited by the uncertainty of
estimates due to small sample sizes, particularly in older age categories and Māori.
The results are not directly comparable with the results of the previous report (i.e. as a tool for
monitoring the impact of changes in alcohol consumption). This is because the methodology used to
produce the estimates presented in the current report differs from the NZBoA2000/02 estimates in
several respects, including the following major points (for more details, please see the
‘Methodological developments’ section starting on page 64):
People older than 80 years were not included in our analysis.
Four new condition categories were included.
There were methodological differences between the alcohol consumption surveys.
Updated RRs were used to calculate the AAFs:
o the RRs in the current report were derived from a much larger and more
current evidence base.
o ex-drinkers and lifetime abstainers were considered separately.
o separate RRs were used for ischaemic and haemorrhagic stroke.
o morbidity RRs were available for several conditions.
o drinking pattern information was included in ischaemic heart disease
calculations.
Caution is required when interpreting the preventive effects of alcohol, as they always need to be
considered alongside the greater alcohol-attributable health risks rather than in isolation.
Our results are all presented as point estimates, with an unquantified degree of uncertainty
surrounding each estimate. It is possible to calculate the uncertainty of AAF estimates using complex
simulation methods,9,62 but this was not considered a priority for our report.

110
Despite the limitations presented above, the updated methods we used to calculate the alcohol-
attributable burden of disease and injury in this report mean that the burden estimates presented in
this report are an improvement over those presented in the previous NZBoA2000/02 report.
COMPARISON WITH PREVIOUS ANALYSES
Our results clearly show the substantial contribution of alcohol to the burden of disease and injury in
New Zealand during 2004 and 2007.
As previously discussed in the ‘Methodological developments’ section, there have been several
changes in methods since the previous NZBoA2000/02 report1 estimated the alcohol-attributable
burden of alcohol in New Zealand. Therefore, our 2004/2007 results are not directly comparable with
the previous 2000/02 results, and any differences are due to a combination of several factors, not
solely changes in alcohol consumption of New Zealanders. One major difference was the restriction of
our 2004/2007 analyses to people under 80 years old due to the unreliability of the alcohol
consumption and risk estimates for older age groups, whereas the NZBoA2000/02 report included all
ages. Notwithstanding other differences between the two reports, when we excluded the 80+ years
age group from the NZBoA2000/02 analysis, the proportion of all deaths attributed to alcohol in 2000
was 5.7%, a similar result to the proportions calculated for 2004 (5.1%) and 2007 (5.4%) in the
current report.
As the Global Burden of Disease and Injury (GBD) 2005/2010 study is not yet complete, the most
recent GBD estimates available are for 2004.63 Our methods were broadly similar to those used by
the GBD, but several differences do exist that limit comparability (including the use of net deaths and
DALYs by the GBD), and the GBD estimates are limited to broad World Health Organization regions
and selected countries. Despite these limitations, many of the GBD findings for high-income
populations are generally similar to those presented in this report. For example, alcohol-attributable
deaths as a proportion of all deaths in the WHO Western Pacific region (WPR), American region
(AMR) and European region (EUR) were 5.3%, 5.6% and 6.5%, respectively.63 The overall
proportions of alcohol-attributable disability-adjusted life years (DALYs) for the WHO regions (7.2%
for WPR, 9.2% for AMR and 11.6% for EUR) were higher than our New Zealand estimate (6.5% of all
2004 DALYs lost). However, all of these proportions depend on competing causes of deaths and
DALYs as well as level of alcohol-related harm.
The estimated proportions of total deaths and DALYs attributable to alcohol in New Zealand were
higher than to the net global estimates of 3.8% for deaths and 4.6% for DALYs.63 As found in New
Zealand, sex disparities were present in all global and regional alcohol-attributable death and DALY
estimates, with men more likely to be harmed by alcohol consumption than women. The broad
categories responsible for most global deaths due to alcohol consumption (i.e. injury, cancer,
cardiovascular disease, and liver cirrhosis) were also leading causes of death in New Zealand.63
Some countries that have recently completed comparable country-level assessments of the alcohol-
attributable health burden include the United States,64 Canada65 and Scotland.18 While each country
used slightly different methods, they shared the same general approach.

111
In contrast to the methods we used to estimate the New Zealand burden, the United States analysis:64
was restricted to people aged 15–64 years; adjusted survey estimates of alcohol consumption for
undercoverage; used the 2005 U.S. population instead of the WHO world population to calculate
standardised rates; and estimated injury alcohol-attributable fractions (AAFs) with GBD models that
result in higher AAFs than those used in our main analysis (see 0 3 for a sensitivity analysis that
shows the effect of using GBD injury AAFs). Alcohol-attributable mortality was estimated by Shield et
al. for the United States for 2005, with alcohol responsible for 9% of all 15–64 year old deaths (12%
for men and 4% for women).65 This was the first report to examine the alcohol-attributable burden in
the United States by both sex and ethnicity. Similar to New Zealand, there were health disparities in
the United States across ethnicities, with Native Americans showing the highest standardised alcohol-
attributable mortality and YLL rates. Sex differences were also present, with men in every ethnic
group experiencing more than three times the amount of alcohol-attributable harm when compared to
women).65 Population standardised alcohol-attributable death rates for 2005 varied widely between
U.S. sex/ethnicity subgroups, ranging from 2 deaths per 100,000 female Asian/Pacific Islanders to
130 per 100,000 male Native Americans.65 Standardised death rates for New Zealand sex/ethnicity
subgroups also showed considerable variation, ranging from 8.1 alcohol-attributable deaths per
100,000 in non-Māori females to 46.5 per 100,000 Māori males in 2007.
The Canadian analysis included people aged 0–64 years in 2005 and calculated confidence intervals
for their estimates.65 While they did not perform analyses by ethnicity, the other methods were mostly
similar to the U.S. study, including the upshifting of alcohol survey estimates and the use of injury
AAFs modelled using GBD methods.65 Alcohol-attributable deaths were estimated at 7.7% of all 0‒64
year old deaths and alcohol-attributable YLLs at 8.0% of all YLLs, with the wide confidence intervals
(95% CI for deaths: 1.6% to 13.9%; YLLs: 2.2% to 14.1%) illustrating the high degree of uncertainty
associated with burden estimates. Similar to New Zealand, alcohol was shown to impact the health of
men more than women, with 75% of alcohol-attributable deaths occurring in men.65 Overall, the
largest contributors to alcohol-attributable death in Canada were similar to those in New Zealand:
unintentional injuries (particularly road traffic injuries), cancers, cirrhosis of the liver, and self-inflicted
injuries. While the leading causes of alcohol-attributable deaths in Canadian men and women were
also generally similar to New Zealand, their ranks and proportions varied somewhat between
countries. The top three causes of alcohol-attributable death in Canadian men aged 0–64 years were:
cirrhosis of the liver (20.2%), road traffic injuries (19.9%) and self-inflicted injuries (15.5%).65 In
Canadian women the top causes were: breast cancer (30.1%), cirrhosis of the liver (27.2%) and road
traffic injuries (7.5%).65 As for New Zealand, the Canadian analysis showed that road traffic injuries
and self-inflicted injuries were the top two specific leading causes of alcohol-attributable deaths for
several younger age groups: 15–24 and 25–34 year old males and females and 35–44 year old
males.65
The Scottish report calculated alcohol-attributable mortality for men and women aged 16 years and
older in 2003.18 In contrast to the methods used in the New Zealand, United States and Canadian
analyses, the Scottish report did not consider ex-drinkers separately; therefore all people who
reported no alcohol consumption within the previous year were included in the non-drinkers reference
group. Injury AAFs for Scotland were estimated directly from case series and other primary data
sources, using a similar approach to our New Zealand injury AAF estimates. Alcohol-attributable

112
deaths were estimated at 5.0% of all deaths among adults aged 16 years and over (6.8% in men and
3.3% in women).18 The proportions of alcohol-attributable deaths were highest in younger age groups,
peaking in 35–44 year old men (26.1% of all deaths) and women (21.1% of all deaths).18 While more
deaths due to alcohol consumption were also seen in younger New Zealanders, the age group with
the highest proportions of overall deaths attributable to alcohol was younger (15–29 years), with
26.6% of male deaths and 14.8% of female deaths in this age group attributed to alcohol
consumption. The corresponding Scottish proportions for alcohol-attributable deaths in 16–24 year old
males and females were 17.5% and 9.9% of all 16–24 year old male and female deaths,
respectively.18 When considering alcohol-attributable deaths by age/sex subgroups, road traffic
injuries and self-inflicted injuries were again the leading causes in younger age groups in Scotland
during 2003: 16–24 year old males and females, and 25–34 year old males.18 Alcoholic liver cirrhosis
was the top cause of Scottish alcohol-attributable deaths for both men and women between 35 and
74 years of age,18 a finding that was similar in New Zealand males. New Zealand females aged 30–69
years differed slightly, with breast cancer as the top cause of alcohol-attributable deaths and alcoholic
liver cirrhosis in second or third place. Compared to New Zealand, mental and behavioural disorders
(i.e. alcohol use disorders) figured more prominently as a cause of alcohol-attributable deaths in
Scottish men and women aged 35–64 years.
PUBLIC HEALTH IMPLICATIONS
Overall, our analysis shows that alcohol consumption is a major risk factor for burden of disease and
injury. The average volume of alcohol consumption and patterns of drinking, especially heavy drinking
occasions, contribute to this disease burden. Alcohol is linked to many disease categories, but
alcohol-use disorders, cancer, cardiovascular disease, liver cirrhosis, and injury are the most
important disease categories causally affected by alcohol. This is consistent with findings from the
Global Burden of Disease study.63
In this report we have taken the approach of incorporating the putative beneficial effects of alcohol
(largely from ischaemic heart disease, diabetes, and ischaemic stroke) based on estimates from
meta-analyses of cohort studies. However, we note:
The magnitude of the relative risks is controversial. There are several identified
sources of uncontrolled error in the cohort studies and their meta-analyses that have
been previously described.66,67 Without the prospect of randomised trials to answer
the question definitively, it is likely that, (a) the benefits are exaggerated by
uncontrolled confounding, as has been seen in the analogous situation with the
effect of hormone replacement therapy on ischaemic heart disease,66,68,69 and (b) the
‘dose’ required for maximal beneficial effect is underestimated due to under-reporting
of alcohol consumption.67
The net effect of alcohol on cardiovascular disease might be beneficial in subgroups
of the population in which alcohol is regularly consumed lightly to moderately without
heavy drinking occasions, but this benefit is restricted to older people only. In other
subgroups, where this is not the case, no net protective effect on ischaemic heart
113
disease is expected, and the overall effect of alcohol on cardiovascular disease will
be detrimental because of its harmful effect on haemorrhagic stroke and
hypertensive disorders. Even in subgroups in which the net effect on cardiovascular
disease is beneficial, the overall effect of alcohol on the burden of disease is
detrimental.63
The same regular low-dose drinking pattern that has been promoted for the reduction
of ischaemic heart disease for many years is associated with a significant increase in
risk of cancer. This includes breast cancer, the commonest cause of cancer death for
New Zealand women.
Finally, there are no grounds for the promotion of alcohol as a therapeutic agent,
regardless of evidence of a beneficial effect, given its addictive, carcinogenic,
intoxicating and toxic properties. There are safe and effective agents available for the
lowering of cardiovascular risk, for which the appropriate doses can be determined
and delivered, according to evidence-based guidelines.70
The main messages from the previous report are upheld by the current analysis.
1. There are no health benefits of drinking before middle age, and benefits in later life
are uncertain.
2. The pattern of drinking is very important in determining the health effects of alcohol
consumption.
3. Injury is responsible for a large proportion of the alcohol burden: 43% of alcohol-
attributable deaths, 63% of years of life lost and 36% of DALYs lost due to alcohol.
4. There is a huge burden of disability due to alcohol use disorders that is not reflected
in mortality figures.
5. The health burden of alcohol falls inequitably on Māori.
6. The health of men as measured in this study is more affected by alcohol than the
health of women. This may not apply to health impacts that are outside the scope of
this study, such as harm from the drinking of others.
No level of alcohol consumption is without risk, although high average consumption and
frequency of heavy drinking occasions are associated with the most risk of harm to the drinker
and to others.
The effects of alcohol on public health are large enough to motivate population-wide interventions
in New Zealand and globally. We know more than ever about which strategies can effectively and
cost-effectively control alcohol-related harms.71,72 WHO’s Global strategy to reduce harmful use of
alcohol was ratified at the World Health Assembly in 2010, to coordinate an effective evidence-
based response.73
The interventions that change the drinking environment of the whole population can reduce
average consumption and alcohol-related harm, including in population subgroups at highest risk.

114
These focus on increasing the price of alcohol, decreasing availability (number of outlets as well
as hours and days of sale), and reducing alcohol promotion and marketing. Increasing the
minimum legal purchase age for alcohol has also been shown to be effective in reducing harm.
There are interventions specific to the contexts in which injuries occur that have been shown to be
effective, largely for prevention of traffic injury (e.g. lowering the legal blood alcohol concentration
limit for driving; increased random breath testing and other enforcement; alcohol treatment for
repeat offenders), but also violence associated with licensed premises (e.g. design of premises;
enforcement of licence conditions; closing hours).
Finally, increased use of screening and brief intervention, and better availability of treatment
services for identified heavy drinkers (via primary and secondary healthcare, courts, and prisons)
are individual-focused interventions for which there is research evidence of effectiveness.71,72
A detailed set of recommendations to reduce alcohol-related harm in New Zealand, based on
international research evidence and tailored to the New Zealand policy environment, was put
forward by the New Zealand Law Commission at the conclusion of an extensive review in 2010.3

115
GLOSSARY OF ACRONYMS AND TERMS
Acronym/Term Definition
AAF Alcohol-attributable fraction. The AAF is the proportion of a given
condition or injury that would have been prevented if none of the
individuals in a specified population had consumed alcohol. This is also
known as the population attributable fraction (PAF) or population
attributable risk (PAR) due to alcohol. The AAF varies for different health
conditions/injuries and population subgroups. An AAF can be negative if
alcohol reduces risk or is protective for the defined group and condition.
(Also see page 33.)
CRA Comparative risk assessment.
DALY Disability-adjusted life year. DALY = YLL + YLD.
DALYs are a summary measure of population health. One DALY for a
specific health condition can be thought of as one lost year of ‘healthy’ life
due to the specified condition, and the burden of disease in DALYs as a
measurement of the gap between the current health of the population and
an ideal situation where everyone lives to old age in full health. (Also see
page 49.)
GBD Global Burden of Disease and Injury.
GENACIS2007 2007 Gender, Alcohol and Culture: An International Survey – New
Zealand.23,24
HBS2003/04 2003/04 Health Behaviours Survey – Alcohol Use.20
HDO Heavy drinking occasion (i.e. binge drinking episode). Used to describe
and/or measure pattern of drinking. Precise definition varies depending
on source and use. For males, it is often defined as 60+ g of pure alcohol
consumed during a single occasion, while the female definition
sometimes has a lower cut off (i.e. 40+ g).
HtO2008/09 2008/09 SHORE’s Harm to Others Survey.26
ICD-10 The International Classification of Diseases, 10th revision. The
international standard diagnostic classification for epidemiology, health
management and clinical purposes.
Irregular HDOs Heavy drinking occasions that occur at least monthly, but not daily.
NZADUS2007/08 2007/08 New Zealand Alcohol and Drug Use Survey.25
NZBoA2000/02 2004 New Zealand Burden of Alcohol report.1
NZHS2006/07 2006/07 New Zealand Health Survey.22

116
Acronym/Term Definition
NZMHS2003/04 Te Rau Hinengaro: 2003/04 New Zealand Mental Health Survey.21
People with
HDOs
People with heavy drinking occasions that occur at least monthly,
including daily. Includes people with irregular HDOs and people with
regular HDOs.
Regular HDOs Heavy drinking occasions that occur daily.
RR Relative risk. The ratio of the probability of an exposed person (i.e.
drinker or ex-drinker) dying or suffering from a specified condition
compared to an unexposed person (i.e. lifetime abstainer), when all other
factors are equal). (Also see page 35.)
SHORE Centre for Social and Health Outcomes Research and Evaluation.
(Massey University, Auckland)
WHO World Health Organization.
Wpr-A One of 14 World Health Organization subregions defined based on region
and mortality level (Western Pacific Region; mortality stratum A – very low
child mortality and very low adult mortality). Wpr-A is comprised of the
WHO Member States of New Zealand, Australia, Brunei Darussalam,
Japan and Singapore.
YLD Years lost due to disability. Years of ‘healthy’ life lost due to living in a
state of poor health or disability. (Also see page 57.)
YLL Years of life lost due to premature mortality. (Also see page 48.)

117
APPENDIX A:DETAILED INFORMATION ON ICD-10 CODES
AND IMPACT OF ALCOHOL FOR ALCOHOL-RELATED
CONDITIONS LISTED IN TABLE 3.
ICD-10 codes: Differences between the Global Burden of Disease (GBD) 2005/2010 study
and the NZBoA2000/02 report.
Mouth and
oropharyngeal
cancers
GBD 2005/2010 excludes C14 (Malignant neoplasm of other and
ill-defined sites in the lip, oral cavity and pharynx). We included
C14 because knowledge of the exact location of the cancer is not
necessary for the purposes of our analyses.
Alcohol use
disorders
GBD 2005/2010 also includes X45 (accidental poisoning by and
exposure to alcohol). We categorise X45 as an unintentional injury.
Unipolar
depressive
disorders
F34 (persistent mood [affective] disorders) was not included for
unipolar depressive disorders in the NZBoA2000/02 report.
Inconsequential change since no F34 deaths were recorded in
2004 or 2007.
Hypertensive heart
disease
GBD 2005/2010 does not include I10 (primary hypertension). We
include I10 in this analysis because Rehm et al.2 included I10 in
their RR calculations due to a lack of epidemiological data for I11–
I13 only.
Stroke I68 (cerebrovascular disorders in diseases classified elsewhere)
was included in the NZBoA2000/02 report’s stroke category, but is
not included by GBD 2005/2010 or Rehm et al. 2010.
Inconsequential change since there are no I68 deaths in 2004 or
2007. GBD 2005/2010 excludes I69 except for I69.0 (sequelae of
subarachnoid haemorrhage), I69.1 (sequelae of intracerebral
haemorrhage), I69.2 (sequelae of other nontraumatic intracranial
haemorrhage) and I69.3 (sequelae of cerebral infarction). See
report text for detailed description of how mortality numbers for
different stroke subtypes were determined.
Oesophageal
varices
No GBD 2005/2010 category.
Alcoholic liver
cirrhosis
GBD 2005/2010 has a broader category (Cirrhosis of the liver: K70,
K73–K74). See report text for detailed description of how mortality
numbers were determined for our analysis.
Cholelithiasis GBD 2005/2010 has a broader category (Gall bladder and bile duct
disease: K80–K83). Not specific enough for our purposes, so we
used only K80.

118
ICD-10 codes: Differences between the Global Burden of Disease (GBD) 2005/2010 study
and the NZBoA2000/02 report.
Pancreatitis K86 (other diseases of pancreas) was not included in
NZBoA2000/02 report. We include K86 in our analysis since both
GBD 2005/2010 and Rehm et al. 2010 included this additional
code.
Low birth weight GBD 2005/2010 has a broader category (Preterm birth
complications: P05–07, P22, P25–P28, P77). Not specific enough
for our purposes, so we used P05–07.
Tuberculosis GBD 2005/2010 also includes P37.0 (congenital tuberculosis).
Inconsequential difference since there are no deaths from P37 in
our dataset.
Lower respiratory
infections:
pneumonia
GBD 2005/2010 has a broader category for lower respiratory
infections (J09–J22, J85, P23). However, Rehm et al. (2010) note:
“Influenza and pneumonia had not been included into the GBD so
far. However, the transfer to GBD is only possible for disease
categories with J10–J18 as definition, as the epidemiological
studies are usually restricted to these codes. Also, the impact of
alcohol use is restricted to community-acquired pneumonia”.
Therefore, our use of J10–J18 will avoid overestimating the impact
of alcohol on lower respiratory infections.
Diabetes mellitus GBD 2005/2010 excludes E14 (unspecified diabetes mellitus). We
include E14 because diagnostic specificity for this disease is not
critical for the purposes of our analyses.
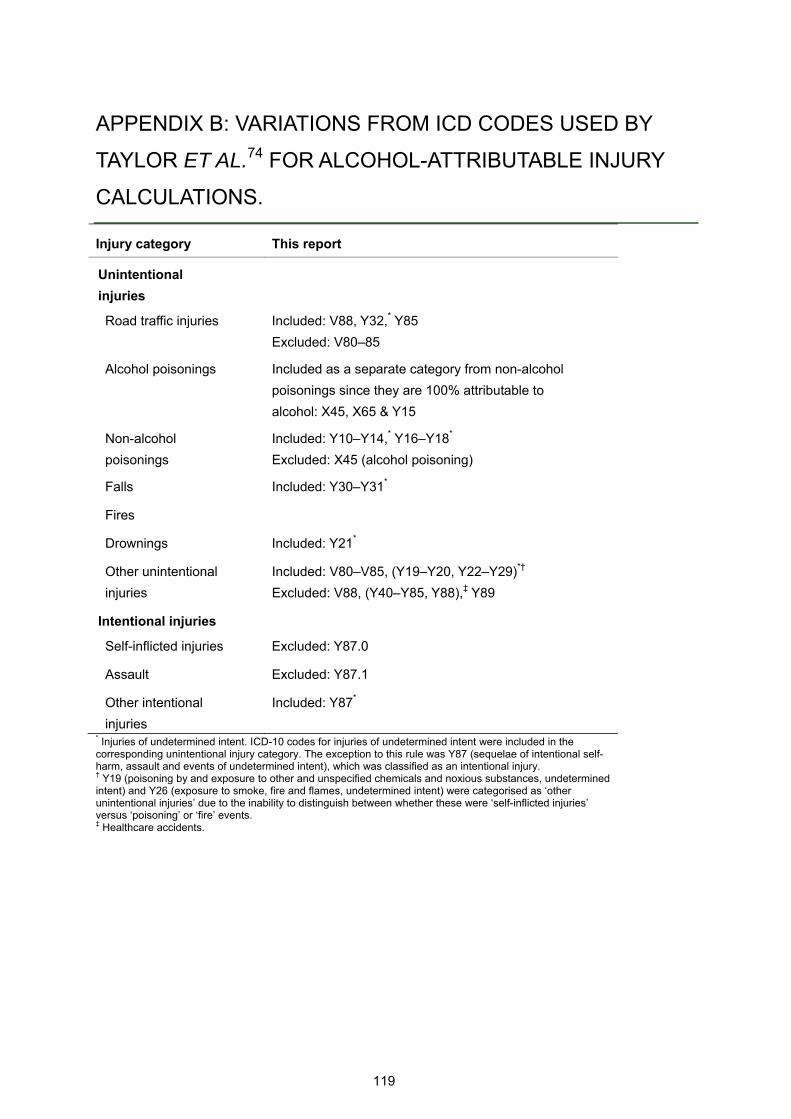
119
APPENDIX B: VARIATIONS FROM ICD CODES USED BY
TAYLOR ET AL.74 FOR ALCOHOL-ATTRIBUTABLE INJURY
CALCULATIONS.
Injury category This report
Unintentional
injuries
Road traffic injuries Included: V88, Y32,* Y85
Excluded: V80–85
Alcohol poisonings Included as a separate category from non-alcohol
poisonings since they are 100% attributable to
alcohol: X45, X65 & Y15
Non-alcohol
poisonings
Included: Y10–Y14,* Y16–Y18*
Excluded: X45 (alcohol poisoning)
Falls Included: Y30–Y31*
Fires
Drownings Included: Y21*
Other unintentional
injuries
Included: V80–V85, (Y19–Y20, Y22–Y29)*†
Excluded: V88, (Y40–Y85, Y88),‡ Y89
Intentional injuries
Self-inflicted injuries Excluded: Y87.0
Assault Excluded: Y87.1
Other intentional
injuries
Included: Y87*
* Injuries of undetermined intent. ICD-10 codes for injuries of undetermined intent were included in the corresponding unintentional injury category. The exception to this rule was Y87 (sequelae of intentional self-harm, assault and events of undetermined intent), which was classified as an intentional injury. † Y19 (poisoning by and exposure to other and unspecified chemicals and noxious substances, undetermined intent) and Y26 (exposure to smoke, fire and flames, undetermined intent) were categorised as ‘other unintentional injuries’ due to the inability to distinguish between whether these were ‘self-inflicted injuries’ versus ‘poisoning’ or ‘fire’ events. ‡ Healthcare accidents.
120
APPENDIX C: THE EFFECT OF USING ALTERNATIVE
INJURY AAFS CALCULATED BY THE GLOBAL BURDEN OF
DISEASE 2010 RISK FACTORS COLLABORATING GROUP:
A SENSITIVITY ANALYSIS.
The Global Burden of Disease (GBD) 2010 Risk Factors Collaborating Group used New Zealand
average alcohol consumption data and drinking pattern estimates to calculate injury AAFs by
age/sex/ethnicity subgroup. Since the GBD modelling methods did not appear robust to the
extreme drinking patterns in the younger New Zealand age categories, the GBD injury AAFs were
not used in our main analysis (please see ‘AAFs for partially alcohol-attributable injuries’ on page
39 for the detailed rationale behind this decision).
This appendix outlines the methods and data used to calculate the GBD injury AAFs and
demonstrates the effect of using these GBD injury AAFs to recalculate the 2004 alcohol-
attributable mortality and DALY results.
INJURY SENSITIVITY ANALYSIS METHODS: ALCOHOL CONSUMPTION DATA
The GBD injury AAF calculations incorporated several pieces of information about both average
alcohol consumption and drinking patterns in New Zealanders, with the same definitions used for
both women and men. The data used to calculate the GBD injury AAFs included: Current drinkers (i.e. people who had consumed alcohol during the previous year).
1. Prevalence (denominator = drinkers & non-drinkers).
2. Average alcohol consumption (grams of pure alcohol per day; denominator = current drinkers).
People with heavy drinking occasions (HDOs) (i.e. people who consumed 60+ grams of alcohol on one occasion at least monthly; includes people with irregular and regular HDOs).
1. Prevalence (denominator = drinkers & non-drinkers).
2. Average number of HDOs per week (denominator = people with HDOs).
3. Average number of drinks per HDO (denominator = people with HDOs).
Please see Table C-1 and Table C-2 for these 2004 average alcohol consumption and drinking
pattern estimates by age/sex/ethnicity subgroup (used to calculate AAFs for estimating alcohol-
attributable mortality). Table C-3 presents the estimates by age/sex subgroup (used to calculate
AAFs for estimating alcohol-attributable DALYs).
PREVALENCE OF PEOPLE WITH HEAVY DRINKING OCCASIONS
People with heavy drinking occasions (HDOs) were defined as people who consumed 60+ grams
of alcohol on one occasion at least monthly, therefore including both people with irregular and

121
regular HDOs. We used the same data sources and older age extrapolation methods as
described in the ‘Prevalence of people with irregular heavy drinking occasions’ section (see page
30). To calculate the prevalence of people with HDOs for each age/sex/ethnicity subgroup, we
summed the prevalence of people with irregular HDOs (categories Ib, IIb and IIIb in Table 12) with
the prevalence of people with regular HDOs (category IV in Table 12). This resulted in prevalence
estimates with denominators that included both drinkers and non-drinkers.
AVERAGE NUMBER OF HEAVY DRINKING OCCASIONS PER WEEK
The average number of heavy (60+ g) drinking occasions per week were calculated by
age/sex/ethnicity subgroups using data from all people with heavy drinking occasions (i.e. people who
consumed 60+ grams of alcohol on one occasion at least monthly).
We planned to use the same data sources for calculating these drinking pattern estimates as we did
for the average daily alcohol consumption estimates. The drinking pattern data were available from
the 2003/04 Health Behaviours Survey – Alcohol Use (HBS2003/04), so the 2004 drinking pattern
estimates for the 15–59 year age categories were calculated from this source. However, the Ministry
of Health could not provide these data from the 2007/08 New Zealand Alcohol and Drug Use Survey
(NZADUS2007/08), so we used SHORE’s Harm to Others Survey (HtO2008/09) for 2007 drinking
pattern estimates for the 15–59 year age categories as it was the best available alternative.
Drinking pattern estimates for both older age categories (i.e. 60–69 and 70–79 years) were calculated
using the same extrapolation methods as previously described for average daily alcohol consumption
estimates (see page 26), with two exceptions: (1) weighted estimates from HBS2003/04 and
HtO2008/09 were included in the calculations since we were unable to obtain the required data from
NZADUS2007/08; and (2) 70–79 year old HtO2008/09 estimates were not used in the calculations,
due to the prohibitively small sample sizes of people with heavy drinking occasions in this age group.
As previously mentioned in the ‘Alcohol consumption estimates for older age categories’ section (see
page 26), there is a large degree of uncertainty in the estimates for older age categories, and this is
even more so for the drinking pattern estimates where only people with heavy drinking occasions
were included.
AVERAGE NUMBER OF DRINKS PER HEAVY DRINKING OCCASION
NZADUS2007/08 did not have data available regarding the quantity of drinks per heavy drinking
occasion, so these drinking pattern estimates were calculated for each age/sex/ethnicity subgroup
using identical data sources and methods as described above for the ‘average number of heavy
drinking occasions per week’ estimates. As a result, the extrapolated older age estimates for
‘average number of drinks per heavy drinking occasion’ also share the limitations discussed in the
previous section (i.e. high levels of uncertainty).

122
Table C-1: New Zealand alcohol consumption estimates used for the calculation of GBD injury AAFs, by age and ethnicity (2004 males).
Age group (years)
Alcohol consumption estimates* 15–29 30–44 45–59 60–69† 70–79†
Māori
males
Average consumption
Prevalence of current drinkers 85.6% 83.2% 75.7% 76.8% 77.2%
Average daily alcohol consumption ‡
63.0 28.0 21.0 15.5 9.7
Pattern of drinking
Prevalence of people with HDOs§ 57.4% 36.2% 22.3% 15.8% 10.4%
Average number of HDOs per
week** 2.6 1.8 1.7 2.1 2.8
Average number of drinks per
HDO** 14.4 11.6 10.6 10.2 9.7
Non-
Māori
males
Average consumption
Prevalence of current drinkers 87.0% 90.1% 87.0% 85.8% 83.0%
Average daily alcohol consumption 48.0 24.0 22.0 21.0 18.5
Pattern of drinking
Prevalence of people with HDOs§ 41.8% 18.8% 12.5% 10.3% 6.8%
Average number of HDOs per
week** 2.7 1.8 2.1 2.5 3.1
Average number of drinks per
HDO** 12.5 9.9 9.0 8.9 8.4
* HDO = heavy drinking occasion (60+ grams in one occasion). Prevalence calculations included drinkers and non-drinkers in the denominator. † Extrapolated estimates for older age categories have a high degree of uncertainty, particularly for the average ‘pattern of drinking’ estimates. ‡ For all current drinkers. § People with HDOs = people who have heavy drinking occasions at least monthly (including daily). **Calculations of averages only included people with heavy drinking patterns.

123
Table C-2: New Zealand alcohol consumption estimates used for the calculation of GBD injury AAFs, by age and ethnicity (2004 females).
Age group (years)
Alcohol consumption estimates* 15–29 30–44 45–59 60–69† 70–79†
Māori
females
Average consumption
Prevalence of current drinkers 84.2% 73.5% 67.3% 57.7% 44.3%
Average daily alcohol 34.0 16.0 13.0 6.2 2.7
Pattern of drinking
Prevalence of people with
HDOs§ 41.7% 20.7% 10.2% 3.2% 0.2%
Average number of HDOs per
week** 1.6 1.0 1.1 0.6 0.0
Average number of drinks per
HDO** 12.7 10.8 10.8 9.1 8.3
Non-
Māori
females
Average consumption
Prevalence of current drinkers 83.3% 86.0% 84.0% 75.8% 68.2%
Average daily alcohol 18.0 12.0 12.0 8.9 7.8
Pattern of drinking
Prevalence of people with
HDOs§ 18.2% 7.0% 2.5% 2.0% 0.6%
Average number of HDOs per
week** 1.5 1.3 1.3 1.2 0.4
Average number of drinks per
HDO** 9.1 8.4 10.1 7.6 7.1
* HDO = heavy drinking occasion (60+ grams in one occasion). Prevalence calculations included drinkers and non-drinkers in the denominator. † Extrapolated estimates for older age categories have a high degree of uncertainty, particularly for the average ‘pattern of drinking’ estimates. ‡ For all current drinkers. § People with HDOs = people who have heavy drinking occasions at least monthly (including daily). **Calculations of averages only included people with heavy drinking patterns.

124
Table C-3: New Zealand alcohol consumption estimates used for calculation of GBD injury AAFs, by age (2004 males and females).
Age group (years)
Alcohol consumption estimates* 15–29 30–44 45–59 60–69† 70–79†
Males
Average consumption
Prevalence of current drinkers 86.8% 89.2% 85.9% 85.2% 82.8%
Average daily alcohol 50.7 24.5 21.9 20.6 18.1
Pattern of drinking
Prevalence of people with
HDOs§ 44.6% 21.2% 13.4% 10.7% 6.9%
Average number of HDOs per
week** 2.7 1.8 2.1 2.4 3.1
Average number of drinks per
HDO** 12.8 10.1 9.2 9.0 8.5
Females
Average consumption
Prevalence of current drinkers 83.5% 84.2% 82.3% 74.4% 67.1%
Average daily alcohol 21.0 12.6 12.1 8.7 7.5
Pattern of drinking
Prevalence of people with
HDOs§ 22.6% 8.9% 3.2% 2.1% 0.5%
Average number of HDOs per
week** 1.5 1.3 1.3 1.2 0.4
Average number of drinks per
HDO** 9.8 8.7 10.2 7.8 7.2
* HDO = heavy drinking occasion (60+ grams in one occasion). Prevalence calculations included drinkers and non-drinkers in the denominator. † Extrapolated estimates for older age categories have a high degree of uncertainty, particularly for the average ‘pattern of drinking’ estimates. ‡ For all current drinkers. § People with HDOs = people who have heavy drinking occasions at least monthly (including daily). **Calculations of averages only included people with heavy drinking patterns.

125
Injury sensitivity analysis methods: Alcohol-attributable fraction
(AAF) calculations
The injury AAFs used in this sensitivity analysis were calculated by members of the Global Burden of
Disease (GBD) 2010 Risk Factors Collaborating Group,a who have recently developed new methods
for modelling injury AAFs from average alcohol consumption and drinking pattern characteristics for a
given population.60 New Zealand AAFs were calculated by age/sex/ethnicity subgroup for three types
of injury:
1. Road traffic injuries (RTIs).
2. Non-road traffic injuries (non-RTIs), a broad injury group that includes:
a. unintentional injuries (i.e. non-alcohol poisonings, falls, fires, drownings, and other unintentional injuries)
b. intentional injuries (i.e. self-inflicted injuries and other intentional injuries).
3. Assault.
Since the GBD 2010 Risk Factors Assessment for alcohol did not calculate AAFs for children (0–14
years old) for road traffic injuries, fire injuries or other unintentional injuries, for these injury categories
we used the same child AAFs as in our main analysis (for more information please see the ‘Injury
AAFs for children on page 40).
Estimating AAFs for road traffic injuries and non-road traffic injuries
The AAFs for RTIs and non-RTIs were modelled according to methodology which takes into account
two dimensions of alcohol consumption:
1. Heavy drinking patterns (both the number of heavy drinking occasions and the
amount consumed per heavy drinking occasion).
2. Average daily alcohol consumption (on days without heavy drinking occasions).
When calculating the AAFs, alcohol metabolism rates for men and women were also included to
calculate a person’s time at risk of an injury outcome, according to methods outlined by Taylor and
colleagues.9 The AAFs for injuries attributable to alcohol consumption were calculated as follows:
where,
Pabs = prevalence of current abstainers
Pdrinkers(without HDOs) = prevalence of current drinkers without heavy drinking occasions
Pdrinkers(with HDOs) = prevalence of current drinkers with heavy drinking occasions
People with heavy drinking occasions (HDOs) were defined as people who consumed 60+ grams of
alcohol on one occasion at least monthly.
a Jürgen Rehm, Kevin Shield and Benjamin Taylor.

126
The injury relative risks (RRs) were calculated separately for:
1. Current drinkers without heavy drinking occasions (RRdrinkers(without HDOs)).
2. Current drinkers with heavy drinking occasions (RRdrinkers(with HDOs)).
RRdrinkers(without HDOs) was calculated as follows:
and RRdrinkers(with HDOs) was calculated as follows:
where injury risk on average drinking days (RRnonHDOdays) was calculated as follows:
and where injury risk on days with heavy drinking occasions (RRHDOdays) was calculated as
follows:
where,
PnonHDOdays = proportion of drinking days without a heavy drinking occasion
PHDOdays = proportion of drinking days with a heavy drinking occasion
xnonHDOdays = average daily alcohol consumption on days without a heavy drinking occasion
xHDOdays = average daily alcohol consumption on days with a heavy drinking occasion
Pdayatrisk = proportion of a day at risk
- calculated based on the average rate at which alcohol is metabolised, given the average daily alcohol consumption (x) on days with or without heavy drinking occasions
- corresponds to the time during which the blood alcohol level is sufficiently elevated to increase the risk of injury
RRinjury = RR function for injuries
- used to calculate the RR for both days with and without heavy drinking occasions, given the average daily alcohol consumption (x) on days with or without heavy drinking occasions
- different RR functions were used for RTIs and non-RTIs (60)
Since these AAFs were calculated based on samples of emergency room patients, we estimated
the AAF for mortality from non-road traffic injuries by multiplying the AAF for morbidity from non-
road traffic injuries by 9/4.17 These methods were based on two studies that compared blood
alcohol levels of emergency room patients with blood alcohol levels obtained from coroners’
reports of patients who died from an injury.75,76
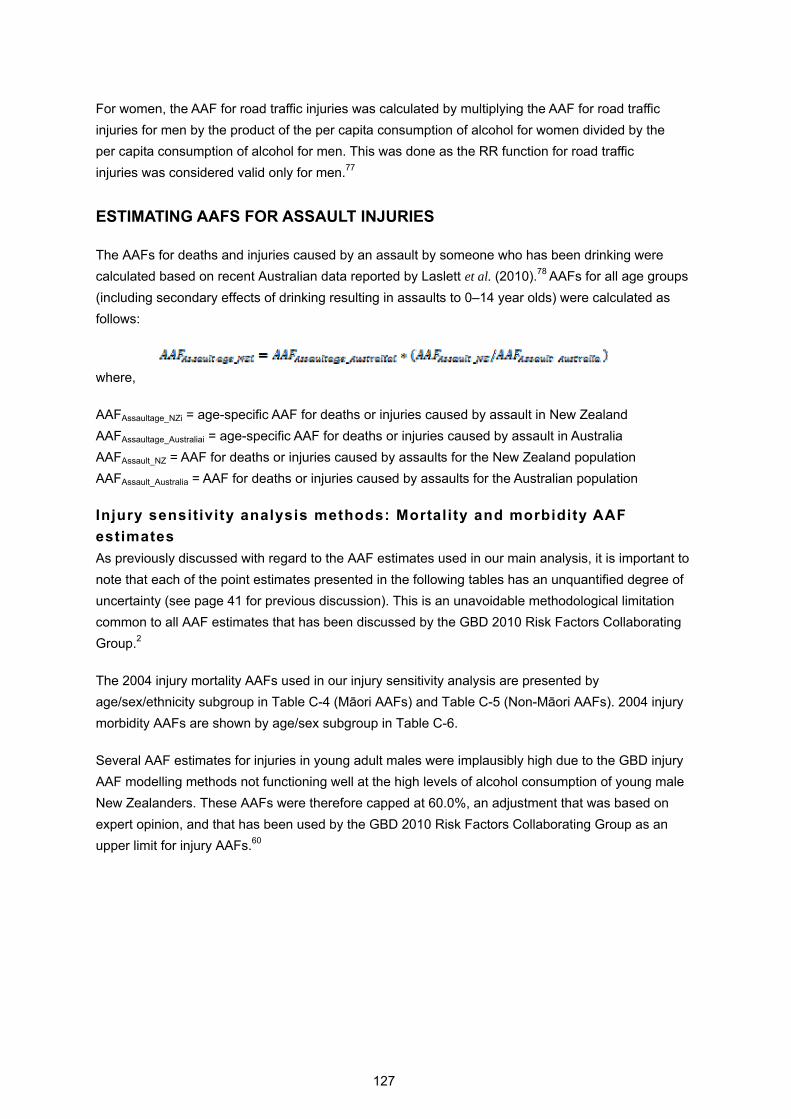
127
For women, the AAF for road traffic injuries was calculated by multiplying the AAF for road traffic
injuries for men by the product of the per capita consumption of alcohol for women divided by the
per capita consumption of alcohol for men. This was done as the RR function for road traffic
injuries was considered valid only for men.77
ESTIMATING AAFS FOR ASSAULT INJURIES
The AAFs for deaths and injuries caused by an assault by someone who has been drinking were
calculated based on recent Australian data reported by Laslett et al. (2010).78 AAFs for all age groups
(including secondary effects of drinking resulting in assaults to 0–14 year olds) were calculated as
follows:
where,
AAFAssaultage_NZi = age-specific AAF for deaths or injuries caused by assault in New Zealand
AAFAssaultage_Australiai = age-specific AAF for deaths or injuries caused by assault in Australia
AAFAssault_NZ = AAF for deaths or injuries caused by assaults for the New Zealand population
AAFAssault_Australia = AAF for deaths or injuries caused by assaults for the Australian population
Injury sensitivity analysis methods: Mortality and morbidity AAF
estimates
As previously discussed with regard to the AAF estimates used in our main analysis, it is important to
note that each of the point estimates presented in the following tables has an unquantified degree of
uncertainty (see page 41 for previous discussion). This is an unavoidable methodological limitation
common to all AAF estimates that has been discussed by the GBD 2010 Risk Factors Collaborating
Group.2
The 2004 injury mortality AAFs used in our injury sensitivity analysis are presented by
age/sex/ethnicity subgroup in Table C-4 (Māori AAFs) and Table C-5 (Non-Māori AAFs). 2004 injury
morbidity AAFs are shown by age/sex subgroup in Table C-6.
Several AAF estimates for injuries in young adult males were implausibly high due to the GBD injury
AAF modelling methods not functioning well at the high levels of alcohol consumption of young male
New Zealanders. These AAFs were therefore capped at 60.0%, an adjustment that was based on
expert opinion, and that has been used by the GBD 2010 Risk Factors Collaborating Group as an
upper limit for injury AAFs.60

128
Table C-4: Injury sensitivity analysis: Māori mortality AAFs for injuries (2004).*
Māori males Māori females
0–4 5–14 15–29 30–44 45–59 60–69 70–79 0–4 5–14 15–29 30–44 45–59 60–69 70–79
Road traffic injuries 20.0% 20.0% 60.0% 60.0% 48.7% 38.0% 23.7% 20.0% 20.0% 45.6% 33.6% 24.9% 19.4% 12.1%
Alcohol poisonings 100% 100% 100% 100% 100% 100% 100% 100% 100% 100% 100% 100% 100% 100%
Non-alcohol poisonings 60.0% 30.5% 13.9% 10.3% 9.0% 37.3% 12.8% 9.8% 1.6% 1.0%
Falls 60.0% 30.5% 13.9% 10.3% 9.0% 37.3% 12.8% 9.8% 1.6% 1.0%
Fires 24.0% 24.0% 60.0% 30.5% 13.9% 10.3% 9.0% 24.0% 24.0% 37.3% 12.8% 9.8% 1.6% 1.0%
Drownings 60.0% 30.5% 13.9% 10.3% 9.0% 37.3% 12.8% 9.8% 1.6% 1.0%
Other unintentional injuries 28.6% 28.6% 60.0% 30.5% 13.9% 10.3% 9.0% 8.7% 8.7% 37.3% 12.8% 9.8% 1.6% 1.0%
Self-inflicted injuries 60.0% 30.5% 13.9% 10.3% 9.0% 37.3% 12.8% 9.8% 1.6% 1.0%
Assault 14.0% 14.0% 22.9% 24.8% 20.1% 13.0% 11.3% 14.0% 14.0% 22.9% 24.8% 20.1% 13.0% 11.3%
Other intentional injuries 60.0% 30.5% 13.9% 10.3% 9.0% 37.3% 12.8% 9.8% 1.6% 1.0%
* These AAFs were used for calculating 2004 alcohol-attributable deaths and YLLs. AAF estimates for 60+ years have more uncertainty due to smaller sample sizes and the use of extrapolated alcohol consumption estimates.

129
Table C-5: Injury sensitivity analysis: Non-Māori mortality AAFs for injuries (2004).*
Non-Māori males Non-Māori females
0–4 5–14 15–29 30–44 45–59 60–69 70–79 0–4 5–14 15–29 30–44 45–59 60–69 70–79
Road traffic injuries 20.0% 20.0% 60.0% 42.1% 25.6% 25.2% 20.2% 20.0% 20.0% 34.8% 17.3% 10.5% 10.3% 8.3%
Alcohol poisonings 100% 100% 100% 100% 100% 100% 100%
100% 100% 100% 100% 100% 100% 100%
Non-alcohol poisonings 60.0% 18.2% 15.0% 14.4% 13.6%
10.6% 6.0% 6.9% 3.4% 2.6%
Falls 60.0% 18.2% 15.0% 14.4% 13.6%
10.6% 6.0% 6.9% 3.4% 2.6%
Fires 24.0% 24.0% 60.0% 18.2% 15.0% 14.4% 13.6%
24.0% 24.0% 10.6% 6.0% 6.9% 3.4% 2.6%
Drownings 60.0% 18.2% 15.0% 14.4% 13.6%
10.6% 6.0% 6.9% 3.4% 2.6%
Other unintentional injuries 19.1% 19.1% 60.0% 18.2% 15.0% 14.4% 13.6%
5.8% 5.8% 10.6% 6.0% 6.9% 3.4% 2.6%
Self-inflicted injuries 60.0% 18.2% 15.0% 14.4% 13.6%
10.6% 6.0% 6.9% 3.4% 2.6%
Assault 14.0% 14.0% 22.9% 24.8% 20.1% 13.0% 11.3%
14.0% 14.0% 22.9% 24.8% 20.1% 13.0% 11.3%
Other intentional injuries 60.0% 18.2% 15.0% 14.4% 13.6% 10.6% 6.0% 6.9% 3.4% 2.6%
* These AAFs were used for calculating 2004 alcohol-attributable deaths and YLLs. AAF estimates for 60+ years have more uncertainty due to smaller sample sizes and the use of extrapolated alcohol consumption estimates.

130
Table C-6: Injury sensitivity analysis: Total New Zealand morbidity AAFs for injuries (2004).*
Males Females
0–4 5–14 15–29 30–44 45–59 60–69 70–79 0–4 5–14 15–29 30–44 45–59 60–69 70–79
Road traffic injuries 20.0% 20.0% 60.0% 47.5% 27.5% 26.0% 20.4% 20.0% 20.0% 36.6% 20.2% 11.7% 11.1% 8.7%
Non-alcohol poisonings† 26.7% 8.4% 6.6% 6.3% 5.9% 6.1% 2.8% 3.0% 1.4% 1.1%
Falls 26.7% 8.4% 6.6% 6.3% 5.9% 6.1% 2.8% 3.0% 1.4% 1.1%
Fires 10.7% 10.7% 26.7% 8.4% 6.6% 6.3% 5.9% 10.7% 10.7% 6.1% 2.8% 3.0% 1.4% 1.1%
Drownings 26.7% 8.4% 6.6% 6.3% 5.9% 6.1% 2.8% 3.0% 1.4% 1.1%
Other unintentional injuries 11.5% 10.1% 26.7% 8.4% 6.6% 6.3% 5.9% 2.9% 2.9% 6.1% 2.8% 3.0% 1.4% 1.1%
Self-inflicted injuries 26.7% 8.4% 6.6% 6.3% 5.9% 6.1% 2.8% 3.0% 1.4% 1.1%
Assault 6.2% 6.2% 10.2% 11.0% 8.9% 5.8% 5.0% 6.2% 6.2% 10.2% 11.0% 8.9% 5.8% 5.0%
Other intentional injuries 26.7% 8.4% 6.6% 6.3% 5.9% 6.1% 2.8% 3.0% 1.4% 1.1%
* These AAFs were used for calculating 2004 alcohol-attributable YLDs. AAF estimates for 60+ years have more uncertainty due to smaller sample sizes and the use of extrapolated alcohol consumption estimates. † See ‘Poisonings’ section starting on page 63 for a detailed explanation of why we were unable to use ‘alcohol poisonings’ 100% AAFs for YLD calculations.

131
Injury sensitivity analysis methods: Alcohol-attributable mortality and
DALY calculations
Except for substituting the GBD injury AAFs, we conducted this analysis exactly as for the main
analysis. Please see the following main report sections for calculation details: ‘Calculating alcohol-
attributable deaths and years of life lost (YLLs)’ starting on page 48; and ‘Calculating alcohol-
attributable disability-adjusted life years (DALYs)’ starting on page 61).
Injury sensitivity analysis results: Alcohol-attributable mortality
When the GBD injury mortality AAFs in Tables C-4 and C-5 are used to calculate alcohol-attributable
mortality in New Zealand, the proportion of all New Zealand deaths that were attributable to alcohol in
2004 increases to 5.6% (compared to 5.1% in the main analysis) and alcohol-attributable YLLs are
responsible for 9.6% of all New Zealand YLLs (compared to 8.0% in the main analysis). Alcohol-
attributable deaths due to injury (i.e. compared to cancers and other non-injury conditions) rise from
42.8% to 47.4% of all alcohol-attributable deaths (from 337 to 406 injury deaths), with a
corresponding increase in the proportion of alcohol-attributable YLLs due to injury from 63.3% to
69.3% (from 8,610 to 11,267 injury YLLs). As a result of the high GBD AAF estimates for injuries in
young male New Zealanders, most of the increase in alcohol-attributable injury mortality occurs in
young adult males due to alcohol-attributable deaths from road traffic injuries and self-inflicted
injuries.
Compared to the main analysis, the injury sensitivity analysis shows a marked increase in male
alcohol-attributable deaths and a slight decrease in female alcohol-attributable deaths: total alcohol-
attributable injury deaths in men increase by 28% (from 270 to 345 injury deaths) and decrease by
9% in women (from 67 to 61 injury deaths). In terms of the proportion of all 2004 New Zealand deaths
that were attributable to alcohol, this translates into an increase from 5.8% to 6.7% for men and very
little change for women (from 4.2% to 4.1%).
When the ages at death are taken into account by calculating years of life lost (YLLs) due to injuries,
men lose an additional 2,637 years of life compared to the main analysis (from 6,912 to 9,549 injury
YLLs), while female YLLs are very similar for the sensitivity and main analyses (1,719 and 1,699
injury YLLs, respectively). When the GBD injury AAFs are used, the proportion of all 2004 YLLs due
to alcohol increases from 9.6% to 12.3% in men, while the proportion remains the same in women
(5.8%).
Using the GBD injury AAFs did not have a large effect on the rankings of specific causes of alcohol-
attributable deaths and YLLs for males or females (see Tables C-7 and Error! Reference source not
found.). However, the proportions in these tables demonstrate how the use of GBD injury AAFs
resulted in a much larger contribution of self-inflicted injuries to the alcohol-attributable mortality
burden in New Zealand males, with self-inflicted injuries now accounting for 19.8% of alcohol-
attributable male deaths (compared to 11.0% in main analysis) and 27.8% of alcohol-attributable male
YLLs (15.3% in main analysis).

132
Table C-7: Injury sensitivity analysis: Top five causes of alcohol-attributable (AA) deaths,
by sex (0–79 years; 2004).
Males% of AA deaths
(N = 596) Females% of AA deaths
(N = 259)
Road traffic injuries 23.2% Female breast cancer 25.7%
Self-inflicted injuries 19.8% Road traffic injuries 13.4%
Alcoholic liver cirrhosis 9.4% Haemorrhagic stroke 12.3%
Haemorrhagic stroke 5.2% Alcoholic liver cirrhosis 9.3%
Oesophagus cancer 4.8% Colon cancer 6.7%
Table C-8: Injury sensitivity analysis: Top five causes of alcohol-attributable years of life lost
(AA YLLs), by sex (0–79 years;2004).
Males% of AA YLLs
(N = 12172) Females% of AA YLLs
(N = 4090)
Road traffic injuries 32.0% Road traffic injuries 24.9%
Self-inflicted injuries 27.8% Female breast cancer 21.8%
Other unintentional injuries 6.0% Self-inflicted injuries 8.9%
Alcoholic liver cirrhosis 5.2% Alcoholic liver cirrhosis 8.5%
Falls 3.6% Haemorrhagic stroke 6.7%
Table shows the changes in death results by sex/ethnicity subgroups when the GBD injury AAFs
were used in the sensitivity analysis, with notable increases in alcohol-attributable deaths
occurring in both Māori and non-Māori males.
Table C-9: Comparison of injury sensitivity analysis and main analysis: Total alcohol-attributable deaths, by sex and ethnicity (0–79 years; 2004).
Ethnicity
Deaths caused (count)
(results from main
analysis)% of all deaths
(results from main
analysis)
Deaths caused (rate*)
(results from main
analysis)
Males Māori 138 (125) 10.1% (9.1%) 55.0 (50.7)
Non-Māori 458 (396) 6.1% (5.2%) 23.6 (19.0)
Total 596 (521) 6.7% (5.8%) 27.6 (23.0)
Females Māori 64 (61) 6.1% (5.8%) 24.7 (23.9)
Non-Māori 195 (204) 3.7% (3.8%) 8.2 (8.6)
Total 259 (265) 4.1% (4.2%) 10.1 (10.2)
Total Māori 203 (186) 8.4% (7.7%) 39.3 (36.8)
Non-Māori 653 (601) 5.1% (4.7%) 15.8 (13.7)
Total 856 (787) 5.6% (5.1%) 18.7 (16.5)
* Rate per 100,000 age-standardised to WHO world population

133
Table provides details about the alcohol-attributable deaths for each sex/ethnicity subgroup by
specific injury categories. Comparing these numbers to the equivalent numbers in the main
analysis (Table I-7 on page 156) shows how the use of GBD injury AAFs changes the numbers of
alcohol-attributable deaths in several injury categories. In particular, there are more alcohol-
attributable deaths due to self-inflicted injuries in males (34 Māori and 84 non-Māori male deaths
compared to 14 and 43 deaths in the main analysis, respectively), and road traffic injuries in non-
Māori males (94 deaths compared to 64 in the main analysis).
Table C-10: Injury sensitivity analysis: Number of alcohol-attributable deaths for each injury category (0–79 years; 2004).
Males Females All Males Females All Males Females All
Unintentional injuries
Road traffic injuries 45 13 58 94 22 115 139 35 173
Alcohol poisonings 1 1 2 4 3 7 5 4 9
Non-alcohol poisonings 4 1 5 7 1 8 11 2 13
Falls 3 0 3 17 1 18 20 1 21
Fires 1 0 2 1 0 2 3 1 3
Drownings 3 0 3 10 0 10 13 0 14
Other unintentional injuries 9 1 10 20 2 21 28 3 31
Intentional injuries
Self-inflicted injuries 34 7 41 84 6 89 118 12 130
Assault 3 1 4 4 2 6 7 3 10
Other intentional injuries 1 0 1 1 0 1 1 0 1
Māori Non-Māori Total
Figure C- shows how most of the increased injury mortality seen in this sensitivity analysis occurs
in 15–29 year old New Zealand males, with a total of 199 alcohol-attributable deaths (193 due to
injuries) in 15–29 year old males when using the GBD injury AAFs compared to a total of 115
alcohol-attributable deaths (109 due to injuries) using the AAFs from our main analysis.
The age-specific rankings shown in Table C-11 further illustrate how the use of GBD injury AAFs
impacted the relative contributions of specific condition and injury categories to the overall
numbers of alcohol-attributable deaths in each age/sex subgroup. The proportion of self-inflicted
injuries increased for most age/sex subgroups, with 15–29 year old males showing the most
marked increases, climbing from 19.8% of all alcohol-attributable deaths in the main analysis to
38.3% in the sensitivity analysis (see Table 50 on page 87 for the main analysis ranking results by
age/sex subgroup).

134
Figure C-1: Comparison of injury sensitivity analysis and main analysis. Number of deaths attributable to alcohol consumption, by age and sex (2004).
0
50
100
150
200
0‐4 5‐14 15‐29 30‐44 45‐59 60‐69 70‐79 0‐4 5‐14 15‐29 30‐44 45‐59 60‐69 70‐79
Males Females
Main analysis
Injury sensitivity analysis
TableC-11: Injury sensitivity analysis: Top five causes of alcohol-attributable (AA) deaths in 15–59 year olds, by sex (2004).
Males% of
AA deaths Females% of
AA deaths
15-29 years (N = 199) 15-29 years (N = 32)
Road traffic injuries 39.2% Road traffic injuries 60.1%
Self-inflicted injuries 38.3% Self-inflicted injuries 23.8%
Other unintentional injuries 5.1% Non-alcohol poisonings 3.4%
Falls 4.2% Alcohol poisonings 3.2%
Drownings 4.2% Epilepsy 2.5%
30-44 years (N = 94) 30-44 years (N = 34)
Road traffic injuries 35.1% Female breast cancer 30.1%
Self-inflicted injuries 26.5% Road traffic injuries 24.0%
Other unintentional injuries 7.5% Alcoholic liver cirrhosis 11.8%
Alcoholic liver cirrhosis 4.3% Self-inflicted injuries 7.8%
Falls 3.5% Alcohol use disorders 5.9%
45-59 years (N = 100) 45-59 years (N = 67)
Alcoholic liver cirrhosis 16.9% Female breast cancer 34.1%
Road traffic injuries 16.6% Alcoholic liver cirrhosis 16.5%
Self-inflicted injuries 10.6% Alcohol use disorders 9.0%
Mouth and oropharyngeal cancers 9.8% Haemorrhagic stroke 7.7%
Oesophagus cancer 7.3% Colon cancer 4.9%

135
Injury sensitivity analysis results: Alcohol-attributable DALYs
When the GBD injury mortality and morbidity AAFs (Tables C-4 – C-6) are used to calculate alcohol-
attributable DALYs lost in New Zealand during 2004, the proportion of all New Zealand DALYs that
are attributable to alcohol in 2004 increases to 7.1% (compared to 6.5% in the main analysis).
Alcohol-attributable DALYs lost due to injury (i.e. compared to cancers and other non-injury
conditions) rise from 35.5% to 41.2% of all alcohol-attributable DALYs lost.
Compared to the main analysis, the injury sensitivity analysis shows a 15% increase in total male
alcohol-attributable DALYs lost, while total female DALYs decrease by less than 1% (see Table).
Table C-12: Comparison of injury sensitivity analysis and main analysis. Alcohol-attributable (AA) DALYs lost, by sex (0–79 years; 2004).
AA DALYs lost (count)
(results from main
analysis)% of all
DALYs lost
(results from main
analysis)AA DALYs lost (rate*)
(results from main
analysis)
Males 21,636 (18,803) 10.2% (8.8%) 1108 (933)
Females 9,515 (9,601) 4.2% (4.3%) 435 (435)
Total 31,151 (28,403) 7.1% (6.5%) 767 (680)
* Rate per 100,000 age-standardised to WHO world population
Table C-13 shows how the alcohol-attributable DALYs are distributed in the unintentional and
intentional injury categories for the sensitivity and main analyses. Table C-13 also demonstrates how
the use of GBD injury AAFs impacts the relative contributions of condition and injury categories to the
overall male and female DALY burdens. Similar to the mortality analysis, the major differences occur
in males. The GBD injury AAFs double the number of male DALYs due to intentional injuries, resulting
in an increased proportion of all alcohol-attributable male DALYs due to intentional injuries from 9.7%
to 16.8%.
Table C-13: Comparison of injury sensitivity analysis and main analysis. Alcohol-attributable DALYs lost, by cause categories (0–79 years; 2004).
DALYs lost
(results from main analysis)
% of AA DALYs
(results from main analysis) DALYs lost
(results from main analysis)
% of AA DALYs
(results from main analysis)
Cancers 1114 (1114) 5.1% (5.9%) 1680 (1680) 17.7% (17.5%)
Neuro-psychiatric disorders 8392 (8392) 38.8% (44.6%) 4933 (4933) 51.8% (51.4%)
Cardiovascular disorders 435 (435) 2.0% (2.3%) 358 (358) 3.8% (3.7%)
Digestive disorders 713 (713) 3.3% (3.8%) 412 (412) 4.3% (4.3%)
Other conditions 177 (177) 0.8% (0.9%) 109 (109) 1.1% (1.1%)
Unintentional injuries 7168 (6157) 33.1% (32.7%) 1577 (1700) 16.6% (17.7%)
Intentional injuries 3637 (1815) 16.8% (9.7%) 447 (409) 4.7% (4.3%)
Totals 21636 (18803) 100.0% (100.0%) 9515 (9601) 100.0% (100.0%)
Males Females
Table C-14 demonstrates how the use of GBD injury AAFs changes the numbers of alcohol-
attributable DALYs by specific injury category.

136
Table C-14: Comparison of injury sensitivity analysis and main analysis. Alcohol-attributable DALYs lost, by specific injury categories (0–79 years; 2004).
DALYs lost (count)
(results from main analysis)
DALYs lost (count)
(results from main analysis)
DALYs lost (count)
(results from main analysis)
Unintentional injuries
Road traffic injuries 4478 (3526) 1201 (989) 5679 (4515)
Poisonings 436 (367) 149 (204) 585 (572)
Falls 708 (559) 45 (85) 754 (644)
Fires 95 (117) 23 (34) 118 (152)
Drownings 377 (364) 12 (48) 389 (412)
Other unintentional injuries 1074 (1223) 147 (340) 1221 (1563)
Intentional injuries
Self-inflicted injuries 3408 (1473) 371 (297) 3780 (1770)
Assault 187 (322) 75 (108) 261 (430)
Other intentional injuries 42 (21) 1 (4) 43 (25)
Females TotalMales
In men, using the GBD injury AAFs has a minimal impact on the ranking order of the leading causes
of alcohol-attributable DALYs (only poisonings and epilepsy switch positions). Despite the similar
ranking results, Figure shows that the sensitivity analysis does result in notable increases in alcohol-
attributable male DALYs due to road traffic injuries and self-inflicted injuries.
Figure C-2: Comparison of injury sensitivity analysis and main analysis. Males: 10 specific leading causes of DALYs lost due to alcohol consumption (0–79 years; 2004).
0.0 1.0 2.0 3.0 4.0 5.0 6.0 7.0 8.0 9.0
Alcohol use disorders
Road traffic injuries
Self‐inflicted injuries
Other unintentional injuries
Cirrhosis of the liver
Falls
Poisonings
Epilepsy
Drownings
Haemorrhagic stroke
Alcohol‐attributable DALYs (in thousands)
Main analysis
Injury sensitivity analysis
On the other hand, while using the GBD injury AAFs for women results in several ranking changes
(e.g. within the top five leading causes, female breast cancer moves from 2nd to 3rd; road traffic
injuries move from 3rd to 2nd; self-inflicted injuries move from 6th to 5th; and other unintentional
injuries move from 5th to 9th), these ranking changes are due to relatively small changes in DALY
numbers (see Figure ).
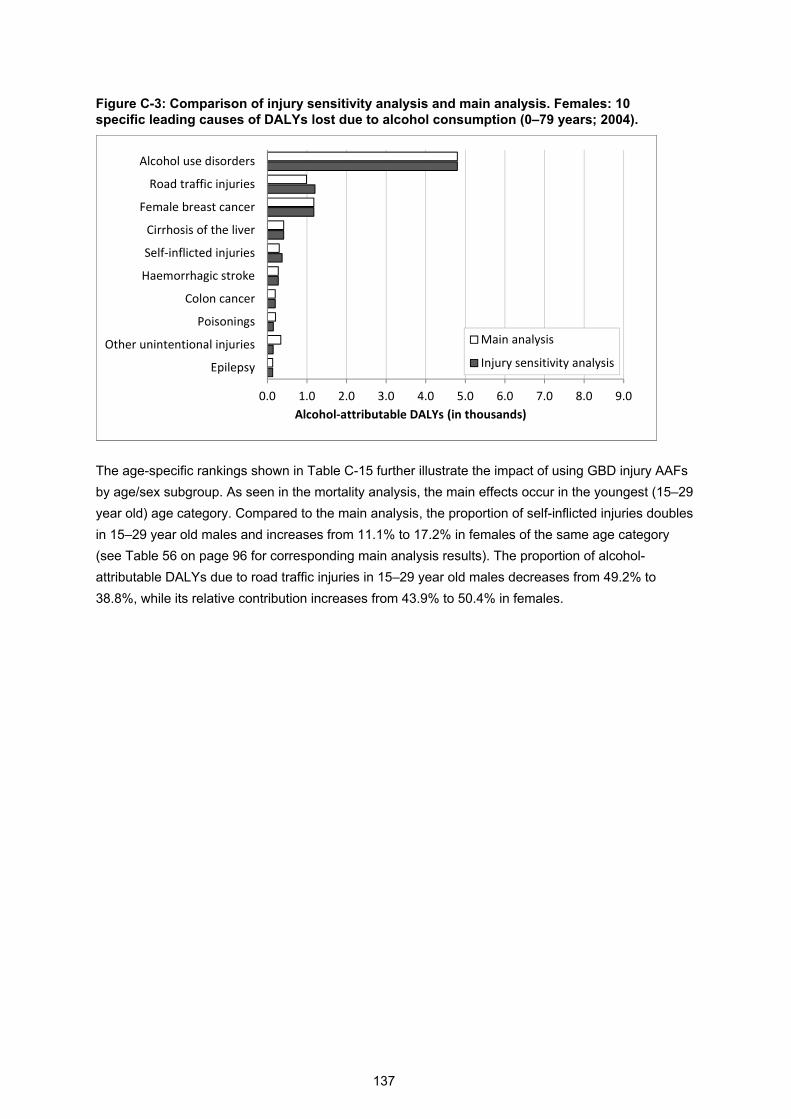
137
Figure C-3: Comparison of injury sensitivity analysis and main analysis. Females: 10 specific leading causes of DALYs lost due to alcohol consumption (0–79 years; 2004).
0.0 1.0 2.0 3.0 4.0 5.0 6.0 7.0 8.0 9.0
Alcohol use disorders
Road traffic injuries
Female breast cancer
Cirrhosis of the liver
Self‐inflicted injuries
Haemorrhagic stroke
Colon cancer
Poisonings
Other unintentional injuries
Epilepsy
Alcohol‐attributable DALYs (in thousands)
Main analysis
Injury sensitivity analysis
The age-specific rankings shown in Table C-15 further illustrate the impact of using GBD injury AAFs
by age/sex subgroup. As seen in the mortality analysis, the main effects occur in the youngest (15–29
year old) age category. Compared to the main analysis, the proportion of self-inflicted injuries doubles
in 15–29 year old males and increases from 11.1% to 17.2% in females of the same age category
(see Table 56 on page 96 for corresponding main analysis results). The proportion of alcohol-
attributable DALYs due to road traffic injuries in 15–29 year old males decreases from 49.2% to
38.8%, while its relative contribution increases from 43.9% to 50.4% in females.

138
Table C-15: Injury sensitivity analysis: Top five causes of alcohol-attributable disability-adjusted life years (AA DALYs) in 15–59 year olds, by sex (2004).
Males
% of AA DALYs Females
% of AA DALYs
15-29 years (N = 7898) 15-29 years (N = 1548)
Road traffic injuries 38.8% Road traffic injuries 50.4%
Self-inflicted injuries 32.4% Self-inflicted injuries 17.2%
Other unintentional injuries 6.9% Alcohol use disorders 13.6%
Falls 6.3% Poisonings 4.8%
Drownings 3.6% Epilepsy 4.5%
30-44 years (N = 6416) 30-44 years (N = 2920)
Alcohol use disorders 59.5% Alcohol use disorders 65.4%
Road traffic injuries 14.3% Female breast cancer 12.4%
Self-inflicted injuries 9.8% Road traffic injuries 8.2%
Other unintentional injuries 3.3% Cirrhosis of the liver 4.1%
Cirrhosis of the liver 1.9% Self-inflicted injuries 2.4%
45-59 years (N = 4761) 45-59 years (N = 3230)
Alcohol use disorders 64.6% Alcohol use disorders 64.3%
Cirrhosis of the liver 6.6% Female breast cancer 14.7%
Road traffic injuries 6.2% Cirrhosis of the liver 6.3%
Self-inflicted injuries 3.7% Haemorrhagic stroke 2.5%
Mouth and oropharyngeal cancers 3.4% Colon cancer 1.9%
APPENDIX D: SAMPLE SIZES AND RESPONSE RATES FOR
SURVEYS WITH INFORMATION ABOUT DRINKING DURING
PREGNANCY.
Sample size
(currently or
previously
pregnant
women)
Response
rate
(overall
survey)
2007/08 New Zealand Alcohol and Drug
Use Survey (NZADUS2007/08)25
948 60%
2005 Alcohol in Pregnancy Study32 552 65%
2003/04 Health Behaviours Survey
(HBS2003/04)20
138 59%
2006 Taranaki hospital study33 100 90%

139
APPENDIX E: ESTIMATES USED TO CALCULATE THE
ALCOHOL-ATTRIBUTABLE FRACTIONS FOR ISCHAEMIC
HEART DISEASE BY NEW ZEALAND AGE/SEX/ETHNICITY
SUBGROUP.
Table E-1: People with irregular heavy drinking occasions (HDOs) in meta-analysis studies, pooled results by sex.
Males Females
Proportion of people with irregular HDOs* 15.7% 1.4%
Number of meta-analysis37 studies 5 3
Number of drinkers† 73882 29328
* People with irregular HDOs were people who drank 60+ grams of pure alcohol per occasion at least monthly, but not daily. † All mild to moderate drinkers (0.01–59.99 g/day) were included in proportion calculations.
Table E-2: Overall proportions of people with irregular heavy drinking occasions (HDOs)* in New Zealand sex/ethnicity subgroups, 2004 and 2007.
Males Females
2004 (HBS2003/04 estimates)
Māori 38.3% 26.4%
Non-Māori 15.0% 6.3%
2007 (NZADUS2007/08 estimates)
Māori 34.0% 30.9%†
Non-Māori 17.2% 14.8%†
* People with irregular HDOs were people who drank 60+ grams of pure alcohol per occasion at least monthly, but not daily. † 2007 female estimates used a lower cutoff to define HDOs (40+ grams).

140
Table E-3. New Zealand age/ethnicity subgroup alcohol consumption prevalences (%), with excess proportions of people with irregular heavy drinking occasions (HDOs) extracted for application of ischaemic heart disease RRs; 2004 males.
Alcohol
consumption
category
Age group (years)*
RR 15–29† 30–44† 45–59† 60–69‡ 70–79‡
2004
Māori
males
Abstainers 1.000 10.1 4.8 5.5 3.0 2.5
Ex-drinkers 1.210 4.3 12.1 18.9 20.1 20.3
0.01 – 19.99 g/day 0.863 34.5 47.0 50.7 54.5 59.7
20.00 – 39.99 g/day 0.791 11.6 14.7 10.6 9.4 8.3
40.00 – 59.99 g/day 0.879 7.9 5.6 4.6 3.3 2.1
60+ g/day 0.765 24.0 9.9 6.2 7.9 6.2
Excess people with
irregular HDOs§
1.000 7.5 5.9 3.6 1.8 1.0
2004
Non-
Māori
males
Abstainers 1.000 10.2 4.9 5.4 5.5 7.2
Ex-drinkers 1.210 2.8 5.0 7.7 8.7 9.7
0.01 – 19.99 g/day 0.863 42.9 55.6 56.8 57.0 57.9
20.00 – 39.99 g/day 0.791 15.6 20.3 16.4 17.0 15.2
40.00 – 59.99 g/day 0.879 8.5 7.9 6.5 6.2 5.6
60+ g/day 0.765 20.1 6.4 7.2 5.6 4.3
Excess people with
irregular HDOs§
1.000 0.0 0.0 0.0 0.0 0.0
* Sums of age/sex/ethnicity subgroup proportions may not equal exactly 100% due to rounding. † Estimates from HBS2003/04. ‡ Extrapolated estimates from weighted averages of proportions from HBS2003/04, NZADUS2007/08 and HtO2008/09 surveys. See report section: ‘Alcohol consumption estimates for older age categories’ for details about calculation methods and limitations of extrapolated estimates (i.e. high degree of uncertainty). § Excess proportions of people with irregular HDOs extracted from alcohol consumption categories I, II and III (relative to meta-analysis37 proportions provided by Roerecke and Rehm).

141
Table E-4. New Zealand age/ethnicity subgroup alcohol consumption prevalences (%), with excess proportions of people with irregular heavy drinking occasions (HDOs) extracted for application of ischaemic heart disease RRs; 2004 females.
Alcohol
consumption
category
Age group (years)*
RR 15–29† 30–44† 45–59† 60–69‡ 70–79‡
2004
Māori
females
Abstainers 1.000 8.2 8.8 13.6 11.3 11.3
Ex-drinkers 1.390 7.7 17.7 19.2 31.0 44.4
0.01 – 19.99 g/day 0.884 48.9 55.8 54.3 49.7 44.3
20.00 – 39.99 g/day 0.661 11.3 7.6 5.3 5.9 0.0
40.00 – 59.99 g/day 0.903 4.6 2.2 3.0 1.3 0.0
60+ g/day 2.076 11.9 3.6 2.8 0.0 0.0
Excess people with
irregular HDOs§
1.000 7.5 4.3 1.8 0.8 0.1
2004
Non-
Māori
females
Abstainers 1.000 12.1 8.7 10.6 13.0 19.5
Ex-drinkers 1.390 4.6 5.4 5.4 11.2 12.3
0.01 – 19.99 g/day 0.884 61.6 70.5 68.1 65.0 60.1
20.00 – 39.99 g/day 0.661 12.9 10.8 12.1 8.3 6.5
40.00 – 59.99 g/day 0.903 3.7 2.3 2.5 1.7 1.1
60+ g/day 2.076 4.5 2.1 1.3 0.7 0.5
Excess people with
irregular HDOs§
1.000 0.7 0.2 0.1 0.1 0.0
* Sums of age/sex/ethnicity subgroup proportions may not equal exactly 100% due to rounding. † Estimates from HBS2003/04. ‡ Extrapolated estimates from weighted averages of proportions from HBS2003/04, NZADUS2007/08 and HtO2008/09 surveys. See report section: ‘Alcohol consumption estimates for older age categories’ for details about calculation methods and limitations of extrapolated estimates (i.e. high degree of uncertainty). § Excess proportions of people with irregular HDOs extracted from alcohol consumption categories I, II and III (relative to meta-analysis37 proportions provided by Roerecke and Rehm).

142
Table E-5. New Zealand age/ethnicity subgroup alcohol consumption prevalences (%), with excess proportions of people with irregular heavy drinking occasions (HDOs) extracted for application of ischaemic heart disease RRs; 2007 males.
Alcohol
consumption
category
Age group (years)*
RR 15–29† 30–44† 45–59† 60–69‡ 70–79‡
2007
Māori
males
Abstainers 1.000 1.3 1.1 1.2 3.0 2.5
Ex-drinkers 1.210 5.8 9.2 27.2 20.1 20.3
0.01 – 19.99 g/day 0.863 43.6 48.7 44.5 54.7 59.7
20.00 – 39.99 g/day 0.791 12.0 11.8 7.5 9.5 8.4
40.00 – 59.99 g/day 0.879 7.0 8.2 5.7 3.3 2.1
60+ g/day 0.765 24.2 16.4 11.9 7.9 6.2
Excess people with
irregular HDOs§
1.000 6.1 4.6 2.0 1.5 0.8
2007
Non-
Māori
males
Abstainers 1.000 6.5 2.7 2.8 5.5 7.2
Ex-drinkers 1.210 8.0 7.7 9.4 8.7 9.7
0.01 – 19.99 g/day 0.863 46.8 56.0 58.1 57.0 57.9
20.00 – 39.99 g/day 0.791 17.4 14.7 18.2 17.0 15.2
40.00 – 59.99 g/day 0.879 4.7 9.5 5.0 6.2 5.6
60+ g/day 0.765 16.2 9.2 6.3 5.6 4.3
Excess people with
irregular HDOs§
1.000 0.3 0.2 0.2 0.1 0.0
* Sums of age/sex/ethnicity subgroup proportions may not equal exactly 100% due to rounding. † Estimates from NZADUS2007/08. ‡ Extrapolated estimates from weighted averages of proportions from HBS2003/04, NZADUS2007/08 and HtO2008/09 surveys. See report section: ‘Alcohol consumption estimates for older age categories’ for details about calculation methods and limitations of extrapolated estimates (i.e. high degree of uncertainty). § Excess proportions of people with irregular HDOs extracted from alcohol consumption categories I, II and III (relative to meta-analysis37 proportions provided by Roerecke and Rehm).

143
Table E-6: New Zealand age/ethnicity subgroup alcohol consumption prevalences (%), with excess proportions of people with irregular heavy drinking occasions (HDOs) extracted for application of ischaemic heart disease RRs; 2007 females.
Alcohol
consumption
category
Age group (years)*
RR 15–29† 30–44† 45–59† 60–69‡ 70–79‡
2007
Māori
females
Abstainers 1.000 1.8 2.7 2.5 11.3 11.3
Ex-drinkers 1.390 10.9 13.6 21.4 31.0 44.4
0.01 – 19.99 g/day 0.884 47.6 62.1 64.1 49.6 44.3
20.00 – 39.99 g/day 0.661 9.3 7.6 2.4 5.8 0.0
40.00 – 59.99 g/day 0.903 5.3 2.6 1.4 1.3 0.0
60+ g/day 2.076 14.0 5.5 5.0 0.0 0.0
Excess people with 1.000 11.1 5.9 3.2 0.9 0.1
2007
Non-
Māori
females
Abstainers 1.000 9.0 6.6 5.8 13.0 19.5
Ex-drinkers 1.390 9.8 10.6 10.3 11.2 12.3
0.01 – 19.99 g/day 0.884 61.6 68.4 68.4 65.0 60.1
20.00 – 39.99 g/day 0.661 6.9 8.0 9.8 8.2 6.5
40.00 – 59.99 g/day 0.903 3.2 2.1 2.8 1.7 1.1
60+ g/day 2.076 6.2 2.7 1.7 0.7 0.5
Excess people with 1.000 3.3 1.6 1.3 0.2 0.0
* Sums of age/sex/ethnicity subgroup proportions may not equal exactly 100% due to rounding. † Estimates from NZADUS2007/08. ‡ Extrapolated estimates from weighted averages of proportions from HBS2003/04, NZADUS2007/08 and HtO2008/09 surveys. See report section: ‘Alcohol consumption estimates for older age categories’ for details about calculation methods and limitations of extrapolated estimates (i.e. high degree of uncertainty). § Excess proportions of people with irregular HDOs extracted from alcohol consumption categories I, II and III (relative to meta-analysis37 proportions provided by Roerecke and Rehm).

144
Table E-7: Total New Zealand alcohol consumption prevalence (%) by age, with excess proportions of people with irregular heavy drinking occasions (HDOs) extracted for application of ischaemic heart disease RRs; 2004 males and females.
Alcohol
consumption
category
Age group (years)*
RR 15–29† 30–44† 45–59† 60–69‡ 70–79‡
Males
Abstainers 1.000 10.2 4.9 5.4 5.3 7.0
Ex-drinkers 1.210 3.0 6.0 8.8 9.5 10.2
0.01 – 19.99 g/day 0.863 41.4 54.4 56.2 56.8 58.0
20.00 – 39.99 g/day 0.791 14.9 19.6 15.8 16.4 14.9
40.00 – 59.99 g/day 0.879 8.4 7.6 6.3 6.0 5.5
60+ g/day 0.765 20.8 6.8 7.1 5.8 4.4
Excess people with
irregular HDOs§
1.000 1.3 0.8 0.4 0.1 0.0
Females
Abstainers 1.000 11.4 8.7 10.9 12.9 19.1
Ex-drinkers 1.210 5.2 7.1 6.8 12.7 13.9
0.01 – 19.99 g/day 0.863 59.3 68.5 66.7 63.9 59.4
20.00 – 39.99 g/day 0.791 12.6 10.3 11.4 8.1 6.2
40.00 – 59.99 g/day 0.879 3.8 2.3 2.5 1.7 1.0
60+ g/day 0.765 5.8 2.4 1.5 0.7 0.5
Excess people with
irregular HDOs§
1.000 1.9 0.8 0.2 0.1 0.0
* All estimates weighted by 2004 population sizes of ethnic subgroups. Sums of age/sex/ethnicity subgroup proportions may not equal exactly 100% due to rounding. † Estimates from HBS2003/04. ‡ Extrapolated estimates from weighted averages of proportions from HBS2003/04, NZADUS2007/08 and HtO2008/09 surveys. See report section: ‘Alcohol consumption estimates for older age categories’ for details about calculation methods and limitations of extrapolated estimates (i.e. high degree of uncertainty). § Excess proportions of people with irregular HDOs extracted from alcohol consumption categories I, II and III (relative to meta-analysis37 proportions provided by Roerecke and Rehm).

145
APPENDIX F: PROPORTIONS OF DEATHS IN THE OVERALL
GBD ‘LOWER RESPIRATORY INFECTIONS’ CATEGORY
THAT WERE DUE TO PARTIALLY ALCOHOL-ATTRIBUTABLE
CAUSES.*
Age group (years)
15–29 30–44 45–59 60–69 70–79
Males 100.0% 100.0% 93.3% 85.7% 95.3%
Female 100.0% 100.0% 85.7% 88.9% 87.9%
* New Zealand mortality data for 2004 and 2007 were combined when calculating these proportions. Please see equation 4 (page 63) and accompanying text for more details as to how these proportions were calculated and applied.

146
APPENDIX G: 2004 DEATHS IN SELECTED CATEGORIES AS REPORTED BY STATISTICS NEW ZEALAND
AND ESTIMATED BY THE WORLD HEALTH ORGANIZATION: TOTAL NEW ZEALAND POPULATION.*
All NZ (<80 yrs)
Males Females
0–4 5–14 15–29 30–44 45–59 60–69 70–79 Total 0–4 5–14 15–29 30–44 45–59 60–69 70–79 Total
Statistics New Zealand
Cancers 1646 0 0 2 25 144 208 300 679 0 0 6 92 272 276 321 967
Neuro-psychiatric disorders 86 1 2 12 11 13 4 16 59 0 0 4 6 9 3 5 27
Cardiovascular disorders 3823 1 0 4 85 440 617 1330 2477 0 0 3 35 154 263 891 1346
Liver cirrhosis (K70 only) 80 0 0 0 4 17 23 12 56 0 0 0 4 11 4 5 24
Low birth weight 51 23 0 0 0 0 0 0 23 28 0 0 0 0 0 0 28
Respiratory disorders 99 8 0 2 3 6 8 30 57 10 0 0 0 4 8 20 42
Diabetes mellitus 508 1 1 2 9 58 94 131 296 0 0 0 2 45 53 112 212
Unintentional injuries 880 22 20 189 150 118 37 74 610 20 12 63 48 47 36 44 270
Intentional injuries 521 3 5 139 124 80 26 22 399 4 3 36 38 30 5 6 122
Totals 7694 59 28 350 411 876 1017 1915 4656 62 15 112 225 572 648 1404 3038
World Health Organization Cancers 1743 0 0 3 19 150 229 322 723 0 0 4 92 268 285 372 1020
Neuro-psychiatric disorders 76 1 0 5 8 10 5 10 38 3 1 4 8 6 6 11 37
Cardiovascular disorders 3742 0 1 5 84 449 586 1240 2365 1 2 1 26 153 265 929 1377
Liver cirrhosis (K70, K73 & K74)
97 0 0 0 4 41 13 13 70 0 0 0 3 9 7 9 27
Low birth weight 79 47 0 0 0 0 0 0 47 32 0 0 0 0 0 0 32
Respiratory disorders 94 1 1 2 2 5 13 25 49 7 0 3 1 7 6 22 45
Diabetes mellitus 517 0 0 2 5 51 95 148 301 0 0 0 7 39 67 102 216
Unintentional injuries 891 18 26 192 155 111 75 56 632 23 11 66 43 48 20 47 259
Intentional injuries 546 0 4 120 133 90 25 26 398 1 2 46 45 34 10 11 148
Totals 7784 68 32 328 409 905 1041 1840 4623 66 16 124 225 564 665 1501 3161
* Sums of age/sex/ethnicity subgroup proportions may not equal exactly 100% due to rounding.

147
APPENDIX H: ALCOHOL-ATTRIBUTABLE DEATHS BY AGE/SEX/ETHNICITY SUBGROUP AND CAUSE (2004).
Table H-1: Māori alcohol-attributable deaths (2004).
0-4 5-14 15-29 30-44 45-59 60-69 70-79 0-4 5-14 15-29 30-44 45-59 60-69 70-79 Male Female All
Mouth and oropharynx cancers 0 0 0 0 3 2 0 0 0 0 0 0 0 0 5 1 5
Oesophagus cancer 0 0 0 0 0 2 1 0 0 0 0 1 0 0 3 1 4
Colon cancer 0 0 0 0 0 0 0 0 0 0 0 1 1 0 1 2 3
Rectum cancer 0 0 0 0 0 0 0 0 0 0 0 0 0 0 1 1 2
Liver cancer 0 0 0 1 2 1 0 0 0 0 0 0 0 0 4 0 4
Laryngeal cancer 0 0 0 0 0 1 0 0 0 0 0 0 0 0 1 0 1
Female breast cancer 0 0 0 0 0 0 0 0 0 1 3 5 2 2 0 13 13
Alcohol use disorders 0 0 0 0 0 0 1 0 0 0 1 1 0 0 1 2 3
Epilepsy 0 0 1 0 1 0 0 0 0 0 0 0 0 0 1 0 1
Hypertensive heart disease 0 0 0 0 1 1 1 0 0 0 0 0 0 0 3 1 4
Ischaemic heart disease 0 0 0 -2 -8 -7 -6 0 0 0 0 1 1 6 -23 8 -15
Cardiac arrhythmias 0 0 0 0 0 0 1 0 0 0 0 0 0 1 1 2 3
Ischaemic stroke 0 0 0 0 0 0 0 0 0 0 0 -2 -1 -1 1 -4 -4
Haemorrhagic stroke 0 0 0 0 1 1 1 0 0 0 0 2 1 1 3 5 8
Oesophageal varices 0 0 0 0 0 0 0 0 0 0 0 1 0 0 0 1 1
Alcoholic liver cirrhosis 0 0 0 0 2 4 1 0 0 0 0 1 1 0 7 2 9
Cholelithiasis 0 0 0 0 0 0 0 0 0 0 0 0 0 0 0 0 0
Pancreatitis 0 0 0 0 0 0 0 0 0 0 0 0 0 0 0 0 0
Low birth weight 1 0 0 0 0 0 0 1 0 0 0 0 0 0 1 1 1
Fetal alcohol syndrome 0 0 0 0 0 0 0 0 0 0 0 0 0 0 0 0 0
Tuberculosis 0 0 0 0 0 1 0 0 0 0 0 0 0 0 1 0 1
Lower respiratory infections: pneumonia 0 0 0 0 0 0 0 0 0 0 0 0 0 0 1 0 1
Diabetes mellitus 0 0 0 0 -1 -2 -1 0 0 0 0 -4 -4 -2 -4 -10 -14
Road traffic injuries 1 1 22 15 2 0 0 1 1 4 5 0 0 0 42 11 53
Alcohol poisoning 0 0 1 0 0 0 0 0 0 1 0 0 0 0 1 1 2
Non-alcohol poisoning 0 0 3 1 0 0 0 0 0 1 1 0 0 0 3 1 5
Falls 0 0 1 1 2 0 0 0 0 0 0 0 0 0 4 1 5
Fire 0 0 0 2 0 0 0 0 0 0 0 0 0 0 2 1 3
Drownings 0 0 1 2 1 0 0 0 0 0 0 0 0 0 5 0 5
Other unintentional injuries 1 1 3 3 2 1 1 1 0 0 0 1 0 0 13 2 15
Self-inflicted injuries 0 0 7 6 1 0 0 0 0 2 1 0 0 0 14 3 17
Assault 0 0 3 1 1 0 0 1 0 0 0 0 0 0 6 1 7
Other intentional injuries 0 0 0 0 0 0 0 0 0 0 0 0 0 0 0 0 0
Total deaths caused 4 2 42 33 21 14 9 2 1 9 14 15 7 12 125 61 186
Total deaths prevented 0 0 0 -2 -9 -9 -7 0 0 0 0 -6 -5 -3 -28 -15 -42
TotalsMāori Males Māori Females

148
Table H-2: Non-Māori alcohol-attributable deaths (2004).
0-4 5-14 15-29 30-44 45-59 60-69 70-79 0-4 5-14 15-29 30-44 45-59 60-69 70-79 Male Female All
Mouth and oropharynx cancers 0 0 0 1 7 7 8 0 0 0 1 1 2 1 24 5 29
Oesophagus cancer 0 0 0 2 7 8 9 0 0 0 0 1 1 3 26 6 32
Colon cancer 0 0 0 0 2 4 8 0 0 0 0 2 5 8 13 15 29
Rectum cancer 0 0 0 0 3 5 6 0 0 0 0 1 3 3 14 7 21
Liver cancer 0 0 0 1 2 4 5 0 0 0 0 1 1 2 12 4 16
Laryngeal cancer 0 0 0 0 1 1 3 0 0 0 0 0 0 0 5 0 5
Female breast cancer 0 0 0 0 0 0 0 0 0 0 7 17 16 13 0 53 53
Alcohol use disorders 0 0 1 0 4 2 11 0 0 0 1 5 2 1 18 9 27
Epilepsy 0 0 3 3 2 1 1 0 0 1 1 0 0 0 9 2 11
Hypertensive heart disease 0 0 0 0 1 3 4 0 0 0 0 0 0 0 8 1 8
Ischaemic heart disease 0 0 -1 -7 -37 -57 -108 0 0 0 -1 -6 -8 -21 -210 -36 -246
Cardiac arrhythmias 0 0 0 0 0 0 3 0 0 0 0 0 0 2 3 2 6
Ischaemic stroke 0 0 0 0 0 -1 -4 0 0 0 -1 -5 -10 -39 -5 -55 -60
Haemorrhagic stroke 0 0 0 1 4 5 18 0 0 0 1 3 6 18 28 27 55
Oesophageal varices 0 0 0 0 0 0 0 0 0 0 0 0 0 0 0 0 0
Alcoholic liver cirrhosis 0 0 0 4 15 19 11 0 0 0 4 10 3 5 49 22 71
Cholelithiasis 0 0 0 0 0 0 -1 0 0 0 0 0 0 -1 -1 -2 -3
Pancreatitis 0 0 0 0 0 0 1 0 0 0 0 0 0 0 2 1 3
Low birth weight 0 0 0 0 0 0 0 1 0 0 0 0 0 0 0 1 1
Fetal alcohol syndrome 0 0 0 0 0 0 0 0 0 0 0 0 0 0 0 0 0
Tuberculosis 0 0 0 0 0 0 1 0 0 0 0 0 0 0 1 1 2
Lower respiratory infections: pneumonia 0 0 0 0 0 0 2 0 0 0 0 0 0 1 4 2 5
Diabetes mellitus 0 0 0 -1 -2 -4 -9 0 0 0 0 -6 -8 -23 -15 -38 -54
Road traffic injuries 0 1 37 16 7 1 2 0 1 10 4 2 0 0 64 17 81
Alcohol poisonings 0 0 0 2 2 0 0 0 0 0 0 3 0 0 4 3 7
Non-alcohol poisonings 0 0 2 2 1 0 0 0 0 1 1 1 0 0 5 3 8
Falls 0 0 3 3 3 1 5 0 0 0 0 0 1 1 16 2 18
Fires 0 0 0 0 0 0 0 0 0 0 0 0 0 1 1 1 3
Drownings 0 0 3 3 2 1 1 0 0 1 1 0 0 1 11 2 13
Other unintentional injuries 1 1 4 10 7 2 3 0 0 1 1 2 2 1 28 6 34
Self-inflicted injuries 0 0 16 15 9 3 1 0 0 3 3 2 0 0 43 8 52
Assault 0 0 1 2 2 0 1 0 0 0 1 1 0 0 6 3 9
Other intentional injuries 0 0 0 0 0 0 0 0 0 0 0 0 0 0 0 0 1
Total deaths caused 2 1 73 67 81 69 103 2 1 16 26 54 45 62 396 204 601
Total deaths prevented 0 0 -1 -8 -40 -62 -121 0 0 0 -3 -18 -26 -84 -232 -131 -363
Non-Māori Males Non-Māori Females Totals

149
Table H-3: Māori alcohol-attributable deaths (2007).
0-4 5-14 15-29 30-44 45-59 60-69 70-79 0-4 5-14 15-29 30-44 45-59 60-69 70-79 Male Female All
Mouth and oropharynx cancers 0 0 0 0 1 1 2 0 0 0 0 0 0 0 4 0 4
Oesophagus cancer 0 0 0 0 1 1 1 0 0 0 0 0 0 0 3 0 3
Colon cancer 0 0 0 0 0 0 0 0 0 0 0 1 1 1 1 2 2
Rectum cancer 0 0 0 0 1 1 1 0 0 0 0 0 0 0 2 0 3
Liver cancer 0 0 0 1 3 1 0 0 0 0 0 0 0 0 5 1 6
Laryngeal cancer 0 0 0 0 1 0 1 0 0 0 0 0 0 0 1 0 2
Female breast cancer 0 0 0 0 0 0 0 0 0 0 2 5 3 2 0 12 12
Alcohol use disorders 0 0 0 0 0 0 0 0 0 0 0 1 0 1 0 2 2
Epilepsy 0 0 0 0 0 0 0 0 0 0 0 0 0 0 1 0 1
Hypertensive heart disease 0 0 0 0 0 1 1 0 0 0 0 0 0 0 2 0 2
Ischaemic heart disease 0 0 0 -4 -7 -7 -7 0 0 0 0 2 2 7 -24 10 -14
Cardiac arrhythmias 0 0 0 0 0 0 0 0 0 0 0 0 0 0 1 0 1
Ischaemic stroke 0 0 0 0 1 0 0 0 0 0 -1 -1 -1 -1 1 -4 -3
Haemorrhagic stroke 0 0 0 1 2 1 1 0 0 0 1 1 1 1 4 4 8
Oesophageal varices 0 0 0 0 0 0 0 0 0 0 0 0 0 0 0 0 0
Alcoholic liver cirrhosis 0 0 0 0 5 2 0 0 0 0 0 3 1 0 7 4 11
Cholelithiasis 0 0 0 0 0 0 0 0 0 0 0 0 0 0 0 0 0
Pancreatitis 0 0 0 0 0 0 0 0 0 0 0 0 0 0 0 0 1
Low birth weight 1 0 0 0 0 0 0 1 0 0 0 0 0 0 1 1 1
Fetal alcohol syndrome 0 0 0 0 0 0 0 0 0 0 0 0 0 0 0 0 0
Tuberculosis 0 0 0 0 0 0 0 0 0 0 0 0 0 0 0 0 0
Lower respiratory infections: pneumonia 0 0 0 0 0 0 0 0 0 0 0 0 0 1 1 1 2
Diabetes mellitus 0 0 0 0 0 -1 -2 0 0 0 0 -3 -4 -2 -4 -10 -14
Road traffic injuries 1 1 22 13 3 0 0 0 1 7 2 0 0 0 40 11 50
Alcohol poisoning 0 0 1 0 0 0 0 0 0 0 1 0 0 0 1 1 2
Non-alcohol poisoning 0 0 2 1 1 0 0 0 0 1 0 0 0 0 5 2 6
Falls 0 0 0 1 0 1 0 0 0 0 0 0 0 0 3 1 4
Fire 0 0 0 0 0 0 0 0 0 0 0 0 0 0 1 0 1
Drownings 0 0 1 2 3 0 0 0 0 0 1 0 0 0 7 1 8
Other unintentional injuries 5 1 1 6 3 0 0 1 0 0 0 1 0 0 16 2 18
Self-inflicted injuries 0 0 6 6 1 0 0 0 0 1 1 0 0 0 13 3 15
Assault 0 0 2 1 0 0 0 1 0 0 1 0 0 0 4 3 7
Other intentional injuries 0 0 0 0 0 0 0 0 0 0 0 0 0 0 0 0 0
Total deaths caused 6 2 35 32 27 12 9 3 1 11 9 16 8 13 124 62 185
Total deaths prevented 0 0 0 -4 -7 -8 -8 0 0 0 -1 -5 -5 -4 -28 -14 -42
TotalsMāori Males Māori Females

150
Table H-4: Non-Māori alcohol-attributable deaths (2007).
0-4 5-14 15-29 30-44 45-59 60-69 70-79 0-4 5-14 15-29 30-44 45-59 60-69 70-79 Male Female All
Mouth and oropharynx cancers 0 0 0 1 6 11 9 0 0 0 0 2 2 3 27 6 33
Oesophagus cancer 0 0 0 1 6 11 14 0 0 0 0 1 2 2 31 5 36
Colon cancer 0 0 0 0 2 5 7 0 0 0 1 2 6 9 15 17 33
Rectum cancer 0 0 0 0 2 6 7 0 0 0 1 2 2 3 16 8 24
Liver cancer 0 0 0 0 4 5 6 0 0 0 0 1 1 1 15 4 19
Laryngeal cancer 0 0 0 0 2 2 2 0 0 0 0 0 0 1 5 1 6
Female breast cancer 0 0 0 0 0 0 0 0 0 0 7 23 16 14 0 60 60
Alcohol use disorders 0 0 0 0 3 5 3 0 0 0 0 2 2 0 11 4 15
Epilepsy 0 0 1 2 2 1 1 0 0 1 0 1 0 1 7 3 10
Hypertensive heart disease 0 0 0 0 1 2 5 0 0 0 0 0 0 0 9 1 9
Ischaemic heart disease 0 0 0 -7 -37 -47 -85 0 0 0 0 -3 -7 -15 -176 -25 -201
Cardiac arrhythmias 0 0 0 0 0 0 1 0 0 0 0 0 0 1 1 1 2
Ischaemic stroke 0 0 0 0 0 -1 -3 0 0 0 -1 -6 -8 -32 -5 -47 -52
Haemorrhagic stroke 0 0 0 1 4 5 15 0 0 0 1 5 4 15 25 25 50
Oesophageal varices 0 0 0 0 0 1 0 0 0 0 0 0 0 0 1 0 1
Alcoholic liver cirrhosis 0 0 0 3 25 20 7 0 0 0 5 6 10 1 55 22 77
Cholelithiasis 0 0 0 0 0 0 -1 0 0 0 0 0 0 -1 -1 -1 -2
Pancreatitis 0 0 0 0 0 0 0 0 0 0 0 0 0 0 1 1 2
Low birth weight 1 0 0 0 0 0 0 0 0 0 0 0 0 0 1 0 1
Fetal alcohol syndrome 0 0 0 0 0 0 0 0 0 0 0 0 0 0 0 0 0
Tuberculosis 0 0 0 0 0 0 1 0 0 0 0 0 0 0 1 0 1
Lower respiratory infections: pneumonia 0 0 0 0 1 0 2 0 0 0 0 0 0 1 3 2 5
Diabetes mellitus 0 0 0 0 -4 -4 -8 0 0 0 -2 -6 -11 -18 -17 -37 -54
Road traffic injuries 1 1 37 20 4 1 2 0 1 7 4 2 0 0 65 15 81
Alcohol poisonings 0 0 0 2 5 0 1 0 0 0 0 0 0 0 8 0 8
Non-alcohol poisonings 0 0 4 4 1 0 0 0 0 0 2 2 0 0 10 4 14
Falls 0 0 1 1 2 2 5 0 0 0 1 1 1 1 12 4 15
Fires 0 0 1 1 0 0 0 0 0 0 0 0 0 0 2 0 3
Drownings 0 0 4 2 3 1 1 0 0 0 0 0 0 0 11 1 12
Other unintentional injuries 1 1 5 10 9 3 3 0 0 1 1 1 0 2 32 6 38
Self-inflicted injuries 0 0 13 17 10 3 1 0 0 2 4 3 1 0 44 9 53
Assault 0 0 3 1 2 0 0 0 0 2 1 0 0 0 7 4 11
Other intentional injuries 0 0 0 0 0 0 0 0 0 0 0 0 0 0 1 0 1
Total deaths caused 3 2 69 66 94 86 93 1 1 13 29 54 49 55 414 203 617
Total deaths prevented 0 0 0 -7 -41 -52 -98 0 0 0 -3 -15 -26 -66 -198 -111 -309
Non-Māori Males Non-Māori Females Totals

151
APPENDIX I: FURTHER RESULTS FOR 2004 ALCOHOL-
ATTRIBUTABLE MORTALITY.
MORTALITY BY SEX (2004)
Years of Life Lost
Our years of life lost (YLL) estimates incorporated the impact of deaths at different ages (0–79 years) so
that deaths at younger ages resulted in more years of life lost than deaths at older ages. As shown
below, since injury deaths occur more often in younger age groups, injuries are responsible for an even
larger proportion of alcohol-attributable YLLs than for alcohol-attributable deaths.
The YLL estimates showed a greater disparity between sexes than previously shown for alcohol-
attributable deaths, with the alcohol-attributable YLL burden 2.3 times higher in men (n = 9,534) than
women (n = 4,070). Most of the leading causes of alcohol-attributable YLLs were similar to the leading
causes of alcohol-attributable deaths, as seen in Table I-1 I-1. Road traffic injuries were responsible for
32.2% of alcohol-attributable YLLs in males (n = 3,070) and 20.7% in females (n = 841). For both males
and females, the proportion of alcohol-attributable burden due to self-inflicted injuries was higher for YLLs
than for deaths.
Table I-1: Top five causes of alcohol-attributable years of life lost (AA YLLs), by sex (0–79 years; 2004).
Males
% of AA YLLs(N = 9534) Females
% of AA YLLs(N = 4070)
Road traffic injuries 32.2% Female breast cancer 21.9%
Self-inflicted injuries 15.3% Road traffic injuries 20.7%
Other unintentional injuries 9.2% Alcoholic liver cirrhosis 8.6%
Alcoholic liver cirrhosis 6.6% Self-inflicted injuries 7.1%
Falls 3.8% Haemorrhagic stroke 6.8%
Table I-2 shows that injuries accounted for two-thirds of all years of life lost due to alcohol consumption:
73% of male and 42% of female alcohol-attributable years of life lost.
Table I-2: Alcohol-attributable YLLs due to cancer, other conditions, and injuries; by sex (0–79 years; 2004).
N % N % N %
Cancers 1046 11.0% 1324 32.5% 2370 17.4%
Other conditions 1577 16.5% 1047 25.7% 2624 19.3%
Injuries 6912 72.5% 1699 41.7% 8610 63.3%
Male YLLs Female YLLs Total YLLs

152
YLLs prevented due to alcohol consumption are summarised in Table I-3 by condition. The YLL
proportions are similar to the proportions of deaths prevented by alcohol consumption, since most
mortality caused by these conditions occurs in older age groups.
Table I-3: Male and female YLLs prevented by alcohol consumption, by condition (0–79 years; 2004).
N % N % N %
Ischaemic heart disease 2012 90.3% 311 25.8% 2323 67.7%
Ischaemic stroke 34 1.5% 445 37.0% 480 14.0%
Diabetes 169 7.6% 428 35.6% 597 17.4%
Cholelithiasis 12 0.5% 20 1.7% 32 0.9%
Male YLLs Female YLLs Total YLLs
MORTALITY BY SEX/ETHNICITY SUBGROUP (2004)
Deaths
The total number of alcohol-attributable deaths in males was approximately double the number of female
deaths for both Māori and non-Māori New Zealanders in 2004. The leading causes of alcohol-attributable
death were the same for both groups (Table I-I-4). Road traffic injuries were the most common cause of
deaths in Māori and non-Māori males, while breast cancer was the most common cause in Māori and
non-Māori females.
There are several ethnic differences in ranking order and proportions of causes of alcohol-attributable
deaths (see Table I-I-4). However, caution is advised when interpreting these figures due to small
numbers in many groups, particularly for Māori. Ischaemic heart disease emerged as the third leading
cause of alcohol-attributable deaths in Māori women. This was due to the relatively high proportions of
older Māori females who were ex-drinkers (see Appendix E, Table E-4 for detailed consumption data), as
female ex-drinkers are approximately 40% more likely to die from ischaemic heart disease compared to
female lifetime abstainers (see Table 14 page 39 for mortality relative risks for ischaemic heart disease).
This result differs from all the other sex/ethnicity subgroups, for whom the net effect of alcohol
consumption on ischaemic heart disease deaths is estimated to be preventive (see Table 15 and Table
16 on pages 42 and 43 for 2004 ischaemic heart disease mortality AAFs by age/sex/ethnicity subgroup).

153
Table I-4: Top five causes of alcohol-attributable (AA) deaths, by sex and ethnicity (0–79 years; 2004).
Males% of
AA deaths Females% of
AA deaths
Māori (N = 125) Māori (N = 61)
Road traffic injuries 33.5% Female breast cancer 21.7%
Self-inflicted injuries 11.1% Road traffic injuries 18.3%
Other unintentional injuries 10.2% Ischaemic heart disease 13.3%
Alcoholic liver cirrhosis 5.6% Haemorrhagic stroke 7.6%
Violence 5.0% Self-inflicted injuries 4.8%
Non-Māori (N = 396) Non-Māori (N = 204)
Road traffic injuries 16.2% Female breast cancer 26.2%
Alcoholic liver cirrhosis 12.4% Haemorrhagic stroke 13.3%
Self-inflicted injuries 10.9% Alcoholic liver cirrhosis 10.8%
Haemorrhagic stroke 7.1% Road traffic injuries 8.1%
Other unintentional injuries 7.0% Colon cancer 7.6%
Māori men had the highest proportion of deaths in 2004 attributed to alcohol consumption (9.1%). In
contrast, 5.8% of all deaths in Māori women were attributed to alcohol, while alcohol consumption in non-
Māori men and women was responsible for 5.2% and 3.8% of their total annual deaths, respectively
(TablI-5).
To enable direct comparisons of alcohol-attributable deaths by sex and ethnicity subgroups while
controlling for differences in age structure of the populations, we calculated standardised rates of
mortality per 100,000 people using the WHO world population57 as the standard population
(see Tabl I-5). The alcohol-attributable death rate for Māori overall was 2.7 times the rate for non-Māori
when standardisation had adjusted for the effect of differences in the age structures. In addition to the
ethnic disparity in alcohol-attributable deaths, Figure I-1 illustrates how men of both ethnic groups had
double the standardised death rate of women.

154
Table I-5: Alcohol-attributable deaths caused and prevented, by sex and ethnicity (0–79 years; 2004).
EthnicityDeaths caused
(count) % of all deathsDeaths caused
(rate*)Deaths
prevented
Males Māori 125 9.1% 50.7 28
Non-Māori 396 5.2% 19.0 232
Total 521 5.8% 23.0 259
Females Māori 61 5.8% 23.9 15
Non-Māori 204 3.8% 8.6 131
Total 265 4.2% 10.2 145
Total Māori 186 7.7% 36.8 42
Non-Māori 601 4.7% 13.7 363
Total 787 5.1% 16.5 405
* Rate per 100,000 age-standardised to WHO world population
Figure I-1: Population standardised alcohol-attributable deaths per 100,000 people, by sex and ethnicity (0–79 years; 2004).
0
10
20
30
40
50
60
Maori Non‐Maori Total
Deaths per 100,000 people (0 to 79 years of age)
Males
Females
Total
Table I-6 shows that sex and ethnic differences in alcohol-attributable deaths were mostly due to injury
deaths, whereas the proportions of condition deaths attributable to alcohol consumption did not vary
markedly by sex or ethnicity. The results in Table I-6 also demonstrate the substantial contribution of
alcohol consumption to injury deaths in both sexes and ethnicities, with estimates of alcohol-attributable
injury deaths as a proportion of all injury deaths ranging from 16% in non-Māori females to 36% in Māori
males.

155
Table I-6: Alcohol-attributable (AA) condition and injury deaths, by sex and ethnicity (0–79 years; 2004).
EthnicityConditions: AA deaths
caused
% of total condition
deaths
Injuries: AA deaths
caused
% of total injury deaths
Males Māori 34 3.1% 91 36.2%
Non-Māori 217 3.2% 179 23.6%
Total 251 3.2% 270 26.7%
Females Māori 40 4.2% 21 21.8%
Non-Māori 158 3.1% 46 15.5%
Total 198 3.3% 67 17.1%
Total Māori 75 3.6% 111 32.2%
Non-Māori 375 3.2% 226 21.3%
Total 450 3.2% 337 24.0%
Table I-7 provides the estimated alcohol-attributable death numbers by sex/ethnicity subgroup,
showing the differences within each specific condition and injury category.

156
Table I-7: Number of alcohol-attributable deaths for each condition and injury category, by sex and ethnicity (0–79 years; 2004).*
Males Females All Males Females All Males Females All
Conditions
Mouth and oropharyngeal cancers 5 1 5 24 5 29 28 6 34
Oesophagus cancer 3 1 4 26 6 32 29 7 36
Colon cancer 1 2 3 13 15 29 14 17 32
Rectum cancer 1 1 2 14 7 21 16 8 24
Liver cancer 4 0 4 12 4 16 16 4 20
Laryngeal cancer 1 0 1 5 0 5 6 0 6
Female breast cancer 13 13 53 53 67 67
Alcohol use disorders 1 2 3 18 9 27 19 11 30
Epilepsy 1 0 1 9 2 11 11 2 13
Hypertensive heart disease 3 1 4 8 1 8 11 1 12
Ischaemic heart disease† -23 8 -15 -210 -36 -246 -233 -28 -261
Cardiac arrhythmias 1 2 3 3 2 6 4 4 8
Ischaemic stroke† 1 -4 -4 -5 -55 -60 -5 -59 -64
Haemorrhagic stroke 3 5 8 28 27 55 31 32 63
Oesophageal varices 0 1 1 0 0 0 0 1 1
Alcoholic liver cirrhosis 7 2 9 49 22 71 56 24 80
Cholelithiasis 0 0 0 -1 -2 -3 -1 -2 -4
Pancreatitis 0 0 0 2 1 3 2 1 3
Low birth weight 1 1 1 0 1 1 1 1 3
Fetal alcohol syndrome 0 0 0 0 0 0 0 0 0
Tuberculosis 1 0 1 1 1 2 2 1 4
Lower resp. infections: pneumonia 1 0 1 4 2 5 4 2 6
Diabetes mellitus -4 -10 -14 -15 -38 -54 -20 -48 -68
Injuries
Road traffic injuries 42 11 53 64 17 81 106 28 134
Alcohol poisonings 1 1 2 4 3 7 5 4 9
Non-alcohol poisonings 3 1 5 5 3 8 9 4 13
Falls 4 1 5 16 2 18 20 3 23
Fires 2 1 3 1 1 3 4 2 6
Drownings 5 0 5 11 2 13 15 2 18
Other unintentional injuries 13 2 15 28 6 34 41 9 49
Self-inflicted injuries 14 3 17 43 8 52 57 11 68
Assault 6 1 7 6 3 9 12 4 16
Other intentional injuries 0 0 0 0 0 1 1 0 1
Māori Non-Māori Total
* Totals may not exactly equal the sums of components. This is a result of the table estimates being rounded to the nearest whole number, while totals are calculated from actual estimates with several decimal places. † For ischaemic heart disease and ischaemic stroke, please note that totals are net deaths due to several instances where totals combine positive and negative numbers of deaths. Please see 0 for detailed alcohol-attributable death numbers for each age/sex/ethnicity subgroup.

157
Years of Life Lost
For both Māori and non-Māori, alcohol-attributable injuries contributed a larger proportion of alcohol-
attributable YLLs than alcohol-attributable deaths (Table I-8). This is due to the lower average age of
death for injuries than for most other conditions.
Table I-8: Top five causes of alcohol-attributable years of life lost (AA YLLs), by sex and ethnicity (0–79 years; 2004).
Males
% of AA YLLs Females
% of AA YLLs
Māori (N = 2921) Māori (N = 1167)
Road traffic injuries 42.0% Road traffic injuries 28.9%
Self-inflicted injuries 13.5% Female breast cancer 18.5%
Other unintentional injuries 10.1% Self-inflicted injuries 7.7%
Violence 5.8% Haemorrhagic stroke 5.2%
Drownings 4.2% Ischaemic heart disease 5.2%
Non-Māori (N = 6614) Non-Māori (N = 2903)
Road traffic injuries 27.9% Female breast cancer 23.2%
Self-inflicted injuries 16.1% Road traffic injuries 17.3%
Other unintentional injuries 8.7% Alcoholic liver cirrhosis 11.0%
Alcoholic liver cirrhosis 8.4% Haemorrhagic stroke 7.4%
Falls 4.2% Self-inflicted injuries 6.9%
As seen in Table I- I-9, the proportions of YLLs attributed to alcohol consumption in 2004 were higher
than for deaths, with 8.0% of all New Zealand YLLs in 2004 attributed to alcohol, compared to 5.1% of
deaths. The sex-specific proportions of YLLs attributed to alcohol consumption were 9.6% for men
and 5.8% for women (compared to 5.8% and 4.2% of deaths in men and women, respectively).
Table I- also shows that the alcohol-attributable YLL rate for Māori overall was 2.7 times the non-
Māori rate when the differences in age structure had been adjusted for. This was the same magnitude
of ethnic disparity estimated for the standardised death rates. Sex differences were also present in
standardised YLL rates, with the rate of alcohol-attributable YLLs in Māori and non-Māori men 2.6
times the corresponding female YLL rates (Table I-9). This sex difference in YLL rates was larger than
that estimated for alcohol-attributable death rates.

158
Table I-9: Alcohol-attributable years of life lost (YLLs) caused and prevented, by sex and ethnicity (0–79 years; 2004).
EthnicityYLLs caused
(count)% of all YLLs*
YLLs caused(rate)**
YLLs prevented
Males Māori 2921 1072 309
Non-Māori 6614 387 1919
Total 9534 9.6% 488 2228
Females Māori 1167 414 173
Non-Māori 2903 149 1033
Total 4070 5.8% 186 1206
Total Māori 4088 731 481
Non-Māori 9517 267 2952
Total 13605 8.0% 335 3433
**Rate per 100,000 age-standardised to WHO world population.
*We were unable to calculate the proportions of all Māori and non-Māori YLLs that were attributable to alcohol because GBD YLL denominator data was not available by ethnicity.
MORTALITY BY AGE/SEX SUBGROUP (2004)
Deaths
Table I-10 details the how the numbers of alcohol-attributable deaths caused by injuries and
conditions varied by age and sex. Injuries were responsible for most alcohol-attributable deaths in
young adults with a transition in the older age groups to fewer alcohol-attributed injury deaths and
more deaths due to alcohol-attributable conditions. This transition from alcohol-attributable injury
deaths to condition deaths was more apparent and appeared later in life for men than women (Figure
I-2).

159
Table I-10: Alcohol-attributable (AA) condition and injury deaths, by age and sex (2004).
Age category (years)
AA deathscaused
% of total
deaths
Conditions: AA deaths
caused
Injuries: AA deaths
caused
Males 0-4 6 3.0% 1 5
5-14 3 5.6% 0 3
15-29 115 27.6% 6 109
30-44 100 16.6% 15 85
45-59 102 6.5% 60 42
60-69 83 3.9% 72 11
70-79 112 2.8% 97 15
Total 521 5.8% 251 270
Females 0-4 4 2.1% 1 3
5-14 2 4.8% 0 2
15-29 25 14.5% 2 22
30-44 39 9.7% 21 19
45-59 69 5.9% 57 13
60-69 52 3.5% 47 5
70-79 75 2.5% 70 4
Total 265 4.2% 198 67
Figure I-2: Number of condition and injury deaths attributable to alcohol consumption, by age and sex (2004).
0
20
40
60
80
100
120
140
0‐4 5‐14 15‐29 30‐44 45‐59 60‐69 70‐79 0‐4 5‐14 15‐29 30‐44 45‐59 60‐69 70‐79
Males Females
Injury deaths
Condition deaths

160
We further examined the composition of the alcohol-attributable death burden by broad injury and
condition categories in adult males (Figure I-3) and females (Figure I-4). These figures highlight the
prominent role of injuries in the youngest age groups (i.e. 95% and 91% of alcohol-attributable deaths
in 15–29 year old males and females, respectively) and the increasing role of cancers and
cardiovascular disorders with age. For detailed lists of the specific conditions and injuries included
within each broad cause category, please see Table 3 on page 13 (conditions) and Table 6 on page
17 (injuries).
Figure I-3: Males: Causes of alcohol-attributable deaths, by age (2004).
0%
10%
20%
30%
40%
50%
60%
70%
80%
90%
100%
15‐29 30‐44 45‐59 60‐69 70‐79
Cancers
Neuro‐psychiatric disorders
Cardiovascular disorders
Digestive disorders
Respiratory disorders
Unintentional injuries
Intentional injuries
Figure I-4: Females: Causes of alcohol-attributable deaths, by age (2004).
0%
10%
20%
30%
40%
50%
60%
70%
80%
90%
100%
15‐29 30‐44 45‐59 60‐69 70‐79
Cancers
Neuro‐psychiatric disorders
Cardiovascular disorders
Digestive disorders
Respiratory disorders
Unintentional injuries
Intentional injuries

161
MORTALITY BY AGE/ETHNICITY SUBGROUP (2004)
Deaths
The absolute numbers of Māori and non-Māori deaths caused and prevented by alcohol consumption
are presented by age category in Figure I-5 and Figure I-6. The largest number of alcohol-attributed
Māori deaths occurred in young adults with fewer deaths in older age categories, whereas for non-
Māori the number of alcohol-attributed deaths increased with increasing age. For both Māori and non-
Māori, most deaths prevented by alcohol consumption would have occurred in people 45 years and
older.
The Māori and non-Māori populations have different age structures, with relatively larger proportions
of younger Māori and older non-Māori (i.e. in 2004, 61% of the Māori population and 39% of the non-
Māori population was aged 0–29 years, while 6% of Māori and 15% of non-Māori were 60–79 years
old). These contrasting age structures are reflected in the larger number of absolute deaths caused
and prevented within younger age categories for Māori (Figure I-5) and older age categories for non-
Māori (Figure I-6)
When the impact of the age structures on the alcohol-attributable death burden is adjusted for by
calculating age/ethnicity-specific rates (i.e. dividing death numbers by the population size of each
age/ethnicity subgroup), the Māori alcohol-attributable death rates are more than double the
corresponding non-Māori rates for each age group, with similar rates of deaths prevented for 70–79
year olds (see Table I-11).
Figure I-5: Number of Māori deaths caused and prevented by alcohol consumption, by age (2004).
‐20
‐10
0
10
20
30
40
50
60
0‐4 5‐14 15‐29 30‐44 45‐59 60‐69 70‐79
deaths caused
deaths prevented
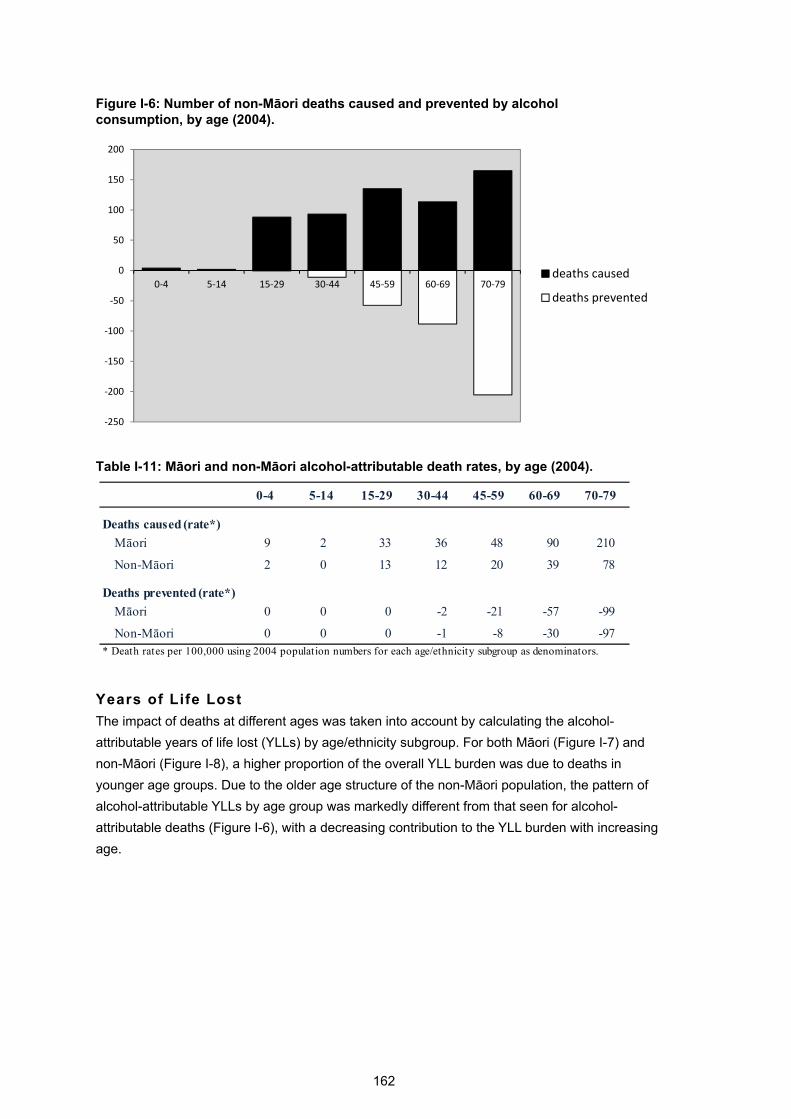
162
Figure I-6: Number of non-Māori deaths caused and prevented by alcohol consumption, by age (2004).
‐250
‐200
‐150
‐100
‐50
0
50
100
150
200
0‐4 5‐14 15‐29 30‐44 45‐59 60‐69 70‐79deaths caused
deaths prevented
Table I-11: Māori and non-Māori alcohol-attributable death rates, by age (2004).
0-4 5-14 15-29 30-44 45-59 60-69 70-79
Deaths caused (rate*)
Māori 9 2 33 36 48 90 210
Non-Māori 2 0 13 12 20 39 78
Deaths prevented (rate*)
Māori 0 0 0 -2 -21 -57 -99
Non-Māori 0 0 0 -1 -8 -30 -97* Death rates per 100,000 using 2004 population numbers for each age/ethnicity subgroup as denominators.
Years of Life Lost
The impact of deaths at different ages was taken into account by calculating the alcohol-
attributable years of life lost (YLLs) by age/ethnicity subgroup. For both Māori (Figure I-7) and
non-Māori (Figure I-8), a higher proportion of the overall YLL burden was due to deaths in
younger age groups. Due to the older age structure of the non-Māori population, the pattern of
alcohol-attributable YLLs by age group was markedly different from that seen for alcohol-
attributable deaths (Figure I-6), with a decreasing contribution to the YLL burden with increasing
age.

163
Figure I-7: Number of Māori YLLs caused and prevented by alcohol consumption, by age (2004).
‐500
0
500
1000
1500
2000
0‐4 5‐14 15‐29 30‐44 45‐59 60‐69 70‐79
YLLs caused
YLLs prevented
Figure I-8: Number of non-Māori YLLs caused and prevented by alcohol consumption, by age (2004).
‐2000
‐1000
0
1000
2000
3000
4000
0‐4 5‐14 15‐29 30‐44 45‐59 60‐69 70‐79
YLLs caused
YLLs prevented

164
MORTALITY BY AGE/SEX/ETHNICITY SUBGROUP (2004)
The absolute numbers of alcohol-attributable deaths and YLLs are presented in Table I-12 by
age/sex/ethnicity subgroup.
TableI-12: Number of alcohol-attributable deaths and years of life lost (YLLs); by age, sex and ethnicity (2004).
Ethnicity
Males Māori 4 (129) 2 (71) 42 (1432) 33 (789) 21 (332) 14 (119) 9 (49)
Non-Māori 2 (84) 1 (44) 73 (2464) 67 (1656) 81 (1259) 69 (615) 103 (493)
Totals 6 (213) 3 (115) 115 (3896) 100 (2444) 102 (1591) 83 (734) 112 (541)
Females Māori 2 (83) 1 (35) 9 (315) 14 (341) 15 (252) 7 (74) 12 (68)
Non-Māori 2 (54) 1 (28) 16 (538) 26 (647) 54 (862) 45 (433) 62 (340)
Total 4 (137) 2 (63) 25 (853) 39 (989) 69 (1114) 52 (507) 75 (408)
Total Māori 6 (212) 3 (106) 51 (1746) 46 (1130) 37 (584) 21 (193) 22 (117)
Non-Māori 4 (138) 2 (72) 88 (3002) 93 (2303) 135 (2121) 114 (1048) 165 (832)
Total 10 (350) 5 (178) 140 (4749) 139 (3433) 172 (2705) 135 (1241) 186 (949)
0-4 5-14 15-29 30-44 45-59 60-69 70-79

165
REFERENCES
1. Connor J, Broad J, Jackson R, Rehm J. The burden of death, disease and disability due to alcohol in New Zealand: Alcohol Advisory Council of New Zealand; 2004.
2. Rehm J, Baliunas D, Borges GL, Graham K, Irving H, Kehoe T, et al. The relation
between different dimensions of alcohol consumption and burden of disease: an overview. Addiction. 2010 May;105(5):817-43.
3. New Zealand Law Commission. Alcohol in our lives: Curbing the harm. Wellington: New
Zealand Law Commission; 2010. 4. Gmel G, Shield KD, Rehm J. Developing a method to derive alcohol-attributable fractions
for HIV/AIDS mortality based on alcohol’s impact on adherence to antiretroviral medication. Popul Health Metr. 2011;9(1):5.
5. Shield K, Shuper PA, Gmel G, Rehm J. Global Burden of HIV/AIDS in 2004 resulting from
alcohol attributable non-adherence to medication regimes. International Journal of Alcohol and Drug Research. (accepted).
6. Institute for Health Metrics and Evaluation. Global burden of diseases: injuries and risk
factors study operations manual (final draft). Seattle, WA: Institute for Health Metrics and Evaluation; 2009.
7. Lawes CMM, Vander Hoorn S, Law MR, Rodgers A. Chapter 7: High Cholesterol. In:
Ezzati M, Lopez A, Rodgers A, Murray C, editors. Comparative quantification of health risks: global and regional burden of disease attributable to selected major risk factors. Geneva: World Health Organization; 2004. p. 391-496.
8. Feigin V, Carter K, Hackett M, Barber PA, McNaughton H, Dyall L, et al. Ethnic disparities
in incidence of stroke subtypes: Auckland Regional Community Stroke Study, 2002-2003. Lancet Neurol. 2006 Feb;5(2):130-9.
9. Taylor BJ, Shield KD, Rehm JT. Combining best evidence: a novel method to calculate
the alcohol-attributable fraction and its variance for injury mortality. BMC Public Health. 2011;11:265.
10. Blakely T, Kiro C, Woodward A. Unlocking the numerator-denominator bias. II:
adjustments to mortality rates by ethnicity and deprivation during 1991-94. The New Zealand Census-Mortality Study. N Z Med J. 2002 Feb 8;115(1147):43-8.
11. Blakely T, Robson B, Atkinson J, Sporle A, Kiro C. Unlocking the numerator-denominator
bias. I: Adjustments ratios by ethnicity for 1991-94 mortality data. The New Zealand Census-Mortality Study. N Z Med J. 2002 Feb 8;115(1147):39-43.
12. Blakely T, Atkinson JN, Fawcett J. Ethnic counts on mortality and census data (mostly)
agree for 2001-2004: New Zealand Census-Mortality Study update. N Z Med J. 2008 Sep 5;121(1281):58-62.
13. Ministry of Health. Mortality and Demographic Data 2007. Wellington: Ministry of Health;
2010. 14. New Zealand Health Information Service. Mortality and demographic data 2004.
Wellington: Ministry of Health; 2007.

166
15. English D, Holman C, Milne E, Winter M, Hulse G, Codde G. The quantification of drug-caused morbidity and mortality in Australia, 1995. Canberra: Commonwealth Department of Human Services and Health; 1995.
16. Rehm J, Giesbrecht N, Patra J, Roerecke M. Estimating chronic disease deaths and
hospitalizations due to alcohol use in Canada in 2002: implications for policy and prevention strategies. Prev Chronic Dis. 2006 Oct;3(4):A121.
17. Rehm J, Room R, Monteiro M, Gmel G, Graham K, Rehn N, et al. Alcohol Use. In: Ezzati
M, Lopez A, Rodgers A, Murray C, editors. Comparative quantification of health risks: global and regional burden of disease attributable to selected major risk factors. Geneva: World Health Organization; 2004. p. 959-1109.
18. Grant I, Springbett A, Graham L. Alcohol attributable mortality and morbidity: alcohol
population attributable fractions for Scotland. Edinburgh: NHS National Services Scotland; 2009.
19. Begg S, Vos T, Barker B, Stevenson C, Stanley L, Lopez AD. The burden of disease and
injury in Australia 2003. Canberra: Australian Institute of Health and Welfare; 2007. 20. Ministry of Health. Alcohol Use in New Zealand: Analysis of the 2004 New Zealand Health
Behaviours Survey – Alcohol Use. Wellington: Ministry of Health; 2007. 21. Oakley Browne M, Wells J, Scott K, (eds). Te Rau Hinengaro: The New Zealand Mental
Health Survey. Wellington: Ministry of Health; 2006. 22. Ministry of Health. A Portrait of Health: key results of the 2006/07 New Zealand Health
Survey. Wellington: Ministry of Health; 2008. 23. Wilsnack RW, Wilsnack SC, Kristjanson AF, Vogeltanz-Holm ND, Gmel G. Gender and
alcohol consumption: patterns from the multinational GENACIS project. Addiction. 2009 Sep;104(9):1487-500.
24. Connor JL, Kypri K, Bell ML, Cousins K. Alcohol involvement in aggression between
intimate partners in New Zealand: a national cross-sectional study. BMJ Open. 2011;1:e000065. doi:10.1136/bmjopen-2011-000065.
25. Ministry of Health. Alcohol use in New Zealand: key results of the 2007/08 New Zealand
Alcohol and Drug Use Survey. Wellington: Ministry of Health; 2009. 26. Casswell S, You RQ, Huckle T. Alcohol’s harm to others: reduced wellbeing and health
status for those with heavy drinkers in their lives. Addiction. 2011;106(6):1087-94. 27. Kish L. A procedure for objective respondent selection within the household. Journal of
the American Statistical Association. 1949;44(247):380-7. 28. Ministry of Health. Presenting ethnicity: comparing prioritised and total response ethnicity
in descriptive analyses of New Zealand Health Monitor surveys. Wellington: Ministry of Health; 2008.
29. Ministry of Health. Methodology report for the 2007/08 New Zealand Alcohol and Drug
Use Survey Wellington: Ministry of Health; 2010. 30. Huckle T, You RQ, Casswell S. Increases in quantities consumed in drinking occasions in
New Zealand 1995-2004. Drug Alcohol Rev. Jul;30(4):366-71. 31. McLeod D, Pullon S, Cookson T, Cornford E. Factors influencing alcohol consumption
during pregnancy and after giving birth. N Z Med J. 2002 Jul 2;115(1157):U29.

167
32. Parackal SM, Parackal MK, Ferguson EL, Harraway JA. Awareness of the effects of alcohol use during pregnancy among New Zealand women of childbearing age (Alcohol in Pregnancy Study). Report to Alcohol Advisory Council and Ministry of Health: Dunedin: University of Otago; 2006.
33. Ho R, Jacquemard R. Maternal alcohol use before and during pregnancy among women
in Taranaki, New Zealand. N Z Med J. 2009;122(1306):20-32. 34. Public Health Agency of Canada. Alcohol use and pregnancy: an important Canadian
public health and social issue. Ottawa: PHAC; 2007. 35. Roerecke M, Rehm J. Irregular heavy drinking occasions and risk of ischemic heart
disease: a systematic review and meta-analysis. Am J Epidemiol. 2010;171(6):633-44. 36. Roerecke M, Rehm J. Ischemic heart disease mortality and morbidity rates in former
drinkers: a meta-analysis. Am J Epidemiol. 2011;173(3):245-58. 37. Roerecke M, Rehm J. The cardioprotective association of average alcohol consumption
and ischaemic heart disease: a systematic review and meta-analysis. Addiction. 2012 Jul;107(7):1246-60.
38. Rehm J, Kehoe T, Gmel G, Stinson F, Grant B, Gmel G. Statistical modeling of volume of
alcohol exposure for epidemiological studies of population health: the US example. Population Health Metrics. 2010;8(3).
39. Casswell S, Huckle T, Pledger M. Survey data need not underestimate alcohol
consumption. Alcohol Clin Exp Res. 2002 Oct;26(10):1561-7. 40. Statistics New Zealand. Hot off the press: alcohol and tobacco available for consumption
year ended December 2004. Wellington: Statistics New Zealand; 2004. 41. Statistics New Zealand. Hot off the press: alcohol and tobacco available for consumption
year ended December 2007. Wellington: Statistics New Zealand; 2007. 42. Connor J, Casswell S. The burden of road trauma due to other people’s drinking. Accid
Anal Prev. 2009 Sep;41(5):1099-103. 43. Connor J, Casswell S. Alcohol-related harm to others in New Zealand: evidence of the
burden and gaps in knowledge. N Z Med J. In press 2012. 44. World Health Organization. International guide for monitoring alcohol consumption and
related harm: WHO/MSD/MSB/00.4; 2000. 45. Mathers CD, Vos T, Lopez AD, Salomon J, Ezzati M (ed.). National burden of disease
studies: a practical guide. Geneva: World Health Organization; 2001. 46. Steenland K, Armstrong B. An overview of methods for calculating the burden of disease
due to specific risk factors. Epidemiology. 2006 Sep;17(5):512-9. 47. World Health Organization. The global burden of disease: 2004 update. Switzerland:
World Health Organization; 2008. 48. World Health Organization. Global health risks. Mortality and burden of disease
attributable to selected major risks. Geneva: World Health Organization; 2009. 49. Shield KD, Kehoe T, Taylor B, Patra J, Rehm J. Alcohol-attributable burden of disease
and injury in Canada, 2004. Int J Public Health. 2011. 50. Connor J, Broad J, Rehm J, Vander Hoorn S, Jackson R. The burden of death, disease,
and disability due to alcohol in New Zealand. N Z Med J. 2005 Apr 15;118(1213):U1412.

168
51. New Zealand Health Information Service. Cancer: new registrations and deaths 2004.
Wellington: Ministry of Health; 2007. 52. Lopez A, Mathers C, Ezzati M, Jamison D, Murray C. Global Burden of Disease and Risk
Factors. Washington DC: Oxford University Press and The World Bank; 2006. 53. Vander Hoorn S, Ezzati M, Rodgers A, Lopez A, Murray C. Estimating attributable burden
of disease from exposure and hazard data. In: Ezzati M, Lopez A, Rodgers A, Murray C, editors. Comparative duantification of health risks: global and regional burden of disease attributable to selected major risk factors. Geneva: World Health Organization; 2004. p. 2129-40.
54. Connor J, Norton R, Ameratunga S, Jackson R. The contribution of alcohol to serious car
crash injuries. Epidemiology. 2004 May;15(3):337-44. 55. Habgood R, Casswell S, Pledger M, Bhatta K. Drinking in New Zealand: national surveys
comparison 1995 & 2000. Auckland: Alcohol and Public Health Research Unit, University of Auckland; 2001.
56. Oakley-Browne MA, Joyce PR, Wells JE, Bushnell JA, Hornblow AR. Christchurch
Psychiatric Epidemiology Study, Part II: Six month and other period prevalences of specific psychiatric disorders. Aust N Z J Psychiatry. 1989 Sep;23(3):327-40.
57. Ahmad O, Boschi-Pinto C, Lopez A, Murray C, Lozano R, Inoue M. Age standardization of
rates: a new WHO standard. GPE Discussion Paper Series: No.31: World Health Organization; 2001.
58. Meiklejohn J, Connor J, Kypri K. The effect of low survey response rates on estimates of
alcohol consumption in a general population survey. PLoS One. 2012;7(4):e35527. 59. Casswell S, Harding JF, You RQ, Huckle T. Alcohol’s harm to others: self-reports from a
representative sample of New Zealanders. N Z Med J. 2011 Jun 10;124(1336):75-84. 60. Shield KD, Gmel G, Patra J, Rehm J. Global burden of injuries attributable to alcohol
consumption in 2004: a novel way of calculating the burden of injuries attributable to alcohol consumption. Population Health Metrics. 2012 May 18;10(1):9.
61. Rehm J, Monteiro M, Room R, Gmel G, Jernigan D, Frick U, et al. Steps towards
constructing a global comparative risk analysis for alcohol consumption: determining indicators and empirical weights for patterns of drinking, deciding about theoretical minimum, and dealing with different consequences. Eur Addict Res. 2001 Aug;7(3):138-47.
62. Gmel G, Shield KD, Frick H, Kehoe T, Rehm J. Estimating uncertainty of alcohol-
attributable fractions for infectious and chronic diseases. BMC Med Res Methodol. 2011;11:48.
63. Rehm J, Mathers C, Popova S, Thavorncharoensap M, Teerawattananon Y, Patra J.
Global burden of disease and injury and economic cost attributable to alcohol use and alcohol-use disorders. Lancet. 2009 Jun 27;373(9682):2223-33.
64. Shield K, Gmel G, Kehoe T, Dawson D, Grant B, Rehm J. Mortality and potential years of
life lost attributable to alcohol consumption in the United States in 2005 [conference paper]. 38th Annual Alcohol Epidemiology Symposium of the Kettil Bruun Society. Stavanger, Norway; 2012.
65. Shield KD, Taylor B, Kehoe T, Patra J, Rehm J. Mortality and potential years of life lost
attributable to alcohol consumption in Canada in 2005. BMC Public Health. 2012;12:91.

169
66. Jackson R, Broad J, Connor J, Wells S. Alcohol and ischaemic heart disease: probably no free lunch [commentary]. Lancet. 2005 Dec 3;366(9501):1911-2.
67. Chikritzhs T, Fillmore K, Stockwell T. A healthy dose of scepticism: four good reasons to
think again about protective effects of alcohol on coronary heart disease. Drug Alcohol Rev. 2009 Jul;28(4):441-4.
68. Beral V, Banks E, Reeves G. Evidence from randomised trials on the long-term effects of
hormone replacement therapy. Lancet. 2002 Sep 21;360(9337):942-4. 69. Petitti D. Commentary: hormone replacement therapy and coronary heart disease: four
lessons. Int J Epidemiol. 2004 Jun;33(3):461-3. 70. New Zealand Guidelines Group. New Zealand cardiovascular guidelines handbook: a
summary resource for primary care practitioners. 2nd Ed. Wellington: New Zealand Guidelines Group; 2009.
71. Anderson P, Chisholm D, Fuhr DC. Effectiveness and cost-effectiveness of policies and
programmes to reduce the harm caused by alcohol. Lancet. 2009 Jun 27;373(9682):2234-46.
72. Babor T, Caetano R, Casswell S, Edwards G, Giesbrecht N, Graham K, et al. Alcohol: no
ordinary commodity – research and public policy. Oxford: Oxford University Press; 2010. 73. World Health Organization. Global strategy to reduce the harmful use of alcohol. Geneva:
WHO; 2010. 74. Taylor B, Rehm J, Room R, Patra J, Bondy S. Determination of lifetime injury mortality
risk in Canada in 2002 by drinking amount per occasion and number of occasions. Am J Epidemiol. 2008 Nov 15;168(10):1119-25.
75. Cherpitel CJ. Alcohol and casualties: a comparison of emergency room and coroner data.
Alcohol Alcohol. 1994 Mar;29(2):211-8. 76. Cherpitel CJ. Alcohol in fatal and nonfatal injuries: a comparison of coroner and
emergency room data from the same county. Alcohol Clin Exp Res. 1996 Apr;20(2):338-42.
77. Rehm J, Shield K, Rehm M, Gmel G, Frick U. Alcohol consumption, alcohol dependence
and attributable burden of disease in Europe: potential gains from effective interventions for alcohol dependence. Toronto, ON: Centre for Addiction and Mental Health; 2012.
78. Laslett AM, Catalano P, Chikritzhs T, Dale C, Doran C, Ferris J, et al. The range and
magnitude of alcohol’s harm to others. Fitzroy, Vic: Turning Point Alcohol and Drug Centre; 2010.