Albany Port Authority Maintenance Dredging Program ... · Albany Port Authority Maintenance...
76
Albany Port Authority Maintenance Dredging Program Environmental Impact Assessment 812_01_002/2_Rev1 August 2014
-
Upload
nguyentruc -
Category
Documents
-
view
216 -
download
1
Transcript of Albany Port Authority Maintenance Dredging Program ... · Albany Port Authority Maintenance...

Albany Port Authority Maintenance Dredging Program Environmental Impact Assessment
812_01_002/2_Rev1
August 2014


P:\AlbanyPortAuthority\812_01AlbanyMaintDredge2013\002_EnvironmentalApprovals\Reports\ReportFolder_EIA\APAEIA_812_01_002_Rev1_20140822.docm
Albany Port Authority Maintenance Dredging Program
Environmental Impact Assessment
Prepared for
Albany Port Authority
Prepared by
BMT Oceanica Pty Ltd
August 2014
Report No. 812_01_002/2_Rev1


Client: Albany Port Authority
Document history
Distribution
Revision Author Recipients Organisation No. copies
& format Date
A J. Anderson L. Twomey BMT Oceanica 1 docm 29/05/2014
B J. Anderson J. Phillips BMT Oceanica 1 docm 30/05/2014
C J. Anderson R. Goetze Albany Port 1 pdf 30/05/2014
D J. Anderson R. Goetze Albany Port 1 pdf 13/06/2014
0 J. Anderson
R. Goetz
M. Ward
A. Sutton
C. Murphy
K. MeKeough
Albany Port
DoE
OEPA
Sea Dumping
Section DoE
Department of
Water
1 pdf
1 pdf
1 hardcopy
1 pdf
1 hardcopy
1 pdf
1 hardcopy
1 pdf
17/06/2014
1 J. Anderson
R. Geotze
M. Smith
P. Heyward
K. MeKeough
Albany Port
Sea dumping
section of DoE
OEPA
Department of
Water
1 pdf 20/08/2014
Review
Revision Reviewer Intent Date
A L. Twomey Technical review 29/05/2014
B J. Phillips Editorial review 30/05/2014
C R. Goetze Client review 11/06/2014
D R. Goetze Client review 13/06/2014
0 Office of the EPA
Department of Environment
Section 38
Sea Dumping Permit application
And EPBC referral
12/08/2014
1 R. Goetze Client review 22/08/2014
Quality Assurance
BMT Oceanica Pty Ltd has prepared this report in accordance with our Quality Management System,
certified to AS/NZS ISO 9001: 2008.
Status
This report is 'Draft' until approved for final release, as indicated below by inclusion of signatures from: (i) the author
and (ii) a Director of BMT Oceanica Pty Ltd or their authorised delegate. A Draft report may be issued for review with
intent to generate a 'Final' version, but must not be used for any other purpose.

Approved for final release:
Author Director (or delegate) Date: 17/06/2014 Date: 17/06/2014


Cover
Main image: Albany Port from the entrance channel (BMT Oceanica Pty Ltd)
Minor images: Vessel arriving at Albany Port (BMT Oceanica Pty Ltd)
Sarcoptilus grandis at site EC6 (BMT Oceanica Pty Ltd)
Disclaimer
This report has been prepared on behalf of and for the exclusive use of Albany Port Authority, and is subject to and
issued in accordance with the agreed terms and scope between Albany Port Authority and BMT Oceanica Pty Ltd.
BMT Oceanica Pty Ltd accepts no liability or responsibility for it in respect of any use of or reliance upon this report by
any third party.
Copying this report without prior written consent of Albany Port Authority or BMT Oceanica Pty Ltd is not permitted.
© Copyright 2014 BMT Oceanica Pty Ltd

BMT Oceanica: Albany Port Authority: Albany Port Authority Maintenance Dredging Program Environmental Impact Assessment i
Contents
Acronyms .................................................................................................................................... v
Executive Summary ................................................................................................................. vii
1. Introduction ....................................................................................................................... 1
1.1 Background ............................................................................................................ 1
1.2 Purpose of this document ..................................................................................... 4
2. Dredging Operation and Disposal .................................................................................... 5
2.1 Dredging operation ................................................................................................ 5
2.1.1 Alternative options ........................................................................................ 6
2.2 Area to be dredged ................................................................................................ 7
2.3 Disposal of dredge material .................................................................................. 7
3. Background ....................................................................................................................... 8
3.1 Previous dredging programs ................................................................................ 8
3.2 Previous sediment surveys ................................................................................... 9
3.2.1 Review of existing information on sediment contamination ........................... 9
3.3 Contaminants of concern .................................................................................... 10
3.3.1 Potential sources of sediment contamination ...............................................10
3.3.2 Disposal area ..............................................................................................10
4. Existing Environment ..................................................................................................... 11
4.1 Tide, currents and waves .................................................................................... 11
4.2 Bathymetry ........................................................................................................... 11
4.3 Marine fauna ......................................................................................................... 14
4.4 Benthic habitats ................................................................................................... 15
4.5 Invasive marine species ...................................................................................... 15
4.6 Offshore disposal area ........................................................................................ 16
5. Sediment Sampling and Design ..................................................................................... 17
5.1 Sampling locations .............................................................................................. 17
5.1.1 Harbour basin and entrance channel 2010 and 2014 ..................................17
5.1.2 Disposal area 2013 ......................................................................................19
5.2 Sediment collection methods ............................................................................. 20
5.3 QA/QC procedures ............................................................................................... 20
5.3.1 Field split samples .......................................................................................21
5.3.2 Triplicate samples ........................................................................................21
5.4 Laboratory analysis ............................................................................................. 21
5.4.1 Laboratory QA/QC .......................................................................................21
5.5 Data analysis ........................................................................................................ 22
5.5.1 Normalisation of organics data ....................................................................22
5.5.2 Computation of 95% upper confidence limit (UCL) of the mean ...................22
6. Nature of the Material to be Dredged ............................................................................. 23
6.1 Sediment surveys ................................................................................................ 23
6.2 Sample recovery .................................................................................................. 23
6.3 Sediment physical composition ......................................................................... 24

ii BMT Oceanica: Albany Port Authority: Albany Port Authority Maintenance Dredging Program Environmental Impact Assessment
6.3.1 Particle size ................................................................................................. 24
6.3.2 Settling velocity ........................................................................................... 26
6.4 Sediment chemistry ..............................................................................................27
6.4.1 Metals ......................................................................................................... 27
6.4.2 Nutrients ...................................................................................................... 29
6.4.3 Organics ...................................................................................................... 30
6.5 Survey QA/QC .......................................................................................................31
7. Key Potential Impacts ......................................................................................................32
7.1 Assessment of impact risks.................................................................................32
7.2 Turbidity ................................................................................................................36
7.2.1 Dredge plume .............................................................................................. 36
7.2.2 Offshore disposal ........................................................................................ 36
7.3 Mobilisation of contaminants ..............................................................................36
7.3.1 Release of metals ........................................................................................ 36
7.3.2 Release of nutrients .................................................................................... 37
7.3.3 Organics ...................................................................................................... 37
7.4 Hydrocarbons .......................................................................................................37
7.5 Noise ......................................................................................................................37
7.6 Marine fauna .........................................................................................................38
7.6.1 Threatened and migratory species .............................................................. 38
7.7 Introduced marine species...................................................................................40
7.8 Waste management ..............................................................................................40
7.9 Impacts to other users .........................................................................................40
7.10 Principles of environmental protection ...............................................................40
8. Environmental Monitoring and Management .................................................................42
8.1 Turbidity monitoring .............................................................................................42
8.1.1 Seagrass monitoring ................................................................................... 45
8.2 Marine fauna .........................................................................................................45
8.2.1 Cetacean impact avoidance ........................................................................ 45
8.2.2 Trained observers ....................................................................................... 46
8.3 Introduced marine pests ......................................................................................46
8.4 Reporting...............................................................................................................47
9. Stakeholder Consultation ................................................................................................48
10. References ........................................................................................................................49

BMT Oceanica: Albany Port Authority: Albany Port Authority Maintenance Dredging Program Environmental Impact Assessment iii
List of Figures
Figure 1.1 Albany Port harbour basin, entrance channel and disposal area ........................... 2
Figure 1.2 Albany Port difference to design depth bathymetry in 2013 ................................... 3
Figure 2.1 Trailer suction hopper dredge ................................................................................ 5
Figure 3.1 Albany Port Authority limit ..................................................................................... 8
Figure 4.1 Bathymetry of King George Sound and Princess Royal Harbour ......................... 12
Figure 4.2 Bathymetry in and around the Albany Port harbour basin and entrance
channel ............................................................................................................... 13
Figure 5.1 Sampling locations within the 2014 Albany Port maintenance dredging
footprint ............................................................................................................... 18
Figure 5.2 Sampling locations during 2013 within and near the proposed disposal area ...... 19
Figure 6.1 Penetration depth of cores at all sites .................................................................. 24
Figure 6.2 Cumulative sediment particle size distributions in Albany Port for 2010
samples ............................................................................................................... 25
Figure 6.3 Cumulative sediment particle size distributions in Albany Port for 2014
samples ............................................................................................................... 25
Figure 8.1 Turbidity monitoring sites for the maintenance dredging campaign ..................... 44
List of Tables
Table 2.1 Dredge areas and material volumes ...................................................................... 7
Table 3.1 Historical dredging projects at the Albany Port ...................................................... 9
Table 3.2 Sediment surveys within Albany Port and disposal areas (1999–2014) ................. 9
Table 4.1 Threatened and migratory marine species that may be present in the area ......... 14
Table 4.2 Invasive marine species which have been identified in Albany waters ................. 16
Table 5.1 Coordinates of sediment sites sampled in Albany Port ........................................ 17
Table 5.2 Coordinates of sites sampled for sediment in the Albany Port proposed
disposal area ....................................................................................................... 20
Table 5.3 Laboratories used for sediment analysis in the 2010, 2013 and 2014
sediment surveys ................................................................................................ 21
Table 6.1 Sediment sampling site labelling schemes .......................................................... 23
Table 6.2 Particle settling velocities and time for sediment samples ................................... 26
Table 6.3 95% upper confidence limit of the mean for total metal concentrations in
dredge area sediments (mg kg-1) ......................................................................... 27
Table 6.4 Disposal area sediments 80th percentiles for total metal concentrations
(mg kg-1) .............................................................................................................. 28
Table 6.5 95% upper confidence limit of the mean for elutriate metal concentrations
(mg L-1)................................................................................................................ 28
Table 6.6 95% upper confidence limit of the mean for bioavailable concentrations in
dredge area sediments (mg kg-1) ......................................................................... 29
Table 6.7 Total nutrient concentrations of nutrients in sediments ........................................ 29
Table 6.8 95% upper confidence limit of mean elutriate nutrient concentrations (µg L-1) ..... 30
Table 6.9 95% upper confidence limit (UCL) of standardised (1% TOC) mean
concentrations of contaminants in sediments ...................................................... 31
Table 7.1 Risk assessment: likelihood table ........................................................................ 33
Table 7.2 Risk assessment: consequence table.................................................................. 33
Table 7.3 Risk matrix .......................................................................................................... 33
Table 7.4 Risk assessment for Albany Port maintenance dredging proposal ...................... 34
Table 7.5 Significant impact criteria for threatened and migratory species .......................... 38

iv BMT Oceanica: Albany Port Authority: Albany Port Authority Maintenance Dredging Program Environmental Impact Assessment
Table 7.6 Principles of environmental protection and their application to the proposal
program ...............................................................................................................41
Table 8.1 Secchi disk monitoring sites .................................................................................43
List of Appendices
Appendix A EPA Referral Form
Appendix B EPBC Referral Form
Appendix C Sea Dumping Permit Application

BMT Oceanica: Albany Port Authority: Albany Port Authority Maintenance Dredging Program Environmental Impact Assessment v
Acronyms
ABA Acid base accounting
ANC Acid neutralizing capacity
APA Albany Port Authority
AQIS Australian Quarantine Inspection Service
ASS Acid sulfate soils
BTEX benzene, toluene, ethylbenzene, and xylenes
DEC Western Australian Department of Environment and Conservation
DEWHA Commonwealth Department of Environment, Water, Heritage and the Arts
DoE Commonwealth Department of the Environment
DoF Western Australian Department of Fisheries
DoT Western Australian Department of Transport
DoW Western Australian Department of Water
DSEWPaC Commonwealth Department of Sustainability, Environment, Water, Population
and Communities
EIA Environmental impact assessment
EIL Environmental Investigation Level
EPA Environmental Protection Authority
EPBC Environment Protection and Biodiversity Conservation
FF Fineness factor
HIL Health Investigation Level
LEPA Low ecological protection area
LoR Limit of reporting
LWOST Low Water of Ordinary Spring Tide
ML Megaliter (106 L)
NAGD National Assessment Guidelines for Dredging
NRM Natural resource management
OC Organic carbon
OEPA Western Australian Office of the Environmental Protection Authority
PAH Polycyclic aromatic hydrocarbon
PASS Potential acid sulfate sediments
pH Logarithmic scale of hydrogen ions in solution
pHKCl pH measurement of solution exacted with potassium chloride
PSD Particle size distribution
QA/QC Quality assurance and quality control
RPD Relative Percent Difference
RSD Relative Standard Deviation
SNAS Net acid soluble sulphur
TAA Titratable actual acidity
TBT Tributyltin
TKN Total Kjeldahl nitrogen
TN Total nitrogen
TOC Total organic carbon
TP Total phosphorus
TPH Total petroleum hydrocarbon
TSHD Trailer suction hopper dredge
UCL Upper confidence limits
UWA University of Western Australia
WA Western Australia


BMT Oceanica: Albany Port Authority: Albany Port Authority Maintenance Dredging Program Environmental Impact Assessment vii
Executive Summary
Albany Port Authority (APA) proposes to undertake maintenance dredging to remove high spots
within the Port of Albany entrance channel and harbour basin, to reinstate the declared
navigation depths. The APA proposes to dispose of approximately 82,400 m3 of dredged
material to an offshore disposal area. The type of dredging plant yet to be determined, but it is
anticipated that a trailer suction hopper dredge will be used to carry out the works.
Maintenance dredging was initially proposed to be completed in 2010, but was delayed due to
potential capital dredging works, which have yet to commence. As capital dredging works have
been postponed, maintenance dredging needs to be completed as soon as possible. Sediment
sampling surveys were completed during January 2010 and January 2014. Additional sampling
in and around the disposal area was also completed in 2013. Sediments were sampled to
develop an understanding of the concentrations of potential contaminants of concern in the
sediments to be dredged and to develop a strategy for disposal of the dredged sediments.
Sediments were analysed for:
physical composition (particle size and settling velocity)
total, elutriate and bioavailable metals
organics (hydrocarbons, and total and elutriate tributyltin).
Albany Port Authority proposes to dispose of 82,400 m3 of dredged material at an offshore
disposal area (G7). A number of management and monitoring measures have been proposed to
reduce the risk of potential impacts due to:
turbidity
mobilisation of contaminants and nutrients
hydrocarbon spills
noise
vessel movements
threatened or migratory species
introduced marine species
waste management
impacts to other users
exposure to contaminants.
Relevant stakeholders have been consulted to ensure they are aware of the project. The
outcome of this consultation has informed the document.
This document presents an Environmental Impact Assessment (EIA) that serves three purposes:
To support a referral to the Western Australian Office of the Environmental Protection
Authority in accordance with Section 38(1) of the Environmental Protection Act 1986, for a
decision on whether formal assessment is required.
To be submitted to the Commonwealth Department of the Environment (DoE) in accordance
with the Environment Protection and Biodiversity Conservation Act 1999 for a decision on
whether formal assessment is required.
To support an application to the DoE for a sea dumping permit, in accordance with the
Environmental Protection (Sea Dumping) Act 1981.


BMT Oceanica: Albany Port Authority: Albany Port Authority Maintenance Dredging Program Environmental Impact Assessment 1
1. Introduction
1.1 Background
The Port of Albany is on the southern coast of Western Australia with infrastructure in Princess
Royal Harbour and King George Sound (Figure 1.1). The port is an industrial port operated by
Albany Port Authority (APA) under the Port Authorities Act 1999. The regional port services the
City of Albany and the Great Southern region of Western Australia. The main cargoes handled
by the port include exported bulk materials (grain, silica sand and woodchips) and imported
fertiliser and fuel.
The Port of Albany is currently dredged to -12.2 m LWOST (Low Water of Ordinary Spring Tide)
in parts of the entrance channel and berthing areas. The harbour basin is up to 550 m wide, with
a navigable section of entrance channel 3.22 km long and 145 m wide. In August 2013, APA
received the latest hydrographic survey results from the Western Australian Department for
Planning and Infrastructure, obtained using multi-beam sidescan sonar technology. The survey
identified a number of high spots that have accumulated within APA’s marine infrastructure areas
(Figure 1.2), reducing the port’s declared channel and berthing area depths and thus reducing the
safety margins required by the Harbour Master and APA’s Marine Pilots.
Albany Port Authority proposes to undertake maintenance dredging to remove these high spots
as a matter of urgency and to reinstate the design depths as soon as possible. The Port
proposes to dispose of the dredged material at an offshore disposal area (G7) (Figure 1.1).
A sediment sampling and analysis plan (SAP) within the entrance channel and the berth areas
was previously prepared and submitted to the Commonwealth Department of the Environment
(DoE) (formerly Department of Environment, Water, Heritage and the Arts; DEWHA) in
November 2009 (Oceanica 2009). The sediments of the entrance channel and berth areas were
subsequently sampled and analysed for physicochemical properties, with results presented in the
SAP implementation report (Oceanica 2010a). The report was submitted on 3 June 2010 in
support of a sea dumping permit application (SD2010/1702), but was withdrawn in
December 2013 on recommendation from the DoE. An Environmental Impact Assessment (EIA)
document (Oceanica 2010b) in support of the EPBC referral (EPBC: 2010/5527) was submitted
on the same date to the DEWHA, and then withdrawn on 21 October 2013. An application for a
dredging and/or reclamation license was submitted to the Western Australian Department of
Water (DoW) on 3 June 2010, which was subsequently referred to the Western Australian
Environmental Protection Authority (EPA) (document reference A312804) as the decision making
authority.
Currently, a new sea dumping permit application has been submitted to the DoE, which includes
all sampling from 2010, sampling of the disposal area in 2013, and sampling of sediments in the
harbour basin and entrance channel in 2014. Data from the initial SAP implementation report
(Oceanica 2010a) have been combined with the results from the 2014 sampling regime to
develop a single SAP implementation report (BMT Oceanica 2014). The original EIA document
(Oceanica 2010b) has been revised to incorporate all relevant data and to update and improve
the assessment of potential impacts, the monitoring of the environment and the subsequent
management of the dredge practices.

2 BMT Oceanica: Albany Port Authority: Albany Port Authority Maintenance Dredging Program Environmental Impact Assessment
Figure 1.1 Albany Port harbour basin, entrance channel and disposal area

BMT Oceanica: Albany Port Authority: Albany Port Authority Maintenance Dredging Program Environmental Impact Assessment 3
Figure 1.2 Albany Port difference to design depth bathymetry in 2013

4 BMT Oceanica: Albany Port Authority: Albany Port Authority Maintenance Dredging Program Environmental Impact Assessment
1.2 Purpose of this document
This document presents an EIA that serves three purposes:
1. To support a referral (Appendix A) to the Western Australian Office of the Environmental
Protection Authority (OEPA) in accordance with Section 38(1) of the Western Australian
Environmental Protection Act 1986 for a decision on whether formal assessment is required.
2. To be submitted in accordance with the Environment Protection and Biodiversity
Conservation Act 1999 (EPBC Act), whereby the proposed maintenance dredging is referred
to the Commonwealth Department of the Environment (DoE) for a decision on whether formal
assessment is required. The EPBC referral form has been completed and is attached as
Appendix B.
3. To support an application for a sea dumping permit (Appendix C). The EIA along with the
Sampling and Analysis Plan (SAP) (Oceanica 2009; BMT Oceanica 2013) and the SAP
Implementation Report (BMT Oceanica 2014) is submitted to the DoE, in accordance with the
Environmental Protection (Sea Dumping) Act 1981.
4. In addition to the above listed purposes, this document will also accompany an ‘application for
a licence to carry out dredging’ to be submitted to the Western Australian Department of
Water for approval under the Waterways Conservation Act 1976.

BMT Oceanica: Albany Port Authority: Albany Port Authority Maintenance Dredging Program Environmental Impact Assessment 5
2. Dredging Operation and Disposal
2.1 Dredging operation
The type of dredging plant has yet to be determined, but it is anticipated that the Albany Port
maintenance dredging works will use a trailer suction hopper dredge (TSHD). A TSHD is a self-
propelled ship with a hopper for the temporary storage of dredged material (Figure 2.1). It is a
highly mobile vessel that uses a trailing suction pipe(s) to remove material from the seabed and is
generally defined in terms of its 'hopper capacity', that is the maximum volume of water/sediment
mix that can be contained in the hopper. The hopper capacity of the TSHD that will be used for
the Albany Port maintenance dredging is expected to be in the range of 1000–3000 m3.
Source: Bray (2008)
Figure 2.1 Trailer suction hopper dredge
A TSHD is fitted with one or two drag arms that can be lowered over the side to the seabed. The
end of the drag arm is fitted with a drag-head that can be fitted with ripping teeth and high
pressure water jets as required. The dredge fills the hopper by travelling at low speeds (1–
2 knots) with the drag-head on the seabed. A vacuum is created at the drag-head by the dredge
pumps. The vacuum entrains sediment and water off the seabed, which is then transported up
the drag arm as slurry. The slurry travels through the dredge pump and is discharged into the
hopper.
In the hopper, the sediment settles out from the water and is retained for disposal. Once the
hopper reaches capacity with the sediment/water slurry, it is possible to overflow the surface
water in the hopper to allow loading of sediment to continue. While draining off the water, fines
that have not settled out will also be discharged in the overflow mix. The concentration of fines
leaving the hopper via the overflow depends on the composition of the material being dredged
and the 'retention time' in the hopper. Thus, the concentration of fines in the overflow will
increase as the volume of solids in the hopper increases (and free water in the hopper reduces).
Filling of the hopper ceases either when the dredge reaches its maximum load, or when the
concentration of sediment (fines) contained in the overflow reaches an unacceptable limit. This
limit is usually dictated by the economics of the operation or environmental constraints placed on
the dredging. In some scenarios no overflow at all is permitted, such as when dredging
contaminated sediments or when dredging adjacent to areas of very high environmental
sensitivity and/or value.

6 BMT Oceanica: Albany Port Authority: Albany Port Authority Maintenance Dredging Program Environmental Impact Assessment
The total volume of solids that can be transported during each trip depends on the particle size
and density of the material being dredged, and the limits on the fines in the overflow. During the
Albany Port maintenance dredging it is expected that the amount of solids transported each trip in
the hopper will be ~40% of the hopper volume when disposing offshore. Disposal to the offshore
disposal area will be via bottom dumping.
The typical sequence for a dredging cycle for the Albany Port can be summarised as:
dredge travels to dredging area with an empty hopper
the drag arm(s) are lowered to the seafloor, dredging commences to load the hopper – no
overflow
dredging continues, hopper full and overflow of water and fine sediment from hopper
commences
dredging ceases – hopper full. The time to fill the hopper depends on the material being
dredged but is assumed for Albany Port it will be ~3 hours when disposing offshore (with
overflow). Drag arm(s) raised and brought onboard
material discharged via bottom dumping to the offshore disposal area.
The maintenance dredging is planned for the earliest dredge availability. Conservatively,
assuming that a small dredge will be used (hopper capacity 1000–3000 m3), the dredging works
will take 1–2 weeks to complete with dredging occurring continuously (with allowance for up to
3 weeks in the event of adverse weather conditions). The typical cycle will be ~3 hours when
dumping at the offshore disposal area.
2.1.1 Alternative options
Options considered for the management of the harbour depths maintenance dredging were:
No action
Reuse for beach renourishment
Land disposal.
No action
Taking no action or to delay the maintenance works until the Port is unable to accommodate
vessels was not considered feasible as the decreasing drafts within the harbour basin and in the
channel would restrict ship movements and reduce the safety and operability of the Port.
Delaying the dredging was not considered to be in keeping with APA's charter as a responsible
corporate citizen and carries unacceptable risks to the community, the Port’s customers, the
regional economy and the environment.
Beach renourishment
Reusing the dredge material for beach renourishment at Middleton Beach was determined not
feasible due to the following:
considered excessively costly due to transport costs
the material grade may not be adequate for re-nourishment
lack of hydrodynamic knowledge to make an informed decision
disposal material may be visually unappealing for beach re-nourishment.
A detailed cost analysis was not necessary as the approach to the area is too shallow for the
dredge to be able to 'rainbow' discharge directly. This results in increased discharge time due to
connecting up to discharge pipeline and increased discharge time which would extend the length
of the dredging campaign significantly. Additional costs included the cost of mobilisation of a

BMT Oceanica: Albany Port Authority: Albany Port Authority Maintenance Dredging Program Environmental Impact Assessment 7
floating pipeline (to reach required area), the construction of possible temporary bunds on beach,
a potential requirement for earthmoving equipment for shifting and maintaining material during
process.
The material grade is not well known for its adequacy for beach renourishment. The sediment
analysis undertaken was for contamination assessment under the NAGD as opposed to the
engineering suitability of the material. Given this, the material grade for renourishment is largely
unknown. This coupled with a lack of understanding of the hydrodynamic characteristics along
Middleton Beach made re-nourishment an unlikely component.
The disposal material may be visually unappealing as the sediment in Princess Royal Harbour
contained a greater percentage of organic matter and was a darker colour than the sands at
Middleton Beach. The visual impact of these sediments being applied in conjunction with the
discharge process may have resulted in being aesthetically displeasing to the residents and large
number of tourist who visit this area during the possible dredging period.
Land disposal
Land disposal options were explored, but determined to be unnecessary due to the short duration
of the dredging campaign. All harbour sediments which are proposed to be dredged pass all
criteria for sea disposal.
2.2 Area to be dredged
Reinstating the design level of Albany Port requires the removal of ~82,400 m3 of material
(Table 2.1), which involves removing sediment from 15 dredge areas (Figure 1.2).
Table 2.1 Dredge areas and material volumes
Dredge area Estimated design volume (m3)
Estimated design volume and over dredge
volume (m3)
B1 220 3320
B2 0 220
B3 0 190
C1 0 800
C3 160 3020
C4 0 270
C5 0 150
C6 150 860
C7 11,310 16,050
C8 0 1620
D1 430 2210
D2 50 2800
D3 50 2760
D4 0 670
E1 29,520 47,460
Total 46,930 91,250
2.3 Disposal of dredge material
Dredge materials from areas B1–3, C1, C3–8, D1–4 and E1 (total volume 82,400 m3) will
disposed of at a single disposal area (G7) in King George Sound. This disposal area has not
previously been used, but has been established for the proposed Albany Port Expansion Project
(SKM 2007).

8 BMT Oceanica: Albany Port Authority: Albany Port Authority Maintenance Dredging Program Environmental Impact Assessment
3. Background
Albany Port Authority waters encompass Princess Royal Harbour and extend out as far as
Michaelmas and Breaksea Islands on the western boundary of King George Sound (Figure 3.1).
Figure 3.1 Albany Port Authority limit
3.1 Previous dredging programs
The Port of Albany was constructed in 1893 in the vicinity of present day Port jetty. It has
developed to its current size through a number of dredging and reclamation programs spanning
120 years (Table 3.1).

BMT Oceanica: Albany Port Authority: Albany Port Authority Maintenance Dredging Program Environmental Impact Assessment 9
Table 3.1 Historical dredging projects at the Albany Port
Time Dredge volume
(estimated m3)
Disposal method Reason for action
1893 800,000 Ocean disposal in Middleton Bay Initial construction
1901–1903 Unknown Unknown Deepen entrance channel and
extend harbour basin
1922–1923 Unknown (22 ha area) Unknown Deepen harbour basin
1951–1952 Unknown (39 ha area) Land disposal Deepen harbour basin and
reclamation
1967 Unknown
Majority land disposal
Limited ocean disposal within
Princess Royal Harbour
Extend reclaimed land and
increase harbour basin area
1978–1979 Unknown (>50 ha) Land disposal
Deepen entrance channel and
harbour basin. Extend reclaimed
area
1985 100–200,000
Ocean disposal
Material used for beach
renourishment at Middleton beach
Maintenance dredging to remove
1984 storm deposits.
2000–2001 470,000 Land disposal Construction of berths 5 and 6
2009 24,000 Land disposal Maintenance dredging to ensure
safe navigation
Source: ATA Environmental (2000)
Historically, very little dredged material has been disposed of via ocean disposal as it has been
utilised for land reclamation in the development of the Port.
3.2 Previous sediment surveys
In the past 15 years, multiple surveys have been conducted to assess sediment properties for
dredging campaigns (Table 3.2).
Table 3.2 Sediment surveys within Albany Port and disposal areas (1999–2014)
Date Related dredging campaign Undertaken by Time dredging completed
1999/2000 Development of Berth 5 and 6 Alan Tingay & Associates 2000/2001
2005 Grange/Albany Port Expansion SKM Not completed
2010 Current maintenance dredging Oceanica Currently proposed
2011
Grange/Albany Port Expansion
(not within current proposed
dredge footprint)
Bastyan & Associates Not completed
2013 Current maintenance dredging
(Disposal area survey) Bastyan & Associates Currently proposed
2014 Current maintenance dredging BMT Oceanica Currently proposed
3.2.1 Review of existing information on sediment contamination
A detailed review of relevant sediment data available for Albany Port is presented in the
Sediment Sampling and Analysis Plans (Oceanica 2009; BMT Oceanica 2013). Only data from
the past 5 years have been used to assess the feasibility for ocean disposal.

10 BMT Oceanica: Albany Port Authority: Albany Port Authority Maintenance Dredging Program Environmental Impact Assessment
3.3 Contaminants of concern
3.3.1 Potential sources of sediment contamination
The Public Environmental Review for the Albany Port Expansion Project (Ecologia 2007)
described the main sources of pollution in Princess Royal Harbour as:
“…industrial effluents, agricultural and urban runoff. The Albany townsite occupies
approximately 235 ha of the Princess Royal Harbour catchment and the steep topography
and shallow topsoil results in a large proportion of the urban runoff flowing directly into the
harbour. The volume of runoff is estimated to be 6140 ML or 7% of the total volume of the
Harbour, with the actual amount entering the harbour each year dependant on the variations
in rainfall, soils moisture content and other factors (ATA Environmental 2000).”
3.3.2 Disposal area
The proposed disposal area for this project is an area of 900 m radius, near the boundaries of the
Port waters. The disposal area was authorised for sea dumping for the Grange/Albany Port
Expansion project (Sea Dumping Permit No. SD2006/0035 dated 11 June 2010). The disposal
area is 35–44 m chart datum. Data has been collected on the sediment physical and chemical
properties of the area in 2005 (SKM 2007) and 2013 surveys. The area is dominated by fine to
medium sands with very low concentrations of total organic carbon and metals. The area has
never been used for disposal of dredge material and it is believed to have no sources of
contamination.

BMT Oceanica: Albany Port Authority: Albany Port Authority Maintenance Dredging Program Environmental Impact Assessment 11
4. Existing Environment
4.1 Tide, currents and waves
The hydrodynamic characteristics of the area are described in the Albany Port Expansion
Proposal Public Environmental Review (Ecologia 2007):
“The dominant influence on the circulation in the waters of King George Sound and Princess
Royal Harbour is the local wind. Tides are relatively weak at Albany and vary from diurnal to
semi-diurnal throughout the year with a spring tidal range of approximately 1.1 m. Water
levels are also influenced by the weather systems, with wind driven setup resulting from
sustained winds in King George Sound that at times can be readily transmitted into Princess
Royal Harbour.
Modelling conducted by Mills and Brady (1985) of wind driven water circulation in Princess
Royal Harbour indicated that west to north-west winds in winter generate predominantly anti-
clockwise circulation. During summer, however, winds from the south to south-east sector
generate a predominantly anti-clockwise circulation in King George Sound, and winds from
the east to north-east sector generate a predominantly clockwise circulation in King George
Sound (GEMS 2007).
The broad high latitude westerly flow over the Southern and Indian Oceans produces a highly
energetic wave climate at the south-west corner of the continent. However, the south-
easterly to easterly aspect of King George Sound provides a significant level of protection to
these waves. During winter, sustained strong westerly winds generate what appears to be a
shelf wave along the continental shelf outside King George Sound resulting in current speeds
over 1 knot at depths of 40 m (GEMS 2007)."
4.2 Bathymetry
The current bathymetry difference from design depth of the Princess Royal Harbour and shipping
channels is shown in Figure 1.2. The Albany Port basin and entrance channel is currently
dredged to a depth of 12.2 m LWOST with water depths within the harbour becoming
progressively shallower in the southern and western areas of the Harbour due to a wide sandy
intertidal shelf <2 m deep. The bathymetry of King George Sound is highly variable and relatively
shallow (5–40 m) (Figure 4.1). The areas immediately surrounding the harbour basin are shallow
(3–11 m) (Figure 4.2).

12 BMT Oceanica: Albany Port Authority: Albany Port Authority Maintenance Dredging Program Environmental Impact Assessment
Figure 4.1 Bathymetry of King George Sound and Princess Royal Harbour

BMT Oceanica: Albany Port Authority: Albany Port Authority Maintenance Dredging Program Environmental Impact Assessment 13
Figure 4.2 Bathymetry in and around the Albany Port harbour basin and entrance
channel

14 BMT Oceanica: Albany Port Authority: Albany Port Authority Maintenance Dredging Program Environmental Impact Assessment
The sediment within the existing shipping channel has been described as consisting of
unconsolidated material to ~8–10 m depth into the seabed with a particle size composition of
medium to coarse silica sand and some fine silt (SKM 2007). Diver observations (JFA 2005)
described the material from the existing harbour and channel as a dark grey, fine to medium
grained sand with minimal organic material and the material offshore as clean white sand.
Probe and sidescan surveys (Fugro 2005 in Ecologia 2007, JFA 2005,) were done as part of the
EIA for the Albany Port Expansion Project and found that consolidated material does not
generally occur at a shallower depth than the proposed dredge depth for the port expansion.
Probe refusal occurred in the proposed Berth 7 location and south of Gio Batta Patch (JFA 2005)
but subsequent seismic reflection surveys did not identify any limestone or granitic bedrock
(Fugro 2005 in Ecologia 2007).
The high spots proposed to be dredged during the maintenance dredge are all soft sediments
that have accumulated over time.
4.3 Marine fauna
The coastal waters near Albany provide habitat, breeding grounds and migratory routes for
cetaceans and other marine fauna, including the southern right whale (Eubalaena australis),
humpback whale (Megaptera novaeangliae), bottlenose dolphin (Tursiops truncates), common
dolphin (Delphinus delphis), great white shark (Carcharodon carcharias) and Australian sea-lion
(Neophoca cinerea) (DoE 2014, Ecologia 2008). The southern right whale, humpback whale,
Australian sea-lion and great white shark are protected under the Environment Protection and
Biodiversity Conservation Act 1999 (EPBC Act) as threatened and/or migratory species. A full list
of species that may occur in the Albany region, and which are protected under the EPBC Act, is
provided in Table 4.1.
Table 4.1 Threatened and migratory marine species that may be present in the area
Species Status Type of presence
Threatened species
Blue whale (Balaenoptera musculus) Endangered Species or species habitat may occur within area
Southern right whale (Eubalaena australis) Endangered Breeding known to occur within area
Humpback whale (Megaptera novaeangliae) Vulnerable Species or species habitat likely to occur within area
Australian sea-lion (Neophoca cinerea) Vulnerable Breeding known to occur within area
Loggerhead turtle (Caretta caretta) Endangered Species or species habitat likely to occur within area
Green turtle (Chelonia mydas) Vulnerable Species or species habitat likely to occur within area
Grey nurse shark (Carcharias taurus) Vulnerable Species or species habitat may occur within area
Great white shark (Carcharodon carcharias) Vulnerable Species or species habitat known to occur within
area
School shark (Galeorhinus galeus) Conservation
Dependent Species or species habitat may occur within area
Whale shark (Rhincodon typus) Vulnerable Species or species habitat may occur within area
Migratory species
Bryde’s whale (Balaenoptera edeni) Migratory Species or species habitat may occur within area
Blue whale (Balaenoptera musculus) Migratory Species or species habitat may occur within area
Pygmy right whale (Caperea marginata) Migratory Species or species habitat may occur within area
Southern right whale (Eubalaena australis) Migratory Breeding known to occur within area
Dusky dolphin (Lagenorhynchus obscures) Migratory Species or species habitat may occur within area
Humpback whale (Megaptera novaeangliae) Migratory Species or species habitat likely to occur within area
Killer whale (Orcinus orca) Migratory Species or species habitat may occur within area
Loggerhead turtle (Caretta caretta) Migratory Species or species habitat likely to occur within area
Green turtle (Chelonia mydas) Migratory Species or species habitat likely to occur within area
Great white shark (Carcharodon carcharias) Migratory Species or species habitat known to occur within
area
Whale shark (Rhincodon typus) Migratory Species or species habitat may occur within area

BMT Oceanica: Albany Port Authority: Albany Port Authority Maintenance Dredging Program Environmental Impact Assessment 15
4.4 Benthic habitats
Benthic habitat types in the region include seagrass meadows on sandy substrate in both
Princess Royal Harbour (PRH) and King George Sound, and algal-dominated limestone reef in
central King George Sound (notably Gio Batta Patch and Michaelmas Reef) and on the subtidal
areas of rocky shoreline and islands in King George Sound. The maintenance dredging
proposed in this document is not adjacent to any reefs, but the harbour basin and portions of the
entrance channel are adjacent to seagrass meadows.
Seagrass meadows have an important role in providing habitat and food for marine organisms
and dispersing wave energy. Seagrasses in PRH are dominated by Posidonia australis and
P. sinuosa (Ecologia 2007). Both species of Amphibolis (griffithii and antarctica) are also present
throughout King George Sound, while P. kirkmanii occurs along the north-eastern shores
(MPRSWG 1994). P. robertsoniae is common along the edges and inside of blowouts
(MPRSWG 1994) and P.coriacea has been identified near Bramble Point (DoW 2008).
Extensive historical loss of seagrass has occurred in PRH and was first reported in 1986
(EPA 1990). Between 1962 (when the seagrass meadows were considered to be in pristine
condition) and 1984, 66% of the seagrass meadows in PRH were lost. By 1988 the loss had
increased to 90% (EPA 1990). A two-year intensive ‘Albany Harbours’ study coordinated by the
EPA in 1988–89 concluded that the major cause of seagrass loss was attributable to light
reduction from macroalgae smothering, which was driven by excessive nutrient loads. The study
also concluded that it was unlikely that luxuriant Posidonia meadows would ever be re-
established, but that there could be recovery in remaining areas and that bare areas could be
colonised by other species (EPA 1990).
Water quality improvements and a reduction in macroalgal accumulations in PRH since the
1980s have enabled a gradual recovery of seagrass meadows. Seagrass in PRH was mapped
during a collaborative exercise between LandCorp and the DoW in 2006. This study showed that
the extent of seagrass had increased considerably since the 1980s, particularly the areas of
dense seagrass with 45% cover or more (Strategen 2008).
4.5 Invasive marine species
Of the 60 known species of marine species believed to be introduced by humans in Western
Australia, 25 of these had been identified within the Albany area (Huisman et al. 2008). An
extensive survey in 2007 for introduced marine species within Albany Port and Oyster Harbour
identified additional species, bringing the total to 29 (McDonald et al. 2009; Table 4.2). The
current distribution and density of the 29 recorded introduced marine species within Port waters is
unknown.

16 BMT Oceanica: Albany Port Authority: Albany Port Authority Maintenance Dredging Program Environmental Impact Assessment
Table 4.2 Invasive marine species which have been identified in Albany waters
Group Scientific Name Common Name
Algae
Elachista orbicularis Brown algae
Stictyosiphon soriferus Brown algae
Codium fragile ssp. fragile Dead man’s fingers/Oyster thief
Grateloupia imbricata Forked grateloup’s weed
Ulva fasciata Sea lettuce
Bryozoans
Bugula flabellata Bryozoan
Bugula neritina Bryozoan
Bugula stolonifera Bryozoan
Cryptosula pallasiana Bryozoan
Schizoporella errata Bryozoan
Schizoporella unicornis Single horn bryozoan
Watersipora arcuata Bryozoan
Watersipora subtorquata Bryozoan
Crustaceans Amphibalanus amphitrite Striped barnacle
Tesseropora rosea Rose barnacle
Hydroids
Antenella secundaria Knotted thread hydroid
Eudendrium carneum Red stick hydroid
Halecium delicatulum Delicate hydroid
Obelia dichotoma Sea thread hydroid
Sarsia eximia Hydroid
Molluscs
Mytilus edulis ssp. planulatus Blue mussel
Ostrea edulis European flat oyster
Polycera hedgpethi Hedgpeth’s dorid
Polychaetes Sabella spallanzanii European fanworm
Ascidians
Ascidiella aspersa European sea squirt
Botryllus schlosseri Star ascidian/Golden star tunicate
Ciona intestinalis Solitary ascidian
Styela clava Leathery sea squirt/Rough sea squirt
/Club tunicate/Asian tunicate
Styela plicata Solitary ascidian
4.6 Offshore disposal area
The offshore disposal area (G7) is south of Breaksea Island, near the western boundary of the
Ports water limit of King George Sound. Water depths are 35–44 m chart datum. The disposal
area has never been used for dredge material disposal.
The disposal area is described as a flat seabed with very sparsely distributed epifauna
(SKM 2007). The epifauna observed were:
sponges
sea pens (Sarcoptilus grandis)
colonial ascidian (Sycozoa sp.)
southern blue-spotted flathead (Platycephalus speculator)
sand dollar.
No rare or endangered epifauna were observed and the most numerous biota were small, oval
sponges (Ecologia 2007).

BMT Oceanica: Albany Port Authority: Albany Port Authority Maintenance Dredging Program Environmental Impact Assessment 17
5. Sediment Sampling and Design
5.1 Sampling locations
5.1.1 Harbour basin and entrance channel 2010 and 2014
Sediments in the harbour basin and entrance channel were sampled as per the relevant SAPs
(Oceanica 2009; BMT Oceanica 2013), on 4–5 January 2010 and on 28 January 2014. The
harbour has been designated into 15 individual dredge areas for the 2014 maintenance dredging
(Figure 1.2). Dredge volumes per dredge area are shown in Section 2.2. The sampling sites
within these dredge areas are shown in Figure 5.1 and coordinates of the 25 sampling locations
are shown in Table 5.1. Sample locations A'1, B2, C1, are no longer in the current (2014)
dredging footprint, but the data are presented as they assist in understanding the sediment
characteristics in each area. A total of 47 sediment samples were taken across the 25 sites.
Table 5.1 Coordinates of sediment sites sampled in Albany Port
Survey
date
Harbour
section Dredging area
Sampling
location
Target
depth (m) Easting Northing
2010
Entrance
Channel
D2 (A) A1 1.0 584809 6122584
E1 (A) A2 1.0 584982 6122627
(A’) A'1 1.0 583903 6122429
D3 (A’) A'2 1.0 584728 6122689
Harbour
Basin
C7 (B) B1 1.0 582869 6122145
(B) B2 1.0 582973 6122210
C5 (C) C1 0.5 582584 6121897
C4 (D) D1 0.5 582273 6122099
C3 (E) E1 1.0 582012 6122305
E2 1.0 581979 6122348
C3 (F) F1 0.5 581932 6122401
B1-3 (I) I1 1.0 581305 6122764
I2 1.0 581223 6122668
2014
C1, C8 BA1 0.5 581946 6122019
C6 BA2 0.5 582474 6122146
C7
BA3 1.0 582617 6122157
BA4 2.0 582640 6122115
BA5 2.0 582917 6122165
Entrance
Channel
D1 EC1 0.5 583514 6122149
EC2 1.0 583673 6122226
E1 EC3 1.5 584408 6122452
D3 EC4 0.5 584723 6122690
D2 EC5 0.5 584824 6122611
E1 EC6 1.5 584979 6122626
D4 EC7 0.5 585645 6122840
Notes:
1. Coordinates are in GDA94
2. Dredging areas in () denote 2009 dredging footprint sections (Oceanica 2009)

18 BMT Oceanica: Albany Port Authority: Albany Port Authority Maintenance Dredging Program Environmental Impact Assessment
Figure 5.1 Sampling locations within the 2014 Albany Port maintenance dredging
footprint

BMT Oceanica: Albany Port Authority: Albany Port Authority Maintenance Dredging Program Environmental Impact Assessment 19
5.1.2 Disposal area 2013
Sediments were collected at six sites (DS1–6; Figure 5.2, Table 5.2) within and near the disposal
area by Bastyan & Associates in 2013. Samples were collected using a Van Veen grab to
retrieve surface sediments from 35–44 m water depths.
Figure 5.2 Sampling locations during 2013 within and near the proposed disposal area

20 BMT Oceanica: Albany Port Authority: Albany Port Authority Maintenance Dredging Program Environmental Impact Assessment
Table 5.2 Coordinates of sites sampled for sediment in the Albany Port proposed
disposal area
Site Easting Northing
DS1 593144 6118044
DS2 593670 6117787
DS3 593764 6118289
DS4 593429 6118428
DS5 593087 6117642
DS6 593977 6118030
Note:
1. Coordinates are in GDA94
5.2 Sediment collection methods
Within the harbour basin and entrance channel, sediments were collected using a core (PVC pipe
with an internal diameter of 50 mm) hammered into the sediment by a diver until the target depth
was reached or until corer refusal occurred. When the corer reached the maximum depth, a
rubber bung was inserted in the end of the core. The core was slowly pulled from the sediment.
The vacuum created in the core allowed the sediment to be retained. When the bottom opening
was just below the seabed surface, a rubber bung was inserted to hold the sediment in place
during ascent.
At the surface, water was carefully poured out of the top, ensuring no sediment was lost. The
sediment was extracted from the PVC pipe onto a core tray. Once the sediment was extracted,
the core was photographed, length recorded and sediment characteristics noted into the
sediment core log (BMT Oceanica 2014). Sediment cores longer than 0.5 m, were sampled in 0–
0.5 m, 0.5–1 m, 1–1.5 m and 1.5–2.0 m depth increments.
All sampling gear was cleaned with Decon 90 and rinsed in clean seawater between each
sampling depth interval and site. Each section of the core was placed in a glass bowl and
homogenised before subsamples were placed in glass jars and zip-lock bags as described in the
SAPs (Oceanica 2009; BMT Oceanica 2013) and stored on ice. At the end of each field day, the
samples were stored in appropriate refrigeration with the samples being transported to
laboratories upon arrival in Perth.
5.3 QA/QC procedures
There were two types of field quality assurance/quality control (QA/QC) samples:
Field splits, where one sample was collected, homogenised, split into three in the field and
analysed individually. Two samples were analysed at the primary laboratory and one sample
was analysed at the secondary laboratory (Section 5.4) for comparison.
Triplicates, where three cores were obtained at the same location and analysed individually at
the primary laboratory.
The results of the field QA/QC sampling were analysed as described in the National Assessment
Guidelines for Dredging (NAGD; CoA 2009) by calculating the Relative Percent Difference (RPD)
between two samples, and Relative Standard Deviation (RSD) between three samples. The
results should agree within a RPD or RSD of ±50%, although the guidelines note that this may
not always be the case where the sediments are very heterogeneous or greatly differing in grain
size (CoA 2009).

BMT Oceanica: Albany Port Authority: Albany Port Authority Maintenance Dredging Program Environmental Impact Assessment 21
5.3.1 Field split samples
Field splits were sampled at a minimum of 5% of sampling locations as specified in the SAPs
(Oceanica 2009; BMT Oceanica 2013). The Relative Percent Difference (RPD) was calculated
for field replicates as follows:
The acceptable RPD for field splits is ±50% (CoA 2009).
5.3.2 Triplicate samples
Sediments were sampled in triplicate at a minimum of 10% of the sampling locations as specified
in the SAP (Oceanica 2009; BMT Oceanica 2013). The Relative Standard Deviation (RSD) was
calculated for field triplicates as follows:
The acceptable RSD for triplicates is ±50% (CoA 2009).
5.4 Laboratory analysis
Analysis of sediment samples were completed by the laboratories as specified in Table 5.3.
Laboratory methods are explained in detail in the relevant SAP (Oceanica 2009 or
BMT Oceanica 2013).
Table 5.3 Laboratories used for sediment analysis in the 2010, 2013 and 2014
sediment surveys
Analysis 2010 survey 2014 survey 2013 disposal
area9 Primary Secondary Primary Secondary
Nutrients and metals MAFRL AAA NMI MPL
ALS Organics, organotins NMI
Particle size distribution Microanalysis Australia
Notes:
1. Primary being the laboratory used for the main analysis
2. Secondary being the laboratory used for QA/QC of the splits
3. MAFRL – Marine and Freshwater Research Laboratory
4. NMI – National Measurement Institute
5. AAA – Advance Analytical Australia Laboratory
6. MPL – member of the Envirolab group
7. ALS – ALS Environmental (nutrients not determined for disposal area)
8. Samples collected by Bastyan & Associates
5.4.1 Laboratory QA/QC
As part of their procedures all laboratories undertook the required testing of blanks, spikes and
standards and completed laboratory duplicates as required by the NAGD and to the satisfaction
of the National Association of Testing Authorities requirements. Laboratory QA/QC reports are
included in the individual laboratory reports within the relevant appendices.

22 BMT Oceanica: Albany Port Authority: Albany Port Authority Maintenance Dredging Program Environmental Impact Assessment
5.5 Data analysis
5.5.1 Normalisation of organics data
Sediment tributyltin (TBT), polycyclic aromatic hydrocarbons (PAHs), total petroleum
hydrocarbons (TPHs) and benzene, toluene, ethylbenzene and xylene (BTEX) levels were
standardised to 1% total organic carbon (TOC) prior to reporting unless concentrations were less
than the limit of reporting (LoR). Contaminant concentrations were standardised to 1% TOC as
follows:
IF TOC ≤ 0.2% in sediment the contaminant concentration was multiplied by 5 (i.e.1/0.2)
TOC ≥ 10% in sediment the contaminant concentration was multiplied by 0.1 (i.e.1/10)
TOC > 0.2% but <10% the contaminant concentration was multiplied by 1/TOC%.
If contaminant concentrations were below the LoR, but were required for statistical purposes, half
the LoR value was used in statistical analysis (CoA 2009).
5.5.2 Computation of 95% upper confidence limit (UCL) of the mean
Initially all data were screened by depth for trends of contamination within sampling depth
intervals. Due to the limited number of samples at the deeper depths (>1.0 m) and a lack of
trends based on depth intervals, it was determined to pool all depths for assessment purposes.
Data from all dredge area sites and depths are pooled. The pooled data were tested for
normality using the software ProUCL 4.0 (USEPA 2007). Depending on the distribution of the
data, size of the dataset and the proportion of values below LoR the software recommended the
most appropriate method for calculating the 95% UCL of the mean. If some data were >LoR,
while other data within the same category were <LoR, the samples <LoR were assigned a value
of LoR/2 to compute a 95% UCL of the mean (CoA 2009).

BMT Oceanica: Albany Port Authority: Albany Port Authority Maintenance Dredging Program Environmental Impact Assessment 23
6. Nature of the Material to be Dredged
6.1 Sediment surveys
Harbour sediments (entrance channel and harbour basin) were collected and analysed in 2010
and 2014. Where practicable the results from both surveys were presented together. Where the
figures were too large or complex, the data were presented by survey (i.e. either 2010 or 2014) in
individual figures. Disposal area data (2013) were also presented in the relevant sections.
Sediments at the disposal area were collected by Bastyan & Associates and analysed by ALS in
2013. These unpublished data (disposal area) were presented for comparison against the
sediment proposed for disposal (i.e. harbour basin and entrance channel sediments) at this site.
The sediment sampling site labelling differed between the two surveys due to the overlapping
coding of the two different dredging footprints (i.e. 2010 and 2014). For quick reference the
labelling schemes have been summarised in Table 6.1.
Table 6.1 Sediment sampling site labelling schemes
2010 survey 2014 survey
Site name based on individual 2009 dredge section Site name based on harbour section (distinct sediment
deposition area)
Harbour section Sites in group Harbour section Label code
entrance channel A1, A'1, A2. A'2 entrance channel EC
harbour basin B1, B2, C1, D1, E1, E2,
F1, I1, I2 harbour basin BA
Sediment depth interval Label suffix Sediment depth interval Label suffix
0–0.5 m top 0–0.5 m S
0.5–1.0 m mid 0.5–1.0 m 0.5–1
1.0–1.5 m bot 1.0–1.5 m 1–1.5
- - 1.5–2.0 m 1.5–2
Results are presented in the relevant sections to show UCL (95%) in the main text and tables in
the context of evaluating against the NAGD screening levels for the acceptability of ocean
disposal. Summary tables of results showing means by depth, within sites, are presented in the
SAP implementation report appendices (BMT Oceanica 2014). Additionally, laboratory reports of
the raw data, laboratory QA/QC reports and statistical outputs for all 95% UCL calculations are
provided in the SAP implementation report appendices (BMT Oceanica 2014).
6.2 Sample recovery
Samples were obtained at 100% of sites and penetration depth varied from 0.5 to 2.0 m
(Figure 6.1).

24 BMT Oceanica: Albany Port Authority: Albany Port Authority Maintenance Dredging Program Environmental Impact Assessment
Figure 6.1 Penetration depth of cores at all sites
6.3 Sediment physical composition
6.3.1 Particle size
The sediments were generally dominated by fine to medium grained sands, but harbour basin
sites had higher percentages of silt/clay than the entrance channel (Figure 6.2 and Figure 6.3).
Sites C1, D1, E1, F1, I1, I2, BA1, BA3 and BA4 had silt/clay fractions >20%. All of these sites
were in the harbour basin. All sites in the entrance channel had silt/clay contents <3%. Particle
size distribution summary tables and cumulative particle size distribution curves are shown in the
SAP implementation report (BMT Oceanica 2014). Particle size distributions were not completed
for samples A1, A'1, A2 and A'2 during the 2010 survey.
For sediments collected in 2010, the particle size distributions in the 0–0.5 m layer, the 0.5–1 m
layer and the 1–1.5 m layer of each site were generally similar (Figure 6.2). Exceptions occurred
at sites E1 and I1 where the bottom sediments were coarser than the surface layer.
0.0
0.2
0.4
0.6
0.8
1.0
1.2
1.4
1.6
1.8
2.0
A1 A2 A'1 A'2 B1 B2 C1 D1 E1 E2 F1 I1 I2 BA1 BA2 BA3 BA4 BA5 EC1 EC2 EC3 EC4 EC5 EC6 EC7
De
pth
(m
)Core location

BMT Oceanica: Albany Port Authority: Albany Port Authority Maintenance Dredging Program Environmental Impact Assessment 25
Figure 6.2 Cumulative sediment particle size distributions in Albany Port for 2010
samples
For sediments collected in 2014, the particle size distributions within the entrance channel were
generally similar for each depth interval within a site (Figure 6.3). Within the harbour basin area,
profiles showed sediments were coarser with depth, although the 1.5–2.0 m depth interval (site
BA5) had a greater portion of fines than the shallower depth interval.
Figure 6.3 Cumulative sediment particle size distributions in Albany Port for 2014
samples
0%
10%
20%
30%
40%
50%
60%
70%
80%
90%
100%
C1
top
D1
top
E1 to
p
E1 b
ot
E2 to
p
E2 b
ot
F1 t
op
I1 to
p
I1 b
ot
I2 to
p
I2 b
ot
>2000um 1000-2000 µm 500-1000 µm 250-500 µm 125-250 µm 63-125 µm 4-63 µm 0-4 µm
0%
10%
20%
30%
40%
50%
60%
70%
80%
90%
100%
BA
1_
S
BA
2_
S
BA
3_
S
BA
4_
S
BA
4_
0.5
-1
BA
4_
1-1
.5
BA
5_
S
BA
5_
0.5
-1
BA
5_
1-1
.5
BA
5_
1.5
-2
EC1
_S
EC2
_S
EC2
_0
.5-1
EC3
_S
EC3
_0
.5-1
EC3
_1
-1.5
EC4
_S
EC5
_S
EC6
_S
EC6
_0
.5-1
EC7
_S
>2000um 1000-2000 µm 500-1000 µm 212-500 µm 106-212 µm 63-106 µm 4-63 µm 0-4 µm

26 BMT Oceanica: Albany Port Authority: Albany Port Authority Maintenance Dredging Program Environmental Impact Assessment
Sediments at the disposal area were classified as fine to medium grain sand with the silt and clay
portions being <6% at all sites (BMT Oceanica 2014). Sediment particle size distributions at the
disposal area were similar to the sediment particle size distributions found in the entrance
channel.
6.3.2 Settling velocity
The 50% and 90% of particle settling velocities and times are shown in Table 6.2. For all
sediments, 50% of the material would settle through 1 m of water column in less than 36 minutes
(0.6 hours). Most sediment samples (21 out of 32) required less than one hour for 90% of the
sediments to settle through 1 m of water column. Of the remaining nine samples, five had
settling times for 90% of the particles to settle in less than 10 hours. The four samples (D1 top,
BA1_S, BA3_S and BA4_0.5–1.0) with times greater than 10 hours are considered likely to not
be accurately calculated due to limitations from assumptions associated with using Stokes' Law
to determine settling velocity. The four samples with calculated 1 m settling times of 90% of the
particles being >10 hours had high clay contents (D1 top – 16%; BA1_S – 24%; BA3_S – 26.6%;
and BA4_0.5–1.0 – 11.1% clay).
Table 6.2 Particle settling velocities and time for sediment samples
50% of particles 90% of particles
Sample
Minimum settling
velocity of 50% of
particles (mm s-1)
Time for 50% of
particles to settle over
1 m (hours)
Minimum settling
velocity of 90% of
particles (mm s-1)
Time for 90% of
particles to settle over
1 m (hours)
C1 top 25.94 0.011 0.07 3.828
D1 top 0.46 0.600 0.01 49.307
E1 top 1.12 0.249 0.03 9.266
E1 bot 73.59 0.004 13.93 0.020
E2 top 45.22 0.006 0.28 0.990
E2 bot 70.78 0.004 16.17 0.017
F1 top 8.14 0.034 0.06 4.321
I1 top 21.66 0.013 0.07 3.722
I1 bot 75.29 0.004 0.89 0.311
I2 top 49.34 0.006 0.21 1.333
I2 bot 79.63 0.003 16.57 0.017
BA1_S 1.32 0.314 0.002 193.2
BA2_S 144.54 0.001 25.44 0.01
BA3_S 37.97 0.01 0.0001 2013
BA4_S 46.11 0.01 15.99 0.02
BA4_0.5–1 31.05 0.01 0.01 23.30
BA4_1–1.5 51.07 0.01 16.41 0.02
BA5_S 38.88 0.01 16.89 0.02
BA5_0.5–1 52.84 0.01 18.35 0.02
BA5_1–1.5 170.63 0.001 22.66 0.01
BA5_1.5–2 37.84 0.010 14.67 0.02

BMT Oceanica: Albany Port Authority: Albany Port Authority Maintenance Dredging Program Environmental Impact Assessment 27
EC1_S 48.57 0.010 18.63 0.01
EC2_S 85.67 0.003 21.09 0.01
EC2_0.5–1 71.90 0.004 19.28 0.01
EC3_S 41.44 0.01 18.14 0.02
EC3_0.5–1 41.92 0.01 17.97 0.02
EC3_1–1.5 70.50 0.004 20.26 0.01
EC4_S 81.92 0.003 17.32 0.01
EC5_S 65.72 0.004 20.04 0.01
EC6_S 64.72 0.004 20.16 0.01
EC6_0.5–1 78.95 0.004 20.70 0.01
EC7_S 118.30 0.002 25.76 0.01
Note:
1. Bold text indicates a settling time >1 hour
6.4 Sediment chemistry
6.4.1 Metals
Whole sediment metals
The 95% UCL of the mean for all metals in sediments were below NAGD screening levels
(Table 6.3). Individual sites had concentrations exceeding the NAGD screening levels for arsenic
(I1 – 58 mg kg-1), and mercury (BA1 – 0.3 and E1 – 0.24 mg kg-1) (BMT Oceanica 2014). No
values were greater than the NAGD high value. No trends of metal concentrations occurred by
depth within sites. A summary table of means per depth at each site is in the SAP
implementation report (BMT Oceanica 2014).
Table 6.3 95% upper confidence limit of the mean for total metal concentrations in
dredge area sediments (mg kg-1)
Analyte Limit of reporting NAGD
1 screening
level NAGD
1 high
value 95% UCL (n=32)
Antimony 0.2 2 25 0.26
Arsenic 0.5 20 70 10.75
Cadmium 0.1 1.5 10 0.75
Chromium 0.2 80 370 11.24
Copper 0.2 65 270 3.45
Lead 0.2 50 220 9.13
Mercury 0.01 0.15 1 0.095
Nickel 0.1 21 52 4.76
Silver 0.1 1.0 3.7 0.37
Zinc 0.2 200 410 9.9
Notes:
1. NAGD = National Assessment Guidelines for Dredging (CoA 2009)
Concentrations of total metals at the disposal area (Table 6.4) were generally below the LoR
except for chromium (8.9–11.8 mg kg-1), which was in concentrations similar to those found in the
harbour basin and entrance channels. Disposal area laboratory report data are provided in the
SAP implementation report (BMT Oceanica 2014).

28 BMT Oceanica: Albany Port Authority: Albany Port Authority Maintenance Dredging Program Environmental Impact Assessment
Table 6.4 Disposal area sediments 80th percentiles for total metal concentrations
(mg kg-1)
Analyte Limit of reporting 80th percentile (n=6)
Antimony 0.5 <0.5
Arsenic 1.0 0.51
Cadmium 0.1 <0.1
Chromium 1.0 11.6
Copper 1.0 <1.0
Lead 1.0 0.51
Mercury 0.01 0.0051
Nickel 1.0 <1.0
Silver 0.1 <0.1
Zinc 1.0 1.21
Note:
1. Some concentrations were >LoR, so the remaining samples that were <LoR were assigned the value LoR/2 for
the determination of the 80th
percentile
Elutriate metals
Elutriate analysis was undertaken for all metals from the 2010 survey harbour basin sites (i.e. not
including A1, A1', A2 and A2') (BMT Oceanica 2014). During the 2014 survey, elutriate metals
were only analysed for those contaminants of concern that had concentrations >LoR in the 2010
survey; namely, arsenic, cadmium and mercury. These were sampled in the harbour basin sites
only (i.e. site BA1-5). The 95% UCL of the mean for all elutriate metal concentrations (except
arsenic) were below either the laboratory LoR or the default ANZECC/ARMCANZ (2000)
guidelines (Table 6.5). No trends in concentrations occurred with depth. One individual sample
(BA3_S) had a cadmium concentration (0.0008 mg L-1) that exceeded the guideline. A summary
table of means per depth at each site is in the SAP implementation report (BMT Oceanica 2014).
Table 6.5 95% upper confidence limit of the mean for elutriate metal concentrations
(mg L-1)
Analyte Areas sampled Limit of
reporting
ANZECC/ARMCANZ (2000) guidelines
(marine waters) 95% UCL
99/95%1 90%
Arsenic All harbour basin sites2 0.0004 No guideline available 0.017
Cadmium All harbour basin sites2 0.0001 0.0007 0.014 0.00044
Chromium 2010 harbour basin
sites only3 0.001 0.0274 0.020 <LoR
Copper 2010 harbour basin
sites only3 0.001 0.0013 0.003 <LoR
Lead 2010 harbour basin
sites only3 0.01 0.0044 0.066 <LoR
Mercury All harbour basin sites2 0.0001 0.0001 0.0007 <LoR
Nickel 2010 harbour basin
sites only3 0.004 0.007 0.200 <LoR
Silver 2010 harbour basin
sites only3 0.01 0.0014 0.0018 <LoR
Zinc 2010 harbour basin
sites only3 0.001 0.015 0.023 LoR4
Notes:
1. Values applied to typical slightly - moderately disturbed systems
2. All harbour basin sites (n=21)
3. 2010 harbour basin sites only (n=11)
4. Zinc had one value >LoR : site C1 = 0.003
5. <LoR indicates that all samples were below the limit of reporting

BMT Oceanica: Albany Port Authority: Albany Port Authority Maintenance Dredging Program Environmental Impact Assessment 29
Bioavailable metals
In 2010, dilute acid extraction of arsenic in sediments was undertaken for sample ‘I1 bot’ only as
this was the only sample that exceeded the NAGD screening level for arsenic in sediments
(BMT Oceanica 2014). In 2014, bioavailable fractions were analysed for arsenic, cadmium and
mercury for all samples located within the harbour basin (i.e. BA1-5) (BMT Oceanica 2014). The
bioavailable fractions of arsenic varied from <LoR to 4.9 mg kg-1, while cadmium was <LoR for all
samples and mercury was <LoR for all samples except at BA1 S_1. No trends in concentrations
occurred with depth. Bioavailable concentrations (95% UCL) of arsenic, cadmium and mercury
were well below NAGD screening levels (Table 6.6). Mercury was below the limits of reporting
for all sites, except one BA1_S (0.01 mg kg-1). A summary table of means per depth at each site
is in the SAP Implementation report (BMT Oceanica 2014).
Table 6.6 95% upper confidence limit of the mean for bioavailable concentrations in
dredge area sediments (mg kg-1)
Analyte Limit of reporting NAGD1 screening level All sampled sites
Arsenic 0.5 20 2.332
Cadmium 0.1 1.5 <LoR3
Mercury 0.01 0.15 LoR3,4
Notes:
1. NAGD = National Assessment Guidelines for Dredging (CoA 2009)
2. Sites include BA1-5 (2014) and I1 'bot' (2010) (n=11)
3. Sites include BA1-5 (2014) only (n=10)
4. Site BA1_S was reported at the LoR (i.e. 0.01 mg kg-1
)
6.4.2 Nutrients
Whole sediment nutrients
No guidelines exist for the concentration of nutrients within marine sediments. However, mean
sediment nutrient values for total Kjeldahl nitrogen (0.1–3.6 mg g-1) and total phosphorus (0.08–
0.65 mg g-1) were within the range expected for estuarine and coastal waters in the region
(Hillman et al. 1990), apart for a high total nitrogen value at site BA1 (10.43 mg g-1) (Table 6.7).
Organic carbon content ranged from 0.07 to 6.77%. Total organic carbon at the disposal area
was 0.14%. The SAP implementation report contains a summary table of the nutrient means by
depth at each site and the laboratory report for nutrients from the 2010 and 2014 surveys.
Table 6.7 Total nutrient concentrations of nutrients in sediments
Sample Total organic carbon (%) Total nitrogen
(mg g-1
)
Total phosphorus
(mg g-1
)
Limit of reporting <0.02 <0.05 <0.005
Background concentration range1 0.8–37.5 0.34–7.39 0.05–1.75
C1 top 1.10 1.5 0.19
D1 top 0.68 0.7 0.13
E1 top 3.80 3.6 0.55
E1 bot 0.19 0.2 <0.05
E2 top 1.15 0.9 0.15
E2 bot 1.40 0.3 0.09
F1 top 2.30 2.7 0.39
I1 top 1.53 1.7 0.64
I1 bot 0.90 0.6 0.29
I2 top 1.00 1.5 0.58
I2 bot 1.30 0.3 0.12
BA1_S 6.77 10.43 0.65

30 BMT Oceanica: Albany Port Authority: Albany Port Authority Maintenance Dredging Program Environmental Impact Assessment
BA2_S 0.14 0.20 0.06
BA3_S 0.34 0.57 0.08
BA4_S 0.55 0.45 0.08
BA4_0.5-1 1.30 1.30 0.20
BA4_1-1.5 0.04 0.17 0.04
BA5_S 0.28 0.10 0.05
BA5_0.5-1 0.17 0.13 0.09
BA5_1-1.5 0.30 0.14 0.07
BA5_1.5-2 0.28 0.15 0.05
EC1_S 0.43
NA
EC2_S 0.08
EC2_0.5-1 0.07
EC3_S 0.54
EC3_0.5-1 0.56
EC3_1-1.5 0.66
EC4_S 0.57
EC5_S 0.33
EC6_S 0.40
EC6_0.5-1 0.44
EC7_S 0.25
Disposal area 0.142
Note:
1. Data from Hillman et al (1990)
2. 80th
percentile (n=6)
Elutriate nutrients
Elutriate nutrient analysis was carried out to assess the potential impacts on water quality
following the disturbance of sediments during the dredging operation. Potential impacts include
toxicity due to ammonia concentrations. The 95% UCLs of the mean for ammonia in sediments
were below the default ANZECC/ARMCANZ (2000) guideline for slight to moderately disturbed
ecosystems (Table 6.8), indicating low risk of toxicity due to ammonia. A summary table of
elutriate nutrient means by depth, at each site is in SAP Implementation report as are the
laboratory reports for elutriate nutrients. Nutrients were not measured at the disposal area.
Table 6.8 95% upper confidence limit of mean elutriate nutrient concentrations (µg L-1)
Parameter Limit of
reporting
ANZECC/ARMCANZ (2000)
default trigger value for marine
waters
95% UCL (n =21)
Ammonia <3 910 854
Nitrate + nitrite <2 NA 10.3
Total dissolved nitrogen <50 NA 1121
Total phosphorus <5 NA 154
Orthophosphate
phosphorus <2 NA 17.6
6.4.3 Organics
TPH, BTEX and PAH
Concentrations of TPHs and BTEX were below the laboratory LoR in all samples (Table 6.9).
Concentrations of TPHs and BTEX were not measured at the disposal area. There was one
sample (I1 top) in the dredge area with measurable total PAH concentrations in the harbour basin
(BMT Oceanica 2014). The 95% upper confidence limits of the mean for total PAHs in sediments

BMT Oceanica: Albany Port Authority: Albany Port Authority Maintenance Dredging Program Environmental Impact Assessment 31
were below the NAGD screening levels. Concentrations of PAH at the disposal area sites were
all <LoR (0.004 mg kg-1). A summary table of the concentrations by depth within sites is in the
SAP Implementation report. No trends in concentrations with depth occurred.
TBT
Concentrations of TBT in the entrance channel sites were all <LoR (BMT Oceanica 2014).
During the 2014 survey, very low concentrations of TBT were found and no trends occurred with
sediment depth. Concentrations of TBT at the disposal area sites were all <LoR (0.5 µg Sn kg-1).
A summary table of the concentrations by depth within sites is in the SAP implementation report
(BMT Oceanica 2014). The 95% UCL of the mean for TBT for all dredge areas was below the
NAGD screening level (Table 6.9).
Table 6.9 95% upper confidence limit (UCL) of standardised (1% TOC) mean
concentrations of contaminants in sediments
Analyte LoR1
NAGD2 screening
level NAGD
2 high
quality value 95% UCL
TBT (µg Sn kg-1
) <0.5 9 70 0.94
PAH (mg kg-1
) <0.16 10 50 <LoR
TPH (mg kg-1
) <275 550 NA <LoR
Notes:
1. LoR = limit of reporting
2. NAGD = National Assessment Guidelines for Dredging (CoA 2009)
3. NA = no guideline available
4. n = 22
Elutriate tributyltin
A conservative approach was adopted in the 2014 survey whereby elutriate TBT was analysed in
sediments from all harbour basin and one of the entrance channel sites (BMT Oceanica 2014).
All concentrations of elutriate TBT from the 2014 survey were <LoR.
6.5 Survey QA/QC
Quality assurance and control was very good during the survey and laboratory results are
considered highly reliable. Full details and analysis of QA/QC is presented in the SAP
Implementation report (BMT Oceanica 2014).

32 BMT Oceanica: Albany Port Authority: Albany Port Authority Maintenance Dredging Program Environmental Impact Assessment
7. Key Potential Impacts
7.1 Assessment of impact risks
This section describes the potential impacts on relevant environmental factors. Each potential
impact of the proposal was rated by likelihood of occurrence (Table 7.1) and consequence of
impact (Table 7.2) to give an inherent risk (Table 7.3). Potential impacts of the proposal are
presented in Table 7.4. A number of management measures are proposed to reduce the
inherent risk (Table 7.4) and are used to determine the residual risk. Most potential impacts were
reduced to a low risk after implementation of management measures and no impacts were rated
as high risk after management. Further detail is provided on the medium risks and some
potential impacts with low risk in the following section. These potential impacts are:
turbidity and sedimentation
mobilisation of contaminants
hydrocarbon spills
noise
vessel movement
threatened or migratory species
introduced marine species
waste management
impacts to other users
exposure to contaminants.

BMT Oceanica: Albany Port Authority: Albany Port Authority Maintenance Dredging Program Environmental Impact Assessment 33
Table 7.1 Risk assessment: likelihood table
Value Descriptor Description
1 Rare Occurs only in exceptional circumstances
2 Unlikely Could occur but not expected
3 Possible Should occur at some time
4 Likely Will probably occur in most circumstances
5 Almost Certain Is expected to occur in most circumstances
Source: modified from AS/NZS ISO 31000:2009
Table 7.2 Risk assessment: consequence table
Value Description Natural environment Human environment Marine fauna (individuals)
1 Insignificant Negligible impact with no remediation required
No alteration to ecosystems
Very minor disruption to small section of community
Insignificant impacts on quality of life
No community interest/concern
Behaviour, physiology, and well-being barely or weakly affected
2 Minor
Minor impacts with minimal remediation required
Minor alteration to ecosystems
Recovery period measured in weeks to months
Appearance of a threat but no actual harm
Isolated short-term disruption to some communities
Minor reductions in quality of life
Limited community interest/concern
Possible isolated local and individual concern
Behaviour, physiology, and well-being affected to a degree that minimally
influences individual reproductive success
3 Moderate
Moderate impacts with some remediation required
Moderate alteration to ecosystems
Recovery period measured in months to years
Small number of minor illnesses
Significant disruption to some communities
Significant short-term or minor long-term reduction in quality of life
Moderate community interest/concern and discussion but limited (if any)
regional or state interest
Behaviour, physiology, and well-being affected to a degree that individual
reproductive success is reduced
4 Major
Major impacts with considerable remediation required
Major alteration to ecosystem
Recovery period measured in years to decades
Small numbers of illnesses or loss of life
Significant, widespread disruption to communities
Significant long-term decline in quality of life
Widespread community interest/concern - local and regional interest
Behaviour, physiology, and well-being substantially affected with reduction in
individual reproductive success
5 Catastrophic
Massive impacts with significant remediation required
Irreversible alteration to ecosystems
Long term environmental recovery that may take decades or longer
Large numbers of illnesses or loss of life
Severe and widespread disruption to communities
Severe long-term reductions in quality of life
State, national and potential international interest/concern
Behaviour, physiology, and well-being severely (or mortally) affected with
individual reproductive success greatly reduced or ceased
Source: modified from AS/NZS ISO 31000:2009
Table 7.3 Risk matrix
Likelihood Rare Unlikely Possible Likely Almost Certain
Insignificant 1 2 3 4 5
Minor 2 4 6 8 10
Moderate 3 6 9 12 15
Major 4 8 12 16 20
Catastrophic 5 10 15 20 25
Risk Severity Low (1-4) Medium (5-10) High (11-25)
Source: modified from AS/NZS ISO 31000:2009

34 BMT Oceanica: Albany Port Authority: Albany Port Authority Maintenance Dredging Program Environmental Impact Assessment
Table 7.4 Risk assessment for Albany Port maintenance dredging proposal
Issue Potential impacts Likelihood Consequence Inherent risk
rating Supporting evidence and management measures Likelihood Consequence
Residual risk
rating
Biophysical
Turbidity and
sedimentation from
dredging
Light limitation to benthic flora
Smothering of benthic habitat 4 2 8
The dredging campaign is of very short duration (anticipated <4 weeks)
Any effects will be largely confined to waters within the Port:
there will be no overflow during berth dredging of sediments with a
significant portion of fines, which will reduce turbidity
channel sediments have low fines content so turbidity from dredging and
overflow will be minimal
3 2 6
Turbidity and
sedimentation from
disposal at offshore
disposal area
Light limitation to benthic flora
Smothering of benthic habitat 3 2 6
As the disposal area is sandy substrate at a depth of >35 m there is no
significant benthic habitat
The dredge will dump in a different area each trip and as the sediment is
predominately sand with little silt or clay fractions the high settling velocity will
result in suspended sediments clearing quickly
2 2 4
Mobilisation of
contaminants during
dredging
Deteriorating water quality
Contamination of marine organisms 3 2 6 Dredge will not overflow during dredging of berth sediments 2 2 4
Mobilisation of
contaminants during
disposal
Deteriorating water quality
Contamination of marine organisms 4 2 8
Sediments meet relevant environmental and health guidelines for their
relevant disposal areas
Depth of chosen offshore disposal area results in dilutions that exceed those
required
2 2 4
Hydrocarbon spill
(dredge)
Contamination of marine
environment 4 3 12
Dredge inspection conducted daily by vessel crew
Conduct scheduled maintenance
Follow refuelling, spill response and clean-up procedures
Ensure spill kits are appropriately located and stocked
2 2 4
Noise Disturbance of marine/terrestrial
fauna 2 2 4
The expected noise level from the dredge is within the frequency and range
of background ship noise and below the estimated bandwidth for most marine
mammals
Dredge and terrestrial plant will undertake scheduled servicing to ensure that
noise levels are minimised
2 1 3
Vessel movement Collision with marine mammals 1 4 4
The timing of the dredging will be chosen to avoid the key period of whale
migration of July to November if possible
Monitoring measures will be implemented throughout the dredging program to
avoid potential impacts to large marine fauna during dredging as outlined in
Section 8.2.1
1 4 4
Threatened or migratory
species Significant impact of proposal on
threatened or migratory species 1 4 4
Dredging is not likely to result in a significant impact on threatened or
migratory species as outlined in Section 7.6.1 1 4 4
Introduced marine
species Introduction of marine species 3 4 12
Dredge contractor to confirm that vessel arrives to Port with non-fouled hulls,
with adequate hopper washing and ballast water exchanges being performed
in accordance with AQIS ballast water requirements
DoF will be notified prior to the dredge arrival of name, previous location, and
most recent inspection date of the dredge vessel
Upon arrival, APA will coordinate a survey of the hull and onboard inspection
for sediment to confirm the fulfilment of contract conditions.
1 3 3
Waste management Damage to fauna or flora 4 3 12
Waste management will be implemented in accordance with contractor
construction management plans
Segregation of wastes will occurs and wastes will be secured to avoid the
potential for wind-blown wastes entering the marine environment or terrestrial
areas of the Port and surrounds
2 2 4
Social
Impacts to other users Restricted commercial values 4 2 8 Interruption to shipping movements will be minimised and navigable waters
improved on completion 3 1 3
BMT Oceanica: Albany Port Authority: Albany Port Authority Maintenance Dredging Program Environmental Impact Assessment 35
Issue Potential impacts Likelihood Consequence Inherent risk
rating Supporting evidence and management measures Likelihood Consequence
Residual risk
rating
Access to dredge will be controlled for safety reasons
Turbidity Reduced aesthetics and recreational
values 4 2 8
Dredging is occurring within the Port area which is not a favoured recreational
area
Community liaison will be undertaken so that they are aware of the dredging
4 1 4
Exposure to
contaminants in dredge
material
Reduced health of local community 2 3 6 Dredging of the berth areas with significant fines will be without overflow
reducing the risk of mobilising contaminants 1 3 3
Noise Reduced aesthetics and health of
local community 3 2 6
Dredging is taking place within an operating Port and noise levels will be
similar to those from current shipping
Dredge will undertake scheduled servicing to ensure that noise levels are
minimised
2 2 4
Notes:
1. DoF = Western Australian Department of Fisheries
2. APA = Albany Port Authority
3. AQIS = Australian Quarantine Inspection Service

36 BMT Oceanica: Albany Port Authority: Albany Port Authority Maintenance Dredging Program Environmental Impact Assessment
7.2 Turbidity
7.2.1 Dredge plume
Minimal release of sediment into the water column surrounding the dredge is expected due to the
rapid intake velocity at the dredge head. Sediment remaining in suspension and the dredge head
is generally less than 0.5% of the gross production (Bridges et al. 2008). Overflow of the dredge
may occur during dredging and when travelling to the offshore disposal area hence, some
turbidity will be generated as these overflow waters are likely to contain a proportion of the finer
sediment particles.
Experience and observations from a long-term trailer suction and jet suction dredging campaign
has not resulted in long-term adverse impacts on adjacent seagrass beds when the dredge has
been mobile (in Owen Anchorage by Cockburn Cement; Oceanica 2007). The small quantities of
sediments that overflow and are suspended during the dredging will be transported in the
direction of the prevailing currents. Any change in water quality is likely to be limited only to an
increase in turbidity for short durations.
The main vegetated habitat adjacent to the Port is Posidonia sinuosa seagrass meadows.
Shading studies have shown that Posidonia species can survive beyond 206 days where there is
a 91% reduction in incident light at the canopy (Collier 2006). The proposed maintenance
dredging duration will be considerably shorter and will result in much less shading than levels
investigated by Collier (2006). It is therefore very unlikely that the maintenance dredging will
have an adverse impact on nearby seagrass, but as a precaution Secchi depths will be monitored
during the dredging operation (Section 8.1).
7.2.2 Offshore disposal
Turbidity will result from disposal of dredge materials at the offshore disposal area, but the
majority (68%) of the sediments to be disposed are clean fine to medium grained sands (from
entrance channel) that should generate minimal turbidity during dumping. Due to the relatively
small amounts of material (<3000 m3) dumped per trip into the deep water (35–44 m), it is
expected that any turbidity will be short lived. The disposal site has been modelled and
determined to be a retentive site for sediment disposal (Ecologia 2007). Modelling has shown
that only a small area of seabed will be impacted by direct disposal and adjacent areas will have
minimal deposition (Ecologia 2007).
7.3 Mobilisation of contaminants
7.3.1 Release of metals
The 95% UCL for metal concentrations were below the NAGD (CoA 2009) screening levels for all
metals. Three individual samples in the dredge areas had concentrations of metals which exceed
the NAGD screening levels. Site I1 exceeded the arsenic (58 mg kg-1) and sites BA1 and E1 (0.3
and 0.24 mg kg-1, respectively) exceeded the mercury screening levels. No trends in
concentrations occurred with depth within sites. Elutriate analysis concentrations were <LoR for
all metals, except arsenic and cadmium, which had 95% UCLs below the ANZECC/ARMCANZ
(2000) guidelines for marine waters. Bioavailable concentrations for arsenic, cadmium and
mercury were all well below NAGD screening levels.
No effect to the environment is expected to occur due to the limited metal mobilisation during
ocean disposal.

BMT Oceanica: Albany Port Authority: Albany Port Authority Maintenance Dredging Program Environmental Impact Assessment 37
7.3.2 Release of nutrients
Sediment nutrient concentrations for dredge areas were within the range expected for Western
Australia estuarine and coastal waters in the region, apart from a high nitrogen value at site
BA1_S. Elutriate analysis for nutrients resulted in the 95% UCL mean concentrations for
ammonia being below the ANZECC/ARMCANZ (2000) guidelines for marine waters. The 95%
UCL mean concentrations for ammonia were below ammonia Toxicant Trigger Value.
No effect to the environment is expected to occur due to the limited nutrient mobilisation and
large dilution during ocean disposal.
7.3.3 Organics
Total petroleum hydrocarbons and BTEX concentrations were below the LoR in all samples.
Concentrations of PAHs were measureable at one site only, which was well below the NAGD
screening levels. Tributyltin (TBT) was below the NAGD screening levels in all dredge areas.
No effect to the environment is expected to occur due to the limited organics mobilisation during
ocean disposal.
7.4 Hydrocarbons
An accidental release of hydrocarbons has the potential to impact on the environment.
Hydrocarbons will be used throughout the proposed dredging and disposal. Potential sources of
hydrocarbon release include hydraulic spills, refuelling spills, release of contaminated bilge
waters, grease and spills resulting from incorrect storage and handling.
The risk of hydrocarbon spills will be managed by:
daily onshore plant and dredge inspections by dredge Master
scheduled maintenance of onshore plant and dredge
adherence to refuelling, spill response, clean up procedures and APA permit requirements
spill kits with appropriate stock and location.
7.5 Noise
A key potential risk of the maintenance dredging to large marine fauna (whales, cetaceans,
pinnipeds and sharks) is underwater noise from the dredge causing temporary or permanent
harm. Noise from cutter suction dredges has been found to be of low to moderate frequency
(around 100 Hz) with some tonal noise, and an acoustic intensity of around 180 dB re 1μPa at
1 m (SKM 2009). Noise levels from a TSHD would likely be equal or lower than that of a cutter
suction dredge. These noise levels are within the frequency and intensity range of ambient
background ship noise (approximately 5–100 Hz and 177 dB re 1μPa m-1, respectively)
(SKM 2009), and below the estimated auditory bandwidth for the majority of marine mammals
(Southall et al. 2007).
Impacts to terrestrial fauna are unlikely as the area is an operating Port and the proposed works
will not result in significantly increased noise levels. Scheduled servicing will be undertaken on
dredge to ensure that noise is minimised.

38 BMT Oceanica: Albany Port Authority: Albany Port Authority Maintenance Dredging Program Environmental Impact Assessment
7.6 Marine fauna
The key potential risks of the maintenance dredging to large marine fauna (whales, cetaceans,
pinnipeds and sharks) are:
the dredge colliding with an animal (vessel strikes)
underwater noise from the dredge causing temporary or permanent harm (Section 7.5).
Southern right whales are generally sighted in the waters near Albany during the months of June
to October, whereas humpback whales are generally sighted from late-May to early-September.
The timing of the proposed dredging is dependent on the availability of the dredging vessel, but it
is expected that dredging will occur sometime between November 2014 and April 2015.
Therefore, there is a low potential for any interaction between the dredging operation and
migrating whales. Although cetaceans are regularly seen in the area, there have been no known
reports of impacts to cetaceans in the history of shipping and infrequent dredging at Albany Port
(Ecologia 2007). In general, the risk of collisions is low as the dredge vessel will be operating at
slower speeds than regular shipping traffic, the dredge will only cross the whale migration route
when travelling to and from the offshore disposal area (approximately eight times per day), and
whales and other species are likely to easily move away from the slow moving dredge plant.
Although the turtle species (logger head and green) have been identified as ‘likely to occur’ by the
EPBC search output it is noted that they are rarely reported and there is no breeding or egg
laying habitat within the Port Authority waters. The expected duration of maintenance dredging is
also very brief (2–3 weeks).
To further avoid any potential impacts on whales and other large marine fauna during dredging,
monitoring and management of marine fauna that enter the vicinity of the dredging will be carried
out throughout the dredging program (Section 8.2).
7.6.1 Threatened and migratory species
Approval under the EPBC Act is required if a proposal is likely to have a ‘significant impact’ on a
matter of national environmental significance (NES). Whether an action is likely to have a
significant impact is dependent on the sensitivity, value and quality of the environment and the
intensity, duration, magnitude and geographic extent of the impacts.
The matter of NES relevant to Albany Port maintenance dredging is the presence of threatened
and migratory marine fauna in the surrounding area. The significant impact criteria for threatened
and migratory species are considered with regard to the maintenance dredging of Albany Port in
Table 7.5. The maintenance dredging campaign is not likely to result in a significant impact on
threatened or migratory species.
Table 7.5 Significant impact criteria for threatened and migratory species
Significant impact criteria Risk Notes
An action is likely to have a significant impact on a critically endangered or endangered species if there is a real
chance or possibility that it will:
Lead to a long-term decrease in the size of a population None
Short term operation
No direct interaction with marine
fauna anticipated
Monitoring program in place
Reduce the area of occupancy of the species Low
Maintenance of existing
infrastructure
Short term operation
Very small footprint area
Fragment an existing population into two or more populations None Maintenance of existing

BMT Oceanica: Albany Port Authority: Albany Port Authority Maintenance Dredging Program Environmental Impact Assessment 39
Significant impact criteria Risk Notes
infrastructure
Short term operation
Adversely affect habitat critical to the survival of a species None
Maintenance of existing
infrastructure
Short term operation
Very small footprint area
Disrupt the breeding cycle of a population Low Short term operation
Modify, destroy, remove, isolate or decrease the availability or
quality of habitat to the extent that the species is likely to decline None
Maintenance of existing
infrastructure
Short term operation
Very small footprint area
Result in invasive species that are harmful to a critically
endangered or endangered species becoming established in the
endangered or critically endangered species’ habitat
Low Introduced marine pests
monitoring measures
Introduce disease that may cause the species to decline or Low Introduced marine pests
monitoring measures
Interfere with the recovery of the species None Short term operation.
An action is likely to have a significant impact on a vulnerable species if there is a real chance or possibility that
it will:
Lead to a long term decrease in the size of an important
population of a species None
Short term operation
No direct interaction with marine
fauna anticipated.
Monitoring program in place
Reduce the area of occupancy of an important population Low
Maintenance of existing
infrastructure
Short term operation
Very small footprint area
Fragment an existing important population into two or more
populations None
Maintenance of existing
infrastructure
Short term operation
Adversely affect habitat critical to the survival of a species None
Maintenance of existing
infrastructure
Short term operation
Very small footprint area
Disrupt the breeding cycle of an important population Low Short term operation;
Modify, destroy, remove or isolate, or decrease the availability
or quality of habitat to the extent that the species is likely to
decline
None
Maintenance of existing
infrastructure
Short term operation
Very small footprint area
Result in invasive species that are harmful to a vulnerable
species becoming established in the vulnerable species’ habitat Low
Introduced marine pests
monitoring measures
Introduce disease that may cause the species to decline Low Introduced marine pests
monitoring measures
Interfere substantially with the recovery of the species None Short term operation
An action is likely to have a significant impact on migratory species if there is a real chance or possibility that it
will:
Substantially modify (including by fragmenting, altering fire
regimes, altering nutrient cycles or altering hydrological cycles),
destroy or isolate an area of important habitat for migratory
species
None
Maintenance of existing
infrastructure
Short term operation
Very small footprint area
Result in an invasive species that is harmful to the migratory
species becoming established in an area of important habitat for
the migratory species
Low Introduced marine pests
monitoring measures
Seriously disrupt the lifecycle (breeding, feeding, migration or
resting behaviour) or an ecologically significant proportion of the
population of a migratory species
Low
Short term operation
No direct interaction with marine
fauna anticipated
Monitoring program in place

40 BMT Oceanica: Albany Port Authority: Albany Port Authority Maintenance Dredging Program Environmental Impact Assessment
7.7 Introduced marine species
A key risk of dredging programs is the introduction of marine species via dredging vessels.
Introduced marine species are marine plants or animals that are not native to Australia, but have
been introduced by human activities such as shipping (CoA 2014). They have the potential to
significantly impact marine industries and the environment. Australia has over 250 introduced
marine species; most remain relatively harmless, but some have become aggressive pests.
Aggressive species have significant impacts on marine ecosystems and marine industries.
The primary ways that foreign marine species are introduced are through ballast water1 and
biofouling2. It is anticipated that the dredge vessel will be travelling from another location within
Western Australian state waters prior to arriving in the Port. Details on management of invasive
marine species are provided in Section 8.3.
7.8 Waste management
Release of waste material can adversely impact on the environment. Wastes requiring
management include solid wastes, hazardous wastes and sewage and grey water. Waste
management will be implemented in accordance with contractor waste management plans that
meet Port and regulatory environmental management requirements. Segregation of wastes will
occur and wastes will be secured to avoid the potential for wind-blown wastes entering the
marine environment of the Port and surrounds.
7.9 Impacts to other users
Albany Port is a regional port that handles multiple cargo types. Navigable access to and from
this Port is critical to ensure the ongoing operation of this industry. It is anticipated that the
negative impacts on users will be minor as:
interruption to shipping movements will be minimised during dredging and navigable waters
will be greatly improved on completion
access to the dredging areas will be controlled for safety reasons.
7.10 Principles of environmental protection
This document has been developed with consideration of the principles of environmental
protection as outlined in Table 7.6.
1 Ballast water refers to water that a ship takes on board at a port before commencing a voyage in order to provide stability in unladen
ships, with marine organisms taken on board as well. 2 Biofouling refers to the attachment of biological material (microorganisms, plants, algae and animals) on submerged structures such
as ships hulls and internal areas.

BMT Oceanica: Albany Port Authority: Albany Port Authority Maintenance Dredging Program Environmental Impact Assessment 41
Table 7.6 Principles of environmental protection and their application to the proposal
program
Principle (EPA 2004) Application to Proposed Program
1. The precautionary principle: Where there are
threats of serious or irreversible damage, lack of
full scientific certainty should not be used as a
reason for postponing measures to prevent
environmental degradation.
In application of this precautionary principle, decisions
should be guided by
a) Careful evaluation to avoid, where practicable,
serious or irreversible damage to the environment;
and
b) An assessment of the risk – weighted consequences
of various options.
The need for the program has been clearly
demonstrated as navigational safety is a major priority.
The potential impacts on the environment during
dredging are minimal as any adverse conditions will only
exist for a short time period. The potential impacts on
the environment during operations are well understood
from existing operations
2. The principle of intergenerational equity:
The present generation should ensure that the health,
diversity and productivity of the environment is
maintained and enhanced for the benefit of future
generations.
The program seeks to minimise impacts to marine water
quality, marine fauna and benthic habitats
3. The principle of the conservation of biological
diversity and ecological integrity:
Conservation of biological diversity and ecological
integrity should be a fundamental consideration.
The program seeks to minimise impacts to marine water
quality, marine fauna and benthic habitats and ensures
that a high level of ecological protection will be achieved
outside the Port area
4. Principles relating to improved valuation,
pricing and incentive integrity:
a) Environmental factors should be included in the
valuation of assets and services.
b) The polluter pays principles – those who generate
pollution and waste should bear the cost of
containment, avoidance and abatement.
c) The users of goods and services should pay prices
based on the full life cycle costs of providing goods
and services, including the use of natural resources
and assets and the ultimate disposal of any waste.
d) Environmental goals, having been established,
should be pursued in the most cost effective way, by
establishing incentive structure, including market
mechanisms, which enable those best placed to
maximise benefits and/or minimise costs to develop
their own solution and responses to environmental
problems.
APA bears the costs associated with this program
5. The principle of waste minimisation:
All reasonable and practicable measures should be
taken to minimise the generation of waste and its
discharge into the environment.
Any wastes produced by the program will be managed
through a contractor construction management plan
including segregation and appropriate disposal of waste
relevant to material type
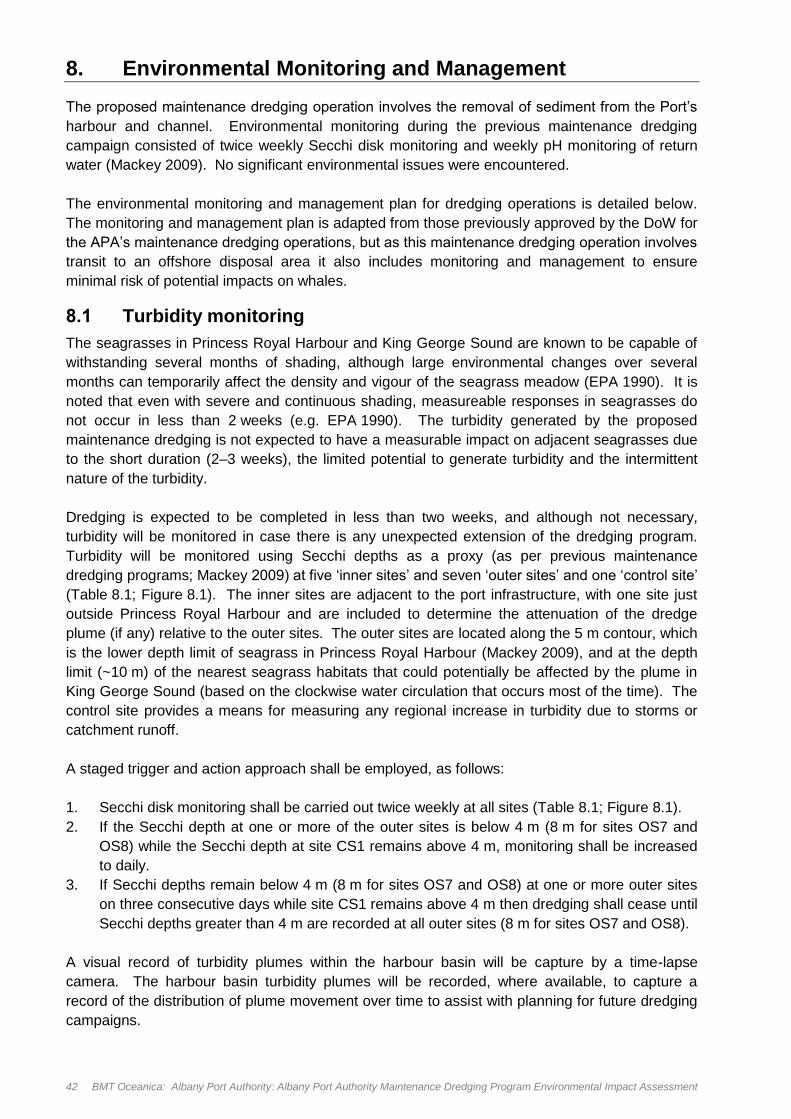
42 BMT Oceanica: Albany Port Authority: Albany Port Authority Maintenance Dredging Program Environmental Impact Assessment
8. Environmental Monitoring and Management
The proposed maintenance dredging operation involves the removal of sediment from the Port’s
harbour and channel. Environmental monitoring during the previous maintenance dredging
campaign consisted of twice weekly Secchi disk monitoring and weekly pH monitoring of return
water (Mackey 2009). No significant environmental issues were encountered.
The environmental monitoring and management plan for dredging operations is detailed below.
The monitoring and management plan is adapted from those previously approved by the DoW for
the APA’s maintenance dredging operations, but as this maintenance dredging operation involves
transit to an offshore disposal area it also includes monitoring and management to ensure
minimal risk of potential impacts on whales.
8.1 Turbidity monitoring
The seagrasses in Princess Royal Harbour and King George Sound are known to be capable of
withstanding several months of shading, although large environmental changes over several
months can temporarily affect the density and vigour of the seagrass meadow (EPA 1990). It is
noted that even with severe and continuous shading, measureable responses in seagrasses do
not occur in less than 2 weeks (e.g. EPA 1990). The turbidity generated by the proposed
maintenance dredging is not expected to have a measurable impact on adjacent seagrasses due
to the short duration (2–3 weeks), the limited potential to generate turbidity and the intermittent
nature of the turbidity.
Dredging is expected to be completed in less than two weeks, and although not necessary,
turbidity will be monitored in case there is any unexpected extension of the dredging program.
Turbidity will be monitored using Secchi depths as a proxy (as per previous maintenance
dredging programs; Mackey 2009) at five ‘inner sites’ and seven ‘outer sites’ and one ‘control site’
(Table 8.1; Figure 8.1). The inner sites are adjacent to the port infrastructure, with one site just
outside Princess Royal Harbour and are included to determine the attenuation of the dredge
plume (if any) relative to the outer sites. The outer sites are located along the 5 m contour, which
is the lower depth limit of seagrass in Princess Royal Harbour (Mackey 2009), and at the depth
limit (~10 m) of the nearest seagrass habitats that could potentially be affected by the plume in
King George Sound (based on the clockwise water circulation that occurs most of the time). The
control site provides a means for measuring any regional increase in turbidity due to storms or
catchment runoff.
A staged trigger and action approach shall be employed, as follows:
1. Secchi disk monitoring shall be carried out twice weekly at all sites (Table 8.1; Figure 8.1).
2. If the Secchi depth at one or more of the outer sites is below 4 m (8 m for sites OS7 and
OS8) while the Secchi depth at site CS1 remains above 4 m, monitoring shall be increased
to daily.
3. If Secchi depths remain below 4 m (8 m for sites OS7 and OS8) at one or more outer sites
on three consecutive days while site CS1 remains above 4 m then dredging shall cease until
Secchi depths greater than 4 m are recorded at all outer sites (8 m for sites OS7 and OS8).
A visual record of turbidity plumes within the harbour basin will be capture by a time-lapse
camera. The harbour basin turbidity plumes will be recorded, where available, to capture a
record of the distribution of plume movement over time to assist with planning for future dredging
campaigns.

BMT Oceanica: Albany Port Authority: Albany Port Authority Maintenance Dredging Program Environmental Impact Assessment 43
Table 8.1 Secchi disk monitoring sites
Site Description Location (GDA94 UTM 50)
Easting Northing
IS1 Inner Site 581189 6122602
IS2 Inner Site 581810 6122071
IS3 Inner Site 582488 6121452
IS4 Inner Site 582893 6121888
IS5 Inner Site 584587 6122043
OS1 Outer Site 581322 6122247
OS2 Outer Site 580438 6121720
OS3 Outer Site 581536 6120946
OS4 Outer Site 582724 6121301
OS5 Outer Site 583113 6121558
OS6 Outer Site 583117 6121903
OS7 Outer Site 584336 6121669
OS8 Outer Site 584374 6121495
CS1 Control Site 580479 6122764

44 BMT Oceanica: Albany Port Authority: Albany Port Authority Maintenance Dredging Program Environmental Impact Assessment
Figure 8.1 Turbidity monitoring sites for the maintenance dredging campaign

BMT Oceanica: Albany Port Authority: Albany Port Authority Maintenance Dredging Program Environmental Impact Assessment 45
8.1.1 Seagrass monitoring
Seagrass epiphyte loading will be monitored to document any potential effect of nutrient release
on epiphyte growth. Photographs of the seagrass meadows shall be taken in ten randomly
placed 20 x 20 cm quadrats, one week prior to, once during and one week after dredging at each
of the outer sites with seagrass (CS1, OS5, OS6, OS7 and OS8) (Table 8.1; Figure 8.1).
Epiphyte cover shall be visually assessed from the photographs and qualitatively classified as
low, medium or high density. Any change in epiphyte cover shall be documented in the close-out
report.
8.2 Marine fauna
These monitoring and management guidelines have been developed to avoid, reduce or mitigate
any potential impacts to whales (and other protected marine fauna visible at the surface) as a
result of dredging operations during the maintenance dredging of Albany Port. Observations will
also be made of other protected marine fauna (e.g. sea lions, dolphins, sharks and any schooling
fish) during the monitoring program to inform future dredging operations.
The management guidelines have been developed with reference to DEWHA (2008) EPBC Act
Policy Statement 2.1 – Interaction between offshore seismic exploration and whales. However, it
should be noted the proposed monitoring and management has been adapted from this policy
statement. The policy document has been developed for seismic explorations which generate
more noise than trailer suction dredging, which is similar to the noise of background shipping. A
level of conservatism has been adopted and the dredging has been assumed to be an elevated
acoustic disturbance due to an absence of noise modelling or measurements of noise generated
by the dredge vessel. The plan and measures employed are based on the likelihood of
encountering a whale (or other marine faunal species) protected by the EPBC Act during the
survey.
Modifications to the recommendations in the DEWHA (2008) policy statement have been adopted
due to the low level of noise generated by the dredge vessel in relation to background shipping
noise; the low likelihood of encountering whales (the dredge will only cross the whale migration
route when travelling to and from the offshore disposal area – a maximum of eight times per day,
during 1–2 weeks of dredging) and the inability for a TSHD to operate at ‘low power’ or turn off
engines. The dredge vessel requires the engine to be running to navigate safely.
Several EPBC listed marine species (sharks, dolphins, turtles and sea lions) may be present in
the vicinity of the dredge and disposal area. These species are smaller than whales and able to
change direction more quickly to avoid impacts. As such the risk of impact during dredging and
disposal activities is considered low and sightings of these species will not trigger a delay in
dredging.
8.2.1 Cetacean impact avoidance
Pre-start up procedures
Visual observations for the presence of protected marine fauna are to be undertaken by a
suitably trained observer (Section 8.2.2) for at least 5 min before the commencement of
dredge suction. Visual observations will be conducted during day operations using binoculars
and from the bridge of the dredge vessel at night.
Activities may only commence if no protected marine fauna have been sighted within 300 m
(the exclusion zone). Visual observations will commence during the period of steaming to the
dredge location and can include the time where the drag-heads are lowered to the bed (the
noise generated during this process is similar to background shipping traffic).

46 BMT Oceanica: Albany Port Authority: Albany Port Authority Maintenance Dredging Program Environmental Impact Assessment
If any protected marine fauna are observed within the exclusion zone, dredging may not
commence until the animal is observed to leave the exclusion zone, until 20 min of
observations have passed since the last sighting or until the dredge moves at least 300 m
away from the marine fauna.
All observations will be recorded on the Environment Australia Whale and Dolphin Sighting
Report form (http://data.aad.gov.au/aadc/whales/report_sighting.cfm).
Start-up procedures
Start-up procedures should be used each time dredging is initiated with the dredge suction
turned on only after the pre-start up procedure has been followed. The noise of the vessel
engine steaming to the site will provide a ramp-up of the acoustic source, which may alert
whales in the area to the presence of the dredging and enable animals to move and avoid (or
stand off) at distances where injury is unlikely.
If any protected marine fauna are spotted within, or are about to enter, the exclusion zone, the
dredge vessel should navigate away from the fauna (as the engine cannot be shut down
completely for navigation safety).
Start-up procedures should only resume after the animal is observed to leave the exclusion
zone, until 20 min of observations have passed since the last sighting or until the dredge
moves at least 300 m away from the marine fauna.
Operations procedures
During dredging, a trained observer will undertake regular visual observations during the
acoustic operations. As a minimum, at least one observer should scan the exclusion zone at
1 hour intervals for at least 5 min.
Stop work/continuation procedures
If any protected marine fauna are sighted within, or about to enter, the exclusion zone during
operations, the dredge vessel should navigate away from the marine fauna (as the engine
cannot be shut down completely for navigation safety).
The dredge vessel can navigate at least 300 m away from the marine fauna and continue
dredging in a new exclusion zone.
The dredge vessel can return to the area of dredging and commence suction, only after the
protected marine fauna has been observed to move outside the exclusion zone, or when
20 min has lapsed since the last sighting.
8.2.2 Trained observers
The APA will ensure that there are sufficiently trained observers to satisfy the basic requirements
outlined above. The trained observers will be briefed prior to the commencement of dredging by
a person with proven experience in marine fauna observation, distance estimation and reporting.
A briefing will be provided to all observers on environmental matters, protected marine fauna
identification and the environmental legal obligations for companies operating in Australian
waters. Appropriate reference materials, visual aids and reporting materials will be provided to
the trained observers to assist reporting any protected marine fauna sighted.
8.3 Introduced marine pests
It is anticipated that the dredge vessel will be travelling from another location within Western
Australian state waters prior to arriving in the port. The APA will confirm with the contractor that
the dredger arrives with non-fouled hulls, and to have performed adequate hopper washing and
ballast water exchanges in accordance with the Australian Quarantine Inspection Services
(AQIS) ballast water management requirements prior to arrival in Albany Port. Ships must also
submit a Quarantine Pre-Arrival Report (QPAR) to AQIS 12–48 hours prior to arrival and

BMT Oceanica: Albany Port Authority: Albany Port Authority Maintenance Dredging Program Environmental Impact Assessment 47
complete the ballast water uptake/discharge log and treatment/exchange log and retain these on
board. In addition, the Western Australian Department of Fisheries (DoF) will be notified in
advance of the: name; previous location; and most recent inspection date of the dredge vessel.
Upon arrival, the APA will coordinate a diving survey of the hull and an onboard inspection for
mud and sediment to confirm the fulfilment of contract conditions. The control of ballast water
and management of introduced species is managed by the AQIS. Following the IMO Ballast
Water Protocols and AQIS’s Mandatory Ballast Water Requirements during port operations it is
unlikely that there will be a significant increase in the risk of introductions. The APA will
immediately notify the DoF, AQIS and the DoW if any introduced marine pests are observed.
8.4 Reporting
The results of the Secchi depth and seagrass monitoring shall be included in the close-out report.
A copy of the completed close out report shall be made available to the DoW within 2 months of
the works completion.
An additional report, on the dredging operations and any protected marine fauna interactions will
be provided to the DoE within 2 months of the works completion. The report will contain:
the location, date and start time of dredging
name, qualification and experience of any trained observers (or scientists) involved in the
observation
the location, times and reasons when observations were hampered by poor visibility or high
winds
the location and time of any start-up delays or stop work procedures instigated as a result of
protected marine fauna sightings
the location, time and distance of any protected marine fauna sighting including species
where possible and
the date and time of survey completion.
All observation records will be collated and archived by APA and made available to the DoE on
request.

48 BMT Oceanica: Albany Port Authority: Albany Port Authority Maintenance Dredging Program Environmental Impact Assessment
9. Stakeholder Consultation
Representatives from the following stakeholders have been consulted in relation to the proposed
maintenance dredging in the Port of Albany:
Port customers
Department of Water
Department of Fisheries
Department of Transport
Department of Parks and Wildlife
Department of Environment and Regulation
City of Albany
South Coast Diving Supplies
Albany Ocean Adventures
Albany Whale Tours
South Coast Purse Seine Fishery
Great Southern Aquaculture Association
Environmentalists/surfers
Centre for Excellence in Natural Resources – UWA
South Coast NRM.
Albany Port Authority continues to present details on the maintenance dredging proposal and the
campaign based on the EIA document (this document) to the stakeholder members. Stakeholder
meetings were held on 16, 17 and 18 June 2014 and the APA CEO discussed the dredging
campaign on local ABC radio on 11 June 2014 to raise public awareness.

BMT Oceanica: Albany Port Authority: Albany Port Authority Maintenance Dredging Program Environmental Impact Assessment 49
10. References
Ahern CR, McElnea AE, Sullivan LA (2004) Acid Sulfate Soils Laboratory Methods Guidelines.
Queensland Department of Natural Resources Mines and Energy, Indooroopilly,
Queensland, June 2004
ANZECC, ARMCANZ (2000) Australian and New Zealand Guidelines for Fresh and Marine Water
Quality. Volume 1: The Guidelines. Australian and New Zealand Environment and
Conservation Council, Agriculture and Resource Management Council of Australia and
New Zealand, Canberra, Australian Capital Territory, October 2000
ATA Environmental (2000) Albany Port Developments Dredge and Dredge Spoil Disposal
Management Plan, Volume II, Appendices 7. Prepared for Albany Port Authority by ATA
Environmental, Report No. 2000/62, Perth, Western Australia, September 2000
BMT Oceanica (2013) Albany Port Authority Maintenance Dredging Program – Sediment
Sampling and Analysis Plan (SAP). Prepared for Albany Port Authority by BMT Oceanica
Pty Ltd, Report No. 812_01_001/1_Rev0, Perth, Western Australia, October 2013
BMT Oceanica (2014) Albany Port Authority Maintenance Dredging Program – Sediment
Sampling and Analysis Implementation. Prepared for Albany Port Authority by
BMT Oceanica Pty Ltd, Report No. 812_01_002/1_Rev0, Perth, Western Australia, May
2014
Bridges TS, Ells S, Hayes D, Mount D, Nadeau SC, Palermo MR, Patmont C, Schroeder P
(2008) The Four Rs of Environmental Dredging: Resuspension, Release, Residual, and
Risk. US Army Corps of Engineers, Engineer Research and Development Center, Report
No. ERDC/EL TR-08-4, Washington, DC, February 2008
CoA (2009) National Assessment Guidelines for Dredging. Commonwealth of Australia,
Canberra, Australian Capital Territory
CoA (2014) Marine Pests. National System for the Prevention and Management of Marine Pest
Incursions, Commonwealth of Australia, Canberra, Australian Capital Territory. Available
at <http://www.marinepests.gov.au/marine_pests> [Accessed May 2014]
Collier CJ (2006) Characterising responses of the seagrass Posidonia sinuosa to changes in light
availability. PhD Thesis, Faculty of Computing, Health and Science, Edith Cowan
University, Perth, Western Australia
DEC (2009) Identification and Investigation of Acid Sulfate Soils and Acidic Landscapes: Acid
Sulfate Soils Guideline Series. Department of Environment and Conservation,
Contaminated Sites Branch Environmental Regulation Division, Perth, Western Australia,
May 2009
DEWHA (2008) EPBC Act Policy Statement 2.1 – Interaction between offshore seismic
exploration and whales. Department of the Environment Water Heritage and the Arts,
Canberra, Australian Capital Territory, September 2008
DEC (2010) Contaminated Sites Management Series – Assessment Levels for Soil, Sediment
and Water –. Department of Environment, Perth, Western Australia, February 2010
DoE (2011) Treatment and Management of Soils and Water in Acid Sulfate Soil Landscapes.
Department of Environment, Perth, Western Australia, July 2011
DoE (2014) EPBC Act Protected Matters Report. Department of the Environment, Canberra,
Australian Capital Territory. Available at <http://www.environment.gov.au/epbc/pmst>
[Accessed 29 May 2014]

50 BMT Oceanica: Albany Port Authority: Albany Port Authority Maintenance Dredging Program Environmental Impact Assessment
DoW (2008) Princess Royal Harbour and Oyster Harbour benthic habitat survey. Internal report.
Perth, Western Australia
Ecologia (2007) Albany Iron Ore Project Public Environmental Review, Albany Port Expansion
Proposal. EPA Assessment No. 1594. Prepared for the Albany Port Authority by Ecologia
Environment, Perth, Western Australia
Ecologia (2008) Dredging and Land Reclamation Environmental Management Plan – Albany Port
Expansion Proposal. EPA Assessment No 1594. Prepared for Albany Port Authority by
Ecologia Environment, Perth, Western Australia, August 2008
EPA (1990) Albany Harbours Environmental Study 1988–89, Bulletin 412. Environmental
Protection Authority, Perth, Western Australia, February 1990
Hillman K, Lukatelich RJ, Bastyan G, McComb AJ (1990) Distribution of Biomass of Seagrasses
and Algae, and Nutrient Pools in Water, Sediments and Plants in Princess Royal Harbour
and Oyster Harbour. Centre for Water Research, Report No. EPA Technical Series 40,
Perth, Western Australia, November 1990
Huisman JM, Jones DS, Wells FE, Burton T (2008) Introduced marine biota in Western Australian
waters. Records of the Western Australian Museum 24:323–366
JFA (2005) Southdown Magnetite Iron Ore Project – Albany Port Upgrade. Prepared for Grange
Resources Limited by JFA Consultants Pty Ltd, Perth, Western Australia, August 2005
Mackey P (2009) Return Water Management Plan for the Minor Maintenance Program required
to Safely Re-instate the Declared Depths at Albany Port. Prepared for the Albany Port
Authority, January 2009
Mackey P, Fretton S (2008) Return Water Management Plan for UXO Recovery Pumping at the
Old Curved and Straight-Armed Jetties located at Port Albany. Prepared for the Albany
Port Authority, April 2008
McDonald JI, Wells FE, Travers J (2009) Results of the 2007 survey of the Albany Marine Area
for Introduced Marine Species. Department of Fisheries, Report No. 188, Perth, Western
Australia
MPRSWG (1994) A Representative Marine Reserve System for Western Australia. Marine Parks
& Reserves Selection Working Group, Perth, Western Australia, June 1994
Oceanica (2007) Owen Anchorage Pressure State Response Report. Prepared for Department of
Environment and Conservation by Oceanica Consulting Pty Ltd, Report No. 508/1, Perth,
Western Australia, February 2007
Oceanica (2009) Albany Port Authority Maintenance Dredging Program – Sediment Sampling
and Analysis Plan (SAP). Prepared for Albany Port Authority by Oceanica Consulting Pty
Ltd, Report No. 812_001/1, Perth, Western Australia, September 2009
Oceanica (2010a) Albany Port Authority Maintenance Dredging – Sediment Sampling and
Analysis Implementation Report. Prepared for Albany Port Authority by Oceanica
Consulting Pty Ltd, Report No. 812_001/2, Perth, Western Australia, May 2010
Oceanica (2010b) Albany Port Proposed Maintenance Dredging 2010 – Environmental Impact
Assessment. Prepared for Albany Port Authority by Oceanica Consulting Pty Ltd, Report
No. 812_001/3, Perth, Western Australia, June 2010
SKM (2007) Albany Iron Ore Project Albany Port Expansion Proposal: Sampling and Analysis
Plan and Benthic Primary Producer Habitat Report, Revision 7. Prepared for Grange
Resources by Sinclair Knight Merz Pty Ltd, Perth, Western Australia, October 2007

BMT Oceanica: Albany Port Authority: Albany Port Authority Maintenance Dredging Program Environmental Impact Assessment 51
SKM (2009) Cape Lambert Port B Development – Cetacean Management Plan. Prepared for Rio
Tinto by Sinclair Knight Merz Pty Ltd, Perth, Western Australia, August 2009
Southall BL, Bowles AE, Ellison WT, Finneran JJ, Gentry RL, Greene Jr. CR, Kastak D, Ketten
DR, Miller JH, Nachtigall PE, Richardson WJ, Thomas JA, Tyack PL (2007) Marine
mammal noise exposure criteria: Initial scientific recommendations. Aquatic Mammals
33:411–414
Strategen (2008) Albany Protected Harbour Development – Environmental Protection Statement.
Prepared for LandCorp by Strategen, Perth, Western Australia, September 2008
USEPA (2007) ProUCL version 4.0. United States Environmental Protection Authority, Atlanta,
Georgia


Appendix A
EPA Referral Form


Appendix B
EPBC Referral Form


Appendix C
Sea Dumping Permit Application


BMT Oceanica Pty Ltd
PO Box 462 Wembley
WA 6913 Australia
Tel: +61 8 6272 0000
Fax: +61 8 6272 0099
www.bmtoceanica.com.au