
Juneau Fish Habitat Assessment revised 2012 - Southeast Alaska

Technical Paper No. 315
Alaska Subsistence Fisheries 2002 Annual Report
by
James A. Fall,
Caroline L. Brown,
David Caylor,
Susan Georgette,
Tracie Krauthoefer,
and
Amy W. Paige
December 2003
Alaska Department of Fish and Game Division of Subsistence

Symbols and Abbreviations The following symbols and abbreviations, and others approved for the Système International d'Unités (SI), are used without definition in the following reports by the Divisions of Sport Fish and of Commercial Fisheries: Fishery Manuscripts, Fishery Data Series Reports, Fishery Management Reports, and Special Publications. All others, including deviations from definitions listed below, are noted in the text at first mention, as well as in the titles or footnotes of tables, and in figure or figure captions. Weights and measures (metric) centimeter cm deciliter dL gram g hectare ha kilogram kg kilometer km liter L meter m milliliter mL millimeter mm Weights and measures (English) cubic feet per second ft3/s foot ft gallon gal inch in mile mi nautical mile nmi ounce oz pound lb quart qt yard yd Time and temperature day d degrees Celsius °C degrees Fahrenheit °F degrees kelvin K hour h minute min second s Physics and chemistry all atomic symbols alternating current AC ampere A calorie cal direct current DC hertz Hz horsepower hp hydrogen ion activity pH (negative log of) parts per million ppm parts per thousand ppt, ‰ volts V watts W
General Alaska Administrative Code AAC all commonly accepted abbreviations e.g., Mr., Mrs.,
AM, PM, etc. all commonly accepted professional titles e.g., Dr., Ph.D., R.N., etc. at @ compass directions:
east E north N south S west W
copyright © corporate suffixes:
Company Co. Corporation Corp. Incorporated Inc. Limited Ltd.
District of Columbia D.C. et alii (and others) et al. et cetera (and so forth) etc. exempli gratia (for example) e.g. Federal Information Code FIC id est (that is) i.e. latitude or longitude lat. or long. monetary symbols (U.S.) $, ¢ months (tables and figures): first three letters Jan,...,Dec registered trademark ® trademark ™ United States (adjective) U.S. United States of America (noun) USA U.S.C. United States
Code U.S. state use two-letter
abbreviations (e.g., AK, WA)
Measures (fisheries) fork length FL mideye-to-fork MEF mideye-to-tail-fork METF standard length SL total length TL Mathematics, statistics all standard mathematical signs, symbols and abbreviations alternate hypothesis HA
base of natural logarithm e catch per unit effort CPUE coefficient of variation CV common test statistics (F, t, χ2, etc.) confidence interval CI correlation coefficient (multiple) R correlation coefficient (simple) r covariance cov degree (angular ) ° degrees of freedom df expected value E greater than > greater than or equal to ≥ harvest per unit effort HPUE less than < less than or equal to ≤ logarithm (natural) ln logarithm (base 10) log logarithm (specify base) log2, etc. minute (angular) ' not significant NS null hypothesis HO
percent % probability P probability of a type I error (rejection of the null hypothesis when true) α probability of a type II error (acceptance of the null hypothesis when false) β second (angular) " standard deviation SD standard error SE variance population Var sample var

TECHNICAL PAPER NO. 315
ALASKA SUBSISTENCE FISHERIES 2002 ANNUAL REPORT
by
James A. Fall Alaska Department of Fish and Game, Division of Subsistence, Anchorage
Caroline L. Brown
Alaska Department of Fish and Game, Division of Subsistence, Fairbanks
David Caylor Alaska Department of Fish and Game, Division of Subsistence, Anchorage
Susan Georgette
Alaska Department of Fish and Game, Division of Subsistence, Kotzebue
Tracie Krauthoefer Alaska Department of Fish and Game, Division of Subsistence, Bethel
and
Amy W. Paige
Alaska Department of Fish and Game, Division of Subsistence, Juneau
Alaska Department of Fish and Game
Division of Subsistence PO Box 115526, Juneau, Alaska 99811-5526
December 2003
Annual Report to the U.S. Fish and Wildlife Service, Office of Subsistence Management, Fisheries Resource Monitoring Program, to fulfill obligations for Study No. FIS 01-107 under agreement 701811J335 and ADF&G COOP-01-074

The Division of Subsistence Technical Paper Series was established in 1979 and represents the most complete collection of information about customary and traditional uses of fish and wildlife resources in Alaska. The papers cover all regions of the state. Some papers were written in response to specific fish and game management issues. Others provide detailed, basic information on the subsistence uses of particular communities which pertain to a large number of scientific and policy questions. Technical Paper Series reports are available through the Alaska State Library and on the Internet: http://www.subsistence.adfg.state.ak.us/
James A. Fall and David Caylor Alaska Department of Fish and Game, Division of Subsistence 333 Raspberry Road, Anchorage, Alaska 99518-1599, USA
Caroline L. Brown
Alaska Department of Fish and Game, Division of Subsistence 1300 College Road, Fairbanks, Alaska 99701-1599, USA
Susan Georgette
Alaska Department of Fish and Game, Division of Subsistence PO Box 689, Kotzebue, Alaska 99752, USA
Tracie Krauthoefer
Alaska Department of Fish and Game, Division of Subsistence PO Box 1789, Bethel, Alaska 99559-1789, USA
and Amy Paige
Alaska Department of Fish and Game, Division of Subsistence PO Box 115526, Juneau, Alaska 99811-5526, USA
This document should be cited as: Fall, J.A., C.L. Brown, D. Caylor, S. Georgette, T. Krauthoefer, and A.W. Paige. 2003. Alaska subsistence fisheries
2002 annual report. Alaska Department of Fish and Game, Division of Subsistence Technical Paper No. 315. Juneau.
The Alaska Department of Fish and Game (ADF&G) administers all programs and activities free from discrimination based on race, color, national origin, age, sex, religion, marital status, pregnancy, parenthood, or disability. The department administers all programs and activities in compliance with Title VI of the Civil Rights Act of 1964, Section 504 of the Rehabilitation Act of 1973, Title II of the Americans with Disabilities Act (ADA) of 1990, the Age Discrimination Act of 1975, and Title IX of the Education Amendments of 1972. If you believe you have been discriminated against in any program, activity, or facility please write:
ADF&G ADA Coordinator, P.O. Box 115526, Juneau AK 99811-5526 U.S. Fish and Wildlife Service, 4040 N. Fairfax Drive, Suite 300 Webb, Arlington VA 22203 Office of Equal Opportunity, U.S. Department of the Interior, Washington DC 20240
The department’s ADA Coordinator can be reached via phone at the following numbers: (VOICE) 907-465-6077, (Statewide Telecommunication Device for the Deaf) 1-800-478-3648, (Juneau TDD) 907-465-3646, or (FAX) 907-465-6078
For information on alternative formats and questions on this publication, please contact: ADF&G, Division of Subsistence, Website: http://www.subsistence.adfg.state.ak.us/

TABLE OF CONTENTS
List of Tables ..................................................................................................................... iii List of Figures .................................................................................................................. viii Acknowledgments................................................................................................................x I. Introduction: Purposes and Objectives ...................................................................1 II. Overview of Statewide Subsistence Fisheries Harvests in 2002 .............................7
Subsistence Harvests in Rural Alaska..........................................................7 Subsistence Salmon Harvests in 2002 .........................................................8 Statewide Subsistence Salmon Harvests, 1994 – 2002................................9
III. Northwest Alaska...................................................................................................23 Norton Sound and Port Clarence Area Salmon .........................................23 Kotzebue Area Salmon .............................................................................28 Kotzebue Area: Sheefish, Whitefish, and Char ........................................30
IV. Yukon Area ...........................................................................................................41 Background................................................................................................41 Regulations ................................................................................................41 Subsistence Harvest Assessment Methods ................................................43 Subsistence Salmon Harvests in 2002 .......................................................44 V. Kuskokwim Area ...................................................................................................57 Background................................................................................................57 Regulations ................................................................................................57 Subsistence Salmon Harvest Assessment Methods ...................................59 2002 Sampling Summary...........................................................................62 2002 Subsistence Salmon Harvest Summary ............................................62 Other Fish...................................................................................................65 Study Findings for Bethel ..........................................................................66 Study Findings for Aniak...........................................................................67 VI. Bristol Bay Area ....................................................................................................75 Background................................................................................................75 Regulations ................................................................................................75 Inseason Management in 2002...................................................................76 Salmon Harvest Assessment Program .......................................................77 Subsistence Salmon Harvests in 2002 .......................................................77 Other Subsistence Fisheries .......................................................................79 VII. Chignik Area..........................................................................................................89 Background................................................................................................89 Regulations ................................................................................................89 Harvest Assessment Program ....................................................................89 Subsistence Salmon Harvests in 2002 .......................................................90 Other Chignik Area Subsistence Fisheries ................................................91 VIII. Alaska Peninsula Area ...........................................................................................99 Background................................................................................................99 Regulations ................................................................................................99 Salmon Harvest Assessment Program .......................................................99
i

Subsistence Salmon Harvests in 2002 .....................................................100 Other Subsistence Fisheries .....................................................................100 IX. Aleutian Islands Area...........................................................................................107 Unalaska District: Subsistence Salmon Fishery .....................................107 Adak District............................................................................................108 Other Subsistence Salmon Fisheries in the Aleutian Islands...................109 Other Subsistence Fisheries in the Aleutian Islands Area .......................110 X. Kodiak Area .........................................................................................................117 Introduction..............................................................................................117 Regulations ..............................................................................................117 Harvest Assessment Program ..................................................................117 Subsistence Salmon Harvests in 2002 .....................................................118 Other Subsistence Fisheries .....................................................................119 XI. Cook Inlet Area....................................................................................................125 Introduction..............................................................................................125 Port Graham and Koyuktolik Subdistricts ...............................................125 Seldovia Subsistence Fishery...................................................................127 Tyonek Subdistrict ...................................................................................128 Upper Yentna River Fish Wheel Fishery.................................................129 XII. Prince William Sound Area .................................................................................139 Introduction..............................................................................................139 Upper Copper River Subsistence Fishery: Glennallen Subdistrict ..........139 Upper Copper River Subsistence Fishery: Chitina Subdistrict...............142 Batzulnetas Subsistence Fishery ..............................................................143 Copper River District Subsistence Fishery ..............................................144 Eastern District Subsistence Salmon Fishery ..........................................144 Southwestern District Subsistence Salmon Fishery.................................145 Prince William Sound: General Districts.................................................146 Other Subsistence Fisheries in the Prince William Sound Area..............146 XIII. Southeast/Yakutat Region....................................................................................169 Background..............................................................................................169 Harvest Assessment Program ..................................................................169 Subsistence Salmon Harvests in 2002 – Regional Overview ..................171 Yakutat Management Area: Yakutat Subsistence Salmon Fishery ........176 Haines Management Area: Haines and Klukwan Subsistence Salmon Fisheries:.....................................................................................178 Juneau Management Area: Angoon Subsistence Salmon Fisheries ...................................................................................................183 Juneau Management Area: Hoonah Subsistence Salmon Fisheries......................................................................................186 Juneau Management Area: Elfin Cove, Gustavus, Pelican, Tenakee Springs Subsistence and Personal Use Fishing .........................188 Juneau Management Area: Juneau Subsistence and Personal Use Fishing.........................................................................190
Sitka Management Area: Sitka Subsistence Salmon Fisheries ...................................................................................................192
ii

Petersburg/Wrangell Management Area: Kake Subsistence Salmon Fisheries ..................................................................196 Petersburg/Wrangell Management Area: Petersburg Subsistence and Personal Use Fisheries ......................................................................199 Petersburg/Wrangell Management Area: Wrangell Subsistence and Personal Use Fisheries ......................................................................202 Petersburg/Wrangell Management Area: Point Baker/Port Protection Subsistence Fisheries ...............................................................................203 Ketchikan Management Area: Craig, Klawock, and Hydaburg Subsistence Fisheries ...............................................................................205 Ketchikan Management Area: Kasaan Subsistence and Eastern Prince of Wales Personal Use ..................................................................209 Ketchikan Management Area: Saxman and Metlakatla Subsistence and Ketchikan Personal Use Fisheries: ..............................213
References Cited ..............................................................................................................217
iii

LIST OF TABLES Table II-1. Alaska Subsistence Salmon Harvests by Fishery and Species, 2002..........................................................................10 Table II-2. Alaska Subsistence Salmon Harvests by Species and Place of Residence of Fisher, 2002 .....................................................11 Table II-3. Historic Alaska Subsistence Salmon Harvests, 1994 – 2002 ....................18 Table III-1. 2002 Northwest Alaska Subsistence Salmon Harvests by District and Species...............................................................................32 Table III-2. 2002 Northwest Alaska Subsistence Salmon Harvests by Community ...........................................................................................33 Table III-3. Northwest Alaska Subsistence Salmon Harvests by District, 1994 – 2002..............................................................34 Table III-4. 2002 Northwest Alaska Subsistence Salmon Harvests by Resident Community of Fishing Household.........................................35 Table III-5. Northwest Alaska Historic Subsistence Salmon Harvests, 1975-2002 .....36 Table III-6. Sheefish and Whitefish Harvests by Community in the Kotzebue District, 2002 .............................................................................37 Table III-7. Sheefish, Whitefish, and Char Harvests in the Kotzebue District, 1995 – 2002 .................................................................38 Table IV-1. 2002 Subsistence Salmon Harvests by Community, Yukon Management Area ..........................................................................47 Table IV-2. Historic Subsistence Salmon Harvests, Yukon Management Area ..........................................................................49 Table IV-3. Comparison of Amounts Necessary for Subsistence (ANS) Determinations and Estimated Subsistence Harvests, 1998 – 2002 ..........50 Table V-1. 2002 Subsistence Salmon Harvests by Community: Kuskokwim Management Area .................................................................69 Table V-2. Historic Subsistence Salmon Harvests: Kuskokwim Area, 1960 –2002 ..................................................................70 Table V-3. Reported Number of Households Harvesting Salmon by Gear Type, Kuskokwim Area Subsistence Fishery, 2002 .........................71 Table V-4. 2002 Estimated Subsistence Harvest of Fish, Bethel Surveys...................72 Table V-5. 2002 Estimated Subsistence Harvest of Fish, Aniak Surveys ...................73 Table VI-1. Subsistence Salmon Harvest by Species, by District and Location Fished, Bristol Bay, 2002...................................82 Table VI-2. Historic Subsistence Salmon Harvests: Bristol Bay Management Area, 1979 – 2002................................................................83 Table VI-3. Bristol Bay Subsistence Salmon Harvest by Species and Community of Residence, 2002..........................................................84 Table VI-4. Uses and Harvests of Fish Other Than Salmon, Bristol Bay Communities...........................................................................86 Table VI-5. Nonsalmon Finfish Known to be Used for Subsistence Purposes in the Bristol Bay Area ...........................................87 Table VII-1. Historic Subsistence Harvests of Salmon, Chignik Management Area, 1976 – 2002 ..................................................92
iv

Table VII-2. Chignik Area Subsistence Salmon Harvests by Species and Community of Residence, 2002........................................93 Table VII-3. Chignik Area Subsistence Salmon Harvests by Species and Subarea of Harvest, 2002..................................................94 Table VII-4. Finfish Other Than Salmon Used for Subsistence Purposes in Communities of the Chignik Management Area, 1989 .........................95 Table VII-5. Marine Invertebrates Used for Subsistence Purposes in Communities of the Chignik Management Area, 1989 .........................96 Table VIII-1. Historic Subsistence Salmon Harvests, Alaska Peninsula Area, 1985 – 2002 .......................................................102 Table VIII-2. Estimated Subsistence Salmon Harvests, Alaska Peninsula Area by Community and Species, 2002 ..................................103 Table VIII-3. Percentage of Households Using Selected Non-Salmon Finfish, Alaska Peninsula Area Communities.......................................................104 Table IX-1. Historic Subsistence Salmon Harvests, Unalaska District, 1985 – 2002................................................................111 Table IX-2. Estimated Subsistence Salmon Harvests, Unalaska District, by Community and Species, 2002 ...........................................................112 Table IX-3. Estimated Personal Use and Subsistence Harvests of Salmon, Adak District, 1988 – 2002......................................................................113 Table IX-4. Estimated Subsistence Harvests of Salmon: Akutan, Atka, and Nikolski .....................................................................114 Table X-1. Historic Subsistence Salmon Harvests, Kodiak Management Area, 1981 – 2002..............................................................120 Table X-2. Reported Subsistence Salmon Harvests, Kodiak Area, by Community and Species, 2002 ...........................................................121 Table XI-1. 2002 Subsistence Salmon Harvests by Community, Port Graham/Koyuktolik Subdistricts......................................................130 Table XI-2. Historic Subsistence Salmon Harvests: Port Graham and Koyuktolik Subdistricts, 1981 – 2002...............................................131 Table XI-3. Historic Subsistence Salmon Harvests: Seldovia Fishery, 1996 – 2002................................................................................132 Table XI-4. Tyonek Subdistrict Subsistence Salmon Harvests by Community, 2002 ....................................................................................133 Table XI-5. Historic Subsistence Salmon Harvests: Tyonek Subdistrict, 1980 – 2002 .............................................................134 Table XI-6. Subsistence Salmon Harvests, Upper Yentna River Fish Wheel Fishery by Community, 2002 ...............................................135 Table XI-7. Historic Subsistence and Personal Use Salmon Harvests, Upper Yentna River Fish Wheel Fishery, 1996 – 2002...........................136 Table XII-1. Subsistence Harvests by Village Fish Wheel Permit Holders, Glennallen Subdistrict ...................................................147 Table XII-2. Number of State and Federal Subsistence Permits Issued and Number of Households Obtaining Permits by Subdistrict and Gear Type, 2002...............................................................................148
v

Table XII-3. Historic Subsistence Salmon Harvests, Glennallen Subdistrict, 1988 – 2002........................................................149 Table XII-4. Subsistence Salmon Harvests, Glennallen Subdistrict, by Area of Residence and Gear Type, 2002 ............................................150 Table XII-5. 2002 Subsistence Salmon Harvests by Community, Glennallen Subdistrict – All Gear............................................................151 Table XII-6. 2002 Subsistence Salmon Harvests by Community: Glennallen Subdistrict – Fish Wheels......................................................153 Table XII-7. 2002 Subsistence Salmon Harvests by Community: Glennallen Subdistrict – Dip Nets ...........................................................154 Table XII-8. 2002 Subsistence Salmon Harvests by Community: Glennallen Subdistrict – Rod and Reel....................................................155 Table XII-9. Historic Subsistence and Personal Use Salmon Harvests, Chitina Subdistrict, 1988 – 2002 .............................................................156 Table XII-10. 2002 Subsistence Salmon Harvests by Gear Type: Chitina Subdistrict, Federal Permits ........................................................157 Table XII-11. 2002 Subsistence Harvest by Community: Chitina Subdistrict (state permits only) ...................................................158 Table XII-12. 2002 Subsistence Salmon Harvests by Community and Gear Type: Chitina Subdistrict Federal Permits .....................................161 Table XII-13. Historic Subsistence Salmon Harvests, Batzulnetas Fishery, 1987 – 2002................................................................................162 Table XII-14. Historic Subsistence Salmon Harvests, Copper River District (Copper River Flats), 1965 – 2002.......................163 Table XII-15. Historic Subsistence Harvests of Salmon, Eastern Prince William Sound, 1988 – 2002........................................................164 Table XII-16. Estimated Harvests of Salmon for Home Use, Tatitlek, 1998.................165 Table XII-17. Historic Subsistence Salmon Harvests, Southwestern Prince William Sound, 1988 – 2002........................................................166 Table XII-18. Estimated Harvests of Salmon for Home Use, Chenega Bay, 1998 ..................................................................................167 Table XII-19. Historic Subsistence Salmon Harvests, General Prince William Sound Area, 1960 - 2002 .................................168 Table XIII-1. Subsistence and Personal Use Salmon Harvests by District and Species, Southeast/Yakutat Region, 2002.......................172 Table XIII-2. Southeast Alaska/Yakutat Region Subsistence and Personal Use Salmon Harvests by Fishing Areas Discussed in Chapter XIII, 2002 .....173 Table XIII-3. 2002 Subsistence and Personal Use Salmon Harvest by Community, Southeast/Yakutat Region...................................................174 Table XIII-4. Historic Subsistence and Personal Use Salmon Harvests, Southeast/Yakutat Region, 1985 – 2002..................................................175 Table XIII-5. Yakutat Forelands and Yakutat Bay: Yakutat Subsistence/Personal Use Salmon Fisheries, Permit Estimated Harvest, by Community, 2002 .............................................................................. 177 Table XIII-6. Yakutat Community Subsistence/Personal Use Salmon Permit Estimated Harvest, 2002 ..........................................................................177
vi

Table XIII-7. Lynn Canal/Chilkat Inlet – District 15: Haines and Klukwan Subsistence/Personal Use Salmon fisheries, Permit Estimated Harvest by Community, 2002..................................................................181 Table XIII-8. Haines and Klukwan Community Subsistence/Personal Use Salmon Permit Estimated Harvest, 2002 .................................................181 Table XIII-9. Angoon/North Chatham Strait/East Chichagof – District 12, Plus Portion District 12 – Sitkoh Bay, Angoon Subsistence Salmon Permit Estimated Harvest by Community 2002 .........................185 Table XIII-10. Angoon Community Subsistence/Personal Use Salmon Permit Estimated Harvest, .......................................................................185 Table XIII-11. Icy Strait/Glacier Bay – District 14, Plus Portion District 13: Hoonah Subsistence/Personal Use Salmon Permit Estimated Harvest by Community, 2002..................................................................187 Table XIII-12. Hoonah Community Salmon Subsistence/Personal Use Permit Estimated Harvest, 2002 .............................................................188 Table XIII-13. Elfin Cove Community Subsistence/Personal Use Salmon Permit Estimated Harvest, 2002 ..............................................................189 Table XIII-14. Gustavus Community Subsistence/Personal Use Salmon Permit Estimated Harvest, 2002 ..........................................................................189 Table XIII-15. Pelican Community Subsistence/Personal Use Salmon Permit Estimated Harvest, 2002 ..........................................................................189 Table XIII-16. Tenakee Springs Community Subsistence/Personal Use Salmon Estimated Harvest, 2002.............................................................189 Table XIII-17. Skagway Community Subsistence/Personal Use Salmon Estimated Harvest, 2002.............................................................190 Table XIII-18. Juneau/Taku Inlet/Stephens Passage – District 11: Juneau Area Subsistence/Personal Use Salmon Permit Estimated Harvest by Community, 2002..................................................................191 Table XIII-19. Juneau Community Subsistence/Personal Use Salmon Permit Estimated Harvest, 2002 .................................................191 Table XIII-20. Sitka/Outer Baranof and Chichagof/Peril Strait – District 13 (except Sitkoh Bay, Surge Bay, and Hoktaheen Cove) Sitka Subsistence/Personal Use Salmon Permit Estimated Harvest by Community, 2002 ...............................................................................194 Table XIII-21. Sitka Community Subsistence/Personal Use Salmon Permit Estimated Harvests , 2002........................................................................195 Table XIII-22. South Chatham/West Frederick Sound – District 9 and Sumner Strait – District 5: Kake Area Subsistence/Personal Use Salmon Permit Estimated Harvest by Community, 2002.................198 Table XIII-23. Kake Community Subsistence/Personal Use Salmon Permit Estimated Harvest 2002 ...............................................................198 Table XIII-24. Portion District 6 – East Sumner Strait/North Frederick Sound [Sumner Strait/Pt. Baker/Macnamara and Wrangell Narrows] – Point Baker/Port Protection and Petersburg Area Subsistence/Personal Use Salmon Permit Estimated Harvest by Community 2002 ................................................................................201
vii

Table XIII-25. Petersburg Community Subsistence/Personal Use Salmon Permit Estimated Harvest, 2002 ..............................................................201 Table XIII-26 East Etolin Island/Wrangell Island/Ernest Sound –District 7 Wrangell: Wrangell Area Subsistence/Personal Use Salmon Permit Estimated Harvest by Community, 2002 ....................................202 Table XIII-27. Wrangell Community Subsistence/Personal Use Salmon Permit Estimated Harvest, 2002 ..........................................................................202 Table XIII-28. Point Baker Community Subsistence/Personal Use Salmon Permit Estimated Harvest, 2002 ..........................................................................204 Table XIII-29. Inside Waters/West Prince of Wales Island – District 3: Craig/Klawock/Hydaburg Area Subsistence/Personal Use Salmon Permit Estimated Harvest by Community, 2002.................207 Table XIII-30. Craig Community Subsistence/Personal use Salmon Permit Estimated Harvests by Location, 2002 ....................................................208 Table XIII-31.Klawock Community Subsistence/Personal Use Salmon Permit Estimated Harvests by Location, 2002.........................................208 Table XIII-32. Hydaburg Community Subsistence/Personal Use Salmon Permit Estimated Harvest, 2002 ..............................................................209 Table XIII-33. Clarence Strait/East Prince of Wales Island – District 2, plus Portion District 6: Kasaan and Eastern Prince of Wales Island Area Subsistence/Personal Use Salmon Permit Estimated Harvest by Community, 2002..................................................................211 Table XIII-34. Coffman Cove Community Subsistence/Personal Use Salmon Permit Estimated Harvest, 2002 ................................................211 Table XIII-35. Kasaan Community Subsistence/Personal Use Salmon Permit Estimated Harvest, 2002 ..............................................................211 Table XIII-36. Hollis Community Subsistence/Personal Use Salmon Permit Estimated Harvest, 2002 ..............................................................212 Table XIII-37. Thorne Bay Community Subsistence/Personal Use Salmon Permit Estimated Harvests by Location, 2002.........................................212 Table XIII-38. Ketchikan/Behm Canal – District 1: Ketchikan Area Subsistence/Personal Use Salmon Permit Estimated Harvest, by Community, 2002.................................................................214 Table XIII-39. Ketchikan Community Subsistence/Personal Use Permit Estimated Harvest, 2002 ..........................................................................215
LIST OF FIGURES Figure I-1. Alaska Subsistence Fisheries Areas ..........................................................5 Figure II-1. Composition of Subsistence Harvest by Rural Alaska Residents .............7 Figure II-2. Alaska Subsistence Salmon Harvest by Species, 2002 ...........................19 Figure II-3. Alaska Subsistence Salmon Harvest by Area, 2002................................20 Figure II-4. Alaska Subsistence Chinook Salmon Harvest by Area, 2002.................20
viii

Figure II-5. Alaska Subsistence Sockeye Salmon Harvest by Area, 2002 .................21 Figure II-6. Alaska Subsistence Chum Salmon Harvest by Area, 2002.....................21 Figure II-7. Alaska Subsistence Coho Salmon Harvest by Area, 2002 ......................22 Figure II-8. Alaska Subsistence Pink Salmon Harvest by Area, 2002 .......................22 Figure III-1. Species Composition of Subsistence Salmon Harvests, 2002 Norton Sound, Port Clarence, and Kotzebue Districts ............................39 Figure IV-1. Map of the Alaskan Portion of the Yukon River Drainage Showing Communities and Fishing Districts ..........................................51 Figure IV-2. Yukon Area Subsistence Salmon Harvests, 2002 ...................................52 Figure IV-3. Yukon River Subsistence Salmon Harvests by Species, 1988 – 2002 ....53 Figure IV-4. Estimated Number of Dogs by Fishing District, Yukon Area, 2002.......54 Figure IV-5. Primary Gear Type Utilized for Subsistence Salmon Fishing, Yukon Area, 2002 .....................................................................55 Figure V-1. Composition of Subsistence Salmon Harvest by Species, Kuskokwim Area, 2002...........................................................................74 Figure VI-1. Composition of Bristol Bay Area Subsistence Salmon Harvest by Species, 2002 ...........................................................88 Figure VI-2. Subsistence Salmon Harvests by District, Bristol Bay Management Area, 2002 ......................................................88 Figure VII-1. Composition of Chignik Area Subsistence Salmon Harvest by Species, 2002 ........................................................................97 Figure VII-2. Subsistence Salmon Harvests by Community, Chignik Management Area, 2002............................................................97 Figure VIII-1. Composition of Alaska Peninsula Area Subsistence Salmon Harvest by Species, 2002 .........................................................105 Figure VIII-2. Subsistence Salmon Harvests by Community, Alaska Peninsula Management Area, 2002...........................................105 Figure IX-1. Composition of Unalaska District Subsistence Salmon Harvest by Species, 2002 .....................................115 Figure X-1. Composition of Kodiak Area Subsistence Salmon Harvest by Species, 2002 ......................................................................123 Figure XI-1. Composition of Subsistence Salmon Harvest, Port Graham/Koyuktolik Subdistricts, 2002 .........................................137 Figure XIII-1 ADF&G Salmon and Shellfish Fishery Statistical Areas, Southeastern Alaska, Chart No. 4..........................................................179 Figure XIII-2 ADF&G Salmon and Shellfish Fishery Statistical Areas, Southeastern Alaska, Chart No. 3..........................................................182 Figure XIII-3 ADF&G Salmon and Shellfish Fishery Statistical Areas, Southeastern Alaska, Chart No. 2..........................................................197 Figure XIII-4 ADF&G Salmon and Shellfish Fishery Statistical Areas, Southeastern Alaska, Chart No. 1..........................................................206
ix

ACKNOWLEDGEMENTS Every year, thousands of Alaska residents who participate in subsistence fisheries take the time to provide harvest information to the Alaska Department of Fish and Game. We gratefully acknowledge their support, because without it, a report like this would be impossible to produce. We also thank the many Department of Fish and Game staff in the divisions of Commercial Fisheries, Sport Fish, and Subsistence who annually conduct the programs that collect, analyze, and report subsistence fisheries harvest data. They, too, made this report possible. Many department personnel generously took the time to be interviewed by Division of Subsistence staff about harvest assessment programs and subsistence harvest databases. They provided many insights about these programs that we have relied upon in developing the Alaska Subsistence Fisheries Database and evaluating the data that appear in this report. We very much appreciate their help. We also thank the Subsistence Fisheries Harvest Assessment Working Group, composed of federal, tribal, and state representatives, for providing guidance in the preparation of this report series, including important commentary on existing harvest assessment programs. Finally, we thank the Office of Subsistence Management of the US Fish and Wildlife Service for helping to fund the preparation of this report and the supporting database. As we note in the report itself, this is the fourth in a series of statewide summaries of subsistence fisheries harvest data. While we have received a lot of help in compiling the report, we take full responsibility for any errors or shortcomings it may contain. We encourage the users of the report to share with us their ideas on how we can improve upon this effort in the future.
x

I. INTRODUCTION This is the fourth in a series of annual reports on Alaska’s subsistence fisheries. It was prepared by the Division of Subsistence of the Alaska Department of Fish and Game (ADF&G). Funding was provided through a cooperative agreement with the US Fish and Wildlife Service, Office of Subsistence Management (Project No. FIS 01-107; USFWS Agreement No.701811J335; ADF&G COOP-01-074). “Subsistence fishing” is defined in state law as taking of fish, shellfish, or other fisheries resources by Alaska residents for subsistence uses (AS 16.05.940[30]). “Subsistence uses” of wild resources are defined as “noncommercial, customary and traditional uses” for a variety of purposes, including:
Direct personal or family consumption as food, shelter, fuel, clothing, tools, or transportation, for the making and selling of handicraft articles out of nonedible by-products of fish and wildlife resources taken for personal or family consumption, and for the customary trade, barter, or sharing for personal or family consumption (AS 16.05.940[32]).
Under Alaska’s subsistence statute, the Alaska Board of Fisheries must identify fish stocks that support subsistence fisheries and, if there is a harvestable surplus of these stocks, adopt regulations that provide reasonable opportunities for these subsistence uses to take place. Whenever it is necessary to restrict harvests, subsistence fisheries have a preference over other uses of the stock (AS 16.05.258). Also, the Joint Board of Fisheries and Game is required is identify “nonsubsistence areas,” where “dependence upon subsistence is not a principal characteristic of the economy, culture, and way of life of the area or community” (AS 16.05.258 (c)). The Board of Fisheries may not authorize subsistence fisheries in nonsubsistence areas. Personal use fisheries (see below) provide opportunities for harvesting fish with gear other than rod and reel in nonsubsistence areas. The Joint Board has identified five nonsubsistence areas (5 AAC 99.015): Ketchikan Nonsubsistence Area, Juneau Nonsubsistence Area, Anchorage-Matsu-Kenai Nonsubsistence Area, Fairbanks Nonsubsistence Area, and Valdez Nonsubsistence Area. In addition to subsistence, Alaska law recognizes three other categories of fishing: commercial, sport, and personal use. Commercial fishing is the taking of fish “with the intent of disposing of them for profit, or by sale, barter, trade, in commercial channels” (AS 16.05.940[5]). Sport fishing is defined by Alaska law as the taking “for personal use, and not for sale or barter, any fresh water, marine, or anadromous fish by hook and line held in the hand, or by hook and line with the line attached to a pole or rod which is held in the hand or closely attended, or by other means defined by the Board of Fisheries” (AS 16.05.940[29]). Personal use fishing is defined by statute as the taking of fish “by Alaska residents for personal use and not for sale or barter, with gill or dip net, seine, fish wheel, long line, or other means defined by the Board of Fisheries” (AS 16.05.940[24]). Personal use fisheries differ from subsistence fisheries in that they do not meet the criteria established by the Joint Board for identifying customary and traditional fisheries (5 AAC 99.010) or they occur within nonsubsistence areas.
1

Every year, ADF&G’s Division of Commercial Fisheries prepares “annual management reports” (AMRs) for most fishery management areas in the state. Figure I-1 shows the location of these management areas. Although the AMRs focus primarily on commercial fisheries, they routinely summarize basic data for programs that collect harvest information for subsistence fisheries. In a few areas, more detailed annual reports about subsistence fisheries harvest assessment programs are prepared. These include Northwest Alaska, the Yukon River, and the Kuskokwim River. However, until this annual report series began in 1999, there was no single source that compiled subsistence fisheries harvest data from all management areas. That is the purpose of this report for 2002. At the outset, it is important to acknowledge the limitations that are faced when trying to present a comprehensive annual report on Alaska’s subsistence fisheries. These limitations include the following points.
• Annual harvest assessment programs do not take place for all subsistence fisheries.
Programs are in place for most salmon fisheries, but few other finfish fisheries or shellfish fisheries have annual harvest monitoring programs.
• Annual harvest data are mostly, but not entirely, limited to fisheries classified as subsistence by regulation, which for salmon generally means fish taken with nets, seines, or fish wheels. In some parts of the state, substantial numbers of fish for home use are taken with rod and reel (in most areas considered sport gear by regulation) or retained from commercial harvests. With the exceptions noted in the individual chapters on each area, these harvests are not included in the subsistence harvest estimates in this report because they are not covered in annual harvest assessments. Therefore, the harvest data in this report are a conservative estimate of the number of salmon being taken for subsistence use in Alaska. Underestimates of subsistence salmon harvests are particularly an issue in the Southeast Region (see Chapter XIII on the Southeast Region).
• Between management areas, and sometimes between districts within management areas, there is inconsistency in how subsistence harvest data are collected, analyzed, and reported.
• In some areas, there are no routine mechanisms for evaluating the quality of the subsistence harvest data. For example, in some areas it is not known if all subsistence fishers are obtaining permits and providing harvest reports. This can result in a large underestimate of harvests.
• There are also few programs for contextualizing subsistence harvest data each year to provide information to interpret changes in harvests. In some cases, however, AMRs do contain discussions of data limitations and harvest trends.
Despite these limitations, it is possible to present a reasonable, conservative statewide overview of subsistence harvests of salmon. Information for all areas of the state where salmon occur are covered in this report. We have included data for personal use salmon fisheries in the Yukon Management Area and Southeast Region because these fisheries have been classified as subsistence fisheries in the past and because they are administered in the same programs that collect subsistence harvest data. We have not included data from the Cook Inlet Management Area personal use salmon fisheries in this statewide overview, primarily because most of these fisheries have relatively short histories and are administered separately from the Cook Inlet
2

subsistence fisheries. However, we intend to add data from these personal use fisheries in future versions of the Alaska Subsistence Fisheries Database (see below) and include summaries in future annual reports in order to present a more comprehensive overview of non-recreational fish harvests for home use in the state. The coverage for other finfish and for shellfish is very uneven. For other finfish, if annual subsistence harvest data are collected, they are reported here if the summary data were available to the Division of Subsistence. In other areas, we have usually noted which are the major species used for subsistence, generally relying on baseline studies conducted by the Division. In a few cases, we have drawn from reports prepared for the Alaska Board of Fisheries. We have not attempted to provide a comprehensive overview of subsistence shellfish harvests in this report. This is largely because the statewide database development (see immediately below) has not yet located, reviewed, and summarized existing data. Future annual reports will provide historical data for subsistence shellfish as well as overviews of the study year. In 1988, the Division of Subsistence, ADF&G, prepared the first version of the “Historic Subsistence Salmon Harvest Database” (HSSHDB). As part of the same cooperative agreement that supported the development of this annual report series, this database was updated, upgraded, and renamed the “Alaska Subsistence Fisheries Database” (Caylor and Walker 2003). The database is written for Microsoft Access 2000 software. It is organized by 21 subsistence fisheries, mostly reflecting unique harvest assessment programs and regulatory structures. It contains harvest data by species, year, community of residence of permit holder, and gear type. The number of permits issued and returned each year is reported as well. In developing the database, the most complete data have been sought, which in some cases are more up to date than that reported in AMRs. In most fisheries, reported harvests have been expanded to account for unreturned permits. In a few cases, this results in a larger estimate than in those AMRs that routinely only summarize data from returned permits. Also, the database calculates harvest estimates first for all permit holders living in particular communities represented in the fishery, and then adds these community estimates for a fishery total. This contrasts with the conventional expansion method for a few fisheries (for example, the Glennallen Subdistrict of the Prince William Sound Area) which only considers the total number of issued and returned permits in expansion, and results in a slightly different estimate of the total harvest for those fisheries as reported in AMRs. The goal of this annual report on Alaska’s subsistence fisheries is to treat each fishery in a consistent, systematic manner, rather than to reiterate previously published data. Due to the large size of the database, it is not yet available for downloading from the Internet. The database is presently distributed upon request to the Division of Subsistence on compact disks (CDs) along with the Community Profile Database (CPDB) (Scott et al. 2001), which includes the results of systematic household surveys, and is the primary source for subsistence harvest data for finfish other than salmon and for shellfish. The next chapter of the report is a statewide perspective on subsistence salmon harvests in Alaska in 2002. This is followed by chapters on 11 management areas or, in the case of Southeast Alaska, a region. In a few cases (Northwest, Aleutians, Cook Inlet, and Prince
3

William Sound) harvest assessment programs within areas with different regulations or histories are discussed separately. It is important to note that the preparation of an annual report such as this and the supporting database were two of several objectives of the “Statewide Subsistence Fisheries Harvest Monitoring Strategy” project, funded by the US Fish and Wildlife Service’s Office of Subsistence Management and implemented jointly by the Division of Subsistence of ADF&G and the Alaska Inter-Tribal Council (AI-TC). A key goal of the project was to develop recommendations for a unified subsistence harvest assessment program for Alaska’s subsistence fisheries. These recommendations were developed by a Working Group composed of state, federal, and tribal members. The recommendations are available as a separate document (ADF&G and AI-TC 2000a) and a final report with an overview of all the project activities is also available (ADF&G and AI-TC 2000b). The final report also includes a set of comments on existing subsistence harvest assessment programs, based on interviews of ADF&G staff conducted by the Division of Subsistence as well as Working Group discussions. We have drawn on these comments for most of the evaluations of harvest data in this annual report. As background for the Working Group’s efforts, Division of Subsistence staff prepared detailed overviews of current subsistence fisheries harvest assessment programs. These are the basis of the descriptions of these programs that appear in this report. This annual report is the result of the work of a number of Division of Subsistence staff. James Fall and Dave Caylor were the primary compilers of the information. Robert Walker, and formerly Charles Utermohle and Gretchen Jennings, assisted with developing the harvest database. Several other staff prepared chapters of the report, including Susan Georgette (Northwest), Tracie Krauthoefer (Kuskokwim), Caroline Brown (Yukon), and Amy Paige (Southeast). Other Division of Subsistence staff who administer subsistence fisheries harvest assessment programs include Molly Chythlook and Eunice Dyasuk for Bristol Bay; Ron Stanek for Cook Inlet; and Lisa Hutchinson-Scarbrough for Chignik.
4

5
Source: Alaska Department of Fish and Game, Division of Subsistence.
Gulf ofAlaska
Figure I-1.BeaufortSea
ChukchiSea
BeringSea
BristolBay
KuskokwimBay
NortonSound
KotzebueSound


II. OVERVIEW: SUBSISTENCE FISHERIES IN ALASKA
SUBSISTENCE HARVESTS IN RURAL ALASKA Of the estimated 43.7 million pounds of wild foods produced in rural Alaska communities annually, subsistence fisheries contribute about 62 percent – 60 percent from finfish and 2 percent from shellfish (Fig. II-1). On average, this subsistence fisheries harvest provides about 230 pounds of food per person per year in rural Alaska (Wolfe 2000:2). Although producing a major portion of the food supply, subsistence harvests represent just a small part of the annual harvest of wild resources in Alaska, about 2 percent. Commercial fisheries take 97 percent of the wild resource harvest and sport fisheries and hunts take about 1 percent.
Figure II-1. Composition of Subsistence Harvest by Rural Alaska Residents
Fish60%
Land Mammals20%
Birds2%
Shellfish2%
Marine Mammals14%
Wild Plants2%
N = 44 million usable pounds; Source: Wolfe 2000, based on data in the Community Profile Database (Scott et al. 2001)
7
SUBSISTENCE SALMON HARVESTS IN 2002
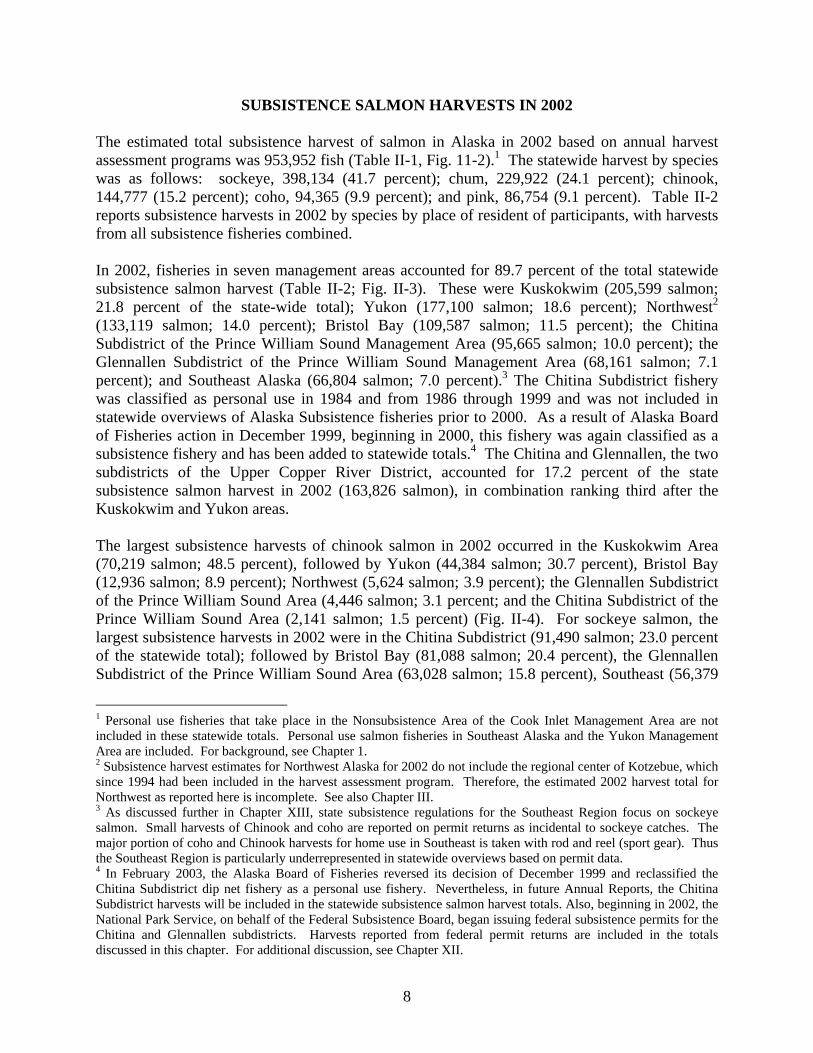
The estimated total subsistence harvest of salmon in Alaska in 2002 based on annual harvest assessment programs was 953,952 fish (Table II-1, Fig. 11-2).1 The statewide harvest by species was as follows: sockeye, 398,134 (41.7 percent); chum, 229,922 (24.1 percent); chinook, 144,777 (15.2 percent); coho, 94,365 (9.9 percent); and pink, 86,754 (9.1 percent). Table II-2 reports subsistence harvests in 2002 by species by place of resident of participants, with harvests from all subsistence fisheries combined.
In 2002, fisheries in seven management areas accounted for 89.7 percent of the total statewide subsistence salmon harvest (Table II-2; Fig. II-3). These were Kuskokwim (205,599 salmon; 21.8 percent of the state-wide total); Yukon (177,100 salmon; 18.6 percent); Northwest2 (133,119 salmon; 14.0 percent); Bristol Bay (109,587 salmon; 11.5 percent); the Chitina Subdistrict of the Prince William Sound Management Area (95,665 salmon; 10.0 percent); the Glennallen Subdistrict of the Prince William Sound Management Area (68,161 salmon; 7.1 percent); and Southeast Alaska (66,804 salmon; 7.0 percent).3 The Chitina Subdistrict fishery was classified as personal use in 1984 and from 1986 through 1999 and was not included in statewide overviews of Alaska Subsistence fisheries prior to 2000. As a result of Alaska Board of Fisheries action in December 1999, beginning in 2000, this fishery was again classified as a subsistence fishery and has been added to statewide totals.4 The Chitina and Glennallen, the two subdistricts of the Upper Copper River District, accounted for 17.2 percent of the state subsistence salmon harvest in 2002 (163,826 salmon), in combination ranking third after the Kuskokwim and Yukon areas. The largest subsistence harvests of chinook salmon in 2002 occurred in the Kuskokwim Area (70,219 salmon; 48.5 percent), followed by Yukon (44,384 salmon; 30.7 percent), Bristol Bay (12,936 salmon; 8.9 percent); Northwest (5,624 salmon; 3.9 percent); the Glennallen Subdistrict of the Prince William Sound Area (4,446 salmon; 3.1 percent; and the Chitina Subdistrict of the Prince William Sound Area (2,141 salmon; 1.5 percent) (Fig. II-4). For sockeye salmon, the largest subsistence harvests in 2002 were in the Chitina Subdistrict (91,490 salmon; 23.0 percent of the statewide total); followed by Bristol Bay (81,088 salmon; 20.4 percent), the Glennallen Subdistrict of the Prince William Sound Area (63,028 salmon; 15.8 percent), Southeast (56,379
1 Personal use fisheries that take place in the Nonsubsistence Area of the Cook Inlet Management Area are not included in these statewide totals. Personal use salmon fisheries in Southeast Alaska and the Yukon Management Area are included. For background, see Chapter 1. 2 Subsistence harvest estimates for Northwest Alaska for 2002 do not include the regional center of Kotzebue, which since 1994 had been included in the harvest assessment program. Therefore, the estimated 2002 harvest total for Northwest as reported here is incomplete. See also Chapter III. 3 As discussed further in Chapter XIII, state subsistence regulations for the Southeast Region focus on sockeye salmon. Small harvests of Chinook and coho are reported on permit returns as incidental to sockeye catches. The major portion of coho and Chinook harvests for home use in Southeast is taken with rod and reel (sport gear). Thus the Southeast Region is particularly underrepresented in statewide overviews based on permit data. 4 In February 2003, the Alaska Board of Fisheries reversed its decision of December 1999 and reclassified the Chitina Subdistrict dip net fishery as a personal use fishery. Nevertheless, in future Annual Reports, the Chitina Subdistrict harvests will be included in the statewide subsistence salmon harvest totals. Also, beginning in 2002, the National Park Service, on behalf of the Federal Subsistence Board, began issuing federal subsistence permits for the Chitina and Glennallen subdistricts. Harvests reported from federal permit returns are included in the totals discussed in this chapter. For additional discussion, see Chapter XII.
8

salmon; 14.2 percent), Kodiak (32,977 salmon; 8.3 percent); and Kuskokwim (27,733 salmon; 7.0 percent) (Fig. II-5). In past recent years, three areas dominated the subsistence chum salmon harvest in 2002: Yukon (107,739 salmon; 46.9 percent of the statewide harvest), Kuskokwim (73,234 salmon; 31.9 percent); and Northwest (37,396 salmon; 16.3 percent) (Fig. II-6). Of the statewide subsistence harvest of coho salmon in 2002, the most were taken in the Kuskokwim drainage (34,413 salmon; 36.5 percent), followed by Northwest (17,838 salmon; 18.9 percent), Yukon (16,551 salmon; 17.5 percent), Bristol Bay (6,565 salmon; 7.0 percent), Kodiak Island (6,057 salmon; 6.4 percent), Alaska Peninsula (3,188 salmon; 3.4 percent); and Southeast (3,176 salmon; 3.4 percent) (Fig. II-7). Finally, by far the largest portion of the statewide pink salmon subsistence harvest in 2002 occurred in Northwest Alaska (67,756 salmon; 78.1 percent), followed by Yukon (8,425 salmon; 9.7 percent); Southeast (3,210 salmon; 3,7 percent), Bristol Bay (2,341 salmon; 2.7 percent); and the Port Graham Subdistrict of the Cook Inlet Management Area (1,831 salmon; 2.1 percent) (Fig. II-8).
STATEWIDE SUBSISTENCE SALMON HARVESTS, 1994 - 2002
Table II-3 reports estimated statewide subsistence salmon harvests for 1994 through 2002
based on annual harvest assessment programs. Harvest estimates for the Chitina Subdistrict have been included for the years 1994 through 1999, although the fishery was classified as personal use during that period. Statewide estimates for years prior to 1994 are not available based on annual harvest assessment programs because data for key fisheries, such as most of the Northwest Alaska fisheries, were not regularly collected. There appears to be a downward trend in the statewide total over the nine-year period reported in Table II-3. The estimate for 2002 of 953,952 salmon was the lowest over the nine-year period and below the recent five-year average of 1,041,363 salmon. Accounting for much of this decline is a drop in subsistence harvests in the Yukon Area (from 344,049 salmon in 1994 to 152,300 salmon in 2000 and 177,100 salmon in 2002; see Chapter IV) and the Kuskokwim Area (from 251,112 salmon in 1994 to 204,714 salmon in 2000 and 205,599 salmon in 2001; see Chapter V). Subsistence salmon harvests in the Bristol Bay Management Area have also dropped substantially, from 157,787 in 1994 to 109,587 in 2002, the third lowest on record (see Chapter VI).
9

Table II-1. Alaska Subsistence Salmon Harvests, 2002
Fishery1 Total2 Included Chinook Sockeye Coho Chum Pink TotalAdak District 3 3 0 150 0 0 0 150Alaska Peninsula Management Area 157 133 345 9,384 3,188 1,603 532 15,052Batzulnetas Fishery 1 1 0 208 0 0 0 208Bristol Bay Management Area 1,093 994 12,936 81,088 6,565 6,658 2,341 109,587Chignik Management Area 120 86 74 10,092 1,401 23 390 11,980Chitina Subdistrict: State 6,804 5,736 2,093 90,655 2,034 0 0 94,782Chitina Subdistrict: Federal 122 90 48 835 0 0 0 883Copper River Flats 355 331 589 3,289 30 2 0 3,910Glennallen Subdistrict3 1,308 1,162 4,446 63,028 686 1 0 68,161Kodiak Management Area 2,271 2,271 593 32,977 6,057 350 1,665 41,642Kuskokwim Management Area 4,339 2,798 70,219 27,733 34,413 73,234 0 205,599Northwest Alaska 1,327 1,204 5,624 4,504 17,838 37,396 67,756 133,119Port Graham & Koyuktolik Subdistricts 79 79 346 10,620 1,057 488 1,831 14,342Prince William Sound (General) 11 9 0 38 0 9 11 57PWS Eastern District (Tatitlek) 19 8 6 437 278 66 71 858PWS Southwestern District (Chenega Bay) 10 5 10 142 123 60 83 418Seldovia Fishery 20 20 124 234 13 11 31 413Southeast / Yakutat Region 3,326 2,732 1,857 56,379 3,176 2,183 3,210 66,804Tyonek Fishery 101 71 1,080 209 115 4 9 1,417Unalaska District 231 180 3 5,678 707 65 385 6,837Upper Yentna Fishery 25 22 0 454 133 31 14 632Yukon Management Area 2,775 1,254 44,384 0 16,551 107,739 8,425 177,100Totals 24,497 19,189 144,777 398,134 94,365 229,922 86,754 953,952
1 Estimates for the Yukon and Southeast fisheries include both subsistence and personal use harvests.2 Because the numbers of permits issued for the Kodiak and Port Graham/Koyuktolik fisheries are unknown, the numbers of permits returned are used in place of these values.3 Includes harvests with state and federal subsistence permits.
SOURCE: Alaska Department of Fish and Game, Division of Subsistence, Alaska Subsistence Fisheries Database, Version 3.3.
Households / Permits Estimated Salmon Harvest
10

11
Community Total Included Chinook Chum PinkAdak Station 4 4 0 230 0 0 0 230Afognak Island 2 2 0 61 0 0 0 61Akhiok 12 12 0 206 16 9 49 280Akiachak 132 102 6,860 2,440 1,620 5,048 0 15,968Akiak 71 55 3,340 1,195 1,113 2,527 0 8,175Alakanuk 131 39 1,773 0 183 7,860 130 9,946Alatna 6 5 3 0 0 25 0 28Aleknagik 21 18 306 1,082 72 57 0 1,517Alexander Creek 2 2 0 0 0 0 0 0Allakaket 49 13 200 0 56 6,342 0 6,598Anchor Point 2 2 0 20 0 0 0 20Anchorage 2,197 1,872 1,755 38,719 934 137 76 41,621Anderson 8 7 1 145 20 0 0 166Angoon 91 58 0 1,178 63 33 105 1,379Aniak 166 164 2,994 725 2,628 3,002 23 9,372Anvik 33 30 708 0 0 1,490 0 2,198Atmautluak 56 46 1,282 1,015 591 2,189 0 5,077Auke Bay 26 18 0 116 6 2 0 124Barrow 12 6 5 316 0 0 0 321Bear Lake 1 1 0 115 0 0 0 115Beaver 26 18 702 0 17 78 0 797Beluga 2 2 2 0 27 0 0 29Bethel 1,501 1,313 19,305 7,350 12,966 15,082 0 54,703Bettles 25 20 0 50 0 0 0 50Big Lake 43 35 20 711 10 2 0 743Birch Creek 8 5 67 0 0 0 0 67Bird Creek 1 0Brevig Mission 71 67 65 2,127 1,741 1,534 2,347 7,814Buckland 1 1 0 0 0 0 0 0Cantwell 2 2 0 30 0 0 0 30Central 19 17 262 77 0 0 0 339Chalkyitsik 40 27 26 0 0 4 0 30Chefornak 93 0Chickaloon 6 5 3 160 5 0 0 168Chicken 1 1 1 29 0 0 0 30Chignik Bay 17 15 9 1,306 170 0 0 1,485Chignik Lagoon 32 22 32 2,396 68 0 0 2,496Chignik Lake 23 20 8 2,979 75 0 0 3,062Chiniak 27 27 6 361 242 17 10 636Chisana 1 1 4 73 0 0 0 77
[continued]
Table II-2. Alaska Subsistence Salmon Harvests by Species and Place of Residence of Fisher, 2002
Households / Permits
Estimated Salmon Harvest
Sockeye CohoTotal
Salmon

12
Community Total Included Chinook Chum PinkChistochina 1 1 1 1 0 0 0 2Chitina 49 32 107 2,794 14 0 0 2,915Chuathbaluk 30 22 663 337 607 1,553 0 3,160Chugiak 139 124 122 2,567 111 2 29 2,831Circle 29 27 1,655 0 0 85 0 1,740Clarks Point 13 10 176 553 165 20 51 965Clear AFB 4 4 1 76 0 0 0 77Coffman Cove 31 29 0 141 0 0 0 141Cold Bay 21 20 0 497 0 15 0 512College 1 1 0 0 0 0 0 0Cooper Landing 5 3 1 241 0 0 0 242Copper Center 146 129 459 7,449 77 1 0 7,986Cordova 7 6 10 403 0 0 0 413Craig 181 149 0 2,161 18 197 129 2,505Crooked Creek 34 28 790 413 420 1,266 0 2,889Delta Junction 269 237 127 4,539 36 0 0 4,702Denali Park 8 6 1 26 6 0 0 33Dillingham 333 300 5,595 12,070 3,588 2,072 1,051 24,376Dot Lake 8 7 5 35 0 0 0 40Douglas 48 34 0 408 11 9 0 428Dutch Harbor 113 88 2 2,408 197 35 65 2,707Eagle 43 38 2,195 0 1 416 0 2,612Eagle River 387 354 403 7,407 126 11 2 7,949Edna Bay 2 2 0 0 0 0 0 0Eek 73 54 2,432 748 904 1,259 0 5,343Egegik 18 15 12 468 406 13 4 903Eielson AFB 127 102 36 1,604 22 0 0 1,662Ekwok 21 21 1,049 1,044 111 522 9 2,735Elfin Cove 5 5 0 15 5 0 0 20Elim 82 76 565 14 1,801 1,451 8,345 12,176Elmendorf AFB 22 21 7 228 0 0 0 235Emmonak 161 61 1,750 0 514 9,719 39 12,022Ester 65 46 27 852 31 0 0 910Fairbanks 2,352 2,001 2,770 33,085 1,741 547 0 38,143False Pass 14 10 32 662 269 78 41 1,082Fort Richardson 21 14 52 385 0 0 0 437Fort Wainwright 113 83 33 1,407 16 0 0 1,456Fort Yukon 166 47 2,348 0 14 5,355 0 7,717Gakona 43 40 186 2,474 0 0 0 2,660Galena 171 54 1,525 60 169 1,061 50 2,865
[continued]
Table II-2. [continued]
Households / Permits
Estimated Salmon Harvest
Sockeye CohoTotal
Salmon

13
Community Total Included Chinook Chum PinkGambell 1 0Girdwood 33 29 25 630 3 0 0 658Glennallen 152 135 462 6,620 175 0 0 7,257Golovin 47 39 42 66 979 1,144 7,827 10,058Goodnews Bay 55 43 703 794 202 312 0 2,011Grayling 47 16 2,249 35 30 1,363 33 3,710Gulkana 3 2 15 395 0 0 0 410Gustavus 13 10 0 132 0 1 1 134Haines 335 310 88 5,572 604 513 806 7,583Healy 36 33 7 312 3,047 831 0 4,197Hollis 23 19 0 52 5 0 202 259Holy Cross 60 23 1,813 0 0 155 0 1,968Homer 38 37 18 1,325 2 12 1 1,358Hoonah 141 71 0 1,579 4 191 159 1,933Hooper Bay 201 63 282 0 125 9,824 5,475 15,706Houston 6 6 0 86 0 0 0 86Hughes 20 18 67 0 100 1,089 0 1,256Huslia 81 22 222 0 60 3,178 0 3,460Hydaburg 47 34 0 796 0 0 0 796Igiugig 8 8 8 2,138 5 13 1 2,165Iliamna 37 34 79 4,674 15 0 0 4,768Indian 4 4 2 22 2 0 0 26Ivanof Bay 1 0Juneau 589 418 39 5,571 113 60 90 5,873Kake 156 140 2 2,315 0 138 78 2,533Kaktovik 1 1 1 24 0 0 0 25Kalskag (Upper) 60 44 1,420 485 1,032 2,333 0 5,270Kaltag 58 18 1,435 0 212 548 0 2,195Karluk 5 5 2 295 10 0 10 317Kasaan 15 15 0 351 0 0 0 351Kasigluk 136 5 381 59 142 306 0 888Kasilof 8 8 14 78 2 5 3 102Kenai 22 19 4 323 21 7 0 355Kenny Lake 49 40 234 2,276 18 0 0 2,528Ketchikan 380 334 205 4,970 49 694 1,219 7,137King Cove 62 53 35 4,390 2,424 415 77 7,341King Salmon 90 83 165 4,486 199 106 97 5,053Kipnuk 176 1 1 11 69 5 0 86Klawock 175 134 1 3,705 24 76 20 3,826Klukwan 3 3 1 78 0 0 2 81
[continued]
Table II-2. [continued]
Households / Permits
Estimated Salmon Harvest
Sockeye CohoTotal
Salmon

14
Community Total Included Chinook Chum PinkKodiak (city) 1,739 1,734 286 25,925 3,374 156 932 30,673Kokhanok 29 26 19 10,150 6 15 7 10,197Koliganek 16 15 1,155 659 19 1,263 1 3,097Kongiganak 81 51 808 774 596 1,965 0 4,143Kotlik 90 26 1,686 0 542 6,229 849 9,306Kotzebue 4 4 13 100 0 4 0 117Koyuk 84 76 557 0 509 3,971 6,049 11,086Koyukuk 27 22 323 0 249 681 4 1,257Kwethluk 156 113 6,429 1,993 2,515 7,434 0 18,371Kwigillingok 95 0Lake Creek 1 1 0 28 2 5 0 35Lake Minchumina 1 1 0 15 0 0 0 15Larsen Bay 24 24 162 431 31 0 4 628Levelock 7 7 1 700 303 304 409 1,717Lime Village 17 0Loring 2 2 0 0 0 0 0 0Lower Kalskag 69 56 1,210 247 241 1,187 0 2,885Lower Tonsina 7 5 44 680 15 0 0 739Manley Hot Springs 13 12 556 30 1,764 1,153 0 3,503Manokotak 26 25 224 2,874 128 27 2 3,255Marshall (Fortuna Ledge) 76 24 2,290 0 386 2,824 473 5,973McCarthy 54 34 5 349 0 0 0 354McGrath 137 119 700 323 1,067 665 0 2,755Mekoryuk 95 19 13 213 114 1,292 0 1,632Mentasta 2 2 1 219 0 0 0 220Metlakatla 6 6 0 20 0 0 0 20Meyers Chuck 1 1 0 0 0 0 0 0Minto 46 43 21 15 281 236 0 553Moose Pass 1 1 0 0 0 0 0 0Mountain Village 149 38 1,523 0 240 7,004 745 9,512Nabesna Road 2 2 0 5 0 0 0 5Naknek 104 86 266 9,647 299 253 445 10,910Nanwalek 56 56 96 10,203 967 414 1,681 13,361Napakiak 90 66 1,931 1,201 578 2,391 0 6,101Napaskiak 83 60 3,856 1,292 716 3,720 0 9,584Naukati Bay 5 4 0 6 0 0 0 6Nelchina 2 2 23 117 0 0 0 140Nelson Lagoon 4 3 7 187 95 0 0 289Nenana 59 53 707 671 4,499 2,169 0 8,046New Stuyahok 35 33 2,571 2,265 344 1,074 11 6,265
[continued]
Table II-2. [continued]
Households / Permits
Estimated Salmon Harvest
Sockeye CohoTotal
Salmon

15
Community Total Included Chinook Chum PinkNewhalen 18 18 0 5,125 0 0 0 5,125Newtok 79 5 13 85 0 20 0 118Nightmute 68 3 0 0 0 0 0 0Nikiski 5 5 1 69 5 1 2 78Nikolaevsk 1 1 0 177 3 0 0 180Nikolai 36 30 507 0 105 171 0 783Ninilchik 5 4 6 110 0 1 1 118Noatak 101 90 0 0 11 2,937 0 2,948Nome 188 152 28 272 763 1,159 3,752 5,974Nondalton 21 18 0 5,527 0 0 0 5,527Noorvik 115 101 3 9 44 13,943 8 14,007North Pole 661 563 453 9,231 203 40 10 9,937Northway 13 12 0 35 0 0 0 35Nulato 95 27 1,773 0 78 269 50 2,170Nunam Iqua (Sheldon Point) 32 24 393 0 56 2,182 13 2,644Nunapitchuk 102 81 3,883 1,382 790 6,917 0 12,972Old Harbor 40 40 6 792 1,063 110 535 2,506Oscarville 13 12 953 377 119 1,121 0 2,570Ouzinkie 40 40 34 1,868 440 51 74 2,467Palmer 462 412 384 9,321 165 50 4 9,924Paxson 2 2 8 116 0 4 1 129Pedro Bay 16 16 0 2,687 0 0 0 2,687Pelican 7 7 0 120 0 0 0 120Perryville 30 25 11 1,692 1,058 23 390 3,174Petersburg 118 113 1 1,149 385 13 9 1,557Pilot Point 7 7 19 397 218 2 1 637Pilot Station 102 37 2,530 0 230 7,170 22 9,952Pitka's Point 25 20 566 0 47 655 35 1,303Platinum 16 12 154 256 95 95 0 600Point Baker 1 1 0 27 20 16 6 69Point Hope 2 2 1 59 0 0 0 60Point Lay 1 1 1 9 0 0 0 10Port Alexander 2 2 0 0 0 0 0 0Port Alsworth 22 20 1 1,403 0 0 0 1,404Port Graham 23 23 250 417 90 74 150 981Port Heiden 3 3 120 34 50 6 0 210Port Lions 47 47 33 2,447 702 1 25 3,208Portage Creek 1 1 78 42 0 13 0 133Quinhagak 139 101 2,475 855 1,099 1,839 0 6,268Rampart 16 12 852 0 0 14 0 866
[continued]
Table II-2. [continued]
Households / Permits
Estimated Salmon Harvest
Sockeye CohoTotal
Salmon

16
Community Total Included Chinook Chum PinkRed Devil 14 10 248 92 413 325 0 1,078Ruby 67 21 954 0 69 1,484 87 2,594Russian Mission 63 17 1,887 0 115 559 0 2,561Saint Marys (Andreafsky) 118 41 2,045 0 209 7,387 8 9,649Saint Michael 93 90 227 20 989 1,136 583 2,955Salcha 62 56 175 676 83 204 0 1,138Sand Point 32 25 105 2,060 283 1,007 375 3,830Saxman 26 18 0 308 3 17 17 345Scammon Bay 82 25 840 0 123 5,256 417 6,636Selawik 1 0Seldovia 25 21 124 234 13 11 31 413Seward 15 11 5 162 0 2 0 169Shageluk 33 24 439 0 0 1,956 0 2,395Shaktoolik 59 57 1,230 4 2,169 800 8,769 12,972Shishmaref 2 1 0 20 0 0 0 20Sitka 569 502 22 19,312 64 86 121 19,605Skagway 8 6 0 265 0 28 25 318Skwentna 10 9 0 242 46 13 3 304Slana 24 24 9 760 0 0 0 769Sleetmute 34 27 516 603 689 1,105 0 2,913Soldotna 22 22 4 195 0 2 0 201South Naknek 40 35 207 2,990 190 142 152 3,681Stebbins 122 108 469 300 2,324 3,586 7,459 14,138Sterling 5 4 50 11 0 0 0 61Stevens Village 28 20 1,036 0 0 4 0 1,040Stony River 15 13 293 460 517 560 0 1,830Sutton 28 25 3 572 8 0 0 583Takotna 20 16 9 0 20 1 0 30Talkeetna 19 19 9 254 35 2 3 303Tanacross 8 7 0 0 0 0 0 0Tanana 102 35 2,379 0 2,032 9,576 0 13,987Tazlina 14 10 165 1,132 0 0 0 1,297Telida 2 0Teller 77 71 50 1,440 433 1,152 1,043 4,118Tenakee Springs 3 3 3 25 1 0 0 29Thorne Bay 92 82 0 763 23 0 30 816Togiak 35 34 718 2,358 241 605 10 3,932Tok 68 65 49 1,643 0 25 1 1,718Toksook Bay 136 8 54 32 74 657 0 817Tonsina 4 3 1 23 0 0 0 24
[continued]
Table II-2. [continued]
Households / Permits
Estimated Salmon Harvest
Sockeye CohoTotal
Salmon

17
Community Total Included Chinook Chum PinkTrapper Creek 1 1 0 0 0 0 0 0Tuluksak 82 56 2,364 1,011 1,181 3,042 0 7,598Tuntutuliak 76 64 3,632 972 1,153 3,845 0 9,602Tununak 110 5 1 8 49 0 0 58Two Rivers 21 20 7 309 11 0 0 327Tyonek 81 52 948 189 85 4 9 1,235Uganik Bay 1 1 8 11 0 0 0 19Ugashik 5 5 16 362 132 9 0 519Unalakleet 225 222 2,367 280 5,490 3,877 15,557 27,571Unalaska 114 90 1 3,211 510 30 320 4,072Valdez 213 180 223 5,023 1 0 0 5,247Venetie 40 27 77 0 12 693 0 782Wainwright 2 2 2 31 0 0 0 33Ward Cove 4 4 0 50 0 0 0 50Wasilla 678 592 761 14,535 294 7 15 15,612Whale Pass 1 1 0 0 0 0 0 0White Mountain 65 59 27 0 581 706 6,014 7,328Willow 34 30 9 641 17 0 0 667Wrangell 113 98 136 1,282 11 100 31 1,560Yakutat 103 97 1,342 3,609 1,768 6 155 6,880Other USA 30 28 0 61 4 0 0 65Unknown Community 460 416 617 4,739 503 137 165 6,161Totals1 24,497 19,189 144,781 398,138 94,363 229,921 86,756 953,959
1 Due to rounding, state totals in this table do not match exactly the state totals in Table II-1 and Table II-3.Please refer to Table II-1 for precise estimates of statewide subsistence harvests by species.
SOURCE: Alaska Department of Fish and Game, Division of Subsistence, Alaska Subsistence Fisheries Database, Version 3.3.
Table II-2. [continued]
Households / Permits
Estimated Salmon Harvest
Sockeye CohoTotal
Salmon

18
Year Total2 Included Chinook Sockeye Coho Chum Pink Total1994 22,553 16,492 188,134 445,109 138,101 417,199 94,469 1,283,0121995 22,358 15,770 186,422 386,034 125,909 499,992 54,908 1,253,2641996 23,708 18,751 161,976 416,467 124,786 498,525 80,928 1,282,6821997 26,754 21,782 182,174 525,417 99,043 347,808 41,543 1,195,9851998 27,774 22,264 177,017 466,386 95,211 302,037 74,216 1,114,8671999 27,854 22,993 161,333 511,044 91,896 339,242 33,253 1,136,7682000 25,365 20,983 134,270 422,002 103,212 248,598 52,710 960,7912001 28,641 21,907 165,039 487,570 101,291 242,035 44,501 1,040,4362002 24,497 19,189 144,777 398,134 94,365 229,922 86,754 953,9521998-2002 Average 26,826 21,467 156,487 457,027 97,195 272,367 58,287 1,041,363All Years Average 25,500 20,015 166,794 450,907 108,201 347,262 62,587 1,135,751
SOURCE: Alaska Department of Fish and Game, Division of Subsistence, Alaska Subsistence Fisheries Database, Version 3.3.
1 Does not include personal use salmon fisheries in the Cook Inlet Area (within the Nonsubsistence Area). Does include personal use fisheries in the Southeast Region and Yukon Area. Also includes estimates for the Seldovia, Yentna River, and Chitina Subdistrict fisheries, that were classified as subsistence fisheries in 2001, for prior years when they were classified as personal use fisheries.
2 In this version of the table, the number of returned permits issued includes permits returned from the Kodiak and Port Graham/Koyuktolik fisheries. (The number of permits issued is not accurately tracked for these fisheries.)
Table II-3. Historic Alaska Subsistence and Personal Use Salmon Harvests: 1994 - 20021
Households /Permits Estimated Salmon Harvest

Figure II-2. Alaska Subsistence SalmonHarvest by Species, 2002
Chinook15.2%
Sockeye41.7%Coho
9.9%
Chum24.1%
Pink9.1%
N = 953,952 salmonBased on annual harvest assessments with permits, calendars, and household surveys.
19

Figure II-3. Alaska Subsistence Salmon Harvest by Area, 2002
Kuskokwim21.6%
Yukon18.6%
Northwest14.0%
Bristol Bay11.5%
Chitina Subdistrict10.0%
Glennallen Subdistrict
7.1%
Other10.3%
Southeast7.0%
N = 953,952 salmonBased on annual harvest assessments with permits, calendars, and household surveys.
Figure II-4. Alaska Subsistence Chinook Salmon Harvest by Area, 2002
Kuskokwim48.5%
Yukon30.7%
Bristol Bay8.9%
Northwest3.9%
Other3.5%
Glennallen Subdistrict3.1%
Chitina Subdistrict1.5%
N = 144,777 salmonBased on annual harvest assessments with permits, calendars, and household surveys.
20

Figure II-5. Alaska Subsistence Sockeye Salmon Harvest by Area, 2002
Chitina Subdistrict23.0%
Bristol Bay20.4%
Southeast14.2%
Kodiak 8.3%
Kuskokwim7.0%
Glennallen Subdistrict
15.8%
Other11.4%
N = 398,134 salmonBased on annual harvest assessments with permits, calendars, and household surveys.
Figure II-6. Alaska Subsistence Chum Salmon Harvest by Area, 2002
Yukon46.9%
Kuskokwim31.9%
Northwest16.3%
Other5.0%
N = 229,922 salmonBased on annual harvest assessments with permits, calendars, and household surveys.
21

Figure II-7. Alaska Subsistence Coho Salmon Harvest by Area, 2002
Kuskokwim36.5%
Northwest18.9%
Yukon17.5%
Bristol Bay7.0%
Kodiak Island6.4%
Alaska Peninsula3.4%
Other4.8%
Chitina Subdistrict2.2%Southeast
3.4%
N = 94,365 salmonBased on annual harvest assessments with permits, calendars, and household surveys.
Figure II-8. Alaska Subsistence Pink Salmon Harvest by Area, 2002
Northwest78.1%
Yukon9.7%
Southeast3.7%
Bristol Bay2.7%
Other3.7%
Port Graham2.1%
N = 86,754 salmonBased on annual harvest assessments with permits, calendars, and household surveys.
22

23
III. NORTHWEST ALASKA
NORTON SOUND AND PORT CLARENCE AREA SALMON Background Subsistence salmon fishing has been a major feature of life in northwest Alaska for centuries. In the early 21st century, most local residents in the region continue to participate in a mixed subsistence-cash economy, depending on local wild foods for cultural and nutritional sustenance. In summer subsistence fishers harvest salmon with gillnets or seines in the main Seward Peninsula rivers and in the coastal marine waters. Beach seines are used near the spawning grounds to catch schooling or spawning salmon and other species of fish. The major portion of fish taken during the summer months is air dried or smoked for later consumption by local residents. Chum, pink, and coho salmon are found throughout the Norton Sound and Port Clarence districts, with chinook salmon more common in eastern and southern Norton Sound and sockeye salmon more common in Port Clarence drainages. Regulations In most of the Port Clarence District, subsistence salmon fishing has few restrictions other than the general statewide provisions. Salmon may be taken in most areas at any time with no harvest limits and no required permits. The exception to this is the Pilgrim River drainage including Salmon Lake where permits are required, harvests are limited, and specified areas are closed to subsistence salmon fishing. The Norton Sound District has considerably more complex regulations, particularly in Subdistricts 1 (Nome) and 6 (Unalakleet), where restrictions exist on gear, fishing periods, and areas opened to fishing. In Subdistrict 1, chum salmon runs have been depressed for approximately 20 years. Upstream portions of most rivers are closed to protect spawning salmon, and harvests are limited in all subdistrict rivers. In regulation, subsistence fishing in fresh water is open during two 48-hour periods each week, but during the last 15 years subsistence fishing has been regulated primarily by emergency order, and openings have been much less frequent than in regulation. Fishing periods in marine waters are also limited. Since 1999, chum salmon fishing in Subdistrict 1 has been managed on a Tier II system, the only such fishery in the state.1 In 2002, 40 Tier II permits were issued. In Subdistrict 6, subsistence fishing is closed one day a week through July 15 to ensure adequate chinook salmon escapement. In Subdistricts 2-5, salmon may be taken at any time with no harvest limits. However, restrictions exist on commercial fishermen’s participation in subsistence salmon fishing.
1 A “Tier II” subsistence permit system is necessary when the number of participants in a subsistence fishery or hunt must be limited because the harvestable surplus of the fish stock or wildlife population is less than the amount necessary to provide for subsistence uses. Individuals are scored based on their history of use of the particular resource and availability of alternative resources; those with the highest scores receive Tier II permits.

24
In 2001, a regulatory change by the Board of Fisheries made rod-and-reel a legal subsistence fishing gear in the area from Cape Espenberg on the northern Seward Peninsula to Bald Head between Elim and Koyuk. This includes most of the subsistence fishing areas used by residents of Elim, Golovin, White Mountain, Nome, Teller, Brevig Mission, Wales, and Shishmaref. Sport fish bag and possession limits still apply, except when fishing through the ice or when a subsistence salmon permit is required. In the latter case, the harvest limits specified in the permit apply. In-Season Management in 2002 In Subdistrict 1 (Nome), subsistence salmon fishing was initially closed to all households. On June 25 salmon fishing opened three days per week in the marine waters east of Cape Nome for households with Tier II permits. Beginning July 4, the fresh waters of the Eldorado-Flambeau rivers east of Cape Nome also were opened three days per week for Tier II permit holders. This was the earliest opening for a fresh water subsistence fishing period in over five years in Subdistrict 1. Beginning in the first week of July, restricted gillnet fishing by Tier I permit holders was allowed in the marine waters east of Cape Nome. Tier I beach seining for pink salmon opened periodically in the fresh waters of Safety Sound beginning July 6. West of Cape Nome, Tier I beach seining for pink salmon opened on the Nome River beginning in mid-July. On July 22, all fresh water subsistence harvest areas in Subdistrict 1 were opened to all Tier I and Tier II fishermen. The Nome River, however, was restricted to beach seining only and chum salmon were required to be returned to the water. On July 29, Subdistrict 1 opened in both marine and fresh waters to all Tier I and Tier II fishermen to target coho salmon. The coho salmon return turned out to be well below average, and in mid-August Subdistrict 1 and the Port Clarence District were closed for two weeks to subsistence salmon fishing. In late August, the subdistrict and the Port Clarence District reopened to subsistence fishing, except for the Snake and Solomon rivers. In Subdistrict 2, subsistence fishing on the Niukluk and Fish rivers was restricted to four days per week during three weeks in late August and early September due to a weak coho return. The normal seven days per week subsistence fishing schedule in fresh waters resumed the second week of September. In Subdistricts 3-6 subsistence fishing continued as normal throughout the season. Subsistence Salmon Harvest Collection Methods Two methods were used to assess subsistence salmon harvests in the Norton Sound and Port Clarence districts in 2002: 1) fishing permits in Subdistrict 1 (Nome) and in the Salmon Lake-Pilgrim River drainage, and 2) post-season household surveys in 12 communities.

25
Norton Sound Subdistrict 1 Fishing Permits Permits have been required for subsistence salmon fishing in Norton Sound Subdistrict 1 (Nome) since 1974. Beginning in 1999, Tier II chum salmon fishing permits also were issued to a limited number of Nome households with the intent that these households would have first priority over other subsistence fishermen if only a small number of chum salmon were available for harvest. This priority would allow these households to fish earlier in the season when weather conditions are more suitable for drying salmon. Tier I fishing permits were available to all other households when run strength was determined to be adequate. In 2002, 141 permits (103 Tier I and 38 Tier II permits) were issued for Subdistrict 1, 113 (80%) of which were returned to the department. Two persons selected for the Tier II fishery did not pick up a permit. In addition, 17 permits were issued for the Niukluk and Fish rivers in Subdistrict 2, although regulations do not require fishermen to obtain these. Fourteen (82%) of these permits were returned to the department. Since 1998, the Nome permit data have not been expanded to account for households whose permits were not returned. This contrasted with earlier years when permit data were expanded by drainage with expansion factors based upon the fraction of unreturned permits for that drainage. Department staff believed that expansion of the permit data led to an overestimation of the salmon harvest because the unreturned permits were most likely from households that did not fish.
Salmon Lake and Pilgrim River Fishing Permits Permits were required for subsistence salmon fishing in Salmon Lake and the Pilgrim River drainage in the Port Clarence District. In 2002, 28 households requested permits for this area, 21 (75%) of which were returned to the department.
Household Surveys In the Norton Sound and Port Clarence districts, household surveys were jointly conducted by Kawerak, Inc. and ADF&G in Brevig Mission, Teller, Golovin, White Mountain, Elim, Koyuk, Shaktoolik, Unalakleet, St. Michael, and Stebbins. Surveys were not conducted in Gambell or Savoonga. Kawerak obtained approval for the research from tribal councils in the study communities, and hired a local resident in each community to assist ADF&G staff with the surveys. Researchers attempted to contact 100% of the households in each of the surveyed communities. Actual sample rates ranged from 83% of households in Golovin to 99% of households in Unalakleet. Overall, 94% of the households in the surveyed communities were interviewed. The salmon survey data were expanded by community to account for the households not contacted. The goals of the post-season household survey were to:
1) collect harvest data that would result in a total harvest estimate for subsistence salmon by species by community, and

26
2) compile information on gear types, participation rates, sharing, household size, and use of salmon for dog food.
2002 Subsistence Salmon Harvests
Norton Sound District Subsistence Salmon Harvest The estimated 2002 subsistence harvest of salmon by study communities in the Norton Sound District was 104,012 fish (Table III-1, Table III-2). This was the highest subsistence salmon harvest in the district since 1996 (Table III-3). Pink salmon returns are strongest in even-numbered years, accounting in large part for this year’s higher subsistence harvest. In 2002, pink salmon returns were highly variable in the district, with some districts having very high returns and some very low returns when compared to the historical averages (Menard 2002). Coho, chum, and chinook returns were generally below average. Of the total salmon harvest, 5% were chinook, 17% were chum, 62% were pink, 1% were sockeye, and 15% were coho (Fig. III-1). Very little of the documented subsistence salmon harvest was taken by residents from outside the district (Table III-4). Combined harvest estimates for the Norton Sound District, Port Clarence District, and Kotzebue Area for the period 1975-2002 are presented in Table III-5. However, the methodology used in determining harvests prior to 1994 is substantially different from that used since 1994, and as a consequence the data are not directly comparable. The estimated mean harvest was about 111 salmon per household in the Norton Sound District; the estimated breakdown of this harvest was 6 chinook, 19 chum, 69 pink, 1 sockeye, and 16 coho. Mean household harvests in the subdistricts ranged from 36 salmon in Subdistrict 1 (Nome) to 220 salmon in Subdistrict 5 (Shaktoolik). In Nome, the 2002 subsistence salmon harvest as reported on Subdistrict 1 and Pilgrim River permits was 5,244 fish compared to 1,709 fish in 2001. The increased harvest in 2002 was largely due to the strong pink salmon return in even-numbered years. Subdistrict 1 and Pilgrim River permits account for only a portion of Nome’s actual salmon harvest because some Nome residents fish in areas (e.g., Teller, Woolley Lagoon, and Niukluk River) or with gear (i.e., rod and reel) not requiring permits. Kawerak, Inc. and the Alaska Department of Fish and Game jointly conducted a study in 2001 to estimate Nome’s total subsistence salmon harvest, including the portion not documented by permits. Results indicated that Nome residents harvested an estimated total of 6,138 salmon in 2001, 47% of which were taken outside the Nome permit areas, primarily in the Port Clarence and White Mountain-Golovin areas. Nets accounted for 78% of Nome’s total estimated salmon harvest, and rod-and-reel for 22% (Magdanz, Tahbone, Kamletz, and Ahmasuk 2003).
Port Clarence District Subsistence Salmon Harvest The estimated 2002 subsistence harvest of salmon by the two communities in the Port Clarence District was 12,152 fish (Table III-1, Table III-2). This was the highest harvest since 1998 (Table III-3). Of the total harvest, 1% were chinook, 22% were chum, 28% were pink, 31% were sockeye, and 18% were coho (Fig. III-1). The estimated mean harvest in the Port Clarence

27
District was about 69 salmon per household; the estimated breakdown of this harvest was 1 chinook, 15 chum, 19 pink, 21 sockeye, and 13 coho.
Participation in Subsistence Fishing In the Norton Sound District (only permit holders included in Nome), about 65% of households subsistence fished for salmon and an additional 9% assisted other households in processing subsistence-caught salmon. Participation in subsistence salmon fishing in the district ranged from 34% of households in St. Michael to 87% in Elim. In the Port Clarence District, 55% of households subsistence fished for salmon in 2002. About 8% helped other households process subsistence-caught fish. Overall, participation in subsistence salmon fishing in these two districts has been fairly stable over the past eight years, with no clear trend upward or downward.
Participation in Commercial Fishing In the Norton Sound District (excluding Nome), less than 2% of households participated in commercial salmon fishing, and less than 1% of all households removed salmon from their commercial catches for subsistence use. In the Port Clarence District no surveyed households participated in commercial salmon fishing. In 2002, commercial salmon fishing in the region was at its lowest in the past 40 years with a total harvest worth less than $3,000 (Menard 2002). In the Norton Sound District, an estimated total of 542 salmon were retained from commercial catches for subsistence use. The salmon retained from commercial catches comprised 0.6% of the district’s estimated subsistence harvest.
Gear Type In the Norton Sound District (excluding Nome), set gillnets were the most common gear for harvesting salmon for subsistence, used by about 82% of fishing households. Rod and reel was the next most widely used gear, used by 63% of fishing households. Seines were used by 29% of fishing households. Rod and reel fishing accounted for 9% of the total salmon harvest in the surveyed communities in the Norton Sound District. Coho salmon were the primary target of rod and reel fishing. In the Port Clarence District, set gillnets were used by 95% of the households that subsistence fished for salmon. Seines were used by 6% of the fishing households, and rod and reel by 7%.
Salmon for Dog Food In 2002 an estimated 2,863 salmon, or about 3% of the total subsistence catch, were harvested specifically for dog food in the surveyed communities (excluding Nome) in the two districts. The mean number of salmon fed per dog was about 15 fish per year. Overall, about 3% of all the surveyed households in the two districts (excluding Nome) caught salmon for dog food.

28
Assessment of Fishing Season When asked whether subsistence chum salmon fishing was very good, average, or poor in 2002, 47% of the fishing households in the Norton Sound District (excluding Nome) responded “poor,” 38% responded “average,” and 15% responded “very good.” This was the most favorable assessment of the fishing season since 1997. In the Port Clarence District, 16% of the fishing households responded that the chum fishing season was “poor” in 2002, 58% said it was “average,” and 26% said “very good.” This was by far the most favorable assessment of the fishing season in the past six years.
KOTZEBUE AREA SALMON
Background Kotzebue Sound residents have relied on fish for cultural and nutritional sustenance for thousands of years. Most local residents in the region continue to participate in a mixed subsistence-cash economy, harvesting a wide variety of wild foods. In the Kotzebue Area, salmon’s role in the wild food diet varies from community to community, affected primarily by salmon abundance. Along the Noatak and Kobuk rivers, where runs of chum salmon are strong, many households’ activities in middle and late summer revolve around the catching, drying, and storing of salmon for use during the winter. Chum salmon predominate in the district, with small numbers of other salmon species present. Regulations In the Kotzebue Area, subsistence salmon fishing has few restrictions other than the general statewide provisions. Salmon may be taken in the district at any time with no harvest limits and no required permits. Commercial fishermen, however, are not allowed to subsistence fish for salmon during the commercial season. In-Season Management Subsistence salmon fishing in the Kotzebue Area proceeded as normal in 2002. No emergency orders were issued affecting this fishery. Subsistence Salmon Harvest Collection Methods In 2002, subsistence salmon harvests in the Kotzebue Area were assessed using a post-season household survey in 2 communities.

29
Household Surveys In the Kotzebue Area, household surveys were conducted in Noatak and in Noorvik. Although normally surveyed, Ambler, Kiana, Kobuk, and Shungnak were not surveyed in 2002. The communities of Wales, Diomede, Shishmaref, Deering, Buckland, Selawik, Kivalina, and Point Hope are not routinely surveyed due to little availability of salmon, the lack of competing commercial salmon uses, or limited staff time and funding. Researchers attempted to contact 100% of the households in each of the surveyed communities. Overall, about 88% of the households in the two surveyed communities were interviewed. The salmon survey data were expanded by community to account for the households not contacted. The goals of the post-season household survey were to:
1) collect harvest data that would result in a total harvest estimate for subsistence salmon by species by community, and 2) compile information on gear types, participation rates, sharing, household size, and use of salmon for dog food.
Kotzebue Postcard Survey
Due to funding constraints, Kotzebue was not surveyed in 2002. In past years, Kotzebue’s subsistence salmon harvests have been assessed through a mail-out postcard survey, essentially an abbreviated version of the household survey instrument. 2002 Subsistence Salmon Harvests
Kotzebue Area Subsistence Salmon Harvest
The 2002 subsistence salmon harvest in the two surveyed communities in the Kotzebue Area was 16,955 fish, nearly all of which were chum salmon (Table III-1, Table III-2, Fig. III-1). For the same communities, the 2002 subsistence salmon harvest was the second lowest since 1995. The estimated mean salmon harvest was about 79 salmon per household, nearly all of which were chum. Noorvik had a mean household harvest of 122 salmon, while Noatak’s mean household harvest was 29 salmon.
Participation in Subsistence Fishing
In the Kotzebue Area, 64% of households in the two surveyed villages subsistence fished for salmon in 2002 and about 7% assisted other households in processing subsistence-caught salmon. Because communities that typically have lower participation rates, such as Kotzebue, were not surveyed, the overall estimated participation rate in the Kotzebue Area was higher in 2002 than in previous years.

30
Participation in Commercial Fishing
In the Kotzebue Area, no households in the surveyed communities participated in commercial salmon fishing in 2002. The Kotzebue Sound commercial salmon fishery had a record low harvest and participation in 2002, with only 3 permit holders fishing (Jones 2002).
Gear Type
In the Kotzebue Area, set gillnets were the most common gear for harvesting salmon for subsistence, used by 49% of fishing households. Rod and reel was the next most widely used gear (48% of fishing households), although it accounted for less than 4% of the salmon harvest in the two surveyed communities. Seines were used by 24% of fishing households.
Salmon for Dog Food
In the Kotzebue Area, an estimated 2,266 salmon were harvested specifically for dog food in the two surveyed communities in 2002. All of these were taken by Noorvik households. This harvest for dog food was about 16% of the total subsistence salmon catch in Noorvik. The mean number of salmon fed per dog was about 22 fish per year. Overall, 6% of Noorvik households caught salmon specifically for dog food.
Assessment of Fishing Season
In the Kotzebue Area, 11% of fishing households responded that their chum fishing season was “poor” in 2002, 53% said “average,” and 36% said “very good.” Assessment of the fishing season has been fairly stable over the past four years. In general, satisfaction with subsistence chum salmon fishing in the Kotzebue Area is determined largely by weather and water conditions. Salmon stocks continue to be fairly abundant in this area, particularly compared to the Norton Sound area.
KOTZEBUE AREA SHEEFISH, WHITEFISH, AND CHAR
Background In addition to salmon, major subsistence fisheries take place in northwest Alaska for sheefish, whitefish, and char (Dolly Varden). In the Kotzebue Area, subsistence fishing for these species has few restrictions other than the general statewide provisions. Fish may be taken at any time with no harvest limits and no required permits. Gillnets used to take sheefish have length, depth, and mesh size restrictions. Harvest Collection Methods Household surveys were conducted in two communities, Noatak and Noorvik. Ambler, Kiana, Kobuk, and Shungnak were not surveyed in 2002, although normally they are. The household surveys primarily collected subsistence salmon harvest information, but also asked about

31
harvests of sheefish and whitefish in Noorvik and harvests of char and whitefish in Noatak. Researchers attempted to contact 100% of the households in each of the surveyed communities. Overall, about 88% of the households in the two surveyed communities were interviewed. The survey data were expanded by community to account for the households not contacted. 2002 Sheefish and Whitefish Harvests In 2002 an estimated 4,310 sheefish were harvested by Noorvik households (Table III-6). This was the second highest sheefish harvest in Noorvik in the past eight years. The mean household harvest in Noorvik was 38 sheefish. In 2002 an estimated 25,607 whitefish were harvested for subsistence in the two surveyed communities in the Kotzebue Area (Table III-6). About 89% of this harvest was taken by Noorvik households. This was Noorvik’s third highest harvest of whitefish in the past six years. The mean household harvest in Noorvik was 197 whitefish, and in Noatak 29 whitefish. In 2002 an estimated 3,242 char (Dolly Varden) were harvested for subsistence by the community of Noatak for a mean household harvest of 32 fish (Table III-7). This was higher than the previous year’s harvest, but lower than the 1995-2000 harvests.

TotalHouseholds Chinook Chum Pink Sockeye Coho Total
Norton Sound District 935 5,488 17,817 64,354 763 15,589 104,012
Port Clarence District 176 133 2,699 3,394 3,732 2,194 12,152
Kotzebue Area1 216 3 16,880 8 9 56 16,955
Total Northwest Alaska 1,327 5,624 37,396 67,756 4,504 17,838 133,119
1 Only the communities of Noatak and Noorvik were surveyed in 2002.SOURCE: Alaska Department of Fish and Game, Division of Subsistence, household surveys, 2002.
Harvests in Numbers of Fish
Table III-1. 2002 Northwest Alaska Subsistence Salmon Harvests by District and Species
32

Total HH'sHH's Contacted Chinook Chum Pink Sockeye Coho Total
Nome Permits1 141 113 4 1,114 3,161 79 666 5,024Subdistrict 1 141 113 4 1,114 3,161 79 666 5,024 Golovin 47 39 42 1,144 7,827 66 979 10,058 Niukluk R. Permits1 17 14 0 32 589 0 80 701 White Mountain 65 59 27 706 6,014 0 581 7,328Subdistrict 2 129 112 69 1,882 14,430 66 1,640 18,087 Elim 82 76 565 1,451 8,345 14 1,801 12,177Subdistrict 3 82 76 565 1,451 8,345 14 1,801 12,177 Koyuk 84 76 557 3,971 6,049 0 509 11,086Subdistrict 4 84 76 557 3,971 6,049 0 509 11,086 Shaktoolik 59 57 1,230 800 8,769 4 2,169 12,972Subdistrict 5 59 57 1,230 800 8,769 4 2,169 12,972 Unalakleet2 225 222 2,367 3,877 15,557 280 5,490 27,572Subdistrict 6 225 222 2,367 3,877 15,557 280 5,490 27,572 Stebbins 122 108 469 3,586 7,459 300 2,324 14,137 St. Michael 93 90 227 1,136 583 20 989 2,957South Norton Sound 215 198 697 4,722 8,043 320 3,313 17,094NORTON SOUND 935 854 5,488 17,817 64,354 763 15,589 104,012 Brevig Mission 71 67 65 1,534 2,347 2,127 1,741 7,815 Pilgrim R. Permits1 28 21 18 13 4 165 20 220 Teller 77 71 50 1,152 1,043 1,440 433 4,117PORT CLARENCE 176 159 133 2,699 3,394 3,732 2,194 12,152 Noatak 101 90 0 2,937 0 0 11 2,948 Noorvik 115 101 3 13,943 8 9 44 14,007KOTZEBUE SOUND3 216 191 3 16,880 8 9 56 16,955TOTALS 1,327 1,204 5,624 37,396 67,756 4,504 17,838 133,119
* Data from contacted households were expanded to households not contacted. If fewer than 30 and less than 50% of households in a community harvest strata were contacted, then the harvest for that community is the reported harvest, not an expanded estimate.1 Alaska Department of Fish and Game, Division of Commercial Fisheries, permit returns, 2002. Data not expanded.2 Estimated salmon harvest in Unalakleet includes 42 chinook, 692 chum, 1,522 pink, and 353 coho from the ADF&G test net fishery in addition to the survey results.3 Only Noatak and Noorvik were surveyed in 2002. Normally Ambler, Kiana, Kobuk, Kotzebue, Noatak, Noorvik, and Shungnak are surveyed.SOURCE: Alaska Department of Fish and Game, Division of Subsistence, household surveys, 2002.
Harvests in Numbers of Fish*
Table III-2. 2002 Northwest Alaska Subsistence Salmon Harvests by Community
33

Number of Households Chinook Chum Pink Sockeye Coho Total
1994 839 7,212 24,776 70,821 1,161 22,108 126,0771995 851 7,766 43,014 38,594 1,222 23,015 113,6121996 858 7,255 34,585 64,724 1,182 26,304 134,05019971 1,113 8,998 26,803 27,200 1,892 16,476 81,37019981 1,184 8,295 20,032 51,933 1,214 19,007 100,4801999 898 6,144 19,398 20,017 1,177 14,342 61,0782000 860 4,149 17,283 38,308 682 17,062 77,4852001 878 5,576 20,213 30,261 767 14,550 71,3672002 935 5,488 17,817 64,354 763 15,589 104,012
Number of Households Chinook Chum Pink Sockeye Coho Total
1994 151 203 2,294 4,309 2,220 1,892 10,9181995 151 76 6,011 3,293 4,481 1,739 15,6001996 132 194 4,707 2,236 2,634 1,258 11,0291997 163 158 2,099 755 3,177 829 7,0191998 157 289 2,621 7,815 1,696 1,759 14,1791999 177 89 1,936 786 2,392 1,030 6,2332000 163 72 1,275 1,387 2,851 935 6,5212001 160 84 1,910 1,183 3,692 1,299 8,1672002 176 133 2,699 3,394 3,732 2,194 12,152
Number of Households Chinook Chum Pink Sockeye Coho Total
19943 557 135 48,175 3,579 33 478 52,40019954 1,327 228 102,880 2,059 935 2,560 108,6621996 1,187 550 99,740 951 471 317 102,0291997 1,122 464 57,906 1,181 528 848 60,9251998 1,279 383 48,979 2,116 392 461 52,3301999 1,277 9 94,342 841 478 1,334 97,0042000 1,227 211 65,975 75 75 2,557 68,89320015 1,149 11 49,014 36 14 768 49,84420026 216 3 16,880 8 9 56 16,955
1 Includes Gambell and Savoonga.2 Normally includes Ambler, Kiana, Kobuk, Kotzebue, Noatak, Noorvik, and Shungnak. 3 Includes Deering and Wales; does not include Kotzebue.4 Includes Shishmaref.5 Does not include Ambler.6 Includes only Noatak and Noorvik.
Norton Sound District
Kotzebue Area2
Table III-3. Northwest Alaska Subsistence Salmon Harvests by District, 1994-2002
Port Clarence District
34

of Fishing Household
COMMUNITY2 Total Included Chinook Chum PinkAnchorage 2 0Brevig Mission 71 67 65 2,127 1,741 1,534 2,347 7,815Eagle River 1 1 0 14 3 0 2 19Elim 82 76 565 14 1,801 1,451 8,345 12,177Golovin 47 39 42 66 979 1,144 7,827 10,058Koyuk 84 76 557 0 509 3,971 6,049 11,086Noatak 101 90 0 0 11 2,937 0 2,948Nome 183 147 22 230 763 1,159 3,752 5,926Noorvik 115 101 3 9 44 13,943 8 14,007Saint Michael 93 90 227 20 989 1,136 583 2,957Shaktoolik 59 57 1,230 4 2,169 800 8,769 12,972Stebbins 122 108 469 300 2,324 3,586 7,459 14,137Teller 77 71 50 1,440 433 1,152 1,043 4,117Unalakleet 225 222 2,367 280 5,490 3,877 15,557 27,572White Mountain 65 59 27 0 581 706 6,014 7,328Totals 1,327 1,204 5,624 4,504 17,838 37,396 67,756 133,119
1 Includes subsistence harvests, commercial harvests retained for home use, and fish distributed from Alaska Department of Fish and Game test fisheries.
2 Harvest information from residents of non-local communities (i.e., Anchorage and Eagle River) is available only for Norton Sound Subdistrict 1 and Pilgrim River permits. Non-local residents might subsistence fish in other northwest Alaska areas, but these harvests are not documented in the regional household surveys.
Table III-4. 2002 Northwest Alaska Subsistence Salmon Harvests by Resident Community
SOURCE: Alaska Department of Fish and Game, Division of Subsistence, Alaska Subsistence Fisheries Database, Version 3.3.
Households / Permits
Sockeye CohoTotal
Salmon
Estimated Salmon Harvest1
35

Table III-5. Northwest Alaska Historic Subsistence Salmon Harvests, 1975-2002.
Year Total Included Chinook Sockeye Coho Chum Pink Total1975 117 79 3 225 102 3,698 7,298 11,3261976 138 104 6 0 275 1,856 5,472 7,6091977 195 181 35 64 623 12,222 2,839 15,7831978 168 126 31 0 242 4,035 10,697 15,0051979 138 119 519 0 1,007 3,419 5,842 10,7871980 232 161 135 0 2,075 5,839 21,728 29,7771981 236 169 47 88 1,844 9,251 6,100 17,3301982 230 182 33 6 2,093 5,719 20,480 28,3311983 243 189 74 40 1,950 7,013 8,499 17,5761984 240 189 85 0 1,890 4,945 18,067 24,9871985 215 198 56 114 1,054 5,717 2,117 9,0581986 279 240 157 127 788 8,494 9,011 18,5771987 235 173 97 102 812 7,265 705 8,9811988 192 166 67 171 1,089 6,379 2,543 10,2491989 173 130 24 131 549 3,456 924 5,0841990 188 165 60 234 542 4,525 2,413 7,7741991 155 128 83 166 1,279 3,715 194 5,4371992 163 132 152 163 1,720 2,030 7,746 11,8111993 142 104 51 74 1,780 1,578 758 4,24119942 1,547 1,169 7,713 3,414 24,494 75,489 78,954 190,06319953 2,329 1,445 8,070 6,639 27,314 151,905 43,947 237,8741996 2,177 1,454 7,999 4,287 27,879 139,032 67,911 247,10819974 2,398 1,645 9,620 5,597 18,153 86,808 29,135 149,31419984 2,620 1,730 8,967 3,301 21,226 71,632 61,863 166,9891999 2,351 1,300 6,242 4,046 16,706 115,676 21,644 164,3152000 2,247 1,336 4,399 3,612 20,654 84,196 40,499 153,36020015 2,192 1,259 5,671 4,473 16,617 71,138 31,480 129,37820026 1,327 1,204 5,624 4,504 17,838 37,396 67,756 133,1191998-2002 Average 2,147 1,366 6,181 3,987 18,608 76,008 44,648 149,4321993-2002 Average 1,933 1,265 6,436 3,995 19,266 83,485 44,395 157,576All Years Average 817 553 2,358 1,485 7,593 33,372 20,594 65,402
1 Includes selected communities in the Norton Sound District, Port Clarence District, and Kotzebue Area.2 Beginning in 1994, ADF&G initiated a new annual subsistence salmon harvest assessment effort in northwest Alaska that provided more extensive, complete, and reliable estimates than existed previously. Harvest estimates prior to 1994 cannot be directly compared to those after 1994. Communities routinely included in harvest estimates since 1994 are all the communities in the Norton Sound and Port Clarence districts except Gambell and Savoonga, and 7 communities (Ambler, Kiana, Kobuk, Kotzebue, Noatak, Noorvik, and Shungnak) in the Kotzebue Area. However, 1994 estimates include Deering and Wales, and do not include Kotzebue.3 Includes Shishmaref.4 Includes Gambell and Savoonga.5 Does not include Ambler.6 For the Kotzebue Area, includes only Noatak and Noorvik.
SOURCE: Alaska Department of Fish and Game, Division of Subsistence, Alaska Subsistence Fisheries Database, Version 3.3.
Estimated Salmon Harvest1PermitsHouseholds /
36

Total Households Sheefish Whitefish
Noatak 101 NA 2,919Noorvik 115 4,310 22,688Total 216 4,310 25,607
NA = not available
Table III-6 Sheefish and Whitefish Harvests by Community in the Kotzebue District, 2002
Number of Fish Harvested
37

Total Households
Number of Fish
Total Households
Number of Fish
Total Households
Number of Fish
1995 385 9,465 * * 92 5,7621996 389 6,953 * * 88 5,6921997 398 9,805 482 84,851 84 4,7631998 392 5,350 489 39,754 97 3,8721999 445 8,256 445 56,326 * *2000 448 7,446 448 70,097 102 3,315
20014 267 3,838 363 30,976 96 2,70220025 115 4,310 216 25,607 101 3,242
* Data not collected.1 Normally includes Noorvik, Kiana, Ambler, Shungnak, and Kobuk.2 Normally includes Noorvik, Kiana, Ambler, Shungnak, Kobuk, and Noatak.3 Includes Noatak.4 Does not include Ambler.5 Includes only Noorvik for sheefish, and Noorvik and Noatak for whitefish.
Char3Whitefish2Sheefish1
Table III-7. Sheefish, Whitefish, and Char Harvests in Kotzebue District, 1995-2002
38

Norton Sound, Port Clarence, and Kotzebue DistrictsFigure III-1. Species Composition of Subsistence Salmon Harvests, 2002,
Norton Sound District
Chinook5%
Chum17%
Pink62%
Sockeye1%
Coho15%
Port Clarence District
Chinook1%
Chum22%
Pink28%
Sockeye31%
Coho18%
Kotzebue Area
Chum99.6%
Other Salmon 0.4%
39

40

41
IV: YUKON AREA
BACKGROUND Residents of the Yukon River area have relied heavily upon fish for human food for generations. While non-salmon fish species provide an important component of the overall fish harvest, salmon comprises the bulk of the fish harvested for subsistence. Chinook, summer chum, fall chum, and coho salmon comprise the majority of the subsistence salmon harvests in the Yukon River drainage and the number of salmon harvested for subsistence in this region is significant. Unlike many marine and coastal fisheries where commercial harvests predominate, within the Yukon drainage subsistence salmon harvests often exceed commercial, sport and personal use harvests combined. Drift gillnets, set gillnets, and fish wheels are used by Yukon Area fishermen to harvest the majority of salmon. Set gillnets are utilized throughout the Yukon Area, in the main rivers and coastal marine waters, while drift gillnets are used extensively in some parts of the river (i.e., by regulation, that portion of the Yukon drainage 18 miles below Galena). Fish wheels are a legal gear type throughout the Yukon drainage, although due to river conditions and the availability of wood, they are most commonly used on the upper Yukon and Tanana Rivers. Depending on the area of the drainage, subsistence fishing occurs from late May through early October. Fishing activities are either based from a fish camp or from the home village: fishing patterns and preferred sites vary from community to community. Extended family groups, typically representing several households, often undertake subsistence salmon fishing together. Households and related individuals typically cooperate to harvest, process, preserve, and store salmon for subsistence use. (For more detail on subsistence uses of Yukon River salmon, see the three articles on this topic in the Division of Subsistence “Wildlife Use Notebook Series” [ADF&G n.d.a, n.d.b, n.d.c]). The majority of the subsistence salmon harvest is preserved for later use by freezing, drying, or smoking, while the head, cutting scraps and viscera are often fed to dogs. Chinook salmon are harvested and processed primarily for human consumption, although those fish deemed not suitable for human consumption (due to presence of the fungus, Ichthyophonous hoferi, or some other disease or disfigurement) are often fed to dogs. In addition, while chum and coho salmon are primarily taken for human consumption, relatively large numbers are harvested and processed to feed sled dogs. Fall chum and coho salmon typically arrive in the upper portion of the drainage to coincide with freezing weather, allowing fish to be “cribbed” for use as dog food. This method involves the natural freezing of whole (un-cut) fish. The practice of keeping sled dogs is much more common in communities along the Upper Yukon River.
REGULATIONS
The Alaska Joint Board of Fisheries and Game has defined a portion of the Yukon River drainage as lying within the Fairbanks Nonsubsistence Area (5 AAC 99.015). Subsistence fisheries may not be authorized within non-subsistence areas and the harvest of fish for home use in these areas occurs under personal use and sport fishing regulations.

42
Over the last decade, several regulatory changes have affected the subsistence salmon fishery on the Yukon River drainage. In 1993 the Alaska Board of Fisheries adopted regulations which separated subsistence and commercial salmon fishing times in Districts 1, 2, and 3 and in the lower portion of District 4 (Subdistrict 4-A) (Fig. IV-1). In these districts, subsistence salmon fishing is allowed seven days per week, but may not occur 24 hours prior to and immediately following the commercial salmon fishing season. By regulation, once the commercial season is open, subsistence salmon fishing may not occur 18 hours immediately before, during, and 12 hours after each District 1, 2, or 3 summer season commercial fishing period. During the fall season, in Districts 1, 2, and 3, subsistence fishing may not occur 12 hours immediately before, during, and 12 hours after each commercial fishing period. In Subdistrict 4A, subsistence salmon fishing may not occur 12 hours immediately before, during, and 12 hours after each commercial salmon fishing period throughout the season. In the Upper portion of District 4 (Subdistricts 4-B and 4-C) and in Subdistricts 5-B and 5-C, subsistence salmon fishing is allowed 7 days per week until 24 hours prior to and immediately following the commercial salmon fishing season. In these areas, subsistence salmon fishing periods coincide with commercial salmon fishing periods. Additional, subsistence-only salmon fishing periods may be allowed during the commercial salmon fishing season. In Subdistrict 5-D, subsistence salmon fishing is allowed 7 days per week, regardless of commercial activities. In Subdistrict 5-A, subsistence fishing is allowed seven days per week until 24 hours prior to the commercial fishing season. Since 1994, with the exception of 19981, the subsistence salmon fishing schedule in Subdistrict 5-A allows subsistence salmon fishing five days per week following the closure of the commercial salmon fishing season. Since 1988, subsistence fishing in the lower Tanana River drainage in Subdistricts 6-A and 6-B is allowed for two 42-hour periods per week unless altered by emergency order.2 In the Upper Tanana River drainage, subsistence fishing is allowed seven days per week. In 2000, for the first time in history, restrictions were imposed on the summer portion of the subsistence salmon fishery to protect chinook and summer chum salmon populations. Poor returns and subsequent restrictions on subsistence fishing resulted in an 80 percent reduction of fishing opportunity in most districts. In 2001, as a result of the declared disaster, the Alaska Board of Fisheries (BOF) instituted a new subsistence schedule on the Yukon River. The schedule was intended to fulfill several goals: 1) increase the quality of escapement, 2) equalize subsistence opportunity among users in years with no commercial fishing, and 3) and reduce the impact of harvest on any one species by spreading the harvest throughout the run, thereby providing windows of time that salmon may migrate upriver with less exploitation. The schedule was based on past fishing schedules and is believed to provide reasonable opportunity for subsistence users to meet their needs when
1 In 1998, the Alaska Board of Fisheries relaxed restrictive elements of the Toklat River Fall Chum Salmon Rebuilding Management Plan and allowed Subdistrict 5-A to subsistence salmon fish seven days per week. When the escapement objectives were not subsequently met, the restrictive elements of the salmon rebuilding plan were reinstated and subsistence fishing in Subdistrict 5-A was reduced during the 1999 season. 2 In the lower Tanana River drainage, Subdistrict 6-C is a personal use salmon fishery. Its regulations match those of the 6-A and 6-B subsistence salmon fishery; namely, that personal use fishing is allowed for two 42-hour periods per week unless altered by emergency order.
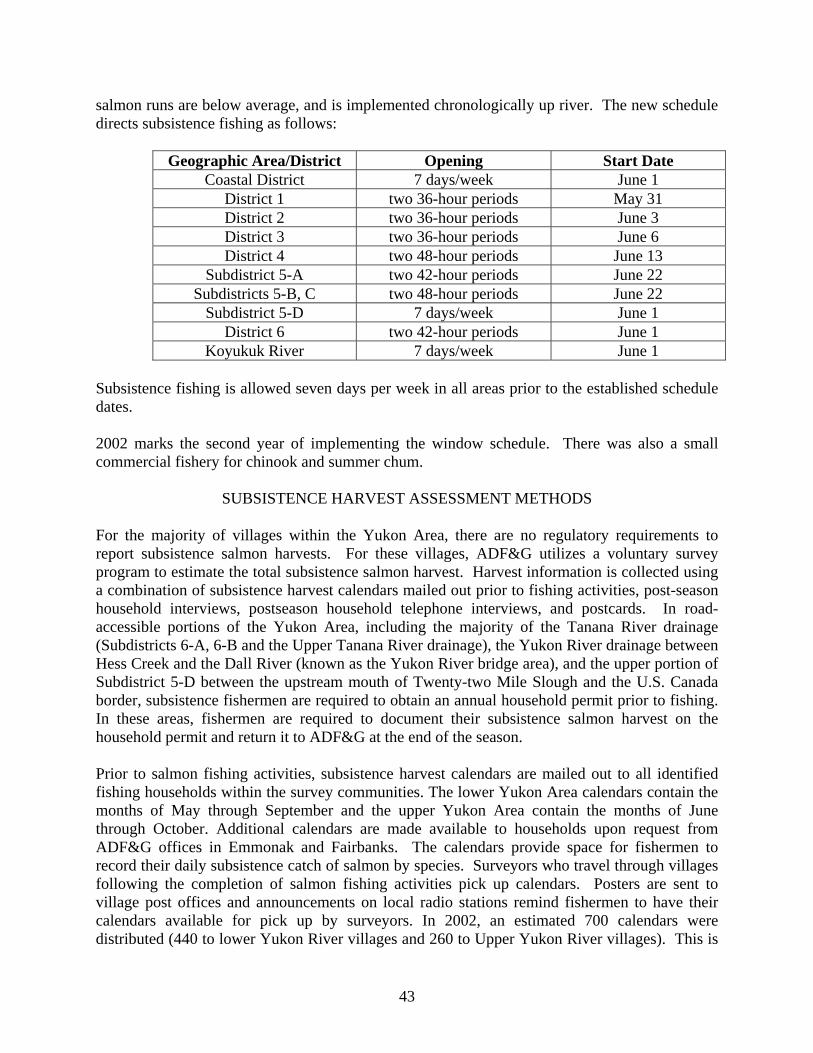
43
salmon runs are below average, and is implemented chronologically up river. The new schedule directs subsistence fishing as follows:
Geographic Area/District Opening Start Date
Coastal District 7 days/week June 1 District 1 two 36-hour periods May 31 District 2 two 36-hour periods June 3 District 3 two 36-hour periods June 6 District 4 two 48-hour periods June 13
Subdistrict 5-A two 42-hour periods June 22 Subdistricts 5-B, C two 48-hour periods June 22
Subdistrict 5-D 7 days/week June 1 District 6 two 42-hour periods June 1
Koyukuk River 7 days/week June 1 Subsistence fishing is allowed seven days per week in all areas prior to the established schedule dates. 2002 marks the second year of implementing the window schedule. There was also a small commercial fishery for chinook and summer chum.
SUBSISTENCE HARVEST ASSESSMENT METHODS
For the majority of villages within the Yukon Area, there are no regulatory requirements to report subsistence salmon harvests. For these villages, ADF&G utilizes a voluntary survey program to estimate the total subsistence salmon harvest. Harvest information is collected using a combination of subsistence harvest calendars mailed out prior to fishing activities, post-season household interviews, postseason household telephone interviews, and postcards. In road-accessible portions of the Yukon Area, including the majority of the Tanana River drainage (Subdistricts 6-A, 6-B and the Upper Tanana River drainage), the Yukon River drainage between Hess Creek and the Dall River (known as the Yukon River bridge area), and the upper portion of Subdistrict 5-D between the upstream mouth of Twenty-two Mile Slough and the U.S. Canada border, subsistence fishermen are required to obtain an annual household permit prior to fishing. In these areas, fishermen are required to document their subsistence salmon harvest on the household permit and return it to ADF&G at the end of the season. Prior to salmon fishing activities, subsistence harvest calendars are mailed out to all identified fishing households within the survey communities. The lower Yukon Area calendars contain the months of May through September and the upper Yukon Area contain the months of June through October. Additional calendars are made available to households upon request from ADF&G offices in Emmonak and Fairbanks. The calendars provide space for fishermen to record their daily subsistence catch of salmon by species. Surveyors who travel through villages following the completion of salmon fishing activities pick up calendars. Posters are sent to village post offices and announcements on local radio stations remind fishermen to have their calendars available for pick up by surveyors. In 2002, an estimated 700 calendars were distributed (440 to lower Yukon River villages and 260 to Upper Yukon River villages). This is

44
a departure from previous years’ methods of sending calendars to every household in the drainage. According to the Division of Commercial Fisheries, the change was made in response to the expense of mass mailings with very low return rates. Households that had returned a calendar at least once in the last ten years were sent a calendar in 2002; calendars were made available to additional households on request. About 30 percent of these (210) were either returned to the department by mail, or picked up by surveyors during their fall surveys. Calendars provide important run timing information that is not obtained by any other data collection method. In addition to the catch calendars, ADF&G’s Division of Commercial Fisheries personnel conduct post-season personal interviews with a stratified random sample of all fishing households within the Yukon River drainage. Survey questions focus on chinook, summer chum, fall chum and coho salmon, but households are also asked about other species as well such as pink salmon (primarily taken by coastal communities), pike, whitefish, and sheefish. Some households that are not personally contacted by the surveyors are contacted by telephone. Those households not contacted by telephone are mailed a survey questionnaire including a postage paid return envelope. In 2002, 913 households were interviewed concerning their subsistence salmon harvests (Brase and Hamner 2003:8). In road-accessible portions of the Yukon River drainage (see area description above), a subsistence permit is required. Subsistence fishermen record their salmon catches on a household permit and return the permit at the end of the season. Subsistence permit applications are mailed to all permitees who return the prior year’s permit. Subsistence permit applications are mailed to rural communities along with a letter explaining how to apply by mail. In addition, ADF&G staff travel to select villages so that applicants can be issued permits in person. Permits are also issued in person or by mail throughout the season from numerous ADF&G offices. Permit holders are required to keep a record of their daily fish harvest on their permit and return it to the department within ten days of the expiration date on the permit. Permit holders who do not send in their permits within ten days are sent up to two reminder letters. Telephone contacts with households that do not respond to the reminder letters are attempted as a final measure. Subsistence salmon permit-holders in a portion of Subdistrict 6-B (the Tanana River drainage above a point three miles upstream of Tolchaket Slough to the boundary with 6-C) are required to report their harvests weekly for in-season management purposes. To maximize the return of permits, ADF&G staff also sends reminder letters to these households. The annual return rate for permits is typically over 80 percent. A total of 367 subsistence and personal use permits were issued in 2002, and 340 (92.6%) were returned (Brase and Hamner 2003:Table17).
SUBSISTENCE SALMON HARVESTS IN 2002
In 2002, 913 households (81% of the total selected for surveys), 281 subsistence permit holders (92% of the 305 issued), and 59 personal use permit holders (95% of the 62 issued) provided harvest data for the Yukon Area subsistence/personal use salmon fishery (Brase and Hamner 2003). The estimated 2002 subsistence/personal use salmon harvest for the entire Yukon area broken down by species included 44,384 chinook (25%), 87,599 summer chum (50%), 20,140

45
fall chum (11%), 16,551 coho (9%) and 8,425 pink salmon (5%) for a total of 177,100 salmon (Fig. IV-2; Table IV-1). (Note that this is an estimated total based on household surveys and returned permits, and includes subsistence harvests, personal use harvests, commercial harvests retained for home use, and fish distributed from ADF&G test fisheries.) The 2002 subsistence salmon harvest shows a marginal increase over the disastrous 2000 levels but a significant decline from 2001 harvests, except for summer chum. The 2002 estimates fall below the recent five-year averages for all species, except summer chum. Nonetheless, summer chum, fall chum, and coho averages still show considerable declines compared to harvests averaged for the last two decades. While low abundance figures in 2001 closed commercial fishing in the Alaska portion of the Yukon River drainage, there was a small commercial fishery for chinook and summer chum in 2002 while the commercial fishery for fall chum and coho salmon remained closed. As shown in Table IV-2, the estimated subsistence harvest of 44,384 chinook salmon in 2002 is below both the most recent five-year Yukon Area average of 48,394 chinook salmon and the most recent 10 year average of 51,319 chinook salmon. However, the estimated 2002 subsistence harvest of 87,599 summer chum salmon showed a marked increase over 2001 harvests and the most recent five year average of 80,884 summer chum. The fall chum salmon harvest of 20,140 is both a significant decrease from the previous year and falls below the most recent five year average 44,405 fall chum salmon. It should be noted that the 1998-2002 average harvest includes years when regulatory restrictions were imposed on fishers to protect fall chum salmon stocks due to poor returns. Comparison with average fall chum salmon harvest for all years begins to show the true magnitude of the harvest decline in this fishery between 2000 and 2002; the average harvest of fall chum salmon between 1976 and 2002 was 124,483 fish (see also Figure IV-3). Subsistence harvests of coho salmon in 2002 were also slightly below average at 16,551 compared to the recent five year average of 18,908 coho salmon and the most recent ten year average of 23,486 coho salmon. Pink salmon harvest information is collected in several communities in the Yukon Area. Although pink salmon can be abundant in coastal and near-coastal communities of the lower Yukon area, they are not typically targeted by fishers and their harvest in the subsistence fishery remained low until 2002. The estimated 2002 subsistence pink salmon harvest was 8,425 fish. While these fish are primarily harvested exclusively by communities in the coastal district, 2002 estimates showed harvests by communities in the middle Yukon River region. An estimated 66% percent of the total households who participated in the 2002 subsistence fishery owned dogs. Figure IV-4 provides a breakdown of number of dogs by fishing district. Of the estimated 1,730 households (drainage wide) owning dogs, about 11% (193 households) are estimated to have fed their dogs whole salmon in 2001. Of the 5,744 dogs owned by fishing households, about 62% percent (3,531 dogs) were owned by households in the upper Yukon River, which includes Districts 4, 5, and 6 (Brase and Hamner 2003:74). In surveyed Districts 4 and 5, where species specific data were collected, an estimated 10,542 summer chum, 7,172 fall chum and 2,090 coho salmon were retained for dog food from both subsistence and commercial-related salmon harvests. This marks a significant increase in using summer chum for dog food in light of declining fall chum returns.

46
Primary gear types used by fishing households in surveyed villages included set gillnet (58%), drift gillnet (29%) and fish wheel (8%), and other gear (5%) (Brase and Hamner 2002:8). Figure IV-5 provides a breakdown of the subsistence salmon harvest gear types. Since 1992, ADF&G has inquired as to whether surveyed households were meeting their subsistence salmon needs for that year. The disastrous fishing year in 2000 resulted in restrictions and closures in subsistence salmon fishing schedules and made it extremely difficult for fishing families to meet their needs (64% of surveyed households reported not meeting their needs in 2000). Though salmon numbers were generally up from 2000, 56% of all surveyed households reported that they were unable to meet their subsistence salmon needs in 2001, while 55% of households reported not meeting their needs in 2002. In 1993, the Board of Fisheries (BOF) made a positive finding for Customary and Traditional Use for all salmon in the Yukon-Northern Area. The Amount Necessary for Subsistence Use determination (ANS) was established at 348,000-503,000 salmon for all species combined. Within the context of the last twenty years (since 1982), the overall total subsistence salmon harvest has declined by just over 50%. According to these figures, 1992 marks the last year when total subsistence salmon harvests fell within the ANS range. In 2001, the BOF broke this figure down by species in order to better represent the pattern of use in the subsistence fishery. While the post-season survey question does not attempt to address “needs” by species, it is significant to note, through retrospective comparison, that in the last five years (since 1998), chinook salmon harvest levels have fallen below the Amounts Necessary for Subsistence use determinations (ANS) twice (2000 and 2002), summer chum salmon harvest levels have fallen below the ANS three times (1999, 2000, 2001), fall chum salmon harvest levels have fallen below the ANS all five years, and finally, coho salmon harvests have not fallen within the ANS except for 2001 (see Table IV-3). Across species, harvest levels have not fallen within ANS 70% of the time. A species-specific ANS range provides one index for measuring the extent to which reasonable opportunity was provided in the subsistence fishery. Harvests below the lower bound of the ANS range may indicate, with other evidence, that there was not a reasonable opportunity for subsistence uses during the previous season. Harvests consistently lower than the lower bound of the ANS are an indication to the BOF to consider whether additional management actions are necessary to provide reasonable subsistence opportunities.

COMMUNITY TOTAL INCLUDED CHINOOK COHOAlakanuk 131 39 1,773 7,637 222 183 130 9,946Alatna 6 5 3 15 10 0 0 28Allakaket 49 13 200 6,242 100 56 0 6,598Anvik 33 30 708 1,089 401 0 0 2,198Beaver 25 18 702 77 1 17 0 796Bettles 22 17 0 0 0 0 0 0Birch Creek 8 5 67 0 0 0 0 67Central 10 10 258 0 0 0 0 258Chalkyitsik 40 27 26 0 4 0 0 30Circle 29 27 1,655 5 79 0 0 1,740College 1 1 0 0 0 0 0 0Delta Junction 4 4 0 0 0 0 0 0Denali Park 1 1 0 0 0 0 0 0Dot Lake 6 5 0 0 0 0 0 0Eagle 43 38 2,195 27 389 1 0 2,613Eagle River 1 1 42 2 0 0 0 44Emmonak 161 61 1,750 8,458 1,261 514 39 12,023Ester 4 2 0 0 0 0 0 0Fairbanks 105 104 1,839 298 247 1,089 0 3,473Fort Yukon 165 46 2,348 1,832 3,523 14 0 7,717Gakona 1 1 0 0 0 0 0 0Galena 168 53 1,522 712 349 169 50 2,802Grayling 46 15 2,249 1,311 52 30 30 3,671Healy 6 6 0 0 831 3,034 0 3,865Holy Cross 60 23 1,813 155 0 0 0 1,967Hooper Bay 201 63 282 9,780 44 125 5,475 15,706Hughes 20 18 67 1,089 0 100 0 1,256Huslia 81 22 222 3,178 0 60 0 3,461Kaltag 58 18 1,435 234 314 212 0 2,195Kotlik 90 26 1,686 6,115 114 542 849 9,306Koyukuk 27 22 323 426 255 249 4 1,256Manley Hot Springs 12 11 556 120 1,033 1,764 0 3,473Marshall (Fortuna Ledge) 76 24 2,290 2,484 341 386 473 5,974Minto 45 42 21 11 225 281 0 539Mountain Village 149 38 1,523 6,657 347 240 745 9,511Nenana 33 32 696 696 1,473 4,493 0 7,358North Pole 18 18 196 40 0 0 0 235Northway 11 11 0 0 0 0 0 0Nulato 94 27 1,773 269 0 78 50 2,170Nunam Iqua (Sheldon Point) 32 24 393 1,898 284 56 13 2,643Pilot Station 102 37 2,530 6,490 680 230 22 9,952Pitka's Point 25 20 566 639 16 47 35 1,303Rampart 16 12 852 14 0 0 0 866Ruby 67 21 954 1,406 78 69 87 2,594Russian Mission 63 17 1,887 394 164 115 0 2,561
[continued]
Table IV-1. 2002 Subsistence Harvests by Community: Yukon Management Area
ESTIMATED SALMON HARVEST1HOUSEHOLDS / PERMITS SUMMER
CHUMFALL
CHUM PINKTOTAL
SALMON
47

COMMUNITY TOTAL INCLUDED CHINOOK COHO
Table IV-1. 2002 Subsistence Harvests by Community: Yukon Management Area
ESTIMATED SALMON HARVEST1HOUSEHOLDS / PERMITS SUMMER
CHUMFALL
CHUM PINKTOTAL
SALMONSaint Marys (Andreafsky) 118 41 2,045 7,284 103 209 7 9,648Salcha 9 9 155 204 0 20 0 379Scammon Bay 82 25 840 5,016 240 123 417 6,636Shageluk 33 24 439 1,956 0 0 0 2,395Stevens Village 28 20 1,036 4 0 0 0 1,040Tanacross 7 7 0 0 0 0 0 0Tanana 102 35 2,379 3,321 6,255 2,032 0 13,987Tok 10 10 11 0 25 0 0 36Venetie 40 27 77 13 680 12 0 782Wasilla 1 1 0 0 0 0 0 0Totals 2,775 1,254 44,384 87,599 20,140 16,551 8,425 177,100
1Includes subsistence harvests, personal use harvests, commercial harvests retained for home use, and fish distributed from Alaska Department of Fish and Game test fisheries.
SOURCE: Alaska Department of Fish and Game, Division of Subsistence, Alaska Subsistence Fisheries Database, Version 3.3.
48

SUMMER FALLYEAR ISSUED RETURNED CHINOOK CHUM CHUM COHO PINK TOTAL1975 12,724 10,992 23,7161976 17,530 1,375 12,737 31,6421977 16,007 4,099 16,333 36,4391978 30,785 213,953 95,532 7,965 348,2351979 31,005 202,772 233,347 9,794 476,9181980 42,724 274,883 172,657 20,158 510,4221981 29,690 210,785 188,525 21,228 450,2281982 28,158 260,969 132,897 35,894 457,9181983 49,478 240,386 192,928 23,905 506,6971984 42,428 230,747 174,823 49,020 497,0181985 39,771 264,828 206,472 32,264 543,3351986 45,238 290,825 164,043 34,468 534,5741987 55,039 300,042 226,990 46,213 628,2841988 2,700 1,865 45,495 229,838 157,075 69,679 502,0871989 2,211 983 48,462 169,496 211,303 40,924 470,1851990 2,666 1,121 48,587 115,609 167,900 43,460 375,5561991 2,521 1,261 46,773 118,540 145,524 37,388 348,2251992 2,751 1,281 47,077 142,192 107,808 51,980 349,0571993 3,028 1,397 63,915 125,574 76,882 15,812 282,1831994 2,922 1,386 53,902 124,807 123,565 41,775 344,0491995 2,832 1,391 50,620 136,083 130,860 28,377 345,9401996 2,869 1,293 45,671 124,738 129,258 30,404 330,0711997 2,825 1,309 57,117 112,820 95,141 23,945 289,0231998 2,986 1,337 54,124 87,366 62,901 18,121 222,5121999 2,888 1,377 50,515 79,250 83,420 19,984 233,1692000 3,209 1,341 36,844 77,813 19,402 16,650 1,591 152,3002001 3,072 1,355 56,103 72,392 36,164 23,236 403 188,2982002 2,775 1,254 44,384 87,599 20,140 16,551 8,425 177,1001998-2002 Average 2,986 1,333 48,394 80,884 44,405 18,908 3,473 194,6761993-2002 Average 2,941 1,344 51,319 102,844 77,773 23,486 3,473 256,464All Years Average 2,817 1,330 42,506 171,772 124,483 28,545 3,473 344,828
SOURCE: Alaska Department of Fish and Game, Division of Subsistence, Alaska Subsistence Fisheries Database, Version 3.3.
ESTIMATED SALMON HARVEST
Table IV-2: Historic Subsistence Salmon Harvests: Yukon Management Area
HOUSEHOLDS /PERMITS
49

50
Table IV-3
Comparison of Amounts Necessary for Subsistence (ANS) Determinations and Estimated Subsistence Harvests, 1998-2002
*shaded boxes indicate where harvests fell below ANS
Species
Amount Necessary
for Subsistence
(ANS)
1998
1999
2000
2001
2002
Chinook
45,500-66,704
54,124
50,515
36,844
56,103
44,384
Summer Chum
83,500-142,192
87,366
79,250
77,813
72,392
87,599
Fall Chum
89,500-167,100
62,901
83,420
19,402
36,164
20,140
Coho
20,500- 51-980
18,121
19,984
16,650
23,236
16,551
Source: Alaska Department of Fish and Game, Division of Subsistence, Alaska Subsistence Fisheries Database, version 3.2

51
Delta Jct.
Dot Lake
TanacrossTok
Northway
Dawson
Eagle
Koyukuk
Pitka's Pt.
Pilot Station
Anchorage
Hooper Bay
ScammonBay
Sheldon Pt. Alakanuk Emmonak
Kotlik
Marshall
Russian MissionHoly Cross
ShagelukAnvik
Grayling
Kaltag NulatoGalena
Ruby
Bettles
HughesAllakaket
Tanana
Nenana
Manley MintoRampart
Stevens Village
Venetie
Fairbanks
CircleCentral
BirchCreek
Chalkyitsik
Ft.YukonBeaver
Huslia
Stebbins
Dillingham
Anvik
Rive
rMt.Village Healy
St. Mary's
Andreafsky R.
Innoko River
Koyukuk River Porcupine RiverChandalar River
Black River
Shee
njek
Rive
r
Kantis
hna R
.
Kusko
kwim
Rive
r
Tanana RiverYuk
on R
iver
Gisasa R.
Nulato R.
Birch Cr.
Chena R.
Salcha R.Wood R.
Tolovana R.
5b5c 5d
6a6b 6c
32
1
4a
4b4c
Distric ts 4,5,6Upper Yukon Area
Yukon River Fisheries Management Area
Nome
Alatna
Old Crow
0 50 100 miles
ALAS
KAYU
KON
5a
Map of the Alaskan portion of the Yukon River drainage showing communities and fishing districts.
Lower Yukon AreaDistric ts 1,2,3 &Coastal Distric t
Point Romanof
NaskonatPeninsula

52
Figure IV-2. Yukon Area Subsistence Salmon Harvests, 2002
Chinook25.1%
Coho9.3%
Pink4.8%
Fall Chum11.4%
Summer Chum49.5%
N = 177,100 salmon; based on annual harvest assessment program using permits, calendars, and household surveys.

Figure IV-3. Yukon River Subsistence Salmon Harvests by Species, 1988 - 2002
53
Chinook
010,00020,00030,00040,00050,00060,00070,000
1988
1989
1990
1991
1992
1993
1994
1995
1996
1997
1998
1999
2000
2001
2002
Year
Num
ber o
f Sal
mon
Summer Chum
0
50,000
100,000
150,000
200,000
250,000
1988
1989
1990
1991
1992
1993
1994
1995
1996
1997
1998
1999
2000
2001
2002
Year
Num
ber o
f Sal
mon
Fall Chum
0
50,000
100,000
150,000
200,000
250,000
1988
1989
1990
1991
1992
1993
1994
1995
1996
1997
1998
1999
2000
2001
2002
Year
Num
ber o
f Sal
mon
Coho
010,00020,00030,00040,00050,00060,00070,00080,000
1988
1989
1990
1991
1992
1993
1994
1995
1996
1997
1998
1999
2000
2001
2002
Year
Num
ber o
f Sal
mon
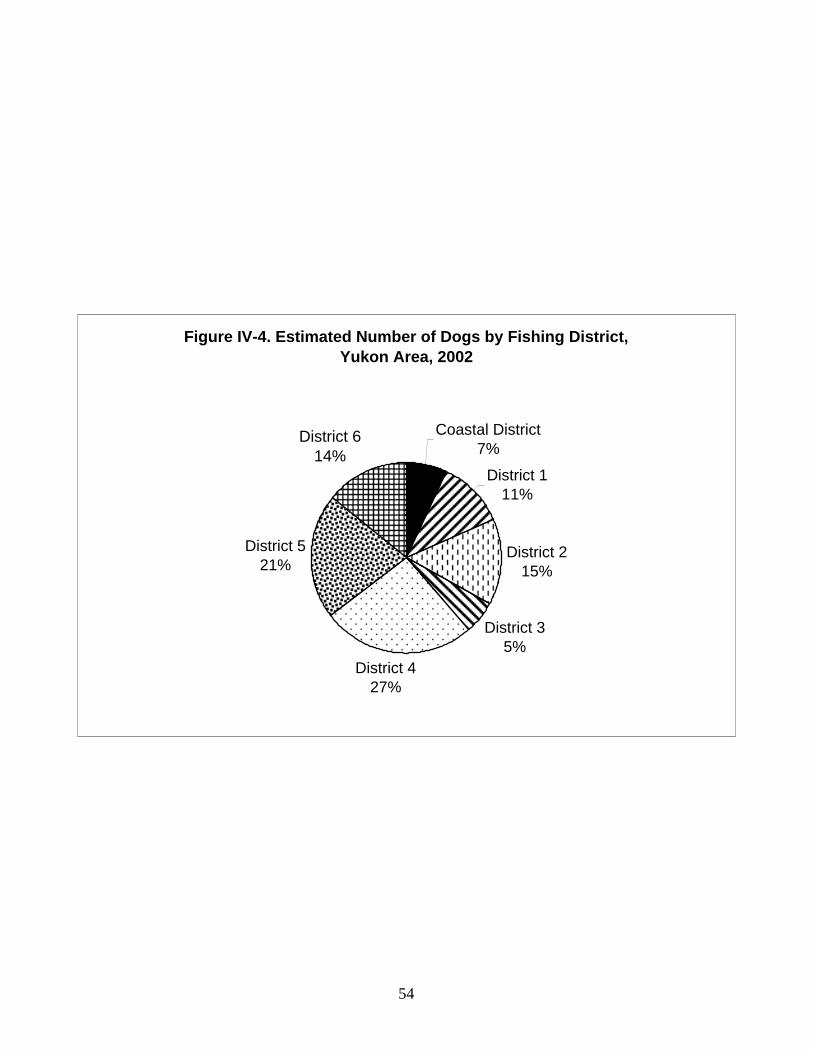
54
Figure IV-4. Estimated Number of Dogs by Fishing District, Yukon Area, 2002
Coastal District7%
District 111%
District 215%
District 35%
District 427%
District 521%
District 614%

55
Figure IV-5. Primary Gear Type Utilized for Subsistence Salmon Fishing, Yukon Area, 2002
Set Nets58%
Drift Nets29%
Hook and Line 5%
Fishwheels8%

56

57
V: KUSKOKWIM AREA
BACKGROUND
The subsistence salmon fishery in the Kuskokwim region is one of the largest and most important in the state. From early June through August, the day-to-day activities of many Kuskokwim Area households revolve around the harvesting, processing and preserving of salmon for subsistence use. The seasonal movement of families from permanent winter communities to summer fish camps situated along rivers and sloughs continues to be a significant element of the annual subsistence harvest effort. Division of Subsistence studies in the region indicate that fish contribute as much as 85 percent of the total pounds of fish and wildlife harvested in a community annually, and salmon as much as 53 percent of the total annual harvest (Coffing 1991). The harvest of salmon for subsistence use is a much as 650 pounds per capita in some Kuskokwim River communities. More than 1,500 households in the region annually harvest salmon for subsistence use. Many other households not directly involved in catching salmon participate by assisting family and friends with cutting, drying, smoking, and associated preservation activities (salting, canning, and freezing). Annual subsistence harvest surveys have been aimed at gathering data on chinook, chum, sockeye, and coho salmon. Subsistence catches of Chinook salmon in the Kuskokwim Area often exceed the commercial catch of this species. There are 38 communities consisting of approximately 4,500 households within the Kuskokwim Area. The majority (75 percent) of the area households are situated within the drainage of the Kuskokwim River. Bethel is the largest community in the region, containing approximately 1,700 households. Roughly 350 households are located in the northern Kuskokwim Bay communities of Kwigillingok, Kongiganak, and Kipnuk. Residents of these three communities harvest subsistence salmon from the Kuskokwim River as well as from areas closer to the communities. Residents of Quinhagak, Goodnews Bay, and Platinum, located along the southern shore of Kuskokwim Bay, harvest salmon stocks primarily from the Kanektok, Arolik, and Goodnews river systems. Residents of Toksook Bay, Nightmute, Tununak, Newtok, Chefornak, and Mekoryuk, situated near the Bering Sea Coast, harvest salmon from coastal waters as well as local tributaries.
REGULATIONS
Statewide eligibility criteria require individuals be Alaskan residents for the proceeding 12 consecutive months before harvesting salmon for subsistence use. Prior to 1990 there were additional restrictions on participation in the fishery, described in earlier annual management reports. The majority of those individuals subsistence fishing for salmon in the Kuskokwim Area are residents of the area. People living in other parts of the state who have family or friends in the region sometimes return to the Kuskokwim area to harvest or help process salmon. Licenses and permits have never been required for subsistence salmon fishing in the Kuskokwim Area, nor were any required during 2002. With the exception of the Aniak River, there were also no restrictions on the number of salmon that could be harvested by individual fishers or

58
households. Salmon harvested for subsistence use could be caught using set and drift gill nets, beach seines, fish wheels, and rod and reel. Spears could be used in the Holitna, Kanektok, Arolik, and Goodnews river drainages only. The total length of set or drift gill nets in use by an individual fisher could not exceed 50 fathoms. Unless changed by emergency order, gill nets used for harvesting salmon could be of any size mesh, however nets with six inch or smaller mesh could not be more than 45 meshes deep and nets with greater than six-inch mesh could not be more than 35 meshes deep. Fishers were required to have their name and address attached to their gill nets and fish wheels. Rod and reel fishers upstream of Doestock Creek on the Aniak River had a combined daily bag limit of six fish, no more than three of which could be salmon. Subsistence Salmon Fishing Schedule As in 2001, subsistence salmon fishing throughout the Kuskokwim River drainage was regulated by a fishing schedule as part of the salmon management rebuilding plan adopted by the Board of Fisheries in January 2001. The fishing schedule provided for periods of four consecutive days per week that were opened to subsistence salmon fishing and three consecutive days per week when subsistence salmon fishing was closed to gillnet and fish wheel gear. The department polled the communities throughout the Kuskokwim River drainage for guidance on which three days would be the most desirable. Based on community response and the recommendation of the Kuskokwim River Salmon Management Working Group (KRSWMG), Wednesday through Saturday was selected for the open period. Subsistence fishing with rod and reel was not included in this schedule nor were other Kuskokwim Area salmon fisheries. The schedule started June 2 in District 1, was expanded to include all waters downstream of Chuathbaluk starting June 9, and was further expanded to include all waters of the entire Kuskokwim River drainage starting June 16. Some non-salmon tributaries in the lower and middle Kuskokwim drainage were not closed by this schedule and waters outside of the Kuskokwim drainage were not affected by the schedule. The schedule was lifted June 30, when the department opened the commercial salmon fishing season in Districts 1 and 2. Compliance with the schedule was excellent. Department staff made specific efforts to inform the public through the newspaper and radio media starting in late March 2002 and continued through late June. In-Season Subsistence Closures Areas within the commercial salmon fishing districts were periodically closed to subsistence salmon fishing using net gear and fish wheels 16 hours before, during, and 6 hours after commercial salmon fishing periods. The purpose of these closures was to discourage illegal commercial fishing and to help discourage the sale of subsistence caught salmon in the commercial fishery. Many of the commercial fishers are local residents who also subsistence fish. The specific waters closed to subsistence fishing varied district to district. During 2002, these closures in District 1 began August 1 and lasted until August 3. Three additional closures occurred in District 1, from August 4 to August 13. There were numerous periodic subsistence fishing closures in both district 4 (Quinhagak) and District 5 (Goodnews Bay and Platinum) areas from June through August.

59
Also in 2002, the department issued an emergency order which modified the periodic subsistence fishing closure time in Kuskokuak Slough. By regulation, Kuskokuak Slough remains open to subsistence salmon fishing seven days per week after July 31. The modified regulation established periodic subsistence salmon fishing closures in Kuskokuak Slough 16 hours before, during and 6 hours after each commercial fishing period anywhere in District 1, consistence with the remainder of District 1 waters. This change was also proposed for the upcoming 2004 Arctic-Yukon-Kuskokwim Board of Fisheries meeting.
SUBSISTENCE SALMON HARVEST ASSESSMENT METHODS Data on the subsistence harvest of salmon are collected annually. Commercial Fisheries Division began conducting subsistence salmon harvest surveys along the Kuskokwim River in 1960. Surveys were initiated in Quinhagak (1967) and Goodnews Bay and Platinum (1979). The Division of Subsistence took over the annual subsistence salmon harvest surveys in 1988 under a reimbursable services agreement and has been responsible for collecting and analyzing the data since then. During the early survey years, prior to 1985, subsistence salmon catch data were lumped into two primary categories, “king salmon” and “small salmon.” Survey methods were further refined during the 1988 field season that have resulted in more complete data for all salmon species harvested. For 2002, three methods were used to gather subsistence salmon harvest data in the Kuskokwim Area. These methods include subsistence salmon catch calendars, post-season community household surveys, and postcard surveys. Catch Calendars In May 2002, subsistence salmon catch calendars were mailed to all Kuskokwim Area households that had been identified as “usually fish” and to all households that fished the previous fishing season. Three similar, but unique, catch calendars were designed for recording the daily catch of each salmon species harvested for subsistence use. One style of calendar was sent to households in communities along the Lower and Middle regions of the Kuskokwim river, to communities along the Bering Sea Coast and North Kuskokwim Bay, and to those communities in the Upper Kuskokwim river region upstream as far as the community of Stony River. A second style of calendar was sent to the remaining households in the Upper Kuskokwim River region, and a third style was sent to households in Quinhagak, Goodnews Bay, and Platinum. Differences in the style of calendar sent to households take into account the species available, salmon run-timing, and timing of subsistence fishing activities. Where mailing addresses were available, the calendars were mailed to post office boxes; otherwise calendars were sent general delivery for the post office clerk to distribute. Each calendar was postage paid and addressed for return to the Division of Subsistence office in Bethel. Subsistence salmon catch calendars were mailed to 2,504 households.

60
Household Surveys The second method, which is the primary method of collecting subsistence salmon harvest information, was the post-season household surveys. For these surveys, staff traveled to communities in the Kuskokwim Area and went house-to-house interviewing residents about their 2002 fishing efforts. Similar to the approach used in developing the catch calendars, three color-coded survey instruments were used to survey the majority of the communities. Except for local terms used for the salmon species the survey questions asked in each region were identical. The survey form used when interviewing Bethel and Aniak households also included a space for recording the household’s resident address and quantified harvests by gear type and harvest locations for fish caught with hook and line gear. Both Bethel and Aniak surveys included questions aimed at collecting subsistence harvest information for non-salmon species. During 2002, the Division of Subsistence staff conducted house-to-house surveys in 27 communities. Budget constraints have precluded attempts to conduct house-to-house surveys in Mekoryuk, Newtok, Nightmute, Toksook Bay, Tununak, Chefornak, and Telida. As in past years, house-to-house surveys were also not done in the communities of Kwigillingok, Kipnuk, and Kasigluk. These communities have not consented to allow the house-to-house surveys to be done. For the first time in several years, surveys were not done in Lime Village because of weather and logistical difficulties. Through funding administered through the US Fish and Wildlife Service Office of Subsistence Management, the Orutsararmiut Native Council (ONC) located in Bethel, hired survey technicians to conduct the house-to-house surveys in Bethel. The Kuskokwim Native Association (KNA), through a similar funding arrangement with US Fish and Wildlife Service Office of Subsistence Management, hired technicians to conduct the post-season surveys in Aniak. In both of these cooperative efforts, the Division of Subsistence trained the hired technicians and oversaw the survey efforts. The data collected by both ONC and KNA followed the methods and protocols developed by the Division. Survey efforts in these communities occurred over a two-month period, beginning in early October after most residents had completed salmon fishing for the season and after most hunters had returned home from fall moose and caribou hunting. Communities in which residents usually harvest salmon through October were surveyed in November. Time spent in any one community ranged from one-half to two days depending on the size of the community. Surveys in Bethel were conducted over an 11-week period. Households were surveyed systematically. Prior to beginning the community surveys, efforts were made to inform and prepare residents for the arrival of staff conducting the surveys. This was done weeks or days in advance of their arrival through letters to city, tribal, or traditional council offices in each community, radio announcements, posters in public buildings, and phone calls to community officials. Prior to traveling to each community, staff identified households that had already mailed in or returned their salmon harvest calendars. In Bethel, survey staff used a map of the community originally developed by the Bethel Fire Department. This map identified the street addresses of much of the community and was used to divide the community into areas that could be assigned to each of the two survey staff. This map was edited and modified using aerial photos taken in late August by the Division of

61
Subsistence SRS III in Bethel. Survey staff working in Bethel also had access to a list of all Bethel households identified through previous surveys and a list of households that had been sent and had returned their salmon fishing calendar. Upon arrival in a community, staff checked in with the city or council office to introduce themselves and outline their task. Staff used these household checklists to help them identify households they needed to contact while conducting household surveys. Each “checklist” contained a listing of all known households in the community, identified those households which were reported to have subsistence fished for salmon the previous year (2001), and households which were mailed 2002 catch calendars. Knowledgeable individuals in the community helped staff update the community household list and identify which households “usually fished” and which households “usually did not fish.” These individuals also helped to identify households that subsistence fished for salmon in 2002. Attempts were made to contact all households that were either identified as “usually fish” or were known to have fished during 2002. In Bethel, an effort was made to contact every household (a census) so that a more accurate list of the total number of households in Bethel could be established. Unlike the other communities, there was no one agency or organization that could provide a current Bethel household list. Structured interviews were conducted with these households through the use of the survey instrument. Subsistence salmon catch calendars that had not been mailed back to the department were also collected during the interview if available. If time permitted, other households on the community list were contacted about their salmon fishing activities. In 2002, 2,631 Kuskokwim Area households were surveyed using this method. Postcard Surveys The third method of collecting subsistence salmon harvest information was through the use of postcard surveys. The postcard survey simply asked if the household harvested salmon from the Kuskokwim Area for subsistence use, the type of fishing gear used, and how fishing was for each of the four salmon species usually harvested. The postcard could be separated in half and returned postage paid to the department. This type of survey was the primary method for obtaining harvest data from households in Kipnuk, Kwigillingok, Kasigluk, Mekoryuk, Newtok, Nightmute, Toksook Bay, Tununak, and households in other communities which were not available at the time of the community surveys. In Bethel, several postcard surveys were also left at occupied homes where multiple attempts to contact the residents failed. As a final effort to contact households in Bethel, those individuals on the “usually fish” strata for which the department had a mailing address were also mailed a survey postcard. Overall, 300 postcards were distributed to Bethel residents. Several postcards were returned with an address correction indicating that the individual had moved away. If the address correction included a current address, a follow-up postcard was then sent to determine if the individual harvested salmon in the Kuskokwim Area during 2002. Overall, 1,655 households in the region were mailed postcard surveys.

62
2002 SAMPLING SUMMARY Of the estimated 4,339 households located in the Kuskokwim Area, 2,798 households were contacted through calendar returns, returned postcards, or household surveys (Table V-1). Additionally, fishing and harvest information was obtained for other households from another household’s survey form or in consultation with village officials. This increased to 2,806 the number of households for which some information was available. Of this total, harvest data (whether did not fish or harvest numbers) was obtained for 2,767 households; community and area harvest estimates are based upon this set of households. Of all households for which information is available, 1,696 (39 percent of total households) were identified as harvesting salmon during 2002 for subsistence use (although harvest numbers were not available for all of these fishing households). Within the Kuskokwim River drainage (including North Kuskokwim Bay communities) 2,603 (73 percent) of the 3,549 households in the region were contacted. Households that were determined not to have fished during 2002, were not targeted for the survey, however, some were contacted. This region contains 82 percent of the total households in the Kuskokwim Area and 92 percent of the identified subsistence fishing households. In the South Kuskokwim Bay region (Quinhagak, Goodnews Bay, and Platinum), 156 (74 percent) of the 210 households were contacted. A total of 114 (54 percent) households harvested salmon in 2002 for subsistence use, of the households contacted, 73 percent harvested salmon in 2002 for subsistence use. In total, 580 households have been estimated in the Bering Sea Coast communities of Mekoryuk, Newtok, Nightmute, Toksook Bay, Tununak, and Chefornak. A complete list of households was not available for these communities. Because house-to-house surveys were not conducted in these communities, data were obtained only by postcard surveys and calendar returns. 39 households in this region provided information, and 27 reported harvesting salmon. Based on data gathered in previous years, actual participation in salmon harvesting activities by households in this region is thought to be much greater than that reported by catch calendars and postcards. For most communities, house-to-house surveys continue to be the primary vehicle for gathering data on harvest and use of subsistence salmon. In total, 12 percent (304) of the 2,504 subsistence salmon calendars which were mailed pre-season were used and returned or picked up during household surveys. There were 139 (8 percent) responses to the 1,655 postcard surveys mailed to Kuskokwim Area households.
2002 SUBSISTENCE SALMON HARVEST SUMMARY A summary of the subsistence salmon harvest estimates by community and fishing area is presented in Table V-1. The 2002 total subsistence salmon harvest estimates for the Kuskokwim Area were 70,219 chinook (34 percent), 73,234 chum (36 percent), 27,733 sockeye (13 percent), and 34,413 coho (17 percent), a total of 205,599 salmon. Seventy-six percent of the overall subsistence salmon harvest in the Kuskokwim was taken by residents of communities located

63
from Tuluksak downstream to Eek. Residents of Bethel harvested 27 percent of the overall Kuskokwim Area subsistence salmon harvest. The harvest of chinook in the entire Kuskokwim Area decreased slightly in 2002 compared to 2001 harvests (Table V-2). When compared to the 1989 – 2001 average, the 2002 chinook harvest was down about 17 percent for the Kuskokwim Area. Although the 2002 harvest of chum salmon increased by 43 percent over the 2001 harvest, which was a relatively low harvest, the 2002 chum salmon harvest was still about 8 percent below the 1989 to 2001 average harvest for the entire area. In contrast, the 2002 sockeye harvest was 46 percent lower than the 2001 sockeye harvest, and 30 percent lower than the 1989 to 2001 average. The 2002 coho harvest increased 8 percent over the 2001 harvest, but was still 12 percent below the 1989 to 2001 average. Harvest trends described above were also true for the Kuskokwim River drainage, where most of the salmon harvested in the area are caught. While chinook harvests in the Lower and Middle Kuskokwim declined slightly, chinook harvest in the Upper Kuskokwim River increased by 39 percent from 2001. Chinook harvests in both Quinhagak and Goodnews Bay/Platinum also declined from 2001. Sockeye salmon harvests in 2002 were down in each region of the Kuskokwim River by 49 percent to 54 percent from 2001. In contrast, the 2002 sockeye harvest in the South Kuskokwim Bay was slightly up (1%) from 2001, and significantly up (260%) on the Bering Sea Coast. The Bering Sea Coast numbers likely reflect the change in contacted households, 39 contacted in 2002 and only 6 contacted in 2001. The stronger chum salmon return in 2002 resulted in increased harvests ranging from 18 percent over the 2001 harvest in the Middle Kuskokwim area to 21 percent in the Upper Kuskokwim River. The reported chum salmon harvest in Quinhagak, Goodnews Bay and Platinum was up 131 percent from 2001. Coho salmon harvests in 2002 were up 9 percent to 32 percent from 2001 on the River, but down 33 percent to 35 percent in the North and South Kuskokwim Bay communities. Dog Food Historically, the harvest of salmon for use as dog food was a significant portion of the overall subsistence harvest of salmon, specifically for chum and coho salmon. Over the past 10 years, the number of households harvesting salmon specifically for dog food has declined. During 2002, 71 households reported harvesting salmon specifically to process and use as dog food. Chum salmon represented the majority of the reported harvest for dog food at 5,918 fish. Coho salmon accounted for 1,321 fish and sockeye contributed a reported 513. Households do not target chinook salmon for dog food; however, some chinook salmon unfit for human consumption may be fed to dogs so the fish is not wasted. It is common for most households to feed scraps, backbones, entrails, and salmon unfit for human consumption to their dogs so nothing is wasted. 247 households responded that they fed scraps, backbones, and entrails to their dogs, but they did not harvest or put up any salmon specifically for dog food.

64
Gear Types Subsistence fishing households often use more than one type of gear (i.e. set gillnet, drift gillnet, fish wheel, or rod and reel) when harvesting salmon (Table V-3). Households that harvested salmon were asked to provide information on the types of gear they used. The most common gear type used throughout the Kuskokwim Area is the drift gillnet, which is the primary gear used by households from Crooked Creek to downriver, including the coastal communities. During the 2002 season, 1,087 households reported using drift gillnets for harvesting subsistence salmon. Set gillnets area also used throughout the Kuskokwim Area; however they are used in a greater proportion in the upper Kuskokwim communities of Red Devil, Lime Village, Stony River, McGrath and Nikolai, as well as Mekoryuk located on Nunivak Island. Overall, 304 households reported using set gillnets for harvesting salmon. Rod and Reel gear is also used for subsistence fishing by many communities throughout the area. Rod and reel is used by families who may not have access to other gear types, by fishers in areas were other gear types are not as effective or efficient, and to harvest fewer fish when less is needed. Chinook and coho salmon are the two salmon species most frequently harvested by rod and reel gear. For McGrath and Nikolai residents, rod and reel is the primary gear type used for harvesting subsistence chinook salmon. During 2002, 369 households in 23 communities reported using rod and reel to harvest salmon for subsistence use. Fish wheels are used in the middle and upper Kuskokwim areas for harvesting salmon, most frequently by fishers in Aniak, Stony River, Lime Village, and McGrath. Fish wheels in the Kuskokwim are used primarily for harvesting sockeye, chum, and coho salmon. During 2002, two households reported using fish wheel gear for harvesting subsistence salmon, both were in Aniak. Generally one or two fish wheels are operated by households in McGrath; however, during 2002 none of the households in McGrath reported harvest using a fish wheel. It is possible that the households that usually use a fish wheel were missed by the 2002 survey effort. During 2002, no households reported using spears for harvesting subsistence salmon. In Mekoryuk, three households reported using seine gear to harvest subsistence salmon. Salmon Retained from Commercial Fishing for Subsistence Use Households that are involved in commercial salmon fishing sometimes keep some salmon caught through their commercial fishing activities to bring home for subsistence use. The number of salmon retained from commercial fishing activities for subsistence use is usually relatively low. During 2002, there were no commercial salmon fishing periods in the Kuskokwim River drainage until early August. There were, however, commercial fishing periods in Districts 4 and 5 during June and July as well as August. Forty-one households reported retaining salmon for subsistence use from commercial fishing activities in 2002. The amount of salmon reportedly kept for subsistence use amounted to 56 chinook, 15 chum, 77 sockeye, and 177 coho salmon.

65
Quality of Fishing Fishing households that were interviewed in person and those that were mailed a survey postcard were asked to respond to a qualitative question about their subsistence salmon fishing for the season. The purpose of this question was to learn how households viewed their 2002 subsistence fishing success. Households were asked to rate their subsistence fishing success for each of the four species surveyed (chinook, sockeye, coho, and chum) as “Very Good,” “Average,” or “Poor.” A total of 1,198 households responded to this survey question. The majority of responding households rated their subsistence fishing during 2002 as very good or average. Harvest success was highest for coho (88 percent), chum (85 percent) and chinook salmon (83 percent). Sixty-three percent of responding households indicated 2002 sockeye fishing was very good or average; with most (44 percent) indicating only average fishing success, 19 percent indicating very good fishing success. Thirty-seven percent rated sockeye fishing during 2002 as poor. A total of 166 households who rated their 2002 chinook fishing as poor also provided reasons for their rating. Sixty-nine households reported not enough fish, seven households indicated that it was too sunny and hot and the fish were deeper than usual, and eight households reported gear problems. Twenty-two households reported that the subsistence fishing schedule prevented them from harvesting enough chinook salmon. Other reasons given were of a personal nature. One hundred and eleven households reported chum salmon fishing as poor. Forty-three of these households indicated the low numbers of returning fish as the reason. Thirteen households identified the subsistence salmon fishing schedule as the reason that their chum fishing was poor, seven identified gear or equipment problems, and the rest of were of a personal nature. A total of 296 households rated their sockeye salmon fishing as poor. Most (169) indicated that there were relatively few sockeye available during the 2002 fishing season. Few (17) indicated the subsistence schedule as the reason. The remaining indicated personal reasons for the poor sockeye fishing. Seventy-four households rated coho salmon fishing as poor for 2002, 35 of these households pointed to weak coho returns as the reason, and personal reasons accounted for the rest.
OTHER FISH
In 2002, there was no annual non-salmon fisheries harvest assessment project in place uniformly throughout the Kuskokwim Area. In most communities, harvest assessment for non-salmon does not occur, however, in 2002, both Bethel and Aniak non-salmon harvests were surveyed in conjunction with the post-season salmon harvest household surveys (see following summaries). Harvest estimates for non-salmon are also available for a few other communities, such as Kwethluk, Nunapitchuk, and Akiachak, based on community-based surveys conducted in the region in the 1980’s and 1990’s. Surveys of herring harvested for subsistence use were conducted in the mid 1980’s through the early 1990’s in the Nelson Island region. These data are in the Community Profile Database (Scott et al. 2001).

66
STUDY FINDINGS FOR BETHEL During 2002, harvest assessment of non-salmon species by Bethel households occurred in conjunction with the post-season salmon harvest surveys. The Division of Subsistence, for the second year in a three year project, directed a study of the Bethel area through the work of Orutsararmiut Native Council (ONC) in Bethel to conduct subsistence fish harvest surveys of households in the Bethel community during October and November 2002. The purpose of the survey was to contact Bethel households to gather information about their harvest of fish, identify households that participated in the subsistence fisher, estimate the number of fish harvested by the community, and identify gear used for subsistence fishing. The survey focused on salmon harvested during the period from May through September 2002, and non-salmon species harvested during the period October 1 2001 through September 30, 2002. 2002 Bethel Sampling Summary Using the 2001 list of Bethel housing units, and results from the 2001 Bethel survey, an updated list of Bethel housing units was created for 2002. Survey results indicate that there were a total of 1,499 occupied household units in 2002. Of these 1,499 households, 1,312 were contacted through calendar returns, postcard returns, or household survey. Face-to-face surveys were conducted at 1,263 of these households, for a participation rate of 84 percent. 2002 Bethel Subsistence Harvest Participation Summary Of all the households contacted, a total of 579 households (39 percent of total households) reported harvesting salmon during the study period (Table V-4). Of these households, 507 reported harvesting chinook, 395 reported harvesting coho, 433 reported harvesting chums, 392 reported harvesting sockeye, and 48 harvested pinks. Of non-salmon species, smelt, northern pike, whitefish, burbot, and sheefish were reported as being harvested most often and in largest numbers, with smelt being reported harvested by the most households (16 percent). Roughly 4 percent of households reported harvesting blackfish, grayling, Dolly Varden, and rainbow trout; and few households (1%) reported harvesting lake trout. Bethel Harvest Amounts Based on the Bethel household surveys, total community estimates were made of the amount of each fish species harvested for subsistence use during the study period (Table V-4). An estimated 55,424 salmon were harvested for subsistence use by Bethel residents in 2002, and estimated 28,500 non-salmon fish (excluding blackfish and smelt) were harvested. Approximately 2,191 gallons of smelt were harvested, along with 711 gallons of blackfish. Of the salmon harvest, 34.8 percent were chinook, 27.2 percent were chum, 13.3 percent were sockeye, 23.4 percent were coho, and 1.3 percent were pinks. Northern pike and whitefish were the primary non-salmon species harvested, representing 37 percent and 34 percent of the total non-salmon harvest (excluding blackfish and smelt).

67
Bethel Harvest Gear In 2002, the majority of the salmon harvested by Bethel residents (89.2 percent) were caught with drift gillnets (Table V-4). Set gillnets, which are generally used when fishers are targeting chinook salmon early in the run, were used to harvest approximately 7.7 percent of the salmon harvested. Rod and reel gear accounted for 3.1 percent of salmon harvest. In contrast to salmon, drift gillnets were reported as being used to harvest only 1.5 percent of non-salmon species, while 43.6 percent of the non-salmon harvest resulted from hook and line gear (mainly for northern pike and burbot) and 21.2 percent from set gillnet in open water (mainly for whitefish). Eighteen percent of the non-salmon harvest was done using nets set under the ice (mainly for sheefish and whitefish), and 16.9 percent of the non-salmon harvest was accomplished using rod and reel (all non-salmon species excluding smelt and blackfish). Smelt were harvested exclusively with dip nets, and blackfish were harvested using small, locally made fish traps called taluyat.
STUDY FINDINGS FOR ANIAK During October and November, 2002, ADF&G in partnership with Kuskokwim Native Association (KNA), conducted subsistence salmon and non-salmon harvest surveys of households in the community of Aniak. The purpose of the survey was to gather information from Aniak households about their harvest of fish, to identify households that participated in the subsistence fishery, to estimate the number of salmon and non-salmon resident fish harvested by the community for subsistence, and to identify gear used for subsistence fishing as well as the harvest areas where hook and line gear was used for each species harvested. The survey focused on salmon harvested during the period of May to September 2002, and non-salmon species harvested during the period of October 1, 2001 through September 30, 2002. 2002 Aniak Sampling Summary An updated list of households in Aniak was generated using the 2001 household list and results from the 2001 household survey in Aniak. Kuskokwim Native Association staff verified household locations and addresses, adding and removing households as appropriate. The updated list indicated a total of 165 occupied household units in the community of Aniak. During the 2002 survey effort, face-to-face surveys were conducted at 163 of these units, for a participation rate of 99 percent. 2002 Aniak Subsistence Harvest Participation Summary A total of 120 households (74 percent of surveyed households) reported harvesting fish for subsistence use during the study period (Table V-5). Of these households, 86 reported harvesting chinook salmon, 97 harvested coho, 56 harvested chum, and 51 harvested sockeye. Only four households reported harvesting pink salmon. Of non-salmon species, whitefish, sheefish, and northern pike were each reported as being harvested by 25 to 30 households, with northern pike being harvested by the most households. Rainbow trout was harvested by 20 households, Dolly Varden by 17, and Grayling by 15. Three households reported harvesting

68
smelt, one household reported harvesting lake trout, and no households reported harvesting blackfish. Aniak Harvest Amounts Based on the 163 households surveyed, total community estimates were made of the amount of each fish species harvested for subsistence use during the study period (Table V-5). An estimated 9,379 salmon and 3,938 resident species (excluding smelt) were harvested by Aniak residents in 2002. Chinook salmon represented 31.9 percent of the salmon harvest, coho salmon represented 27.9 percent, sockeye represented 7.7 percent, chum represented 32.0 percent, and pink salmon represented 0.5 percent. The majority of non-salmon fish harvested were whitefish, representing 79 percent of the total non-salmon harvest. Sheefish and northern pike represented 5 percent and 6 percent respectively, with remaining species representing less than 5 percent each of the total non-salmon harvest. Aniak Harvest Gear In 2002, the majority of salmon harvested (63.3 percent), were caught with drift gillnets (Table V-5). Set gillnets were used to harvest approximately 14.6 percent of the salmon caught, and 15.3 percent of salmon were caught with rod and reel. Large mesh gear continues to be used by the majority of subsistence fishers targeting chinook salmon. Forty-one households reported using gillnets with 8-inch mesh or greater. In contrast to salmon, drift gillnets were used to harvest only two percent of non-salmon species. Approximately 14 percent of resident species were harvested with rod and reel gear and 16 percent (primarily whitefish and sheefish) with set gillnet in open water. Sixty-seven percent of resident species (primarily whitefish), were harvested with other gear, such as fish wheel or fish trap. Few households reported fishing with hook and line gear through the ice. Smelt were harvested exclusively with dip nets.

Table V-1. 2002 Kuskokwim Area Subsistence Salmon HarvestsChinook Chum Sockeye Coho Total
Total HH's Reported Est.* Reported Est.* Reported Est.* Reported Est.* Reported Est.*HH's Harvest Total Harvest Total Harvest Total Harvest Total Harvest Total
Kipnuk 176 1 1 1 5 5 11 11 69 69 86 86Kwigillingok 95 0 0 0 0 0 0 0 0 0 0 0Kongiganak 81 51 772 808 1883 1965 739 774 568 596 3962 4143N. KUSKOKWIM BAY 352 52 773 809 1888 1970 750 785 637 665 4048 4229
Tuntutuliak 76 64 3081 3632 3260 3845 824 972 981 1153 8146 9602Eek 73 54 1959 2432 1004 1259 604 748 704 904 4271 5343Kasigluk 136 5 381 381 306 306 59 59 142 142 888 888Nunapitchuk 102 81 3206 3883 5703 6917 1122 1382 644 790 10675 12972Atmautluak 56 46 1215 1282 2125 2189 987 1015 536 591 4863 5077Napakiak 90 66 1931 1931 2391 2391 1201 1201 578 578 6101 6101Napaskiak 83 60 2729 3856 2632 3720 908 1292 503 716 6772 9584Oscarville 13 12 953 953 1121 1121 377 377 119 119 2570 2570Bethel 1499 1312 16748 19305 13078 15082 6382 7350 11274 12966 47482 54703Kwethluk 156 113 4902 6429 5682 7434 1501 1993 1920 2515 14005 18371Akiachak 131 101 5540 6860 4089 5048 1996 2436 1321 1620 12946 15964Akiak 71 55 2632 3340 2008 2527 942 1195 881 1113 6463 8175Tuluksak 80 55 1920 2364 2470 3042 822 1011 963 1181 6175 7598LOWER KUSKOKWIM 2566 2024 47197 56648 45869 54881 17725 21031 20566 24388 131357 156948
Lower Kalskag 69 56 1088 1210 1072 1187 221 247 221 241 2602 2885Upper Kalskag 59 44 1251 1420 2153 2333 433 485 909 1032 4746 5270Aniak 165 163 2959 2994 2967 3002 715 723 2585 2616 9226 9335Chuathbaluk 30 22 493 663 1156 1553 250 337 455 607 2354 3160MIDDLE KUSKOKWIM 323 285 5791 6287 7348 8075 1619 1792 4170 4496 18928 20650
Crooked Creek 34 28 713 790 1212 1266 401 413 405 420 2731 2889Red Devil 14 10 180 248 236 325 67 92 300 413 783 1078Sleetmute 34 27 426 516 913 1105 498 603 569 689 2406 2913Stony River 15 13 262 293 507 560 412 460 466 517 1647 1830Lime Village 17 0 0 0 0 0 0 0 0 0 0 0McGrath 136 118 649 700 634 665 309 323 996 1067 2588 2755Takotna 20 16 8 9 1 1 0 0 20 20 29 30Nikolai 36 30 484 507 171 171 0 0 105 105 760 783Telida 2 0 0 0 0 0 0 0 0 0 0 0UPPER KUSKOKWIM 308 242 2722 3063 3674 4093 1687 1891 2861 3231 10944 12278
KUSKOKWIM RIVER 3549 2603 56483 66807 58779 69019 21781 25499 28234 32780 165277 194105
Quinhagak 139 101 1880 2475 1381 1839 650 855 844 1099 4755 6268Goodnews Bay 55 43 561 703 247 312 630 794 162 202 1600 2011Platinum 16 12 112 154 69 95 187 256 70 95 438 600S. KUSKOKWIM BAY 210 156 2553 3332 1697 2246 1467 1905 1076 1396 6793 8879
Mekoryuk 94 18 12 12 1292 1292 204 204 114 114 1622 1622Newtok 79 5 13 13 20 20 85 85 0 0 118 118Nightmute 68 3 0 0 0 0 0 0 0 0 0 0Toksook Bay 136 8 54 54 657 657 32 32 74 74 817 817Tununak 110 5 1 1 0 0 8 8 49 49 58 58BERING SEA COAST 487 39 80 80 1969 1969 329 329 237 237 2615 2615
Chefornak 93 0 0 0 0 0 0 0 0 0 0 0TOTALS 4,339 2,798 59,116 70,219 62,445 73,234 23,577 27,733 29,547 34,413 174,685 205,599
* If less than 30 or 50% of households in a stratum in a community were contacted, then reported harvest is used for estimated harvest. NOTE: Includes harvests using rod and reel and the removal of salmon from commercial harvests as well as subsistence nets.
Contacted
69

Year Total Included Chinook Sockeye Chum Coho
1960 18,887 303,153 322,0401961 28,934 183,186 212,1201962 13,582 163,554 177,1361963 34,482 138,669 173,1511964 29,017 190,191 219,2081965 24,697 250,878 275,5751966 49,325 180,054 229,3791967 61,262 221,419 282,6811968 35,698 278,008 313,7061969 40,617 238,798 279,4151970 69,612 258,678 328,2901971 43,013 123,290 166,3031972 38,176 121,641 159,8171973 38,451 203,005 241,4561974 26,665 309,950 336,6151975 47,569 176,389 223,9581976 58,055 228,104 286,1591977 58,158 215,590 273,7481978 38,145 137,489 175,6341979 57,053 190,567 247,6201980 62,047 216,322 278,3691981 64,274 191,855 256,1291982 61,141 240,872 302,0131983 51,020 76,059 127,0791984 60,668 103,144 163,8121985 45,720 33,632 95,999 24,524 154,155 199,8751986 54,256 20,239 142,930 29,742 192,911 247,1671987 71,804 25,180 70,709 18,085 113,974 185,7781988 75,107 33,102 153,980 43,866 230,948 306,0551989 3,422 2,135 85,322 37,088 145,106 57,847 240,041 325,3631990 3,317 1,830 92,678 39,662 131,469 50,713 221,844 314,5221991 3,347 2,024 90,224 56,404 96,308 55,581 208,293 298,5171992 3,314 1,724 68,665 34,159 99,576 44,496 178,231 246,8961993 3,274 1,816 91,721 51,363 61,726 35,295 148,384 240,1051994 3,179 1,821 98,378 39,279 76,951 36,504 152,734 251,1121995 3,652 1,894 100,159 28,622 68,942 39,165 136,729 236,8881996 3,643 1,837 81,598 35,036 90,238 34,698 159,972 241,5701997 3,510 1,831 85,506 41,270 40,976 30,714 112,960 198,4661998 3,495 1,849 86,115 37,578 67,665 27,239 132,482 218,5971999 4,180 2,523 77,660 49,388 47,612 27,753 124,753 202,4132000 4,441 2,750 68,841 44,832 55,371 35,670 135,873 204,7142001 4,483 2,297 77,570 51,965 51,117 31,686 134,768 212,3382002 4,339 2,798 70,219 27,733 73,234 34,413 135,380 205,599
1998-2002 Average 4,188 2,443 76,081 42,299 59,000 31,352 132,651 208,7321993-2002 Average 3,820 2,142 83,777 40,707 63,383 33,314 137,404 221,180All Years Average 3,685 2,081 58,886 38,141 87,217 36,555 182,681 241,567
Note: Prior to 1985, subsistence salmon harvest information was collected using two basic categories, king salmon and small salmon. Small salmon were comprised of primarily chum and sockeye salmon with some coho salmon and very few pink salmon. In 1985 survey methods were modified to identify chum, sockeye and coho salmon harvests in the subsistence catch. Pink salmon are harvested primarily on even number years and have not been included in the subsistence surveys. Data for 1983, 1984, 1986 and 1987 are estimates based on surveys in a sample of communities. Survey methods were revised beginning in 1988.
Table V-2. Historic Subsistence Salmon Harvest Kuskokwim Area, 1960 - 2002.
Estimated Salmon Harvest"Small Salmon"
Total Salmon
Households
70

Table V-3: 2002 Kuskokwim River Subsistence Salmon Project: Gear Types
Gear Types**Fishing Fish Rod and Not
Community HH'S* Setnet Drift Net Wheel Reel Seine Spear Reported
Kipnuk 1 0 0 0 0 0 0 1Kwigillingok 0 0 0 0 0 0 0 0Kongiganak 46 1 35 0 0 0 0 10N KUSKOKWIM BAY Totals 47 1 35 0 0 0 0 11
Tuntutuliak 56 3 40 0 4 0 0 14Eek 47 13 30 0 8 0 0 7Kasigluk 5 0 0 0 0 0 0 5Nunapitchuk 69 3 56 0 0 0 0 12Atmautluak 33 0 23 0 0 0 0 10Napakiak 58 15 39 0 1 0 0 14Napaskiak 43 13 32 0 4 0 0 10Oscarville 11 1 11 0 0 0 0 0Bethel 579 55 397 0 121 0 0 90Kwethluk 91 31 65 0 32 0 0 14Akiachak 91 22 67 0 9 0 0 17Akiak 47 20 27 0 3 0 0 13Tuluksak 50 18 42 0 17 0 0 5LOWER KUSKOKWIM Totals 1,180 194 829 0 199 0 0 211
Lower Kalskag 34 8 23 0 2 0 0 7Upper Kalskag 29 7 19 0 6 0 0 6Aniak 120 10 49 2 75 0 0 12Chuathbaluk 17 7 11 0 3 0 0 3MIDDLE KUSKOKWIM Totals 200 32 102 2 86 0 0 28
Crooked Creek 24 4 16 0 5 0 0 6Red Devil 8 6 1 0 4 0 0 1Sleetmute 17 6 12 0 5 0 0 1Stony River 9 5 1 0 4 0 0 1Lime Village 0 0 0 0 0 0 0 0McGrath 51 17 6 0 25 0 0 10Takotna 3 0 0 0 3 0 0 0Nikolai 16 8 0 0 9 0 0 2Telida 0 0 0 0 0 0 0 0UPPER KUSKOKWIM Totals 128 46 36 0 55 0 0 21
Quinhagak 77 6 43 0 19 0 0 22Goodnews Bay 30 6 24 0 4 0 0 4Platinum 7 4 6 0 0 0 0 1S KUSKOKWIM BAY Totals 114 16 73 0 23 0 0 27
Mekoryuk 15 11 2 0 6 3 0 0Newtok 4 0 4 0 0 0 0 0Nightmute 0 0 0 0 0 0 0 0Toksook Bay 5 2 5 0 0 0 0 0Tununak 3 2 1 0 0 0 0 1BERING SEA COAST Totals 27 15 12 0 6 3 0 1
Chefornak 0 0 0 0 0 0 0 0OTHER Totals 0 0 0 0 0 0 0 0
TOTAL 1,696 304 1,087 2 369 3 0 299
* Data on households which subsistence fished based upon in-person surveys, returned postcards, or returned calendars.** A household may use multiple gear types.
71

Table V-4. 2002 Estimated Subsistence Harvest of Fish: Bethel Surveys
TOTAL NUMBER OF HOUSEHOLDS: 1499
Species # % Set Net Drift Net Net Under Ice Other GearHook and
Line Rod and Reel TOTAL
Chinook 507 33.82% 2,146 16,923 0 236 19,305Chum 395 26.38% 972 14,004 0 106 15,082Sockeye 392 26.14% 511 6,700 0 139 7,350Coho 433 28.90% 586 11,144 0 1,236 12,966Pink 47 3.17% 77 641 0 2 721TOTAL SALMON 4,293 49,412 0 1,719 55,424
Northern Pike 222 14.81% 617 4 190 0 7,747 1,225 9,783Burbot 172 11.48% 261 10 826 23 3,674 1,015 5,809Whitefish 198 13.23% 4,800 278 3,519 11 823 1,157 10,588Sheefish 115 7.69% 283 113 224 0 76 91 787Grayling 69 4.59% 0 1 0 0 12 540 553Dolly Varden 74 4.91% 76 15 1 0 13 373 478Rainbow Trout 64 4.27% 2 7 0 0 44 304 357Lake Trout 19 1.27% 0 0 0 0 31 114 145TOTAL NON-SALMON 6,039 428 4,760 34 12,420 4,819 28,500
TOTAL FISH BY GEAR TYPE 10,332 49,840 4,760 34 12,420 6,538 83,924
Trap# % (Gallons)
Blackfish 63 4.20% 711
Dipnet# % (Gallons)
Smelt 241 16.08% 2,191
* Household number and percentage estimates expanded from household surveys only. ** Salmon harvest estimates from all sources reallocated to gear types according to survey distribution.NOTE: Salmon harvest data are for summer 2002. Data for other species is from 1 October 2001 to 30 September 2002.SOURCE: Alaska Department of Fish and Game, Division of Subsistence and Orutsaramiut Native Council, Household Surveys, 2002.
72
Households* Number of Fish Harvested for Subsistence**
Households
Households

Table V-5. 2002 Estimated Subsistence Harvest of Fish: Aniak Surveys
TOTAL NUMBER OF HOUSEHOLDS: 165
Species # % Set Net Drift Net Net Under Ice Other GearHook and
Line Rod and Reel TOTAL
Chinook 86 51.99% 591 2,252 0 151 2,994Chum 56 34.07% 518 2,096 183 205 3,002Sockeye 51 30.98% 110 505 56 52 723Coho 97 58.73% 150 1,084 390 991 2,616Pink 4 2.48% 0 0 10 34 44TOTAL SALMON 1,369 5,937 639 1,433 9,379
Northern Pike 30 17.94% 61 0 0 2 13 110 186Burbot 6 3.72% 0 0 0 72 0 7 79Whitefish 26 15.49% 442 9 0 2,560 5 93 3,109Sheefish 25 14.87% 115 86 0 0 0 31 232Grayling 15 9.29% 0 0 0 4 5 101 110Dolly Varden 17 10.54% 0 0 0 10 3 134 147Rainbow Trout 20 12.38% 0 0 0 1 10 60 71Lake Trout 1 0.62% 0 0 0 0 0 4 4TOTAL NON-SALMON 618 95 0 2,649 36 540 3,938
TOTAL FISH BY GEAR TYPE 1,987 6,032 0 3,288 36 1,973 13,317
Trap# % (Gallons)
Blackfish 0 0.00% 0
Dipnet# % (Gallons)
Smelt 3 1.85% 30
* Household number and percentage estimates expanded from household surveys only. ** Salmon harvest estimates from all sources reallocated to gear types according to survey distribution.NOTE: Salmon harvest data are for summer 2002. Data for other species is from 1 October 2001 to 30 September 2002.SOURCE: Alaska Department of Fish and Game, Division of Subsistence and Orutsaramiut Native Council, Household Surveys, 2002.
73
Households* Number of Fish Harvested for Subsistence**
Households
Households

74
Figure V-1. Composition of Subsistence Harvest by Species, Kuskokwim Area, 2002
34.2%
13.5%16.7%
35.6% CHINOOK
SOCKEYE
COHO
CHUM
N = 205,599 salmon; based on annual harvest assessment program using calendars and household surveys.

75
VI. BRISTOL BAY AREA
BACKGROUND In spite of numerous social, economic, and technological changes, Bristol Bay residents continue to depend on salmon and other fish species as an important source of food. Residents have relied on fish to provide nourishment and sustenance for thousands of years. Subsistence harvests still provide important nutritional, economic, social, and cultural benefits to most Bristol Bay households. All five species of salmon are utilized for subsistence purposes in Bristol Bay, but the most popular are sockeye, chinook, and coho. Many residents continue to preserve large quantities of fish through traditional methods such as drying and smoking, and fish are also frozen, canned, salted, pickled, fermented, and eaten fresh.
REGULATIONS Permits are required to harvest salmon for subsistence purposes in Bristol Bay. Since 1990, under state regulations, all Alaska State residents have been eligible to participate in subsistence salmon fishing in all Bristol Bay drainages (but see below). In 2002, with two exceptions, only gillnets were recognized as legal subsistence gear. In the Togiak District, spear fishing was also allowed. In 1998, the Board of Fisheries adopted new regulations for the taking of “redfish” (spawned sockeye salmon) in portions of the Naknek District. Gillnets, spears, and dip nets may be used along a 100 yard length of the west shore of Naknek Lake near the outlet to the Naknek River from August 20 through September 30; at Johnny’s Lake from August 15 through September 25; and at the mouth of the Brooks River from October 1 through November 15. In the Bristol Bay Area in 2002, gillnet lengths were limited to 10 fathoms in the Naknek, Egegik, and Ugashik rivers, Dillingham beaches, and within the Nushagak commercial district during emergency openings. Up to 25 fathoms could be used in the remaining areas, except that nets were limited to 5 fathoms in the special “redfish” harvest areas in the Naknek District. In Dillingham and the Naknek, Egegik, and Ugashik rivers, subsistence fishing was limited to several fishing periods per week during the peak of the sockeye run. All commercial districts were open for subsistence fishing during commercial openings. In addition, all commercial districts were open for subsistence fishing in May and September, from Monday to Friday. In recent years, declining chinook and coho stocks resulted in longer commercial closures and some residents had an increasingly difficult time obtaining fish for home use. The Nushagak commercial district, starting in 1988, has been opened for subsistence fishing by emergency order during extended commercial closures. On May 21, 2001, Deborah Liggett, the superintendent of Lake Clark National Park and Preserve, announced that the National Park Service (NPS) was prohibiting subsistence fishing with nets in the park and preserve, including all of Lake Clark, except by federally qualified local rural residents. This prohibition was a new enforcement action of a NPS regulation and applied to anyone who was not a permanent resident of Iliamna, Lime Village, Newhalen, Nondalton, Pedro Bay, or Port Alsworth, or who did not have a Section 13.44 subsistence use permit issued by the park superintendent.

76
The Alaska Department of Fish and Game has continued to issue Bristol Bay subsistence salmon permits to any Alaska resident who requests one. However, the department informs permit applicants that unless they live in one of the above-named communities or have a 13.44 permit, they need to take this NPS closure into account when they subsistence fished in waters of the park and preserve. The department also informs permittees that waters outside of national park and preserve boundaries remain open for subsistence salmon fishing to all permit holders.
INSEASON MANAGEMENT Due to extended closures to the commercial fishery in the Nushagak commercial fishing district, an emergency order opened the Nushagak commercial fishing district to subsistence salmon harvesting on 12:01 a.m. June 1, 2002. The commercial district was closed by emergency order to subsistence salmon fishing, except during commercial openings, effective 9 p.m. June 20. The Nushagak Section was reopened effective 3 p.m. on July 5 for the remainder of the season. By emergency orders, the Igushik Section of the Nushagak area was opened to subsistence fishing effective 8 p.m. June 30 and closed at 8 p.m. on July 1. It was reopened effective July 4 for the remainder of the season. Because of a planned commercial opening, the Wood River Special Harvest Area was closed to subsistence fishing by emergency order effective July 5. It opened again for subsistence fishing effective July 23 at 9 a.m. Effective 9 a.m. August 15, an emergency order restricted subsistence fishing for salmon in the Nushagak commercial fishing district, local Dillingham beaches, the entire Nushagak River drainage and its tributaries, and the Wood River downstream of the Dragnet dock to three 24-hour periods per week. The restriction was intended to conserve coho salmon for spawning escapement in the Nushagak River because the spawning escapement was projected to be below 60,000 coho salmon. This action was in accordance with the Nushagak River Coho Salmon Management Plan (5 AAC 06.358[d][3]). Because of an extended closure to commercial salmon fishing in the Togiak District, an emergency order opened subsistence fishing within the commercial fishing district from 3 p.m. June 21 until 9 p.m. June 23. Other emergency orders opened subsistence fishing in the Togiak commercial fishing district from 9 p.m. June 27 until 9 p.m. June 30; from 9 p.m. July 5 until July 7 at 9 p.m.; and from noon on July 13 until 9 p.m. on July 21. Effective 9 a.m. August 10, an emergency order opened the Togiak commercial fishing district to subsistence salmon fishing until further notice. An emergency order opened the Naknek Section of the Naknek/Kvichak District and the Naknek River to subsistence fishing for three 24-hour periods per week, from 9 a.m. Saturdays until 9 a.m. Sundays, from 9 a.m. Mondays to 9 a.m. Tuesdays, and from 9 a.m. Wednesdays until 9 a.m. Thursdays, effective 9 a.m. Saturday June 29. This was to allow subsistence fishing opportunity when the Naknek/Kvichak District was closed to commercial fishing and commercial fishing was occurring in the Naknek River Special Harvest Area. In the Egegik District, an additional subsistence fishing period was opened by emergency order at 2:00 p.m. on June 14 until 8:00 a.m. June 17. The department had been informed that some Egegik residents were having difficulty obtaining subsistence fishing locations within the district

77
when the commercial fishery was open. These emergency orders provided subsistence fishing time during a commercial closure. Additional subsistence openings in the Egegik District were established by emergency orders from 10 a.m. June 17 to 3:00 p.m. June 18; 3:00 p.m. June 18 to 3:30 p.m. June 19; 3:30 p.m. June 19 to 4:00 p.m. June 20; 4:00 p.m. June 20 to 5:00 p.m. June 21; 5:00 p.m. June 21 until 5:00 p.m. June 22; 5:00 p.m. June 22 to 7:00 p.m. June 23; and 7:00 p.m. June 23 to 7:30 p.m. June 24. No emergency orders were issued for the Ugashik subsistence fishery in 2002.
SALMON HARVEST ASSESSMENT PROGRAM A permit system was gradually introduced throughout the Bristol Bay region in the late 1960s to document the harvest of salmon for subsistence. Much of the increase in the number of permits issued during these years reflects: 1) a greater compliance with the permitting and reporting requirements, 2) an increased level of effort expended by the department in making permits available (including a local system of vendors), contacting individuals, and reminding them to return the harvest forms, and 3) a growing regional population. Most fishermen are obtaining permits and reporting their catches, and overall permit returns have averaged between 85% and 90%. However, fish removed for home use from commercial catches are not included in most reported subsistence harvest totals. Also, fish caught later in the season, such as coho and spawning salmon are probably not documented as consistently as chinook and sockeye. In 2002, a total of 1,093 permits were issued for the Bristol Bay Management Area, and of these, 994 (90.9 percent) were returned to the Department with harvest data (Table VI-1, Table VI-3). The largest number of permits was issued for the Nushagak (520 permits) and Naknek/Kvichak (471 permits) districts. For the Nushagak District more permits were issued in 2002 than the long-term 20-year average (478), due in part to permits being available to all state residents since 1990. Compared to the last five years, however, the number of permits issued was down for the Nushagak District. Fewer permits were issued in the Naknek/Kvichak district than in any year since 1990, likely reflecting the National Park Service prohibition against non-drainage residents’ subsistence fishing in the waters of Lake Clark National Park. About the same number of permits were issued for the Egegik District in 2002 (53) compared to the average for the past 10 years (51), while the number issued in the Ugashik District (23) was lower than the recent ten-year average (29). The number of permits issued for the Togiak District in 2002 (36) was lower than recent averages (44 permits on average for 1992 – 2001). In 2001, permit data for the Togiak District were supplemented by post-season household surveys conducted by the Division of Subsistence. Although these surveys were also conducted for 2002, they were still underway when the data were prepared for the annual management report. Of all Bristol Bay Area subsistence permits issued in 2002, 917 (83.9 percent) were issued to residents of Bristol Bay communities, and 176 (16.1 percent) were issued to other Alaska residents (Table VI-3).
SUBSISTENCE SALMON HARVESTS IN 2002 The estimated total Bristol Bay subsistence salmon harvest in 2002 was 109,587 fish (Table VI-1). This number was down from the 119,856 salmon estimated for 2001, and is the lowest estimated subsistence salmon harvest for the Bristol Bay Area since 1973, when 88,400 salmon

78
were harvested, and the third-lowest since harvest records have been kept beginning in 1963 (the estimated subsistence harvest was 93,000 salmon in 1972). The 2002 harvest was 26.2% below the recent 10-year average of 148,583 salmon and about 31.2% below the recent 20-year average of 159,311 salmon (Table VI-2). The area-wide chinook harvest of 12,936 salmon was down from the recent ten-year average of 16,268 chinook. The area-wide harvest of 81,088 sockeye salmon was the lowest since 1973. The 2002 sockeye harvest was 30.3% below the recent 10-year average of 116,407 sockeyes. Compared to recent 10-year averages, subsistence harvests of pink and coho salmon were also down in 2002, while chum harvests were higher (Table VI-2). In 2002, the Bristol Bay subsistence salmon harvest was composed of 74.0% sockeye, 11.8% chinook, 6.1% chum, 2.1% pink, and 6.0% coho salmon (Fig. VI-1). Of the entire Bristol Bay Area subsistence salmon harvest, residents of Bristol Bay communities harvested 101,543 salmon (92.7%), and other Alaska residents harvested 8,044 salmon (8.3%) (Table VI-3). In 2002 as over the last several decades, most of the Bristol Bay Area subsistence harvest was taken in the Naknek/Kvichak (51.7%) and the Nushagak (41.0%) districts (Fig. VI-2). The Naknek/Kvichak total harvest of 56,632 salmon was the lowest since 1973 (when 43,000 salmon were harvested) and the third-lowest on record (the estimated harvest was 53,800 salmon in 1972). The 2002 subsistence salmon harvest in this district was 34.3% below the recent 10-year average of 86,174 fish. In 2002, Kvichak drainage residents, and other permit holders fishing in the Kvichak drainage portion of the Naknek/Kvichak District, harvested an estimated 33,001 sockeye salmon, compared to a recent 10-year average of 56,085 sockeyes and a 20-year average of 66,472 sockeyes. The 2002 subsistence harvest of sockeye salmon in the Kvichak drainage was the second-lowest since records have been kept beginning in 1963, just slightly above the estimate for 2001 of 32,808 sockeye. (The previous lows were 36,990 sockeyes in 2000 and 39,100 sockeyes in 1973.) Of Kvichak drainage communities, estimated sockeye harvests were down substantially at Levelock, Pedro Bay, Kokhanok, Iliamna/Newhalen, Nondalton and Port Alsworth compared to recent 10-year averages. The number of permits issued to households with Port Alsworth addresses dropped to 22, from 30 in 2001 and 37 in 2000. This may be the result of seasonal Port Alsworth residents not obtaining permits because of the NPS prohibition against subsistence fishing in Lake Clark by non-local residents (see above). Sockeye salmon harvests by Port Alsworth subsistence permit holders dropped to 1,201 fish, compared to a recent 10-year average of 2,990 sockeyes. The number of permits issued to households with non-Kvichak drainage addresses dropped in 2002 to 33, from 37 in 2001 and 48 in 2000, and the sockeye salmon harvest by these permittees fell to 1,578 fish compared to a recent 10-year average of 2,856. The NPS closure is likely at least partly responsible for this change as well. In the Nushagak District, the total estimated subsistence harvest in 2002 was 44,897 salmon. The recent 10-year average is 49,499. The Nushagak chinook harvest in 2002 of 11,760 was about the same as 2001 (11,760) but still below the recent 10-year average of 13,529 chinook. The sockeye harvest of 22,777 was below the 10-year average (26,106) and the 20-year average

79
(31,852). In 2002, subsistence salmon harvests in several Nushagak District communities were substantially lower than recent averages, most notably Ekwok and Koliganek. The estimated total subsistence salmon harvest for the Togiak District in 2002 of 3,878 fish was lower than both the recent 10-year average (4,401) and the 20-year average (5,135). This may reflect less participation in the harvest reporting program than in other recent years rather than an actual drop in subsistence harvests. The estimated subsistence harvest in the Ugashik District in 2002 was 1,821, lower than the 10-year average of 2,234. In the Egegik District, the estimated subsistence salmon harvest of 2,359 was down from the estimate of 3,653 salmon for 2001 and was lower than the recent ten-year average of 3,464 salmon.
OTHER SUBSISTENCE FISHERIES There were no annual harvest assessment programs in the Bristol Bay Area for non-salmon subsistence fisheries in 2002.1 The following overview derives primarily from a report that the Division of Subsistence, ADF&G, prepared for the Alaska Board of Fisheries in November 1997 (Fall and Chythlook 1997). Subsistence Regulations The Alaska Board of Fisheries has determined that all finfish of the Bristol Bay Management Area support customary and traditional uses (5 AAC 01.336). The Board determined that approximately 250,000 pounds (usable weight; about 41 pounds per person) is the amount necessary to provide for these uses. This amount was based upon estimates of fish harvests derived from systematic household surveys conducted by the Division of Subsistence (Scott et al. 2001). Amounts for specific species or more specific stocks were not established. For the most part, subsistence fishing for fish other than salmon and rainbow trout is open year-round in the Bristol Bay Area with gear listed in 5 AAC 01.010(a). There are no seasonal limits established by regulation. The following regulations apply to subsistence fishing for fish other than salmon in the area. • A permit is required for harvesting trout and char (5 AAC 01.330). However, the department
has no program for issuing such permits, and virtually all subsistence fishing for these resources takes place without permits.
• Rainbow trout taken incidentally in other subsistence net fisheries or through the ice are lawfully taken and may be retained for subsistence uses (5 AAC 01.310(g)).
• Subsistence fishing with a line attached to a rod or pole is prohibited except when fishing through the ice (5 AAC 01.320(l)).
• Subsistence fishing with nets is prohibited in 18 waters of the Kvichak/Iliamna Lake drainage and within one-fourth mile of the terminus of those waters from September 1 through June 14.
1 Beginning in 2003, subsistence fishing for rainbow trout in the Bristol Bay Area under federal subsistence regulations required a federal permit. When available, any harvest data resulting from that permit program will be included in future annual reports.

80
Subsistence Harvests and Uses A detailed description of subsistence uses of freshwater fish in the Bristol Bay Area appears in Fall et al. (1996). Wright and Chythlook (1985) describe uses of herring spawn on kelp in the Togiak District. Harvests of fish other than salmon contribute about 10 percent of the annual subsistence harvests of wild foods in the Bristol Bay region, about 42.5 pounds per person. In the villages, the per capita harvest is 72.6 pounds per person (Fall and Chythlook 1997). Subsistence harvests of fish other than salmon are not annually monitored by the Department of Fish and Game. Harvest and use data are available for most communities through Division of Subsistence household harvest surveys (Scott et al. 2001; BBNA and ADF&G 1996; Kenner et al. 2003). Some of the findings of this research regarding non-salmon fish are summarized in Table VI-4. The vast majority of households in the Bristol Bay area use fish other than salmon for subsistence purposes. Most households also participate in the harvest of these fish. Harvests as measured in pounds useable weight per person for available study years vary from community to community, but are generally substantial. Harvests range from a low of 12 pounds per person (Port Alsworth in 1983) to 175 pounds per person (Nondalton in 1983). Harvests in nine communities exceeded 50 pounds per person per year; these harvests exceeded 20 pounds per person per year in an additional eight communities. Fish other than salmon generally rank third behind salmon and land mammals in their contribution to the total subsistence harvests in Bristol Bay communities. Harvests and uses of the non-salmon fish listed in Table VI-5 have been documented in Bristol Bay communities through Division of Subsistence research. Uses of other species may occur. Harvest quantities of particular species vary between communities, subregions, and from year to year. Generally, fish taken in the largest quantities in the area as a whole include smelt, whitefish, Dolly Varden, grayling, and pike (see Fall et al. 1996 for a summary of harvest data). In the Bristol Bay Area, harvests of non-salmon finfish occur throughout the year. Harvest effort for these fish is generally lower among Bristol Bay residents in the summer as attention is focused on salmon. Spring is important for herring, herring spawn-on-kelp, and smelt. Substantial harvests of non-salmon fish occur through the ice in winter. Smelting is a popular activity in October and in late winter when they can be caught by jigging through the ice. Halibut are mostly taken in June and July (Wright et al. 1985:34). Many gear types are used to harvest non-salmon fish for home use in the Bristol Bay Area. Rod and reel is used for most fish and some, such as Dolly Varden/Arctic char, herring, and other marine fish are removed from commercial catches. Various other methods are used, including (but not necessarily limited to) the following:
• Traps: blackfish, burbot • Set hooks: burbot • Handline jigging through the ice: grayling, Dolly Varden/Arctic char, lake trout, smelt,
rainbow trout, whitefish, pike

81
• Set gill nets: grayling, Dolly Varden/Arctic char, lake trout, suckers, rainbow trout, herring, pike, burbot, whitefish
• Beach seining: Dolly Varden/Arctic char, lake trout, smelt, herring, whitefish • Hand line in open water: halibut, rainbow trout • Dip nets: smelt, herring
Herring spawn on kelp is usually picked by hand, although rakes, knives, and uluaqs (woman's knife) are also used (Schichnes and Chythlook 1988:127). Maps of areas used by Bristol Bay communities to harvest non-salmon fish appear in the Alaska Habitat Management Guide Reference Atlas Series (ADF&G 1985), and in Wright et al. (1985). Harvest activities occur throughout in region in most rivers, lakes, and along shorelines. It is likely that most effort occurs near each community and near seasonal camps at such locations as Kulukak. (See Wright and Chythlook (1985) and Schichnes and Chythlook (1988) for maps of herring camps at Kulukak Bay.) For frequency of use of various areas for freshwater fishing by Nushagak River communities, see Schichnes and Chythlook (1991) and by Togiak and Manokotak, see BBNA and ADF&G (1996). Bristol Bay residents use a wide variety of methods to process and preserve their harvests of fish other than salmon. These vary by species and community. Some freezing of harvests of most species occurs. Some examples of other methods include the following:
• Grayling: dried, half-dried, fresh frozen, aged frozen and eaten with seal oil • Dolly Varden: dried, smoked, half dried (egamaarrluk) • Pike: dried, half-dried, fresh frozen, aged frozen and eaten with seal oil • Rainbow trout: dried, half dried, smoked • Whitefish: dried, fresh frozen, aged frozen and eaten with seal oil
Much dry fish is eaten with seal oil. Some use of brown bear fat with dry fish also occurs. Smelt are fried, boiled, dried, or eaten frozen with seal oil (Fall et al. 1986:100). Herring are salted, or split, dried, and smoked (Schichnes and Chythlook 1988:126). Pike heads and stomachs are boiled and eaten (Schichnes and Chythlook 1991:139). Freshwater fish that are usually eaten frozen with seal oil also form a category called kumlaneq. This includes grayling, whitefish, and pike (Fall et al. 1986:102). Much traditional knowledge is associated with subsistence uses of nonsalmon fish in the Bristol Bay area. For example, a Yup'ik classification system for some types of freshwater fish exists that is different from that developed by Western science. Three kinds of fish separately named in Central Yup'ik all are classed by biologists as "Dolly Varden." Distinctions are made in Yup'ik depending upon the condition of the flesh for aging, freezing, and/or drying; harvest locations; and harvest methods (Fall et al. 1996). The Division of Subsistence of ADF&G has compiled a database with traditional knowledge about the fish of Bristol Bay based on interviews with area residents (ADF&G 2001).

Table VI-1. Subsistence salmon harvest by species, in numbers of fish, by district and location fished, Bristol Bay, 2002. a
Estimated Number of Salmon HarvestedArea and River System Sockeye Chinook Chum Pink Coho Total
NAKNEK-KVICHAK DISTRICT 471 52,805 837 909 1,137 943 56,632
Naknek River c 290 19,297 692 517 717 607 21,830
Kvichak River/Iliamna Lake: 180 33,001 134 388 420 337 34,280Alagnak (Branch) River 3 35 0 0 0 0 35Chekok 1 288 0 0 0 0 288Igiugig 11 2,042 8 13 1 5 2,069Iliamna Lake 28 3,913 3 0 0 0 3,917Kijik 4 150 0 0 0 0 150Kokhanok 28 10,221 32 21 10 16 10,300Kvichak River 9 427 3 2 9 15 456Lake Clark: General 28 2,365 0 0 0 0 2,365Levelock 5 519 0 300 400 300 1,519Newhalen River 40 6,634 88 52 0 0 6,774Pedro Bay 15 2,590 0 0 0 0 2,590Port Alsworth 6 422 0 0 0 0 422Six Mile Lake 14 3,395 0 0 0 0 3,395
Naknek or Kvichak Unspecified 6 507 11 4 0 0 522
EGEGIK DISTRICT d 53 1,892 65 34 12 356 2,359
UGASHIK DISTRICT e 23 1,294 51 14 2 460 1,821
NUSHAGAK DISTRICT 520 22,777 11,281 5,096 1,179 4,565 44,897Wood River f 117 4,377 1,411 370 188 612 6,957Lower Nushagak River g 39 1,285 1,217 383 78 156 3,119Upper Nushagak River h 74 3,346 4,104 2,540 10 490 10,489Dillingham Beaches i 232 7,963 3,598 1,505 785 2,671 16,522Nushagak Bay Commercial j 66 2,556 717 260 93 496 4,121Igushik/Snake River 30 3,029 213 29 2 129 3,402Nushagak, Site Unspecified 5 221 22 9 23 12 287
TOGIAK DISTRICT k 36 2,319 703 605 10 241 3,878
TOTAL BRISTOL BAY 1,093 81,088 12,936 6,658 2,341 6,565 109,587
a Harvests are extrapolated for all permits issued, based on those returned and on the area fished as recorded on the permit. Due to rounding, the sum of columns and rows may not equal the estimated total. Of 1,093 permits issued for the management area, 994 were returned (90.9%).b Sum of sites may exceed district totals, and sum of districts may exceed area total, because permittees may use more than one site.c Includes Mile 5 North, Naknek River General, Powerline-North, North and South Savonoski, South Naknek Beach, and Telephone Point-North.d Includes Egegik river and beache Includes Pilot Point and Ugashikf Includes Dragnet, Aleknagik, Muklung River, Red Bluff, and Upper and Lower Wood River Generalg Includes Black Point, Grassy Island, and Lewis Pointh Includes Ekwok, Kokwok River, New Stuyahok, Koliganek, Mulchatna River, and Portage CreekI Includes Bradford Point, City Dock, Kanakanak, Scandinavia, Skinner, Snag Point, and Squaw Creekj Includes Clark's Point, Ekuk, Etolin Point, Nushagak Point, Protection Point, and Queen's Slough.k Includes Togiak village and Togiak River
PermitsIssued b
82

YEAR Issued Returned Chinook Sockeye Coho Chum Pink Total1979 829 10,300 116,500 7,300 7,700 500 142,3001980 1,243 14,100 168,600 7,300 13,100 10,000 213,1001981 1,121 13,000 132,100 12,200 11,500 2,600 171,4001982 806 13,700 110,800 11,500 12,400 8,600 157,0001983 829 674 13,268 143,639 7,477 11,646 1,073 177,1041984 882 698 11,537 168,803 16,035 13,009 8,228 217,6121985 1,015 808 9,737 142,755 8,122 5,776 825 167,2151986 930 723 14,893 129,487 11,005 11,268 7,458 174,1121987 996 866 14,424 135,782 8,854 8,161 673 167,8941988 938 835 11,848 125,556 7,333 9,575 7,341 161,6521989 955 831 9,678 125,243 12,069 7,283 801 155,0741990 1,042 870 13,462 128,343 8,389 9,224 4,455 163,8741991 1,194 1,045 15,245 137,837 14,024 6,574 572 174,2511992 1,203 1,028 16,425 133,605 10,722 10,661 5,325 176,7391993 1,206 1,005 20,527 134,050 8,915 6,539 1,051 171,0821994 1,193 1,019 18,873 120,782 9,279 6,144 2,708 157,7871995 1,119 990 15,921 107,717 7,423 4,566 691 136,3191996 1,110 928 18,072 107,737 7,519 5,813 2,434 141,5751997 1,166 1,051 19,074 118,250 6,196 2,962 674 147,1561998 1,234 1,155 15,621 113,289 8,126 3,869 2,424 143,3301999 1,219 1,157 13,009 122,281 6,143 3,653 420 145,5062000 1,219 1,109 11,547 92,050 7,991 4,637 2,599 118,8242001 1,226 1,137 14,412 92,041 8,406 4,158 839 119,8562002 1,093 994 12,936 81,088 6,565 6,658 2,341 109,5871998-2002 Average 1,198 1,110 13,505 100,150 7,446 4,595 1,725 127,4211991-2002 Average 1,182 1,052 15,972 113,394 8,443 5,519 1,840 145,168All Years Average 1,074 946 14,234 124,514 9,121 7,786 3,110 158,764
1 Data for 1983 through 1998 may differ from data previously reported in annual management reports.The number of permits issued and returned has been updated. Also, data have been expanded to reflect community ofresidence of permit holders.
SOURCE: Alaska Department of Fish and Game, Division of Subsistence, Alaska Subsistence Fisheries Database, Version 3.30.
Table VI-2. Historic Subsistence Salmon Harvests: Bristol Bay Management Area, 1979 - 20021
Permits Estimated Salmon Harvest
83

Community Issued ReturnedAleknagik 21 18 306 1,082 72 57 0 1,517Clarks Point 13 10 176 553 165 20 51 963Dillingham 331 299 5,595 12,070 3,588 2,072 1,051 24,376Egegik 18 15 12 468 406 13 4 902Ekwok 21 21 1,049 1,044 111 522 9 2,735Igiugig 8 8 8 2,138 5 13 1 2,165Iliamna 36 34 79 4,674 15 0 0 4,769King Salmon 89 82 165 4,486 199 106 97 5,052Kokhanok 29 26 19 10,150 6 15 7 10,196Koliganek 16 15 1,155 659 19 1,263 1 3,098Levelock 7 7 1 700 303 304 409 1,717Manokotak 26 25 224 2,874 128 27 2 3,254Naknek 104 86 266 9,647 299 253 445 10,909New Stuyahok 35 33 2,571 2,265 344 1,074 11 6,265Newhalen 18 18 0 5,125 0 0 0 5,125Nondalton 20 17 0 5,508 0 0 0 5,508Pedro Bay 15 15 0 2,687 0 0 0 2,687Pilot Point 7 7 19 397 218 2 1 637Port Alsworth 22 20 1 1,403 0 0 0 1,404Portage Creek 1 1 78 42 0 13 0 133South Naknek 40 35 207 2,990 190 142 152 3,680Togiak 35 34 718 2,358 241 605 10 3,932Ugashik 5 5 16 362 132 9 0 519
Bristol Bay Subtotal 917 831 12,663 73,681 6,440 6,510 2,249 101,543
Anchorage 89 82 149 3,735 68 109 20 4,080Aniak 1 1 0 2 12 0 23 37Bethel 1 1 0 0 0 0 0 0Chugiak 7 7 4 516 27 2 29 578Cooper Landing 2 0Craig 1 1 0 50 0 0 0 50Eagle River 7 7 19 430 1 0 0 450Fairbanks 10 10 9 354 0 1 0 364Healy 1 1 0 0 0 0 0 0Homer 6 5 7 644 0 10 1 662Juneau 3 3 2 14 0 0 0 16Kasilof 2 2 7 15 2 3 3 30Kenai 4 4 1 221 0 0 0 222
continued
Table VI-3. 2002 Subsistence Harvests by Community and Species: Bristol Bay Management Area
PermitsEstimated Subsistence Salmon Harvest
Chinook Sockeye Coho Chum PinkTotal
Salmon
84

Community Issued ReturnedKodiak (city) 7 6 2 84 0 1 0 88Kotzebue 1 1 12 56 0 4 0 72Moose Pass 1 1 0 0 0 0 0 0Nikiski 1 1 0 49 5 1 2 57Ninilchik 1 1 6 27 0 1 1 35Nome 1 1 0 22 0 0 0 22North Pole 1 1 0 30 1 0 10 41Palmer 5 4 5 280 0 0 0 285Paxson 1 1 6 93 0 4 1 104Petersburg 1 1 0 0 0 0 0 0Sand Point 1 1 3 41 0 7 0 51Seward 1 1 0 58 0 2 0 60Sitka 2 1 0 0 0 0 0 0Soldotna 3 3 1 51 0 2 0 54Talkeetna 1 1 0 0 0 0 0 0Valdez 1 1 0 0 0 0 0 0Wasilla 13 13 39 635 9 1 2 686
Other, Subtotal 176 163 272 7,407 125 147 92 8,044
Area Totals 1,093 994 12,936 81,088 6,565 6,658 2,341 109,587
SOURCE: Alaska Department of Fish and Game, Division of Subsistence, Alaska Subsistence Fisheries Database, Version 3.3.
Table VI-3. 2002 Subsistence Harvests by Community and Species: Bristol Bay Management Area, continued
PermitsEstimated Subsistence Salmon Harvest
Chinook Sockeye Coho Chum PinkTotal
Salmon
85

Table VI-4. Uses and Harvests of Fish Other Than Salmon, Bristol Bay Communities1
Percentage of Households Average Pounds HarvestedCommunity and Year Use Fish for Harvest Receive Give Per Household Per Person
Aleknagik 89 94.7 89.5 89.5 73.7 71.1 208.3 61.4Clark's Point 89 94.1 82.4 82.4 82.4 70.6 113.4 34.4Dillingham 84 75.0 56.2 54.9 39.9 19.6 51.6 17.5Egegik 84 64.0 60.0 60.0 24.0 40.0 36.5 15.7Ekwok 87 75.9 72.4 62.1 62.1 37.9 229.4 68.6Igiugig 92 100.0 100.0 100.0 80.0 80.0 392.0 100.5Iliamna 91 87.0 73.9 73.9 65.2 43.5 249.7 76.6King Salmon 83 76.7 48.1 15.9Kokhanok 92 91.7 86.1 86.1 72.2 61.1 469.9 105.7Koliganek 87 92.9 81.0 81.0 69.0 57.1 369.7 95.3Levelock 92 90.0 76.7 73.3 76.7 63.3 186.6 65.9Manokotak 99 86.4 77.8 76.5 76.5 75.3 163.8 37.3Naknek 83 75.0 58.0 18.6New Stuyahok 87 100.0 85.0 82.5 82.5 62.5 171.9 36.0Newhalen 91 100.0 96.2 92.3 73.1 46.2 185.1 37.6Nondalton 83 90.5 90.5 23.8 906.4 174.6Pedro Bay 96 76.9 53.8 53.8 53.8 30.8 85.6 25.9Pilot Point 87 94.1 94.1 94.1 35.3 58.8 55.8 15.5Port Alsworth 83 61.5 61.5 7.7 42.0 11.6Port Heiden 87 91.9 62.2 62.2 70.3 45.9 32.6 11.7South Naknek 92 85.7 77.1 74.3 68.6 48.6 64.4 20.1Togiak 99 89.0 83.5 83.5 56.6 66.4 185.1 44.8Twin Hills 99 91.7 91.7 91.7 75.0 91.7 302.9 101.0Ugashik 87 100.0 100.0 100.0 0.0 40.0 72.2 36.1
1 Information for the most recent year for which data are available.
Source: Scott et al. 2001; BBNA and ADF&G 1996; Kenner et al. 2003
86

Table VI-5. Nonsalmon Finfish Known to be Used for Subsistence Purposes in the Bristol Bay Area
Common English Name Scientific Name Yup'ik Name Dena'ina Name
Arctic Grayling Thymallus arcticus Nakrullugpak Ch'dat'anCulugpauk
Blackfish Dallia pectoralis Can'giiq Huzhegh
Burbot Lota lota Manignaq a Ch'unyaAtgiaq b
Dolly Vardenc Salvelinus malma Yugyaq d Qak'elayAnerrluaqAnyuk
Lake Trout Salvelinus namaycush Cikignaq Zhuk'udghuzha
Longnose Sucker Catosomus catostomus Cungartak Duch'ehdi
Northern Pike Esox lucius Cuukvak Ghelguts'i
Rainbow Smelt Osmerus mordax Iqalluaq
Rainbow Trout Oncorhynchus mykiss Talaariq Tuni
Broad Whitefishe Coregonus nasus Akakiik Telay
Humpback Whitefishe Coregonus pidschian Uraruq Q'untuq'
Round Whitefishe Prosopium cylindraceum Uraruq Hesten
Least Cisco Coregonus sardinella Cavirrutnaq Ghelguts'i k'una
Herring, Pacific Clupea harengus pallasi Iqalluarpak
Herring Spawn on Kelp Melucuaq
Starry Flounder Platichthys stellatus Naternaq
Halibut Hippoglossus stenolepis Naternarpak
Pacific Cod Cadus macrocephalus Ceturrnaq
Sculpin Unknown Kayutaq
Capelin Mallotus villosus Cikaaq
Yellowfin Sole Limanda aspera Sagiqa Nushagak River villages.b Manokotak, Aleknagik, Twin Hills, Togiak.c Also includes the closely related Arctic char, Salvelinus alpinus .d At Togiak, Manokotak, and Aleknagik, and perhaps elsewhere, there are three Yup'ik names for Dolly Varden/Arctic char. Yugyak probably refers to resident Dolly Varden/char. Anerrluak , called "Togiak trout" in the local English dialect, probably refers to anadromous fish taken in fresh water. Finally, anyuk or "sea run dollies" are Dolly Varden or char taken in salt water. See Fall et al. 1996:16-20 for further discussion of these distinctions.e Broad whitefish are rare to absent in the Bristol Bay region. "Akakiik " is the word used at Aleknagik and Manokotak to refer to whitefish they receive from Kuskokwim River communities, where broad whitefish are common. Humpback whitefish are caught in the Iliamna Lake subregion and called "uraruq ." "Uraruq " is used for round whitefish in the Togiak and Nushagak drainages.
Source: Fall et al. 1996
87

Figure VI-1. Composition of Bristol Bay Area Subsistence Salmon Harvest by Species, 2002
74.0%
11.8%
6.0%2%
6.1%SockeyeChinookChumPinkCoho
Figure VI-2. Subsistence Salmon Harvests by District, Bristol Bay Management Area, 2002
51.7%41.0%
3.5%
2.2%1.7%
Naknek/KvichakEgegikUgashikNushagakTogiak
N = 109,587 salmon, based on annual harvest assessement program with subsistence permits
N = 109,587 salmon, based on annual harvest assessement program with subsistence permits
88

89
VII. CHIGNIK AREA
BACKGROUND The Chignik Management Area includes all waters of Alaska on the south side of the Alaska Peninsula enclosed by 156°20.22' west longitude (the longitude of the southern entrance to Imuya Bay near Kilokak Rocks) and a line extending 135° southeast from the tip of Kupreanof Point. The communities of the Chignik Area are Chignik (also called Chignik Bay) (estimated population 79 in 2000), Chignik Lagoon (population 103), Chignik Bay (population 145), Ivanof Bay (population 22), and Perryville (population 107) (US Census Bureau 2001). All of these communities are within the Lake and Peninsula Borough. In the early 1990s, the Division of Subsistence of ADF&G conducted detailed research on patterns of subsistence use of fisheries resources in the Chignik Management Area. The research findings are summarized in Hutchinson-Scarbrough and Fall (1996). More recent updates with more detail on subsistence uses of salmon by Perryville residents are also available (Hutchinson-Scarbrough and Fall 1999; ADF&G 2002a).
REGULATIONS A subsistence permit is required for fishing within the Chignik Management Area, which must be used to record daily salmon harvests. Permits must be returned to the department by December 31. There is a 250 salmon annual limit. Legal gear includes seine and gillnets. Purse seines may not be used in Chignik Lake. There is no closed season for subsistence salmon fishing. However, commercial fishing license holders may not subsistence fish for salmon from 48 hours before the first commercial salmon fishing opening through September 30. Salmon may not be taken in the Chignik River upstream from the department weir site or counting tower, in Black Lake, or any tributary to Black and Chignik lakes. By emergency order, ADF&G announced a special subsistence fishing opening for commercial fishing license holders from 8 a.m. until 8 p.m. daily beginning Wednesday June 26 and ending Saturday June 29, 2002. This action as taken because of a new management strategy for commercial fishing in 2002 (a cooperative commercial fishery operated for the first time in the Chignik Area in 2002), slow movement of fish prior to the first open commercial fishing period, and adverse weather conditions the prevented subsistence fishing opportunities before the first commercial fishing period.
HARVEST ASSESSMENT PROGRAM The Division of Commercial Fisheries conducted the first subsistence salmon fisheries harvest assessment in the Chignik Area in 1976. Subsistence harvest assessments for salmon have been conducted annually since then. The Division of Subsistence took over responsibility for running the harvest assessment program in 1993. Permits are issued on request in each community. The method of permit issuance in the communities varies by community and year, depending on the availability of vendors and other arrangements in place with local organizations. Permits are

90
also issued on request at the Chignik River fish weir by Division of Commercial Fisheries seasonal staff. Chignik subsistence salmon permits must be returned by mail to the Division of Subsistence office in Anchorage by December 31. Permits include a harvest report that fishers are required to complete. The report asks for the dates fished, the specific locations fished, and the number of each species of salmon caught on each day. Non-responses are followed up with reminder letters, and phone calls are made where phone numbers are known if further follow-up is required. Also, face-to-face household interviews have been conducted since 1997 to collect harvest information from households that do not obtain permits and to add late season harvest information not recorded on permits. Local survey technicians attempt to contact all households in the Chignik area. The surveys are generally conducted during January, February, and March. Respondents are asked questions similar to those on the permit, but additional questions regarding late season harvests and whether or not their subsistence needs were met are also asked. In 1993, the Division of Subsistence, ADF&G, obtained copies of all available subsistence permits for the Chignik Management Area from the Division of Commercial Fisheries archive in Kodiak. Permits issued prior to 1980 and for 1987 could not be located. All permit data were entered into a database. The estimated harvests developed in this database and reported in subsequent AMRs differ slightly from that reported in earlier AMRs for several reasons. There are small discrepancies in some years for the number of permits issued or returned. Estimated harvests in earlier AMRs were based on a simple expansion from harvests reported on returned permits to the total number of permits issued. Since 1993, harvest data from returned permits have been expanded by community of residence to estimate the harvest by all permit holders. Data from returned permits are tabulated by species and fishing area. Increases in permits issued and returned beginning in 1993, and consequently higher harvest estimates, reflect the use of local vendors to issue permits and post-season surveys by department staff and local research assistants. Comparisons of household survey data and permit data collected for 1984 and 1989 suggested that permit data underestimated subsistence harvests in the Chignik Area subsistence salmon fishery (Hutchinson-Scarbrough and Fall 1996:27). With the assistance of local permit vendors, research assistants, and local governments, subsistence salmon harvest assessments for most recent years, with some exceptions, hare resulted in more reliable estimates of the total harvest.
SUBSISTENCE SALMON HARVESTS IN 2002 Since 1980, the number of subsistence salmon permits issued for the Chignik Area has averaged 100 per year, with 65.1 percent returned. Since 1993, the average has been 137 permits issued and 76.2 percent returned. The recent 5-year average (1998 through 2002) is 119 permits issued, and 80.7 percent returned. In 2002, 120 permits were issued and 86 were returned (71.7 percent) (Table VII-1). Of all permits issued for 2002, 102 (85 percent) were issued to residents of Chignik Area communities, and 18 (15 percent) were issued to residents of other Alaska communities (Table VII-2).

91
In 2002, the estimated subsistence salmon harvest for the Chignik Area was 11,980 fish (Table VII-1). This was slightly above the long-term average (11,141 salmon) but lower than the average since 1993 (14,523 salmon). The 2002 subsistence harvest was made up of 84.2 percent sockeye, 11.7 percent coho, 3.3 percent pink, 0.6 percent chinook, and 0.2 percent chum salmon (Fig. VII-1). The relative contribution of sockeye salmon to the total subsistence harvest in the Chignik Area was particularly high in 2002 compared to other recent years, and reflects a lower than average harvest of coho, pink, and chum salmon. Of the total harvest, local residents took 10,216 salmon (85.3 percent) and other Alaska residents harvested 1,764 salmon (14.7 percent) (Table VII-2; Fig. VII-2). In 2002, the largest number of salmon (6,583; 54.9 percent) was harvested in Chignik Bay and Chignik Lagoon (Table VII-3). Most of this harvest was sockeyes (96.1 percent). Subsistence harvests in the Perryville and Western districts numbered 1,946 salmon (16.2 percent), with most of this coho (59.6 percent), accounting for most of the Area’s subsistence harvest of coho and pink salmon. Estimated subsistence harvests in Chignik Lake totaled 3,451 salmon (28.8 percent), mostly sockeye salmon. This total includes spawning sockeye salmon, locally called “redfish,” which are harvested in the fall and early winter.
OTHER CHIGNIK AREA SUBSISTENCE FISHERIES Although state regulations require a subsistence permit for harvesting trout and char, there are no annual harvest assessment programs for the other subsistence fisheries of the Chignik Area. The Alaska Board of Fisheries, in an update of its customary and traditional use finding in January 2002, has identified subsistence uses of all finfish in the Chignik Area. Table VII-4 lists the finfish other than salmon for which subsistence uses have been documented through systematic household interviews. For purposes of subsistence shellfish management, the Chignik Finfish Management Area is within the Alaska Peninsula – Aleutian Islands Area. The Alaska Board of Fisheries has identified subsistence uses of all shellfish stocks in the Alaska Peninsula – Aleutian Islands Area. There are no subsistence harvest assessment programs for these shellfish stocks in the Chignik Area. Table VII-5 lists the shellfish for which subsistence uses have been documented through systematic household interviews. The reader should consult Morris 1987, Fall et al. 1995, Hutchinson-Scarbrough and Fall 1996, and ADF&G 2002a for more background on these subsistence fisheries for nonsalmon finfish and for shellfish. For harvest estimates based on systematic household interviews, see the Division of Subsistence Community Profile Database (Scott et al. 2001).

Table VII-1. Historic Subsistence Harvests of Salmon, Chignik Management Area, 1976 - 2002
EstimatedNumber of Permits Percentage Number Percentage Estimated Harvests
Year Issued Returned Returned Fished Fished Chinook Sockeye Coho Pink Chum Total
1976 100 6,000 1,500 500 150 8,250 1977 50 9,700 2,400 1,800 600 14,550 1978 50 6,000 500 2,100 600 9,250 1979 14 7,750 34 262 0 8,060 1980 82 37 45.1% 70.0 85.4% 6 12,475 32 478 169 13,160 1981 29 7 24.1% 18.0 62.1% 0 2,049 0 0 0 2,049 1982 59 15 25.4% 56.0 94.9% 3 8,532 12 2 0 8,548 1983 32 21 65.6% 26.5 82.8% 0 3,078 1,319 1,250 850 6,497 1984 77 64 83.1% 57.7 74.9% 23 8,747 464 330 204 9,768 1985 59 48 81.4% 49.0 83.1% 1 7,177 50 26 25 7,279 1986 74 38 51.4% 70.0 94.6% 4 10,347 205 98 77 10,730 1987 NA NA NA NA NA 10 7,021 278 204 261 7,774 1988 80 34 42.5% 77.0 96.3% 9 9,073 1,455 54 142 10,733 1989 68 23 33.8% 46.8 68.8% 24 7,552 384 81 147 8,187 1990 72 23 31.9% 62.0 86.1% 103 8,099 210 470 115 8,996 1991 95 58 61.1% 83.0 87.4% 42 11,483 13 275 81 11,893 1992 98 19 19.4% 85.8 87.5% 55 8,648 709 305 145 9,862 1993 202 141 69.8% 163.6 81.0% 122 14,710 3,765 1,265 642 20,503 1994 219 122 55.7% 159.9 73.0% 165 13,978 4,055 1,720 382 20,300 1995 111 95 85.6% 95.2 85.8% 98 9,563 1,191 723 150 11,725 1996 119 104 87.4% 104.1 87.5% 48 7,357 2,126 2,204 355 12,090 1997 126 103 81.7% 118.7 94.2% 28 13,442 2,678 2,035 840 19,023 1998 104 72 69.2% 89.6 86.2% 91 7,750 1,390 1,007 186 10,424 1999 106 88 83.0% 99.1 93.5% 243 9,040 1,679 1,191 136 12,290 2000 130 112 86.2% 111.0 85.4% 163 9,561 1,802 1,185 517 13,227 2001 135 122 90.4% 115.4 85.5% 171 8,633 1,859 2,787 213 13,663 2002 120 86 71.7% 104.5 87.1% 74 10,092 1,401 390 23 11,980
Average 99.9 65.1 65.2% 84.7 84.8% 63 8,809 1,167 842 260 11,141
Average1993-02 137.2 104.5 76.2% 116.1 84.6% 120 10,413 2,195 1,451 344 14,523
Average1998-02 119.0 96.0 80.7% 103.9 87.3% 148 9,015 1,626 1,312 215 12,317
Sources: Quimby and Owen 1994:90, for 1976 - 1979 and 1987; Division of Subsistence, ADF&G, Alaska Subsistence Fisheries Database, Version 3.30, for the remaining years.
92

Table VII-2. Chignik Area Subsistence Salmon Harvests by Species and Community of Residence, 2002
Communityof Residence Issued Returned Chinook Sockeye Coho Pink Chum Total
Chignik 17 15 9 1,306 170 0 0 1,485Chignik Lagoon 31 21 32 2,396 68 0 0 2,496Chignik Lake 23 20 8 2,979 75 0 0 3,061Ivanof Bay 1 0 0 0 0 0 0 0Perryville 30 25 11 1,692 1,058 390 23 3,174
Subtotal, Chignik Area Communities 102 81 60 8,373 1,371 390 23 10,216
Anchorage 6 2 6 900 30 0 0 936Cordova 1 0 0 0 0 0 0 0Kodiak 6 3 8 820 0 0 0 828Petersburg 1 0 0 0 0 0 0 0Seldovia 2 0 0 0 0 0 0 0Seward 2 0 0 0 0 0 0 0
Subtotal, Other Alaska Communities 18 5 14 1,720 30 0 0 1,764
Grand Total 120 86 74 10,092 1,401 390 23 11,980
Source: ADF&G, Division of Subsistence, Alaska Subsistence Fisheries Database Version 3.30
Permits Estimated Number of Salmon Harvested
93

Table VII-3. Chignik Area Subsistence Salmon Harvests by Species and Subarea of Harvest, 2002
Subareaof Harvest1 Chinook Sockeye Coho Pink Chum All Salmon
Chignik Bay and Lagoon 40 6,324 219 0 0 6,583Chignik Lake 28 3,401 22 0 0 3,451Perryville 6 367 1,160 390 23 1,946
Grand Total 74 10,092 1,401 390 23 11,980
1 The Chignik Bay/Lagoon Subarea corresponds to the portion of the Chignik Bay District downstreamof the ADF&G weir in the Chignik River, and the Central District. The Chignik Lake Subarea includessubsistence harvests above the weir. The Perryville Subarea corresponds to the Perryville and Western districts, including Ivan Bay, Mitrofania Bay, the Kametolook River and other streams nearPerryville, and Ivanof Bay. In recent years there have been no subsistence harvests reported for theEastern District.
2 Estimated based on extrapolating harvests recorded on returned permits. In 2002, 120 permits wereissued and 86 were returned (71.7 percent).
Estimated Number of Salmon Harvested2
94

Table VII-4. Finfish Other Than Salmon Used for Subsistence Purposes in Communities of the Chignik Management Area, 1989
Percentage of Households Using in:Common English Chignik Chignik Chignik Ivanof
Name Scientific Name Bay Lagoon Lake Bay Perryville
Herring Clupea harengus pallasi 22.9 46.7 28.6 28.6 14.8 Herring Spawn on Kelp --- 14.3 0.0 4.8 0.0 3.7 Pollock Theragra chalcogramma 2.9 0.0 0.0 0.0 0.0 * Rainbow Smelt Osmerus mordax 11.4 0.0 47.6 0.0 0.0 Halibut Hippoglossus stenolepis 88.6 100.0 66.7 100.0 96.3 Rainbow Trout Salmo gairdneri 2.9 0.0 23.8 57.1 7.4 Dolly Varden Salvelinus malma 22.9 6.7 38.1 85.7 55.6 Eulachon (Candlefish) Thaleichthys pacificus 22.9 40.0 33.3 100.0 77.8 Pacific Cod (Gray) Gadus macrocephalus 28.6 60.0 47.6 85.7 63.0 Sculpin Hemilepidotus sp. 11.4 0.0 4.8 0.0 29.6 Starry Flounder Platichthys stellatus 5.7 0.0 19.0 14.3 0.0 Greenling Hexagrammos decagrammus 11.4 0.0 9.5 0.0 29.6 Grayling Thymallus arcticus 0.0 0.0 0.0 14.3 0.0 Black Cod Anoplopoma fimbria 0.0 6.7 4.8 0.0 0.0 Steelhead Salmo gairdneri 0.0 13.3 4.8 0.0 0.0 Black Rockfish Sebastes melanops 0.0 6.7 0.0 0.0 22.2 Red Rockfish Sebastes ruberrimus 2.9 0.0 0.0 0.0 3.7
Any Fish Other Than Salmon 89.0 100.0 86.0 100.0 96.0
* Most likely harvested outside the Chignik Management Area; Chignik area households receive gifts of rainbow smelt from relatives and friends in Pilot Point, Ugashik, and Naknek, among other communities.
Source: Scott et al. 2001; Hutchinson-Scarbrough and Fall 1996
95

Table VII-5. Marine Invertebrates Used for Subsistence Purposes in Communities of the Chignik Area, 1989
Percentage of Households Using in:Chignik Chignik Chignik Ivanof
Common English Name Scientific Name Bay Lagoon Lake Bay Perryville
Razor Clams Siliqua patula 14.3 33.3 23.8 42.9 37.0 Butter Clams Saxidomus giganteus 71.4 66.7 52.4 71.4 40.7 Horse Clams Tresus capax 11.4 0.0 0.0 0.0 3.7 Cockles Clinocardium sp. 37.1 6.7 47.6 100.0 70.4 Pinkneck Clams (redneck) Spicula polynuma 0.0 0.0 0.0 71.4 3.7 Littleneck (Steamer) Clams Protothaca staminea* 11.4 0.0 0.0 28.6 11.1 Chitons, Black Katharina tunicata 48.6 26.7 57.1 100.0 92.6 Chitons, Red Cryptochiton stelleri 0.0 0.0 0.0 85.7 11.1 Mussels (blue) Mytilus edulis 8.6 6.7 0.0 14.3 14.8 Octopus Octopus dolfleini 42.9 20.0 47.6 71.4 51.9 Sea Urchins Stronglyocentrotus sp. 28.6 0.0 47.6 100.0 88.9 Sea Cucumber Unidentified 0.0 0.0 0.0 0.0 3.7 Shrimp Pandalus sp. 8.6 0.0 4.8 0.0 0.0 Scallops Pecten caurinus 2.9 0.0 0.0 0.0 0.0 King Crab Paralithades camtschatica 40.0 20.0 33.3 42.9 0.0 Dungeness Crab Cancer magister 37.1 40.0 47.6 100.0 51.9 Tanner Crab Chionoecetes bairdi 62.9 66.7 14.3 0.0 3.7 Snails Neptunea sp. 2.9 0.0 0.0 0.0 3.7 Limpets Acmaeidae sp. 2.9 0.0 0.0 0.0 3.7
Any Marine Invertebrate 89.0 87.0 81.0 100.0 96.0
* May also include smaller-sized individuals of other species and softshell clams of the genus Mya .
Source: Scott et al. 2001; Hutchinson-Scarbrough and Fall 1996
96

Figure VII-1. Composition of Chignik Area Subsistence Salmon Harvest by Species, 2002
84.2%
0.2%
3.3%11.7%
0.6%SockeyeChinookChumPinkCoho
Figure VII-2. Subsistence Salmon Harvests by Community, Chignik Management Area, 2002
12%
21%
26%0%
26%
15%
Chignik BayChignik LagoonChignik LakeIvanof BayPerryvilleOther
N = 11,980 salmon, based on annual harvest assessment program with permits and household surveys.
N = 11,980 salmon, based on annual harvest assessment program with permits and household surveys.
97

98

VIII: ALASKA PENINSULA AREA
BACKGROUND The Alaska Peninsula Area includes all Pacific Ocean waters of Alaska between a line extending southeast from the tip of Kupreanof Point and the longitude of the tip of Cape Sarichef, and all Bering Sea waters of Alaska east of the longitude of the tip of Cape Sarichef and south of the latitude of the tip of Cape Menshikof. The communities of the Alaska Peninsula Area are Port Heiden (estimated population 119 in 2000), Nelson Lagoon (population 83), False Pass (population 64), Cold Bay (population 88), King Cove (population 792), and Sand Point (population 952) (US Census Bureau 2001). Port Heiden is in the Lake and Peninsula Borough; the other communities are in the Aleutians East Borough (which also includes Akutan in the Aleutian Islands Area).
REGULATIONS A subsistence permit is required for fishing in the Alaska Peninsula Area, which must be used to record daily harvests. There is a 250 salmon annual limit. Legal gear includes seine and gillnets. Set gillnets may not exceed 100 fathoms in length. Salmon may be taken at any time except within 24 hours before and within 12 hours following each open weekly commercial salmon fishing period within a 50-mile radius of the area open to commercial salmon fishing. A few small areas closed to subsistence salmon fishing are listed in 5 AAC 01.425. Federal regulations governing subsistence salmon fishing in waters under the jurisdiction of the Federal Subsistence Board were generally identical to the state regulations summarized above, except rod and reel, in addition to gill nets and seines, was legal subsistence gear under federal rules. There was no separate federal subsistence permit; a state permit was required for subsistence fishing under the federal regulations.
HARVEST ASSESSMENT PROGRAM
The Division of Commercial Fisheries of ADF&G has issued subsistence permits for the Alaska Peninsula Area since 1979. Except for residents of Sand Point and Cold Bay, permits are mailed each year to fishers who turned in their permits at the end of the previous fishing season. Sand Point and Cold Bay residents are issued permits on request at the Sand Point and Cold Bay ADF&G offices. Permits are also issued on request at other ADF&G offices and by mail to people who call in and request them. Regulations require that permits be turned in to ADF&G by October 31. Reminder letters are sent around November 1 to people who have not yet returned their permits. If a person does not return the permit, their name is dropped from the mailing list for the next year. Data from returned permits are tabulated by species and fishing area. Harvest data from returned permits are expanded by community of residence to estimate the harvest by all permit holders.
99

SUBSISTENCE SALMON HARVESTS IN 2002 Since 1985, the number of subsistence salmon permits issued for the Alaska Peninsula Area has averaged 207 per year (Table VIII-1). The recent five-year average (1998 through 2002) was 188 permits. In 2002, 157 subsistence salmon fishing permits were issued for the Alaska Peninsula Area, a sharp decrease from 2001 (185 permits issued) and continuing a downward trend that began in 1999. The response rate was 84.7 percent in 2002 (133 of 157 permits were returned). Of all permits issued, 134 (85.4 percent) were issued to residents of Alaska Peninsula Area communities, and 23 (14.6 percent) were issued to other Alaska communities (Table VIII-2). Most non-local residents fish at Mortensen’s Lagoon on the Cold Bay road system. In 2002, the estimated subsistence salmon harvest for the Alaska Peninsula Area was 15,052 fish. This was a substantial drop from the year before (harvest of 19,912 salmon) and quite lower than the long-term average (19,612 salmon) and the recent five-year average (20,150 salmon) (Table VIII-2). The 2002 subsistence harvest was made up of 62 percent sockeye, 21 percent coho, 11 percent chum, 4 percent pink, and 2 percent chinook salmon (Fig. VIII-1). Of the total harvest, local residents took 13,320 salmon (88.5 percent) and other Alaska residents harvested 1,731 salmon (11.5 percent) (Table VIII-2; Fig. VIII-2). In interviews with Division of Subsistence staff, fisheries managers stated that in their view, the subsistence permit system does completely document all subsistence salmon harvesting activities because some fishers fail to obtain permits. A comparison of permit and household interview data for 1992 for King Cove found that about 31 percent of interviewed households that reported subsistence fishing did not have permits. The estimated total subsistence salmon harvest for the community based on the interviews was 7,036 (+/-1,773), compared to 5,856 based on permit returns (Fall et al. 1993a:58-62). At Sand Point in the same year, 41 percent of interviewed households who reported that they harvested salmon with subsistence methods did not have permits. The estimated total subsistence salmon harvest for Sand Point based on the interviews was 11,338 (+/-2,551), compared to 7,833 based on permit returns (Fall et al. 1993b:61). Another limitation is that the subsistence permit system for the Alaska Peninsula Area does not account for salmon withheld from commercial catches for home use. Fisheries managers believe that this number is substantial, especially in years when commercial salmon prices are low. For 1992, it was estimated that 51 percent of the salmon harvested for home use at King Cove and 39 percent at Sand Point were removed from commercial harvests (Fall et al. 1993a:56, Fall et al. 1993b:58).
OTHER SUBSISTENCE FISHERIES There are no annual harvest assessment programs for the other finfish and shellfish subsistence fisheries of the Alaska Peninsula Area.1 The Division of Subsistence has conducted one round of systematic household harvest surveys in each of the Area’s communities except Cold Bay. The findings of these surveys, including species used, percentage of households harvesting each species in the study year, and estimated harvest quantities for the study year, appear in the 1 In May 2003, federal regulations authorizing subsistence harvests of halibut in Alaska were finalized. A harvest assessment program for subsistence halibut will be implemented in 2003.
100

Community Profile Database (Scott et al. 2001). Table VIII-3 reports the percentage of households in the surveyed communities that used selected non-salmon finfish species in the study year. Generally, Pacific cod, halibut, and Dolly Varden/char were used by the most households. Survey data for marine invertebrates will be reported in future annual reports.
101

YEAR Issued Returned Chinook Sockeye Coho Chum Pink Total1985 161 95 74 4,037 7,504 1,566 574 13,7551986 147 84 101 5,396 2,996 1,455 1,779 11,7271987 191 144 193 5,777 4,259 1,943 1,547 13,7191988 183 114 257 5,501 5,646 1,692 1,666 14,7621989 188 139 88 10,404 3,505 2,104 1,213 17,3141990 201 157 246 8,588 4,029 1,589 736 15,1881991 249 185 458 11,345 5,551 3,551 1,878 22,7831992 229 177 385 10,739 4,267 2,574 1,840 19,8051993 262 215 615 12,478 5,753 1,997 1,189 22,0321994 256 213 674 11,884 6,086 4,406 2,206 25,2561995 260 198 492 12,716 5,021 3,369 2,653 24,2511996 234 178 362 12,176 7,743 2,728 2,569 25,5781997 217 172 420 15,224 4,612 2,885 2,955 26,0961998 233 153 407 12,920 5,820 1,326 2,286 22,7591999 185 148 391 15,119 4,961 2,235 2,136 24,8432000 180 152 341 9,955 5,239 1,699 950 18,1852001 185 155 570 12,259 3,940 1,963 1,181 19,9122002 157 133 345 9,384 3,188 1,603 532 15,0521998-2002 Average 188 148 411 11,927 4,629 1,765 1,417 20,1501993-2002 Average 217 172 462 12,411 5,236 2,421 1,866 22,396All Years Average 207 156 357 10,328 5,007 2,260 1,661 19,612
SOURCE: Alaska Department of Fish and Game, Division of Subsistence, Alaska Subsistence Fisheries Database, Version 3.3.
Table VIII-1. Historic Subsistence Salmon Harvests, Alaska Peninsula Area, 1985 - 2002
Permits Estimated Salmon Harvest
102

Species, 2002
Community Issued ReturnedBear Lake 1 1 0 115 0 0 0 115Cold Bay 21 20 0 497 0 15 0 511False Pass 14 10 32 662 269 78 41 1,082King Cove 60 52 35 4,385 2,424 415 77 7,336Nelson Lagoon 4 3 7 187 95 0 0 288Port Heiden 3 3 120 34 50 6 0 210Sand Point 31 24 102 2,019 283 1,000 375 3,778
Subtotal: Area Communties 134 113 296 7,899 3,121 1,514 493 13,320
Anchorage 4 3 3 165 60 20 33 281Eagle River 1 1 0 34 0 3 0 37Fairbanks 1 1 36 8 0 0 0 44Girdwood 1 1 0 22 3 0 0 25Homer 3 3 0 350 0 1 0 351Kalskag (Upper) 1 0 0 0 0 0 0 0Kenai 1 0 0 0 0 0 0 0Kodiak (city) 6 6 2 194 0 13 0 209Nikolaevsk 1 1 0 177 3 0 0 180Palmer 2 2 9 411 0 50 4 474Talkeetna 1 1 0 45 1 2 2 50Unknown Community 1 1 0 80 0 0 0 80
Subtotal: Other 23 20 50 1,486 67 89 39 1,731
Totals 157 133 345 9,384 3,188 1,603 532 15,052
Total Salmon
SOURCE: Alaska Department of Fish and Game, Division of Subsistence, Alaska Subsistence Fisheries Database, Version 3.3.
Table VIII-2. Estimated Subsistence Salmon Harvests, Alaska Peninsula Area, by Community and
PermitsEstimated Salmon Harvest
Chinook Sockeye Coho Chum Pink
103

Table VIII-3. Percentage of Households Using Selected Non-Salmon Finfish, Alaska Peninsula Area Communities
Percentage of Households Using in Study Year2
Resource1 False Pass King CoveNelson Lagoon Port Heiden Sand Point
Pacific Cod 65.0% 44.0% 0.0% 2.7% 60.6%Sablefish 15.0% 8.0% 12.5%Greenling 10.0% 5.3% 6.7%Flounder 20.0% 4.0% 7.7% 10.8% 3.8%Halibut 95.0% 73.3% 0.0% 21.6% 89.4%Herring 30.0% 22.7% 2.7% 13.5%Herring Spawn on Kelp 0.0% 2.7% 2.7% 1.0%Smelt 0.0% 1.3% 48.6% 4.8%Rockfish 5.0% 36.0% 60.6%Sculpin 35.0% 6.7% 3.8%Pollock 2.7% 1.9%Lake Trout 10.8%Dolly Varden/Char 75.0% 66.7% 53.8% 75.7% 51.0%Rainbow Trout/Steelhead 5.0% 4.0% 2.7% 30.8%
1 Most commonly used types in the study year; uses of other species occurred, or may occurin other years. Blank cells indicate no data for that resource.2 Study year = 1987/88 for False Pass; 1986/87 for Nelson Lagoon and Port Heiden; 1992 for King Cove and Sand Point.
Source: Scott et al. 2001
104

Figure VIII-1. Composition of Alaska Peninsula Area Subsistence Salmon Harvest by Species, 2002
62%11%
4%
21%
2%
SockeyeChinookChumPinkCoho
Figure VIII-2. Subsistence Salmon Harvests by Community, Alaska Peninsula Management Area,
2002
7%
49%
25%
12% 3%
3%
1%
Cold BayFalse PassKing CoveNelson LagoonPort HeidenSand PointOther
N = 15,052 salmon; based on annual harvest assessment program with permits.
N = 15,052 salmon; Nelson Lagoon includes Bear Lake; based on annual harvest assessment program with permits.
105

106

107
IX. ALEUTIAN ISLANDS AREA
UNALASKA DISTRICT: SUBSISTENCE SALMON FISHERY Background The Aleutian Islands Area includes all waters of Alaska west of the longitude of the tip of Cape Sarichef, east of 172° east longitude, and south of 54° 36' north latitude (5 AAC 01.350). For subsistence purposes, the Aleutian Islands Area is divided into five management districts. From east to west, they are the Akutan District, Unalaska District, Umnak District, Atka-Amlia Islands District, and the Adak District. The major communities of the Aleutian Islands Area are Akutan (population 713 in 2000, but 638 live in group quarters [fish processor]; population in households is 75), Unalaska/Dutch Harbor (population 4,283; 2,091 living in households, the remainder in group quarters), Nikolski (population 39), Atka (population 92), and Adak (population 316) (US Census Bureau 2001). Akutan is part of the Aleutians East Borough; the other communities are not part of any organized borough. The Unalaska District includes all waters west of Akutan Pass to and including Umnak Pass (5 AAC 12.200(b). Regulations A permit is required for subsistence salmon fishing in the Unalaska District. Fishers must record their daily harvests on the permit, and return it to ADF&G by October 31. Permit holders may harvest no more than 25 salmon, plus an additional 25 salmon for each member of the same household who are listed on the permit. Also, as specified in 5 AAC 01.380(b)(2), “a permit holder may obtain an additional permit from the department to harvest more salmon.” Salmon may be taken from 6 a.m. until 9 p.m. from January 1 through December 31, except from June 1 through September 15, a salmon seine vessel may not be used to take salmon for subsistence purposes 24 hours before, during, or 24 hours after an open commercial fishing period within a 50-mile radius of the area open to commercial fishing. Salmon may be taken by seine or gillnet, but from June 1 through September 15, a purse seine vessel may be used to take subsistence salmon only with a gillnet. Subsistence gillnets must be attended at all times while fishing. Waters with in the Unalaska District that are closed to subsistence fishing for salmon are defined in 5 AAC 01.375. Harvest Assessment Program
The Division of Commercial Fisheries of ADF&G has issued subsistence salmon harvest permits for the Unalaska District since 1979. Permits are issued only in person at the ADF&G office in Dutch Harbor. Unalaska District permits may be dropped off or mailed back to the ADF&G office in Dutch Harbor at the end of the fishing season. They are required by regulation to be returned by October 31. Reminder letters are sent around the first of November to all permit holders who have not turned in their permits by that time. Data from returned permits are tabulated by species and fishing area. Data from successfully fished permits are then expanded to represent fish taken by all permit holders, including those who did not return permits.

108
Subsistence Salmon Harvests in 2002 In 2002, 231 subsistence salmon permits were issued for the Unalaska District, slightly above other recent years (recent five-year average of 212 permits) but notably above the long-term average of 148 permits since 1985. The return rate in 2002 was 77.9 percent (180 of 231 permits) (Table IX-1). Individuals with Unalaska/Dutch Harbor addresses obtained 225 permits (97.4 percent) and other Alaska residents obtained the balance, 6 permits (2.6 percent) (Table IX-2). The estimated subsistence harvest of salmon in the Unalaska District in 2002 was 6,837 fish. This is second-highest annual harvest on record (after the 1986 harvest of 7,139 salmon), well above the long-term average of 4,620 salmon and also higher than the recent five-year average of 5,4,74 salmon. The 2002 subsistence harvest in the Unalaska District was composed of 83.0 percent sockeye, 10.3 percent coho, 5.6 percent pink, 1.0 percent chum, and 0.04 percent chinook (Fig. IX-1). Permit holders with Unalaska/Dutch harbor addresses harvested all but 80 fish (98.8 percent) of the Unalaska District total subsistence catch in 2002 (Table IX-2). In interviews with Division of Subsistence personnel, ADF&G fisheries managers expressed the view that the permit system covers most subsistence salmon fishing occurring in the Unalaska District. In their view, most subsistence fishers obtain permits. They cite the local presence of Fish and Wildlife Protection officers and a population that is self-enforcing (likely to report violators) as reasons for this belief. Unlike other in other areas, fisheries managers in the Unalaska District feel that commercially caught salmon withheld for subsistence purposes is not a major factor in the Aleutian Islands Area. This is because most commercial fishing occurring in the area is for shellfish and ground fish, not for salmon. Results of a survey of randomly-selected Unalaska households conducted by the Division of Subsistence, found that about 4 percent of all salmon harvested for home use were removed from commercial catches, 62 percent were harvested with noncommercial nets, and 34 percent were taken with rod and reel (Scott et al. 2001).
ADAK DISTRICT Background The Adak District of the Aleutian Islands Area consists of waters west of Atka Pass at 175° 23.00’ west longitude to the terminus of the Aleutian Islands. Until phased out from 1993 to 1996, Adak was the site of a navy base and military community, with a population of 4,633 in 1990. With the base closure complete, the population was estimated at 0 in 1997. Since then, a new civilian community has been established. In 2000, the Alaska Boundary Commission approved Adak’s application to become a second class city. The estimated population in 2000 was 316 (US Census Bureau 2001).

109
Regulations Prior to 1988, the non-commercial salmon net fishery at Adak was classified as a subsistence fishery. Beginning in 1988, this fishery operated as a personal use fishery. The Alaska Board of Fisheries reclassified it again as a subsistence fishery beginning in 1998. Subsistence regulations in place in 2001 required that fishers obtain a permit from ADF&G. Fishers must record their daily harvests on the permit, and return it to ADF&G by October 31. Permit holders may harvest no more than 25 salmon, plus an additional 25 salmon for each member of the same household who are listed on the permit. Also, as specified in 5 AAC 01.380(b)(2), “a permit holder may obtain an additional permit from the department to harvest more salmon.” Salmon may be taken at any time. The following waters of and around Adak Island and Kagalaska Island were closed to subsistence fishing for salmon (5 AAC 01.375(6)):
A. all freshwater B. all salt waters within 100 yards of a stream terminus.
Harvest Assessment Program Subsistence salmon permits are issued by ADF&G out of the Cold Bay office and are faxed upon request to Adak residents. Permits must be returned by mail or fax to Cold Bay by October 31, after which reminder letters are sent to those who have yet to report their harvests. ADF&G fisheries managers believe that the program provides reliable data on subsistence salmon fishing effort and harvests at Adak. Subsistence Salmon Harvests in 2002 Only three subsistence salmon permits were issued for the Adak District in 2002, a notable drop from the 13 and 17 permits issued in 2000 and 2001, respectively. All three permits were issued to residents of Adak and all were returned. The estimated harvest was 150 salmon, all sockeyes. This was the lowest total since the reclassification to a subsistence fishery in 1998. For the period 1988 through 1993 during which the navy base operated at Adak, an average of about 49 personal use permits were issued annually. The average annual harvest during that period was 611 salmon. Since the establishment of the civilian population at Adak in 1997, an average of 11.5 personal use/subsistence permits have been issued and the average annual harvest has been 310 salmon (Table IX-3).
OTHER SUBSISTENCE SALMON FISHERIES IN THE ALEUTIAN ISLANDS Permits are not required for subsistence salmon fishing in the waters fished by the communities of Atka, Akutan, and Nikolski, and there are no annual harvest assessment programs in place. The Division of Subsistence of ADF&G conducted post-season household interviews in Akutan and Nikolski pertaining to 1991 subsistence harvests (all resources), and in Atka pertaining to harvests in 1992 (salmon only) and 1994 (all resources). The results of these interviews for salmon are reported in Table IX-4. Subsistence salmon harvests in Akutan in 1991 totaled 3,268 fish. This harvest consisted primarily of sockeye (1,872 fish), pink (915 fish), and coho (429).

110
At Nikolski in 1991, subsistence salmon harvests totaled 1,902 fish, with sockeye (957 fish), coho (547 fish), and pink (327 fish) making up most of the total. At Atka in 1992, the subsistence salmon harvest totaled 1,454 fish, composed of about equal numbers of sockeye (502 fish), coho (465 fish), and pink salmon (459). Subsistence salmon harvests at Atka were higher in 1994, with a total of 2,387 fish. A substantially larger harvest of pink salmon in 1994 (1,267) accounted for most of the difference from the 1992 estimates.
OTHER SUBSISTENCE FISHERIES IN THE ALEUTIAN ISLANDS AREA Finfish There are no annual harvest assessment programs for the other subsistence finfish fisheries of the Aleutian Islands Area.1 Permits are required for the taking of trout and char, but no permit system is in place. Fish other than salmon may be taken by gear specified in 5 AAC 01.010(a), except that halibut may be taken only a single handheld line with no more than two hooks attached. The Division of Subsistence has conducted systematic household surveys pertaining to a single year’s harvests in Akutan (pertaining to 1991), Atka (1994), Nikolski (1991), Saint George (1994), Saint Paul (1994), and Unalaska/Dutch Harbor (1994). Results, including harvest estimates for finfish and shellfish, can be found in the Community Profile Database (Scott et al. 2001). Shellfish Permits for the taking of shellfish for subsistence purposes are only required for king and Tanner crab in the portion of the Alaska Peninsula-Aleutian Islands area west of Scotch Cap Light and east of 168° west longitude. Future annual reports will summarize subsistence harvest data from this permit program. As noted above, estimates of subsistence harvests of all marine invertebrates for single study years based on systematic household surveys are available in the Community Profile Database (Scott et al. 2001).
1 In May 2003, federal regulations authorizing subsistence harvests of halibut in Alaska were finalized. A harvest assessment program for subsistence halibut will be implemented in 2003.

Year Issued Returned Chinook Sockeye Coho Chum Pink Total1985 65 22 0 897 208 20 1,293 2,4181986 121 28 0 3,449 847 375 2,468 7,1391987 81 49 0 1,097 378 151 1,780 3,4061988 77 45 3 966 390 83 2,627 4,0691989 74 42 2 1,112 470 36 1,292 2,9121990 94 37 4 2,357 681 100 1,428 4,5701991 89 48 0 1,294 666 45 1,075 3,0801992 144 102 7 2,739 587 11 1,723 5,0671993 139 102 17 2,831 697 136 587 4,2681994 150 120 1 2,759 774 48 1,053 4,6351995 160 129 23 4,484 484 23 791 5,8051996 189 123 5 1,107 1,033 49 492 2,6861997 221 163 8 4,192 864 110 554 5,7281998 206 161 4 3,317 731 26 729 4,8071999 208 154 0 2,485 1,234 16 1,044 4,7792000 212 167 10 3,935 603 26 580 5,1542001 204 165 6 4,202 724 77 784 5,7932002 231 180 3 5,678 707 65 385 6,8371998-2002 Average 212 165 5 3,923 800 42 704 5,4741993-2002 Average 192 146 8 3,499 785 58 700 5,049All Years Average 148 102 5 2,717 671 78 1,149 4,620
SOURCE: Alaska Department of Fish and Game, Division of Subsistence, Alaska Subsistence Fisheries Database, Version 3.3.
Table IX-1. Historic Subsistence Salmon Harvests, Unalaska District, 1985- 2002
Permits Estimated Salmon Harvest
111

Community Total Included Chinook Chum PinkAdak Station 1 1 0 80 0 0 0 80Anchorage 1 0Dutch Harbor 111 86 1 2,387 196 35 65 2,683Eagle River 1 1 0 0 0 0 0 0Kodiak (city) 3 2 0 0 0 0 0 0Unalaska 114 90 1 3,211 510 30 320 4,074Totals 231 180 3 5,678 707 65 385 6,837
SOURCE: Alaska Department of Fish and Game, Division of Subsistence, Alaska Subsistence Fisheries Database, Version 3.3.
Table IX-2. Estimated Subsisence Salmon Harvests, Unalaska District, by Community and Species, 2002
PermitsEstimated Salmon Harvest
Sockeye CohoTotal
Salmon
112

Year Issued Returned Chinook Sockeye Coho Chum Pink Total1988 43 29 0 503 23 0 150 6761989 64 47 0 382 0 0 117 4991990 61 29 0 800 47 0 41 8881991 37 31 0 281 6 0 34 3211992 52 41 0 572 30 0 4 6061993 36 26 0 638 12 0 26 6761994 2 0 0 0 0 0 0 0 01995 4 3 0 156 0 0 0 1561996 6 6 0 91 0 0 0 911997 3 18 12 0 229 0 4 0 2331998 13 10 0 399 0 0 25 4241999 5 5 0 164 4 0 0 1682000 13 13 0 270 4 0 75 3492001 17 15 14 489 18 0 16 5372002 3 3 0 150 0 0 0 1501988-1993 Average 49 34 0 529 20 0 62 6111997-2002 Average 12 10 2 284 4 1 19 310All Years Average 25 18 1 342 10 0 33 385
1 Personal Use fishery, 1988 to 1997; subsistence fishery, 1998 to present2 US Navy presence at Adak was reduced beginning in 1994; no requests for personal use permits in 1994.3 In 1997, a substantial number of civilians were hired by the Navy to work on a clean-up effort at Adak.
SOURCE: Alaska Department of Fish and Game, Division of Subsistence, Alaska Subsistence Fisheries Database, Version 3.3.
Table IX-3. Estimated Subsistence and Personal Use Harvests of Salmon, Adak District, 1988 - 2002
Permits1 Estimated Harvest in Numbers of Salmon
113
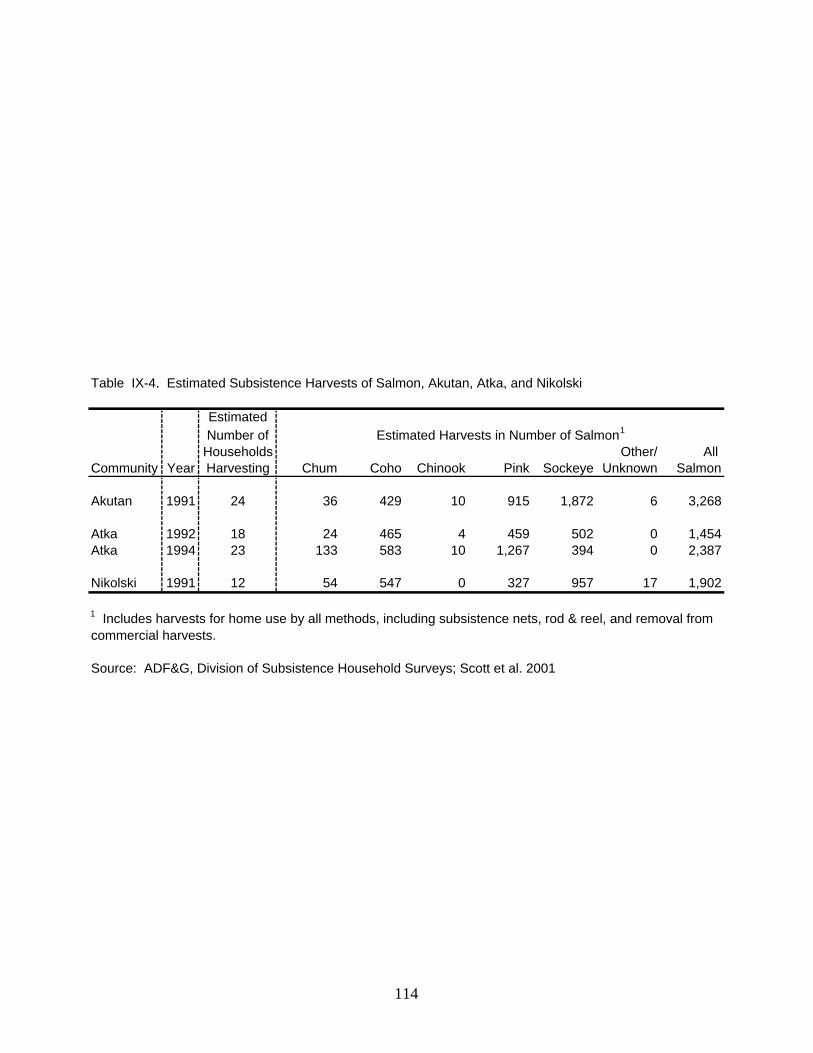
Table IX-4. Estimated Subsistence Harvests of Salmon, Akutan, Atka, and Nikolski
EstimatedNumber of
Households Other/ All Community Year Harvesting Chum Coho Chinook Pink Sockeye Unknown Salmon
Akutan 1991 24 36 429 10 915 1,872 6 3,268
Atka 1992 18 24 465 4 459 502 0 1,454Atka 1994 23 133 583 10 1,267 394 0 2,387
Nikolski 1991 12 54 547 0 327 957 17 1,902
1 Includes harvests for home use by all methods, including subsistence nets, rod & reel, and removal from commercial harvests.
Source: ADF&G, Division of Subsistence Household Surveys; Scott et al. 2001
Estimated Harvests in Number of Salmon1
114

Figure IX-1. Composition of Unalaska District Subsistence Salmon Harvest by Species, 2002
83.04%
5.63%
0.04%
10.34%
0.95%
SockeyeChumPinkChinookCoho
N = 6,837 salmon; based on annual harvest assessment program with permits.
115

116

X: KODIAK AREA
INTRODUCTION The Kodiak Management Area encompasses the waters of the western Gulf of Alaska surrounding the Kodiak Archipelago and along that portion of the Alaska Peninsula that drains into Shelikof Strait between Cape Douglas and Kilokak Rocks. It also includes Chirikof Island. The major communities within the Area include Akhiok, Chiniak, the Coast Guard Base, Karluk, and Kodiak City. Larsen Bay, Old Harbor, Ouzinkie, and Port Lions. All are within the Kodiak Island Borough, which had an estimated population in 2000 of 13,913 (US Census Bureau 2001).
REGULATIONS Permits have been required to harvest salmon for subsistence purposes in the Kodiak Management Area since 1962. Since 1990, all Alaska state residents have been eligible to participate in subsistence salmon fishing in the Kodiak Management Area. In 2001, legal gear for subsistence salmon fishing under state regulations included gillnets and seines, and fishers were required to be physically present while the net was being fished. Generally, fishing was open year-round from 6:00 a.m. to 9:00 p.m. daily. From June 1 through September 15, salmon seine vessels could not be used for subsistence salmon fishing 24 hours before, during, and 24 hours after any open commercial salmon fishing period. During the same time span, only gillnets could be operated for subsistence purposes from purse seine vessels. Permits allowed fishers to harvest 25 salmon plus 25 additional salmon for each member of the permit holder’s household. An additional permit could be obtained if the fisher could demonstrate a need for more fish. Permit holders are required to keep a record of their harvest on the permit. A list of waters closed to subsistence fishing within the Kodiak Management Area appears in 5 AAC 01.525. Federal regulations governing subsistence salmon fishing in waters under the jurisdiction of the Federal Subsistence Board were generally identical to the state regulations summarized above, except rod and reel, in addition to gill nets and seines, was legal subsistence gear under federal rules. There was no separate federal subsistence permit; a state permit was required for subsistence fishing under the federal regulations.
HARVEST ASSESSMENT PROGRAM ADF&G’s Division of Commercial Fisheries runs the subsistence salmon harvest assessment program for this management area out of the Kodiak regional office. Permits are mailed each year to people who turned in their permits at the end of the previous fishing season. Subsistence permits are also issued on request at ADF&G offices and by mail to people who call in and request one. In addition, field camp staff at Karluk and Olga Bay issue permits on request. In June 2001, staff from the Division of Commercial Fisheries and the Division of Subsistence of ADF&G traveled to the six small Kodiak Island Borough communities (Akhiok, Karluk, Larsen Bay, Old Harbor, Ouzinkie, and Port Lions) to implement a local permit vendor system. A resident in each community was trained to issue subsistence fishing permits. Outreach occurred in each community as well to encourage subsistence fishers to obtain permits, record their
117

harvests, and return the permits at the end of the season. The vendor program also operated in 2002. Subsistence fishers mail permits with a harvest record to ADF&G at the end of the season or drop the permits off at the Kodiak office. ADF&G sends reminder letters in February to those permit holders who have not returned their permits by then.
SUBSISTENCE SALMON HARVESTS IN 2002
In 2002, subsistence fishers returned 2,271 subsistence permits to the Department (Table X-1). Of all returned permits, 1,912 (84.2 percent) were held by residents of Kodiak Island Borough communities, and 359 (15.8 percent) were issued to other Alaska residents (Table X-2). Individuals and families with Kodiak city addresses accounted for a very large number of the total permits in 2002 (1,715; 75.5 percent of all permits returned). In the Kodiak Area, tabulated subsistence harvest data are not expanded. Results of the assessment program reflect only the reported harvests of subsistence fishers who obtained and returned permits. The reported total Kodiak Area subsistence salmon harvest in 2002 was 41,642 fish (Table X-1). This number is higher than both the recent 5-year average of 35,229 salmon and recent 10-year average of 33,826 salmon. Of the entire management area harvest, 39,592 salmon (95.1 percent) were harvested by residents of Kodiak Island Borough communities, and 2,050 salmon (4.9 percent) were harvested by other Alaska residents (Table X-2). In 2002, the Kodiak Area subsistence salmon harvest was composed of 79.2 percent sockeye, 14.5 percent coho, 4.0 percent pink, 1.4 percent chinook, and 0.8 percent chum salmon (Fig. X-1). In interviews with Division of Subsistence staff, fisheries managers within Division of Commercial Fisheries expressed uncertainty about the extent to which subsistence salmon harvests in the Kodiak Management Area are documented by the permit system. They suspected that a substantial amount of subsistence harvesting occurs without permits, especially in areas off of the road system. Comparisons of subsistence harvests based on returned permits with those from household harvest surveys (as reported in the Community Profile Database; Scott et al. 2001) suggest that subsistence salmon harvests are substantially higher than permit return indicate. Delivery of permits to subsistence fishers living in the six communities off the island road system has been problematic in the past, but as noted above, in recognition of this problem, a local permit vendor system was implemented in 2001. This outreach appeared to result in increased participation in the permit system in the six smaller communities: 189 households from these communities returned subsistence permits in 2001and 167 in 2002 (Table X-2), compared to 100 in 2000 (ADF&G 2002c:105). The reported subsistence salmon harvest for the six communities was 9,034 in 2001 and 9,386 in 2002, compared to 6,299 in 2000 (Table X-2, ADF&G 2002c:105). Additional research and outreach need to take place to assess these recent harvest data. The permit system in this management area might also be improved by adding documentation of rod and reel fishing as subsistence take method. This gear type is allowed for subsistence salmon
118

fishing under federal subsistence rules. Accounting of fish removed from commercial harvests needs to also occur for a full picture of home use salmon harvests in the Kodiak Management Area.
OTHER SUBSISTENCE FISHERIES There are no annual harvest assessment programs for the other subsistence finfish fisheries of the Kodiak Management Area.1 Harvest estimates based on systematic household surveys conducted by the Division of Subsistence are available for resident and marine species for multiple years for each Kodiak Island Borough community. These estimates can be found in the Community Profile Database (Scott et al. 2001). Fish harvested in the largest quantities and used by the most households include Pacific cod, lingcod, flounder, halibut, rockfish, and Dolly Varden. Subsistence permits are required for the harvest of king, Tanner, and Dungeness crab in the Kodiak Area (5 AAC 02.410). Regulations also establish size, bag and possession limits for each type of crab. Only male crab may be taken. In addition to crab, other marine invertebrates used for subsistence purposes in the Kodiak Area include, but are limited to, clams, cockles, mussels, chitons, octopus, and sea urchins. Future annual reports will summarize the subsistence harvest data for marine invertebrates based on permit programs and household surveys.
1 In May 2003, federal regulations authorizing subsistence harvests of halibut in Alaska were finalized. A harvest assessment program for subsistence halibut will be implemented in 2003.
119

Year Issued Returned Chinook Sockeye Coho Chum Pink Total1986 1,244 1,002 90 14,391 6,998 605 2,371 24,4551987 1,124 880 101 13,198 6,463 1,299 2,421 23,4821988 1,098 699 108 10,081 4,291 377 1,320 16,1771989 2,800 717 43 12,638 4,123 419 1,553 18,7761990 2,900 1,167 131 17,959 8,627 655 1,605 28,9771991 1,406 1,225 177 21,835 8,208 714 1,743 32,6771992 1,561 1,195 318 20,684 8,643 643 1,646 31,9341993 1,496 959 243 19,471 7,176 838 2,696 30,4241994 2,550 1,464 205 17,962 7,491 440 1,758 27,8561995 1,950 1,194 175 19,416 5,603 293 1,548 27,0351996 1,567 1,390 253 28,287 5,117 381 1,125 35,1631997 2,098 1,638 383 33,293 6,369 234 1,458 41,7371998 1,841 1,126 350 20,459 5,348 214 1,412 27,7831999 1,438 397 26,497 4,932 388 1,266 33,4802000 1,376 273 24,873 5,399 341 742 31,6282001 2,153 273 33,833 5,920 427 1,158 41,6112002 2,271 593 32,977 6,057 350 1,665 41,6421998-2002 Average 1,673 377 27,728 5,531 344 1,249 35,2291993-2002 Average 1,501 315 25,707 5,941 391 1,483 33,836All Years Average 1,288 242 21,638 6,280 507 1,617 30,285
SOURCE: Alaska Department of Fish and Game, Division of Subsistence, Alaska Subsistence Fisheries Database, Version 3.3.
Table X-1. Historic Subsistence Salmon Harvests, Kodiak Management Area, 1986 - 2002
Permits Reported Salmon Harvest
120

Community Issued ReturnedAfognak Island 2 0 61 0 0 0 61Akhiok 11 0 186 16 9 49 260Chiniak 27 6 361 242 17 10 636Karluk 5 2 295 10 0 10 317Kodiak (city) 1,715 270 24,772 3,374 142 932 29,490Larsen Bay 24 162 431 31 0 4 628Old Harbor 40 6 792 1,063 110 535 2,506Ouzinkie 40 34 1,868 440 51 74 2,467Port Lions 47 33 2,447 702 1 25 3,208Uganik Bay 1 8 11 0 0 0 19
Subtotal, Kodiak Island Borough 1,912 521 31,224 5,878 330 1,639 39,592
Anchor Point 2 0 20 0 0 0 20Anchorage 149 57 738 121 3 22 941Bettles 1 0 0 0 0 0 0Big Lake 2 0 0 0 0 0 0Chickaloon 1 0 0 0 0 0 0Chignik Lagoon 1 0 0 0 0 0 0Chugiak 1 0 0 0 0 0 0Copper Center 1 0 0 0 0 0 0Cordova 4 0 0 0 0 0 0Craig 1 0 0 0 0 0 0Delta Junction 1 0 0 0 0 0 0Dutch Harbor 1 0 1 1 0 0 2Eagle River 15 1 45 1 6 0 53Elmendorf AFB 1 0 0 0 0 0 0Fairbanks 31 3 233 0 1 0 237Fort Wainwright 1 0 0 0 0 0 0Girdwood 3 0 0 0 0 0 0Glennallen 1 0 0 0 0 0 0Grayling 1 0 35 0 0 3 38Homer 22 0 251 2 1 0 254Indian 1 0 0 0 0 0 0Juneau 4 1 58 0 0 0 59Kasilof 4 7 28 0 2 0 37Kenai 12 1 20 21 7 0 49Ketchikan 1 0 0 0 0 0 0
continued
Table X-2. Reported Subsistence Salmon Harvests, Kodiak Area, by Community and Species, 2002
PermitsReported Salmon Harvest
Chinook Sockeye Coho Chum PinkTotal
Salmon
121

Community Issued ReturnedKing Salmon 1 0 0 0 0 0 0Nikiski 3 0 0 0 0 0 0Ninilchik 1 0 0 0 0 0 0North Pole 5 0 0 0 0 0 0Other USA 27 0 55 4 0 0 59Palmer 20 0 105 0 0 0 105Pedro Bay 1 0 0 0 0 0 0Seldovia 1 0 0 0 0 0 0Seward 3 0 0 0 0 0 0Sitka 3 0 0 0 0 0 0Soldotna 9 0 26 0 0 0 26Sterling 2 0 0 0 0 0 0Talkeetna 3 2 1 29 0 1 33Tok 1 0 0 0 0 0 0Valdez 2 0 50 0 0 0 50Wasilla 14 0 87 0 0 0 87Wrangell 1 0 0 0 0 0 0
Subtotal, Other 359 72 1,753 179 20 26 2,050
Totals 2,271 593 32,977 6,057 350 1,665 41,642
SOURCE: Alaska Department of Fish and Game, Division of Subsistence, Alaska Subsistence Fisheries Database, Version 3.3.
Table X-2. Reported Subsistence Salmon Harvests, Kodiak Area, by Community and Species, 2002 (continued)
PermitsReported Salmon Harvest
Chinook Sockeye Coho Chum PinkTotal
Salmon
122

Figure X-1. Composition of Kodiak Area Subsistence Salmon Harvest by Species, 2002
79.2%
14.5%
1.4%
4.0%
0.8%SockeyeChinookChumPinkCoho
N = 41,642 salmon; based on annual harvest assessment program with permits.
123

124

125
XI. COOK INLET AREA
INTRODUCTION Most of the waters of the Cook Inlet Management Area are within the Anchorage-MatSu-Kenai Nonsubsistence Area as established by the Joint Boards of Fisheries and Game (5 AAC 99.015(3)). Subsistence fisheries are not authorized within these nonsubsistence areas. Non-commercial harvesting opportunities are provided under sport and personal use fishing regulations. Harvest summaries for the personal use dip net and set net fisheries of the Kenai Peninsula can be found in annual management reports prepared by the ADF&G divisions of Sport Fish and Commercial Fisheries.
Waters outside the nonsubsistence area include the Tyonek Subdistrict and the western portion of the Susitna River drainage in Upper Cook Inlet, plus those waters north of Point Bede which are west of a line from the eastern most point of Jakolof Bay north of the westernmost point of Hesketh Island including Jakolof Bay and south of a line west of Hesketh Island and the waters south of Point Bede which are west of the easternmost point of Rocky Bay, which are in Lower Cook Inlet.
Communities within the areas outside the nonsubsistence zone include Skwentna (population 111 in 2000), Alexander (population 39 [in 1999] [ADLWD 2000]), Tyonek (population 193), Seldovia (population 430 in city and village CDP), Port Graham (population 171) and Nanwalek (English Bay) (population 177). The population of the entire Cook Inlet Area in 2000 was 369,296, including the Anchorage Municipality (population 260,283), the Kenai Peninsula Borough (49,691), and the Matanuska-Susitna Borough (59,322). This represents 58.9 percent of the state’s total population in 2000 (US Census Bureau 2001).
PORT GRAHAM AND KOYUKTOLIK SUBDISTRICTS History and Regulations A separate set of subsistence regulations for this subsistence setnet fishery was first established by the Alaska Board of Fisheries in 1980. The fishery is located along the southern shore of outer Kachemak Bay in the Port Graham and Koyuktolik subdistricts of the Southern District and, beginning in 2002, the Port Chatham and Wind Bay subdistricts. Two Alaska Native communities, Nanwalek and Port Graham, are located in the Port Graham Subdistrict. For detailed description of this subsistence fishery and other subsistence harvests and uses in Nanwalek and Port Graham, see Stanek (1985). The fishery opens April 1st and closes in the Port Chatham and Windy Bay subdistricts on August 1st, and in the Port Graham and Koyuktolik subdistricts on September 30th. There have been frequent emergency closures and openings during July when escapements of sockeye salmon into the English Bay River are being closely monitored to achieve minimum escapement goals. Throughout the season two 48-hour openings occur each week. The area open to subsistence set netting includes the entire shoreline of the subdistrict to a regulatory marker near the head of Port Graham Bay. There are no season or household bag or possession limits. The
126
three primary species harvested include sockeye, pink, and coho salmon. The gear allowed includes set gillnets no longer than 35 fathoms, no deeper than 45 meshes, and no larger than a six-inch stretched mesh. A lead may be used on the shoreward end of the net.
Harvest Assessment Methods
Household permits are issued by the Department of Fish and Game, Division of Subsistence through cooperative agreements with the Port Graham and Nanwalek village councils prior to fishing. When permits are issued, a separate monthly catch calendar is also issued for recording daily household harvests. (Due to changes in personnel, there was a disruption in distribution of harvest calendars in Port Graham in 2002, and reported harvests for that community are likely minimum estimates.) Home use salmon harvests by the two communities occur with the use of setnet and rod and reel gear. While the recording of harvests in the setnet fishery is mandatory, it is not in the rod and reel fishery. Therefore, fishermen are asked to voluntarily record their rod and reel harvests. In order to accommodate the recording of harvests in both fisheries, the recording device has two pages, one for each gear type, and is issued separately from the permit. Local assistants hired by each village council collect the calendars periodically throughout the season. Dolly Varden harvests are also recorded on the calendars. (Future annual reports will summarize the Dolly Varden data.) The sockeye salmon run to the English Bay Lakes was severely depressed for much of the late 1980s and early 1990s, with returns failing to achieve the minimum escapement goal for nine consecutive years between 1985 and 1993. Returns in the late 1990s were enhanced as a result of a rehabilitation/enhancement project initiated by ADF&G and subsequently run by the Nanwalek Salmon Enhancement Project in association with the Chugach Regional Resources Commission (CRRC) and the village of Nanwalek (Hammarstrom and Dickson 2003:62). In-season escapement monitoring has taken place since 1994, and openings and closures in the subsistence and commercial fisheries controlled by emergency order.
Harvest Estimates
A strong return of 30,000 sockeye salmon was forecast for the English Bay lakes in 2002. The strong run allowed the subsistence fishery to continue with regular openings until the regulatory closing date of September 30 (Hammarstrom and Dickson 2002:62). In 2002, subsistence salmon harvests in the Port Graham and Koyuktolik subdistricts totaled 14,342 salmon, including both set net and rod and reel harvests (Table XI-1). This is, by far, the highest subsistence salmon harvest recorded for this fishery since the present harvest assessment program began in 1981. (The previous record of 9,313 salmon in 2000.) This was due to a strong return of sockeye salmon to the English Bay River, resulting in a record subsistence harvest of 10,620 sockeyes. In 2002, residents of Nanwalek, with 56 permits, harvested 13,361 salmon and residents of Port Graham, with 23 permits, took the balance of 981 salmon (Table XI-2). (As noted above, distribution of harvest calendars was disrupted in Port Graham, and this reported harvest is likely
127
well below the actual number.) Of the total harvest, sockeye salmon were by far the most numerous species (10,620 salmon; 74.0 percent), followed by pink (1,831 salmon; 12.8 percent), coho (1,057 salmon; 7.4 percent), chum (488 salmon; 3.4 percent), and chinook (346 salmon; 2.4 percent) (Fig. XI-1).
SELDOVIA SUBSISTENCE FISHERY History and Regulations
This is a subsistence set gillnet fishery that was established in the fall of 1995 by the Alaska Board of Fisheries. The fishery is located on the south side of Kachemak Bay in the vicinity of the community of Seldovia in the Southern District of the Lower Cook Inlet Area. The fishery targets chinook salmon runs passing through lower Cook Inlet and a separate enhanced chinook run returning to Seldovia Bay. Coho salmon are targeted in a fall fishery. The fishery operates in a split season with two parts, the first occurring from April 1 through May 30 and the second occurring during the first two weekends in August. In the early season fishing is allowed during two 48-hour periods each week, while in the late season fishing is continuous during the two-day weekends. There is a guideline harvest limit of 200 chinook salmon set for the early season and an annual possession limit of 20 chinook per household. There are no seasonal limits for the other species. The area open to subsistence set gillnetting includes those waters along the eastern shore of Seldovia Bay as well as a short stretch outside Seldovia Bay proper to the west of Point Naskowhak. The gear allowed includes set gillnets no longer than 35 fathoms, no deeper that 45 meshes, and no larger than a six inch stretched mesh.
Harvest Assessment Methods
A household permit is issued by the Department of Fish and Game prior to fishing, and catches are recorded on the permit. Permits are also available from the harbormaster in Seldovia. Fishermen are required to call in daily to report their catch to ADF&G and return their permit after each of the two segments of the season. ADF&G sends reminder letters to permit holders if harvest records have not been returned in a timely manner, and phone calls are also made to enhance permit returns. ADF&G considers the harvest data for this fishery to be very reliable. The 2002 Season There were 20 permits issued for the Seldovia subsistence fishery in 2002. All the permits were returned to the Department as required by regulation (100 percent). The total harvest was 124 chinook salmon, 234 sockeyes, 13 coho, 11 chum, and 31 pink (Table XI-3). All of the permits were issued to residents of Seldovia. The 1998, 1999, 2000, 2001, and 2002 harvests increased from the first two years of the fishery, and this increase can be attributed to the longer season for the fourth straight year. Beginning with the 1998 season, the Board of Fisheries lengthened the season by 10 days in May. The

128
additional fishing time resulted in increased harvests of both chinook and sockeye salmon (Table XI-3).
TYONEK SUBDISTRICT History and Regulations A separate set of subsistence salmon fishing regulations was first established for the Tyonek Subdistrict by court order in 1980, and subsequently established permanently by the Alaska Board of Fisheries. This setnet fishery is located in the Tyonek Subdistrict of the Northern District of upper Cook Inlet. The subdistrict includes the area from one mile south of the mouth of the Chuitna River south to the eastern-most part of Granite Point and from the mean high tide to the mean lower low tide. The area is unique in that all the lands within the subdistrict are owned by the Tyonek Native Corporation. This feature often raises issues of trespass for those individuals living outside the Tyonek area who do not seek permission to land their boats or set their nets on the privately owned land. For a detailed discussion of this fishery and other subsistence uses at Tyonek, see Fall et al. (1984). The season in this subsistence fishery operates in two parts. The first part, which focuses on chinook salmon, opens May 15th and runs through June 15th with daily openings on Tuesdays, Thursdays, and Fridays. The second part opens on Saturdays from June 16th through October 15th. A 4,200 chinook salmon limit in set for the early season. If this limit is reached, the second season does not open until July 1st. In the more than 20 years of operation of this fishery, the chinook salmon limit has never been reached. Allowable gear for the Tyonek Subdistrict subsistence fishery includes set gillnets 10 fathoms in length, no deeper than 45 meshes, and a stretched mesh sized no larger than 6 inches. When fishing, permit holders are required to be present at the net site.
Harvest Assessment Methods
A household permit is issued by the Department of Fish and Game prior to fishing, and catches are recorded on the permit. Two separate permits are required, one for the early season and one for the late season. Permits are available in the Anchorage ADF&G office or in the Tyonek village office. Reported harvests are not expanded in this fishery. Because of the high compliance with the permit requirement and the strong assistance from the Tyonek village government, ADF&G views the harvest estimates for this fishery as very reliable. The 2002 Season In 2002, 101 subsistence permits were issued for the Tyonek District, including 81 permits issued to Tyonek residents (80.2 percent) and 20 permits issued to other Alaska residents (18.8 percent), mostly residents of Anchorage (9 permits) (Table XI-4). The total reported subsistence salmon harvest was 1,417 fish, with 1,080 chinook, 209 sockeye, 115 coho, and 4 chum. Residents of Tyonek accounted for 87.2 percent of the harvest total (1,235 salmon), including 87.8 percent of the chinook harvest (948 salmon). The total 2002 harvest was lower than the

129
long-term average for this fishery of 1,633 salmon, but was slightly above the recent five and ten-year averages (Table XI-5)
UPPER YENTNA RIVER FISH WHEEL FISHERY History and Regulations This is a subsistence fish wheel fishery that began in 1996 as a personal use fishery and was reclassified as a subsistence fishery by the Board of Fisheries beginning in 1998. It is located in the main stem of the Yentna River from its confluence with Martin Creek upstream to its confluence with the Skwentna River. The fishery occurs from July 15 through July 31. Fishing periods are from 4 a.m. to 8 p.m. Monday, Wednesday, and Friday. Legal gear includes a fish wheel with a live box. Permit holders must be present at the fish wheel while fishing. A season limit of 2,800 salmon is established for the fishery. Chinook salmon and rainbow trout must be returned alive to the water. Seasonal limits for households are 25 salmon for a head of household and 10 salmon for each dependent. Harvest Assessment Methods A permit issued by the ADF&G is required prior to fishing. Permits are available through the Division of Sport Fish office in Palmer. Permit holders must record their harvests on the permit and return it to the department. In the view of ADF&G, compliance with the permit requirement is high and harvest estimates for this fishery are very reliable.
Harvests in 2002 Twenty-five subsistence permits were issued for the Yentna River subsistence fish wheel fishery in 2002. All but three were returned to ADF&G (88.0 percent). In 2002, 10 of the 25 permit holders resided in the Skwentna area, with the remaining 15 permits held by residents of Anchorage (4 permits), Wasilla (three permits), Chugiak (three permits), Willow (2 permits), Big Lake (one permit), Lake Creek (one permit), and Palmer (one permit) (Table XI-6). The total harvest in 2002 was 632 salmon, including 454 sockeye (71.8 percent), 133 coho (21.0 percent), 31 chum (4.9 percent), and 14 pink (2.2 percent). (Chinook salmon may not be retained in this fishery.) The 2002 harvest was slightly higher than the five-year average (594 salmon), and also above the long-term average of 585 salmon (Table XI-7).

Year Issued Returned Chinook Sockeye Coho Chum Pink Total1981 57 138 2,670 825 177 874 4,6841982 61 124 2,354 1,493 220 2,932 7,1231983 46 67 2,480 471 95 187 3,3001984 24 45 3,262 510 6 673 4,4961985 24 146 1,177 621 26 345 2,3151986 44 125 647 481 14 1,062 2,3291987 55 21 901 914 114 714 2,6641988 48 104 1,021 844 110 1,756 3,8351989 44 51 157 1,155 74 1,495 2,9321990 60 265 1,162 1,417 151 2,960 5,9551991 63 163 688 2,053 221 4,587 7,7121992 71 200 535 1,150 236 1,421 3,5421993 56 277 1,148 913 257 2,663 5,2581994 70 300 830 1,370 504 1,979 4,9831995 87 585 1,795 538 376 1,273 4,5671996 75 310 1,744 939 276 749 4,0181997 26 202 325 203 153 511 1,3941998 19 169 289 243 240 459 1,4001999 74 485 3,157 1,747 1,104 2,023 8,5162000 67 259 4,664 1,831 953 1,606 9,3132001 49 133 1,085 1,295 228 1,454 4,1952002 79 346 10,620 1,057 488 1,831 14,3421998-2002 Average 58 278 3,963 1,235 603 1,475 7,5531993-2002 Average 60 307 2,566 1,014 458 1,455 5,799All Years Average 55 205 1,941 1,003 274 1,525 4,949
SOURCE: Alaska Department of Fish and Game, Division of Subsistence, Alaska Subsistence Fisheries Database, Version 3.3.
Table XI-1. Historic Subsistence Salmon Harvests: Port Graham/Koyuktolik Subdistricts, 1981 - 2002
Permits Reported Salmon Harvests
130
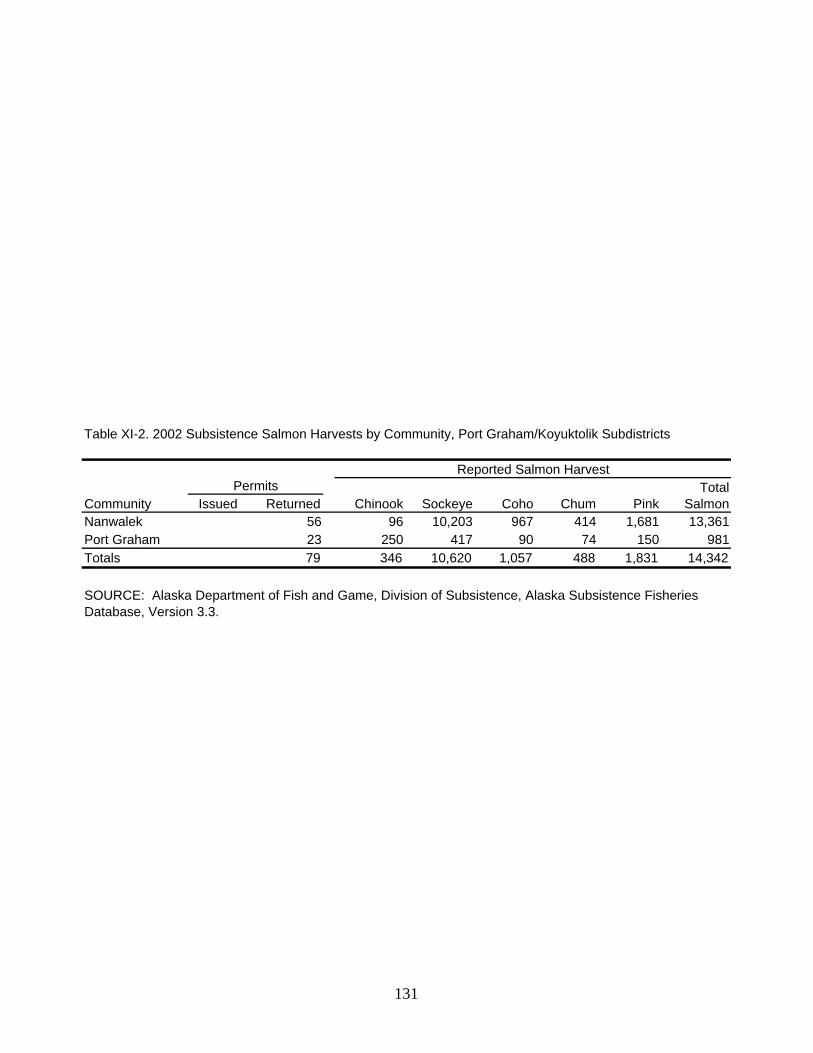
Community Issued ReturnedNanwalek 56 96 10,203 967 414 1,681 13,361Port Graham 23 250 417 90 74 150 981Totals 79 346 10,620 1,057 488 1,831 14,342
SOURCE: Alaska Department of Fish and Game, Division of Subsistence, Alaska Subsistence Fisheries Database, Version 3.3.
Table XI-2. 2002 Subsistence Salmon Harvests by Community, Port Graham/Koyuktolik Subdistricts
PermitsReported Salmon Harvest
Chinook Sockeye Coho Chum PinkTotal
Salmon
131

Year Issued Returned Chinook Sockeye Coho Chum Pink Total1996 43 42 51 9 0 0 0 601997 20 17 52 22 0 0 0 741998 22 20 143 65 0 8 0 2161999 16 16 136 130 0 38 0 3042000 22 22 179 252 0 16 0 4472001 19 16 149 142 0 0 0 2902002 20 20 124 234 13 11 31 4131998-2002 Average 20 19 146 165 3 15 6 334All Years Average 23 22 119 122 2 10 4 258
SOURCE: Alaska Department of Fish and Game, Division of Subsistence, Alaska Subsistence Fisheries Database, Version 3.3.
Table XI-3. Historic Subsistence Salmon Harvests: Seldovia Fishery, 1996 - 2002
Permits Estimated Salmon Harvest
132

Community Total Included Chinook Chum PinkAlexander Creek 2 2 0 0 0 0 0 0Anchorage 9 9 80 17 3 0 0 100Beluga 2 2 2 0 27 0 0 29Eagle River 3 3 0 0 0 0 0 0Sterling 1 1 50 3 0 0 0 53Tyonek 81 52 948 189 85 4 9 1,235Wasilla 2 2 0 0 0 0 0 0Unknown Community 1 0Totals 101 71 1,080 209 115 4 9 1,417
SOURCE: Alaska Department of Fish and Game, Division of Subsistence, Alaska Subsistence Fisheries Database, Version 3.3.
Table XI-4. Tyonek Subdistrict Subsistence Salmon Harvests by Community, 2002
PermitsReported Salmon Harvest
Sockeye CohoTotal
Salmon
133
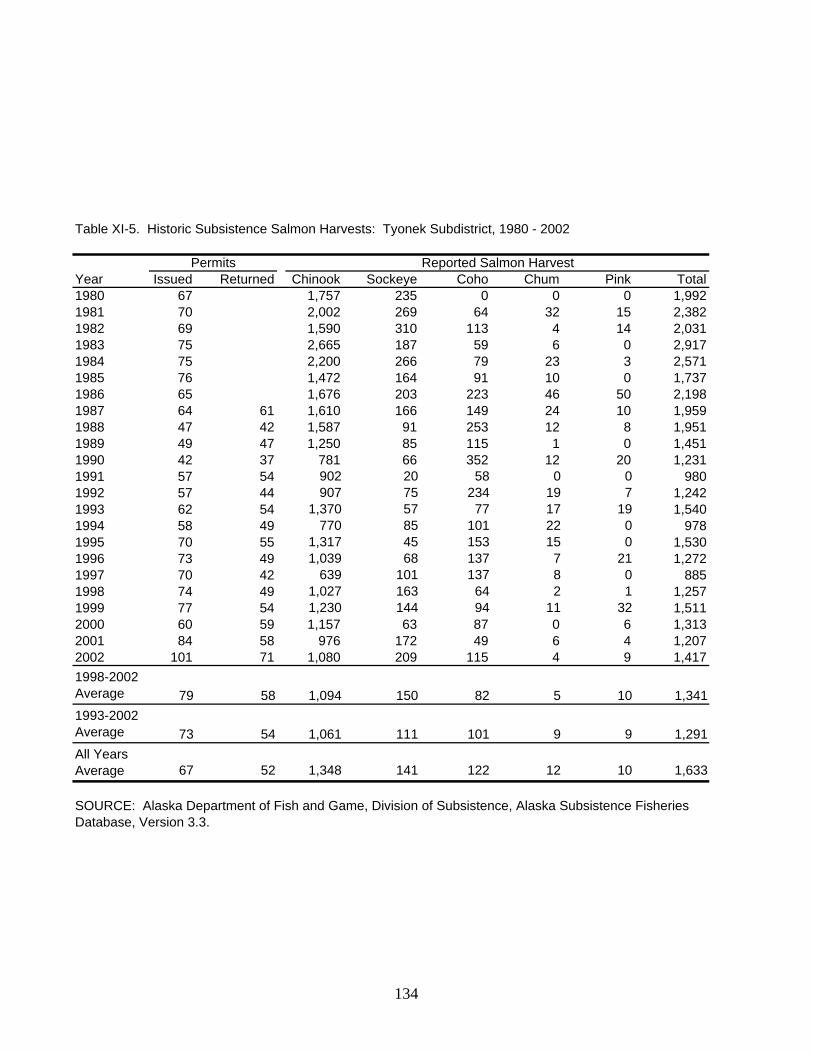
Year Issued Returned Chinook Sockeye Coho Chum Pink Total1980 67 1,757 235 0 0 0 1,9921981 70 2,002 269 64 32 15 2,3821982 69 1,590 310 113 4 14 2,0311983 75 2,665 187 59 6 0 2,9171984 75 2,200 266 79 23 3 2,5711985 76 1,472 164 91 10 0 1,7371986 65 1,676 203 223 46 50 2,1981987 64 61 1,610 166 149 24 10 1,9591988 47 42 1,587 91 253 12 8 1,9511989 49 47 1,250 85 115 1 0 1,4511990 42 37 781 66 352 12 20 1,2311991 57 54 902 20 58 0 0 9801992 57 44 907 75 234 19 7 1,2421993 62 54 1,370 57 77 17 19 1,5401994 58 49 770 85 101 22 0 9781995 70 55 1,317 45 153 15 0 1,5301996 73 49 1,039 68 137 7 21 1,2721997 70 42 639 101 137 8 0 8851998 74 49 1,027 163 64 2 1 1,2571999 77 54 1,230 144 94 11 32 1,5112000 60 59 1,157 63 87 0 6 1,3132001 84 58 976 172 49 6 4 1,2072002 101 71 1,080 209 115 4 9 1,4171998-2002 Average 79 58 1,094 150 82 5 10 1,3411993-2002 Average 73 54 1,061 111 101 9 9 1,291All Years Average 67 52 1,348 141 122 12 10 1,633
SOURCE: Alaska Department of Fish and Game, Division of Subsistence, Alaska Subsistence Fisheries Database, Version 3.3.
Table XI-5. Historic Subsistence Salmon Harvests: Tyonek Subdistrict, 1980 - 2002
Permits Reported Salmon Harvest
134

Community Total Included Chinook1 Chum PinkAnchorage 4 3 0 24 29 5 0 59Big Lake 1 1 0 40 3 2 0 45Chugiak 3 3 0 58 16 0 0 74Lake Creek 1 1 0 28 2 5 0 35Palmer 1 1 0 0 0 0 0 0Skwentna 10 9 0 242 46 13 3 304Wasilla 3 3 0 42 27 5 11 85Willow 2 1 0 20 10 0 0 30Totals 25 22 0 454 133 31 14 632
1 Regulations prohibit the retention of chinook salmon in this fishery (5 AAC 01.593).
SOURCE: Alaska Department of Fish and Game, Division of Subsistence, Alaska Subsistence Fisheries Database, Version 3.3.
Table XI-6. Subsistence Salmon Harvests, Upper Yentna River Fish Wheel Fishery by Community, 2002
PermitsEstimated Salmon Harvest
Sockeye CohoTotal
Salmon
135
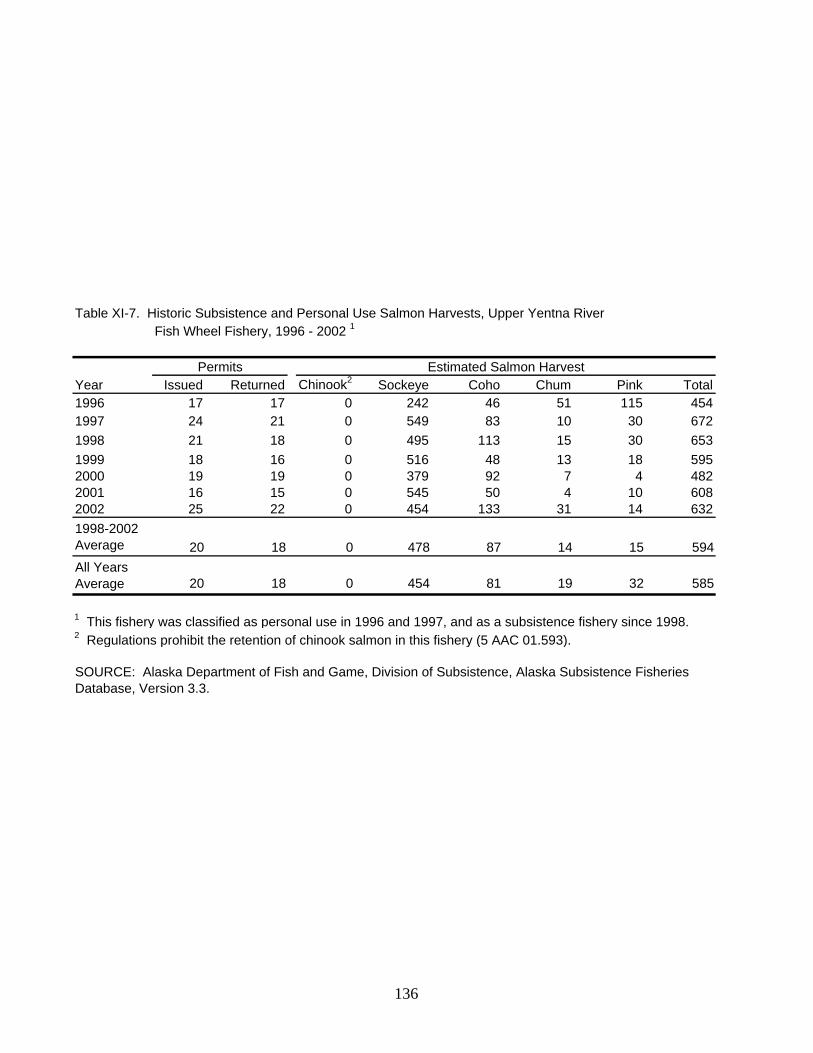
Fish Wheel Fishery, 1996 - 2002 1
Year Issued Returned Chinook2 Sockeye Coho Chum Pink Total1996 17 17 0 242 46 51 115 4541997 24 21 0 549 83 10 30 6721998 21 18 0 495 113 15 30 6531999 18 16 0 516 48 13 18 5952000 19 19 0 379 92 7 4 4822001 16 15 0 545 50 4 10 6082002 25 22 0 454 133 31 14 6321998-2002 Average 20 18 0 478 87 14 15 594All Years Average 20 18 0 454 81 19 32 585
1 This fishery was classified as personal use in 1996 and 1997, and as a subsistence fishery since 1998.2 Regulations prohibit the retention of chinook salmon in this fishery (5 AAC 01.593).
SOURCE: Alaska Department of Fish and Game, Division of Subsistence, Alaska Subsistence Fisheries Database, Version 3.3.
Table XI-7. Historic Subsistence and Personal Use Salmon Harvests, Upper Yentna River
Permits Estimated Salmon Harvest
136

137
Figure XI-1. Composition of Subsistence Salmon Harvest, Port Graham/Koyuktolik
Subdistricts, 2002
2.4%
74.0%
7.4%
3.4%
12.8%
ChinookSockeyeCohoChumPink
N = 14,342 salmon, based on annual harvest assessment program with harvest calendars.

138

139
XII: PRINCE WILLIAM SOUND AREA
INTRODUCTION The Prince William Sound Management Area includes all waters of Alaska between the longitude of Cape Fairfield and the longitude of Cape Suckling. In 2002, there were nine subsistence fisheries with annual harvest assessment programs in the Prince William Sound Management Area:
1. Upper Copper River: Glennallen Subdistrict, state permit system 2. Upper Copper River: Glennallen Subdistrict, federal permit system 3. Upper Copper River: Chitina Subdistrict, state permit system 4. Upper Copper River: Chitina Subdistrict, federal permit system 5. Batzulnetas Fishery 6. Copper River Flats / Prince William Sound 7. Prince William Sound: Eastern District / Tatitlek 8. Prince William Sound: Southwestern District / Chenega 9. Prince William Sound: General
Each of these fisheries will be discussed in turn. 2002 was the first year in which there were separate state and federal permit systems for the Glennallen and Chitina subdistricts. It should also be noted that the dip net fishery that takes place in the Chitina Subdistrict of the Upper Copper River District under state regulations was classified as a personal use fishery through 1999. The Alaska Board of Fisheries reclassified this fishery as a subsistence fishery beginning in 2000 and therefore it is discussed in this report. Historical data for this fishery, including years when it was classified as personal use, are included as well (but see footnote, below).
UPPER COPPER RIVER SUBSISTENCE FISHERY: GLENNALLEN SUBDISTRICT
Background and History The Upper Copper River District of the Prince William Sound Management Area consists of all waters of the mainstem Copper River from the mouth of the Slana River downstream to an east-west line crossing the Copper River approximately 200 yards upstream of Haley Creek as designated by ADF&G regulatory markers. There are two subdistricts:
1. The Chitina Subdistrict consists of all waters of the Upper Copper River District downstream of the downstream edge of the Chitina-McCarthy Road Bridge; and
2. The Glennallen Subdistrict consists of all remaining waters of the Upper Copper River District.
The Glennallen and Chitina subdistricts were established in 1977. Prior to that time, the Upper Copper River was treated as one unit for management purposes. For a detailed discussion of the history of these fisheries, see Simeone and Fall (1996).

140
Regulations In the Glennallen Subdistrict, permits are required to participate in subsistence fishing for salmon and freshwater fish species. ADF&G issues state permits under the authority of 5 AAC 01.630. Permits are issued on request at ADF&G offices. Beginning in 2002, the Federal Subsistence Board created a federal permit requirement for qualified rural residents (primarily residents of Copper River Basin and Upper Tanana communities). This permit system is administered by the National Park Service. While state subsistence permits limit fishers to one choice of gear (either fish wheel or dip net), federal permit holders may use fish wheels, dip nets, and rod and reel. Holders of state permits for the Glennallen subsistence may not also obtain a permit for the Chitina Subdistrict, but federally qualified rural resident households may hold permits for both subdistricts (as well as the Balzulnetas area), although seasonal limits for the subdistricts are not additive. Also, there is no prohibition against a federally-qualified rural resident household obtaining both a state and federal subsistence permit for these subdistricts, but again the seasonal limits for the two permits are not additive. Legal subsistence gear in the Glennallen Subdistrict under state regulations includes fish wheels and dip nets. Federal subsistence permit holders may also use rod and reel. The state season runs from June 1 through September 30; the federal season opens May 15 and also closes September 30. Annual limits are the same under state and federal regulations: 30 salmon for a household with one person, of which no more than five may be chinook salmon if taken with a dip net; 60 salmon for a household of two persons, with the same chinook limit for dipnetters; and 10 salmon for each additional person in the household, again with the chinook limit for dipnetters. Upon request, permits will be issued for additional salmon, with limits of 200 salmon for 1 person households and 500 for households of two or more persons. Dipnetters are still limited to 5 chinook per year. An additional federal rule is that in addition to the five chinook salmon limit for dipnetting, federal permit holders may take up to five chinook with rod and reel. Harvest Assessment Program Annual subsistence salmon harvest assessments have been conducted for Upper Copper River since 1960, originally by the Division of Commercial Fisheries, but currently by the Division of Sport Fish of ADF&G. Permits include harvest reports, and fishers are required to record the dates they fish and the number of each species harvested each day. Reminder letters are mailed to those permittees who do not return permits at the end of the season. Total harvest estimates for the fishery are made based on reported harvests expanded to all permit holders. Beginning in 2002, the National Park Service, on behalf of the Federal Subsistence Board, compiles the data from federal permit returns in a program separate from that administered by ADF&G. The creation of a dual permit system for subsistence fishing in the Upper Copper River creates challenges for the compilation of a single subsistence harvest estimate for this subsistence fishery, which is the goal of this annual report. Issues include the following:
1. As noted above, federal permits allow fishing with multiple gear types, including rod and reel, but state permits allow fishing with only one gear type--either dip net or fish wheel. Thus while past years' annual report summaries for the Glennallen Subdistrict

141
showed the number of permits issued by gear type, this is not possible for the combined state and federal data summaries reported here.
2. Some households obtain both state and federal permits for the Glennallen Subdistrict. Of these "dual-permitted" households, some report only on their state permits (not returning the federal permit), some report only on their federal permits (not returning the state permit), some report identical harvests on both permits, some report fishing on one permit but not the other, and some return neither permit. Controlling for double-counting of salmon requires making two assumptions: a) permittees returning only one permit did not harvest on the other, and b) permittees reporting identical harvests on both permits reported the same harvests twice rather than split their harvests between permits. [These assumptions were employed in the analysis only after discussing the dual-permitted households with the program administrators for ADF&G Division of Sport Fish and the National Park Service.] All households obtaining both state and federal permits were counted as receiving only one permit in the summary tables for the Glennallen Subdistrict included here.
3. State permits collect only the permit holder's mailing address city, but federal permits collect this and the "community of primary residence." Since the Copper River area has a number of smaller communities without their own post offices, state permits issued to residents of these communities do not provide adequate information to assure analysis results accurately reflect the true residence communities of harvesters. But because of the precision of the federal permit regarding place of residence, the federal permit place of residence data were used to compile the harvest tables, in combination with the mailing address data from state permits. Since there were several dual-permitted households in the Glennallen Subdistrict fishery, the federal residence community was used as the default where this information differed.
Under the provisions of 5 AAC 01.630(h), a village council or other similarly qualified organization, may obtain a permit to operate a fish wheel on behalf of its members upon approval of a harvest assessment plan submitted to ADF&G. These organizations may also issue household permits and register fish wheels. Table XII-1 summarizes data for the permits issued for village fish wheels by ADF&G in 1997, 1999, 2000, 2001, and 2002. Harvests for village fish wheels are also included in the subdistrict totals. Subsistence Salmon Harvests in 2002 As shown in Table XII-2, ADF&G issued a total of 1,121 subsistence salmon permits for the Glennallen Subdistrict for 2002. Of these, 662 were for using fish wheels and 459 were for using dip nets. In addition, 201 federal subsistence salmon permits for the Glennallen Subdistrict were issued for 2002 (these allow use of fish wheels, dip nets, or rod and reel). Because federally-qualified households could obtain both a state and federal permit, the analysis for this annual report identified households with two permits. In total, 1,308 households held subsistence salmon permits for the Glennallen Subdistrict for 2002. This is the total that is comparable with data on the number of permits issued in previous years (when households were limited to a single permit).

142
As reported in Table XII-3, the estimated total subsistence salmon harvest in the Glennallen Subdistrict in 2002 was 68,161 salmon, including 63,028 sockeye (92.5 percent), 4,446 chinook (6.5 percent), and 686 coho (1.0 percent). (There are no pink or chum salmon in the upper Copper River although 1 chum was reported harvested, as shown in Table XII-3.) The estimated subsistence salmon harvest in 2002 was down notably from the record estimated harvest in the Glennallen Subdistrict in 2001 of 86,601 salmon. Of the total harvest in 2002, 58,446 salmon were taken with fish wheels (85.7 percent), 9,694 salmon with dip nets (14.2 percent), and 22 with rod and reel (less than 0.1 percent) (Table XII-4). Table XII-5 reports subsistence salmon harvests in the Glennallen Subdistrict by place of residence of permit holders in 2002, while Table XII-6, Table XII-7, and Table XII-8 show harvests by community by gear type: fish wheel, dip net, or rod and reel, respectively. Copper Basin residents caught 38.3 percent of the harvest, including 43.4 percent of the fish wheel harvest but only 7.2 percent of the dip net harvest in the Glennallen Subdistrict (Table XII-3).
UPPER COPPER RIVER SUBSISTENCE FISHERY: THE CHITINA SUBDISTRICT
Background and History As noted above, the Chitina Subdistrict is one of two (along with the Glennallen Subdistrict) within the Upper Copper River District. It consists of all waters of the Upper Copper River District downstream of the downstream edge of the Chitina-McCarthy Road Bridge to an east-west line crossing the Copper River approximately 200 yards upstream of Haley Creek. The Glennallen and Chitina subdistricts were separated in 1977. Prior to that time, the Upper Copper River was treated as one unit for management purposes. In 1984 and from 1986 through 1999, the Chitina Subdistrict was closed to subsistence fishing, and the dip net fishery there operated as a personal use fishery. At its December 1999 meeting, the Alaska Board of Fisheries reversed its earlier decision and determined that the Chitina Subdistrict supported customary and traditional uses of salmon, changing the classification of the fishery back to subsistence.1 For a detailed discussion of the history of these fisheries, see Simeone and Fall (1996) and ADF&G 2002b. Regulations There are state and federal permit programs for the Chitina Subdistrict. Under state regulations, a household permit is required for subsistence fishing in the Chitina Subdistrict, issued by ADF&G. Households may not possess state subsistence permits for both the Glennallen and Chitina subdistricts in the same year. Under state rules, dip nets are the only legal gear in the Chitina Subdistrict. Annual limits are 15 salmon for a one-person household and 30 salmon for households with more than one person. Only one chinook salmon may be harvested annually. Households that achieve their annuals limits may obtain supplemental permits for 10 additional sockeye salmon if ADF&G determines that a weekly surplus of 50,000 salmon or more will be present in the subdistrict. Qualified Alaska rural residents may obtain federal subsistence
1 In February 2003, the Alaska Board of Fisheries reconsidered the classification of the Chitina dip net fishery, and reversed its decision of 1999, making a negative customary and traditional use finding and changing the fishery back to personal use. No other regulatory changes were made. Despite this shift back to the personal use category, future annual reports will continue to include harvest data for the Chitina Subdistrict.

143
permits for the Chitina Subdistrict from the National Park Service. Legal gear includes fish wheels, dip nets, and/or rod and reel. Federal seasonal limits for the Chitina Subdistrict are the same as for the Glennallen Subdistrict, but are not additive. Harvest Assessment Program Annual subsistence salmon harvest assessments have been conducted for Upper Copper River since 1960 by ADF&G, currently by the Division of Sport Fish. Chitina Subdistrict permits include harvest reports, and fishers are required to record the dates they fish and the number of each species harvested each day. Reminder letters are mailed to those permittees who do not return permits at the end of the season. Total harvest estimates for the Chitina Subdistrict are made based on reported harvests expanded to all permit holders. As noted above, qualified rural Alaska residents may obtain a federal subsistence permit for the Chitina Subdistrict in a program administered by the National Park Service. Subsistence Salmon Harvests in 2002 As reported in Table XII-9, the estimated total salmon harvest in the state-administered Chitina Subdistrict subsistence fishery in 2002 was 94,782 salmon, including 90,655 sockeye (95.6 percent), 2,093 chinook (2.2 percent), and 2,034 coho (2.1 percent), by 6,804 permit holders. (There are no pink or chum salmon in the upper Copper River.) An additional 883 salmon (835 sockeye [94.6 percent] and 48 chinook [5.4 percent]) were taken in the federal subsistence fishery, with 122 permit issued (Table XII-10), giving a total subsistence salmon harvest in the subdistrict in 2002 of 95,665 salmon. As reported in Table XII-9, the 2002 total harvest for the Chitina Subdistrict was well below the recent 10-year average of 122,087, and well below the record harvest levels of 1997 through 1999 and 2001, which ranged at around 150,000 salmon. Table XII-11 reports subsistence salmon harvests in the Chitina Subdistrict by place of residence of state permit holders in 2002; most participants in this fishery live in Fairbanks, Anchorage, or the Matanuska-Susitna Borough. Only 21 Copper Basin residents obtained state subsistence salmon permits for the Chitina Subdistrict in 2002. Table XII-12 reports subsistence harvests by place of residence, gear type, and species in the federal permit fishery in 2002. Of the estimated total of 883 salmon harvested in this fishery, 683 (77.3 percent) were taken with dip nets and 200 (22.7 percent) with fish wheels. There was no rod and reel harvest in this fishery.
BATZULNETAS SUBSISTENCE FISHERY The Batzulnetas subsistence salmon fishery includes all waters from the regulatory markers near the mouth of Tanada Creek and approximately on-half mile downstream from that mouth, and in Tanada Creek between ADF&G regulatory markers. The fishery may begin after June 1. Fishing periods during the month of June are one 48 hour period per week. Beginning in July fishing periods are 84-hours per week until September 1 when the fishery closes. This fishery was created in 1987 through an emergency regulation to settle the United States District Court case of John vs. Alaska.

144
Since 1987, subsistence permits have been issued in nine years (Table XII-13). In 2002, one permit was issued with a total reported harvest of 208 sockeye salmon. The long-term average harvest for this fishery is 123 sockeye salmon, with the highest harvest occurring in 1994 with a take of 997 sockeyes. Participants in this fishery are largely from the community of Mentasta.
COPPER RIVER DISTRICT SUBSISTENCE FISHERY Background and Regulations This fishery takes place in the Copper River District at the mouth of the Copper River (Copper River Flats) near the community of Cordova. Permits are required to participate in subsistence fishing for salmon and freshwater fish species under the authority of 5 AAC 01.630. Permits are issued on request at the ADF&G office in Cordova or they may be obtained by calling and requesting them by phone. Legal gear is set or drift gillnet. Annual limits are 15 salmon for a one person household; 30 salmon for a two person household; and 10 salmon for each additional person in the household. There is a limit of five king salmon per permit. Harvest Assessment Program A permit system with annual subsistence salmon harvest assessments has been in place for Prince William Sound at least since 1960. Permits are either dropped off at the Cordova ADF&G office or mailed in at the end of the fishing season. Permits include a harvest report, and fishers are required to fill in the dates fished and the number of each species of fish harvested caught each day. There is one version of the permit, but fishers need to declare whether they want to fish the Copper River Flats area or in Prince William Sound. An issued permit is only valid for one of these locations. Subsistence Salmon Harvests in 2002 As reported in Table XII-14, 355 permits were issued for this fishery in 2002, and 331 (87.3 percent) were returned. Both numbers were down from the record number of permits issued for this fishery in 2001. The estimated harvest was 3,910 salmon, including 3,289 sockeye (84.1 percent), 589 chinook (15.1 percent), 30 coho (0.8 percent), and 2 chum (<0.1 percent). Most permit holders lived in Cordova, although place of residence data are not presently available in the database. The 2002 harvest was the third highest on record, exceeded only by the 5,318 salmon harvest in 2000 and the 4,232 salmon harvest in 2001, and substantially above the recent 10-year average of 2,512 salmon.
EASTERN DISTRICT SUBSISTENCE SALMON FISHERY The present set of subsistence regulations the Eastern District of Prince William Sound has been in place since 1988. The primary participants in this fishery are residents of Tatitlek. Prior to 1992, permits were only issued in Tatitlek. Since 1992, they have also been issued at the ADF&G office in Cordova. Permits may be dropped off at the Cordova ADF&G office, the Tatitlek Village Council office, or mailed in at the end of the fishing season. Permits include a

145
harvest report, and fishers are required to fill in the dates fished and the number of each species of salmon caught each day. Legal gear for this fishery includes seines up to 50 fathoms in length and 100 meshes deep with a maximum mesh size of four inches, or gillnets up to 150 fathoms in length with a maximum size of six and one-quarter inches. Pink salmon may be taken in fresh water with dip nets. The season is May 15 through October 31, seven days per week before and after the commercial salmon season, and during commercial fishing openings. There are no bag or possession limits for this fishery. In 2002, 19 permits were issued for this fishery. Eight permits were returned. Because of the historically low permit return rate for this fishery, data in Table XII-15 are reported harvests only. The reported harvest for 2002 was 858 salmon, mostly sockeye (437; 50.9 percent) and coho (278; 32.4 percent). It is likely that the harvest assessment program for this fishery consistently underestimates harvests. As shown in Table XII-16, household surveys in Tatitlek for 1998 provided an estimate of 830 salmon taken with subsistence methods in 1998, compared to just 105 based on returned permits for that year. Rod and reel and removal from commercial harvests also provide salmon for home use in Tatitlek.
SOUTHWESTERN DISTRICT SUBSISTENCE SALMON FISHERY The present set of subsistence regulations the Southwestern District of Prince William Sound has been in place since 1988. For subsistence fishing purposes, the waters around Green Island are included in this area. The primary participants in this fishery are residents of Chenega Bay. Prior to 1992, permits were only issued in Chenega Bay. Since 1992, they have also been issued at the ADF&G office in Cordova. Permits may be dropped off at the Cordova ADF&G office, the Chenega Village Council office, or mailed in at the end of the fishing season. Permits include a harvest report, and fishers are required to fill in the dates fished and the number of each species of salmon caught each day. Legal gear for this fishery includes seines up to 50 fathoms in length and 100 meshes deep with a maximum mesh size of four inches, or gillnets up to 150 fathoms in length with a maximum size of six and one-quarter inches. Pink salmon may be taken in fresh water with dip nets. The season is May 15 through October 31, seven days per week before and after the commercial salmon season, and during commercial fishing openings. There are no bag or possession limits for this fishery. In 2002, 10 permits were issued for this fishery. Five permits were returned. Because permit return rates for this fishery have been low in the past, data in Table XII-17 are reported harvests only. The reported harvest for 2002 was 418 salmon, consisting of sockeye (142; 34.0 percent), coho (123; 29.4 percent), pink (83; 19.9 percent), chum (60; 14.4 percent), and chinook (10; 2.4 percent). Historically, sockeye have been the most abundant species in this fishery, but only 142 sockeyes were reported for 2002, compared to a long-term average of 245 sockeye salmon. It is likely that the harvest assessment program for this fishery consistently underestimates harvests. As shown in Table XII-18, household surveys in Chenega Bay for 1998 provide an estimate of 1,571 salmon taken with subsistence methods in 1998, compared to just 331 based on returned

146
permits for that same year. Rod and reel and removal from commercial harvests also provide salmon for home use in Chenega Bay.
PRINCE WILLIAM SOUND: GENERAL DISTRICTS Subsistence fishing for salmon in the other districts of the Prince William Sound Area (other than the Upper Copper River, Copper River, Eastern, and Southwestern districts) is open in conformance with commercial fishing regulations regarding gear, open areas, and open periods. Permits are required and may be obtained from the Cordova office of ADF&G. Annual limits are 15 salmon for a one person household; 30 salmon for a two person household; and 10 salmon for each additional person in the household. There is a limit of five king salmon per permit. Since the creation of separate regulations for the waters fished by Tatitlek and Chenega Bay residents in 1988, there has been very limited participation in this fishery. Since 1994, there has been only two years with any reported harvest. In 2002, 11 permits were issued and 9 were returned. The estimated harvest was 57 salmon, mostly sockeye (38 fish; 66.7 percent) (Table XII-19).
OTHER SUBSISTENCE FISHERIES IN THE PRINCE WILLIAM SOUND AREA In 2002, there were no harvest assessment programs for other subsistence finfish fisheries in the Prince William Sound Area. In the upper Copper River watershed, resident species such as grayling, burbot, and whitefish, among other species, are harvested for home use. Harvest estimates based on household surveys are available in the Community Profile Database (Scott et al. 2001). Residents of Cordova, Chenega Bay, Tatitlek, Valdez, and Whittier take a variety of shellfish and marine finfish for subsistence use. Harvest estimates are available in the Community Profile Database (Scott et al 2001) based upon systematic household surveys.

Table XII-1. Subsistence Harvests by Village Fish Wheel Permit Holders, Glennallen Subdistrict
Year Village Sockeye Chinook Coho Steelhead Other Total Comments
2002 Chickaloon 91 912002 Chitina 0
2001 Chickaloon 120 20 0 0 0 1402001 Chistochina 1,203 4 0 0 0 1,2072001 Klut-Kaah 259 3 114 376
2000 Chickaloon 200 73 0 0 0 2732000 Chistochina 880 1 0 0 0 8812000 Kluti-Kaah 110 20 0 0 0 130
1999 Gakona 0 did not fish1999 Chickaloon 5 1 61999 Kluti-Kah 85 46 131
1997 Kluti-Kah 61 12 731997 Gakona 1,242 8 1,2501997 Chistochina 342 105 139 88 1 675
Source: Tom Taube, ADF&G, Division of Sport Fish, Glennallen
147

Table XII-2. Number of State and Federal Subsistence Permits Issued and Number of Households Obtaining Permits by Subdistrict and Gear Type, 2002
Subdistrict State Permits2Federal Permits3 Total Permits
Total Households4
Glennallen1 All Gear 1,121 201 1,322 1,308Fish Wheel 662 NA NA NADip Net 459 NA NA NA
Chitina All Gear 6,804 122 6,926 7,048Dip Net 6,804 NA NA NA
Combined Subdistricts All Gear 7,925 323 8,248 NAFish Wheel 662 NA NA NADip Net 7,263 NA NA NA
1 State permits specify the gear type to be used, either fish wheel or dip net. Federal permits allow the use of fish wheels, dip nets, and/or rod and reel.2 Under state regulations, households may not hold a Glennallen and a Chitina Subdistrict permit.3 Separate federal permits are required for each subdistrict. Households qualified for federal subsistence permits may hold permits for both subdistricts.4 Number of households holding either a state and/or a federal permit. Households holding both afederal and a state permit, or permits for both subdistricts, are counted once. There were nodual (state and federal) permit holders for the Chitina Subdistrict
Gear Type
148

Table XII-3. Historic Subsistence Salmon Harvests: Glennallen Subdistrict
Year Issued Returned Chinook Sockeye Coho Chum Pink Total1988 420 264 1,082 33,294 465 0 0 34,8411989 386 360 796 28,724 67 0 0 29,5871990 406 384 639 32,219 91 0 0 32,9491991 712 645 1,314 39,364 241 0 0 40,9191992 655 619 1,440 45,115 345 0 0 46,9001993 773 696 1,443 54,003 76 0 0 55,5231994 970 776 1,979 69,143 71 0 0 71,1931995 858 726 1,968 54,336 975 0 0 57,2801996 850 788 1,483 52,269 552 0 0 54,3051997 1,136 1,058 2,608 83,692 183 0 0 86,4831998 1,010 951 1,846 64,876 553 0 0 67,2751999 1,102 1,040 3,234 76,456 1,145 0 0 80,8352000 1,251 1,197 4,937 60,551 539 5 0 66,0322001 1,239 1,176 3,480 81,960 1,142 20 0 86,6012002 1,308 1,162 4,446 63,028 686 1 0 68,1611998-2002 Average 1,182 1,105 3,589 69,374 813 5 0 73,7811993-2002 Average 1,050 957 2,743 66,031 592 3 0 69,369All Years Average 872 789 2,180 55,935 475 2 0 58,592
SOURCE: Alaska Department of Fish and Game, Division of Subsistence, Alaska Subsistence Fisheries Database, Version 3.3.1Starting in 2002, estimates include salmon harvested under federal as well as state subsistence fishing regulations and permits.
Permits Estimated Salmon Harvest1
149

Communities Issued % Harvest % Harvest % Harvest % Harvest %
Copper River Basin 407 31.1% 703 7.2% 25,369 43.4% 22 100.0% 26,093 38.3%Outside of Basin 901 68.9% 8,991 92.8% 33,077 56.6% 0 0.0% 42,068 61.7%
Total 1,308 100.0% 9,694 14.2% 58,446 85.7% 22 0.0% 68,161 100.0%
Rod and Reel1
Table XII-4. Subsistence Salmon Harvests, Glennallen Subsidistrict, by Area of Residence and Gear Type, 2002
SOURCE: Alaska Department of Fish and Game, Division of Subsistence, Alaska Fisheries Database, Version 3.31Percentages shown are of the "All Gear" harvest totals.
Permits Dip Nets1 Fishwheels1 All Gear
150

Table XII-5. 2002 Subsistence Salmon Harvests by Community, Glennallen Subdistrict -- All Gear
Community Issued ReturnedChistochina 1 1 1 1 0 0 0 2Chitina 29 19 72 2,569 14 0 0 2,654Copper Center 115 105 459 7,411 77 1 0 7,948Gakona 38 35 186 2,474 0 0 0 2,660Glennallen 123 115 456 6,494 173 0 0 7,123Gulkana 3 2 15 395 0 0 0 410Kenny Lake 28 23 230 2,139 18 0 0 2,387Lower Tonsina 4 3 44 605 15 0 0 664McCarthy 24 15 0 0 0 0 0 0Mentasta 1 1 1 11 0 0 0 12Nabesna Road 2 2 0 5 0 0 0 5Nelchina 2 2 23 117 0 0 0 140Paxson 1 1 2 23 0 0 0 25Slana 23 23 9 757 0 0 0 766Tazlina 11 9 165 1,132 0 0 0 1,297Tonsina 2 1 0 0 0 0 0 0
Copper Basin 407 357 0 1,662 24,134 297 1 0 26,093
Anchorage 370 310 926 14,671 254 0 0 15,850Anderson 1 1 0 55 0 0 0 55Barrow 2 1 0 230 0 0 0 230Big Lake 6 6 6 305 0 0 0 311Bird Creek 1 0 0Cantwell 1 1 0 0 0 0 0 0Central 1 1 0 0 0 0 0 0Chickaloon 1 1 0 91 0 0 0 91Chisana 1 1 4 73 0 0 0 77Chugiak 21 20 74 502 0 0 0 576Clear AFB 2 2 0 29 0 0 0 29Cooper Landing 1 1 1 198 0 0 0 199Cordova 1 1 10 403 0 0 0 413Delta Junction 22 17 36 1,042 0 0 0 1,078Denali Park 2 1 0 22 0 0 0 22Dillingham 1 1 0 0 0 0 0 0Dot Lake 2 2 5 35 0 0 0 40Eagle River 57 55 251 3,125 64 0 0 3,440Eielson AFB 2 2 0 8 0 0 0 8Ester 1 1 11 242 0 0 0 253
[continued]
PermitsEstimated Salmon Harvest
Chinook Sockeye Coho Chum PinkTotal
Salmon
151
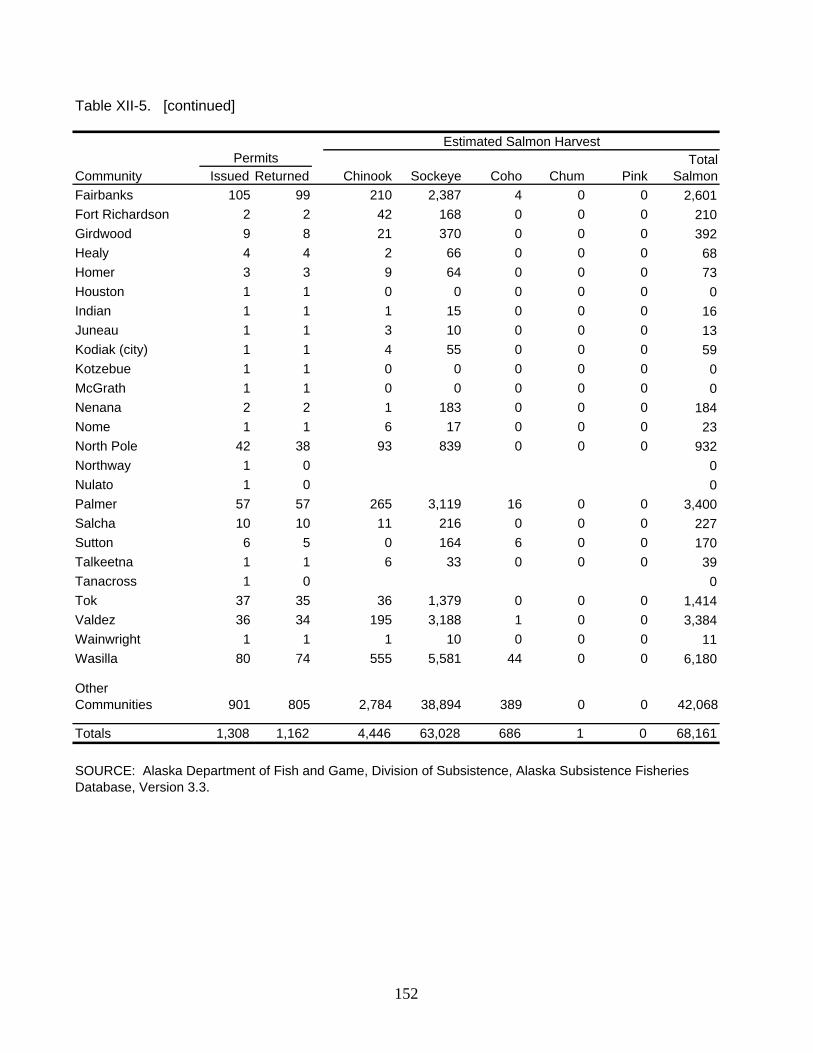
Table XII-5. [continued]
Community Issued ReturnedFairbanks 105 99 210 2,387 4 0 0 2,601Fort Richardson 2 2 42 168 0 0 0 210Girdwood 9 8 21 370 0 0 0 392Healy 4 4 2 66 0 0 0 68Homer 3 3 9 64 0 0 0 73Houston 1 1 0 0 0 0 0 0Indian 1 1 1 15 0 0 0 16Juneau 1 1 3 10 0 0 0 13Kodiak (city) 1 1 4 55 0 0 0 59Kotzebue 1 1 0 0 0 0 0 0McGrath 1 1 0 0 0 0 0 0Nenana 2 2 1 183 0 0 0 184Nome 1 1 6 17 0 0 0 23North Pole 42 38 93 839 0 0 0 932Northway 1 0 0Nulato 1 0 0Palmer 57 57 265 3,119 16 0 0 3,400Salcha 10 10 11 216 0 0 0 227Sutton 6 5 0 164 6 0 0 170Talkeetna 1 1 6 33 0 0 0 39Tanacross 1 0 0Tok 37 35 36 1,379 0 0 0 1,414Valdez 36 34 195 3,188 1 0 0 3,384Wainwright 1 1 1 10 0 0 0 11Wasilla 80 74 555 5,581 44 0 0 6,180
Other Communities 901 805 2,784 38,894 389 0 0 42,068
Totals 1,308 1,162 4,446 63,028 686 1 0 68,161
SOURCE: Alaska Department of Fish and Game, Division of Subsistence, Alaska Subsistence Fisheries Database, Version 3.3.
PermitsEstimated Salmon Harvest
Chinook Sockeye Coho Chum PinkTotal
Salmon
152

Table XII-6. 2002 Subsistence Salmon Harvests by Community: Glennallen Subdistrict - Fish Wheels
Community Issued1 Returned2 Chinook Sockeye Coho Chum Pink Total SalmonChistochina 1 1 1 1 0 0 0 2Chitina 29 17 72 2,569 14 0 0 2,654Copper Center 115 78 422 7,150 72 1 0 7,645Gakona 38 24 186 2,430 0 0 0 2,615Glennallen 123 94 455 6,443 173 0 0 7,071Gulkana 3 1 15 395 0 0 0 410Kenny Lake 28 14 220 1,908 18 0 0 2,146Lower Tonsina 4 2 37 555 15 0 0 607Mentasta 1 1 1 11 0 0 0 12Nabesna Road 2 1 0 5 0 0 0 5Nelchina 2 1 23 91 0 0 0 114Paxson 1 1 2 23 0 0 0 25Slana 23 21 9 757 0 0 0 766Tazlina 11 8 165 1,132 0 0 0 1,297
Copper Basin 381 264 1,607 23,468 292 1 0 25,369
Anchorage 370 110 658 10,145 138 0 0 10,941Anderson 1 1 0 55 0 0 0 55Barrow 2 1 0 230 0 0 0 230Big Lake 6 3 2 273 0 0 0 275Chickaloon 1 1 0 91 0 0 0 91Chisana 1 1 4 73 0 0 0 77Chugiak 21 8 63 384 0 0 0 447Clear AFB 2 1 0 29 0 0 0 29Cooper Landing 1 1 1 198 0 0 0 199Cordova 1 1 10 403 0 0 0 413Delta Junction 22 4 10 450 0 0 0 461Dot Lake 2 2 5 35 0 0 0 40Eagle River 57 35 237 2,925 64 0 0 3,226Ester 1 1 11 242 0 0 0 253Fairbanks 105 31 123 1,424 0 0 0 1,547Fort Richardson 2 1 42 103 0 0 0 145Healy 4 3 2 54 0 0 0 56Homer 3 2 7 36 0 0 0 43Indian 1 1 1 15 0 0 0 16Kodiak (city) 1 1 4 55 0 0 0 59Nenana 2 1 1 180 0 0 0 181Nome 1 1 6 17 0 0 0 23North Pole 42 15 76 430 0 0 0 506Palmer 57 34 252 2,826 16 0 0 3,094Salcha 10 1 2 71 0 0 0 73Sutton 6 1 0 164 0 0 0 164Talkeetna 1 1 6 33 0 0 0 39Tok 37 23 31 1,215 0 0 0 1,245Valdez 36 28 188 3,142 1 0 0 3,331Wainwright 1 1 1 10 0 0 0 11Wasilla 80 56 535 5,270 0 0 0 5,805
Other Communities 877 371 2,279 30,578 219 0 0 33,077
Total 1,258 635 3,887 54,046 512 1 0 58,446
Source: Alaska Department of Fish and Game, Division of Subsistence, Alaska Subsisence FisheriesDatabase, Version 3.3.
1All permits issued to communities reporting harvests or harvest attempts with fish wheels.2Returned permits indicating harvests or harvest attempts with fish wheels.
Permits Estimated Salmon Harvest
153

Table XII-7. 2002 Subsistence Salmon Harvests by Community -- Glennallen Subdistrict - Dip Nets
Community Issued1 Returned2 Chinook Sockeye Coho Chum Pink Total Salmon
Copper Center 115 6 15 262 4 0 0 281Gakona 38 3 0 45 0 0 0 45Glennallen 123 3 1 51 0 0 0 52Kenny Lake 28 5 10 231 0 0 0 241Lower Tonsina 4 2 7 51 0 0 0 57Nelchina 2 2 0 26 0 0 0 26
Copper Basin 310 21 33 666 4 0 0 703
Anchorage 370 114 267 4,526 116 0 0 4,909Big Lake 6 2 4 32 0 0 0 36Chugiak 21 6 11 117 0 0 0 129Delta Junction 22 12 26 591 0 0 0 617Denali Park 2 1 0 22 0 0 0 22Eagle River 57 8 13 200 0 0 0 213Eielson AFB 2 1 0 8 0 0 0 8Fairbanks 105 40 87 963 4 0 0 1,054Fort Richardson 2 1 0 65 0 0 0 65Girdwood 9 7 21 370 0 0 0 392Healy 4 1 0 12 0 0 0 12Homer 3 1 2 28 0 0 0 30Juneau 1 1 3 10 0 0 0 13Nenana 2 1 0 3 0 0 0 3North Pole 42 16 17 409 0 0 0 426Palmer 57 11 13 293 0 0 0 306Salcha 10 6 9 145 0 0 0 154Sutton 6 1 0 0 6 0 0 6Tok 37 4 5 164 0 0 0 169Valdez 36 2 6 47 0 0 0 53Wasilla 80 7 19 311 44 0 0 374
Other Communities 874 243 505 8,316 170 0 0 8,991
All Communities 1,184 264 538 8,982 174 0 0 9,694
Source: Alaska Department of Fish and Game, Division of Subsistence, Alaska Subsistence FisheriesDatabase, Version 3.3
1All permits issued to communities reporting harvests or harvest attempts with dip nets.2Returned permits indicating harvests or harvest attempts with dip nets.
Permits Estimated Salmon Harvest
154

Table XII-8. 2002 Subsistence Salmon Harvests by Community -- Glennallen Subdistrict - Rod and Reel
Community Issued1 Returned2 Chinook Sockeye Coho Chum Pink Total Salmon
Copper Center 115 1 22 0 0 0 0 22
Copper Basin 115 1 22 0 0 0 0 22
Other Communities 0 0 0 0 0 0 0 0
All Communities 115 1 22 0 0 0 0 22
Source: Alaska Department of Fish and Game, Division of Subsistence, Alaska Subsistence FisheriesDatabase, Version 3.3
1All permits issued to communities reporting harvests or harvest attempts with rod and reel gear.2Returned permits indicating harvests or harvest attempts with rod and reel gear.
Permits Estimated Salmon Harvest
155

Year Issued Returned Chinook Sockeye Coho Chum Pink Total1988 4,252 2,900 3,936 55,862 658 0 0 60,4551989 4,584 4,353 2,269 56,547 865 0 0 59,6811990 5,689 5,475 2,711 66,435 1,516 0 0 70,6621991 6,222 5,990 4,092 78,412 3,378 0 0 85,8821992 6,387 6,229 3,422 87,090 1,524 0 0 92,0361993 7,914 7,914 2,729 89,629 1,358 0 0 93,7161994 7,060 5,939 4,198 106,163 2,204 0 0 112,5661995 6,762 5,442 5,617 94,494 5,861 0 0 105,9721996 7,196 6,962 3,607 95,645 3,404 0 0 102,6561997 9,086 8,919 5,470 149,020 160 0 0 154,6501998 10,002 9,751 6,746 137,530 2,156 0 0 146,4311999 9,941 9,607 5,964 142,682 2,199 0 0 150,8452000 8,145 7,676 3,219 109,370 3,758 0 0 116,3472001 9,458 8,356 3,171 137,047 2,687 0 0 142,9052002 2 6,804 5,736 2,093 90,655 2,034 0 0 94,782
1998-2002 Average 8,870 8,225 4,239 123,457 2,567 0 0 130,262
1993-2002 Average 8,237 7,630 4,281 115,223 2,582 0 0 122,087
All Years Average 7,300 6,750 3,950 99,772 2,251 0 0 105,972
SOURCE: Alaska Department of Fish and Game, Division of Subsistence, Alaska Subsistence Fisheries Database, Version 3.3.
1 Under state regulations, this fishery was classified as personal use from 1986 through 1999; in 2000, 2001, and 2002, it was classified as a subsistence fishery.
2 Does not include harvest with federal subsistence permits.
Table XII-9. Historic Subsistence and Personal Use Salmon Harvests: Chitina Subdistrict1
Permits Estimated Salmon Harvest
156

GEAR TYPE ISSUED1 RETURNED2
All Gear 122 90 48 835 0 0 0 883Dip Net 21 29 654 0 0 0 683Fishwheel 5 19 182 0 0 0 200Rod and Reel 0
SOURCE: Alaska Department of Fish and Game, Division of Subsistence, Alaska Subsistence Fisheries Database, Version 3.3.1Permit holders are allowed to use more than one gear type, so the number of permits issued is only reportable at the "All Gear" level.2At the "All Gear" level, the number of returned permits represents the total number returned from all issued permits, whether fished or not. At the individual gear type levels, the number of returned permits reflects only those that were fished using the respective gear types.
157
Table XII-10. 2002 Subsistence Salmon Harvests by Gear Type: Chitina Subdistrict Federal Permits
PERMITSESTIMATED SALMON HARVEST
CHINOOK SOCKEYE COHO CHUM PINKTOTAL
SALMON

Table XII-11. 2002 Subsistence Salmon Harvests by Community: Chitina Subdistrict (state permits only)
Community Issued ReturnedChitina 2 1 0 6 0 0 0 6Copper Center 6 3 0 38 0 0 0 38Glennallen 12 7 2 94 2 0 0 98Slana 1 1 0 3 0 0 0 3
Copper Basin 21 12 2 141 2 0 0 145
Akhiok 1 1 0 20 0 0 0 20Akiachak 1 1 0 4 0 0 0 4Anchorage 1,547 1,300 511 18,156 369 0 0 19,037Anderson 7 6 1 90 20 0 0 111Barrow 9 4 5 59 0 0 0 63Beaver 1 0Bethel 1 0Bettles 2 2 0 50 0 0 0 50Big Lake 34 26 14 366 7 0 0 386Buckland 1 1 0 0 0 0 0 0Cantwell 1 1 0 30 0 0 0 30Central 8 6 4 77 0 0 0 81Chickaloon 4 3 3 69 5 0 0 77Chicken 1 1 1 29 0 0 0 30Chugiak 106 93 44 1,491 68 0 0 1,603Clear AFB 2 2 1 47 0 0 0 48Cooper Landing 2 2 0 43 0 0 0 43Delta Junction 242 215 91 3,497 36 0 0 3,623Denali Park 5 4 1 4 6 0 0 11Dillingham 1 0Dutch Harbor 1 1 1 20 0 0 0 21Eagle River 301 270 90 3,759 57 0 0 3,906Eielson AFB 125 100 36 1,596 22 0 0 1,653Elmendorf AFB 21 20 7 228 0 0 0 234Ester 60 43 16 610 31 0 0 657Fairbanks 2,098 1,755 673 30,103 648 0 0 31,424Fort Richardson 19 12 10 217 0 0 0 226Fort Wainwright 112 82 33 1,407 16 0 0 1,456Fort Yukon 1 1 0 0 0 0 0 0Galena 3 1 3 60 0 0 0 63Gambell 1 0Girdwood 20 17 4 238 0 0 0 241Haines 1 0Healy 25 22 5 246 13 0 0 264Homer 4 4 2 16 0 0 0 18
[continued]
PermitsEstimated Salmon Harvest
Chinook Sockeye Coho Chum PinkTotal
Salmon
158

Table XII-11. [continued]
Community Issued ReturnedHouston 5 5 0 86 0 0 0 86Indian 2 2 1 7 2 0 0 10Juneau 3 2 3 83 0 0 0 86Kaktovik 1 1 1 24 0 0 0 25Kasilof 1 1 0 0 0 0 0 0Kenai 5 3 2 82 0 0 0 83Ketchikan 1 0King Cove 1 0Kodiak (city) 1 1 0 0 0 0 0 0Kotzebue 2 2 1 44 0 0 0 45Lake Minchumina 1 1 0 15 0 0 0 15Manley Hot Springs 1 1 0 30 0 0 0 30Mekoryuk 1 1 1 9 0 0 0 10Minto 1 1 0 15 0 0 0 15Nenana 24 19 10 488 6 0 0 504Nikiski 1 1 1 20 0 0 0 21Ninilchik 3 2 0 83 0 0 0 83Nome 3 3 0 3 0 0 0 3Nondalton 1 1 0 19 0 0 0 19North Pole 595 501 164 8,362 202 0 0 8,729Other USA 3 1 0 6 0 0 0 6Palmer 377 328 105 5,406 149 0 0 5,660Petersburg 1 1 0 0 0 0 0 0Point Hope 2 2 1 59 0 0 0 60Point Lay 1 1 1 9 0 0 0 10Salcha 43 37 9 460 63 0 0 532Selawik 1 0Seldovia 2 0Seward 8 6 5 96 0 0 0 101Shishmaref 2 1 0 20 0 0 0 20Sitka 1 1 0 0 0 0 0 0Soldotna 10 10 3 118 0 0 0 121Sterling 2 1 0 8 0 0 0 8Sutton 22 20 3 408 2 0 0 414Talkeetna 13 13 1 175 5 0 0 181Tok 18 17 1 232 0 0 0 233Trapper Creek 1 1 0 0 0 0 0 0Two Rivers 21 20 7 309 11 0 0 327Unknown Community 63 62 12 753 72 0 0 838Valdez 174 143 28 1,785 0 0 0 1,814
[continued]
PermitsEstimated Salmon Harvest
Chinook Sockeye Coho Chum PinkTotal
Salmon
159
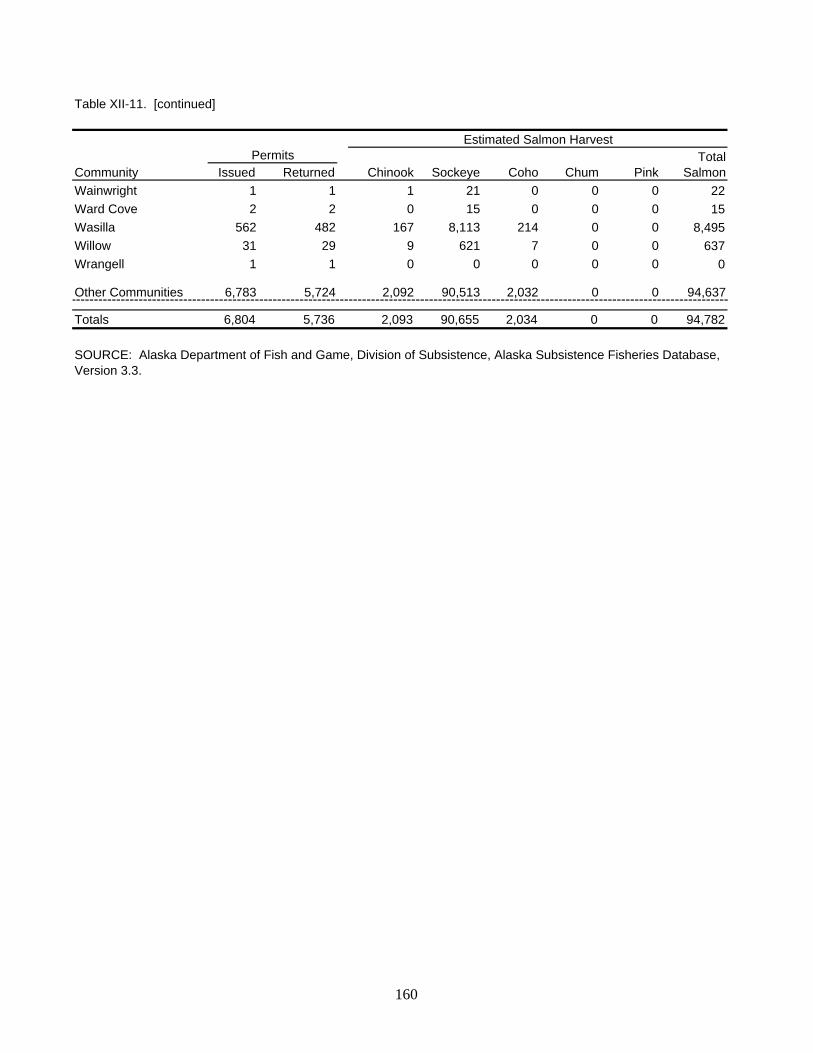
Table XII-11. [continued]
Community Issued ReturnedWainwright 1 1 1 21 0 0 0 22Ward Cove 2 2 0 15 0 0 0 15Wasilla 562 482 167 8,113 214 0 0 8,495Willow 31 29 9 621 7 0 0 637Wrangell 1 1 0 0 0 0 0 0
Other Communities 6,783 5,724 2,092 90,513 2,032 0 0 94,637
Totals 6,804 5,736 2,093 90,655 2,034 0 0 94,782
Estimated Salmon Harvest
Chinook Sockeye Coho Chum PinkTotal
Salmon
SOURCE: Alaska Department of Fish and Game, Division of Subsistence, Alaska Subsistence Fisheries Database, Version 3.3.
Permits
160

COMMUNITY GEAR TYPE ISSUED1 RETURNED2
All Gear 122 90 48 835 0 0 0 883 Dip Net 21 29 654 0 0 0 683 Fishwheel 5 19 182 0 0 0 200All Gear 18 12 35 219 0 0 0 254 Dip Net 2 18 38 0 0 0 56 Fishwheel 3 17 182 0 0 0 198
Copper Center All Gear 24 20 0 0 0 0 0 0Gakona All Gear 4 4 0 0 0 0 0 0
All Gear 16 12 4 32 0 0 0 36 Dip Net 4 4 32 0 0 0 36 Fishwheel 1 0 0 0 0 0 0All Gear 21 17 4 137 0 0 0 141 Dip Net 4 1 137 0 0 0 138 Fishwheel 1 2 0 0 0 0 2All Gear 3 2 0 75 0 0 0 75 Dip Net 1 0 75 0 0 0 75All Gear 30 19 5 349 0 0 0 354 Dip Net 8 5 349 0 0 0 354
Tazlina All Gear 3 1 0 0 0 0 0 0Tok All Gear 1 1 0 0 0 0 0 0
All Gear 2 2 1 23 0 0 0 24 Dip Net 2 1 23 0 0 0 24
161
Table XII-12. 2002 Subsistence Salmon Harvests by Community and Gear Type: Chitina Subdistrict Federal Permits
PERMITSESTIMATED SALMON HARVEST
CHINOOK SOCKEYE COHO CHUM PINKTOTAL
SALMONAll Communities
Chitina
Glennallen
Kenny Lake
1Permit holders are allowed to use more than one gear type, so the number of permits issued is only reportable at the "All Gear" level.2At the "All Gear" level, the number of returned permits represents the total number returned from all issued permits, whether fished or not. At the individual gear type levels, the number of returned permits reflects only those that were fished using the respective gear types.
Lower Tonsina
McCarthy
Tonsina
SOURCE: Alaska Department of Fish and Game, Division of Subsistence, Alaska Subsistence Fisheries Database, Version 3.3.

Year Issued Returned Chinook Sockeye Coho Chum Pink Total1987 8 8 0 22 0 0 0 221988 0 0 0 0 0 0 0 01989 0 0 0 0 0 0 0 01990 0 0 0 0 0 0 0 01991 0 0 0 0 0 0 0 01992 0 0 0 0 0 0 0 01993 1 1 0 160 0 0 0 1601994 4 4 0 997 0 0 0 9971995 4 2 0 32 0 0 0 321996 0 0 0 0 0 0 0 01997 0 0 0 0 0 0 0 01998 1 1 0 382 0 0 0 3821999 1 1 0 55 0 0 0 552000 1 1 0 55 0 0 0 552001 1 1 1 61 0 0 0 622002 1 1 0 208 0 0 0 2081998-2002 Average 1 1 0 152 0 0 0 1521993-2002 Average 1 1 0 195 0 0 0 195All Years Average 1 1 0 123 0 0 0 123
SOURCE: Alaska Department of Fish and Game, Division of Subsistence, Alaska Subsistence Fisheries Database, Version 3.3.
Table XII-13. Historic Subsistence Salmon Harvests, Batzulnetas Fishery, 1987 - 2002
Permits Estimated Salmon Harvest
162

Year Issued Returned Chinook Sockeye Coho Chum Pink Total1965 31 20 19 711 132 0 0 8621966 45 31 68 254 0 0 0 3221967 61 56 90 167 0 0 0 2571968 17 15 12 41 0 0 0 531969 49 33 24 94 126 0 0 2441970 32 27 78 212 0 0 0 2901971 29 26 11 36 4 0 0 511972 104 79 196 749 70 0 0 1,0151973 94 89 162 344 190 0 0 6961974 9 5 9 7 4 0 0 201975 2 2 0 5 0 0 0 51976 27 14 2 19 0 0 0 211977 23 22 10 74 0 0 0 851978 34 28 45 22 15 0 0 811979 49 41 54 31 20 0 0 1051980 39 35 21 30 19 0 0 701981 72 51 68 205 147 0 0 4191982 108 90 72 761 127 0 0 9601983 87 73 94 128 68 0 0 2901984 118 104 77 368 153 0 0 5981985 94 94 88 261 83 0 0 4321986 88 85 89 360 49 0 0 4981987 95 89 52 383 15 0 0 4501988 114 97 69 266 49 0 0 3841989 75 64 66 397 60 0 0 5231990 88 76 69 543 95 0 0 7071991 129 115 153 931 43 0 0 1,1261992 126 113 158 875 47 0 0 1,0801993 111 93 143 511 35 0 0 6891994 101 97 171 494 70 0 0 7341995 126 112 173 779 35 0 0 9871996 176 157 309 1,086 53 0 0 1,4481997 269 243 223 1,144 1,967 0 0 3,3331998 245 230 314 905 724 0 0 1,9441999 294 275 377 1,422 729 0 0 2,5282000 416 400 717 4,534 46 18 3 5,3182001 468 439 881 3,275 75 2 0 4,2322002 355 331 589 3,289 30 2 0 3,9101998-2002 Average 356 335 576 2,685 321 4 1 3,5871993-2002 Average 256 238 390 1,744 376 2 0 2,512All Years Average 116 104 151 677 139 1 0 968
SOURCE: Alaska Department of Fish and Game, Division of Subsistence, Alaska Subsistence Fisheries Database, Version 3.3.
Table XII-14. Historic Subsistence Salmon Harvests: Copper River District (Copper River Flats), 1965 - 2002
Permits Estimated Salmon Harvest
163

Year Issued Returned Chinook Sockeye Coho Chum Pink Total1988 17 2 210 249 297 143 9011989 14 1 107 653 43 28 8321990 13 0 5 241 4 10 2601991 19 0 107 984 28 320 1,4391992 15 2 441 369 49 30 8911993 18 2 512 305 74 144 1,0371994 14 0 50 143 70 50 3131995 15 01996 6 0 0 38 0 0 381997 6 0 107 45 54 0 2061998 11 0 2 71 28 4 1051999 17 0 344 541 31 31 9472000 12 3 0 140 468 40 40 6882001 14 9 0 114 230 12 60 4162002 19 8 6 437 278 66 71 8581998-2002 Average 15 7 1 207 318 35 41 6031993-2002 Average 13 5 1 190 235 42 44 512All Years Average 14 5 1 184 330 57 67 638
1 Defined as "those waters north of a line from Porcupine Point to Granite point, and south of a line fromPoint Lowe to Tongue Point" (5 AAC 01.648(b)). Prior to 1988, this area was included in the "general PrinceWilliam Sound Area" for purposes of subsistence salmon permits.
SOURCE: Alaska Department of Fish and Game, Division of Subsistence, Alaska Subsistence Fisheries Database, Version 3.3.
Table XII-15. Historic Subsistence Salmon Harvests, Eastern Prince William Sound, 1988 - 2002 1
Permits Reported Salmon Harvest
164

Table XII-16. Estimated Harvests of Salmon for Home Use, Tatitlek, 1998
Subsistence Methods Rod & Reel
Removed from Commercial
Harvests All Methods
Chinook 29 3 8 40Sockeye 472 46 83 601Coho 202 322 54 578Pink 110 25 0 135Chum 17 3 0 20
All Salmon 830 399 145 1,374
Estimated Number of Households Harvesting1
8 households 19 households 3 households 19 households (any method)
1 Number of households in the community = 27; 16 (59.3 percent) were interviewed
Source: Community Profile Database (Scott et al. 2001)
Estimated Number Harvested
165

Year Issued Returned Chinook Sockeye Coho Chum Pink Total1988 10 1 50 8 294 251 6041989 8 0 322 0 180 554 1,0561990 7 1 36 5 2 20 641991 12 3 345 42 53 195 6381992 14 1 526 23 99 313 9621993 22 2 835 50 124 232 1,2431994 16 5 192 77 161 402 8371995 10 2 152 67 41 67 3291996 7 0 107 7 46 105 2651997 5 44 193 30 272 110 6491998 4 13 114 20 119 65 3311999 14 57 499 62 101 168 8872000 12 8 24 39 229 143 211 6462001 16 9 2 119 92 146 95 4542002 10 5 10 142 123 60 83 4181998-2002 Average 11 7 21 183 105 114 124 5471993-2002 Average 12 7 16 239 76 121 154 606All Years Average 11 7 11 245 56 123 191 626
1 Defined as 'those waters of the Southwestern District, as described in 5 AAC 24.200, and along thenortrwestern shore of Green Island" (5 AAC 01.648(a)). Prior to 1988, this area was included in the "generalPrince William Sound Area" for purposes of subsistence salmon permits.
SOURCE: Alaska Department of Fish and Game, Division of Subsistence, Alaska Subsistence Fisheries Database, Version 3.3.
Table XII-17. Historic Subsistence Salmon Harvests, Southwestern Prince William Sound, 1988 - 2002 1
Permits Reported Salmon Harvest
166

Table XII-18. Estimated Harvests of Salmon for Home Use, Chenega Bay, 1998
Subsistence Methods Rod & Reel
Removed from Commercial
Harvests All Methods
Chinook 112 57 21 190Sockeye 409 41 87 537Coho 60 78 21 159Pink 391 112 140 643Chum 599 73 140 812Other/Unknown 0 45 0 45
All Salmon 1,571 406 409 2,386
Estimated Number of Households Harvesting1
14 households 8 households 4 households 17 households (any method)
1 Number of households in the community = 21; 15 (71.4 percent) were interviewed
Source: Community Profile Database (Scott et al. 2001)
Estimated Number Harvested
167

Year Issued Returned Chinook Sockeye Coho Chum Pink Total1960 50 1 139 505 27 1,292 1,9641961 12 3 41 123 3 732 9021962 9 0 0 119 142 214 4751963 9 0 0 406 24 298 7281964 15 0 11 0 0 900 9111965 22 16 0 0 0 34 246 2811966 3 3 0 3 19 50 20 921967 4 3 0 0 5 0 5 111968 4 3 0 0 27 0 208 2351969 7 3 0 0 37 0 0 371970 1 1 0 0 0 0 0 01971 3 2 0 0 0 0 69 691972 0 0 0 0 0 0 0 01973 19 16 0 0 343 0 0 3431974 3 1 0 0 0 0 0 01975 2 01976 0 0 0 0 0 0 0 01977 4 4 0 0 0 0 0 01978 3 2 0 0 0 0 0 01979 15 2 0 0 0 0 0 01980 26 15 0 12 10 0 0 231981 12 8 0 5 44 3 0 511982 35 27 0 109 5 31 40 1851983 26 21 0 27 45 98 11 1811984 8 8 0 10 0 2 11 231985 22 16 1 37 22 36 19 1161986 25 14 0 9 27 0 0 361987 18 17 5 33 6 17 0 611988 7 7 2 51 7 9 10 791989 11 7 0 0 0 5 0 51990 8 8 0 0 7 0 4 111991 9 5 0 4 0 0 0 41992 10 6 0 33 0 0 0 331993 6 6 1 104 10 0 0 1151994 5 4 0 0 0 0 0 01995 4 2 0 0 0 0 0 01996 10 7 0 0 0 0 0 01997 4 3 0 4 0 0 0 41998 4 3 0 0 0 0 0 01999 3 3 0 0 0 0 0 02000 3 3 0 0 0 0 0 02001 5 5 0 0 0 0 0 02002 11 9 0 38 0 9 11 571998-2002 Average 5 5 0 8 0 2 2 111993-2002 Average 6 5 0 15 1 1 1 18All Years Average 11 7 0 16 42 12 97 167
SOURCE: Alaska Department of Fish and Game, Division of Subsistence, Alaska Subsistence Fisheries Database, Version 3.3.
Table XII-19. Historic Subsistence Salmon Harvests, General Prince William Sound Area, 1960 - 2002
Permits Estimated Salmon Harvest
168

169
XIII. SOUTHEAST/YAKUTAT REGION
BACKGROUND
The Southeast/Yakutat Region includes all waters of Alaska between the latitude of Cape Muzon at the tip of Prince of Wales Island at Dixon Entrance to Cape Suckling on the Gulf of Alaska. It consists of six management areas for subsistence purposes, matching the commercial salmon and shellfish management areas: the Yakutat Area, the Haines Area, the Juneau Area, the Sitka Area, the Petersburg Area, the Wrangell Area, and the Ketchikan Area. Subsistence and personal use fisheries in each of these areas have annual harvest assessment programs based on a permit reporting system. All but the Yakutat Area have identified specific waters where subsistence or personal use fishing is permitted, with daily or annual limits, seasons, and gear type allowed.
The total population of Southeast Alaska in 2000 was 73,082 (U.S. Census 2000). By July 2002 the State Department of Labor estimates the total population of Southeast Alaska had dropped to 71,972. The Alaska Joint Board of Fisheries and Game has identified two nonsubsistence areas in Southeast Alaska - the Ketchikan Nonsubsistence Area and the Juneau Nonsubsistence Area (5 AAC99.015). Subsistence fisheries may not be authorized in nonsubsistence areas. Depending upon the district and section, non-commercial, non-recreational salmon fishing in Southeast Alaska occurs under either subsistence or personal use regulations. The Board of Fisheries bases the distinction on whether there has been a “customary and traditional use” determination.
HARVEST ASSESSMENT PROGRAM
The Division of Commercial Fisheries has been responsible for administering the subsistence/personal use salmon fisheries in Southeast Alaska. Area management biologists issue permits identifying fishing locations open, species, daily (and in some cases annual) possession limits, and other permit conditions, such as seasons, and gear. Area management biologists may use their discretion in changing these conditions, including emergency closures. Area management offices require that catch calendars on the permit be returned by mail or phone at the end of each season, and the information on the calendars is entered into Alexander: The Integrated Fisheries Database for Southeast Alaska and Yakutat, that includes all the harvest data from commercial fisheries as well. The Division of Commercial Fisheries maintains in the database the names and addresses of all those applying for subsistence/personal use permits, along with their catch record. Only one permit is issued per household, and permit holders and other household members authorized to fish this permit must be Alaska residents. Most permits for the region specify that a permit will not be issued to anyone who has failed to return a permit issued for the previous year. Generally, area management offices will accept a reported catch for the previous year at the time a person is applying for a current year permit. Sometimes this is done by phone.
Some of Southeast Alaska's sockeye salmon stocks have on-going biological monitoring or escapement programs. Aerial surveys and weir counts are available for some years and

170
locations. Some test fisheries done as part of the management of the commercial salmon fisheries, provide information for managers that may be reflected in the management of the subsistence and personal use fisheries. The permit conditions have been used as a conservative means of managing these fisheries, given the lack of biological data about the health of the several stocks.
The Division of Commercial Fisheries records the amounts of salmon reported on returned permits, but does not expand these numbers to permits not returned when entering the data into the Alexander database. The decision, by the Division of Commercial Fisheries, not to expand to unreturned permits stems from the uncertainty about whether those permits were fished. Also, since all permits issued in Southeast for subsistence fisheries, with the exception of the Yakutat Area, include daily or annual limits on amounts, permits returned with catch data have usually matched the limits. Information from other sources, notably the Division of Subsistence household harvest surveys, suggest that catches typically exceed limits for some communities and locations. Data on subsistence salmon harvests from the Alexander database therefore represent a minimum harvest estimate.
Data from the Alexander database were first added to the Alaska Subsistence Fisheries Database for the calendar year 2000, as part of the "Statewide Subsistence Fisheries Harvest Monitoring Strategy" project, funded by the U.S. Fish and Wildlife Service's Office of Subsistence Management. In order to achieve consistency, and to treat each fishery in a systematic manner, the same conventions used when entering data on subsistence harvests from other regions have been applied to Southeast subsistence salmon permit harvest data, namely expanding to account for unreturned permits.
There is concern that the permit system used in Southeast Alaska, with its limitations on daily possession and/or annual limits, opening and closing dates, and in some cases, gear restrictions, does not accommodate the traditional practices followed by Southeast salmon fishers. The permit conditions generally do not recognize local knowledge of the resource, or local practices of specialization in resource harvest activities and sharing among families and households. Typically, the Division of Subsistence' household harvest surveys in communities of Southeast have documented substantially higher salmon harvest levels than those reported on the subsistence salmon permits. Past surveys have not attempted to tie harvest numbers to specific fishing locations, however.
Fishers respond to the regulatory system governing the Southeast subsistence salmon fisheries in a variety of ways, including more than one permit application per household, using permits from several households when fishing in an attempt to comply with "proxy fishing" requirements, as understood at the local level, reporting of the amount of the limit on the permit when it is returned, rather than actual amounts harvested, and fishing without a permit, or at locations not listed on the permit. If one or more of these factors are in play, the resulting data provided to the Department may be considerably different from actual harvests.
As a part of the “Statewide Subsistence Fisheries Harvest Monitoring Strategy" project, post-season, subsistence salmon harvest surveys were conducted in three Southeast communities - Angoon, Kake and Hoonah covering harvests during the 2001 salmon fishing season. Lists of fishing households were developed using the Alexander database, and face-to-face, confidential

171
interviews were conducted in the fall and winter of 2001/02 with all, or a random sample of, households. The purpose was to compare individual household salmon harvest information from the survey with harvests reported on the returned permits, matching surveyed households directly with the permit reports. The face-to-face surveys collected information on the numbers, species, gear and location of salmon harvested, as well as number of persons in the household who fished, number of permits fished, and number of other households the respondent fished for. Confidentiality of information provided in the face-to-face interviews was assured, as is the custom on all Division of Subsistence household surveys. The comparative analysis of the results of these two methodologies has not been completed in time for inclusion in this year’s report. A report on this project will be forthcoming.
SUBSISTENCE SALMON HARVESTS IN 2002 – REGIONAL OVERVIEW
In 2002, the estimated subsistence/personal use salmon harvest for Southeast Alaska/Yakutat Region was 66,804 fish (Table XIII-1). This was below the amounts estimated for 2001 (68,080), and below recent five-year and ten-year averages (68,665 and 68,737 respectively). By species, sockeye comprised the biggest share at 56,379 (84.4 percent), followed by 3,210 pink (4.8 percent), 3,176 coho (4.8 percent), and 1,857 chinook (2.8 percent). Coho and chinook are under-represented in these estimates since there are no directed subsistence chinook fisheries in Southeast Alaska/Yakutat, and only one subsistence coho fishery (in Mitchell Bay near Angoon). Sockeye is the species targeted by Southeast Alaska subsistence/personal use fisheries and the other species reported are usually, but not exclusively, taken as by-catch to a sockeye harvest.
Subsistence salmon harvests for home use reported on the Subsistence /Personal Use Salmon Permits represents only a portion of the salmon harvested for home use by Southeast Alaska fishers. Additional quantities of chinook, coho, pink, and chum salmon are harvested using rod and reel gear, defined by statute as “sport” gear, and by removal from commercial catches.
Since responsibility for administering and managing subsistence fisheries has been with the Division of Commercial Fisheries, with each management area office responsible for waters and fisheries within the districts assigned, and with subsistence salmon/personal use permits issued for those waters and fisheries, harvests are reported and recorded by commercial fishing districts and statistical areas. In some cases, this has resulted in portions of a “customary and traditional” area, as originally identified by the Board of Fisheries, falling within the jurisdictions of two different management area offices. The Alexander database does not allow for grouping of subsistence salmon fisheries by C&T area. Under current state law, all Alaska residents are eligible to engage in subsistence (or personal use) fishing in all waters outside of the designated “nonsubsistence” areas.
To better understand the relative importance of each fishery to the communities that use them, it is important to look at the harvest record by location and by community of fishers. For the purposes of this report, harvests have been grouped by C&T area, and by primary community associated with each C&T area. Table XIII-1 shows the 2002 harvests by commercial salmon fishing districts. Table XIII-2 shows the 2002 harvests by subsistence fishing areas based on waters identified as having “customary and traditional” uses by the Board of Fisheries, and as discussed in this report. Table XIII-3 reports the 2002 harvest by community.

Table XIII-1. Subsistence and Personal Use Salmon Harvests by District and Species, Southeast/Yakutat Region, 2002 Permits Estimated Salmon Harvests
Fishing Location Name Issued Estimated Chinook Sockeye Coho Chum Pink Total
101 District 1 Ketchikan/Behm Canal 198 223 205 4,208 43 712 1,236 6,404
102 District 2 Clarence Strait/East Prince of Wales Island 59 67 0 727 30 7 342 1,106
103 District 3 Inside Waters/West Prince of Wales Island 189 236 1 7,190 41 266 43 7,542105 District 5 Sumner Strait 1 1 0 12 0 0 0 12
106 District 6 East Sumner Strait/North Frederick Sound 205 231 1 2,321 415 29 9 2,775
107 District 7 East Etolin Island/Wrangell Island/Ernest Sound 76 87 136 1,229 11 100 31 1,507
109 District 9 South Chatham Strait/West Frederick Sound 88 98 2 2,427 0 138 92 2,660
111 District 11 Juneau.Taku Inlet.Stephens Passage 229 328 19 4,089 96 31 87 4,322
112 District 12 Angoon/North Chatham Strait/East Chichagof 44 67 0 1,090 63 31 63 1,246
113 District 13 Sitka.Outer Baranof and Chichagof/Peril Strait 432 520 19 22,421 52 93 152 22,738
114 District 14 Icy Strait/Glacier Bay 15 27 0 115 4 191 159 468
115 District 15 Lynn Canal/Chilkat Inlet 326 355 96 6,258 630 571 839 8,394
182 Yakutat Forelands Yakutat Forelands 87 91 542 4,166 1,664 13 156 6,540
183 Yakutat Bay-Troll Yakutat Bay-Troll 33 35 835 126 127 0 0 1,088
Totals 1,857 56,379 3,176 2,183 3,210 66,804
Percent of Totals 2.8% 84.4% 4.8% 3.3% 4.8% 100.0%
Source: ADF&G Division of Subsistence, Alaska Subsistence Fisheries Database, Version 3.3
172

Table XIII-2. Southeast Alaska/Yakutat Region Subsistence and Personal Use Salmon Harvests by Fishing Areas Discused in Capter XIII, 2001 Permits Fished Estimated Harvest Total Reported Estimated Chinook Sockeye Coho Chum Pink Salmon
Yakutat Management Area
Yakutat Forelands & Yakutat Bay-Troll 120 126 1,376 4,292 1,791 13 156 7,629
Haines Management Area
Lynn Canal/Chilkat Inlet - District 15 Haines and Klukwan Subsistence Area 326 355 96 6,258 630 571 839 8,394
Juneau Management Area Juneau/Taku Inlet/Stephens Passage - District 11 229 328 20 4,089 96 31 87 4,322
Angoon/North Chatham Strait/East Chichagof - District 12 Angoon Subsistence Area District 12, Plus Portion Dist 13 - Sitkoh Bay
50 76 0 1,331 63 33 105 1,532
Icy Strait/Glacier Bay - District 14 Hoonah Subsistence Area District 14, Plus Portion District 13 - Surge Bay & Hoktaheen Cove
61 103 0 2,288 9 191 159 2,646
Sitka Management Area Sitka/Outer Baranof & Chichagof/Peril Strait - District 13 Except Surge Bay, Hoktaheen and Sitkoh Bay
380 434 19 20,007 47 92 110 20,275
Petersburg Management Area Petersburg Subsistence Area, Portion District 6 - Sumner Strait/ Pt. Baker/Macnamara, and Wrangell Narrows
95 99 1 1,271 415 29 9 1,725
East Etolin Island/Wrangell Island/Ernest Sound - District 7 Wrangell Subsistence Area - Districts 7 & 8
76 87 136 1,229 11 100 31 1,507
South Chatham Strait/West Frederick Sound - District 9 Kake Subsistence Area, Plus Portion District 5 (Shipley Bay)
89 99 2 2,439 0 138 92 2,672
Ketchikan Management Area
Ketchikan/Behm Canal - Ketchikan Personal Use Area - District 1 198 223 205 4,208 43 712 1,236 6,404
Clarence Strait/East Prince of Wales Island - District 2, Plus Portion District 6 Kasaan Subsistence Area - District 2 Plus Portion District 6 - Steamer Bay/Kindergarten/Quiet Harbor
169 199 0 1,776 30 7 342 2,155
Inside Waters/West Prince of Wales Island - District 3 Craig/Klawock.Hydaburg Subsistence Area
189 236 1 7,190 41 266 43 7,542
Totals 1,858 56,379 3,176 2,183 3,210 66,804 Source: ADF&G Division of Subsistence, Alaska Subsistence Fisheries Database, Version 3.3
173

174
Table XIII-3. 2002 Subsistence Harvests By Community: Southeast Alaska / Yakutat Region Estimated Salmon Harvest PERMITS COMMUNITY ISSUED RETURNED CHINOOK SOCKEYE COHO CHUM PINK
TOTAL SALMON
Angoon 91 58 0 1,178 63 33 105 1,379Auke Bay 26 18 0 116 6 2 0 124Coffman Cove 31 29 0 141 0 0 0 141Cordova 1 1 0 0 0 0 0 0Craig 179 147 0 2,111 18 197 129 2,456Douglas 48 34 0 408 11 9 0 428Edna Bay 2 2 0 0 0 0 0 0Elfin Cove 5 5 0 15 5 0 0 20Gustavus 13 10 0 132 0 1 1 135Haines 334 310 88 5,572 604 513 806 7,584Hollis 23 19 0 52 5 0 202 259Hoonah 141 71 0 1,579 4 191 159 1,933Hydaburg 47 34 0 796 0 0 0 796Juneau 578 408 30 5,406 113 60 90 5,699Kake 156 140 2 2,315 0 138 78 2,533Kasaan 15 15 0 351 0 0 0 351Ketchikan 378 333 205 4,970 49 694 1,219 7,137Klawock 175 134 1 3,705 24 76 20 3,826Klukwan 3 3 1 78 0 0 2 81Loring 2 2 0 0 0 0 0 0Metlakatla 6 6 0 20 0 0 0 20Meyers Chuck 1 1 0 0 0 0 0 0Naukati Bay 5 4 0 6 0 0 0 6Pelican 7 7 0 120 0 0 0 120Petersburg 115 111 1 1,149 385 13 9 1,557Point Baker 1 1 0 27 20 16 6 69Port Alexander 2 2 0 0 0 0 0 0Saxman 26 18 0 308 3 17 17 345Seward 1 1 0 8 0 0 0 8Sitka 563 497 22 19,312 64 86 121 19,605Skagway 8 6 0 265 0 28 25 318Tenakee Springs 3 3 3 25 1 0 0 29Thorne Bay 92 82 0 763 23 0 30 816Ward Cove 2 2 0 35 0 0 0 35Whale Pass 1 1 0 0 0 0 0 0Wrangell 111 96 136 1,282 11 100 31 1,561Yakutat 103 97 1,342 3,609 1,768 6 155 6,881Other Alaska Communities Anchorage 16 14 23 313 0 0 1 337Barrow 1 1 0 27 0 0 0 27Chugiak 1 0 Fairbanks 2 1 0 0 0 0 0 0Iliamna 1 0

175
Table XIII-3. 2002 Subsistence Harvests By Community: Southeast Alaska / Yakutat Region [continued] Estimated Salmon Harvest PERMITS COMMUNITY ISSUED RETURNED CHINOOK SOCKEYE COHO CHUM PINK
TOTAL SALMON
Kasilof 1 1 0 35 0 0 0 35King Cove 1 1 0 5 0 0 0 5Northway 1 1 0 35 0 0 0 35Tok 1 1 1 32 0 0 1 34Tuluksak 2 1 0 0 0 0 0 0Wasilla 3 3 0 77 0 1 2 80Willow 1 0
Totals 3,326 2,732 0 1,857 56,379 3,176 2,183 3,210 66,804
SOURCE: Alaska Department of Fish and Game, Division of Subsistence, Alaska Subsistence Fisheries Database, Version 3.3.
Since 1996 the number of salmon permits issued for Southeast Alaska/Yakutat Region has averaged 3,952 per year (Table XIII-4). Prior to 1996 the number of permits issued was not included in the database, and amounts harvested were based on amounts reported on permits returned. In 2002 3,326 permits were issued and 2,732 were returned region-wide, compared with 4,172 permits issued and 3,341 returned in 1996. Table XIII-4. Historic Subsistence and Personal Use Salmon Harvest: Southeast Alaska/ Yakutat Region Permits Estimated Salmon Harvest YEAR Issued Returned Chinook Sockeye Coho Chum Pink Total1985 1,271 19 20,006 360 2,951 2,136 25,4721986 1,354 29 21,974 277 2,840 971 26,0911987 1,322 34 25,405 117 3,878 1,474 30,9081988 1,013 94 19,898 97 3,013 1,145 24,2471989 1,479 580 32,860 1,381 3,113 3,664 41,5981990 1,543 524 36,376 1,615 3,433 3,529 45,4771991 1,554 262 37,765 766 3,271 1,741 43,8051992 1,860 614 53,131 4,939 3,201 2,942 64,8271993 2,121 537 56,249 3,515 2,583 2,143 65,0271994 2,239 800 57,097 3,607 4,211 3,639 69,3541995 2,005 1,203 45,087 3,702 3,370 3,215 56,5771996 4,172 3,341 1,170 69,216 3,090 5,553 3,204 82,2331997 4,211 3,529 780 58,782 2,701 4,515 4,080 70,8581998 4,273 3,629 1,082 62,551 3,264 6,442 3,910 77,2501999 4,308 3,717 1,393 56,618 1,933 5,557 3,280 68,7822000 3,771 3,170 1,359 52,867 2,151 3,414 2,619 62,4112001 3,605 3,116 1,457 55,157 3,266 3,968 4,230 68,0802002 3,326 2,732 1,857 56,379 3,176 2,183 3,210 66,8041998-2002 Average 3,857 3,273 1,429 56,715 2,758 4,313 3,450 68,6651996-2002 Average 3,952 2,960 1,164 57,000 3,041 4,180 3,353 68,737All Years Average 3,952 2,278 766 45,412 2,220 3,750 2,841 54,989SOURCE: Alaska Department of Fish and Game, Division of Subsistence, Alaska Subsistence Fisheries Database, Version 3.3.

176
YAKUTAT MANAGEMENT AREA
YAKUTAT SUBSISTENCE SALMON FISHERY
Yakutat Forelands and Yakutat Bay
Background and History
The Yakutat Management Area stretches from Cape Fairweather to Cape Suckling. "Customary and Traditional Use" determinations for salmon identify the freshwaters upstream from the terminus of streams and rivers from the Doame River in the south to the Tsiu River, and the waters of Yakutat Bay and Russell Fjord, and waters of Icy Bay (5AAC 01.666 (3)). The Yakutat Area is unique among Southeast areas in that subsistence salmon fishing locations are not restricted to just specific streams, nor is there a daily or annual limit on the number of fish harvested. Fishing usually occurs where sockeye runs are most productive (Figure XIII-1).
In 2000 the population of the City of Yakutat was 680 in 261 households.1 An estimated 53 percent of Yakutat households harvest salmon using subsistence gear, based on Yakutat Tribe of Alaska/Division of Subsistence household harvest surveys conducted in 2001 (Scott et al. 2001).
Regulations
A subsistence salmon permit for the Yakutat Management Area limits subsistence fishing in the hours before, during and after commercial salmon fishing openings. The 2002 permit form specifies that subsistence salmon may not be taken during the period 48 hours before a commercial opening until 48 hours after the closure of an open commercial salmon net fishing season. There is an exception in cases where the commercial salmon net fishery exceeds two days - in such cases the subsistence fishing period runs "from 6:00 am to 6:00 pm Saturday in those locations, except in the Tsiu River where the subsistence fishing period shall be from 6:00 am to 6:00 pm Sunday". This effectively limits the period when subsistence fishing can take place to 2-3 days a week during the commercial salmon fishing season. At the Situk River, subsistence fishers are required to attend their net at all times when it is being used to take salmon.
Other standard permit conditions include removal of dorsal fins, prohibition of fishing within 300 feet of a dam, fish ladder, weir, culvert or other artificial obstruction, completion of the catch calendar for each day fished, specifying location, species, and gear. Sport-taken and subsistence taken salmon may not be possessed on the same day. Since the State does not recognize rod and reel as "subsistence" gear, any salmon or steelhead taken with rod and reel gear, could not be
1 The Yakutat Borough included an additional population of 128 living in group quarters in Icy Bay in 2000
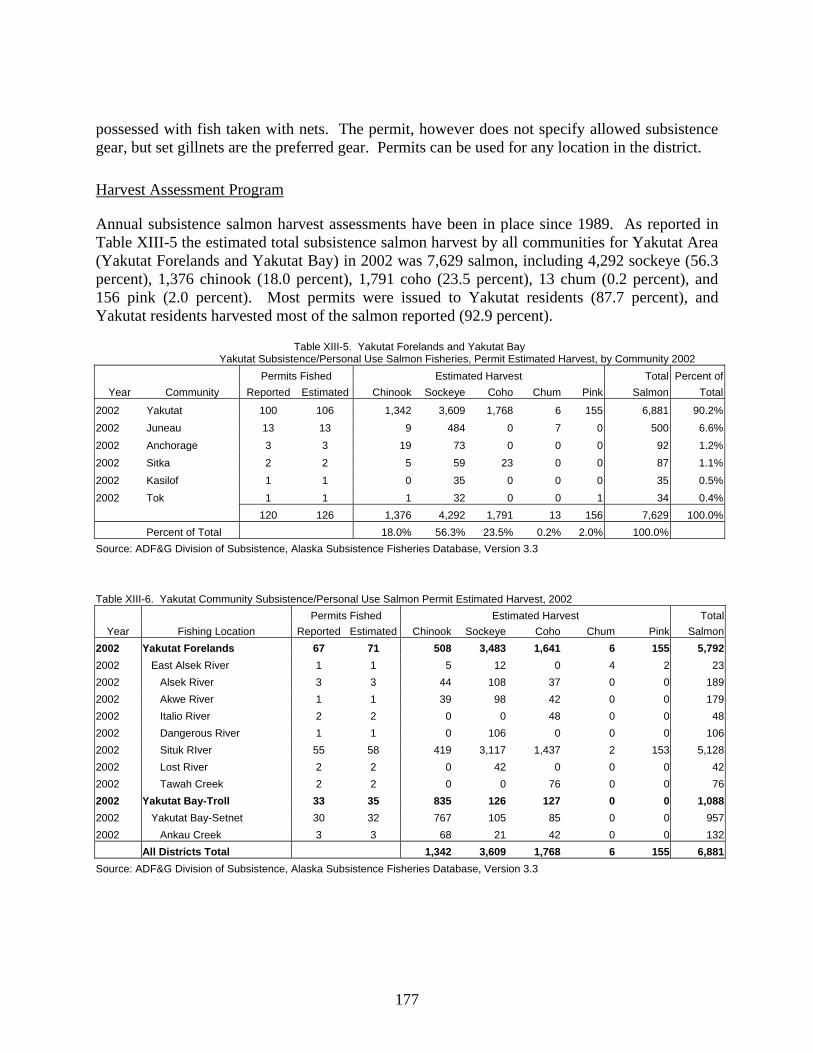
177
possessed with fish taken with nets. The permit, however does not specify allowed subsistence gear, but set gillnets are the preferred gear. Permits can be used for any location in the district.
Harvest Assessment Program
Annual subsistence salmon harvest assessments have been in place since 1989. As reported in Table XIII-5 the estimated total subsistence salmon harvest by all communities for Yakutat Area (Yakutat Forelands and Yakutat Bay) in 2002 was 7,629 salmon, including 4,292 sockeye (56.3 percent), 1,376 chinook (18.0 percent), 1,791 coho (23.5 percent), 13 chum (0.2 percent), and 156 pink (2.0 percent). Most permits were issued to Yakutat residents (87.7 percent), and Yakutat residents harvested most of the salmon reported (92.9 percent).
Table XIII-5. Yakutat Forelands and Yakutat Bay Yakutat Subsistence/Personal Use Salmon Fisheries, Permit Estimated Harvest, by Community 2002
Permits Fished Estimated Harvest Total Percent ofYear Community Reported Estimated Chinook Sockeye Coho Chum Pink Salmon Total
2002 Yakutat 100 106 1,342 3,609 1,768 6 155 6,881 90.2%2002 Juneau 13 13 9 484 0 7 0 500 6.6%2002 Anchorage 3 3 19 73 0 0 0 92 1.2%2002 Sitka 2 2 5 59 23 0 0 87 1.1%2002 Kasilof 1 1 0 35 0 0 0 35 0.5%2002 Tok 1 1 1 32 0 0 1 34 0.4% 120 126 1,376 4,292 1,791 13 156 7,629 100.0% Percent of Total 18.0% 56.3% 23.5% 0.2% 2.0% 100.0% Source: ADF&G Division of Subsistence, Alaska Subsistence Fisheries Database, Version 3.3
Table XIII-6. Yakutat Community Subsistence/Personal Use Salmon Permit Estimated Harvest, 2002 Permits Fished Estimated Harvest Total
Year Fishing Location Reported Estimated Chinook Sockeye Coho Chum Pink Salmon2002 Yakutat Forelands 67 71 508 3,483 1,641 6 155 5,7922002 East Alsek River 1 1 5 12 0 4 2 232002 Alsek River 3 3 44 108 37 0 0 1892002 Akwe River 1 1 39 98 42 0 0 1792002 Italio River 2 2 0 0 48 0 0 482002 Dangerous River 1 1 0 106 0 0 0 1062002 Situk RIver 55 58 419 3,117 1,437 2 153 5,1282002 Lost River 2 2 0 42 0 0 0 422002 Tawah Creek 2 2 0 0 76 0 0 762002 Yakutat Bay-Troll 33 35 835 126 127 0 0 1,0882002 Yakutat Bay-Setnet 30 32 767 105 85 0 0 9572002 Ankau Creek 3 3 68 21 42 0 0 132 All Districts Total 1,342 3,609 1,768 6 155 6,881Source: ADF&G Division of Subsistence, Alaska Subsistence Fisheries Database, Version 3.3

178
In 2002, all of the subsistence salmon harvests reported on the permits returned by Yakutat residents occurred in streams in Districts 182 and 183, and two locations - Situk River and Yakutat Bay - account for over 88.5 percent of the subsistence harvest by Yakutat residents. The East Alsek, Alsek, Akwe and Dangerous Rivers provided additional quantities of sockeye salmon. Additional quantities of chinook were harvested at Ankau Creek (Table XIII-6).
The overall numbers of king salmon harvested by residents of Yakutat in 2002, as estimated based on amounts reported on the permits, represent an all-time high since 1985, when records of subsistence salmon harvests in the Yakutat fishing areas have been included in the database. Sockeye reported in 2002 for Yakutat are the lowest since 1997. Coho and chum harvests reported on the 2002 permits returned are also below amounts reported in previous years. Estimated pink harvest in 2002 were slightly up over the past five years.
HAINES MANAGEMENT AREA
HAINES AND KLUKWAN SUBSISTENCE SALMON FISHERIES
Lynn Canal and Chilkat, Chilkoot and Lutak Inlets
Background and History
The Haines Management Area stretches from Little Island in Lynn Canal north to Chilkat Inlet and the waters of the Chilkat River, and up Chilkoot Inlet to Skagway. "Customary and Traditional Use" determinations for salmon identify all the waters of the Chilkat River and Chilkat Inlet north of the latitude of Glacier Point, and in the Chilkoot River, Lutak Inlet, and Chilkoot Inlet north of the latitude of Battery Point, excluding waters of Taiya Inlet north of the latitude of the tip of Taiya Point (5AAC 01.716 (2)) (Figure XIII-1).
There are two communities in the immediate area - the City of Haines and surrounding Borough (including the settlements at Covenant Life, Lutak, Mosquito Lake and Excursion Inlet) and Klukwan. At the head of Chilkoot Inlet is the town of Skagway. In 2000 the combined population of these communities was 3,393 in 1,435 households. Thirty-eight percent of Haines households and 55 percent of Klukwan households are estimated to use subsistence methods to harvest salmon for home use (ADFG Division of Subsistence, Community Profile Database, 2003). Today the populations of Haines and Skagway are predominantly non-Alaska Native, while Klukwan continues to have a predominantly Alaska Native population.

179
Figure XIII-1. ADF&G Salmon and Shellfish Fishery Statistical Areas, Southeastern Alaska, Chart No. 4

180
Regulations
A subsistence/personal use permit for the Haines Management Area provides for an open season for sockeye salmon in the Chilkat River, Chilkat Inlet and Lutak Inlet, and for pink and chum salmon in the Chilkat River and Chilkat Inlet both running from June 1 through September 30. Season limits for sockeye are specified at 25 per person, or 50 per household; and for pink and chum, 75 per person or 100 per household. Coho and chinook salmon, trout (such as steelhead) and char (Dolly Varden) may be taken only incidentally by gear operated under the terms of the permit. Fishers are requested to release uninjured chinook salmon "immediately in order to benefit rebuilding the Chilkat River stock. An additional permit may be issued upon request if more salmon are needed.
Sport taken and subsistence taken salmon may not be possessed on the same day. In the saltwater portions of Section 15-A, Lynn Canal including Chilkat, Chilkoot and Lutak inlets, subsistence salmon may not be taken during closed periods of the commercial salmon net fishery in Section 15-A, except that, on a Saturday before any period that the commercial salmon net fishery is open, salmon may be taken in saltwater areas of Section 15-A north of the latitude of Glacier Point and Chilkoot Inlet north of Battery Point, excluding the waters of Taiya Inlet north of the tip of Taiya Point.
Set gillnets may only be used in the mainstream and side channels, but not the tributaries, of the Chilkat River from four (4) mile Haines Highway to one mile upstream of Wells Bridge and may not exceed 50 feet in length. The permit holder is required to be physically present at the net while operating a set gill net, and a drift gillnet may not exceed 50 fathoms when operated in saltwater and 50 feet when used in freshwater areas. Other standard permit conditions include removal of dorsal fins, prohibition of fishing within 300 feet of a dam, fish ladder, weir, culvert or other artificial obstruction, and completion of the catch calendar for each day fished, specifying location, species, and gear.
Again, in 2002 the portion of Chilkat Inlet, from 1 mile south of Anchorage Point to just north of the Letnikof Cove boat ramp, was closed to subsistence salmon fishing from June 16 through July 15; and the Chilkat River mainstream and side channels from 4 mile Haines Highway to one mile upstream of Wells Bridge (except adjacent to Klukwan) was closed from June 24 through July 20. These closures were made to protect adult Chinook salmon returning to spawn in the Chilkat valley, and were conservation actions similar to those implemented in previous years.
Residents of Klukwan continue their traditional practice of using their setnets right at the village site, although some may also fish with drift gillnets in the open saltwaters of Chilkat and Lutak inlets.
Harvest Assessment Program
Annual subsistence salmon harvest assessments have been in place since 1985. As reported in Table XIII-7 the estimated salmon harvest in the Chilkat River, Chilkoot and Lutak inlets subsistence fisheries in 2002 was 8,394 salmon, including 6,258 sockeye (74.6 percent), 96

181
chinook (1.1 percent), 630 coho (7.5 percent), 571 chum (6.8 percent), and 839 pink (10.0 percent). Most permits were issued to Haines residents, and Haines residents harvested most of the salmon reported (90.3 percent). The database does not list Haines area fishers by residence location, so Klukwan fishers with post office box addresses in Haines are shown as Haines residents. Just three permits were issued to fishers listing Klukwan as their residence. In this report Haines and Klukwan permits and harvests are combined for 2002.
Table XIII-7. Lynn Canal/Chilkat Inlet - District 15 Haines & Klukwan Subsistence/Personal Use Salmon Fisheries, Permit Estimated Harvest, by Community
2002 Permits Fished Estimated Harvest Total Percent of
Year Community Reported Estimated Chinook Sockeye Coho Chum Pink Salmon Total2002 Haines* 303 326 88 5,572 604 513 806 7,584 90.3%2002 Juneau** 12 16 3 437 25 28 4 498 5.9%2002 Klukwan 3 3 1 78 0 0 2 81 1.0%2002 Skagway 2 3 0 15 0 28 25 68 0.8%2002 Anchorage 1 1 4 54 0 0 0 58 0.7%2002 Northway 1 1 0 35 0 0 0 35 0.4%2002 Wasilla 1 1 0 27 0 0 1 28 0.3%2002 Petersburg 1 1 0 21 0 0 0 21 0.3%2002 Ketchikan*** 1 1 0 9 0 1 1 11 0.1%2002 Gustavus 1 1 0 10 0 0 0 10 0.1%
326 355 96 6,258 630 571 839 8,394 100.0% Percent of Total 1.1% 74.6% 7.5% 6.8% 10.0% 100.0% * Includes Klukwan ** Includes Auke Bay and Douglas *** Includes Ward Cove Source: ADF&G Division of Subsistence, Alaska Subsistence Fisheries Database, Version 3.3
In 2002 most of the subsistence salmon harvests reported on the permits fished by Haines and Klukwan residents occurred in the waters of Chilkat Inlet, with the Chilkat River, Lutak Inlet and Chilkoot Inlet supplying most of the salmon harvested that year (Table XIII-8). Table XIII-8. Haines & Klukwan Community Subsistence/Personal Use Salmon Permit Estimated Harvest, 2002 Permits Fished Estimated Harvest Total
Year Fishing Location Reported Estimated Chinook Sockeye Coho Chum Pink Salmon2002 District 15 306 329 89 5,650 604 513 808 7,6652002 Chilkat Inlet 226 243 81 4,404 597 490 478 6,0502002 Lutak Inlet 48 52 1 686 8 11 208 9142002 Chilkoot Inlet 32 34 8 560 0 12 122 701 All Districts Total 89 5,650 604 513 808 7,665Source: ADF&G Division of Subsistence, Alaska Subsistence Fisheries Database, Version 3.3

Figure XIII-2. ADF&G Salmon and Shellfish Fishery Statistical Areas, Southeastern Alaska, Chart No. 3
182


183
The overall numbers of coho salmon harvested by residents of Haines and Klukwan in 2002, as estimated based on amounts reported on the permits, represent an all-time high since 1985, when records of subsistence salmon harvests in the Haines/Klukwan fishing areas have been included in the database. Pink salmon harvests estimated for 2002 for Haines/Klukwan are up to 1997 levels. Estimated chum harvests for 2002 are just above amounts reported in previous years. Estimated pink harvest in 2002 were slightly up over the past five years.
JUNEAU MANAGEMENT AREA
ANGOON SUBSISTENCE SALMON FISHERIES
Angoon/North Chatham/East Chichagof – District 12 Kootznahoo Inlet, Kanalku Bay, Mitchell Bay
Plus Sitkoh and Basket Bays in District 13
Background and History
Subsistence salmon fisheries in the waters traditionally used by the community of Angoon are under the management responsibility of the Division of Commercial Fisheries Juneau and Sitka Management Area offices. In 1989 the Alaska Board of Fisheries adopted a positive finding for the village of Angoon “customary and traditional use” of salmon in the waters of District 12 south of a line from Fishery Point to South Passage Point and north of the latitude of Point Caution, and in waters of Section 13-C east of the longitude of Point Elizabeth (5AAC 01.716(5)). Since 1990 any Alaska resident may harvest under the terms of a subsistence permit in those waters (Figure XIII-2).
The residents of the Village of Angoon are the principal subsistence users in this area. In 2000 Angoon had a population of 572 in 184 households. Forty-six percent of Angoon households are estimated to use subsistence methods to harvest salmon for home use (Scott et. al. 2001). Angoon Tlingit have traditionally used most of the west coast of Admiralty Island, from Hawk Inlet to the south tip of Admiralty, and lands and waters of the east coasts of Chichagof and Baranof Islands. Over the years the waters of Kootznahoo Inlet, with its maze of tidal passages between small islands, Favorite Bay and Hood Bay to the south, Mitchell Bay, Salt Lake, and

184
Kanalku bays further east, the deep waters of Chatham Strait have offered the people of Angoon rich salmon and other marine resources.
Regulations
A subsistence salmon permit for the Angoon area waters of District 12 provided for an open season for sockeye salmon in Kanalku, Basket (Kook Lake outlet), and Sitkoh bays from June 1 through July 31.1 The open period for subsistence coho salmon fishing on the Hasselborg/Salt Lake runs from August 1 through October 31. Pink salmon may be harvested in all streams of the District from July 1 through September 30, and the season for chum salmon in all streams of the District runs from July 1 through October 31. Possession limits for sockeye in 2002 were specified at 10 fish per individual or 20 per household at Basket Bay, 25 fish per individual and household at Kanalku and Hasselborg River/Salt Lake, and 10 fish at Sitkoh Bay. Season limits for pinks was 150 fish from any stream in the District, and for chums the limit was 50 fish. Coho salmon season limit at Hasselborg River/Salt Lake was 20 fish. This is the only subsistence coho fishery in Southeast Alaska.
Sport taken and subsistence taken salmon may not be possessed on the same day, and salmon taken under the subsistence/personal use regulations may not be subsequently used as bait for commercial fishing purposes. Gaffs, spears, beach seines, and dip nets are the types of subsistence gear allowed for general use in the Angoon area. Drift gillnets may only be used to take sockeye salmon and may not exceed 50 fathoms in length; set gillnets may not be used. Beach seines and gaffs only may be used to take coho salmon in Salt Lake. Snagging or fishing with a rod or reel is prohibited. Other standard permit conditions include removal of dorsal fins, prohibition of fishing within 300 feet of a dam, fish ladder, weir, culvert or other artificial obstruction, completion of the catch calendar for each day fished, specifying location, species, and gear.
Harvest Assessment Program
Annual subsistence salmon harvest assessments have been in place since 1985. As reported in Table XIII-9 the estimated salmon harvest in Angoon’s subsistence salmon fisheries in District 12 (Kootznahoo Inlet/Mitchell Bay, Chaik, and Hood Bay) and Sitkoh Bay (in District 13) in 2002 was 1,532 salmon, including 1,331 sockeye (86.9 percent), 63 coho (4.1 percent), 33 chum (2.2 percent) and 105 pink (6.9 percent). Most permits were issued to Angoon residents, and Angoon residents harvest most of the salmon reported (90.0 percent). In 2002 fishers from Juneau and Tenakee Springs also reported harvesting salmon in the Angoon area waters. In 2002 most of the subsistence salmon harvests reported on the permits fished by Angoon residents occurred in the waters of Kook Lake outlet (in Basket Bay) and Sitkoh Lake Creek, across Chatham Strait (Table XIII-10).
1 Sitkoh Bay-Lake Eva and Basket Bay (Kook Lake outlet) are listed on both the Juneau and Sitka Management Area permits.

185
Table XIII-9. Angoon/North Chatham Strait/East Chichagof - District 12, Plus Portion District 13 - Sitkoh Bay Angoon Subsistence/Personal Use Salmon Fisheries, Permit Estimated Harvest, by Community 2002
Permits Fished Estimated Harvest Total Percent ofYear Community Reported Estimated Chinook Sockeye Coho Chum Pink Salmon Total
2002 Angoon 41 64 0 1,178 63 33 105 1,379 90.0%2002 Elfin Cove 1 1 0 0 0 0 0 0 0.0%2002 Juneau** 7 10 0 138 0 0 0 138 9.0%2002 Tenakee Springs 1 1 0 15 0 0 0 15 1.0% 50 76 0 1,331 63 33 105 1,532 100.0% Percent of Total 0.0% 86.9% 4.1% 2.2% 6.9% 100.0% ** Includes Auke Bay and Douglas Source: ADF&G Division of Subsistence, Alaska Subsistence Fisheries Database, Version 3.3 Table XIII-10. Angoon Community Subsistence/Personal Use Salmon Permit Estimated Harvest, 2002 Permits Fished Estimated Harvest Total
Year Fishing Location Reported Estimated Chinook Sockeye Coho Chum Pink Salmon2002 District 12 35 55 0 937 63 31 63 1,0942002 Little Basket Bay 1 2 0 28 0 0 0 282002 Kook Lake Outlet 29 46 0 808 0 0 31 8392002 Hasselborg River 3 5 0 78 63 0 31 1732002 Kanalku Bay 1 2 0 22 0 0 0 222002 Favorite Creek 1 2 0 0 0 31 0 312002 District 13 6 9 0 242 0 2 42 2862002 Sitkoh Lake Creek 5 8 0 218 0 2 42 2622002 Sitkoh Bay Head 1 2 0 24 0 0 0 24 All Districts Total 0 1,178 63 33 105 1,379Source: ADF&G Division of Subsistence, Alaska Subsistence Fisheries Database, Version 3.3
The overall numbers of salmon harvested by residents of Angoon in 2002, as estimated based on amounts reported on the permits, are the lowest since 1995. Sockeye reported in 2002 are well below amounts estimated for 1996. Coho harvests reported on the 2002 permits returned from Angoon are well below normal, and pink and chum harvest estimates in 2002 were about average. Angoon fishers are not reporting chinooks on their returned permits.

186
JUNEAU MANAGEMENT AREA
HOONAH SUBSISTENCE SALMON FISHERIES
Icy Strait/Glacier Bay – District 14 Berg Bay, Neva Creek, and Excursion Inlet
and Surge Bay and Hoktaheen Cove in District 13,
Background and History
Subsistence salmon fisheries in the waters traditionally used by the community of Hoonah are under the management responsibility of the Division of Commercial Fisheries Juneau and Sitka Management Area offices. In 1989 the Alaska Board of Fisheries adopted a positive finding for the village of Hoonah “customary and traditional use” of salmon in the waters of District 12 in waters of Basket Bay inside a line from 57o30.83’N. lat., 134o53.20’ W. long., to 57o39.28’ N. lat., 134o53.88’ W. long., in District 13 in waters along the western shore of Yakobi Island east of a line from Cape Spencer Light to Surge Bay Light, and in waters of Section 14B and 14-C, (5AAC 01.716(4)). Since 1990 any Alaska resident may harvest under the terms of a subsistence permit in those waters (Figure XIII-2).
The residents of the Village of Hoonah are the principal subsistence users in this area. In 2000 Hoonah had a population of 860 in 300 households. Thirty-three percent of Hoonah households are estimated to use subsistence methods to harvest salmon for home use (Scott et al. 2001).
Regulations
The 2002 subsistence salmon permit for the Hoonah area waters provided for an open season for sockeye salmon in Surge Bay and Hoktaheen Cove from June 1 through July 20, and at Neva Creek, and all other subsistence sockeye fisheries in the area from June 1 through July 31. Individual and household possession limits for sockeye salmon from Surge Bay and Hoktaheen Cove were 50 fish (up from only 20 in 2001), for Neva Creek the limit was 25 fish annually per individual or household (up from just 10 fish in 2001). The season for pink salmon was July 1 through September 30, and the possession limit for pink salmon from all streams within the Hoonah-Angoon Subsistence Area was 150 per individual and per household. The subsistence season for chum salmon was July 1 through Oct 31, and the possession limit remained at 50 fish per individual and per household. There was an opening for subsistence coho salmon at the Hasselborg River (Salt Lake) at the head of Mitchell Bay near Angoon, 20/20 possession/annual limits), but no streams within the traditional waters of the Hoonah Tlingit were open to subsistence coho fishing.
Sport taken and subsistence taken salmon may not be possessed on the same day, and salmon taken under the subsistence/personal use regulations may not be subsequently used as bait for commercial fishing purposes. Gaffs, spears, beach seines, and dip nets are the types of

187
subsistence gear allowed for general use in the Angoon area. Drift gillnets may only be used to take sockeye salmon and may not exceed 50 fathoms in length; set gillnets may not be used. Beach seines and gaffs only may be used to take coho salmon in Salt Lake. Snagging or fishing with a rod or reel is prohibited. Other standard permit conditions include removal of dorsal fins, prohibition of fishing within 300 feet of a dam, fish ladder, weir, culvert or other artificial obstruction, completion of the catch calendar for each day fished, specifying location, species, and gear.
Harvest Assessment Program
Annual subsistence salmon harvest assessments have been in place since 1985. As reported in Table XIII-11 the estimated salmon harvest in the Hoonah area subsistence fisheries in 2002 was 2,646 salmon, including 2,288 sockeye (86.5 percent), 9 coho (0.3 percent), 191 chum (7.2 percent), and 159 pink (6.0 percent). Most permits were issued to Hoonah residents, and Hoonah residents harvest most of the salmon reported (67.4 percent). In 2002 a substantial number of permits were issued to fishers from Juneau, and Juneau’s estimated harvest amounted to 21.5 percent of the salmon harvested. In 2002 subsistence salmon harvests reported on the permits fished by Hoonah residents occurred in the waters of Neva Creek in Excursion Inlet, Whitestone Creek, Hoktaheen Cove, Surge Bay, Necker Bay Lake, and Klag Bay. Hoktaheen Cove was the principal source of Hoonah’s sockeye salmon in 2002 (Table XIII-12).
Table XIII-11. Icy Strait/Glacier Bay - District 14, Plus Portion District 13*Hoonah Subsistence/Personal Use Salmon Permit Estimated Harvest, by Community 2002
Permits Fished Estimated Harvest Total Percent ofYear Community Reported Estimated Chinook Sockeye Coho Chum Pink Salmon Total
2002 Hoonah 35 70 0 1,430 4 191 159 1,783 67.4%2002 Juneau** 14 20 0 568 0 0 0 568 21.5%2002 Gustavus 6 7 0 110 0 0 0 110 4.2%2002 Pelican 2 2 0 70 0 0 0 70 2.6%2002 Sitka 1 1 0 57 0 0 0 57 2.1%2002 Petersburg 1 1 0 38 0 0 0 38 1.4%2002 Elfin Cove 2 2 0 15 5 0 0 20 0.8%
61 103 0 2,288 9 191 159 2,646 100.0% Percent of Total 0.0% 86.5% 0.3% 7.2% 6.0% 100.0% *Surge Bay and Hoktaheen Cove ** Includes Auke Bay and Douglas Source: ADF&G Division of Subsistence, Alaska Subsistence Fisheries Database, Version 3.3
The overall numbers of salmon harvested by residents of Hoonah in 2002, as estimated from amounts reported on the permits, are well below past years. Estimated sockeye and pink harvests in 2002 were higher than in the past four years, but numbers of coho and chum were well below average. Hoonah fishers are not reporting chinook on their returned permits.

188
Table XIII-12. Hoonah Community Salmon Subsistence/Personal Use Salmon Permit Estimated Harvest, 2002 Permits Fished Estimated Harvest Total
Year Fishing Location Reported Estimated Chinook Sockeye Coho Chum Pink Salmon2002 District 11 2 4 0 50 0 0 0 502002 Sweetheart Creek 2 4 0 50 0 0 0 502002 District 13 27 52 0 1,450 0 0 0 1,4502002 Necker Bay Lake 1 1 0 50 0 0 0 502002 Fish Camp -Klag Bay 1 1 0 50 0 0 0 502002 Surge Bay 2 4 0 44 0 0 0 442002 Hokatheen Cove 23 46 0 1,307 0 0 0 1,3072002 District 14 10 20 0 79 4 191 159 4332002 Whitestone East Side 2 4 0 0 0 139 139 2782002 Game Creek 2 4 0 0 4 22 20 462002 Bear Ck Midway Rocks 1 2 0 0 0 30 0 302002 Neka River 1 2 0 30 0 0 0 302002 Neva Creek 4 8 0 50 0 0 0 50 All Districts Total 0 1,579 4 191 159 1,933Source: ADF&G Division of Subsistence, Alaska Subsistence Fisheries Database, Version 3.3
JUNEAU MANAGEMENT AREA
ELFIN COVE, GUSTAVUS, PELICAN, TENAKEE SPRINGS SUBISTENCE AND PERSONAL USE FISHING
Elfin Cove, Gustavus, Pelican, Tenakee Springs and Skagway residents also fished for salmon for home use in Districts 12, 13 and 14 waters traditionally used by Angoon and Hoonah. Tables XIII-13 through Table XIII-17 show harvest estimates for these five communities for 2002. In 2002 Elfin Cove subsistence salmon fishers harvested from Hoktaheen Cove. Gustavus fishers harvested salmon for home use primarily from Surge Bay and Hoktaheen Cove in District 13, but also from Taku River in District 11, Berg River in District 14, and Chilkat River in District 15. For Pelican and Tenakee Springs, located within the traditional use areas of Angoon and Hoonah, the closest salmon locations are Kook Creek and Kook Lake Outlet in Basket Bay, and Takanis Bay and Hoktaheen Cove in District 13.

189
Table XIII-13. Elfin Cove Community Subsistence/Personal Use Salmon Permit Estimated Harvest, 2002 Permits Fished Estimated Harvest Total
Year Fishing Location Reported Estimated Chinook Sockeye Coho Chum Pink Salmon2002 District 12 1 1 0 0 0 0 0 02002 Tenakee Creek 1 1 0 0 0 0 0 02002 District 13 2 2 0 15 5 0 0 202002 Hoktaheen Cove 2 2 0 15 5 0 0 20 All Districts Total 0 15 5 0 0 20Source: ADF&G Division of Subsistence, Alaska Subsistence Fisheries Database, Version 3.3 Table XIII-14. Gustavus Community Subsistence/Personal Use Salmon Permit Estimated Harvest, 2002 Permits Fished Estimated Harvest Total
Year Fishing Location Reported Estimated Chinook Sockeye Coho Chum Pink Salmon2002 District 11 1 1 0 12 0 1 1 152002 Taku River 1 1 0 12 0 1 1 152002 District 13 4 5 0 99 0 0 0 992002 Surge Bay 2 2 0 71 0 0 0 712002 Hoktaheen Cove 2 2 0 28 0 0 0 282002 District 14 2 2 0 11 0 0 0 112002 Berg River 2 2 0 11 0 0 0 112002 District 15 1 1 0 10 0 0 0 102002 Chilkat River 1 1 0 10 0 0 0 10 All Districts Total 0 132 0 1 1 135Source: ADF&G Division of Subsistence, Alaska Subsistence Fisheries Database, Version 3.3 Table XIII-15. Pelican Community Subsistence/Personal Use Salmon Permit Estimated Harvest, 2002 Permits Fished Estimated Harvest Total
Year Fishing Location Reported Estimated Chinook Sockeye Coho Chum Pink Salmon2002 District 13 4 4 0 120 0 0 0 1202002 Takanis Bay 2 2 0 50 0 0 0 502002 Hoktaheen Cove 2 2 0 70 0 0 0 70 All Districts Total 0 120 0 0 0 120Source: ADF&G Division of Subsistence, Alaska Subsistence Fisheries Database, Version 3.3 Table XIII-16. Tenakee Springs Community Subsistence/Personal Use Salmon Permit Estimated Harvest, 2002 Permits Fished Estimated Harvest Total
Year Fishing Location Reported Estimated Chinook Sockeye Coho Chum Pink Salmon2002 District 11 1 1 1 10 1 0 0 122002 Taku River 1 1 1 10 1 0 0 122002 District 12 1 1 0 15 0 0 0 152002 Little Basket Bay 1 1 0 15 0 0 0 152002 District 13 1 1 2 0 0 0 0 22002 Salmon Lake Stream 1 1 2 0 0 0 0 2 All Districts Total 2 15 0 0 0 17Source: ADF&G Division of Subsistence, Alaska Subsistence Fisheries Database, Version 3.3

190
In 2002 Pelican reported salmon harvests from Takanis Bay and Hoktaheen Cove in District 13. Tenakee Springs fishers got some sockeye salmon at Little Basket Bay in District 12, and some from Taku River, in District 11.
In 2002 Skagway’s salmon came from Necker Bay Lake and Klag Bay in District 13, and from Lutak Inlet, and Taiya River in District 15. Table XIII-17. Skagway Community Subsistence/Personal Use Salmon Permit Estimated Harvest, 2002 Permits Fished Estimated Harvest Total
Year Fishing Location Reported Estimated Chinook Sockeye Coho Chum Pink Salmon2002 District 13 3 3 0 250 0 0 0 2502002 Necker Bay Lake 1 1 0 150 0 0 0 1502002 Fish Camp -Klag Bay 2 2 0 100 0 0 0 1002002 District 15 2 3 0 15 0 28 25 682002 Lutak Inlet 1 2 0 15 0 0 8 232002 Taiya River 1 2 0 0 0 28 17 45 All Districts Total 0 265 0 28 25 318Source: ADF&G Division of Subsistence, Alaska Subsistence Fisheries Database, Version 3.3
JUNEAU MANAGEMENT AREA
JUNEAU SUBSISTENCE AND PERSONAL USE FISHING
Juneau/Taku Inlet/Stephens Passage - District 11
Waters of District 11 lie within the Juneau “nonsubsistence area.” Juneau fishers were the principal users of the designated “personal use” fisheries in District 11, but fishers from a few other Southeast communities also used the area, including Hoonah, Gustavus, Tenakee Springs, Petersburg, Sitka, and Ketchikan (Table XIII-18).
Today Juneau fishers travel throughout the region to harvest their salmon for home use. Personal Use regulations apply to salmon fishing for home use in Juneau area waters. As in 2001, in 2002 Juneau fishers depended most heavily on sockeye salmon from the Taku River and Sweetheart Creek, in Taku Inlet in District 11. Other locations used by Juneau salmon fishers included Hoktaheen Cove, and Klag Bay in District 13 waters, the Chilkat Inlet in District 15, and the Situk River in the Yakutat area (Table XIII-19).

191
Table XIII-18. Juneau/Taku Inlet/Stephens Passage - District 11
Juneau Area Subsistence/Personal Use Salmon Permit Estimated Harvest, by Community 2002 Permits Fished Estimated Harvest Total Percent of
Year Community Reported Estimated Chinook Sockeye Coho Chum Pink Salmon Total
2002 Juneau** 222 317 18 3,988 95 30 85 4,217 97.4%2002 Hoonah 2 4 0 50 0 0 0 50 1.1%2002 Gustavus 1 1 0 12 0 1 1 15 0.3%2002 Tenakee Springs 1 1 1 10 1 0 0 12 0.3%2002 Petersburg 1 1 0 10 0 0 0 10 0.2%2002 Sitka 1 1 0 10 0 0 0 10 0.2%2002 Ketchikan 1 3 0 9 0 0 0 9 0.2% 229 328 20 4,089 96 31 87 4,322 100.0% Percent of Total 0.5% 94.6% 2.2% 0.7% 2.0% 100.0% ** Includes Auke Bay and Douglas Source: ADF&G Division of Subsistence, Alaska Subsistence Fisheries Database, Version 3.3
Although Juneau fishers rely heavily on the Taku River and Sweetheart Creek, harvesting 66.5 percent of their salmon from those two locations in 2002, the amounts of fish harvested by Juneau fishers in the Angoon and Hoonah area fisheries comprises a substantial portion to the harvest from those stocks – 9.0 percent and 21.5 percent respectively (Table XIII-9 and Table XIII-11), and combined with harvests from locations other than Taku/Sweetheart, contributed one third of Juneau’s 2002 salmon harvest for home use. Table XIII-19. Juneau Community Subsistence/Personal Use Salmon Permit Estimated Harvest, 2002 Permits Fished Estimated Harvest Total
Year Fishing Location Reported Estimated Chinook Sockeye Coho Chum Pink Salmon2002 District 9 1 2 0 75 0 0 0 752002 Falls Ck Baranof Is 1 2 0 75 0 0 0 752002 District 11 186 264 18 3,574 84 27 85 3,7892002 Taku River 109 155 18 1,491 84 27 82 1,7032002 Sweetheart Creek 76 108 0 2,061 0 0 0 2,0612002 Admiralty Creek 1 1 0 21 0 0 3 242002 District 12 7 10 0 138 0 0 0 1382002 Little Basket Bay 6 9 0 128 0 0 0 1282002 Kook Lake Outlet 1 1 0 10 0 0 0 102002 District 13 15 24 0 731 6 6 0 7422002 Redoubt Lake Outlet 1 2 0 38 0 4 0 412002 Fish Camp -Klag Bay 3 6 0 188 0 2 0 1892002 Lake Anna Head 1 2 0 4 6 0 0 92002 Surge Bay 1 1 0 28 0 0 0 282002 Hokatheen Cove 9 13 0 474 0 0 0 4742002 District 14 3 4 0 24 0 0 0 242002 Excursion River 1 1 0 9 0 0 0 92002 Neva Creek 2 3 0 16 0 0 0 162002 District 15 9 13 3 380 23 20 4 4312002 Chilkat Inlet 8 12 3 336 23 20 4 3872002 Lutak Inlet 1 1 0 44 0 0 0 44

192
Table XIII-19. Juneau Community Subsistence/Personal Use Salmon Permit Estimated Harvest, 2002 [continued] Permits Fished Estimated Harvest Total
Year Fishing Location Reported Estimated Chinook Sockeye Coho Chum Pink Salmon2002 Yakutat Forelands 13 13 9 484 0 7 0 5002002 Alsek River 1 1 1 21 0 0 0 222002 Akwe River 2 2 0 12 0 6 0 182002 Situk RIver 9 9 8 390 0 1 0 3992002 Ahrnklin River 1 1 0 61 0 0 0 61 All Districts Total 30 5,406 113 60 90 5,699Source: ADF&G Division of Subsistence, Alaska Subsistence Fisheries Database, Version 3.3
The historic record for Juneau’s personal use salmon harvest showed a steady increase up to 1998, followed by a sharp drop in total numbers of salmon reported. Harvests of all salmon species have dropped by half between 1997 and 1998. The 2002 total estimated salmon harvest continues to be below the five-year and ten-year averages, but a slight rise over 2001 levels.
SITKA MANAGEMENT AREA
SITKA SUBSISTENCE SALMON FISHERIES
Sitka/Outer Baranof & Chichagof/Peril Strait – District 13 Redfish Bay, Necker Bay, Redoubt Bay, Klag Bay, Ford Arm
and Lake Anna
Background and History
Subsistence salmon fisheries in the waters traditionally used by the Tlingit people of Sitka are under the management responsibility of the Division of Commercial Fisheries Sitka Management Area Office. In 1989 the Alaska Board of Fisheries adopted a positive finding for “customary and traditional use” of sockeye salmon in the waters of Section 13-A south of the latitude of Cape Edward, in waters of Section 13-B north of the latitude of Redfish Cape, and in waters of Section 13-C. At the Board of Fisheries meeting in Sitka in March 1997, this was extended to include all other salmon species. Principal salmon waters and streams used by Sitka fishers include Klag Bay-Lake Anna, Lake Stream-Ford Arm, Necker Bay, Redoubt Bay, Salmon Lake, and Redfish Bay. The Sitka Management Area Office also manages the subsistence salmon fisheries at Surge Bay and Hoktaheen Cove, on the west coast of Yakobi Island, and Sitkoh Bay on the east side of Chichagof Island. Surge Bay and Hoktaheen Cove fisheries are discussed

193
with the Hoonah fisheries, and Sitkoh Bay fishery is discussed with the Angoon fisheries (Figure XIII-3).
The residents of Sitka are the principal subsistence users of the salmon stocks in this area. In 2000 Sitka had a population of 8,835 in 3,278 households. Twenty percent of Sitka households are estimated to use subsistence methods to harvest salmon for home use (Scott et al. 2001). Sitka Tlingits have traditionally used most of the Pacific coast of Baranof and Chichagof islands from Point Urey in the north to Cape Ommaney, including the myriad islands lying off the coast, and extending inward up Peril Strait between Chichagof and Baranof islands into Hoonah Sound as far as Patterson Bay. Sitkans share with Hoonah people the use of Yakobi Island and the sockeye salmon fisheries at Hoktaheen Cove and Surge Bay. Sitka territory touches that of Angoon in Peril Strait, and Sitkoh Bay.
Regulations
The 2002 subsistence/personal use salmon permit for the Sitka Management Area stipulates that “sport-taken and subsistence/personal use taken salmon may not be possessed on the same day.” Coho, Chinook, steelhead, trout and char “may only be taken incidentally by gear operated under the subsistence/personal use fishing guidelines of the permit.” Additionally, “salmon streams flowing across or adjacent to the Sitka road system are closed to subsistence/personal use fishing.” And further, that “salmon may not be taken by a line attached to a rod or pole”, and “snagging is not allowed for subsistence.”
The 2002 permit provided for an open season for pink salmon from July 15 through September 30, and for chums from July 15 through October 31, in streams in the Sitka management area (except as noted above). Open season for sockeye salmon for all Sitka sockeye locations started June 1 and closed on varying dates at the various locations. August 15 was the closing date for Redoubt Bay, Necker Bay, Redfish Bay, Lake Eva, Sitkoh Lake. July 20th was the closing date for Gut Bay, Falls Lake, Surge Bay and Hoktaheen, July 25th – for Klag Bay2, Ford Arm, and Lake Anna, and Leo’s Anchorage, and July 31st was the closing date for the Salmon Lake3, and Politofski Lake subsistence sockeye fishery. Individual and household “possession limits” for sockeye was 10 fish at Leo’s Anchorage, Redoubt Bay, Salmon Lake, Takanis Bay, Gut Bay and Falls Lake; 15 fish at Lake Evan, and Sitkoh Lake; 50 fish at Klag Bay from June 1st to July 24th, and 25 fish at Klag Bay after it was re-opened Aug 14th; 20 fish at Surge Bay, Hoktaheen, Ford Arm, and Lake Anna, and Politofski Lake; 25 fish at Redfish Bay; 50 fish at Necker Bay. The 2 Klag Bay was closed for sockeye subsistence and sport fishing on Friday, July 24, 2002, by emergency order. The area closed included all marine waters of Klag Bay north of the latitude of Rose Point, located on Klag Island, and all freshwater drainages flowing into and from Klag Bay Lake. It was re-opened on Wednesday, August 14, 2002 through Saturday, August 31, 2003, after returns to the weir following rainfall showed that escapement goals were expected to be met. 3 Salmon Lake outlet stream located in Silver Bay was closed for sockeye subsistence, on Wednesday, July 24, 2002 through December 31, 2002 by emergency order. The closed area included freshwaters of the Salmon Lake drainage area and marine waters in District 13 within a 0.3 nautical mile radius of the Salmon Lake outlet stream as indicated by ADF&G regulatory markers on Arguello Island and the adjacent Baranof Island shoreline.

194
individual and household “possession” limit for chum salmon was 50, and for pink salmon the individual limit was 50, and the household limit was 150.
Allowed subsistence gear included hand purse seines, beach seines, drift gill nets, dip nets, gaffs, and spears. Drift gillnets may not exceed 50 fathoms. Set gillnets are not allowed. And in Redoubt Bay, only dip nets, gaffs, and spears were allowed.
Harvest Assessment Program
Annual subsistence salmon harvest assessments have been in place since 1985. As reported in Table XIII-20 the estimated salmon harvest in the Sitka area subsistence fisheries in 2002 (exclusive of Surge Bay, Hoktaheen Cove, and Sitkoh Bay) was 20,275 salmon, including 20,007 sockeye (98.7 percent), 19 chinook (0.1 percent), 47 coho (0.2 percent), 31 chum (0.7 percent), and 110 pink (0.5 percent). Most permits were issued to Sitka residents, and Sitka residents harvested most of the salmon reported (95.4 percent). Some Sitka residents fish in waters beyond these traditional use areas. In 2002 most of the subsistence salmon harvests reported on the permits fished by Sitka residents occurred in the waters of Necker Bay, and Fish Camp-Klag Bay, Redoubt Lake Outlet, Redfish Bay, and Lake Stream in Ford Arm (Table XIII-21).
Table XIII-20. Sitka/Outer Baranof & Chichagof/Peril Strait - District 13 [except Sitkoh Bay, Surge Bay and Hoktaheen Cove]
Sitka Subsistence/Personal Use Salmon Permit Estimated Harvest, by Community 2002 Permits Fished Estimated Harvest Total Percent ofYear Community Reported Estimated Chinook Sockeye Coho Chum Pink Salmon Total
2002 Sitka 361 410 17 19,095 39 86 110 19,347 95.4%2002 Anchorage 2 2 0 100 0 0 0 100 0.5%2002 Juneau** 6 10 0 240 9 6 0 254 1.3%2002 Hoonah 2 2 0 100 0 0 0 100 0.5%2002 Skagway 3 3 0 250 0 0 0 250 1.2%2002 Ketchikan*** 1 2 0 72 0 0 0 72 0.4%2002 Kake 1 1 0 50 0 0 0 50 0.2%2002 Pelican 2 2 0 50 0 0 0 50 0.2%2002 Wasilla 1 1 0 50 0 0 0 50 0.2%2002 Tenakee Springs 1 1 2 0 0 0 0 2 0.01% 380 434 19 20,007 47 92 110 20,275 100.0% Percent of Total 0.1% 98.7% 0.2% 0.5% 0.5% 100.0% ** Includes Auke Bay and Douglas *** Includes Ward Cove Source: ADF&G Division of Subsistence, Alaska Subsistence Fisheries Database, Version 3.3
The numbers of sockeye salmon harvested by residents of Sitka in 2002, as estimated based on amounts reported on the permits, were the highest since 1985, and well over the five year, ten-year averages, and all-year average (1985-2002). Chum salmon harvests estimated based on amounts reported on permits in 2002 were about the same as for 2001, and coho harvests were well above the 5-, 10- and all-year averages. Sitka’s pink salmon reported harvests were down in 2002, and chinook harvests were above average.
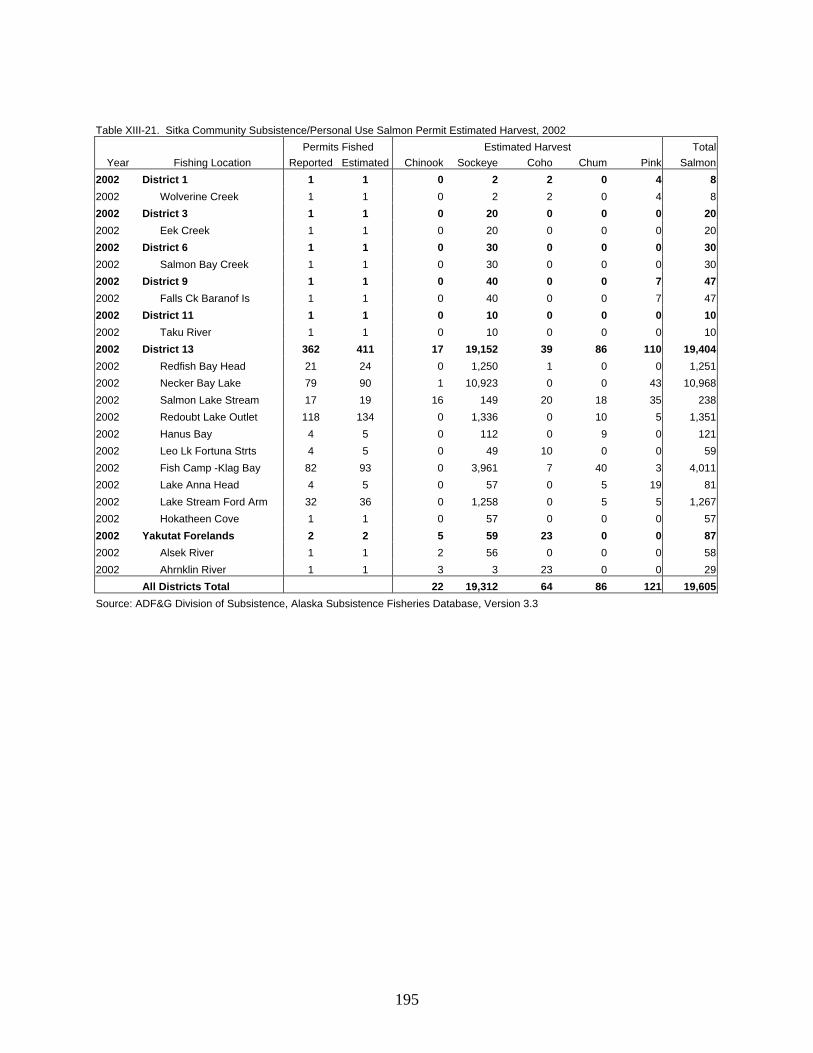
195
Table XIII-21. Sitka Community Subsistence/Personal Use Salmon Permit Estimated Harvest, 2002 Permits Fished Estimated Harvest Total
Year Fishing Location Reported Estimated Chinook Sockeye Coho Chum Pink Salmon2002 District 1 1 1 0 2 2 0 4 82002 Wolverine Creek 1 1 0 2 2 0 4 82002 District 3 1 1 0 20 0 0 0 202002 Eek Creek 1 1 0 20 0 0 0 202002 District 6 1 1 0 30 0 0 0 302002 Salmon Bay Creek 1 1 0 30 0 0 0 302002 District 9 1 1 0 40 0 0 7 472002 Falls Ck Baranof Is 1 1 0 40 0 0 7 472002 District 11 1 1 0 10 0 0 0 102002 Taku River 1 1 0 10 0 0 0 102002 District 13 362 411 17 19,152 39 86 110 19,4042002 Redfish Bay Head 21 24 0 1,250 1 0 0 1,2512002 Necker Bay Lake 79 90 1 10,923 0 0 43 10,9682002 Salmon Lake Stream 17 19 16 149 20 18 35 2382002 Redoubt Lake Outlet 118 134 0 1,336 0 10 5 1,3512002 Hanus Bay 4 5 0 112 0 9 0 1212002 Leo Lk Fortuna Strts 4 5 0 49 10 0 0 592002 Fish Camp -Klag Bay 82 93 0 3,961 7 40 3 4,0112002 Lake Anna Head 4 5 0 57 0 5 19 812002 Lake Stream Ford Arm 32 36 0 1,258 0 5 5 1,2672002 Hokatheen Cove 1 1 0 57 0 0 0 572002 Yakutat Forelands 2 2 5 59 23 0 0 872002 Alsek River 1 1 2 56 0 0 0 582002 Ahrnklin River 1 1 3 3 23 0 0 29 All Districts Total 22 19,312 64 86 121 19,605Source: ADF&G Division of Subsistence, Alaska Subsistence Fisheries Database, Version 3.3

196
PETERSBURG/WRANGELL MANAGEMENT AREA
KAKE SUBSISTENCE SALMON FISHERIES
South Chatham Strait/West Frederick Sound – District 9 Gut Bay, and Falls Lake Creek (Baranof Island),
Kutlaku Creek (Bay of Pillars), and Alecks Creek (Tebenkof Bay) Plus Shipley Bay in District 5
Background and History
Subsistence salmon fisheries in the waters traditionally used by the Tlingit people of Kake are under the management responsibility of two area offices of the Division of Commercial Fisheries – the Petersburg/Wrangell office. In 1989 the Alaska Board of Fisheries adopted a positive finding for “customary and traditional use” of salmon in the waters of Section 9-A and 9-B in waters north of the latitude of Swain Point, in waters of District 10 west of a line from Pinta Point to False Point Pybus, and in waters of District 5 north of a line from Point Barrie to Boulder Point. Principal salmon waters and streams used by Kake fishers include Gut Bay and Falls Lake Creek flowing into Chatham Strait on the southwest coast of Baranof Island, as well as Saginaw, Security (Salt Lake), Pillar (Kutlaku Creek) and Tebenkof Bays (Alecks Creek) on Kuiu Island (Figure XIII-3).
The residents of Kake are the principal subsistence users of the salmon stocks in Gut Bay and Falls Lake Creek on Baranof Island, and Saginaw, Security, Pillar, and Tebenkof Bays on Kuiu Island. In 2000 Kake had a population of 710 in 246 households. Thirty-three percent of Kake households are estimated to use subsistence methods to harvest salmon for home use (Scott et al. 2001). Kake residents shared the use of the southern coastal waters of Admiralty Island with people of Angoon and Petersburg. In recent years principal subsistence salmon fishing by Kake residents occurs in Gut Bay, and Falls Creek on Baranof Island, and at Kutlaku Creek in Pillar Bay.
Regulation
The 2002 subsistence salmon permit for the Kake area waters of District 9 provided for an open season for sockeye salmon in Alecks Creek in Tebenkoff Bay, and Pillar Bay (Kutlaku) from June 1 through July 31. For Shipley Bay and Falls Creek the season ran from June 1 through July 31, and for Gut Bay the season ran from June 1 through July 20. The open season for pink salmon in all streams in the Kake and point Baker/Port Protection subsistence area ran from July 15 through August 31. The 2002 season for fall chum in Port Camden was August 15 – September 30, and for Security Bay, from September 1 through October 31. Allowed subsis-

197
Figure XIII-3. ADF&G Salmon and Shellfish Fishery Statistical Areas, Southeastern Alaska, Chart No. 2

198
tence gear included gaffs, spears, beach seines and dip nets. Possession limits for sockeye from Alecks Creek, Kutlaku (in Pillar Bay), and Falls Creek was 50 in possession and 50 annually. The limit for fish from Gut Bay was 10 in possession and 20 annually. For Shipley Bay limits were 15 in possession, 25 annual.
Harvest Assessment Program
Annual subsistence salmon harvest assessments have been in place since 1985. As reported in Table XIII-22 the estimated salmon harvest in the Kake subsistence fisheries in 2002 was 2,672 salmon, including 2,439 sockeye (91.3 percent), 138 chum (5.2 percent), and 92 pink (3.5 percent). No cohos were reported. Most permits were issued to Kake residents, and Kake residents harvested most of the salmon reported (91.5 percent).
Table XIII-22. South Chatham/West Frederick Sound - District 9 & Sumner Strait - District 5 Kake Area Subsistence/Personal Use Salmon Permit Estimated Harvest, by Community 2002
Permits Fished Estimated Harvest Total Percent ofYear Community Reported Estimated Chinook Sockeye Coho Chum Pink Salmon Total
2002 Kake 83 92 2 2,226 0 138 78 2,444 91.5%2002 Juneau** 1 2 0 75 0 0 0 75 2.8%2002 Ketchikan*** 2 2 0 54 0 0 0 54 2.0%2002 Sitka 1 1 0 40 0 0 7 47 1.7%2002 Petersburg 1 1 0 25 0 0 7 32 1.2%2002 Anchorage 1 1 0 20 0 0 0 20 0.7% 89 99 2 2,439 0 138 92 2,672 100.0% Percent of Total 0.1% 91.3% 0.0% 5.2% 3.5% 100.0% ** Includes Auke Bay and Douglas *** Includes Ward Cove Source: ADF&G Division of Subsistence, Alaska Subsistence Fisheries Database, Version 3.3 Table XIII-23. Kake Community Subsistence/Personal Use Salmon Permit Estimated Harvest, 2002 Permits Fished Estimated Harvest Total
Year Fishing Location Reported Estimated Chinook Sockeye Coho Chum Pink Salmon2002 District 6 3 3 0 39 0 0 0 392002 Salmon Bay Creek 3 3 0 39 0 0 0 392002 District 9 83 92 2 2,226 0 138 78 2,4442002 Gut Bay Head 12 13 0 134 0 7 0 1412002 Falls Ck Baranof Is 57 64 2 1,814 0 65 17 1,8972002 Point White Creek 2 2 0 0 0 0 39 392002 Salt Chuck-Security 1 1 0 0 0 67 22 892002 Kutlaku Creek 8 9 0 217 0 0 0 2172002 Alecks Creek 3 3 0 61 0 0 0 612002 District 13 1 1 0 50 0 0 0 502002 Fish Camp -Klag Bay 1 1 0 50 0 0 0 50 All Districts Total 2 2,315 0 138 78 2,533Source: ADF&G Division of Subsistence, Alaska Subsistence Fisheries Database, Version 3.3

199
Some Kake residents fish in waters beyond these traditional use areas. In 2002 most of the subsistence salmon harvests reported on the permits fished by Kake residents occurred in the waters of Falls Creek, Gut Bay, and in Kutlaku Creek in Bay of Pillars (Table XIII-23).
The numbers of sockeye salmon harvested by residents of Kake in 2002, as estimated based on amounts reported on the permits, were up from 2001, and above the 5-year and 10-year averages, and chum salmon reported harvests were up somewhat above the 2001 level, but still below average. Few chinook harvests were reported on the permits returned in 2002.
PETERSBURG/WRANGELL MANAGEMENT AREA
PETERSBURG SUBSISTENCE AND PERSONAL USE FISHERIES
Sumner Strait/Pt. Baker/Macnamara – Portion District 6 Point Baker, Salmon Bay, Red Bay Lake and
Crystal Creek (Wrangell Narrows) in District 6
Background and History
Subsistence salmon fisheries in the waters traditionally used by the Tlingit people of Wrangell are under the management responsibility of the Commercial Fisheries Petersburg/Wrangell office. In 1989, when the Alaska Board of Fisheries adopted positive findings for “customary and traditional use” of salmon in some waters of southeast, it did not act on proposals to make a similar finding for the principal waters used by the people of Petersburg and Wrangell to obtain their fish for home use. These waters and streams include Crystal Creek in the Wrangell Narrows, Salmon Bay, Red Bay Lake, on the northwest coast of Prince of Wales Island along the shores of Sumner and Clarence Strait in District 6, Thoms Creek, Harding River, Mill Creek in District 7, and the Stikine River in District 8. Salmon fishing for home use in these waters occurs under the personal use regulations. The Petersburg-Wrangell Management Area Office also manages the subsistence sockeye salmon fisheries at Alecks Creek in Tebenkof Bay and Kutlaku Creek in Bay of Pillars on Kuiu Island, and Gut Bay and Falls Creek on Baranof Island, in District 9 (Figure XIII-3).
The residents of Petersburg and Wrangell are the principal communities dependent on the salmon stocks of Salmon Bay on Prince of Wales Island, and Crystal Creek, Thoms Creek, Earl

200
West Cove, Mill Creek and the Stikine River. In 2000 Petersburg had a population of 3,247 in 1,252 households, and Wrangell had a population of 2,308 in 907 households. Rod and reel is the preferred method used by Petersburg and Wrangell fishers to harvest salmon for home use. Just 3 percent of Petersburg households, and 9 percent of Wrangell households are estimated to use subsistence methods to harvest salmon for home use (Scott et al. 2001).
Regulations
The subsistence/personal use salmon permit for the Petersburg/Wrangell Management Area provides for an open season for sockeye salmon in the designated subsistence fisheries Shipley Bay, Salmon and Red Bays and Falls Lake running from June 1 through July 31. Season limits for sockeye are specified at 15 in possession and 25 annually from Shipley, and 30 in possession and annual limit from Salmon Bay and Red Bay, up from 10 in 2001. The open season for the personal use sockeye salmon fisheries at Thoms Place and Mill Creek was June 1 – July 31, with a daily possession limit of 20, and 40 annually, up from 10/10 in 2001. Hatchery Creek season runs from June 1-30, with a daily limit of 5 sockeye, and an annual limit of 20. There was a daily limit of 50 pinks per person and 100 per household from all streams in the Kake and Point Baker/Port Protection areas. The open season for pinks in Cat Creek, Chuck River, Olive Cove and Kuday Bay was July 15-August 31, with a possession limit of 50 and 100 annual limit. The open season for chum on the Harding River was July 1 – August 15, with a limit of 25 in possession and 50 annually.
Harvest Assessment Program – Petersburg
As reported in Table XIII-24 the estimated harvest in the Petersburg area subsistence/personal use salmon fisheries in 2002 was 1,725 salmon, including 1,271 sockeye (73.7 percent), 415 coho (24.0 percent), 29 chum (1.7 percent), and 9 pink (0.5 percent). Most permits were issued to Petersburg residents, and Petersburg residents harvested most of the salmon reported (82.2 percent). In 2002, 91 percent of the salmon harvest reported on the permits by Petersburg residents occurred in the waters of Salmon Bay Creek, and Petersburg residents caught 100 percent of their cohos in Crystal Creek in District 6 (Table XIII-25). Some Petersburg residents fished in waters beyond District 6, including Mill Creek in District 7, Falls Creek-Baranof Island in District 9, the Taku River just south of Juneau, in District 11, Hoktaheen Cove in District 13, and Chilkat Inlet in District 15.
The numbers of sockeye salmon harvested by residents of Petersburg in 2002, as estimated based on amounts reported on the permits, continue to be well over the five year, ten-year averages, and all-year average (1985-2002), although coho, chum and pink reported remain low.

201
Table XIII-24. Portion District 6 - East Sumner Strait/North Frederick Sound [Sumner Strait/Pt Baker/Macnamara & Wrangell Narrows] – Point Baker/Port Protection &
Petersburg Area Subsistence/Personal Use Salmon Permit Estimated Harvest, by Community 2002 Permits Fished Estimated Harvest Total Percent of
Year Community Reported Estimated Chinook Sockeye Coho Chum Pink Salmon Total2002 Petersburg 75 78 1 1,016 385 13 2 1,418 82.2%2002 Wrangell 6 7 0 92 0 0 0 92 5.3%2002 Point Baker 1 1 0 27 20 16 6 69 4.0%2002 Anchorage 2 2 0 39 0 0 1 40 2.3%2002 Kake 3 3 0 39 0 0 0 39 2.3%2002 Sitka 1 1 0 30 0 0 0 30 1.7%2002 Craig 3 3 0 15 0 0 0 15 0.9%2002 Ketchikan** 1 1 0 0 10 0 0 10 0.6%2002 Seward 1 1 0 8 0 0 0 8 0.5%2002 King Cove 1 1 0 5 0 0 0 5 0.3%2002 Thorne Bay 1 1 0 0 0 0 0 0 0.0% 95 99 1 1,271 415 29 9 1,725 100.0% Percent of Total 0.1% 73.7% 24.0% 1.7% 0.5% 100.0% ** Includes Ward Cove Source: ADF&G Division of Subsistence, Alaska Subsistence Fisheries Database, Version 3.3
Table XIII-25. Petersburg Community Subsistence/Personal Use Salmon Permit Estimated Harvest, 2002 Permits Fished Estimated Harvest Total
Year Fishing Location Reported Estimated Chinook Sockeye Coho Chum Pink Salmon2002 District 6 75 78 1 1,016 385 13 2 1,4182002 Salmon Bay Creek 47 49 1 1,005 6 2 1 1,0152002 Red Lake Creek 2 2 0 3 0 5 0 82002 Crystal Creek 26 27 0 8 379 6 1 3942002 District 7 2 2 0 38 0 0 0 382002 Mill Ck 2 2 0 38 0 0 0 382002 District 9 1 1 0 25 0 0 7 322002 Falls Ck Baranof Is 1 1 0 25 0 0 7 322002 District 11 1 1 0 10 0 0 0 102002 Taku River 1 1 0 10 0 0 0 102002 District 13 1 1 0 38 0 0 0 382002 Hoktaheen Cove 1 1 0 38 0 0 0 382002 District 15 1 1 0 21 0 0 0 212002 Chilkat Inlet 1 1 0 21 0 0 0 21 All Districts Total 1 1,149 385 13 9 1,557Source: ADF&G Division of Subsistence, Alaska Subsistence Fisheries Database, Version 3.3

202
PETERSBURG/WRANGELL MANAGEMENT AREA
WRANGELL SUBSISTENCE AND PERSONAL USE FISHERIES
East Etolin Island/Wrangell Island/Ernest Sound – District 7 Thoms Creek, Harding River, and Mill Creek
and Stikine River in District 8
Harvest Assessment - Wrangell
As reported in Table XIII-26 the estimated salmon harvest in the Wrangell area subsistence/personal use salmon in 2002 was 1,507 salmon, including 1,229 sockeye (81.5 percent), 136 chinook (9.0 percent), 100 chum (6.6 percent), 31 pink (2.1 percent), and just 11 coho (0.8 percent). Salmon harvests by Wrangell residents accounted for 97.5 percent of salmon harvested under subsistence/personal use regulations from the waters of Districts 7. This represents more than twice the numbers estimated from harvests reported on permits in 2001 for District 7.
Table XIII-26. East Etolin Island/Wrangell Island/Ernest Sound - District 7 Wrangell Area Subsistence/Personal Use Salmon Permit Estimated Harvest, by Community 2002
Permits Fished Estimated Harvest Total Percent ofYear Community Reported Estimated Chinook Sockeye Coho Chum Pink Salmon Total
2002 Wrangell 74 85 136 1,191 11 100 31 1,469 97.5%2002 Petersburg 2 2 0 38 0 0 0 38 2.5% 76 87 136 1,229 11 100 31 1,507 100.0% Percent of Total 9.0% 81.5% 0.8% 6.6% 2.1% 100.0% Source: ADF&G Division of Subsistence, Alaska Subsistence Fisheries Database, Version 3.3
In 2002 54.8 percent of all the salmon harvest reported on the permits by Wrangell residents occurred in the waters of Thoms Creek at the southwest tip of Wrangell Island, Earl West Cove Special Harvest Area – a hatchery chinook run, and Salmon Bay on Prince of Wales Island (Table XIII-27). The Stikine River remained closed to subsistence fishing in 2002. Table XIII-27. Wrangell Community Subsistence/Personal Use Salmon Permit Estimated Harvest, 2002 Permits Fished Estimated Harvest Total
Year Fishing Location Reported Estimated Chinook Sockeye Coho Chum Pink Salmon2002 District 6 6 7 0 92 0 0 0 922002 Salmon Bay Creek 6 7 0 92 0 0 0 922002 District 7 74 85 136 1,191 11 100 31 1,4692002 Thoms Creek 17 19 0 366 0 13 10 3882002 Earl West Cove SHA 5 6 41 2 7 0 2 532002 Mill Ck 52 60 95 823 5 87 18 1,028 All Districts Total 136 2,145 23 187 52 2,679Source: ADF&G Division of Subsistence, Alaska Subsistence Fisheries Database, Version 3.3

203
Overall the numbers of salmon harvested by residents of Wrangell in 2002, as estimated based on amounts reported on the permits, were considerably over the 5- and 10-year averages and the all-year average (1985-2002). This was true for the estimated numbers of chinook, sockeye, and chum. Estimated cohos and pinks harvested were very low compared with earlier years.
PETERSBURG-WRANGELL MANAGEMENT AREA
POINT BAKER/PORT PROTECTION SUBSISTENCE FISHERIES
Sumner Strait/Pt. Baker/Macnamara – Portion District 6 Point Baker, Red Bay and Salmon Bay
and Shipley Bay in District 5
Background and History
The Petersburg-Wrangell Area Management Office manages subsistence and personal use salmon fisheries in the waters used by fishers from the communities of Point Baker and Port Protection – the Salmon Bay and Red Bay sockeye salmon stocks at the north end of Prince of Wales Island. In 1989, when the Alaska Board of Fisheries adopted positive findings for “customary and traditional use” of salmon in some waters of southeast, it did not act on proposals to make a similar finding for the principal waters used by the people of Point Baker and Port Protection to obtain their fish for home use. From 1989 to 1997 the only option for Point Baker and Port Protection fishers for obtaining salmon for home use was from Shipley Bay, over 20 miles south across the open water of Sumner Strait, and Red and Salmon Bays, over 20 miles east along Sumner Strait.
In 1997 the Alaska Board of Fisheries acted favorably on a proposal to adopt a positive finding for “customary and traditional” use of salmon (and other fish) “in waters of District 5 north of a line from Point St. Albans to Cape Pole, in waters of Section 6-A west of a line from Macnamara Point to Mitchell Point, and in waters of Section 6-B west of the longitude of Macnamara Point.” This opened the opportunity for a subsistence “drift gillnet fishery” from the mixed salmon stocks in the waters of Sumner Strait off shore from the two communities.
In 2000 Point Baker had a population of 35 in 13 households, and Port Protection had a population of 63 in 31 households. In 1996, the year before the Board of Fisheries acted on the proposal to allow a subsistence drift gillnet fishery off the cape in front of the community, the Division’s harvest survey found no households using subsistence methods to obtain salmon for home use. In that year 24 percent of Port Protection households were estimated to use subsistence methods to harvest salmon for home use. In 1996 in Point Baker 50 percent of

204
households, and in Port Protection 28 percent of households, relied on removal from commercial catches to meet their household’s need for salmon (Scott et al. 2001).
Regulations
The 2002 subsistence/personal use salmon permit for Petersburg-Wrangell Management Area stipulated that gaffs, spears, beach seines, and dip nets are the types of subsistence gear allowed for general use in the Point Baker/Port Protection areas. The 2002 permit provided for an open season for the Pt. Baker Drift Gillnet Subsistence salmon fishery running from June 15 through July 31, from Wednesday noon until Sunday noon. Drift gillnets may not exceed 50 fathoms. Harvest is limited to a maximum of 25 sockeye per family per year, with incidental harvests of other salmon species allowed. Set gillnets may only be used in Shipley Bay within 100 yards of the terminus of Shipley Creek and the permit holder must be physically present at the net while it is in operation, and nets may not exceed 50 fathoms. In Shipley Bay, daily limit for sockeye salmon is 15 fish, with an annual limit of 25, compared with 25/no limit in 2001. In Salmon and Red Bays the daily and annual limit for sockeye is 30 fish.
Harvest Assessment Program
As reported in Table XIII-28 the estimated salmon harvest in the Point Baker/Port Protection subsistence area in 2002 was just 69 salmon from the Sumner Strait/Point Baker/Macnamara sub-district, likely in the Point Baker Subsistence Drift Gillnet fishery. The subsistence/personal use salmon permit system database does not include any harvests reported by Port Protection fishers. It is believed that since many Port Protection households receive mail via pouch from Ketchikan, and maintain either a Ketchikan or Point Baker post office box address, their harvests are included in either the Point Baker or Ketchikan numbers.
There has been a steady decline in the number of Point Baker fishers using the subsistence/personal use salmon permit fisheries since 1985. The estimated subsistence harvest has dropped unevenly over the years.
Table XIII-28. Point Baker Community Subsistence/Personal Use Salmon Permit Estimated Harvest, 2002 Permits Fished Estimated Harvest Total
Year Fishing Location Reported Estimated Chinook Sockeye Coho Chum Pink Salmon2002 District 6 1 1 0 27 20 16 6 69
2002 Sumner Strait/Pt Baker/ Macnamara 1 1 0 27 20 16 6 69
All Districts Total 0 27 20 16 6 69Source: ADF&G Division of Subsistence, Alaska Subsistence Fisheries Database, Version 3.3
Other harvests from this sub-district are reported with the Petersburg and Wrangell fisheries above.

205
KETCHIKAN MANAGEMENT AREA
CRAIG, KLAWOCK AND HYDABURG SUBSISTENCE FISHERIES
Inside Waters/West Prince of Wales Island – District 3 Eek Creek, Hetta Inlet, Klawock River, and Sarkar
Background and History
The Ketchikan Management Area includes three distinct subsistence areas where the Board of Fisheries adopted positive “customary and traditional use” determinations in 1989. Two of these areas are on the west coast of Prince of Wales Island: the Hydaburg area waters of Section 3-A, and in waters of District 2 in Nichols Bay north of 54o 42.12’ N. lat. (5AAC 01.716 (18)); Craig/Klawock area waters of Section 3-B east of a line from Point Ildefonso to Tranquil Point and in waters of Warm Chuck Inlet north of a line from a point on Heceta Island at 55 o 44’ N. lat., 133 o 25’ W long. to Bay Point, and in the waters of Section 3-C in Karheen Passage north of 55 o 48’ N lat. and east of 133o20’ W long., and in waters of Sarkar Cove and Sarkar Lakes (5AAC 01.716 (15)) (Figure XIII-4).
The communities of Hydaburg, Craig, and Klawock on the west coast of Prince of Wales Island, are the principal subsistence users of the salmon stocks of Districts 3-A and 3-B – Hetta Inlet/Sukkwan Strait (Eek Creek), Big Salt/Trocadero Bay (Klawock River), and Sea Otter Sound (Sarkar). In District 2, no salmon harvests were reported from Nichols Bay in 2002.
In 1997 the Division’s household survey found that 27 percent of Craig households used subsistence methods to harvest salmon. In Klawock 36 percent and in Hydaburg 59 percent of households used subsistence methods to harvest salmon that year (ADFG Division of Subsistence, Community Profile Database 2003).
In 2000 the numbers of people and households in the three west coast Prince of Wales Island communities were as follows:
Community Population Households Craig [1] 1,725 631 Klawock 854 313 Hydaburg 382 133
[1] Alaska Native Village Statistical Area includes population on Port St. Nicholas Rd. and other residential areas outside City of Craig boundaries.

206
Figure XIII-4. ADF&G Salmon and Shellfish Fishery Statistical Areas, Southeastern Alaska, Chart No. 1

207
Regulations
The 2002 subsistence/personal use salmon permit for the Ketchikan Management Area stipulated that hand purse seines, beach seines, and dip nets are the types of subsistence/ personal use gear allowed for general use, with use of “line attached to a rod or pole” specifically not allowed. No mention is made of use of gaffs or spears. The standard rules governing fishing near dams, fish ladders, weirs, culverts etc. is included, as well as the prohibition of possessing salmon taken under sport-fish regulations on the same day as subsistence/personal use taken salmon, and the requirement of removing tail fin tips immediately. The 2002 permit provided for an open season in Nichols Bay, and Warm Chuck Lake (on Heceta Island) from June 1 through July 31. The season in Hetta Inlet/Eek Creek ran from June 1 through August 31, and in the Klawock River, from July 7 through July 31, but with fishing allowed only from 8 am Monday through 5 pm Friday. All streams in the Hydaburg and Craig/ Klawock subsistence areas were open for pink salmon from July 1 through September 30, and for chum salmon, from July 1 through October 31. Harvest possession limit for individuals and households were as follows: in Nichols Bay, Hetta/Eek, Warm Chuck Lake, Klawock River, and Karheen, Deweyville (Sarkar) – sockeye - 10/20; in all streams in the Hydaburg and Craig/Klawock Subsistence Areas – pinks - 100/150, chum – 20/25.
Harvest Assessment Program
As reported in Table XIII-29 the estimated salmon harvest in District 3 - the Hydaburg and Craig/Klawock Subsistence Areas (except Nichols Bay in District 2) in 2002 was 7,542 salmon, representing a 15 percent drop from 2001 levels. The harvest composition was 7,190 sockeye (95.3 percent), 1 chinook (0.02 percent), 41 coho (0.5 percent), 43 pink (0.6 percent), and 266 chum (3.5 percent). Residents of Klawock accounted for the most number of permits issued. Klawock and Craig fishers shared the salmon harvested from these waters, harvesting 47.0 percent and 27.2 percent respectively, of the estimated harvest based on returned permits.
Table XIII-29. Inside Waters/West Prince of Wales Island – District 3 Craig/Klawock/Hydaburg Area Subsistence/Personal Use Salmon Permit Estimated Harvest, by Community
2002 Permits Fished Estimated Harvest Total Percent of
Year Community Reported Estimated Chinook Sockeye Coho Chum Pink Salmon Total
2002 Klawock 79 104 1 3,426 24 76 20 3,546 47.0%2002 Craig 52 64 0 1,831 16 190 14 2,050 27.2%2002 Hydaburg 14 19 0 796 0 0 0 796 10.6%2002 Ketchikan** 27 30 0 662 1 0 0 663 8.8%2002 Kasaan 8 8 0 266 0 0 0 266 3.5%2002 Thorne Bay 4 5 0 79 0 0 10 89 1.2%2002 Saxman 3 4 0 87 0 0 0 87 1.1%2002 Hollis 1 1 0 24 0 0 0 24 0.3%2002 Sitka 1 1 0 20 0 0 0 20 0.3%
189 236 1 7,190 41 266 43 7,542 100.0% Percent of Total 0.02% 95.3% 0.5% 3.5% 0.6% 100.0% ** Includes Ward Cove Source: ADF&G Division of Subsistence, Alaska Subsistence Fisheries Database, Version 3.3
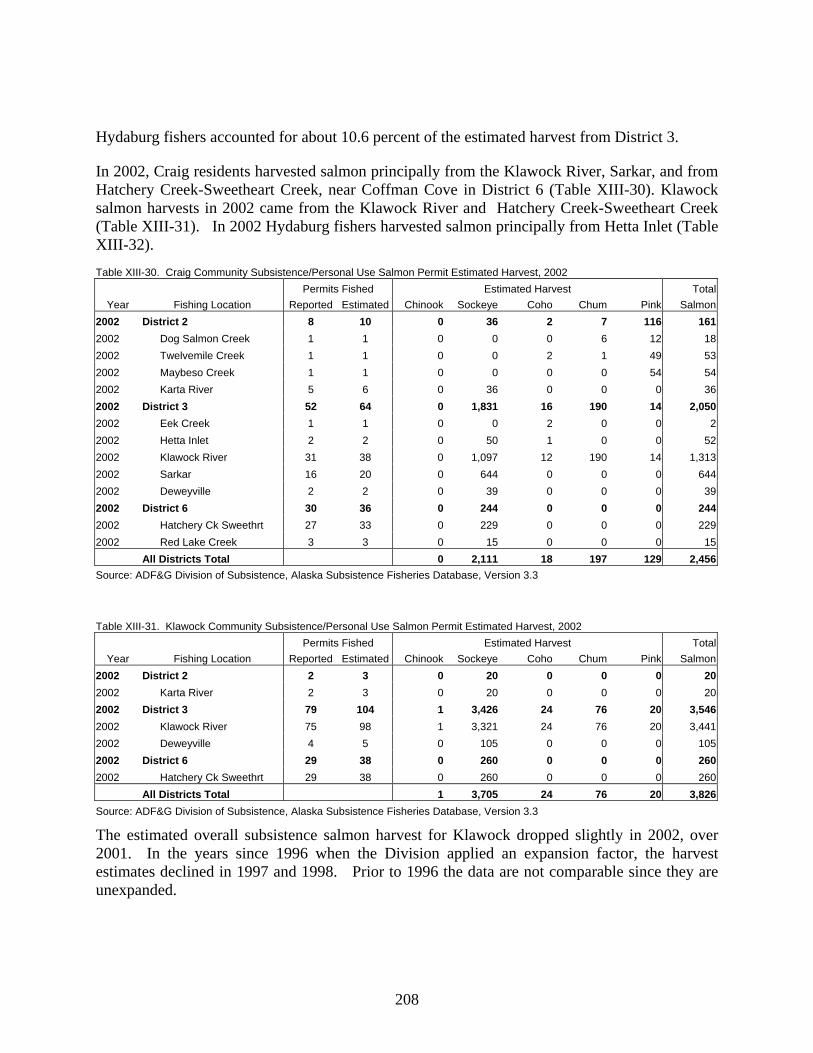
208
Hydaburg fishers accounted for about 10.6 percent of the estimated harvest from District 3.
In 2002, Craig residents harvested salmon principally from the Klawock River, Sarkar, and from Hatchery Creek-Sweetheart Creek, near Coffman Cove in District 6 (Table XIII-30). Klawock salmon harvests in 2002 came from the Klawock River and Hatchery Creek-Sweetheart Creek (Table XIII-31). In 2002 Hydaburg fishers harvested salmon principally from Hetta Inlet (Table XIII-32). Table XIII-30. Craig Community Subsistence/Personal Use Salmon Permit Estimated Harvest, 2002 Permits Fished Estimated Harvest Total
Year Fishing Location Reported Estimated Chinook Sockeye Coho Chum Pink Salmon2002 District 2 8 10 0 36 2 7 116 1612002 Dog Salmon Creek 1 1 0 0 0 6 12 182002 Twelvemile Creek 1 1 0 0 2 1 49 532002 Maybeso Creek 1 1 0 0 0 0 54 542002 Karta River 5 6 0 36 0 0 0 362002 District 3 52 64 0 1,831 16 190 14 2,0502002 Eek Creek 1 1 0 0 2 0 0 22002 Hetta Inlet 2 2 0 50 1 0 0 522002 Klawock River 31 38 0 1,097 12 190 14 1,3132002 Sarkar 16 20 0 644 0 0 0 6442002 Deweyville 2 2 0 39 0 0 0 392002 District 6 30 36 0 244 0 0 0 2442002 Hatchery Ck Sweethrt 27 33 0 229 0 0 0 2292002 Red Lake Creek 3 3 0 15 0 0 0 15 All Districts Total 0 2,111 18 197 129 2,456Source: ADF&G Division of Subsistence, Alaska Subsistence Fisheries Database, Version 3.3
Table XIII-31. Klawock Community Subsistence/Personal Use Salmon Permit Estimated Harvest, 2002 Permits Fished Estimated Harvest Total
Year Fishing Location Reported Estimated Chinook Sockeye Coho Chum Pink Salmon2002 District 2 2 3 0 20 0 0 0 202002 Karta River 2 3 0 20 0 0 0 202002 District 3 79 104 1 3,426 24 76 20 3,5462002 Klawock River 75 98 1 3,321 24 76 20 3,4412002 Deweyville 4 5 0 105 0 0 0 1052002 District 6 29 38 0 260 0 0 0 2602002 Hatchery Ck Sweethrt 29 38 0 260 0 0 0 260 All Districts Total 1 3,705 24 76 20 3,826Source: ADF&G Division of Subsistence, Alaska Subsistence Fisheries Database, Version 3.3
The estimated overall subsistence salmon harvest for Klawock dropped slightly in 2002, over 2001. In the years since 1996 when the Division applied an expansion factor, the harvest estimates declined in 1997 and 1998. Prior to 1996 the data are not comparable since they are unexpanded.

209
In Hydaburg estimated harvests based on amounts reported on the subsistence salmon permits have declined in the past two years. The 2002 estimate is well below the 5- and 10-year averages, as well as the all-year average. The decline in the estimated number of permits issued to Hydaburg residents continued in 2002 dropping from 26 in 2001 to just 19. Hydaburg relied on Hetta Inlet and Creek, and Eek Creek for 93 percent of its sockeye salmon in 2002. Table XIII-32. Hydaburg Community Subsistence/Personal Use Salmon Permit Estimated Harvest, 2002 Permits Fished Estimated Harvest Total
Year Fishing Location Reported Estimated Chinook Sockeye Coho Chum Pink Salmon2002 District 3 14 19 0 796 0 0 0 7962002 Klakas Lake Creek 1 1 0 53 0 0 0 532002 Eek Creek 3 4 0 206 0 0 0 2062002 Hetta Inlet 8 11 0 386 0 0 0 3862002 Hetta Lake Creek 2 3 0 152 0 0 0 152 All Districts Total 0 796 0 0 0 796Source: ADF&G Division of Subsistence, Alaska Subsistence Fisheries Database, Version 3.3
KETCHIKAN MANAGEMENT AREA
KASAAN SUBSISTENCE AND EASTERN PRINCE OF WALES PERSONAL USE FISHERIES
Clarence Strait/East Prince of Wales Island: Kegan Lake, Thorne River, Karta River in District 2;
and Hatchery Creek-Sweetheart Creek in District 6
Background and History
The subsistence area on the east coast of Prince of Wales Island, identified by the Board of Fisheries as having “customary and traditional use” of salmon were the Kasaan area waters of District 2 north of the latitude of the northernmost tip of Chasina Point and west of a line from the northernmost tip of Chasina Point to the easternmost tip of Grindall Island to the easternmost tip of the Kasaan Peninsula (5AAC 01.716 (12)). Salmon fishing in all other marine waters along the east coast of Prince of Wales Island occurs under personal use regulations. The principal waters used for salmon fishing in District 6 along the east coast of Prince of Wales Island are the Kegan Lake, Thorne River, and Hatchery Creek-Sweetheart Creek (Figure XIII-4)

210
The population and number of households of the communities of Prince of Wales Island that use these waters are:
Community Population Households Community Population Households Coffman Cove 199 63 Kasaan 39 17 Craig [1] 1,725 631 Klawock 854 313 Edna Bay 49 19 Thorne Bay 557 219 Hollis 139 55 Whale Pass 58 22 Hydaburg 382 133
Source: U.S. Census of Population, 2000 [1] Alaska Native Village Statistical Area, includes population on Port St. Nicholas Rd and other suburbs of City of Craig.
Regulations
The 2002 subsistence/personal use salmon permit for the Ketchikan Management Area provided for an open season on the Karta River from June 15 through July 15. Harvest “possession” limits for individuals and households were as follows: in Karta River – sockeye 10/15; in all streams in the Hydaburg, Kasaan, and Craig/Klawock Subsistence Areas – pinks - 100/150, chum – 20/25. For the areas not included in the “customary and traditional use” areas, salmon fishing takes place under personal use regulations. The 2002 permit provided for open season for sockeye in Kegan Lake and the Thorne River from June 1 through July 31, in Dolomi Lake (north of Moira Sound) from June 1 through July 15, and in Hatchery Creek from June 1 through June 30.
Harvest Assessment Program
As reported in Table XIII-33 the estimated salmon harvest in the Kasaan subsistence area and other marine waters in the eastern portions of Prince of Wales Island (District 2, and Hatchery Creek (Dist. 6) in 2002 was 2,155 salmon, (down from 3,297 in 2001) including 1,776 sockeye (86.3 percent), no chinook, 13 coho (0.4 percent), 343 pink (10.4 percent), and 94 chum (2.8 percent). Thorne Bay residents accounted for the majority (33.7 percent) of permits reporting salmon harvests in these waters. But other east Prince of Wales Island residents participated only modestly in the personal use salmon fisheries of District 2 and Hatchery Creek (Dist. 6). Besides Thorne Bay, Craig, Klawock and Ketchikan residents reported salmon harvests in these waters. In 2002 Craig’s share of the salmon harvested in these fisheries comprised 18 percent of the estimated harvest based on returned permits, and Klawock’s share of the estimated salmon harvest comprised 13.0 percent. Coffman Cove’s share of the harvest from these waters amounted to just 6.5 percent of the harvest that year, Kasaan’s share – just 3.9 percent. Ketchikan permits reported harvesting from District 2 and Hatchery Creek (Dist. 6) waters, their reported harvest represented almost 11 percent of the total from that area in 2002.
Table XIII-34 through Table XIII-37 show the location of 2002 salmon harvests for the communities of Coffman Cove, Kasaan and Thorne Bay. Coffman Cove harvested salmon exclusively from Hatchery Creek. Hatchery Creek was the main source of Thorne Bay’s salmon in 2001. Kasaan caught most of its salmon in Old Tom Creek in Kasaan Bay. In 2002 Edna

211
Bay, Naukati Bay and Whale Pass did not report salmon harvests on subsistence/personal use salmon permits.
Table XIII-33. Clarence Strait/East Prince of Wales Island - District 2, plus Portion District 6 Kasaan & Eastern Prince of Wales Area Subsistence/Personal Use Salmon Permit Estimated Harvest, by
Community 2002 Permits Fished Estimated Harvest Total Percent of
Year Community Reported Estimated Chinook Sockeye Coho Chum Pink Salmon Total2002 Thorne Bay 49 55 0 684 23 0 20 727 33.7%2002 Craig 35 43 0 265 2 7 116 390 18.1%2002 Klawock 31 40 0 279 0 0 0 279 13.0%2002 Ketchikan** 24 27 0 241 0 0 3 245 11.4%2002 Hollis 7 8 0 28 5 0 202 235 10.9%2002 Kasaan 4 4 0 85 0 0 0 85 3.9%2002 Coffman Cove 15 16 0 141 0 0 0 141 6.5%2002 Anchorage 1 1 0 27 0 0 0 27 1.2%2002 Metlakatla 2 2 0 20 0 0 0 20 0.9%2002 Naukati Bay 1 1 0 6 0 0 0 6 0.3%
169 199 0 1,776 30 7 342 2,155 100.0% Percent of Total 0.0% 82.4% 1.4% 0.3% 15.8% 100.0% ** Includes Ward Cove Source: ADF&G Division of Subsistence, Alaska Subsistence Fisheries Database, Version 3.3 Table XIII-34. Coffman Cove Community Subsistence/Personal Use Salmon Permit Estimated Harvest, 2002 Permits Fished Estimated Harvest Total
Year Fishing Location Reported Estimated Chinook Sockeye Coho Chum Pink Salmon2002 District 6 15 16 0 141 0 0 0 1412002 Hatchery Ck Sweethrt 15 16 0 141 0 0 0 141 All Districts Total 0 141 0 0 0 141 Table XIII-35. Kasaan Community Subsistence/Personal Use Salmon Permit Estimated Harvest, 2002 Permits Fished Estimated Harvest Total
Year Fishing Location Reported Estimated Chinook Sockeye Coho Chum Pink Salmon2002 District 2 3 3 0 65 0 0 0 652002 Kasaan Bay 3 3 0 65 0 0 0 652002 Karta River 3 3 0 65 0 0 0 652002 District 3 8 8 0 266 0 0 0 2662002 Sarkar 8 8 0 266 0 0 0 2662002 District 6 1 1 0 20 0 0 0 202002 Hatchery Ck Sweethrt 1 1 0 20 0 0 0 20 All Districts Total 0 351 0 0 0 351Source: ADF&G Division of Subsistence, Alaska Subsistence Fisheries Database, Version 3.3
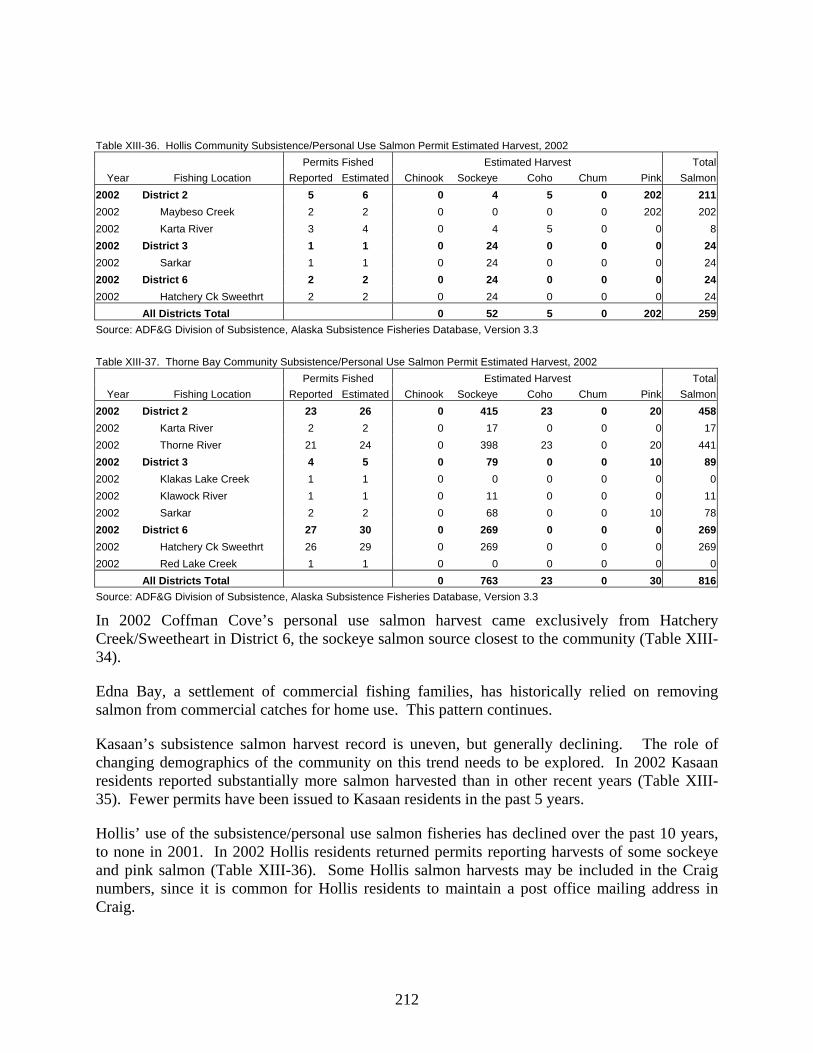
212
Table XIII-36. Hollis Community Subsistence/Personal Use Salmon Permit Estimated Harvest, 2002 Permits Fished Estimated Harvest Total
Year Fishing Location Reported Estimated Chinook Sockeye Coho Chum Pink Salmon2002 District 2 5 6 0 4 5 0 202 2112002 Maybeso Creek 2 2 0 0 0 0 202 2022002 Karta River 3 4 0 4 5 0 0 82002 District 3 1 1 0 24 0 0 0 242002 Sarkar 1 1 0 24 0 0 0 242002 District 6 2 2 0 24 0 0 0 242002 Hatchery Ck Sweethrt 2 2 0 24 0 0 0 24 All Districts Total 0 52 5 0 202 259Source: ADF&G Division of Subsistence, Alaska Subsistence Fisheries Database, Version 3.3 Table XIII-37. Thorne Bay Community Subsistence/Personal Use Salmon Permit Estimated Harvest, 2002 Permits Fished Estimated Harvest Total
Year Fishing Location Reported Estimated Chinook Sockeye Coho Chum Pink Salmon2002 District 2 23 26 0 415 23 0 20 4582002 Karta River 2 2 0 17 0 0 0 172002 Thorne River 21 24 0 398 23 0 20 4412002 District 3 4 5 0 79 0 0 10 892002 Klakas Lake Creek 1 1 0 0 0 0 0 02002 Klawock River 1 1 0 11 0 0 0 112002 Sarkar 2 2 0 68 0 0 10 782002 District 6 27 30 0 269 0 0 0 2692002 Hatchery Ck Sweethrt 26 29 0 269 0 0 0 2692002 Red Lake Creek 1 1 0 0 0 0 0 0 All Districts Total 0 763 23 0 30 816Source: ADF&G Division of Subsistence, Alaska Subsistence Fisheries Database, Version 3.3
In 2002 Coffman Cove’s personal use salmon harvest came exclusively from Hatchery Creek/Sweetheart in District 6, the sockeye salmon source closest to the community (Table XIII-34).
Edna Bay, a settlement of commercial fishing families, has historically relied on removing salmon from commercial catches for home use. This pattern continues.
Kasaan’s subsistence salmon harvest record is uneven, but generally declining. The role of changing demographics of the community on this trend needs to be explored. In 2002 Kasaan residents reported substantially more salmon harvested than in other recent years (Table XIII-35). Fewer permits have been issued to Kasaan residents in the past 5 years.
Hollis’ use of the subsistence/personal use salmon fisheries has declined over the past 10 years, to none in 2001. In 2002 Hollis residents returned permits reporting harvests of some sockeye and pink salmon (Table XIII-36). Some Hollis salmon harvests may be included in the Craig numbers, since it is common for Hollis residents to maintain a post office mailing address in Craig.

213
Thorne Bay subsistence salmon harvests also show a steady decline over the past ten years, as have the numbers of permits issued and returned. The 2002 estimated harvests are up modestly from 2001 (Table XIII-37), but still well under the 5-, 10- and all-year averages.
The record of subsistence salmon harvests for Whale Pass is uneven. For three years, 1991, 2000 and 2002, no permits were issued to Whale Pass residents. It is possible that some Whale Pass harvests may be included with the Point Baker or Ketchikan harvests, since some may keep a post office mailing address in one of those places.
KETCHIKAN MANAGEMENT AREA
SAXMAN & METLAKATLA SUBSISTENCE AND KETCHIKAN PERSONAL USE FISHERIES
Ketchikan/Behm Canal – District 1
Herring Cove, Wolverine Creek
Background and History
The Ketchikan Management Area is responsible for the subsistence and personal use salmon fisheries in Districts 1, 2, 3, and 6. The Board of Fisheries recognized “customary and traditional use” of salmon stocks in the waters used by the Tongass Tlingit of Saxman: waters of the Naha River, and Boca de Quadra in the waters of Sockeye Creek and Hugh Smith Lake, and within 500 yards of the terminus of Sockeye Creek (5AAC 01.716 (19)). Sockeye salmon fisheries in Helm, McDonald, and Checates lakes, and pink and chum salmon fisheries in all streams in the Ketchikan Management Area except along the Ketchikan road systems and in subsistence areas described above, are managed under personal use regulations (Figure XIII-4).
The communities of Ketchikan and Saxman are the principal users of these fisheries. In 2000 the population of the City and Borough of Ketchikan, excluding Saxman, was 13,639 in 5,272 households. Saxman, located within the Ketchikan Borough, had a population of 431 in 127 households.
Regulations
The Subsistence/Personal Use Salmon Permit for the Ketchikan Management Area provided for an open season for sockeye salmon in Hugh Smith Lake from June 22 through July 12, and in the Naha River from June 1 through July 15; and in the Checates, Dolomi, and Mahoney lakes from

214
June 1 through July 15. Helm Lake, at the southeast end of the Cleveland Peninsula, had an open sockeye season from June 15 through July 15. There was an open season for pink salmon from July 1 through September 30, and for chum salmon from July 1 through October 31 on all streams in the Ketchikan Management Area, except along the Ketchikan road system and subsistence areas, and in the Hydaburg, Kasaan, Naha, Hugh Smith Lake and Craig/Klawock Subsistence area. Harvest “possession” limits for individuals and households were as follows: in the Naha River, Dolomi, Hugh Smith and Mahoney lakes – sockeye – 6/12; in Helm Lake – sockeye – 6/10; in Checates Lake – sockeye – 10/10; in McDonald Lake (Yes Bay) –sockeye – 25/50. For pinks the possession limits were 100/150, and for chums, 20/25.
Harvest Assessment Program
As reported in Table XIII-38 the estimated salmon harvest in the Ketchikan/Saxman area in 2002 (District 1) was 6,404 (down from 10,599 in 2001), including 4,208 sockeye (65.7 percent), 205 chinook (3.2 percent), 43 coho (0.7 percent), 712 chum (11.1 percent) and 1,236 pink (19.3 percent). Most permits were issued to residents of Ketchikan, and Ketchikan residents harvested most of the salmon reported on the permits (94.8 percent). Saxman does not appear in the database, likely due to the fact that zip code for Saxman is the same as for Ketchikan.
Table XIII-38. Ketchikan/Behm Canal - District 1 Ketchikan Area Subsistence/Personal Use Salmon Permit Estimated Harvest, by Community 2002
Permits Fished Estimated Harvest Total Percent ofYear Community Reported Estimated Chinook Sockeye Coho Chum Pink Salmon Total
2002 Barrow 1 1 0 27 0 0 0 27 0.4%2002 Ketchikan** 187 209 205 3,923 38 693 1,214 6,073 94.8%2002 Saxman 7 10 0 221 3 17 17 259 4.0%2002 Sitka 1 1 0 2 2 0 4 8 0.1%2002 Ward Cove 1 1 0 35 0 0 0 35 0.5%2002 Wasilla 1 1 0 0 0 1 1 2 0.0% 198 223 205 4,208 43 712 1,236 6,404 100.0% Percent of Total 3.2% 65.7% 0.7% 11.1% 19.3% 100.0% ** Includes Ward Cove Source: ADF&G Division of Subsistence, Alaska Subsistence Fisheries Database, Version 3.3
Table XIII-39 shows the location of 2001 salmon harvests for Ketchikan. The most heavily used location was at Wolverine Creek that flows out of McDonald Lake into Yes Bay. But Ketchikan residents traveled widely to obtain their salmon for home use.

215
Table XIII-39. Ketchikan* Community Subsistence/Personal Use Salmon Permit Estimated Harvest, 2002 Permits Fished Estimated Harvest Total
Year Fishing Location Reported Estimated Chinook Sockeye Coho Chum Pink Salmon2002 District 1 188 210 205 3,958 38 693 1,214 6,1082002 Herring Cove 11 12 190 1 0 4 0 1962002 Mahoney Lake Creek 2 2 0 1 0 0 0 12002 Wolverine Creek 170 190 15 3,942 38 682 1,174 5,8512002 Naha River 4 4 0 13 0 7 40 602002 Helm Bay Head 1 1 0 0 0 0 0 02002 District 2 16 18 0 168 0 0 3 1712002 Kegan Cove 15 17 0 168 0 0 0 1682002 Harris River 1 1 0 0 0 0 3 32002 District 3 27 30 0 662 1 0 0 6632002 Klakas Lake Creek 5 6 0 23 0 0 0 232002 Eek Creek 3 3 0 85 0 0 0 852002 Hetta Inlet 4 4 0 82 0 0 0 822002 Klawock River 8 9 0 344 1 0 0 3452002 Sarkar 6 7 0 117 0 0 0 1172002 Deweyville 1 1 0 10 0 0 0 102002 District 5 1 1 0 12 0 0 0 122002 Shipley Bay Lk Ck 1 1 0 12 0 0 0 122002 District 6 9 10 0 74 10 0 0 842002 Hatchery Ck Sweethrt 8 9 0 74 0 0 0 742002 District 9 1 1 0 42 0 0 0 422002 Falls Ck Baranof Is 1 1 0 42 0 0 0 422002 District 11 1 3 0 9 0 0 0 92002 Sweetheart Creek 1 3 0 9 0 0 0 92002 District 13 1 2 0 72 0 0 0 722002 Lake Stream Ford Arm 1 2 0 72 0 0 0 722002 District 15 1 1 0 9 0 1 1 112002 Chilkat Inlet 1 1 0 9 0 1 1 11 All Districts Total 205 5,005 49 694 1,219 7,172* Includes Ward Cove Source: ADF&G Division of Subsistence, Alaska Subsistence Fisheries Database, Version 3.3
Ketchikan’s historic personal use salmon harvest grew steadily through 1994. Since then amounts declined in 1995-96, rose modestly in 1997, declined again during 1998 and 1999. In 2002 Ketchikan’s harvest dropped substantially from 2001 levels, and was well below the 5-year, 10-year, and all-year averages. Number of permits returned has dropped in recent years.

216

217
REFERENCES CITED Alaska Department of Fish and Game
1985 Alaska Habitat Management Guide Reference Maps, Southwest Region, Volume IV: Human Use of Fish and Wildlife. Division of Habitat. Juneau.
2001 From Neqa to Tepa: A Database with Traditional Knowledge about the Fish of
Bristol Bay. Version 1.0. Alaska Department of Fish and Game, Division of Subsistence. Juneau.
2002a Customary and Traditional Use Worksheet: Salmon: Chignik Management Area.
Report prepared by the Division of Subsistence for the Alaska Board of Fisheries, Anchorage, AK, January 2002.
2002b Customary and Traditional Use Worksheet: Salmon: Chitina Subdistrict, Prince
William Sound Management Area. Report prepared by the Division of Subsistence for the Alaska Board of Fisheries, Cordova, December 2002. [meeting postponed until January 2003]
2002c Alaska Subsistence Fisheries 2000 Annual Report. Division of Subsistence. Juneau.
n.d.a The Salmon Fishing People of the Yukon River. Wildlife Use Notebook Series No.
1. Division of Subsistence, Alaska Department of Fish and Game. Juneau. n.d.b Salmon Fishing Methods of the Yukon River. Wildlife Use Notebook Series No. 2.
Division of Subsistence, Alaska Department of Fish and Game. Juneau. n.d.a Family Fish Camps of the Yukon River. Wildlife Use Notebook Series No. 3.
Division of Subsistence, Alaska Department of Fish and Game. Juneau.
Alaska Department of Fish and Game and the Alaska Inter-Tribal Council (ADF&G and AI-TC) 2000a Recommendations for a Unified Subsistence Fisheries Harvest Assessment Program.
Developed by the Subsistence Fisheries Harvest Assessment Working Group for the Office of Subsistence Management, US Fish and Wildlife Service. Project No. FIS00-017. Anchorage.
2000b Statewide Subsistence Fisheries Harvest Monitoring Strategy: Final Report.
Prepared by the Subsistence Fisheries Harvest Assessment Working Group for the Office of Subsistence Management, US Fish and Wildlife Service. Project No. FIS00-017. Anchorage.
Brase, Audra L.J. and Helen H. Hamner
2003 Subsistence and Personal Use Salmon Harvests in the Alaska Portion of the Yukon River Drainage, 2002. Regional Information Report 3A03-13. Alaska Department of Fish and Game, Division of Commercial Fisheries. Anchorage.

218
Bristol Bay Native Association and Alaska Department of Fish and Game (BBNA and ADF&G) 1996 The Harvest and Use of Freshwater Fish in Togiak and Manokotak, 1994 – 95.
Natural Resource Department, Bristol Bay Native Association and Division of Subsistence, Alaska Department of Fish and Game. Dillingham.
Caylor, David A. and Robert J. Walker
2003 Alaska Subsistence Fisheries Database. Version 3.2 for Microsoft Access 2000. Alaska Department of Fish and Game, Division of Subsistence. Juneau.
Coffing, Michael W.
1991 Kwethluk Subsistence: Contemporary Land Use Patterns, Wild Resource Harvest and Use, and the Subsistence Economy of a Lower Kuskokwim River Area Community. Alaska Department of Fish and Game, Division of Subsistence Technical Paper No. 157. Juneau.
Fall, James A., Dan J. Foster, and Ronald T. Stanek
1984 The Use of Fish and Wildlife Resources in Tyonek, Alaska. Alaska Department of Fish and Game, Division of Subsistence Technical Paper No. 105. Juneau.
Fall, James A., Janet Schichnes, Molly Chythlook, and Robert J. Walker
1986 Patterns of Wild Resource Uses in Dillingham: Hunting and Fishing in an Alaskan Regional Center. Alaska Department of Fish and Game, Division of Subsistence Technical Paper No. 135. Juneau.
Fall, James A., Rachel Mason, Terry Haynes, Vicki Vanek, Louis Brown, Gretchen Jennings, Craig Mishler, and Charles Utermohle
1993a Noncommercial Harvests and Uses of Wild Resources in King Cove, Alaska, 1992. Alaska Department of Fish and Game, Division of Subsistence Technical Paper No. 227. Juneau.
Fall, James A., David B. Andersen, Louis Brown, Michael Coffing, Gretchen Jennings, Craig Mishler, Amy Paige, Charles Utermohle, and Vicki Vanek
1993b Noncommercial Harvests and Uses of Wild Resources in Sand Point, Alaska, 1992. Alaska Department of Fish and Game, Division of Subsistence Technical Paper No. 226. Juneau.
Fall, James A., Lisa B. Hutchinson-Scarbrough, and Philippa A. Coiley
1995 Fish and Wildlife Harvest and Use in Five Alaska Peninsula Communities, 1989. Alaska Department of Fish and Game, Division of Subsistence Technical Paper No. 202. Juneau.
Fall, James A., Molly B. Chythlook, Janet C. Schichnes, and Judith M. Morris
1996 An Overview of the Harvest and Use of Freshwater Fish by the Communities of the Bristol Bay Region, Southwest Alaska. Alaska Department of Fish and Game, Division of Subsistence Technical Paper No. 166. Juneau.

219
Fall, James A. and Molly B. Chythlook 1997 An Overview of the Subsistence Fisheries of the Bristol Bay Management Area.
Report to the Alaska Board of Fisheries, King Salmon, AK, November 1997. Alaska Department of Fish and Game, Division of Subsistence, Anchorage and Dillingham.
Hammarstrom, Lee F. and Mark S. Dickson
2003 2002 Lower Cook Inlet Annual Finfish Management Report. Alaska Department of Fish and Game, Division of Commercial Fisheries Regional Information Report 2A03-04. Anchorage.
Hutchinson-Scarbrough, Lisa B. and James A. Fall
1996 An Overview of Subsistence Salmon and Other Subsistence Fisheries of the Chignik Management Area, Alaska Peninsula, southwest Alaska. Alaska Department of Fish and Game, Division of Subsistence Technical Paper No. 230. Juneau.
1999 Interim Progress Report: Supplemental Information on Subsistence Uses of Salmon
in the Chignik Management Area by the Residents of Perryville, Southwest Alaska. Report to the Alaska Board of Fisheries, Fairbanks, October 1999. Alaska Department of Fish and Game, Division of Subsistence. Anchorage.
Jones, Wesley
2002 2002 Kotzebue Sound Salmon Season Summary. Memo to Dan Bergstrom, Regional Management Biologist, Division of Commercial Fisheries, Alaska Department of Fish and Game, Anchorage, Alaska. October 1, 2002.
Kenner, Philippa Coiley, Theodore M. Krieg, Molly B. Chythlook, and Gretchen Jennings
2003 Wild Resource Harvests and Uses by Residents of Manokotak, Togiak, and Twin Hills, 1999/2000. Alaska Department of Fish and Game, Division of Subsistence Technical Paper Number 275. Juneau.
Magdanz, James S., Sandra Tahbone, Kurt Kamletz, and Austin Ahmasuk
2003 Subsistence Salmon Fishing by Residents of Nome, Alaska, 2001. Technical Paper No. 274, Division of Subsistence, Alaska Department of Fish and Game, Juneau, Alaska, and Natural Resources Department, Kawerak, Inc., Nome, Alaska.
Menard, Jim
2002 2002 Norton Sound Salmon Season Summary. Memo to Dan Bergstrom, Regional Management Biologist, Division of Commercial Fisheries, Alaska Department of Fish and Game, Anchorage, Alaska. October 1, 2002.
Morris, Judith M.
1987 Fish and Wildlife Uses in Six Alaska Peninsula Communities: Egegik, Chignik, Chignik Lagoon, Chignik Lake, Perryville, and Ivanof Bay. Alaska Department of Fish and Game, Division of Subsistence Technical Paper No. 151. Juneau.

220
Quimby, Alan and David L. Owen 1994 Chignik Management Area Annual Finfish Report. Alaska Department of Fish and
Game, Division of Commercial Fisheries. Regional Information Report No. 4K94-37. Kodiak.
Schichnes, Janet and Molly Chythlook
1988 Wild Resource Uses in Manokotak, Southwest Alaska. Alaska Department of Fish and Game, Division of Subsistence Technical Paper No. 152. Juneau.
1991 Contemporary Use of Fish and Wildlife in Ekwok, Koliganek, and New Stuyahok,
Alaska. Alaska Department of Fish and Game, Division of Subsistence Technical Paper No. 185. Juneau.
Scott, Cheryl L., Louis A. Brown, Gretchen B. Jennings, and Charles J. Utermohle
2001 Community Profile Database for Access 2000. Version 3.12. Alaska Department of Fish and Game, Division of Subsistence. Juneau.
Simeone, William E. and James A. Fall
1996 Patterns and Trends in the Subsistence Salmon Fishery of the Upper Copper River, Alaska. Report to the Alaska Board of Fisheries, Cordova, Alaska, December 1996. Alaska Department of Fish and Game, Division of Subsistence. Anchorage.
Stanek, Ronald T.
1985 Patterns of Wild Resource Use in English Bay and Port Graham, Alaska. Alaska Department of Fish and Game, Division of Subsistence Technical Paper No. 104. Juneau.
United States Bureau of the Census
2001 Profiles of General Demographic Characteristics 2000: Alaska. U.S. Department of Commerce.
Wolfe, Robert J.
2000 Subsistence in Alaska: A Year 2000 Update. Alaska Department of Fish and Game, Division of Subsistence. Juneau.
Wright, John M. and Molly Chythlook
1985 Subsistence Harvests of Herring Spawn on Kelp in the Togiak District of Bristol Bay. Alaska Department of Fish and Game, Division of Subsistence Technical Paper No. 116. Juneau.
Wright, John M., Judith Morris, and Robert Schroeder.
1985 Bristol Bay Regional Subsistence Profile. Alaska Department of Fish and Game, Division of Subsistence Technical Paper No. 114. Juneau.


![The Alaska daily empire. (Juneau, Alaska). 1920-04-20 [p 7].](https://static.fdocuments.net/doc/165x107/628dcc8573409f183b341bd5/the-alaska-daily-empire-juneau-alaska-1920-04-20-p-7.jpg)


