Alaska Forward: Phase I Situational Analysis - Alaska Municipal
148
Alaska Forward: Phase I Situational Analysis Prepared For: Alaska Partnership for Economic Development
Transcript of Alaska Forward: Phase I Situational Analysis - Alaska Municipal

Alaska Forward: Phase I Situational Analysis
Prepared For:
Alaska Partnership for Economic Development

A L A S K A F O R W A R D : P H A S E I S I T U A T I O N A L A N A L Y S I S
W W W . I H S G L O B A L I N S I G H T . C O M i
TA B L E O F C O N T E N T S
EExxeeccuuttiivvee SSuummmmaarryy .. .. .. .. .. .. .. .. .. .. .. .. .. .. .. .. .. .. .. .. .. .. .. .. .. .. .. .. .. .. .. .. .. .. .. .. .. .. .. .. .. .. .. .. .. .. .. .. .. .. .. .. .. .. ..11
About this Report . . . . . . . . . . . . . . . . . . . . . . . . . . . . . . . . . . . . . . . . . . . . . . . . . . . . . . . . . . . . . . . . . . .1Key Findings . . . . . . . . . . . . . . . . . . . . . . . . . . . . . . . . . . . . . . . . . . . . . . . . . . . . . . . . . . . . . . . . . . . . . . .1Existing Economic Development Objectives and Strategies . . . . . . . . . . . . . . . . . . . . . . . . . . . . . . . . . .2Comparison with Best Economic Development Practices in Other Regions . . . . . . . . . . . . . . . . . . . . . .4Assessment of Entrepreneurship and Business Climate . . . . . . . . . . . . . . . . . . . . . . . . . . . . . . . . . . . . .5The Economy . . . . . . . . . . . . . . . . . . . . . . . . . . . . . . . . . . . . . . . . . . . . . . . . . . . . . . . . . . . . . . . . . . . . . .5Global Opportunities . . . . . . . . . . . . . . . . . . . . . . . . . . . . . . . . . . . . . . . . . . . . . . . . . . . . . . . . . . . . . . . . .7Alaska's Clusters . . . . . . . . . . . . . . . . . . . . . . . . . . . . . . . . . . . . . . . . . . . . . . . . . . . . . . . . . . . . . . . . . . .8Economic Foundations . . . . . . . . . . . . . . . . . . . . . . . . . . . . . . . . . . . . . . . . . . . . . . . . . . . . . . . . . . . . . . .9Conclusion: A Path Forward . . . . . . . . . . . . . . . . . . . . . . . . . . . . . . . . . . . . . . . . . . . . . . . . . . . . . . . . . .10
Looking Forward . . . . . . . . . . . . . . . . . . . . . . . . . . . . . . . . . . . . . . . . . . . . . . . . . . . . . . . . . . . . . . . . .11Moving Forward: Toward What Kind of Economy? . . . . . . . . . . . . . . . . . . . . . . . . . . . . . . . . . . . . . . .11Three Strategic Thrusts . . . . . . . . . . . . . . . . . . . . . . . . . . . . . . . . . . . . . . . . . . . . . . . . . . . . . . . . . . .12Next Steps . . . . . . . . . . . . . . . . . . . . . . . . . . . . . . . . . . . . . . . . . . . . . . . . . . . . . . . . . . . . . . . . . . . . .13
IInnttrroodduuccttiioonn,, OObbjjeeccttiivveess,, aanndd MMeetthhooddoollooggyy .. .. .. .. .. .. .. .. .. .. .. .. .. .. .. .. .. .. .. .. .. .. .. .. .. .. .. .. .. .. .. .. .. .. .. .. ..1155
AAnnaallyyssiiss ooff EExxiissttiinngg EEccoonnoommiicc DDeevveellooppmmeenntt OObbjjeeccttiivveess aanndd SSttrraatteeggiieess .. .. .. .. .. .. .. .. .. .. .. .. .. .. ..1166
Key Organizations Responsible for Economic Development: An Overview . . . . . . . . . . . . . . . . . . . . . .16Addressing the Challenge: From Decentralized Approaches to a Leadership Model . . . . . . . . . . . . .18Economic Objectives and Strategies . . . . . . . . . . . . . . . . . . . . . . . . . . . . . . . . . . . . . . . . . . . . . . . . .19Examples of Past Statewide Economic Development Planning . . . . . . . . . . . . . . . . . . . . . . . . . . . .22
Assessment of Strengths and Weaknesses of the State's Economic Development Organizations . . .26Survey Results . . . . . . . . . . . . . . . . . . . . . . . . . . . . . . . . . . . . . . . . . . . . . . . . . . . . . . . . . . . . . . . . . .26Economic Development Organization Interviews . . . . . . . . . . . . . . . . . . . . . . . . . . . . . . . . . . . . . . .26Summary of Major Themes . . . . . . . . . . . . . . . . . . . . . . . . . . . . . . . . . . . . . . . . . . . . . . . . . . . . . . . .27Industry Association Interviews . . . . . . . . . . . . . . . . . . . . . . . . . . . . . . . . . . . . . . . . . . . . . . . . . . . . .30Web Survey Results . . . . . . . . . . . . . . . . . . . . . . . . . . . . . . . . . . . . . . . . . . . . . . . . . . . . . . . . . . . . . .31Conclusions and Common Themes . . . . . . . . . . . . . . . . . . . . . . . . . . . . . . . . . . . . . . . . . . . . . . . . . .32Implications for Alaska EDOs . . . . . . . . . . . . . . . . . . . . . . . . . . . . . . . . . . . . . . . . . . . . . . . . . . . . . . .33
Key Strengths and Challenges of Existing Organizations . . . . . . . . . . . . . . . . . . . . . . . . . . . . . . . . . . . .34Need for Leadership and Coordination . . . . . . . . . . . . . . . . . . . . . . . . . . . . . . . . . . . . . . . . . . . . . . .34Need for Explicit Goals and Strategies . . . . . . . . . . . . . . . . . . . . . . . . . . . . . . . . . . . . . . . . . . . . . . . .35Need to Integrate Short-term and Long-term Initiatives . . . . . . . . . . . . . . . . . . . . . . . . . . . . . . . . . .35Challenges of Geographic Isolation . . . . . . . . . . . . . . . . . . . . . . . . . . . . . . . . . . . . . . . . . . . . . . . . . .36Challenges Supporting and Adding Value to Existing Industries . . . . . . . . . . . . . . . . . . . . . . . . . . . .36Developing an Institutional Framework to Elevate the Impact of Knowledge-based Industries . . . .37
CCoommppaarriissoonn wwiitthh BBeesstt EEccoonnoommiicc DDeevveellooppmmeenntt PPrraaccttiicceess iinn OOtthheerr RReeggiioonnss .. .. .. .. .. .. .. .. .. .. .. ..3388
Addressing Alaska's need for Economic Development Leadership and Coordination: The Puget SoundProsperity Partnership's Approach . . . . . . . . . . . . . . . . . . . . . . . . . . . . . . . . . . . . . . . . . . . . . . . . . . . . .38Addressing Alaska's Need for Explicit Economic Development Goals and Strategies: Oregon's Approach 41Addressing Alaska's Need to Integrate Short- and Long-term Initiatives: Alberta's Approach . . . . . . . .44

ii
Addressing Alaska's Challenge of Geographic Isolation: Chile's Approach . . . . . . . . . . . . . . . . . . . . . .47Addressing Alaska's Challenge of Adding Value to Existing Industries: Austin's Approach . . . . . . . . . .49Addressing Alaska's Need to Develop an Institutional Framework to Elevate the Impact of Knowledgein Regional Iindustries: North Carolina's Approach . . . . . . . . . . . . . . . . . . . . . . . . . . . . . . . . . . . . . . . .51
AAsssseessssmmeenntt ooff EEnnttrreepprreenneeuurrsshhiipp aanndd BBuussiinneessss CClliimmaattee .. .. .. .. .. .. .. .. .. .. .. .. .. .. .. .. .. .. .. .. .. .. .. .. .. .. ..5577
Factors Affecting Economic Vitality . . . . . . . . . . . . . . . . . . . . . . . . . . . . . . . . . . . . . . . . . . . . . . . . . . . . .57The Business Environment for Start-ups . . . . . . . . . . . . . . . . . . . . . . . . . . . . . . . . . . . . . . . . . . . . . . . .58
Frontier Spirit or Welfare State? . . . . . . . . . . . . . . . . . . . . . . . . . . . . . . . . . . . . . . . . . . . . . . . . . . . . .59
EEccoonnoommiicc PPrrooffiillee aanndd OOuuttllooookk .. .. .. .. .. .. .. .. .. .. .. .. .. .. .. .. .. .. .. .. .. .. .. .. .. .. .. .. .. .. .. .. .. .. .. .. .. .. .. .. .. .. .. .. .. .. ..6633
Macroeconomic Summary . . . . . . . . . . . . . . . . . . . . . . . . . . . . . . . . . . . . . . . . . . . . . . . . . . . . . . . . . . .63Gross State Product . . . . . . . . . . . . . . . . . . . . . . . . . . . . . . . . . . . . . . . . . . . . . . . . . . . . . . . . . . . . . . . .63Beyond GSP—Non-Mining Economy . . . . . . . . . . . . . . . . . . . . . . . . . . . . . . . . . . . . . . . . . . . . . . . . . . .65Population . . . . . . . . . . . . . . . . . . . . . . . . . . . . . . . . . . . . . . . . . . . . . . . . . . . . . . . . . . . . . . . . . . . . . . . .65Employment and Income . . . . . . . . . . . . . . . . . . . . . . . . . . . . . . . . . . . . . . . . . . . . . . . . . . . . . . . . . . . .66Alaska's Regional Structure . . . . . . . . . . . . . . . . . . . . . . . . . . . . . . . . . . . . . . . . . . . . . . . . . . . . . . . . . .69Alaska's Industry Structure . . . . . . . . . . . . . . . . . . . . . . . . . . . . . . . . . . . . . . . . . . . . . . . . . . . . . . . . . . .69
Oil and Gas Industry . . . . . . . . . . . . . . . . . . . . . . . . . . . . . . . . . . . . . . . . . . . . . . . . . . . . . . . . . . . . .71Military and Federal Non-Defense . . . . . . . . . . . . . . . . . . . . . . . . . . . . . . . . . . . . . . . . . . . . . . . . . . .73Transportation Sector . . . . . . . . . . . . . . . . . . . . . . . . . . . . . . . . . . . . . . . . . . . . . . . . . . . . . . . . . . . . .74Healthcare Sector . . . . . . . . . . . . . . . . . . . . . . . . . . . . . . . . . . . . . . . . . . . . . . . . . . . . . . . . . . . . . . .77Mining Sector (Excluding Oil and Gas) . . . . . . . . . . . . . . . . . . . . . . . . . . . . . . . . . . . . . . . . . . . . . . . .78Travel and Tourism Sector . . . . . . . . . . . . . . . . . . . . . . . . . . . . . . . . . . . . . . . . . . . . . . . . . . . . . . . . . .79Seafood Processing Sector . . . . . . . . . . . . . . . . . . . . . . . . . . . . . . . . . . . . . . . . . . . . . . . . . . . . . . . .80Commercial Fisheries . . . . . . . . . . . . . . . . . . . . . . . . . . . . . . . . . . . . . . . . . . . . . . . . . . . . . . . . . . . .80
GGlloobbaall OOppppoorrttuunniittiieess .. .. .. .. .. .. .. .. .. .. .. .. .. .. .. .. .. .. .. .. .. .. .. .. .. .. .. .. .. .. .. .. .. .. .. .. .. .. .. .. .. .. .. .. .. .. .. .. .. .. .. .. .. ..8822
Trade Trends . . . . . . . . . . . . . . . . . . . . . . . . . . . . . . . . . . . . . . . . . . . . . . . . . . . . . . . . . . . . . . . . . . . . . .82Commodity Composition of Alaska's Exports . . . . . . . . . . . . . . . . . . . . . . . . . . . . . . . . . . . . . . . . . . . .83Comparison to the Peer States . . . . . . . . . . . . . . . . . . . . . . . . . . . . . . . . . . . . . . . . . . . . . . . . . . . . . . . .83Alaska's Trading Partners . . . . . . . . . . . . . . . . . . . . . . . . . . . . . . . . . . . . . . . . . . . . . . . . . . . . . . . . . . . .84Major Commodity Exports by Destination . . . . . . . . . . . . . . . . . . . . . . . . . . . . . . . . . . . . . . . . . . . . . . .85Export Opportunities . . . . . . . . . . . . . . . . . . . . . . . . . . . . . . . . . . . . . . . . . . . . . . . . . . . . . . . . . . . . . . . .85What About Alaska's Imports? . . . . . . . . . . . . . . . . . . . . . . . . . . . . . . . . . . . . . . . . . . . . . . . . . . . . . . . .88
AAllaasskkaa''ss IInndduussttrryy CClluusstteerrss .. .. .. .. .. .. .. .. .. .. .. .. .. .. .. .. .. .. .. .. .. .. .. .. .. .. .. .. .. .. .. .. .. .. .. .. .. .. .. .. .. .. .. .. .. .. .. .. ..8899
A Cluster-Based Economic Development Approach . . . . . . . . . . . . . . . . . . . . . . . . . . . . . . . . . . . . . . . .89Cluster Identification and Analysis . . . . . . . . . . . . . . . . . . . . . . . . . . . . . . . . . . . . . . . . . . . . . . . . . . . . .90
Overview and Methodology . . . . . . . . . . . . . . . . . . . . . . . . . . . . . . . . . . . . . . . . . . . . . . . . . . . . . . . .90Data Sources and Methodology . . . . . . . . . . . . . . . . . . . . . . . . . . . . . . . . . . . . . . . . . . . . . . . . . . . .91Cluster Identification . . . . . . . . . . . . . . . . . . . . . . . . . . . . . . . . . . . . . . . . . . . . . . . . . . . . . . . . . . . . .92Cluster Segmentation . . . . . . . . . . . . . . . . . . . . . . . . . . . . . . . . . . . . . . . . . . . . . . . . . . . . . . . . . . . .92Star Clusters . . . . . . . . . . . . . . . . . . . . . . . . . . . . . . . . . . . . . . . . . . . . . . . . . . . . . . . . . . . . . . . . . . .94Opportunity Clusters . . . . . . . . . . . . . . . . . . . . . . . . . . . . . . . . . . . . . . . . . . . . . . . . . . . . . . . . . . . . .97Mature Clusters . . . . . . . . . . . . . . . . . . . . . . . . . . . . . . . . . . . . . . . . . . . . . . . . . . . . . . . . . . . . . . . . .97Challenge Clusters . . . . . . . . . . . . . . . . . . . . . . . . . . . . . . . . . . . . . . . . . . . . . . . . . . . . . . . . . . . . . .100
A L A S K A F O R W A R D : P H A S E I S I T U A T I O N A L A N A L Y S I S

A L A S K A F O R W A R D : P H A S E I S I T U A T I O N A L A N A L Y S I S
W W W . I H S G L O B A L I N S I G H T . C O M iii
Cluster Analysis by Region . . . . . . . . . . . . . . . . . . . . . . . . . . . . . . . . . . . . . . . . . . . . . . . . . . . . . . . .101Cluster Identification: Going Beyond the Data . . . . . . . . . . . . . . . . . . . . . . . . . . . . . . . . . . . . . . . . . . .108
EEccoonnoommiicc FFoouunnddaattiioonnss .. .. .. .. .. .. .. .. .. .. .. .. .. .. .. .. .. .. .. .. .. .. .. .. .. .. .. .. .. .. .. .. .. .. .. .. .. .. .. .. .. .. .. .. .. .. .. .. .. .. ..111100
Overview . . . . . . . . . . . . . . . . . . . . . . . . . . . . . . . . . . . . . . . . . . . . . . . . . . . . . . . . . . . . . . . . . . . . . . . .110Peer State Benchmarking . . . . . . . . . . . . . . . . . . . . . . . . . . . . . . . . . . . . . . . . . . . . . . . . . . . . . . . . . . .111Human Resources . . . . . . . . . . . . . . . . . . . . . . . . . . . . . . . . . . . . . . . . . . . . . . . . . . . . . . . . . . . . . . . . .111
Population . . . . . . . . . . . . . . . . . . . . . . . . . . . . . . . . . . . . . . . . . . . . . . . . . . . . . . . . . . . . . . . . . . . . .111Work Force and Source Population . . . . . . . . . . . . . . . . . . . . . . . . . . . . . . . . . . . . . . . . . . . . . . . . . .113Unemployment Rate . . . . . . . . . . . . . . . . . . . . . . . . . . . . . . . . . . . . . . . . . . . . . . . . . . . . . . . . . . . .113Wages . . . . . . . . . . . . . . . . . . . . . . . . . . . . . . . . . . . . . . . . . . . . . . . . . . . . . . . . . . . . . . . . . . . . . . .113Educational Attainment . . . . . . . . . . . . . . . . . . . . . . . . . . . . . . . . . . . . . . . . . . . . . . . . . . . . . . . . . . .113Occupational Forecast . . . . . . . . . . . . . . . . . . . . . . . . . . . . . . . . . . . . . . . . . . . . . . . . . . . . . . . . . . .114Nonresident Workers in Alaska . . . . . . . . . . . . . . . . . . . . . . . . . . . . . . . . . . . . . . . . . . . . . . . . . . . . .116The Workforce Development System . . . . . . . . . . . . . . . . . . . . . . . . . . . . . . . . . . . . . . . . . . . . . . . .117
Access to Capital . . . . . . . . . . . . . . . . . . . . . . . . . . . . . . . . . . . . . . . . . . . . . . . . . . . . . . . . . . . . . . . . . .117Small Business Lending and Micro Business Lending . . . . . . . . . . . . . . . . . . . . . . . . . . . . . . . . . . .118Venture Capital . . . . . . . . . . . . . . . . . . . . . . . . . . . . . . . . . . . . . . . . . . . . . . . . . . . . . . . . . . . . . . . . .119
Technology . . . . . . . . . . . . . . . . . . . . . . . . . . . . . . . . . . . . . . . . . . . . . . . . . . . . . . . . . . . . . . . . . . . . . . .119Technology Commercialization . . . . . . . . . . . . . . . . . . . . . . . . . . . . . . . . . . . . . . . . . . . . . . . . . . . . .120
Business Climate . . . . . . . . . . . . . . . . . . . . . . . . . . . . . . . . . . . . . . . . . . . . . . . . . . . . . . . . . . . . . . . . .120Change in the Number of Establishments . . . . . . . . . . . . . . . . . . . . . . . . . . . . . . . . . . . . . . . . . . . .122Business Starts and Closures . . . . . . . . . . . . . . . . . . . . . . . . . . . . . . . . . . . . . . . . . . . . . . . . . . . . .123Regulatory and Tax Issues . . . . . . . . . . . . . . . . . . . . . . . . . . . . . . . . . . . . . . . . . . . . . . . . . . . . . . . .123Utilities . . . . . . . . . . . . . . . . . . . . . . . . . . . . . . . . . . . . . . . . . . . . . . . . . . . . . . . . . . . . . . . . . . . . . . .125Environmental Protection . . . . . . . . . . . . . . . . . . . . . . . . . . . . . . . . . . . . . . . . . . . . . . . . . . . . . . . . .127
Physical Infrastructure . . . . . . . . . . . . . . . . . . . . . . . . . . . . . . . . . . . . . . . . . . . . . . . . . . . . . . . . . . . . . .127Rail . . . . . . . . . . . . . . . . . . . . . . . . . . . . . . . . . . . . . . . . . . . . . . . . . . . . . . . . . . . . . . . . . . . . . . . . . .128Airports . . . . . . . . . . . . . . . . . . . . . . . . . . . . . . . . . . . . . . . . . . . . . . . . . . . . . . . . . . . . . . . . . . . . . . .128Pipeline . . . . . . . . . . . . . . . . . . . . . . . . . . . . . . . . . . . . . . . . . . . . . . . . . . . . . . . . . . . . . . . . . . . . . . .129Roadways . . . . . . . . . . . . . . . . . . . . . . . . . . . . . . . . . . . . . . . . . . . . . . . . . . . . . . . . . . . . . . . . . . . . .129Ports . . . . . . . . . . . . . . . . . . . . . . . . . . . . . . . . . . . . . . . . . . . . . . . . . . . . . . . . . . . . . . . . . . . . . . . . .129
Quality of Life & Social Capital . . . . . . . . . . . . . . . . . . . . . . . . . . . . . . . . . . . . . . . . . . . . . . . . . . . . . . .130Arts and Culture . . . . . . . . . . . . . . . . . . . . . . . . . . . . . . . . . . . . . . . . . . . . . . . . . . . . . . . . . . . . . . . .131
SSuummmmaarryy aanndd CCoonncclluussiioonnss:: AA PPaatthh FFoorrwwaarrdd .. .. .. .. .. .. .. .. .. .. .. .. .. .. .. .. .. .. .. .. .. .. .. .. .. .. .. .. .. .. .. .. .. .. ..113322
Looking Forward . . . . . . . . . . . . . . . . . . . . . . . . . . . . . . . . . . . . . . . . . . . . . . . . . . . . . . . . . . . . . . . . . .133Moving Forward: Toward What Kind of Economy? . . . . . . . . . . . . . . . . . . . . . . . . . . . . . . . . . . . . . . . .133Three Strategic Thrusts . . . . . . . . . . . . . . . . . . . . . . . . . . . . . . . . . . . . . . . . . . . . . . . . . . . . . . . . . . . . .134Next Steps . . . . . . . . . . . . . . . . . . . . . . . . . . . . . . . . . . . . . . . . . . . . . . . . . . . . . . . . . . . . . . . . . . . . . .135
AAnnnneexx:: EEccoonnoommiicc DDeevveellooppmmeenntt RReeppoorrttss .. .. .. .. .. .. .. .. .. .. .. .. .. .. .. .. .. .. .. .. .. .. .. .. .. .. .. .. .. .. .. .. .. .. .. .. .. ..113377
Statewide Reports . . . . . . . . . . . . . . . . . . . . . . . . . . . . . . . . . . . . . . . . . . . . . . . . . . . . . . . . . . . . . . . .137Regional Reports . . . . . . . . . . . . . . . . . . . . . . . . . . . . . . . . . . . . . . . . . . . . . . . . . . . . . . . . . . . . . . . . . .137Community Reports . . . . . . . . . . . . . . . . . . . . . . . . . . . . . . . . . . . . . . . . . . . . . . . . . . . . . . . . . . . . . . .139


A L A S K A F O R W A R D : P H A S E I S I T U A T I O N A L A N A L Y S I S
W W W . I H S G L O B A L I N S I G H T . C O M 1
E X E C U T I V E S U M M A R Y
About this ReportAlaska's economy is challenged to provide quality jobs for the state's residents, cover the costs of gov-ernment services, and build the economic infrastructure needed to be globally competitive. With sup-port from the Denali Commission, the Alaska Partnership for Economic Development (APED) hasinitiated a multi-phase process to analyze the economy, create an economic development strategy andidentify action initiatives to address the state's challenges.
This report is a first step in that process. It is a situational analysis that describes and analyzes the cur-rent economic development system in Alaska and the state's unique set of economic and business cli-mate factors. Along with a suggested path forward, the report is designed to inform a next phase ofcollaborative formulation of practical strategic and tactical action initiatives to safeguard the future suc-cess of Alaska.
APED is a 501(c)(3) umbrella organization consisting of the 12 designated Alaska Regional DevelopmentOrganizations (ARDORs). APED selected a team to undertake this report consisting of IHS Global In-sight (lead consultant), the Economic Competitiveness Group, and Alaska's McDowell Group. The pro-ject's steering committee comprised representatives of the ARDORs, as well as representatives ofother industry and public sector organizations, such as the State Chamber of Commerce, the Universityof Alaska, Western Alaska Community Development Association, Office of the Governor and the Eco-nomic Development Administration.
The research for the report was conducted from September to December 2009. The team collectedand analyzed existing information and insight, conducted surveys and interviews, presented and dis-cussed preliminary results at conferences, and engaged in a wide variety of discussions with steeringcommittee members and other public sector and business stakeholders.
Key FindingsThe economic development system in Alaska is largely ineffective both from the perspective ofAlaskans as well as in comparison to best practices in other jurisdictions. A web survey of 300 busi-ness and community leaders showed that 52% of them felt that economic development efforts inAlaska have been ineffective and 61% of them felt that, at best, the outlook for Alaska's economy overthe next 10 years is uncertain.
Alaskans should worry not because of any immediate economic crisis, but because of the accumulatinglevels of future risk and declining economic resiliency associated with:
• Poor relative economic performance compared to the rest of the country.
• A high level of dependence on the price of oil, federal government spending, and natural resourceindustries facing supply or regulatory/legal constraints.
• Weak linkages to rapidly expanding global market opportunities.
• Ignoring opportunities for diversification and increased resiliency by optimizing the needs and link-ages within and among the state's existing portfolio of export-oriented industry "clusters."
• Weak culture of entrepreneurship.
• Sub-par support from the state's economic foundations compared to other peer states in the areaof transportation and other infrastructure, quality of workforce/education, and technology.

2
A L A S K A F O R W A R D : P H A S E I S I T U A T I O N A L A N A L Y S I S
W W W . I H S G L O B A L I N S I G H T . C O M /
This risk represents the basis of our call to action for a different approach to economic development.Oil prices may stay at or above current levels, significant new sources of oil and gas may be tapped,and federal government spending may keep rising. However, the probability that these events will nothappen is uncomfortably high.
The path forward involves moving away from competition among industries, regions, and communities.It involves moving towards a more collaborative, state-wide approach to economic development that isfocused on developing a stronger portfolio of export-oriented industry clusters. The effort should belead by the private sector and supported by the public sector and to take a state-wide approach know-ing that a stronger portfolio of industry clusters will benefit all the regions of the state.
Existing Economic Development Objectives and Strategies The economic development system in Alaska is decentralized and fragmented with little overarchingstructure tying the pieces together to foster a sustainable and resilient economy for the future. Only2.5% of the respondents to our survey felt that economic development efforts have been very effectiveand only 6% felt that the economic outlook over the next 10 years was very good. Interviews with eco-nomic development professionals and business leaders produced a more detailed diagnosis of the situ-ation, but overall painted a consistent picture of generally ineffective economic development efforts andconcern about the longer term outlook for the state's economy.
Past development efforts have come up short largely because of poor implementation planning and re-sourcing, inadequate consideration of market fundamentals, and shifting political priorities. Further-more, it is clear that very few economic development best practices from other regions are beingdeployed or even tested in the state. There is no shortage of imaginative economic development ideasacross the state. However, without a framework for action, these ideas are just biding their time in re-ports on shelves or flowing in the daily stream of ad hoc policy discussion.
While the interviews and web survey uncovered a broad range of views and insights, the followingcommon themes were identified:
Alaska's EEconomic DDevelopment OOrganizations ((EDOs) ooperate iin aan eextreme eenvironment. Alaska is arelatively new state that is remote from other business or industrial regions and has under-developed in-frastructure, high energy and labor costs, and severe geographic and climate conditions.
Large-sscale ddevelopment oof ppublicly oowned rresources hhas bbeen aa ddominant ttheme iin tthe AAlaska eecon-omy. This includes seafood harvesting, mining, timber harvesting, oil exploration and, most recently,large-scale tourism. Alaska's economic development efforts have evolved, in part, around how to mini-mize regulatory restrictions and how to siphon off local benefits from these large, externally driven in-dustries.
Government ffunding oof llocal sservices, pparticularly rrural hhealthcare aand llocal aand ttribal ggovernment iis aanotherdominant ttheme. Federal funding has the greatest impact, but state employment is also very significant.
Alaska hhas eestablished aa wworkforce ttraining iinfrastructure, bbut ssome qquestion wwhether tthe ttypes ooftraining aavailable aare sstrategically ttargeted tto ssupport ddevelopment. Although many say that consolida-tion of the Alaska community colleges within the University of Alaska in the 1980s was a setback to vo-cational education, workforce training efforts are now wide-spread. Training typically has focused onreplacing imported labor with resident labor in existing industries. Critics say that training gaps includehigher level technical and professional education. Other criticisms are that entry-level workers lack basicreading and math skills and what are often referred to as "soft skills" or "work ethic" by employers.1
1 These criticisms are typical of feedback obtained during workforce assessments and training program evaluations performed by McDowell Group.
A L A S K A F O R W A R D : P H A S E I S I T U A T I O N A L A N A L Y S I S
W W W . I H S G L O B A L I N S I G H T . C O M 3
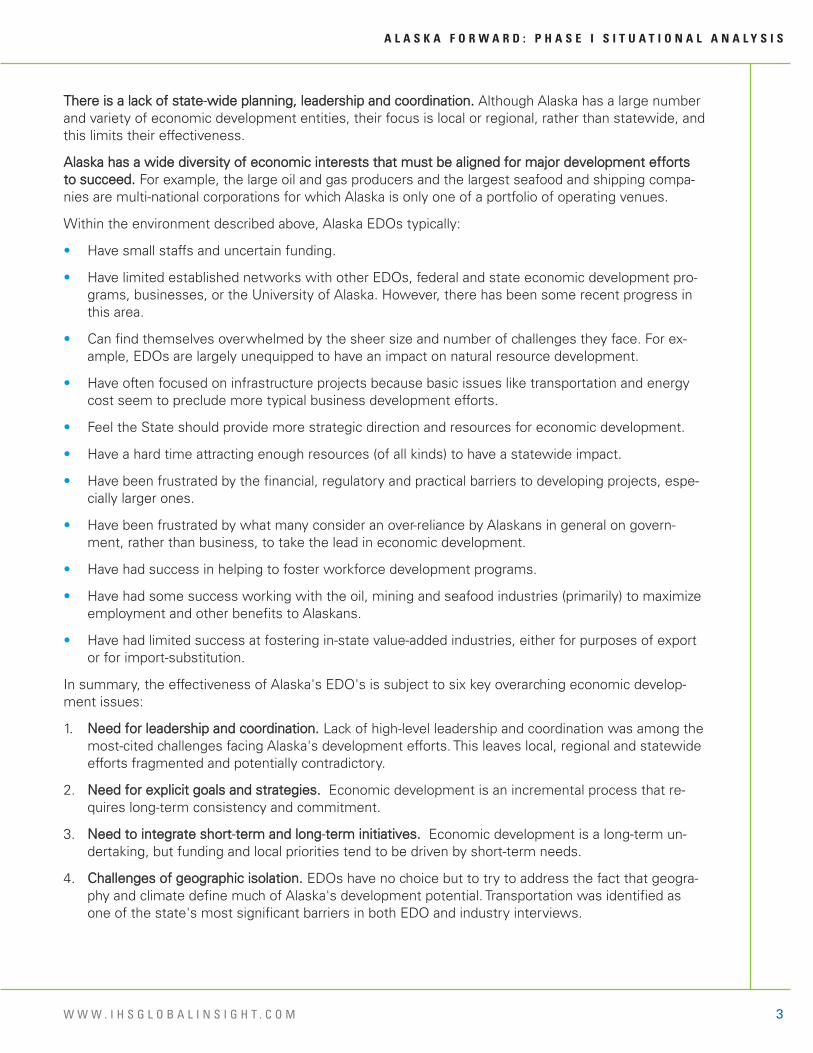
There iis aa llack oof sstate-wwide pplanning, lleadership aand ccoordination. Although Alaska has a large numberand variety of economic development entities, their focus is local or regional, rather than statewide, andthis limits their effectiveness.
Alaska hhas aa wwide ddiversity oof eeconomic iinterests tthat mmust bbe aaligned ffor mmajor ddevelopment eeffortsto ssucceed. For example, the large oil and gas producers and the largest seafood and shipping compa-nies are multi-national corporations for which Alaska is only one of a portfolio of operating venues.
Within the environment described above, Alaska EDOs typically:
• Have small staffs and uncertain funding.
• Have limited established networks with other EDOs, federal and state economic development pro-grams, businesses, or the University of Alaska. However, there has been some recent progress inthis area.
• Can find themselves overwhelmed by the sheer size and number of challenges they face. For ex-ample, EDOs are largely unequipped to have an impact on natural resource development.
• Have often focused on infrastructure projects because basic issues like transportation and energycost seem to preclude more typical business development efforts.
• Feel the State should provide more strategic direction and resources for economic development.
• Have a hard time attracting enough resources (of all kinds) to have a statewide impact.
• Have been frustrated by the financial, regulatory and practical barriers to developing projects, espe-cially larger ones.
• Have been frustrated by what many consider an over-reliance by Alaskans in general on govern-ment, rather than business, to take the lead in economic development.
• Have had success in helping to foster workforce development programs.
• Have had some success working with the oil, mining and seafood industries (primarily) to maximizeemployment and other benefits to Alaskans.
• Have had limited success at fostering in-state value-added industries, either for purposes of exportor for import-substitution.
In summary, the effectiveness of Alaska's EDO's is subject to six key overarching economic develop-ment issues:
1. Need ffor lleadership aand ccoordination. Lack of high-level leadership and coordination was among themost-cited challenges facing Alaska's development efforts. This leaves local, regional and statewideefforts fragmented and potentially contradictory.
2. Need ffor eexplicit ggoals aand sstrategies. Economic development is an incremental process that re-quires long-term consistency and commitment.
3. Need tto iintegrate sshort-tterm aand llong-tterm iinitiatives. Economic development is a long-term un-dertaking, but funding and local priorities tend to be driven by short-term needs.
4. Challenges oof ggeographic iisolation. EDOs have no choice but to try to address the fact that geogra-phy and climate define much of Alaska's development potential. Transportation was identified asone of the state's most significant barriers in both EDO and industry interviews.

4
A L A S K A F O R W A R D : P H A S E I S I T U A T I O N A L A N A L Y S I S
5. Challenges ssupporting aand aadding vvalue tto eexisting iindustries. Import substitution, value-added pro-cessing, and support services have been widely recognized as key to Alaskans reaping more of thebenefits of in-state development.
6. Developing aan iinstitutional fframework tto eelevate tthe iimpact oof kknowledge wwithin aall iindustries.Alaska's next-generation economy must be one that produces and utilizes knowledge workers to fa-cilitate growth in traditional industries and emerging industries.
Comparison with Best Economic Development Practices in Other RegionsMuch can be gained by an inward analysis of Alaska's economic development system. However, a lookat how other regions have tackled similar issues is also informative. From these insights and "best prac-tices," a number of lessons for Alaska are drawn. Each should be instructive as leaders grapple with thequestion of how to organize for, and improve the state's economy.
In highlighting best practices, we have focused on leadership approaches, systemic changes and/or in-stitutional efforts that were implemented in order to transform the subject region's economy. Ofcourse, there is no single domestic or international best practice that aligns perfectly with Alaska's par-ticular situation. But there are no doubt elements within these models that are appropriate to Alaska'sparticular context and the state's long-term goals.
Six regions were examined in this overview of best practices:
• Puget Sound Region—Economic development leadership and coordination
• Oregon—Explicit economic development goals and strategies
• Alberta, Canada—Integration of short- and long-term initiatives
• Chile—Addressing the challenge of geographic isolation
• Austin, Texas—Adding value to existing industries
• North Carolina—Institutional framework to elevate the impact of knowledge in its industries
Some leaders may feel that Alaska's unique history and atypical development challenges are such pow-erful constraints on economic development that the system and approaches that have evolved over theyears are the best way forward. But the examples show that other regions having different fundamentalcharacteristics than Alaska's have nevertheless been successful in overcoming barriers to economic de-velopment. In many instances these barriers are not so different than those faced by the state. All ofthe cases presented have just a few themes in common, and each theme is relevant to Alaska.
Leaders can take steps to affect the trajectory of an economy—the destiny of a state's economy is notpreordained. Interventions in the status quo in the form of new public policies, bold private sector initia-tive, new public-private partnerships and strategic resource allocation can all affect the trajectory of aneconomy. The province of Alberta in Canada is a good example. The vision of a single leader in the1970's drove new thinking in the 1980s about how to achieve a far more diverse economy. Subsequentpolicy initiatives launched new economic development organizations with new missions. New initiativesin education and training and in science and technology began to shift the structure of the economy inthe 1990s. Analysts looking at the province's economic transformation typically note that its successrelative to neighboring provinces can be attributed to successful diversification into new economic sec-tors that now complement resource extraction and industrial manufacturing.
Strategic planning can have a payoff—Economic analysis cannot end with a simple statement of theproblems. The Situational Analysis contained in this report is meant to be a foundational document

A L A S K A F O R W A R D : P H A S E I S I T U A T I O N A L A N A L Y S I S
W W W . I H S G L O B A L I N S I G H T . C O M 5
upon which a strategic plan will be based. The situation analysis is necessary but insufficient to sparkthe new thinking and new behaviors that will be needed to move Alaska's economy in new directions.In every best practice case analyzed, leaders took steps to design, launch and implement a comprehen-sive strategic plan to guide their region's development.
Leaders in states whose economies are threatened cannot afford to be idle and wait for economic con-ditions to improve—Waiting for new economic conditions is not a strategy. Oil prices might go up, andthat would be good. But they might, as they have in years past, go down. By their nature commodityprices will vary according to demand conditions far removed from Alaska's control. Alaska's leadersneed to inform residents of the "razors edge" on which the economy rests and organize for new collec-tive action.
Assessment of Entrepreneurship and Business Climate Alaska doesn't appear to have a particularly good climate for business risk-taking. We are told by inter-viewees that Alaskans do not have a willingness for "change," "innovation" or "rejuvenation." Many in-formed leaders told us that Alaskans seems to have an "entitlement mentality."
Ultimately, the goal is to provide a good environment for innovation—for new companies to start-up andgrow and for new thinking and new behavior within and among the state's EDOs and other develop-ment organizations. This will require a significant shift in both how leaders think about the economyand in economic policies going forward. On the other hand, if incentives in the economic system canbe fundamentally altered, the entrepreneurial spirit is never lurking far below the surface, and can riseto strike at good economic opportunities and to meet new economic challenges.
The EconomyAlaska weathered the Great Recession of 2009 well compared to other parts of the U.S. economy andAlaska will be participating in the global recovery. However, from a longer term perspective there arerisks and concerns that ultimately provide a rationale for a new approach to economic development todeal with potential risks and a loss of economic resiliency.
The top line view of Alaska's economy is one of stagnation and lagging economic performance in largepart due to declining oil production.
Gross state product (GSP) measures the output or total value added of all industries in Alaska. By thismeasure, Alaska's economy has been stagnating for the past 20 years. Over the 1990 to 2020 periodwe expect the U.S. econ-omy to have doubled inconstant dollar terms.Over the same period,Alaska will have barely re-turned to its level of totaleconomic activity in 1990.
Overall employment in thestate economy may re-flect more directly howpeople feel about theeconomy's performance.The oil industry is verycapital intensive, so bothincreases and decreases
30,000
35,000
40,000
45,000
50,000
55,000
60,000
1990 1992 1994 1996 1998 2000 2002 2004 2006 2008 2010 2012 2014 2016 2018
Real
PPer
CCap
ita GG
DP/G
SP
Sources: BEA and IHS Global Insight
History Forecast
U.S.
Alaska
Figure 11. TTwenty YYears oof CComparative SStagnation

6
A L A S K A F O R W A R D : P H A S E I S I T U A T I O N A L A N A L Y S I S
in output have a moremuted impact on em-ployment than in labor in-tensive industries.Second, sectors withlarge numbers of work-ers like travel andtourism have been grow-ing and generating jobs.Third, while prices of thestate's commodities arelower than the highs of2008, they are still at his-torically high levels.These high price levelsare supporting incomeand employment acrossthe state. In this way Alaska is doing better than the GSP data alone suggests.
It's important to notice that per capita income and non-mining labor productivity is lagging. High com-modity prices are hiding structural problems and of course commodity prices can quickly become acurse when they start to fall. IHS CERA has published a number of alternative scenarios for world en-ergy markets and not all of these scenarios envision higher prices for crude into the future. The GlobalFissures Scenario has West Texas Intermediate (WTI) averaging only about $40 per barrel. In additionthere is significant risk that future cutbacks in federal government spending will have a large impact onAlaska.
100
110
120
130
140
150
1990 1992 1994 1996 1998 2000 2002 2004 2006 2008 2010 2012 2014 2016 2018
Milli
on
0.15
0.20
0.25
0.30
0.35
0.40
0.45
Milli
on
US
Alaska (Total)
Alaska (Excl. Mining)
Alaska (right sscale)
Sources: Bureau of Labor Statistics (BLS) and IHS Global Insight
History Forecast
U .S. (left sscale)
FFiigguurree 22.. SStteeaaddyy,, bbuutt LLaaggggiinngg,, EEmmppllooyymmeenntt GGrroowwtthh
-6%
-3%
0%
3%
6%
1990 1994 1998 2002 2006 2010 2014 2018
Prod
uctiv
ity GG
rowt
h
Alaska (Excl. Mining) US
History Forecast
Sources: BEA, BLS and IHS Global Insight
Labor PProductivity, EExcluding MMining aand OOil aand GGas
$0
$20
$40
$60
$80
$100
$120
$140
$160
1995 2000 2005 2010 2015 2020
HistoricalAsian PhoenixBreak PointGlobal Fissures
11998866-22000033 aavveerraaggee:: $$2211..2200
Source: IHS CERA, Global Insight
WTI PPrice SScenarios tto 22020(Nominal US$ per barrel)
Figure 33. FFuture RRisk: LLagging LLabor PProductivity aand OOil PPrice RRisk

A L A S K A F O R W A R D : P H A S E I S I T U A T I O N A L A N A L Y S I S
W W W . I H S G L O B A L I N S I G H T . C O M 7
Global Opportunities There are many attractive market opportunities around the world for a resource-rich state like Alaska.However, the state is in danger of letting those opportunities go to competing regions around theworld. Alaska's trade with the rest of the world expanded at a compounded annual rate of 6.2% overthe period from 2000 to 2008. Most of the peer states2 we selected for this study had considerablystronger export performances.
2 The peer states chosen for this study include Idaho, Louisiana, Montana, North and South Dakota, Washington and Wyoming. The criterion used for se-lecting the peer states is explained in Economic Foundations.
6.2% 5.8%
16.4% 17.1%16.0%
9.2%
13.6%
28.1%
0%
5%
10%
15%
20%
25%
30%
Alaska Idaho Louisiana MontanaNorth Dakota
South DakotaWashington State Wyoming
Expo
rts GG
rowr
h ((CA
GR, 22
000-
008)
FFiigguurree 44.. EExxppoorrtt PPeerrffoommaannccee ooff PPeeeerr SSttaatteess
Source: U.S. Census Bureau, Foreign Trade Division
Ta b l e 1 . To p - F i v e E x p o r t s , 2 0 0 8 — A l a s k a a n d P e e r S t a t e s
A l a s k a I d a h o L o u i s i a n a M o n t a n a
Fishing and Seafood Processing (50.6%)
Mining (20.2%)
Oil and Gas Extraction (8.6%)
Transportation Equipment(6%)
Primary Metal Manufactures(4.2%)
Computer and ElectronicProducts (58.6%)
Processed Foods (9.3%)
Chemical Manufactures(5.2%)
Paper Products (4.6%)
Transportation Equipments(4.4%)
Crop Production (37.7%)
Petroleum and Coal Products(23.9%)
Chemical Manufactures(16.9%)
Processed Foods (8.9%)
Machinery Manufactures(3.0%)
Chemical Manufactures(25.3%)
Mining (15.8%)
Machinery Manufactures(13.3%)
Transportation Equipment(10.9%)
Primary Metal Manufactures(8.2%)
N o r t h D a k o t a S o u t h D a k o t a W a s h i n g t o n S t a t e W y o m i n g
Machinery Manufactures(42.7%)
Crop Production (22.1%)
Transportation Equipment(8.4%)
Processed Foods (7.9%)
Oil and Gas Extraction (7.5%)
Computer and ElectronicProducts (30.7%)
Processed Foods (21.0%)
Machinery Manufactures(15.7%)
Beverage & Tobacco Products(7.2%)
Transportation Equipment(5.7%)
Transportation Equipment(41.1%)
Crop Production (20.9%)
Computer and ElectronicProducts (5.9%)
Processed Foods (4.9%)
Petroleum and Coal Products(4.9%)
Chemical Manufactures(73.1%)
Oil & Gas Extraction (7.4%)
Machinery Manufactures(6.6%)
Mining (5.4%)
Fabricated Metal Products(1.2%)
Note: number in parenthesis is the share in total exportsSource: U.S. Census Bureau, Foreign Trade Division
8
A L A S K A F O R W A R D : P H A S E I S I T U A T I O N A L A N A L Y S I S
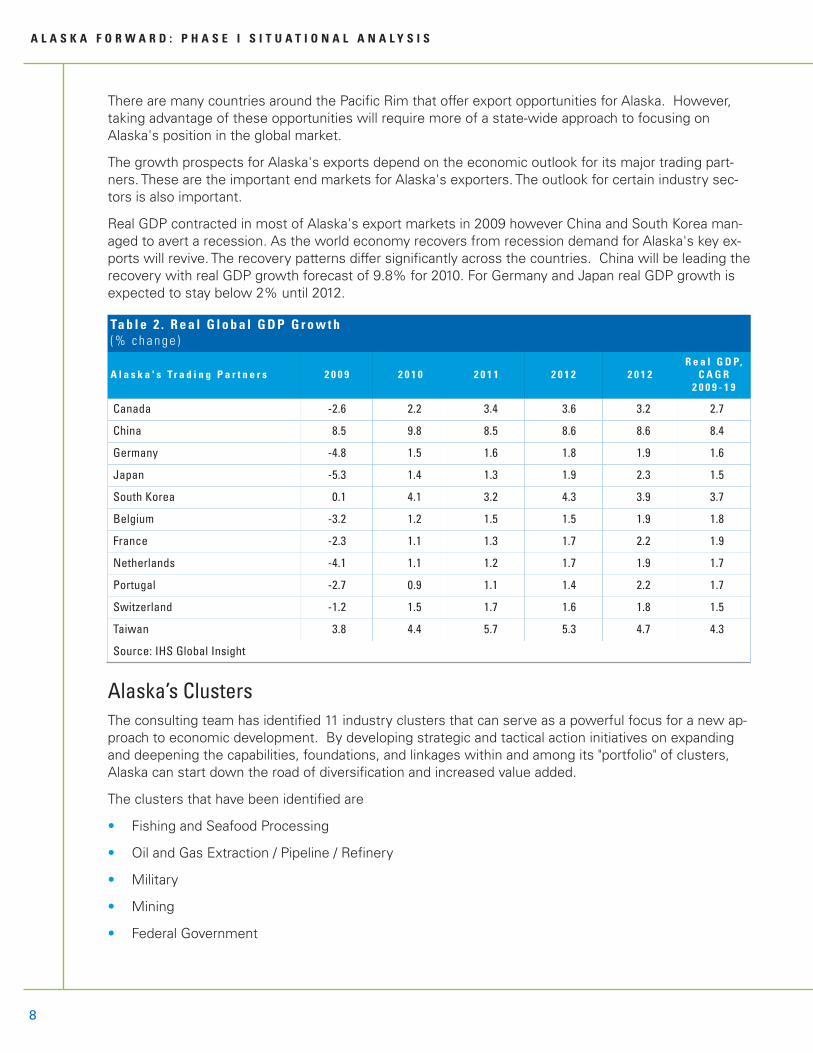
There are many countries around the Pacific Rim that offer export opportunities for Alaska. However,taking advantage of these opportunities will require more of a state-wide approach to focusing onAlaska's position in the global market.
The growth prospects for Alaska's exports depend on the economic outlook for its major trading part-ners. These are the important end markets for Alaska's exporters. The outlook for certain industry sec-tors is also important.
Real GDP contracted in most of Alaska's export markets in 2009 however China and South Korea man-aged to avert a recession. As the world economy recovers from recession demand for Alaska's key ex-ports will revive. The recovery patterns differ significantly across the countries. China will be leading therecovery with real GDP growth forecast of 9.8% for 2010. For Germany and Japan real GDP growth isexpected to stay below 2% until 2012.
Alaska’s Clusters The consulting team has identified 11 industry clusters that can serve as a powerful focus for a new ap-proach to economic development. By developing strategic and tactical action initiatives on expandingand deepening the capabilities, foundations, and linkages within and among its "portfolio" of clusters,Alaska can start down the road of diversification and increased value added.
The clusters that have been identified are
• Fishing and Seafood Processing
• Oil and Gas Extraction / Pipeline / Refinery
• Military
• Mining
• Federal Government
Ta b l e 2 . R e a l G l o b a l G D P G r o w t h( % c h a n g e )
A l a s k a ' s Tr a d i n g P a r t n e r s 2 0 0 9 2 0 1 0 2 0 1 1 2 0 1 2 2 0 1 2R e a l G D P,
C A G R 2 0 0 9 - 1 9
Canada -2.6 2.2 3.4 3.6 3.2 2.7
China 8.5 9.8 8.5 8.6 8.6 8.4
Germany -4.8 1.5 1.6 1.8 1.9 1.6
Japan -5.3 1.4 1.3 1.9 2.3 1.5
South Korea 0.1 4.1 3.2 4.3 3.9 3.7
Belgium -3.2 1.2 1.5 1.5 1.9 1.8
France -2.3 1.1 1.3 1.7 2.2 1.9
Netherlands -4.1 1.1 1.2 1.7 1.9 1.7
Portugal -2.7 0.9 1.1 1.4 2.2 1.7
Switzerland -1.2 1.5 1.7 1.6 1.8 1.5
Taiwan 3.8 4.4 5.7 5.3 4.7 4.3
Source: IHS Global Insight

A L A S K A F O R W A R D : P H A S E I S I T U A T I O N A L A N A L Y S I S
W W W . I H S G L O B A L I N S I G H T . C O M 9
• Tourism
• Logistics and International Trade
• Community and Social Services
• Advanced Business Services
• Specialized Machinery/Capital Goods
• Forestry and Wood Products
The clusters are grouped into four segments based on employment concentration in Alaska comparedto the U.S. national average and the estimated dynamism, or growth potential over the next 10 years.This segmentation is an important consideration when formulating strategic economic developmentpolicy.
In addition, we found evidence of some unique, technology-based capabilities in the state that canserve as potential future seed clusters or assets to potentially aid the 11 identified clusters. These are:Cold climate technology, Rocket launch technology, Cold climate housing, Specialized super computingcapabilities, Distance delivery -- education, medical, and management services, Alternative energy andClean-energy (bio fuels, clean coal/coal gasification, etc), Specialty solvents, Light aircraft operationsand maintenance/navigation, Marine and arctic biological sciences/potential for aquaculture, Remotecommunications technologies/systems, Aerospace technology/operations, and Naturally grown/grazedfood products.
Economic FoundationsSix key economic foundation areas underpin the development of these clusters. A strong foundation isa vital element for cluster development. Alaska's economic foundations are evaluated against a set ofpeer states including North and South Dakota, Louisiana, Idaho, Montana, Washington and Wyoming.The selection of these states was based on a number of factors that include: (1) population and urbanorientation; (2) cluster structure; (3) economic performance; (4) strategy-oriented economic develop-ment; and (5) multi-modal transportation issues.
Underpinning every successful cluster are the economic foundations of a region as described here andshown as the base of the pyramid in the cluster diagram below.
• Human RResources: an educated and productive workforce.
• Technologgyy: the quality of research and development and other sources of innovation.
• Access tto CCapital: the ability of firms in the region to obtain financing.
• Business CClimate: a competitive business climate; adequate funding for necessary services.
• Phyysical IInfrastructure: well-developed, cost-effective and efficient roads, highways, transit, ports,and airports that meet the transit and transportation needs of both workers and business.
• QQualityy oof LLife aand SSocial CCapital: The quality of life a region offers its residents is comprised ofmany things—many of them intangible. It also consists of what is known as "social capital"—theinter-personal and organizational networks that enhance a region's ability to facilitate transactionsand investment due to trust and access to information.

10
A L A S K A F O R W A R D : P H A S E I S I T U A T I O N A L A N A L Y S I S
Figure 55. EEconomic FFoundations oof aa CCluster-BBased EEconomic DDevelopment FFramework
Relative to the peer regions, Alaska offers a low tax business environment and a high level of quality oflife for those that have settled in the state. In addition, the state's workforce is relatively well-educated.
Relative weaknesses of the state are its high secondary school dropout rate and the associated need ofits resident workforce for educational remediation for employment. Cluster development would benefitfrom a tighter linkage between education and industry so that specific occupational skills are targeted.There is also evidence of a relative lack of technological commercialization within the state. Indicatorssuch as per-capita or per-employee R&D spending show an average level of innovative activity. Data onthe number of patents registered shows challenges related to the commercialization of new technologywithin the state. Finally, a poor system of roads and highways is a unique challenge that Alaska faces.
Conclusion: A Path Forward Alaska's EDOs and approaches to economic development have evolved according to the state's uniquecharacteristics and needs. This report analyzed the current situation from several perspectives. In thefirst section, we looked at the array of EDOs in the state and provided an outline of their various strate-gies and objectives. We then looked at the strengths and weaknesses of today's organizational struc-ture and provided comments on the main features of Alaska's approach to economic development. Ourfindings in these two sections came from a review of past reports as well as from input from informedleaders in interviews and surveys.
From these analyses, we developed six overarching economic development themes for continuingstudy. Each theme highlights a critical issue for Alaska, ranging from the need for more leadership andcoordination of Alaska's economic development infrastructure, to the need for new thinking about howto add more value to Alaska's important natural resource sectors. Finally, we looked at how other
Working TogetherWorking Together
Technology Access to Capital
Business Climate
Physical Infra-
structure
Network of Supplier Firms
Firms supplying inputs, raw materials, components, parts, and specialized services.
LeadFirms
Key firms exporting goods
and servicesoutside the region
Copyright Copyright ©© 2001 Economic Competitiveness Group, Inc.2001 Economic Competitiveness Group, Inc.
Human Resources
Economic FoundationsQuality of Life
& Social Capital

A L A S K A F O R W A R D : P H A S E I S I T U A T I O N A L A N A L Y S I S
W W W . I H S G L O B A L I N S I G H T . C O M 11
states and regions have addressed similar challenges. There are lessons here for Alaska's leaders thatfocus on how the state should organize its efforts and work toward a more competitive economy.
The next step in the analytical process was to understand the state and global economic challenges andopportunities and match these with our understanding of the state's clusters and economic founda-tions. For example, we noted in the Economic Profile section of the report that the slowdown in rev-enues from the natural resources sectors, notably in oil and gas, has caused real GSP to stagnate since1998-9 when compared to the national economy. Over the last few years GSP has slipped even furtherbehind the national average and the forecast is for this gap to widen. As a result per capita income hasalso slipped alarmingly. The forecast is for Alaska to fall well below the national average.
Looking Forward
Our comprehensive approach has lead us to conclude that Alaska's economic future is, at best, cloudywe have identified a few significant risks. Going forward commodity prices might work to the state'sadvantages and push per-capita income higher. Betting on this outcome however would be unwise. Theconclusions of our economic research has been largely confirmed by our recent interviews and surveys.Informed leaders in Alaska know that the state is potentially facing serious economic challenges.
It seems that economic development efforts at the state, regional and local levels need to be steppedup however the basic organizational infrastructure and today's typical economic development objectivesand strategies are less than optimal. The state's institutional capacity to address fundamental economicproblems, while well intentioned and at times successful with tactical interventions, may not haveevolved a shared economic vision among key stakeholders. Stronger and higher-level leadership andcoordination is needed in order to make the most of efforts expended.
The area where we see opportunity is largely at the statewide level. We believe that a different overar-ching approach to economic development is needed, perhaps one driven by a public-private leadershipgroup, with the public sector providing the initial funding and the private sector providing its knowledgeof how markets work, where the opportunities for diversification lie and what makes an economy com-petitive. The approach might be based on contemporary economic development models used in otherstates (such as Oregon's cluster-based economic development networks or the Puget Sound region'swell coordinated Prosperity Partnership and industry working groups to define needed policy initiatives).
With a different policy framework, such as a statewide cluster development and leadership and coordi-nation towards this end, regional and local practitioners would have both an overarching policy frame-work and the flexibility to implement the policy as local needs dictate. A cluster policy strategy wouldnot only outline the main implementation features and suggest tools for regional and local EDOs, butprovide a way of coordinating most of the practices of regional and local economic development agen-cies. It is important to point out that whatever economic development model Alaska's moves toward inthe future it needs to be an "Alaska Model." The state is too atypical in too many ways for a textbook ap-proach to have the desired outcomes.
Moving Forward: Toward What Kind of Economy?
If asked, most people in Alaska would say that the state, fundamentally, has a natural resource econ-omy, and that it always will. Our analysis suggests that Alaskans begin looking at the state's economyin a broader way, as a "natural resources, PLUS" economy. Oil, gas, mining, and fishing, along withtourism, will be the most important engines of economic growth for as long as one can see into the fu-ture. Economic development policy and practice must continue to focus on making the most of thesesectors. But the notion of "natural resources, PLUS" means that in the future, Alaska will look to its nat-ural resources as the state's primary economic engines while simultaneously developing emerging sec-tors (e.g., logistics and trade, advanced business services, specialized machinery) where the state has

12
A L A S K A F O R W A R D : P H A S E I S I T U A T I O N A L A N A L Y S I S
comparative advantages. Some attention must also be paid to the pre-clusters, where much more re-search is needed to better define if these or other "faint signs on the radar" can, with the right policysupport, be elevated from "radar blips" to something more. To a great degree, economic developmentefforts should be shifted from the very difficult task of trying to get more job and revenue impact fromthe state's natural resources sectors to trying to make the most of the PLUS side of the envisionednew economy.
The country's security equation is changing and these changes are likely to affect both the missions ofAlaska's military installations as they shift to respond to changing threats as well as the role and reachof the Department of Homeland Security Coast Guard. Keeping abreast of how agency missions arechanging, and are likely to change in the future as well as how federal resources will be spent on mili-tary and national security priorities should be a high priority of the state's economic development lead-ers. Federal funding for national security is not likely to decrease in the near- to mid-term.
Developing the PLUS side of the new economy should be a high priority of APED's Phase 2, StrategyDevelopment. But there is little doubt that new strategies will be needed to address the state's climatefor business entrepreneurship. For example, young people in Alaska should learn about small business,the pros and the cons, throughout their formal education. They should have a working knowledge ofmarkets and how investment flows to economic opportunity.
New policies are most likely needed at University of Alaska (UA) to try to move basic research closer tocommercialization and to support more applied research. The key roles that the university can play inlong-term development strategies include: educating and nurturing the next generation of workers andleaders; conducting applied research that is critical to industrial innovation; engaging in transferring newtechnology and processes to businesses; conducting policy analysis to inform decision-makers; sup-porting small business development with skills and information and creating forums for networking andinformation exchange. To perform these roles well, universities must examine and mitigate policies, pro-cedures and organizational structures that could interfere with their economic development functions.Furthermore they should initiate and align internal incentives so that faculty and staff work toward com-mon development goals. This process must be led from the top and must be ongoing.
Putting in place other features in the state's economic environment should likewise be a priority. For ex-ample, Alaska doesn't need to lose its applied research investments, or its graduates to other states.Keeping both in-state might require implementing not only technology commercialization strategies butalso complementary "technology capture" strategies that work to keep innovation in-state, within existingfirms and in the hands of local entrepreneurs. Fledgling entrepreneurs will need help from the state'sEDOs to secure financial resources and other pre-requisites for market success, suggesting in this lightat least a review of small business programs and state financing programs designed to help launch smallbusinesses. The range of potential new economic development strategies is wide and deep.
Three Stategic Thrusts
We envision three main strategic thrusts (similar to the three-legged stool3 suggested by the Instituteof Social and Economic Research at the University of Alaska (UAA ISER). The first strategic thrustwould be to make the most of the natural resources that have made the state what it is today. Existingpriorities will need to be reviewed in the context of economic forecasts and specific tactics will need tobe developed to support the strategy of making the most of the state's resource advantages. An essen-tial element of such a strategy would be continued refinement of approaches to natural resourcepreservation—in which Alaska is already a leader in many respects—so that future generations also de-rive benefits from those resources.
3 This is referenced at http://www.alaskaseconomy.org/.
A L A S K A F O R W A R D : P H A S E I S I T U A T I O N A L A N A L Y S I S
W W W . I H S G L O B A L I N S I G H T . C O M 13
The second strategic thrust would be to work with the federal government in strategic ways to main-tain, if not grow, its presence in the state and generate all the public and private sector jobs associatedwith the government's priorities in Alaska that are possible. While this thrust has been a strategic prior-ity for some time, opportunities noted earlier may exist for new or expanded military and homeland se-curity initiatives as global security threats evolve. Even changes in polar region access can change themilitary and security calculus, potentially leading to new federal investment in preparedness. Again,specific program tactics will need to be developed to achieve this objective. Keeping track of these op-portunities should be a heightened priority of Alaska's Congressional delegation. Put in the context ofthis initiative, Alaska Forward: Towards a Next Generation Economy, elected leaders and their staffshould be encouraged to redouble efforts to get inside the decision-making processes of key federalagencies and influence decisions with an aim at securing new jobs and new investment, consistentwith broad government needs.
The third strategic thrust would be to create a stronger entrepreneurial climate that is pro-small busi-ness. The suggestion is to nurture those that take the risks to create small companies and who mostlikely live in Alaska because they love it. These business people and entrepreneurs, while present today,are not particularly well-supported with the necessary ingredients for growth-oriented, commercial suc-cess. This area is wide open for new, contemporary initiatives designed to achieve the goal of newfirms in small population centers. Books have been written on the topic, one published just a fewmonths age titled "Generating Local Wealth, Opportunity and Sustainability through Rural Clusters," byStewart Rosenfeld of Regional Technology Strategies, Inc. The author is a thought leader on the topicbecause his work is empirical, years of study of what kinds of firms cluster in less populated regions,and why. Rosenfeld's conclusions regarding cluster development success factors in places with smallpopulations point to the importance of certain community characteristics including social capital trustand connections to urban centers, all of which can be enhanced through policy interventions and newcommunity and economic development practices.
Next Steps
Can Alaska make the necessary changes in policy and practice to build a more diversified and sustain-able economy? This report has made the point that when faced with similar challenges, other regionshave made difficult decisions and moved in new directions with new thinking, new economic develop-ment policies, and new practices.
This report concludes that Alaska's leaders need to begin to address the risk of declining economic re-siliency by transitioning from today's approaches to economic development to new approaches, basedin part on the best practices of other regions. Bridging from this Situational Assessment to the upcom-ing Phase 2 Strategy Development work should begin immediately. We recommend the process startas other regions have started their strategic planning efforts. Puget Sound's Prosperity Partnership, forexample, moved quickly from its analysis of economic conditions and opportunities to form a newstrategic planning-oriented "Alaska Forward Leadership Council."
This group should be comprised of leaders drawn from companies, institutions and organizations acrossthe state. By virtue of their position and visibility, these leaders would command a degree of authority.Involving high level government leaders who have a strong incentive to address the state's economicchallenges would bring resources to the effort. Having top level private sector leaders involved wouldhelp assure that market-based principles would guide new initiatives and help avoid undesirable focuson grand, "pie in the sky" efforts. Private sector leadership would also bring executive and managerialtalent to the task, helping to keep the strategic planning process lean, focused and "business-like."
From this starting point, the leadership group would prepare to launch Phase 2. If the strategy develop-ment process has a significant component which is cluster-based, as we suggest, the next step would

14
A L A S K A F O R W A R D : P H A S E I S I T U A T I O N A L A N A L Y S I S
be to select specific clusters for priority attention. All the clusters would eventually be given full atten-tion, but the Leadership Council should not try to take on too much at once. Top-level leaders in eachcluster would be identified and briefed on their role to help coordinate and lead from their cluster's per-spective an 8-10 month-long cluster development strategy effort. The notion is that each cluster wouldgenerate a set of cluster-specific priorities aimed at addressing impediments to growth and develop-ment. Facilitated discussions would lead to a shared economic vision for each cluster as well as devel-opment of a number of policy initiatives, each designed to address an impediment to the cluster'sgrowth. Each initiative would have its own business plan and an "implementation champion" (i.e., own-ership) to help take the initiative forward. In addition, a limited number of cross-cutting initiatives andpolicy recommendations would also emerge from each cluster group, which would be integrated intothe broader state-wide strategy.
With the overall plan to move from Phase 1 to Phase 2 laid out, the Leadership Council should considerlaunching the effort with a high visibility event, perhaps a statewide Economic Summit. Stakeholdersfrom across the state would be invited to a day-long program, hosted by the Leadership Council whowould be introduced to the assembled leaders by the chairman. Presentations of the Situation Analysiswould be made with the objective of impacting how the audience hears the messages. Questionswould be solicited and answers provided by knowledgeable leaders, economists, and other experts.
In this way, Alaska will have kick-started the needed transition from its current approaches to economicdevelopment to a more strategic approach, led by leaders from the private and public sector. Similar ap-proaches have been used, in many cases repeatedly making collaborative strategic economic develop-ment planning the prevailing practice in many regions. There is no reason that Alaska's leaders can'tmove in similar ways, evolving a 21st century "Alaska Model" for economic development and startafresh to build a more diverse and more sustainable economy.

A L A S K A F O R W A R D : P H A S E I S I T U A T I O N A L A N A L Y S I S
W W W . I H S G L O B A L I N S I G H T . C O M 15
I N T R O D U C T I O N , O B J E C T I V E S A N D M E T H O D O L O G YSince statehood, Alaska has evolved its EDOs and approaches to economic development according tothe state's unique characteristics and needs. This report analyzes the current situation from several per-spectives. In the report's first section, we look at the array of EDOs in the state and comment on thevarious strategies and objectives of these and other organizations. We comment on the main featuresof Alaska's approach to economic development then look at the strengths and weaknesses of today'sorganizational structure. Our findings in these two sections come from a review of past reports as wellas input from informed leaders in interviews and surveys. From these analyses, we develop six overar-ching economic development themes for continuing study. Each theme highlights a critical issue forAlaska, ranging from the need for more top level leadership and coordination over what we refer to asAlaska's economic development infrastructure, to the need for new thinking about how to add morevalue to Alaska's important natural resource sectors. Finally, we look at how other states and regionshave addressed similar challenges and draw potential lessons for Alaska's leaders who must now focuson how best to organize economic development efforts and move the state toward a better performingand more sustainable economy.
The report then looks at the overall economic and competitive context that allows for an assessment ofthe impact of any deficiencies revealed in the economic development system. The consulting team an-alyzed Alaska's economy and produced an up-to-date economic profile and analysis of global market op-portunities. Another section of this report identifies the state's existing and nascent industry "clusters."Then the analysis proceeds to benchmark Alaska against a set of peer comparator states in severalareas we refer to as "economic foundations" (e.g., worker skills, technology, business climate, etc.). Thisreport brings into the overall analysis:
• Alaska's economic history and current approach to economic development
• Existing economic development objectives and strategies
• Strengths and weaknesses of the state's economic development organizations in terms of theirability to provide relevant, coordinated, business development services.
• Conditions in Alaska that foster or impede economic development, entrepreneurial climate and busi-ness retention.
To examine these issues, the consulting team completed a data collection approach that included re-search into the economic development history of the state through a review of relevant reports. Theteam also obtained a large and varied amount of insight from one-on-one interviews and stakeholdermeetings with top leaders in the public and private sector across the state. The team has completed 75one-on-one interviews.
Overall, our research includes interviews or surveys of three audiences:
1. Economic development organizations,
2. Specific industry and business leaders, and
3. Other interested parties through an on-line survey.
Additionally, the team made presentations to, and took questions from large audiences in group meet-ings including the State Chamber of Commerce, the Alaska Municipal League and the Resource Devel-opment Council. While non-Alaska-based team members were in Anchorage, Fairbanks and Mat-Su,additional information was collected in large and smaller scale meetings with economic developmentstakeholders, including industry representatives, local government officials, and elected officials.

16
A L A S K A F O R W A R D : P H A S E I S I T U A T I O N A L A N A L Y S I S
A N A L Y S I S O F E X I S T I N G E C O N O M I C D E V E L O P M E N T O B J E C T I V E S A N D S T R AT E G I E S
Key Organizations Responsible for Economic Development: An OverviewAlaska has a large number of economic development organizations with diverse funding sources, geo-graphic scopes, and approaches to creating economic wealth, retaining and attracting companies andgenerating new jobs. This section examines the state's economic development "infrastructure." Figure 6—Key Organizations Responsible for Economic Development—provides an overview, with selected ex-amples, of the variety of organizations whose purpose includes enhancing economic conditions withinAlaska. The entries in the figure are clearly not exhaustive. Instead, the purpose here is to show repre-sentative examples of economic development organizations (EDOs) and the scope of their work,whether statewide, regional or more sharply focused at the local level. They are also in the figure tosupport an important point: Alaska's organizational infrastructure for economic development is multi-faceted with little overarching structure tying the various pieces together.
The figure highlights organizations that are funded at the federal level but have state-level programssuch as the U.S. Economic Development Administration, U.S. Department of Agriculture and the U.S.Small Business Administration. We note that the federally-funded Denali Commission has funded theAPED project and has funded a broad range of infrastructure projects as part of its broader mandates.
The only state-funded, statewide EDOs are the Alaska Department of Commerce, Community and Eco-nomic Development (DCCED) and the Alaska Industrial Development and Export Authority. The latter isa financing entity created with state funds but is now self-supporting. Various divisions within DCCEDfocus on community and economic development. Within the DCCED is the Office of Economic Devel-opment (OED), which is intended as the focal point for state leadership and coordination in economicdevelopment. Its mission is broad, including initiatives to support and create jobs across the economy--from forest products to film to fisheries, minerals and tourism. A division within DCCED is the Divisionof Investments where direct state lending occurs, for example to commercial fishermen for permitsand gear and to pilots for avionics upgrades.
The Alaska Industrial Development and Export Authority (AIDEA) is a public corporation of the State,with a mission to "promote, develop and advance economic growth and diversification in Alaska by pro-viding various means of financing and investment." AIDEA provides financing for projects and programsdesigned to spur economic growth and development. It offers an array of financing programs and holdsinvestments in large projects supported by the government.

A L A S K A F O R W A R D : P H A S E I S I T U A T I O N A L A N A L Y S I S
W W W . I H S G L O B A L I N S I G H T . C O M 17
Figure 66. KKey OOrganizations RResponsible ffor EEconomic DDevelopment ((Examples)
The University of Alaska Center for Economic Development (UACED), while located in Anchorage,serves the entire state. Its mission is to leverage the university's resources to build the capacity ofAlaska to engage in sustainable economic development. The UACED is funded, in part, by a grant fromthe U.S. Department of Commerce, Economic Development Administration. Matching funds are pro-vided by the University of Alaska Anchorage, the Institute of Social and Economic Research and fees forclient services. The center provides entrepreneurial focused technical assistance (business planning,feasibility studies, marketing analysis, etc.), conducts applied research, and disseminates informationthrough outreach and economic development courses to support statewide economic development ini-tiatives and providers.
The University of Alaska's Small Business Development Center (SBDC) offers free business counselingby professional staff consultants and volunteers. The SBDC (which receives federal, state and localfunding) also offers business training through workshops, seminars and conferences on marketing, loanproposals, record keeping, business plans and other business-related areas. In addition, the SBDCmaintains a business library stocked with books, periodicals, videotapes, computers and business soft-ware for use by small business owners. Additional programs designed to promote the growth and de-velopment of small business offered through the SBDC network include the Procurement TechnicalAssistance Center (PTAC) which provides assistance with government contracting, Buy Alaska, whichworks to promote in-state purchase of goods and services via the Buyer-Seller Network, and the Tech-nology Research and Development Center (TREND).

18
A L A S K A F O R W A R D : P H A S E I S I T U A T I O N A L A N A L Y S I S
Alaska Growth Capital offers loans backed by guaranteed programs of the SBA and USDA. Loanamounts range from $100,000 to $10 million.
Finally, Alaska is experimenting at the state level with new forms of business assistance. For example,the AKSourceLink network launched in 2009 consists of nonprofit organizations, university programs,and government agencies that provide resources to promote the success of small business. Resourcepartners include economic development organizations, educators, technical assistance providers, stateand federal programs, networking groups, loan providers and others.
In the middle of Table 1, are a much larger number of EDOs whose scope is mainly regional. Includedhere are the non-governmental Alaska Regional Development Organizations (ARDORs). ARDORs offertechnical and other forms of assistance to public and private parties in their area, basically serving as re-gional economic development service centers. The ARDORs represent Alaska's different regions andbridge, through partnerships, locally driven initiatives with State and Federal initiatives to stimulate eco-nomic development and produce healthy, sustainable local economies. The ARDORs are intended to:
• Enable communities to pool their limited resources, and work together on economic developmentissues, through comprehensive economic development strategies.
• Develop partnerships among public, private and other organizations within their region,
• Offer technical expertise to economic development strategies.
Alaska's unique ANCSA corporations can also be put into this regional category. The mission for manyANCSA Corporations includes economic, social and cultural growth through subsidiaries, foudations andpartnerships.
Non-profit tribal organizations also assume some regional economic development responsibilities. Thisincludes organizations such as the Central Council Tlingit Haida Indian Tribes of Alaska (CCTHITA), an or-ganization interested in (among many other things) economic development in Southeast Alaska. TheTanana Chiefs Conference (TCC) plays a similar role in Interior Alaska.
Somewhere between regional and local lie the unique Community Development Quota Groups. Each ofthe six groups represents a cluster of traditionally fisheries-dependent communities in western Alaska.The groups use a share of the federal fisheries harvest to operate businesses that allow residents oftheir communities to participate in, and benefit directly from, the groundfish fisheries off their shores.
At the local level are the array of Chambers of Commerce, independent local development organiza-tions and tribal organizations. Chambers of Commerce have the mission of supporting local business in-terests—an element of any state's economic development mosaic.
Addressing the Challenge: From Decentralized Approaches to a Leadership Model
Alaska's economic development infrastructure is different than that of other states, not surprising givenits relatively recent granting of statehood, the large role played by the federal government and thestate's mainly resource-based economy. Alaska's unique geography, varying physical environments andcultural diversity are other factors that have brought the EDO "system" to the point we see today.
While Alaska's unique characteristics and huge development challenges may argue for today's organiza-tional infrastructure, many leaders who responded to our surveys and in interviews commented onwhether the increasingly cloudy economic picture might suggest different approaches in the future.With the wide variety of organizations, some with potentially overlapping missions and different fundingsources and thus outcome expectations, it is understandable that questions arise about statewide lead-ership and coordination.

A L A S K A F O R W A R D : P H A S E I S I T U A T I O N A L A N A L Y S I S
W W W . I H S G L O B A L I N S I G H T . C O M 19
We can conclude that in the past a largely decentralized organizational approach made a good deal ofsense. The economy was more narrowly based on commercial fishing, oil and other natural resources.But the economy is changing. Newer sectors like tourism are playing a much larger role, while manufac-turing and business services are emerging, albeit slowly. In this context, is increasingly clear that Alaskaneeds a more strategic approach to retain and strengthen its core industries while at the same time de-velop the much smaller sectors and "pre clusters" identified in the cluster analysis report. From this van-tage point, what is needed is a broadly accepted source of leadership, and a coordinated, moresystematic and networked array of regional and local economic development organizations where poli-cies meet practice.
Whether or how the state moves to a more focused and coordinated statewide strategy does not nec-essarily mean abandonment or even serious curtailment of regional and local practices. It may, how-ever, mean evolving a unique and overarching "Alaska Model" for economic development that takeslessons from other states but puts them into practice in ways that recognize Alaska's special circum-stances.
Economic Objectives and Strategies
The EDO survey and related research provides a way of looking at the economic development objec-tives being employed in Alaska. Again, this is just a glimpse because of the wide array of economic de-velopment programs and initiatives in the state, but is nevertheless instructive. Table 3—EconomicDevelopment Objectives and Example Alaska Strategies—is presented as a framework to further as-sess Alaska's approaches to economic development against the typical economic development objec-tives and approaches in most U.S. states. We look at eight typical economic development objectivesand some example initiatives used in Alaska.
1. Economic DDiversification ffor IIncome SStability: Diversification in an economy is desirable for a num-ber of reasons including smoothing out the peaks and valleys and the booms and busts that arepossible in any economy as market forces and other factors out of local control impact economicsectors. A diversified economy is desirable as well because diversification minimizes seasonality ofeconomic activity and the resultant fluctuations that affect employment, wage and other local mar-kets.
2. Industrial AAttraction: In order to build a diversified regional economy, nearly every state focuses ef-forts to attract industries that would find competitive advantages in the state. Industrial attractionobjectives are achieved by marketing the state's attractions to targeted industries and firms. Statesgenerally offer tax or other publicly supported incentives (e.g., special purpose infrastructure) de-signed to induce firms to relocate from one area to another. In this way, however, industrial attrac-tion strategies are controversial because regions who lose "their" industry to another region thatoffers a "better deal" often feel taken advantage of. From a national perspective, industrial attractionand targeted marketing can also be seen as "zero sum" in the sense that there is no net growth injobs or income to the country if companies simply move from one state to another to take advan-tage of lower costs. Industrial attraction can be viewed as a "race to the bottom," a good examplebeing how the U.S. footwear industry left the northeast for lower costs in the southeast, and thenfor even lower costs in the Caribbean, then China and now Vietnam.
3. Development oof tthe WWorkforce: Increasingly, states and regions are focused on job skill training asa way to both attract firms from the outside but also to provide local firms with the competitive ad-vantage of a skilled workforce. Workforce development as a tool for economic development is awin-win proposition, paying dividends to residents, firms and a state's overall economy. The down-

20
side is that it can take a long time to scale up worker skills and can be costly, as education and train-ing institutions often require new resources for teachers, curricula development and facilities.
4. Technology CCommercialization: Most states have reasonably comprehensive programs designed todevelop for commercial purposes technology from the labs of land grant universities into the stateeconomy. "Tech transfer" is the process of identifying patentable technologies from the applied re-search of universities, and systematically providing training in entrepreneurship and management,business plans, capital financing and other resources in order to create small companies whose pur-pose is to produce and sell the technology product or service. Most states can point to many eco-nomic development successes coming from the commercialization of university-based technology.
5. Assistance tto SSmall aand MMedium EEnterprises: It is widely agreed that most jobs are created bysmall and midsize business, typically firms with 250 or fewer employees. Economic developmentorganizations around the country are assisting small businesses with capital financing, targeted jobskill training and other inputs to help them gain stronger footholds in their markets, grow and gener-ate jobs. The key to success in small business formation is having a business culture that nurturesentrepreneurship and effective small business management. While entrepreneurs may be "born notcreated," there is little doubt that state level public policies and programs have had a positive impacton the growth of small businesses.
6. Improved BBusiness CClimate: Businesses, large, small or just starting up, require a supportive taxand regulatory climate to succeed. Economic development organizations can help shape a pro-growth business climate through advocacy and by lobbying legislative bodies for changes in tax pol-icy, permitting processes and other impediments to business formation and growth. Pro-growthpolicies provide the umbrella under which new business investments are made and efforts to ex-pand or modernize existing businesses can be successful.
7. Reasonable RRegulations aand RResource MManagement: An element of a region's business climate isits regulatory environment. Economic development organizations can advocate to agencies and ad-ministrations for more efficient processes and for relief from rules and regulations that unnecessar-ily impede investment, business formation and growth.
8. Improved LLogistics aand PPhysical IInfrastructure: Successful commerce requires physical facilities,particularly transportation and logistics infrastructure. Many industries have a need for specializedinfrastructure such as access to air freight, advanced access to communications and location advan-tages (e.g., specialized business or industrial parks). Economic development organizations can ad-vocate for roads and highways, for telecom infrastructure and other physical advantages needed byfirms to be competitive.
The connection between the objectives based on typical practice in most states (listed in the left-handcolumn of Table 3) and the example strategies found in Alaska in the right hand column is inferred. Noone program or activity raises any particular question. From a strategic standpoint Alaska has focusedits economic development resources largely in the more traditional areas, notably economic diversifica-tion, infrastructure development, and the like. These efforts are often driven by "big picture" initiatives(e.g., gas pipelines, ANWR exploration). Some attention has historically been paid to developing interna-tional business relationships, but mainly with respect to the seafood and forest product industries.
A L A S K A F O R W A R D : P H A S E I S I T U A T I O N A L A N A L Y S I S

A L A S K A F O R W A R D : P H A S E I S I T U A T I O N A L A N A L Y S I S
W W W . I H S G L O B A L I N S I G H T . C O M 21
Ta b l e 3 . E c o n o m i c D e v e l o p m e n t O b j e c t i v e s a n d E x a m p l e A l a s k a S t r a t e g i e s
O b j e c t i v eS t r a t e g i e s ( I m p l i c i t a n d E x p l i c i t )
( I n i t i a t i v e s t h a t h a v e t e n d e d t o r e c e i v e t h e m o s t s t a t e w i d ea t t e n t i o n a n d r e s o u r c e s i n t h e p a s t a r e i n i t a l i c s . )
Economic Diversification
• Small planning grants (mainly for start-up and expansion feasibility studies).
• Supporting value-added processing (e.g. seafood and wood products; mainly federally funded).
• Business and industrial investments—Alaska Industrial Development and Export Authority(AIDEA).
• Proposed gas line (e.g., Alaska Gasline Inducement Act).
• Development of Alaska's cultural resources sector—arts, crafts, cultural tourism [e.g., AlaskaDepartment of Education and Early Development (State Council on the Arts) manages the Sil-ver Hand Program, which authenticates Alaska Native crafts].
• Commercialization of underutilized resources (e.g., proposed gas line, seafood species andbyproducts, including shellfish mariculture, farm and meat products, and timber products).
• Marketing Alaska [e.g., Alaska Travel Industry Association (ATIA), Alaska Film Office, AlaskaSeafood Marketing Institute (ASMI)].
Industrial Attraction • Practiced regionally by a few ARDORS and some municipalities.
• Minor emphasis at the state level (e.g., Alaska Exploration Incentives Tax, feasibility analysisof Foreign Trade Zones).
Development of the Workforce
• Minimize non-resident employment; maximize job skills of residents through training programsthat address demonstrated employer needs such as oilfield services, construction, health serv-ices personnel and teachers.
• Workforce development has received substantial attention in many parts of Alaska.
Technology Commercialization
• Focus has been primarily on small-business applications (e.g., University of Alaska Office ofTechnology Transfer, SBDC's TRENDAlaska and the former Alaska Science and TechnologyFoundation).
• Recent interest in alternative energy may promote new technology.
Assistance to Small andMedium Enterprises
• Industry-specific research and technical assistance [e.g., Alaska Visitor Statistics Program, Of-fice of Fisheries Development, Office of Tourism Development, ASMI (primarily industryfunded), Regional Seafood Marketing Authorities (RSDAs—industry funded)].
• Financing programs (e.g., AIDEA, DCCED Division of Investments, Alaska Growth CapitalBIDCO),
• Grants to subsidize equipment and industry-specific infrastructure and, occasionally market-ing efforts (e.g., fishing, seafood processing, sawmill, agricultural and other equipment - mainlyfederally funded).
• Web-based networking and technical assistance (e.g., www.AKSourceLink.com).
• Support for value-added processing (primarily seafood and wood products (e.g., Wood Certi-fication Program for Alaska species—mainly federally funded).
• Technical assistance for urban and rural small businesses (e.g., SBDC (state and federallyfunded), Alaska Village Initiatives.
• CDQ program (i.e., federal program that grants a percentage of Bering Sea and Aleutian Islandscommercial fish harvests to six regional development organizations).

22
Bold thinking has, of course, been a hallmark of the state's development. The Trans-Alaska Pipeline Sys-tem (TAPS), Red Dog Mine road and port, and hydroelectric projects in the Southeast have transformedthe economy. But long-term transformational initiatives, while clearly visionary, cannot be the only ap-proach at a time when the economy is showing strains.
The question that is not easy to answer is: Has Alaska worked on its economy in a strategic way, ormore of a scatter shot way? The purpose of Table 4 and this discussion is to make the case thatAlaska's economic development leaders have had no shortage of "big ideas' as well as smaller, moretactical programs. The key question is: if driven by an informed economic development vision, a morestrategic approach, with strong leadership, would Alaska have more to show from its economic devel-opment investments and efforts?
Examples of Past Statewide Economic Development Planning
A review of recent statewide economic planning documents available electronically or in the AlaskaState Library identified several reports from the Hickel and Knowles administrations. The only formaldocument found from the Murkowski administration is State of Alaska Seafood Economic Strategies,an industry-specific study by the McDowell Group in 2006.
A L A S K A F O R W A R D : P H A S E I S I T U A T I O N A L A N A L Y S I S
Ta b l e 3 . E c o n o m i c D e v e l o p m e n t O b j e c t i v e s a n d E x a m p l e A l a s k a S t r a t e g i e s ( C o n t i n u e d )
O b j e c t i v eS t r a t e g i e s ( I m p l i c i t a n d E x p l i c i t )
( I n i t i a t i v e s t h a t h a v e t e n d e d t o r e c e i v e t h e m o s t s t a t e w i d ea t t e n t i o n a n d r e s o u r c e s i n t h e p a s t a r e i n i t a l i c s . )
Improved Business Climate
• Minimize taxes and regulation.
• Facilitate investor networks (minimal activity in the past, e.g., Alaska InvestNet, Alaska GrowthCapital BIDCO).
• Facilitate buyer networks (e.g., ASMI, Buy Alaska, World Trade Center Alaska)
• Facilitate state procurement by local firms (e.g., Alaska Bidders Preference)
Reasonable Regulation and Re-source Management
• Lobby Congress to allow more private development of federal resources—especially oil, min-erals and timber—on federal lands.
• Manage state-controlled, renewable resources for sustained yield.
• Exploration incentives.
• Ensure state-imposed business and regulatory costs are reasonable and related to legitimatepublic interest (e.g., ongoing regulatory review, Small Business Regulations Program).
Improved Logistics & PhysicalInfrastructure
• Seek federal funding for major transportation infrastructure such as roads, bridges, airportsand ferry system improvements.
• Seek federal funding (e.g., Denali Commission, EDA) funding for smaller, local infrastructuresuch as rural diesel generation, fuel storage, medical clinics and some local transportationand other community infrastructure.
• Quasi-public provision of services [e.g., Alaska Railroad Corporation, Alaska Marine HighwaySystem, Alaska Energy Authority (AEA), Alaska Aerospace Corporation (Kodiak launch facility)].
• Various AIDEA investments (e.g., Ketchikan Shipyards, Delong Mountain Transportation Sys-tem, and FEDEX Aircraft Maintenance Facility.)
• Recent: Encourage development of potentially lower-cost, renewable, and alternative energy.
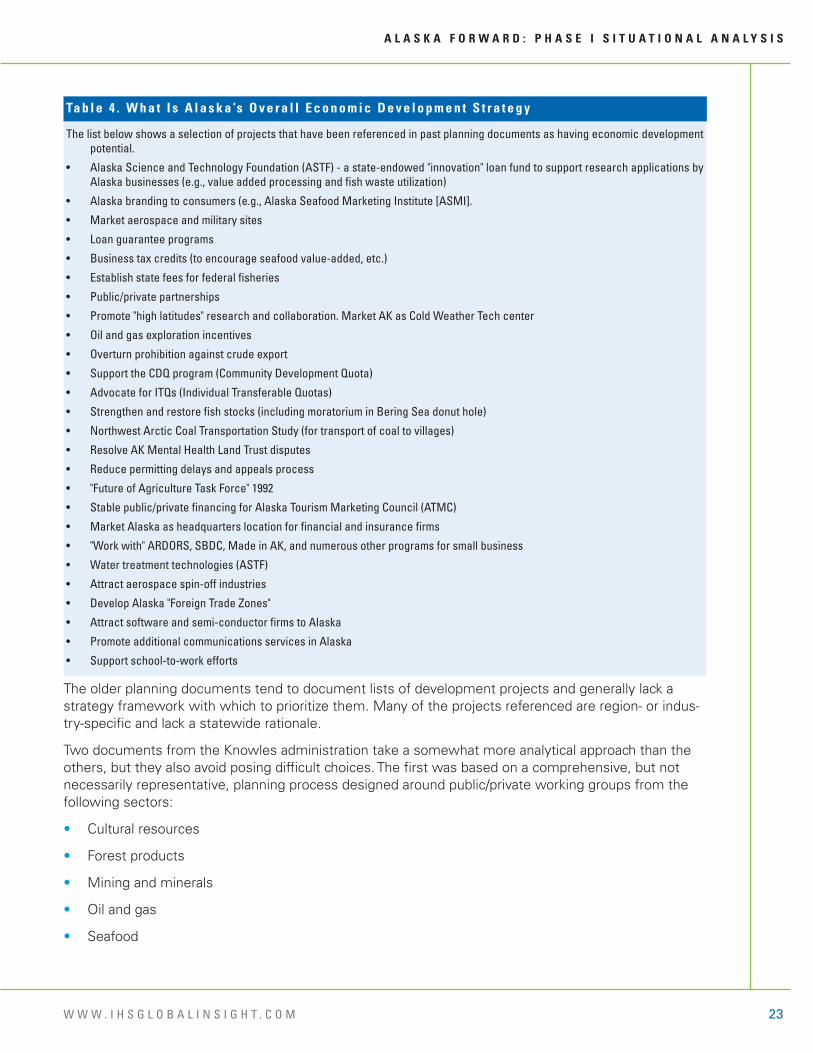
A L A S K A F O R W A R D : P H A S E I S I T U A T I O N A L A N A L Y S I S
W W W . I H S G L O B A L I N S I G H T . C O M 23
The older planning documents tend to document lists of development projects and generally lack astrategy framework with which to prioritize them. Many of the projects referenced are region- or indus-try-specific and lack a statewide rationale.
Two documents from the Knowles administration take a somewhat more analytical approach than theothers, but they also avoid posing difficult choices. The first was based on a comprehensive, but notnecessarily representative, planning process designed around public/private working groups from thefollowing sectors:
• Cultural resources
• Forest products
• Mining and minerals
• Oil and gas
• Seafood
The list below shows a selection of projects that have been referenced in past planning documents as having economic developmentpotential.
• Alaska Science and Technology Foundation (ASTF) - a state-endowed "innovation" loan fund to support research applications byAlaska businesses (e.g., value added processing and fish waste utilization)
• Alaska branding to consumers (e.g., Alaska Seafood Marketing Institute [ASMI].
• Market aerospace and military sites
• Loan guarantee programs
• Business tax credits (to encourage seafood value-added, etc.)
• Establish state fees for federal fisheries
• Public/private partnerships
• Promote "high latitudes" research and collaboration. Market AK as Cold Weather Tech center
• Oil and gas exploration incentives
• Overturn prohibition against crude export
• Support the CDQ program (Community Development Quota)
• Advocate for ITQs (Individual Transferable Quotas)
• Strengthen and restore fish stocks (including moratorium in Bering Sea donut hole)
• Northwest Arctic Coal Transportation Study (for transport of coal to villages)
• Resolve AK Mental Health Land Trust disputes
• Reduce permitting delays and appeals process
• "Future of Agriculture Task Force" 1992
• Stable public/private financing for Alaska Tourism Marketing Council (ATMC)
• Market Alaska as headquarters location for financial and insurance firms
• "Work with" ARDORS, SBDC, Made in AK, and numerous other programs for small business
• Water treatment technologies (ASTF)
• Attract aerospace spin-off industries
• Develop Alaska "Foreign Trade Zones"
• Attract software and semi-conductor firms to Alaska
• Promote additional communications services in Alaska
• Support school-to-work efforts
Ta b l e 4 . W h a t I s A l a s k a ’s O v e r a l l E c o n o m i c D e v e l o p m e n t S t r a t e g y

24
• Small business
• Technical services
• Tourism
The working group recommendations—entitled Marketing Alaska, the Governor's Economic Develop-ment Initiative 1996—were similar to those in earlier documents, but somewhat more detailed and ana-lytical about the role of state government. Marketing Alaska identifies a wide range of specific policyand regulatory steps and strategies. The recommendations are too extensive to summarize here.
The second Knowles-era document, in 1997, was facilitated by the Hubert H. Humphrey Institute ofPublic Affairs and is documented in the report, Alaska's New Deal: An Economic Development Strategyfor Alaska. In addition to developing a basic overview of Alaska and its economy, the study included lo-cation quotient and shift-share analyses that identified several Alaska sectors as having competitive ad-vantage compared to other states. These were:
• All resource extracting and producing industries (export industries)
• Transportation-related industries
• Social service and personal service industries
The report concluded that Alaska did not have an advantage with respect to manufacturing and saidmanufacturers would need to be "lured" to Alaska.
Alaska's New Deal included seven "visions":4
1. Alaska will become a leader in the use of telecommunications technology.
2. Alaska will make land transportation more accessible.
3. Native corporations will provide economic equality for Native Alaskans across the state.
4. Honey buckets will become history.
5. Cost of living in Alaska will steadily decline (through infrastructure investment).
6. Alaska's economy will be diversified and unemployment will drop.
7. The sanctity of the environment will remain intact, while the economy will continue to benefit fromnatural resource development.
Subsequent action planning addressed three main areas:
• Transportation and telecommunications
• A public/private Infrastructure Investment Coalition to promote "realistic" infrastructure expan-sion in transportation and telecommunications.
• Creation of Regional Telecenters to encourage phone companies to install "backbone" technolo-gies and provide widespread access to teleconferencing.
• Mechanisms for public subsidy, if needed, to promote backbone infrastructure.
• Promotion of businesses tied to "remote living" with access to world markets through cutting-edge technology.
A L A S K A F O R W A R D : P H A S E I S I T U A T I O N A L A N A L Y S I S
4 The report does not specify, but it appears these visions were developed at a State Economic Development Workshop.

A L A S K A F O R W A R D : P H A S E I S I T U A T I O N A L A N A L Y S I S
W W W . I H S G L O B A L I N S I G H T . C O M 25
• Economic diversification
• Natural resources—for example, through long-term policies, active marketing and low-interest fi-nancing.
• Aerospace—location marketing, business attraction, and University of Alaska partnerships.
• Tourism—help rural operations, assist with infrastructure and marketing, and loosen land con-trols.
• Native corporations—encourage information sharing and cooperation between them and theState.
• Quality of life
• Increase home ownership.
• Provide financial support for water and sewer systems.
• Increase educational attainment.
• Increase the supply and quality of healthcare.
• Reduce crime.
• Resolve differences among sport, subsistence and commercial harvesters.
Alaska's New Deal represents the most recent formal statement of statewide economic developmentgoals and priorities identified.
Conclusions aand IIssues ffor SStrategy DDevelopment
Why have Alaska's previous statewide economic development efforts come up short? Probably themost important reason is that implementation planning was not part of the process. Other probablereasons include
• Lack of overarching (across industry) leadership or ownership of the planning effort,
• Lack of resources to support next-steps in the planning and implementation process, and
• Shifting political priorities.
Alaska has no shortage of economic development organizations and institutions nor has it come up shortwith its historical array of large and smaller scale economic development activities. But too many of thestate's past efforts to analyze economic development issues have focused more on problems than on vi-able, longer term solutions. The result has been tactical shifts in policy and practice to address specificneeds rather than higher level, strategic efforts to address broad weaknesses in the economy. Indeed,few would be able to credibly argue today that Alaska has a coherent economic development strategy.
Put this in context with the upcoming profile of the state's economy that makes the case that thestate's economic picture, especially looking forward, is clouded by higher risk and a key question arises.Should the spending and array of programs of the past simply continue, or is broad new thinking re-quired about the economy and how it should be developed? If the answer to the question is that newthinking and new approaches are necessary, then the state's organizational approach to economic de-velopment and the strategies and tactics used need to be more cohesive, more part of an overarchingeconomic vision, with strong leadership from the top, improved staff capacity and much more coordina-tion within and among the economic development organizations throughout the state that operatewhere policy meets practice.

26
For all the reasons mentioned in this report, building a more diverse economy better able to meet thelonger-term needs of the state is clearly a tough order for Alaska's EDOs. Yet from this review, we mustconclude that the state's institutional capacity to address fundamental economic problems, while wellintentioned and at times successful with tactical interventions, may lack the overarching vision andhigher-level leadership and coordination needed to make the most of efforts expended.
Assessment of Strengths and Weaknesses of the State’s Economic Development OrganizationsSurvey Results
Three research components were designed to obtain information about the baseline status of Alaska'seconomic development efforts. These are:
• Approximately 50 interviews with individuals who represent organizations engaged in economic de-velopment, or development-related activities (EDOs)
• Approximately 25 interviews with individuals who represent associations or other organizations thatrepresent Alaska's major industries
• A web-based survey available to any interested parties and the general public. This survey was de-signed to accept a wide variety of input.
The three research components were selected to provide a broad range of perspectives. However, thereader should note that none of the three is based on statistical (random) sampling. The degree towhich results reflect, or diverge from, those of all Alaska economic development professionals, industryassociations, or the general public therefore cannot be calculated.
The interview process was designed to examine a broad spectrum of activities and perspectives. It isan exploratory outreach to help identify 1) the full range of barriers to development faced by Alaska, and2) the major development ideas, strategies and activities currently being pursued. The interviews alsoasked about new development possibilities.
The interview and survey tasks focused on complex issues. The reader interested in all the informationdeveloped in this work should review the companion survey results appendix material.
Economic Development Organization Interviews
More than 50 interviews were conducted with people who represent a wide variety of economic devel-opment organizations including the following:
• Alaska Regional Development Organizations (ARDORs)
• State agencies
• Municipal officials
• Tribal organizations
• Labor organizations
• Private consultants
• Federal development programs
• Post-secondary educational institutions
• Community Development Quota groups
A L A S K A F O R W A R D : P H A S E I S I T U A T I O N A L A N A L Y S I S

A L A S K A F O R W A R D : P H A S E I S I T U A T I O N A L A N A L Y S I S
W W W . I H S G L O B A L I N S I G H T . C O M 27
• Organizations that promote discussion and analysis of economic issues
Summary of Major Themes
Respondents were generally optimistic about the future of Alaska. There was, though, a general feelingof frustration at what is perceived as a lack of leadership and coordination of economic development re-sources. Some believe that the State of Alaska should provide the leadership. Others believe that theprivate sector needs to do more. A few said the State is not supportive of rural Alaska needs.
What aare tthe ggreatest oopportunities ffor eeconomic ddevelopment?
Natural resources, especially oil and gas, tourism, and fishing, were the most common responses. Oth-ers included education (for example, expand community colleges and research at the University ofAlaska), technology, renewable energy, transportation and Alaska's strategic location, development ofsmall businesses and entrepreneurship, mining, arctic engineering and architecture, the film Industry,aerospace, military expansion, value-added processing, mariculture, healthcare services, timber, retail,port expansions. Small business development was seen as especially important for rural Alaska.
What aare tthe ggreatest bbarriers tto eeconomic ggrowth?
Most of those interviewed mentioned high costs of transportation, shipping and energy. Also men-tioned was lack of leadership and vision at high levels in business and public policy. Respondents feltthere was no coordinated plan for development efforts in Alaska.
Other responses include the following:
• Alaska's entrepreneurial spirit is not well-developed, especially in bush communities where the sub-sistence lifestyle remains a mainstay
• Lack of educational opportunities and training for small business startups
• Lack of financing for major projects and lack of business capital in general
• Vast distances and geographic isolation along with small population centers and severe climate
• Lack of available land for development
• Inadequate public infrastructure to support businesses
• Gaps in workforce training
• Gaps in communications and other technology (for example, internet services in some areas)
• High cost of living, especially in rural communities, and the high cost of doing business in general.
Respondents were then asked to rate16 potential barriers to economic development. A rating of 1meant "not at all a barrier," and a rating of 10 meant "a significant barrier." Since each of the 16 barriersreceived at least one rating of "1" and at least one rating of "10," it is clear that different disciplines andgeographic locations result in different perspectives. It should be kept in mind that the sample is notrandom and specific priorities vary from region to region and industry to industry.
The barriers with the highest ratings (6.7 to 6.9) included transportation links with markets and suppli-ers, energy costs and federal regulations. A large group of barriers received moderate ratings (4.3 to5.9). These are access to capital, state regulations, availability of professional/technical workforce, avail-ability of economic development incentives, technology competitiveness, local regulations, cost of busi-ness property, telecommunications infrastructure, availability of semi-skilled workers, and job-readinessof entry-level workforce. The two factors with the lowest ratings (3.2 to 3.3) were quality of life andlocal taxes. The latter is understandable, since taxes in Alaska tend to be low compared to other states.

28
The quality of life rating is interesting from the perspective of attracting new business and industry,since quality of life in Alaska is different, or perceived as different, from what many Americans and oth-ers are used to.
Lookingg 225 yyears oout, wwhat aare tthe bbest oopportunities ffor ddiversifyyingg AAlaska''s eeconomyy bbeyyond rre-source eextraction?
Longer term opportunities identified included tourism; transportation (Alaska as a hub for the world);technology (IT, Arctic climates technology, software development, fiber optics, call centers); educationand vocational training; manufacturing; shipping (for example in the Bering Sea and Northwest Pas-sage); energy innovation; telecommunications; commercial fishing; the film industry; university re-search; alternative energy (wind, solar, tidal, and hydro); value- added processing and services, andsmall business development.
How cconfident aare yyou tthat AAlaska wwill bbe aable tto ccompete ggloballyy oover tthe nnext 225 yyears?
Answers overall were positive, in part, respondents said, because Alaska has resources that the rest ofthe world values. Respondents also said that to develop Alaska's resources, political and economic chal-lenges must be addressed. Here, again, respondents cited lack of statewide planning, lack of informa-tion on how to implement economic development, lack of cooperation among the various agencies andeconomic development organizations, and a lack of leadership. Several respondents said the ANCSAcorporations are one key to future development.
What iis tthe ffocus oof yyour oorgganization''s ccurrent eeconomic ddevelopment eefforts, aand hhow eeffective aaretheyy?
Respondents said they use a number of different strategies to greater or lesser extent. These include:
• Support for infrastructure development
• Local or regional marketing
• Community and economic development grants
• Industry/business attraction
• Workforce development
• Small business assistance
• Other strategies—Respondents listed many other activities, including education, advocacy, renew-able energy projects, technical assistance, and general networking.
All the areas above receive some attention from EDOs. The amount varies widely depending on thetype of organization and its geographic orientation. The greatest percentage of overall EDO effort is di-rected at workforce development, industry/business attraction, and support for infrastructure develop-ment, according to the interview results.
Asked to rate how effective their organizations are at individual strategies, respondents gave the high-est ratings to specific projects that fall into the "other" category above. Taken as a group, respondentssaid they were most effective at writing economic development grant proposals and workforce develop-ment and least effective at industry/business attraction and technology commercialization. They rated allthe major strategies listed as moderately effective.
A L A S K A F O R W A R D : P H A S E I S I T U A T I O N A L A N A L Y S I S

A L A S K A F O R W A R D : P H A S E I S I T U A T I O N A L A N A L Y S I S
W W W . I H S G L O B A L I N S I G H T . C O M 29
Who ddo EEconomic DDevelopment OOrgganizations ppartner wwith?
The variety of answers to this question offers a sense of the wide and challenging scope of Alaska de-velopment efforts. Organizations cited by respondents include, in no particular order:
U.S. Economic Development Administration; Denali Commission; U.S. Housing and Urban De-velopment (HUD); U.S. Small Business Administration (SBA); University of Alaska; local eco-nomic development councils, corporations; convention and visitors bureaus; the ARDORs;USDA Forest Service; various State of Alaska agencies; Indian Health Service; Rasmuson Foun-dation; Foraker Group; regional housing authorities; mortgage lenders; community developmentfinance institutions (CDFIs); municipal and tribal governments; regional and village Native corpo-rations; regional and village Native nonprofits; various workforce training programs; ResourceDevelopment Council; Alaska Energy Authority; chambers of commerce; Alaska Railroad Corpo-ration; Port of Anchorage; school districts; airports; Alaska Natural Gas Development Authority;mining companies; community colleges; UAF's Fisheries Technical Center at Kodiak; CDQgroups; U.S. Coast Guard; various industry associations; Associated General Contractors ofAlaska; labor unions; business leaders; Federal Emergency Management Agency (FEMA); Envi-ronmental Protection Agency (EPA); Army Corps of Engineers, and the U.S. Congress.
A complete list of the organizations that comprise Alaska's statewide economic development networkwould be even larger. The range of EDO partnership efforts underscores the frustration of many inter-viewees who commented on a sense of poor coordination of economic development activities.
What aadditional rresources aare nneeded?
The most common needs among EDOs are, not surprisingly, money and staff time. More specifically,respondents said they needed funding for program grants, bringing state personnel to rural areas, get-ting information out, travel money, and planning and analysis.
Sample Comments
When asked for any additional comments, EDO respondents made a variety of observations. Thosebelow are not to be interpreted as study conclusions. Rather, they represent some of the more com-mon themes and frustrations that were expressed.
• Government cannot drive economic development for the State of Alaska. Opportunities should bedeveloped in the private sector and then have government support.
• It is important to continue the dialog among state, federal, land local entities. Be realistic aboutwhat to pursue and do not let egos get in the way.
• For a state of our population size, we are wealthy. Much wealth has been developed, but we needto do a better job of retaining that money in the state.
• The State of Alaska has been a non-player with respect to industry recruitment and foreign and do-mestic investment. Need the State to be active partner.
• The challenge is to move projects forward. There are too many steps, feasibility studies, etc. Permit-ting process takes too long.
• Need more coordination of resources. People do not work together.
• The State isn't supportive of rural Alaska. Flying people out to villages does not accomplish anything.
• Workforce development is key. Grants are funded but there is a shortage of trained people to do thework.

30
• Workforce and economic development work hand in hand. Economies in rural Alaska are mixed be-tween cash and subsistence with a cash economy not always seen as valuable.
• The biggest challenge is finding good employees in-state—to hire Alaskans rather than "importing"workers.
Industry Association Interviews
Structured interviews were conducted with individuals from approximately 25 associations or other or-ganizations that represent Alaska business interests.
Summary of Major Themes
Opinions about Alaska's current business climate and the outlook for economic growth ranged frompositive to uncertain to negative. As with the EDO representatives, many respondents said there is alack of leadership and coordination of resources.
What aare tthe ggreatest oopportunities ffor ggrowth iin yyour iindustry?
Whereas EDO respondents were asked about opportunities for Alaska in general, industry representa-tives were asked to address their own industries. Many said Alaska should expand its natural resourcedevelopment, for example mining, outer continental shelf (OCS), other oil and gas (e.g., ANWR,Chukchi Sea and gas line), and fishing. Other opportunities cited include tourism (and ecotourism), An-chorage as a transportation hub, the military presence in Alaska, and exploiting the increasingly ice-freeNorthwest Passage for freight transportation.
Other responses include biomass and bio-energy development; timber harvesting; carbon trading; aero-space (for example, rapid response and medium-lift launches); encouraging innovative entrepreneurs;training more youth in the construction trades; technology (such as putting fiber optic cable in ruralAlaska communities); construction of the Point MacKenzie Bridge (to open up land near Anchorage);building housing and rental housing (to accommodate workforce and create jobs); Native arts and crafts;off-site and remote participation in high-tech jobs; and developing more jobs in the health care industry.
What aare tthe sspecific bbarriers tto ggrowth iin yyour iindustry?
Most often mentioned were lack of infrastructure and road access; the high costs of transportation andenergy; and lack of coordination and planning by the State. Some respondents said there is an anti-busi-ness climate in Alaska.
Other responses include education and recruitment of labor; environmental groups (and the Endan-gered Species Act); federal taxes, laws, regulations and public policy; capitalization; lack of state incen-tives or recognition of possible economic growth sectors; zoning laws in the Municipality of Anchorage;litigation and permitting; and difficulty obtaining construction loans or mortgages.
Sample CComments
Again, these comments are only examples and should not be interpreted as study conclusions. Instead,they represent some of the more common themes discussed above.
• The State needs to take a leadership position in economic development. There is no statewide de-velopment plan, no vision, no direction to follow and too many silos.
• The State should have an office of economic development that identifies opportunities and obsta-cles and that proactively engages with communities and helps bring opportunities to fruition.
• The State should pay for strategic infrastructure so development will follow.
A L A S K A F O R W A R D : P H A S E I S I T U A T I O N A L A N A L Y S I S

A L A S K A F O R W A R D : P H A S E I S I T U A T I O N A L A N A L Y S I S
W W W . I H S G L O B A L I N S I G H T . C O M 31
• For economic development, people need to take calculated risks but the public sector does not re-ward risk. Be aggressive and targeted.
Web Survey Results
This section presents partial results from a web survey designed to gather input from business andcommunity leaders. As of survey closing approximately 300 people had logged on and answered someor all of the questions. The sample is self-selected, so the degree to which responses are representa-tive of the population of Alaska as a whole cannot be specified.
Respondents expressed considerable uncertainty about Alaska's economic future in the short term.While many more said they think the outlook over the next two years is good compared to those whothink it is poor, the largest group, 40%, said they are uncertain.
Opinions about the longer term were more positive than negative, but again the dominant responsewas uncertainty.
Attitudes about the current business climate are similar to those about the future, above. Even whenconsidering the business climate today, one-third of respondents aren't sure whether it is good or poor.The fact that respondents answered "uncertain" rather than "don't know," suggests that they are trulyunable to decide what the information available to them means.
00..00%%
44..77%%
1144..55%%
4400..22%%
3377..55%%
33..00%%
0 0.1 0.2 0.3 0.4 0.5
Don't Know
Very Poor
Poor
Uncertain
Good
Very Good
Figure 77. HHow DDo YYou VView tthe EEconomic OOutlook ffor AAlaska Over tthe NNext TTwo YYears?(N=296*)
*This number represents the number of respondents who answered this question.
11..44%%
55..44%%
1100..55%%
3300..77%%
66..11%%
4455..99%%
0 0.1 0 .2 0.3 0.4 0.5
Don't Know
Very Poor
Poor
Uncertain
Good
Very Good
Figure 88. HHow DDo YYou VView tthe EEconomic OOutlook ffor Alaska OOver tthe NNext 110 YYears?(N=296)
11..00%%
44..77%%
2211..33%%
3333..88%%
3377..55%%
11..77%%
0% 10% 20% 30% 40% 50%
Don't Know
Very Poor
Poor
Uncertain
Good
Very Good
Figure 99. HHow DDo YYou VView tthe OOverall BBusiness CClimate iin Alaska?(N=296)
Don't Know5.0%
Not Effective52.1%
Somewhat Effective
40.4%
Very Effective2.5%
Figure 110. HHow WWould yyou RRate tthe EEffectiveness oof Economic DDevelopment EEfforts iin AAlaska?(N=240)

32
Web-survey respondents were split on the effec-tiveness of current and past economic develop-ment efforts in Alaska, with a small majoritysaying that efforts were not effective.
Respondents attitudes toward Alaska's ability tocompete globally were similar to those about theeffectiveness of the state's development efforts.Less than 6% said they were very confident ofthe state's ability, a sentiment that echoes the un-certainty expressed in the earlier questions.
Energy costs and transportation links are seenas the biggest barriers to development by surveyrespondents. Federal and state regulations areviewed as significant barriers while workforcecapacities are viewed as moderate barriers. Al-
though many firms have difficulty attracting workers from outside Alaska, quality of life is seen as amoderate, not a significant barrier by most respondents.
Conclusions and Common Themes
Alaska EEDOs ooperate iin aan eextreme eenvironment. Alaska is a relatively new state that is remote fromother business or industrial regions and has under-developed infrastructure, high energy and laborcosts, and severe geographic and climate conditions.
Large-sscale ddevelopment oof ppublicly oowned rresources hhas bbeen aa ddominant ttheme iin tthe AAlaska eecon-omy. This includes seafood harvesting, mining, timber harvesting, oil exploration and, most recently,large-scale tourism. Alaska's economic development efforts have evolved, in part, around how to mini-mize regulatory restrictions and how to siphon off local benefits from these large, externally driven in-dustries.
A L A S K A F O R W A R D : P H A S E I S I T U A T I O N A L A N A L Y S I S
0% 10% 20% 30% 40% 50% 60% 70% 80% 90% 100%
Access to Capital
Federal Regulations
State Regulations
Availability Professional/Technical Workforce
Availability Semi-Skilled Workforce
Job-readiness of Entry-Level Workforce
Technology
Transportation Linkages to Suppliers
Transportation Linkages to Markets
Energy costs
Telecommunications
Quality of life
Signif icant barrier Moderate barrier
Figure 112. HHow SSignificant AAre tthe FFollowing BBarriers* tto EEconomic DDevelopment iin AAlaska?
*A list of potential barriers was supplied.
Very Confident5.8%
Somewhat Confident
40.0%
Not Confident47.9%
Don't Know6.3%
Figure 111. HHow CConfident AAre YYou iin AAlaska’s AAbility to CCompete GGlobally?(N=240)

A L A S K A F O R W A R D : P H A S E I S I T U A T I O N A L A N A L Y S I S
W W W . I H S G L O B A L I N S I G H T . C O M 33
Government ffunding oof llocal sservices, pparticularly rrural hhealthcare aand llocal aand ttribal ggovernment iis aan-other ddominant ttheme. Federal funding has the greatest impact, but state employment is also very sig-nificant.
Alaska hhas eestablished aa wworkforce ttraining iinfrastructure, bbut ssome qquestion wwhether tthe ttypes ooftraining aavailable aare sstrategically ttargeted tto ssupport ddevelopment. Although many say that consolida-tion of the Alaska community colleges within the University of Alaska in the 1980s was a setback to vo-cational education, workforce training efforts are now wide-spread. Training typically has focused onreplacing imported labor with resident labor in existing industries. Critics say that training gaps includehigher level technical and professional education. Other criticisms are that entry-level workers lack basicreading and math skills and what are often referred to as "soft skills" or "work ethic" by employers.5
There iis aa llack oof sstate-wwide pplanning, lleadership aand ccoordination. Although Alaska has a large numberand variety of economic development entities, their focus is local or regional, rather than statewide, andthis limits effectiveness.
Alaska hhas aa wwide ddiversity oof eeconomic iinterests tthat mmust bbe aaligned ffor mmajor ddevelopment eeffortsto ssucceed. For example, the large oil and gas producers and the largest seafood and shipping compa-nies are multi-national corporations for which Alaska is only one of a portfolio of operating venues.
Implications for Alaska EDOs
Within the environment described above, Alaska EDOs typically:
• Have small staffs and uncertain funding.
• Have limited established networks with other EDOs, federal and state economic development pro-grams, businesses, or the University of Alaska. However, there has been some recent progress inthis area.
• Can find themselves overwhelmed by the sheer size and number of challenges they face. For ex-ample, EDOs are largely unequipped to have an impact on natural resource development.
• Have often focused on infrastructure projects because basic issues like transportation and energycost seem to preclude more typical business development efforts.
• Feel the State should provide more strategic direction and targeted or associated resources for eco-nomic development.
• Have a hard time attracting enough resources (of all kinds) to have a statewide impact.
• Have been frustrated by the financial, regulatory and practical barriers to developing projects, espe-cially larger ones.
• Have been frustrated by what many consider an over-reliance by Alaskans in general on govern-ment, rather than business, to take the lead in economic development.
• Have had success in helping to foster workforce development programs.
• Have had some success working with the oil, mining and seafood industries (primarily) to maximizeemployment and other benefits to Alaskans.
• Have had limited success at fostering in-state value-added industries, either for purposes of exportor for import-substitution.
5 These criticisms are typical of feedback obtained during workforce assessments and training program evaluations performed by McDowell Group.

34
Key Strengths and Challenges of Existing Organizations The research reported in the previous section suggests that the effectiveness of Alaska's EDOs is sub-ject to six overarching issues. In the section that follows, the report addresses the major strengths andchallenges of Alaska's EDOs with respect to each issue.
Need for Leadership and Coordination
Lack of high-level leadership and coordination was among the most-cited challenge facing Alaska's devel-opment efforts. While a few organizations have created or facilitated venues where EDO leaders meetfor informal discussions on topics of mutual interest (e.g., Commonwealth North, Institute of the North,the University of Alaska Center for Economic Development and a few entities focused on specific indus-tries), there is no organization or mechanism providing overall leadership, direction and coordination tothe universe of EDOs (other than the emerging Alaska Partnership for Economic Development). Thisleaves local, regional and statewide efforts fragmented and potentially contradictory.
SStrenggths
• Some EDOs, in particular Southeast Conference and the Southwest Alaska Municipal Conference(SWAMC), have developed regional models for planning and development initiatives. Other, morelocally focused models include the Anchorage Economic Development Corporation, Juneau Eco-nomic Development Corporation, and the Fairbanks Economic Development Corporation.
• Alaska's EDOs operate within an extensive and complex framework of public, private and non-profit institutions with relevant expertise, networks and other resources. For example:
• Community development organizations such as the Denali Commission have helped improvethe capacity of Alaska communities and regions to participate in formal planning.
• Alaska's regional health organizations have institutionalized an important body of talent, knowl-edge, and relationships, especially in rural Alaska, that could be leveraged for development ini-tiatives. The regional housing authorities are not as large or uniform in this regard, but bringsome similar assets.
• The ANCSA corporations, as a group, represent the largest set of Alaskan-controlled private as-sets and business expertise in the state.
CChallengges
• Federal agencies such as the Economic Development Administration, USDA Rural Development andthe Small Business Administration, provide most of the resources for economic development inAlaska. However, these agencies have primary responsibility to a national agenda that may not bealigned with Alaska priorities.
• Though local and regional planning has increased, efforts to ensure that planning efforts are consis-tent with one another are not yet formalized.
• Like the EDO sector, the private sector, especially outside Anchorage, consists mainly of very smallfirms and is constrained in its access to business expertise and resources. For example, private in-dustry in Alaska spent only $32 million on R&D in 2005 and contributed only 12% of total R&Dspending in the state, according to the National Science Foundation and the Bureau of EconomicAnalysis. This is very low compared to the national average (70%) and most other states.
• Alaska has a great diversity of economic and geographic interests that must be aligned for majordevelopment efforts to succeed. Local, state, federal and private sector interests are as multi-faceted as the landscape.
A L A S K A F O R W A R D : P H A S E I S I T U A T I O N A L A N A L Y S I S

A L A S K A F O R W A R D : P H A S E I S I T U A T I O N A L A N A L Y S I S
W W W . I H S G L O B A L I N S I G H T . C O M 35
• The major private corporations doing business in Alaska, though they engage in a wide variety ofcommunity and charitable activities, have had minimal participation in efforts to develop comprehen-sive strategies for the state's economic health.
• EDOs have uncertain funding and are thinly staffed. Only Anchorage has a significant mass of localeconomic development organizations. State funding for EDOs is minimal. At the same time, the ge-ographic and operational challenges facing EDOs are immense.
Need for Explicit Goals and Strategies
Economic development is an incremental process that requires long-term consistency and commit-ment. Explicit goals and strategies are necessary to sustain initiatives through shifts in political andother leadership and allow progress to be documented. Strategies allow orderly periodic reassessmentof tactics and priorities.
SStrenggths
• The amount and quality of strategic planning at the local and regional levels has increased substan-tially over the past decade, largely in response to federal and Denali Commission requirements. Thestate's overall planning skills are improving, but are by no means fully developed.
• The Alaska Constitution provides guidance on the goals of resource management.
CChallengges
• A significant barrier to forming and carrying out strategies consistent with Alaska's constitution isinadequate data and weak analytical capacity for estimating the impact of strategy options. For ex-ample, a study for the Murkowski Administration found that lack of data and analytical capacity is asignificant barrier to managing state fisheries for the "maximum benefit of (Alaska's) people," as re-quired by the Alaska Constitution.6
• Efforts to define formal development strategies at the state level in the past typically have not donea thorough job of prioritizing and funding actionable options. This has tended to result in long lists ofactivities and potential programs that are either vaguely defined or hopelessly under-resourced.
Need to Integrate Short-Term and Long-Term Initiatives
Economic development is a long-term undertaking, but funding and local priorities tend to be driven byshort-term needs. Alaska's diverse communities and regions need the continuity of long-term initiativesin order to develop short and mid-term strategies that build mass and momentum.
SStrenggths
• One advantage of the state's large number and diversity of EDOs, is that in sum they have experi-ence with a wide variety of strategies and initiatives for maximizing local and regional benefits fromeconomic activity. Long-term planning could draw on that body of knowledge.
CChallengges
• Lack of long-term planning at the state level means there is little strategic guidance to local and re-gional planners about where to look for future opportunities.
6 Draft Report: State of Alaska Seafood Economic Strategies, McDowell Group, December 2006.

36
Challenges of Geographic Isolation
EDOs have no choice but to try to address the fact that geography and climate define much of Alaska'sdevelopment potential. Transportation was identified as one of the state's most significant barriers inboth EDO and industry interviews. However, it is impossible for EDOs to effectively address enormouschallenges such as transportation infrastructure alone. Further, the process needed to design, approveand construct major transportation projects can leave industries paralyzed by uncertainty for decades.
SStrenggths
• Alaska's location, though isolated from the rest of the U.S. has strategic shipping, scientific, militaryand other advantages.
CChallengges
• Alaska's climate and relatively high energy and transportation costs create an enormous challengefor EDOs whose options for practical strategies and initiatives are thereby limited.
• Alaska has a history of large-scale development, and sometimes exploitation, of publicly owned re-sources—salmon harvesting, mining, timber harvesting, and oil—by non-Alaskan interests. Thestate is often characterized as having a "colonial" relationship with such firms in that capital and ex-pertise typically have been controlled by entities outside the state.
Challenges of Supporting and Adding Value to Existing Industries
Import substitution, value-added processing, and support services have been widely recognized as keyto Alaskans reaping more of the benefits of in-state development. Some firms have had success devel-oping support services for major industries such as oil, mining, and seafood, particularly where Alaska'sclimate and geography have created unique challenges that out-of-state firms are less accustomed tosolving. In-state processing and manufacturing to add value and displace imported goods have provenmore difficult.
SStrenggths
• Existing workforce training infrastructure offers a foundation for future strategies. In addition tomany training programs available through the university system and union- and contractor-affiliatedorganizations such as AlaskaWorks Partnership and Associated Builders and Contractors, Alaskaalso has several regional training facilities. Prominent among them is the Alaska Vocational and Tech-nical Center operated by the Department of Labor and Workforce Development in Seward and An-chorage. Others include the Alaska Technical Center sponsored by the Northwest Arctic BoroughSchool District in Kotzebue, Yuut Elitnaurviat in Bethel, and the Vocational Training and ResourceCenter in Juneau. Workforce development is also supported by broad partnership networks. For ex-ample, the DHSS website describes a healthcare industry network that includes rural and Nativehealth providers, state agencies, private sector associations, and the Alaska and Washington Stateuniversity systems.7
• Alaska EDOs understand well the potential benefits of keeping dollars circulating longer in the localeconomy and bringing in additional dollars through value-added manufacturing and import substitu-tion. In spite of significant challenges, many initiatives have been tried, and some—for example,seafood processing using new filleting, cold storage and quality control equipment—have experi-enced a measure of success.
A L A S K A F O R W A R D : P H A S E I S I T U A T I O N A L A N A L Y S I S
7 http://www.hss.state.ak.us/dph/healthplanning/workforce/workforce_home.htm

A L A S K A F O R W A R D : P H A S E I S I T U A T I O N A L A N A L Y S I S
W W W . I H S G L O B A L I N S I G H T . C O M 37
CChallengges
• The substantial, even dominating, economic importance of government-funded services is seen bymany as having eroded the state's entrepreneurial and business climate.
• Most of the natural resources in Alaska are under federal, not state or private control. For example,most of the commercial-grade timber remaining in Alaska is on federal land and must be managedin accordance with mixed-use principles that, in combination with Alaska's geographic and operat-ing-cost disadvantages, make economic utilization extremely challenging.
Developing an Institutional Framework to Elevate the Impact of Knowledge-Based Industries
Alaska's next-generation economy must be one that produces and utilizes knowledge workers to facili-tate growth in traditional industries and emerging industries. Adding knowledge-based industries to re-source-based industries will place new demands on an educational system that must also address thechallenges of a diverse and geographically diffuse population.
SStrenggths
• Alaska leaders understand that education is at the heart of the state's future. Considerable effortand resources have been devoted to improving what many view as an inadequate pre-statehood ed-ucation infrastructure, and many would agree that progress is being made, if frustratingly slow forsome.
• Work of many academic and other institutions over the years has improved Alaska's knowledge ofitself, its challenges and its potential. One example is the University of Alaska Anchorage Institute ofSocial and Economic Research, which is producing important economic forecasts and analyses ofenergy, fisheries, and a deeper understanding of environmental and other critical issues facing thestate.
• Experience has shown that access to resources coupled with a certain degree of flexibility to adaptto local needs and changing times can speed innovation.
CChallengges
• The challenge of consistently advancing both academic and vocational education in a state as largeand heterogeneous as Alaska is significant at both the university and secondary levels. Many Alaskaprimary schools are still under-performing, often because of delayed language development.
• As a young state, Alaska has a relatively short history of developing its own intellectual property.
• The university system has not always been managed for maximum economic development impact.For example, the university established a Center for Economic Development in 1992, but as re-cently as 2006 it was staffed only by a director, an administrative assistant, and a student researchposition. (UAA Center for Economic Development Annual Report, 2006.)
38
C O M P A R I S O N W I T H B E S T E C O N O M I C D E V E L O P M E N T P R A C T I C E S I N O T H E R R E G I O N SThis section expands on the above analysis that identified six overarching economic development is-sues by looking at how other states have addressed similar challenges. From these insights and "bestpractices," a number of lessons for Alaska are drawn. Each should be instructive as leaders grapple withthe question of how to organize for, and improve the state's economy.
In highlighting best practices, we have focused on leadership approaches, systemic changes and/or in-stitutional efforts that were implemented in order to transform the subject region's economy. Ofcourse, there is no single domestic or international best practice that aligns perfectly with Alaska's par-ticular situation. But there are no doubt elements within these models that are appropriate to Alaska'sparticular context and the state's long-term goals.
Note that the region's selected to highlight "best practices" and lessons below are not the same as thepeer states used in the upcoming analysis of Alaska's Economic Foundations. Peer states were chosenbecause their populations and economic structures are similar to Alaska. The regions below have beenhighlighted for their innovative approaches to economic development and the potential that their innova-tions would address critical issues facing Alaska. Footnotes in this section provide leads to additionalsources of information.
Six regions are examined in this overview of best practices:
• Puget Sound Region
• Oregon
• Alberta, Canada
• Chile
• Austin, Texas
• North Carolina
Addressing Alaska’s Need for Economic Development Leadership and Coordination: The Puget Sound Prosperity Partnership’s Approach8
Seattle's Puget Sound region offers Alaska several lessons for addressing the issue of a large and di-verse infrastructure of economic development organizations having the same, but poorly coordinatedmissions. Puget Sound is home to more than 20 cities with a combined population exceeding two mil-lion people. The region's economy, once driven by aerospace manufacturing, forestry resources and thelogistics capability of ports in Seattle and Tacoma, has changed. Today, information technology, sophisti-cated business services and tourism supplement the economic impact of older industries and severalmilitary bases.
As new economic opportunities emerged in the latter half of the 20th century, new economic develop-ment organizations were formed throughout the region. Each county in the region established its owneconomic development council. Large and small cities strengthened or formed their own Chambers ofCommerce or economic development departments. By the turn of the century, economic opportunitycontinued, but it would not be in aerospace as new competition emerged in Europe or in forestry or fur-
A L A S K A F O R W A R D : P H A S E I S I T U A T I O N A L A N A L Y S I S
8 http://www.prosperitypartnership.org/

A L A S K A F O R W A R D : P H A S E I S I T U A T I O N A L A N A L Y S I S
W W W . I H S G L O B A L I N S I G H T . C O M 39
ther expansion of the military presence. And it surely was not going to be in high tech as the region suf-fered the pain of the dot.com bust. But there were still all those economic development organizations,each competing for a larger piece of a smaller pie.
State and regional leaders began to see the unhealthy affects of county-to-county and city-to-city com-petition as aggressive entities tried to attract economic opportunities away from their neighbors. Dupli-cation of other economic development efforts and generally wasted resources was increasinglyapparent to all.
To address the need for improved economic develop-ment leadership and coordination, leaders of thePuget Sound Regional Council (PSRC) began to con-sider ways of weaving together the various countyand local economic development organizations intosome kind of regional, networked economic develop-ment "system," one with a degree of centralized lead-ership. In 2003, officials of the four counties whoseland use and transportation planning PSRC coordi-nates, with input from the legislature, decided to folda state-mandated but duplicative Economic Develop-ment Commission nominally representing the regionin under the umbrella of PSRC.
The move had positive results almost from the outset.Recognizing the cost in wasted effort of each countyagency targeting the same opportunities, leaders ineach of the four counties agreed to cooperate andwork together in new ways. For example, instead ofeach individual county marketing itself, it was decidedby all that the entire Puget Sound region would bepromoted to firms looking to relocate. In effect, localeconomic development organizations had agreed to amostly hands-off policy once a firm was attracted tothe larger region, leaving to the new firm final deci-sions about which particular area offered the most ad-vantages. Over a period of just a few years,cooperation and coordination became the prevailingmode of operation rather than county-to-county com-petition for the relatively few business attraction op-portunities that existed at any given time.
County and municipal-level economic development organizations continue to implement their ownworkforce and job skill training programs and support initiatives designed to help their small businessesand entrepreneurs.
As recently as ten years ago, it was not a joke that "economic development organizations" was a growthindustry in Puget Sound. But by 2004, the PSRC-oriented regional, coordinated and more collaborativemodus operendi seemed to have replaced the old decentralized model.
P r o s p e r i t y P a r t n e r s h i p C o - C h a i r s : A d i v e r s e g r o u p o f c i v i c l e a d e r s h a v e p r o -v i d e d i m p o r t a n t l e a d e r s h i p t o t h e e f f o r t 9
9 http://www.prosperitypartnership.org/coalition/index.htm
40
Lessons ffor AAlaska: UUse CCollaborative SStrateggyy DDevelopment AApproach tto IInteggrate EEfforts aand SSiggnifi-cantlyy IInvolve tthe PPrivate SSector iin tthe PPolicyy MMakingg PProcess
With a much better coordinated, col-laborative and regional approachseemingly making a difference,PSRC's leaders then set about thenext step in the change process. Inlate 2004, they launched a high visi-bility initiative called the ProsperityPartnership. This largely informalpartnership of cooperating economicdevelopment agencies from acrossthe 4-county region continues todayto guide regional economic develop-ment organizations.
Funding for the Partnership comesfrom PSRC's member county andcity organizations. With approxi-mately $700,000 banked at the out-set to move the Partnership fromconcept to reality, PSRC's leadersmoved to produce a major economicresearch project—a situation analy-sis. With the analysis as a baseline,PSRC's economic development lead-ers then coordinated efforts to pro-duce sector-specific "actioninitiatives" to further develop the re-gion's economy. The new economicdevelopment model, based on theconcept of "industrial clusters" wasspecifically designed to enable re-gional coordination of cluster work-ing group activities.
Under PSRC, a high level ProsperityPartnership Leadership Council was formed to give the initiative visibility and guidance. The council (seeabove) represented public, private, academic and non-profit sectors. It included the President of theUniversity of Washington as well as very senior leaders from Boeing, Microsoft and other companies.The top official of the YWCA and others representing all social service organizations brought wide-spread community leadership to the effort.
The situation analysis research identified the presence of 15 industrial clusters in the region, rangingfrom the large and complex Aerospace and Logistics clusters, to the smaller Biotechnology cluster tomuch smaller clusters such as Boatbuilding, Tourism and Military.
Recognizing that they couldn't focus on developing new growth strategies for all 15 clusters at thesame time, among the first decisions of the Leadership Council was on which of the 15 clusters the
A L A S K A F O R W A R D : P H A S E I S I T U A T I O N A L A N A L Y S I S
It is now widely accepted that more formal, rigorous and standardizedmethodologies are required for assessing the performance and impact ofeconomic development programs. That said, there is still much debate aboutwhat actually needs to be measured. In general, indicators should be adaptedto region-specific contexts and the community's priorities rather than drawnin a mechanical way from a pre-prepared list. However, the selection of indi-cators and metrics should also be largely based on the particular needs andpriorities of a region's private sector companies and what they need to besuccessful in the increasingly competitive international marketplace.
Puget SSound's PProsperity PPartnership: One of the main factors that drovethe development of the Prosperity Partnership was the recognition that theregion's economic health is at risk. Puget Sound's leaders recognized that inthe emerging global economy, many of the world's most prominent compa-nies could be headquartered anywhere on the globe. Businesses locatewhere there is a high quality of life, good schools, efficient transportation, af-fordable housing, and supportive government policies. Thus, there was noguarantees that the Puget Sound region will be able to attract new busi-nesses, or keep and grow existing firms.
However, the region had not been tracking its progress in these key areasthat are increasingly important to private sector companies. Consequently, aset of indicators was established that closely matched the priorities of the2005 Regional Economic Strategy, structured around six economic founda-tion areas: 1) Education & the Workforce, 2) Technology & Innovation, 3)New & Small Business Support, 4) Business Climate, 5) Transportation & In-frastructure, and 6) Quality of Life & Social Capital.
These indicators are evaluated on an annual basis and benchmarked againstfive peer regions providing the region's leaders with useful information to in-form resource allocation decisions and guide policy development.
C a s e i n P o i n t : P r o s p e r i t y P a r t n e r s h i p a n d M o n i t o r i n g a n d M e a s u r i n g P r o g r e s s To w a r d s
E c o n o m i c G o a l s 1 0
10 http://www.prosperitypartnership.org/indicators/index.htm

A L A S K A F O R W A R D : P H A S E I S I T U A T I O N A L A N A L Y S I S
W W W . I H S G L O B A L I N S I G H T . C O M 41
2005-007 work program would focus. A number of "first priority clusters, among equals" were selected,including Aerospace, Logistics, Biotechnology and Information Technology (Military and Tourism wereselected for the immediately subsequent efforts).
For each cluster, a working group of leaders representing the cluster was formed. Besides top execu-tives of large and small firms, university deans, the heads of vocational training organizations and othersrepresenting the full cluster were included in each cluster working group. Over more than a year, eachCluster Working Group met regularly to develop a consensus economic vision of their cluster, in effect,putting all the industry's stakeholders on the same page. Each group then developed from 5-7 clusteraction initiatives, each designed to address a priority impediment to cluster growth and development asidentified by the cluster working group through their facilitated processes.
Within a year, each cluster group had what amounted to a shared vision of the cluster to guide neweconomic development activities. More specifically, each had a number of business plans for "action ini-tiatives," with "champions" to lead specific policy or program projects. By late 2006, nearly all of thesecluster action initiatives were moving forward—each designed to address impediments to growth andto achieve higher levels of cluster competitiveness.
Today, PSRC's Prosperity Partnership is widely acknowledged to be a success. It has brought togetherformally disconnected economic development organizations under a central approach—cluster-basedeconomic development. It is being guided by top level leaders from business, government, academiaand social services agencies in the region. Observers of the initiative often comment on the effort'sstrong "bias to action," noting that its leaders generally avoid elaborate studies and aim instead at takingdirect action in the Legislature and within other key institutions (e.g., the University of Washington, vo-cational training centers, technology transfer organizations).
The Prosperity Partnership, while not a panacea, illustrates what can be accomplished in a region with acomplex infrastructure of economic development organizations by shifting to a development model hav-ing strong leadership from the top and coordination of efforts throughout 100 or more economic devel-opment organizations making up the Partnership.
Similar top level leadership and coordination would appear to be necessary to better align Alaska's eco-nomic interests and to implement consensus-based initiatives designed to promote economic develop-ment at both the state and local level.
Addressing Alaska’s Need for Explicit Economic Development Goals andStrategies: Oregon’s Approach11
Oregon's economy initially grew as a result of industries driven by abundant natural resources-- the suc-cess of the state's lumber and wood products sectors as well as the agricultural sectors of theWillamette Valley and from the fields to the east. Geography also played a large role, as Portland's pri-macy as a regional port was determined by the Columbia River drainage. Later, hydropower develop-ment on the Columbia helped fuel a new round of industrial growth tied closely to the natural resourceadvantage.
As the 21st century dawned, the state's leaders embarked on a strategy centered on industrial special-ization as the means of developing a more diverse, more value-added economy. Specialists analyzedthe state's, and each region's, strengths and weaknesses and then implemented policies to supportthose industrial activities in which each region enjoyed some clear advantages or was especially special-ized.
11 http://www.regionalbusinessplan.com/plan.shtml and http://www.oregonclusters.org/ and http://www.oregonbusinessplan.org/plan_view.html#plan

42
In 2005, the Oregon Business Planlaunched the Oregon Cluster Net-work to identify Oregon's mature,emerging, and potential industryclusters and assist cluster partici-pants as they work to accelerate in-novation and the growth of theirindustries. By consciously connect-ing industry leaders with universityresearchers, schools, media, ven-ture capital, and other resources,the network helps cluster facilita-tors across the state share bestpractices and develop regional col-laborative advantages. Leaders un-derstand that cluster organizationsgenerating new prospects for busi-ness recruitment, developing rele-vant economic and market data,and guiding public policy will helpstrengthen the Oregon economy.
Cluster Network activities are guided by the Cluster Network Leadership Council, a smaller group ofthought leaders representing diverse professional backgrounds and a balance of industry, academic,and public agency representatives. The Leadership Council sits at the top of the cluster network, coordi-nating programs and activities being implemented at the regional or local level.
The Council meets every few months to discuss progress on cluster-based economic development,focus on areas of interest that cut-across clusters and plan for events and opportunities such as theOregon Leadership Summit, the Oregon Innovation Council and grant/funding opportunities. Some ofthe specific questions focused on in these meetings include:
• What are the needs of each cluster in terms of economic infrastructure,: workforce skills, technol-ogy, finance and infrastructure?
• How well do we currently address those needs?
• What could be done to enhance the relevant economic infrastructure and improve the relationshipsbetween public, private, academic and social service stakeholders?
• What specific actions would move the cluster forward in the near-, mid- and long term?
Oregon's industry cluster approach to economic development allows policy makers to have a better un-derstanding of the way businesses in the Oregon economy compete in the global marketplace and todevelop more effective means of understanding their challenges and supporting their success. The ap-proach helps firms to be more successful by promoting their common interests, and it helps the publicand academic sectors better understand how they can best support industries overall, and the firmswithin industries.
A L A S K A F O R W A R D : P H A S E I S I T U A T I O N A L A N A L Y S I S
Twelve state-level business development officers serve as liaisons linking re-gional and local actors to the Oregon Economic & Community DevelopmentCommission's programs. Two of these business development officers sup-port statewide recruiting efforts, providing site-selection assistance to firmsseeking to locate in Oregon. Ten business development officers connectOregon firms and industries that have similar interests or correspondingneeds. These efforts promote the state's industry cluster strategy and helpensure that the full complement of market intelligence, financial resourcesand services from across public and private sectors are brought together tomeet common needs.
In addition, four international trade officers located in the state as well as anumber of overseas trade representatives in Tokyo, Seoul, Beijing, Shanghaiand Taipei assist small and medium-sized businesses and industries expandexports of goods and services. International trade officers provide one-on-one business counseling, market research and market entry strategies, anddue diligence assistance to identify or evaluate international partners, i.e.,agents, distributors and customers.
C a s e i n P o i n t : O r e g o n p r o v i d e s s i g n i f i c a n t r e s o u r c e s a n d a c o o r d i n a t e d s t a t e w i d e a p p r o a c h
t o b u s i n e s s d e v e l o p m e n t 1 2
12 "Fiscal Year 2008 - Annual report of the Oregon Economic & Community Development Commission." http://www.oregon4biz.com/

A L A S K A F O R W A R D : P H A S E I S I T U A T I O N A L A N A L Y S I S
W W W . I H S G L O B A L I N S I G H T . C O M 43
Lessons ffor AAlaska: EExplicit SStatewide PPolicyy EEffort tto CCreate aa RRationalized EEconomic DDevelopmentSSyystem
The Oregon model offers an alterna-tive to Alaska's today—leadershipfrom the top, a network approachfocused on developing competitiveclusters, with action initiatives atthe state, regional and locallevel—in short, a cohesive eco-nomic development framework.
Having a rationalized economic de-velopment system can help solvethe problem of myopia, or the casewhere organizations with a limitedscope or mission fail to think aboutthe macroeconomic picture andhow various regional groups orpolicies interrelate to create a posi-tive or negative environment forlocal businesses to grow andthrive. It also alleviates diffusion ofresponsibility across different re-gional entities, whereby each indi-vidual region, organization, city or business membership group thinks a statewide or regional economicproblem is somebody else's problem. Regional entities sometimes lack the impetus to reach out togroups or address policies that extend or originate beyond their borders, regardless of the impact theseother groups or decisions may have on their local business climate. Single-issue interest groups, non-profits, or government agencies with a limited jurisdiction are also unlikely to address complex regionaleconomic problems.
Because economic development requires coordination across many types of institutions, creating a ra-tionalized economic development system can benefit the state by bringing together many organizationsworking on distinct issues (i.e. workforce training, affordable housing, transportation planning, permitstreamlining, land use, technology transfer, etc.). A rationalized economic development system can pro-vide direction to distinct groups and help them to recognize the synergies across their organizationsand the relationship they have to each other, to the economy, and to local businesses.
An active clustering agenda facilitates the integration of what would otherwise be nothing more than adisconnected set of co-located firms and organizations into a high performance "cluster system." Opti-mization is focused at a system, rather than at individual organizational levels. An active local clusterwould include firms and support organizations working together to achieve results that would be un-likely individually.
The state economic development commission began its six-month realign-ment project by seeking input from our stakeholders across the state aboutwhat was working well and what needed to be changed in the way theagency's programs were administered.
One of the commission's key recommendations was a call for a more strate-gic focus on business retention, business expansion and business attractionthrough the provision of existing and all new services to Oregon's busi-nesses and communities. That recommendation included improved efforts bybusiness development officers located in Oregon communities, new innova-tion services to Oregon's industries by the department and access to interna-tional market services from the department's international trade officers.
The realignment effort required the agency to focus its activities on develop-ing sound economic strategies and utilizing the commission's expertise tohelp to directly create jobs in Oregon, thus positively impacting the state'seconomy. Towards that goal, the department now partners with regional eco-nomic development organizations to address economic development oppor-tunities and concerns.
C a s e i n P o i n t : O r e g o n ' s r a t i o n a l i z e d e c o n o m i c d e v e l o p -m e n t s y s t e m a l l o w s f o r f l e x i b i l i t y a n d r e a l i g n m e n t 1 3
13 "Fiscal Year 2008 - Annual report of the Oregon Economic & Community Development Commission." http://www.oregon4biz.com/

44
Addressing Alaska’s Need to Integrate Short- and Long-Term Initiatives: Alberta’s ApproachAlberta's economic evolution presents an interesting best practice model for Alaska. First, because theprovince has many of Alaska's characteristics: cold climate, a relatively sparse population, significant in-frastructure shortcomings and an economy once based almost solely on natural resources. Yet, withinthese constraints Alberta has experienced noteworthy economic diversification success. Most impor-tantly is how Alberta evolved from a narrowly-based economy into a more diversified economy. Thedefining characteristic of Alberta's approach is that while the province's economic development leadersworked on "nuts and bolts" type activities such as business attraction and retention, they simultane-ously looked towards the future and launched a cohesive long-term strategy to close gaps and nurtureknowledge-based industries and value-added activities. As such, the province's leaders linked their on-going, short-term activities with their long-term strategy for the future.
Alberta's leaders gave the notion of "economic diversifi-cation" policy priority early on:
The actions of Alberta stand out among theprovinces. As early as the mid-1970s, then PremierLougheed of Alberta told the Alberta Legislature thatsecular stability was an important economic objectiveand could be secured by less dependence on thesale of unprocessed resources. By 1985 the govern-ment had issued a White Paper, Proposals for an In-dustrial and Science Strategy for Alberta 1985 to1990, which emphasized the upgrading and furtherprocessing of Alberta raw materials—effectively prod-uct and market diversification. Just prior to the crucial1987 Western Premier's Conference, the province re-leased a report titled Economic Diversification Policies and Programs, summarizing the actions andbudgetary commitments of government departments for these purposes. The report said:
Diversification of Alberta's economic base has been, and remains, a major objective of theGovernment of Alberta. Diversification is viewed as a means for building additional stabilityinto the province's economy, while at the same time contributing to the growth of employ-ment. The aim of Alberta's diversification efforts is to encourage and strengthen activitiesthat result in upgrading and further processing of the province's resources.15
And although the provincial government drove the initial phases of the economic diversification strat-egy, the government recognized that it could not sustain momentum unless it transitioned towards aprivate sector-led model:
The provincial government play[ed] an active part in creating partnerships to spur the evolution ofthe new economy. In building on the "Alberta Advantage," the province's premier, Ralph Klein, cre-ated an unusual alliance to expedite economic growth. In 1995 Premier Klein put the private sectorin the driver's seat of the Alberta Economic Development Authority (AEDA). The volunteer mem-bers of AEDA are drawn from the front ranks of Alberta's business community. They identify direc-tions for the province to pursue, pointing out obstacles that may stand in the path of development,yet they have full responsibility to see actual economic development become a reality.16
A L A S K A F O R W A R D : P H A S E I S I T U A T I O N A L A N A L Y S I S
"While growth created opportunities and challenges,wealth always raised expectations. Choices neededto be made. Prosperity was both a boon and a bur-den, and it left Albertans and their government withimportant questions. Could Alberta seize the oppor-tunity and sustain its economic performance overthe long term? Could it transform its wealth into ahigher quality of life for all Albertans? Could Albertabecome a leader in Canada and globally? Some sawthe future as a place of difficult challenges; othersas a field of opportunities. Both were right. Bothrecognized the need for urgency, vision, leadershipand action [and] that ultimately, the invisible threatwas complacency."14
14 "Building a Great Future for Alberta - Dateline: September 1, 2020." Alberta Economic Development Authority.
15 "Breaking The Boom And Bust: Exploring Thirty Years Of Diversification In Western Canada." Edward J. Chambers and Chris Ryan Western Centre for Eco-nomic Research School of Business, University of Alberta Edmonton. Information Bulletin, Number 121, April 2009.
16 "The Alberta Advantage" by Carolyn Stout - www.developmentalliance.com/docu/pdf/44012.pdf

A L A S K A F O R W A R D : P H A S E I S I T U A T I O N A L A N A L Y S I S
W W W . I H S G L O B A L I N S I G H T . C O M 45
Key elements of this approach involved defining prior-ities that clarified both what would be supported andwhat would not and then developing explicit strate-gies to implement them successfully. Consequently,several important integrated strategic plans were de-veloped that guided Alberta's development:
In 1993, "Seizing Opportunity" set the province on acourse towards fiscal responsibility and the develop-ment of the "Alberta Advantage" initiative. A bold tar-get of 110,000 new jobs was set—and exceeded. In1997, the Alberta Economic Development Authorityprovided further directions for the development of theAlberta economy in Building on the Alberta Advan-tage. People and Prosperity, a human resource devel-opment strategy for the province, soon followed. Inthe fall of 1997 the Growth Summit engaged Alber-tans in a province-wide discussion about priorities for action. At the same time, the Alberta Science andResearch Authority developed Sustaining the Alberta Advantage, an innovation strategy designed togrow Alberta's knowledge-based economy."18
Recognizing that long term progress toward greater diversification required short term initiatives to en-hance local capacity, Alberta invested significantly in technical and trade schools, in universities, in re-search centers and in promoting entrepreneurship.19 And when compared to the other three provincialgovernments in Western Canada, Alberta's orientation and level of dedication stand out, "none of theother three provincial governments exhibited such sustained concern and explicit actions."20
Alberta's sustained private sector driven, yet government supported approach has resulted in notewor-thy achievements:
[By] 1997 the value of Alberta's industrial manufacturing shipments almost matched energy sec-tor shipments totaling US$11.4 billion. The remarkable thing about these [figures] is that they nolonger solely rest on the state of Alberta's energy sector or on world oil prices. According toCoopers and Lybrand's most recent report "Alberta's growth may be attributed to the steady in-creases experienced in non-resource-based or industrial manufacturing.21
Lessons ffor AAlaska: TTransitioningg ffrom SShort-tterm TTactics aand ""Gap FFillingg" tto LLongg TTerm SStrateggies aandAction IInitiatives
Alberta is a good example of how a region's leaders de-veloped a unified vision of what kind of economy wouldbe right for their region and its residents and then de-signed long term strategies to implement that vision -alllinked in some way to existing short term initiatives toavoid the problem of "start and stop" depending on
The province's leading research organization, the AlbertaResearch Council (ARC) provides a full spectrum of R&Dand advisory services, bridging the gap between basicresearch and market development. ARC works with in-dustry and universities through strategic alliances, con-tract research, joint ventures, consortia and licensingarrangements. A market-driven corporation, the ARC fo-cuses on the sectors of Alberta's economy where it be-lieves it can have the greatest impact. These include theprimary resource sectors of agriculture, energy andforestry, and the emerging or support sectors of biotech-nology, advanced computing systems, environment,health "informatics" and manufacturing.
C a s e i n P o i n t : A l b e r t a ' s R e s e a r c h C o u n c i l h e l p s l i n k r e s e a r c h t o m a r k e t
o p p o r t u n i t i e s 1 7
17 "The Alberta Advantage" by Carolyn Stout - www.developmentalliance.com/docu/pdf/44012.pdf
18 "Get Ready Alberta: Strengthening the Alberta Advantage." Government of Alberta, February 2000.
19 "Breaking The Boom And Bust: Exploring Thirty Years Of Diversification In Western Canada." Edward J. Chambers and Chris Ryan Western Centre for Eco-nomic Research School of Business, University of Alberta Edmonton. Information Bulletin, Number 121, April 2009.
20 "Breaking The Boom And Bust: Exploring Thirty Years Of Diversification In Western Canada." Edward J. Chambers and Chris Ryan Western Centre forEconomic Research School of Business, University of Alberta Edmonton. Information Bulletin, Number 121, April 2009.
21 "The Alberta Advantage" by Carolyn Stout - www.developmentalliance.com/docu/pdf/44012.pdf
22 "The Alberta Advantage" by Carolyn Stout - www.developmentalliance.com/docu/pdf/44012.pdf
"Those who once viewed it as Canada's energyprovince now see Alberta as North America'shottest market for manufacturing and business in-vestment. It's where a new brand of thinking is cre-ating a new breed of opportunity." 22

46
changing political leadership. The importance of strong leadership in the province's economic evolutioncannot be overstated:
As reflected in the consultation process, Alberta's success has been a product of political lead-ership. Most important was the early development of a compelling vision for the province. Thevision has evolved and changed over time and in each case renewed foresight and stimulatedaction. Part of the vision has been a series of projects. Projects provided achievable goals withina clear timeframe. Major projects included the development of an integrated energy industry,the conservation of water, the reduction in poverty and homelessness, diversification of theeconomy and the project to build the highest level of human capital in the world."23
The main point is that the province's government leaders recognized that collaborative strategy devel-opment with significant input from and leadership by the private sector was the appropriate approach tohelp achieve the province's long-term vision.
"Strong leadership by government was instrumental in resolving [Alberta's economic develop-ment] issues. While strong consultation processes had been established, a new level of deci-sion-making was required. Albertans needed leaders to build consensus, develop innovativesolutions to difficult problems, and implement those solutions effectively. New commitments toa process for collaboration and new technologies to enable communication allowed the govern-ment to broaden public consultation. This new process encouraged shared understanding, builtmutual respect and improved conflict resolution. The government still had the responsibility tomake decisions and act, but the outcome was more visible and understandable.
Process was not enough. Effective and pragmatic solutions were also necessary. Considerableinvestment in research and development was [required]. At the same time, integrated land man-agement data banks provided more information on which to base decisions and develop newapproaches to primary resource development that minimized short term and long-term distur-bance to the economic development landscape.
The culmination of these developments has been the successful implementation of govern-ment policy initiatives. Yet, issues and conflicts persist but they are better understood and aremore likely to be addressed when they arise. Evaluation reports have noted that improved deci-sion-making processes have greatly enhanced the ability to develop better scientific and com-munity-based solutions and resolve issues effectively."24
As a result of Alberta's approach:
"The provincial government has become both acoach and facilitator encouraging economic develop-ment and moderating and resolving disputes. Thegovernment is also a leader and decision-maker, set-ting priorities and goals, building support and imple-menting policies effectively. The economy isprosperous and future-oriented. Energy remains themost important sector but with new entrepreneurialbusinesses and value-added production, a more di-verse, robust and adaptive economy has emerged.26
A L A S K A F O R W A R D : P H A S E I S I T U A T I O N A L A N A L Y S I S
"In an expanding and competitive global economy,Alberta has grown and prospered. Strong politicalleaders able to articulate a compelling vision of thefuture, the development of centers of excellencethat strive for world class achievements, the evolu-tion of open and accountable decision-makingprocesses, and the implementation of strong inte-grated plans with clear strategies: all of these havebeen instrumental in the economic success of theprovince." 25
23 "Building a Great Future for Alberta - Dateline: September 1, 2020." Alberta Economic Development Authority.
24 "Building a Great Future for Alberta - Dateline: September 1, 2020." Alberta Economic Development Authority.
25 "Breaking The Boom And Bust: Exploring Thirty Years Of Diversification In Western Canada." Edward J. Chambers and Chris Ryan Western Centre forEconomic Research School of Business, University of Alberta Edmonton. Information Bulletin, Number 121, April 2009.
26 "Building a Great Future for Alberta - Dateline: September 1, 2020." Alberta Economic Development Authority.

A L A S K A F O R W A R D : P H A S E I S I T U A T I O N A L A N A L Y S I S
W W W . I H S G L O B A L I N S I G H T . C O M 47
Addressing Alaska’s Challenge of Geographic Isolation: Chile’s ApproachGlobalization and related trends have forced Chile to confront the challenges associated with its geo-graphic isolation. Recognizing the country's largely natural-resource-based economy, constraints re-lated to the country's geographic location, limited R&D investment, and culture of non-collaboration,the government established Fundación Chile several decades ago to "create new businesses as a mainmeans to diffuse and transfer technology."
Fundación Chile's mission was to, "add economic value to Chile's products and services by promotinginnovation and technology transfer activities, aimed at taking better advantage of Chile's natural re-sources and productive capacity."27 To accomplish this mission, the organization identified key advan-tages that could potentially be leveraged (e.g. complementary seasons with respect to northernhemisphere fruit and vegetable markets, Mediterranean and other climactic advantages, and access toin-demand natural resources) and set out to identify the most appropriate means to make the most ofthose advantages. How did leaders spur the needed economic transformations? Following is anoverview of Chile's approach:
"The main business model developed by Fundación Chile begins with the identification of an in-novative opportunity with high potential, based on a technology transfer or development, that isthen adapted to the local conditions. Then strategic partners are invited to create a companythat uses the new technology, financing is obtained and the scale-up process is defined. Theworking model includes three phases.
1. The process begins with an exploration of market needs and its evaluation. The institutioncarries out innovations that involve changes in the products, services, productive processesand modifications in the business models, in order to offer a proposal of unique value to itstarget clients. It also actively participates in correcting market imperfections, mostly publicgoods, by significantly improving the management and elimination of information asymme-tries. The innovations in products, services and productive processes often occur with thecreation of a new company or with the sale of a technology package to a strategic agentwho is able to place this technology in the relevant markets.
2. The second phase involves obtaining the technologies. Fundación Chile uses three proce-dures for this stage: transfer and adapt a technology furnished by an outside supplier; de-velop it using a Fundación R&D process; or generate it through the work of a network of keyR&D institutions.
3. The third phase is the scale-up of the technology and its dissemination. This is especially im-portant because it generates the innovation's social benefit. In Fundación Chile's model, dis-semination occurs through the creation of innovative companies, the sale and licensing oftechnologies, the supply of technological services undertaken by Fundación Chile's differentareas and business units, certification and implementation of standards and broad dissemi-nation through training, seminars, publications and Internet websites.28
An analysis of market opportunities guided Fundación Chile's initial approach in each area targeted fordevelopment, focusing on areas with clear development potential including salmon farming, raspberryand blueberry crops, oyster farming and boxed beef products, among other areas.
27 "Latin America: The New Frontier, An Emerging Location for Outsourcing, Offshoring, and BPO - The Case Study of Chile." - www.fundacionchile.cl
28 "Fundación Chile: The 30 Years of Fundación Chile," - http://www.fundacionchile.cl

48
In large part as a result of Fundación Chile's successful interventions, several industries includingsalmon cultivation, wine, fresh fruit (e.g., table grapes, raspberries, blue berries) have grown signifi-cantly in the period since the organization's strategic planning began. Noteworthy results of FundaciónChile's efforts include:
• More than 75 companies have been created accounting for over $2 billion of value.29
• "As a result of these measures, salmon production in Chile grew about 17-fold between 1990 and2002. Its share in the global production of farmed salmon and trout increased from about 10% in1990 to about 35% within the same period. Indeed, Chile has moved from being a learner to amajor player in the production and marketing of salmon products."31 In 2006, Chile exported $2.2billion representing over 23% of Chile's total food exports, resulting in more than 35,000 direct andindirect jobs. . "[And importantly,] the growth of the industry has brought about a general improve-ment in regional infrastructure and services: the poverty index of the salmon production region de-creased from 40% to 13% between 1990 and 2000 while the index of extreme poverty decreasedfrom 24% to 7% over the same period."32
• "Developed quality control and certification of fruit exports, the cornerstone of this sector whichgenerates over US$1.9 billion in exports (2003-2004 season)."33
• Developed berry crops in Chile, which represent US$200 million in exports for 2003.34
Lessons ffor AAlaska: EEmployyingg aa MMarket-DDriven MModel tto IIdentifyy aand LLeveragge NNatural RResource-Based CComparative AAdvantagges
Currently, Fundación Chile is broadening its scope by,"establishing better linkages between Chile's productivesector and the domestic and international scientific com-munity…to permit the transfer of innovations [and] sup-porting improvements in local capital markets, includingventure [and] seed capital."36 It has taken further stepsto ensure adequate access to cutting edge technologiesand research through the establishment of a series of al-liances with international organizations such as UCDavis, … Cornell University, Centre de Cooperation Inter-nationale en Recherche Agronomique pour le Développe-ment, France and Bundesanstalt für Geowissenschaften und Rohstoffe (BGR) in Germany.
Chile's model presents an interesting best practice for Alaska because it is an example of a situation, "inwhich a country's factor endowments were modified through investment in physical capital, human re-sources and the building up of capacities required to develop and use new technologies."37 A key take-
A L A S K A F O R W A R D : P H A S E I S I T U A T I O N A L A N A L Y S I S
29 "A Case Study of the Salmon Industry in Chile." United Nations Conference On Trade And Development - Transfer of Technology for Successful Integra-tion into the Global Economy, 2006.
30 www.gkpeventsonthefuture.org/
31 "A Case Study of the Salmon Industry in Chile." United Nations Conference On Trade And Development - Transfer of Technology for Successful Integra-tion into the Global Economy, 2006.
32-34 "Latin America: The New Frontier, An Emerging Location for Outsourcing, Offshoring, and BPO - The Case Study of Chile." - www.fundacionchile.cl
35 "A Case Study of the Salmon Industry in Chile." United Nations Conference On Trade And Development - Transfer of Technology for Successful Integra-tion into the Global Economy, 2006.
38 "San Diego - Clusters Of Innovation Initiative." Council on Competitiveness, May, 2001.
37 "A Case Study of the Salmon Industry in Chile." United Nations Conference On Trade And Development - Transfer of Technology for Successful Integra-tion into the Global Economy, 2006.
""The successful development of the industry high-lights Chile's approach to industrial and economicdevelopment. Chile promotes scientific and techno-logical innovation that adds value to or generates in-dustries based on its natural resource endowment.In this case, the long coastline, abundant freshwatersources and islands, and good climatic conditionsare part of its natural endowments, which, with theappropriate technologies, have played a vital role in[the country's industrial] development."35

A L A S K A F O R W A R D : P H A S E I S I T U A T I O N A L A N A L Y S I S
W W W . I H S G L O B A L I N S I G H T . C O M 49
away for Alaska here is that Fundación Chile did not try to develop industries where no strong competi-tive advantage existed. Rather, it looked to markets first for opportunities related to the Country's com-parative advantages and areas of specialization. Consequently, the institution's efforts were focused onactivities that aligned with the country's strengths and in which they had a realistic chance of achievingsome success. As such, it is a successful example of a market-driven model and public/private technol-ogy transfer mechanism that allowed the country to more effectively leverage key natural endowmentsand comparative advantages.
Chile's economic evolution demonstrates that the challenge of geographic isolation can be addressedthrough economic diversification programs that build on a region's existing strengths in a realistic way.
Addressing Alaska’s Challenge of Adding Value to Existing Industries:Austin’s ApproachAustin's three-decade long strategy to purposefully transform its economy--from one based largely onstate government jobs to one now heavily oriented to high technology and entertainment--has been un-deniably successful. The story began in the early 1980s when business leaders operating within theGreater Austin Chamber of Commerce took the initiative to shift the Chamber's traditional approach toeconomic development of broad based industrial attraction to a more strategic and more highly tar-geted approach. The main features of the 1984 Austin Strategic Plan included firm statements about pri-vate sector economic development leadership, the development of university-supported institutionsdesigned to support the economy's underlying technologies and a local government role focused onpartnerships designed to build up specialized economic infrastructure that would be "purpose-built" tosupport the city's economy.
For more than a decade following the 1984 strategic plan, Austin enjoyed economic growth based onthe core sectors of state government and university employment but complemented by a robust com-puter technology sector. In the period 1984-1995, the applied research capacity at UT/Austin and fromtwo privately operated research centers (MCC and Semi Tech, both semiconductor industry consor-tiums) provided a continuing source of innovation to a growing number of computer hardware firms.With these resources at hand, Austin's tech firms found themselves front-runners in their markets. Butby the mid-1990s it was clear to the area's leaders that off-shore producers, mostly in Asia, were in-creasingly eating away the market share of the economy's key companies with much lower labor costsand even indigenous product and process technologies.
Austin's civic leaders came to the conclusion that theircoveted high tech economy was becoming little morethan a handful of brand name manufacturers producingcommoditized hardware products and that these plantswere destined to move off shore. As they did in theearly 1980s, these civic boosters agreed in 1996 to acomprehensive economic review with the objective ofdeveloping a more diverse and higher value-addingeconomy. A working group was formed that brought together CEOs, academic researchers and othereconomic development stakeholders. They took responsibility for launching a second Austin StrategicPlan process, this one designed in part to put in place a broader base of "strategic institutions" whoseprimary purpose would be to help existing companies stay at the leading edge in their markets and newcompanies to find market success. The new plan focused largely on adding value to the products of the
""Institutions for Collaboration are formal and infor-mal organizations and networks that (1) facilitate theexchange of information and technology; and (2) fos-ter various kinds of coordination and collaborationthat can improve the business environment in a clus-ter or in the overall economy."
— Michael Porter38
38 "San Diego - Clusters Of Innovation Initiative." Council on Competitiveness, May, 2001.
50
computer hardware cluster while building new capacity in the region's fledgling biotechnology, music,film and tourism clusters.
As before, leaders of each of the target clusters, existing and emerging, were organized to develop newideas and take new action. Over a six month process of problem identification, priority-setting and thedevelopment of new policy and practice initiatives, the strategy to add value to a still relatively strongcomputer technology cluster and build new economic engines in the other sectors took shape.
Each cluster working group developed their own programs and initiatives and for each initiative, an im-plementation champion, mostly from the private sector stepped forward to lead the effort. The newprojects ranged from policy development and legislative lobbying to the creation of new financingmechanisms to support start-up firms. Each action initiative was the product of the cluster, not from aconsultant's point of view. Each initiative was designed for what was called "fast-track" implementationand many were in full implementation mode within a year.
Just as was the case in the early 1980s, Austin's bold and decisive civic culture of private sector-led andstrategic economic development planning began to once again drive the economy forward. The AustinTechnology Incubator, America's first (formed in 1984, as a result of the first strategic plan) shiftedgears. Priority was given to incubating software and firms specialized in providing highly tailored busi-ness services (e.g., consulting), even while entrepreneurs in other tech areas continued to be broughtinto the incubator. The Austin Ventures group, supported by the wealth of local business leaders, placeda priority on software development. The Greater Austin Chamber of Commerce, noticing that youngsoftware entrepreneurs (as well as local biotech entrepreneurs, musicians and filmmakers) were not ac-tive in chamber affairs, changed their programming and moved from the typical chamber businessmodel (sponsoring mixers and other "match-making" efforts), to become more of an institution for col-laboration among cluster stakeholders. A high priority was to bring into the Chamber's orbit young busi-ness people who were increasingly feeling left out of the picture. The idea was to shift the chamber'sprevailing business culture, which was self-admittedly "staid," to one that was far more interesting andrelevant to young business people and entrepreneurs who sought much more collaboration with ven-ture capitalists, university professors and other people like themselves.
Computer software soon became the most important value-added element to the existing computerhardware expertise that was what the civic boosters were looking for. From semi-conductors and con-sumer computers (both sectors now declining in Austin) emerged a second economic wave. With thetraditional sectors, software, biotech, music and filmmaking now better define the Austin economy.And, with the strong research and development capabilities of the University and the other researchcenters tuned to meet the changing needs of local firms, Austin's economy has remained as dynamicas any in the country.
Lessons ffor AAlaska: RReggions aand ttheir eeconomic ddevelopment oorgganizations ccan ssupport eexistingg iindus-tries tthrouggh tthe pprovision oof sspecialized iinstitutional iinfrastructure, pproggrams aand aactivities
Alaska needs to add more value to the basic products that now define the state's economy. While hightech Austin may seem like an unusual "best practice" for Alaska to learn from, there is little doubt thatthis case offers several lessons. First, Austin's leaders have established an especially entrepreneurialapproach to economic development. While state and local government have historically played a role injob creation, it has been one of convening and partnering with the private sector rather than taking aleadership position and advocating for economic development policies. Second, Austin's private sectorleaders have learned how important strategic planning can be when economic concerns loom. Theyhave evolved a culture of strategic planning that emerges directly from the culture of the firms in the re-gion. Third, Austin's approach (not unlike Seattle's regional Prosperity Partnership and Oregon's clusternetwork approach) goes well beyond economic research, studies and the like. The prevailing economic
A L A S K A F O R W A R D : P H A S E I S I T U A T I O N A L A N A L Y S I S

A L A S K A F O R W A R D : P H A S E I S I T U A T I O N A L A N A L Y S I S
W W W . I H S G L O B A L I N S I G H T . C O M 51
development model works first to mobilize cluster leaders to put them all "on the same page." Andwhile research studies remain important to Austin's approach, the region's "bias to action" is what setsit apart from many areas. Economic development is about "getting things done", in the legislature, in theacademic and training sectors, and in companies. While it might be the Texas machismo at work, thereis little doubt that Austin's strategically planned economy, implemented in this region's unique businessculture, time and again, has produced good results. Austin remains, with California's Silicon Valley andonly a few others, one of the country's most dynamic local economies.
The IHS-Global Insight team's earlier cluster analysis report pointed to several fledgling clusters nowpresent in Alaska's economy. Alaska's business services cluster is a good example. Remoteness frommarkets, weak transportation and high energy costs are less an issue for the providers of businessservices (such as management consultancies, accounting and legal services). Also, that report notedthat there may be small-scale opportunities in niche technologies unique to Alaska (e.g., cold climatetechnologies, specialized chemicals and solvents, and others like UA's proprietary technology for fishbone removal). Austin shows that strategies to add value to basic products and services, and invest-ments in specialized economic infrastructure to support new technologies, can lead to good outcomes.
Addressing Alaska’s Need to Develop an Institutional Framework to Elevatethe Impact of Knowledge in Regional Industries: North Carolina’s ApproachAlthough North Carolina is obviously quite differentfrom Alaska in most respects, this state still pres-ents an interesting best practice for Alaska, namelyas a now fast-growing state whose success withstrategies to spur economic transformation demon-strates the type of results that can be achievedthrough sustained focus on the goal, political sup-port and sufficient allocation of resources.
Sustainable innovation seldom comes from indi-vidual inspiration alone. It is clear that linkagesamong researchers, and between researchersand industry, are the key to having a certain kindof infrastructure—an "innovation infrastructure"that can result in higher levels of business vitalityand the generation of new jobs.
Networking and collaboration play an impor-tant role in innovation. Commercially valuableinnovations generally do not arise in isolation,but rather develop out of collaboration be-tween firms, customers, suppliers, employ-ees, universities, government researchinstitutes and other players. The degree towhich such linkages exist may be an impor-tant indicator of the strength of a state's in-novation system as a whole.40
39 "Fish out of water." The Economist, Oct 29th 2009.
40 http://www.med.govt.nz/
T h e i m p o r t a n c e o f f o c u s i n g o n k n o w l e d g eb a s e d I n d u s t r i e s t h a t a l i g n w i t h a r e g i o n ' s
p a r t i c u l a r c o m p a r a t i v e a d v a n t a g e s a n d a r e a so f s p e c i a l i z a t i o n 3 9
"Too many [regions] are seized by ambitions that bear no re-lation to their particular comparative advantages. AlthoughMalaysia had few skilled biologists (or entertainment ex-perts) the country's politicians decided to build BioValley onthe ruins of Entertainment Village, an attempt to create aMalaysian Hollywood that failed for lack of media attention,among other problems.
Two [other] foolish tendencies are particularly hard to resistwhen politicians are struggling with high unemployment.The first is the temptation to spread the wealth around toevery region and interest group. France's attempt to trans-form Brittany from one of its more backward regions into ahive of high-tech activity failed dismally for an important rea-son: entrepreneurial firms cluster in particular places-whereother entrepreneurial firms are clustering. The second is asuspicion of foreign investors. The Japanese governmentlavished money on start-ups in the 1990s but at the sametime was reluctant to embrace foreign venture capitalists.Japan now has one of the wealthy world's weakest ven-ture-capital markets."

52
A common definition of innovation is "the design, invention, development and/or implementation ofnew or altered products, services, processes, systems, organizational structures, or business modelsfor the purpose of creating new value for customers and financial returns for the firm."41 And in the lat-ter part of the twentieth century, North Carolina found itself at a crucial juncture as foreign competitionincreased and the state's traditional industries (e.g., footwear, apparel, simple furniture) began losingmarket share to lower-cost competitors. Yet, the state enjoyed several non-traditional (at the time) ad-vantages, namely, a high concentration of educational and research and development infrastructure inthe region known at the Research Triangle(defined as the area between three universi-ties, Duke, North Carolina and North CarolinaState), a strong banking and financial serv-ices sector, agriculture, a large military pres-ence and a long tradition of decentralizeddecision-making at the regional level:
North Carolina's economy is in a periodof transition with their traditional indus-tries of textile and furniture manufactur-ing and tobacco all in rapid decline and"new age" industries of financial services,pharmaceutical manufacturing and hightech research all on the increase.43
The state responded to the challenge of tran-sitioning the economy through the establish-ment of a state-sponsored research parkdesigned to attract the kind of firms and insti-tutions that would, over time, transform thestate's economy.
The Research Triangle Park (RTP) initiative iswidely considered to be the state's mostsuccessful regional economic developmenteffort. State economic development leadersrecognized that the educational institutions inthe Raleigh-Durham area "create knowledgeassets and provide a steady supply of trainedscientists, engineers, managers, and techni-cians to the region's workforce."44 Theseleaders set out to harness the potential ofthis institutional infrastructure in order to po-sition the state to more capably adapt to thechallenges of the changing global economy. And given the number of other regions around the worldthat have tried, and failed, to replicate this model, the effort's leaders should be commended for theiringenuity, determination and long-term vision.
A L A S K A F O R W A R D : P H A S E I S I T U A T I O N A L A N A L Y S I S
42 "A Compendium of Clusters in Less Populated Places: Circumstances, Interventions, and Outcomes." Regional Technology Strategies, Inc., March 2009.
"Generating Local Wealth, Opportunity, and Sustainability through Rural Clusters." Regional Technology Strategies, Inc., March 2009.
43 http://www.delni.gov.uk/index/press-releases/press-releases-apr-jun-2007/minister-explores-best=practice-in-north-carolina.htm
44 "Research Triangle Park: Evolution and Renaissance." Rick L. Weddle, President & CEO, Elizabeth Rooks, Executive Vice President, Tina Valdecanas, VicePresident - Corporate Strategy. The Research Triangle Foundation of North Carolina, June 2006.
About 60% of all men's hose made in the U.S. comes fromwithin a 60-mile radius of Hickory, N.C. The Catawba ValleyHosiery Association formed in 1959 to: provide a forum for dis-cussing common problems, identify new markets, advance in-dustry branding, and implement new skill training. In 1988, itsmembers were able to lobby the state legislature for support ofa Hosiery Technology Center at Catawba Valley Community Col-lege. In 1990, after learning about the success of cluster net-works in Italy, they explored this concept as a theme for theirannual meeting and made marketing and production networks astrategic goal.
While the state's hosiery cluster has been hit hard by pressuresfrom big box stores to cut prices and take back unsold goods andbuy from China, the cluster's response has been proactive: tomove upscale and develop more appealing niche products, suchas Thurlo's differentiated action socks or the Vermont "SockLady's" mismatched pairs of socks.
An association-sponsored trip to similar clusters in Italy (CastelGoffredo) opened cluster leader's eyes to the potential of designand resulted in changes in their community college-basedHosiery Technology Center to include testing, quality standards,and increased emphasis on training in design and understandingmarkets.
This cluster began as a narrowly focused industry effort, butonce its success was evident, the state government and com-munity college system recognized it as a replicable model forcluster and workforce development centers across the economy.
C a s e i n P o i n t : T h e r o l e o f t h e H o s i e r y Te c h n o l o g yC e n t e r i n h e l p i n g t h i s
i n d u s t r y i n t h e s t a t e ' s C a t a w b a Va l l e y a d a p t t oc h a n g i n g m a r k e t t r e n d s 4 2

A L A S K A F O R W A R D : P H A S E I S I T U A T I O N A L A N A L Y S I S
W W W . I H S G L O B A L I N S I G H T . C O M 53
However, it should also be noted that the RTP effort did not happen overnight, and in fact, has experi-enced quite a few setbacks and strategic reconfigurations throughout its evolution. And as the effort'smantra succinctly reminds us, "all overnight successes are at least 20 years in the making."45
The Research Triangle Park effort originated as a response to foreign competition, a rapidly changing globaleconomy and North Carolina's relatively weak competitive position within the new economic paradigm:
The idea for RTP stemmed from the need to reverse a number of negative economic trends facingthe state's economy. In the 1950s, North Carolina had the second-lowest per capita income in theUnited States. Moreover, the economy was heavily dominated by low-wage manufacturing indus-tries such as furniture, textiles, forestry, and small-scale agriculture. The airport was small and re-gional. The state was facing a serious "brain drain" as graduates in the state were leaving in searchof better jobs, and those attending college outside the state were not returning.46
Given the expected consequences, leadership at the highest public and private sector levels setabout to reverse these trends. At the urging of key private sector leaders such as Robert Hanes,the president of Wachovia Bank and Trust Company, and Romeo Guest, a Greensboro buildingcontractor, and with the help and support of North Carolina State Chancellor Carey Bostian,Governor Luther Hodges commissioned a concept report on the idea of the establishment of aresearch park to diversify the state's economic base. By the end of 1956, the University ofNorth Carolina and Duke University joined the effort and the Research Triangle DevelopmentCouncil was formed. The vision was to attract research companies from around the nation to lo-cate in a parcel of land surrounded by the state's research universities. The resulting "ResearchTriangle Park" would be a place where companies could take advantage of the region's intellec-tual assets in individual campus settings that provided a ready physical infrastructure.47
In December 1958 the three educational research institutions founded the Research Triangle In-stitute (RTI), which was provided with a 157-acre campus in the middle of the park and a$500,000 start-up fund to cover projected operating deficits for the first three years.48
The first five years of the Park's existence saw relatively slow growth. While Chemstrand, acompany jointly owned by Monsanto Corporation and America Viscose, announced its decisionto move into the Park in 1960, it was not until 1965 that growth in the Park concept truly tookhold. In that year, IBM announced that it would locate a 400 acre, 600,000 square foot researchfacility in the Park. Also that year, the U.S. Department of Health, Education, and Welfare de-cided to locate its new $70 million National Environmental Health Science Center at the Park.With the location of a substantial government presence and a few notable private sector com-panies, the Park gained credibility as a place for research and development."
The guiding assumption behind the initial recruitment strategy was to attract larger, more estab-lished companies that would build a culture in which smaller, start-up industries could thrive. Thetheory has proved well founded, as a number of smaller, spin-off companies have emerged."49
45 "The Research Triangle Park: Past Success & Future Opportunities." Presentation by the Research Triangle Foundation of North Carolina. "Research Trian-gle Park: Evolution and Renaissance." Rick L. Weddle, President & CEO, Elizabeth Rooks, Executive Vice President, Tina Valdecanas, Vice President - Corpo-rate Strategy. The Research Triangle Foundation of North Carolina, June 2006.
46 "Research Triangle Park: Evolution and Renaissance." Rick L. Weddle, President & CEO, Elizabeth Rooks, Executive Vice President, Tina Valdecanas, VicePresident - Corporate Strategy. The Research Triangle Foundation of North Carolina, June 2006, and http://www.kansasinc.org/pubs/kcspu01/appendix_c.pdf
47 "Research Triangle Park: Evolution and Renaissance." Rick L. Weddle, President & CEO, Elizabeth Rooks, Executive Vice President, Tina Valdecanas, VicePresident - Corporate Strategy. The Research Triangle Foundation of North Carolina, June 2006.
48 http://www.kansasinc.org/pubs/kcspu01/appendix_c.pdf
49 "Research Triangle Park: Evolution and Renaissance." Rick L. Weddle, President & CEO, Elizabeth Rooks, Executive Vice President, Tina Valdecanas, VicePresident - Corporate Strategy. The Research Triangle Foundation of North Carolina, June 2006.
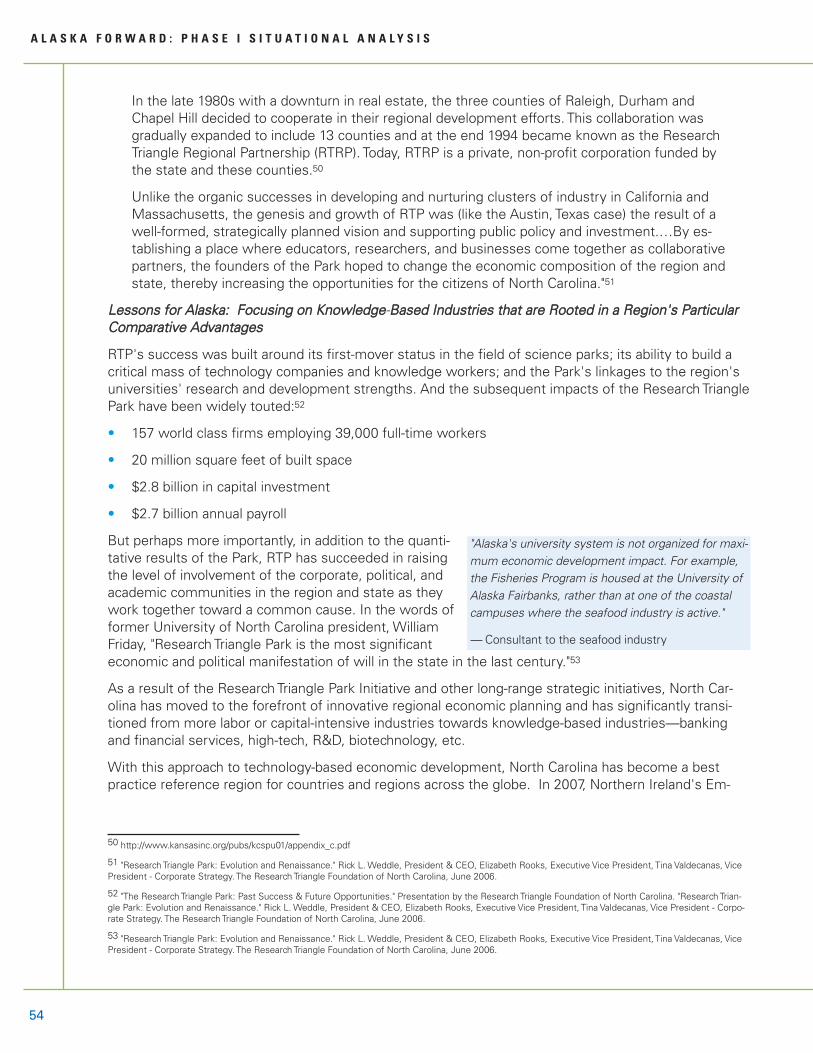
54
In the late 1980s with a downturn in real estate, the three counties of Raleigh, Durham andChapel Hill decided to cooperate in their regional development efforts. This collaboration wasgradually expanded to include 13 counties and at the end 1994 became known as the ResearchTriangle Regional Partnership (RTRP). Today, RTRP is a private, non-profit corporation funded bythe state and these counties.50
Unlike the organic successes in developing and nurturing clusters of industry in California andMassachusetts, the genesis and growth of RTP was (like the Austin, Texas case) the result of awell-formed, strategically planned vision and supporting public policy and investment.…By es-tablishing a place where educators, researchers, and businesses come together as collaborativepartners, the founders of the Park hoped to change the economic composition of the region andstate, thereby increasing the opportunities for the citizens of North Carolina."51
Lessons ffor AAlaska: FFocusingg oon KKnowledgge-BBased IIndustries tthat aare RRooted iin aa RReggion''s PParticularCComparative AAdvantagges
RTP's success was built around its first-mover status in the field of science parks; its ability to build acritical mass of technology companies and knowledge workers; and the Park's linkages to the region'suniversities' research and development strengths. And the subsequent impacts of the Research TrianglePark have been widely touted:52
• 157 world class firms employing 39,000 full-time workers
• 20 million square feet of built space
• $2.8 billion in capital investment
• $2.7 billion annual payroll
But perhaps more importantly, in addition to the quanti-tative results of the Park, RTP has succeeded in raisingthe level of involvement of the corporate, political, andacademic communities in the region and state as theywork together toward a common cause. In the words offormer University of North Carolina president, WilliamFriday, "Research Triangle Park is the most significanteconomic and political manifestation of will in the state in the last century."53
As a result of the Research Triangle Park Initiative and other long-range strategic initiatives, North Car-olina has moved to the forefront of innovative regional economic planning and has significantly transi-tioned from more labor or capital-intensive industries towards knowledge-based industries—bankingand financial services, high-tech, R&D, biotechnology, etc.
With this approach to technology-based economic development, North Carolina has become a bestpractice reference region for countries and regions across the globe. In 2007, Northern Ireland's Em-
A L A S K A F O R W A R D : P H A S E I S I T U A T I O N A L A N A L Y S I S
50 http://www.kansasinc.org/pubs/kcspu01/appendix_c.pdf
51 "Research Triangle Park: Evolution and Renaissance." Rick L. Weddle, President & CEO, Elizabeth Rooks, Executive Vice President, Tina Valdecanas, VicePresident - Corporate Strategy. The Research Triangle Foundation of North Carolina, June 2006.
52 "The Research Triangle Park: Past Success & Future Opportunities." Presentation by the Research Triangle Foundation of North Carolina. "Research Trian-gle Park: Evolution and Renaissance." Rick L. Weddle, President & CEO, Elizabeth Rooks, Executive Vice President, Tina Valdecanas, Vice President - Corpo-rate Strategy. The Research Triangle Foundation of North Carolina, June 2006.
53 "Research Triangle Park: Evolution and Renaissance." Rick L. Weddle, President & CEO, Elizabeth Rooks, Executive Vice President, Tina Valdecanas, VicePresident - Corporate Strategy. The Research Triangle Foundation of North Carolina, June 2006.
"Alaska's university system is not organized for maxi-mum economic development impact. For example,the Fisheries Program is housed at the University ofAlaska Fairbanks, rather than at one of the coastalcampuses where the seafood industry is active."
— Consultant to the seafood industry
A L A S K A F O R W A R D : P H A S E I S I T U A T I O N A L A N A L Y S I S
W W W . I H S G L O B A L I N S I G H T . C O M 55
ployment and Learning Minister, Sir Reg Empey conducted a fact finding mission to North Carolinaspecifically to learn from the state's experiences and policies:
Commenting on his meetings, the Minister said "In order to compete in a global market, North-ern Ireland must learn from examples of best practice from around the world. The work beingdone in North Carolina is an excellent example of how a holistic approach encompassing Furtherand Higher Education and the business community can raise skills levels and attract inward in-vestment.54
Transition to an economy that both needs and produces knowledge workers places difficult demandson the educational system. As Alaska considers the type of institutional framework that would be mostappropriate to elevate the impact of knowledge-based industries in the state, it should be reiteratedthat knowledge-based industry development strategies often take a long time and that they requirestrong commitments and a long-term perspective. Furthermore, the model must be scaled and con-ceptualized to the state's particular context and comparative advantages and designed for the particularkinds of companies that are most likely to spin out of university and other research.
Why AAre tthese CCase EExamples IImportant?
Some leaders may feel that Alaska's unique history and atypical development challenges are such pow-erful constraints on economic development that the system and approaches that have evolved over theyears are the best way forward. But these case examples show that other regions having different fun-damental characteristics than Alaska's, for sure, have nevertheless been successful in overcoming barri-ers to economic development not so different that those faced by the state. All of the cases presentedhave a few themes in common, and each theme is relevant to Alaska.
Leaders can take steps to affect the trajectory of an economy—a state's economy is not somehow pre-ordained towards a particular destiny. Interventions in the status quo in the form of new public policies,bold private sector initiative, new public-private partnerships and strategic resource allocation can all af-fect the trajectory of an economy. Alberta makes this case quite clear. The vision of a single leader inthe 1970's drove new thinking in the 1980s about how to achieve a far more diverse economy. Subse-quent policy initiatives launched new economic development organizations with new missions. New ini-tiatives in education and training and in science and technology began to shift the structure of theeconomy in the 1990s. Analysts looking at the province's economic transformation typically note thatits success relative to neighboring provinces can be attributed to successful diversification into neweconomic sectors that now complement resource extraction and industrial manufacturing.
Strategic planning can have a payoff—Economic analysis cannot end with a simple statement of theproblems. This Phase I Situational Analysis for example, is envisioned to be a foundational documenton which the most important task to come, a strategic plan, is based. In effect, the situation analysis isnecessary, but insufficient to spark the new thinking and new behaviors that will be needed to moveAlaska's economy in new directions. In every case presented above, leaders took steps to design,launch and implement a comprehensive strategic plan to guide their region's development.
Leaders in states whose economies are threatened cannot afford to do nothing and wait for economicconditions to improve—Waiting for new economic conditions is not a strategy. Oil prices might go up,and that would be good. But they might, as they have in years past, go down. By their nature commod-ity prices will vary according to demand conditions far removed from Alaska's control. In this context,Alaska's leaders need to mobilize around the need to inform residents of the "razors edge" on which theeconomy rests and organize themselves for new, collective action.
54 http://www.delni.gov.uk/index/press-releases/press-releases-apr-jun-2007/minister-explores-best=practice-in-north-carolina.htm

56
How leaders respond to the state's challenges will depend on their willingness to take this report andthe others that echo the same themes and boldly go to work on the all important next task of strategydevelopment. If this moment of Denali Commission funding and APED leadership slips away withoutbroad based new action, the next opportunity to take such action will not come along for some time be-cause the resources that have been invested in this effort are becoming increasingly scarce to come by.
A L A S K A F O R W A R D : P H A S E I S I T U A T I O N A L A N A L Y S I S
A L A S K A F O R W A R D : P H A S E I S I T U A T I O N A L A N A L Y S I S
W W W . I H S G L O B A L I N S I G H T . C O M 57
A S S E S S M E N T O F E N T R E P R E N E U R S H I PA N D B U S I N E S S C L I M AT E
Factors Affecting Economic Vitality This section is presented at this point to look in more depth at some factors that, while related to theEDO strengths and weaknesses analysis presented earlier, instead addresses the broader question ofwhether Alaska has within itself wherewithal to do what is necessary to make the economy more sus-tainable for future generations. Overall, is the climate (in the widest possible sense) conducive to eco-nomic change, growth and prosperity? In particular, is it a good environment for both businessentrepreneurship (the generation, growth and sustainability of new and innovative enterprises) and civicentrepreneurship (the collective action of leaders to think and act differently to achieve a new economicvision)? Business and civic entrepreneurship are mechanisms for change. In combination, we are talk-ing about an innovation economy—one that can adapt to challenges from the outside.
Since the world economy is quite dynamic, with constantly changing commodity prices, market de-mands, new technologies and new products, any regional economy that lacks mechanisms to allow forcorresponding changes in resource allocation, technological progress, institutional adaptability and otheraspects of what we can broadly call entrepreneurial initiative, will quickly fall behind. Even if the re-gion's goal is to "tread water" and simply maintain its quality of life, the region's economy must be gen-erating new companies, new products and new ways to rejuvenate itself at some minimal level. Thiskind of flexibility is at the very heart of a market economy.
It is a challenging task to characterize Alaska's climate for entrepreneurial initiative, since it is in factsuch a unique economy. Its uniqueness has been noted elsewhere, but in this section, some of the rel-evant characteristics include:
• The two extremes of a large subsistence economy (mainly Alaska Natives) juxtaposed with a highly"outward-oriented" economy (resource industries, federal government, military and research). Thesubsistence economy is largely un-documentable according to standard metrics, while the mostvisible economic activities are oriented toward "traded goods" to an extraordinary degree. One ofthe many consequences is that some of the most common measures of entrepreneurship, such asthe well-known Kauffman Index of Entrepreneurial Activity, presents a distorted picture.55
• At the mercy of exogenous factors. The relative prosperity or lack thereof of the traded sectors of theeconomy is to a large degree totally independent of the actions of Alaskans—whether it be the pricesof oil, other minerals, fish and wood products, or the priorities of the U.S. Military and other govern-ment departments. Of course there are some ways in which Alaskans can influence these factors, byfor example moving toward more value-added fish products, or lobbying government agencies, both ofwhich can serve to mitigate somewhat these exogenous swings in basics affecting the economy, butfor the most part the economy is extraordinarily dependent on the actions of others.
Thus, characterizing Alaska's climate for entrepreneurial initiative is a task that needs to be undertakenwith care.
The issues of entrepreneurship and business vitality are best examined by evaluating the environmentfor new businesses and existing businesses separately.
55 Alaska ranks 5th in the country in the Kauffman Index for 2008, tied with California - although this is driven to a large degree by the fact that many jobs,such as in the fishing sector, are not salary positions, and the influence of the subsistence economy. These measures do capture a very important charac-teristic of the Alaskan economy, but the entrepreneurial activities in question are for the most part qualitatively different from the activities captured by thecorresponding statistics in the “lower-48 states.” In particular, a far lower percentage of these activities lead to so-called "gazelles" - fast-growth small com-panies that soon become medium and occasionally large enterprises.

58
The Business Environment for Start-ups A new business must overcome several hurdles as it goes from initial concept to sustainable operations.
To be successful, an entrepreneur must first build a business plan based on market research, productresearch, and financial analysis. By the time the business is actually launched, the source of trainedworkforce must be identified, physical plant must be installed and operational, financial resources mustbe located and deployed, licenses need to be obtained from the regulators at all levels, networks ofsuppliers and distributors established, and marketing and promotion must take place (see Figure 13).
However, in Alaska, several key factorsserve to undermine this basic system forgenerating high-growth enterprises.
Several interviewees for this project fo-cused on a single theme, noting that costlevels are so much higher in Alaska that thedecision to launch an entrepreneurial activ-ity is not just quantitatively different butqualitatively different from other parts ofthe U.S. Examining the entire range of po-tential activities that would normally makesense, these leaders find the constraintquite severe. To summarize:
• Processing of natural resources—thenormal evolution of natural resourcebased industries such as fishing, tim-ber, and mining is to move up from lowvalue-added activities (extraction) tohigher value-added activities, such asprocessing. However, the cost of most of the necessary inputs to such high value-added process-ing is prohibitively high—so most of the fish, timber, oil and ores that leave Alaska are processedelsewhere. While certain niches can always be found, an across-the-board shift into higher value-added activities seems unlikely.
• Manufacturing—labor costs are significantly higher in all occupations, while transportation drives upthe cost of key inputs and capital goods that need to be brought in.
• Services—there are a variety of non-traded services that provide good wages for Alaskans. Butwhen it comes to traded services, such as technical and engineering services, which can in princi-ple be largely provided using the internet,56 the high cost of living still makes such activities dubi-ous, unless locals have some specialized knowledge based on Alaska's geographic location andresource mixture that can overcome the labor cost disadvantage.
These objective factors are exacerbated by the cultural and behavioral legacy of Alaska's high-spendingeconomy. Because of Alaska's unique history and economic characteristics, the business community isused to the creation of economic activity through spending (mostly by government or oil companies),not through innovations that lower costs and provide new products more cheaply. A population that hasexperienced 50 years of "cost-plus" billing doesn't suddenly shift gears overnight to become lean and
A L A S K A F O R W A R D : P H A S E I S I T U A T I O N A L A N A L Y S I S
Figure 113. TThe EEntrepreneurial LLifecycle
56 As service industries don't carry the same burden of needing to transport inputs and finished products over long distances, one hopes they can be morecompetitive in cost terms than manufacturing. However, the cost of developing out-of-state markets for new or growing businesses is often overlooked.Every business trip out of state begins with $500 to $1000 or more (per person) in plane tickets. For the same reason, it is difficult to make and maintainwhat might be viewed elsewhere as obvious business and professional networks.
A L A S K A F O R W A R D : P H A S E I S I T U A T I O N A L A N A L Y S I S
W W W . I H S G L O B A L I N S I G H T . C O M 59
competitive. In short, using the standard definitions, Alaskans are on the whole not very entrepreneur-ial in the business sense.57
There are additional constraints to creating an entrepreneurial mindset in Alaska. For example, whenhigh paying jobs dwindle, in most economies the labor force adjusts, and workers are re-trained in newindustries, even if the wages are somewhat lower. Alaska's urban labor force, on the other hand, is ex-ceptionally mobile—so that instead of accepting lower wages, many will relocate to the “lower 48.”Conversely, when new high-tech jobs do become available, they often go to outsiders, who have gener-ally received more specialized training in such fields.
In this kind of business environment, the most talented residents will migrate toward government jobs,or what economists call "rent-seeking" activities—jobs dependent on special licenses, allowances andsinecures that are typically more prevalent where governments and regulations dominate, or where ge-ographical constraints create "local monopolies" in the private sector.
This difficult situation is partly inevitable given the geographic and resource endowment of Alaska—butit is also in large part a direct by-product of existing government policies. The extensive use of govern-ment supports as a policy instrument contributes to the high-cost economy while dulling the impact ofmarket-based incentives. In general, a company, industry or interest group which is facing economichardship calculates that it will probably return to prosperity sooner by pursuing government largessethan by finding more efficient technologies, cutting costs, discovering innovations, and finding new mar-kets—e.g., but pursuing the "entrepreneurial" solutions.
Government support is also the story of civic entrepreneurship in Alaska, if to a lesser degree. Alaska'svast geography and the varying needs of residents as they live farther from the urban centers hasevolved a non-system of EDOs and other development agencies supported entirely or largely by gov-ernment. These organizations have a presence in remote places and attempt to address the specific orunique needs of the people they represent, but there funding is generally not up to the task nor, wewere told in the interviews, their staff not up the challenge. The way Alaska's institutional approach toeconomic development has grown has been more government spending, aimed as best as possible atovercoming enormous development challenges in regions far removed from even basic economic de-velopment opportunities. Civic entrepreneurship, the collective action of the private sector, is not en-couraged when the government plays such a large role in the economic development game.
Frontier Spirit or Welfare State
When looking for appropriate regions to compare to Alaska in the benchmarking exercise, the utility ofbenchmarking Alaska against Norway was debated. Both straddle the Arctic Circle, both have signifi-cant Native populations, and both have significant oil revenues; but the point was often made that Nor-way's social democratic system is quite different from our capitalist system, and that Norway is acountry with considerably more autonomy regarding economic policy as compared with a state—sothat apples-to-apples comparisons might not be possible or productive. Nevertheless, one of the pri-vate sector interviews with a private business executive, who had been based in Norway for severalyears, was illuminating. This executive—a born and bred American—stated that the business climatewas far more 'business friendly' in Norway than in Alaska.58
57 This is not a moral judgment, but an almost inevitable result of the historical economic reality. With a population of 680,000, the internal market size hasbeen insufficient to spur innovation. Before the opportunities now made possible by globalization, Alaska's only economic advantages have been its naturalresources, which were beyond the financial capacity of locals to exploit. Seen in this context, Alaska's past dependence on the wealth of others (oil compa-nies, mining companies, federal government, etc.) has been a necessity, not a choice.
58 In addition, this interviewee reported that the public's confidence in the technologies and safeguards used in exploration and recovery appears to behigher there, allowing for a less contentious public debate regarding the role of that industry in the overall economy. This is also in part explained by themuch narrower gap between the haves and the have-nots in Norway as compared to Alaska - when the distribution of income is less skewed, people tendto be less suspicious of being exploited by big industry.
60
This would appear surprising to those who were raised with the notion that the U.S. system is far moreentrepreneurial than Europe's. However, he pointed out that the general public is far more supportiveof the oil industry in general, while universities, research centers and business organizations were farmore pro-active in finding ways to invest in value-added activities to leverage the oil resource. In fact,knowledgeable Alaskans are aware that not only Norway, but also Sweden, Denmark and Finland areactively involved in business investments, public private partnerships, and perhaps more development-oriented (rather than protectionist) trade policies. Norway's oil policies have in general plowed a greatershare of the oil revenues into investments (in infrastructure, research and education) than into con-sumption (e.g. subsidies) than Alaska.
Thus, the standard notion that Europeans live in "welfare states", while Americans have a natural benttowards the "frontier spirit", may need to be revised when characterizing Alaska. Certainly Alaska stillhas plenty of rugged individualists, and a subsistence/barter economy is still an important part of manycommunities—so a single label cannot be applied to Alaska with impunity. However, time and againduring the interviews, phrases like "entitlement mentality" and "welfare state" kept coming up in placeof "market-driven" and "entrepreneurial spirit." Clearly, any types of programs designed to promote en-trepreneurship that have been successful in other regions (such as loan programs, incubators, and tech-nology commercialization funds) will be fighting against a strong current unless the underlying policiesthat have created this non-entrepreneurial mindset can be reversed.
The Alberta "best practice" case provided another example, where leaders recognized the need for anentrepreneurial mindset and persistence to achieve greater economic diversification. Although Albertatook the lead, the other western provinces followed, to varying degrees, by investing their resources intechnical and trade schools, in universities, in research centers and in promoting entrepreneurship.What this "Western Canada strategy" recognized is that long term progress toward greater diversifica-tion starts at home. These provinces took a strategic look ahead and placed their bets on building upnew, more knowledge-based industries.
Despite this less than glowing assessment of Alaska's climate for change, it is possible to change thismindset and foster a more entrepreneurial culture. However, it would require that state government nolonger operate by being "all things to all people", providing resources at the first sign of trouble. Withstronger fiscal discipline (which is likely to be forced anyway by forecasted declines in oil revenues) anda clearer vision of Alaska's future economy, incentives for new business investments should begin tolead to more entrepreneurial behavior.
The state has several assets and trends that can assist in this transition:
• The UUniversity oof AAlaska—the university has been the generous recipient of federal research dollars,and boasts a significant research infrastructure (Alaska ranks 3rd in the U.S. for university R&Dspending per 1,000 workers).59 The challenges of mobilizing this expertise into an effective technol-ogy commercialization "engine" are significant,60 but can be overcome through intelligent applicationof the basic principles of a 'knowledge economy.' Over time, the share of income from Alaska's re-sources will go less to the owners of those resources, and more to the owners of intellectual prop-erty needed to extract value from that resource. It is in Alaska's interest that a significant share ofthat intellectual property is developed in Alaska.
A L A S K A F O R W A R D : P H A S E I S I T U A T I O N A L A N A L Y S I S
59 Source: National Science Foundation/Division of Science Resources Statistics, Survey of Research and Development. Average annual expendituresfrom 2002 - 2007 is $472,000 per 1,000 workers, ranking only below Maryland ($895,000) and Massachusetts ($611,000).
60 In addition to the purely economic challenges (e.g. high costs), there are mindset challenges in this area as well. In the process of conducting inter-views with economic development professionals throughout the state, the interviewers found that some 90% had nothing to say about technology com-mercialization as a strategy - in fact, so many asked the interviewers to please define that term, that the interviewing staff asked if that question could bedropped from the questionnaire. Research dollars in Alaska have mainly been seen as increased spending in the local economy, not as investments thatprovide a key stepping stone to developing indigenous technological capabilities and creating new industries.

A L A S K A F O R W A R D : P H A S E I S I T U A T I O N A L A N A L Y S I S
W W W . I H S G L O B A L I N S I G H T . C O M 61
• Native CCorporations—Much of the capital generated from economic activities in Alaska is controlledby interests that are not based in Alaska, so even though wealth is generated, this doesn't mean thatinvestments automatically take place in Alaska. The Alaska Native corporations (ANCSA corporations)represent a partial solution to this problem. By their charter, most of these entities have some motiva-tion or incentive to take the long-term view regarding investments in Alaska. Many of them are free toinvest their assets (which exceed $4 billion currently) anywhere in the world, and they do so aggres-sively. However, most of their stockholders are based in Alaska, and their wellbeing will ultimately bedriven by the underlying health of the Alaskan economy. Thus, they have an incentive to direct a signif-icant part of their assets into investments that will have a pay-off in the medium to long term, an in-centive that offshore investors don't share. Thus, as part of a well-conceived and clear economicpolicy for the state, active ANCSA involvement61 in selected technology commercialization efforts,business incubators, loan programs and other activities designed to generate entrepreneurial activitiesshould be in their "narrow" (profit-oriented) as well as "broad" (community-oriented) interests.
• Existing eentrepreneurship oorganizations—In general, there is a severe lack of organizations to promotean environment that is supportive of entrepreneurship. One exception is the "Alaska Innovation andEntrepreneurship Support Group"62 founded by Allan Johnston. This network of business leaders, in-vestors, and support organizations boasts a remarkably diverse membership, across most major eco-nomic sectors, geographic regions, ethnicities and levels of experience to be found in Alaska. Thegroup provides a resource for information, problem-solving, best practices and what can best betermed as "moral support" for (primarily young) entrepreneurs who have embarked or are consideringembarking on a risk-based venture. Members of this group who were interviewed reported that theirtime was "well spent" and, especially since the cost to state and local governments is zero, the returnsare obviously significant. However, this group represents a single point of light in what needs to be aspectrum of related support organizations designed to support entrepreneurship across the state (seeFigure 14 for an example of what such a network looks like in Florida, for example).
Figure 114. TThe EEntrepreneurial LLifecycle wwith SSupporting PPrograms
61 In some respects, we may also look at the Western Alaska Community Development Quota Program (CDQs) similarly. Their investments were re-stricted to the seafood industry until quite recently, but even with regulations being a bit looser now, they are quite different from the ANCSA corporations.Nevertheless, they also represent an asset that could potentially help shift the balance on entrepreneurial investments to some degree.
62 Now branded as TEAM.

62
Conclusion
For reasons having to do with history and the state's special characteristics, Alaska doesn't appear tohave a particularly good climate for business risk-taking nor, we are told by interviewees, a willingnessfor "change," "innovation" or "rejuvenation" the state's strongest characteristics. Instead, Alaska seemsto have evolved what too many informed leaders told us is an "entitlement mentality" for us to not re-port this conclusion.
Ultimately, the goal is to provide a good environment for innovation—for new companies to start-up andgrow and for new thinking and new behavior within and among the state's EDOs and other develop-ment organizations. This will require a significant shift in both how leaders think about the economyand in economic policies going forward. On the other hand, if the fundamental incentives in the eco-nomic system can be fundamentally altered, the entrepreneurial spirit is never lurking far below the sur-face, and can rise to strike at good economic opportunities and to meet new economic challenges.
A L A S K A F O R W A R D : P H A S E I S I T U A T I O N A L A N A L Y S I S

A L A S K A F O R W A R D : P H A S E I S I T U A T I O N A L A N A L Y S I S
W W W . I H S G L O B A L I N S I G H T . C O M 63
E C O N O M I C P R O F I L E A N D O U T L O O K
Macroeconomic SummaryFrom the perspective of an analysis of Alaska's economy, the need for a new approach to economic de-velopment is made even clearer.
Any economy is a complex system. From a short-term perspective, Alaska appears to have weatheredthe Great Recession of 2009 well compared to other parts of the economy and will be participating inthe global cyclical recovery. However, from a longer term perspective there are risks and concerns thatultimately provide a rationale for a new approach to economic development to deal with potential risksand a loss of economic resiliency.
In order to come close to understanding how an economy works and where it is going, one needs to in-vestigate it from a variety of perspectives and different levels of detail. From the perspective of totalreal value added or Gross State Product (GSP), Alaska looks stagnant, largely because of declining oilproduction. The top line view is one of stagnation and lagging economic performance.
Aggregate GSP in this case is a somewhat misleading indicator -- employment and real incomes are muchbetter indicators of how people feel and these indicators are much more positive than GSP. First, the oilindustry is very capital intensive, so both increases and decreases in output have a more muted impact onemployment than in other more labor intensive sectors. Second, labor intensive sectors like travel andtourism have been growing and generating jobs. Third, while prices of the state's commodities are lowerthan the highs of 2008, they are still at historically high levels. These high price levels are supporting in-come and employment across the state. Finally, federal government spending has stayed relativelystrong. Therefore in many ways, Alaska is doing much better than the aggregate GSP data describe.
Upon closer examination of the comparatively brighter employment and income situation, one can findthe seeds of concern for the future. The state's per capita income and non-mining labor productivity islagging. The "income effect" of high commodity prices could be hiding structural problems and com-modity prices can quickly become a curse when they start to fall. Similarly, future cutbacks in federalgovernment spending could have a disproportionate impact on Alaska than other states.
Gross State ProductAs measured by GSP, compared to the totalU.S. Economy, Alaska's economy has beenstagnating for the past 20 years. Over the1990 to 2020 period we expect the U.S.economy to have doubled in real terms (con-stant dollar). Over the same period, theeconomy of Alaska will not even havereached its level of total activity in 1990, al-though it will have grown modestly from thesecular trough in economic activity in 2003.
From year-to-year the state economy tendsto rise and fall with the fortunes of the pri-mary resource sector. The price and de-mand for these commodities are volatile ingeneral and in the last few years the cyclehas been severe. On an annual basis real
8,000
9,000
10,000
11,000
12,000
13,000
14,000
15,000
16,000
1990 1994 1998 2002 2006 2010 2014 2018
Billio
n 220
05 $$
20
22
24
26
28
30
32
34
36
38
40
Billio
n 220
00 $$
Alaska (right sscale)
Sources: Bureau of Economic Analysis (BEA) and IHS Global Insight
History Forecast
U.S. (left sscale)
FFiigguurree 1155.. TTwweennttyy YYeeaarrss ooff CCoommppaarraattiivvee SSttaaggnnaattiioonn(Real gross state/gross domestic product)

64
Gross State Product actually contracted in 5 of the last 10 years. In years when the primary resourcesectors are thriving the overall economy performs well and when these sectors are contracting theoverall economy struggles. More recently real gross state product was flat in 2007 and it contracted by2% in 2008. IHS Global Insight is projecting a 3.2% contraction in 2009 and a modest rebound in 2010followed by much slower growth than the rest of the country over the next 10 years.
The most important single reasonfor this stagnation is the markeddecline of the state's basic indus-tries which include oil and gas ex-traction, commercial fishing andseafood processing as well as themilitary and government sectors.For instance the mining sector (in-cluding the oil industry) is thelargest industry in the state, how-ever its share of the state econ-omy has fallen from 35% in 1990to just 16% in 2008. While this isin some manner a sign of diversifi-cation, other sectors have not par-ticularly stepped in to contributeto a pace of overall economic
growth that is expected elsewhere in the country. The tepid performance of these basic industries hasconstrained growth in industries that sell services including financial services, utilities, construction andprofessional and business services. Retail and wholesale trade as well as health services are growthsectors in Alaska primarily due to growth in the population.
Later in this report, Alaska's economic foundations will be compared to a set of peer states: North andSouth Dakota, Idaho, Montana, Louisiana, Washington and Wyoming. Figure 17 below comparesAlaska's real GSP to the same group of peers beginning in 2000 and extending over the forecast period.It is clear that Alaska has lagged behind most of these states over the last 8 years. More important isthat the base case forecast is for the economic performance gap to increase.
Figure 117. LLagging EEconomic PPerformance tto CContinue
A L A S K A F O R W A R D : P H A S E I S I T U A T I O N A L A N A L Y S I S
-10%
-8%
-6%
-4%
-2%
0%
2%
4%
6%
8%
10%
1991 1993 1995 1997 1999 2001 2003 2005 2007 2009 2011 2013 2015 2017 2019
Real
GGSP/
GDP
GGrow
th
Sources: BEA and IHS Global Insight
HHiissttoorryy FFoorreeccaasstt
UU..SS..
AAllaasskkaa
Figure 116. VVolatile GGSP GGrowth
100
110
120
130
140
150
160
170
180
2000 2004 2008 2012 2016
RReeaall
GGSSPP
IInnddee
xx ((2200
0000==11
0000))
AlaskaIdahoLouisianaMontana
100
110
120
130
140
150
160
170
180
2000 2004 2008 2012 2016
Real
GGSP
IInde
x ((20
00=1
00)
AlaskaNorth DakotaSouth DakotaWashington StateWyoming

A L A S K A F O R W A R D : P H A S E I S I T U A T I O N A L A N A L Y S I S
W W W . I H S G L O B A L I N S I G H T . C O M 65
Beyond GSP—Non-Mining EconomyAs will be discussed later in this report, the state's energy sector is in decline and is a powerful forceunderlying the relatively dismal GSP perspective. How does the rest of the economy look? One simpleapproach is to subtract the mining sector (which includes oil and gas production) from the state's totalGSP. This is a simplistic exercise in that it does not also remove the indirect and induced impacts of theoil industry. Still, the indication is clear that the non-mining portion of the economy is not stagnating.
Figure 118. AAlaska’s EEconomy, EExcluding MMining
Still, the non-mining economy is clearly lagging the rest of the country and IHS Global Insight sees thelong term performance gap widening over the next 20 years.
PopulationPopulation trends have an important impact on the economy. Over long periods population growth isneeded to support growth in the labor force. The compounded annual growth rate in Alaska's populationsince 1980 has been 1.9%, however over the last 10 years population growth has slowed to just 1%and over the next decade we expect population growth to slow even further to 0.8%.
The limiting factor for growth in the economy is the source population for the labor force. The sourcepopulation for the labor force is the number of people between the age of 15 and 65 years. Over thelast 10 years this population has grown by 1.3% on a compounded annual basis—not much slower thanduring the previous 10 year period.
A large proportion of workers in some Alaska industries are nonresidents. This is partly due to the sea-sonality of these industries but also an indication of labor shortages and low wage rates in certain in-dustries. Nonetheless net migration has been negative in recent years. Net migration out of the statewas running at over 3,000 annually over the last two years—high by the standards of the last decadebut not unprecedented. Our expectation is that this outmigration will continue and will average about2,500 annually over the medium term.
Compared to the rest of the country, there is a smaller share of senior citizens in Alaska; however thegap is expected to narrow over the next 20 years. The dependency ratio will rise with the number ofsenior citizens increasing relative to the working age population, and this will create increased demands
8,000
9,000
10,000
11,000
12,000
13,000
14,000
15,000
16,000
1990 1994 1998 2002 2006 2010 2014 2018
Billio
n 2200
5 $$
18
20
22
24
26
28
30
32
34
36
Billio
n 2200
0 $$
US GDP Alaska GSP (Excl. Mining)
AAllaasskkaa ((rriigghhtt ssccaallee))
Sources: Bureau of Economic Analysis (BEA) and IHS Global Insight
HHiissttoorryy FFoorreeccaasstt
UU ..SS.. ((lleefftt ssccaallee))
-10%
-8%
-6%
-4%
-2%
0%
2%
4%
6%
8%
10%
1991 1995 1999 2003 2007 2011 2015 2019
Real
GGSP
/GDP
GGro
wth
US GDP Alaska GSP (Excl. Mining)
Sources: BEA and IHS Global Insight
Note: Mining includes the oil and gas sector for the purposes of this chart

66
on government and health care services. Retirees with financial means still tend to spend much or all oftheir retirement years in states with more moderate climates.
Employment and IncomeA remarkable feature ofAlaska is the overall steadygrowth and stability of itslevel of employment. Em-ployment growth in generalhas lagged the rest of thecountry, but its stability hasprovided Alaskan's with rel-atively more peace of mindthan others might have in amore cyclical labor market.With the deep trough in na-tional employment stilllying ahead in 2010, Alaskalooks to be an oasis ofcalm.
In line with employment growth, real personal income has grown from $20 billion to $29.7 billion since1990, a 48% increase. Real per capita income has increased at a much slower rate, up by 18% overthe same period, a rate somewhat behind national per capita income growth of 24%.
However, it is important to understand that while employment in the overall mining sector (including oiland gas) is a relatively small portion of total employment, the sector has a powerful income effect onthe economy. While some income does leave the state, a lot of it stays in the state or contributes tosome powerful multiplier effects in the rest of the economy. The key driver of income in the sector isthe price of oil which has been on a strong long term upswing since 1990.63
A L A S K A F O R W A R D : P H A S E I S I T U A T I O N A L A N A L Y S I S
0%
2%
4%
6%
8%
10%
12%
14%
16%
18%
1981 1983 1985 1987 1989 1991 1993 1995 1997 1999 2001 2003 2005 2007 2009 2011 2013 2015 2017 2019
HHiissttoorryy FFoorreeccaasstt
Sources: US Census and IHS Global Insight
UU..SS..
AAllaasskkaa
Figure 119. AAging PPopulation
100
110
120
130
140
150
1990 1992 1994 1996 1998 2000 2002 2004 2006 2008 2010 2012 2014 2016 2018
MMiillllii
oonn
0.15
0.20
0.25
0.30
0.35
0.40
0.45
MMiillllii
oonn
US
Alaska (Total)
Alaska (Excl. Mining)
Alaska (right sscale)
Sources: Bureau of Labor Statistics (BLS) and IHS Global Insight
H istory Forecast
U.S. (left sscale)
Figure 220. SSteady, bbut LLagging, EEmployment GGrowth
63 Price of oil is defined as average annual price where average is taken over quarters. For 2008, the price of $100/bbl means for some quarters in that yearthe price of oil was below $100/bbl and for other it was above it.
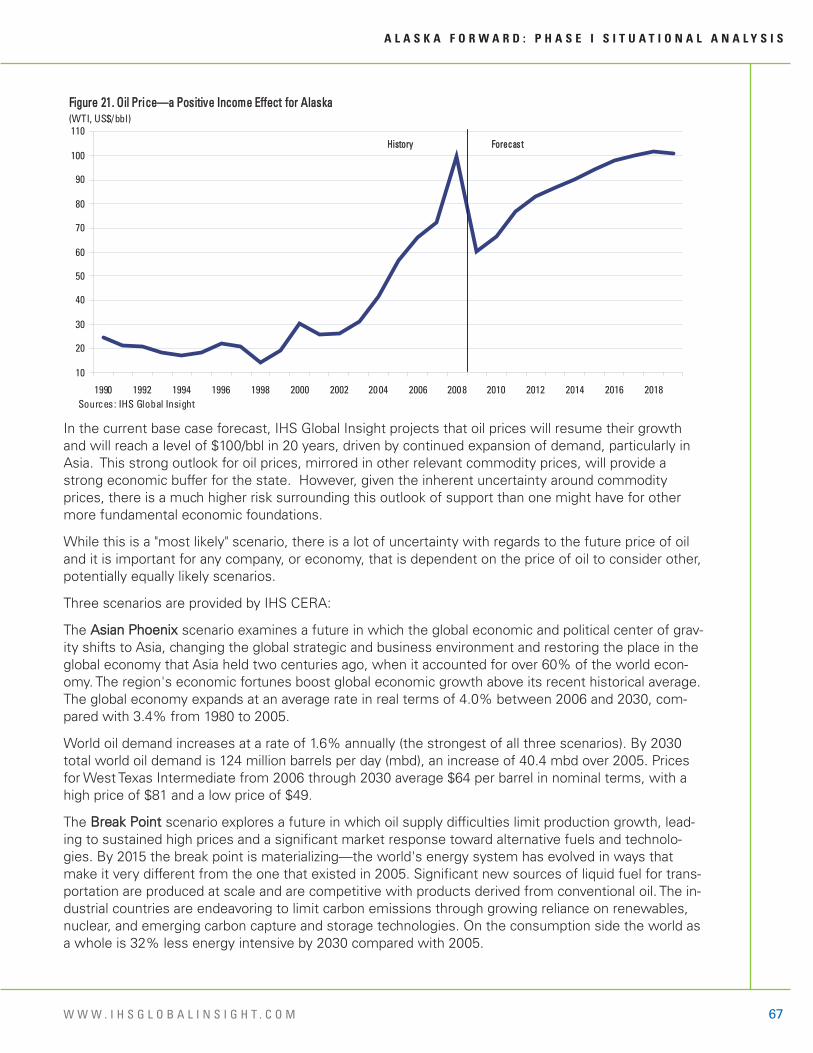
A L A S K A F O R W A R D : P H A S E I S I T U A T I O N A L A N A L Y S I S
W W W . I H S G L O B A L I N S I G H T . C O M 67
In the current base case forecast, IHS Global Insight projects that oil prices will resume their growthand will reach a level of $100/bbl in 20 years, driven by continued expansion of demand, particularly inAsia. This strong outlook for oil prices, mirrored in other relevant commodity prices, will provide astrong economic buffer for the state. However, given the inherent uncertainty around commodityprices, there is a much higher risk surrounding this outlook of support than one might have for othermore fundamental economic foundations.
While this is a "most likely" scenario, there is a lot of uncertainty with regards to the future price of oiland it is important for any company, or economy, that is dependent on the price of oil to consider other,potentially equally likely scenarios.
Three scenarios are provided by IHS CERA:
The Asian PPhoenix scenario examines a future in which the global economic and political center of grav-ity shifts to Asia, changing the global strategic and business environment and restoring the place in theglobal economy that Asia held two centuries ago, when it accounted for over 60% of the world econ-omy. The region's economic fortunes boost global economic growth above its recent historical average.The global economy expands at an average rate in real terms of 4.0% between 2006 and 2030, com-pared with 3.4% from 1980 to 2005.
World oil demand increases at a rate of 1.6% annually (the strongest of all three scenarios). By 2030total world oil demand is 124 million barrels per day (mbd), an increase of 40.4 mbd over 2005. Pricesfor West Texas Intermediate from 2006 through 2030 average $64 per barrel in nominal terms, with ahigh price of $81 and a low price of $49.
The Break PPoint scenario explores a future in which oil supply difficulties limit production growth, lead-ing to sustained high prices and a significant market response toward alternative fuels and technolo-gies. By 2015 the break point is materializing—the world's energy system has evolved in ways thatmake it very different from the one that existed in 2005. Significant new sources of liquid fuel for trans-portation are produced at scale and are competitive with products derived from conventional oil. The in-dustrial countries are endeavoring to limit carbon emissions through growing reliance on renewables,nuclear, and emerging carbon capture and storage technologies. On the consumption side the world asa whole is 32% less energy intensive by 2030 compared with 2005.
10
20
30
40
50
60
70
80
90
100
110
1990 1992 1994 1996 1998 2000 2002 2004 2006 2008 2010 2012 2014 2016 2018Sources: IHS Global Insight
HHiissttoorryy FFoorreeccaasstt
Figure 221. OOil PPrice—a PPositive IIncome EEffect ffor AAlaska(WTI, US$/bbl)

68
The world oil market undergoes severe stress between 2007 and 2015 as annual average prices forlight, sweet crude oil rise to $120 per barrel ($96 per barrel in real 2005 terms). The foundation of thisvery high oil price environment is rooted in production limitations that keep demand tightly balancedwith supply. Strife-related production disruptions, most notably the oil shock of 2013-14, contribute torestricting production and driving prices to new historical highs. But in the years after 2015 supplygrowth, including that of nontraditional liquids, combined with rising end-use efficiency of oil productsleads to falling oil prices as supply increases relative to demand.
Total world oil demand increases from 83.8 mbd in 2005 to 108 mbd in 2030—a total gain of 24.2 mbd,which translates to an annual increase of 1%, or 970,000 bd. This weaker growth in demand reflectsthe impact of high prices, which leads to faster fuel efficiency gains.
The Global FFissures scenario provides a window onto a world where the limits of globalization arereached and world economic growth is lower than in recent experience. A confluence of factors turnslarge parts of the world against liberal trade and to a lower growth trajectory. Barriers to trade and in-vestment are higher, and the incentives for technology innovation are more muted. Security concernsincrease. Nationalism becomes a stronger driving force in shaping domestic and international politics.At the same time social pressures increase within and between nations to address gaps in wealth andopportunity. In short, Global Fissures marks a fundamental shift from the recent past in relationshipsamong government, society, and the marketplace.
World oil demand slows to a rate of 1.1%annually, notably less than the 1.6% annualincrease recorded from 1970 through 2005.By 2030 total world oil demand is 110 mbd,an increase of 26.1 mbd over 2005. Fromthe standpoint of oil markets one of themost significant features of Global Fissuresis the dramatic drop in oil prices in the firstpart of the scenario. By 2011 nominal pricesfall to $19 per barrel. Prices are pusheddownward by weak demand growth, whichslows to an annual average of just 1 mbdfrom 2007 through 2011. They are alsopushed downward by a surge in liquid pro-duction capacity fueled by large projectsthat are sanctioned before the price col-lapse but come onstream as prices weaken.Oil prices do not stay at very low levels. Theoil price downturn leads to reduced up-stream spending, which helps to rebalancesupply with demand. Prices rebound from$19 to the $40 level within several years,supported by more aggressive supply man-agement by many major oil-producing coun-tries. However, prices remain well below2005-06 levels through 2030.
Labor productivity is another key driver ofcurrent and future income levels. After ex-cluding the mining sector (which includes
A L A S K A F O R W A R D : P H A S E I S I T U A T I O N A L A N A L Y S I S
$0
$20
$40
$60
$80
$100
$120
$140
$160
1995 2000 2005 2010 2015 2020
HistoricalAsian PhoenixBreak PointGlobal Fissures
11998866-22000033 aavveerraaggee:: $$2211 ..2200
Source: IHS CERA, Global Insight
Figure 222. WWTI PPrice SScenarios tto 22020(Nominal US$ per barrel)
-6%
-3%
0%
3%
6%
1990 1994 1998 2002 2006 2010 2014 2018
Prod
uctiv
ity GG
rowt
h
Alaska (Excl. Mining) US
History Forecast
Sources: BEA, BLS and IHS Global Insight
FFiigguurree.. 2233.. LLaabboorr PPrroodduuccttiivviittyy,, EExxcclluuddiinngg MMiinniinngg aanndd OOiill aanndd GGaass

A L A S K A F O R W A R D : P H A S E I S I T U A T I O N A L A N A L Y S I S
W W W . I H S G L O B A L I N S I G H T . C O M 69
oil and gas), there is concern that the state has and will continue to lag the national economy. Thistrend will be a drag on personal income growth in the future.
Alaska’s Regional Structure The state of Alaska is comprised of seven regions defined as aggregations of boroughs and censusareas that are logically considered as economic units by virtue of their geographic proximity, industrialstructure, and infrastructure requirements. The table below provides estimates of the value of eco-nomic activity in each region.
Alaska’s Industry Structure Figure 224. AAlaska aand NNational IIndustry SStructure
Ta b l e 5 . R e g i o n a l E c o n o m i c G r o w t h
2 0 0 8 L e v e l ( M i l l i o n 2 0 0 1 $ )
S h a r e o fS t a t e ( % )
2 0 0 8 E s t i m a t e dG r o w t h ( % )
2 0 0 9 F o r e c a s tG r o w t h ( % )
Southeast 2,984 10 -5.2 -3.6
Anchorage/Mat-Su 16,969 54 -1.8 -3.4
Gulf Coast 2,277 7 -2.3 -2.5
Fairbanks 4,094 13 -3.8 -3.2
Interior Western 998 3 -4.8 -3.1
Southwest 1,075 3 -4.7 -3.6
Northern 2,916 9 5.3 -1.8
Total 31,304 100 -2.0 -3.2
Source: IHS Global Insight
Alaska's GGSP bby IIndustry ((2008)
Financial Activit ies, 10.0%
Professional & Business Serv ices,
5.6%
Educational & Health Services, 5.3%
Leisure & Hospitality, 3.0%
Other Services, 1.5%
Government, 17.6%
Manufacturing,2.0%
Mining, 31.7%
Transportation, Trade, & Utilities, 16.6%
Agriculture, Forestry, & Fishing, 0.6%
Information,2.2%
Construction, 3.8%Military,5.3%
Source: Bureau of Economic Analysis (BEA)

70
Taking another view of the Alaskan economy by means of its industry structure reveals a complex mixof trends. Over the last five years, the Information, Business Services, and Military sectors have beena powerful source of growth. Industries such as Construction, Manufacturing, Fishing, and Mining (incl.oil and gas) have been a negative force on overall growth. Looking forward over the next five years,Mining will continue its secular decline due to the decline in oil production and sectors like Educationand Health Services, Transportation, Trade and Utilities, Leisure & Hospitality, Financial Activities, and In-formation will outperform the average.
A L A S K A F O R W A R D : P H A S E I S I T U A T I O N A L A N A L Y S I S
U S GGDP bby IIndustry ((2008)
Construction, 4.1%
Mining, 2.3%
Manufacturing, 11.5%
Financial Activities , 20.0%
Professional & Business Services ,
12.7%
Educational & Health Services , 8.1%
Leisure & Hospitality, 3.8%
Other Serv ices, 2.3%
Government, 12.9%
Transportation, Trade, & Utilities, 17.0%
Agriculture, Forestry, & Fishing, 1.1%
Information, 4.4%
Source: Bureau of Economic Analys is (BEA)
Ta b l e 6 . I n d u s t r i a l E c o n o m i c P e r f o r m a n c e( R e a l g r o s s s t a t e p r o d u c t )
2 0 0 8 L e v e l( M i l l i o n 2 0 0 0 $ )
2 0 0 8E s t i m a t e d
G r o w t h ( % )
2 0 0 9F o r e c a s t
G r o w t h ( & )
2 0 0 3 - 0 8( C A G R )
2 0 0 8 - 1 3( C A G R )
2 0 1 3 - 1 8( C A G R )
Agriculture, Forestry, & Fishing 287 -6.4 -4.1 -2.1 0.2 0.2Construction 1,058 0.4 -1.7 -4.6 2.1 2.1Mining 4,733 -9.9 -9.4 0.8 -5.6 -4.6Manufacturing 602 -9.1 -4.8 -2.5 1.5 2.2Transportation, Trade, & Utilities 7,361 -0.2 -0.3 4.2 3.1 2.4Information 1,225 8.0 2.5 7.8 2.7 1.3Financial Activities 3,858 2.9 0.9 2.1 2.8 2.0Professional & Business Services 2,298 10.0 2.6 6.6 3.0 1.9Educational & Health Services 2,018 3.4 4.4 3.2 5.7 5.0Leisure & Hospitality 1,112 1.7 0.5 2.1 3.5 2.7Government 5,780 2.4 0.3 1.5 1.4 0.2Military 1,554 4.6 1.0 4.0 1.5 0.3Real Gross State Product 29,947 -2.0 -2.7 1.8 0.2 0.4Real GSP (excl. Mining) 25,215 -0.3 -1.5 2.0 1.2 1.0Real US GDP 0.4 -2.5 2.4 1.8 2.6Note: Military not included in GSP, sum of sectors to not equal total due to chain weightingSource: IHS Global Insight

A L A S K A F O R W A R D : P H A S E I S I T U A T I O N A L A N A L Y S I S
W W W . I H S G L O B A L I N S I G H T . C O M 71
Oil and Gas Industry
Alaska's oil and gas sector is massive. It has held the position as the second largest oil producer in thenation for 30 years. It produces about 15% of the nation's domestic supply and employs 3% of the na-tional oil and gas work force. It is no surprise that the Alaska's fortunes are highly dependent on the oiland gas sector.
The central challenge is that Alaska's oil production has been in decline since 1988. The fields that arecurrently producing have an aggregate decline rate of just over 6%. Without any new developments,we expect these fields to be producing only about one-third of their current levels by 2030. However,we can expect some modest relief in the near term with three fields that are under development, com-ing on stream between 2011 and 2014. These developing fields will slow- but not reverse- the currentdecline rates in the near term. We expect Alaska's production in 2015 to be about 522,000 b/d or 75%of 2008 levels.
There are 39 discoveries in Alaska that are not developed, yet among these we anticipate that only sixmight be large enough for commercial development. One of these is currently being appraised and maymove forward with development and first oil in the 2012-2014 timeframe. The other undeveloped dis-coveries are far from infrastructure in the northwestern planning area of the NPR-A. As a result, oil fromthese discoveries is at least a decade away. If they are developed, they can substantially impactAlaska's production, allowing production to plateau for several years post 2020.
The United States Geological Survey (USGS) estimated in 2008 that Alaska holds 30 billion barrels oftechnically recoverable oil that has not yet been discovered. However, these are most likely to be in re-mote regions far from infrastructure. As such, much of this oil will remain undiscovered for a number ofyears and undeveloped for years beyond that.
Exploration, however, will continue. To estimate the impact on future production, we assumed that thevolumes brought on-stream in the future will be less than those brought on-stream in the recent pastbut that the pace of bringing the volumes on-stream will be about the same. In this scenario and com-bined with the assumed production from the undeveloped discoveries, it may be possible to maintain
0.0
0.2
0.4
0.6
0.8
1.0
1.2
2000 2003 2006 2009 2012 2015 2018 2021 2024 2027 2030
F ie ld s iin PPr o du c tio n
F ie lds U n de r DDe v elo pm e nt
F ie ld s Un d er AAp p r ais al
O th e r DD is co v er ie sw it h PP o te n tia l
f or DD ev e lo p m e n t
F u tu r eD is c ov e r ie s
Source: IHS CERA
Fi gure 225 . DDe cl i n gi n g OO i l PProd uct i on TTre nd(Million barre ls per day)

72
production at or near the levels predicted for 2015. Much depends, however, on the pace and locationof exploration. More substantial discoveries in the northwestern planning area of the NPR-A will facili-tate development of existing discoveries there.
In 2008, employment in the industry climbed to 13,000 when oil prices reached an all time high at$150. While additional employment growth has been reported in 2009, based on our oil production pro-jection scenario, the trend in employment will be negative. Gas production is also declining rapidly inthe Cook Inlet region, and the region could face a gas shortage as early as 2010.
To alleviate this, Alaska is reviewing options for a gas pipeline to bring gas to the region from the NorthSlope. If either of the two export lines is built, then the smaller regional line can be built as a spur offthe large trunk line.
The oil and gas industry in Alaska is narrowly focused and can be classified into four groups—oil andgas extraction, support activities for oil and gas operations, pipeline transportation, and refinery opera-tions. The payroll contribution of these sectors was over $1.5 billion in 2008. The industry makes anenormous contribution to state government revenues in fact petroleum royalties have increased sharplyover the last 10 years. These royalties and taxes make up about 85% of state revenue. Unfortunately, oilproduction has been declining for the last two decades due to depleted reserves.
The production of crude oil has fallen by 60% since 1990 and it stood at 257 million barrels in 2008. Theproduction of crude oil is concentrated on the North Slope and most of the crude is transported bypipeline and tanker to refineries located outside of the state. Alaska's refineries meet local demand andare located at Fairbanks, Nikiski, and Valdez. Some of the major oil producers and oil field service compa-nies are—BP Exploration Alaska, ExxonMobil Production Company, ConocoPhillips Company, NaborsDrilling, Doyon Drilling, Alaska Petroleum Contractors, CH2M Hill, Schlumberger Technology Group, PeakOilfield Service Company, Udelhoven, Halliburton, and ASRC Energy Services, among several others.
The production of natural gas is concentrated in two regions—North Slope and the Cook Inlet region.About 95% of gas is produced in association with oil in the North Slope fields and the remaining non-associated gas is produced in the Cook Inlet region. Natural gas is also used to re-inject in oil reservoirsto maintain pressure in order to keep oil production as high as possible. Over 1990-2005, the productionof gas in the Cook Inlet region, has stayed roughly constant 205 billion cubic feet (bcf) in 1990 to 208bcf in 2005.
The oil and gas sector payswages that are higher thanthe others in the Alaskaeconomy partially becausethese are very high skilledjobs. In 2007, the total em-ployment of the sector wasabout 12,500, representing4% of the total wage andsalary jobs in the state. Theindustry's average annualwage in the same year was$108,538, compared to stateaverage of $43,524.
About 90% oil industry em-ployment is concentrated inthree areas—Anchorage,
A L A S K A F O R W A R D : P H A S E I S I T U A T I O N A L A N A L Y S I S
108,538
152,840
89,839
82 ,611
62,593
52,275
51,637
49,450
0 40,000 80,000 120,000 160,000
Oil and Gas
Oil and Gas Extraction
Support Activit ies for Oil and Gas
Mining
Construction
Transportation and Warehousing
Information
Professional & Business Services
Source: Alaska Department of Labor andWorkforce Development , Research and Analysis Section
FFiigguurree 2266.. OOiill aanndd GGaass:: AA HHiigghh WWaaggee IInndduussttrryy(Average annual wages, 2007, US$)

A L A S K A F O R W A R D : P H A S E I S I T U A T I O N A L A N A L Y S I S
W W W . I H S G L O B A L I N S I G H T . C O M 73
North Slope and Kenai Peninsula bor-oughs. Anchorage is home to stateheadquarters for many industry players.Kenai Peninsula borough is a mature oilregion and has oil and gas productionwells, pipeline transportation, LPG facil-ity, and oil refinery. North Slope has thelargest concentration of the oil industryjobs, though the workforce is almostentirely from outside the borough.About one-third of North Slope workersare from outside of the state and thisproportion will be rising in the future.Earnings paid to nonresidents workingin the oil industry totaled about $365million in 2007, up from $328 million in2006. However, the nonresident shareof earnings declined to 27.7% in 2007from 28.7% in 2006.
The sector faces the challenge of volatile prices however there has been a dramatic improvement intechnology in the last 10 to 15 years that has helped to sustain production. These technologies includehorizontal drilling and 3-D and 4-D seismic surveys. The impact has been to reduce the number of wellsthat need to be drilled and brought major changes in the way other activities are performed.
Although there has been long-term demand growth for petroleum products in Alaska, significant sparerefining capacity remains.
In 2007, Alaska consumed 156 thou-sand barrels per day of petroleumproducts and maintained 375 thou-sand barrels per day of refining capac-ity. Demand for refined products islow, except for jet fuel. Flint Hills Re-sources' North Pole refinery shut oneof its crude processing units in March2009 in response to reduced jet fueldemand. The company previously con-sidered closing or selling the facilitybecause of low profitability. Given theamount of spare refining capacity inAlaska, eventual rationalization of ca-pacity seems likely.
Military and Federal Non-Defense
The military is another important sec-tor in the Alaska economy. The major installations include Fort Richardson and Elmendorf Air Force Basein Anchorage and Fort Wainwright and Eielson Air Force Base in the Fairbanks area. The U.S. CoastGuard has a significant presence in Kodiak, Sitka, Juneau and Ketchikan. Alaska has a large NationalGuard presence. Military personnel from other states come to Alaska for specialized training purposes.The state also has a very high concentration of veterans.
Fairbanks North Star Borough
7%
Kenai Peninsula Borough
10%
NorthSlope Borough
58%
Valdez2%
Anchorage21%
Other2%
Source: Alaska Department of Labor and Workforce Development, Research and Analysis Section
FFiigguurree 2277.. NNoorrtthh SSllooppee:: TThhee MMaajjoorr PPllaayyeerr(Concentration of oil and gas jobs, 2007)
0
50
100
150
200
250
300
350
400
1982 1986 1990 1994 1998 2002 2006
Refining Capacity
Demand
Source: IHS CERA
Figure 228. RRefinery SSector OOver CCapacity(Thousand barrels/day)

74
In 2008, defense spending was $3.63 billion. The spending accounted for 38% of total federal fundingfor the state in that year. Procurement contracts account for about $2 billion or 55% of defense spend-ing with salaries and wages accounting for most of the balance. On a per capita basis, defense spend-ing was $3,847 compared to a national average of $1,148.
Military employment in Alaska peaked at 30,800 in 1992. However, some bases were downsizedsharply starting in the mid-1990s and real gross state product of the military sector is no larger nowthan it was in 1990. Military employment stood at 27,400 in 2008. There was a significant risk in 2005that Eielson Air Force Base would be closed under the Defense Department's Base Realignment andClosure Program, however the recommendation was changed. More recently the news has been posi-tive as the army has announced a 5-year plan to add soldiers at Fort Richardson and Fort Wainwright. Inaddition a new missile defense system was recently deployed to a number of sites in Alaska includingFort Greely in the Delta area.
Federal non-defense servicesare divided into three cate-gories—federal agencies likepostal services; services thatare related to transfer pay-ments to individuals and otherorganizations such as socialsecurity programs andMedicare; and services thatprovide capital and operatinggrants to state and local gov-ernment and non profit organi-zations, for example, for stateinfrastructure projects. In2008, non-defense federalspending in Alaska totaled$5.8 billion. The total civilianfederal payroll in the sameyear was $1.1 billion.
Transportation Sector
Alaska's transportation network is complex and unique compared to other parts of the country due toits size, geography and weather, and its isolation from the rest of the nation. Transportation is providedboth by private and by public sectors. Public sector transportation includes the high profile Alaska Ma-rine Highway System (AMHS) and the Alaska Railroad. The sector can be divided into 9 broadcategories—Air, Water, Trucking, Transit, Pipeline, Courier, Scenic and Sightseeing, Warehousing, Sup-port and Other. Air transport is the largest segment accounting for about one third of employment inthe industry in 2008. In the same year, trucking and courier segments accounted for 15% and 12% oftotal transportation employment, respectively. The Transit category is about 7% of industry employmentand includes bus companies, charter buses, special needs transportation, limousine services, and taxis.Water transport (not including the AMHS) accounts for about 4% of transportation employment inAlaska. Scenic and sightseeing transportation, 9% of the total, is oriented toward Alaska's visitor indus-try and includes bus tours and whale watching excursions.
A L A S K A F O R W A R D : P H A S E I S I T U A T I O N A L A N A L Y S I S
0
300
600
900
1,200
1,500
1,800
1990 1992 1994 1996 1998 2000 2002 2004 2006 2008 2010 2012 2014
History Forecast
Sources: BEA and IHS Global Insight
FFiigguurree 2299.. MMiilliittaarryy SSppeennddiinngg TTrreenndd(Real GSP, million 2000 US$)
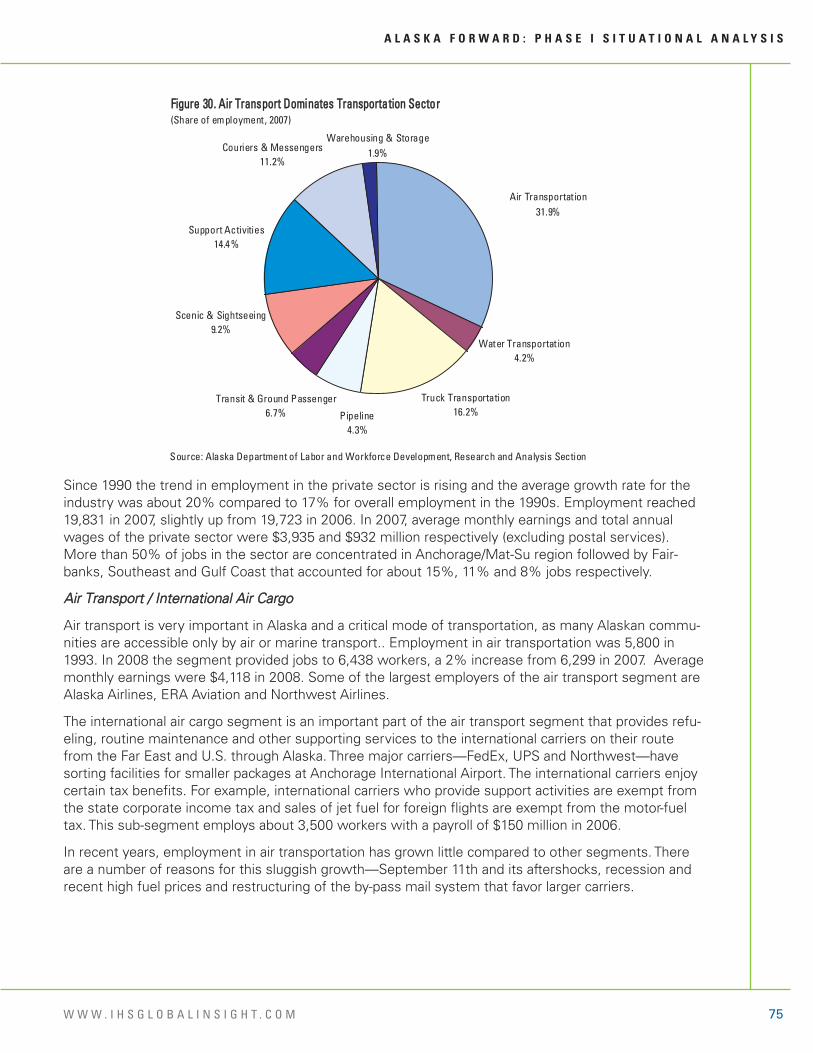
A L A S K A F O R W A R D : P H A S E I S I T U A T I O N A L A N A L Y S I S
W W W . I H S G L O B A L I N S I G H T . C O M 75
Since 1990 the trend in employment in the private sector is rising and the average growth rate for theindustry was about 20% compared to 17% for overall employment in the 1990s. Employment reached19,831 in 2007, slightly up from 19,723 in 2006. In 2007, average monthly earnings and total annualwages of the private sector were $3,935 and $932 million respectively (excluding postal services).More than 50% of jobs in the sector are concentrated in Anchorage/Mat-Su region followed by Fair-banks, Southeast and Gulf Coast that accounted for about 15%, 11% and 8% jobs respectively.
Air TTransport // IInternational AAir CCarggo
Air transport is very important in Alaska and a critical mode of transportation, as many Alaskan commu-nities are accessible only by air or marine transport.. Employment in air transportation was 5,800 in1993. In 2008 the segment provided jobs to 6,438 workers, a 2% increase from 6,299 in 2007. Averagemonthly earnings were $4,118 in 2008. Some of the largest employers of the air transport segment areAlaska Airlines, ERA Aviation and Northwest Airlines.
The international air cargo segment is an important part of the air transport segment that provides refu-eling, routine maintenance and other supporting services to the international carriers on their routefrom the Far East and U.S. through Alaska. Three major carriers—FedEx, UPS and Northwest—havesorting facilities for smaller packages at Anchorage International Airport. The international carriers enjoycertain tax benefits. For example, international carriers who provide support activities are exempt fromthe state corporate income tax and sales of jet fuel for foreign flights are exempt from the motor-fueltax. This sub-segment employs about 3,500 workers with a payroll of $150 million in 2006.
In recent years, employment in air transportation has grown little compared to other segments. Thereare a number of reasons for this sluggish growth—September 11th and its aftershocks, recession andrecent high fuel prices and restructuring of the by-pass mail system that favor larger carriers.
Water Transportation4.2%
Truck Transportation16.2%
Transit & Ground Passenger6.7%
Support Activities14.4%
Couriers & Messengers11.2%
Warehousing & Storage1.9%
Scenic & Sightseeing9.2%
Air Transportation31.9%
Pipeline4.3%
Source: Alaska Department of Labor and Workforce Development, Research and Analysis Section
Figure 330. AAir TTransport DDominates TTransportation SSector(Share of employment, 2007)

76
Truckingg
This sector represents the third largest segment of the state's transportation work force. However, theshare of trucking sector in total industry employment is relatively smaller than the nation's trucking in-dustry. This is because Alaska is not well connected by road, unlike other parts of the nation. Comparedto the continental United States where there is one mile of road per square mile of land area, Alaskahas a mile of road for every 42 square miles of land. Despite such smaller road network, there weremore than 11,000 commercial trucks of 12,000 pounds or greater registered in the state in 2003. In2008, the average monthly wage was $3,995. The sector employed 3,119 workers in the same year.
Water TTransportation
Water transportation is also a smaller sector in terms of employment but it handles the greatest ton-nage of freight coming into the state. The sector employed about 845 workers in 2008 in jobs like bargeoperators, and operators of tug boats, freighters, water taxis, lighterage and other services. The sec-tor's average monthly wage was $5,895 in 2008. Valdez is the state's leading port in terms of tonnage,with oil the major commodity. Anchorage is more diversified and handles 90% of all consumer goodssold in the Rail belt area of the state.
Pipeline
The pipeline segment has some of the highest paying jobs in the state but the employment in the seg-ment has been declining for more than a decade due to declining oil production and improvement intechnology. Alyeska Pipeline Service Company dominates employment in this field. Most of the sec-tor's jobs are concentrated in Valdez, Fairbanks, and Anchorage.
In 1978, the Trans Alaska Pipeline System (TAPS) started moving crude oil from Prudhoe Bay. Efforts toplan and build a gas pipeline are underway now. In August 2008, TransCanada Corporation (Tran-sCanada) was awarded a license to permit, develop, and build an Alaska natural gas pipeline from Prud-hoe Bay, Alaska, to the “lower-48 states.” The State of Alaska has committed $500 million toward the$30 billion construction project. The full capacity of the pipeline is expected to be 4.5 billion cubic feetper day.
Currently, there are four major gas line projects being actively promoted—two projects to transportAlaska North Slope (ANS) natural gas to the “lower-48 states,” the TransCanada project, and the Denaliproject. Denali is a joint venture between ConocoPhillips and BP and the project is being designed todeliver 4 billion cubic feet per day of gas from Alaska's North Slope to North American markets. For2009, the Denali Project is focused on providing the support necessary to meet a successful open sea-son commencing in 2010. In addition, to meet demand within the state, there is a proposed "bullet line"to South Central Alaska and an LNG project with a pipeline to Valdez.
The Alaska natural gas pipeline project has important implications for the state's economic healththrough construction job creation and revenue generation from production royalties. In addition, thepresence of a major interstate pipeline from the ANS to the “lower 48” would change the economicsfor many local energy markets within Alaska. For example, both TransCanada and Denali have agreed toprovide up to five delivery points within Alaska.
Railroads
There is one major railroad in operation in Alaska, the state-owned Alaska Railroad (ARR). The ARR playsan essential role in moving freight and materials such as coal, fuel, and gravel. In 2008, ARR moved 6.1million tons of freight. It also moved over 500,000 passengers. ARR employed 715 full-time workers in2008. Another railroad, located in Skagway, the White Pass & Yukon Route, serves the Southeast Alaskavisitor market with daily summertime excursions to the scenic White Pass Summit.
A L A S K A F O R W A R D : P H A S E I S I T U A T I O N A L A N A L Y S I S

A L A S K A F O R W A R D : P H A S E I S I T U A T I O N A L A N A L Y S I S
W W W . I H S G L O B A L I N S I G H T . C O M 77
Growth of Alaska's overalltransportation sector islinked to the health of theeconomy. Air cargo andtourism activities, which inrecent years have con-tributed to higher than aver-age growth in the sector'semployment, will continueto play key roles in the sec-tor's performance in the fu-ture. Other events such asmajor discoveries of new oilfields and construction ofpipeline can open up newpossibilities and boost theoverall growth.
Healthcare Sector
The healthcare industry is the fastest growing industry in Alaska. The industry now employs more work-ers than the construction sector and non-defense federal government combined. Over the period from1990 to 2008 the industry grew at a compound annual rate of 3.6%. Over the ten year period from1992 to 2002 healthcare employment increased by 62% which was three times faster than the statetotal over the same period. During this period there was an important shift from federal employment toprivate non-profit Native health care-related employment. In 2008 the industry employed about 27,128workers (excluding social assistance).
Some of the main healthcare providers in the state are Providence Health Systems in Alaska, BannerHealth Systems, Yukon Kuskokwim Health Corporation, Alaska Regional Hospital, Southcentral Founda-tion, Alaska Native Tribal Health Consortium, Southeast Alaska Regional Health Consortium, and Mani-laq Association.
Demographic trends are an important driver contributing to increased demand for medical and healthservices. Senior citizens put more demands on the healthcare sector and this part of the population isgrowing rapidly. In 2002 Alaska's 65-plus population accounted for only 6% of the state population com-pared to 12% for the rest of the nation. IHS Global Insight's population forecast is that the 65-plus pop-ulation will grow to 10% of the total population by 2013, thereby doubling the proportion of seniorcitizens in the total population. Alongside this population trend, the healthcare needs of Alaskans are in-creasingly being met by services offered within the state and fewer residents need to travel out of statefor a wide range of services.
In 2008, the share of employment in the outpatient healthcare segment was the highest at 41.6%, fol-lowed by hospitals at 27.6%, and nursing and social assistance 23.2% Nursing and residential care ac-counted for the remaining 7.6% of total employment.
44,,332255
55,,779955
44 ,,000022
11,,889911
22,,335511
22,,661166
33,,883388
55 ,,880022
33,,996655
33,,993355
0 1,000 2,000 3,000 4,000 5,000 6,000
Air Transportation
Water Transportation
Truck Transportation
Transit & Ground Passenger
Pipeline
Scenic & Sightseeing
Support Activit ies
Couriers & Messengers
Warehousing & Storage
Total Industry
Source: Alaska Department of Labor and Workforce Development, Research and Analysis Section
Figure 331. TTransportation SSector MMonthly WWages(Average monthly wages, 2007)

78
The overall demand for healthcare services is expected to rise significantly in the future. Over the pe-riod from 2008 to 2013, the healthcare and social assistance sectors combined is expected to register acompounded annual growth rate of 4.2%.
Mining Sector (Excluding Oil and Gas)
The mining sector in Alaska consists of hard rock mining (producing zinc, lead, gold and silver), coal andaggregates including sand, gravel and rocks. The Red Dog Mine and the Fort Knox Mine are the twolargest mines in the state. Red Dog is in fact the world's largest producer of zinc concentrate and it hasbeen in production since 1989. It also produces lead and silver. In 2008, the mine employed 485 work-ers. The Fort Knox Mine is the largest gold mine in the state and employed 450 workers in the sameyear. The other important mines include Greens Creek Mine (silver, zinc, gold and lead), Pogo (gold) andthe Usibelli Coal Mine. Major mine development projects include Kensington (gold, expected to startproduction in 2010), Donlin Creek (gold), Pebble (copper, gold and molybdenum) and Livengood (gold).
A L A S K A F O R W A R D : P H A S E I S I T U A T I O N A L A N A L Y S I S
Hospitals27 .6%
Nursing & Residential Care
7.6%
Social Assistance
23.2%
Out Patient Health Care
41.6%
Source: Alaska Department of Labor and Workforce Development, Research and Analys is Section
Figure 332. HHealthcare CComposition(Share of employment, 2007)
3,510
4 ,207
2,268
1,993
3,257
0 1,000 2,000 3,000 4,000 5,000
Out Patient Health Care
Hospitals
Nursing & Residential Care
Social Assistance
Total Industry
Source: Alaska Department of Labor and Workforce Development, Research and Analys is Section
FFiigguurree 3333.. HHeeaalltthhccaarree SSeeccttoorr WWaaggeess(Average monthly wages, 2007)
0
400
800
1,200
1,600
2,000
2,400
2,800
3,200
3,600
1990 1992 1994 1996 1998 2000 2002 2004 2006 2008 2010 2012 2014 2016 2018
History Forecast
Sources: BEA and IHS Global Insight
FFiigguurree 3344.. HHeeaalltthhccaarree SSeeccttoorr EExxppaannssiioonn(Real GSP, million 2000 US$)
A L A S K A F O R W A R D : P H A S E I S I T U A T I O N A L A N A L Y S I S
W W W . I H S G L O B A L I N S I G H T . C O M 79
Alaska's mining sector real gross state product in 2008 was $4.73 billion. In 2008 zinc production to-taled 626,000 tons while gold production was 797,000 ounces and coal production was 1.5 million tons.In 2008, the industry directly employed 3,500 workers. The industry also paid $330 million in royalties toproperty owners, taxes and related payments to government in 2008.
Exploration and development activities have been spurred by higher commodity and metal prices. In2008 the industry spent $328 million on exploration and $380 million on mine development. The miningindustry is also a strong contributor to exports—34% of the state's total exports in terms of value.
Mining in remote regions of Alaska has statewide economic benefits. For example, the Red Dog minepays royalties to NANA Regional Corporation, and under the terms of the Alaska Native Claims Settle-ment Act, shares 70% of those royalties among all regional Native corporations. Mining companiesmade $212 million in payments to ANCSA corporations in 2008.
Travel and Tourism Sector
Though the travel and tourism industry suffered declines in 2009, over the long-term the industry hasbeen a growing part of the Alaska economy. About 90% of Alaska's visitors come during the summermonths. Approximately one million cruise-ship passengers comprise the largest share of visitors. Mostother visitors arrive by air, with smaller numbers driving or taking the ferry. Several international cruise-ship companies—Carnival (including Holland America and Princess Cruise Lines subsidiaries) and Nor-wegian Cruise Line—dominate the large cruise-ship business in the state.
Properly gauging the size of the sector is difficult because it spans several industries including trans-portation (air, land and sea), traveler accommodation, entertainment, retail, food and beverage. To sizethe travel and tourism industry, IHS Global Insight used a Tourism Satellite Account (TSA) approach in itsstudy done in 2004 and found that travel and tourism has helped to diversify the Alaska economy andhas been an engine of growth for the Alaska economy. Its economic contribution expanded by 38%from 1998 to 2002.
The study defines a concept called 'core' travel and tourism which allows comparisons to other indus-tries in the state. Travel and tourism's core industry (only the direct impact of end-providers of goodsand services to travelers) generated $856 million in local value added in 2002—3% of gross state prod-uct. The study ranked travel and tourism as the seventh-largest private sector industry in the state interms of value added and the third-largest private sector employer with 26,158 direct full-time equiva-lent jobs in 2002; about 9% of total state employment. The study also found that travel and tourism is avaluable source of revenues for the state and local governments of Alaska. In 2002, $152.4 million instate and local tax revenue was generated by the travel and tourism sector in Alaska.
More recently, a 2006 study by McDowell Group found that non-resident visitors spent $1.7 billion inAlaska during the 2006-07 visitor year (May 06 through April 07). That included $1.5 billion in spendingby summer visitors and about $200 million in off-season visitor spending. A 2008 McDowell Groupstudy found that the cruise component of the visitor industry generated the annual equivalent of 14,500jobs and $565 million in annual payroll. The industry accounted for $100 million in state and local gov-ernment taxes and fees in 2007.
The leisure and hospitality industry is the closest proxy to travel and tourism. Over the last two decadesthe real GSP of this industry expanded at a 1.3% compounded annual rate. Our expectation is that thisindustry will continue to grow at a rate in excess of the state average. Alaska's visitor industry experi-enced a decline in 2009, with a further decline expected in 2010. Over the long term the industry is ex-pected to resume its growth track.
80
Seafood Processing Sector
Seafood processing is one of Alaska's oldest industries. The first commercial fish cannery was openedin 1878. It is the largest manufacturing industry in Alaska—representing nearly half of Alaska's manufac-tured output. Seafood is also Alaska's top international export.
Next to the tourism sector, fish processing is Alaska's most seasonal industry. In some years, state-wideemployment in processing varies by more than four-fold from the peak month to the trough. In 2007 theindustry's 21,356 workers earned $305.5 million in wages. The seasonality of the industry also attractslarge numbers of nonresident workers—in 2007 they represented 75% of total employment.
The number of establishments has not changed much over the last 10 years. In 2008 there were 138establishments. Trident Seafoods is the largest employer with over 4,500 workers. Icicle Seafoods hasover 2,250 workers while Ocean Beauty Seafoods, Peter Pan Seafoods, Unisea and WestwardSeafoods all have over 1,000 workers.
A study conducted for the Alaska Fisheries Science Center in 2006 used a social accounting matrix modelto determine that the seafood processing industry contributed 4.5% of the state's total employment. Thestudy also found that the industry has the smallest economic multiplier mainly due to a large leakage oflabor earnings (due to non-resident workers) and a large share of imported intermediate inputs.
Seafood processing dominates the manufacturing industry in Alaska and this industry has been trend-ing downward over the last 20 years. The compound annual growth rate since 1990 has been -2.2% andit contributed only 2% of real gross state product in 2008. The manufacturing industry is expected tocontract by 6% in 2009 and some very moderate growth is expected in 2010 and 2011. We expect theindustry's output to be no larger in 2013 than it was in 2008. Four major factors constrain growth in theshort run: inherent limits to the size of the wild seafood harvest in Alaska, competition from farmedseafood, competition from processing industries in regions with low labor cost, and relatively stagnantworld markets.
Commercial Fisheries
The commercial fishery in Alaska is large. In a given year it generates about half of the total U.S. com-mercial fishing harvest by weight. Dutch Harbor/Unalaska, Kodiak and Sitka are the top ranked fisheryports in Alaska. Dutch Harbor/Unalaska is the largest fishery port in the country. The value-added of theindustry can fluctuate sharply from year to year and in general, its contribution to the state economyhas been declining. The Alaska Community Development Quota program is a unique mechanismwhereby 65 historical fishing communities share ownership in a portion of certain federal fisheries. To-gether, the six CDQ entities representing the communities held assets of $416 million in 2005.
In 2008 the estimated gross earnings of Alaska's fisheries was $1.7 billion based on almost 3 billionlanded pounds of fish. Gross earnings were up about $200 million from 2007. In terms of landing val-ues, Alaska's seafood industry has enjoyed six consecutive years of growth, from $800 million in 2002to $1.7 billion in 2008. The fishery has evolved over the years. In the past it was the salmon fishery thatmade the largest contribution to ex-vessel values. In recent years, however, ground fish accounted forabout 50% while shellfish, salmon and halibut were about 15% each of ex-vessel values.
Alaska is recognized as having among the best managed fisheries in the world. Entry into most state-controlled fisheries is limited by permit. Federally controlled fisheries are regulated by harvest quotasystems. Harvesting employment consists almost entirely of independent contractors.64 It is very diffi-cult to quantify industry employment, data is limited to the number of fishing permit holders and fishingboat crew license holders—20,500 permits were issued in 2008.
A L A S K A F O R W A R D : P H A S E I S I T U A T I O N A L A N A L Y S I S
64 Employment falls under 1099 income tax regulations.

A L A S K A F O R W A R D : P H A S E I S I T U A T I O N A L A N A L Y S I S
W W W . I H S G L O B A L I N S I G H T . C O M 81
The industry is very seasonal. According to the Alaska Department of Labor and Workforce Develop-ment the average monthly fish-harvesting job-count was 7,500, with a peak in the summer of more than20,000. This number fell sharply from 2000 to 2002 but has been nearly constant since then. Thesalmon fisheries account for half of all seafood harvesting employment. The seasonality of the seafoodindustry fits many rural Alaska lifestyles and also attracts large numbers of nonresident workers. TheAlaska Department of Labor and Workforce Development estimates that at least 54,000 people wereinvolved in commercial fishing and processing at some time in 2007.
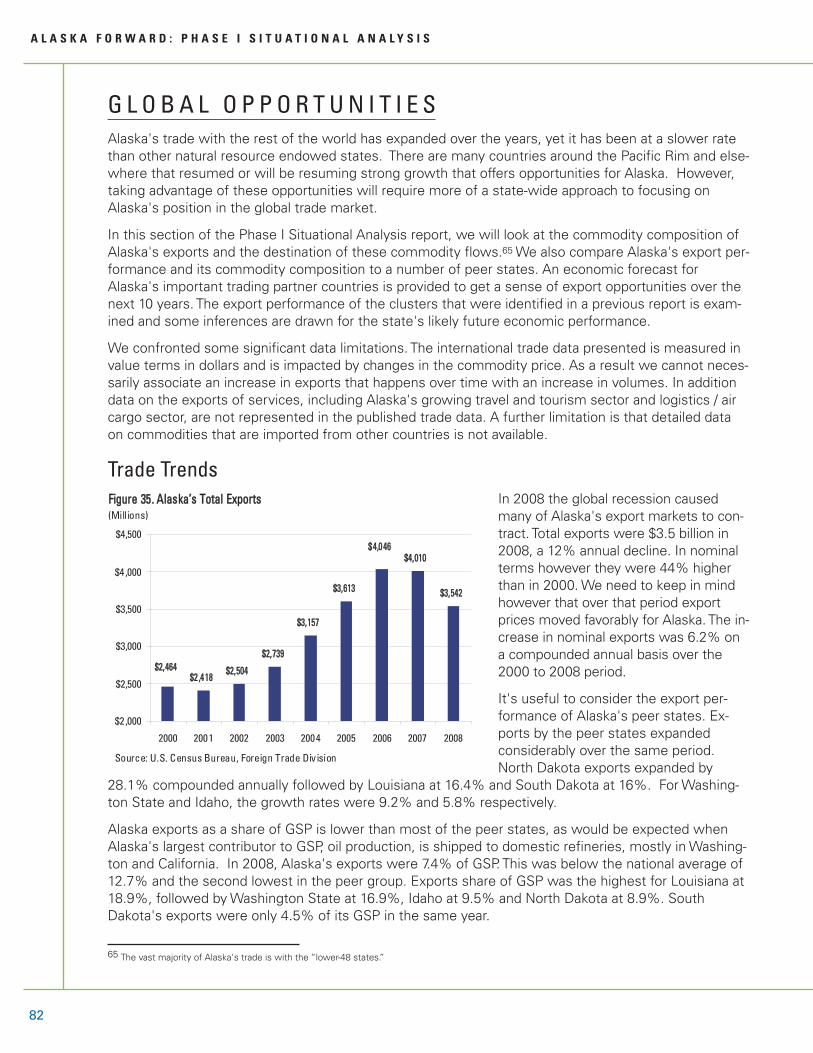
82
G L O B A L O P P O R T U N I T I E S Alaska's trade with the rest of the world has expanded over the years, yet it has been at a slower ratethan other natural resource endowed states. There are many countries around the Pacific Rim and else-where that resumed or will be resuming strong growth that offers opportunities for Alaska. However,taking advantage of these opportunities will require more of a state-wide approach to focusing onAlaska's position in the global trade market.
In this section of the Phase I Situational Analysis report, we will look at the commodity composition ofAlaska's exports and the destination of these commodity flows.65 We also compare Alaska's export per-formance and its commodity composition to a number of peer states. An economic forecast forAlaska's important trading partner countries is provided to get a sense of export opportunities over thenext 10 years. The export performance of the clusters that were identified in a previous report is exam-ined and some inferences are drawn for the state's likely future economic performance.
We confronted some significant data limitations. The international trade data presented is measured invalue terms in dollars and is impacted by changes in the commodity price. As a result we cannot neces-sarily associate an increase in exports that happens over time with an increase in volumes. In additiondata on the exports of services, including Alaska's growing travel and tourism sector and logistics / aircargo sector, are not represented in the published trade data. A further limitation is that detailed dataon commodities that are imported from other countries is not available.
Trade Trends In 2008 the global recession causedmany of Alaska's export markets to con-tract. Total exports were $3.5 billion in2008, a 12% annual decline. In nominalterms however they were 44% higherthan in 2000. We need to keep in mindhowever that over that period exportprices moved favorably for Alaska. The in-crease in nominal exports was 6.2% ona compounded annual basis over the2000 to 2008 period.
It's useful to consider the export per-formance of Alaska's peer states. Ex-ports by the peer states expandedconsiderably over the same period.North Dakota exports expanded by
28.1% compounded annually followed by Louisiana at 16.4% and South Dakota at 16%. For Washing-ton State and Idaho, the growth rates were 9.2% and 5.8% respectively.
Alaska exports as a share of GSP is lower than most of the peer states, as would be expected whenAlaska's largest contributor to GSP, oil production, is shipped to domestic refineries, mostly in Washing-ton and California. In 2008, Alaska's exports were 7.4% of GSP. This was below the national average of12.7% and the second lowest in the peer group. Exports share of GSP was the highest for Louisiana at18.9%, followed by Washington State at 16.9%, Idaho at 9.5% and North Dakota at 8.9%. SouthDakota's exports were only 4.5% of its GSP in the same year.
A L A S K A F O R W A R D : P H A S E I S I T U A T I O N A L A N A L Y S I S
65 The vast majority of Alaska's trade is with the “lower-48 states.”
$2 ,418$2,504
$2,739
$3,157
$3,613
$4,010
$3,542
$2,464
$4,046
$2 ,000
$2,500
$3,000
$3,500
$4 ,000
$4,500
2000 2001 2002 2003 2004 2005 2006 2007 2008
FFiigguurree 3355.. AAllaasskkaa’’ss TToottaall EExxppoorrttss(Millions)
Source: U.S. Census Bureau, Foreign Trade Div ision

A L A S K A F O R W A R D : P H A S E I S I T U A T I O N A L A N A L Y S I S
W W W . I H S G L O B A L I N S I G H T . C O M 83
Commodity Composition of Alaska’s Exports The pattern of trade between countriesis tied to comparative advantage. Com-parative advantage can result from a va-riety of sources—factor abundance isone of these. Natural resources areabundant in Alaska which explainsAlaska's large trade surplus in the ex-port of processed fish, oil and gas andvarious base and precious metals.
In 2008 fishing, hunting and trapping66
accounted for the highest share of thetotal exports at 50.6%. Mining and oiland gas extraction were the next high-est, occupying 20.2% and 8.6%shares of total exports respectively.These three industries together gener-ated almost 80% of international ex-ports. Transportation equipment,primary metals and petroleum and coalcontributed significantly to exports.
Comparison to Peer StatesThe commodity composition of exports by the peer states is considerably different than Alaska's. Idahoand South Dakota have computer and electronic products as their top exports, occupying 58.6% and30.7% share of states' total exports respectively in 2008. North Dakota and Washington State have ma-chinery manufacture (42.7%) and transportation equipment (41.1%) respectively as the top exportsproducts in the same year. The composition of Louisiana's exports is more similar to Alaska. In 2008crop production generated 37.7% of total exports and petroleum and coal products were 23.9% of ex-
6.2% 5.8%
16.4% 17.1%16.0%
9.2%
13.6%
28.1%
0%
5%
10%
15%
20%
25%
30%
Alaska Idaho Louisiana MontanaNorth Dakota
South DakotaWashington State Wyoming
Expo
rts GG
rowr
h ((CA
GR, 22
000-
008)
FFiigguurree 3366.. EExxppoorrtt PPeerrffoommaannccee ooff PPeeeerr SSttaatteess
Source: U.S. Census Bureau, Foreign Trade Division
Forestry and Logging, 2.3% Other, 4.0%Petroleum and Coal
Products, 4.1%
Fishing, Hunting and Trapping, 50.6%
Primary Metal Manufacturer, 4 .2%
Oil and Gas Extraction, 8.6%
Transportation Equipment, 6.0%
Mining, 20.2%
Figure 337. AAlaska’s EExports iin 22008
Source: U.S. Census Bureau, Foreign Trade Division
66 This category is dominated by fish and processed seafood.

84
ports. The higher value added chemical manufacturing industry in Louisiana contributed an important16.9% of exports in 2008. In Wyoming chemical manufactures represented 73% of exports in 2008.
Alaska’s Trading PartnersAlaska's main international trading partners include Japan, China, Canada, South Korea and Germany.Minor trading partners include Switzerland, Taiwan, Netherlands, Portugal, France and Belgium. In 2008,29.7% of Alaska's exports were destined to Japan, followed by 20.7% to China and about 10% toCanada and South Korea.
A L A S K A F O R W A R D : P H A S E I S I T U A T I O N A L A N A L Y S I S
Ta b l e 7 . To p - F i v e E x p o r t s , 2 0 0 8 — A l a s k a a n d P e e r S t a t e s
A l a s k a I d a h o L o u i s i a n a M o n t a n a
Fishing and Seafood Processing (50.6%)
Mining (20.2%)
Oil and Gas Extraction (8.6%)
Transportation Equipment(6%)
Primary Metal Manufactures(4.2%)
Computer and ElectronicProducts (58.6%)
Processed Foods (9.3%)
Chemical Manufactures(5.2%)
Paper Products (4.6%)
Transportation Equipments(4.4%)
Crop Production (37.7%)
Petroleum and Coal Products(23.9%)
Chemical Manufactures(16.9%)
Processed Foods (8.9%)
Machinery Manufactures(3.0%)
Chemical Manufactures(25.3%)
Mining (15.8%)
Machinery Manufactures(13.3%)
Transportation Equipment(10.9%)
Primary Metal Manufactures(8.2%)
N o r t h D a k o t a S o u t h D a k o t a W a s h i n g t o n S t a t e W y o m i n g
Machinery Manufactures(42.7%)
Crop Production (22.1%)
Transportation Equipment(8.4%)
Processed Foods (7.9%)
Oil and Gas Extraction (7.5%)
Computer and ElectronicProducts (30.7%)
Processed Foods (21.0%)
Machinery Manufactures(15.7%)
Beverage & Tobacco Products(7.2%)
Transportation Equipment(5.7%)
Transportation Equipment(41.1%)
Crop Production (20.9%)
Computer and ElectronicProducts (5.9%)
Processed Foods (4.9%)
Petroleum and Coal Products(4.9%)
Chemical Manufactures(73.1%)
Oil & Gas Extraction (7.4%)
Machinery Manufactures(6.6%)
Mining (5.4%)
Fabricated Metal Products(1.2%)
Note: number in parenthesis is the share in total exportsSource: U.S. Census Bureau, Foreign Trade Division
Taiwan, 3.1%
Netherlands, 3.0%
Portugal, 1.7%
Switzerland, 4.2%
Japan, 29.7%
Germany, 5.9%
Canada, 10.5%
South Korea, 10.3% China, 20.7%
France, 1.2%Other, 8.8%Belgium, 1.0%
Figure 338. AAlaska’s TTrading PPartners, 22008
Source: U.S. Census Bureau, Foreign Trade Division
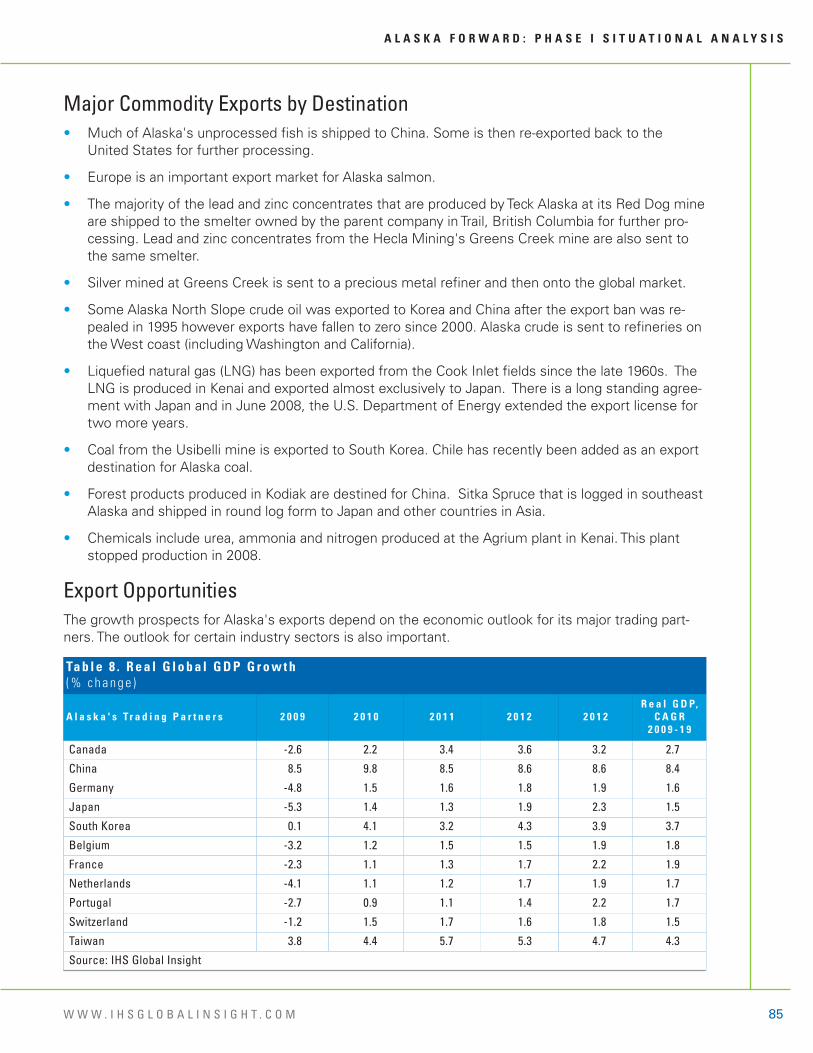
A L A S K A F O R W A R D : P H A S E I S I T U A T I O N A L A N A L Y S I S
W W W . I H S G L O B A L I N S I G H T . C O M 85
Major Commodity Exports by Destination• Much of Alaska's unprocessed fish is shipped to China. Some is then re-exported back to the
United States for further processing.
• Europe is an important export market for Alaska salmon.
• The majority of the lead and zinc concentrates that are produced by Teck Alaska at its Red Dog mineare shipped to the smelter owned by the parent company in Trail, British Columbia for further pro-cessing. Lead and zinc concentrates from the Hecla Mining's Greens Creek mine are also sent tothe same smelter.
• Silver mined at Greens Creek is sent to a precious metal refiner and then onto the global market.
• Some Alaska North Slope crude oil was exported to Korea and China after the export ban was re-pealed in 1995 however exports have fallen to zero since 2000. Alaska crude is sent to refineries onthe West coast (including Washington and California).
• Liquefied natural gas (LNG) has been exported from the Cook Inlet fields since the late 1960s. TheLNG is produced in Kenai and exported almost exclusively to Japan. There is a long standing agree-ment with Japan and in June 2008, the U.S. Department of Energy extended the export license fortwo more years.
• Coal from the Usibelli mine is exported to South Korea. Chile has recently been added as an exportdestination for Alaska coal.
• Forest products produced in Kodiak are destined for China. Sitka Spruce that is logged in southeastAlaska and shipped in round log form to Japan and other countries in Asia.
• Chemicals include urea, ammonia and nitrogen produced at the Agrium plant in Kenai. This plantstopped production in 2008.
Export OpportunitiesThe growth prospects for Alaska's exports depend on the economic outlook for its major trading part-ners. The outlook for certain industry sectors is also important.
Ta b l e 8 . R e a l G l o b a l G D P G r o w t h( % c h a n g e )
A l a s k a ' s Tr a d i n g P a r t n e r s 2 0 0 9 2 0 1 0 2 0 1 1 2 0 1 2 2 0 1 2R e a l G D P,
C A G R 2 0 0 9 - 1 9
Canada -2.6 2.2 3.4 3.6 3.2 2.7
China 8.5 9.8 8.5 8.6 8.6 8.4
Germany -4.8 1.5 1.6 1.8 1.9 1.6
Japan -5.3 1.4 1.3 1.9 2.3 1.5
South Korea 0.1 4.1 3.2 4.3 3.9 3.7
Belgium -3.2 1.2 1.5 1.5 1.9 1.8
France -2.3 1.1 1.3 1.7 2.2 1.9
Netherlands -4.1 1.1 1.2 1.7 1.9 1.7
Portugal -2.7 0.9 1.1 1.4 2.2 1.7
Switzerland -1.2 1.5 1.7 1.6 1.8 1.5
Taiwan 3.8 4.4 5.7 5.3 4.7 4.3
Source: IHS Global Insight

86
Real GDP contracted in most of Alaska's export markets in 2009 however China and South Korea man-aged to avert a recession. As the world economy recovers from recession demand for Alaska's key ex-ports will revive. The recovery patterns differ significantly across the countries. China will be leading therecovery with real GDP growth forecast of 9.8% for 2010. For Germany and Japan real GDP growth isexpected to stay below 2% until 2012.
China Outlook
The government's massive fiscal and monetary stimulus measures were effective—the economyaverted recession. China's real GDP is expected to grow at around 8% in 2009. The growth in fixed in-vestment and industrial production has rebounded but consumer demand has not picked up significantmomentum and export demand still remains depressed. A robust recovery cannot be achieved withouta significant rebound in consumer demand and exports. Consumer demand is structurally weak in Chinabecause of lack of social safety net and a state-controlled banking system. There does not seem to bean easy fix to sluggish consumer demand but the government has initiated some policy measures in-cluding taxes and subsidies to revive China's auto market earlier in 2009. These measures have re-ceived positive reactions from consumers and automakers. In 2009, total vehicle production isexpected to grow by 24% to 11.77 million units. China is likely to overtake both Japan and the UnitedStates to become the largest vehicle production base in the world in 2009.
China's exports account for about one third of its GDP and they are facing the most severe demandconditions in the last 30 years. Consumer spending in the United States and Western European coun-tries has been hit hard in the current recession. The United States, Western Europe, and Asia combinedtogether account for more than 70% of China's export market. Given the importance of exports inChina's growth prospects, the government will utilize all policy tools to slow the downfall in the exportsector. Not surprisingly the monetary authorities have not allowed the currency to appreciate.
Despite all economic stimulus measures, risks to economic growth in the medium-term outlook cannotbe overlooked. This is because the government does not have unlimited fiscal ammunition and if exter-nal demand recession remain severe and prolonged, China's economic rebound cannot be sustained bypolicy stimulus alone. Over the next ten years we expect growth in real GDP of 8.5% compounded an-nually.
China's currency has appreciated by 21% against the U.S. dollar since 2005 and there is still consider-able pressure for further appreciation. Our expectation is that China's imports of consumer goods willremain sluggish. China's domestic market is nonetheless a massive one and will remain important forAlaska's seafood exports.
A L A S K A F O R W A R D : P H A S E I S I T U A T I O N A L A N A L Y S I S
Ta b l e 9 . E x c h a n g e R a t e F o r e c a s t( L C U * p e r U S $ )
2 0 0 9 2 0 1 0 2 0 1 1 2 0 1 2 2 0 1 3 2 0 1 4 2 0 1 5 2 0 1 6 2 0 1 7 2 0 1 8 2 0 1 9
Canada(Canadian dollar) 1.15 1.16 1.17 1.18 1.19 1.20 1.21 1.21 1.21 1.21 1.21
China (Renminbi) 3.68 3.66 3.70 3.76 3.80 3.85 3.92 3.98 4.05 4.12 4.18
Germany (Euro) 0.67 0.70 0.69 0.69 0.68 0.68 0.67 0.66 0.65 0.64 0.63
Japan (Yen) 9.82 90.83 89.07 88.53 88.27 88.10 87.96 87.89 87.87 87.88 87.89
South Korea(Won) 1,168.32 1,051.32 982.71 976.48 977.50 979.35 981.71 983.94 985.62 986.79 987.92
*LCU=Local Currency UnitSource: IHS Global Insight
A L A S K A F O R W A R D : P H A S E I S I T U A T I O N A L A N A L Y S I S
W W W . I H S G L O B A L I N S I G H T . C O M 87
Japan Outlook
Japan is in its worst economic downturn in more than 30 years. Real GDP fell for four consecutive quar-ters through the first quarter of 2009. Japan is an export-oriented economy and slow recovery in Eu-rope and the United States will constrain export demand. Domestic demand remains depressedbecause of low consumer confidence which has caused Japan's thrifty households to save even morethan normal. The recovery will be slow and will not happen until other developed economies recover in2009-10.
Our medium- to long-term forecast for Japan envisions slowing growth as demographic changes anddeclining productivity growth conspire to dampen the economy's potential. There will be a decreasingnumber of people in the important 15-65 year age bracket and this will cause labor force growth to flat-ten and then decline. Japanese manufacturers will find it increasingly difficult to squeeze more outputfrom a limited number of employees. The real exchange rate, which factors in price changes in Japanand its trading partners, has been weakening over the long term by over 2% per year. The main problemfor exports is the decline in overseas demand for some of Japan's key export commodities. As theeconomy contracted last year, yen followed. The factors that lead to its weakening—high savings, highliquidity, and low interest rates—are still in effect.
Over the next ten years IHS Global Insight forecasts compounded annual growth in real GDP of just1.4%—a relatively slow growing market for Alaska's LNG.
South Korea Outlook
The South Korean government's stimulus package and policy interventions in the current recessionhave been effective in mollifying the worst effects of the global downturn. In 2010 South Korea will beone of the first major economies to emerge from the shadow of the global downturn. Consumer spend-ing will be weak however in light of higher unemployment, exports will grow slowly in tandem with thesluggish overseas economies, and capital expenditures will be limited by ongoing excess capacity.
For more than a decade the South Korean economy has benefited from the combination of relativelylow wages and high efficiency. This has generated an export boom and a rising standard of living. Koreawill soon face rising competition from lower wage countries. In the past the country has been knownfor export success and large current-account surpluses in 2008 however Korea ran external deficits asoil prices rose sharply. The outlook for exports growth is weak due to sluggish overseas demand. Thispoor performance will be moderated to a degree by the weakness of the won.
Similar to China and Japan, the government in South Korea has also introduced a sophisticated automo-tive market stimulus programs comprising several specific schemes, tax benefits and subsidies. Thesemeasures have been effective in restoring life to domestic vehicle sales. Over the next ten yearsgrowth in real GDP will average 3.9% compounded annually. Growing demand for energy means thatSouth Korea will continue to be a strong destination market for Alaska's coal exports.
Canada Outlook
The Canadian economy contracted around 2.6% in 2009 despite significant federal government stimu-lus. The weakness in U.S. growth, coupled with lagged effects of the Canadian dollar's strength, willcause net exports to obstruct Canada's economic performance. Export volumes fell significantly in realterms in 2008 and will continue to drop in 2009. IHS Global Insight expects the Canadian dollar to re-main slightly below par over the medium term. A favorable move in commodity prices (especially en-ergy commodity prices) and significant increase in U.S. debt levels will add some further upside to theCanadian dollar over the medium term.

88
Consumer spending on auto has been hit the hardest in the current recession and stabilization in em-ployment and a bigger bounce in consumer confidence are not expected until 2011. Over the next tenyears real GDP growth is expected to be 2.7% compounded annually.
Germany Outlook
IHS Global Insight expects the German economy to show at least a temporary rebound in comingmonths as replenishment of stocks and a sharp swing of net exports boost GDP. Consumer spendinggrowth improved somewhat in this year but is expected to relapse in 2010. German exporting firmshave made considerable progress in regaining competitiveness since 2002, lowering their cost baseand improving productivity. The structural competitiveness of German exporters' will help in the currentdemand rebound. However, the recovery will be restrained by persisting banking sector woes amidworsening credit quality of non-financial firms, and an unavoidable further increase in unemployment.Similar concerns about creditworthiness of other European countries over the medium term will likelyput pressure on the Euro. We expect the euro to trade around US$1.50 in the near term and it will trendmodestly lower through 2010 before making renewed gains in 2011.
Over the next ten years real GDP growth will average only 1.4% compounded annually. Alaskan seafoodproducers will have to focus on gaining market share in Western Europe and Germany in particular.
What About Alaska’s Imports?Data on imports at the state level is limited and we were unable to obtain much commodity detail. In2007 Alaska imported $87 million of petroleum and coal products and $122 million of machinery andequipment from Canada. These imports are a leakage from the local economy and reduce the economicimpact of the oil and gas cluster on other industries in the state. The indirect economic impact of thisimportant cluster could be increased if these goods were produced locally. Unfortunately producers ofgoods for the local market have experienced limited growth in Alaska. Local production is hindered bythe fact that Alaska is underserved in certain support sectors. It's important to be mindful of the impactof the exchange rate on import costs. The general trend is towards continuing U.S. dollar depreciationand imports from countries like Canada, Japan and China will become more expensive in the future. Animport substitution policy could be very effective if the trend in the exchange rate persists.
Research by the UAA Institute of Social and Economic Research found that the development of the sup-port sector has been hamstrung by the state's small market size and high cost of business. Their re-search suggested that the support sector might be responsive to economic development policy. Theexpansion of local support sector is a strategy of "import substitution." The most effective type of importsubstitution for Alaska would be to develop support sector for the fast growing star and opportunityclusters. Financial services as well as business and professional services are important support sectorsfor all of Alaska's clusters.
A L A S K A F O R W A R D : P H A S E I S I T U A T I O N A L A N A L Y S I S

A L A S K A F O R W A R D : P H A S E I S I T U A T I O N A L A N A L Y S I S
W W W . I H S G L O B A L I N S I G H T . C O M 89
A L A S K A ' S I N D U S T R Y C L U S T E R SIn this section the consulting team has employed a cluster identification and segmentation methodol-ogy and found there to be 11 established clusters in Alaska. The state's traditional engines of growthare: oil and gas extraction / pipelines / refinery, mining, fishing and seafood processing, travel andtourism and the military. Forestry and wood products is a cluster that is in significant decline but thereare a number of dynamic clusters which include: logistics and international trade, advanced businessservices, specialized machinery / capital goods and community and social services. There are also anumber of pre-clusters (or seed clusters) identified including: cold climate technology, rocket launchtechnology, cold climate housing and others.
A Cluster-Based Economic Development ApproachClusters are geographically concentrated cooperation networks of interdependent firms, research anddevelopment institutions, and other intermediary actors (such as universities, economic or regional de-velopment agencies, chambers, etc.), where the close contacts of the members and the continuous,fast knowledge exchange between them contribute to the competitive increase of both the membersand the whole region. Industry clustering is a powerful framework for regional economic developmentbecause it captures economic relationships among specific industry sub-sectors, and it provides a setof tools to help define economic development strategies.
In a cluster, firms and others within a concentrated geographical area are cooperating toward commongoals, and establishing close linkages and working alliances to improve their collective competitiveness.An active clustering agenda facilitates the integration of what would otherwise be a clump of co-locatedfirms and organizations into a high performance system. Optimization is at a system, rather than individ-ual organization level. An active local cluster includes firms and support organizations working togetherto achieve results that would not be possible individually.
A key component of any high performance cluster is extensive informal and formal networking betweenfirms—even competitors—across the cluster, and between firms and their supporting infrastructure.Soft networks (such as local professional and trade associations) and hard networks (strategic alliancesbetween firms) are both important, and their development is supported by a local culture that enablesboth competition and cooperation to thrive. Active clustering is "co-opetition," a combination of competi-tion and cooperation that is more sophisticated than most notions of rivalry within an industry, andmore appropriately captures the nuances of company interactions within a region. Companies in clusterworking groups, as implemented in the Prosperity Partnership, often begin to see that firms once con-sidered direct competitors are actually in slightly different market niches, and that many opportunitiesfor joint effort exist, even while rivalry in some dimensions continue.
Every jurisdiction whether it is a nation, state or region has a set of unique local conditions that under-pin the ability of its companies to compete in an industry. The competitive advantage of a location doesnot normally arise in isolated companies but in clusters of companies. These firms are in the same orrelated field, or are linked by buyer-seller relationships, common customers, or other relationships. Anindustry cluster is a group of companies that rely on an active set of relationships among themselvesfor individual efficiency and competitiveness. These relationships have four prominent characteristics:
1. Buyer-Supplier Relationships. Core companies produce goods and services that are sold to finalconsumers, generally exported outside the region.
2. Competitor and Collaborator Relationships. Companies produce the same or similar goods andservices at a specific level in the value chain.

90
3. Shared-Resource Relationships. These relationships exist when firms rely on the same sources ofraw materials, technology, human resources and information, even though they may use these re-sources to produce goods and services for very different markets.
4. Critical Mass of Competitiveness Factors. Critical masses of information, skills, relationships, andinfrastructure accrued in a particular field.
One of the central tenets of the cluster-based model of economic development is that the most eco-nomically successful regions have managed to knit together companies, teaching and research institu-tions, and government at multiple levels to create a uniquely competitive industry. Professor MichaelPorter of Harvard Business School introduced the concept of "institutions for collaboration" to representthe myriad public, private, and quasi-public entities that are the glue that effectively binds the cluster to-gether.
Competitive advantage is not created within a single firm alone. Efficiency in internal operations is anecessary but not sufficient condition to compete globally. Factors external to the business, but internalto the regional economic foundation, are increasingly important for the creation of competitive advan-tage. Each firm is part of a "cluster" of interrelated firms, suppliers, customers, and service providers, aswell as supporting organizations (human resources, R&D, finance, infrastructure, and regulatory envi-ronment).
According to Porter, clusters increase productivity and efficiency by providing:
• Efficient access to specialized inputs, services, employees, information, institutions and "publicgoods" (e.g., training programs)
• Ease of coordination and transactions across firms
• Rapid diffusion of best practices
• Ongoing, visible performance comparisons and strong incentives to improve vs. rivals
Clusters stimulate and enable innovations by:
• Enhancing ability to perceive opportunities for innovation
• Improving the presence of multiple suppliers and institutions to assist knowledge creation
• Easing experimentation given locally available resources
Clusters facilitate commercialization:
• Opportunities for new companies and new lines of established business are more apparent
• Commercialization of new products and starting new companies is easier because of availableskills, suppliers, etc.
Cluster Identification and AnalysisOverview and Methodology
This section presents IHS Global Insight's analysis of Alaska's portfolio of industry clusters. It beginswith a description of the methodology used to identify the region's clusters, proceeds to a descriptionof the clusters identified, and then presents a way of segmenting the region's cluster portfolio to guideappropriate development strategies.
A L A S K A F O R W A R D : P H A S E I S I T U A T I O N A L A N A L Y S I S

A L A S K A F O R W A R D : P H A S E I S I T U A T I O N A L A N A L Y S I S
W W W . I H S G L O B A L I N S I G H T . C O M 91
Data Sources and Methodology
The process of identifying Alaska's clusters begins with the iterative analysis of detailed sector data, in-cluding employment, wages, productivity and sales. Our Business Market Insight (BMI) database andthe U.S. Census' County Business Patterns database together form the key data sources, but special-ized company databases are also used. Key indicators are evaluated to select and group industries thatare defined by industry classifications. The process is illustrated in the figure below.
Figure 339. CCluster IIndentification PProcess
It is important to note that not all industries will be part of a cluster—nor should they be. Clusters areimportant for their ability to drive economic growth in a region. To that end, they all have the characteris-tic that they can or do export goods and services outside of the region in which they exist. In all re-gions, several large industries are primarily local-serving. Education, health services, governmentservices, and local business and personal services are important industries, and are often some of thelargest employers in a region. However, their focus is usually centered around serving the local popula-tion and economy. These industries are therefore more a product of the local economic growth than acause of it. This is not to say that local-serving industries are not important—in fact they are some ofthe most vital services in an area. Nevertheless, the strategies for their development are not the sameas cluster strategies. Some of these industries are important in their role as economic foundations, un-derpinning the basic regional infrastructures that clusters must have in order to develop vibrantly.
Alaska's cluster portfolio represents about 30% of employment in the region. While this may seem to bea low share, it actually falls within the normal range of other regions that IHS Global Insight has analyzed.
It also is important to note that industry clusters may not fit neatly into political jurisdictions. Whilesome of Alaska's clusters may be present across the region, others may be concentrated in certain bor-oughs. In general clusters may cross state lines, drawing on resources and markets from neighboring
Recent employmentgrowth or change in the
ECR
indicates momentum
AdvancedM anufacturing
Clust er s
M aterials Clusters
Ch emicals &Plastics
M etals & M etalP roducts
Phar maceut icals
Health
M edical Equipment
Bio tech nology
Non- met allicM inerals
Aerospace/D ef ense
Industr ia lM achinery
Tr ansportationE quipment
In formationTechnolog y Softw are
Rail Equip.
Auto P ar ts
Test/Cont rolEq uip.
Ad vancedM at er ials
B usiness S ervicesC lusters
Insur ance & BankingB usiness
S ervices
R esear ch & Consult in g Services
EngineeringServices Environ ment al
Equ ipment & Ser vices
Region X’s Cluster Portfolio
Local Experts
Local experts can offervaluable information and
insight to shape thedefinition of clusters.
Employment Concentration RatioECR
Sectoral share of the region’semployment relative to the national
average share. An ECR greater than 1indicates strong market position or
specialization. This measure issometimes called the location quotient.
Linkages
Sectors with commonsuppliers or markets.

92
regions. In that sense, the Alaska economy is linked to other states. Nevertheless, as a share of its totalemployment, traded clusters comprise slightly less than one third.
Cluster Indentification
Using the methodology described above, IHS Global Insight and its partners identified 11 establishedclusters in Alaska. Classified by the segmentation categories illustrated in Figure 40 they are:67
Star CClusters
• Tourism
• Logistics and International Trade
• Community and Social Services
• Advanced Business Services
Opportunity CCluster
• Specialized Machinery/Capital Goods
Mature CClusters
• Fishing and Seafood Processing
• Oil and Gas Extraction / Pipeline / Refinery
• Military
• Mining
• Federal Government
Challenge CClusters
• Forestry and Wood Products
The relative growth rates are expressed as the "industry ddynamism" concept. We determined industrydynamism for each cluster by adding up the real gross output of each industry within the cluster andthen calculating the compound average annual growth of the cluster's total real gross output. Impor-tantly we used the real gross output of each industry at the U.S. national level to capture the macroeco-nomic or national trends. We considered the period 2009 to 2019 to reflect each cluster's medium tolong-term potential.
The employment cconcentration rratio ((ECR) is the most essential aspect of this analysis. A concentrationratio larger than one suggests that the cluster is more concentrated in the region than it is nationally. Itis calculated using employment levels that existed in 2008. ECR measures an industry's concentrationin a region relative to the country as a whole. It compares an industry's share of local employment withits share of national employment. An ECR of greater than 1 implies that the industry produces moregoods and services than required to meet the demands of the local market. More than likely, the indus-try is exporting the good or service out of the region.
Cluster Segmentation
Economic strategy formulation can be strengthened by an understanding of the market position ofAlaska's clusters. One useful means of differentiation is to segment clusters and sectors according toAlaska's competitive market position and the dynamism of its markets. This analysis identifies Alaska's
A L A S K A F O R W A R D : P H A S E I S I T U A T I O N A L A N A L Y S I S
67 Ordering of clusters here is not important.
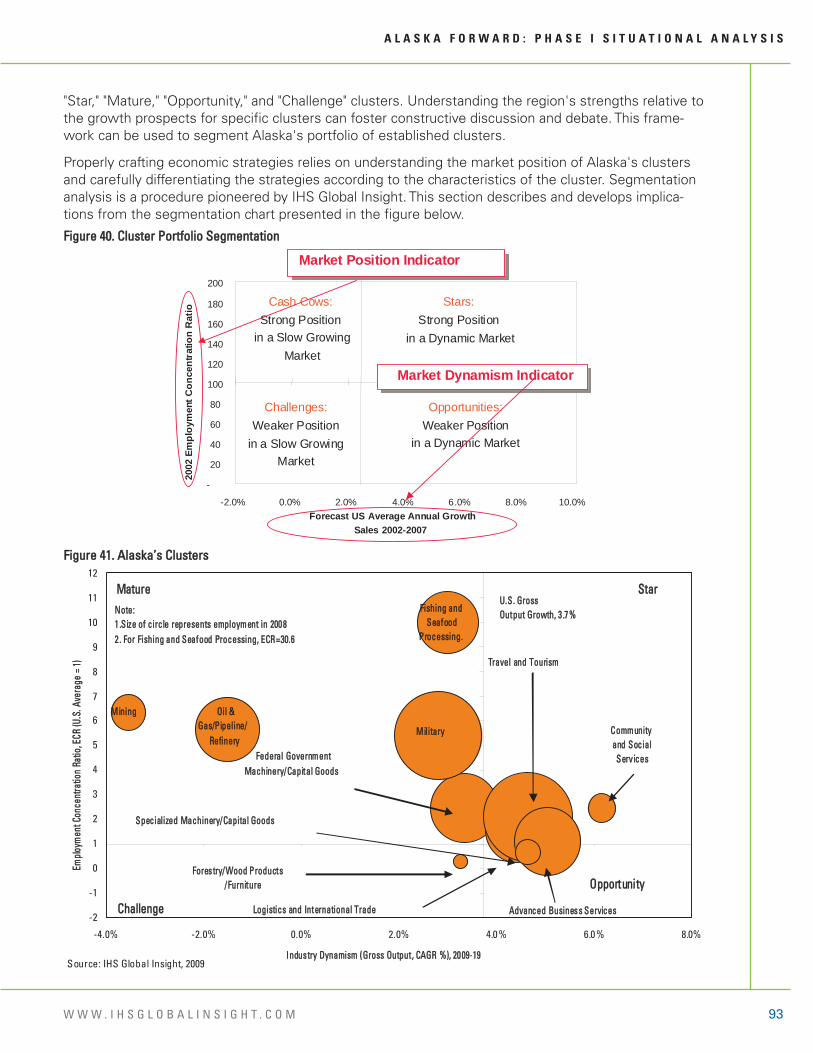
A L A S K A F O R W A R D : P H A S E I S I T U A T I O N A L A N A L Y S I S
W W W . I H S G L O B A L I N S I G H T . C O M 93
"Star," "Mature," "Opportunity," and "Challenge" clusters. Understanding the region's strengths relative tothe growth prospects for specific clusters can foster constructive discussion and debate. This frame-work can be used to segment Alaska's portfolio of established clusters.
Properly crafting economic strategies relies on understanding the market position of Alaska's clustersand carefully differentiating the strategies according to the characteristics of the cluster. Segmentationanalysis is a procedure pioneered by IHS Global Insight. This section describes and develops implica-tions from the segmentation chart presented in the figure below.
Figure 440. CCluster PPortfolio SSegmentation
Figure 441. AAlaska’s CClusters
-
20
40
60
80
100
120
140
160
180
200
-2.0% 0.0% 2.0% 4.0% 6.0% 8.0% 10.0%Forecast US Average Annual Growth
Sales 2002-2007
2002
Em
ploy
men
t Con
cent
ratio
n R
atio
Stars: Strong Position
in a Dynamic Market
Opportunities:Weaker Position
in a Dynamic Market
Challenges:Weaker Position
in a Slow GrowingMarket
Cash Cows: Strong Position
in a Slow GrowingMarket
Market Position Indicator
Market Dynamism Indicator
-2
-1
0
1
2
3
4
5
6
7
8
9
10
11
12
-4.0% -2.0% 0.0% 2.0% 4.0% 6.0% 8.0%
Industry DDynamism ((Gross OOutput, CCAGR %%), 22009-119
Emplo
ymen
t CCon
cent
ratio
n RRa
tio, EE
CR ((U
.S. AA
vera
ge ==
11) Travel aand TTourism
Mining Oil && Gas/Pipeline/
Refinery
Logistics aand IInternational TTrade
Forestry/Wood PProducts/Furniture
Military Community and SSocial Serv ices
MMaattuurree SSttaarr
OOppppoorrttuunniittyy
CChhaalllleennggee Advanced BBusiness SServices
Specialized MMachinery/Capital GGoods
Note:1 .Size oof ccircle rrepresents eemployment iin 220082 . FFor FFishing aand SSeafood PProcessing, EECR=30.6
U.S. GGross Output GGrowth, 33 .7%
Fishing aand Seafood
Processing.
Federal GGovernment Machinery/Capital GGoods
Source: IHS Global Insight, 2009

94
Star Clusters
Clusters located in the upper right-hand quadrant, "Stars," represent the key areas of focus for Alaska.These clusters represent businesses in which Alaska has some capability, but also ones that will experi-ence above-average growth over the next decade. Clusters in this quadrant have been competitive inmarkets that continue to hold good future prospects. The region should continue to emphasize theseclusters as key sectors for development.
The clusters that we have identified as stars in Alaska include Travel and Tourism, Logistics and Interna-tional Trade, Community and Social Services and Advanced Business Services.
• Travel aand TTourism is a large cluster and falls into the star quadrant because of its above averageemployment intensity relative to the national average as well as significant dynamism. Total employ-ment in the cluster was estimated at 26,157 in 2002 and employment concentration is 2.1 timesthe national average based on a Tourism Satellite Account study by IHS Global Insight in 2004. Thestudy also found that travel and tourism's core industry generated $856 million in local value addedin 2002—3% of gross state product.
• IHS Global Insight's Tourism Satellite Account approach is consistent with the notion of a cluster.Tourism is a complicated cluster that is broadly composed of accommodation, entertainment, trans-portation, retail and food. A large number of industries are impacted by tourism however there arevarying degrees of tourism intensity. The hotel industry is very tourism intensive as is scenic andsightseeing transportation, museums and historical institutions. There are other industries that areconsiderably less tourism intensive. The leisure and hospitality industry is the closest proxy to traveland tourism. Our expectation is that this cluster will grow at 4.6% compounded annually over the10 years to 2019.
A L A S K A F O R W A R D : P H A S E I S I T U A T I O N A L A N A L Y S I S
Ta b l e 1 0 . A l a s k a ’s C l u s t e r s
C l u s t e rI n d u s t r y D y n a m i s m ,
C A G R G r o s s O u t p u t , 2 0 0 9 - 1 9
E m p l o y m e n t C o n c e n t r a t i o n
R a t i o
E m p l o y m e n t2 0 0 8
C h a n g e i n E m p l o y m e n t ,
C A G R , 2 0 0 3 - 0 8
Federal Government 3.3% 2.5 16,833 -0.3%Military 2.8% 5.4 27,424 3.8%Fishing and Seafood Processing 3.0% 30.6 13,351 -1.2%Logistics and International Trade 4.4% 1.5 13,784 1.7%Travel and Tourism 4.6% 2.1 28,093 1.2%Forestry and Wood Products 3.3% 0.3 734 -5.7%Communities and Social Services 6.2% 2.5 2,858 4.2%Advanced Business Services 5.0% 1.1 16,354 6.3%Specialized Machinery/Capital Goods 4.6% 0.7 2,301 14.9%Oil and Gas/Pipeline/Refinery -1.5% 5.7 15,067 8.2%Mining (excl. Oil and Gas) -3.6% 6.4 4,452 12.1%Subtotal 2.8% 2.4 141,252 2.9%Non-cluster 4.4% 0.7 208,435 0.9%Total 3.7% 1.0 349,686 1.7%Source: IHS Global Insight, 2009

A L A S K A F O R W A R D : P H A S E I S I T U A T I O N A L A N A L Y S I S
W W W . I H S G L O B A L I N S I G H T . C O M 95
• Logistics aand IInternational TTrade is about the movement of goods / freight. The cluster employed13,784 in 2008, an increase of 1.7% compounded annually since 2003. This is a star cluster withemployment concentration that is 1.5 times the national average and a compounded annual growthrate in gross output of 4.4% over next ten years. Industries in the cluster include air, rail, road andwater transportation as well as couriers, warehousing and storage. The sector has good potential inthe future as continued cargo expansion should result in solid growth opportunities. Growthprospects for the courier industry are particularly high.
Ta b l e 1 1 . Tr a v e l a n d To u r i s m C l u s t e r
C l u s t e rI n d u s t r y D y n a m i s m ,
C A G R G r o s s O u t p u t , 2 0 0 9 - 1 9
E m p l o y m e n t C o n c e n t r a t i o n
R a t i o
E m p l o y m e n t2 0 0 8
C h a n g e i n E m p l o y m e n t ,
C A G R , 2 0 0 3 - 0 8
Travel aand TTourism 4.6% 2.1 28,093 1.2%Amusement and Recreation Services 4.0% 8.2 8,345 0.7%Hotel and Lodging Places 6.5% 4.8 7,948 2.3%Eating and Drinking 4.2% 1.0 4,081 -0.3%Air Transportation 4.8% 6.4 2,578 0.0%Water Transport 3.5% 18.9 701 7.8%Transportation Services -2.7% 8.6 1,211 1.3%General Merchandise Store 5.5% 0.9 1,084 7.2%Automative Dealers and Service Stations 1.9% 0.4 487 0.6%Apparel and Accessory Stores 3.2% 0.3 364 -1.6%Furniture & Home Furniture Stores 0.1% 1.2 298 -2.8%MembershipSports and Recreation Clubs 4.0% 0.3 323 0.7%Miscellaneous Retail 6.3% 1.3 320 6.0%Automobile Repair and Services 6.9% 0.2 126 -0.9%Automobile Rental and Leasing 3.4% 0.9 141 1.7%Food Stores 6.8% 0.6 87 -3.0%
Sources: The Alaska Tourism Satellite Account, Global Insight Study 2004 and IHS Global Insight, 2009
Ta b l e 1 2 . L o g i s t i c s a n d I n t e r n a t i o n a l Tr a d e C l u s t e r
C l u s t e rI n d u s t r y D y n a m i s m ,
C A G R G r o s s O u t p u t , 2 0 0 9 - 1 9
E m p l o y m e n t C o n c e n t r a t i o n
R a t i o
E m p l o y m e n t2 0 0 8
C h a n g e i n E m p l o y m e n t ,
C A G R , 2 0 0 3 - 0 8
Logistics aand IInternational TTrade 4.4% 1.5 13,784 1.7%
Scheduled Air Transportation 4.8% 4.7 5,242 -0.7%Support Activities for Air Transportation -2.7% 2.7 1,022 2.6%Rail Transportation 1.8% 2.9 705 -3.4%Deep Sea, Coastal, and Great Lakes Water Transportation 3.5% 6.5 652 15.9%
Inland Water Transportation 7.4% 2.4 104 -10.2%Specialized Freight Trucking 4.4% 1.9 2,035 7.6%Support Activities for Water Transportation 1.0% 2.8 664 -4.2%Support Activities for Road Transportation -0.9% 0.4 70 1.8%Freight Transportation Arrangement -5.2% 0.9 460 -2.3%Couriers 8.4% 1.9 2,295 6.0%Warehousing and Storage 5.1% 0.3 407 -0.7%Aerospace Product and Parts MFG 3.3% 0.1 99 35.1%Navigational, Measuring, Electromedical,and Control Instruments MFG 2.5% 0.0 9 -12.0%
Source: IHS Global Insight, 2009

96
• Scheduled air transportation is the largest employer in the cluster with 5,242 workers in 2008 fol-lowed by couriers with 2,295 employees and specialized freight trucking with 2,035. Scheduled airtransportation has employment concentration that is 4.7 times the national average. Employmentconcentration is particularly high for water transportation.
• Community aand SSocial SServices is a star cluster that employed 2,858 workers in 2008. The clusterincludes civic and social organizations as well as social advocacy organizations. They are considereda cluster because these organizations are a common platform to connect various industries andgroups in the state. Civic and social organizations is quite large, the industry employed 1,878 peoplein 2008 and had an employment concentration of 2.2 times the national average. Employment withsocial advocacy organizations more than doubled from 426 in 2003 to 980 in 2008.
• The cluster is 2.5 times more concentrated in Alaska than it is nationally. The social advocacy andcivic and social organizations had ECRs of 3.1 and 2.2 respectively in 2008. Cluster dynamism how-ever is higher than average and is estimated to be 4.4%.
• Advanced BBusiness SServices is a large star cluster. The cluster employed 16,354 people in 2008.There was a large increase in employment since 2003 in this cluster particularly in the scientific re-search and development services industry and special food services. Cluster dynamism is esti-mated to be higher than average at 5%. The cluster includes industries that employ highly skilledlabor and provides technical, research and management services to other industries in the state.The architectural, engineering and related service is the largest employer in the cluster (4,414 work-ers) followed by facilities support services with 2,931. The special food services industry employed2,897 in the same year while the scientific research and development services industry employed
A L A S K A F O R W A R D : P H A S E I S I T U A T I O N A L A N A L Y S I S
Ta b l e 1 3 . C o m m u n i t y a n d S o c i a l S e r v i c e s C l u s t e r
C l u s t e rI n d u s t r y D y n a m i s m ,
C A G R G r o s s O u t p u t , 2 0 0 9 - 1 9
E m p l o y m e n t C o n c e n t r a t i o n
R a t i o
E m p l o y m e n t2 0 0 8
C h a n g e i n E m p l o y m e n t ,
C A G R , 2 0 0 3 - 0 8
Community aand SSocial SServices 4.4% 1.5 13,784 1.7%
Social Advocacy Organizations 8.0% 3.1 980 18.1%Civic & Social Organizations 5.1% 2.2 1,878 -0.2%
Source: IHS Global Insight, 2009
Ta b l e 1 4 . A d v a n c e d B u s i n e s s S e r v i c e s C l u s t e r
C l u s t e rI n d u s t r y D y n a m i s m ,
C A G R G r o s s O u t p u t , 2 0 0 9 - 1 9
E m p l o y m e n t C o n c e n t r a t i o n
R a t i o
E m p l o y m e n t2 0 0 8
C h a n g e i n E m p l o y m e n t ,
C A G R , 2 0 0 3 - 0 8
Advanced BBusiness SServices 5.0% 1.1 16,354 6.3%
Other Specialty Trade Contractors 5.2% 0.9 1,174 1.4%Architectural, Engineering, and Related Services 1.1% 1.3 4,414 4.6%
Specialized Design Services 3.0% 0.4 124 4.0%Computer Systems Design and Related Services 9.1% 0.5 1,309 6.1%
Management, Scientific, and Technical Consulting Services 6.4% 0.4 1,005 -0.5%
Scientific Research and Development Services 4.6% 0.9 1,494 16.5%
Facilities Support Services 6.7% 8.3 2,931 8.4%Vocational Rehabilitation Services 5.6% 1.2 1,006 2.5%Special Food Services 8.0% 2.2 2,897 10.4%
Source: IHS Global Insight, 2009

A L A S K A F O R W A R D : P H A S E I S I T U A T I O N A L A N A L Y S I S
W W W . I H S G L O B A L I N S I G H T . C O M 97
1,494. Facilities support services has employment concentration that is 8.3 times the national aver-age. Some of these industries are linked to the oil and gas sector.
Opportunity Clusters
"Opportunity" clusters are those in the lower right-hand corner of the four quadrant cluster diagram. Inthe case of the Alaska region, there are four clusters that fall into this quadrant. These clusters tend toface above-average national demand growth, but have not yet achieved significant mass in a region.Clusters in this quadrant would benefit from a recruitment and enterprise formation process that wouldharness existing demand, leading to the creation of new jobs in a region.
Specialized Machinery/ Capital Goods is identified as an opportunity clusters.
• Specialized MMachinery // CCapital GGoods is a small opportunity cluster and a part of Alaska's manufac-turing industry. Cluster employment more than doubled over the five years to 2008 when employ-ment stood at 2,301. The cluster is composed of architectural and structural metal manufacturingand commercial and industrial machinery and equipment rental and leasing services. Cluster em-ployment concentration is 0.7 but its dynamism is estimated to be above average at 4.6%.
• The commercial and industrial machinery, equipment rental and leasing industry employed 565workers in 2008. Other general purpose manufacturing employed 996 workers. They are the twolargest employers in the cluster. These industries also have the highest ECRs in the cluster. Shipand boat building is a small and not particularly dynamic industry which is primarily linked to thefishing industry.
Mature Clusters
The clusters in the upper left-hand quadrant of our cluster diagram are "Mature." These clusters are thebasis of Alaska's historical strengths but they are facing slow-growing markets. Although these clustershave strong capabilities in the region, the low market attractiveness means that they can maintain thestatus-quo, downsize, or transform their focus into new markets.
These clusters are assets in a region's portfolio and require a great deal of investment to achieve a de-sired level of growth. There has long been extensive employment and specialization in these clusters,but they have had difficulties in competing with other regions and face uncertain global markets. Theseclusters probably have the greatest need for undertaking collaborative cluster initiatives that will helpthem understand market requirements, improve production capabilities, enhance worker productivity,and innovate in marketing and distribution.
Ta b l e 1 5 . S p e c i a l i z e d M a c h i n e r y / C a p i t a l G o o d s C l u s t e r
C l u s t e rI n d u s t r y D y n a m i s m ,
C A G R G r o s s O u t p u t , 2 0 0 9 - 1 9
E m p l o y m e n t C o n c e n t r a t i o n
R a t i o
E m p l o y m e n t2 0 0 8
C h a n g e i n E m p l o y m e n t ,
C A G R , 2 0 0 3 - 0 8
Specialized MMachinery/Capital GGoods 4.6% 0.7 2,301 14.9%
Architectural & Structural Metals MFG 2.6% 0.2 180 0.8%Machine Shops; Turned Product; andScrew, Nut, and Bolt MFG -1.3% 0.3 283 18.1%
Other General Purpose Machinery MFG 0.4% 1.4 996 83.4%Commercial & Industrial Machinery & EquipRental & Leasing 5.5% 1.5 565 4.7%
Ship and Boat Building 0.4% 0.7 277 -5.0%
Source: IHS Global Insight, 2009

98
The clusters that have been identified as mature in Alaska include Oil and Gas Extraction / Pipeline / Re-finery, Fishing and Seafood Processing, Mining and the Military.
• Oil aand GGas // PPipeline // RRefinery is a large and mature cluster in Alaska, it employed 15,067 in 2008.The employment concentration of the overall cluster is 5.7 times the national average. Over the lastfive years employment increased by a very healthy compounded annual rate of 8.2%. The cluster'sfuture potential is limited. Alaska's oil production has been declining since 1988 and the fields thatare currently producing have an aggregate decline rate of just over 6%. We expect Alaska's produc-tion in 2015 to be about 522,000 barrels per day or 75% of the 2008 levels. Cluster dynamism iswell below average at minus 1.5% over the next 10 years.
• While oil and gas extraction is at the centre of the cluster it also includes support activities, pipelinetransportation of crude oil and gas, petroleum manufacturing (refinery), lessors of nonfinancial intan-gible assets and pesticides, fertilizer and other agricultural chemical manufacturing.
• The extraction industry employed 3,960 in 2008. Support activities for mining is a large industry inthe cluster, its activities include: field well drilling, reconditioning, chemical treatment, rig skiddingand geological and geophysical exploration. In 2008 support activities employed 9,727. Petroleumproducts manufacturing employed 420 in the same year. Employment in the pipeline and pesticideand fertilizer manufacturing industries are quite low.
• Fishing aand SSeafood PProcessing is a large mature cluster, and employed 13,351 workers in 2008.Seafood processing is one of Alaska's oldest industries and dominates the manufacturingindustry—representing nearly half of manufactured output. It is also Alaska's top international ex-port.
• The employment concentration of the cluster is highest among all clusters at 30.6 times the na-tional average in 2008. The fishery in Alaska generates about half of the total U.S. commercial fish-ing harvest by weight. Dutch Harbor/Unalaska is in fact the largest fishery port in the country. Thefuture potential of the cluster is limited and the industry dynamism is estimated to be below aver-age at 3.0% over forecast period.
A L A S K A F O R W A R D : P H A S E I S I T U A T I O N A L A N A L Y S I S
Ta b l e 1 6 . O i l a n d G a s / P i p e l i n e / R e f i n e r y C l u s t e r
C l u s t e rI n d u s t r y D y n a m i s m ,
C A G R G r o s s O u t p u t , 2 0 0 9 - 1 9
E m p l o y m e n t C o n c e n t r a t i o n
R a t i o
E m p l o y m e n t2 0 0 8
C h a n g e i n E m p l o y m e n t ,
C A G R , 2 0 0 3 - 0 8
Oil aand GGas -11.5% 5.7 15,067 8.2%
Oil & Gas Extraction -2.9% 3.3 3,960 6.5%
Support Activities for Oil and Gas 0.0% 10.3 9,727 11.2%
Pipeline Transportation of Crude Oil -0.5% 37.6 661 -2.5%
Petroleum and Coal Products MFG 5.5% 1.4 420 2.2%Lessors of Nonfinancial Intangible Assets(except Copyrighted Works) 0.1% 2.0 131 21.7%
Pesticide, Fertilizer, and Other AgriculturalChemical MFG -8.3% 2.2 168 -13.7%
Source: IHS Global Insight, 2009

A L A S K A F O R W A R D : P H A S E I S I T U A T I O N A L A N A L Y S I S
W W W . I H S G L O B A L I N S I G H T . C O M 99
• Mining in Alaska is a large, mature cluster. The cluster encompasses metal ore mining, nonmetallicmineral and quarrying as well as coal mining. Red Dog Mine is the largest in the state; it produceszinc, lead and silver. Overall cluster employment was 4,452 in 2008.
• The cluster expanded rapidly over the last 5 years. Metal ore mining employs about 10 times asmany workers as nonmetallic mineral mining however the latter grew much more rapidly since2003. The cluster employment concentration ratio (ECR) is very high at 6.4 times the national aver-age in 2008. The metal ore mining industry in particular has a very high concentration ratio of 25times the national average.
• Surging metals prices bolstered growth in gross output of the cluster over the last 5 years. It in-creased by a compound annual rate of 7.2%, however, over the forecast period this growth slowssharply as price increases are assumed to be more moderate. We expect all industries in the clusterto contract over the next 10 years. Mining is a mature cluster.
• Military is a large and mature cluster in Alaska centered in Anchorage and Fairbanks. The Depart-ment of Homeland Security Coast Guard has a significant presence as well. The cluster employed2,858 people in 2008. Employment has increased by a compounded annual rate of 4.2% since2003. Cluster concentration is very high at 2.5 times the national average and is likely to go evenhigher as the army has announced its intention to add personnel at Fort Richardson and Fort Wain-wright. Overall cluster dynamism is expected to be higher than average at 6.2% over the forecasthorizon.
Ta b l e 1 7 . F i s h i n g a n d S e a f o o d P r o c e s s i n g C l u s t e r
C l u s t e rI n d u s t r y D y n a m i s m ,
C A G R G r o s s O u t p u t , 2 0 0 9 - 1 9
E m p l o y m e n t C o n c e n t r a t i o n
R a t i o
E m p l o y m e n t2 0 0 8
C h a n g e i n E m p l o y m e n t ,
C A G R , 2 0 0 3 - 0 8
Fishing aand SSeafood PProcessing CCluster 3.0% 30.6 13,351 -11.2%
Fishing 3.4% 20.0 7,109 -4.4%Seafood Product Preparation & Packaging 2.8% 76.4 6,242 3.3%
Sources: IHS Global Insight, 2009 and Alaska Department of Labor and Workforce Development
Ta b l e 1 8 . M i n i n g C l u s t e r
C l u s t e rI n d u s t r y D y n a m i s m ,
C A G R G r o s s O u t p u t , 2 0 0 9 - 1 9
E m p l o y m e n t C o n c e n t r a t i o n
R a t i o
E m p l o y m e n t2 0 0 8
C h a n g e i n E m p l o y m e n t ,
C A G R , 2 0 0 3 - 0 8
Mining ((Excl. OOil aand GGas) -33.6% 6.4 4,452 12.1%
Metal Ore Mining -3.8% 24.6 3,966 11.3%
Nonmetallic Mineral Mining & Quarrying -3.1% 0.9 396 24.3%
Coal Mining -2.6% 0.8 90 6.1%Source: IHS Global Insight, 2009
Ta b l e 1 9 . M i l i t a r y C l u s t e r
C l u s t e rI n d u s t r y D y n a m i s m ,
C A G R G r o s s O u t p u t , 2 0 0 9 - 1 9
E m p l o y m e n t C o n c e n t r a t i o n
R a t i o
E m p l o y m e n t2 0 0 8
C h a n g e i n E m p l o y m e n t ,
C A G R , 2 0 0 3 - 0 8
Military 6.2% 2.5 2,858 4.2%
Source: IHS Global Insight, 2009 and Alaska Command (ALCOM)

100
• Federal Government is a large and mature cluster in Alaska and concentration in centered in An-chorage, Fairbanks and Southeast. The cluster employed 16,833 people in 2008. Since 2003, em-ployment in the cluster has declined slightly at a compounded annual rate of -0.3%. Theemployment concentration ratio is 2.5 times the national average and overall cluster dynamism isexpected to be somewhat lower than average at 3.3% over the forecast horizon.
Challenge Clusters
In the lower left-hand quadrant are the "Challenge" clusters. While these clusters have some strength inAlaska, they are not a dominant capability compared to other regions. In addition, the traditional mar-kets for these clusters are growing much slower than average. Here, the strategic focus should be oncatching opportunities that might emerge in the region, such as "spin-offs" from existing companies, ora special case where a firm has "discovered" the region and wants to locate here. Within these clusters,expensive marketing and recruitment programs are not likely to pay off.
Forestry and Wood Products is a challenge cluster in Alaska.
• Forestry aand WWood PProducts is a challenge cluster, which in its current form has limited future po-tential. The cluster includes: logging, timber tact operations, support activities, sawmill and woodpreservation, and furniture manufacturing.
• It is a small cluster with total employment of only 734 in 2008. The logging and furniture manufactur-ing industries account for most of employment in the cluster. In 2008, logging employed 349 and thefurniture manufacturing industry employed 265 workers. Timber is a small sector and it consists of theharvest and limited processing of timber resources in Southeast and South Central Alaska. Sawmilland wood preservation is another small industry in the cluster with total employment of 95 in 2008.
• In 2008 the cluster's employment concentration ratio (ECR) was low at 0.3 in 2008—a slight declinefrom 2003. Only logging and timber tract operations have employment concentration that is greaterthan 1 in 2008 at 2.2 and 1.1 respectively. Cluster dynamism over the next 10 years is about averageat 3.3%. It is limited by the logging and timber tract operations; they are expected to grow by only
A L A S K A F O R W A R D : P H A S E I S I T U A T I O N A L A N A L Y S I S
Ta b l e 2 0 . F e d e r a l G o v e r n m e n t C l u s t e r
C l u s t e rI n d u s t r y D y n a m i s m ,
C A G R G r o s s O u t p u t , 2 0 0 9 - 1 9
E m p l o y m e n t C o n c e n t r a t i o n
R a t i o
E m p l o y m e n t2 0 0 8
C h a n g e i n E m p l o y m e n t ,
C A G R , 2 0 0 3 - 0 8
Federal GGovernment 3.3% 2.5 16,833 -00.3%
Source: IHS Global Insight, 2009
Ta b l e 2 1 . F o r e s t r y a n d Wo o d P r o d u c t s C l u s t e r
C l u s t e rI n d u s t r y D y n a m i s m ,
C A G R G r o s s O u t p u t , 2 0 0 9 - 1 9
E m p l o y m e n t C o n c e n t r a t i o n
R a t i o
E m p l o y m e n t2 0 0 8
C h a n g e i n E m p l o y m e n t ,
C A G R , 2 0 0 3 - 0 8
Forestry aand WWood PProducts 3.3% 0.3 734 -55.7%
Timber Tract Operations 3.1% 1.1 12 -12.2%Forest Nurseries & Gathering of ForestProducts 4.8% 0.4 2 14.9%
Logging 2.7% 2.2 349 -10.7%
Support Activities for Forestry 6.9% 0.3 11 17.1%
Sawmills & Wood Preservation 6.3% 0.4 95 -0.6%
Furniture Manufacturing 6.3% 0.1 265 1.7%
Source: IHS Global Insight, 2009

A L A S K A F O R W A R D : P H A S E I S I T U A T I O N A L A N A L Y S I S
W W W . I H S G L O B A L I N S I G H T . C O M 101
2.7% and 3.1% respectively over the next 10 years. The cluster is being challenged by significantenvironmental concerns as well as an inexpensive supply of timber from Russia and South America.
Cluster Analysis by Region
In this section the project team investigates and details the dispersion of the identified clusters acrossthe various regions including Anchorage / Mat-Su, Fairbanks, Gulf Coast, Interior Western, NorthernSoutheast and Southwest.
• The majority of Alaska's advanced bbusiness sservices cluster is located in the Anchorage/Mat-Su re-gion. The region accounts for 75% of the cluster's total employment in 2008. The employment con-centration ratio is 1.6 times the average. The cluster is very dynamic with industry dynamismestimated to be at 5.0%. It is a star cluster in the region.
• Military is a large mature cluster in the region with an employment concentration ratio of 6.2 timesthe national average. It employed 16,806 workers in 2008 in the region—60% of cluster employ-ment in the state.
• Logistics aand iinternational ttrade is a very large star cluster and employed 9,450 workers in 2008.The ECR of the cluster is twice the national average and industry dynamism is estimated to be4.4% over the forecast period.
• Travel aand ttourism is also a very large cluster in the region and employed 15,762 workers in 2008.The employment concentration ratio of the cluster 2.2 times the national average.
• Community aand ssocial sservices is a small but concentrated and very dynamic cluster in the region.
• Federal GGovernment is a large mature cluster with total employment of 9,633 in 2008. The employ-ment concentration ratio of the cluster 2.6 times the national average.
Ta b l e 2 2 . A n c h o r a g e / M a t - S u C l u s t e r s
C l u s t e rI n d u s t r y D y n a m i s m ,
C A G R G r o s s O u t p u t , 2 0 0 9 - 1 9
E m p l o y m e n t C o n c e n t r a t i o n
R a t i o
E m p l o y m e n t2 0 0 8
C h a n g e i n E m p l o y m e n t ,
C A G R , 2 0 0 3 - 0 8
Federal Government 3.3% 2.6 9,633 -0.5%Military 2.8% 6.2 16,806 -Fishing and Seafood Processing - - - -Logistics and International Trade 4.4% 2.0 9,450 1.3%Travel and Tourism 4.6% 2.2 15,762 0.6%Forestry and Wood Products 7.1% 0.1 164 -1.7%Community and Social Services 7.8% 2.3 1,430 8.4%Advanced Business Services 5.0% 1.6 12,199 6.4%Specialized Machinery/Capital Goods 6.3% 0.3 566 1.1%Oil and Gas/Pipeline/Refinery** -0.04% 0.3 469 14.7%Mining (Excl. Oil and Gas) -2.5% 1.1 401 27.1%** Employment does not inlcude oil and gas headquarters positions. According to ADOL, there are 1300 positions in oil and gasheadquartersSource: IHS Global Insight, 2009

102
Figure 442. AAnchorage/Mat-SSu CClusters
• In 2008, travel aand ttourism cluster employed 4,668 people in Fairbanks. The employment concentra-tion ratio of the cluster is 2.3 times the average.
• The mining cluster has 31% of its total employment in the Fairbanks region. It is also the most con-centrated cluster in the region, the ECR is 13 times higher than average. Cluster dynamism is esti-mated to be minus 2.9%.
• Military is a large cluster with total employment of 8,775 in 2008, 32% of military cluster employ-ment in the state. The cluster's ECR is 11.6 times higher than the national average.
A L A S K A F O R W A R D : P H A S E I S I T U A T I O N A L A N A L Y S I S
-2
-1
0
1
2
3
4
5
6
7
8
9
10
11
12
-3 .0% -2.0% -1.0% 0.0% 1.0% 2.0% 3.0% 4.0% 5.0% 6.0% 7.0% 8.0% 9.0%
Ind us try DDyn am ism ((G ro ss OO ut put , CC AGR %% ), 22 009 -119
Empl
oym
ent CC
once
ntra
tion
RRatio
, EECR
((U.S
. AAve
rage
== 11
)MMaatt uurree SSttaarr
Tra ve l aan d T our ism
Mini ng
Oil && GG as/ Pip elin e/ Ref ine ry
L ogi stic s aa nd In ter na tion al TTra de
For es try/Wo od PPro du cts /
/ Fu rnit ure
Co m m un ity a nd SSo cia l SSe rv ice s
OOpppp oorrtt uunn iittyyCChh aallll eenn ggee
Ad va nce d B usi nes s Serv ice s
Spec ial ized MMach ine ry/ Ca pita l GG ood s
U .S. GGro ss O utp ut GGro wth , 33 .7%
Mili tar y
No te: SSiz e oo f cci rcle rre pre se nts eem plo ym en t in 2200 8
Fe de ral GGo ver nm ent
Source: IHS Global Insight, 2009
Ta b l e 2 3 . F a i r b a n k s C l u s t e r s
C l u s t e rI n d u s t r y D y n a m i s m ,
C A G R G r o s s O u t p u t , 2 0 0 9 - 1 9
E m p l o y m e n t C o n c e n t r a t i o n
R a t i o
E m p l o y m e n t2 0 0 8
C h a n g e i n E m p l o y m e n t ,
C A G R , 2 0 0 3 - 0 8
Federal Government 3.3% 3.9 3,961 0.9%Military 2.8% 11.6 8,775 -Fishing and Seafood Processing - - - -Logistics and International Trade 6.4% 0.9 1,175 4.1%Travel and Tourism 5.2% 2.3 4,668 0.6%Forestry and Wood Products 5.8% 0.2 94 25.7%Community and Social Services 2.2% 0.5 86 -10.6%Advanced Business Services 3.8% 0.9 1,877 10.3%Specialized Machinery/Capital Goods 3.2% 0.3 161 11.1%Oil and Gas/Pipeline/Refinery -0.2% 0.9 369 -4.3%Mining (Excl. Oil and Gas) -2.9% 13.1 1,373 5.9%Source: IHS Global Insight, 2009

A L A S K A F O R W A R D : P H A S E I S I T U A T I O N A L A N A L Y S I S
W W W . I H S G L O B A L I N S I G H T . C O M 103
• Logistics aand iinternational ttrade is one of the most dynamic clusters in the Fairbanks region. Thecluster's industry dynamism is estimated to be 6.4% however cluster employment concentration isonly average.
• Advanced bbusiness sservices is another large cluster—it employed about 1,877 people in the Fair-banks region or 11% of the entire cluster in the state in 2008.
• Federal GGovernment employed 3,961 people in 2008, the third largest employer in the region. Theemployment concentration ratio of the cluster is 3.9 times the national average.
Figure 443. FFairbanks CClusters
-2
-1
0
1
2
3
4
5
6
7
8
9
10
11
12
13
14
15
-5.0% -3 .0% -1.0% 1.0% 3.0% 5.0% 7.0% 9.0% 11.0% 13.0%
In d u str y DD yn a m ism ((G r o ss OO u t p u t, CC A G R %% ), 22009- 119
Empl
oym
ent CC
once
ntra
tion
RRatio
, EECR
((U.S
. AAve
rage
== 11
)
M atu re S tar
T r a ve l a n d
T o u r ism
Mi n in g
O il && GG a s/ Pip e lin e / Re fin e r y Lo g is t ic s aa n d
In te r n a ti o n a l TT r a d e
Fo r e str y /Wo o d PPr o d u c ts/
/ F u r n itu r e
C o m m u n ity a n d SSo c ia l SSe r v ic e s
Op p o rtu n ity
C h alle n g e
A d va n c e d B u sin e ss Se r v ic e s
Sp e c ia lize d MMa c h in e r y/ C a p ita l GG o o d s
U .S. GG r o ss O u tp u t GG r o wt h , 33 .7%
No te : SSize oo f cc ir c l e rr e p r e s e n ts ee m p lo ym e n t in 22 008
Mi lita r y
Fe d e r a l GG o ve r n m e n t
Sou rce: IHS Global In sight, 2009
Ta b l e 2 4 . G u l f C o a s t C l u s t e r s
C l u s t e rI n d u s t r y D y n a m i s m ,
C A G R G r o s s O u t p u t , 2 0 0 9 - 1 9
E m p l o y m e n t C o n c e n t r a t i o n
R a t i o
E m p l o y m e n t2 0 0 8
C h a n g e i n E m p l o y m e n t ,
C A G R , 2 0 0 3 - 0 8
Federal Government 4.5% 1.2 541 -2.1%Military 2.8% 0.3 110 -Fishing and Seafood Processing 3.9% 73.2 2,154 -1.0%Logistics and International Trade 2.7% 0.8 471 2.6%Travel and Tourism 4.5% 2.5 2,274 1.3%Forestry and Wood Products 12.5% 0.2 34 -25.7%Community and Social Services 3.4% 3.6 282 -1.7%Advanced Business Services 6.2% 0.7 643 -2.0%Specialized Machinery/Capital Goods 3.5% 0.6 141 4.5%Oil and Gas/Pipeline/Refinery -3.9% 12.3 2,206 -8.3%Mining (Excl. Oil and Gas) -3.3% 8.3 392 42.5%Source: IHS Global Insight, 2009

104
• Oil aand ggas, mmining and fishing aand sseafood pprocessing are the most concentrated clusters in theGulf Coast region.
• The ECRs of oil aand ggas and mining are 12 and 8 times the national average. Both however havenegative cluster dynamism at -3.9% and -3.3% respectively. They are in the mature quadrant.
• Travel aand ttourism is another large and dynamic cluster with 2,274 employees. The cluster's indus-try dynamism is estimated to be higher than average at 5.1%.
• Military only employs 110 in the Gulf Coast region and has very low employment concentration ratioof 0.3.
Figure 444. GGulf CCoast CClusters
A L A S K A F O R W A R D : P H A S E I S I T U A T I O N A L A N A L Y S I S
-2
-1
0
1
2
3
4
5
6
7
8
9
10
11
12
13
14
15
-5.0% -3 .0% -1.0% 1.0% 3.0% 5.0% 7.0% 9.0% 11.0% 13 .0%
In d u st r y DD yn a m ism ((G r o ss OO u tp u t, CC A G R %% ) , 22009- 11 9
Empl
oym
ent CC
once
ntra
tion
RRatio
, EECR
((U.S
. AAve
rage
== 11
)
M atu re Star
T r a ve l a n d
T o u r ism
M in in g
O il && GG a s/ Pip e lin e / R e fin e r y Lo g ist ic s aa n d
In te r n a tio n a l TT r a d e
Fo r e str y /Wo o d PPr o d u c ts/
/ Fu r n itu r e
C o m m u n ity a n d SSo c ia l SSe r v i c e s
Op p o rtu n ity
C h alle n ge
A d va n c e d B u sin e ss Se r v i c e s
Sp e c ia lize d MMa c h i n e r y/ C a p ita l GG o o d s
U .S. GG r o ss O u tp u t GG r o w th , 33 .7 %
N o te : SSiz e oo f cc ir c le rr e p r e se n ts ee m p lo y m e n t in 22008
M ilita r y
Fe d e r a l GG o v e r n m e n t
So urce: IHS Global In sight, 2009
Ta b l e 2 5 . I n t e r i o r We s t e r n C l u s t e r s
C l u s t e rI n d u s t r y D y n a m i s m ,
C A G R G r o s s O u t p u t , 2 0 0 9 - 1 9
E m p l o y m e n t C o n c e n t r a t i o n
R a t i o
E m p l o y m e n t2 0 0 8
C h a n g e i n E m p l o y m e n t ,
C A G R , 2 0 0 3 - 0 8
Federal Government 3.2% 1.0 291 -2.3%Military - - -Fishing and Seafood Processing 5.5% 40.0 43 4.2%Logistics and International Trade 5.9% 1.3 475 1.9%Travel and Tourism 6.2% 1.0 576 3.4%Forestry and Wood Products 6.0% 0.1 16 -17.2%Community and Social Services 5.0% 9.8 482 7.3%Advanced Business Services 8.0% 0.2 94 19.9%Specialized Machinery/Capital Goods - - - -Oil and Gas/Pipeline/Refinery 3.4% 0.1 7 29.1%Mining (Excl. Oil and Gas) -2.9% 1.9 57 -5.3%Source: IHS Global Insight, 2009

A L A S K A F O R W A R D : P H A S E I S I T U A T I O N A L A N A L Y S I S
W W W . I H S G L O B A L I N S I G H T . C O M 105
• Fishing aand sseafood pprocessing is the largest cluster in the Interior Western region followed bytravel aand ttourism and communities and social sservice aand llogistics and international ttrade.
• The fishing aand sseafood pprocessing cluster is the most concentrated with an ECR that is about 40times the national average.
• Advanced bbusiness sservice is a small but dynamic cluster in the region.
Figure 445. IInterior WWestern CClusters
-2
-1
0
1
2
3
4
5
6
7
8
9
10
11
12
13
14
15
-4.0% -2.0% 0.0% 2.0% 4.0% 6.0% 8.0% 10.0%
In d u str y DD yn a m is m ((G r o ss OO u tp u t, CC A G R %% ), 22009- 119
Empl
oym
ent CC
once
ntra
tion
RRatio
, EECR
((U.S
. AAve
rage
== 11
)
M atu re Star
T r a ve l aa n d T o u r ism
Min in g
O il && GG a s /P ip e lin e /R e fin e r y
Lo g is t ic s aa n d In te r n a tio n a l TT r a d e
Fo r e st r y /Wo o d PPr o d u c ts/
/ Fu r n it u r e
C o m m u n it y aa n d So c ia l SSe r v ic e s
Op p o rtu n i tyC h alle n ge
A d v a n c e d B u s in e ss Se r v ic e s
N o te :1 . SSize oo f cc ir c le rr e p r e s e n ts ee m p lo ym e n t iin 22 0082 . FFo r FF i sh in g aa n d SSe a fo o d PPr o c e ssi n g , EE C R = 40
U .S. GG r o ss O u tp u t GG r o wth , 33 .7%
Fish in g && Se a sfo o d
P r o c e ss in g
Fe d e r a l GG o ve r n m e n t
So urce: IH S Global Insight, 2009
Ta b l e 2 6 . N o r t h e r n C l u s t e r s
C l u s t e rI n d u s t r y D y n a m i s m ,
C A G R G r o s s O u t p u t , 2 0 0 9 - 1 9
E m p l o y m e n t C o n c e n t r a t i o n
R a t i o
E m p l o y m e n t2 0 0 8
C h a n g e i n E m p l o y m e n t ,
C A G R , 2 0 0 3 - 0 8
Federal Government 4.0% 0.2 68 -3.4%Military - - -Fishing and Seafood Processing 5.4% 7.8 156 11.8%Logistics and International Trade 4.8% 0.4 170 -2.4%Travel and Tourism 6.0% 0.7 449 7.9%Forestry and Wood Products - - - -Community and Social Services 3.1% 2.5 134 -1.2%Advanced Business Services 5.1% 0.7 487 -3.0%Specialized Machinery/Capital Goods 1.0% 7.4 1,163 -Oil and Gas/Pipeline/Refinery -1.1% 97.0 11,905 14.6%Mining (Excl. Oil and Gas) -5.8% 54.3 1,757 13.2%Source: IHS Global Insight, 2009

106
• Oil aand ggas and mining clusters are the largest employers in the Northern region. In 2008, the oiland gas cluster employed 11,905 workers in the region (79% of cluster employment in the state).The ECR of the cluster is 97 times the national average.
• Mining cluster in the Northern region has employment concentration that is 54 times the national av-erage. Cluster employment in the region was 1,757 or 39% of the entire cluster in the state in 2008.
• Specialized mmachinery // ccapital ggoods cluster employed 1,163 workers in 2008. The cluster has anemployment concentration ratio which is 7.4 times the national average in this region.
• The community aand ssocial sservices is a small concentrated cluster in the region. However, the in-dustry dynamism of the cluster is estimated to be below average at 3.1%.
Figure 446. NNorthern CClusters
A L A S K A F O R W A R D : P H A S E I S I T U A T I O N A L A N A L Y S I S
- 1
0
1
2
3
4
5
6
7
8
9
10
11
12
-7.0% -5.0% - 3 .0% -1.0% 1.0% 3.0% 5.0% 7.0% 9.0%
In d u str y DD yn a m is m ((G r o ss OO u tp u t, CC A G R %% ), 2200 9- 119
Empl
oym
ent CC
once
ntra
tion
RRatio
, EECR
((U.S
. AAve
rage
== 11
)
Mat u re Sta r
T r a ve l aa n d T o u r is m
Min in g
O il && GG a s/Pi p e lin e /Re fin e r y
Lo g is t ic s aa n d In te r n a tio n a l TT r a d e
C o m m u n it y aa n d So c i a l SSe r v ic e s
Op p o rtu n ityC h all e n ge
A d va n c e d B u sin e ss S e r v ic e s
Sp e c ia lize d Ma c h in e r y/
C a p ita l GG o o d s
Fi sh in g aa n d Se a fo o d
PP r o c e ssin g
U .S. GG r o ss O u tp u t GG r o wth , 33 .7%
N o te : 1 .Size oo f cc i r c le rr e p r e se n ts ee m p lo ym e n t iin 2 0082 . FFo r OO il aa n d GG a s, EE C R= 97 ; ffo r MMin in g , E C R= 54.3
Fe d e r a l GG o v e r n m e n t
Sour ce: IHS Globa l Insig ht, 2009
Ta b l e 2 7 . S o u t h e a s t C l u s t e r s
C l u s t e rI n d u s t r y D y n a m i s m ,
C A G R G r o s s O u t p u t , 2 0 0 9 - 1 9
E m p l o y m e n t C o n c e n t r a t i o n
R a t i o
E m p l o y m e n t2 0 0 8
C h a n g e i n E m p l o y m e n t ,
C A G R , 2 0 0 3 - 0 8
Federal Government 3.2% 2.4 1,765 -2.1%Military 2.8% 1.3 695 -Fishing and Seafood Processing 1.8% 81.6 3,845 -2.5%Logistics and International Trade 4.3% 1.4 1,300 1.7%Travel and Tourism 4.1% 2.4 3,481 4.3%Forestry and Wood Products -0.5% 1.5 419 -3.5%Community and Social Services 4.1% 2.6 319 0.6%Advanced Business Services 4.8% 0.5 726 10.5%Specialized Machinery/Capital Goods 2.1% 0.7 252 -4.3%Oil and Gas/Pipeline/Refinery 4.8% 0.2 47 21.0%Mining (Excl. Oil and Gas 0.0% 5.9 449 11.1%Source: IHS Global Insight, 2009

A L A S K A F O R W A R D : P H A S E I S I T U A T I O N A L A N A L Y S I S
W W W . I H S G L O B A L I N S I G H T . C O M 107
• Fishing aand sseafood pprocessing and travel aand ttourism are the largest clusters in the Southeast re-gion with 3,845 and 3,481 employees respectively in 2008.
• Fishing aand sseafood pprocessing has a very high employment concentration in the region.
• Mining is the next most concentrated cluster in the Southeast region with an ECR 5.9 times the na-tional average.
• The community aand ssocial sservices cluster is quite concentrated in the region. The cluster employed319 people.
• Federal GGovernment is another large mature cluster and employed 1,765 people in 2008. The em-ployment concentration ratio of the cluster is 2.4 times the national average.
Figure 447. SSoutheast CClusters
-1
0
1
2
3
4
5
6
7
8
9
10
-2.0% 0.0% 2.0% 4.0% 6.0%
In d u str y DD yn a m ism ((G r o ss OO u tp u t, CC A G R %% ), 22009- 11 9
Empl
oym
ent CC
once
ntra
tion
RRatio
, EECR
((U.S
. AAve
rage
== 11
)
M atu re Star
T r a ve l aa n d TT o u r ismM in in g
O il && GG a s/Pip e li n e /Re fin e r y
Lo g is t i c s aa n d In te r n a tio n a l TT r a d e
Fo r e s tr y /W o o d PPr o d u c ts/
/ Fu r n i tu r e
C o m m u n ity aa n d S o c ia l SSe r v ic e s
Op p o rtu n ityCh alle n ge
A d va n c e d B u sin e s s Se r v ic e s
Sp e c ia lize d MMa c h i n e r y/ C a p it a l GG o o d s
F ish in g aa n d Se a fo o d
P r o c e ssi n g
U .S. GG r o ss O u tp u t G r o wth , 3 .7%
Milit a r y
No te :1 . SS ize oo f cc ir c le rr e p r e se n ts e m p lo ym e n t iin 2200 82 . FF o r FF ish i n g aa n d SS e a fo o d Pr o c e ssin g , EE C R= 8 1.6
Fe d e r a l GG o ve r n m e n t
So urce: IHS Global Ins ight, 2009
Ta b l e 2 8 . S o u t h w e s t C l u s t e r s
C l u s t e rI n d u s t r y D y n a m i s m ,
C A G R G r o s s O u t p u t , 2 0 0 9 - 1 9
E m p l o y m e n t C o n c e n t r a t i o n
R a t i o
E m p l o y m e n t2 0 0 8
C h a n g e i n E m p l o y m e n t ,
C A G R , 2 0 0 3 - 0 8
Federal Government 2.9% 1.7 574 4.7%Military 2.8% 4.2 1,039 -Fishing and Seafood Processing 2.6% 301.6 6,453 -1.2%Logistics and International Trade 1.4% 1.7 743 3.3%Travel and Tourism 2.6% 1.3 885 1.6%Forestry and Wood Products 7.4% 0.1 7 -39.4%Community and Social Services 4.1% 2.2 125 0.8%Advanced Business Services 8.4% 0.5 328 14.2%Specialized Machinery/Capital Goods 6.7% 0.1 18 43.1%Oil and Gas/Pipeline/Refinery - 0.5 63 -Mining (Excl. Oil and Gas) -10.2% 0.7 23 6.7%Source: IHS Global Insight, 2009

108
• Fishing aand sseafood pprocessing cluster is a very large cluster in the Southwest region. In 2008, thecluster employed 6,453 workers in the region—48% of the entire cluster in the state.
• Community aand ssocial sservices is a small star cluster in the region and employed 125 workers in2008. The cluster's ECR is 2.2 times the national average and it has above average industry dy-namism, estimated to be 4.1%.
• Logistics aand iinternational ttrade cluster is also highly concentrated with an ECR that is 1.7 times thenational average. The cluster however is not particularly dynamic in the Southwest region.
• Advanced bbusiness sservices cluster has the highest industry dynamism in the region estimated at8.4%. The cluster employed only 328 people and concentration is also very low at 0.5 in 2008
• Military employed 1,039 workers in the region in 2008. The employment concentration ratio of thesector is 4.2 times the national average.
Figure 448. SSouthwest CClusters
Cluster Indentification: Going Beyond the DataThe data and our analysis makes the case that Alaska has 11 clusters. Most of these are the industrysets that nearly everyone in Alaska would recognize as the basic engines of the economy—oil and gas,mining, forestry, fishing and tourism. The other clusters we have identified are smaller, but still show upin the data as clusters—trade and logistics, community services, etc. Most of these we could refer toas "seed clusters" or "clusters-in-the-making." They are yet to be fully developed and would presumablyrespond well to policy support.
But like any region, Alaska has other strengths that would not necessarily show up in this 4-digit leveldata, but nevertheless represent latent competitive advantage—faint signs of clusters on the horizon. Insome cases, these advantages lie within the University of Alaska, perhaps with a handful of experts in
A L A S K A F O R W A R D : P H A S E I S I T U A T I O N A L A N A L Y S I S
-1
0
1
2
3
4
5
6
7
8
9
10
-12.0% -10 .0% - 8.0% - 6.0% -4.0% -2.0% 0.0% 2.0% 4.0% 6.0% 8.0% 10.0%
In d u str y DD y n a m ism ((G r o ss OO u tp u t, CC A G R %% ), 22 009- 119
Empl
oym
ent CC
once
ntra
tion
RRatio
, EECR
((U.S
. AAve
rage
== 11
)
MMaattuu rree SStt aarr
T r a ve l aa n d TT o u r ism
M in in g
Lo g i st ic s aa n d In te r n a tio n a l TT r a d e
F o r e s tr y /W o o d PPr o d u c ts/
/ F u r n i tu r e
C o m m u n ity aa n d So c ia l SS e r v ic e s
OOpppp oorrttuu nniittyyCChh aallllee nnggee
A d v a n c e d B u sin e s s Se r v ic e s
S p e c ia lize d MM a c h i n e r y/ C a p i ta l GG o o d s
Fish in g aa n d S e a fo o d
Pr o c e s sin g
O il && GG a s/Pip e lin e /Re fin e r y
Mi lita r y
No te :1 . SS ize oo f cc i r c le rr e p r e se n ts ee m p lo ym e n t iin 2200 82 . FF o r FF ish in g aa n d SSe a fo o d PPr o c e ssin g , EE C R= 3 01 .6
F e d e r a l GG o ve r n m e n t
Sou rce: IHS G lobal Insigh t, 2009

A L A S K A F O R W A R D : P H A S E I S I T U A T I O N A L A N A L Y S I S
W W W . I H S G L O B A L I N S I G H T . C O M 109
one department. In other cases, these advantages might be with a small handful of entrepreneurs whohave specific know-how but haven't yet had a market breakthrough.
The diagram below shows the stages of development that clusters typically pass though.
Figure 449. SStages iin tthe EEvolution oof aa CCluster
The point is that, for the pre-clusters, certain concentrations of capabilities and know-how exist inAlaska, and thus should be included in any discussion of future economic directions. With the rightcombination of policy and other kinds of government and/or private sector support, such concentrationscould be more fully developed, be they mature clusters, seed clusters, or simply latent sources of com-petitive advantage.
Our team has identified the following potential areas of "latent competitive advantage" that don't appearto fall within the 11 clusters identified in this draft:
• Cold climate technology
• Rocket launch technology
• Cold climate housing
• Specialized super computing capabilities
• Distance delivery -- education, medical, and management services
• Alternative energy and clean-energy (bio fuels, clean coal/coal gasification, etc)
• Specialty solvents
• Light aircraft operations and maintenance/navigation
• Marine and arctic biological sciences/potential for aquaculture
• Remote communications technologies/systems
• Aerospace technology/operations
• Naturally grown/grazed food products
Going into the strategy development phase, the project should recognize these areas as economicstrengths and develop appropriate strategies for them.
© 1997 Economic Competitiveness Group, Inc.
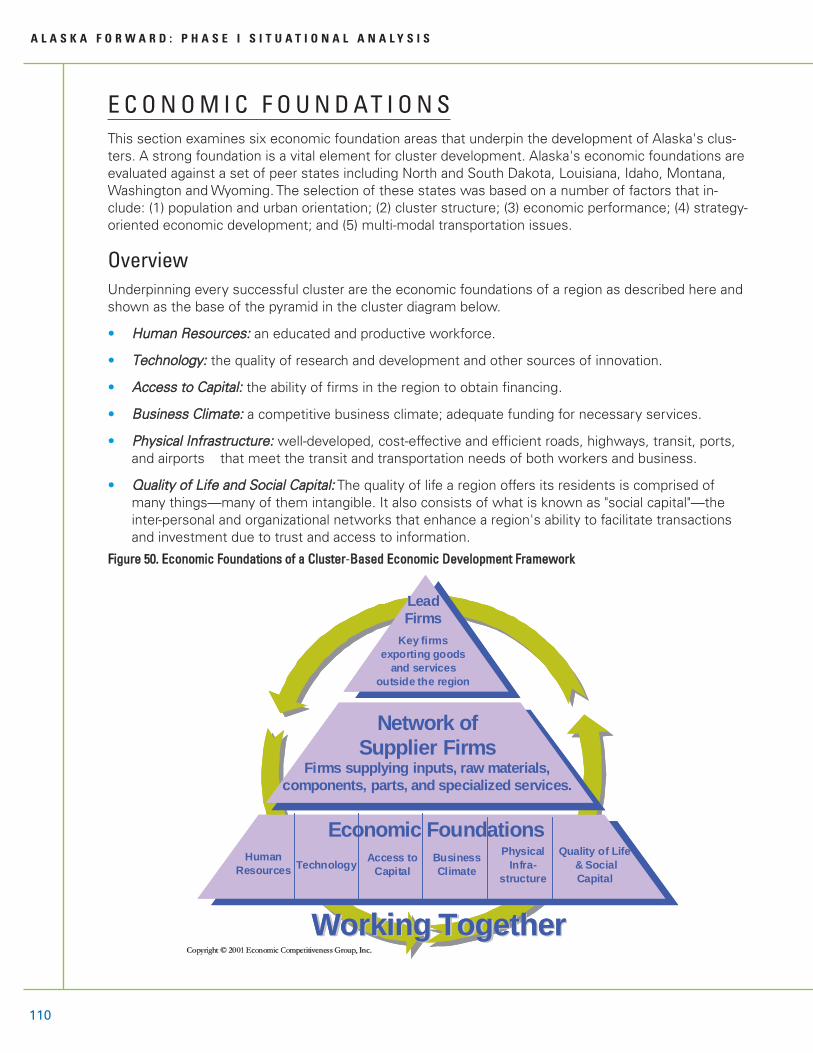
110
E C O N O M I C F O U N D AT I O N SThis section examines six economic foundation areas that underpin the development of Alaska's clus-ters. A strong foundation is a vital element for cluster development. Alaska's economic foundations areevaluated against a set of peer states including North and South Dakota, Louisiana, Idaho, Montana,Washington and Wyoming. The selection of these states was based on a number of factors that in-clude: (1) population and urban orientation; (2) cluster structure; (3) economic performance; (4) strategy-oriented economic development; and (5) multi-modal transportation issues.
Overview Underpinning every successful cluster are the economic foundations of a region as described here andshown as the base of the pyramid in the cluster diagram below.
• Human RResources: an educated and productive workforce.
• Technologgyy: the quality of research and development and other sources of innovation.
• Access tto CCapital: the ability of firms in the region to obtain financing.
• Business CClimate: a competitive business climate; adequate funding for necessary services.
• Phyysical IInfrastructure: well-developed, cost-effective and efficient roads, highways, transit, ports,and airports that meet the transit and transportation needs of both workers and business.
• QQualityy oof LLife aand SSocial CCapital: The quality of life a region offers its residents is comprised ofmany things—many of them intangible. It also consists of what is known as "social capital"—theinter-personal and organizational networks that enhance a region's ability to facilitate transactionsand investment due to trust and access to information.
Figure 550. EEconomic FFoundations oof aa CCluster-BBased EEconomic DDevelopment FFramework
A L A S K A F O R W A R D : P H A S E I S I T U A T I O N A L A N A L Y S I S
Working TogetherWorking Together
Technology Access to Capital
Business Climate
Physical Infra-
structure
Network of Supplier Firms
Firms supplying inputs, raw materials, components, parts, and specialized services.
LeadFirms
Key firms exporting goods
and servicesoutside the region
Copyright Copyright ©© 2001 Economic Competitiveness Group, Inc.2001 Economic Competitiveness Group, Inc.
Human Resources
Economic FoundationsQuality of Life
& Social Capital

A L A S K A F O R W A R D : P H A S E I S I T U A T I O N A L A N A L Y S I S
W W W . I H S G L O B A L I N S I G H T . C O M 111
This section provides summary statistics, or indicators, and a description of the major issues for each ofthese foundations for Alaska.
Peer State BenchmarkingTo assess the strength and performance of the state's economic foundations, this report has identifiedseven peer states with which to compare Alaska. These states were selected on the basis of a numberof criteria including: (1) population and urban orientation; (2) cluster structure (states with similar keyclusters were given extra weight in the selection process); (3) economic performance; (4) strategy-ori-ented economic development (regions that had followed or were developing a collaborative, state eco-nomic development strategy were preferred to those without a strategy); and (5) multimodaltransportation issues.
On the basis of these criteria, the following "peer regions" were identified:
• Louisiana
• Idaho
• Montana
• North Dakota
• South Dakota
• Washington
• Wyoming
To the extent possible, each of the economic foundations of Alaska examined in the following analysisis compared, or "benchmarked," with these peer states.
Human Resources Competitive economies require a workforce that has the necessary technical skills, the ability to con-tinue developing skills as technologies and markets change, and a commitment to perform high-qualitywork (i.e., a good work ethic). Education and job skill training are the primary ways by which the humancapital of a state is preserved and enhanced. The ability of the labor force, industry, educational andtraining institutions, statewide policy organizations, organized labor, and workforce development coun-cils to respond flexibly and work collaboratively are vital to a strong human resource foundation.
Population
A growing population is vital for labor force renewal. Over the last decade Alaska's population hasgrown by a compounded annual rate of 1%. Compared to the peer group this is in the middle of thepack. The population in North Dakota and Louisiana has changed very little between 1998 and 2008while Idaho's population growth was 2% compounded annually. Washington's population increased by1.3% compounded annually while South Dakota's population increased by 0.8% over the same period.Montana's population growth was very similar to Alaska's while in Wyoming the population growth wassomewhat slower.

112
Job opportunities and quality of life are two important factors that impact migration or population flowsbetween states. Migration out of Alaska has been significant in recent years and has been an importantpart of the population trend. From 1975 to 1985 the economy was booming led by the oil and gas sec-tor and migration into the state averaged 107,000 annually. The pattern reversed from 1998 to 2008,with out-migration of about 10,000 per year. The net outflow in 2008 was 3,200 about 0.5% of the pop-ulation. In the same year Idaho, Louisiana and South Dakota all experienced net population inflows of14,000, 12,400 and 2,370 respectively. Washington's net inflow of population was 59,820 in 2008 whilein North Dakota there was a small net outflow. Migration into the state was similar in Montana andWyoming in 2008.
A L A S K A F O R W A R D : P H A S E I S I T U A T I O N A L A N A L Y S I S
11..00%%
22..11%%
00..33%%
11..00%%
00..22%%
00..88%%
11..55%%
00..99%%
0.0%
0.5%
1.0%
1.5%
2.0%
2.5%
Alaska Idaho Louisiana MontanaNorth Dakota
South DakotaWashington State
Wyoming
Figure 551. PPopulation GGrowth AAmong PPeer SStates, 11990-22019(CAGR)
Sources: U.S. Census Bureau and IHS Global Insight, 2009
-33..22
1144..00 1122 ..4466..22
-00..33
22..4455..11
5599..88
-10
0
10
20
30
40
50
60
70
Alaska Idaho Louisiana MontanaNorth Dakota
South DakotaWashington State Wyoming
Figure 552. NNet MMigration, 22008(Thousands)
Source: U.S. Census Bureau

A L A S K A F O R W A R D : P H A S E I S I T U A T I O N A L A N A L Y S I S
W W W . I H S G L O B A L I N S I G H T . C O M 113
Work Force and Source Population
The source population for the labor force is more important than the overall population from the stand-point of economic performance. The source population is the working age population—those between25 and 64 years of age. Over the last 10 years, this segment of Alaska's population has grown morerapidly than the overall population at a compound annual rate of 1.2%. Based on IHS Global Insight pro-jections this part of the population will experience sharply slower growth over the next decade. This is acommon trend among the peer group.
Labor force participation in Alaska was 67.5% in 2008—in the middle of the peer group range. Participa-tion rates are higher in North and South Dakota at 71.8% and 70.7% respectively. Wyoming also has ahigh participation rate at 69.8%. The participation rate is lower in Louisiana at 60.5%. In Montana, Idahoand Washington the participation rate is similar to Alaska at 65.5%, 65.1% and 66.8% respectively. It'simportant note that Alaska has both a 'contemporary' urban and rural 'subsistence' economy. The ruraleconomy is a traditional subsistence economy that runs parallel and supplements the urban economy.As a result of the dual economy, published data for employment may underestimate the actual partici-pation rate.
Unemployment Rate
Unemployment rose across the board in 2008. The unemployment rate in Alaska was higher than thepeer group at 6.7%.68 The higher participation rates in North and South Dakota and Wyoming are ac-companied by low unemployment rates of 3.2%, 3% and 3.1% respectively. Unemployment rates inIdaho, Louisiana and Montana are in the middle of the range at 4.9%, 4.6% and 4.5% respectively. Theunemployment rate in Washington rose to 5.3% last year.
Wages
Alaska's average annual wage in 2008 was higher than most of its peer group members at $46,800.69
Average annual wages are lower than $35,000 in Idaho, North and South Dakota and Montana. Averageannual wages are similar in Louisiana and Wyoming at just over $41,000. Average annual wages are5.5% higher in Washington than Alaska at $49,374.
66..77%%
44..99%%44..66%% 44..55%%
33..22%% 33..00%%
55..33%%
33..11%%
0%
1%
2%
3%
4%
5%
6%
7%
Alaska Idaho Louisiana MontanaNorth Dakota
South DakotaWashington State Wyoming
Figure 553. UUnemployment RRate, 22008
Source: Bureau of Labor Statist ics
68 Published unemployment data are not very reliable for rural Alaska.
69 The cost of living in Alaska is considerably higher and offsets much of the perceived benefits of higher wages.

114
Educational Attainment
Education is a vital foundation for the workforce in a modern economy. The high school dropout ratehowever is alarmingly high in Alaska. The National Center for Education Statistics (NCES) U.S. Depart-ment of Education states that 8.2% of high school students dropped out in the 2004-05 school year.This is considerably higher than in the peer states; in fact, only Louisiana had a dropout rate that wasclose to Alaska. The dropout rate is considerably lower in Idaho, Montana and North Dakota. For report-ing states as a whole, the rate was 3.9%.
Higher dropout rates are commonly quoted in Alaska, however some of the definitions are inconsistentand include students that simply transfer to other schools or school districts. The NCES provides a con-sistent definition of "true" drop outs and also has the benefit of providing a consistent measure tobenchmark the state. The bottom-line message is that Alaska has abnormally high dropout rates.
A L A S K A F O R W A R D : P H A S E I S I T U A T I O N A L A N A L Y S I S
$41,163
$33,242
$49,374
$41,609
$34,960
$46,805
$34 ,932$34,178
$32,000
$36,000
$40,000
$44,000
$48,000
$52,000
Alaska Idaho Louisiana MontanaNorth Dakota
South DakotaWashington State Wyoming
FFiigguurree 5544.. AAvveerraaggee AAnnnnuuaall WWaaggeess,, 22000088
Source: Bureau of Economic Analysis
88..22%%
33..00%%
77..55%%
11..99%%
44..88%%44..55%%44..44%%
33..44%%
1%
2%
3%
4%
5%
6%
7%
8%
9%
Alaska Idaho Louisiana MontanaNorth Dakota
South DakotaWashington State Wyoming
Figure 555. EEvent DDropout RRate ffor GGrades 99-112, SSchool YYear 22004-005
Source: U.S. Department of Education, National Center for Education Statistics
70 The event dropout rate estimates the percentage of high school students who left high school between the beginning of one school year and the begin-ning of the next without earning a high school diploma or its equivalent. In contrast the average freshman graduation rate estimates the proportion of publichigh school freshmen who graduate with a regular diploma 4 years after starting 9th grade.
70

A L A S K A F O R W A R D : P H A S E I S I T U A T I O N A L A N A L Y S I S
W W W . I H S G L O B A L I N S I G H T . C O M 115
Despite the high dropout rate, a large numbers of Alaskans ultimately obtain a high school equivalency(either diploma or GED).71 The American Community Survey conducted by the Census Bureau statesthat over 90% of Alaskans have completed high school (or equivalency)—well above the national aver-age of 84.5% and higher than the peer states. In Louisiana only 80% of the population completed highschool. On the surface this data suggests that the Alaska workforce is well-educated however schoolsin rural areas are regularly criticized for graduating students without basic skills and employers regularlycomment that many entry-level workers cannot read, write or perform basic analytical functions.
An increasing number of occupations require education beyond high school. The American CommunitySurvey for 2008 tells us that 26.5% of the Alaska population held a bachelor's degree or higher, a higherproportion than in its peers with the exceptions of Washington and Montana. The national average wasonly slightly higher at 27.4%.
71 Alaska has the highest per capita level of GED holders in the country.
8844..55%%
9900..66%%
8877..99%%
8800..22%%
9900..55%%8899..00%% 8888..99%% 8899..33%%
9900..99%%
70%
75%
80%
85%
90%
95%
United States Alaska Idaho Louisiana MontanaNorth Dakota
South DakotaWashington State Wyoming
Figure 556. PPercentage oof PPopulation ((25 aand OOlder) WWho HHave CCompleted HHigh SSchool ((or EEquivalency)
Source: U.S. Census Bureau, 2006-08 American Community Survey
2277..44%%2266..55%%
2244..00%%
2277..11%%2266..11%%
3300..55%%
2233..33%%
2244..88%%
2200..44%%
14%
18%
22%
26%
30%
34%
United States Alaska Idaho Louisiana MontanaNorth Dakota
South DakotaWashington State Wyoming
Figure 557. PPercentage oof PPopulation ((25 aand OOlder) wwith BBachelor’s DDegree oof HHigher
Source: U.S. Census Bureau, 2006-08 American Community Survey

116
Occupational Forecast
In an ever changing economy matchingthe skill set of the labor force with theneeds of employers is an important chal-lenge. Early in 2009 Alaska's Departmentof Labor and Workforce Development pub-lished a 10 year forecast for major occupa-tional categories. The forecast has overallemployment for all industries increasingby 14% over the period from 2006 to2016.72 Over that period the health careand social assistance industry is projectedto outperform the average—employmentgrowth will approach 25%. Employment inthe utilities industry and professional, sci-entific and technical services are also pro-jected to grow rapidly at 28% and 25%respectively. Mining and the arts, enter-tainment and recreation industries willalso post well above average employmentgrowth. Underperforming industries in-clude government, manufacturing and in-formation services. Agriculture as well asthe forestry and logging industries willcontinue to lose jobs over the forecast.
Every industry employs workers in a mix ofoccupations. The industry employmentforecast is the basis for the occupation pro-jection. The fastest growing occupationswill be concentrated in communication andhealthcare related industries. Fast growingoccupations are network and data commu-nication analysts, medical assistants, nurs-ing aides, environmental engineertechnicians, and pharmacy technicians, etc.Declining occupations include file clerks,computer operators, mail clerks, floral de-signers, editors, data entry keyers, andradio and television announcers, etc.
The study has another interesting dimen-sion—the amount of education and train-ing that will be required for these jobopenings. Eighteen percent will require abachelor's degree or more while only
about 10% will require an associate's degree or vocational training. Over the 10 year period about 60%of these job openings will require less than a year of on-the-job training.
A L A S K A F O R W A R D : P H A S E I S I T U A T I O N A L A N A L Y S I S
72 The Department of Labor forecast is considerably stronger than the IHS Global Insight base case forecast for employment to 2016.
Ta b l e 2 9 . F a s t e s t - G r o w i n g O c c u p a t i o n s i n A l a s k a ,2 0 0 6 - 1 6
P e r c e n t N u m b e r o fO p e n i n g s
Network Systems and Data Communication Analysts 46.1% 140
Medical Assistants 41.5% 430
Environmental Engineering Technicians 36.4% 170
Nursing Aides, Orderlies and Attendant 35.5% 860
Home Health Aides 35.3% 830
Pharma Technicians 34.6% 300
Personal and Home Care Aides 33.7% 1,210
Pharmacists 33.6% 150
Physical Therapists 32.4% 140
Interviewers, Except Eligibility and Loan 32.2% 50
Respiratory Therapists 31.5% 70
Millwrights 31.5% 70
Registered Nurses 31.4% 2,310
Physician Assistants 30.7% 160
Recreational Therapists 30.5% 60
Source: Alaska Department of Labor and Workforce Development, Research and Analysis Section
Bachelor's Degree, 18.4%
Long-Term On-the-Job
Training, 7.3%
Experience in a Related
Occupation, 4.4%
Moderate-Term On-the-Job Training,
17.0%
Associate Degree or Vocational
Traning, 9.7%Short-Term On-
the-Job Training, 43.2%
FFiigguurree 5588.. RReeqquuiirreedd EEdduuccaattiioonn aanndd TTrraaiinniinngg LLeevveell ffoorr JJoobb OOppeenniinnggss,, 22000066-1166
Sources: Alaska Department of Labor and Workforce Development, Research and Analysis Section; US Department of Labor, Bureau of Labor Statistics

A L A S K A F O R W A R D : P H A S E I S I T U A T I O N A L A N A L Y S I S
W W W . I H S G L O B A L I N S I G H T . C O M 117
Nonresident Workers in Alaska
Nonresident workers are prevalent in Alaska. There are a variety of factors for the large number of non-resident workers. There is a persistent shortage of skilled workers in the state. In addition to this thereare significant numbers of seasonal jobs in the commercial fishery and tourism sectors. Nonresidentworkers made up just less than 20% of the total workforce in 2007. The share was as high as 22.6% in1995 and it has trended slightly up since 2000.
The share of nonresidentworkers is highest inseafood processing fol-lowed by accommodationservices at 41.0%. Someof the highest paying jobsin Alaska are held by nonresident workers, for ex-ample, in oil and gas sec-tor, where average annualwage is over $100,000.The share of nonresidentworkers in the oil and gassector was 25.9% in 2007.Seafood processing, ac-commodation services andoil and gas sectors com-
bined together also account for high shares of nonresident wages in the state.
The Workforce Development System
Workforce development programs bring together industry partners, various vocational training agenciesand universities to meet the needs of the economy. These programs offer continuing education and de-velopment opportunities to keep incumbent workers current in their jobs.
16%
17%
18%
19%
20%
21%
22%
23%
1995 1996 1997 1998 1999 2000 2001 2002 2003 2004 2005 2006 2007
FFiigguurree 5599.. PPeerrcceennttaaggee ooff NNoonnrreessiiddeenntt WWoorrkkeerrss iinn tthhee TToottaall WWoorrkkffoorrccee
Source: Alaska Department of Labor and Workforce Development, Research and Analysis Section
Ta b l e 3 0 . N o r e s i d e n t Wo r k e r s b y I n d u s t r y i n 2 0 0 7
I n d u s t r y To t a l W o r k e r s N o n r e s i d e n tW o r k e r s
P e r c e n t a g e o fTo t a l W o r k e r s
Manufacturing 26,811 16,962 63.3Agriculture, Forestry, Fishing and Hunting* 1,736 618 35.6Mining (Including Oil and Gas) 18,617 5,442 29.2Transportation and Warehousing 26,290 6,340 24.1Construction 28,155 5,341 19.0Utilities 2,242 148 6.6Services 221,287 38,720 17.5Government 75,844 5,571 7.3Total 401,427 79,299 19.8* Does not include fish harvesting employment numbersSource: Alaska Department of Labor and Workforce Development, Research and Analysis Section

118
The University of Alaska develops and executes workforce development programs. In the late 1980s theAnchorage Community College merged with the University of Alaska Anchorage and the College of Com-munity and Continuing Education and the College of Career and Vocational Education were created. TheCommunity & Technical College annually serves more than 6,000 students through 40 programs, leadingto occupational endorsement and undergraduate certificates, associate of applied science and baccalau-reate degrees, a master's degree and a post-baccalaureate dietetic intern program.
The University of Alaska Corporate Program was launched in 1999. It acts as the point of contact forbusiness and industry to access the university's expertise and resources for continuing education andtraining. The program through its partnership with the State of Alaska Department of Transportation andPublic Facilities provides logistical support for training and the coordination of training locations. TheUACP works to develop new training or present existing training on required topics, and has been in-volved in several research projects.
The university responds to workforce needs by expanding existing programs or developing new ones. Forexample, in response to the ongoing shortage of nurses in Alaska, UAA's School of Nursing expanded itsnursing program in Anchorage and added two-year nursing programs in Fairbanks, Juneau, Kodiak, Bethel,Kenai, Ketchikan and Stika. The university also works closely with business and industry partners to de-velop programs to fit their needs. For example, the University of Alaska Fairbanks' Tanana Valley Campusand the UAA Community and Technical College recently established a new associate's degree in construc-tion management. The program, which was developed with input from local contractors and professionalorganizations, is designed to meet the high demand for skilled employees in the construction industry.
The Alaska Human Resources Investment Council developed a plan to guide a workforce developmentsystem that is needs-driven, accessible, interconnected, accountable, sustainable, and has collaborativegovernance. The development plan has two main objectives—achieving statewide alignment of second-ary and post-secondary programs and improving the quality of existing tech prep opportunities. It willbe implemented through Vocational Technical Education Providers (VTEP) by identifying existing models,disseminating information, and providing both professional development and training statewide usingface-to-face, distance, and mobile methods. The VTEP represents secondary education, technicalschools, proprietary institutions, union apprenticeship-training organizations, the University of Alaska,business education consortia, rural and urban representatives, and Alaska Workforce Investment Board.
The Alaska Works Partnership (AWP) was formed by Alaska's construction trade unions to build anAlaska construction workforce. The jointly administered trade apprenticeship program represents thelargest private sector training enterprise in Alaska. The AWP delivers services in partnership withAlaska's Building Trades unions, the Alaska Department of Labor and Workforce Development, the U.S.Department of Labor, the Alaska Construction Academy, and the Denali Training Fund. For example theHelmets to Hardhats program is in place to transition men and women from the Armed Forces into ca-reers in building and construction. The program works closely with transition offices of the NationalGuard, Army, Air Force, and Coast Guard in Alaska and ADOLWD Veteran representatives.
Access to CapitalThe ability of firms to obtain the start-up and operating capital they need is essential to any state's eco-nomic health. In Alaska several trends regarding access to capital are apparent:
• Loans to micro and small businesses is low compared to the peer states.
• Alaska InvestNet is the only organization serving the venture capital market in Alaska.73 The demo-graphic and physical infrastructure environments in the state are the main factors behind low entre-preneurial activity and limited availability of venture capital.
A L A S K A F O R W A R D : P H A S E I S I T U A T I O N A L A N A L Y S I S
73 Alaska InvestNet is now largely defunct.

A L A S K A F O R W A R D : P H A S E I S I T U A T I O N A L A N A L Y S I S
W W W . I H S G L O B A L I N S I G H T . C O M 119
Small Business Lending and Micro Business Lending
The availability of credit lending facilities and free flow of capital is essential for local small businessesto flourish and in turn for the development of the state economy. However Alaska's small businessesare under-served by the banking sector. In 2007, total small business lending (loan amount less than $1million) and micro business lending (loan amount less than $100,000) was $1.13 billion. This amounts to2.5% of gross state product and is low compared to the peer group of states. Total loans as a percentof GSP was highest in Montana at 6.1% and also quite high in Idaho. South and North Dakota, Wash-ington and Louisiana occupy the middle ground while the lending ratio is very low in Wyoming.
The under-developed nature of the bankingsector is evident by low employment concen-tration ratio of the banking and financial serv-ices sector. Only the real estate sector hademployment concentration similar to the na-tional average in 2008. Commercial banking,securities and investment and insurance havebelow average concentration.
Venture Capital
Venture capital is financing for startup firmsthat are deemed to have long term growth potential. In practice most venture capital comes fromwealthy investors who like to have a hand in the important decision making functions of the firm. Alter-natively angel investors provide loans at rates more favorable than commercial banks. Angel investorswill take a more hands-off approach. Their aim is to help a business succeed rather than profiting fromtheir investment. Seed capital is the initial capital that is required to start a business and is consideredto be a high-risk investment.
Venture capital is scarce in Alaska. The state's geography and physical infrastructure do not provide nec-essary support for new and small businesses to grow and prosper. Investors from outside of the state
Ta b l e 3 1 . S m a l l a n d M i c r o B u s i n e s s L e n d i n g , 2 0 0 7
S m a l l B u s i n e s sL o a n s *
( M i l l i o n $ )
M i c r o B u s i n e s sL o a n s * *
( M i l l i o n $ )
To t a l L o a n s( M i l l i o n $ )
To t a l L o a n s a s P e r c e n t a g e
o f G S P
Alaska 760 371 1,132 2.5%
Idaho 1,806 886 2,692 5.2%
Louisiana 4,263 1,597 5,859 2.8%
Montana 804 568 1,372 6.1%
North Dakota 627 267 894 3.1%
South Dakota 925 400 1,325 3.8%
Washington State 6,813 3,126 9,939 3.2%
Wyoming 224 240 464 1.1%
* Only lenders with small business loan (loan<$1 Million) totals of more than $50 million are considered ** Only lenders with micro business loan (loan<$100,000) totals of more than $10 million are considered
Sources: SBA Office of Advocacy, Small Business Lending and Micro Business Lending in the United States, for Data Years2007-08; and IHS Global Insight, 2009
Ta b l e 3 2 . E m p l o y m e n t C o n c e n t r a t i o n R a t i o , F i n a n c i a l S e r v i c e S e c t o r, 2 0 0 8
I n d u s t r y E m p l o y m e n t C o n c e n t r a t i o nR a t i o , 2 0 0 8
Commercial Banking 0.87
Securities and Investment 0.33
Insurance 0.38
Real Estate 1.03
Source: IHS Global Insight, 2009

120
are less likely to fund projects in Alaska primarily because of their perceived high-risk nature. Venturecapitalists like to have a hand in the management of businesses they are funding and proximity to theactual business location matters when financing a venture capital project.
Alaska InvestNet is the only organization serving the venture capital market. It was established in 1998by an Alaska Science and Technology Foundation grant. It provides services and education to entrepre-neurs and investors in Alaska. The organization also facilitates business relationships and catalyzes theformation of venture capital in Alaska. One of InvestNet's important objectives is to address the "braindrain."
Technology Tomorrow's truly competitive regions will have found mechanisms for providing ongoing support to re-search, discovery and the development of new ideas and products. The ability and flexibility of a re-gion's research institutions, both private and public to innovate will be increasingly crucial to the typesof companies and economic activity that will be generated in that region. Technologycommercialization—or the bringing of new ideas to market will be crucial.
Technology Commercialization
Alaska stands below the national average in R&D spending. In 2005, the state spent $266 million onR&D activities—0.7% of gross state product and ranked 45 among all states. Among the peer group,R&D spending as a percentage of gross state product was very high for Washington State at 4.37%,followed by Idaho at 2.24%, and North Dakota at 1.14%. R&D spending as a percentage of gross stateproduct in Louisiana, South Dakota and Wyoming were also quite low at about 0.5%.
Private industry in Alaska spent only $32 million on R&D in 2005 and contributed only 12% of total R&Dspending in the state. This is very low compared to the national average and the peer group of states.At the national level, industry contributed 70% of total R&D spending in the same year. In Washington,private industry contributed 82.1% of the total R&D spending. Private industry's contribution was alsovery high in Idaho at 62.3% followed by South Dakota at 43.3%. Industry in Montana and Wyomingcontributed less than 25% of total R&D spending.
A L A S K A F O R W A R D : P H A S E I S I T U A T I O N A L A N A L Y S I S
2.6%
0.7%
2.2%
0.5%
1.1% 1.1%
0.5%
4.4%
0.5%
0%
1%
2%
3%
4%
5%
United States Alaska Idaho Louisiana MontanaNorth Dakota
South DakotaWashington State Wyoming
FFiigguurree 6600.. RR&&DD SSppeennddiinngg aass PPeerrcceennttaaggee ooff GGrroossss SSttaattee PPrroodduucctt,, 22000055
Sources: National Science Foundation and Bureau of Economic Analysis

A L A S K A F O R W A R D : P H A S E I S I T U A T I O N A L A N A L Y S I S
W W W . I H S G L O B A L I N S I G H T . C O M 121
The majority of R&D activities in Alaska are performed by universities. The R&D activities are primarilyfocused on marine, ocean and biological science, arctic health and social welfare, and resources devel-opment. In 2005, universities in Alaska contributed 57.9% of total R&D spending in the state which ismuch higher than the 14% national average. Among its peer states university R&D in Louisiana, NorthDakota, and South Dakota was 60%, 52.6%, and 42.7% respectively of the total R&D spending. InWashington state university R&D spending was only 7.6% of the state total.
There has been very little effort by universities in Alaska to convert research outcomes into commer-cially viable technology. Alaska stands below its peer member states and the national average in termsof cumulative patents registered per million inhabitants between 1977 and 2008. During that period thenumber of patents granted for Alaska was 1,760 per one million inhabitants. Idaho has the highest num-ber of patent registered per million inhabitants at 13,626 followed by Washington at 7,185. Over thesame period the national average of patent registration per million inhabitants was 6,891.
To foster technology commercialization and business development in Alaska, the legislature provided a$100 million endowment to Alaska Science and Technology Foundation (ASTF) in 1998. The ASTF, how-ever, was closed and the endowment was withdrawn in 2003.
0%
10%
20%
30%
40%
50%
60%
70%
80%
90%
United States Alaska Idaho Louisiana MontanaNorth Dakota
South DakotaWashington State Wyoming
Industry
University
FFiigguurree 6611.. RR&&DD SSppeennddiinngg bbyy IInndduussttrryy aanndd UUnniivveerrssiittyy,, 22000055(Percentage of total R&D spending)
Source: National Science Foundation
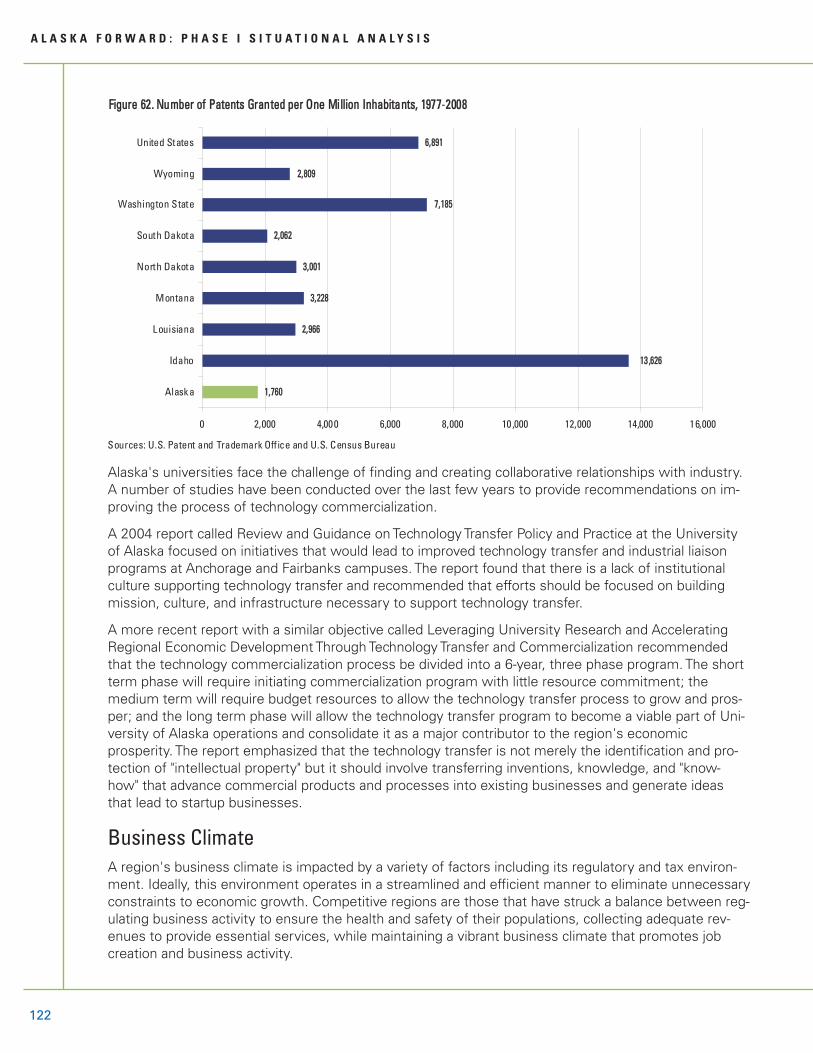
122
Alaska's universities face the challenge of finding and creating collaborative relationships with industry.A number of studies have been conducted over the last few years to provide recommendations on im-proving the process of technology commercialization.
A 2004 report called Review and Guidance on Technology Transfer Policy and Practice at the Universityof Alaska focused on initiatives that would lead to improved technology transfer and industrial liaisonprograms at Anchorage and Fairbanks campuses. The report found that there is a lack of institutionalculture supporting technology transfer and recommended that efforts should be focused on buildingmission, culture, and infrastructure necessary to support technology transfer.
A more recent report with a similar objective called Leveraging University Research and AcceleratingRegional Economic Development Through Technology Transfer and Commercialization recommendedthat the technology commercialization process be divided into a 6-year, three phase program. The shortterm phase will require initiating commercialization program with little resource commitment; themedium term will require budget resources to allow the technology transfer process to grow and pros-per; and the long term phase will allow the technology transfer program to become a viable part of Uni-versity of Alaska operations and consolidate it as a major contributor to the region's economicprosperity. The report emphasized that the technology transfer is not merely the identification and pro-tection of "intellectual property" but it should involve transferring inventions, knowledge, and "know-how" that advance commercial products and processes into existing businesses and generate ideasthat lead to startup businesses.
Business ClimateA region's business climate is impacted by a variety of factors including its regulatory and tax environ-ment. Ideally, this environment operates in a streamlined and efficient manner to eliminate unnecessaryconstraints to economic growth. Competitive regions are those that have struck a balance between reg-ulating business activity to ensure the health and safety of their populations, collecting adequate rev-enues to provide essential services, while maintaining a vibrant business climate that promotes jobcreation and business activity.
A L A S K A F O R W A R D : P H A S E I S I T U A T I O N A L A N A L Y S I S
11,,776600
22,,996666
33,,222288
33,,000011
22,,006622
77,,118855
22,,880099
66,,889911
1133 ,,662266
0 2,000 4,000 6,000 8,000 10 ,000 12,000 14,000 16,000
Alaska
Idaho
Louisiana
Montana
North Dakota
South Dakota
Washington State
Wyoming
United States
Figure 662. NNumber oof PPatents GGranted pper OOne MMillion IInhabitants, 11977-22008
Sources: U.S. Patent and Trademark Off ice and U.S. Census Bureau

A L A S K A F O R W A R D : P H A S E I S I T U A T I O N A L A N A L Y S I S
W W W . I H S G L O B A L I N S I G H T . C O M 123
Change in the Number of Establishments
Alaska has a vibrant economy as evidenced by the 122 new business establishments in the large ma-ture clusters in the state during the five year period ending 2008. This represents a 12% increase incluster establishments in Alaska and compares favorably with the national total. The largest increase inestablishments was in the mining sector followed by oil and gas and logistics and international trade.The only mature cluster that had a reduced establishment count over the period was fishing andseafood processing.
Business Starts and Closures
According to the U.S. Small Business Administration Alaska has both a high rate of business creationand termination.74 Alaska ranked 11th in the nation in business creation rate and 10th in business termi-nation rate in 2008. The business creation and termination rates were 14.1 per 1000 workers and 14.6per 1000 workers respectively. Alaska stands next to Idaho, Montana and Wyoming for rates of open-ing and closing. Louisiana, North and South Dakota and Washington experienced lower rates of busi-ness opening and closing in 2008.
Alaska had a net business creation rate (difference between business creation and termination rate) -0.5 in 2008. The net business creation rate is the lowest for Idaho at -2.5. Louisiana, Washington andSouth Dakota had negative net business creation rate. In North Dakota the net business creation ratewas positive at 0.8 in 2008.
-20%
0%
20%
40%
60%
80%
100%
120%
United StateAlaska Idaho
LouisianaMontana
North Dakota
South Dakota
Washington StateWyoming
Fishing and Seafood Processing
Logist ics and International Trade
Mining (excl. Oil and Gas)
Oil and Gas
Figure 663. PPercent CChange iin NNumber oof EEstablishments, 22003-008
Source: IHS Global Insight, 2009
74 Defined as the number of new establishment opening and closings per 1000 workers.

124
The Small Business and Enterprise Council maintain an indicator that evaluates the environment forsmall business and provides a ranking for all states. The Small Business Survival Index is a composite of34 measures.75 In 2008 Alaska has the 16th most-friendly environment for entrepreneurship accordingto this measure. South Dakota ranks 1st among the peer states, followed by Wyoming (3rd), Washing-ton (5th), North Dakota (22nd), Louisiana (27th), Montana (33rd) and Idaho (35th).
The Milken Institute maintains a Risk Capital and Entrepreneur Infrastructure index. The index measuresthe number of capable entrepreneurs and risk capital available to support the conversion of researchinto commercially viable technology products and services. The index is based on 11 indicators which in-clude: venture capital investment in technology (clean and nanotechnology), total venture capital invest-
A L A S K A F O R W A R D : P H A S E I S I T U A T I O N A L A N A L Y S I S
0
2
4
6
8
10
12
14
16
18
20
22
24
Alaska Idaho Louisiana MontanaNorth Dakota
South DakotaWashington State Wyoming
Business Opening Per 1000 Workers
Business Closing Per 1000 Workers
Figure 664. BBusiness CCreation aand TTermination RRate, 22008
Source: U.S. Small Business Administration, Off ice of Advocacy
-00..55
-22..55
-00..55
-11..00
00..88
-00 ..11
-00..99
00 ..22
-3.0
-2.5
-2.0
-1.5
-1.0
-0.5
0.0
0.5
1.0
Alaska IdahoLouisiana
MontanaNorth Dakota
South Dakota
Washington StateWyoming
Figure 665. NNet BBusiness CCreation RRate, 22008
Source: U.S. Small Business Administration, Office of Advocacy
75 The indicator incorporates various tax rates including: personal income tax, capital gains tax, corporate income tax, alternative minimum tax, propertytax, sales tax, gas tax, diesel tax and death tax. It also incorporates electricity costs, workers' compensation costs, crime rate, right to work, number ofgovernment employees and per capita state and local government spending. There are a number of other indicators that are incorporated.

A L A S K A F O R W A R D : P H A S E I S I T U A T I O N A L A N A L Y S I S
W W W . I H S G L O B A L I N S I G H T . C O M 125
ment growth, patents issued, proceeds generated by initial public offerings as percent of GSP, numberof firms receiving venture capital, number of business startups, number of business incubators, and av-erage annual small business investment companies funds disbursed. Alaska's overall score is 21.71 in
2008 (lowest in the country). Among peer states, Washington has the highest score at 71.82, followedby Idaho at 54.50, South Dakota at 53.78, Louisianan at 49.45 and Wyoming at 44.
Regulatory and Tax Issues
There are four primary prerequisites to a sound tax system: taxation needs to be broadly based, statu-tory rates are low and administration and compliance are not difficult. According to the Tax Foundation,an independent, non-profit research organization in Washington, D.C., Alaska's business tax climateranks third in the nation.76 Among the peer states, South Dakota is ranked first in the nation. The busi-ness tax climate is not as favorable in the other peer states: Washington state is ranked 9th, Idaho isranked 18th, North Dakota is ranked 25th and Louisiana is ranked 35th.
Alaska received the number one ranking on individual income tax index from the Tax Foundation along withFlorida, Nevada, South Dakota, Texas, Washington and Wyoming because these states do not levy an indi-vidual income tax. Another indication of lower tax is that in 2009, Alaska taxpayers had to work until March23 (50th rank nationally) to pay their total tax bill, 21 days before national Tax Freedom Day (April 13).
Alaska also does not levy general sales tax or use tax on consumers along with Delaware, New Hamp-shire, Montana and Oregon and the state has the lowest gasoline tax in the nation at 8 cents per gallon.Before the Trans-Alaska pipeline was finished in 1977, taxpayers in Alaska bore the second-highest taxburden in the country. By 1980, with rising oil tax revenue, Alaska repealed its personal income tax andstarted sending out Permanent Fund dividend checks instead. In addition, Alaska taxpayers receivemore federal funding per dollar of federal taxes paid compared to the average state. In 2005, Alaska re-ceived $1.84 in federal funding per dollar tax paid and ranked 3rd highest among all states.
Alaska's state and local tax burden is consistently the lowest among states. In 2008, Alaskans paid anaverage of $2,871 in state and local taxes per capita (6.4% of income per capita). Among the peerstates, Wyoming was next lowest at 7%. The state and local tax burden was highest for Idaho at 10.1%
2211..7711
5544..55
4499..4455
3388..55773366..2255
5533..7788
7711 ..8822
4444
10
20
30
40
50
60
70
80
Alaska Idaho Louisiana MontanaNorth Dakota
South DakotaWashington State Wyoming
Source: Milken Institure
Figure 666. RRisk CCapital aand EEntrepreneurial IInfrastructure CComposite IIndex, 22008
76 This rank is a composite of five other ranks: corporate tax index rank, individual income tax rank, sales and gross receipts tax index rank, unemploymentinsurance tax rank, and the fiscal balance index rank. For more information, visit the Tax Foundation's website at: http://www.taxfoundation.org.

126
of income per capita, followed by North Dakota at 9.2%, Washington State at 8.9%, Montana at 8.6%,Louisiana at 8.4% and South Dakota at 7.9%. The national average was 9.7% in the same year.
A composite of five other ranks, this indexdemonstrates that the state has heavy relianceon corporate tax and unemployment insurancetax. Alaska's corporate tax structure consists often separate brackets with a top rate of 9.4%starting at an income level of $90,000. In 2007,Alaska's state-level corporate tax collections (ex-cluding local taxes) reached $1,196 per capita,which ranked highest in the nation.
Alaska and New Jersey are the onlytwo states that tax employees inorder to pay for part of benefitcosts of unemployment insurance(UI). The benefit cost is expressedas the ratio of the amount of bene-fits paid in the current year to thetotal payroll during the previousyear. This ratio is called the benefitcost rate (BCR). Over the 10-yearperiod from 1990 to 1999, BCR av-eraged 2.1% in Alaska. In general,the average benefit cost rate inAlaska is higher than in other statesdue to the seasonality of much em-ployment, and the fact that a largerproportion of the unemployed re-ceives UI benefits in Alaska than inany other state.
A L A S K A F O R W A R D : P H A S E I S I T U A T I O N A L A N A L Y S I S
99..77%%
66..44%%
1100..11%%
88..44%% 88..66%%
99..22%%
77..99%%
88..99%%
77..00%%
4%
6%
8%
10%
12%
United State Alaska Idaho Louisiana MontanaNorth Dakota
South DakotaWashington State Wyoming
Figure 667. SState aand LLocal TTaxes aas PPercentage oof IIncome, 22008
Source: Tax Foundation, 2009
Non-Business Tax, 0.90%
Petroleum Property Tax,
1.02%
Excise Tax, 2.05%
Incom e Tax, 9.86%
Fisheries Business Tax,
0.18%
Severance Tax, 85.99%
Business Tax, 99.10%
FF iigguu rree 6688 .. BBuuss iinnee ssss TTaaxx SShhaarree ii nn AAllaasskkaa,, 22 000088
Source: Alaska Department of Revenue-Tax Division, 2008
Ta b l e 3 3 . A l a s k a Ta x C l i m a t e R a n k i n g s , 2 0 0 8
Ty p e o f Ta x I n d e x R a n k
Corporate Income Tax Index 26
Individual Income Tax Index 1
Sales Tax Index 5
Unemployment Insurance Tax Index 29
Property Tax Index 15
Overall Rank 3Source: Tax Foundation, 2009

A L A S K A F O R W A R D : P H A S E I S I T U A T I O N A L A N A L Y S I S
W W W . I H S G L O B A L I N S I G H T . C O M 127
Business taxes occupy a 99% share of all tax revenue in the state because Alaska does not levy individ-ual income tax and state sales tax. The business tax revenue can be divided into two broadcategories—oil tax revenue and non-oil tax revenue. In 2006, non-oil taxes revenue was $414.8 millionor 18% of the total tax revenue. According to the Alaska Department of Revenue's report published inSeptember 2007, over 2006-2011, oil tax revenue is projected to decline at an average rate of 2% a year,while non-oil tax revenue is projected to increase at an average rate of 4%. Some of the major sourcesof non-oil tax revenue are corporate income tax, tobacco product tax, insurance premium, mining li-cense tax, fishery tax, commercial passenger vessel tax, motor fuel tax, and alcohol tax.
Utilities
The cost of utilities can have an important impact on the business climate. The cost of utilities variesgreatly across the state.77 The ACCRA cost of living index measures the cost of living in U.S. cities. In2008 the city of Anchorage had an ACCRA index number of 97.7 associated with the cost ofutilities—similar to utility costs in other U.S. cities. In Fairbanks and Kodiak the cost of utilities indexwas much higher at 199.2 and 146.2, respectively. This gap is especially drastic in the rural areas ofAlaska. The cost of water and sewer can reach as high $150 per month in rural areas, compared to $49per month in Anchorage. The huge gap in costs is due to the lack of infrastructure in rural areas. Manyof these areas lack roads altogether, so installing sewer or electrical systems is a costly undertaking.
Environmental Protection
The regulatory environment of balancing environmental and development concerns in Alaska is a com-plex and widely debated topic. The industry in the state operates in overlapping jurisdictions of federal,state and local governments which often have competing goals. The state and federal permit-reviewprocesses are criticized as too long and fragmented. The most important state-level environmental influ-ences are habitat preservation regulations and the Alaska Constitution's requirement that resources bemanaged for the "maximum benefit of Alaska's people" and that renewable resources be managed ac-cording to "sustained yield" principles.
The state and federal government employ a number of environmental restrictions in order to protectAlaska's rich wilderness. The National Environmental Policy Act (NEPA) defines and enforces the lengthy
77 The Index measures relative price levels for consumer goods and services in participating areas. The average for all participating places in each quarterequals 100, and each participant's index is read as a percentage of the average for all participating places.
0 50 100 150 200 250
Anchorage, AK
Fairbanks, AK
Kodiak, AK
Seatt le, WA
Spokane, WA
Tacoma, WA
Bellingham, WA
Fargo, ND
Figure 669. AACCRA UUtility CCost IIndex, 22008
Source: American Chamber of Commerce Research Association (ACCRA), Cost of Living Index

128
and elaborate Environmental Assessment and Environmental Impact Statement processes that federalagencies must adhere to when they take actions affecting the environment. The forests of Alaska are pro-tected by regulation on timber volume for the state and the Wilderness act that restricts the activitieswilderness portions of Alaska's two national forests (Tongass and Chugach). Air quality is protectedthrough the use of a permit and a compliance program for stack discharge. In 2006 voters approved a $50per passenger tax on cruise ships entering the state. A portion of this tax goes to a group of observers onboard who monitor the ships' environmental compliance. Oil Spill Prevention and Response (SPAR) regula-tions impose stringent requirements on any kinds of oil storage or shipment over land or water.
Given the competing goals and lack of clear scope of various environment protection acts, disagreementbetween federal and state regulation authorities appear from time to time. The current disagreement be-tween Alaska and the federal government over whether to allow hunting for polar bear is an example.
Physical InfrastructureRail
The Alaska Railroad spans north from Seward and Whittier to Fairbanks and serves both passengersand freight. Freight trains typically carry coal, petroleum, sand and gravel, and manufactured goods. In2008, trains on the Alaska Railroad carried 542,671 passengers and 6.1 million tons of freight. Themajor railroad operation is state-owned Alaska Railroad, but another railroad, located in Skagway, theWhite Pass & Yukon Route, serves the Southeast Alaska visitor market with daily summertime excur-sions to the scenic White Pass Summit.
Airports
The busiest airport in Alaska is Ted Stevens Anchorage International Airport. The airport handles passen-ger and cargo transport. According to the Airports Council International, the Ted Stevens Anchorage In-ternational Airport is the fifth busiest airport in the world in terms of cargo traffic. The airport handled2.3 million metric tons of cargo in 2008. Fairbanks International Airport is another airport which handlesa lot of cargo traffic. The airport is often used as a refueling stop for trans-polar air shipments.
There are over 600 airports in Alaskaand approximately 3,000 airstrips. Thisis in large part due to the state's limitednumber of paved roads. According tothe Statewide Transportation PolicyPlan, 30% of the population and mostof the natural resources in Alaska arenot connected by road and ferry sys-tems. As a result aviation is the primarymeans of transportation in many partsof the state. Nearly all mail in Alaska iscarried on an airplane during some partof its delivery. The U.S. Postal Servicesis required to provide mail service to allU.S. locations, so air service was devel-oped out of necessity to reach rural resi-dents. Two federal subsidies areimportant to air service in rural Alaska.Bypass Mail is meant to reduce thecost of goods transported by air to rural
A L A S K A F O R W A R D : P H A S E I S I T U A T I O N A L A N A L Y S I S
88..22%%
00..11%%
00..11%%
00..22%%
00..11%%
00..00%%
00..00%%
00..00%%
00..11%%
11..00%%
00..22%%
00..00%%
0% 1% 2% 3% 4% 5% 6% 7% 8% 9%
Anchorage AK
Fairbanks AK
Boise ID
New Orleans LA
Shreveport LA
Baton Rouge LA
Lafayette LA
Bismarck ND
Sioux Falls SD
Seattle W A
Spokane WA
Pasco WA
Figure 770. PPercentage oof NNorth AAmerican AAir CCargo VVolume, 22008
Source: Airport Council International

A L A S K A F O R W A R D : P H A S E I S I T U A T I O N A L A N A L Y S I S
W W W . I H S G L O B A L I N S I G H T . C O M 129
communities. Essential Air Service is a program that subsidizes the cost of air service to communitiesin Alaska and elsewhere in the U.S. that are especially dependent on air transportation
Seaplane bases are another important part of Alaska's air transportation infrastructure. Lake Hood Sea-plane Base is located in Anchorage, and is the world's busiest seaplane base. The state has 102 sea-plane bases in total.
Pipeline
Oil and gas was discovered in Prudhoe Bay in 1968. Pipeline construction began in 1975 and it wasshipping crude oil by 1978. The Trans-Alaska Pipeline stretches 800 miles from Prudhoe Bay to Valdez.So far this year the primary pump station has averaged 667,331 barrels per day. Plans for a natural gaspipeline lost momentum in the early 1980s when natural gas prices dropped. The push to develop a nat-ural gas pipeline to the “lower-48 states” was resurrected in 1997, when the country became a net im-porter of liquefied natural gas for the first time in its history.
TransCanada Corporation was awarded an official license by the state of Alaska to construct a naturalgas pipeline from Prudhoe Bay to the “lower-48 states” in 2008. The state committed to a $500 milliongrant contribution but it has not been realized yet. The intention is to build a pipeline extending to Al-berta and would link to TransCanada's existing natural gas pipelines and to the United States. The initialplans do not include construction of a gas treatment facility.
Conoco Philips and BP also have plans to construct a gas pipeline. Their proposal follows a similar routeto the TransCanada plan however their plan involves the construction of a gas treatment facility. Cheapersources of natural gas in the U.S. and elsewhere are influencing the decision to build the pipeline.
Roadways
Roadway infrastructure in Alaska is severely lacking. The western parts of the state have no highways.The southeast part has highways but communities are not connected. Juneau cannot be reached byhighway. The majority of highways are located in the central part of the state, between Anchorage, Fair-banks, and Valdez. The Alaska Highway was built during the Second World War and connects Alaska toCanada's Yukon Territory. Other major highways include the Dalton Highway, the Glenn Highway, the Se-ward Highway, the Parks Highway, the Richardson Highway, and the Steese Highway. High-volume high-ways are paved, while others are simply gravel. Back roads provide access to many small towns. Winterweather conditions often render roads and highways impassable. The lack of dependable road infrastruc-ture in Alaska has made aviation and water ferries important transportation methods for residents.
Ports
The southern coast of Alaska is dotted with small port cities. These cities are connected through theAlaska Marine Highway System (AMHS). The ferry system is operated by the state of Alaska and pro-vides transportation for a number of islands that lack road access. The system connects 31 differentports in Alaska and has a number of different routes. The three main routes are the Inside Passage inthe southeast, the southwest coast, and the Aleutian chain. The routes are connected by bi-monthlyCross Gulf ferry trips.
The port of Anchorage is much larger and busier than the majority of ports along the Marine Highwaysystem. The port of Anchorage is the busiest port in Alaska, with 4 million tons of material movingacross its docks annually. At its peak in 2005, freight volume at the port reached 5.1 million tons. Theport handles exports of refined petroleum products from Alaskan refineries and supplies jet fuel to thestate's airports. In addition, 90% of Alaskan consumer goods move through the port of Anchorage.The port is currently undergoing major construction which will double its capacity. Completion is ex-pected by 2013.

130
The port of Valdez is located at the southern end of the trans-Alaska oil pipeline. In 2002, the portloaded an average of 42 oil tankers per month. Valdez benefits from being the northern-most year-round ice free port in the U.S. Dutch Harbor is a major fishing port, and handled 909 million pounds offish in 2002.
Quality of Life and Social Capital People, especially if they are well educated, are increasingly mobile. They have many options aboutwhere to live and work. Going forward, the most challenging competition faced by firms will be thecompetition for people—for human talent. Those regions that offer a high quality of life will be the win-ners in this competition—places with clean air and water, and that have an array of cultural, leisure timeand recreation offerings. According to Carnegie Mellon Professor Richard Florida, the mobile, highly ed-ucated "creative class" is seeking to settle in places that provide a high quality of life, systems of gover-nance that work, and human scale. Most of today's mega-regions are seriously lacking in this regard,becoming ever more difficult places in which to live.
Alaska has advantages in "quality of life" sometimes called "social capital." The state's natural beauty andrecreational attributes were consistently cited as major strengths by respondents to the interviews andsurveys conducted in the course of this study.
In the context of economic development, social capital is a term increasingly used to describe commu-nity functioning and problem-solving attributes. Definitions range from the academic "social relations ofmutual benefit characterized by norms of trust and reciprocity," to the pragmatic, "the glue that binds."Although not a precise concept, social capital can be viewed as the set of formal and informal commu-nity networks such as business and trade organizations, ad hoc problem-solving groups and other non-profits engaged in what can be viewed, at least in part, as community "quality of life" issues.
Indicators of social capital include per capita measures of community-based non-profits, arts and cultureorganizations, and philanthropic giving. Higher levels of these and related measures suggest the pres-ence of more workable and more livable communities. A lower level suggests cities less able to worktogether as a community to address social and economic problems and therefore places with a gener-ally lower quality of life.
A L A S K A F O R W A R D : P H A S E I S I T U A T I O N A L A N A L Y S I S
33..553333..8833 44..0000 33..9955
44..441144 ..6633
55..1100
44..3355 44..3322 44..3366
0
1
2
3
4
5
6
1999 2000 2001 2002 2003 2004 2005 2006 2007 2008
Figure 771. PPort oof AAnchorage, AAnnual DDock TTonnage, 11999-22008(Total tonnage, millions)
Source: Port of Anchorage
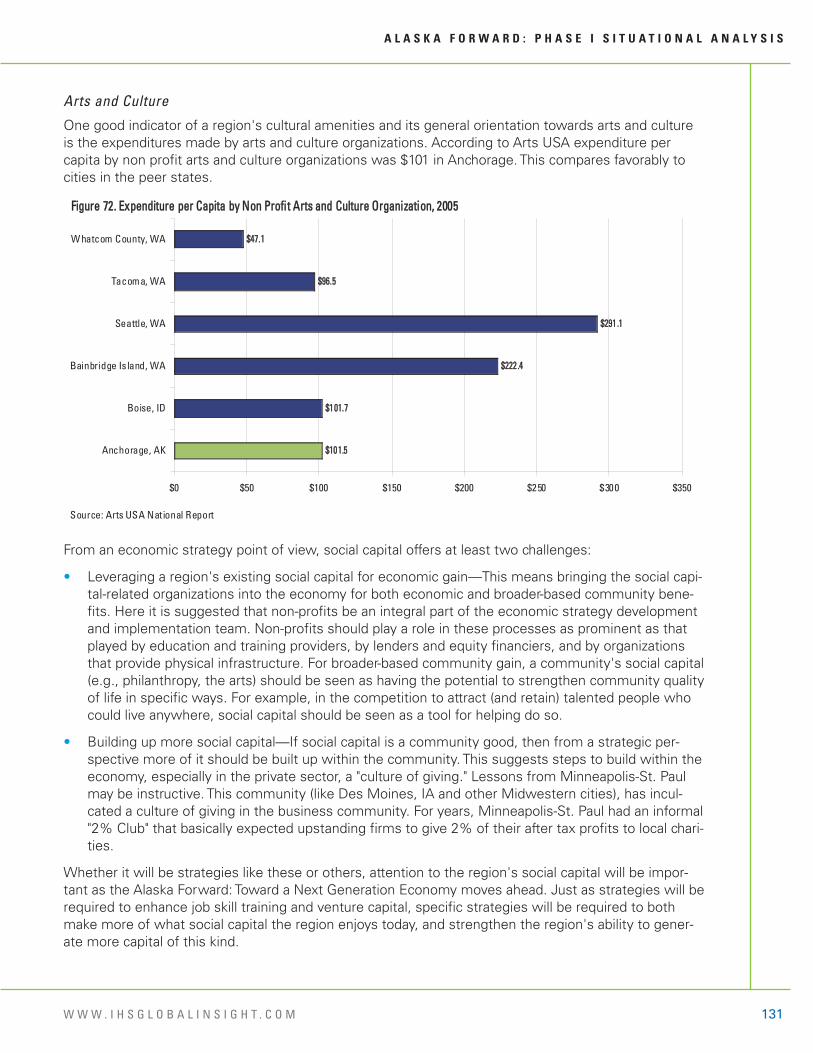
A L A S K A F O R W A R D : P H A S E I S I T U A T I O N A L A N A L Y S I S
W W W . I H S G L O B A L I N S I G H T . C O M 131
Arts and Culture
One good indicator of a region's cultural amenities and its general orientation towards arts and cultureis the expenditures made by arts and culture organizations. According to Arts USA expenditure percapita by non profit arts and culture organizations was $101 in Anchorage. This compares favorably tocities in the peer states.
From an economic strategy point of view, social capital offers at least two challenges:
• Leveraging a region's existing social capital for economic gain—This means bringing the social capi-tal-related organizations into the economy for both economic and broader-based community bene-fits. Here it is suggested that non-profits be an integral part of the economic strategy developmentand implementation team. Non-profits should play a role in these processes as prominent as thatplayed by education and training providers, by lenders and equity financiers, and by organizationsthat provide physical infrastructure. For broader-based community gain, a community's social capital(e.g., philanthropy, the arts) should be seen as having the potential to strengthen community qualityof life in specific ways. For example, in the competition to attract (and retain) talented people whocould live anywhere, social capital should be seen as a tool for helping do so.
• Building up more social capital—If social capital is a community good, then from a strategic per-spective more of it should be built up within the community. This suggests steps to build within theeconomy, especially in the private sector, a "culture of giving." Lessons from Minneapolis-St. Paulmay be instructive. This community (like Des Moines, IA and other Midwestern cities), has incul-cated a culture of giving in the business community. For years, Minneapolis-St. Paul had an informal"2% Club" that basically expected upstanding firms to give 2% of their after tax profits to local chari-ties.
Whether it will be strategies like these or others, attention to the region's social capital will be impor-tant as the Alaska Forward: Toward a Next Generation Economy moves ahead. Just as strategies will berequired to enhance job skill training and venture capital, specific strategies will be required to bothmake more of what social capital the region enjoys today, and strengthen the region's ability to gener-ate more capital of this kind.
$101.5
$101.7
$222 .4
$291 .1
$96.5
$47.1
$0 $50 $100 $150 $200 $250 $300 $350
Anchorage, AK
Boise, ID
Bainbridge Is land, WA
Seattle, WA
Tacoma, WA
Whatcom County, WA
FFiigguurree 7722.. EExxppeennddiittuurree ppeerr CCaappiittaa bbyy NNoonn PPrrooffiitt AArrttss aanndd CCuullttuurree OOrrggaanniizzaattiioonn,, 22000055
Source: Arts USA National Report

132
S U M M A R Y A N D C O N C L U S I O N S : A P AT H F O R W A R DSince statehood, Alaska has evolved its EDOs and approaches to economic development according tothe state's unique characteristics and needs. This report has analyzed the current situation from severalperspectives. In the report's first section, we looked at the array of EDOs in the state and commentedon the various strategies and objectives of these and other organizations. We then looked at thestrengths and weaknesses of today's organizational structure and commented on the main features ofAlaska's approach to economic development. Our findings in these two sections came from a review ofpast reports as well as from input from informed leaders in interviews and surveys. From these analy-ses, we developed six overarching economic development themes for continuing study. Each themehighlights a critical issue for Alaska, ranging from the need for more top level leadership and coordina-tion over what we refer to as Alaska's economic development infrastructure, to the need for new think-ing about how to add more value to Alaska's important natural resource sectors. Finally, we looked athow other states and regions have addressed similar challenges and drew potential lessons for Alaska'sleaders focusing on how the state should organize its efforts and work toward a more competitiveeconomy for today and for the next generation.
The next step in the analytical process was to understand the state and global economic challenges andopportunities along with an understanding of the state's clusters and its economic foundations. For ex-ample, we noted in the Economic Profile section of the report that the slowdown in revenues from thenatural resources sectors, notably in oil and gas, has caused the real gross state product (GDP) since1998-9 to stagnate when compared to the national economy, after leading the rest of the country up tothe mid-1990s, only a relatively few years ago. More recently, since 2006 Alaska's GDP has slippedeven further behind the comparable U.S. figures, and the forecast is for a widening gap between thestate and the rest of the nation. As a result, per capita income, once far higher than the U.S. average,has also slipped alarmingly. Now equal to the rest of the country, the forecast is for Alaska to fall wellbelow the national average.
To examine the state's economy from another perspective, in another section we looked at Alaska's in-dustrial clusters (clusters are sets of private and public sector actors working together to achieve highlevels of economic competitiveness in specific markets). Eleven were identified. Many of the largestwe analyzed were categorized as "mature," important and still competitive but not likely to grow relativeto the U.S. economy. Said to be "mature" are the state's important oil/gas, fishing, military, and federalgovernment clusters. The other clusters identified, tourism, logistics, business services and the like, areforecast to grow only slightly faster than what is forecast for the same cluster in the rest of the country.The cluster report also made the point that Alaska may have a few "pre-clusters,' early signs of poten-tially competitive new industries on the horizon (e.g., cold weather products and services). But overall,one must conclude that Alaska's economic base for as far in the future as can be forecast is going torest largely on its mature, natural resource-based sectors.
Our report on the comparative advantages/disadvantages of Alaska's economic foundations (e.g.,human resources, technology, business climate and the like) concluded that while the state has a rela-tively well-educated (if aging) workforce and some other advantages, overall it has a comparativelyweak secondary school education system (with associated high dropout rates), weak physical infra-structure, high energy costs, scant technology commercialization from its leading public university, neg-ligible venture capital and other comparative disadvantages.
With regards to global economic opportunities, the external demand for many of the state's mature, re-source-based clusters will be strong and will be an important source of inbound wealth for the state forthe foreseeable future. Many of these clusters are, however, somewhat constrained from a supply per-
A L A S K A F O R W A R D : P H A S E I S I T U A T I O N A L A N A L Y S I S

A L A S K A F O R W A R D : P H A S E I S I T U A T I O N A L A N A L Y S I S
W W W . I H S G L O B A L I N S I G H T . C O M 133
spective. But if these challenges can be addressed, markets for their products exist. It is also importantto look at global opportunities from the perspective of identifying elements of the supply chain that areimported and to identify opportunities to displace imports. In particular, the more the state can developa strong capability for providing advanced professional and business services linked to its strongestclusters, the less leakage of wealth will be seen as we see today due to heavy reliance on importedservices. The resulting stronger, more cluster-focused services cluster would then have more opportu-nities for exporting their services to countries that have similar resource-based cluster structures.
Looking ForwardLooked at in a comprehensive way as above, we conclude that Alaska's economic future is, at best,cloudy with clearly defined risk factors (the price of oil and federal government spending). Commodityprices might work to the state's advantages and per-capita income rebound with much higher oil prices.However, betting on this outcome would be unwise. Our economic research is largely confirmedthrough our recent interviews and surveys. Informed leaders in Alaska know that the state is potentiallyfacing serious economic challenges and that betting on very high oil prices is not a prudent economicdevelopment strategy.
Given this, it would seem that economic development efforts at the state, regional and local levels needto be stepped up. But this report also concludes that the basic organizational infrastructure and today'stypical economic development objectives and strategies may be less than optimal. The state's institu-tional capacity to address fundamental economic problems, while well intentioned and at times suc-cessful with tactical interventions, may not have evolved a shared economic vision among keystakeholders. Stronger and higher-level leadership and coordination is needed in order to make themost of efforts expended.
The area where we see opportunity is largely at the statewide level. We believe that a different overar-ching approach to economic development is needed, perhaps one driven by a public-private leadershipgroup, with the public sector providing the initial funding and the private sector providing its knowledgeof how markets work, where the opportunities for diversification lie and what makes an economy com-petitive. The approach might be based on contemporary economic development models used in otherstates (such as Oregon's cluster-based economic development networks or the Puget Sound region'swell coordinated Prosperity Partnership and industry working groups to define needed policy initiatives).
With a different policy framework, such as a statewide cluster development and leadership and coordi-nation towards this end from the top, regional and local practitioners would have both an overarchingpolicy framework and the flexibility to implement the policy as local needs dictate. A cluster policystrategy would not only outline the main implementation features and suggest tools for regional andlocal EDOs, but provide a way of coordinating most of the practices of regional and local economic de-velopment agencies. But it is important to point out that whatever economic development modelAlaska's moves toward in the future be an "Alaska Model." The state is too atypical in too many ways fora textbook approach to have the desired outcomes.
Moving Forward: Toward What Kind of Economy?If asked, most people in Alaska would say that the state, fundamentally, has a natural resource econ-omy, and that it always will. Our analysis suggests that Alaskans begin looking at the state's economyin a broader way, as a "natural resources, PLUS" economy. Oil, gas, mining, and fishing, along withtourism, will be the most important engines of economic growth for as long as one can see into the fu-ture. Economic development policy and practice must continue to focus on making the most of thesesectors. But the notion of "natural resources, PLUS" means that in the future, Alaska will look to its nat-ural resources as the state's primary economic engines while simultaneously developing emerging sec-
134
tors (e.g., logistics and trade, advanced business services, specialized machinery) where the state hascomparative advantages. Some attention must also be paid to the pre-clusters noted in IHS's ClusterAnalysis Report, where much more research is needed to better define if these or other "faint signs onthe radar" can, with the right policy support, be elevated from "radar blips" to real industrial capacity. Toa great degree, economic development efforts should be shifted from the very difficult task of trying toget more job and revenue impact from the state's natural resources sectors to trying to make the mostof the PLUS side of the envisioned new economy.
In the future, the federal government will still play a huge role in the state's future economy and stateleaders will need to spend a correspondingly large amount of time working with federal agencies tokeep the stage set for as much wealth generation and jobs as can come from federal policies and regu-lations. The country's security equation is changing and these changes are likely to affect both the mis-sions of the state's military installations as they shift to respond to changing threats as well as the roleand reach of DHS's Coast Guard. Keeping abreast of how agency missions are changing, and are likelyto change in the future as well as how federal resources will be spent on military and national securitypriorities should be a high priority of the state's economic development leaders. Federal funding for na-tional security is not likely to decrease in the near- to mid-term.
Developing the PLUS side of the new economy should be a high priority of APED's Phase 2, StrategyDevelopment. But there is little doubt that new strategies will be needed to address the state's climatefor business entrepreneurship. For example, young people in Alaska should learn about small business,the pros and the cons, throughout their years in school. They should have a working knowledge of mar-kets and how investment flows to economic opportunity and how people as "kids" in college around thecountry have created companies like Dell Computer and FedEx (even how a college dropout created Mi-crosoft). They should know that a couple of 20-something hobbyists created Apple, a name that willsurely be meaningful.
New policies are most likely needed at University of Alaska to try to move basic research closer to com-mercialization and to support more applied research, paid for by private firms seeking to spur productand process innovation in their existing and in new businesses. New policies at the university shouldbe considered that would encourage professors to seek patent rights from their government-funded re-search and enable the university to realize royalties and license income.
Putting in place other features in the state's economic environment should likewise be a priority. Forexample, Alaska doesn't need to lose its applied research investments, or its graduates to other states.Keeping both in-state might require implementing not only technology commercialization strategies butalso complementary "technology capture" strategies that work to keep innovation in-state, within exist-ing firms and in the hands of local entrepreneurs. Fledgling entrepreneurs will need help from thestate's EDOs to secure financial resources and other pre-requisites for market success, suggesting inthis light at least a review of small business programs and state financing programs designed to helplaunch small businesses. The range of potential new economic development strategies is wide anddeep.
Three Strategic ThrustsWe envision three main strategic thrusts similar to the three-legged stool suggested by University ofAlaska Institute of Social and Economic Research. The first would be to make the most of the naturalresources that have made the state what it is today. Existing priorities will need to be reviewed in thecontext of economic forecasts and specific tactics will need to be developed to support the strategy ofmaking the most of the state's resource advantages. An essential element of such a strategy would becontinued refinement of approaches to natural resource preservation—in which Alaska is already a
A L A S K A F O R W A R D : P H A S E I S I T U A T I O N A L A N A L Y S I S

A L A S K A F O R W A R D : P H A S E I S I T U A T I O N A L A N A L Y S I S
W W W . I H S G L O B A L I N S I G H T . C O M 135
leader in many respects—so that future generations also derive equitable benefits from those re-sources.
The second thrust would be to work with the federal government in strategic ways to maintain, if notgrow, its presence in the state and generate all the public and private sector jobs associated with thegovernment's priorities in Alaska that are possible. While this thrust has been a strategic priority forsome time, opportunities noted earlier may exist for new or expanded military and homeland securityinitiatives as global security threats evolve. Even changes in polar region access can change the militaryand security calculus, potentially leading to new federal investment in preparedness. Again, specificprogram tactics will need to be developed to achieve this objective. Keeping track of these opportuni-ties should be a heightened priority of Alaska's Congressional delegation. Put in the context of this ini-tiative, Alaska Forward: Towards a Next Generation Economy, elected leaders and their staff should beencouraged to redouble efforts to get inside the decision-making processes of key Federal agenciesand influence decisions with an aim at securing new jobs and new investment, consistent with broadgovernment needs.
The third strategic thrust would be to create a more robust, pro-small business and pro-entrepreneureconomic environment. The suggestion is to nurture those that take the risks to create small compa-nies and who most likely live in Alaska because they love it. These business people and entrepreneurs,while present today, are not particularly well-supported with the necessary ingredients for growth-ori-ented, commercial success. This area is wide open for new, contemporary initiatives designed toachieve the goal of new firms in small population centers. Books have been written on the topic, onepublished just a few months age titled "Generating Local Wealth, Opportunity and Sustainability throughRural Clusters," by Stewart Rosenfeld of Regional Technology Strategies, Inc. The author is a thoughtleader on the topic because his work is empirical, years of study of what kinds of firms cluster in lesspopulated regions, and why. Rosenfeld's conclusions regarding cluster development success factors inplaces with small populations point to the importance of certain community characteristics including so-cial capital trust and connections to urban centers, all of which can be enhanced through policy inter-ventions and new community and economic development practices.
Next StepsCan Alaska make the necessary changes in policy and practice to build a more diversified and sustain-able economy? This report has made the point that when faced with similar challenges, other regionshave made difficult decisions and moved in new directions with new thinking, new economic develop-ment policies, and new practices.
This report concludes that Alaska's leaders need to begin to address the gathering economic storm bytransitioning from today's approaches to economic development to new approaches, based in part onthe best practices of other regions. Bridging from this Situational Assessment to the upcoming Phase2 Strategy Development work should begin immediately. We recommend the process start as other re-gions have started their strategic planning efforts. Puget Sound's Prosperity Partnership, for example,moved quickly from its analysis of economic conditions and opportunities to form a new strategic plan-ning-oriented "Alaska Forward Leadership Council." This group should be comprised of top-level leadersdrawn from companies, institutions and organizations across the state. By virtue of their position andvisibility, these leaders would command a degree of authority. Involving high level government leaderswho have a strong incentive to address the state's economic challenges would bring resources to theeffort. Having top level private sector leaders involved would help assure that market-based principleswould guide new initiatives and help avoid undesirable focus on grand, "pie in the sky" efforts. Privatesector leadership would also bring executive and managerial talent to the task, helping to keep thestrategic planning process lean, mean, focused and "business-like."

136
From this starting point, the leadership group would prepare to launch Phase 2. If the strategy develop-ment process has a significant component which is cluster-based, as we suggest, the next step wouldbe to select the specific clusters for priority attention (all clusters would eventually be given full atten-tion, but the Leadership Council should not try to take on too much at once). Top-level leaders in eachcluster would be identified and briefed on their role to help coordinate and lead from their cluster's per-spective an 8-10 month-long cluster development strategy effort. The notion is that each cluster wouldgenerate a set of cluster-specific priorities aimed at addressing impediments to growth and develop-ment. Facilitated discussions would lead to a shared economic vision for each cluster as well as devel-opment of a number of policy initiatives, each designed to address an impediment to the cluster'sgrowth. Each initiative would have its own business plan and an "implementation champion" (i.e., own-ership) to help take the initiative forward. In addition, a limited number of cross-cutting initiatives andpolicy recommendations would also emerge from each cluster group, which would be integrated intothe broader state-wide strategy.
With the overall plan to move from Phase 1 to Phase 2 laid out, the Leadership Council should considerlaunching the effort with a high visibility event, perhaps a statewide Economic Summit. Stakeholdersfrom across the state would be invited to a day-long program, hosted by the Leadership Council whowould be introduced to the assembled leaders by the Governor. Presentations of the Situation Analysiswould be made with the objective of impacting how the audience hears the messages. Questionswould be solicited and answers provided by knowledgeable leaders, economists, and other experts. Aninteresting option would be a segment where the audience uses handheld devices to "vote" on difficultdevelopment choices, with answers immediately displayed on large projection screens. Perhaps afterlunch the cluster working group chairs would be introduced and presentations made about how thestrategic planning process would unfold.
In this way, Alaska will have kick-started the needed transition from its current approaches to economicdevelopment to a more strategic approach, led by leaders from the private and public sector. Similar ap-proaches have been used, in many cases repeatedly (see the Austin case) making collaborative strate-gic economic development planning the prevailing practice in many regions. There is no reason thatAlaska's leaders can't move in similar ways, evolving a 21st century "Alaska Model" for economic devel-opment and start afresh to build a more diverse and more sustainable economy.
A L A S K A F O R W A R D : P H A S E I S I T U A T I O N A L A N A L Y S I S

A L A S K A F O R W A R D : P H A S E I S I T U A T I O N A L A N A L Y S I S
W W W . I H S G L O B A L I N S I G H T . C O M 137
A N N E X : E C O N O M I C D E V E L O P M E N T R E P O R T S
Statewide Reports"Alaska State Economic Rejuvenation Program," 1988.
"Alaska's New Deal: An Economic Development Strategy for Alaska," University of Minnesota'sHumphrey H. Institute of Public Affairs, 1997.
"Economic Development Projects: Regional Attributes and Opportunities" 1996
"Marketing Alaska Initiative, The Governor's Economic Development Initiative," 1996.
"Sustaining Alaska's Economy," 1993.
"The State of the Economy and Strategies for Sustaining Alaska's Economy," 1994.
Regional Reports"2001 Situations and Prospects of the Kenai Peninsula Borough," Kenai Peninsula Borough CommunityEconomic Development Division, 2002.
"2003 Comprehensive Economic Development Strategy Update," Kenai Peninsula Economic Develop-ment, Inc., 2003.
"Alaska Economic Trends: The Delta Region," Neal Fried and Brigitta Windisch-Cole, Alaska Departmentof Labor and Workforce Development, 2002.
"Bristol Bay Regional Economic Opportunity Plan," Bristol Bay Native Association, 2004.
"Bristol Bay, Alaska Comprehensive Economic Development Strategy," Bristol Bay Native Association,2005.
"Comprehensive Economic Development Strategy—Vision, Goals, Objectives and Strategies," FairbanksNorth Star Borough, 2005.
"Comprehensive Economic Development Strategy," Fairbanks North Star Borough Economic Develop-ment Division, 2003.
"Comprehensive Economic Development Strategy," Fairbanks North Star Borough Economic Develop-ment Division, 2005.
"Comprehensive Economic Development Strategy," Lake & Peninsula Borough, 2002.
"Copper Valley Regional Plan Comprehensive Economic Development Strategy," Copper Valley Eco-nomic Council, 2003.
"Fairbanks North Star Borough Comprehensive Economic Development Strategy," Fairbanks North StarBorough, 2008.
"Interior Rivers Resource Conservation & Development Area Plan," Interior Rivers Resource and Conser-vation District, 1997.
"Kenai Peninsula Comprehensive Economic Development Strategy 2003," Kenai Peninsula EconomicDevelopment District, Inc. (KPEDD), 2003.
"Kenai Peninsula Comprehensive Economic Development Strategy," Kenai Peninsula Economic Develop-ment District, Inc. (KPEDD), 2009.

138
"Kodiak Region Comprehensive Economic Development Strategy—Revised 2003," Kodiak Chamber ofCommerce, 2003.
"Lake & Peninsula Overall Economic Development Plan," Lake & Peninsula Borough, 1999.
"Mat-Su Comprehensive Economic Development Strategy December 2008 Update," Mat-Su ResourceConservation & Development Council, 2008.
"Mat-Su Comprehensive Economic Development Strategy," Mat-Su Resource Conservation & Develop-ment Council, 2006.
"Mat-Su RC&D Council Comprehensive Economic Development Strategy," Mat-Su Resource Conserva-tion & Development, Inc., 2000.
"Northwest Arctic Borough Comprehensive Economic Development Strategy," Northwest Arctic Bor-ough Economic Development, 2004.
"Prince William Sound Comprehensive Economic Development Strategy 2003/2004," Prince WilliamSound Economic Development District, 2003.
"Prince William Sound Comprehensive Economic Development Strategy 2009," Prince William SoundEconomic Development District, 2009.
"Prince William Sound Economic Development District Comprehensive Economic Development Strat-egy," Prince William Sound Economic Development District, 2006.
"Prince William Sound Overall Economic Development Strategy," Prince William Sound Economic Devel-opment District, 1998.
"Prince William Sound Overall Economic Development Strategy," Prince William Sound Economic Devel-opment District, 2001.
"Regional Economic Development 5-year Strategic Plan (2001-2006)," Arctic Development Council,2002.
"Situations and Prospects Economic Trends for Period Ending December 2004," Kenai Peninsula Bor-ough, 2005.
"Situations and Prospects Economic Trends for Period Ending December 31, 2006," Kenai Peninsula Bor-ough, 2007.
"Southeast Alaska Comprehensive Economic Development Strategy 2006 - 2011 Strategy [Multiple YearUpdates]," Southeast Conference and Central Council Tlingit and Haida, 2009.
"Southwest Alaska Comprehensive Economic Development Strategy 2003-2008 [Multiple Year Up-dates]," Southwest Alaska Municipal Conference, 2003.
"Strategies to Mitigate the Impact of Large Scale Military Deployments in the Fairbanks, Alaska Region,"Basile Baumann Prost and Associates, Inc., 2006.
"Tanana Chiefs Conference Inc. Comprehensive Economic Development Strategy Draft 2002-2007,"Tanana Chiefs Conference Inc., 2002.
"The Bering Strait Comprehensive Economic Development Strategy 2003 - 2008," Bering Strait Develop-ment Council/Kawerak Inc, 2003.
"The Bering Strait Comprehensive Economic Development Strategy FY05 Annual Report," Bering StraitDevelopment Council/Kawerak Inc, 2005.
A L A S K A F O R W A R D : P H A S E I S I T U A T I O N A L A N A L Y S I S

A L A S K A F O R W A R D : P H A S E I S I T U A T I O N A L A N A L Y S I S
W W W . I H S G L O B A L I N S I G H T . C O M 139
"The Bering Strait Overall Economic Development Plan," Bering Strait Development Council/KawerakInc, 1999.
"The Tanana Chiefs Conference, Inc. Overall Economic Development Plan," Tanana Chiefs ConferenceInc., 1998.
"Two Year Strategic Plan 2003-2005, [Multiple Years]" Lower Kuskokwim Economic Development Coun-cil, 2003.
"Yukon Flats Revised Area Plan," Council of Athabascan Governments, 2001.
"Yukon Kuskokwim Delta Regional Strategic Plan," Association of Village Council Presidents, 2000.
Community Reports"2002 Comprehensive Community Economic Development Plan for the City of Mountain Village,Alaska," Mountain Village City Council, 2002.
"2007 Sitka Visitor Industry Plan Version 2.0," City & Borough of Sitka, 2007.
"A Local Economic Development Plan for Diomede," Kawerak Inc., 2003.
"A Local Economic Development Plan for Golovin 2004 - 2009," Northwest Planning and Grants Devel-opment, 2007.
"A Local Economic Development Plan for Solomon," Kawerak, Inc. Community Services Division, 1998.
"A Local Economic Development Plan for Teller & Mary's Igloo," Kawerak, Inc. - Community Services Di-vision, 1998.
"Anchorage Comprehensive Economic Development Strategy," Fison and Associates, 2009.
"Association of Village Council Presidents 5 Year Overall Economic Development Plan 1988-1993," Asso-ciation of Village Council Presidents, 1988.
"AVCP Comprehensive Economic Development Strategy 2002-2007," AVC, Inc., 2002.
"AVCP Inc. Economic Development Plan 1993 Annual Report," Association of Village Council Presidents,1993.
"Brevig Mission Local Economic Development Plan 2007-2012," Kawerak, Inc., 2007.
"Bristol Bay, Alaska Comprehensive Economic Development Strategy," Bristol Bay Native Association,2003.
"Business Plan for Emmonak Equipment Leasing (EEL)," City of Emmonak, 2001.
"City of Anderson, Comprehensive Economic Development," ASCG Incorporated, 2003.
"City of Coffman Cove Economic Recovery Plan and Annual Plan of Work - Fiscal Year 2002," City ofCoffman Cove, 2002.
"City of Cordova Economic Development Strategy 1997," Prince William Sound Economic DevelopmentCouncil, 1997.
"City of Haines Downtown Development Program," Haines Borough, 1984.
"Cold Bay Overall Economic Development Plan 1999," The Stadum Group, 1999.
"Community Action Plan Nikiski, Alaska," North Peninsula Community Council, 2001.

140
"Community Economic Development Plan for Hydaburg, Alaska 2005-2015," Northwest Planning andGrants Development, 2005.
"Community Economic Development Strategy Plan," ASCG Incorporated and the Community of Bethel,2003.
"Community Impacts Economic Adjust Plan: Ft. Greely and Delta Junction," MDA, 2002.
"Community of Chenega Comprehensive Economic Development Strategies," Aurora Consulting, 2001.
"Community Plan for the Greater Kenny Lake Area," NRCS - Copper Valley RC&D, 2007.
"Community Research Quarterly—A Socio-Economic Review," Fairbanks North Star Borough Commu-nity Research Center, 2009.
"Community Strategic Development Plan for White Mountain 2004-2024," Northwest Planning andGrants Development, 2003.
"Comprehensive Economic Development Strategies," Aurora Consulting, 2008.
"Craig Community Economic Development Strategy (Comprehensive Economic Development Strat-egy)," Craig Economic Development Strategy Committee, 2005.
"Craig Community Economic Development Strategy (Comprehensive Economic Development Strat-egy)," Craig Economic Development Strategy Committee, 2007.
"Delta Junction (Alaska) Region Comprehensive Economic Development Strategy," Delta Regional Eco-nomic Development Council, 2004.
"Delta Junction (Alaska) Region Comprehensive Economic Development Strategy," Delta Regional Eco-nomic Development Council, 2004.
"Economic Analysis of Rail Link Port Mackenzie to Willow, Alaska," Paul A. Metz, Consulting Economicand Mining Geologist, 2007.
"Economic Importance of Sportfishing in the Matanuska-Susitna Borough," Institute of Social and Eco-nomic Research University of Alaska Anchorage, 2009.
"Fiscal and Economic Analysis of Homer Town Square Proposed Development Alternatives," Universityof Alaska - Anchorage ISER, 2003.
"Hooper Bay Comprehensive Economic Development Strategy Plan," ASCG Incorporated, 2004.
"Impact of the Realignment of Eielson AFB on the Fairbanks North Star Borough," Northern EconomicsInc., 2006.
"Kotlik Comprehensive Economic Development Strategic Plan," Kotlik Tribal Council, 2004.
"Kwethluk Economic Development Plan 2000-2004," The Arcturus Group, 2000.
"Local Economic Development Plan 2004 - 2009," Kawerak, Inc., 2003.
"Local Economic Development Plan 2006 - 2011 Updated July 2007," Kawerak, Inc., 2007.
"Local Economic Development Plan for Elim 2005-2010," Kawerak, Inc., 2008.
"Local Economic Development Plan for King Island -1999," Kawerak, Inc., 1999.
"Local Economic Development Plan for Koyuk," Kawerak, Inc, 1998.
A L A S K A F O R W A R D : P H A S E I S I T U A T I O N A L A N A L Y S I S

A L A S K A F O R W A R D : P H A S E I S I T U A T I O N A L A N A L Y S I S
W W W . I H S G L O B A L I N S I G H T . C O M 141
"Local Economic Development Plan for Shaktoolik 2004-2009," Northwest Planning and Grants Develop-ment, 2003.
"Local Economic Development Plan For Wales 2004-2009," Kawerak, Inc, 2004.
"Local Economic Development Plan Koyuk 2005-2010," Kawerak, Inc., 2004.
"Local Economic Development Plan Saint Michael 2005 - 2010," Kawerak, Inc., 2004.
"Local Economic Development Plan Stebbins 2005-2010," Kawerak, Inc., 2004.
"Nikolski Community and Economic Development Plan," Information Insights, 2006.
"Noorvik Community Comprehensive Development Plan, 2006-2016," Northwest Planning and GrantsDevelopment, 2006.
"Overall Economic Development Plan," The Stadum Group, 1999.
"Overall Economic Development Plan," The Stadum Group, 1999.
"Pauloff Harbor Tribe Tribal Economic Development Plan," Information Insights, 2006.
"SEDA Strategic Plan 2008-2012," Sitka Economic Development Association, 2008.
"Seniors and Future Seniors in the Fairbanks North Star Borough: A Quality of Life Assessment," Fair-banks North Star Borough Economic Development, 2008.
"Sitka Economic Profile 2004," McDowell Group, Inc., 2005.
"St. Mary's Community Economic Development Strategy," Kawerak, Inc., 2000.
"St. Paul Island 5-Year Economic Development Strategy," Tanadgusix Corporation, 1999.
"Teller Local Economic Development Plan 2006-2010," Kawerak, Inc, 2005.
"Thorne Bay Overall Economic Development Plan," City of Thorne Bay, 2004.
"Thorne Bay Overall Economic Development Plan," City of Thorne Bay, 2008.
"Unalaska Economic Development Plan," City of Unalaska, 2004.
"Vision Anchorage," Chabin Concepts Team, 2002.
"Whale Pass Community Action Plan," Whale Pass Community Association, 1997.
"Wrangell Downtown Revitalization Final Report," Jensen Yorba Lott, Inc., McDowell Group, Inc., Jonesand Jones Architects and Landscape Architects, Ltd., 2006.

F O R M O R E I N F O R M A T I O N
R o b e r t H o f f m a nS e n i o r C o n s u l t a n t
C o n s u l t i n g S e r v i c e s G r o u p
r o b e r t . h o f f m a n @ i h s g l o b a l i n s i g h t . c o m
4 1 6 6 8 2 7 3 11
Copyright 2010 © IHS Global Insight ALL RIGHTS RESERVED
All information contained herein is obtained by IHS GLOBAL INSIGHT, Inc. from sources believed by it to be accurate and reliable. All forecasts and
predictions contained herein are believed by IHS GLOBAL INSIGHT, Inc. to be as accurate as the data and methodologies will allow.
However, because of the possibilities of human and mechanical error, as well as other factors such as unforeseen and unforeseeable changes in po-
litical and economic circumstances beyond IHS GLOBAL INSIGHT’s control, the information herein is provided “as is” without warranty of any kind
and IHS GLOBAL INSIGHT, Inc., AND ALL THIRD PARTY PROVIDERS MAKE NO REPRESENTATIONS OR WARRANTIES EXPRESS OR IMPLIED TO
ANY SUBSCRIBER OR ANY OTHER PERSON OR ENTITY AS TO THE ACCURACY, TIMELINESS, COMPLETENESS, MERCHANTABILITY OR FITNESS
FOR ANY PARTICULAR PURPOSE OF ANY OF THE INFORMATION OR FORECASTS CONTAINED HEREIN.