Individualized Child Care Subsidy Pilots San Mateo, San Francisco and Alameda Counties.
ALAMEDA COUNTY MATERNAL, CHILD, AND YOUTH HEALTH INDICATORS
Community Assessment Planning and Evaluation Unit (CAPE)Alameda County Public Health Department
Health Care Services AgencyAugust 2017
Lisa Goldberg, MPCAH Epidemiologist, Alameda County Public Health Department.Contact by phone at 510-267-8024 or by email: [email protected]
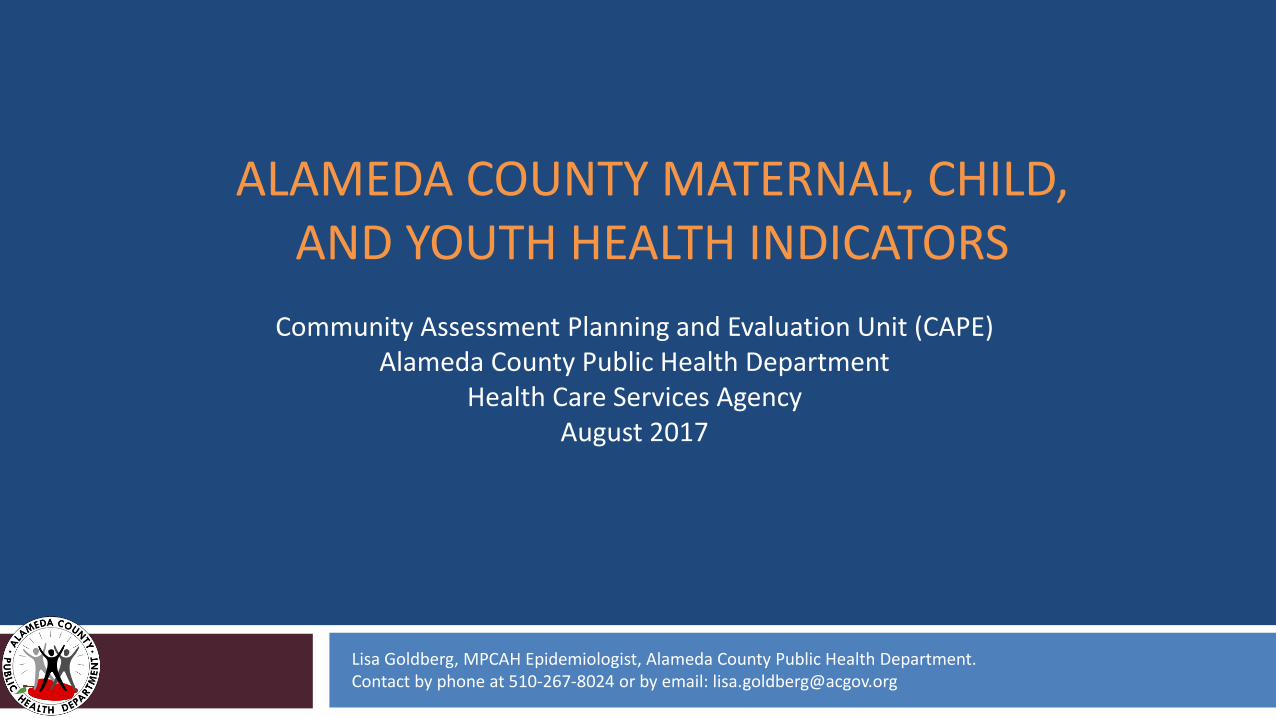
Key Questions
1. Who is giving birth in Alameda County?
2. How healthy are moms and infants in Alameda County and what health inequities exist?
3. How healthy are youth and women of child bearing age in Alameda County and what inequities exist?
4. How has Alameda County been doing over time and within different communities?
5. How is Alameda County doing compared to Healthy People 2020 (HP2020) and within California?
2

Types of Data Presented3
Count: Number of events or cases at a given point in time.
Counts are used to look at the magnitude of the health event within a
population.
In 2014, there were 19,573 births in Alameda County.
Percentage: proportion of total events over the total population
that can be affected at a given point in time.
Percentages are used to compare populations of different sizes for example
comparing different races/ethnicities.
In 2014, 7.6% of all Asian births were low birth weight births.
Types of Data Presented4
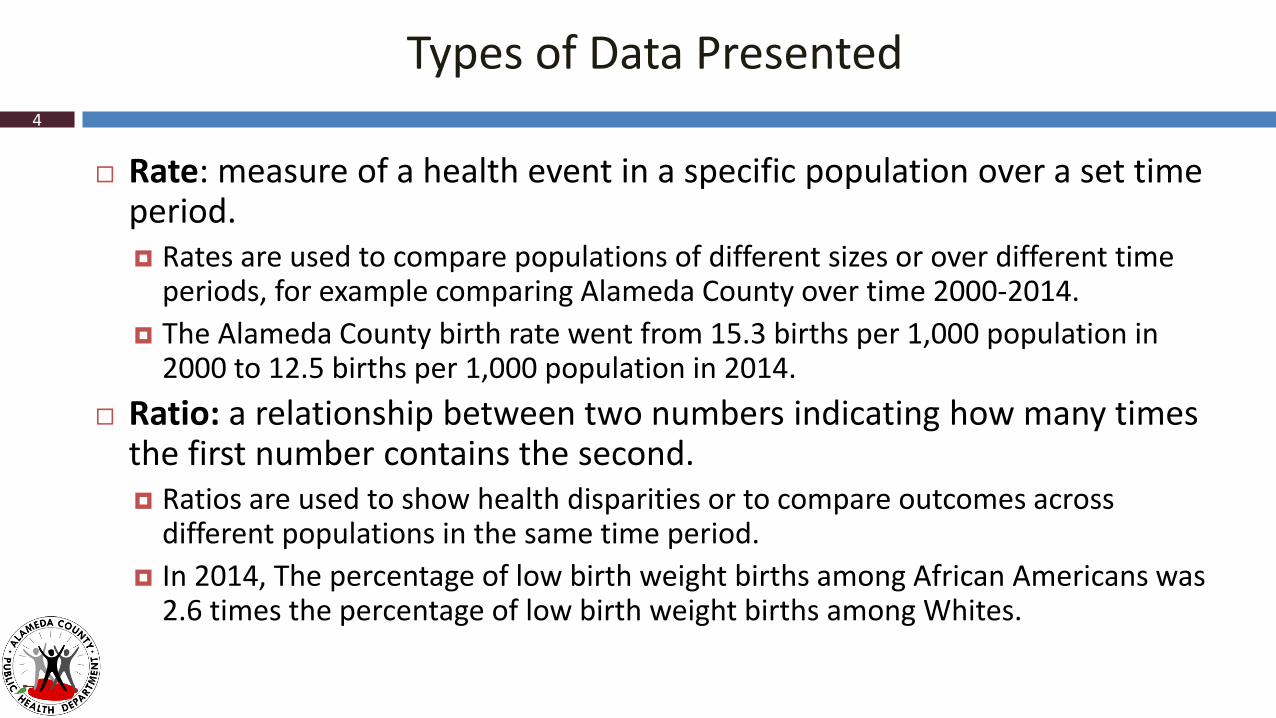
Rate: measure of a health event in a specific population over a set time period. Rates are used to compare populations of different sizes or over different time
periods, for example comparing Alameda County over time 2000-2014.
The Alameda County birth rate went from 15.3 births per 1,000 population in 2000 to 12.5 births per 1,000 population in 2014.
Ratio: a relationship between two numbers indicating how many times the first number contains the second. Ratios are used to show health disparities or to compare outcomes across
different populations in the same time period.
In 2014, The percentage of low birth weight births among African Americans was 2.6 times the percentage of low birth weight births among Whites.
Births
Age
Foreign–Born Moms
First-Time Moms
Medi-Cal Births
Unintended Pregnancies
Unmet Need for Family Planning
Who is giving birth in Alameda County?5
Trends
Race/Ethnicity
Location/Place
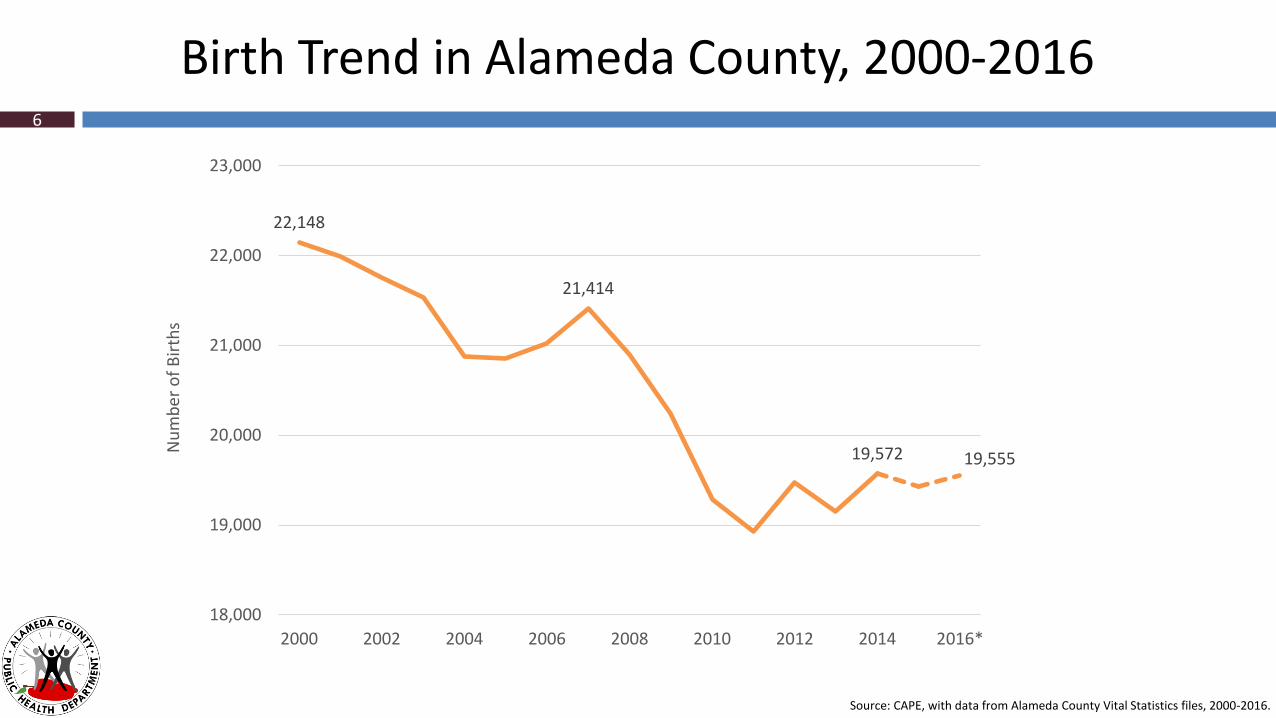
Birth Trend in Alameda County, 2000-2016
22,148
21,414
19,572 19,555
18,000
19,000
20,000
21,000
22,000
23,000
2000 2002 2004 2006 2008 2010 2012 2014 2016*
Nu
mb
er o
f B
irth
s
Source: CAPE, with data from Alameda County Vital Statistics files, 2000-2016.
6
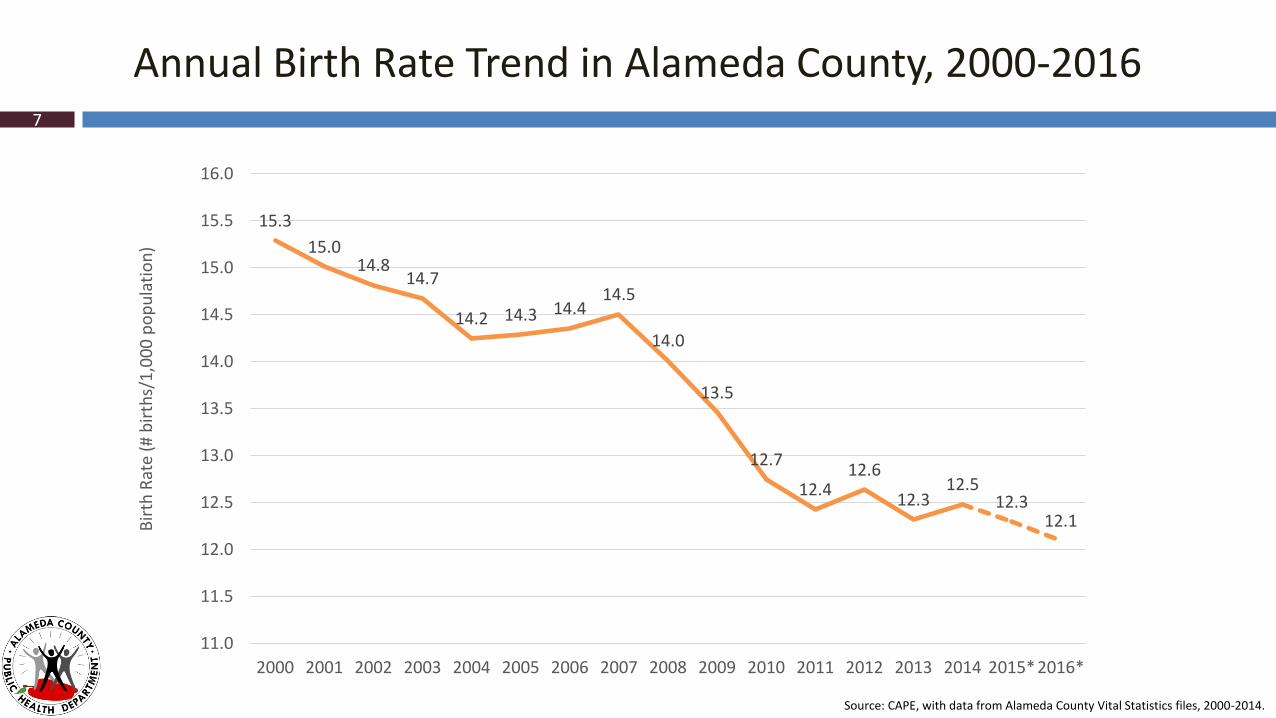
15.3
15.014.8
14.7
14.2 14.3 14.414.5
14.0
13.5
12.7
12.412.6
12.312.5
12.312.1
11.0
11.5
12.0
12.5
13.0
13.5
14.0
14.5
15.0
15.5
16.0
2000 2001 2002 2003 2004 2005 2006 2007 2008 2009 2010 2011 2012 2013 2014 2015*2016*
Bir
th R
ate
(# b
irth
s/1
,00
0 p
op
ula
tio
n)
Annual Birth Rate Trend in Alameda County, 2000-20167
Source: CAPE, with data from Alameda County Vital Statistics files, 2000-2014.
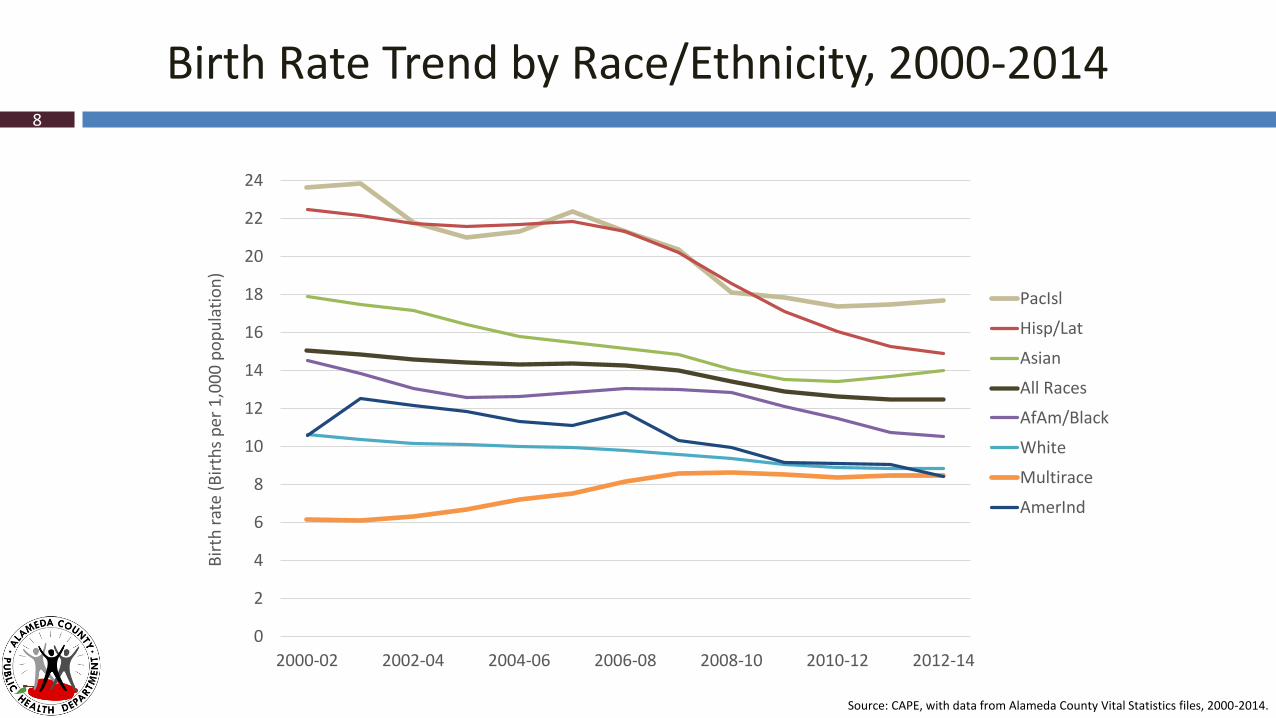
Birth Rate Trend by Race/Ethnicity, 2000-2014
0
2
4
6
8
10
12
14
16
18
20
22
24
2000-02 2002-04 2004-06 2006-08 2008-10 2010-12 2012-14
Bir
th r
ate
(Bir
ths
per
1,0
00
po
pu
lati
on
)
PacIsl
Hisp/Lat
Asian
All Races
AfAm/Black
White
Multirace
AmerInd
8
Source: CAPE, with data from Alameda County Vital Statistics files, 2000-2014.
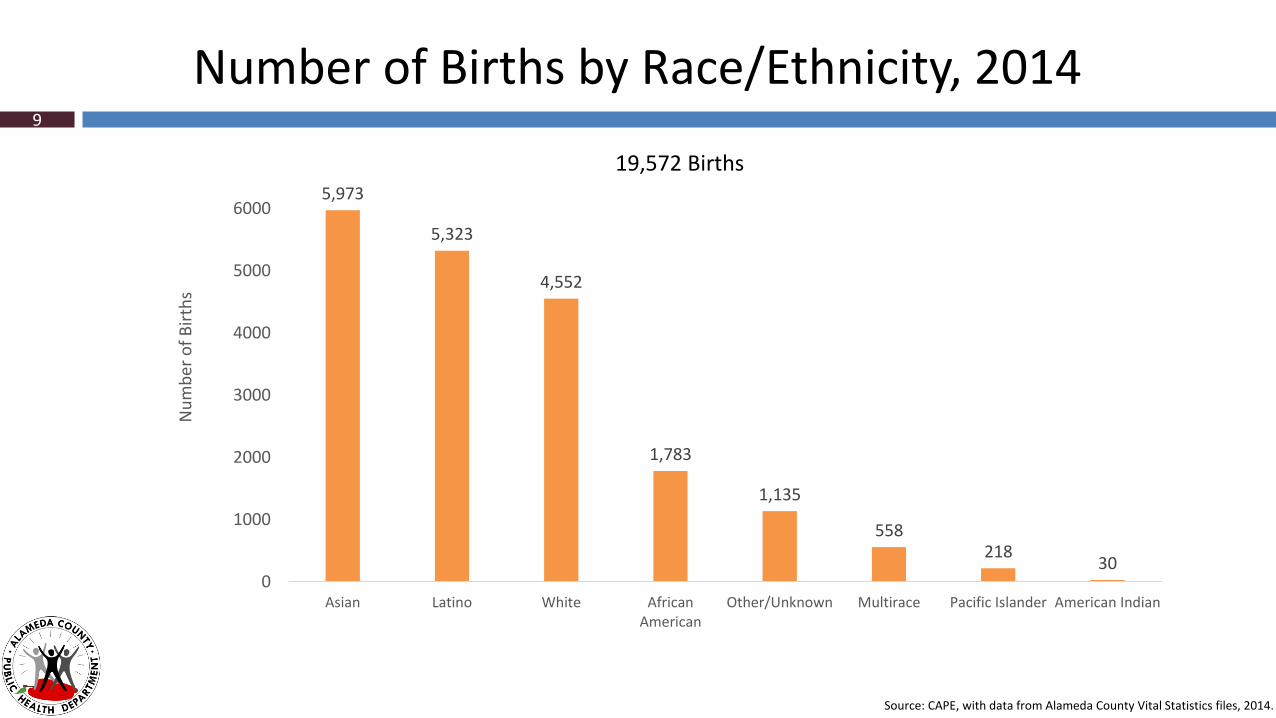
Number of Births by Race/Ethnicity, 2014
5,973
5,323
4,552
1,783
1,135
558218
300
1000
2000
3000
4000
5000
6000
Asian Latino White AfricanAmerican
Other/Unknown Multirace Pacific Islander American Indian
Nu
mb
er o
f B
irth
s
9
Source: CAPE, with data from Alameda County Vital Statistics files, 2014.
19,572 Births
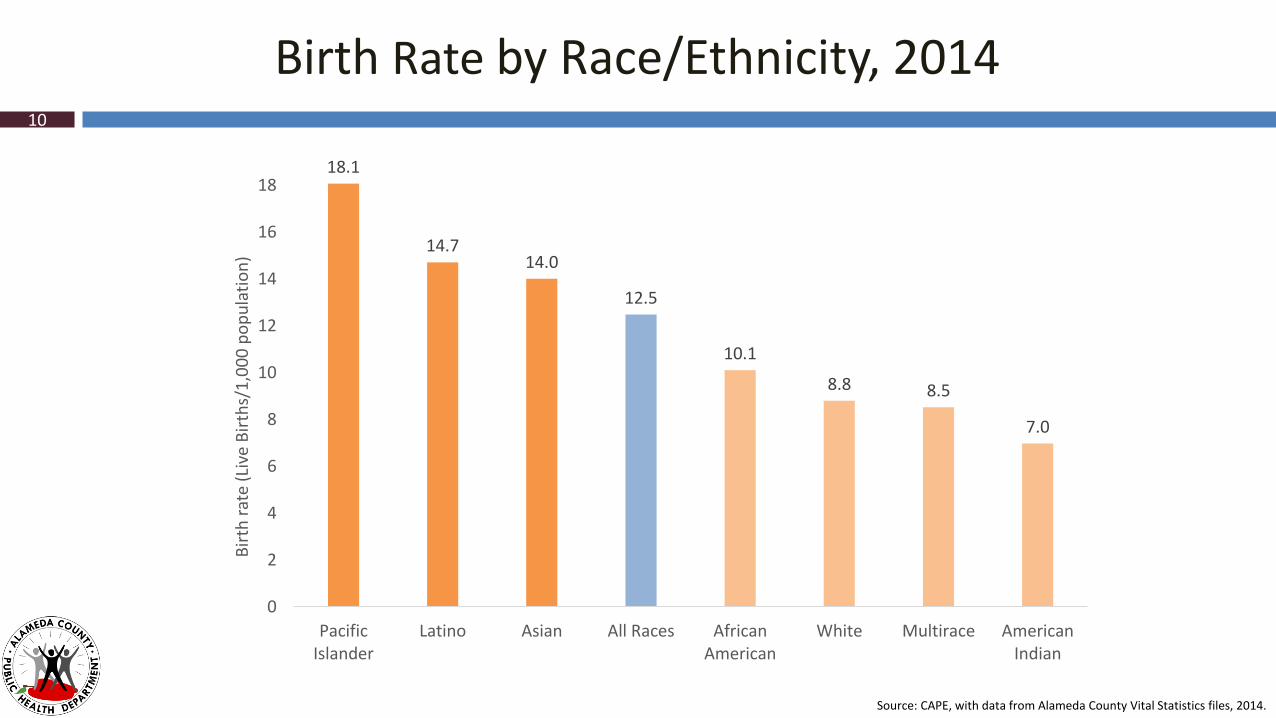
Birth Rate by Race/Ethnicity, 201410
18.1
14.714.0
12.5
10.1
8.8 8.5
7.0
0
2
4
6
8
10
12
14
16
18
PacificIslander
Latino Asian All Races AfricanAmerican
White Multirace AmericanIndian
Bir
th r
ate
(Liv
e B
irth
s/1
,00
0 p
op
ula
tio
n)
Source: CAPE, with data from Alameda County Vital Statistics files, 2014.
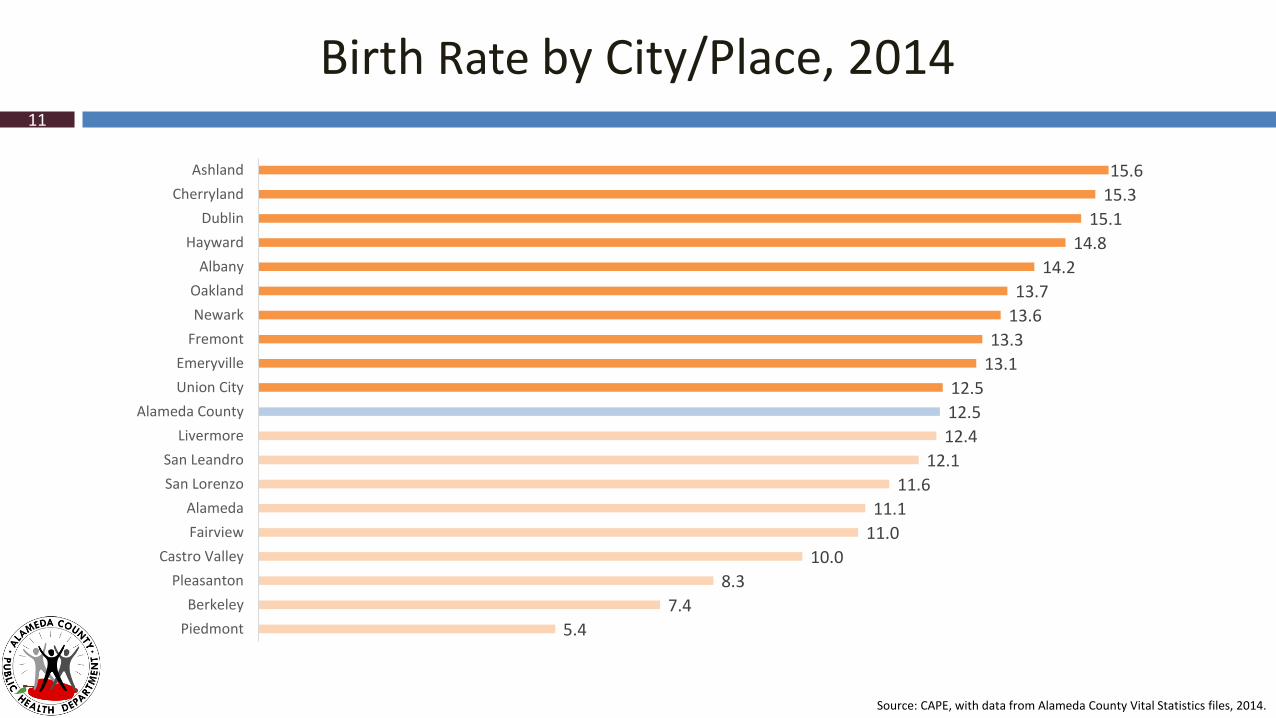
Birth Rate by City/Place, 201411
Source: CAPE, with data from Alameda County Vital Statistics files, 2014.
5.4
7.4
8.3
10.0
11.0
11.1
11.6
12.1
12.4
12.5
12.5
13.1
13.3
13.6
13.7
14.2
14.8
15.1
15.3
15.6
Piedmont
Berkeley
Pleasanton
Castro Valley
Fairview
Alameda
San Lorenzo
San Leandro
Livermore
Alameda County
Union City
Emeryville
Fremont
Newark
Oakland
Albany
Hayward
Dublin
Cherryland
Ashland
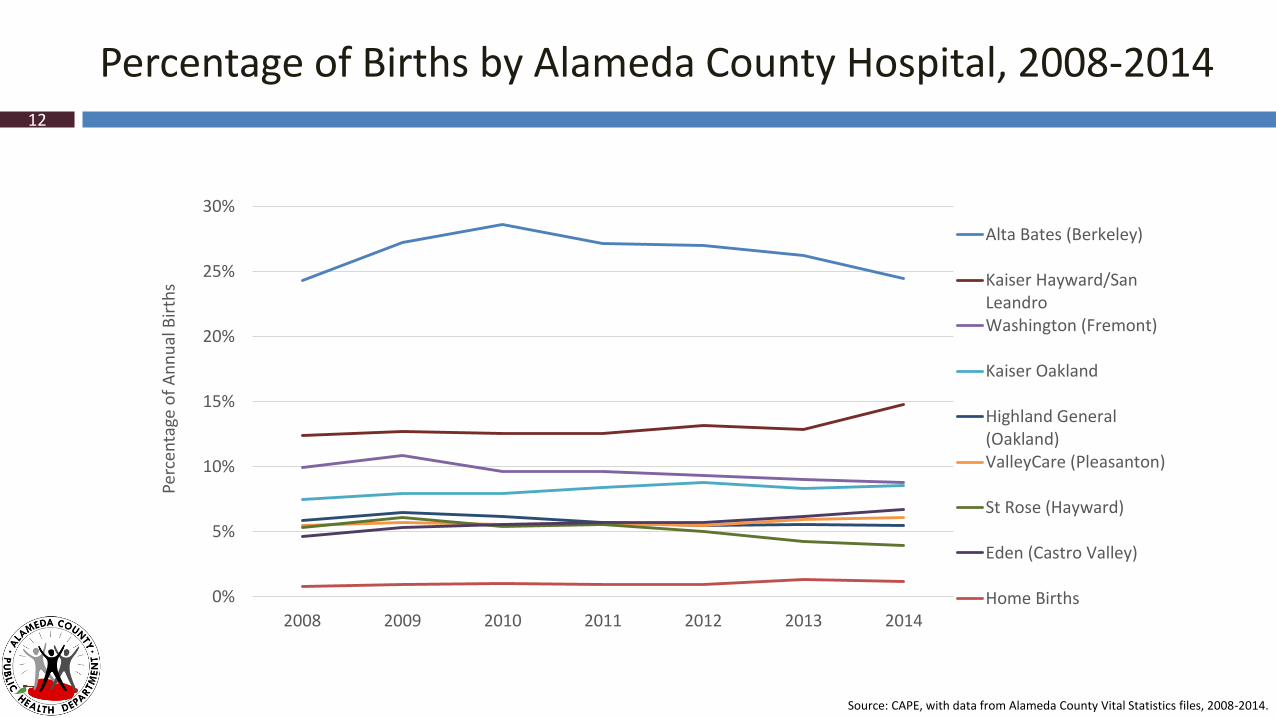
Percentage of Births by Alameda County Hospital, 2008-201412
Source: CAPE, with data from Alameda County Vital Statistics files, 2008-2014.
0%
5%
10%
15%
20%
25%
30%
2008 2009 2010 2011 2012 2013 2014
Perc
enta
ge o
f A
nn
ual
Bir
ths
Alta Bates (Berkeley)
Kaiser Hayward/SanLeandroWashington (Fremont)
Kaiser Oakland
Highland General(Oakland)ValleyCare (Pleasanton)
St Rose (Hayward)
Eden (Castro Valley)
Home Births
Source: CAPE, with data from Alameda County Vital Statistics files, 2000 and 2014
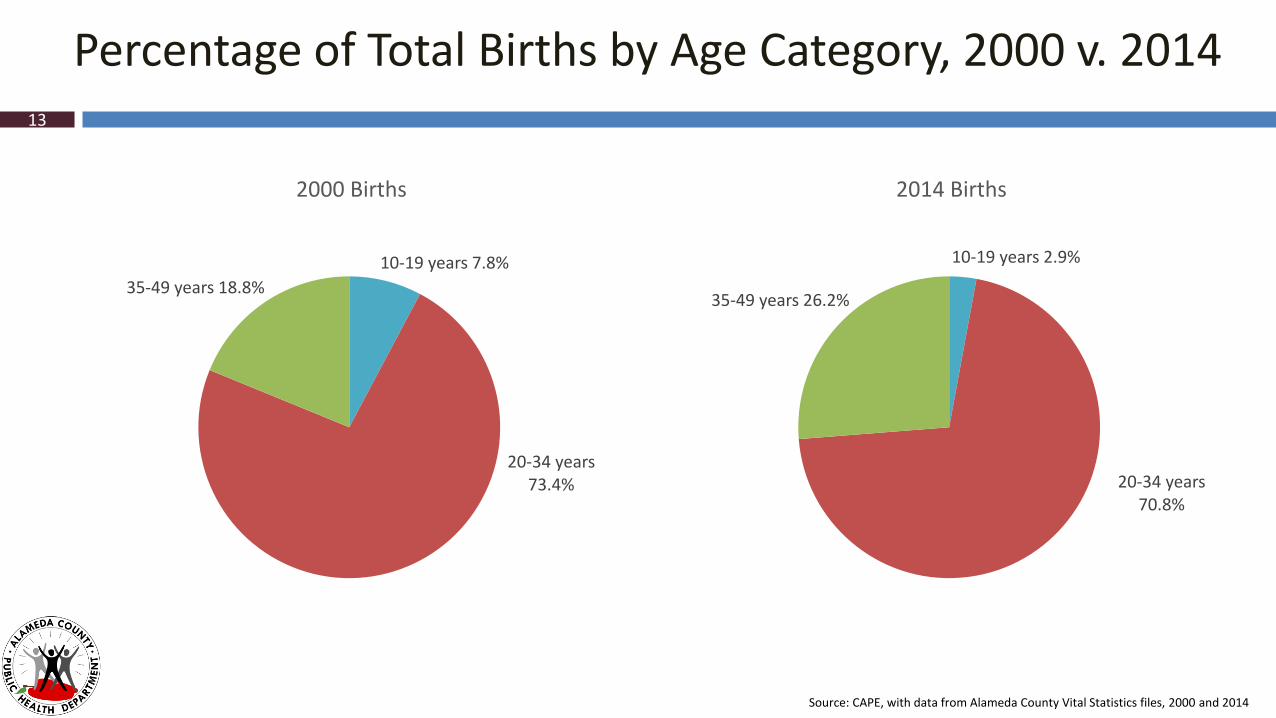
Percentage of Total Births by Age Category, 2000 v. 201413
10-19 years 7.8%
20-34 years 73.4%
35-49 years 18.8%
2000 Births
10-19 years 2.9%
20-34 years 70.8%
35-49 years 26.2%
2014 Births
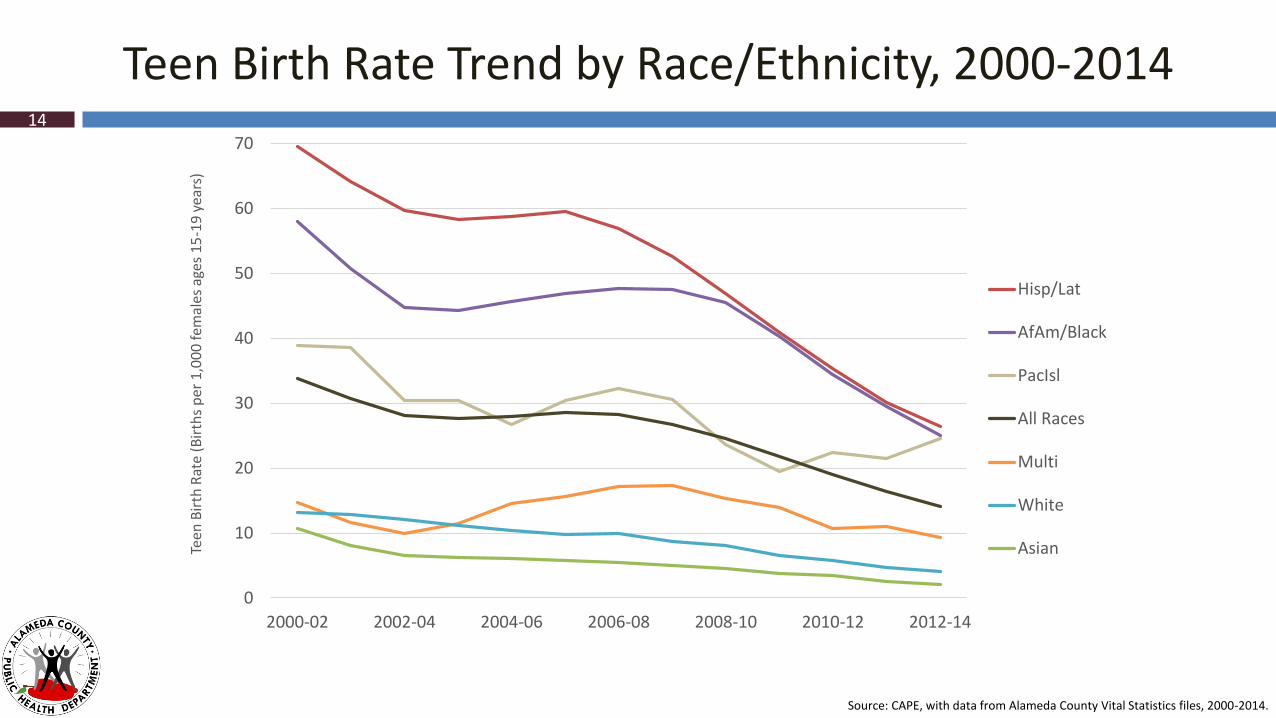
Teen Birth Rate Trend by Race/Ethnicity, 2000-2014
0
10
20
30
40
50
60
70
2000-02 2002-04 2004-06 2006-08 2008-10 2010-12 2012-14
Tee
n B
irth
Rat
e (B
irth
s p
er 1
,00
0 f
emal
es a
ges
15
-19
yea
rs)
Hisp/Lat
AfAm/Black
PacIsl
All Races
Multi
White
Asian
14
Source: CAPE, with data from Alameda County Vital Statistics files, 2000-2014.

31.5
24.3
17.2
11.7
7.9
2.91.7
0
5
10
15
20
25
30
35
Pacific Islander Latino AfricanAmerican
All Races Multirace White Asian
Teen
Bir
th R
ate
(# b
irth
s 1
5-1
9 y
ears
/1,0
00
p
op
ula
tio
n 1
5-1
9 y
ears
)
Teen Birth Rate by Race/Ethnicity, 201415
Source: CAPE, with data from Alameda County Vital Statistics files, 2014.
565 Teen Births
16
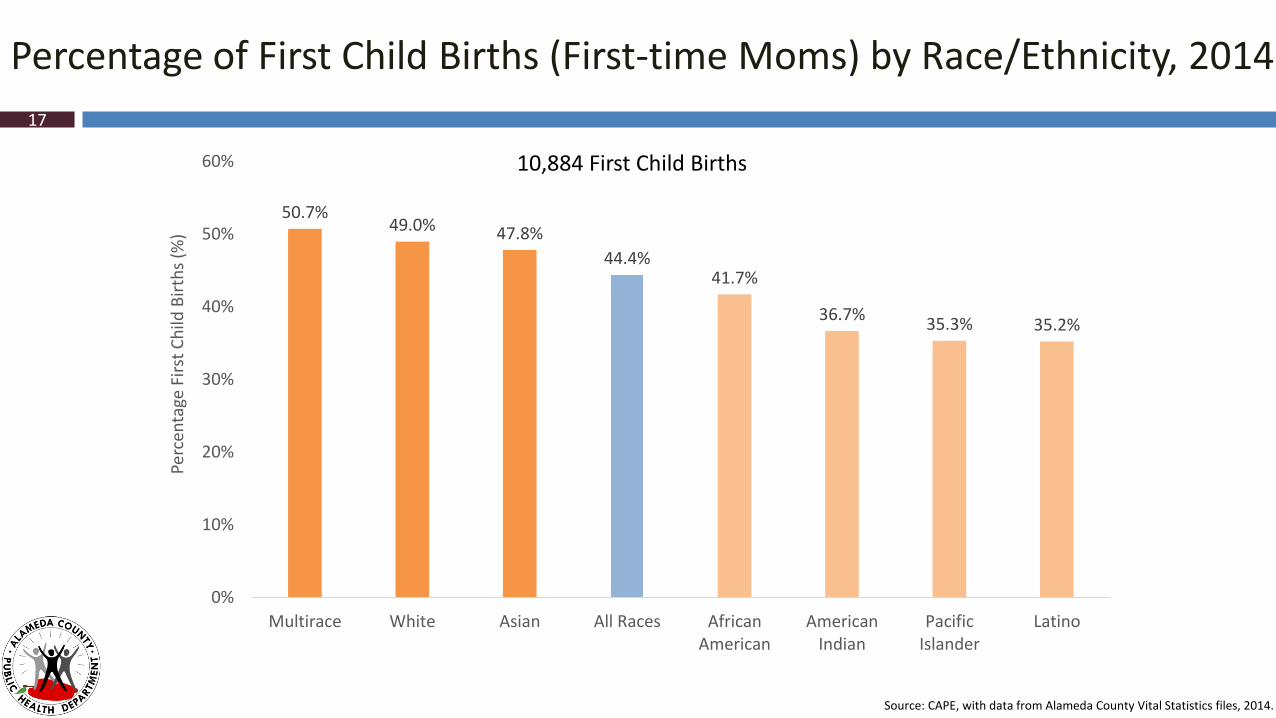
Percentage of First Child Births (First-time Moms) by Race/Ethnicity, 2014
17
50.7%49.0% 47.8%
44.4%41.7%
36.7%35.3% 35.2%
0%
10%
20%
30%
40%
50%
60%
Multirace White Asian All Races AfricanAmerican
AmericanIndian
PacificIslander
Latino
Perc
enta
ge F
irst
Ch
ild B
irth
s (%
)
Source: CAPE, with data from Alameda County Vital Statistics files, 2014.
10,884 First Child Births

Percentage Births to Foreign-born Mothers by Race/Ethnicity, 201418
81.8%
54.2%48.8% 48.2%
20.1%17.2%
10.6%
0%
20%
40%
60%
80%
100%
Asian Latino All Races PacificIslander
White AfricanDescent
Multirace
Perc
enta
ge o
f b
irth
s
Source: CAPE, with data from Alameda County Vital Statistics files, 2014.
9,550 Foreign-born Mom Births
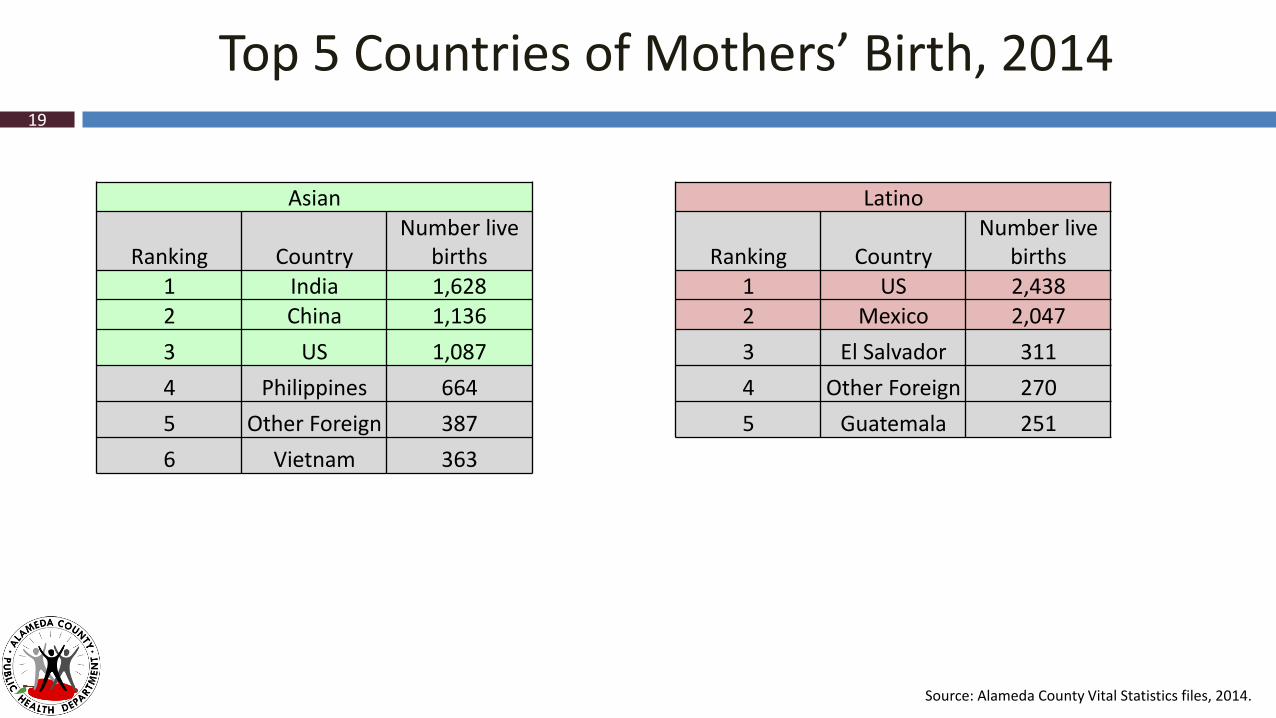
Top 5 Countries of Mothers’ Birth, 201419
Asian
Ranking CountryNumber live
births 1 India 1,6282 China 1,136
3 US 1,087
4 Philippines 664
5 Other Foreign 387
6 Vietnam 363
Source: Alameda County Vital Statistics files, 2014.
Latino
Ranking CountryNumber live
births 1 US 2,4382 Mexico 2,047
3 El Salvador 311
4 Other Foreign 270
5 Guatemala 251
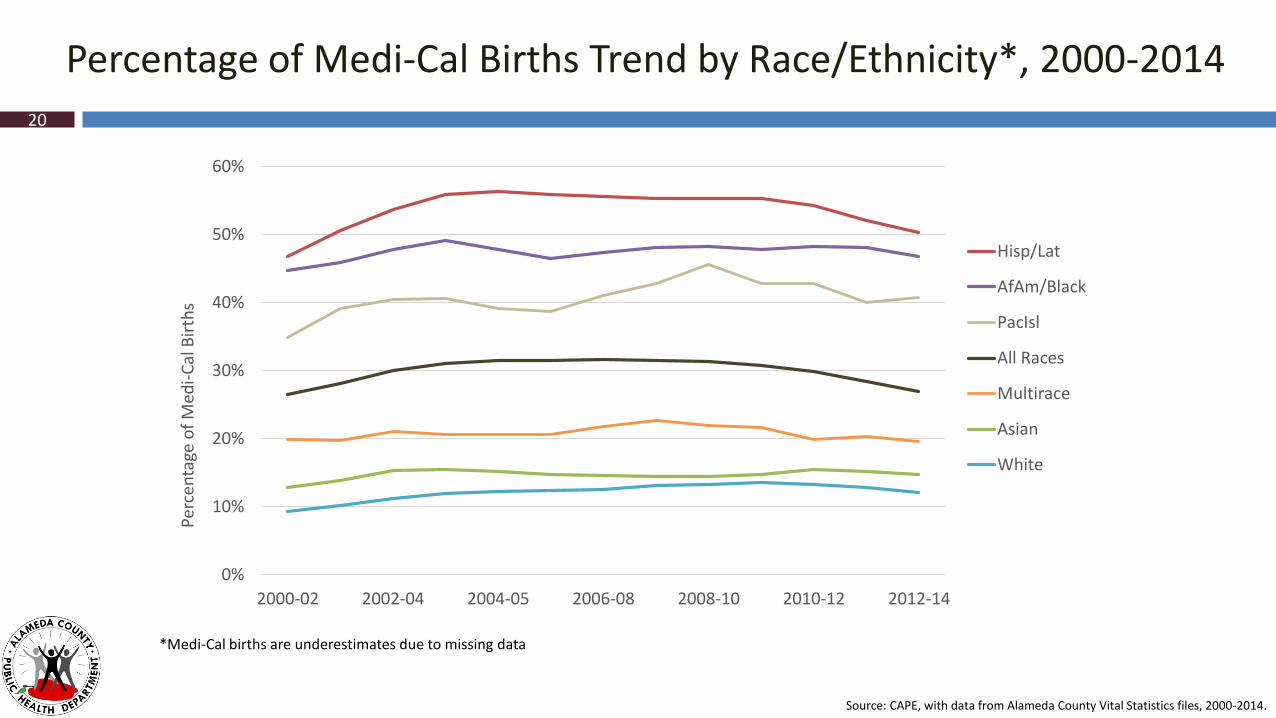
Percentage of Medi-Cal Births Trend by Race/Ethnicity*, 2000-2014
20
Source: CAPE, with data from Alameda County Vital Statistics files, 2000-2014.
*Medi-Cal births are underestimates due to missing data
0%
10%
20%
30%
40%
50%
60%
2000-02 2002-04 2004-05 2006-08 2008-10 2010-12 2012-14
Perc
enta
ge o
f M
edi-
Cal
Bir
ths
Hisp/Lat
AfAm/Black
PacIsl
All Races
Multirace
Asian
White
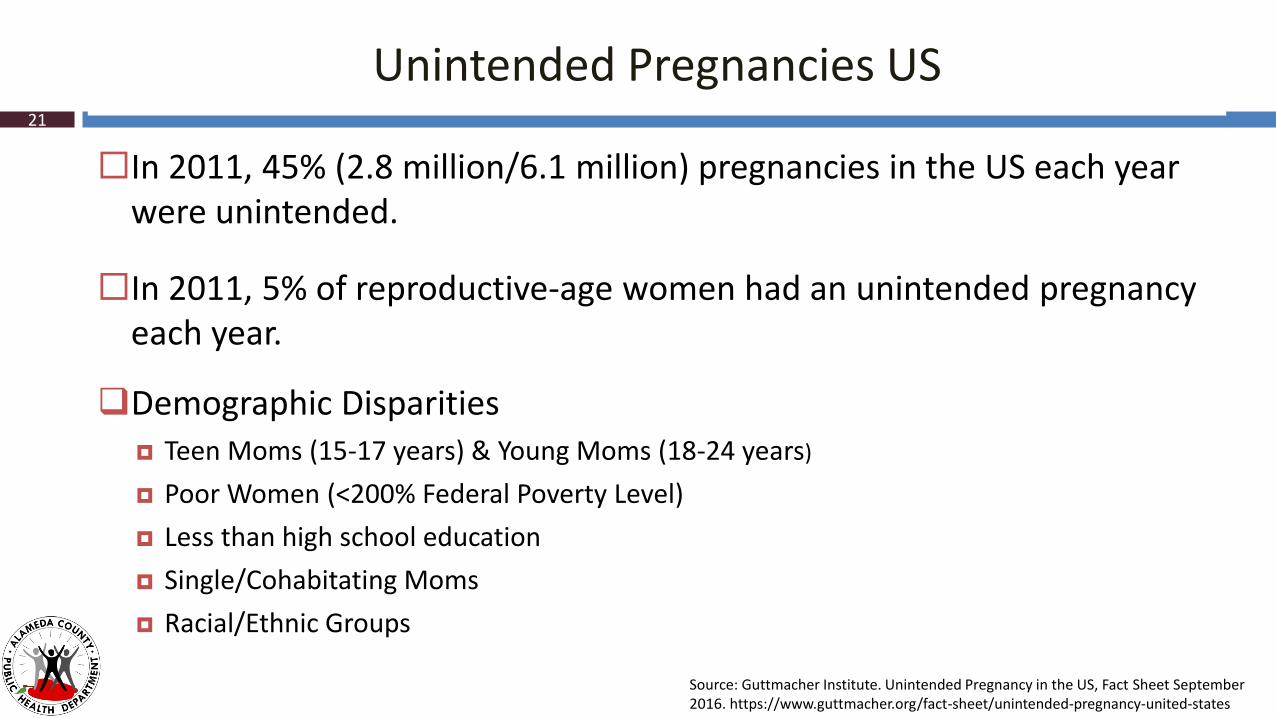
Unintended Pregnancies US
In 2011, 45% (2.8 million/6.1 million) pregnancies in the US each year were unintended.
In 2011, 5% of reproductive-age women had an unintended pregnancy each year.
Demographic Disparities Teen Moms (15-17 years) & Young Moms (18-24 years)
Poor Women (<200% Federal Poverty Level)
Less than high school education
Single/Cohabitating Moms
Racial/Ethnic Groups
21
Source: Guttmacher Institute. Unintended Pregnancy in the US, Fact Sheet September 2016. https://www.guttmacher.org/fact-sheet/unintended-pregnancy-united-states
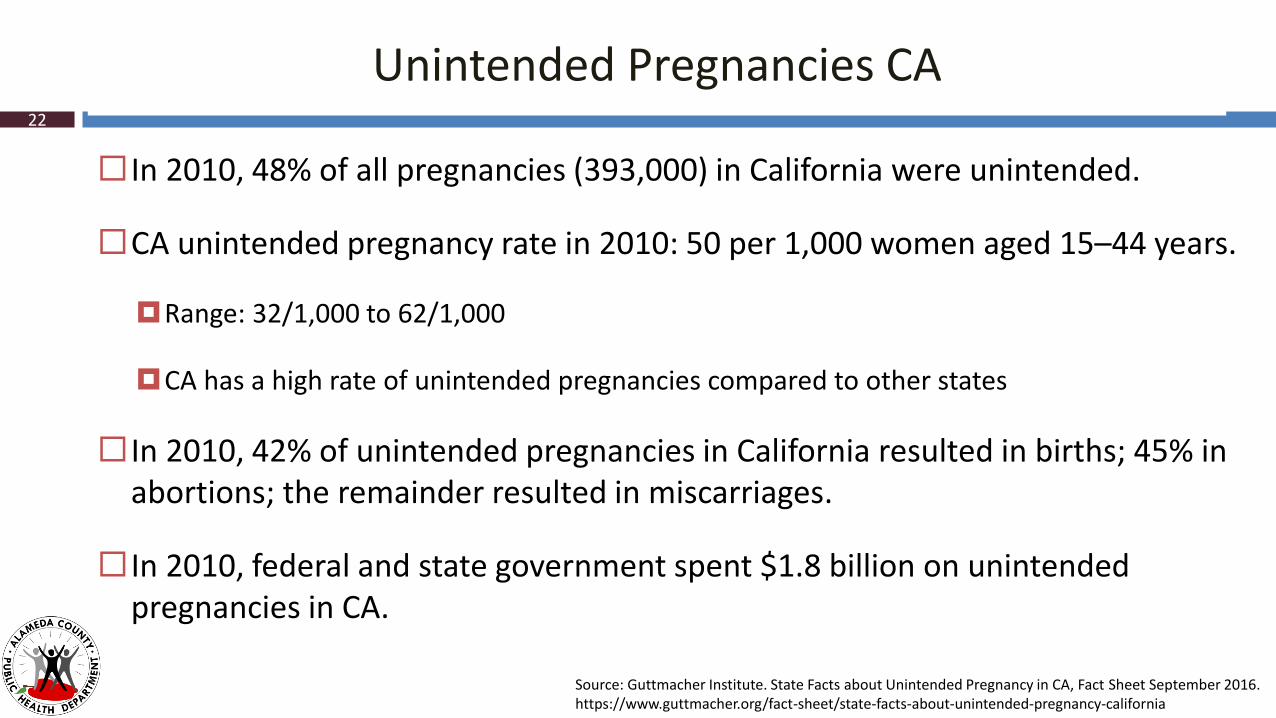
Unintended Pregnancies CA
In 2010, 48% of all pregnancies (393,000) in California were unintended.
CA unintended pregnancy rate in 2010: 50 per 1,000 women aged 15–44 years.
Range: 32/1,000 to 62/1,000
CA has a high rate of unintended pregnancies compared to other states
In 2010, 42% of unintended pregnancies in California resulted in births; 45% in abortions; the remainder resulted in miscarriages.
In 2010, federal and state government spent $1.8 billion on unintended pregnancies in CA.
22
Source: Guttmacher Institute. State Facts about Unintended Pregnancy in CA, Fact Sheet September 2016. https://www.guttmacher.org/fact-sheet/state-facts-about-unintended-pregnancy-california
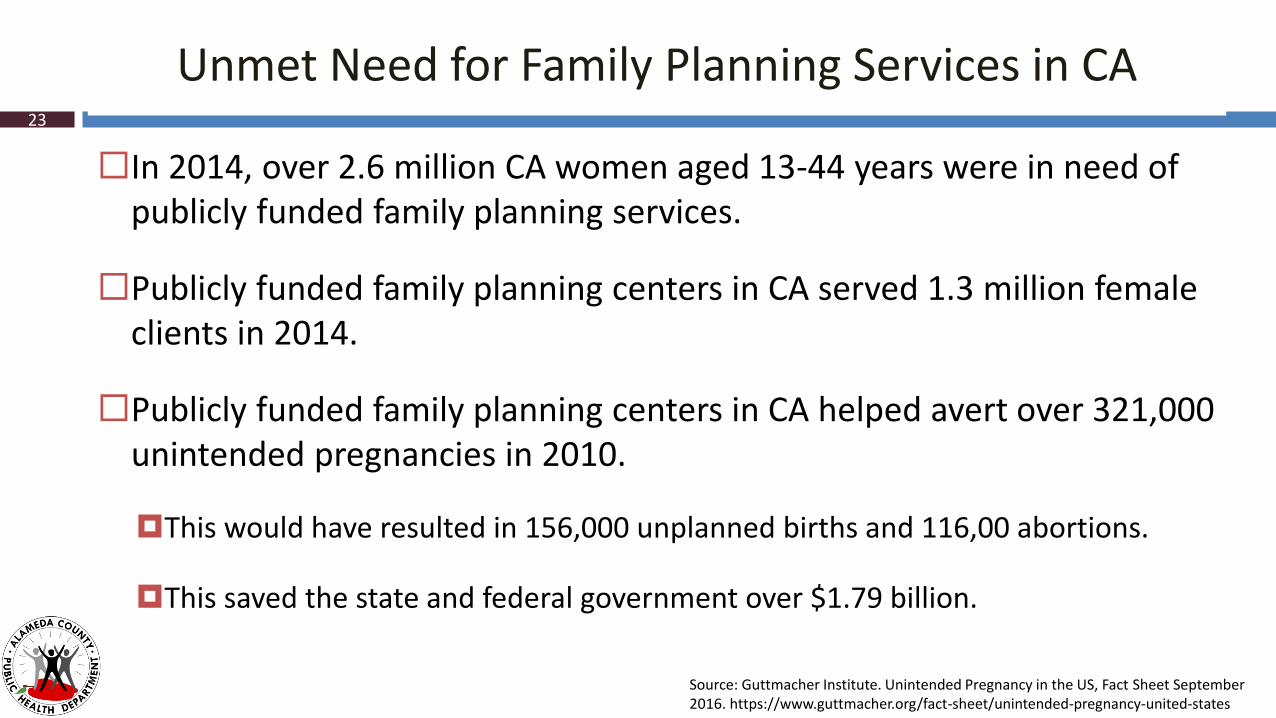
Unmet Need for Family Planning Services in CA
In 2014, over 2.6 million CA women aged 13-44 years were in need of publicly funded family planning services.
Publicly funded family planning centers in CA served 1.3 million female clients in 2014.
Publicly funded family planning centers in CA helped avert over 321,000 unintended pregnancies in 2010.
This would have resulted in 156,000 unplanned births and 116,00 abortions.
This saved the state and federal government over $1.79 billion.
23
Source: Guttmacher Institute. Unintended Pregnancy in the US, Fact Sheet September 2016. https://www.guttmacher.org/fact-sheet/unintended-pregnancy-united-states
Prenatal Care
Breastfeeding
Premature Birth
Low Birth Weight
Very Low Birth Weight
Infant Deaths
Fetal Deaths
How healthy are moms & infants in Alameda County?24
2012-2014 Data
Trends
Race/Ethnicity
Compared to HP2020 & California
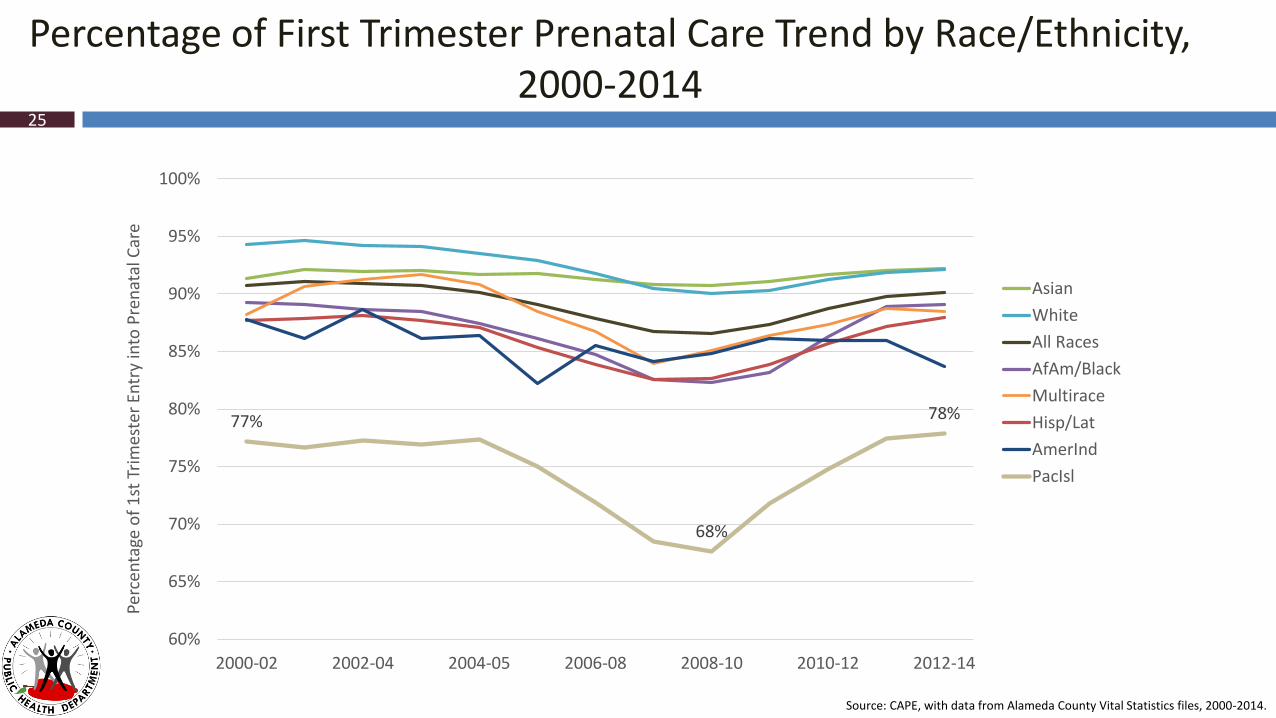
Percentage of First Trimester Prenatal Care Trend by Race/Ethnicity, 2000-2014
77%
68%
78%
60%
65%
70%
75%
80%
85%
90%
95%
100%
2000-02 2002-04 2004-05 2006-08 2008-10 2010-12 2012-14
Perc
enta
ge o
f 1
st T
rim
este
r En
try
into
Pre
nat
al C
are
Asian
White
All Races
AfAm/Black
Multirace
Hisp/Lat
AmerInd
PacIsl
25
Source: CAPE, with data from Alameda County Vital Statistics files, 2000-2014.
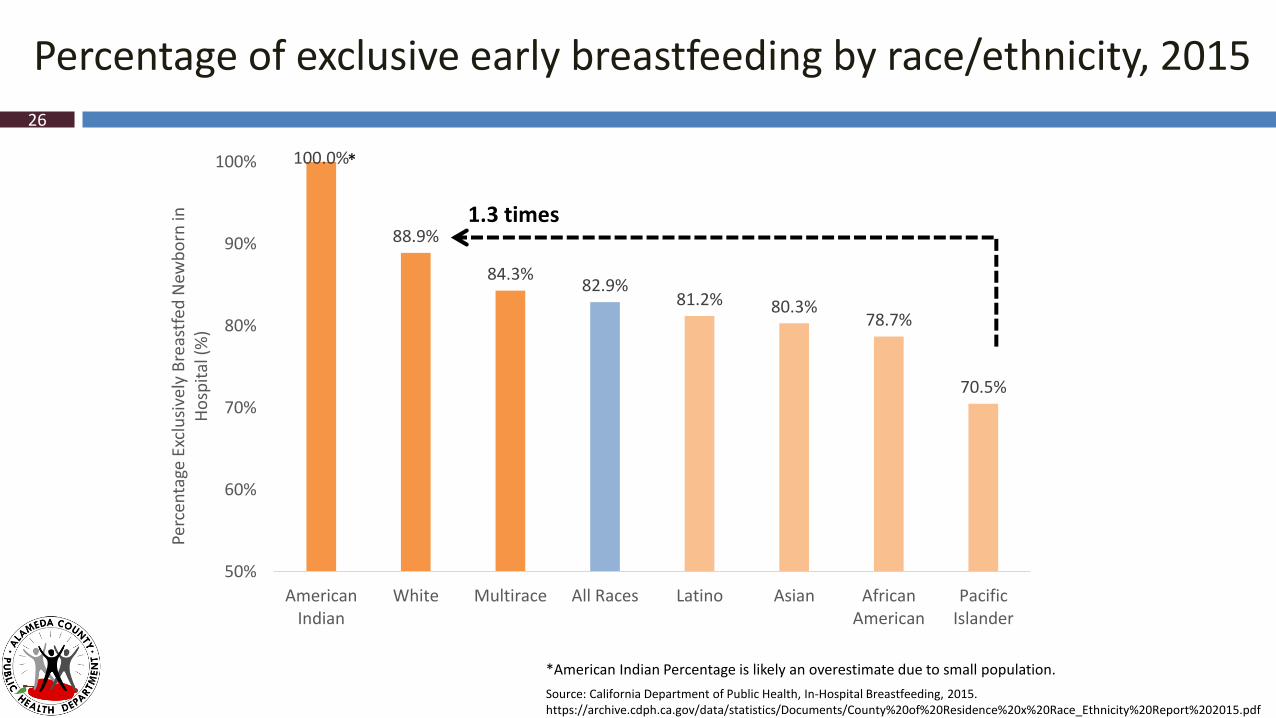
100.0%
88.9%
84.3%82.9%
81.2% 80.3%78.7%
70.5%
50%
60%
70%
80%
90%
100%
AmericanIndian
White Multirace All Races Latino Asian AfricanAmerican
PacificIslander
Perc
enta
ge E
xclu
sive
ly B
reas
tfed
New
bo
rn in
H
osp
ital
(%
)
*
Percentage of exclusive early breastfeeding by race/ethnicity, 2015
Source: California Department of Public Health, In-Hospital Breastfeeding, 2015. https://archive.cdph.ca.gov/data/statistics/Documents/County%20of%20Residence%20x%20Race_Ethnicity%20Report%202015.pdf
26
1.3 times
*American Indian Percentage is likely an overestimate due to small population.
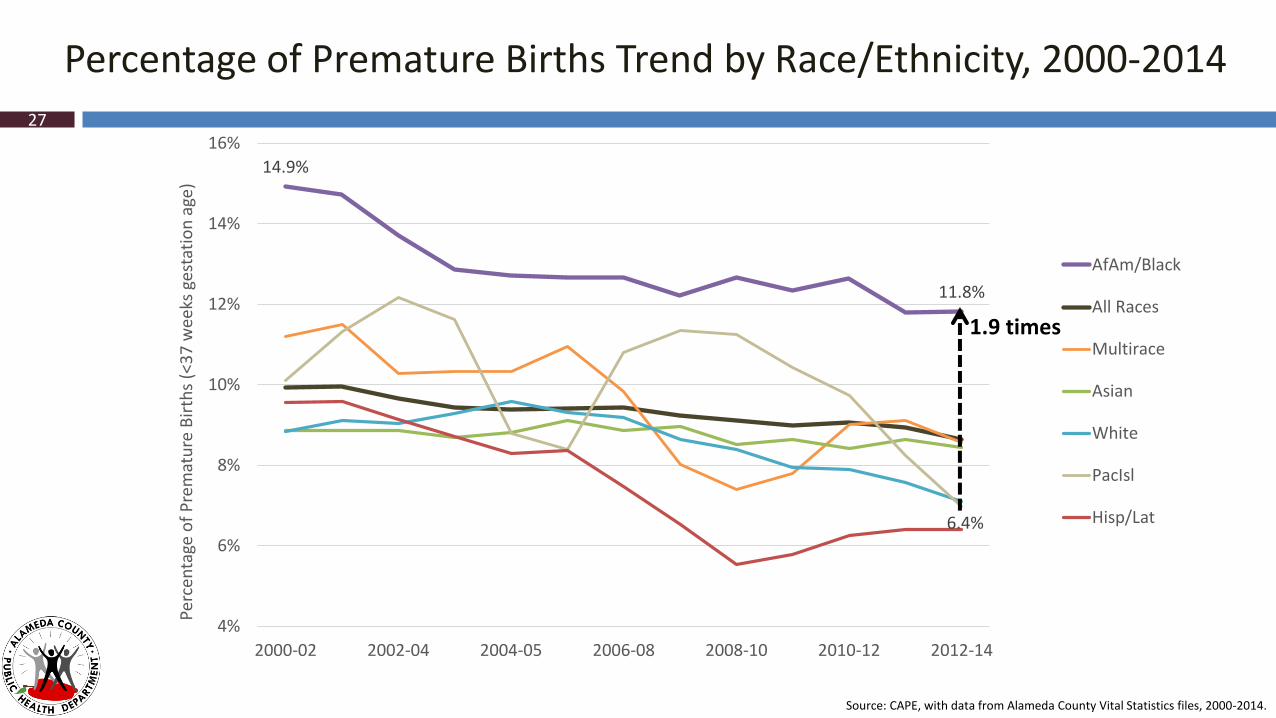
Percentage of Premature Births Trend by Race/Ethnicity, 2000-2014
14.9%
11.8%
6.4%
4%
6%
8%
10%
12%
14%
16%
2000-02 2002-04 2004-05 2006-08 2008-10 2010-12 2012-14
Perc
enta
ge o
f P
rem
atu
re B
irth
s (<
37
wee
ks g
esta
tio
n a
ge)
AfAm/Black
All Races
Multirace
Asian
White
PacIsl
Hisp/Lat
27
Source: CAPE, with data from Alameda County Vital Statistics files, 2000-2014.
1.9 times
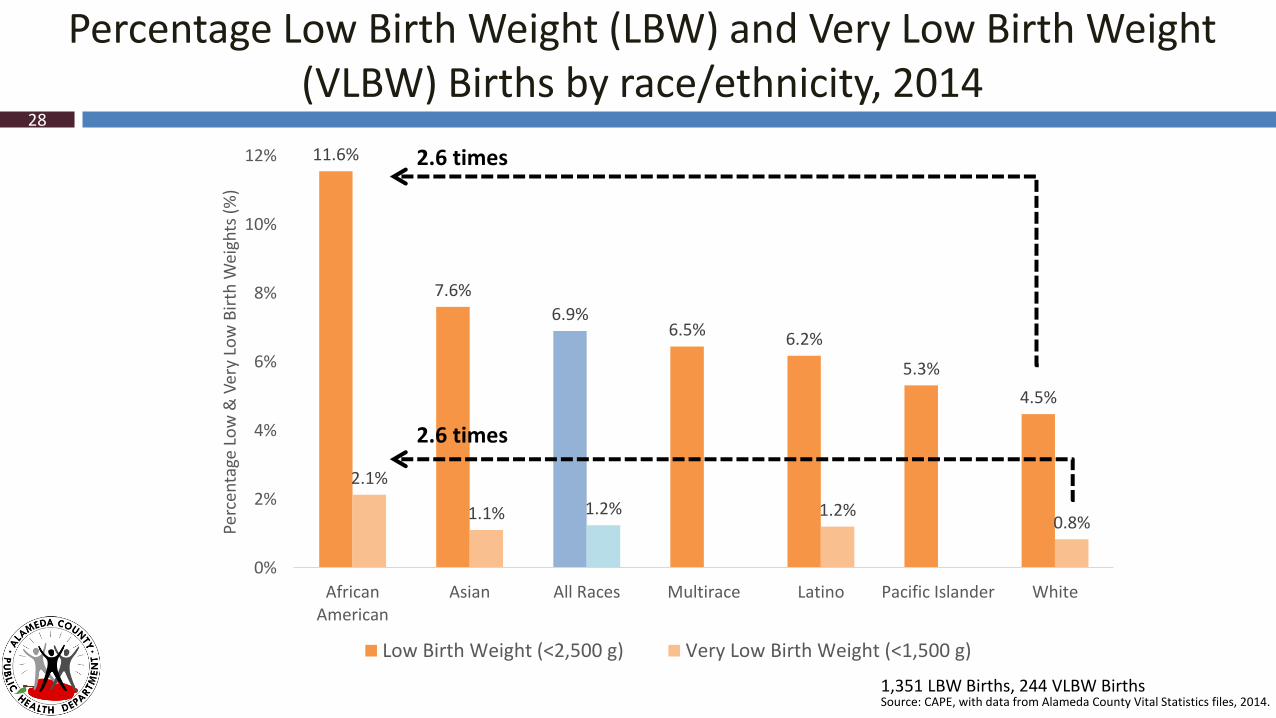
11.6%
7.6%
6.9%6.5% 6.2%
5.3%
4.5%
2.1%
1.1% 1.2% 1.2%0.8%
0%
2%
4%
6%
8%
10%
12%
AfricanAmerican
Asian All Races Multirace Latino Pacific Islander White
Perc
enta
ge L
ow
& V
ery
Low
Bir
th W
eigh
ts (
%)
Low Birth Weight (<2,500 g) Very Low Birth Weight (<1,500 g)
Percentage Low Birth Weight (LBW) and Very Low Birth Weight (VLBW) Births by race/ethnicity, 2014
28
2.6 times
2.6 times
1,351 LBW Births, 244 VLBW BirthsSource: CAPE, with data from Alameda County Vital Statistics files, 2014.
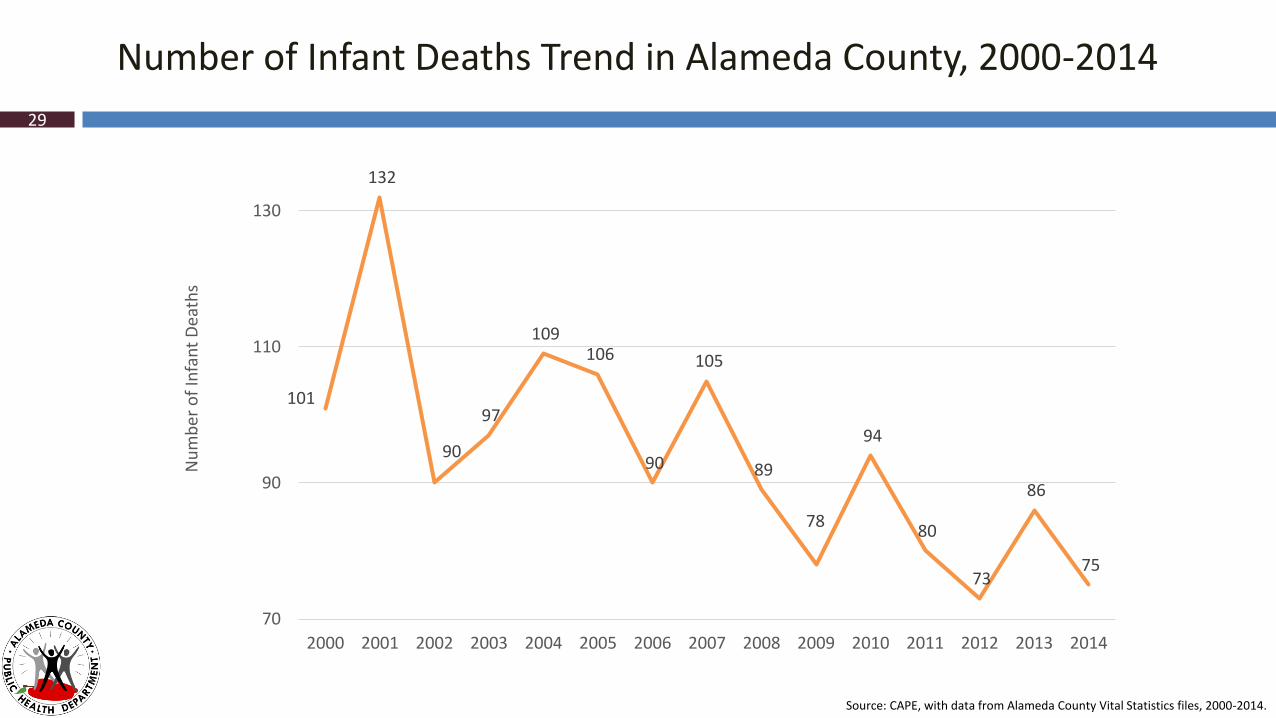
Number of Infant Deaths Trend in Alameda County, 2000-2014
29
101
132
90
97
109 106
90
105
89
78
94
80
73
86
75
70
90
110
130
2000 2001 2002 2003 2004 2005 2006 2007 2008 2009 2010 2011 2012 2013 2014
Nu
mb
er o
f In
fan
t D
eath
s
Source: CAPE, with data from Alameda County Vital Statistics files, 2000-2014.
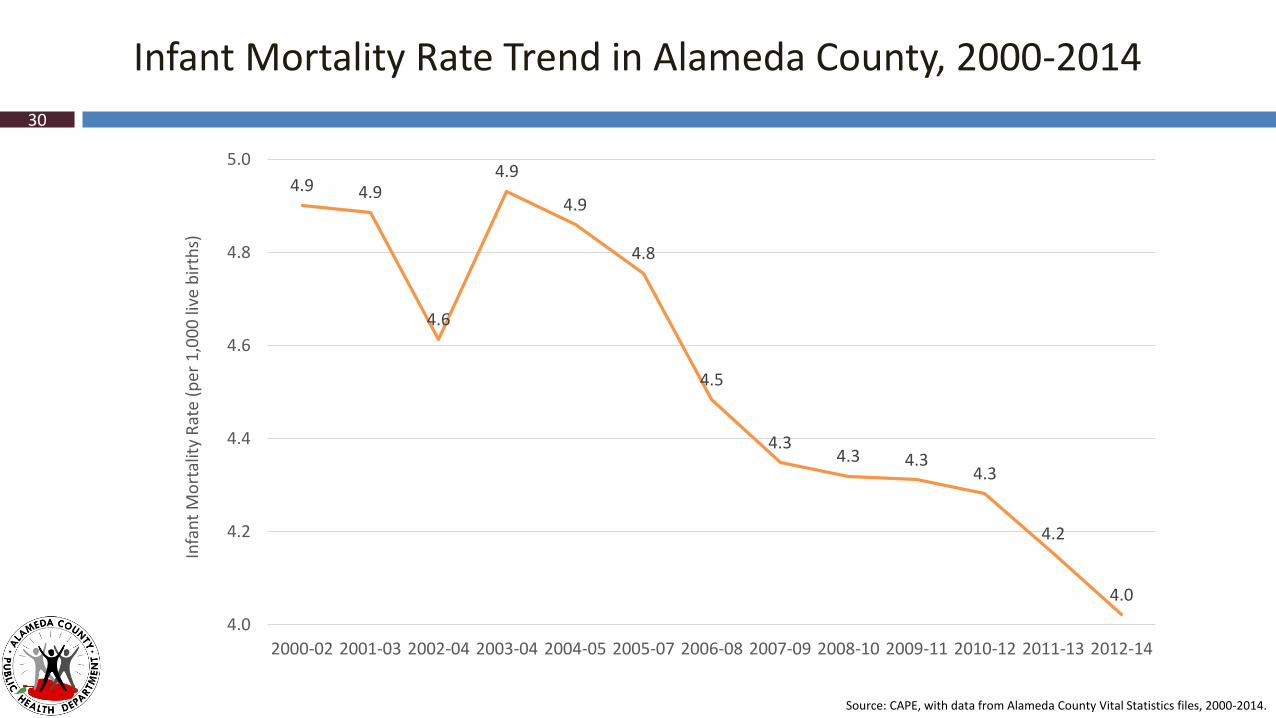
Infant Mortality Rate Trend in Alameda County, 2000-2014
30
Source: CAPE, with data from Alameda County Vital Statistics files, 2000-2014.
4.9 4.9
4.6
4.9
4.9
4.8
4.5
4.34.3 4.3
4.3
4.2
4.0
4.0
4.2
4.4
4.6
4.8
5.0
2000-02 2001-03 2002-04 2003-04 2004-05 2005-07 2006-08 2007-09 2008-10 2009-11 2010-12 2011-13 2012-14
Infa
nt
Mo
rtal
ity
Rat
e (p
er 1
,00
0 li
ve b
irth
s)
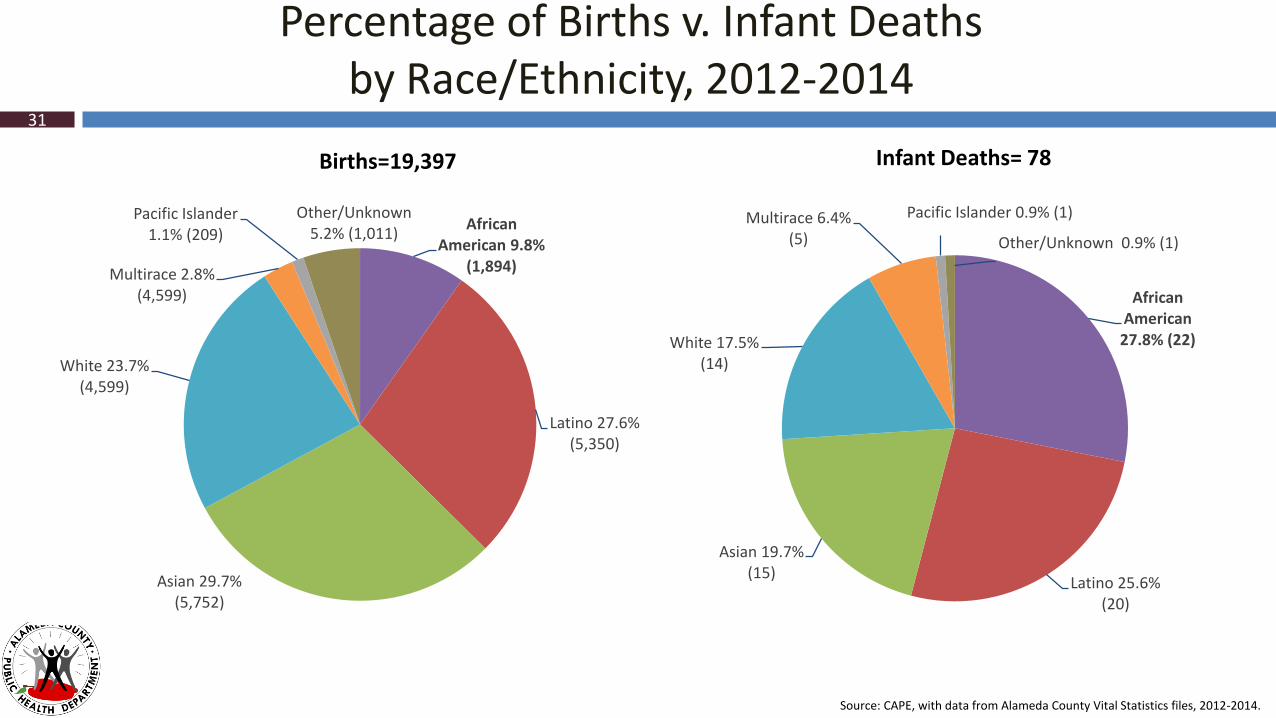
African American 27.8% (22)
Latino 25.6% (20)
Asian 19.7% (15)
White 17.5% (14)
Multirace 6.4% (5)
Pacific Islander 0.9% (1)
Other/Unknown 0.9% (1)African
American 9.8% (1,894)
Latino 27.6% (5,350)
Asian 29.7% (5,752)
White 23.7% (4,599)
Multirace 2.8% (4,599)
Pacific Islander 1.1% (209)
Other/Unknown 5.2% (1,011)
Percentage of Births v. Infant Deaths by Race/Ethnicity, 2012-2014
31
Births=19,397 Infant Deaths= 78
Source: CAPE, with data from Alameda County Vital Statistics files, 2012-2014.

Infant Mortality Rate Trend by Race/Ethnicity, 2000-2014
10.6
11.7
9.3
10.210.8
12.011.7
9.5
8.17.6
8.9
10.4
11.4
0
2
4
6
8
10
12
14
2000-02 2002-04 2004-05 2006-08 2008-10 2010-12 2012-14
Infa
nt
Mo
rtal
ity
Rat
e (p
er 1
,00
0 li
ve b
irth
s)
AfAm/Black
All Races
Hisp/Lat
White
Asian
32
Source: CAPE, with data from Alameda County Vital Statistics files, 2000-2014.
4.3 times
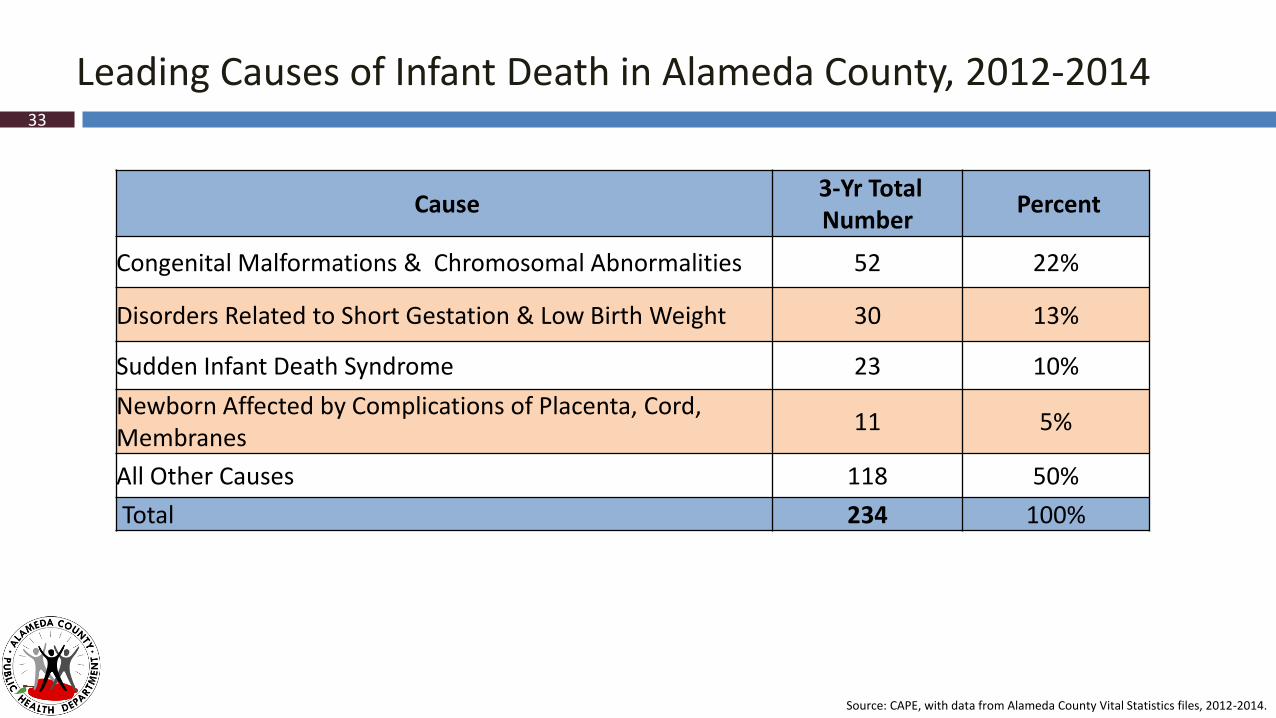
Leading Causes of Infant Death in Alameda County, 2012-2014
Cause3-Yr Total Number
Percent
Congenital Malformations & Chromosomal Abnormalities 52 22%
Disorders Related to Short Gestation & Low Birth Weight 30 13%
Sudden Infant Death Syndrome 23 10%
Newborn Affected by Complications of Placenta, Cord, Membranes
11 5%
All Other Causes 118 50%
Total 234 100%
Source: CAPE, with data from Alameda County Vital Statistics files, 2012-2014.
33

SIDS Deaths in Alameda County
34
Over the last five years, Alameda County had an average of 8 SIDS cases per year.
Source: CAPE, with data from Alameda County Vital Statistics files, 2000-2014.
African American 37.5% (15)
Latino 15.0% (6)
Asian/Pacific Islander
15.0% (6)
White 12.5% (5)
Multirace 15.0% (6)
SIDS cases in Alameda County by Race/Ethnicity, 2010-2014
5 -Year Total
0.0
0.5
1.0
1.5
2.0
2.5
3.0
3.5
4.0
4.5
5.0
2000 2001 2002 2003 2004 2005 2006 2007 2008 2009 2010 2011 2012 2013 2014
SID
S p
er 1
,00
0 li
ve b
irth
s
SIDS Trend in Alameda County
The trend shows a slight decrease in SIDS rates over time that is not statistically significant (p=0.07)
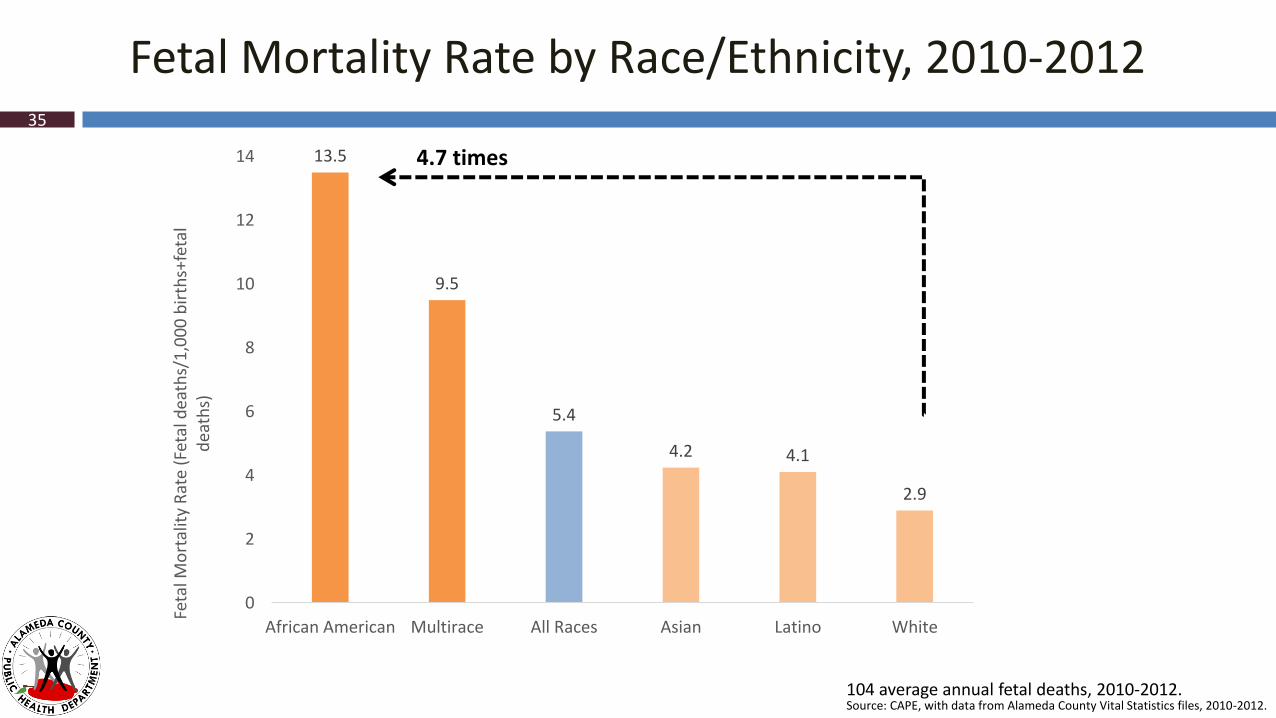
13.5
9.5
5.4
4.2 4.1
2.9
0
2
4
6
8
10
12
14
African American Multirace All Races Asian Latino White
Feta
l Mo
rtal
ity
Rat
e (F
etal
dea
ths/
1,0
00
bir
ths+
feta
l d
eath
s)
Fetal Mortality Rate by Race/Ethnicity, 2010-201235
4.7 times
Source: CAPE, with data from Alameda County Vital Statistics files, 2010-2012.104 average annual fetal deaths, 2010-2012.
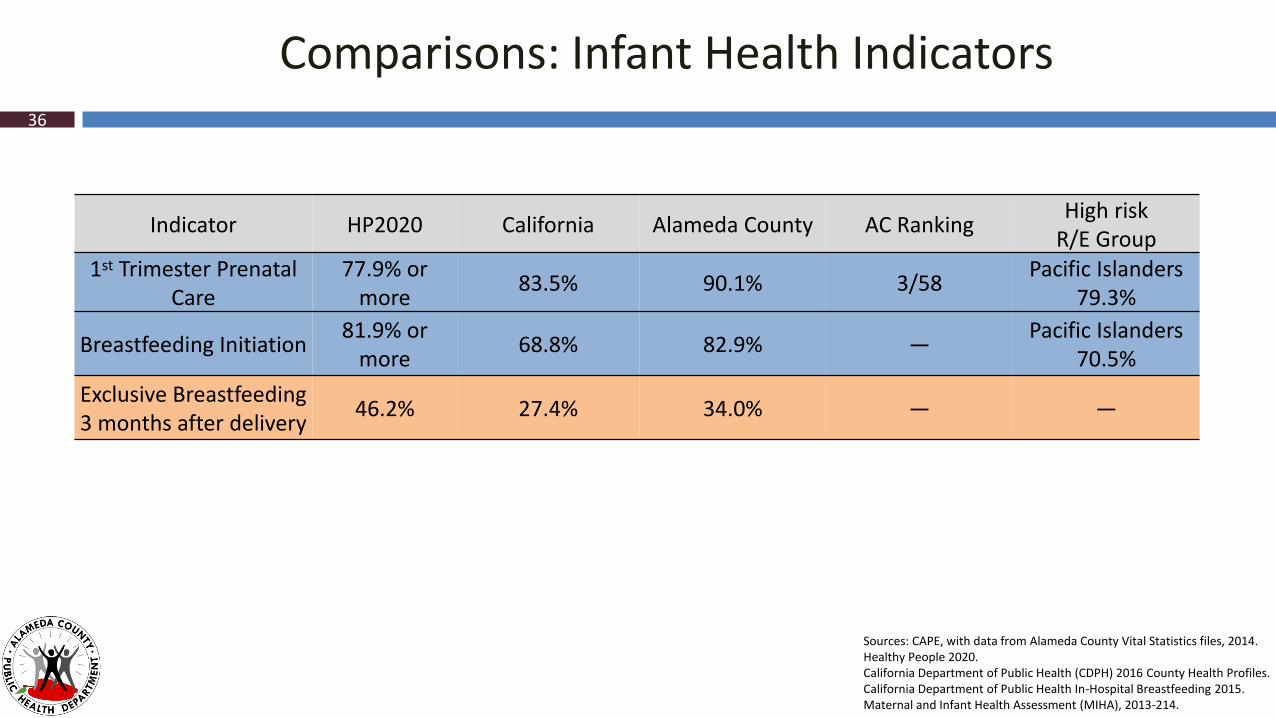
Comparisons: Infant Health Indicators36
Indicator HP2020 California Alameda County AC RankingHigh risk
R/E Group1st Trimester Prenatal
Care77.9% or
more83.5% 90.1% 3/58
Pacific Islanders79.3%
Breastfeeding Initiation81.9% or
more68.8% 82.9% ―
Pacific Islanders70.5%
Exclusive Breastfeeding3 months after delivery
46.2% 27.4% 34.0% ― ―
Sources: CAPE, with data from Alameda County Vital Statistics files, 2014.Healthy People 2020.California Department of Public Health (CDPH) 2016 County Health Profiles. California Department of Public Health In-Hospital Breastfeeding 2015.Maternal and Infant Health Assessment (MIHA), 2013-214.
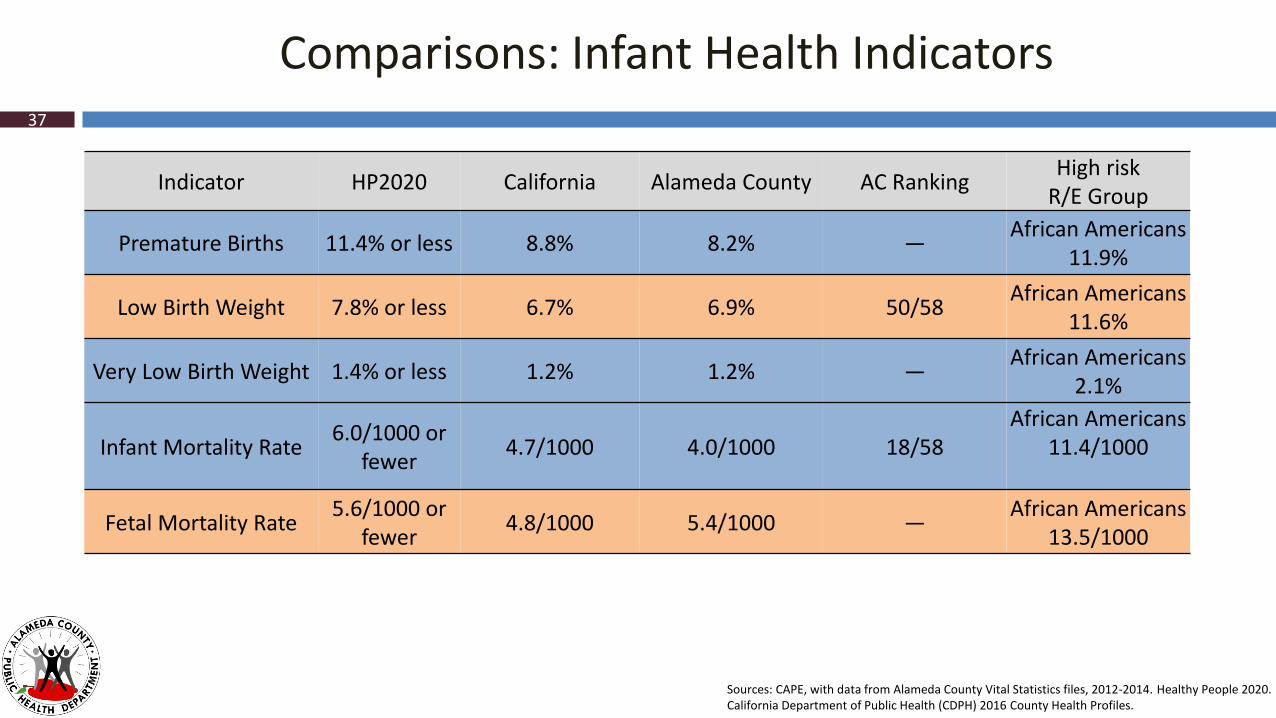
Comparisons: Infant Health Indicators37
Indicator HP2020 California Alameda County AC RankingHigh risk
R/E Group
Premature Births 11.4% or less 8.8% 8.2% ―African Americans
11.9%
Low Birth Weight 7.8% or less 6.7% 6.9% 50/58African Americans
11.6%
Very Low Birth Weight 1.4% or less 1.2% 1.2% ―African Americans
2.1%
Infant Mortality Rate6.0/1000 or
fewer4.7/1000 4.0/1000 18/58
African Americans11.4/1000
Fetal Mortality Rate5.6/1000 or
fewer4.8/1000 5.4/1000 ―
African Americans13.5/1000
Sources: CAPE, with data from Alameda County Vital Statistics files, 2012-2014. Healthy People 2020. California Department of Public Health (CDPH) 2016 County Health Profiles.
The Life Course Perspective in Alameda County38
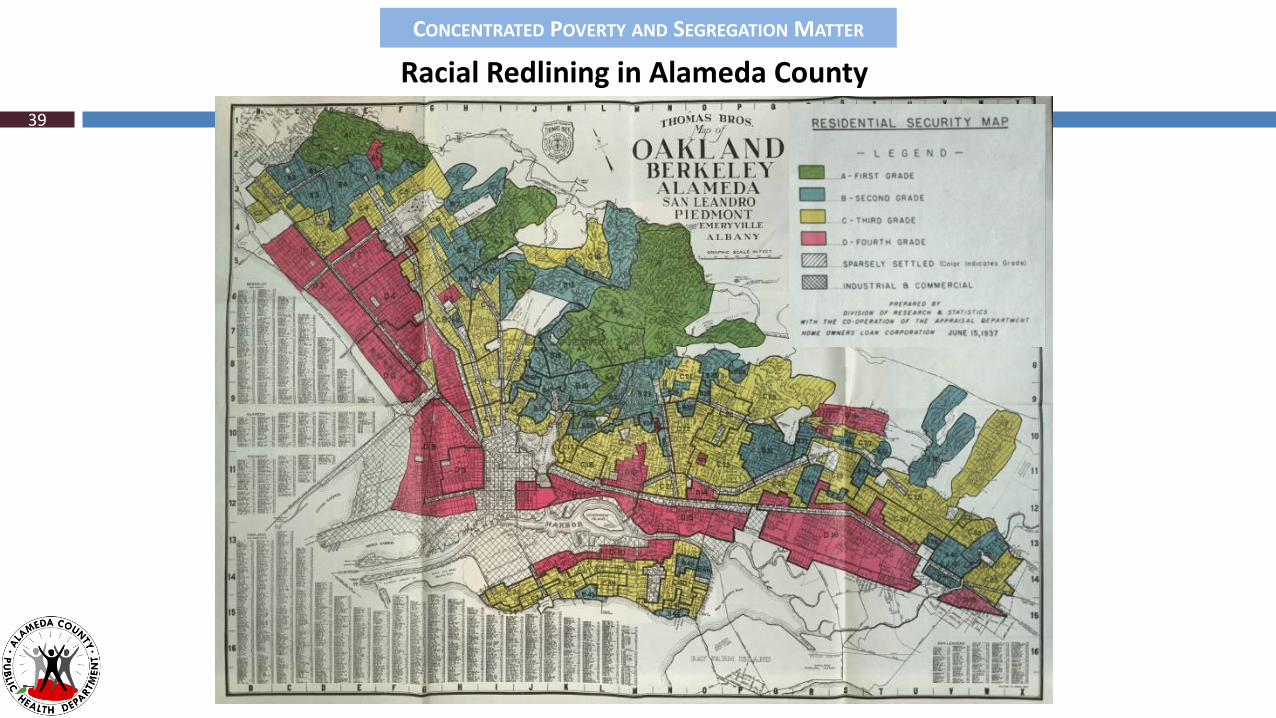
Racial Redlining in Alameda County
CONCENTRATED POVERTY AND SEGREGATION MATTER
39
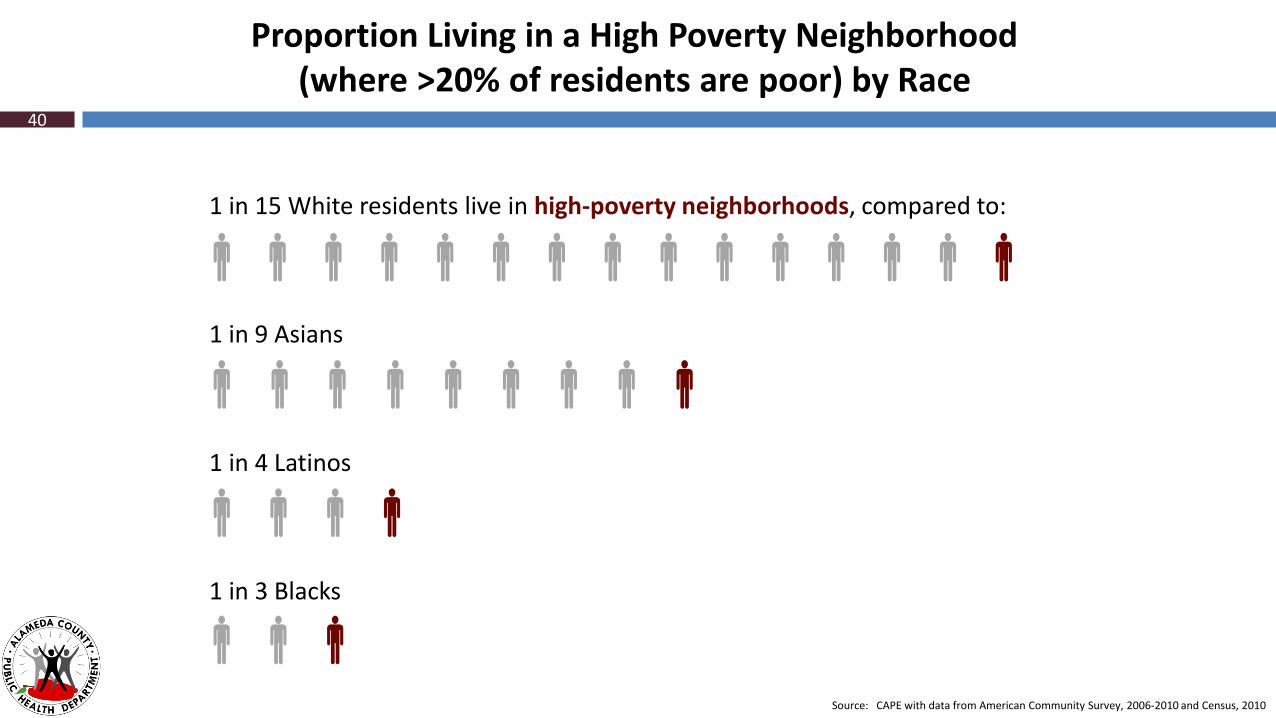
Proportion Living in a High Poverty Neighborhood (where >20% of residents are poor) by Race
Source: CAPE with data from American Community Survey, 2006-2010 and Census, 2010
1 in 15 White residents live in high-poverty neighborhoods, compared to:
1 in 9 Asians
1 in 4 Latinos
1 in 3 Blacks
40
Source: CAPE with data from Alameda County death files, 2013-2015; Alameda County birth files, 2012-2014; American Community Survey, 2011-2015; California Dept of Education, 2012-2013
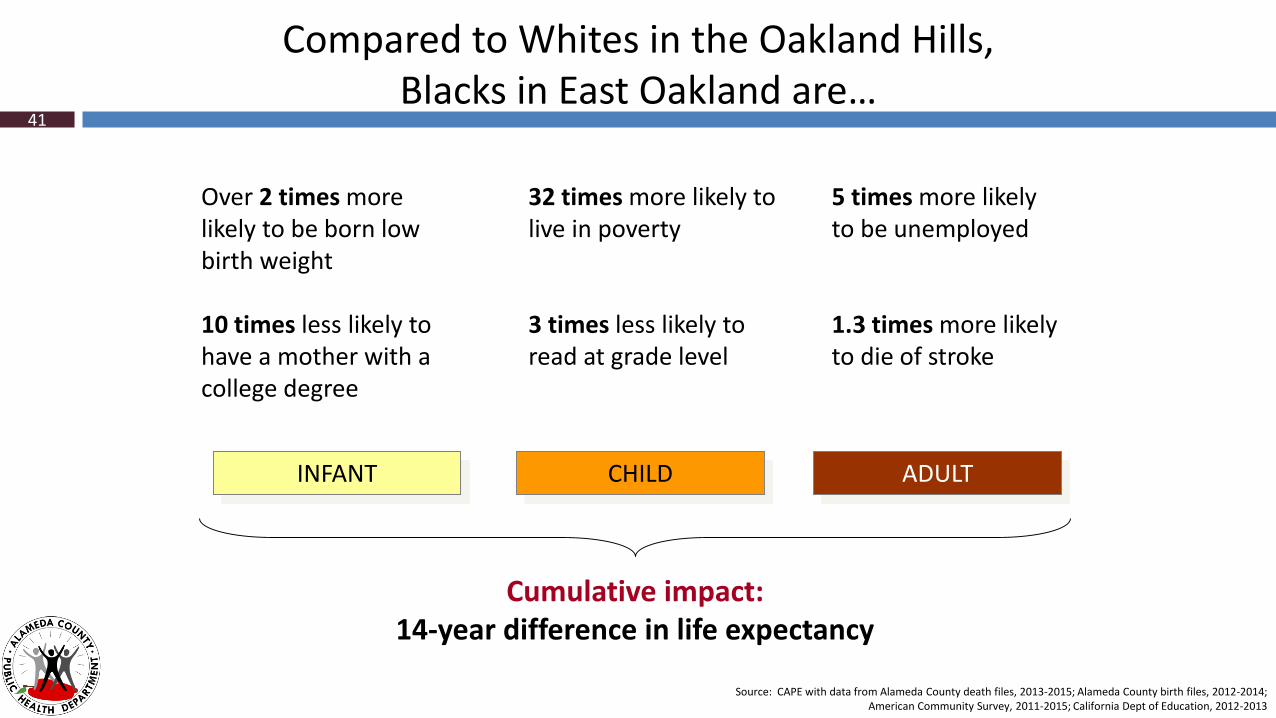
Compared to Whites in the Oakland Hills, Blacks in East Oakland are…
Over 2 times more likely to be born low birth weight
10 times less likely to have a mother with a college degree
32 times more likely to live in poverty
3 times less likely to read at grade level
5 times more likelyto be unemployed
1.3 times more likely to die of stroke
INFANT CHILD ADULT
Cumulative impact:14-year difference in life expectancy
41

Compared to people living in affluent neighborhoods of Alameda County, residents of very high poverty neighborhoods are:
2X more likely to lack
access to employment
Over 4X more likely to be
living in overcrowded
households
Facing nearly 8X higher rates of
homicide
5X more likely to be locked up
as a youth for overwhelmingly
nonviolent offenses
Burdened by a 4X higher density of
industrial chemical and fuel release
sites that pollute water and soil
42
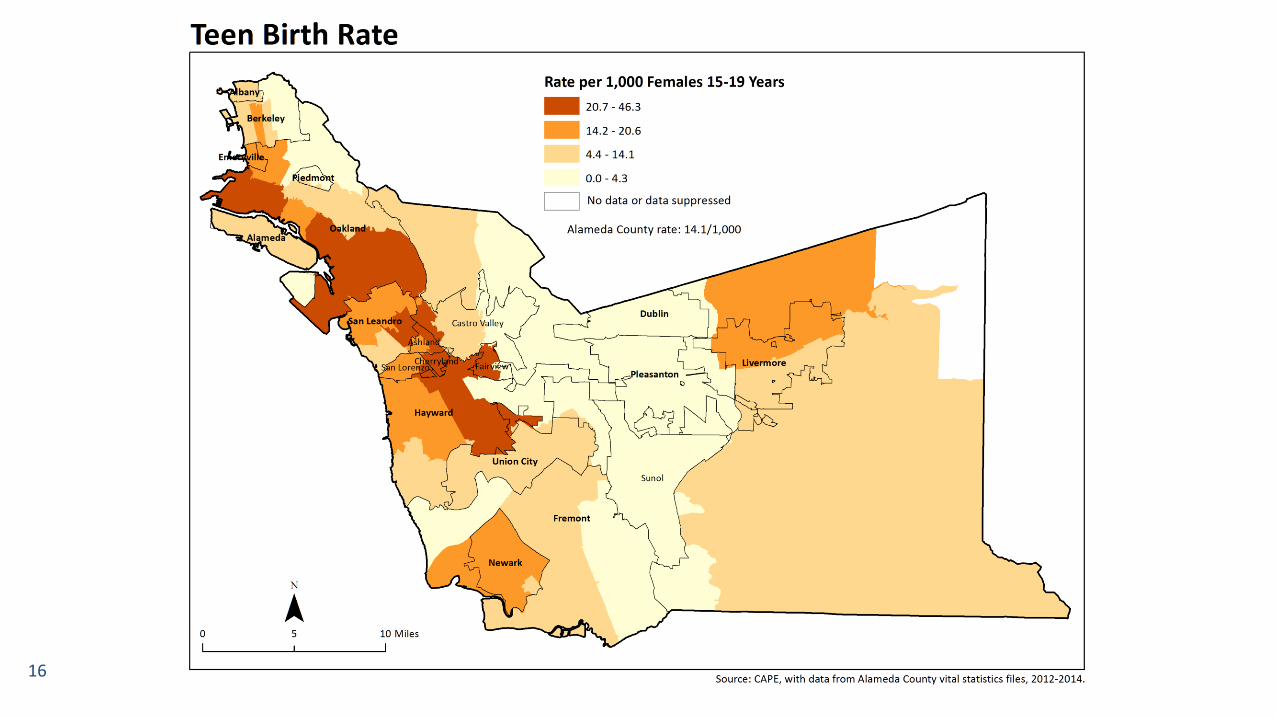
Teen Birth Rate
Infant Mortality Rate
% Low Birth Weight
MCH Indicators by Social Gradient43

Teen Birth Rate by Poverty Level and Race/Ethnicity, 2010-201444
Source: CAPE, with data from Alameda County Vital Statistics files, 2010-2014.
6.0
8.7
13.9
19.9
4.5
7.8
11.2
2.33.3
5.8
10.2
1.81.2
4.5
12.4
0
5
10
15
20
<10% 10-20% 20-30% >30%
Teen
Bir
th R
ate
(# t
een
bir
ths/
1,0
00
po
p 1
5-1
9 y
rs)
Neighborhood Poverty Level
Latino
AfricanAmerican
All Races
White
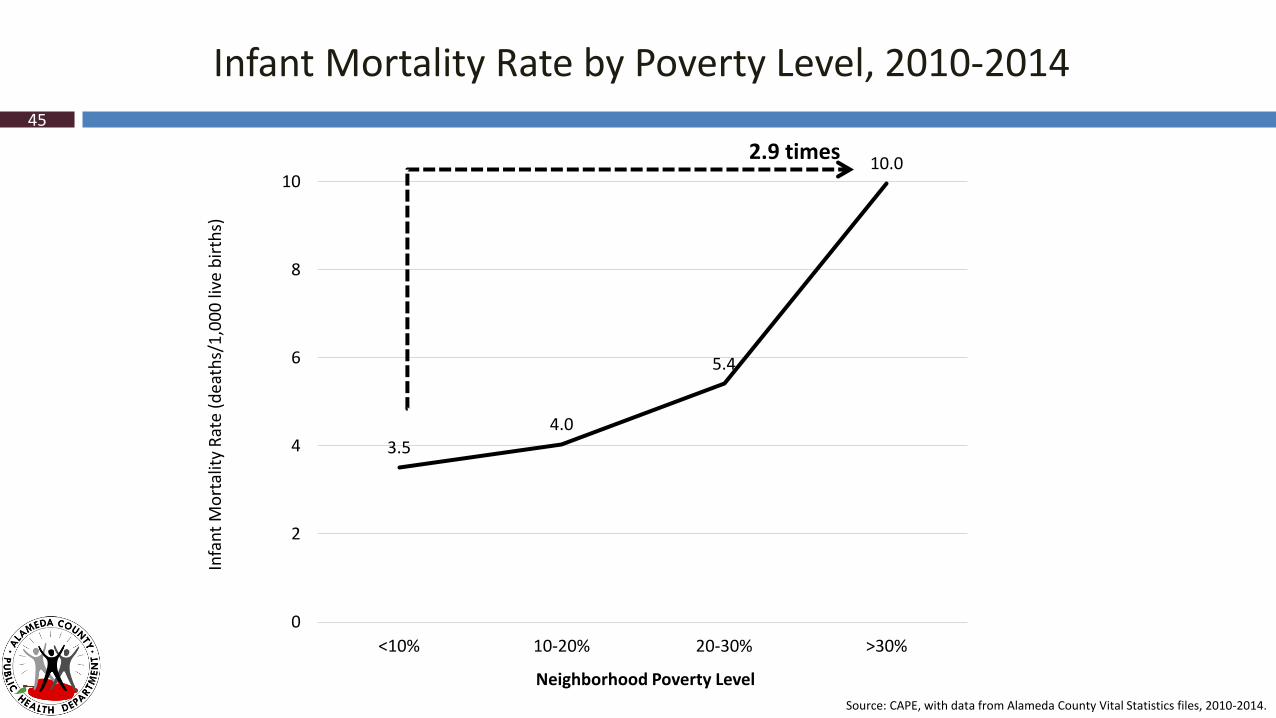
3.54.0
5.4
10.0
0
2
4
6
8
10
<10% 10-20% 20-30% >30%
Infa
nt
Mo
rtal
ity
Rat
e (d
eath
s/1
,00
0 li
ve b
irth
s)
Neighborhood Poverty Level
Infant Mortality Rate by Poverty Level, 2010-201445
Source: CAPE, with data from Alameda County Vital Statistics files, 2010-2014.
2.9 times
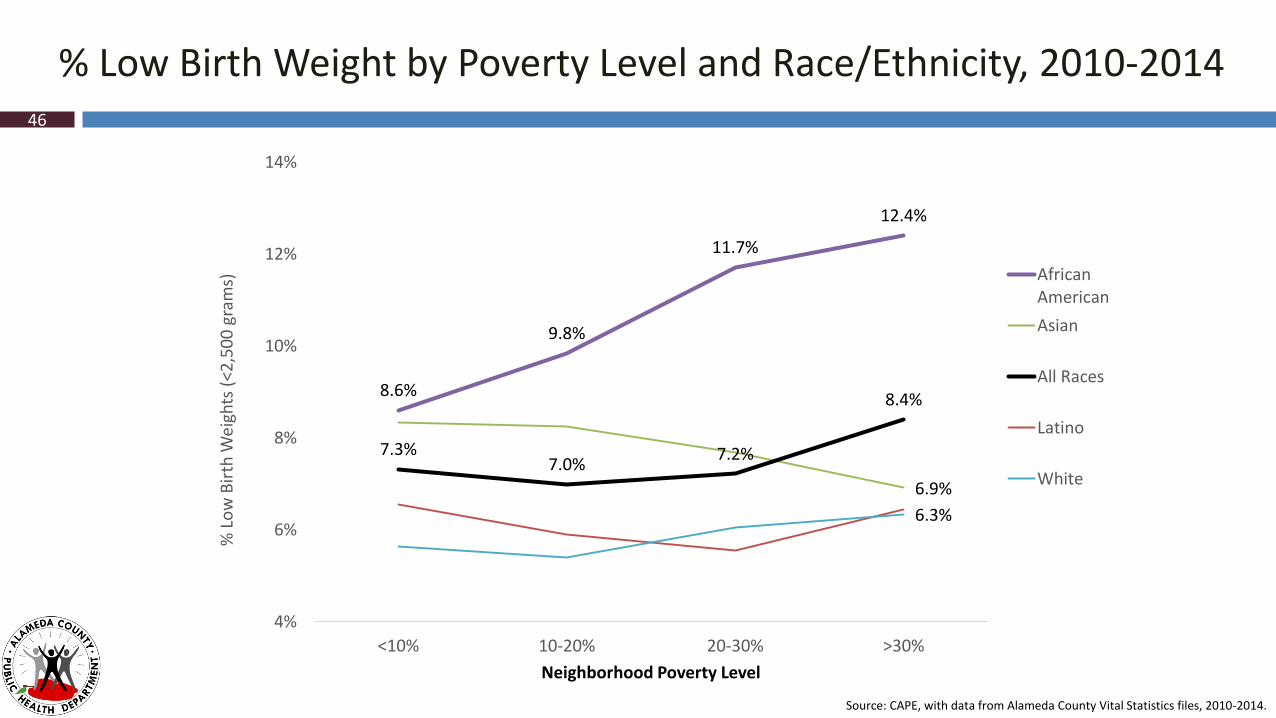
% Low Birth Weight by Poverty Level and Race/Ethnicity, 2010-201446
Source: CAPE, with data from Alameda County Vital Statistics files, 2010-2014.
8.6%
9.8%
11.7%
12.4%
6.9%
7.3%7.0%
7.2%
8.4%
6.3%
4%
6%
8%
10%
12%
14%
<10% 10-20% 20-30% >30%
% L
ow
Bir
th W
eigh
ts (
<2,5
00
gra
ms)
Neighborhood Poverty Level
AfricanAmerican
Asian
All Races
Latino
White
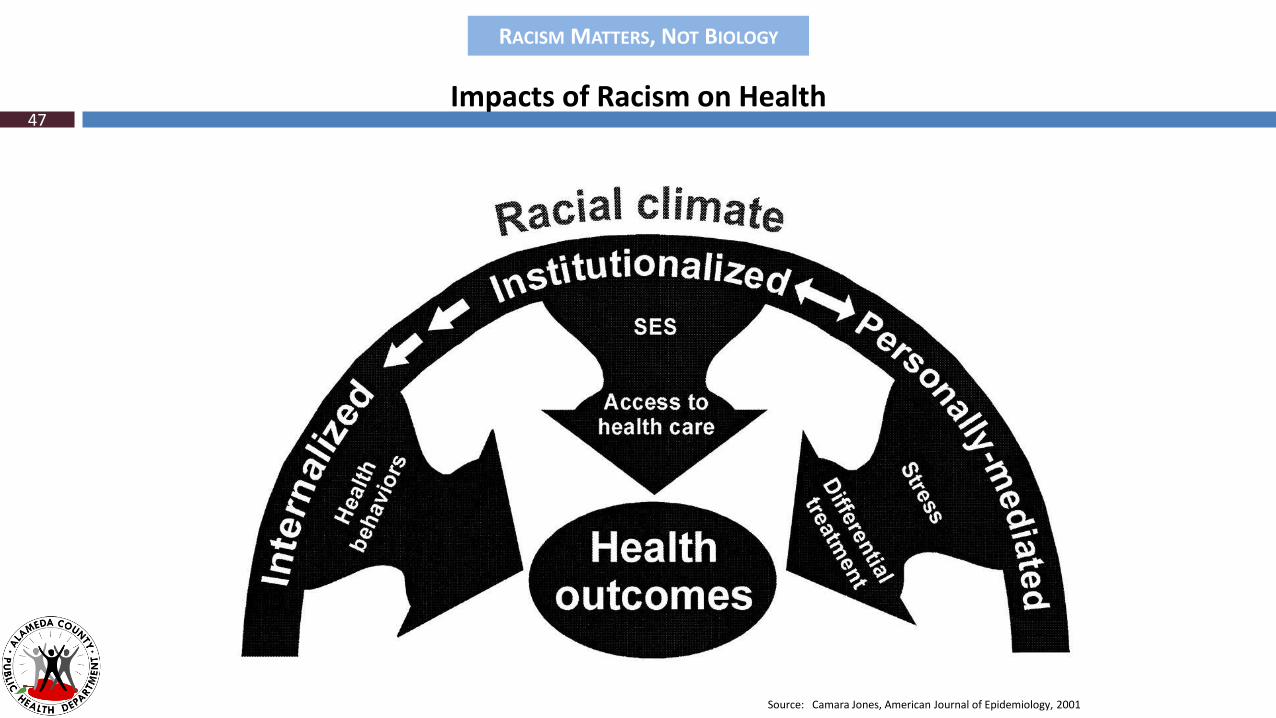
RACISM MATTERS, NOT BIOLOGY
Source: Camara Jones, American Journal of Epidemiology, 2001
Impacts of Racism on Health47
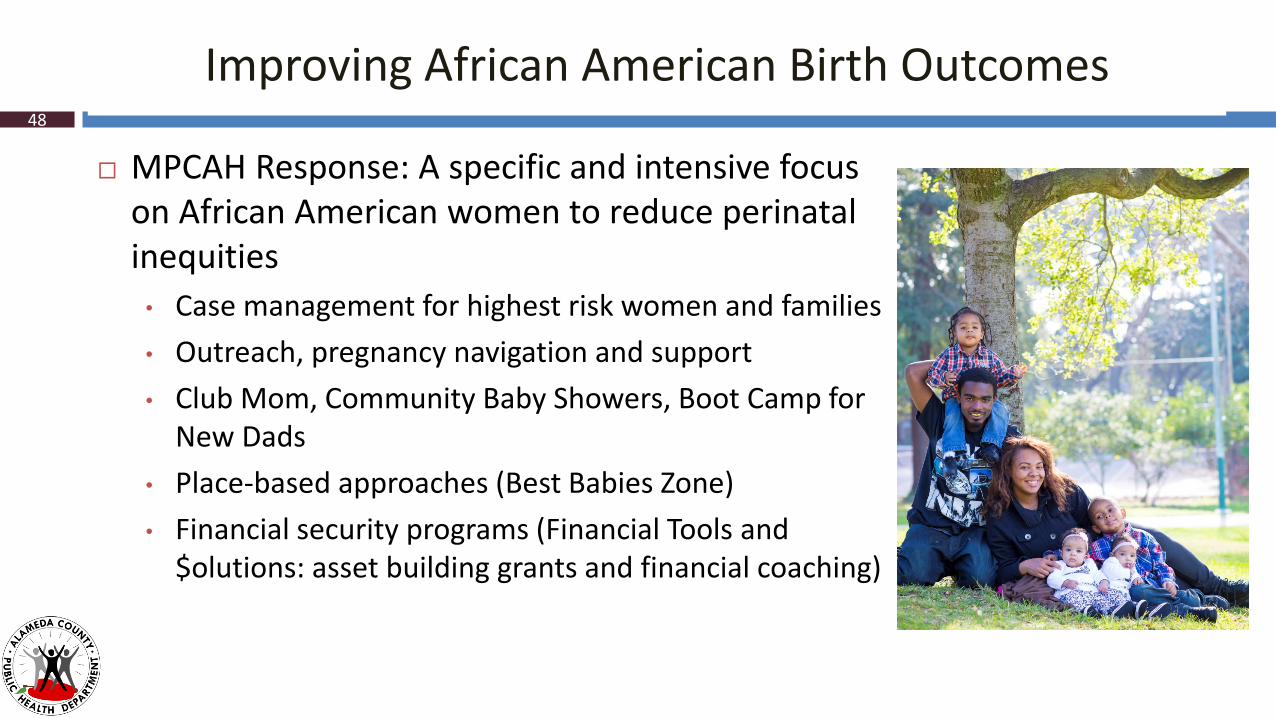
Improving African American Birth Outcomes
MPCAH Response: A specific and intensive focus on African American women to reduce perinatal inequities
• Case management for highest risk women and families
• Outreach, pregnancy navigation and support
• Club Mom, Community Baby Showers, Boot Camp for New Dads
• Place-based approaches (Best Babies Zone)
• Financial security programs (Financial Tools and $olutions: asset building grants and financial coaching)
48

Childhood Poverty
High School Dropouts
Homicides
How healthy are youth in Alameda County?49
Race/Ethnicity

29.7%
25.3%
20.1%
13.6% 13.3%
8.0% 7.4%
4.2%
0%
5%
10%
15%
20%
25%
30%
AfricanAmerican
AmericanIndian*
Latino All races Multirace Asian PacificIslander*
White NH
Perc
enta
ge C
hild
ren
>1
8 y
ears
livi
ng
in p
ove
rty
(%)
Children Living in Poverty by Race/Ethnicity, 2015
*Data for American Indians and Pacific Islanders is from 5 year census files- 2011-2015.Source: Cape with data from US Census Bureau American Community Survey, 1 year file 2015.
50
7.1 times
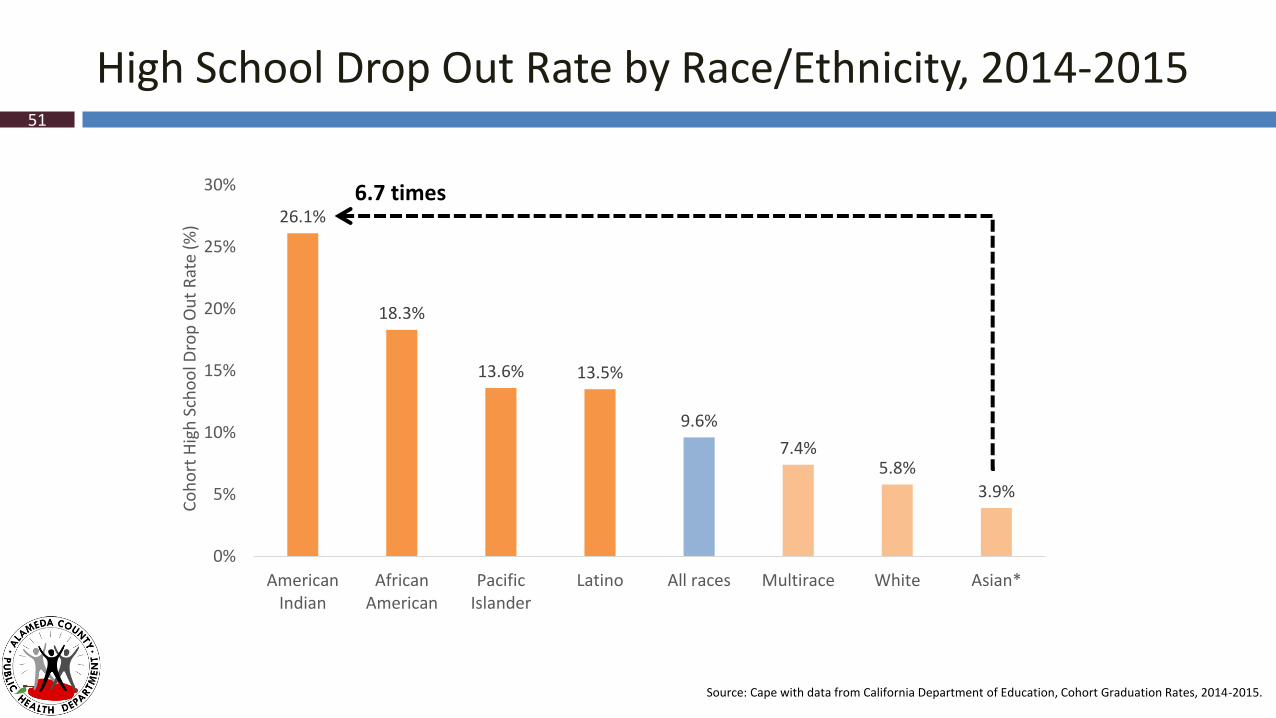
26.1%
18.3%
13.6% 13.5%
9.6%
7.4%5.8%
3.9%
0%
5%
10%
15%
20%
25%
30%
AmericanIndian
AfricanAmerican
PacificIslander
Latino All races Multirace White Asian*
Co
ho
rt H
igh
Sch
oo
l Dro
p O
ut
Rat
e (%
)
High School Drop Out Rate by Race/Ethnicity, 2014-2015
Source: Cape with data from California Department of Education, Cohort Graduation Rates, 2014-2015.
51
6.7 times
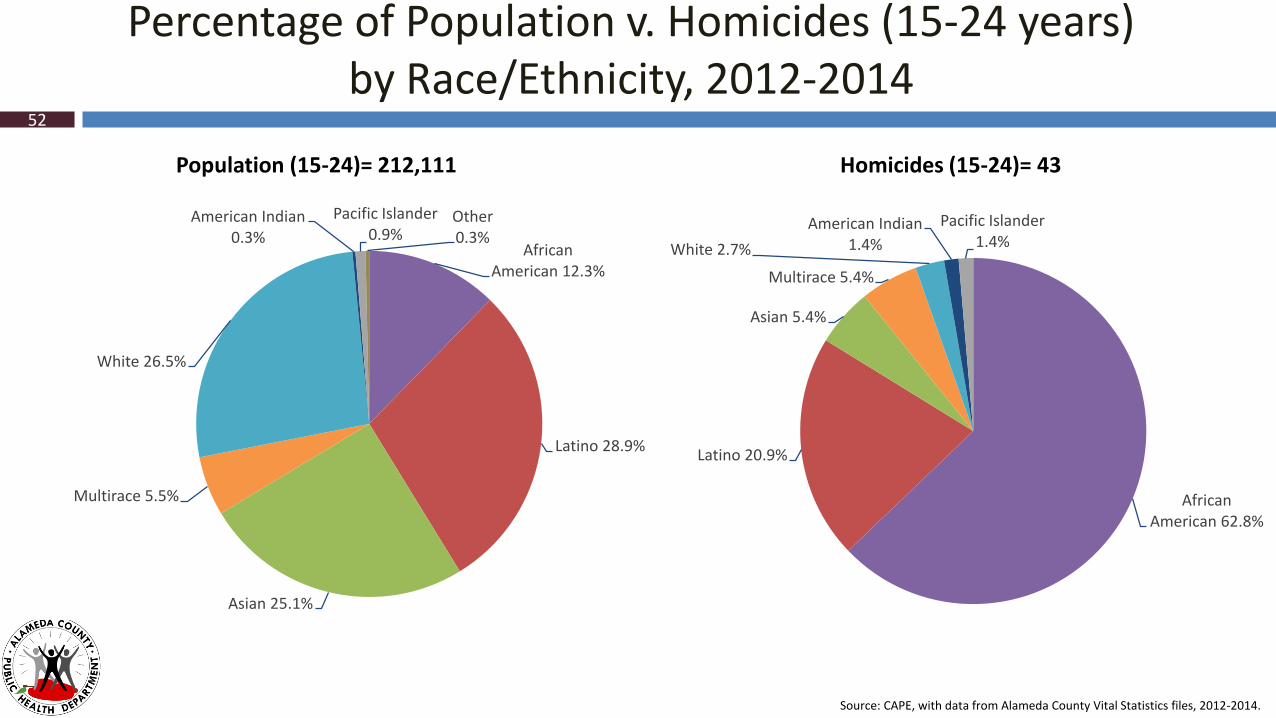
African American 62.8%
Latino 20.9%
Asian 5.4%
Multirace 5.4%
White 2.7%
American Indian 1.4%
Pacific Islander 1.4%African
American 12.3%
Latino 28.9%
Asian 25.1%
Multirace 5.5%
White 26.5%
American Indian 0.3%
Pacific Islander 0.9%
Other 0.3%
Percentage of Population v. Homicides (15-24 years)by Race/Ethnicity, 2012-2014
52
Population (15-24)= 212,111 Homicides (15-24)= 43
Source: CAPE, with data from Alameda County Vital Statistics files, 2012-2014.
Women living in Poverty
Less than High School Education
How healthy are women (15-44 years) in Alameda County?
53
Race/Ethnicity
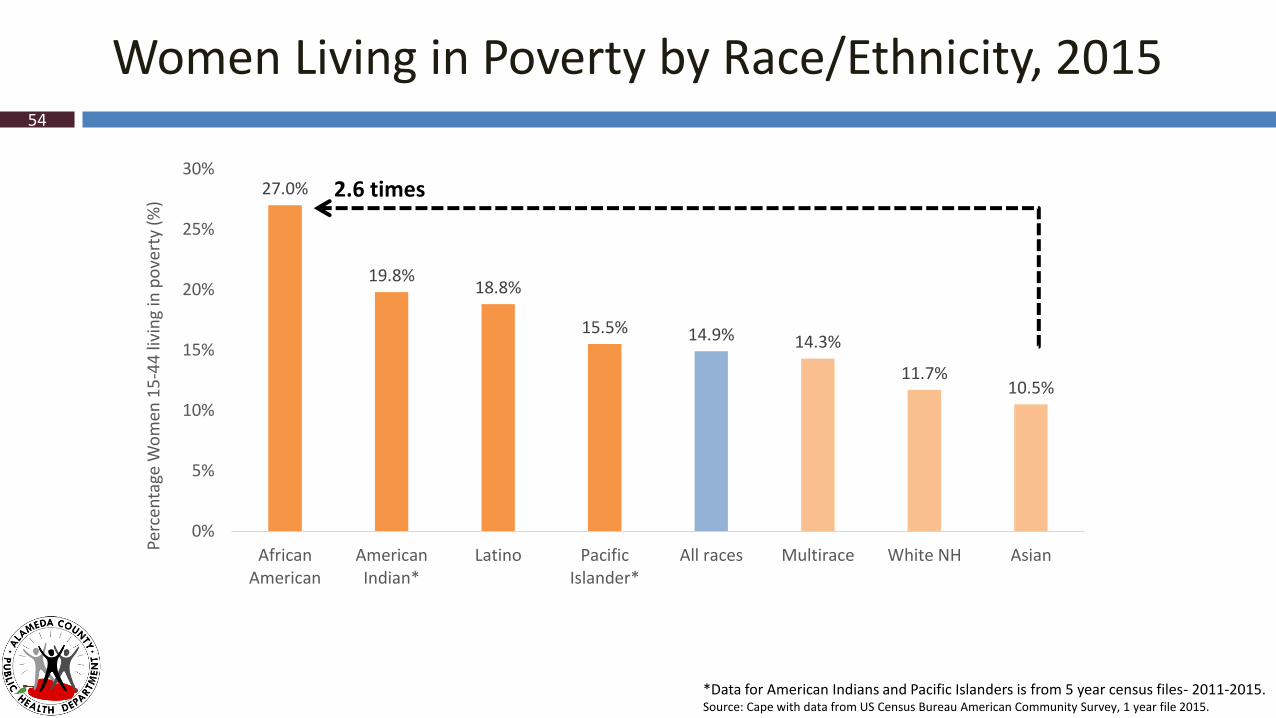
27.0%
19.8%18.8%
15.5% 14.9% 14.3%
11.7%10.5%
0%
5%
10%
15%
20%
25%
30%
AfricanAmerican
AmericanIndian*
Latino PacificIslander*
All races Multirace White NH Asian
Perc
enta
ge W
om
en 1
5-4
4 li
vin
g in
po
vert
y (%
)
Women Living in Poverty by Race/Ethnicity, 2015
*Data for American Indians and Pacific Islanders is from 5 year census files- 2011-2015.Source: Cape with data from US Census Bureau American Community Survey, 1 year file 2015.
54
2.6 times
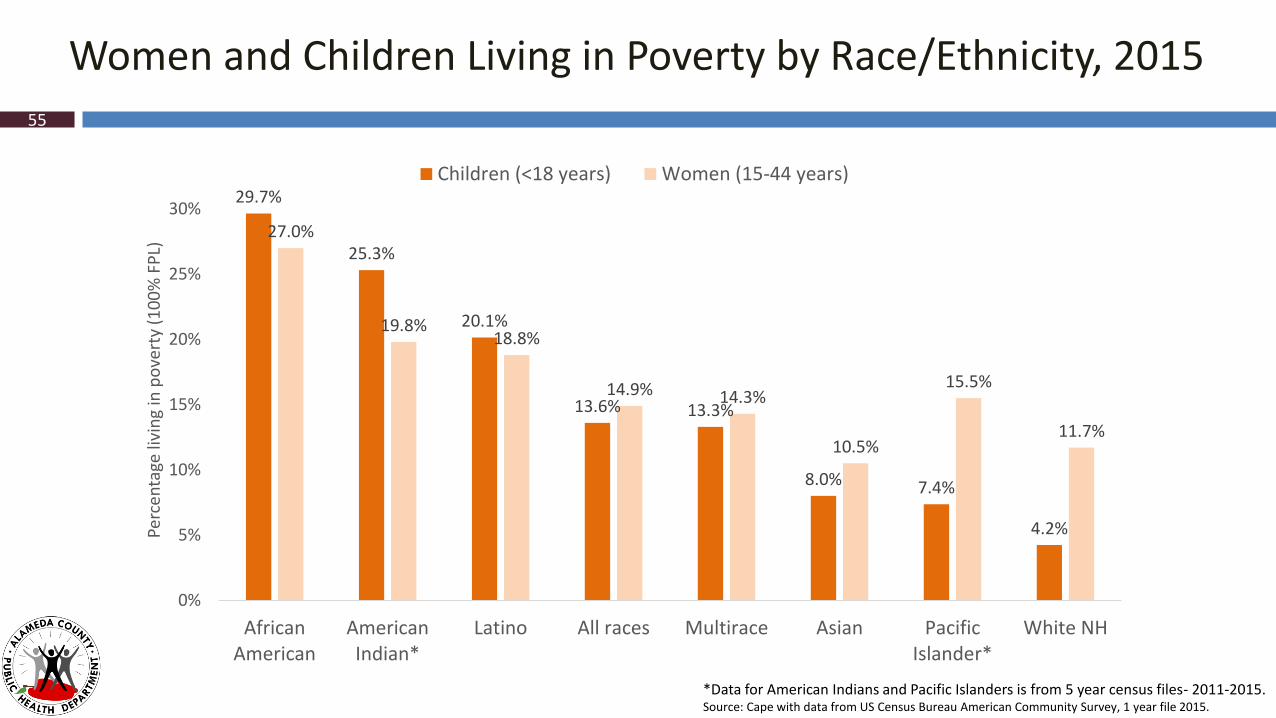
Women and Children Living in Poverty by Race/Ethnicity, 2015
*Data for American Indians and Pacific Islanders is from 5 year census files- 2011-2015.Source: Cape with data from US Census Bureau American Community Survey, 1 year file 2015.
55
29.7%
25.3%
20.1%
13.6% 13.3%
8.0% 7.4%
4.2%
27.0%
19.8%18.8%
14.9% 14.3%
10.5%
15.5%
11.7%
0%
5%
10%
15%
20%
25%
30%
AfricanAmerican
AmericanIndian*
Latino All races Multirace Asian PacificIslander*
White NH
Perc
enta
ge li
vin
g in
po
vert
y (1
00
% F
PL)
Children (<18 years) Women (15-44 years)
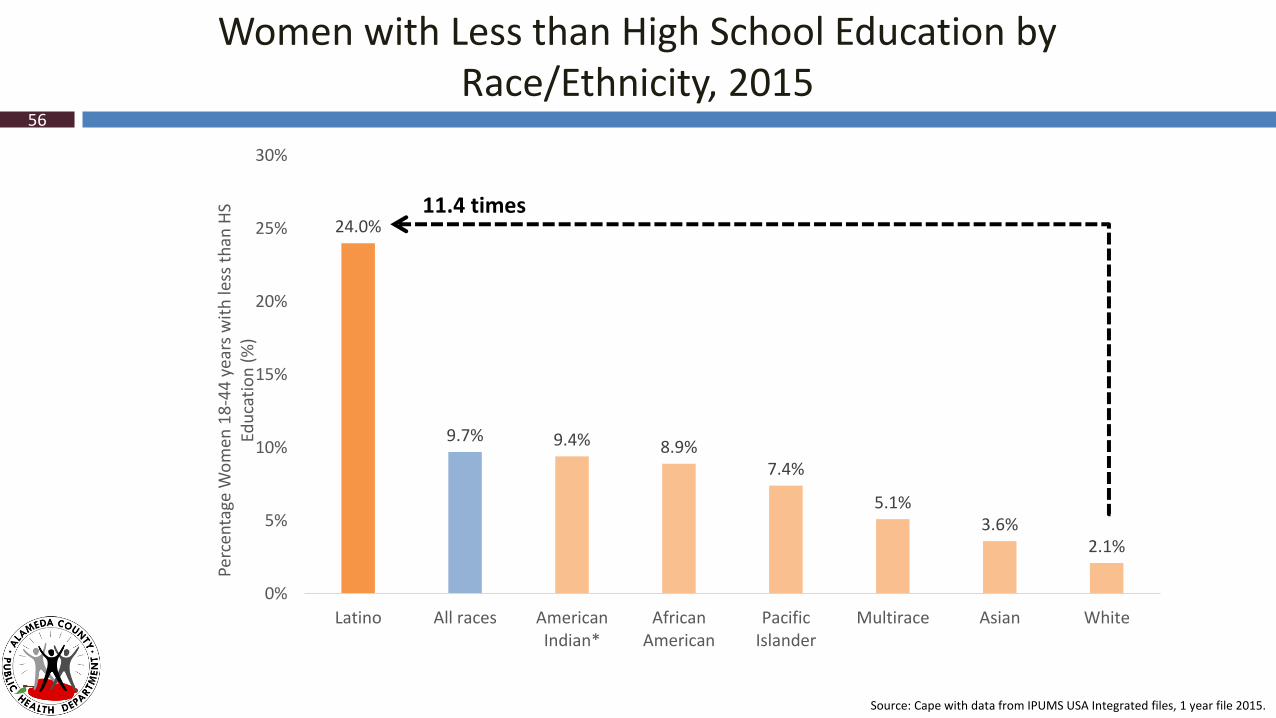
Women with Less than High School Education by Race/Ethnicity, 2015
Source: Cape with data from IPUMS USA Integrated files, 1 year file 2015.
56
24.0%
9.7% 9.4% 8.9%7.4%
5.1%3.6%
2.1%
0%
5%
10%
15%
20%
25%
30%
Latino All races AmericanIndian*
AfricanAmerican
PacificIslander
Multirace Asian White
Perc
enta
ge W
om
en 1
8-4
4 y
ears
wit
h le
ss t
han
HS
Edu
cati
on
(%
)
11.4 times
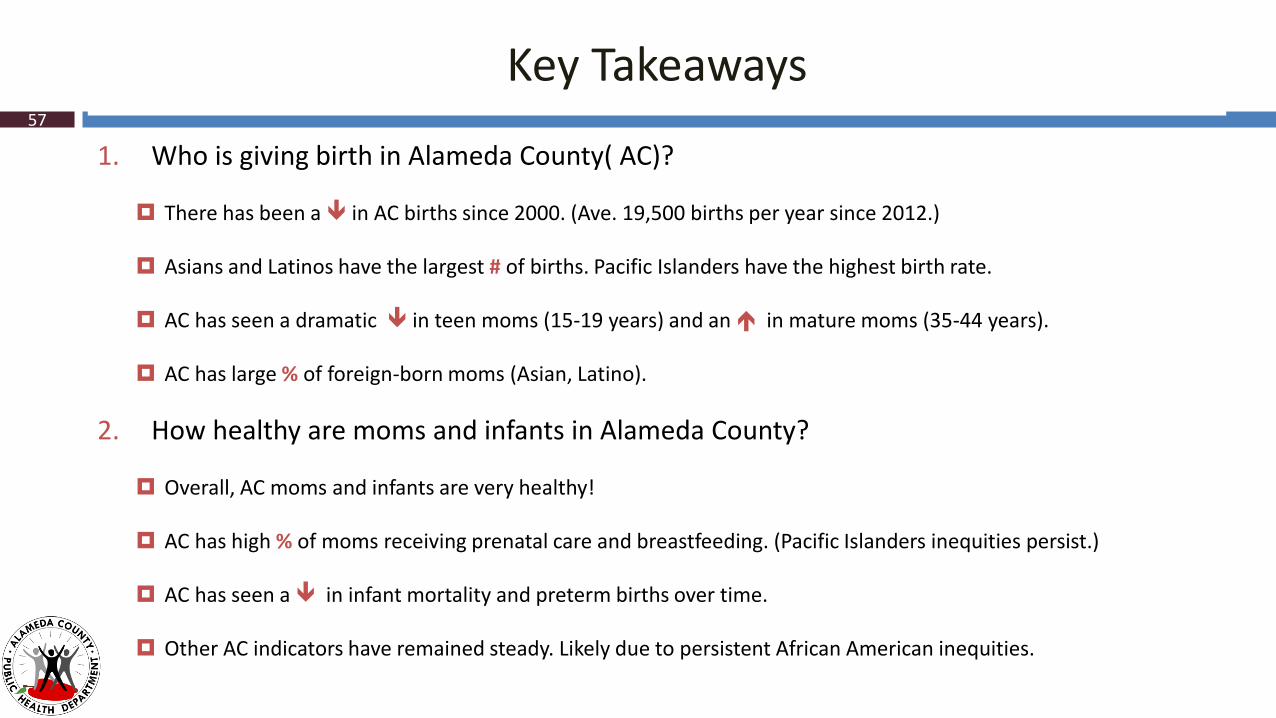
Key Takeaways
1. Who is giving birth in Alameda County( AC)?
There has been a in AC births since 2000. (Ave. 19,500 births per year since 2012.)
Asians and Latinos have the largest # of births. Pacific Islanders have the highest birth rate.
AC has seen a dramatic in teen moms (15-19 years) and an in mature moms (35-44 years).
AC has large % of foreign-born moms (Asian, Latino).
2. How healthy are moms and infants in Alameda County?
Overall, AC moms and infants are very healthy!
AC has high % of moms receiving prenatal care and breastfeeding. (Pacific Islanders inequities persist.)
AC has seen a in infant mortality and preterm births over time.
Other AC indicators have remained steady. Likely due to persistent African American inequities.
57
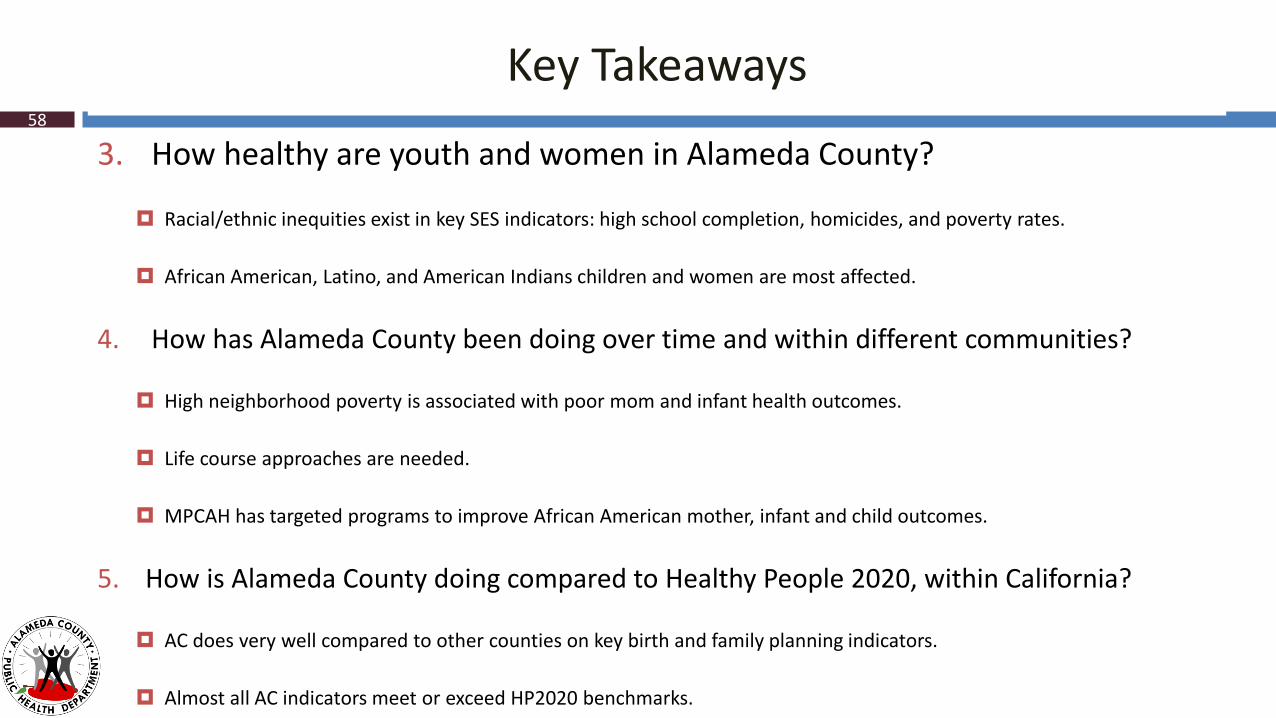
Key Takeaways
3. How healthy are youth and women in Alameda County?
Racial/ethnic inequities exist in key SES indicators: high school completion, homicides, and poverty rates.
African American, Latino, and American Indians children and women are most affected.
4. How has Alameda County been doing over time and within different communities?
High neighborhood poverty is associated with poor mom and infant health outcomes.
Life course approaches are needed.
MPCAH has targeted programs to improve African American mother, infant and child outcomes.
5. How is Alameda County doing compared to Healthy People 2020, within California?
AC does very well compared to other counties on key birth and family planning indicators.
Almost all AC indicators meet or exceed HP2020 benchmarks.
58
EVERYONE in Alameda County –no matter who you are,
where you live, how much money you make,or the color of your skin –
can lead a healthy, fulfilling and productive life.
Our Vision of Health Equity59
Data Sources
Alameda County vital statistics files: Birth, Death, and Fetal Deaths
CAPE with data from US Census 2010 and Esri
US Census Bureau, American Community Survey
Guttmacher Institute (Unintended Pregnancy)
California Department of Public Health (CDPH) In-hospital breast feeding Assessment
Healthy People 2020
CDPH 2016 County Health Profiles
California Department of Education
60

61
For Additional Alameda County Maternal, Child, and Adolescent Health Indicators:www.acphd.org/data-reports/reports-by-topic/maternal,-child,-and-adolescent-health.aspx
Lisa Goldberg, MPCAH Epidemiologist, Alameda County Public Health Department.Contact by phone at 510-267-8024 or by email: [email protected]
Kiko Malin, Director, Family Health Services Division, Alameda County Public Health Department.Contact by phone at 510-267-5979 or by email: [email protected]