Al Ribat National University Faculty of Pharmacy...
52
Al Ribat National University Faculty of Pharmacy Spectrophotometric determination of Chlorzoxazone and Paracetamol in Tablets by H-point Standards Addition Using Both Standards Addition and Absorbance Difference By Mohammed Abdeen Mohammed Salih B. Pharm (U of K)2013 A Thesis Submitted in Partial Fulfillment of The requirements for Master Degree in Drug Quality Control Supervisor Dr. Imad Osman Abu Reid 2016
Transcript of Al Ribat National University Faculty of Pharmacy...

Al Ribat National University
Faculty of Pharmacy
Spectrophotometric determination of Chlorzoxazone and Paracetamol
in Tablets by H-point Standards Addition Using Both Standards Addition
and Absorbance Difference
By
Mohammed Abdeen Mohammed Salih
B. Pharm (U of K)2013
A Thesis Submitted in Partial Fulfillment of The requirements for Master Degree
in Drug Quality Control
Supervisor
Dr. Imad Osman Abu Reid
2016

DEDICATION
This thesis is dedicated to my lovely mother and father
who taught me that difficult tasks can be accomplished one
step at a time.
I dedicate this thesis with special thanks to my lovely
family member and friends, who have always helped me,
encouraged me and believed in me.

Contents
Table of Contents i
Acknowledgements v
Abbreviations vi
Abstract in English viii
Abstract in Arabic ix
List of tables x
List of figures xi
Table of Contents
Chapter one: Introduction And Literature Review
1.1 Introduction: 1
1.2 literature review: 2
1.2.1 Paracetamol 2
1.2.1.1 UV/vis spectrophotometric methods 2
1.2.1.2 Flow-injection spectrophotometric methods: 3
1.2.1.3 Multivariate spectrophotometric methods: 3

1.2.1.4 Derivative spectrophotometric methods: 3
1.2.1.5 Infrared spectrophotometric methods 3
1.2.1.6 Spectrofluorimetric methods: 4
1.2.1.7 Chemiluminescence methods: 4
1.2.1.8 Electroanalytical methods: 4
1.2.1.9 Chromatographic methods: 5
1.2.1.10 Capillary electrophoretic methods: 5
1.2.2 Chlorzoxazone: 5
1.2.3 Analysis of CLX and PCT in combination with other drugs 6
1.2.4 Analysis of chlorzoxazone and paracetamol combination in dosage forms: 6
1.3 Analysis of multicomponent formulation: 7
1.3.1 Chromatographic separation methods: 8
1.3.1.1 Gas Chromatography: 8
1.3.1.2 High Performance Liquid Chromatography: 8
1.3.1.3 Capillary Electrophoresis: 8
1.3.2 Ultraviolet-Visible (UV-VIS) Spectrophotometry: 8
1.3.2.1 Simultaneous Equation method: 8
1.3.2.2 The Absorption Ratio Method (Isoabsorptive Point Method): 9
1.3.2.3 Derivative Spectroscopic Method: 9
1.3.2.4 Multicomponent Mode Method: 9
1.3.2.5 Area Under Curve Method: 9
1.4 H-point standard additions method(HPSAM) Theoretical Consideration: 9
1.4.1 Basic principle 9
1.4.2 HPSAM by addition of both analytes: 12
1.4.3 HPSAM using absorbance increment: 15

1.5 Objectives: 17
Chapter 2: Materials and Methods
2.1 Instrumentation 18
2.2 Materials 18
2.3 Reagents and standards 18
2.3.1 Sodium hydroxide 0.1M 18
2.3.2 Standards stock solutions 18
2.3.3 Working standard mixture 18
2.3.4 Laboratory synthetic mixtures 18
2.4 Samples preparation 18
2.4.1 Tablets 18
2.4.2 Capsules 19
2.5 Procedures: 19
2.5.1 Optimum wavelength selection 19
2.5.3 Linearity at the selected wavelengths 19
2.5.4 General procedure 19
2.5.5 Accuracy: 20
2.5.6 Precision: 20
2.5.6.1 Repeatability: 20
2.5.6.2 Intermediate precision: 20
Chapter 3: Results and discussion
3.1 Optimum wavelengths selection 21
3.2 Suitability for HPSAM application 25
3.3 Analysis of laboratory synthetic mixtures: 26
3.4 Precision 28

3.4.1 Repeatability 28
3.4.2 Intermediate precision: 30
3.5 Analysis of Capsules 32
Chapter 4: Conclusion and references
4.1 Conclusion 33
4.2 References 34

Acknowledgements
This research project would not have been done without ALLAH and the support of many
people.
I would like to thanks my supervisor Dr. Imad Osman Abu Reid for his patience, support
during this program and guidance to accomplish this research.
Special thanks to Prof. Elrasheed A.Gadkariem for being helpful, supportive and for his
valuable advices in anything concerned with M.Sc programme.
I will not forget every teacher, doctor and professor who has taught me a letter in my life,
without them I could not have reached this level.
My gratitude also goes to the staff of Azal laboratories for their help and attention.

List of Abbreviations
Abbreviation
Description
PCT
Paracetamol
CLX Chlorzoxazone
NIR
Near Infrared
HPSAM
H-Point Standard Additions Method
CLS
Classical Least- Squares
ILS
Inverse Least-Squares
PLS Partial Least-Squares
PCR
Principal Components Regression

MCR Mean Centering Of Ratio
PCCA Pure Component Contribution Algorithm
CL Chemiluminescence
FI
Flow Injection
HPLC High Performance Liquid Chromatography
RP-HPLC Reversed-Phase High Performance Liquid
Chromatographic.
TLC Thin-Layer Chromatography
GLC Gas Liquid Chromatography
LC Liquid Chromatography
CE
Capillary Electrophoretic

MEKC
Micellar Electro Kinetic Chromatography
FDNB
1-Fluoro-2,4-Dinitrobenzene
MOSA
Method Of Standard Addition
ZCP
Zero Crossing Points
TYB Total Youden Blank
DCQC 2,6-Dichloroquinone Chlorimide
MBTH 3-Methyl-2-Benzothiazolinone Hydrazone

Abstract
Simple, specific, accurate and precise spectrophotometric method was developed for the
simultaneous determination of Paracetamol (PCT) and Chlorzoxazone (CLX) in their tablet
dosage forms. The proposed H-Point Standard Addition Method (HPSAM) using both
Standards addition and absorbance difference; involves addition of the both analyte to the
binary mixture solution. The absorbance of each solution was measured at the selected
wavelength pair (244 and 270.6nm) for CLX, (255 and 277.4nm) for PCT. Concentrations
of PCT and CLX in the samples were obtained from intersection of straight line (obtained
by plotting ΔA value against the added concentration) with the negative side of the
abscissa. The calibration curves were linear over the concentration range of 2-12and 4-14
µg/mL for PCT and CLX, respectively. This method was tested by analyzing synthetic
mixtures of the above drugs and was applied to commercial pharmaceutical preparation of
the subjected drugs, the assay values were 103.00 % and 102.29% for CLX and PCT with
relative standard deviation 1.68% and 2.29 % respectively. There were no significant
difference (at P = 0.05 , n = 6 ) between the analysis results obtained on two different days
, the calculated t-value was less than the t- tabulated. This confirms the precision of the
proposed method. Moreover, the proposed method was also applied for the determination
of CLX and PCT in capsules formulation, the results obtained were in good agreement with
the labeled amounts 100.08% and 100.08% with relative standard deviations of 1.60% and
1.37% for CLX and PCT respectively.
المستخلص
تم تطوير طريقة قياس طيفيه بسيطة ,متخصصه , ذات مصداقية ودقيقة للتحليل المتزامن للباراسيتامول
المقترحة ـ كال من طريقة H اٳلضافة القياسية للنقطةتشمل طريقة والكلورزوكسازون الموجودان في شكل أقراص.
ٳضافة المحاليل القياسية وطريقة فرق االمتصاصيةـ وتشمل ايضا اضافة المادتين المراد تحليلهما الى الخليط الثنائي
244الذي يحتوي على المادتين. تم قياس امتصاص كل محلول تم تحضيره في االطوال الموجية التي تم اختيارها )
نانومتر( للبراسيتامول. 277.4و 255نانومتر( للكلورزوكسازون,) 270.6و
تم حساب تركيز الباراسيتامول والكلورزوكسازون من تقاطع الخط المستقيم ) المتحصل عليه من خالل مد قيمة فارق
عايرة خطيين على مدى االمتصاصية ضد التركيز المضاف( مع الجانب السالب من المحور السيني. وقد كان منحنيا الم
مايكروجرام/مل للباراسيتامول والكلورزوكسازون على التوالي. تم اختبار هذه الطريقة من 14-4و 12 - 2تركيز
خالل تحليل مخاليط اصطناعية من العقارين المذكورين أعاله وتم تطبيقها على مستحضر صيدالني تجاري يحتوي
% للكلورزوكسازون والباراسيتامول 102.29% و 103.00يمة النقاوة هي على الدوائين المعروضين. وكانت ق
( n= 6 و p = 0. 95 % على الترتيب. لم يكن هناك فارق معنوي ) عند2.29و %1.68بانحراف معياري نسبي
كد دقة هذه وهذا ما يؤ .المحسوبة كانت أقل من المجدولة t بين التائج المتحصل عليها خالل يومين مختلفين, حيث قيمة
عالوة على ذلك فقد تم أيضا تطبيق الطريقة المقترحة في حساب الباراسيتامول والكلورزوكسازون .الطريقة المقترحة
ل عليها في توافق جيد مع القيمة المنصوص عليها بنسبة 100.08الموجودان في شكل كابسوالت. كانت النتائج المتحص
.% للكلورزوكسازون والباراسيتامول على التوالي1.37% و 1.06ن نسبيين % بانحرافين معياريي100.04% و
List of Tables

Table 1. Linearity data at 244 nm and 270.6 nm for Paracetamol: 22
Table 2. Linearity data at 255 nm and 277.4 nm for Chlorzoxazone: 23
Table 3. Linearity results of PCT and CLX at the selected
wavelength
24
Table 4. Linearity data at 255 nm and 277.4 nm for Paracetamol 24
Table 5. Linearity data at 244 nm and 270.6 nm for paracetamol: 25
Table 6. Linearity results of PCT and CLX at the selected
wavelength
25
Table 7. Equations of crossed line for each synthetic mixture 26
Table 8. Analysis result of the synthetic mixtures using ΔA values 27
Table 9. Summary of synthetic mixture analysis results 27
Table 10. Paracetamol -added concentration in µg/ml and ∆A of each
test
28
Table 11. Chlorzoxazone; Added concentration in µg/ml and ∆A of
each test
29
Table 12. Results of the repeatability analysis using ΔA method 30
Table 13. Results of the intermediate precision analysis using ΔA
method
31
Table 14. Statistical analysis of the precision data 31
Table 15. Results of capsules analysis using ΔA method 32
Table 16. Summary of capsules analysis of results 32

List of Figures
Figure 1. Chemical structure of Paracetamol 1
Figure2. Chemical structure of Chlorzoxazone 2
Figure3. Spectrum of analytes X and Y and sample S, and location
of one pair of wavelengths λ1, and λ2, and one pair of
wavelengths λ3 and λ4
11
Figure 4. Plot of the H-point standard additions method. C added is
the added analyte concentration
12
Figure 5. HPSAM lines obtained when the double standard addition
is employed
13
Figure 6. The plot of HPSAM 15
Figure 7. The plot of the HPSAM with ∆A values. 16
Figure 8. Individual spectra of Chlorzoxazone 10 µg/ml and
Paracetamol 10 µg/ml.
21
Figure 9. Calibration curve of Paracetamol at λ 244 nm and
270.6 nm
22
Figure 10. Calibration curve of Chlorzoxazone at λ 255 nm and
277.4 nm
23

Figure 11. Calibration curve of Paracetamol at λ 255 nm and 277.4
nm
24
Figure 12. Calibration curve of Chlorzoxazone at λ 244 nm and
270.6nm
25
Figure 13. Linear regression plot of added concentration
(µg/ml)against ∆A for Paracetamol
29
Figure 14. Linear regression plot of added concentration (µg/ml)
against ∆A for Chlorzoxazone
29

1.1 Introduction:
Different dosage forms containing drug combination are available in the market. Due to
their greater patient acceptability, increased potency, multiple action, fewer side effects
and quicker relief, they have acquired a lot of importance nowadays (1).
Spectrophotometric techniques are mainly used for multicomponent analysis thus
minimizing the cumbersome task of separating interferents and allowing the determination
of an increasing number of analytes, consequently reducing analysis time and cost(2).
Multicomponent UV spectrophotometric methods are based on recording and
mathematically processing absorption spectra. They offer the following advantages (3):
avoiding prior separation techniques e.g. extraction, concentration of constituents, and
cleanup steps that might be required; spectral data are readily acquired with ease; the
process is fast, accurate, and simple; wide applicability to both organic and inorganic
systems; typical detection limits of 10-4 to 10-5 M and moderate to high selectivity. The
spectrophotometric quantitative analysis of mixtures often involves resolution of two
components with partially overlapped spectra. The greater the extent of overlapping the
more difficult the resolution is rendered.
Paracetamol (PCT) is an acylated aromatic amide, which was firstly introduced into
medicine as an antipyretic/analgesic by Von Mering in 1893 and has been in use as an
analgesic for home medication for over 30 years and is accepted as a very effective
treatment for the relief of pain and fever in adults and children. It is the most used medicine
after acetylsalicylic acid in many countries as an alternative to aspirin and phenacetin.
Paracetamol is also known as acetaminophen (N-acetyl-p-aminophenol, 4-
acetamidophenol) Fig(1); it is a major ingredient in numerous cold and flu medications and
many prescription analgesics(4).
Figure 1: Chemical structure of Paracetamol
Chlorzoxazone (CLX),Fig(2) belongs to the class of organic compounds known as
benzoxazolones. These are organic compounds containing a benzene fused to an oxazole
ring (a five-member aliphatic ring with three carbon atoms, one oxygen atom, and one

nitrogen atom) bearing a ketone group, its IUPAC name is 5-chloro-2,3-dihydro-1,3-
benzoxazol-2-one(5)
Figure 2: Chemical structure of Chlorzoxazone
Chlorzoxazone and paracetamol combination is indicated as an adjunct to other measures,
such as rest and physical therapy, for relief of pain and muscle spasm associated with acute,
painful musculoskeletal conditions(6)
1.2 literature review:
1.2.1 Paracetamol
The extensive review on the analytical methods used for the analysis of paracetamolalone
and in combination with other drugs and in biological fluid(4);revealed that variety of
techniques and methods were used, these include:
1.2.1.1 UV/vis spectrophotometric methods:
The spontaneous oxidation of alkaline mixtures of p-aminophenol and phenol with
molecular oxygen to form indophenol has been made the basis of a colorimetric procedure
for the determination of paracetamol via its hydrolysis product, p-aminophenol(7).
When there are no significant spectral interferences, the determination of paracetamol in
pharmaceutical products can be carried out by direct UV absorption spectrophotometry,
such as in the PCT tablets monograph in the British Pharmacopoeia (8). However, when
formulated with other UV absorbing substances such as excipients or active substances,
where spectral overlapping is possible, separation techniques such as high performance
liquid chromatography (HPLC) are usually necessary, as prescribed, for instance, in several
of the acetaminophen articles in the USP (9).
Direct UV/Vis spectrophotometry is by far the instrumental technique of choice in
industrial laboratories, owing mainly to its simplicity, often demanding low cost
equipment. The majority published spectrophotometric methods for the determination of
paracetamol are based on indophenol dye, and Schiff’s base formation, nitrosation and
subsequent chelation, oxidation, oxidative coupling with some special reagent, UV
absorption, pH-induced spectral changes(4).

1.2.1.2 Flow-injection spectrophotometric methods:
Various flow injection analysis along with suitable detection technique have also been
reported for the determination of paracetamol. A simple flow-through UV optisensing
device was developed for the determination of paracetamol based on its transient retention
and concentration on a suitable active solid support (Sephadex QAE A-25 anion-exchange
resin) packed in the flow cell and the continuous monitoring of its native absorbance on
the solid phase at 264 nm(10-12).
1.2.1.3 Multivariate spectrophotometric methods:
In recent years, multivariate calibration techniques have been widely applied to UV/Vis
spectral data, classical least-squares (CLS), inverse least-squares (ILS) and methods such
as principal components regression (PCR) and partial least-squares (PLS) are increasingly
being used in conjunction with flow injection techniques(4).
A fast analytical procedure was proposed for the simultaneous determination of
paracetamol in a mixture with caffeine and acetylsalicylic acid by means the PLS, the
method involves the use of eight standard mixtures of the three compounds assayed(13).
Also, paracetamol, chlorpheniramine and pseudoephedrine were determined by CLS and
PLS(14).
ILS method in matrix form which is K-matrix representation of Beer’s law was presented
for simultaneous determination of ibuprofen and paracetamol without prior separation from
each other(15).
1.2.1.4 Derivative spectrophotometric methods:
Derivative method is used mainly for simultaneous determination of two or more
compounds in the same mixtures without preliminary separation; there is a lot of published
paper about the use of derivative methods to the determination of paracetamol in mixtures
with other compounds.
First derivative spectrophotometry and absorbance ratio method in the zero-order spectra
were used for determination of tablets containing paracetamol and analgine; The relative
standard deviation of the derivative method was found to be 0.35% for analgine and 0.31%
for PCT and 0.49% and 1.26% for analgine and PCT respectively for the absorbance ratio
method(16).
1.2.1.5 Infrared spectrophotometric methods:
A near infrared (NIR) spectroscopic method for the simultaneous determination of five
active principles present in a drug for alleviating influenza symptoms (paracetamol,
ascorbic acid, dextromethorphan hydrobromide, caffeine and chlorpheniramine maleate)
was developed(17).
A procedure for the direct FTIR spectrometric determination of PCT is described [159].
The method was based on the solubilization of paracetamol in a 10% (v/v) ethanol in
dichloromethane solution and direct absorbance measurement at 1515 cm−1, using the
baseline established at 1900 cm−1 for measurement correction. The procedure can be
carried out in both the stopped-flow and flow injection modes.(18)
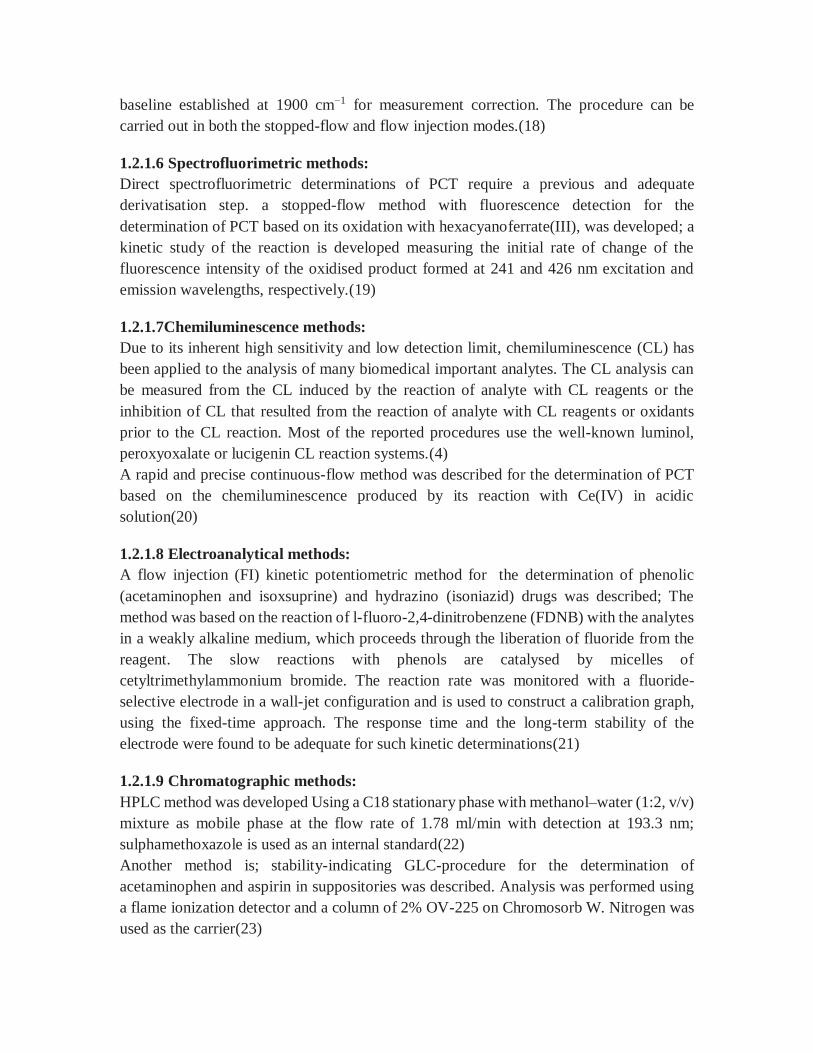
1.2.1.6 Spectrofluorimetric methods:
Direct spectrofluorimetric determinations of PCT require a previous and adequate
derivatisation step. a stopped-flow method with fluorescence detection for the
determination of PCT based on its oxidation with hexacyanoferrate(III), was developed; a
kinetic study of the reaction is developed measuring the initial rate of change of the
fluorescence intensity of the oxidised product formed at 241 and 426 nm excitation and
emission wavelengths, respectively.(19)
1.2.1.7Chemiluminescence methods:
Due to its inherent high sensitivity and low detection limit, chemiluminescence (CL) has
been applied to the analysis of many biomedical important analytes. The CL analysis can
be measured from the CL induced by the reaction of analyte with CL reagents or the
inhibition of CL that resulted from the reaction of analyte with CL reagents or oxidants
prior to the CL reaction. Most of the reported procedures use the well-known luminol,
peroxyoxalate or lucigenin CL reaction systems.(4)
A rapid and precise continuous-flow method was described for the determination of PCT
based on the chemiluminescence produced by its reaction with Ce(IV) in acidic
solution(20)
1.2.1.8 Electroanalytical methods:
A flow injection (FI) kinetic potentiometric method for the determination of phenolic
(acetaminophen and isoxsuprine) and hydrazino (isoniazid) drugs was described; The
method was based on the reaction of l-fluoro-2,4-dinitrobenzene (FDNB) with the analytes
in a weakly alkaline medium, which proceeds through the liberation of fluoride from the
reagent. The slow reactions with phenols are catalysed by micelles of
cetyltrimethylammonium bromide. The reaction rate was monitored with a fluoride-
selective electrode in a wall-jet configuration and is used to construct a calibration graph,
using the fixed-time approach. The response time and the long-term stability of the
electrode were found to be adequate for such kinetic determinations(21)
1.2.1.9 Chromatographic methods:
HPLC method was developed Using a C18 stationary phase with methanol–water (1:2, v/v)
mixture as mobile phase at the flow rate of 1.78 ml/min with detection at 193.3 nm;
sulphamethoxazole is used as an internal standard(22)
Another method is; stability-indicating GLC-procedure for the determination of
acetaminophen and aspirin in suppositories was described. Analysis was performed using
a flame ionization detector and a column of 2% OV-225 on Chromosorb W. Nitrogen was
used as the carrier(23)

A thin-layer chromatography–UV scanning densitometric technique is used for the
simultaneous determination of paracetamol and chlorzoxazone(24)
1.2.1.10 Capillary electrophoretic methods:
Capillary electrophoretic (CE) offers possible advantages over LC in terms of separation
time, solvent pollution and analysis expense. It has been reported as a powerful tool for a
wide range of analysis, including many applications to the determination of drugs, such as
the main component determinations, drug-related impurities estimations, chiral
separations, etc.(4). A micellar electro kinetic chromatography (MEKC) method was
established for determination of paracetamol and chlorpheniramine maleate in cold tablets.
Separation of both drugs, as well as other seven cold remedy ingredients, was achieved in
25.5 min, the effective capillary length, the separating voltage and the temperature was
optimized, detection was by a diode array detector at 214 nm.(25)
1.2.2 Chlorzoxazone:
The USP monograph for CLX tablet described HPLC method, using water, acetonitrile and
glacial acetic acid in ratio (70:30:1) as mobile phase ,phenacetin in acetonitrile as internal
standard, detector at 280 nm and 4mm x 30cm column containing packing L1. The flow
rate is about 1.5 ml/min(26)
Several methods are available for the determination of CLX alone and in combination with
many other drugs specially non-steroidal anti-inflammatory drugs, these include:
Electrochemical method based on cyclic and square wave voltammetric techniques has
been used for the determination of CLX(27)
Three different methods were described for colorimetric determination of chlorzoxazone
in pure form and in formulations using based on the oxidative coupling reaction of the
hydrolysis product of chlorzoxazone with 3-methyl-2-benzothiazolinone hydrazone
(MBTH) in the presence of Fe (III), N, N-dimethyl-p-phenylenediamine (DMPD) in the
presence of periodate (IO4) and 2,6-dichloroquinone chlorimide (DCQC) (28)
1.2.3 Analysis of CLX and PCT in combination with other drugs
Reversed-phase HPLC has been used for the simultaneous estimation of acetaminophen,
ibuprofen and chlorzoxazone in formulations. The method was carried out on a Kromasil®
C8 column using a mixture of 0.2% triethylamine:acetonitrile (adjusted to pH 3.2 using
dilute orthophosphoric acid), the detection was carried out at 215 nm using ketoprofen as
internal standard(29)
Chlorzoxazone, paracetamol and diclofenac sodium combination determination was
carried out using isocratic reverse phase high performance liquid chromatographic. The
chromatographic separation was performed on an inertsil C18 column (250 mm × 4.6 mm
i.d 5 µm particle size) using a mobile phase consisted of a mixture of phosphate buffer
(0.02 M KH2PO4, pH adjusted to 3.7 using orthophosphoric acid), acetonitrile and

methanol in the ratio of (25: 25: 50) at a flow rate of 1.0 mL/min. The wavelength was set
at 220 nm(30).
Chlorzoxazone, paracetamol and aceclofenac combination was determined using a
reversed-phase liquid chromatographic method, this method used a Zorbax SB C18, 250 ×
4.6 mm, 5 μm analytical column and a mobile phase made of acetonitrile and buffer (40:60,
v/v), buffer containing 50mM ortho-phosphoric acid; pH of the buffer is adjusted to 6 with
10% w/v sodium hydroxide solution. The instrumental settings are at a flow rate of 1
mL/min; the column temperature is 25°C, and detector wavelength is 270 nm.(31)
Three spectrophotometric methods were described for the same combination, the three
methods were; novel pure component contribution algorithm (PCCA) along with mean
centering of ratio spectra (MCR) and the factor based partial least squares (PLS)
algorithms.(32).
1.2.4 Analysis of chlorzoxazone and paracetamol combination in dosage forms:
Different methods have been described for the simultaneous determination of paracetamol
and chlorzoxazone in mixtures.
Two spectrophotometric methods have been developed for the simultaneous determination
of chlorzoxazone and acetaminophen in their combined dosage forms, the first, an
absorbance ratio technique using the Isoabsorptive point as one of the wavelengths,
together with “Q curve” analysis. The second was a difference spectrophotometric method
based on measurement of absorbance of an alkaline solution relative to that of an acidic
solution of identical concentration of the sample at two different wavelengths(33).
Derivative spectrophotometry was also used for the simultaneous determination of
paracetamol-chlorzoxazone, binary mixture, second derivative spectrophotometry permits
simple, rapid, and direct determination of these binary mixtures without previous
separations(34)
Orthogonal functions-ratio spectrophotometry has been developed and applied to the
determination of paracetamol and chlorzoxazone in authentic mixtures and capsules(35)
Thin layer chromatography densitometric method was also reported for simultaneous
determination of PCT with CLX in multicomponent mixtures. The mobile phase was ethyl
acetate: methanol: ammonia 25% (85:15:5 v/v) (24).
Simultaneous estimation of PCT and CLX in tablet dosage form was carried out using X
Terra® C18 column (150 mm ×4.6 mm id, 5 μm particle size) as stationary phase,
Acetonitrile: Methanol: HPLC grade water [20: 10: 70 v/v/v] as a mobilephase with flow
rate of 0.7 ml/min. Quantification was achieved with Photo Diode Array detector at 270
nm(36)
Gas liquid chromatography method was described for the estimation of PCT and CLX in
combined dosage forms using 10% OV-17 column and flame ionisation detector;
phenacetin is used as internal standard(37).
New chemometric approaches were introduced into the high performance liquid
chromatographic (HPLC) determination of chlorzoxazone and paracetamol in the tablets

and spiked human plasma. These chemometric approaches contain the application of
classical least squares (CLS), principle component regression (PCR), and partial least
squares (PLS) calibrations to the multi-wavelength HPLC peak area obtained by plotting
the chromatograms at the five wavelengths. The multi-chromatograms were obtained by
using the photodiode array detector at 225 (A), 240 (B), 255 (C), 270 (D), and 285 (E) nm.
The algorithms of CLS, PCR, and PLS were applied to the multi-chromatogram data to
construct the HPLC-CLS, HPLC-PCR, and HPLC-PLS calibrations. A mixture of
acetonitrile and 0.1 M ammonium carbonate (60:40, v /v) on a Waters Symmetry w C18
Column 5 mm 4.6 250 mm at a flow rate of 0.8 mL /min was used as a mobile phase to
separate and determine chlorzoxazone and paracetamol in samples. Hydrochlorothiazide
was used as an internal standard in this chromatographic separation(38).
1.3 Analysis of multi-component formulation:
The determination of mixtures has always been an interesting question for analysts; so
many selective analytical techniques have been put forward.
1.3.1 Chromatographic separation methods:
Chromatography separates complex mixtures with great precision. There are quite a
number of chromatographic techniques that have been developed to analyze complex
mixtures; these include:
1.3.1.1 Gas Chromatography:
In gas chromatography, the components of a vaporized sample are separated as
aconsequence of being partitioned between a gaseous mobile phase and a liquid or solid
stationary phase held in a column. There are two types of gas chromatography; gas liquid
chromatography (GLC) and gas solid chromatography (GSC). With GLC, the stationary
phase is a nonvolatile liquid bonded to the inside of the column or to a fine solid support,
whereas GSC is based on a solid stationary phase in which retention of analytes occurs
because of physical adsorption(39)
1.3.1.2 High Performance Liquid Chromatography:
High performance liquid chromatography(HPLC) is the term used to describe liquid
chromatography in which the liquid mobile phase is mechanically pumped through a
column that contains the stationary phase. HPLC is a powerful tool in analytical chemistry. It
has been used extensively in chemical analysis(40, 41)
1.3.1.3 Capillary Electrophoresis:
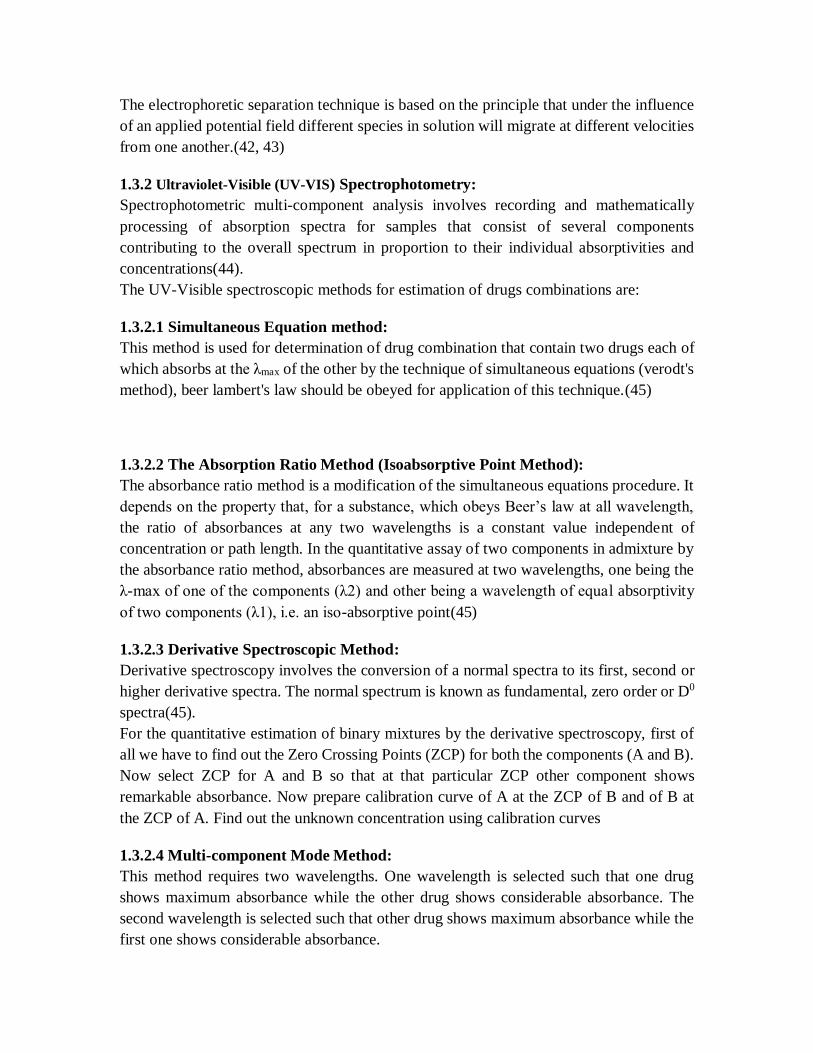
The electrophoretic separation technique is based on the principle that under the influence
of an applied potential field different species in solution will migrate at different velocities
from one another.(42, 43)
1.3.2 Ultraviolet-Visible (UV-VIS) Spectrophotometry:
Spectrophotometric multi-component analysis involves recording and mathematically
processing of absorption spectra for samples that consist of several components
contributing to the overall spectrum in proportion to their individual absorptivities and
concentrations(44).
The UV-Visible spectroscopic methods for estimation of drugs combinations are:
1.3.2.1 Simultaneous Equation method:
This method is used for determination of drug combination that contain two drugs each of
which absorbs at the λmax of the other by the technique of simultaneous equations (verodt's
method), beer lambert's law should be obeyed for application of this technique.(45)
1.3.2.2 The Absorption Ratio Method (Isoabsorptive Point Method):
The absorbance ratio method is a modification of the simultaneous equations procedure. It
depends on the property that, for a substance, which obeys Beer’s law at all wavelength,
the ratio of absorbances at any two wavelengths is a constant value independent of
concentration or path length. In the quantitative assay of two components in admixture by
the absorbance ratio method, absorbances are measured at two wavelengths, one being the
λ-max of one of the components (λ2) and other being a wavelength of equal absorptivity
of two components (λ1), i.e. an iso-absorptive point(45)
1.3.2.3 Derivative Spectroscopic Method:
Derivative spectroscopy involves the conversion of a normal spectra to its first, second or
higher derivative spectra. The normal spectrum is known as fundamental, zero order or D0
spectra(45).
For the quantitative estimation of binary mixtures by the derivative spectroscopy, first of
all we have to find out the Zero Crossing Points (ZCP) for both the components (A and B).
Now select ZCP for A and B so that at that particular ZCP other component shows
remarkable absorbance. Now prepare calibration curve of A at the ZCP of B and of B at
the ZCP of A. Find out the unknown concentration using calibration curves
1.3.2.4 Multi-component Mode Method:
This method requires two wavelengths. One wavelength is selected such that one drug
shows maximum absorbance while the other drug shows considerable absorbance. The
second wavelength is selected such that other drug shows maximum absorbance while the
first one shows considerable absorbance.

Choosing wavelengths at which the differences in molar absorptivities are large, leads to
attain greater accuracy in this analysis.(46)
1.3.2.5 Area Under Curve Method:
The total area under the curve of a mixture at a particular wavelength range is equal to the
sum of area under curve of the individual components at same wavelength range. By
applying “Cramers Rule” and “Matrix Method”, the concentration of component of a
mixture can be determined(46)
1.4 H-point standard additions method(HPSAM)Theoretical Consideration:
1.4.1 Basic principle
HPSAM is a chemometrics methods often used in analytical chemistry. A modification of
the standard additions method, presented by Foster et al(47), was proposed in 1988 by
Reigand Falco (48) in order to obtain an unbiased analyte concentration when both analyte
and interferants are present in a sample. It also permits the determination of an interferant
known to be present. HPSAM is based on the principle of dual-wavelength
spectrophotometry and the standard addition method (48, 49) . HPSAM can determine the
two components simultaneously with extensive or even coincident overlapping
spectra(50)and/or Total Youden Blank (TYB). The TYB represents the constant error of
the method, extrapolated to zero sample level, being independent of the size of sample
taken and not attributable to the analyte(51, 52)
In that method, additions of pure analyte X were made to the sample. Absorbance
increments were used when only the analyte concentration was required(53). This variant
allows the elimination of the blank bias error due to the use of absorbent blanks(54, 55)
The following principles have to be followed for selection of appropriate wavelengths for
applying HPSAM:
At these selected wavelengths the analyte signals must be linear with the concentrations
and the interference signal must remain equal, in the case where the analyte concentrations
are changed, the analytical signal obtained from the mixture containing the analyte and the
interfering should be equal to the sum of the individual signals of the two components. In
addition, the difference in the slopes of the two straight lines measured at two selected
wavelengths must be as large as possible while the difference in the slopes of the two
straight lines measured at the other pair of wavelengths must be as small as
possible(preferred to be equal zero) in order to get good accuracy and sensitivity.(56)
Let us suppose a binary mixture S of the compounds X and Y. Their spectra are shown in
Fig. 3.Absorbance of the sample at each wavelength will be the addition of the individual
absorbances of the species X and Y at this wavelength:
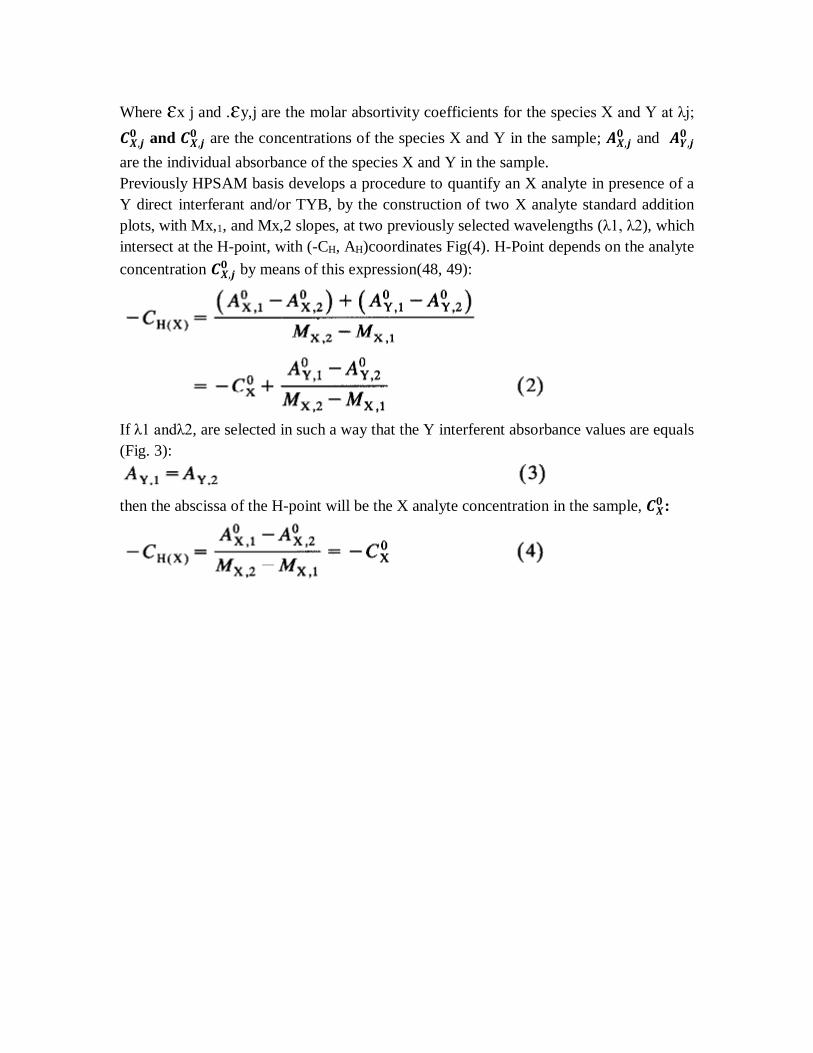
Where ɛx j and .ɛy,j are the molar absortivity coefficients for the species X and Y at λj;
𝑪𝑿,𝒋𝟎 and 𝑪𝑿,𝒋
𝟎 are the concentrations of the species X and Y in the sample; 𝑨𝑿,𝒋𝟎 and 𝑨𝒀,𝒋
𝟎
are the individual absorbance of the species X and Y in the sample.
Previously HPSAM basis develops a procedure to quantify an X analyte in presence of a
Y direct interferant and/or TYB, by the construction of two X analyte standard addition
plots, with Mx,1, and Mx,2 slopes, at two previously selected wavelengths (λ1, λ2), which
intersect at the H-point, with (-CH, AH)coordinates Fig(4). H-Point depends on the analyte
concentration 𝑪𝑿,𝒋𝟎 by means of this expression(48, 49):
If λ1 andλ2, are selected in such a way that the Y interferent absorbance values are equals
(Fig. 3):
then the abscissa of the H-point will be the X analyte concentration in the sample, 𝑪𝑿𝟎 :

Figure 3: Spectrum of analytes X and Y and sample S, and location of one pair of
wavelengths λ1, and λ2, and one pair of wavelengths λ3 andλ4
The interferent determination is made from the AH value (previously corrected the TYB
value, if it is present) and a calibration graph of the interferent.
Figure 4: Plot of the H-point standard additions method. C added is the added analyte
concentration
1.4.2 HPSAM by addition of both analytes:

Basic principle of this method is to analyze each component of the mixture in presence of
the other one as interferent, using analytical signals obtained at two wavelengths where the
absorbance is the same for the interferent and different for the analyte
The required data to apply the method are the absorbance of the sample and the absorbance
of the sample spiked with known amounts of X and Y species at previously selected
wavelengths. Let us suppose that h, and h, are selected according to Eq. 3 (Fig. 3). The
relation of the added concentrations between species X and Y, 𝑪𝒀𝒊 /𝑪𝑿
𝒊 , is the same in all the
solutions prepared to apply the method (because the additions are made from astandard
mixture of both). Then, the equations of the lines that describe the absorbance of the
successive standard additions by application of the HPSAM versus the added concentration
of analyte X at the two previously selected wavelengths will be (Fig. 5):
For λ1 :
For λ2:
Where:
A1 and A2 : the measured absorbance at the two previously selected wavelengths.
Mx,1 , My,1 , Mx,2 and My,2 : are the slopes due to the addition of species X and Y in the
lines obtained at λ1, and λ2.
𝑪𝒀𝒊 and 𝑪𝑿
𝒊 ,: are the concentration of species X and Y added in the i solution.
n: is the number of additions.

When i = 0 corresponds with the solution where only exists sample (there is no standard
added).
Fig. 5. HPSAM lines obtained when the double standard addition is employed
If we represent the analytical signal, absorbance at the two previously selected wavelengths
λ1, and λ2, versus the concentration added of species X, we will obtain two lines, with
intercepts 𝑨𝑿,𝟏𝟎 +𝑨𝒀,𝟏
𝟎 and 𝑨𝑿,𝟐𝟎 +𝑨𝒀,𝟐
𝟎 and slopes
and
The slopes obtained are the ones obtained if the addition was made of analyte X alone, with
the addition of a constant, which depends on the relative concentration of each species in
the standard and the absorbance of the species Y at the selected wavelength. Both lines
intersect at the H point, with coordinates (- CH(X), AH(Y)) where Cn(x) is the unbiased analyte
X concentration. If we operate in Eqs.(5)and(6), and taking into account that Ay,1 = Ay,2and
then My 1 = My,2(Eq. 3):

From where:
Where:
𝑪𝑯(𝑿)= 𝑪𝑿𝟎 : is the unbiased analyte concentration in the sample, because Eq. 8 depends
only of variables related with the analyte, and it is equivalent to:
The incorrigible error due to the presence of one interferent, in spite of its concentration is
not constant, has been transformed into a constant systematic error, which is easily
valuable, as the HPSAM basis predicts. In effect, if we substitute Eq. 9 in Eqs. 5 or 6, we
can prove that AH(Y)is equivalent to:
In the same way as for species X we obtain for the species Y the next expressions, if two
wavelengths λ3, and λ4, are selected in such a way that the species X presents the same
absorbance:
Analogousto expressions (8) and (10), we obtain that:
1.4.3 HPSAM using absorbance increment:
Application of the HPSAM under the condition that the absorbance values of the interferent
at the two wavelengths are the same (Ay,1 = Ay,2), and by subtracting Eqs. 5 from 6, and
taking into account that Ay,1 = Ay,2and then My 1 = My,2 yields:

According to this equation, the absorbance increment depends exclusively on the analyte
concentration, so the plot of ΔA1.2.VS. 𝑪𝑿𝒊 willbe a straight line of ordinate 𝑨𝑿,𝟏
𝟎 -𝑨𝑿,𝟐𝟎 and
slope Mx,1-Mx,2(Fig. 6).The analyte concentration canthus be calculated from ΔA values
by applying the HPSAM to the intercept of the straight line, at the H-point of which
Figure 6: The plot of HPSAM
The ΔA value obtained after each addition will be exclusively related to the analyte
concentration as the interferent absorbance will be the same at the two wavelengths, so its
contribution to ΔA will be zero even if the intensity of its analytical signal changes on
successive analyte additions because of interaction with the analyte. Therefore, the
analytical signals will be free from constant systematic errors (and also from proportional
errors thanks to the features of the MOSA)
Consequently, when only the analyte concentration must be calculated or only the sample
matrix spectrum is known, a single calibration plot of ΔA against the added analyte
concentration allows one to calculate the unknown concentrations free from any bias error
from the intercept of the line in the same way as with the MOSA. but with no systematic
errors.
Figure 7 illustrates the two possibilities of using the HPSAM plots to calculate the analyte
concentration.

Figure 7: The plot of the HPSAM with ∆A values.
On the other hand, routine work usually involves determining the analyte in a given sample
by using the single-calibration method, which requires the sample signal (As), the analytical
signal (Ar) and the concentration of standard used (Cr) to be known. Thus, the analyte
concentration can be calculated from spectroscopic data by using the equation:
The variables required to obtain unbiased results by applying the MOSA are As and the
analytical signal (A1) yielded by a solution containing the sample plus a certain known
added concentration of pure analyte (Ca). The equation to be applied in this case is:
Applying the HPSAM to ∆A values requires them to be known for the original sample and
the solution including the added pure analyte at the two selected wavelengths, as well as
the analyte concentration added. The equation to be used will thus be:
1.5 Objectives:
The combination of paracetamol and chlorzoxazone is not official in any pharmacopoeia;
hence no official method is available for their simultaneous estimation in their combined
synthetic mixture or dosage forms.
The spectra of PCT and CLX (Fig.8), shows significant overlapping over the range of 220-
320 nm, however this overlapping is possible to manipulate using the conditions required
for the application of HPSAM.
The objective of this search was to:
1- Develop and validate HPSAM method based on standard addition of both analytes
utilizing the absorbance difference (∆A) method.
2- To apply the developed method for the simultaneous determination of the two actives in
tablets and capsules
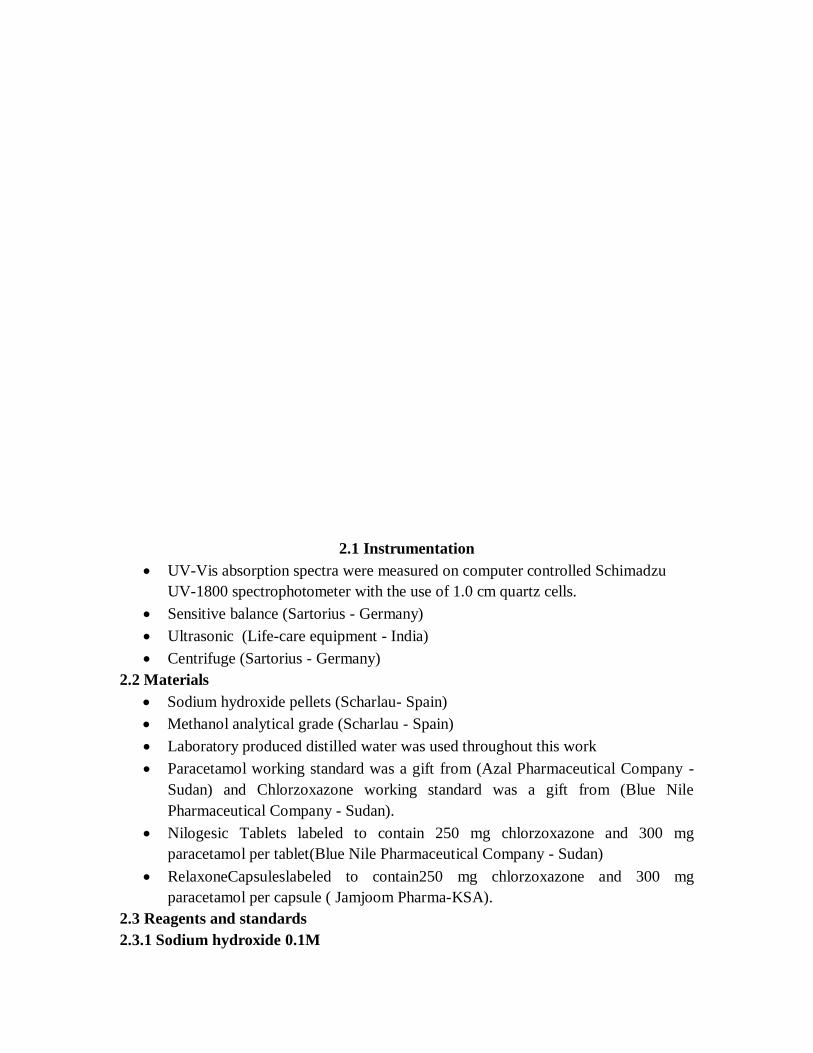
2.1 Instrumentation
• UV-Vis absorption spectra were measured on computer controlled Schimadzu
UV-1800 spectrophotometer with the use of 1.0 cm quartz cells.
• Sensitive balance (Sartorius - Germany)
• Ultrasonic (Life-care equipment - India)
• Centrifuge (Sartorius - Germany)
2.2 Materials
• Sodium hydroxide pellets (Scharlau- Spain)
• Methanol analytical grade (Scharlau - Spain)
• Laboratory produced distilled water was used throughout this work
• Paracetamol working standard was a gift from (Azal Pharmaceutical Company -
Sudan) and Chlorzoxazone working standard was a gift from (Blue Nile
Pharmaceutical Company - Sudan).
• Nilogesic Tablets labeled to contain 250 mg chlorzoxazone and 300 mg
paracetamol per tablet(Blue Nile Pharmaceutical Company - Sudan)
• RelaxoneCapsuleslabeled to contain250 mg chlorzoxazone and 300 mg
paracetamol per capsule ( Jamjoom Pharma-KSA).
2.3 Reagents and standards
2.3.1 Sodium hydroxide 0.1M

Was prepared by dissolving 4 gm of sodium hydroxide pellets in 1000 ml volumetric flask
using purified water.
2.3.2 Standards stock solutions
Standard stock solutions of paracetamol (300 µg/ml) and Chlorzoxazone (300 µg/ml) were
prepared separately by dissolving 30 mg each in 100 ml methanol in a volumetric flask.
2.3.3 Working standard mixture
Working standard solution containing both components was prepared by transferring 5 ml
from each stock solution into a 100 ml volumetric flask and making the volume to the mark
with 0.1 N NaOH.
2.3.4 Laboratory synthetic mixtures
Synthetic samples containing different concentration ratios of PCT and CLX were prepared
by proper dilution of aliquots from the standards stock solutions.
2.4 Samples preparation
2.4.1 Tablets
The homogenized powder from twenty tablets with an average weight equivalent to 300
mg paracetamol and 250 mg Chlorzoxazone was transferred into a 100 ml volumetric flask,
about 70 ml methanol were added, the content of the flask was mechanically shaken for 20
minutes and then sonicated for another 10 minutes(avoid heat generated by the sonicator).
The contents of the flasks were allowed to cool and volume was completed with methanol.
A suitable portion of this mixture was centrifuged at 1500 rpm for 10 minutes, 2 ml of the
clear supernatant solution were transferred into 100 ml volumetric flask and the volume
was completed to the mark with 0.1 N sodium hydroxide.
2.4.2 Capsules
The content of twenty capsules was accurately weighed and mixed well. A quantity of the
resulted powder equivalent to about 250 mg chlorzoxazone was accurately weighed and
transferred into a 100 ml volumetric flask, 70 ml methanol were added and the mixture was
mechanically shaken for 20 minutes then the volume was made to the mark with methanol.
A suitable portion of this mixture was centrifuged at1500 rpm for 10 minutes, 2 ml of the
clear supernatant solution were transferred into 100 ml volumetric flask and the volume
was completed to the mark with 0.1 N sodium hydroxide.
2.5 Procedures:
2.5.1 Optimum wavelength selection
Two separate solutions each containing 150 µg/ml of PCT and CLX were prepared by
diluting 5 ml from their respective standard stock solutions to 100 ml with 0.1 N NaOH.
The UV spectra of the two solutions were recorded over the range 220-320 nm. From the
obtained spectra the pairs of wavelengths satisfying the requirement of Eq.8 for PCT and
Eq. 12 for CLX were selected from the spectra.
2.5.3 Linearity at the selected wavelengths

A calibration series was prepared for PCT and CLX by transferring different volumes from
their respective standard working solutions (100 µg/mL) into two separate series of 50-mL
volumetric flasks, then the volume was completed using 0.1 N NaOH. The prepared
solutions were scanned in the range of 220–320 nm and the absorbance values at the
selected two pairs of wavelength (244, 270.6 nm) and (255, 277.4 nm) was plotted against
their corresponding concentration. Slope and other regression line parameter were
calculated.
2.5.4 General procedure
Two ml of the sample solution/synthetic mixture were transferred into each of six 25 ml
volumetric flasks; each of the six flasks was spiked with a different volume of working
standard mixture (2, 3, 4, 5, 6 ml) except one. The volumes of the flasks were made to mark
with 0.1 N NaOH. The absorbance of each solution was measured at the selected
wavelength pair. Concentrations of PCT and CLX in the samples were obtained from
intersection of straight line (obtained by plotting ΔA value against the added concentration)
with the negative side of the abscissa.
All graphs and calculations were performed using Microsoft Excel spread sheet.
2.5.5 Accuracy:
Six synthetic mixtures containing different ratios of PCT and CLX were prepared by
mixing different volumes from their stock solutions.
2.5.6 Precision:
2.5.6.1Repeatability:
Six homogeneous tests samples from the tablet formulation were determined using the
proposed method following the general procedure described earlier.
2.5.6.2 Intermediate precision:
The determination was repeated on another six samples on different day using freshly
prepared reagent and standards.

3.1 Optimum wavelengths selection
Figure 8: Individual spectra of Chlorzoxazone 10 µg/ml mg/ml and Paracetamol10
µg/ml.

Paracetamol showed equal absorbance at the wavelengths 244nm and 270.6nmaccordingly
it has been selected for the determination of CLX while chlorzoxazone gave equal
absorbanceat255nm and 277.4nm, hence was chosen for the determination of PCT.
The suitability of each selected wavelengths was confirmed by comparing the calibration
graphs (Fig. 10 and 11) produced for each analyte at the two wavelengths where it gave
equal absorbance (i.e. 244 nm and 270.6nm for paracetamol,255nm and 277.4nm for
chlozoxazone).
The obtained calibration plots were linear, approximately superimposed on each other
and their slope ratios were close to one Table 3.These findings confirmed the suitability
of the selected pairs for the two analytes according to HPSM as the requirement of Eq. 8
and 12 above were satisfied(56).
Table 1: Linearity data at 244 nm and 270.6 nm for Paracetamol:
Paracetamol
Cnoc(mg/ml) Absorbance
ΔA 244 nm 270.6 nm
0.002 0.120 0.120 0.000
0.004 0.232 0.233 -0.001
0.006 0.356 0.356 0.000
0.008 0.468 0.471 -0.003
0.010 0.581 0.586 -0.005
0.012 0.700 0.706 -0.006

Figure 9: Calibration curve of Paracetamol at λ 244nm and 270.6nm
Table ( 2 ) Linearity data at 255 nm and 277.4 nm for Chlorzoxazone:
Chlorzoxazone
Cnoc(mg/ml) Absorbance
ΔA 255 nm 277.4 nm
0.004 0.100 0.097 0.003
0.006 0.153 0.150 0.003
0.008 0.205 0.199 0.006
0.010 0.256 0.250 0.006
0.012 0.306 0.297 0.009
0.014 0.354 0.343 0.011
y = 57.986x + 0.0036R² = 0.9998
y = 58.629x + 0.0016R² = 0.9999
0
0.1
0.2
0.3
0.4
0.5
0.6
0.7
0.8
0 0.005 0.01 0.015
ab
sora
nce
conc (mg/ml)
Paracetamol at λ 270.6nm and 244nm
270.6nm
244nm

Figure 10: Calibration curve of Chlorzoxazone at λ 255 nm and 277.4 nm
Table 3: Linearity results of PCT and CLX at the selected wavelength
Parameter Paracetamol Chlorzoxazone
Wavelength (nm) 244 nm 270.6 nm 255 nm 277.4 nm
Concentration range (µg/ml) (2 to 12) µg/ml (4 to 14) µg/ml
Slope (b) 57.986 58.6286 25.429 24.6
Slope ratio 0.99 1.03
Intercept (a) 0.0036 0.0016 0.0001 0.0013
Coefficient of determination (R²) 0.9998 0.9999 0.9997 0.9994
y = 25.429x + 0.0001R² = 0.9997
y = 24.6x + 0.0013R² = 0.9994
0
0.05
0.1
0.15
0.2
0.25
0.3
0.35
0.4
0 0.005 0.01 0.015
Ab
sorb
ance
Conc(mg/ml)
Chlorzoxazone at λ 255nm and 277.4nm
255 nm
277.4 nm

Table 4: Linearity data at 255 nm and 277.4 nm for Paracetamol:
Paracetamol
Cnoc(mg/ml) Absorbance
ΔA 255 nm 277.4 nm
0.002 0.144 0.095 0.049
0.004 0.282 0.185 0.097
0.006 0.430 0.284 0.146
0.008 0.568 0.374 0.194
0.010 0.705 0.466 0.239
0.012 0.852 0.564 0.288
Figure 11: Calibration curve of paracetamol at λ 255nm and 277.4nm
Table5: Linearity data at 244 nm and 270.6 nm for Chlorzoxazone:
Chlorzoxazone
Cnoc(mg/ml) Absorbance
ΔA 244 nm 270.6 nm
0.004 0.219 0.055 0.164
0.006 0.338 0.084 0.254
0.008 0.449 0.112 0.337
0.010 0.563 0.140 0.423
y = 70.671x + 0.0021R² = 0.9999
y = 46.829x + 0.0002R² = 0.9998
0
0.1
0.2
0.3
0.4
0.5
0.6
0.7
0.8
0.9
0 0.002 0.004 0.006 0.008 0.01 0.012 0.014
Ab
sorb
an
ce
Conc(mg/ml)
Paracetamol at λ 255nm and 277.4nm
255 nm
277.4 nm

0.012 0.675 0.165 0.510
0.014 0.778 0.191 0.587
Figure 12: Calibration curve of chlorzoxazone at λ 244nm and 270.6nm
Table 6: Linearity results of PCT and CLX at the selected wavelength
Parameter Paracetamol at Chlorzoxazone at
Wavelength (nm) 255 nm 277.4 nm 244 nm 270.6 nm
Concentration range (µg/ml) (2 to 12) µg/ml (4 to 14) µg/ml
Slope (b) 70.67 46.828 56 13.58
Slope ratio 1.5 4.12
Intercept (a) 0.00213 0.0002 -0.00033 0.0013
Coefficient of determination (R²) 0.9999 0.9998 0.9996 0.9992
3.2 Suitability of HPSAM application
The calibration graphs obtained for each analyte at the two wavelengths were found to be
suitable for its analysis as they produced straight lines with large enough slope difference
(Table 6), accordingly the requirement for application of HPSAM is satisfied (56).
3.3 Analysis of laboratory synthetic mixtures:
To check the accuracy of the method six synthetic samples containing different ratios of
PCT and CLX were prepared from their stock solutions and analysed following the
general procedure.
Table 7: Equations of crossed line for each synthetic mixture:
y = 56x - 0.0003R² = 0.9996
y = 13.586x + 0.0022R² = 0.99930
0.1
0.2
0.3
0.4
0.5
0.6
0.7
0.8
0.9
0 0.005 0.01 0.015
Ab
sorb
ance
Conc(mg/ml)
Chlorzoxazone at lamda 244nm and 270.6nm
244 nm
270.6 nm

Table 8: Analysis result of the synthetic mixtures using ΔA values
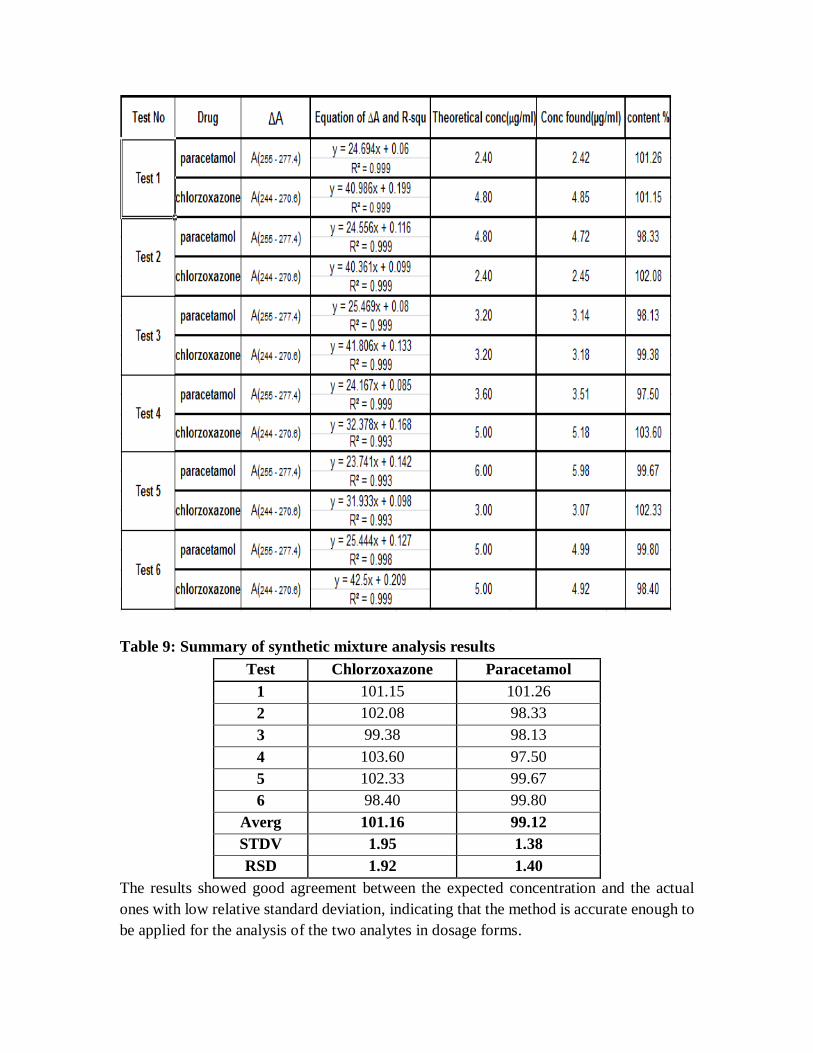
Table 9: Summary of synthetic mixture analysis results
Test Chlorzoxazone Paracetamol
1 101.15 101.26
2 102.08 98.33
3 99.38 98.13
4 103.60 97.50
5 102.33 99.67
6 98.40 99.80
Averg 101.16 99.12
STDV 1.95 1.38
RSD 1.92 1.40
The results showed good agreement between the expected concentration and the actual
ones with low relative standard deviation, indicating that the method is accurate enough to
be applied for the analysis of the two analytes in dosage forms.

3.4 Precision
3.4.1 Repeatability
The concentration of each active was graphically obtained from the intersection of the
straight line (obtained by plotting ∆A value against the added concentration) with negative
side of the x-axis as shown representative graphs Fig 12 and 13 for PCT and CLX
determination, respectively. The concentration of each analyte was also obtained by
solving its corresponding linear regression equation ∆A is equal to zero or simply it is equal
to intercept/slope of the regression line.
The method showed good repeatability for determination of both CLX and PCT. The assay
values were 104.29% and 100.94% for CLX and PCT with relative standard deviation
1.68% and 2.38% respectively. These results are summarized in Table 12.
Table 10: Paracetamol -added concentration in µg/ml and ∆A of each test:
Added
Conc(µg/ml)
Paracetamol
∆A (255-277.4 nm)
Test-1 Test-2 Test-3 Test-4 Test-5 Test-6
0.0 0.119 0.122 0.121 0.117 0.121 0.119
1.2 0.150 0.153 0.151 0.148 0.151 0.148
1.8 0.163 0.168 0.166 0.162 0.164 0.163
2.4 0.178 0.182 0.182 0.178 0.180 0.178
3.0 0.194 0.196 0.196 0.192 0.194 0.191
3.6 0.208 0.211 0.211 0.207 0.207 0.207
Figure 13: Linear regression plot of added concentration (µg/ml)against ∆A for
Paracetamol
0
0.05
0.1
0.15
0.2
0.25
-6.0 -4.0 -2.0 0.0 2.0 4.0 6.0
∆A
Added concentration in µg/ml
Test-1
Test-2
Test-3
Test-4
Test-5
Test-6

Table 11: Chlorzoxazone; Added concentration in µg/ml and ∆A of each test:
Added
conc(µg/ml)
Chlorzoxazone
∆A (244-270.6 nm)
Test-1 Test-2 Test-3 Test-4 Test-5 Test-6
0.0 0.170 0.168 0.167 0.172 0.170 0.171
1.2 0.219 0.217 0.215 0.223 0.221 0.219
1.8 0.241 0.243 0.240 0.248 0.243 0.245
2.4 0.265 0.266 0.265 0.272 0.268 0.269
3.0 0.290 0.290 0.289 0.296 0.293 0.290
3.6 0.314 0.313 0.313 0.319 0.314 0.315
Figure 14: Linear regression plot of added concentration (µg/ml)against ∆A for
chlorzoxazone
Table 12: Results of the repeatability analysis using ΔA method
0.000
0.050
0.100
0.150
0.200
0.250
0.300
0.350
-6.0 -4.0 -2.0 0.0 2.0 4.0
∆A
Added concentration in µg/ml
Test-1
Test-2
Test-3
Test-4
Test-5
Test-6

3.4.2 Intermediate precision:
The method showed good intermediate precision analysis results for the determination of
both CLX and PCT. The assay values were 103.00 % and 102.29% for CLX and PCT
with relative standard deviation 1.68% and 2.29 % respectively. These results are
summarized in Table 13.
There were no significant difference (at P = 0.05 , n = 6 ) between the analysis results
obtained on two different days , the calculated t-value was less than the t- tabulated as
shown in Table 14. This confirms the precision of the proposed method(57).
Table 13: Results of the intermediate precision analysis using ΔA method

Table 14:Statistical analysis of the precision data
% of labeled amount
Chlorzoxazone Paracetamol
sample day1 day2 day1 day2
1 106.50 105.00 100.00 102.90
2 103.25 104.50 102.08 97.92
3 102.75 103.75 100.42 104.17
4 102.50 102.75 97.06 104.17
5 104.50 101.00 104.17 101.67
6 106.25 101.00 101.88 102.92
Average 104.29 103.00 102.29 100.94
STDEV 1.76 1.72 2.34 2.40
RSD% 1.68 1.67 2.29 2.38
Calculated t 1.29 0.99
Tabulated t 2.23 2.23
P = 0.05 n = 6

3.5 Capsules
The proposed method was also applied for the determination of CLX and PCT in capsules
formulation.
The results obtained were in good agreement with the labeled amounts100.08% and
100.04% with relative standard deviations of 1.60% and 1.37% for CLX and PCT
respectively. This supports the suitability the proposed method for the determination of
CLX and PCT in capsules formulation as well.
Table 15: Results of capsules analysis using ΔA method
Table 16: Summary of capsules analysis of results
Test Chlorzoxazone Paracetamol
1 99.75 102.29
2 101.00 100.42
3 98.25 99.38
4 98.50 98.13
5 100.50 99.79
6 102.50 100.21
Average 100.08 100.04
STDEV 1.60 1.37

RSD% 1.60 1.37
4.1 Conclusion
It was observed that PCT and CLX in their mixture have the overlapping absorption spectra
in the spectral region of 220 and 320 nm. Therefore, the simultaneous spectrophotometric
determination of PCT and CLX substances in their synthetic and commercial tablets and
capsules was performed by using this method. The proposed method does not require prior
separation step. From the previous discussion, it could be concluded that the proposed
method is accurate, precise and, unlike the other spectrophotometric methods applied on
this mixture, can cancel the matrix effect during the analysis of PCT and CLX in their
available dosage form. The method is suitable and valid for application in laboratories
lacking liquid chromatographic instruments.

4.2 References
1. Joshi R, Pawar N, Sawant R, Gaikwad P. Simultaneous Estimation of
Paracetamol, Chlorzoxazone and Ibuprofen by Validated Spectrophotometric Methods.
Analytical Chemistry Letters. 2013;2(2 2012).
2. Saldanha TC, de Araújo MCU, Neto BB, Chame HC. Simultaneous Analysis of
Co2+, Cu2+ Mn2+, Ni2+ and Zn2+ in The Ultraviolet Region Using 4-(Pyridil-2-AZO)
Resorcinol and Multivariate Calibration. 2000.
3. Skoog DA, Holler FJ, SR C. Principles of Instrumental Analysis. sixth ed.
Canada: Thomson Corporation; 2007.
4. Bosch ME, Sánchez AR, Rojas FS, Ojeda CB. Determination of paracetamol:
Historical evolution. Journal of pharmaceutical and biomedical analysis. 2006;42(3):291-
321.
5. drugbank. drug. 2014 [cited 2016 8 july]; Available from:
http://www.drugbank.ca/drugs/DB00356.
6. Drug.com. Chlorzoxazone and Acetaminophen. 1994 [cited august 2016];
Available from: https://www.drugs.com/mmx/chlorzoxazone-and-
acetaminophen.html#citec00114105.
7. Ellcock C, Fogg A. Selective colorimetric determination of paracetamol by means
of an indophenol reaction. The Analyst. 1975;100(1186):16-8.
8. Pharmacopoeia B. The Stationary Office: London, 1999, v. Links. 1999:572.
9. Pharmacopeia US, Revision X. US Pharmacopeial Convention. Rockville, Md.
1990:1911.
10. Verma KK, Jain A, Stewart KK. Flow-injection spectroptometric determination of
acetaminophen in drug formulations. Analytica chimica acta. 1992;261(1-2):261-7.
11. Georgiou CA, Koupparis MA. Automated flow injection spectrophotometric
determination of para-and meta-substituted phenols of pharmaceutical interest based on
their oxidative condensation with 1-nitroso-2-naphthol. The Analyst. 1990;115(3):309-
13.
12. Cañada MA, Reguera MP, Medina AR, de Córdova MF, Dıaz AM. Fast
determination of paracetamol by using a very simple photometric flow-through sensing
device. Journal of pharmaceutical and biomedical analysis. 2000;22(1):59-66.
13. Bouhsain Z, Garrigues S, de la Guardia M. PLS-UV spectrophotometric method
for the simultaneous determination of paracetamol, acetylsalicylic acid and caffeine in
pharmaceutical formulations. Fresenius' journal of analytical chemistry.
1997;357(7):973-6.
14. Arana C, Georgita C. Simultaneous determination of paracetamol,
chlorpheniramine and pseudoephedrine by partial least squares method. FARMACIA-
BUCURESTI-. 2002;50(6):30-6.
15. Basu D, Mahalanabis KK, Roy B. Application of least squares method in matrix
form: simultaneous determination of ibuprofen and paracetamol in tablets. Journal of
pharmaceutical and biomedical analysis. 1998;16(5):809-12.
16. Erk N, Onur F. Simultaneous determination of analgine and paracetamol in tablets
by spectrophotometric methods. Analytical letters. 1997;30(6):1201-10.

17. Blanco M, Alcala M. Simultaneous quantitation of five active principles in a
pharmaceutical preparation: development and validation of a near infrared spectroscopic
method. European journal of pharmaceutical sciences. 2006;27(2):280-6.
18. Bouhsain Z, Garrigues S, de La Guardia M. Flow injection–Fourier transform
infrared spectrometric determination of paracetamol in pharmaceuticals. The Analyst.
1996;121(5):635-9.
19. Pulgarín JM, Bermejo LG. Flow-injection stopped-flow spectrofluorimetric
kinetic determination of paracetamol based on its oxidation reaction by hexacyanoferrate
(III). Analytica chimica acta. 1996;333(1):59-69.
20. Koukli II, Calokerinos AC, Hadjiioannou TP. Continuous-flow
chemiluminescence determination of Acetaminophen by reduction of cerium (IV). The
Analyst. 1989;114(6):711-4.
21. Apostolakis JC, Georgiou CA, Koupparis MA. Use of ion-selective electrodes in
kinetic flow injection: determination of phenolic and hydrazino drugs with 1-fluoro-2, 4-
dinitrobenzene using a fluoride-selective electrode. The Analyst. 1991;116(3):233-7.
22. Suzen S, Akay C, Tartilmis S, Erdol R, Onal A, Cevheroglu S. Quantitation of
acetaminophen in pharmaceutical formulations using high-performance liquid
chromatography. Ankara Univ Eczacilik Fakultesi Dergisi. 1998;27:93-100.
23. Bergh J, Lötter A. A Stability-Indicating Gas-Liquid Chromatographic Method
for the Determination of Acetaminophen and Aspirin in Suppositories. Drug development
and industrial pharmacy. 1984;10(1):127-36.
24. Bebawy L, El-Kousy N. Simultaneous determination of some multicomponent
dosage forms by quantitative thin layer chromatography densitometric method. Journal of
pharmaceutical and biomedical analysis. 1999;20(4):663-70.
25. Suntornsuk L, Pipitharome O, Wilairat P. Simultaneous determination of
paracetamol and chlorpheniramine maleate by micellar electrokinetic chromatography.
Journal of pharmaceutical and biomedical analysis. 2003;33(3):441-9.
26. usp. chlorzoxazone tablet. USP29-NF24: United States Pharmacopeial
Convention; 2005. p. 501.
27. Abbar JC, Nandibewoor ST. Development of electrochemical method for the
determination of chlorzoxazone drug and its analytical applications to pharmaceutical
dosage form and human biological fluids. Industrial & Engineering Chemistry Research.
2011;51(1):111-8.
28. Sastry CS, Chintalapati R, Sastry BS, Lakshmi CS. Spectrophotometric
determination of chlorzoxazone in pure state and formulations through oxidative coupling
of its hydrolysis product. 2000.
29. Ravisankar S, Vasudevan M, Gandhimathi M, Suresh B. Reversed-phase HPLC
method for the estimation of acetaminophen, ibuprofen and chlorzoxazone in
formulations. Talanta. 1998;46(6):1577-81.
30. Badgujar MA, Pingale SG, Mangaonkar KV. Simultaneous Determination of
Paracetamol, Chlorzoxazone and Diclofenac Sodium in Tablet Dosage Form by High
Performance Liquid Chromatography. Journal of Chemistry. 2011;8(3):1206-11.
31. Shaikh K, Devkhile A. Simultaneous determination of aceclofenac, paracetamol,
and chlorzoxazone by RP-HPLC in pharmaceutical dosage form. Journal of
chromatographic science. 2008;46(7):649-52.

32. Toubar SS, Hegazy MA, Elshahed MS, Helmy MI. Novel pure component
contribution, mean centering of ratio spectra and factor based algorithms for
simultaneous resolution and quantification of overlapped spectral signals: An application
to recently co-formulated tablets of chlorzoxazone, aceclofenac and paracetamol.
Spectrochimica Acta Part A: Molecular and Biomolecular Spectroscopy. 2016;163:89-95.
33. Chatterjee P, Jain C, Sethi P. Simultaneous determination of chlorzoxazone and
acetaminophen in combined dosage forms by an absorbance ratio technique and
difference spectrophotometry. Journal of pharmaceutical and biomedical analysis.
1989;7(6):693-8.
34. Sharaf El-Din MK, Abuirjeie MA, Abdel-Hay MH. Simultaneous determination
of acetaminophen with orphenadrine citrate, ibuprofen or chlorzoxazone in combined
dosage forms by zero-crossing derivative spectrophotometry. Analytical letters.
1991;24(12):2187-206.
35. Wahbi A-AM, Gazy AA, Abdel Razak O, Mahgoub H, Moneeb M. Simultaneous
Determination of Paracetamol and Chlorzoxazone using Orthogonal Functions Ratio
Spectrophotometry. Saudi Pharmaceutical Journal. 2003;11(4):192-200.
36. G CB, R PH. Stability-Indicating RP-HPLC Method for Simultaneous Estimation
of Chlorzoxazone and Paracetamol in Tablet Dosage Form. International journal of
pharmaceutics and drug analysis. 2014;2(5):402-12.
37. Avadhanulu AB, Pantulu ARR, Anjaneyulu Y. Gas liquid chromatographic
estimation of (1) chlorozoxazoneand paracetamol (2) chlormezanone and paracetamol in
single and combined dosage forms. Indian Drugs. 1994;31(5):201-4.
38. Dinç E, Ozdemir A, Aksoy H, Baleanu D. Chemometric approach to
simultaneous chromatographic determination of paracetamol and chlorzoxazone in tablets
and spiked human plasma. Journal of liquid chromatography & related technologies.
2006;29(12):1803-22.
39. Grob RL, Barry EF. Modern Practice of Gas Chromatography: John Wiley and
Sons; 1995. 64-110 p.
40. Liu J, Meng M, Li C, Huang X, Di D. Simultaneous determination of three
diarylheptanoids and an α-tetralone derivative in the green walnut husks (Juglans regia
L.) by high-performance liquid chromatography with photodiode array detector. Journal
of Chromatography A. 2008;1190(1):80-5.
41. Gennaro M, Marengo E, Gianotti V, Angioi S. Simultaneous reversed-phase high-
performance liquid chromatographic separation of mono-, di-and trichloroanilines
through a gradient elution optimised by experimental design. Journal of Chromatography
A. 2002;945(1):287-92.
42. Robards K, Haddad PR, Jackson PE. Principles and practice of modern
chromatographic methods: Academic Press; 1994.
43. Azhagvuel S, Sekar R. Method development and validation for the simultaneous
determination of cetirizine dihydrochloride, paracetamol, and phenylpropanolamine
hydrochloride in tablets by capillary zone electrophoresis. Journal of pharmaceutical and
biomedical analysis. 2007;43(3):873-8.
44. Ashie JB. Study on Methods of Simultaneous Multi-Component Analysis. 2008.
45. Beckett AH, Stenlake JB. Practical Pharmaceutical Chemistry: Part II Fourth
Edition: A&C Black; 1988.

46. Chaudhary J, Jain A, saini V. SIMULTANEOUS ESTIMATION OF
MULTICOMPONENT FORMULATIONS BY UV-VISIBLE SPECTROSCOPY: AN
OVERVIEW. INTERNATIONAL RESEARCH JOURNAL OF PHARMACY.
2011;2(12):81-3.
47. Foster JS, Langstroth G, McRae D. Quantitative spectrographic analysis of
biological material. I. A method for the determination of lead in cerebrospinal fluid.
Proceedings of the Royal Society of London Series A, Mathematical and Physical
Sciences. 1935;153(878):141-52.
48. Reig FB, Falcó PC. H-point standard additions method. Part 1. Fundamentals and
application to analytical spectroscopy. The Analyst. 1988;113(7):1011-6.
49. Cardone MJ, Reig FB, Falcó PC. Letters. The Analyst. 1990;115(1):111-3.
50. Jinghe Y, Guangjun Z, Nianqin J, Rongjiang H, Cunguo L, Jingtian H.
Simultaneous determination of cephalexin and cefadroxil by using the coupling technique
of synchronous fluorimetry and H-point standard additions method. Analytica chimica
acta. 1996;325(3):195-200.
51. Cardone M. Detection and determination of error in analytical methodology. I: In
the method of verification program. Journal-Association of official analytical chemists.
1983;66(5):1257-82.
52. Cardone M. Detection and determination of error in analytical methodology. II:
Correction for corrigible systematic error in the course of real sample analysis. Journal-
Association of official analytical chemists. 1983;66(5):1283-94.
53. Falco PC, Reig FB, Verdu-Andres J. Application of the H-point standard
additions method by using absorbance increment values as analytical signals. Talanta.
1992;39(1):1-7.
54. Campíns-Falcó P, Bosch-Reig F, Verdú-Andrés J. Evaluation and elimination of
the “blank bias error” using the H-point standard addition method: Application to
spectrophotometric determinations using absorbent blank. Analytica chimica acta.
1992;270(1):253-65.
55. Bosch-Reig F, Verdú-Andrés J, Campins-Falco P, Molins-Legua C. Study of the
behaviour of the absorbent blanks in analytical procedures by using the H-Point standard
additions method (HPSAM). Talanta. 1994;41(1):39-52.
56. Darwish HW, Hassan SA, Salem MY, El-Zeany BA. Development and validation
of H-point standard addition method applied for the analysis of binary mixture of
amlodipine and atorvastatin. International Journal of Pharma & Bio Sciences.
2013;4(2):230-43.
57. Miller JN, Miller JC. Statistics and chemometrics for analytical chemistry:
Pearson Education; 2005.