AL - NASA · Planetary Quarantine at the 16th Meeting of COSPAR, Konstanz, F. R. G., May 25 - June...
72
i AL 10-33'OL 41 ~ a~gdfl~ ~c~ 5Fe p~p df2 V/VC,/a5 LA6.)-6r--p C q 73/o Ive? I~ ~ oproduced by NATIONAL TECHNICAL " ENFORMATION SERVOCE ° US Deportment of Commerce Springfield, VA. 22151 JET PROPULSION LABORATORY CALIFORNIA INSTITUTE OF TECHNOLOGY PASADENA, CALIFORNIA J ~ https://ntrs.nasa.gov/search.jsp?R=19730024308 2019-12-29T02:44:00+00:00Z
Transcript of AL - NASA · Planetary Quarantine at the 16th Meeting of COSPAR, Konstanz, F. R. G., May 25 - June...

i AL
10-33'OL 41 ~ a~gdfl~ ~c~ 5Fe p~p df2
V/VC,/a5 LA6.)-6r--p C q 73/o
Ive?
I~ ~oproduced by
NATIONAL TECHNICAL "ENFORMATION SERVOCE °US Deportment of Commerce
Springfield, VA. 22151
JET PROPULSION LABORATORY
CALIFORNIA INSTITUTE OF TECHNOLOGY
PASADENA, CALIFORNIA
J ~
https://ntrs.nasa.gov/search.jsp?R=19730024308 2019-12-29T02:44:00+00:00Z

900-636
PLANETARY QUARANTINE
Semi-Annual Review
Space Research and Technology
1 January - 30 June 1973
October, 1973
APPROVED BY:DI M. Taylor, 'Sper sorLife Sciences Reseach
A. R. Hoffma SupervisorPlanetary Quarantine Analysis
D. S. Hess, ManagerEnvironmental RequirementsSection
JET PROPULSION LABORATORY
CALIFORNIA INSTITUTE OF TECHNOLOGY
PASADENA, CALIFORNIA
900-636
DISTRIBUTION
Caird, H. 111-118
Craven, C. 180-703
Flitton, D. D. (2) 111-208
Hess, D. S. 233-208
Hoffman, A. R. (2) 233-206
Small, J. G. (3) 180-703
Taylor, D. M. (75) 233-206

900-636
PRECEDING PAf-P BT ANTT NOT FILMED
PREFACE
This document contains a report on Research and Advanced
Development at the Jet Propulsion Laboratory during the
period January, 1973 to July, 1973, sponsored by the
Planetary Quarantine branch of the NASA Office of Space
Science and Applications.
iii

900-636
CONTENTS NG PAGE BLANK NOT FILMEDCONTENTS
PLANETARY QUARANTINE STRATEGIES FORADVANCED MISSIONS (NASA No. 193-58-61-01) . ...... . 1-1
1.1 STRATEGIES FOR SATELLITE ENCOUNTER ..... 1-1
1.1.1 Subtask A Introduction. . ........... . 1-1
1.1.2 Significant Accomplishments . ........ 1-1
1.1.3 Future Activities .... ........... 1-1
1.1.4 Presentations ...... . . ......... 1-1
1.2 JUPITER ENTRY ANALYSIS ............. 1-2
1.2. 1 Subtask B Introduction . . .......... 1-2
1.2.2 Significant Accomplishments . .... .... 1-2
1.2.3 Future Activities ................ 1-2
1.2.4 Presentations .................. 1-3
NATURAL SPACE ENVIRONMENT STUDIES(NASA No. 193-58-61-02) .................... 2-1
2. 1 EFFECT OF PLANETARY TRAPPEDRADIATION BELT ON MICROORGANISMS . ...... 2-1
2. 1. 1 Subtask A Introduction . ............ 2-1
2. 1. 2 Significant Accomplishments . ........ 2-1
2.1.3 Future Activities ................ 2-9
2.2 EFFECT OF SOLAR WIND RADIATION ONMICROORGANISMS .................... 2-10
2.2. 1 Subtask B Introduction . ............ 2-10
2. 2. 2 Significant Accomplishments . ......... 2-10
2.2.3 Future Activities ................ 2-10
2.3 EFFECT OF SPACE VACUUM ONMICROORGANISMS .................... 2-11
2.3. 1 Subtask C Introduction . ............ 2-11
2.3.2 Significant Accomplishments . ......... 2-11
2.3.3 Future Activities .... ... ......... 2-13
2.3.4 Presentations ........ .......... 2-14
POST LAUNCH RECONTAMINATION STUDIES(NASA No. 193-58-62-03) .................... 3-1
3.1 POST LAUNCH RECONTAMINATION STUDIES . . .. 3-1
3. 1.1 Subtask A Introduction . ............ 3-1
3. 1.2 Significant Accomplishments . ........ 3-1
v
900-636
CONTENTS (contd)
3.1.3 Future Activities .................. 3-14
3.1.4 Presentations .................... 3-16
3.1.5 Publications ..................... 3-16
3.1.6 References .................. ... 3-16
IV SPACECRAFT CLEANING AND DECONTAMINATIONTECHNIQUES (NASA No. 193-58-63-02) . ............ . 4-1
4.1 PHYSICAL REMOVAL OF SPACECRAFTMICROBIAL BURDEN ....... ............. 4-1
4.1. 1 Subtask A Introduction . ............ . . 4-1
4.1.2 Approach ........... ........... 4-1
4. 1.3 Significant Accomplishments . ......... . 4-6
4.1.4 Summary and Conclusions . ............ 4-17
4.1.5 Future Activities .................. 4-194.2 EVALUATION OF PLASMA CLEANING AND
DECONTAMINATION TECHNIQUES . ........... 4-214. 2. 1 Subtask B Introduction . .............. 4-214.2.2 Significant Accomplishments . ..... . . . . . 4-214.2.3 Future Activities .................. 4-21
vi

900-636
FIGURES
2-A. 1 Effect of dose and dose rate at different electronenergies on spacecraft spore isolates ...... . . . . . . . . . . 2-5
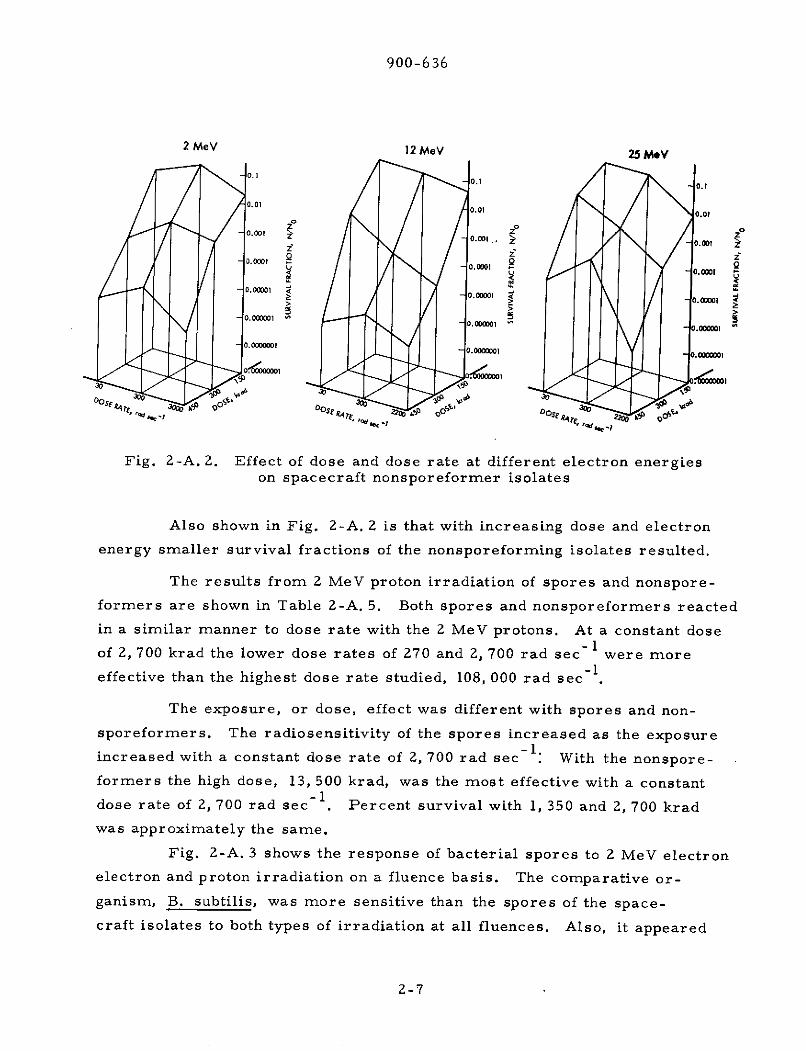
2-A. 2 Effect of dose and dose rate at different electronenergies on spacecraft nonsporeformer isolates . . . . . . . . . 2-7
2-A. 3 Response of bacterial spores to 2 MeV electronand proton irradiation ..... .................. . 2-8
2-C. 1 Effect of temperature on combined spacecraftisolates in vacuum (Vegetatives) . ................ 2-15
2-C. 2 Effect of temperature on combined spacecraftisolates in vacuum (Spores) .................... 2-15
2-C. 3 Effect of vacuum duration on combined spacecraftisolates (Vegetatives) .... ................... 2-16
2-C. 4 Effect of vacuum duration on combined spacecraftisolates (Spores) . . . . . . . . . . . . . . . . . . . . ..... . 2-16
2-C. 5 Interaction of vacuum duration and temperature oncombined spacecraft isolates (Vegetatives). ...... . . . . . . . 2-17
2-C. 6 Interaction of vacuum duration and temperature oncombined spacecraft isolates (Spores) .. ............ 2-18
2-C. 7 Summary of vacuum-temperature studies(Vegetatives) . . . . . . . . . . . . . . . . . . . . . . . . . . . 2-19
2-C. 8 Summary of vacuum-temperature studies(Spores) ................... ............. 2-20
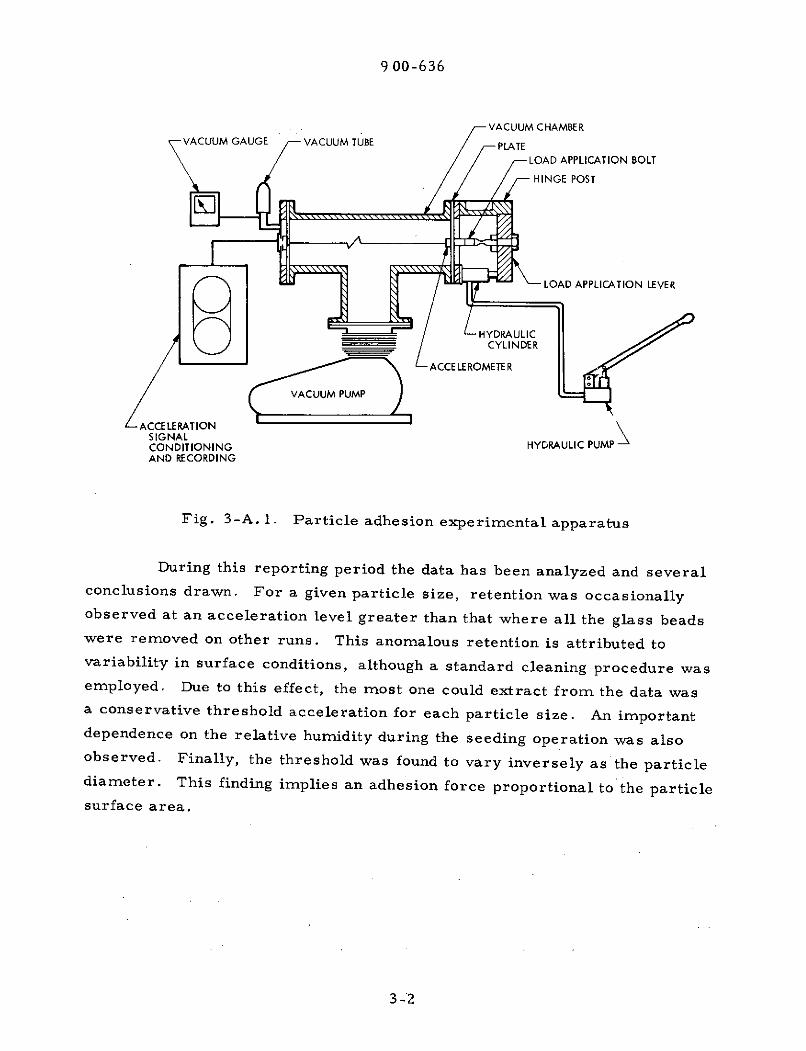
3-A. 1 Particle adhesion experimental apparatus . . . . . . . . . . . 3-1
3-A. 2 Meteoroid impact analysis results (case I) ... . . . . . . . . . 3-6
3-A. 3 Meteoroid impact analysis results (case II). ....... . . . . . 3-6
3-A. 4 One dimensional electric field . ........... . . . . .. . . 3-9
3-A. 5 Grain charging in sunlight .................... 3-11
3-A. 6 Particle trajectory calculations . ................ 3-12
3-A. 7 Conceptual schematic for acoustic emission.application to particle release . ................. 3-14
3-A. 8 Flow diagram for spacecraft recontamination analysis . . . . . 3-15
4-A. 1 Typical size distribution of glass beads used for test . . .. ... 4-3
4-A.2 Test apparatus (as seen in schematic, Fig. 4-A.3) .. . . . . . 4-4
4-A.3 Apparatus schematic ...... ....... .. . . ...... 4-5
4-A. 4 Removal efficiency vs blow angle and pressure. . ... ..... 4-6
4-A. 5 Removal efficiency vs blow-pressure for differentsurface conditions (45 deg blow angle) . ............. 4-7
4-A. 6 Efficiency gain vs sweep pattern . ... . . . . . . . . . . . . . 4-9
vii

900-636
FIGURES (contd)
4-A. 7 Efficiency gain vs number of strokes . ............... 4-11
4-A. 8 Tests with dust -- total removal efficiencies vs pressureand surface conditions (45 deg blow angle, double sweep) . .... 4-13
4-A. 9 Tests with dust on dry surface; effect on size (45 deg blow) . . . . 4-14
4-A. 10 Tests with dust on oily surface; effect on size (45 deg blow). . . . 4-15
4-A. 11 Test with dust on moistened surface; effect on size (45 deg blow) . 4-16
viii

900-636
TABLES
2-A. 1 Conversion for Electron Tests . .................. 2-3
2-A.2 Conversion for Proton Tests .................... 2-3
2-A. 3 Percent Survival of Spores Exposed toElectron Irradiation ................... ....... 2-4
2-A.4 Percent Survival of NonsporeformersExposed to Electron Irradiation ...... ............. 2-6
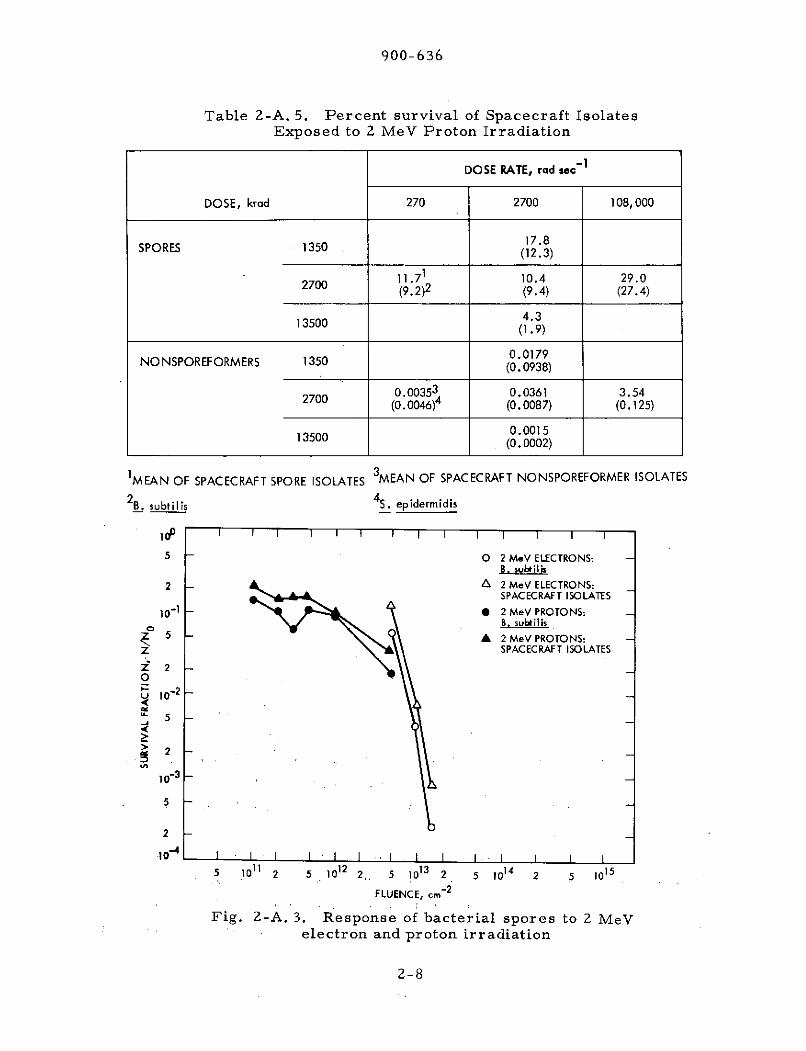
2-A. 5 Percent survival of Spacecraft IsolatesExposed to 2 MeV Proton Irradiation. . ............ . . 2-8
3-A. 1 Particle Adhesion Test Results. . .................. . . 3-4
4-A. 1 Blow vacuum cleaning test efficiencies demonstratedwith dust seeded on optical glass ............... ... 4-17
ix

900-636
SECTION I
PLANETARY QUARANTINE STRATEGIESFOR
ADVANCED MISSIONS(NASA No. 193-58-61-01)
Contents Title and Related Personnel
Subtask A STRATEGIES FOR SATELLITE ENCOUNTERpara. 1. 1
Cognizance: C. Gonzalez
As sociatePersonnel: W. Stavro
Subtask B JUPITER ENTRY ANALYSISpara. 1.2
Cognizance: C. Gonzalez
AssociatePersonnel: W. Jaworski, A. McRonald

900-636
1. 1 STRATEGIES FOR SATELLITE ENCOUNTER
1. 1. 1 Subtask A Introduction
The objectives of this task are to determine the impact of satisfying
satellite quarantine constraints on current outer planet mission and space-
craft designs; and to develop tools required to perform trajectory and naviga-
tion analyses for determining satellite impact probabilities.
1.1.2 Significant Accomplishments
Previously developed software tools were applied to typical outer
planet close satellite encounters involving Io (Jupiter) and Titan (Saturn).
The probability of impact of the satellite by a spacecraft was determined for
various midcourse maneuvers. The implications for outer planet missions
of satisfying satellite quarantine constraints were determined. The results of
the satellite quarantine analyses were presented at the COSPAR meeting
(June 1973) in Germany, and at the AIAA/AGU meeting on the outer planets
(July 1973) in Denver.
The probability of impacting Saturn's rings was also determined.
1. 1. 3 Future Activities
The following future activities will be undertaken:
1) A calculation of the probability of impact for Ganymede (Jupiter)
and Tethys (Saturn) encounters.
2) A determination of the implications of a JS - X mission on
satellite and planetary quarantine.
3) A determination of any fuel load penalties which would be
required to satisfy the quarantine constraints.
4) An investigation of strategies to minimize the fuel load penalties.
1.1.4 Presentations
Hoffman, A. R., Stavro, W., Gonzales, C., "Quarantine Constraints
as Applied to Satellites. " Paper presented at the Joint Open Meeting of the
1-1
900-636
Panel on Planetary Quarantine at the 16th Meeting of COSPAR,
Konstanz, F. R. G., May 25 - June 6, 1973.
Gonzalez, C., Stavro, W., "The Significance of Outer Planet
Satellite Quarantine Constraints on Aim-Point Selection. " Paper presented
at the AIAA/AGU Space Science Conference on the Exploration of the Outer
Solar System, Denver, Colorado, July 10-12, 1973.
1.2 JUPITER ENTRY ANALYSIS
1.2.1 Subtask B Introduction
The objective of the task is to develop and use tools needed to deter-
mine the thermal response characteristics of a typical spacecraft and related
debris upon entry into the Jovian atmosphere.
1.2.2 Significant Accomplishments
A thermal response analysis was performed for the ultraviolet spec-
trometer (UVS) lens cap and indicated that components, such as the lens cap
which are comprised of a homogeneous material (e. g., plastic) and are small
in size (23.0 cm in diameter, 24.0 cm long and 0.5 cm thick), will not survive
atmospheric entry. Thermal modeling of the UVS itself was initiated and is
still in progress at the writing of this report. The chemical and thermal
properties of the UVS component materials have been determined.
The particle analyses for Jupiter are nearly completed.
1.2.3 Future Activities
Future activities for the next six months include completion of allparticle analyses for Jupiter, and initiation of similar analyses for Saturn.Thermal modeling will be completed for the UVS and an entry heatinganalysis performed. Thermal modeling will also be completed for the space-craft mission module.
1-2
900-636
1.2.4 Presentations
Gonzalez, C., Jaworski, W., McRonald, A., and Hoffman, A.,
"Spacecraft Microbial Burden Reduction Due to Atmospheric Entry Heating -
Jupiter. " Paper presented at the Joint Open Meeting of the Panel on
Planetary Quarantine at the 16th Meeting of COSPAR, Konstanz, F. R. G.,
May 25 - June 6, 1973.
1-3
900-636
SECTION II
NATURAL SPACE ENVIRONMENT STUDIES(NASA No. 193-58-61-02)
Contents Title and Related Personnel
Subtask A EFFECT OF PLANETARY TRAPPED RADIATIONpara. 2. 1 BELT ON MICROORGANISMS
Cognizance: D. Taylor
AssociatePersonnel: C. Hagen (Bionetics)
J. BarengoltzC. Smith (Bionetics)G. Renninger (Bionetics)
Subtask B EFFECT OF SOLAR WIND ON MICROORGANISMSpara. 2.2
Cognizance: D. Taylor
AssociatePersonnel: C. Hagen (Bionetics)
J. Barengoltz
Subtask C EFFECT OF SPACE VACUUM ONpara. 2.3 MICROORGANISMS
Cognizance: D. TaylorC. Hagen (Bionetics)
AssociatePersonnel: R. Gildersleeve (Bionetics)
G. Simko (Bionetics)J. Yelinek (Bionetics)C. Smith (Bionetics)

900-636
2. 1 EFFECT OF PLANETARY TRAPPED RADIATION BELT ONMICROORGANISMS
2. 1. 1 Subtask A Introduction
The objective of this subtask is to determine the effect of planetarytrapped radiation belts on the survival of microorganisms associated with anunsterile spacecraft.
With flyby missions now planned for Jupiter and Saturn and possibleJupiter orbiters and probes, the trapped radiation belts may represent anenvironment lethal to microorganisms and thereby reduce the requirement
for decontamination of spacecraft before launch.
The major components of planetary trapped radiation belts are
electrons and protons. The approach of the present task is to evaluate pos-
sible biological effects of these belts by subjecting spacecraft microbial
isolates to different energies, exposures, and dose rates of those particles.
2. 1. 2 Significant Accomplishments
2. 1. 2. 1 Description of Study. During this reporting period a test matrix
for 2, 12, and 25 MeV electron exposures was completed. Additional 2 MeVproton exposures other than those previously reported (JPL Doc. No. 900-608,1 July-31 December 1972) were completed.
As with all the radiation studies, a spacecraft bacterial subpopulation(nine sporeforming and three nonsporeforming isolates) plus two comparativeorganisms, Staphylococcus epidermidis and spores of Bacillus subtilis var.niger, were exposed to the different particle radiations at different exposures
and exposure rates with simultaneous exposure to a vacuum of 10 - 6 torr at-20 and 20 0 C.
2. 1. 2. 2 Experimental Conditions.
1. Microbiology. The derivation, culture, and assay procedures
for the test organisms were previously described in para. 3. 2. 1. 2 of JPL
Doc. No. 900-597, February 1973.
2-1
900-636
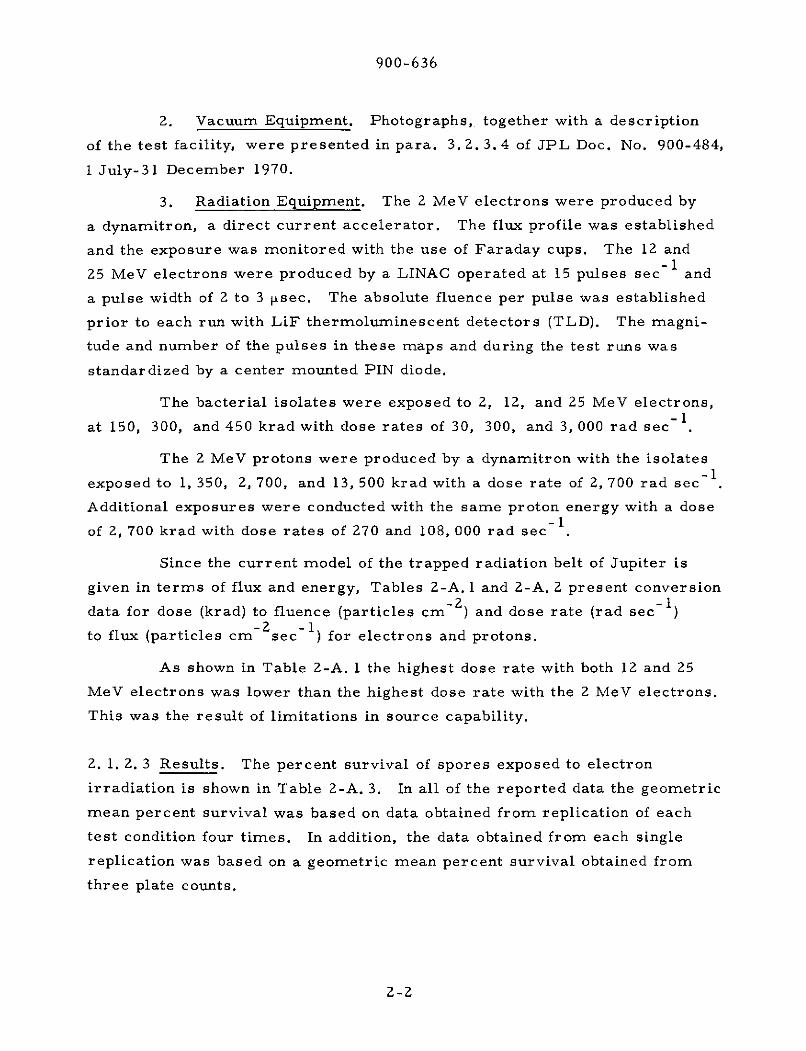
2. Vacuum Equipment. Photographs, together with a description
of the test facility, were presented in para. 3. 2.3.4 of JPL Doc. No. 900-484,
1 July-31 December 1970.
3. Radiation Equipment. The 2 MeV electrons were produced by
a dynamitron, a direct current accelerator. The flux profile was established
and the exposure was monitored with the use of Faraday cups. The 12 and-1
25 MeV electrons were produced by a LINAC operated at 15 pulses sec and
a pulse width of 2 to 3 [ sec. The absolute fluence per pulse was established
prior to each run with LiF thermoluminescent detectors (TLD). The magni-
tude and number of the pulses in these maps and during the test runs was
standardized by a center mounted PIN diode.
The bacterial isolates were exposed to 2, 12, and 25 MeV electrons,-1
at 150, 300, and 450 krad with dose rates of 30, 300, and 3, 000 rad sec-1
The 2 MeV protons were produced by a dynamitron with the isolates-1
exposed to 1, 350, 2, 700, and 13, 500 krad with a dose rate of 2, 700 rad sec-1
Additional exposures were conducted with the same proton energy with a dose-1
of 2, 700 krad with dose rates of 270 and 108, 000 rad sec-1
Since the current model of the trapped radiation belt of Jupiter is
given in terms of flux and energy, Tables 2-A. 1 and 2-A. 2 present conversion
data for dose (krad) to fluence (particles cm-2) and dose rate (rad sec- )-2 -1to flux (particles cm sec ) for electrons and protons.
As shown in Table 2-A. 1 the highest dose rate with both 12 and 25
MeV electrons was lower than the highest dose rate with the 2 MeV electrons.
This was the result of limitations in source capability.
2. 1. 2. 3 Results. The percent survival of spores exposed to electron
irradiation is shown in Table 2-A. 3. In all of the reported data the geometric
mean percent survival was based on data obtained from replication of each
test condition four times. In addition, the data obtained from each single
replication was based on a geometric mean percent survival obtained from
three plate counts.
2-2

900-636
Table 2-A. 1. Conversion for Electron Tests
ENERGY, MeV FLUX, DOSE RATE, FLUENCE, DOSE, krad
NOMINAL ACTUAL cm - 2 sec - 1 rad sec - 1 cm - 2 NOMINAL ACTUAL
2 1.93 109 30 4.85 x 10¹² 150 145
1010 300 9.70 x 10¹² 300 290
1011 3000 1.45 x 10¹³ 450 440
12 10.65 8.4 x 10⁸ 30 4.10 x 10¹² 150 145
8.4 x 10⁹ 300 8.20 x 10¹² 300 290
6.5 x 10¹⁰ 2200 1.24 x 10¹³ 450 440
25 23.40 7.0 x 10⁸ 30 3.50 x 10 12 150 145
7.1 x 10⁹ 300 7.00 x 10¹² 300 290
5.4 x 10¹⁰ 2200 1.07 x 10 13 450 440
Table 2-A. 2. Conversion for Proton Tests
Flux Dose Rate Fluence DoseENERGY, MeV cm - 2 sec- 1 rad sec-1 cm-2 Krad
2 10 8 270 5 x 10¹¹ 1350
109 2700 1 x 10¹² 2700
4 X 10¹⁰ 108000 5 x 10 1 2 13500
2-3
900-636
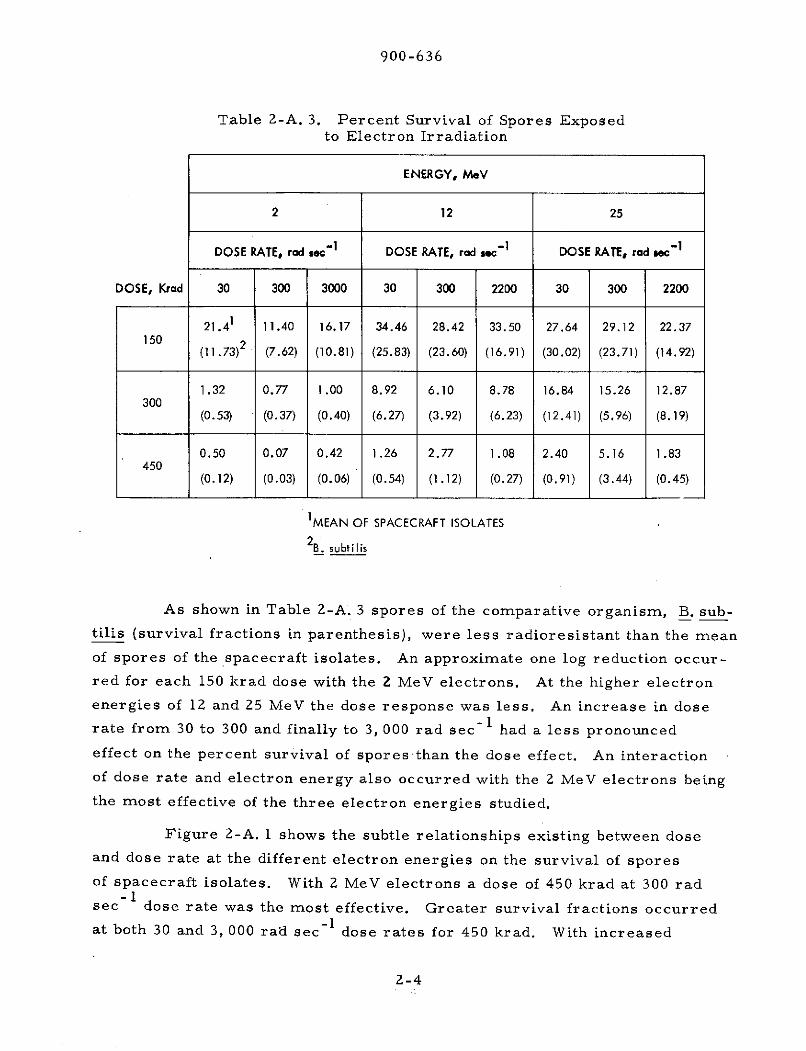
Table 2-A. 3. Percent Survival of Spores Exposedto Electron Irradiation
ENERGY, MeV
2 12 25
DOSE RATE, rad sec-1 DOSE RATE, rod wc-1 DOSE RATE, rad sec-1
DOSE, Krad 30 300 3000 30 300 2200 30 300 2200
21.41 11.40 16.17 34.46 28.42 33.50 27.64 29.12 22.37150 2
(11.73) 2 (7.62) (10.81) (25.83) (23.60) (16.91) (30.02) (23.71) (14.92)
1.32 0.77 1.00 8.92 6.10 8.78 16.84 15.26 12.87300
(0.53) (0.37) (0.40) (6.27) (3.92) (6.23) (12.41) (5.96) (8.19)
0.50 0.07 0.42 1.26 2.77 1.08 2.40 5.16 1.83450
(0.12) (0.03) (0.06) (0.54) (1.12) (0.27) (0.91) (3.44) (0.45)
IMEAN OF SPACECRAFT ISOLATES
2B. subtilis
As shown in Table 2-A. 3 spores of the comparative organism, B. sub-
tilis (survival fractions in parenthesis), were less radioresistant than the mean
of spores of the spacecraft isolates. An approximate one log reduction occur-
red for each 150 krad dose with the 2 MeV electrons. At the higher electron
energies of 12 and 25 MeV the dose response was less. An increase in dose
rate from 30 to 300 and finally to 3, 000 rad sec- 1 had a less pronounced
effect on the percent survival of spores than the dose effect. An interaction
of dose rate and electron energy also occurred with the 2 MeV electrons being
the most effective of the three electron energies studied.
Figure 2-A. 1 shows the subtle relationships existing between dose
and dose rate at the different electron energies on the survival of spores
of spacecraft isolates. With 2 MeV electrons a dose of 450 krad at 300 rad-I
sec dose rate was the most effective. Greater survival fractions occurred
at both 30 and 3, 000 rad sec - I dose rates for 450 krad. With increased
2-4

900-636
2 MeV 12 MeV 25 MeV
1.0 - 1.0 -1.0z z
0.1 0.1 -0.1
Q Q-0.01 -0.01 -- 0.01
- 0.0001 0.0001 - 0.0001m
electron energies on spacecraft spore isolates
electron energy to 12 and 25 MeV a dose of 450 krad at both dose rates of 30-1
and 2, 200 rad sec-1 became the most effective. This is shown as a down-
turning of the projected planes in Fig. 2-A. 1 for the 12 and 25 MeV electrons.
The percent survival of nonsporeformers exposed to electron irra-
diation is shown in Table 2-A. 4. The comparative organism, S. epidermidis,
was considerably less radioresistant than the mean of the nonsporeforming
spacecraft isolates.
The overall radioresistance of the nonsporeforming isolates to the
different electron radiation environments was less than the spores of the
sporeforming isolates. Also, with the nonsporeforming isolates there was
less of an electron energy effect compared to the spores. The 12 MeV elec-
tron energy was slightly more effective, particularly at the higher exposures,
than either the 2 or 25 MeV electron energies on the survival of the nonspore-
forming isolates.
2-5
900-636
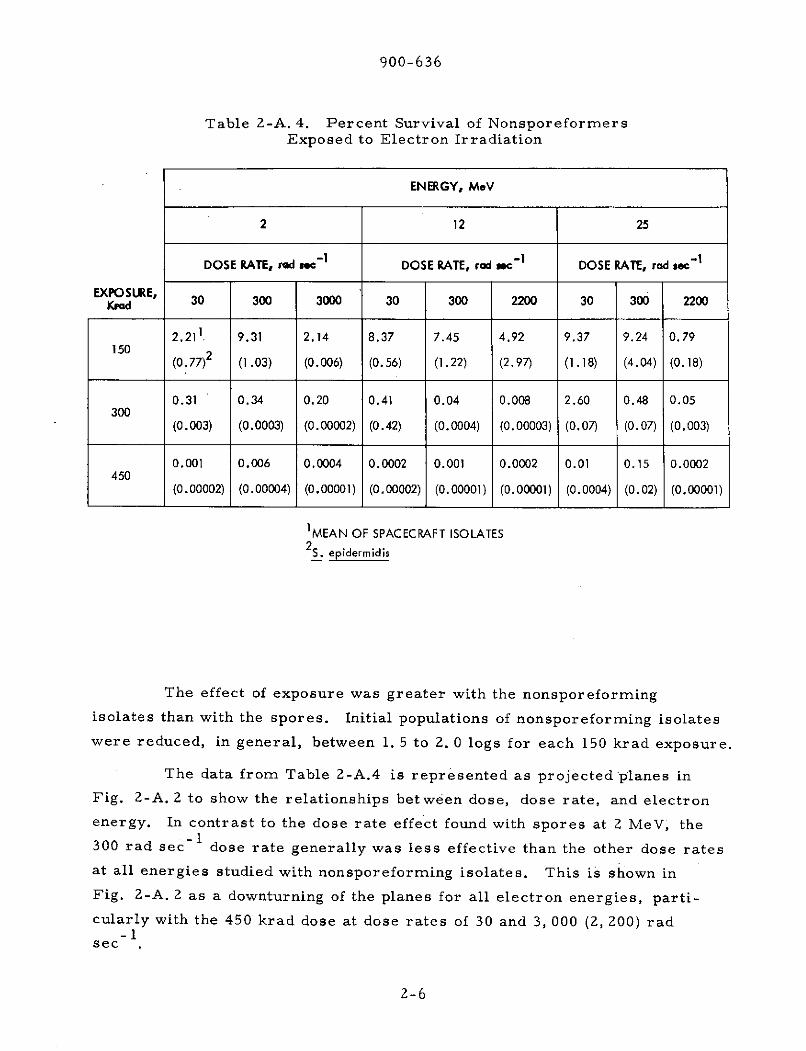
Table 2-A. 4. Percent Survival of NonsporeformersExposed to Electron Irradiation
ENERGY, MeV
2 12 25
DOSE RATE, red c-1 DOSE RATE, rod c- I DOSE RATE, rad sec-1
EXPOSURE,KEXPOSUREd 30 300 3000 30 300 2200 30 300 2200
2.211. 9.31 2.14 8.37 7.45 4.92 9.37 9.24 0.79150 (0.77)2 (1.03) (0.006) (0.56) (1.22) (2.97) (1.18) (4.04) (0.18)
0.31 0.34 0.20 0.41 0.04 0.008 2.60 0.48 0.05300
(0.003) (0.0003) (0.00002) (0.42) (0.0004) (0.00003) (0.07) (0.07) (0.003)
0.001 0.006 0.0004 0.0002 0.001 0.0002 0.01 0.15 0.0002450
(0.00002) (0.00004) (0.00001) (0.00002) (0.00001) (0.00001) (0.0004) (0.02) (0.00001)
1MEAN OF SPACECRAFT ISOLATESS. epidermidis
The effect of exposure was greater with the nonsporeforming
isolates than with the spores. Initial populations of nonsporeforming isolates
were reduced, in general, between 1. 5 to 2. O0 logs for each 150 krad exposure.
The data from Table 2-A.4 is represented as projected planes in
Fig. 2-A. 2 to show the relationships between dose, dose rate, and electron
energy. In contrast to the dose rate effect found with spores at 2 MeV, the-1
300 rad sec- 1 dose rate generally was less effective than the other dose rates
at all energies studied with nonsporeforming isolates. This is shown in
Fig. 2-A. 2 as a downturning of the planes for all electron energies, parti-
cularly with the 450 krad dose at dose rates of 30 and 3, 000 (2, 200) rad-1
sec
2-6
900-636
2 MeV 12 MeV 25 MeV
- 0.00001
0.1o, 0o. , o. i
0.001 z 0.00 ! 000
z 000
0.0000001 0.000000!
0.000000i
Fig. 2-A. 2. Effect of dose and dose rate at different electron energieson spacecraft nonsporeformer isolates
Also shown in Fig. 2-A. 2 is that with increasing dose and electron
energy smaller survival fractions of the nonsporeforming isolates resulted.
The results from 2 MeV proton irradiation of spores and nonspore-
formers are shown in Table 2-A. 5. Both spores and nonsporeformers reacted
in a similar manner to dose rate with the 2 MeV protons. At a constant dose
of 2, 700 krad the lower dose rates of 270 and 2, 700 rad sec were more
ma-l
effective than the highest dose rate studied, 108, 000 rad sec
The exposure, or dose, effect was different with spores and non-
sporeformers. The radiosensitivity of the spores increased as the exposure
increased with a constant dose rate of 2, 700 rad sec- With the nonspore-
formers the high dose, 13, 500 krad, was the most effective with a constant
dose rate of 2, 700 rad sec- 1. Percent survival with 1, 350 and 2, 700 kradwas approximately the same.
Fig. 2-A. 3 shows the response of bacterial spores to 2 MeV electron
electron and proton irradiation on a fluence basis. The comparative or-ganism, B. subtilis, was more sensitive than the spores of the space-
craft isolates to both types of irradiation at all fluences. Also, it appeared
2-72-7
900-636
Table 2-A. 5. Percent survival of Spacecraft IsolatesExposed to 2 MeV Proton Irradiation
-IDOSE RATE, rad sec
DOSE, krad 270 2700 108,000
17.8SPORES 1350 (12.3)
11.71 10.4 29.02700 (9.2)2 (9.4) (27.4)
4.313500(1.9)
0.0179NONSPOREFORMERS 1350 (0.0938)
0.00353 0.0361 3.542700 (0.0046)4 (0.0087) (0.125)
0.001513500 (0.0002)
1MEAN OF SPACECRAFT SPORE ISOLATES 3MEAN OF SPACECRAFT NONSPOREFORMER ISOLATES
2B. subtilis 4S. epidermidis
10 I II i I I I I I I I t
5 O 2 MeV ELECTRONS:B. subtilis
2 2 MeV ELECTRONS:SPACECRAFT ISOLATES
10- 1 - 2 MeV PROTONS:B, subtilis
5 - 2 MeV PROTONS:z SPACECRAFT ISOLATES
Z 202 -
2
103
to I I I I I I I I I I I l
5 1011 2 5 102 2, 5 1013 2 5 1014 2 5 1015
FLUENCE, cm-2
Fig. 2-A. 3. Response of bacterial spores to 2 MeVelectron and proton irradiation
2-8

900-636
that the proton irradiation may be more effective than electron irradiation but
additional work will have to be conducted before final conclusions can be12 -2
reached. A proton fluence of 1012 cm yielded survival fractions comparable12 -2 12 -2
to an electron fluence of 5 x 10 cm and a proton fluence of 5 x 1012 cm-2
resulted in survival fractions lower than the same electron fluence.
In summary, the results from electron irradiation tests at this time
indicate that energy and dose are the most effective parameters. The initial
populations of nonsporeformers were reduced at least 90 percent at all ener-
gies and doses studied. The spores were reduced at least 90 percent at 300
and 450 krad with 2 and 12 MeV energies and at 450 krad with 25 MeV. There
were also indications that dose rate could become an important parameter
under conditions of high exposures, or doses.
2. 1. 3 Future Activities
Future activities in these studies to determine the effect of planetary
trapped radiation belt on microorganisms will be to complete the 0. 6 MeV
electron tests; to investigate the effect of 12 and 25 hleV protons; to evaluate
the effect of secondary radiations on microbial survival; and, finally, to
analyze and model the radiation sensitivity of mnicrobial populations.
2-9

900-636
2. 2 EFFECT OF SOLAR WIND RADIATION ON MICROORGANISMS
2. 2. 1 Subtask B Introduction
The objective of this subtask is to determine the effect of solar
wind radiation on microorganisms associated with nonsterile spacecraft.
This study is directed towards determining the reduction in space-
craft associated microbial burden attributable to solar wind radiation.
The approach does not attempt a simulation of the total radiation
environment, but rather to examine the effect of low energy electrons and pro-
tons as a function of dose and energy. The data acquired would apply to all
missions.
2. 2. 2 Significant Accomplishments
Due to reprogramming of resources the level of effort on this task
had to be reduced. The study will be conducted in-house so that the schedule
can be adjusted in accordance with resources available. An experimental
setup has been designed and preliminary tests are underway to determine the
effect of 100 eV electrons on bacterial isolates.
2. 2. 3 Future Activities
Complete a preliminary experiment with 100 eV electrons. Conduct a
low energy electron study at three energies, exposures, and dose rates.
Design or locate an existing facility to conduct an analogous test program for
low energy protons.
2-10
900-636
2.3 EFFECT OF SPACE VACUUM ON MICROORGANISMS
2. 3. 1 Subtask C Introduction
This study was designed to examine the combined effects of space
vacuum and spacecraft temperatures on the survival of microorganisms.
Fourteen isolates were exposed to the test conditions. Nine of the isolates,
recovered from MM'71 spacecraft, were sporeformers while three isolates
were nonsporeformers. A sporeforming organism, Bacillus subtilis var.
niger, and a nonsporeforming organism, Staphylococcus epidermidis
ATCC 17917, were included in the tests for comparative purposes.
A vacuum exposure (10 - 8 torr) of the bacterial isolates to tempera-
tures of -40, 25, 40, and 55°C were conducted for 7, 14, 28, 56, and 187 days
to simulate the vacuum and temperature environment of a spacecraft during
typical mission to Mars.
This study has been reported in earlier reports and only the results
of the final analysis of the data is reported here.
2.3.2 Significant Accomplishments
2.3.2. 1 Experimental Conditions.
1. Microbiology. The test organisms, isolated from MM'71 space-
craft, were the same organisms that were used in the launch pressure profile
study and are presently being used in the space radiation study. The deriva-
tion, culture, and assay procedures for the isolates are described in
para 3.2.1.2 of the Annual Report (JPL Doc. No. 900-597, February, 1973).
2. Vacuum Equipment. Photographs, together with a description
of the test facility, are presented in para. 3.2. 1.2 of the Annual Report
(JPL Doc. No. 900-597, February, 1973).
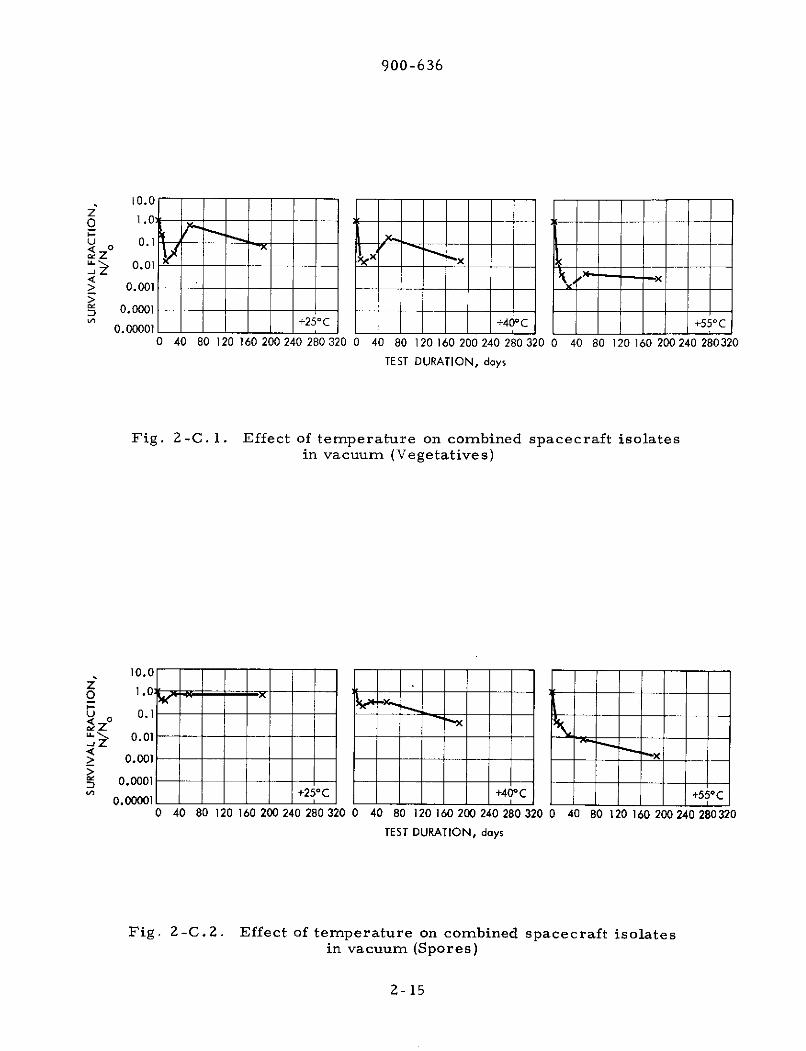
2.3.2.2 Results. The effects of temperature at 25, 40, and 55°C on the non-
sporeforming spacecraft isolates held in vacuum are shown in Fig. 2-C. 1.
Survival data from exposure to -40*C are not presented because survival
fractions were still greater than 0. 1 after the 187-day exposure.
2-11
900-636
There is a zone of uncertainty that with the nonsporeforming isolates
that occurred up to 56 days o- vacuum-temperature exposure and is represented
as troughs in the survivor curves for 25, 40, and 550 C. When the temperaturewas increased from 25°C to 55 0 C the trough effect lessened. The implication
is cell membrane injury with subsequent recovery, or repair, as the vacuum-
temperature exposure time is increased. However, this effect is overcome
with increased temperatures at 40 and 55*C, that are known to impair the cell's
membrane integrity.
The trough phenomenon occurred to a lesser extent with the spores
of spacecraft isolates, Fig. 2-C. 2. The trough effect occurred up to 28 daysonly at 25 and 40 0 C.
Temperature effect with vacuum exposure for nonsporeforming space-
craft isolates is shown in Fig. 2-C. 3. During 28 days vacuum exposure a slow
die-off of the cells occurred possibly as a result of desiccation, with or without,
combined temperature effect. A true temperature effect was manifested be-tween 40 and 550C. After 56- and 187-day exposures the temperature effect
was displaced to between 25 and 400C.
The effect of temperature on vacuum survival of spores of spacecraft
isolates is shown in Fig. 2-C. 4. It appeared that the critical temperature wasbetween 25 and 40 0 C and that the temperature effect occurred as early as 28days.
The combined effect of temperature and duration of vacuum exposureon nonsporeforming spacecraft isolates is shown in Fig. 2-C. 5. The trougheffect mentioned earlier was quite noticeable with the three dimensional plotand occurred to some extent at all temperatures up to 56 days. The least pro-nounced trough effect was observed at 55" C.
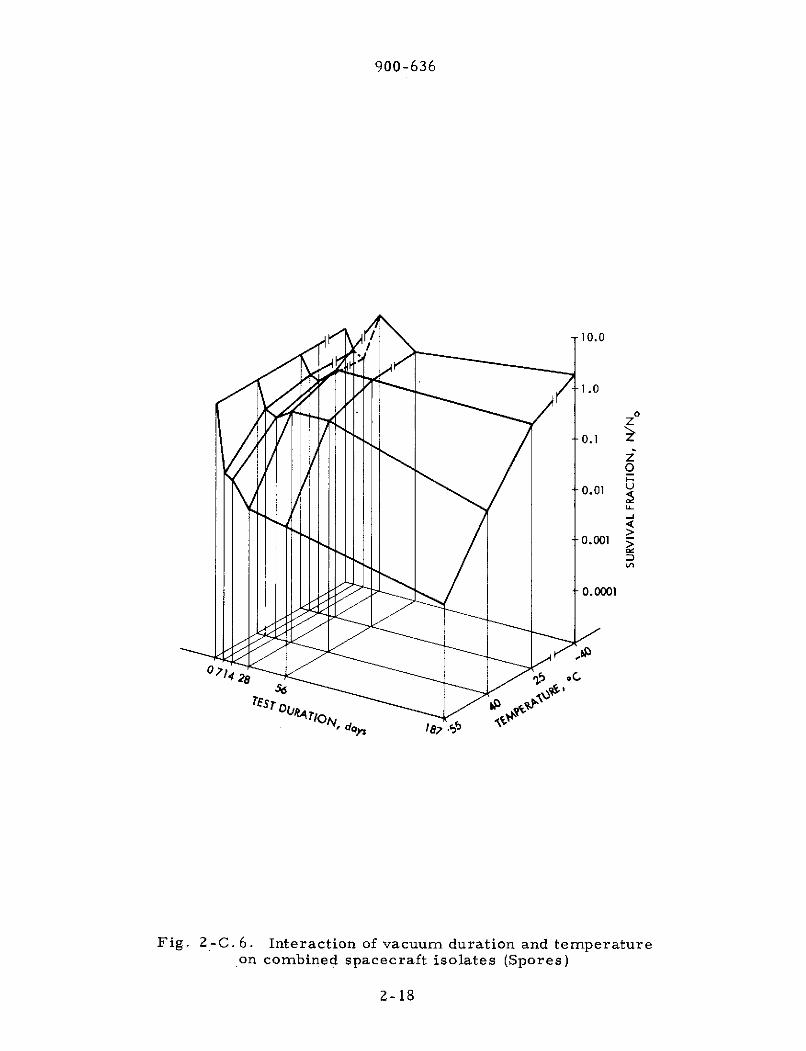
The combined effect of temperature and duration of vacuum exposureon spores of spacecraft isolates is shown in Fig. 2-C. 6. The trough effectoccurred between 14 and 28 days and was temperature dependent with no trougheffect occurring at 550 C and the greatest at -400 C.
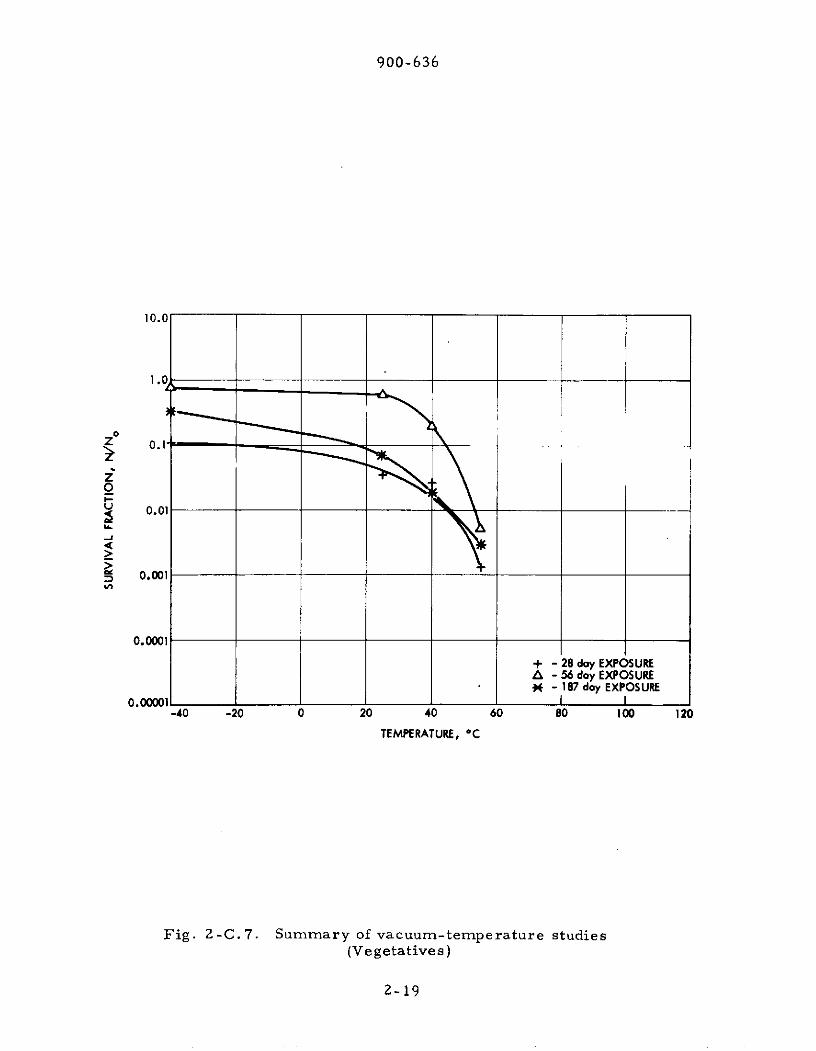
Figure 2-C. 7 summarizes survival data for temperatures of -40, 25,40, and 55 0 C with 28-, 56-, and 187-day vacuum exposures for nonsporeformingspacecraft isolates. Although a critical temperature effect between 25 and
2-12
900-636
40 C was not pronounced with the 28-day exposure, it was quite pronounced
with both the 56-day and 187-day vacuum exposures.
Summary data for spores of spacecraft isolates showing the
temperature effect as a function of vacuum exposure duration is presented in
Fig. 2-C.8. At the 28-, 56-, and 187-day vacuum exposures a temperature
effect became noticeable between 25 and 40 C with a pronounced effect
occurring between 40 and 550C.
In summary:
1) The effect of space vacuum in conjunction with normal operating
temperatures of spacecraft on the survival of spacecraft isolates
was found to be highly dependent upon the duration of vacuum
exposure, temperature, and the individual isolate;
2) Temperatures of -40 and 25*C did not effectively reduce initial
populations even after an 187-day exposure;
3) Temperatures of 40 and 55" C , while effective in reducing initial
populations, did permit survival after as long as an 187-day
exposure;
4) After an 187-day vacuum exposure survival fractions of space-
craft isolate spores were 1. 77, 0. 67, 0. 04, and 0. 002 with
temperatures of -40, 25, 40, and 55*C, respectively;
5) After an 187-day vacuum exposure, survival fractions of non-
sporeforming spacecraft isolates were 0. 33, 0. 07, 0. 02 and
0.003 for temperatures of -40, 25, 40, and 550C, respectively.
2. 3.3 Future Activities
Future activities of the vacuum temperature will be to initiate
studies to investigate the thermal vacuum resistance of naturally occurring
(uncultured) organisms. In addition, the fact that VO'75 spacecraft may ex-
perience higher temperatures for longer periods of time than MM'71 space-
craft may indicate the need for future studies of vacuum exposures with higher
temperatures than thos reported in the present study.
2-13

900-636
2.3.4 Presentations
Taylor, D. M., "Effect of Space Vacuum on Microorganisms, "
presented to the AIBS Planetary Quarantine Panel, Cocoa Beach, Florida,
April 26, 1973.
2-14
900-636
10.0z
I-
u 0.1 xx0
-000-> 0.001 x
0.00010.000+25 0 C +40 C +550 C
0 40 80 120 160 200 240 280 320 0 40 80 120 160 200 240 280 320 0 40 80 120 160 200 240 280320
TEST DURATION, days
Fig. 2-C. 1. Effect of temperature on combined spacecraft isolatesin vacuum (Vegetatives)
10.0
Z z .ot,_0.1------------- _--- --
S0.01> 0.001--
D 0.0001Ln +25 0 C +40+ C +55* C0.00001 -1-
0 40 80 120 160 200 240 280 320 0 40 80 120 160 200 240 280 320 0 40 80 120 160 200 240 280320
TEST DURATION, days
Fig. 2-C.2. Effect of temperature on combined spacecraft isolatesin vacuum (Spores)
2-15

900-636
10.0
S 1.0
Uo 0.1 :
- -.-
0.01> 0.001
0.0001 2 0.0001 28 days 56 days 187 days0.000018----
-40-20 0 20 40 60 80 100120-40-20 0 20 40 60 80 100120-40-20 0 20 40 60 80 100120
TEMPERATURE, oC
Fig. 2-C. 3. Effect of vacuum duration on combined spacecraft isolates(Vegetatives)
10.0
-. 0
_ 0.01--------.> 0.001
D 0.000120.00001 8 days 56 days 187 days
-40-20 0 20 40 60 80 100120 -40-20 0 20 40 60 80 100120 -40-20 0 20 40 60 80 100120
TEMPERATURE, -C
Fig. 2-C.4. Effect of vacuum duration on combined spacecraft isolates(Spores)
2-16

900-636
10.0
1.0
0.1
0
--0.01
-0.001
0.0001
TEST 1 Ot ,oc loys17
Fig. 2-C. 5. Interaction of vacuum duration and temperatureon combined spacecraft isolates (Vegetatives)
2-17
900-636
10.0
1.0
z
0.1
/o-0.01
--0.001
0.0001
do71 C,
Fig. 2-C.6. Interaction of vacuum duration and temperatureon combined spacecraft isolates (Spores)
2-18
900-636
10.0
1.0
zo
0.01
0.001
0.0001+ - 28 day EXPOSUREA - 56 day EXPOSURE0 - 187 day EXPOSURE
0.00001 I I-40 -20 0 20 40 60 80 100 120
TEMPERATURE, -C
Fig. 2-C.7. Summary of vacuum-temperature studies(Vegetatives)
2-19

900-636
10.0
Z 0.1
0I-
0.01u--.I
D 0.001
0.0001
+ - 28 day EXPOSUREA - 56 day EXPOSURE-0 - 187 day EXPOSURE
0.00001 I I-40 -20 0 20 40 60 80 100 120
TEMPERATURE, -C
Fig. 2-C.8. Summary of vacuum-temperature studies(Spores)
2-20

900-636
SECTION III
POST LAUNCH RECONTAMINATION STUDIES(NASA No. 193-58-62-03)
Contents Title and Related Personnel
Subtask A POST LAUNCH RECONTAMINATION STUDIESpara. 3.1
Cognizance: J. Barengoltz
AssociatePersonnel: C. Bauerle (Bionetics)
R. Gildersleeve (Bionetics)E. Robinson

900-636
3.1 POST LAUNCH RECONTAMINATION STUDIES
3. 1.1 Subtask A Introduction
The objective of this task is the development of an analytical
technique for the evaluation of the probability of the relocation of particles
from nonsterile to sterile areas on a spacecraft. The recontamination
process is important for all multiple missions with separate microbiological
burden allocations for various major spacecraft systems, and critical for life
detection experiments that risk contamination from nonsterile components.
The approach has been to study the effects of typical mission environ-
ments on the distribution of particles on spacecraft surfaces both analytically
and experimentally.
The analysis consists of three logical components, which have been
reflected in the effort: (1) particle adhesion, (2) dynamic release mechanisms,
and (3) particle transport. The effort in particle adhesion has been principally
a particle release experiment, together with analytical work and attempts to
correlate other data found in the literature and elsewhere. Under dynamic
release mechanisms, the modelling of meteroid impacts has continued. The
other important release mechanism during the spaceflight phase, pyro firings,
has been treated and reported earlier. The particle transport study is an
analytical effort which includes the development of codes for spacecraft
geometry and orientation, forces acting on released particles, and trajectory.
3.1.2 Significant Accomplishments
3.1.2.1 Particle Adhesion Force Study. The particle adhesion force study
has been addressed to the experimental verification of a previously reported
analytical model (Ref. 1). During the previous fiscal year a test facility was
designed and fabricated. A schematic of this facility is shown in Fig. 3-A. 1.
The preliminary results obtained in that period and the description of the
facility operation have been presented in Ref. 2. A test plan, also detailed
in Ref. 2, designed to provide data to verify or to modify the analytical model,
was inaugurated in the first half of the current fiscal year. As reported in
Ref. 3, the tests with closely-sized glass beads in vacuo have been completed.
3-1
9 00-636
VACUUM CHAMBERVACUUM GAUGE VACUUM TUBE PLATE
LOAD APPLICATION BOLT
HINGE POST
LOAD APPLICATION LEVER
CYLINDER
ACCELEROMETER
VACUUM PUMP
ACCELERATIONSIGNALCONDITIONING HYDRAULIC PUMPAND RECORDING
Fig. 3-A. 1. Particle adhesion experimental apparatus
During this reporting period the data has been analyzed and severalconclusions drawn. For a given particle size, retention was occasionallyobserved at an acceleration level greater than that where all the glass beadswere removed on other runs. This anomalous retention is attributed tovariability in surface conditions, although a standard cleaning procedure wasemployed. Due to this effect, the most one could extract from the data wasa conservative threshold acceleration for each particle size. An importantdependence on the relative humidity during the seeding operation was alsoobserved. Finally, the threshold was found to vary inversely as the particlediameter. This finding implies an adhesion force proportional to the particlesurface area.
3-2

900-636
A new empirical model which takes into account the conclusions
above has been devised:
a t (1 + RH) (1)
where at is the threshold acceleration for removal of particles of diameter D,
seeded at a relative humidity RH (%), and K is an empirical constant.
This model represents an extensive revision of the previous model
(Ref. 1). The previous model predicts two parameters, a characteristic
acceleration a and a characteristic transition parameter t. The latter
parmeter describes the sharpness of the transition from complete retention
of particles at low levels of acceleration to complete release at high levels.
As stated, the data cannot provide a value for this parameter. The prediction
for the characteristic acceleration a in units of kilo-gee (kG) is:O
-4- 2 X 10 (0.4 + 0.006 RH) (2)
o D 20 rD Pg
-3where p is the particle density (g im-3), D is the particle diameter (Rjm), g is
-2the acceleration due to gravity (980 cm sec ), and RH is the relative humidity
(percent) during release. Note that the new model, Equation 1, has the accel-
eration inversely proportional to the particle diameter. This dependence
provided a far superior fit to the data than one can be obtained with the old
model, Equation 2. Also the relative humidity parameter in the old model is
identically zero in vacuo, but the new model allows a dependence on the relative
humidity during seeding, which is not zero. The results of the data analysis
and the empirical fit are summarized in Table 3-A. 1. The empirical
constant K has been determined by the D = 44 [Lm data.
In an attempt to obtain improved particle adhesion data, a feasibility
study on the applicability of acoustic emission detection technology was con-
ducted. Acoustic emission detection exploits the fact that highly localized
transient phenomena in materials radiate stress waves. These low intensity
waves may be detected with piezo-electric transducers and large amplification
factors.
3-3

900-636
Table 3-A. 1. Particle Adhesion Test Results
Particle Relative Threshold Acceleration, kGDiameter, 1 im Humidity, % Exp. ModelExp. Model
20 48 8.0 5.0
44 48 2.9 2.9
63 23 0. 8 1.0
88 30 0.6 0.9
105 40 1.0 1.0
Electronic signal processing and interpretation yield information on the timeof the event and its size. In principle, the impacts of the small particlesreleased from a surface as the result of a simulated meteoroid impact shouldbe detectable by this technique.
The advantages offered by this new approach are:
1) Capability with realistic samples where optical counting is
difficult
2) A direct measurement of ejection velocity
3) A direct experimental verification with glass beads of the
combined particle adhesion and meteoroid impact models
4) A direct experimental link from meteoroid impact parameters
to released grains for real spacecraft materials and contaminants.
All of these capabilities arise from the real time nature of these measurements,in contrast to before and after optical data. Item 3), for example, has beenattempted elsewhere, but an actual optical count of the glass beads releasedis not feasible. Items 1) and 4) take advantage of the indifference of acousticemission detection to the optical properties of the particle to be detected. Aswill be shown in para. 3. 1. 2. 2, analysis has shown that the ejection velocity2) is an important parameter.
3-4

900-636
At this time all of the preliminary experiments have been
successful (Ref. 4). The results of the feasibility study indicate that particles
of the mass and velocity of interest may be detected. Signal processing to
directly display the number of impacts at low repetition rates and to infer the
number of particles (of known mass) in a cluster has been demonstrated. The
measurement of a crude velocity by clocking the interval from initial release
to particle impact on the detection plate has been accomplished. Other experi-
ments have provided information on accuracy and sensitivity.
3.1.2.2 Meteoroid Impact Study. The meteoroid impact study consists of a
series of analyses for different conditions and geometry to provide the accelera-
tion of struck surfaces and an experimental verification task. The code
development of the analyses due to Yang (Ref. 2) is still in progress and almost
complete. These new solutions for a thin plate and a semi-infinite solid call
for a Fourier transform treatment which proves to be unfeasible computation-
ally. JPL programming consultants have developed an alternate approach.
The code development for Yang's punctured plate analysis has been stopped
because an adequate alternative treatment is available. Because of the delays
in obtaining operational codes, simple classical analyses have been performed,
and the computer codes are complete. These codes treat the thin plate and the
semi-infinite solid cases.
A preliminary approach to the problem of relating the loading function
input of all the meteoroid analyses to the meteoroid impact parameters: mass,size, and velocity has been developed. Work is continuing in this area to
refine the approach. The computer programs have been exercised; however,
some results are presented in Figs. 3-A.2 and 3-A.3. In both figures the
maximum surface acceleration response due to the loading function correspond-
ing to a specified meteoroid impact is shown plotted against the distance from
the center of impact. The struck surface is 0. 125 inch aluminum plate.
Figure 3-A.2 is the result for a moderate impact, with an 0.8 Joule
kinetic energy and other parameters as shown. For impacts of this size and
smaller, the surface acceleration is significant (i.e., in the kilo-gee range)
only within distances of a few plate thicknesses. On analytical grounds, the
3-5

900-636
7 - IMPACT PARAMETERS
E = 0.8 JOULE
d = 271 ~m
6 P= 1.1 gcm 3
v = 11.8 km s- 1
55 m =1.15x 10-g
0Z-
< 4-
-j
u -EST THRESHOLD FOR401/m GLASS BEADS
U 3.
PER THICK PLATE SOLUTIONSCALED TO FIT THIN PLATE SOLUTIONAT R = 3X PLATE THICKNESS
LANGLEY"CLEARING RADIUS"1 -
0 I I I I0 0.1 0.2 0.3 0.4 0.5
R,DISTANCE FROM IMPACT, in.
Fig. 3-A.2. Meteoroid impact analysis results (case I)
12 I I
IMPACT PARAMETERS
10_ E = 8 JOULE
d = 587gm-3
P= 1.1 g cm-3
FROM THICK PLATE v = 11.8 km s- 1
8 OLUTION m = 1.15x 10 gALANGLEY
O I"CLEARING RADIUS"
6 -
4I EST THRESHOLD FOR40pm GLASS BEADS
0 1 2 3 4
R, DISTANCE FROM IMPACT, in.
Fig. 3-A.3. Meteoroid impact analysis results (case II)
3-6

900-636
response for such distances is better described by the semi-infinite solid
analysis. However, this program may produce an unnormalized result
because a real plate has a finite thickness. Thus the semi-infinite or thick
plate solution has been normalized to match the thin plate solution at a distance
of three plate thicknesses.
The case of a larger impact, 8 Joule kinetic energy, is shown in
Fig. 3-A. 3. For this case, the surface acceleration persists at significant
levels at much greater distances from impact. As in the other case, the
renormalized contribution from the semi-infinite solid solution is indicated
for small distances from the impact. The dashed line serves to indicate that
the oscillations in the plot are mostly artificial and due to approximations in
the analytical solution. Real materials are expected to produce a more damped
acceleration profile.
Finally, a 3 kilo-gee estimate for the threshold acceleration for the
removal of 40 1 m glass beads is indicated on both Fig. 3-A.2 and 3-A.3. This
value has been extracted from the particle release analysis described in the
previous para. 3. 1. 2. 1. The intersection of this estimate with the acceleration
response curve provides a gauge of the extent of the surface from which the
particles would be removed. This clearing radius, as the concept is commonly
known, is a most important parameter. The particular values of the meteoroid
parameters chosen were selected to match the values obtained experimentally
by a research group at Langley Research Center (LRC) (Ref. 5). LRC results
for the clearing radius with 40 jm glass beads are also shown. Although the
agreement between these experimental values and the results of this analysis
is fair, several problems render the comparison quite preliminary. Many
of the meteoroid parameters in the LRC experiment were not measured.
The cleanliness of the plates has been shown by the LRC group to be a critical
variable. Thus, the removal acceleration found in JPL tests may not be
relevant to LRC tests. Lastly, JPL analysis hinges on the relationship between
impact parameters and the loading function, where work is still in progress.
3.1.2.2 Particle Transport Analysis. During this reporting period of
1 Jan through 30 June 1973, the analysis of the forces acting on released
particles has progressed. Work has been centralized on the electrostatic
3-7
900-636
force, where the electric field due to the spacecraft-plasma system and the
electric charge on the particle (grain) are required. In parallel, the space-
craft geometry and orientation and the particle transport codes have been
integrated to an operational subprogram with dummy forces. Finally, this
subprogram has been exercised in some simple two-dimensional geometries
with the use of the one-dimensional electric field and the particle charging
routines that have been developed. Some insight into the sensitivity of the
recontamination process to physical parameters has been obtained.
The three-dimensional potential solution for an object moving
relative to a plasma is very difficult even in the simplest geometry, a uniform
conducting sphere. This situation, which has been solved implicitly by others,requires that the relative directed velocities (as opposed to the thermal, random
velocities) of all components of the plasma be equal. These conditions are
satisfied when all of the relative directed velocity is due to the object's motion.
In the case of interplanetary spaceflight in the solar wind plasma, however,the proton component has a directed velocity which dominates its relative
velocity, while the electron component by comparison is essentially at rest.
Finally, the photoelectric effect produces yet another plasma component
exactly at rest with respect to the spacecraft. Thus the potential problem is a
much more difficult one than a mere complicated geometry to be approximated
by known solutions for simple geometries.
The solution to the one-dimensional problem of a plate exposed to
solar illumination, electrons, and protons has been found in the literature
(Ref. 6 and 7). In this solution the positional dependence of the electric
potential in equilibrium was expressed implicity in terms of the surface
potential and the plasma parameters. An approximate explicit form for the
potential based on this work has been developed which provides an approximate
formula for the electric field as well. This analysis has been adapted into
a computer code and the results have been published (Ref. 8).
In order to obtain numerical values for the potential and the field, the
plasma parameters and the equilibrium surface potential are required. The
pertinent parameters of the solar wind plasma are available (Ref. 9). For the
photoelectron plasma, the typical experimental values obtained for ultra-clean
3-8

900-636
surfaces are expected to differ drastically from values corresponding to
realistic spacecraft surfaces. However, a detailed experiment for realistic
surfaces of several spacecraft materials has been reported by others. Finally,
the equilibrium surface potential for these materials has been determined with
the use of the parameters above and the requirement that the net current
becomes zero at equilibrium.
Following the authors of Ref. 6 and 7, two classes of solutions to the
problem were found, noted as monotonic and non-monotonic. However, the
quantity of interest here, the electric field in the vicinity of the plate, is
virtually the same for the two solutions. Some results for aluminum and silica
are shown in Fig. 3-A.4. The most striking feature of these results is a fall-
off of the field with distance at a far faster rate than the field for the case with
0.2
ALUMINUME
> NON-MONOTONIC
0.1
MONOTONIC
SILICA
NON-MONOTONIC
MONOTONIC
0 50 100 150 200
DISTANCE, cm
Fig. 3-A.4. One dimensional electric field
3-9

900-636
no photo-electric effect. The latter problem has an exact solution, a
decreasing exponential, with an e-folding distance equal to the Debye length.
For the solar wind plasma parameters, the Debye length is about 1200 cm.
In contrast, the e-folding distance, as determined by an exponential fit to the
results given in Fig. 3-A.4, is about 80 cm for aluminum and 200 cm for silica
in our analysis. Thus the effect of the photoelectrons is to dramatically reduce
the effective range of the electric field and to render the effective range of the
electric field material dependent.
The solution to the problem of particle or grain charging requires
many of the same considerations as the electric field problem. However, in
this case only the surface potential is of interest and the time dependent
solution for this quantity is needed. The surface potential may be related to
the total charge on the particle for a simple geometry (i.e., a sphere). Since
the particle is small compared to the relevant size parameters of the electric
field, it may be treated as a point charge in calculating the force acting on it.
However, because the particle is small, it will not equilibrate in a time that
is short compared to the period of its movement when released. Thus the
need for the time dependence arises.
Given the geometry of a particle and the potential-dependent currents
flowing into it, one may express the charging rate in an implicit form. For
the illuminated particle, these currents are a collimated proton current, an
isotropic electron current, and the photoelectric current due to a collimated
solar spectrum. For a spherical particle:
-9d _ 2.9 x 10 - 1 (3)d2d A + A + A (3)dt R2 p e + v
n vA= Po
p 4
n exp (e /kT) 0
A = - xe 4 [1 + 2eO/kTe] 4 > 0
A, = photoelectron flux, dependent on4
3-10

900-636
In this equation, the proton flux A depends on the number density np (m -3
and the directed velocity v (ms- ) and the electron flux A depends on the3 -1number density ne (m ), the mean thermal speed v(ms ) and the temperature
kT e (eV). The photoelectron flux A v is calculated numerically from the photo-
electric yield data (Ref. 10), for the solar spectrum, material of the surface,-2 -1
and current surface potential. With Ap, A e, and A in units of m s , the
particle diameter d in m and the heliocentric distance R in AU, one obtains
d /dt in Vs -. Results of this calculation are shown in Fig. 3-A. 5 for
aluminum, silica, and graphite. The equilibrium surface potential may be
inferred by the requirement that d /dt is zero at equilibrium. These values
are also given in Fig. 3-A. 5.
50 1 1 1 1 1 1 1 1 1 1 1 1
45 - EQUILIBRIUM POTENTIAL IN SUN
ALUMINUM 9.4V20 - GRAPHITE 0.9 V
SILICA 4.7 V
1-
ALUMINUM0
Zo 10 -
- SILICAU
5 GRAPHITE
0
-2.5 I I I l l-14 -12 -10 -8 -6 -4 -2 0 2 4 6 8 10 12 14
POTENTIAL 4, V
Fig. 3-A. 5. Grain charging in sunlight
3-11

900-636
The particle in the shade (of the spacecraft) may be calculated in an
analogous manner. Here, to a first approximation, A = A = 0 and A isp V e
unchanged from Equation 3. However, the resulting expression for d /dt would
not equilibrate. The particle would continue to charge more negatively
forever, with d/dt tending to zero as 4 tended to -co . In reality, other effects,
such as thermionic emission, field emission, secondary emission and the
accretion of protons attracted into the shade, would act to limit the potential
at approximately -3 kTe/e. The effort is continuing in this area, but at present
the consideration of a reasonable model for A in the shade appears to provide
the necessary balance.
With the addition of the solar radiation pressure to the electrostatic
force based on the preceding discussion, the trajectory of a grain in some
simple but important geometries may be calculated. The results for the two
simplest cases considered are shown in Fig. 3-A.6. In the one-dimensional
L -SUNLIGHT AT R = 1 AU
GRAIN
GRAIN INITIAL VELOCITY = V 0
90>0 GRAIN INITIAL POTENTIAL = 0
D V0 LPARTICLE DIAMETER, NORMAL VELOCITY, TURNAROUND,
_m m/sec m
CASE ISUNLIGHT 10- 100 0 CD
0 = 12 V
CASE IINO SUNLIGHT 20 0.08 D
0 = 6 V 20 0.05 3.6
20 0.02 1.0
80 0.02 6.0
100 0.02 C
20 0.01 0.4
100 0.01 1.7
Fig. 3-A.6. Particle trajectory calculations
3-12
900-636
problem of an aluminum plate with a +12 V surface potential under normal
illumination, a particle is displaced from the surface with a normal velocity
v and an initial potential o , equal to +12 V. Although the electrostatic force
acts always to repel the particle from the plate, the solar radiation force
acting on it tends to push it back toward the plate. At some distance from the
plate, the electrostatic force will have decreased due to the reduction of the
field (see Fig. 3-A.4) so that it just balances the solar radiation force, which
is proportional to D2 , where D is the particle diameter. However, the most
interesting parameter, the turnaround distance where the velocity is zero,
will occur at an even greater distance. The turnaround distance will be
significantly larger than 4 m for all values of diameter considered, even with
v0 equal to zero. In terms of the two-dimensional problem, a released particle
will migrate parallel to the surface with a constant speed given by its original
component parallel to the surface, while it also moves normally to the surface
as discussed above. A consideration of the period of the trajectory shows that
the lateral displacement would be very large even for a very modest parallel
velocity component. Thus the particle cannot, in the practical sense, return
to the spacecraft.
In the second case shown in Fig. 3-A.6, the particle and the aluminum
plate are in the shade, but the plate has a positive potential of 6 V. This
situation would occur if the plate were connected electrically to another metal
surface which was itself illuminated. In this case the displaced particle is
initially repelled by the electrostatic force but eventually discharges. At the
point where the particle has assumed a negative potential, it is attracted back
toward the plate. However, the electric field decreases farther from the plate,
and the attractive force may be very small. As in the previous case, there-
fore, a finite theoretical turnaround distance still may be defined, beyond the
point where the particle obtains zero net charge. Examples where turnaround
occurs beyond 10 m are labeled as co.
The most important result of these considerations is the emergence
of the particle ejection velocity as a critical parameter. Note, for example,-1that a 20 pm particle will escape if its ejection velocity exceeds 0.08 m s-
-1but will return for v = 0.05 ms and will return sooner for v = 0.02 ms-.
3-13

900-636
This effect also depends on particle size. A larger particle has a smaller-1
escape velocity. Thus a 100 pm particle will escape at v = 0.02 ms but not-I
at v = 0.01 ms . All of the values presented in Fig. 3-A.6 are based on-3
glass spheres, with a density of 2400 kg m .
3. 1.3 Future Activities
Work remains to be accomplished in each of the major areas of this
task. Under particle adhesion, the particle release apparatus is currently
being modified to employ acoustic emission detectors. Plans are formulated
to repeat some of the glass bead experiments to verify the accuracy of this
approach and to obtain velocity measurements. Then experiments will be
conducted with realistic samples (dust with a known size distribution). If
resources permit and a hypervelocity gun is available, a complete experiment,
as shown in the schematic Fig. 3-A.7, will be conducted. Such an experiment
would provide a direct verification of the combination of the particle adhesion
and meteoroid impact models, including the loading function. In terms of the
task, a direct connection between meteoroid impact parameters and the number
and velocity of particles released would be made.
PLATE WITH BURDENVACUUM CHAMBER /
O NTER DISPLAY -- NUMBER
GUN
STORAGESCOPE VELOCITY
ACOUSTICEMISSIONDETECTOR
TAPERECORDER
Fig. 3-A. 7. Conceptual schematic for acoustic emissionapplication to particle release
3-14
900-636
In the meteoroid impact analysis, the development of an appropriate
loading function in terms of the meteoroid impact parameters will be
completed. In addition, the computer coding of the new improved impact
analyses will be accomplished. Analysis will be conducted to extract the
relevant results in a more direct manner suitable for a complete program.
The development of a three-dimensional electric field is the goal in
the particle transport analysis. This effort will involve calculations for the
spacecraft wake region. In connection with this work, a charging model forthe particle in the shade, in or out of the wake, will be fashioned.
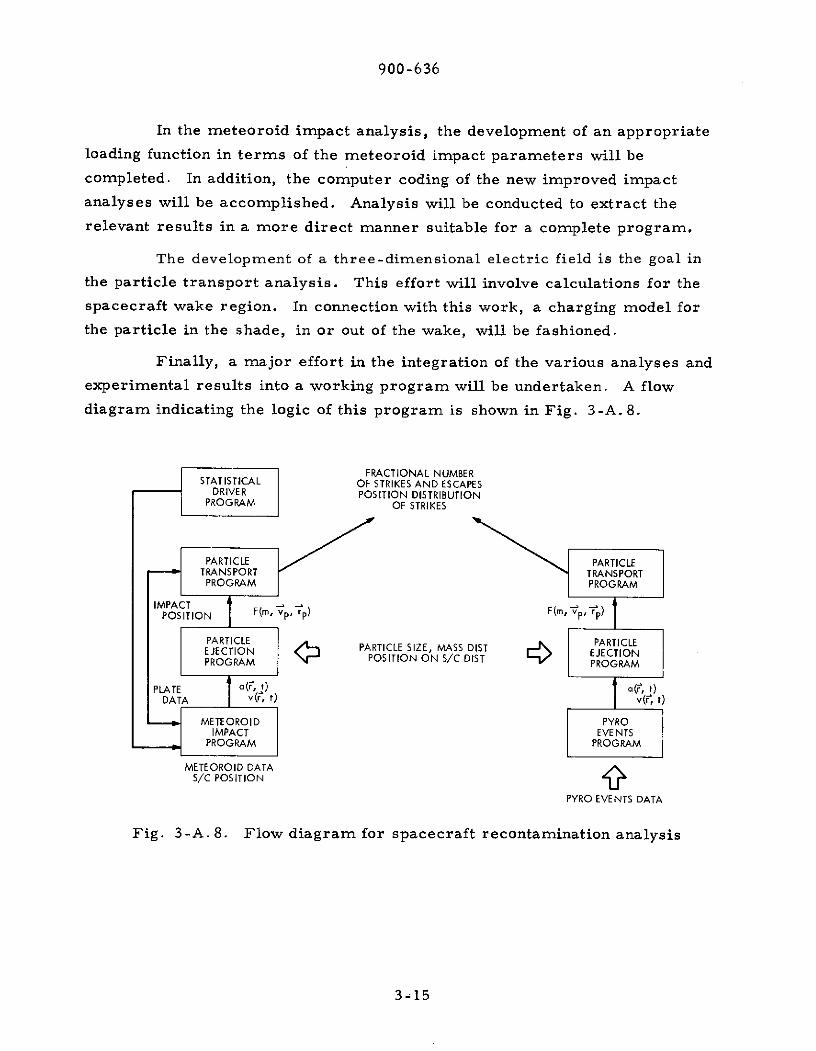
Finally, a major effort in the integration of the various analyses andexperimental results into a working program will be undertaken. A flowdiagram indicating the logic of this program is shown in Fig. 3-A. 8.
FRACTIONAL NUMBERSTATISTICAL OF STRIKES AND ESCAPES
DRIVER POSITION DISTRIBUTIONPROGRAM OF STRIKES
PARTICLE PARTICLETRANSPORT TRANSPORT
PROGRAM PROGRAM
IMPACT ) F(m -p,,p)
POSITION F(m, vrp) F(m,
PARTICLE PARTICLEEJECTION PARTICLE SIZE, MASS DIST EJECTIONPROGRAM POSITION ON S/C DIST PROGRAM
PLATE a(r, t)
ia(f, t)
METEOROID PYROIMPACT EVENTS
S PROGRAM PROGRAM
METEOROID DATAS/C POSITION
PYRO EVENTS DATA
Fig. 3-A. 8. Flow diagram for spacecraft recontamination analysis
3-15
900-636
3.1.4 Presentations
Barengoltz, J., "Post Launch Recontamination Studies, " presented
at NASA Spacecraft Sterilization Technology Seminar, Denver, Colorado,
July, 1973.
3. 1. 5 Publications
Barengoltz, J. and Bauerle, C., "The Electric Field in the Vicinity
of a Photo-Emitting Plate in a Plasma, " JPL Quarterly Technical Review,Vol. 3, No. 1, p. 26, April, 1973.
3. 1. 6 References
1. Haudenschild, C., "Mathematical Model of Particle Adhesion Forceto Surfaces, " JPL IOM, 9 March 1971.
2. Planetary Quarantine Annual Review, Space Technology and Research,July 1971 - July 1972, JPL Document 900-597, February, 1973.
3. Planetary Quarantine Semi-Annual Review, Space Research andTechnology, July 1972 - December 1972, JPL Document 900-608, 1973.
4. Robinson, E., "Application of Acoustic Emission to MicroparticleImpact Methods, " JPL IOM 13 June, 1973.
5. Humes, D. H., et al., private communication.
6. Fu, J. H. M., "Surface Potential of a Photo-Emitting Plate, "J. Geophys. Res., Vol. 76, No. 10, 1971.
7. Guernsey, R. L., and Fu, J. H. M., "Potential Distribution Surroundinga Photo-Emitting Plate in a Dilute Plasma, " J. Geophys. Res., Vol 75,No. 16, 1970.
8. Barengoltz, J., and Baurle, C., "The Electric Field in the Vicinity ofa Photo-Emitting Plate in a Plasma, " JPL Quarterly Technical Review,Vol. 3, No. 1, April, 1973.
9. Divine, N., "Summary of Solar Wind Properties, " JPL IOM 2947-71-151,21 December 1971.
10. Feuerbacher, B., and Fitton, B., "Experimental Investigation ofPhotoemission from Satellite Surface Materials, " J. Appl. Phys.,Vol. 43, 1972.
'3-16

900-636
SECTION IV
SPACECRAFT CLEANING AND DECONTAMINATION TECHNIQUES(NASA No. 193-58-63-02)
Contents Title and Related Personnel
Subtask A PHYSICAL REMOVAL OF SPACECRAFTpara. 4-1 MICROBIAL BURDEN
Cognizance: H. W. Schneider
AssociatePersonnel: E. Roos (Bionetics)
Subtask B EVALUATION OF PLASMA CLEANINGpara. 4-2 AND DECONTAMINATION TECHNIQUES
Cognizance: D. M. Taylor
AssociatePersonnel: R. L. Olson (Boeing)
S. J. Fraizer (Boeing)R. B. Gillette (Boeing)

900-636
4.1 PHYSICAL REMOVAL OF SPACECRAFT MICROBIAL BURDEN
4. 1. 1 Subtask A Introduction
Present planetary quarantine constraints for flyby and orbiter vehicles
require maintaining the microbial burden on the spacecraft below a certain
critical level. State-of-the-art clean room facilities and contamination control
techniques do not assure that this critical level can be maintained throughout
necessary assembly and test operations.
Previous activities under this task concentrated on the study of
vacuum cleaning techniques with and without the aid of a brush. These
techniques are the primary methods applied in present spacecraft operations.
A test device was developed that allowed for the simulation and evaluation of
typical techniques and surface conditions under controllable and repeatable test
conditions. As described in detail in JPL Document 900-597, the following
major problems were identified:
1) Brushes efficiently detach particles of the smallest detectable
size (2-3 lim) but entrainment into the flow is extremely poor.
The flow resistance across the bristle is very high, and flow
velocities near the surface are too low to accomplish entrainment
and transport of the detached particles. Consequently, the
bristles quickly become saturated with particles and the brush
becomes a particle source rather than a cleaning tool. To avoid
this, frequent cleaning, and/or perhaps, if use requires, biological
decontamination of the brushes during or between uses is strongly
recommended.
2) Vacuum flow alone (without the aid of a brush) efficiently detaches
and removes particles larger than 10 p.m size if 1) the surface is
dry; 2) flow velocities are near critical (choked flow) and 3) nozzle
stand-off distance from the surface is approximately 150-200 pm.
The removal efficiency drops off sharply at larger stand-off
distances. The cleaning of moist and fingerprinted surfaces is
very inefficient under any of the conditions tested.
4-1

900-636
Since, at choked flow conditions, the removal capability of vacuum
flow is exhausted, the only means to further increase the detachment force or
to increase the usable standoff from the surface was to increase the flow
density. To accomplish this the pressure of the expansion source had to be
raised. The effort during the reporting period concentrated on the evaluation of
blow-vacuum techniques where particle detachment is accomplished by means
of jet expansion from a pressure source (at higher than atmospheric pressure).
In this case the vacuum flow only has the function of removing detached
particles from the area. The results obtained and the conclusions drawn from
these latter studies are covered and discussed in this report.
4.1.2 Approach
The application of the jet-blow in addition to vacuum flow has
introduced a large number of possible variables. These variables selected
for evaluation included the blow-pressure, the blow angle, and typical working
pattern such as spot-blow, sweeping with and against the flow, as well as
repeated sweeping over the same area. The parameters of the vacuum flow
were kept constant. It was assumed that an existing facility system would be
used to provide a low pressure/large volume flow sufficient to accomplish the
removal of the detached particulates.
4. 1.2.1 Experimental Techniques. As in previous studies, 5 cm x 5 cm
(2 x 2) optical glass slides were used seeded with test particles. The slides
were cleaned prior to seeding with freon TF followed by a wipe with isopropyl
alcohol. Typical abnormal surface conditions, such as oiliness and moisture,were simulated by fingerprinting the samples prior to seeding, and by placing
a seeded sample into a refrigerator for 15 minutes. The latter technique would
induce a temporary fogging when the slides were returned to the room environ-
ment (25-28'C, 45 percent - 55 percent RH).
Glass beads were chosen as the primary test material for evaluating
and comparing the effectiveness of different techniques. Two size groups were
tested which ranged between 0-5 and 5-10 1 m. Figure 4-A. 1 shows the size
distributions found on seeded samples prior to testing. The beads were dried
and shaken prior to testing using the earlier described dip-and-tap method for
4-2

900-636
80-0-5pm BATCH 5-10 pm BATCH
60 - -
O0
40
20-
C I I ! I2 4 6 2 4 6 8 10
DIAMETER,pm
Fig. 4-A.1. Typical size distribution of glass beads used for test
seeding until an initial concentration of approximately 1000 particles per mm
was obtained. Counts of all particles > 3 im were taken from a 0.25 mm2
area in the center of the sample prior to and after each test.
It is well known from literature and from previous tests that the surface
adhesion characteristics of glass beads are different from those of dust. A
small number of selected tests were conducted with dust for comparison before
drawing final conclusions. In this case the samples were seeded by placing
them for a number of days in an undisturbed office area until a concentration
on the order of 10-15 particles per mm 2 was collected. Counts and size
determinations were made from a 5 x 1 mm 2 area in the center of the samples
prior to and after each test with dust by measuring the largest dimension
(Peret's diameter) normal to the flow. Typical surface conditions were sim-
ulated as described above for glass beads.
4.1.2.2 Test Apparatus. The test apparatus is shown in Fig. 4-A.2. It is
the same device used in previous studies but modified to accommodate a blow
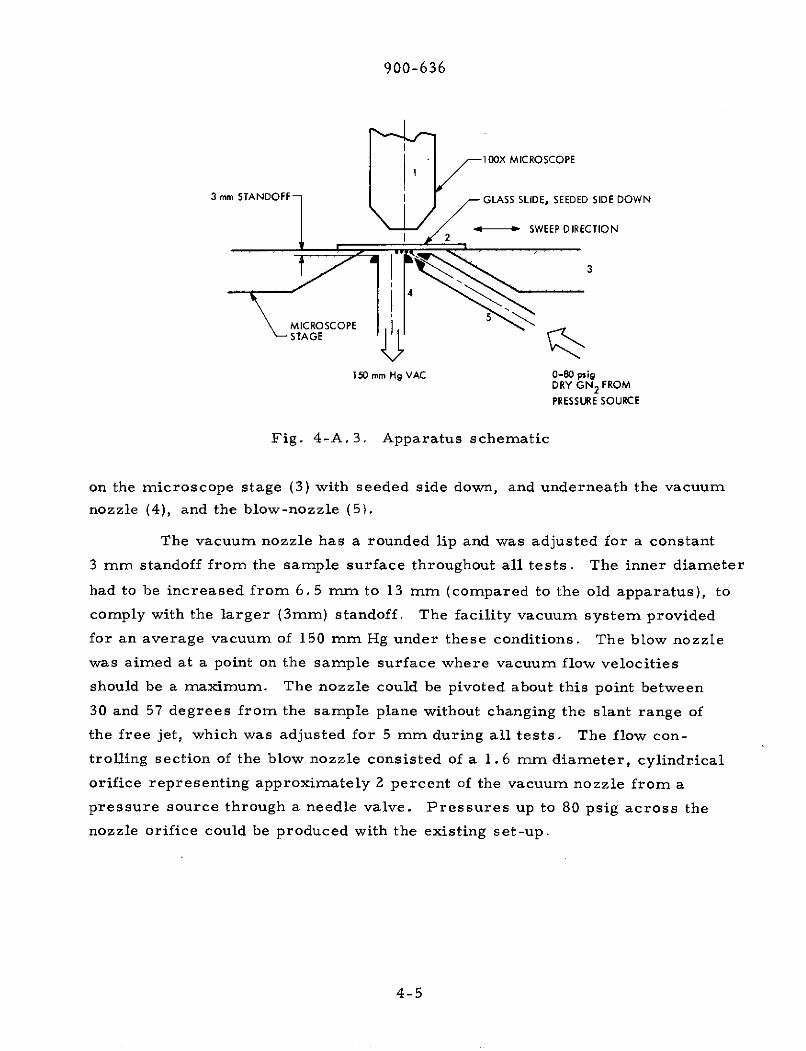
nozzle. Figure 4-A. 3 shows the schematic of the device seen in the photo,Fig. 4-A.2. On top is the 100X microscope (1); the sample slide (2) is placed
4-3

900-6
36:":ii~~ I~ail.I
'"';:~eb~I
I F
I*1
-
U
3.1"
-c: 3
U
U
02
402
cd
lbfi
-4NI
4-4I
900-636
100X MICROSCOPE
3 mm STANDOFF- I GLASS SLIDE, SEEDED SIDE DOWN
SWEEP DIRECTION
MICROSCOPESTAGE
150 mm Hg VAC 0-80 psigDRY GN 2 FROMPRESSURE SOURCE
Fig. 4-A.3. Apparatus schematic
on the microscope stage (3) with seeded side down, and underneath the vacuum
nozzle (4), and the blow-nozzle (5).
The vacuum nozzle has a rounded lip and was adjusted for a constant
3 mm standoff from the sample surface throughout all tests. The inner diameter
had to be increased from 6.5 mm to 13 mm (compared to the old apparatus), to
comply with the larger (3mm) standoff. The facility vacuum system provided
for an average vacuum of 150 mm Hg under these conditions. The blow nozzle
was aimed at a point on the sample surface where vacuum flow velocities
should be a maximum. The nozzle could be pivoted about this point between
30 and 57 degrees from the sample plane without changing the slant range of
the free jet, which was adjusted for 5 mm during all tests. The flow con-
trolling section of the blow nozzle consisted of a 1.6 mm diameter, cylindrical
orifice representing approximately 2 percent of the vacuum nozzle from a
pressure source through a needle valve. Pressures up to 80 psig across the
nozzle orifice could be produced with the existing set-up.
4-5
900-636
4. 1.3 Significant Accomplishments
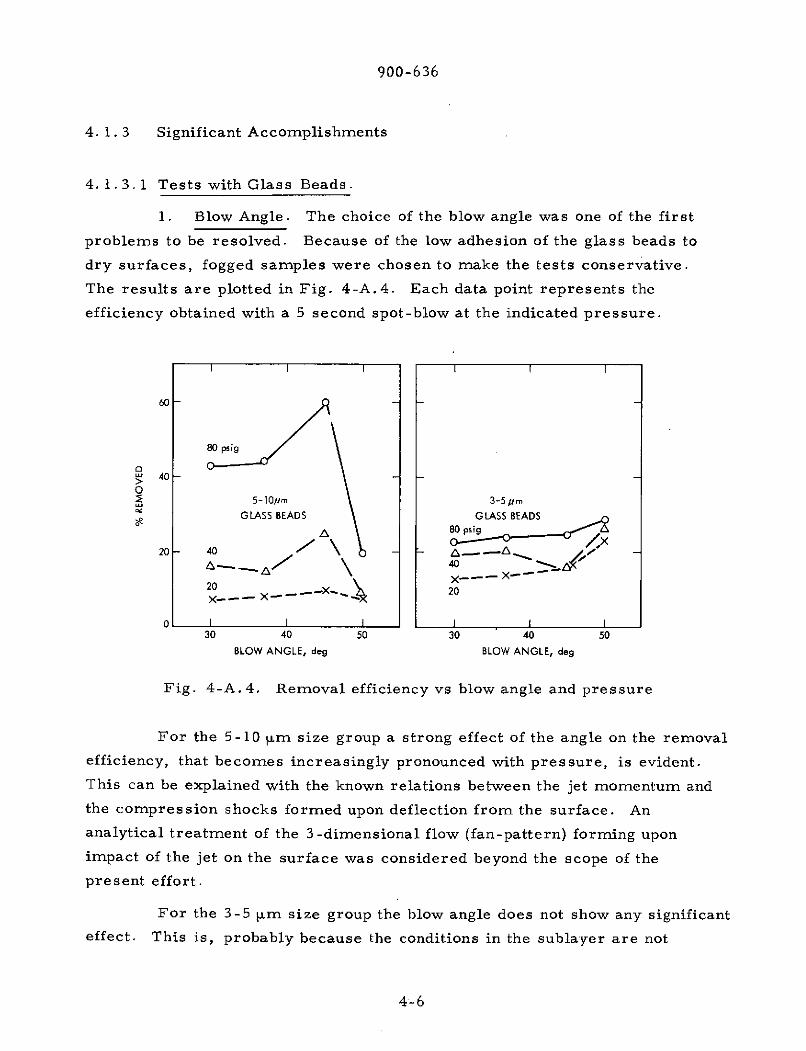
4.1.3. 1 Tests with Glass Beads.
1. Blow Angle. The choice of the blow angle was one of the first
problems to be resolved. Because of the low adhesion of the glass beads to
dry surfaces, fogged samples were chosen to make the tests conservative.
The results are plotted in Fig. 4-A.4. Each data point represents the
efficiency obtained with a 5 second spot-blow at the indicated pressure.
I I I I
60
80 psig
404o
5-10pm 3-5 pmGLASS BEADS GLASS BEADS
2 80 psig
20- 40
-20- X X 20
0 I I I I . I
30 40 50 30 40 50
BLOW ANGLE, deg BLOW ANGLE, deg
Fig. 4-A.4. Removal efficiency vs blow angle and pressure
For the 5-10 1 m size group a strong effect of the angle on the removal
efficiency, that becomes increasingly pronounced with pressure, is evident.
This can be explained with the known relations between the jet momentum and
the compression shocks formed upon deflection from the surface. An
analytical treatment of the 3-dimensional flow (fan-pattern) forming upon
impact of the jet on the surface was considered beyond the scope of the
present effort.
For the 3-5 pm size group the blow angle does not show any significant
effect. This is, probably because the conditions in the sublayer are not
4-6
900-636
effected by the aerodynamics of the main jet. Since the removal of particles> 5 microns was of primary interest, it was concluded that all follow-on tests
should be conducted at a 45 degree angle. As described in para. 4. 1. 3.1,
sub-para. 5, this also appeared to be the best choice from the reentrainment
standpoint.
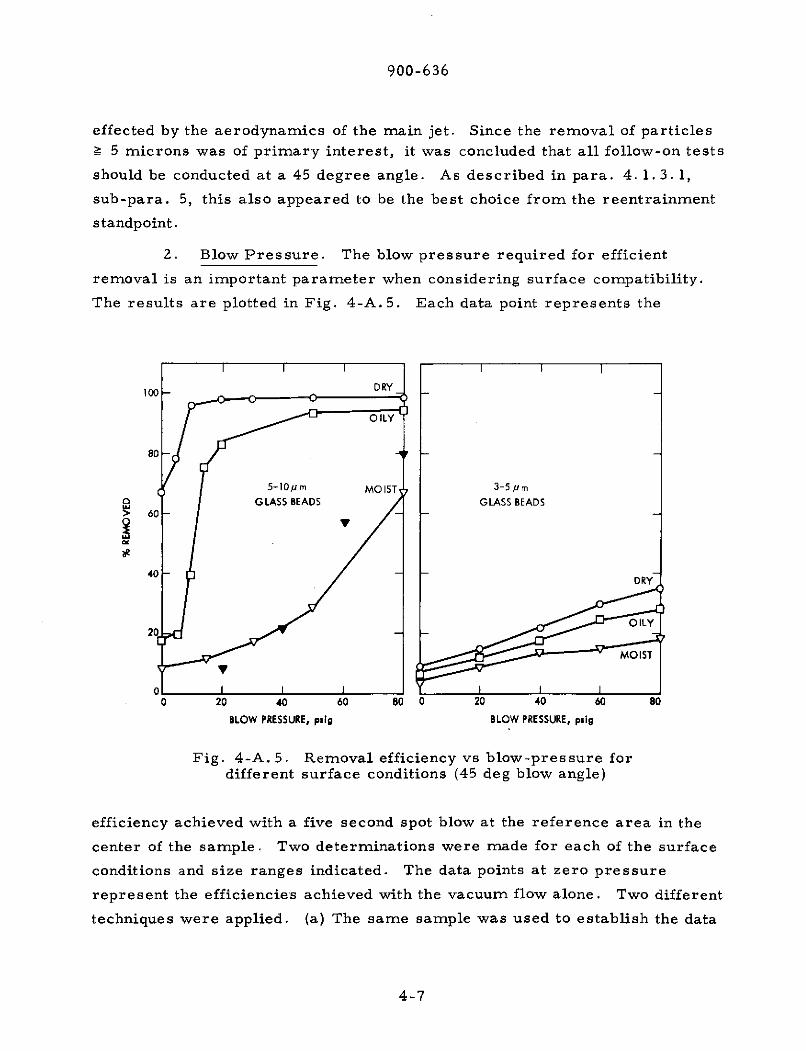
2. Blow Pressure. The blow pressure required for efficient
removal is an important parameter when considering surface compatibility.
The results are plotted in Fig. 4-A.5. Each data point represents the
Ill ll
DRY
OILY
80---
5-l10m MOIST 3-5 mGLASS BEADS GLASS BEADS
> 60 -
i IV
40 - DR
O ILY20 -
MOIST
0 20 40 60 80 0 20 40 60 80
BLOW PRESSURE, psig BLOW PRESSURE, psig
Fig. 4-A. 5. Removal efficiency vs blow-pressure fordifferent surface conditions (45 deg blow angle)
efficiency achieved with a five second spot blow at the reference area in the
center of the sample. Two determinations were made for each of the surface
conditions and size ranges indicated. The data points at zero pressure
represent the efficiencies achieved with the vacuum flow alone. Two different
techniques were applied. (a) The same sample was used to establish the data
4-7

900-636
points, indicated by the curves connecting the open symbols (o, A, o ) with
each other. (b) A completely new sample was used for each data point
(blowing each sample only one time). These data are represented by the
solid symbols. This latter method was mainly applied for a comparison of
time effects and a possible deterioration of the removal capability at higher
pressures.
For the 5-10 pm size group a considerable improvement of the removal
capability over vacuum flow alone is evident, particularly if the surface is wet
or oily. On the dry surface almost all of the particulates were removed at the
critical expansion pressure (15 psig). For the blow-cleaning of oily surfaces,
pressures of approximately 50 psig would have to be applied to achieve maxi-
mum efficiency. Smaller pressures on the order of 15 psig, however, would
already affect a strong increase of the efficiency, if compared to vacuum flow
alone. The removal capability improves drastically with blow pressure on a
moist surface, but the pressures required are high ( > 80 psig).
For 3-5 m glass beads, the blowing at the surface does not seem to
efficiently remove particles under any of the conditions tested.
3. Sweep Pattern. Under practical conditions a relative motion
between the cleaning apparatus and the sample will be involved. Fig. 4-A. 6
shows the results of a series of tests where typical motions were simulated
as they are likely to occur during actual cleaning operations. A separate
sample was used for eath test. Two determinations were made per data point.
A fogged surface was chosen to make the test conservative, because glass
beads on such a surface are more difficult to remove than on dry or oily
surfaces.
The criterion for evaluation, plotted as the ordinate, represents the
efficiency gained by use of the sweeping pattern related to the efficiency
achieved with vacuum flow alone. The high gain factors achieved, in some
cases, result from the small efficiency achieved with vacuum alone (see
Fig. 4-A.5). Each size group shown represents a typical motion applied,
such as a five second spot blow, a 1 cm sweep against, and with the flow; and a
1 cm double sweep starting against and with the flow as indicated by arrows on
4-8

900-636
Fig. 4-A.6. The sweeping motion was manually controlled, advancing at a
rate of approximately 0. 5 cm per second in either direction. The bars within
each group represent the blow pressures applied.
5-10/pm GLASS BEADS ON MOIST SURFACE80 psig 45 deg BLOW ANGLE
U
10
O
z 80
S4040-U 404
40 80
S20 2020
SPOT --- SAMPLEBLOW MOTION
DIRECTIONOF FLOW
Fig. 4-A. 6. Efficiency gain vs sweep pattern
At the high pressures (80 psig) the spot blow is most efficient, because
the time exposure of the reference area is reduced by a factor of ten or more.
For the two lower pressures tested (20 and 40 psig) time exposure does not
seem to be a factor, but the direction of the sweep has a strong influence for
all pressures tested. It is quite obvious that sweeping against flow is best.
Except for the high pressure, a double stroke that ends with an upstream
stroke is better than one that ends with a downstream motion. As could be
observed under the microscope, recontaminating effects (particle migration
without detachment) during the downstream motion are responsible for this.
In conclusion: (a) sweeping against the flow should be the preferred
method, (b) single or multiple double-strokes should start and always end with
an upstream sweep.
4-9

900-636
4. Repeated Cleaning. Another consideration is the gain to be
expected by repeated sweeping over the same area. To establish this, tests
were conducted on six separate samples seeded with 3-5 and 5-10 pm glass
beads, using double strokes ending upstream. A moist surface was chosen
for more indicative results. Counts were taken prior to and after each test.
The results are plotted in Fig. 4-A.7. The criterion for evaluation
here is the efficiency gain over that achieved during the first stroke. A strong
improvement that becomes increasingly pronounced with pressure is evident.
It appears, however, that the gradient tends to level off after a few strokes.
At the lower pressure (20 psig) the smaller size group shows more poten-
tial for improvement than the larger one, because, as can be seen from Fig.
4-A. 5, the efficiencies at this pressure are relatively small on a
moistened surface.
This suggests that a zig-zag motion advancing laterally approximately
1/10 of the working width of a cleaning tool would be the technique to fully
utilize the maximum removal capability of the concept. This does not neces-
sarily mean that it is meaningful to do so. As we have seen earlier, nearly
100 percent removal could be achieved on a dry surface with one stroke only.
In this case a repeated cleaning would not improve the situation but, in contrast,would only introduce recontamination hazards.
5. Entrainment. Flow tests were conducted with smoke injected
upstream of the vacuum nozzle from various directions. Taft probes placed
into the throat of the vacuum nozzle indicated that, at shallow angles below
40 degrees, and at pressures above 15 psig, the blow-jet would penetrate and
reverse the vacuum flow at the far side of the vacuum nozzle. At steep angles
above 50 degrees, the blow jet would fan out broadly and blow past the vacuum
nozzle in all directions. Best conditions appeared to exist about a 45 degree
angle.
To establish the amount of particulate matter detached but not
removed, a second clean sample slide was placed underneath the test sample
at a distance of 2 cm. In this poisition the sample slide restricting the flow
into the vacuum nozzle should catch most of the particulates not entrained.
4-10
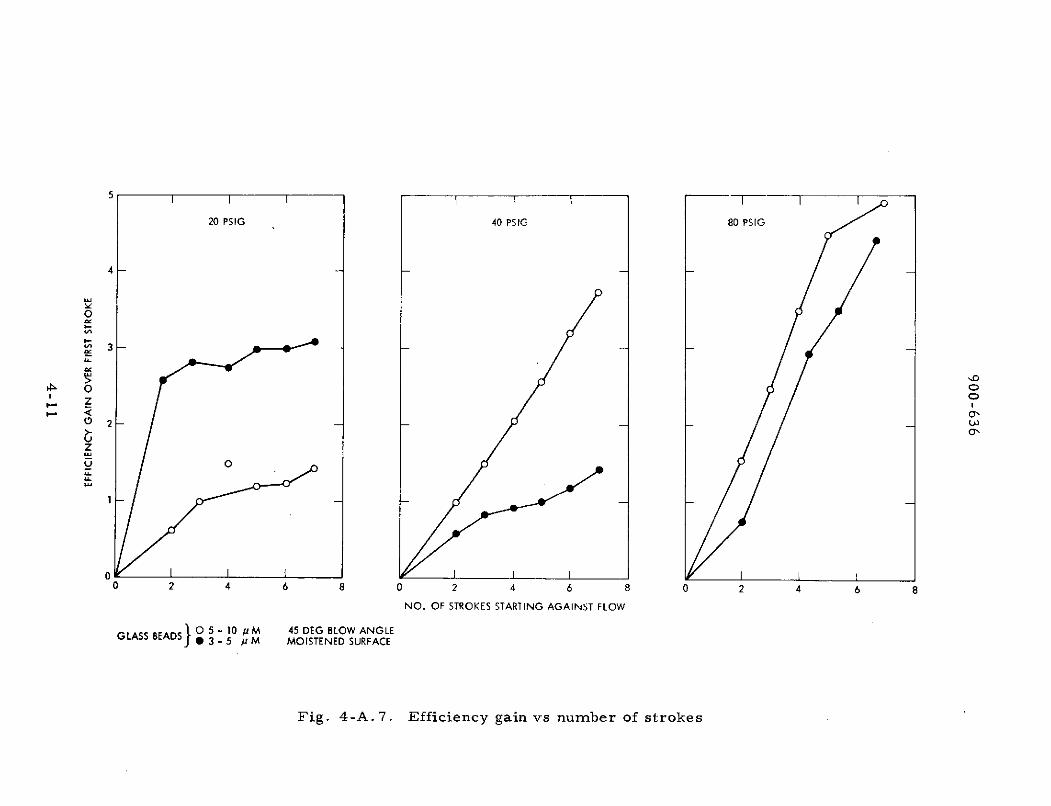
5 1 1 I I I
20 PSIG 40 PSIG 80 PSIG
4
0
o
S3- -
u l
z
U0U-
0 2 4 6 8 0 2 4 6 8 0 2 4 6 8
NO. OF STROKES STARTING AGAINST FLOW
GLASS BEADS O 5 - 10 p M 45 DEG BLOW ANGLEJ 3 - 5 p M MOISTENED SURFACE
Fig. 4-A. 7. Efficiency gain vs number of strokes

900-636
At all pressures tested, the largest amount of particles found on the
lower slide was on the order of 3 percent of the particles removed from the
test samples. This is a relatively small amount. With a slightly larger
vacuum nozzle and with an opposite or circular arrangement of two or more
blow nozzles, this possibly could be avoided.
4. 1.3.2 Tests with Dust. Based upon the conclusions drawn from tests with
glass beads, a 45 degree blow angle and a 1 cm sweep were chosen to conduct
the tests. A separate sample was prepared for each of the pressures and
surface conditions tested. Two determinations for each data point were made.
Various explanations have been advanced relative to the number and
location of microorganisms attached to (or within) dust particles such as x
viables per particle, y viables per unit of particle surface area, or z viables
per unit of particle volume. Plotted in Fig. 4-A. 8 are the total removal ef-
ficiencies achieved for dust particles (assumed to be homogenous in material.
identical in size and shape, and the measured dimension a 3 .m), in terms of
three particle characteristics, quantity of particles, particle surface area, and
particle volume. This information is useful in interpreting the potential biolo-
gical cleaning capability of the considered methods for the three microbial par-
ticle attachment explanations. In Figs. 4-A. 9, 4-A. 10 and 4-A. 11, the effect
on sizes is presented in the form of histograms. The solid, the dashed, and the
dotted lines represent the distribution in existence: prior to test; after sweeping
with the vacuum nozzle only; and after blowing at the indicated pressure, res-
pectively. The distributions are in terms of percent total original counts for all
detectable particles _ 3rnm.
Comparing Fig. 4-A. 8a with identical tests conducted with glass beads
(Fig. 4-A. 5), it can be seen that the relationship between the number of
particles removed, the effect of blow pressures and surface conditions are
essentially the same. As expected, the efficiencies achieved are lower thanthe ones obtained with glass beads. The pressure - efficiency relation, how-
ever, becomes different if we compare efficiencies in terms of surface area
or volume removed (see Fig. 4-A. 8, B and C). The reason for this is the
fact that, in contrast to beads, the large dust particles (see Figs. 4-A.9,4-A. 10 and 4-A. 11) are harder to remove than the smaller ones, particularly
if the surface is oily or moist. At low (15 psig) blow pressures, some of the
4-12
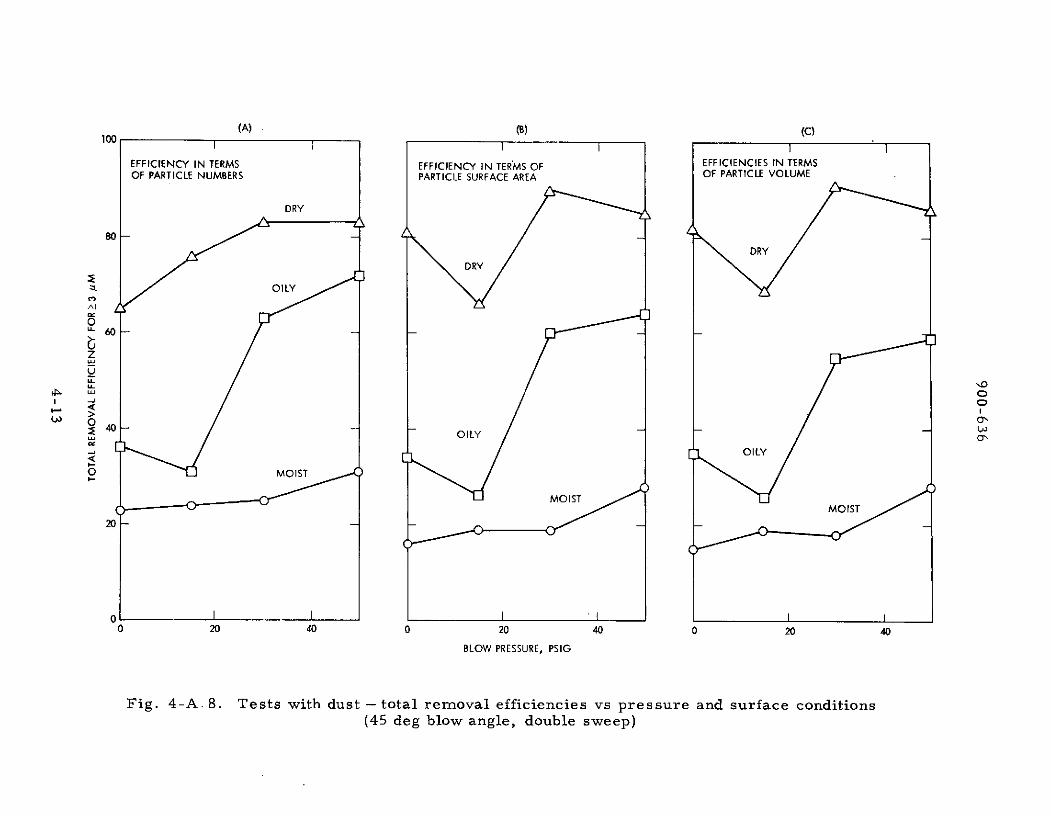
(A) (B) (C)100
EFFICIENCY IN TERMS EFFICIENCY IN TERMS OF EFFICIENCIES IN TERMSOF PARTICLE NUMBERS PARTICLE SURFACE AREA OF PARTICLE VOLUME
DRY
80DRY
DRY
OILY
A[
W
0z
0u
40OILY ILY
0
I--
0 20 40 0 20 40 0 20 40
BLOW PRESSURE, PSIG
Fig. 4-A. 8. Tests with dust - total removal efficiencies vs pressure and surface conditions(45 deg blow angle, double sweep)
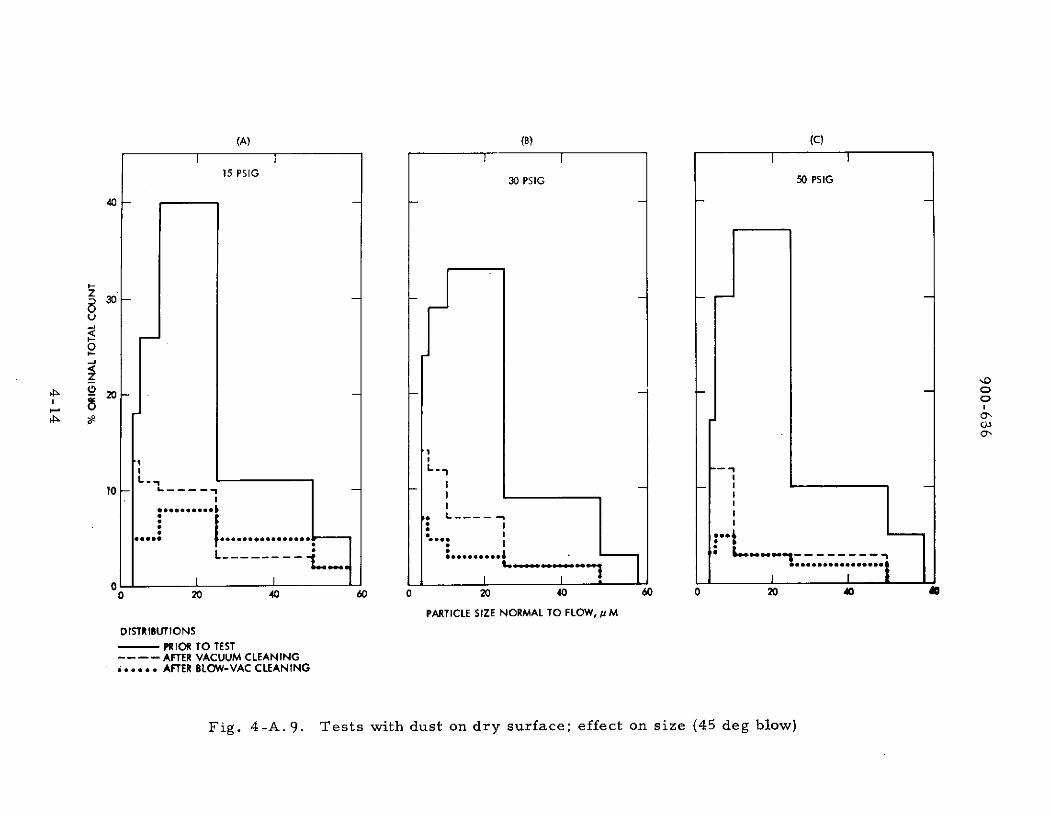
(A) (B) (C)
15 PSIG 30 PSIG 50 PSIG
40
I-I
* .-
-JJ
I.. . . . .I -- "I... *
0 20 40 60 0 20 40 60 0 20 40
PARTICLE SIZE NORMAL TO FLOW, pMDISTRIBUTIONS
- PRIOR TO TEST---- AFTER VACUUM CLEANING
PARTIC AFTER BLOW-VAC CLEANING
Fig. 4-A. 9. Tests with dust on dry surface; effect on size (45 deg blow)
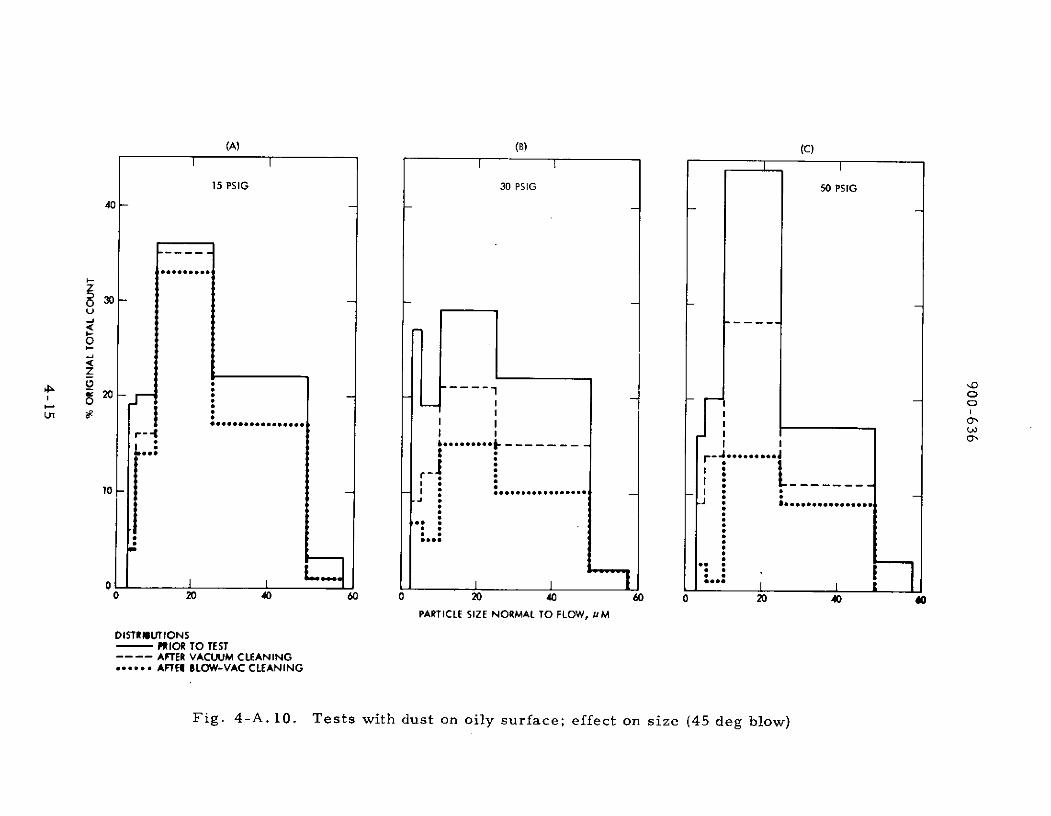
(A) (B) (C)I I I I
15 PSIG 30 PSIG 50 PSIG
40
I--Z0 30
0
O -
o *************
,o -- : ................ j : :I ."
o I I I * I I
0 20 40 60 0 20 40 60 0 20 40 40PARTICLE SIZE NORMAL TO FLOW, M
DISTRIUTIONS- PRIOR TO TEST---- AFTER VACUUM CLEANING*.... AFTER BLOW-VAC CLEANING
Fig. 4-A. 10. Tests with dust on oily surface; effect on size (45 deg blow)
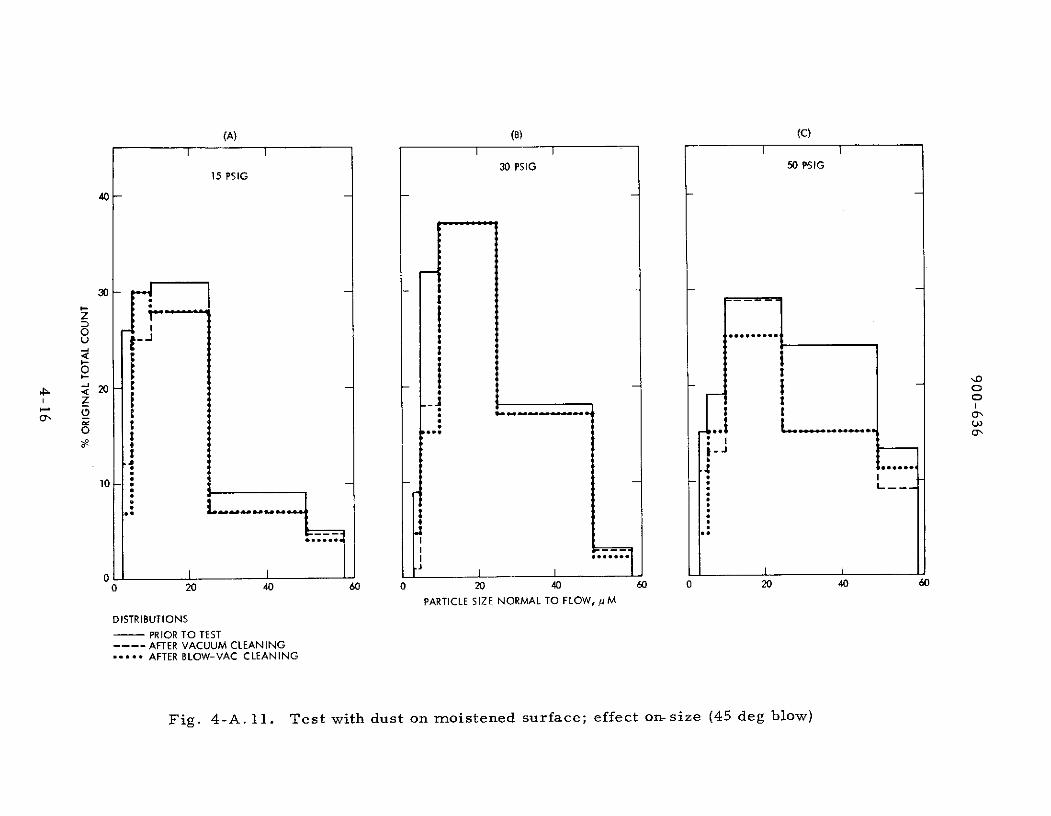
(A) (B) (C)
I I I I I I
30 PSIG 50 PSIG15 PSIG
40
30 -
z ! oO --- - -
V *-
10 C -
2 t
0 I ON
10
0 20 40 60 0 20 40 60 0 20 40 60
PARTICLE SIZE NORMAL TO FLOW, pM
DISTRIBUTIONS
- PRIOR TO TEST---- AFTER VACUUM CLEANING*.... AFTER BLOW-VAC CLEANING
Fig. 4-A. 11. Test with dust on moistened surface; effect on-size (45 deg blow)

900-636
larger size particles tend to migrate into the reference area without being
detached which, in Fig . 4-A. 8 and B and C, shows up as a drop in efficiency,
i.e., the blow has contaminated the reference area.
An explanation for this phenomenon is the heterogeneous composition
of the dust particulates in terms of size, shape, and adhesive properties. For
the dust collected it appeared that many of the particles larger than 10 1 m
were predominantly flat. Their contact area with the surface was relatively
large in relation to their drag, when compared with glass beads of the same
sizes. Many of the larger particles (> 30 Lm) were fibrous in nature and,
particularly on oil and moist surfaces, had the tendency to weathervane into
the flow (and thus reduce drag).
4. 1. 4 Summary and Conclusions
In regard to the task objective, the discussed phase of the study con-
cludes that:
1) Blow vacuum cleaning is a prospective method for the physical
removal of particulate matter where the control of particulates
between 5 and 50 ±m sizes is of primary importance. Particles
> 50 pm in size can be efficiently removed by vacuum flow alone.
On particles - 5 pm the method becomes very inefficient. The
total removal efficiences demonstrated and believed feasible with
a cleaning device that utilizes the described concept are sum-
marized in Table 4-A. 1. These data are based upon tests with dust.
Table 4-A. 1. Blow vacuum cleaning test efficiencies demonstrated withdust seeded on optical glass (45 deg angle, double sweep)
Surface Blow Percent of Particulate MatterConditions Pressure ~ 3 pm Removed in Terms of:
psig Particle Particle ParticleNumbers Surface Area Volume
Dry 30 85 90 90
Oily 50 70 65 60(fingerprinted)
Moist 80 40 40 40(fogged)
4-17

900-636
2) On normally dry surfaces (2 50 percent RH) pressures on the
order of 30 psig across the blow nozzle are required to achieve
a significant improvement over cleaning with vacuum flow alone.
Blowing at lower pressures tends to induce particle migration
without detachment, and is contaminating in nature. Pressures
of 50 to 80 psig are required to efficiently remove particulate
matter from oily surfaces and from surfaces that have been
exposed to moisture condensation shortly before cleaning. Pres-
sures on this order are usually compatible with solid surfaces.
Blowing into entrapped areas, however, may result in pressure
actions not compatible with the spacecraft design. A further
reduction of the effective blow pressures is desirable to make
the method more generally applicable.
3) A jet-angle on the order of 45 degrees against the surface should
be a reasonable choice from the standpoint of efficiency and
entrainment. Larger, i.e., steeper, blow angles appear to be
more efficient on particles _ 5 lim (better penetration of sub-
layer) but entrainment becomes a problem that calls for a different
conceptual approach. Thought should be given to this in further
studies, if the removal of the smaller particulates is desired.
4) The continuous working speed should not exceed 0.5 cm/second
unless the surface is oil-free and dry. Oscillating strokes
advancing approximately 1/10 of the working width of the device
in a lateral direction is probably the most practical working
method from the time and efficiency standpoint. Strokes should
start and end with an upstream sweep of the blow-jet to reduce
recontamination hazards.
5) For uniformly shaped particles such as glass beads, the removal
capability decreases with size and drops off sharply at sizes
below 5 pm. For heterogenous particulate matter, such as dust,the removal of the larger particulates between 10 and (up to)
50 p.m seems to represent more of a problem, if the removal of
surface area and volume (rather than number) is the objective.
4-18

The presence of large numbers of flat and fibrous particles in
this size range are primarily responsible for this phenomenon.
Regardless of experimental problems and inconveniences
associated with dust, more emphasis on test with dust must be
given in further studies to draw final conclusions.
4. 1.5 Future Activities
The objective of future activities is to reduce the blow pressures needed
for efficient cleaning with flow, and to improve the capability for the removal
of medium size dust particles (10-30 1 m) from moist and oily surfaces. Since
brushes. will be used in certain areas, the effort will also concentrate on
resolving the most pressing problems associated with brushes that have been
identified in earlier tests.
4.1.5. 1 Flow-Cleaning. The improvement for flow cleaning will go into the
direction of utilizing pulse-effects to enhance particle detachment. Attachment
to the existing apparatus will produce jet pulses up to approximately 22, 000 Hz
and focused harmonic pressure fluctuations up to 30, 000 Hz. This will allow
the study of the effect of blow-pressures, pulse frequency and intensity, on
the removal capability of the blow jet. Glass beads and presized (Arizona
road) dust seeded on optical glass will be used as test and sampling materials.
4.1.5.2 Brush Cleaning. The major problems to be resolved are those of
(a) bristle materials, their mechanical properties and compatibility with
decontamination and sterilization procedures, (b) accumulative contamination
due to poor entrainment of the detached particles resulting from bristle packing
and entanglement, and (c) the restoration of brush cleanliness during use.
The objective is to establish criteria for the selection of materials
and design parameters for spacecraft cleaning brushes, and to devise the
necessary methods to clean the brushes during use.
4-19

PR EDING PAGE BLA..OT900-636
4. 2 EVALUATION OF PLASMA CLEANING AND DECONTAMINATION
TECHNIQUES
4.2. 1 Subtask B Introduction
Heat and chemicals have been traditionally used as spacecraft
microbial decontaminants. However, certain materials and complex equip-
ment often suffer degradation and a loss in reliability due to heat damage or
chemical incompatibility.
Plasma cleaning and sterilization involves exciting a gas and passing
it over the material to be sterilized. The apparatus used includes a gas
exciter (radio frequency), sterilization chamber and vacuum pump. In opera-
tion, specimens are placed in the sterilization chamber, pressure reduced,
and excited gas is introduced. Sterilization is believed to occur although the
parameters are not well understood, particularly as they may be applied to
typical spacecraft applications. The plasma process does not appear to
degrade materials which have been tested to date and, in addition, does not
raise the temperature of the object being sterilized.
4.2. 2 Significant Accomplishments
An 18 month contract was awarded to the Boeing Co. (May 15, 1973)
to develop plasma sterilization technology for spacecraft application and
generate preliminary design criteria for sterilizers. The study effort will be
divided into two major areas: 1) define or determine the effective sterilizing
ranges of different gases as a function of power, gas flow rate, and chamber
pressure; 2) determine penetration characteristics and material compatibility
of plasma and develop design criteria for plasma sterilizers.
4. 2. 3 Future Activities
Complete the contractual effort by October 15, 1974.
4-21NASA - JPL - Coml.. L.A., Calif.