
Ajit & Nagesh
114
A COMPREHENSIVE PROJECT REPORT ON “COMPARISON STUDY WITH VODAFONE & RELIANCE COMMUNICATION SPECIFICATION ON TELECOM INDUSTRY” Submitted to GROW MORE FACULTY OF MANAGEMENT HIMATNAGAR IN PARTIAL FULFILLMENT OF THE REQUIREMENT OF THE AWARD FOR THE DEGREE OF MASTER OF BUSINESS ADMINISTRATION In GUJARAT TECHNOLOGICAL UNIVERSITY Under The faculty Guidance Of Assi. Prof. Javed Jethara Submitted by Dabhi Ajit S. Enrollment No. : (107130592048) Patel Nagesh A. Enrollment No. : (107130592011) [Batch : 2010-12] MBA SEMESTER III/IV Grow More Faculty of Management 1
-
Upload
parth-patel -
Category
Documents
-
view
82 -
download
4
description
gfgggg
Transcript of Ajit & Nagesh

A
COMPREHENSIVE PROJECT REPORT
ON
“COMPARISON STUDY WITH VODAFONE & RELIANCE
COMMUNICATION SPECIFICATION ON TELECOM INDUSTRY”
Submitted to
GROW MORE FACULTY OF MANAGEMENT
HIMATNAGAR
IN PARTIAL FULFILLMENT OF THE
REQUIREMENT OF THE AWARD FOR THE DEGREE OF
MASTER OF BUSINESS ADMINISTRATION
In
GUJARAT TECHNOLOGICAL UNIVERSITY
Under The faculty Guidance Of
Assi. Prof. Javed Jethara
Submitted by
Dabhi Ajit S. Enrollment No. : (107130592048)
Patel Nagesh A. Enrollment No. : (107130592011)
[Batch : 2010-12]
MBA SEMESTER III/IV
Grow More Faculty of Management
Affiliated to Gujarat Technological University,
Ahmadabad.
1

PREFACE
According to the rules of G.T.U and part of our syllabus, we are the M.B.A
student have to take Comprehensive Project Report of any one industry in the
year 2010-2012 and we have to write about the technical knowledge and how
the Indian economy and also business running in present time.
In M.B.A. we get lots knowledge by our theoretical syllabus and management reference books. In this modern age practical knowledge is more important than theoretical knowledge. It does not mean that theoretical knowledge is not important but without practical knowledge students are incomplete. It proved that “PRACTICE MAKES THE MAN PERFACT.”
2

ACKNOWLEDGEMENT
It is almost inevitable to incur indebtedness to all who generously helped by
sharing their invaluable time and rich experience with me, without which this
project would have never been accomplished. No task can be achieved alone,
particularly while attempting to finish a project of such magnitude. It took many
very special people to facilitate it and support it. Hence, I would like to
acknowledge all of their valuable support and convey my humble gratitude to
them.
Success is a sweet fruit, which every one strives to taste. In the process one
takes help of encouraging and helping. “People one seed at a time and forest
grows and stone at a time and a place is built, a little effort at a time and project
is developed and ambition released.” This was solely the approach; I took
toward the development of the project.
We thankful to other administration staff for their co-operation and kindly take
on our project report.
We would like to express heartily thankful to our respected Prof. Javed Jethera.
who has given us valuable guidance and provide other required information for
the preparation of this report.
3

Students’ Declaration
We are Dabhi Ajit S. & Patel Nagesh A. hereby declare that the report for Comprehensive Project entitled “Comparison Study with Reliance Communication & Vodafone Specification on Telecom Industry ”is a result of our own work and our indebtedness to other work publications, references, if any, have been duly acknowledged.
Place : …… (Signature)
Date : (Name of Students)
Dabhi Ajit S. EN ROLL:(107130592048)
Patel Nagesh A. EN ROLL:(107130592011)
4

INDEX.
Sr. N Particular Page Number
I Preface
Ii Awknowledge
Chap-1. About the telecom industry
1.1 Growth & evolution telecom industry
2. World markets telecoms
3. Major players in industry
4. Services profile
5. Product profile
6. Demand determination of telecom industry
7. Key success factore of telecom industry
8. Pest analysis
9. Research methodology
9.1 Research objectives:-
9.3 Data collection
10 Michel porter’s five force model company
11 Company information
12 Swot analysis
14 Financial analysis
15 Research methodology ratio.
15.1 Liquidity ratio
15.1.1 Current ratio
15.1.2 Net working capital
15.1.3. Quick ratio
15.1.4. Cash ratio
5

15.2 Leverage
15.2.1 Debt equity ratio
15.2.2 Interest on coverage ratio
15.3. Profitability ratio (%)
15.3.1 Return on equity ratio
15.3.2 Net profit ratio
15.3.3 Return On Capital ivestmentRatio
15.3.4 Return On Capital Employed Ratio
15.4 Activity ratio
15.4.1 Net assets turn over ratio
15.4.2 Fixed assets turn over ratio
15.4.3 Total assets turn over ratio
15.5 Profitability ratio (%)
16 Conclusion
17 Annexure
18 Profit & Loss Account
19 Balance sheet
20 Bibliography
6

CHAPTER – 1
ABOUT THE INDUSTRY
7

TELECOM INDUSTRY IN INDIA
1 .1GROWTH & EVOLUTION TELECOM INDUSTRY:-
1.TELECOM NDUSTRY PROFILE:
The Indian Telecommunications network is the third largest in the world and the
second largest among the emerging economies of Asia. Today, it is the fastest
growing market in the world. The telecommunication sector continued to register
significant success during the year and has emerged as one of the key sectors
responsible for India’s resurgent India’s economic growth.
GROWTH:-
The Indian telecom industry has witnessed a significant upswing and is presently on
a high speed growth path, enjoying a growth rate of ~45 % p.a., among the highest
in the World. India currently has ~550 million telecom subscribers, translating to a
tele-density of ~46%. According to Business Monitor International, India is currently
adding 8-10 million mobile subscribers every month. Approximately 20% of the world
population has access to the Internet. The telecom industry is vast and offers a wide
range of career opportunities on both the hardware and software fronts. These
prospects include functional jobs in mobile telephony, internet protocol media
systems, wireless communications, GSM, GPRS and CDMA technology, VoIP, data
networks and optical networks amongst others.
The growth in number of broadband connections in India has accelerated since
2006. As of October 2011, total broadband Internet connections in India had reached
12.98 million constituting 1.0% of the population. India has one of the lowest
penetrations of broadband connectivity in the world. The industry is expected to
8

reach a size of 344,921 crore (US$65.53 billion) by 2011at a growth rate of over 26
percent, and generate employment opportunities for about 10 million people during
the same period. According to analysts, the sector would create direct employment
for 2.8 million people and for 7 million indirectly. The total revenue of the Indian
telecom sector grew by 7% to 283,207 crore (US$53.81 billion) for 2010-11 financial
year, while revenues from telecom equipment segment stood at 117,039 crore
(US$22.24 billion).The number of mobile phone subscribers in the country would
exceed 50 million by 2005 and cross 300 million by 2010, according to Cellular
Operators Association of India (COAI).
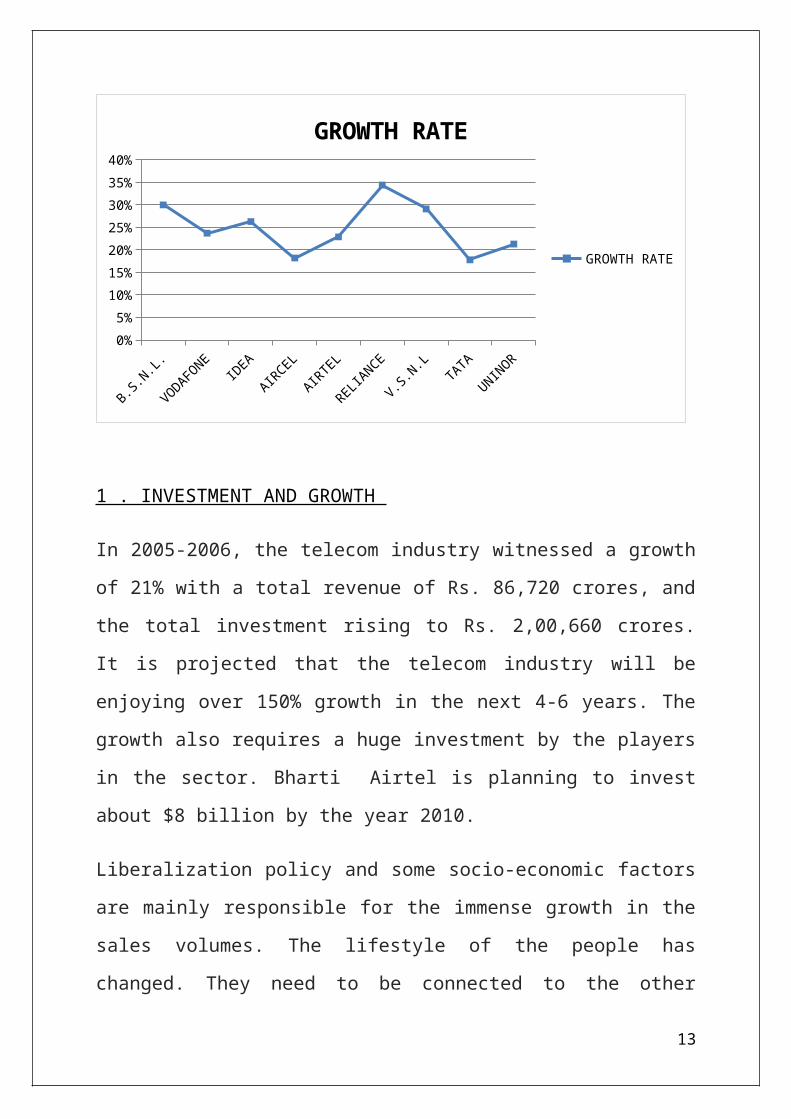
MAJOR PLAYERS IN TELECOM INDUSTRY OF GROWTH RATE OF
201 1 .
COMPANY GROWTH
RATE
B.S.N.L. 30%
VODAFONE 23.7%
IDEA 26.3%
AIRCEL 18.2%
AIRTEL 22.9%
RELIANCE 34.4%
V.S.N.L 29.1%
TATA 17.8%
UNINOR 21.3%
9

B.S.N.L.
VODAFONE
IDEAAIRCEL
AIRTEL
RELIANCE
V.S.N.L
TATA
UNINOR0%
5%
10%
15%
20%
25%
30%
35%
40%
GROWTH RATE
GROWTH RATE
1 . INVESTMENT AND GROWTH
In 2005-2006, the telecom industry witnessed a growth of 21% with a total
revenue of Rs. 86,720 crores, and the total investment rising to Rs. 2,00,660
crores. It is projected that the telecom industry will be enjoying over 150%
growth in the next 4-6 years. The growth also requires a huge investment by the
players in the sector. Bharti Airtel is planning to invest about $8 billion by the
year 2010.
Liberalization policy and some socio-economic factors are mainly responsible
for the immense growth in the sales volumes. The lifestyle of the people has
changed. They need to be connected to the other people all the time. With the
lowering down of the tariffs the affordability of the mobile phones has
increased. The finance sector has also come up with loans for handsets on 0%
interest. Mobile services providers are also expanding their coverage area by
installing more and more antennas and other equipments.
10

EVOLUTION:-
The number of smart devices already reached 940 million units by the end of
2010, suggesting a penetration rate of nearly 18%. Therefore, smart devices
have entered a period of rapid growth.
The telecom industry has entered a critical period for its transformation in
2011.Take mobile communications for example. Openness, competition, and
sharp decrease
of the operating expense (OPEX) have fueled the rapid growth of mobile
communications. There were already 5.6 billion mobile users worldwide in
March 2011 with a mobile communications penetration rate of more than 80%.
Mobile broadband services have become a highlight and drive of the entire
telecom industry, and the faster penetration of smart devices has been pushing
the rapid upgrading of the industry. Mature smart devices such as I Phone and I
Pad are contributing to the economies of scale of the industry, as their prices
keep falling to let them enter the low-end and mid-range markets..
Manufacture of Telecom Equipment:-
1 .
With a growth rate of 45 percent, the Indian telecom industry is booming.
Apart from providing mobile and broadband subscriptions, the telecom industry
is also involved in the manufacture of telecom equipment. Rising demand for a
wide range of telecom equipment, particularly in the area of mobile
telecommunication, has provided excellent opportunities to domestic and
foreign investors in the manufacturing sector. The last two years saw many
11

renowned telecom companies setting up their manufacturing base in India.
Ericsson has set up GSM Radio Base Station Manufacturing facility in Jaipur.
Elicited has set up handset manufacturing facilities in Bangalore. Nokia set up
its manufacturing plant in Chennai. LG Electronics set up plant of
manufacturing GSM mobile phones near Pune.
The Government has already set up Telecom Equipment and Services Export
Promotion Forum and Telecom Testing and Security Certification Centre
(TETC). A large number of companies like Alcatel, Cisco have also shown
interest in setting up their R&D centers in India. With above initiatives India is
expected to be a manufacturing hub for the telecom equipment.
2. WORLD MARKETS TELECOMS
World Markets Telecoms integrates our Same-Day Analysis with our Country
Intelligence and Company Analysis products. Our client website, My Insight,
enables you to link instantly from your daily desktop news to any related in-
depth reports on the countries or companies featured in the same-day analysis.
Subscribers to this service receive:
Same-Day Analysis of daily news, events, and trends in global telecom
markets, with the option to filter by product, company, or country.
Country Intelligence: uniform data, forecasts and analysis across 140
telecoms markets for valuable market insight.
Company Analysis: quarterly-updated statistics for tracking over 500
fixed, broadband and mobile operators in over 100 countries.
Benefits:
12
World Markets Telecoms enables you to:-
Evaluate market opportunities and risks in the fixed-line, mobile, and broadband
sectors. Assess investment opportunities.
Monitor your competitors and customers Stay up to date with recent industry
developments Conduct first-stage and ongoing market assessment of country
telecoms markets.
Assess market size allocate sales and marketing resources Identify convergence
and product substitution.
3. MAJOR PLAYERS IN TELECOM INDUSTRY
There are three types of players in telecom services:
• State owned companies (BSNL and MTNL)• Private Indian owned companies (Reliance Infocomm, Tata Teleservices,)• Foreign invested companies (Hutchison-Essar, Bharti Tele-Ventures, Escotel, IdeaCellular, BPL Mobile, Spice Communications)
13

Bharat Sanchar Nigam Limited (BSNL)
Name:- Bharat Sanchar Nigam Limited (BSNL).
Year of Establishment:- 2000
Company Profile:- Bharat Sanchar Nigam Ltd. is World's 7thlargest Tele
communications Company providing comprehensive range of telecom services
in India: Wire line, CDMA mobile ,GSM Mobile, Internet, Broadband, Carrier
service, MPLS-VPN, VSAT, VoIP services, INS services etc. Within a span of
five years it has become one of the largest public sector unit in India.
Global Presence/ Marketing:- It has a network of over 45 million lines
covering 5000.
14

Network:- towns with over 35 million telephone connections.
Future Prospect:- BSNL plans to expand its customer base from present
47millions lines to 125 million lines and infrastructure investment plan to the
tune of Rs. 733 crores(US$ 16.67 million) in the next three years.
Videsh Sanchar Nigam Limited (VSNL)
Name:- Videsh Sanchar Nigam Limited (VSNL)
Year of Establishment:- 1986.
Company Profile:- The Videsh Sanchar Nigam Limited (VSNL) – a wholly
Government owned corporation. The company operates a network of earth
stations, switches, submarine cable systems, and value added service nodes to
provide a range of basic and value added services and has dedicated work force
of about 2000 employees. VSNL' in gateway centers are located at Mumbai,
New Delhi, Kolkata and Chennai.
Global Presence/ Marketing Network:- The company has 52 subsidiaries in
21 countries as well as operations across four continents.
Acquisitions / Strategic Alliances:- VSNL acquired Nasdaq-listed Teleglobe
International Holdings Ltd for $239 million in2005 Videsh Sanchar Nigam Ltd
acquired Tyco Global Network, submarine cable system, for USD 130 million
in 2005.
15

Future Prospect:- The company plans to expand its wholesale voices services
across the EU, to effectively enable enterprise customers and retail voice
carriers to connect to India. VSNL is adding its capacity to meet the over whe-
lming demand for connectivity to India in the wholesale voice services domain.
The company is also offering flexible agreements and charging methods to meet
the growing demands of the whole sale voice
Reliance Communication
Name:- Reliance Communications.
Year of Establishment:- 1999.
Company Profile:- Reliance Telecom's cellular services are available in 340
towns within its eight-circle footprint. Reliance Infocomm also offered for the
first time in India, mobile data services though its R World mobile portal. This
portal leverages the data capability of the CDMA 1X network. Reliance
Infocomm offers a complete range of telecom services covering mobile and
fixed lintels phony including broadband, national and international long
distance services, data services and a wide range of value added services and
applications aimed at enhancing productivity of enterprises and individuals.
Global Presence/ Marketing Network:-Reliance Communications has IP-
enabled connectivity infrastructure comprising over150,000 kilometers of fiber-
optic cable systems in India, the US, Europe, Middle East, and the Asia Pacific
region.
16

Acquisitions / Strategic Alliances:- International wholesale
telecommunications service provider, FLAG Telecom amalgamates with
Reliance Gateway, a wholly owned subsidiary of Reliance Infocomm in 2004.
Vodafone
Name:- Vodafone
Year of Establishment:- Acquired majority stake in Hutch Essar in India ,by
buying out complete stake of Hutch in 2007, Essar is still minority stakeholder
in company.
Company Profile:- Vodafone Essar in India is a subsidiary of Vodafone Group
Plc and commenced operations in 1994 when its predecessor Hutchison
Telecom acquired the cellular license for Mumbai. Vodafone Essar now has
operations in 16 circles covering 86% of India's mobile customer base, with
over 45.78 million customers. Vodafone Essar, under the Hutch brand, has been
named the 'Most Respected Telecom Company', the 'Best Mobile Service in the
country' and the 'Most Creative and Most Effective Advertiser of the Year'.
Global Presence/ Marketing:- It has operations in 25 countries across
5continents and 40.
Network:- partner networks with over 200 million customers worldwide.
17

Acquisitions / Strategic Alliances Future Prospect:- Vodafone Essar is
expecting to touch over 35million customers across 400,000 shops and thousand
of hutch’s own employees along with employees of its business associates.
Idea
Name:- Idea.
Year of Establishment :-1995.
Company Profile:- Idea Cellular is part of the Aditya Birla Group, which is
India's first truly multinational corporation. Aditya Birla Nuvo Ltd. holds
35.7per cent, Birla TMT Holdings Ltd. 44.9 percent, Grasim 7.5 per cent, and
Hindalco 10.1per cent in Idea.
Global Presence/ Marketing Network:- Has a customer base of over 17
million, IDEA Cellular has operations in Delhi, Maharashtra, Goa, Gujarat,
Andhra Pradesh, Madhya Pradesh, Chattisgarh, Uttaranchal, Haryana, UP West,
Himachal Pradesh and Kerala.
Acquisitions / Strategic Alliances:- Merged with Tata Cellular Limited in
2001,thereby acquiring original license for the Andhra Pradesh Circle Acquired
RPG Cellular Limited and consequently the license for the Madhya Pradesh
(including Chattisgarh) Circle in 2001 In2004 acquired Escotel, incumbent
cellular service provider in Haryana, UP(W) & Kerala and new licensee in HP
Acquired Escorts Telecommunications Limited (subsequent lyre named as Idea
Telecommunications Limited)in 2006 Merger of seven subsidiaries with Idea
Cellular Limited in 2007.
18

Future Prospect:- Idea also plans to enter rural and neglected circles as a
strategy to gain subscribers. Other advancements in the telecom industry will
help it cut costs - use of e-mail to send bills to customers; sharing cell sites;
smaller base transmission stations that will mean lesser infrastructure
requirements and expenses and independent tower operators. Along with its
plan to go for a national long distance license, it will also look at international
long distance in the near future.
Bharti airtel
Year of Establishment :-1985.
Global Presence/ Marketing:- Bharti airtel has IP-enabled connectivity
infrastructure comprising over 148900 kilometers of fiber-optic cable systems
in India, the US, Europe, Middle East, and the Asia Pacific region.
Network:- We provide internet connection - Airtel Broadband, Reliance
Netconnect, MTS MBlaze,7.2 Mbps 3g Huawei 3g Unlocked Data cards, Tata
Photon plus.
Market share:- 20.09%26
Tata Teleservices
Name:- Tata Teleservices
Year of Establishment:- 1996.
19

Company Profile:- Tata Teleservices is a part of the $12 billion Tata Group,
which has 93 companies, over200,000 employees and more than 2.3 million
shareholders. Tata Teleservices’ bouquet of telephony services includes Mobile
services, Wireless Desktop Phones, Public Booth Telephony and Wire line
services. Other services include value added services like voice portal, roaming,
post-paid Internet services, 3-wayconferencing, group calling, Wi-Fi Internet,
USB Modem, data cards, calling card service and enterprise services.
Global Presence/ Marketing:- Tata Teleservices has presence in across
19circles that includes Andhra Pradesh, Chennai, Gujarat, Karnataka, Delhi,
Maharashtra, Mumbai, Tamil Nadu, Orissa, Bihar, Rajasthan, Punjab, Haryana,
Himachal Pradesh, Uttar Pradesh (E), Uttar Pradesh (W), Kerala, Kolkata,
Madhya Pradesh and West Bengal.
Acquisitions / Strategic Alliances:- Tata Teleservices has acquired
HughesTele.com (India) Limited [now renamed Tata Teleservices
(Maharashtra) Limited] in 2002.
Future Prospect:- The company is also expanding its footprint, and has paid
Rs. 4.17 billion ($90 million) to Do T for 11 new licenses under the
IUC(interconnect usage charges) regime.
Uninor
Year of Establishment :-. Founded 2009 Headquarters Gurgaon, India.
Services are Mobile telephony Wireless internet. Owner(s) Telenor Group
(67.25%) Unitech Group (32.75%) Employees 2,000.Uninor is an Indian mobile
20

network operator based in Gurgaon, India. The company holds Unified Access
Service(UAS) licenses to offer mobile telephony services in each of India’s 22
telecom circles, and has received spectrum to roll out services in 21 of these
(excluding Delhi). The company is a joint venture between Telenor Group, a
telecommunications company headquartered in Oslo, Norway, and Unitech
Group, an Indian real estate company. Telenor owns a controlling majority
stake in the company (67.25%), which has been branded Uninor in the Indian
market.
Uninor offers mobile voice and data services based on the GSM technology,
currently on a 4.4 MHz spectrum. Uninor services are commercially available in
13 circles across India. With a ‘value for money’ proposition in the market,
Uninor targets youth and other communities within the Indian mass market.
As of Q2, 2011, Uninor had 26 million customers, 2,200 employees and a sales
force of 7,000 people. Uninor products and services are available from a more
than 330,000 retail outlets serviced by 1,600 distributors all over the country.
4.SERVICES PROFILE:-
21

INTERNET SERVICES:-
Internet services were launched in India on August 15, 1995. In November
1998 the government top ended up the sector to private operators. A liberal
licensing regime was put in place to increase Internet penetration across the
country. The growth of IP telephony or grey market is also a serious concern.
Government loses revenue, while unlicensed operation by certain operators
violates the law and depletes licensed operators market share. New services like
IP-TV and IP-Telephony are becoming popular with the demand likely to
increase in coming years. The scope of services under existing ISP license
conditions.
3G TECHNOLOGY SERVICES :-
3G: There was always a question mark over profitability after more than 67,000
crores were paid by telecom service firms in the 3G spectrum auction. So, who
was to be blamed, the telecom firms who overpaid or the auction process that
was touted as the most efficient price discovery mechanism? May be the
government did not put many blocks on offer thus creating artificial scarcity and
so the prices went up. But it’s not easy to pin down a scientific price to
spectrum. As Marten Peters, MD of Vodafone Essar recounts his experience
when in the beginning of the last decade, 3G spectrum and other spectrum
auctions in Europe fetched very high prices. But a big spectrum auction in
Germany in 2010 saw them getting four times as much spectrum at half the
price. The other problem is the readiness e.g. only 3% of the 141mn Vodafone
subscribers have a 3G enabled handset (Please don’t mistake them as 3G users
yet). So the existing scenario entails that the companies are still some distance
away from breaking even.
22

2G TECHNOLOGY SERVICES:-
2G:2G scam comes to your mind straightaway. Undoubtedly it’s a blot on the
Indian face. And its findings will certainly leave many embarrassed. But let’s
not waste our time over this. Let’s concentrate on the other major issues. The
one that comes to the mind is “too much competition or should I This has
resulted in players with large subscriber base having too little spectrum while
many with little or no subscriber base are sitting on precious resources. The
industry despite taking care of network effect doesn’t seem to be achieving the
economies of scale (remember it’s a capital intensive industry) thus forcing lots
of customers in very little spectrum. As a result India is struggling to improve
the quality of coverage despite achieving decent breadth of coverage at 800mn
subscribers. This could lead to future tariff hikes by major players as low tariffs
become unsustainable say too many players”. While basis used to allocate
spectrum helped keep the cost down hence low tariffs but it allowed too many
players to enter the fray.
CDMA SERVICES:-
CDMA technology was introduced in India as a limited mobility solution. The
introduction of CDMA services has created competition, lowered tariffs and
offered many citizens access to communication services for the first time.
WIRELINE SERVICES:-
With increasing penetration of the wireless services, the wire line services in the
country is becoming stagnant. On the other hand, Broadband demand has
picked up and promises to stabilize fixed linegrowth.
23

GSM Sector
In terms of the Global System for Mobile Communication (GSM) subscriber
base thisnow places India third after China and Russia. China had 401.7 million
GSM Subscribers.
5. PRODUCT PROFILE :-
2. Broad brand
3. Hand set
4. Cell phone
5. Ear- phone
6. I-pod
7. Wi Max
8. Wireless
6.DEMAND DETERMINATION Of TELECOM INDUSTRY
Demanding that the telecom industry in India should:
• Make clear investment plans for the co-development of renewable energy
based generating capacity sources along with development of new telecom
infrastructure. Enable a low-carbon economy by playing a significant role in
advocating strong climate and energy policy changes in favor of renewable
energy sources and technologies at national and international levels. Commit to
24

shifting the sourcing of their energy requirements significantly towards
renewable sources.
Demand-related Factors
Demand for telecom services evolves from a core demand for a homogenous
output –basic telephony – for which pure transmission is the common ingredient
in a wide range of services, where transmission often is combined with other
service functions. Increasingly these services are offered by service providers
other than the provider of the basic transmission services, Other producers may
be foreign telecom operators, computer companies or companies from another
industry. Cost structures differ for different services, and market structure
depends a great deal on the type of service demanded.
KEY SUCCESS FACTORE OF TELECOM INDUSTRY
PEST ANALYSIS
7.KEY SUCCESS FACTORE OF TELECOM INDUSTRY.
MARKET POSITION:-
25

The company presence& dominant in the market can be reflected by the
company business size as well as market share in each business segment
through number of subscribers, numbers of tariffs’ or connection time, plus
production and etc. the capability enlarge the customer base in line with
capability to enhance the network coverage. Which often require of sizable
investment cost. Therefore market position of cellular company usually depend
on the financial capacity to support the capital expenditure.
OPERATING MANAGEMENT:-
The company quality also play key role through it’s businesses strategy to
anticipate the rapid growth of technology global trend and change in regulation
as well as ability to generate efficiency businesses activity. Which can be
indicated by growth of probability of margin of from each business segment,
average revenue per users, revenue per employee, tariff setting for each
services. The company also advantage to capture more market opportunity
relatively stronger price position, which can generate sustain margin to cover
the cost of investment research &development.
DIVERSIFICATION:-
The company ability to event diversify revenue generation base the on the type
of basis or services provide market segment and areas include revenue from
overseas market can insure it’s revenue stream. The capability to product
differentiation as well as disperse revenue from various segment market
geographical areas not will ensure the stability of the companies but also
provide particular business downturn.
QUALITY Of SERVICES & INFRASTRUCTURE:-
The company ability to provide satisfactory services to customer it’s on the key
success factor ,which can be reflected by it’s network coverage areas line
exchange capacity technology, users for the services which will determined the
connection quality ,numbers and accessibility of it’s customers services
26

supports as well as other operational indicators such as level of churn rates
successful connection ratios, track records of any major disruption and etc.
8.PEST ANALYSIS:-
POLITICAL :-
The telecom business has always experienced government regulation and
political involvement. Recently, for example, the Federal
Communications Commission (FCC) issued its guidelines related to net
neutrality: FCC 1, Business 0. That trend continues today with companies
involved in the wireless business. More specifically, the government is
heavily involved in the proposed merger of AT&T and T-Mobile as well
as the approval of Light Square’s nationwide Long-Term Evolution
(LTE) network.
27
The benefits of the merger seem to be that AT&T will have far greater
coverage of GSM/WDCMA/HSPA/LTE by acquiring all the T-Mobile
sites. That is a good thing for subscribers since greater coverage usually
leads to broader, more reliable, and faster service. Furthermore, with
more area covered, the implementation of the government’s National
Broadband Plan becomes more realistic.
The downside, of course, is the threat of price hikes given the less
competitive nature of the market. Of course, the inevitable consolidation
of resources will lead to big layoffs—not such a good thing in our jobless
economy.
ECONOMICAL FACTORS
An important point in relation to the need for regulation is that the
demand profiles of these groups are quite different. A few decades ago
all customers were demanding the same service – namely telephony.
Business customers were generating more traffic but the service
demand was basically the same. Today many business customers are
demanding a wide range of communication services, which only a few
residential customers consider to be relevant for them. On the other
hand cable TV is only of limited use for business customers and other
infotainment services primarily directed toward residential customers
are being developed.
As the load of traffic per connection is relatively low, the needs110for
capacity have been more stable in residential markets than business
markets. Most residential customers have needed only an ordinary
telephone line to meet their demands. Therefore, the need for
investments to upgrade the network have been most apparel in
business districts.
28
Residential Market Business Customers. Homogenous market
Heterogeneous market Many small customers Both small and large
customers1-2 lines per customer Limited load of traffic per line Some
customers with many lines More traffic per line Telephony and Cable-
TV dominant services Demand for a wide range of services Limited
use of advanced services Many customers with special needs.
SOCIAL FACTOR:-
The Indian tea industry directly employs over one million workers, the largest
in any industry of which 60 per cent are women. It takes care of the basic social
needs such as housing, education, Medicare, family welfare, recreation, etc of
four million dependents of these employees. Located in remote rural areas
where infrastructure is significantly lacking and employment opportunity is low
key the tea industry covers all core priorities of our national economy.
TECHNOLOGICAL :-
Technical innovations have contributed to a reduction of barriers to
competition in several ways: Changing structures of network costs:
Reductions in transmission costs limit investments needed for delivery
of the same services. particular the unit costs of the interexchange
network capacity are being reduced continuously.
Development of broadband services is closely related to reductions in
costs of transmission. However, substantial demand for broadband
services will multiply he demand for transmission capacity, and the
costs of both the access and interexchange network will increase as a
result of this major network upgrade.Lifetime of equipment is reduced:
29

With rapid technological innovations old equipment becomes obsolete
more quickly. This increases capital costs (a faster rate of depreciation
is needed), shortens the planning horizon and increases the risk.
Digitization increases economies of scope for provision of facilities,
but reduces economies of scope for service provision. If effective
interconnection rules are established, digitalization improves the
conditions for service providers without their own physical
infrastructure.Satellite and cellular services can provide alternatives
for some local exchange network services. The cost structure of air-
borne services involve few economies of density than wired services.
Therefore a degree of infrastructure competition can be introduced at
lower costs. Although satellite and cellular services cannot be
complete substitutes for wired based services they do reduce the
monopoly power of local exchange operators somewhat, and provide
an alternative for some business and residential services and customers
although far less than a majority.
9. RESEARCH METHODOLOGY
30

Objective of financial analysis:-
Every person has the objectives of respected work therefore I have also the
objectives to make this project report are as under.
To study about financial position of the company.
To know the liquidity position of the company.
To collect the data and find the growth in finance in these three years.
To know how to manage current assets and current liabilities of the
company.
To compare the net profit of the Vodafone & Reliance to previous year.
11.DATA COLLECTION:-
The data collection in this project was through secondary sources. The
secondary sources include Textbooks, journals, internet websites and other
magazines provided the secondary data for the project
31

SCOPE of the study:-
The scope of study in confined to the company “Vodafone & Reliance” is
alarge scale unit. Its scope is very widely. It includes financial analysis of last
three year data. I get the balance sheet and profit & loss account of last three
years.These data are collected from the secondary data method to observe last
three years data and find to the various method of ratio analysis. Last three
years data are very useful to the scope of study to the “Vodafone & Reliance”.
About topic:-
Financial analysis is the process of identifying the financial strengths and
weaknesses of the firm by properly establishing relationship between the items
of the balance sheet and profit and loss account. Management of the firm can
undertake financial analysis, or by parties outside the firm viz. owners,
creditors, investors, and others. The nature of analysis will differ depending on
the purpose of the analyst. The focus of financial analysis is on key figures in
the financial statements and the significant relationship that exist between them.
The analysis of financial statement is a process of evaluating the relationship
between component parts of financial statements to obtain a better
understanding of the firm’s position and performance. The first task of financial
analyst is to select the information relevant to the decision under consideration
from the total information contained in the financial statements. The second step
is to arrange the information in a way to highlight significant relationship. The
final step is to interpretation and drawing of inferences and conclusion.
In brief, analysis is the process of selection, relation and evaluationl
Ratio analysis.
12. Porter's 5 Forces Analysis of Telecom Industry.
32

The five competitive forces model, here is a brief background on who
developed it, and why it is useful. The model originated from Michael E.
Porter's 1980 book "Competitive Strategy. Techniques for Analyzing Industries
and Competitors." Since then, it has become a frequently used tool for
analyzing a company's industry structure and its corporate strategy. In his book,
Porter identified five competitive forces that shape every single industry and
market. These forces help us to analyze everything from the intensity of
competition to the profitability and attractiveness of an industry. Figure 1 shows
the relationship between the different competitive forces.
Porter's five competitive forces.
1. Threat of New Entrants:-
33

The easier it is for new companies to enter the industry, the more cutthroat
competition there will be. Factors that can limit the threat of new entrants are
known as barriers to entry.
Some examples include:
Low Declining Average Revenue Per User. Infrastructure tenancy
costs. Brand pull exists to some extent for brands like Airtel /
Idea/ Vodafone. Extremely high infrastructure setup costs
Spectrum License cost- Lotteries, auctions. Incumbent
Advantages: Established brand image, Reliability of network.
Existing loyalty to major brands. Incentives for using a particular
buyer (such as frequent shopper programs)
High fixed costs
Scarcity of resources
High costs of switching companies
Government restrictions or legislation
2.Power of Suppliers:-
This is how much pressure suppliers can place on a business. If one supplier has
a large enough impact to affect a company's margins and volumes, then it holds
substantial power. Here are a few reasons that suppliers might have power:
Low Large number of suppliers. Shared tower infrastructure.
Limited pool of skilled managers and engineers especially those
well versed in the latest technologies. Medium cost of switching
since changing their hardware would lead to additional cost in
34

modifying the architecture. Overall influence on the industry–
medium.
There are very few suppliers of a particular product .There are no
substitutes Switching to another (competitive) product is very
costly The product is extremely important to buyers - can't do
without it The supplying industry has a higher profitability than
the buying industry
Some examples include:-
Broadband Access: The penetration rate of broadband access in the
United States, the lifeblood of pay VoIP services, is around 55 to 60
percent. This effectively caps the number of customers that have access to
VoIP services and places more power in the hands of the broadband
access providers.
3.Power of Buyers :-
This is how much pressure customers can place on a business. If one customer
has a large enough impact to affect a company's margins and volumes, then the
customer hold substantial power. Here are a few reasons that customers might
have power:
9 .
High Lack of differentiation among the service provider Cut throat competition
Customer is price sensitive.
Increased choice – high bargaining power
Small number of buyers
Purchases large volumes
35

Talented managers & engineers
Switching costs – individual & large business customers.
The product is not extremely important to buyers; they can do without the
product for a period of time.
Customers are price sensitive
Some examples include:-
Pricing: Wireless / cellular and traditional phone service providers have seen
demands from consumer’s drive their price per minute via lower tiered minute
and flat rate plans. Pay VoIP providers are entering not at the top, but closer to
the bottom of these pricing levels.
A few reasons that customers might have power are: there are small number of
buyers, buyers purchase large volumes, customers are price sensitive etc.
4.Availability of Substitutes:-
What is the likelihood that someone will switch to a competitive product or
service? If the cost of switching is low, then this poses a serious threat. Here are
a few factors that can affect the threat of substitutes:
The main issue is the similarity of substitutes.
Some examples include:-
If the price of coffee rises substantially, a coffee drinker may switch over to a
beverage like tea.
If substitutes are similar, it can be viewed in the same light as a new entrant.
36

Wireless Local-Area Networks: The Internet and broadband-based VoIP
market could soon face competitors from the wireless / cellular service
providers (Substitutes) via wireless local area networks.
Low Some Substitutes: VoIP (Skype, Messenger etc.)Online Chat
Email Satellite phones None of the above a major threat in current
scenario, but a potential threat for near future.
5.Competitive Rivalry:-
This describes the intensity of competition between existing firms in an
industry. Highly competitive industries generally earn low returns because the
cost of competition is high. A highly competitive market might result from:
Many players of about the same size;
There is no dominant firm Little differentiation between competitors products
and services.
A mature industry with very little growth; companies can only grow by stealing
customers away from competitors.
Usage of phone,
competition is high
• Price
• Value added services
• Profitability low
37

Some examples include:-
Major players of Indian telecom industry The Top five companies, on the basis
of ‘Market Share’
:1. Bharti Airtel Ltd.2. Reliance Communications Ltd.3. Vodafone Essar Ltd.4.
BSNL5. Idea Cellular + Spice Bottom five companies,
Consolidation: As we have seen in the wireless / cellular service provider
market, this can mean threats from existing companies who consolidate their
position and acquire additional market share by purchasing their competition.
High High Exit Barriers High Fixed Cost6-7 players in each region3 out of 4
BIG, present in each region Very less time to gain advantage by an innovation
(Eg. Caller tunes, life time card)Price wars.
12.1. Company information:-
Vodafone Essar, previously Hutchison Essar is a cellular operator in India that
covers 23 telecom circles in India. Despite the official name being Vodafone
Essar, its products are simply branded Vodafone. It offers both prepaid and
postpaid GSM cellular phone coverage throughout India with good presence in
then metros. Vodafone Essar provides 2.75G services based on 900 MHz and
1800 MHz digital GSM technology, offering voice and data services in 23 of
the country's 23 license areas. It is among the top three GSM mobile operators
38

ofIndia.
Vodafone Essar is owned by Vodafone 52%, Essar Group 33%, and other
Indian nationals, 15%. On February 11, 2007, Vodafone agreed to acquire the
controlling interest of 67% held by Li Ka Shing Holdings in Hutch-Essar for
US$11.1 billion, piping Reliance Communications, Hinduja Group, and Essar
Group, which is the owner of the remaining 33%. The whole company was
valued at USD 18.8 billion. [2] . The transaction closed on May 8, 2007.
Vodafone Year of Establishment Acquired majority stake in Hutch Essar in
India ,by buying out complete stake of Hutch in 2007, Essar is still minority
stakeholder in company.
Company Profile is Vodafone Essar in India is a subsidiary of Vodafone Group
Plc and commenced operations in 1994 when its predecessor Hutchison
Telecom acquired the cellular license for Mumbai. Vodafone Essar now has
operations in 16 circles covering 86% of India's mobile customer base, with
over 45.78 million customers. Vodafone Essar, under the Hutch brand, has been
named the 'Most Respected Telecom Company', the 'Best Mobile Service in the
country' and the 'Most Creative and Most Effective Advertiser of the Year'.
It has operations in 25 countries across 5continents and 40. partner networks
with over 200 million customers worldwide.
39

Reliance Telecom and Flag Telecom, is part of Reliance Communications
Ventures (RCoVL). It is an Indian telecommunications company. According to
National Stock Exchange data, Anil Dhirubhai Ambani controls 66.77 per cent
of the company, which accounts for more than 1.36 billion shares.[3] It is the
flagship company of the Reliance-Anil Dhirubhai Ambani Group, comprising of
power (Reliance Energy), financial services (Reliance Capital) and telecom
initiatives of the Reliance ADAG. It uses CDMA2000 1x technology for its
existing CDMA mobile services, and GSM-900/GSM-1800 technology for its
existing/newly launched GSM services.
Reliance Communications is Year of Establishment:-1999.Company Profile is
Reliance Telecom's cellular services are available in 340 towns within its eight-
circle footprint. Reliance Info comm also offered for the first time in India,
mobile data services though its RWorld mobile portal. This portal leverages the
data capability of the CDMA 1X network. Reliance Info comm offers a
complete range of telecom services covering mobile and fixed lintels phony
including broadband, national and international long distance services, data
services and a wide range of value added services and applications aimed at
enhancing productivity of enterprises and individuals RelCom is also into
Wireline Business throughout India and has the largest optical fiber
communication (OFC) backbone architecture [roughly 110,000 km] in the
country.
Reliance Communications has interests in Direct To Home (DTH) TV also,
known as "Big TV". It plans to launch its DTH business by July 2008. Once
launched, RelCom will have presence across all B2C communications channel
in one of the fastest growing markets in the world. On July 2007, the company
announced it is buying US-based managed ether net and application delivery
services company Yipes Enterprise Services for a cash amount of Rs. 1200
crore rupees (equivalent of USD 300 million). The deal was announced
40

complete in a press release in December 2007.In its first overseas acquisition,
the Reliance group has amalgamated the United States-based Flag Telecom for
Undertook financial restructuring of Reliance communications•To spend Rs 16,000 crore to expand and strengthen network coverage
12. SWOT ANALYSIS
41

SWOT analysis is a basic, straightforward model that provides
direction and serves as a basis for the development of marketing
plans. It accomplishes this by assessing an organizations strengths
(what an organization can do) and weaknesses (what an organization
cannot do) in addition to opportunities (potential favorable conditions
for an organization) and threats (potential unfavorable conditions for
an organization)
42

Strength
attributes of the organization those are helpful to achieving the objective.
Weaknesses:
attributes of the organization those are harmful to achieving the objective.
Opportunities:
external conditions those are helpful to achieving the objective.
Threats:
external conditions that is harmful to achieving the objective.
STRENGTH
Low Entry Cost
Commission Structure
Fast Activation Process
Network
Connectivity
Data GPRS
WEAKNESS
Branding Image
Distribution problem
Limited product portfolio-Only Mobile
Lack of Competitive Strength
Limited Budget
OPPORTUNITY
Preference of GSM over CDMA
New Specialist Application
Rural Telephony
43

New Market, Vertical, Horizontal
Competitors` Vulnerabilities
THREAT
Political destabilization.
New Entrants
44

FINANCIAL ANALYSIS
2.3 MEANING OF RATIO.
“Ratio is well known and most kindly used tolls of financial analysis.
A ratio gives the mathematical relationship between on variable & another. The
usefulness of ratio is ultimately dependent on their intelligent skillful
interpretation.
‘”Financial analysis is process of identifying the financial strength
and weakness of the firm by properly established relationship between the item
of the balance sheet and profit & loss account.”
“ Ratio is used by different people for various purpose. It mainly
helps in valuing the firm in quantitative terms, two groups of people are
interested in valuation of firms and they are creditors & shareholders.”
According to traditional classification ratios are classified into three
categories. They are as under.
(1) Revenue statement Ratios.
(2) Balance Sheet Ratios.
45

2.4 IMPORTANCE OF RATIO ANALYSIS.
Ratio analysis is the important tools of financial analysis of firm. It present facts
on a comparative basis and performance of a firm. Ratio analysis is relevant in
assessing the performance of a firm in respect of the following aspects.
Liquidity Position:-
The ratio analysis helps in assessing liquidity position of a firm. The liquidity
ratios are particularly used in credit analysis by bank and other suppliers of a
short loan.
Long -term solvency:-
The long-term solvency is measured by the leverage and profitability ratios
which focus on earning power and operating efficiency. Ratio analysis reveals
the strength and weakness of a firm.
Operating Efficiency:-
Ratio analysis is also used to measure efficiency of in the management and
utilization of the assets.
Overall Profitability:-
The most important use of ratio analysis is the ascertaining the profitability of a
business on the basis of sales, total assets, and capital employed as well share
holders’ funds in a business.
Inter-firm comparison:-
Ratio analysis is also used for comparison of business’ performance with
competitors as well as industry’s performance. It is indicator of position of a
firm in an industry.
46

15. RESEARCH METHODOLOGY RATIO.
15.1 LIQUIDITY RATIO.
This ratio measures the firm’s ability to meet current obligation. A firm ensures
that it does not surer from lack of liquidity and also does not have excess
liquidity. The failure of a company to meet its obligation due to lack of
sufficient liquidity will result in a poor credit worthiness loss of creditor’s
confidence or even in legal tangle resulting in the closure of the company.
CURRENT RATIO.
The current ratio is calculated by dividing the current assets by the current
liability. The current ratio of the firm measures its short term solvency that is its
ability to meet short-term obligation. The higher the current ratio, the larger is
the amount of rupees available per rupee of current liability, the more is the firm
ability to meet current obligation and greater is the safety of short term creditor.
Current Assets
Current ratio=--------------------------------
Current Liabilit
Vodafone
Years 2009-10 2010-11 2011-12
47

Current Assets 21897646 54471212 63032860
Current Liability 7030237 8305435 13510078
Ratio 3.12 6.56 4.67
Reliance
Years 2009-10 2010-11 2011-12
Current Assets 25862456 28349335 35173485
Current Liability 3471551 3959637 4541512
Ratio 7.44 7.41 7.74
2009-10 2010-11 2011-12
Vodafone 3.12 6.56 4.67
Reliance 7.44 7.41 7.74
0.51.52.53.54.55.56.57.5
Current ratio
Ratio
Interpretation:
This current ratio measures the firms ability to meet it current obligation.
current ratio is more than 4:1. The current ratio represent margin of safety for
creditors, the firms ability to meet their obligation
48

2 NET WORKING CAPITAL RATIO:
Net Working Capital means the different between current assets & current
liability excluding short term bank borrowing is called net working capital.
Net Working Capital
Net Working Capital Ratio = -----------------------------
Net Assets
Net Working Capital;-
Current Assets – Current Liabilities.
Net Assets;-
Fixed Assets Current Assets – Current Liabilities.
Vodafone
Years 2009-10 2010—11 2011-12
Current Assets 21897646 54471212 63032860
- Current Liability 7030237 8305435 13510078
Net assets 65130079 109118824 114387435
Ratio 0.23 0.42 0.43
Reliance
Years 2009-10 2010-11 2011-12
Current Assets 21897646 54471212 63032860
- Current Liability 7030237 8305435 13510078
49

Net assets 32524611 35723959 41048529
Ratio 0.68 0.71 0.74
2009-10 2010-11 2011-12
Vodafone 0.23 0.42 0.43
Reliance 0.68 0.710000000000001
0.740000000000001
0.050.150.250.350.450.550.650.75
Net working capital ratio
ર્�ATi
O
INTERPRETATION:-
The Net working capital ratio indicate the firms potential reservoir of funds. If
the ratio is high than the more proportion of working capital in total assets. If
the ratio is for the higher than the working capital remain idle and the ratio is
lower than the it is bed for the company.
3. QUICK RATIO
Quick ratio is considered to be better measure of the liquidity of a company as
compared to the current ratio. This is because the current ratio includes
50

inventories which cannot be converted into cash. The ideal quick ratio is
assumed to be 1:1 for any company. It is computed by dividing the value of
quick assets by liquid liability.
Current Assets - Inventories
Quick ratio = ---------------------------------------------------
Current Liability
Vodafone
Reliance
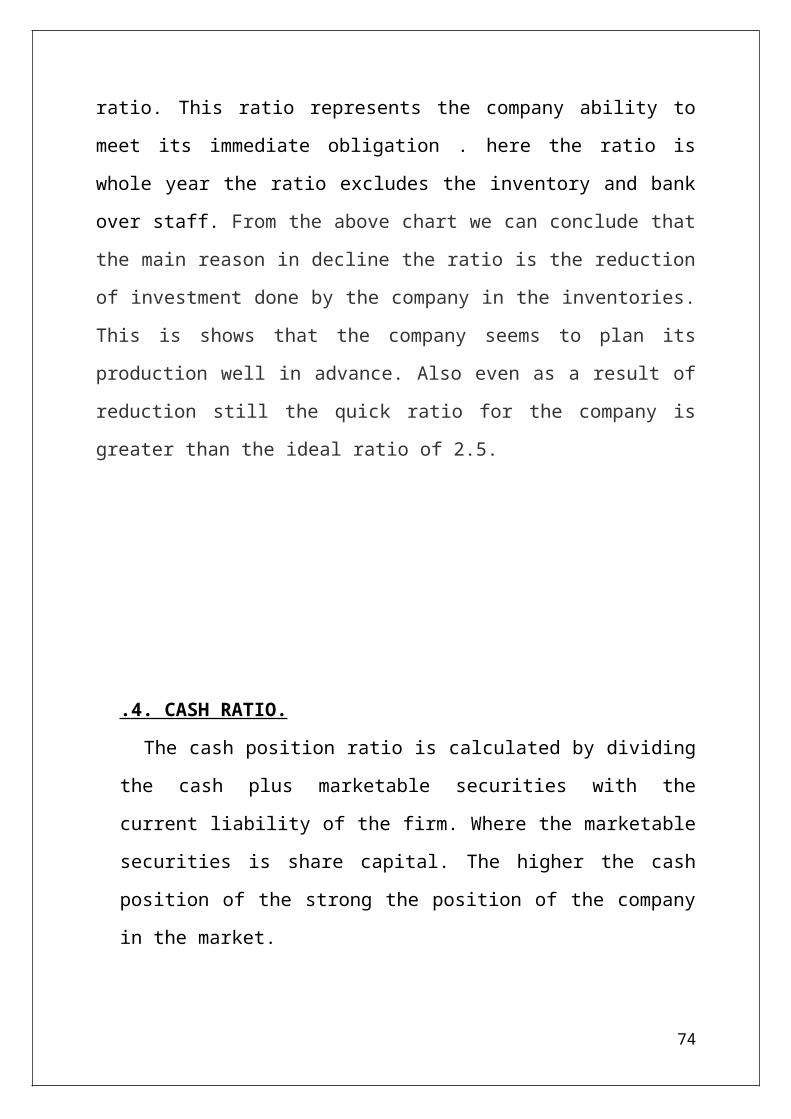
Interpretation:-
The quick ratio is also more than 2:1 which indicate more penetrating test of
liquidity than the current ratio. This ratio represents the company ability to meet
51
Years 2009-10 2010-11 2011-12
Current Assets 21897646 54471212 63032860
- Inventories 4279295 13526986 17583190
Current Liability 7030237 8305435 13510076
Ratio 2.51 4.93 3.36
Years 2009-10 2010-11 2011-12
Current Assets 21897646 54471212 63032860
- Inventories 13463272 14840585 14859056
Current Liability 35996162 396883596 45890041
Ratio 3.57 3.66 4.19

its immediate obligation . here the ratio is whole year the ratio excludes the
inventory and bank over staff. From the above chart we can conclude that the
main reason in decline the ratio is the reduction of investment done by the
company in the inventories. This is shows that the company seems to plan its
production well in advance. Also even as a result of reduction still the quick
ratio for the company is greater than the ideal ratio of 2.5.
. 4. CASH RATIO.
The cash position ratio is calculated by dividing the cash plus marketable
securities with the current liability of the firm. Where the marketable
securities is share capital. The higher the cash position of the strong the
position of the company in the market.
Cash
Cash ratio = ----------------------------
Current Liability
Vodafone
YEAR 2009-10 2010-11 2011-12
Cash 1234434 1630314 2541662
Current Liability 7030237 8305435 13510078
Ratio 0.17 0.19 0.18
52

Reliance
YEAR 2009-10 2010-11 2011-12
Cash 2106002 2677103 3044191
Current Liability 3471551 3959637 4541512
Ratio 0.60 0.67 0.62
2009-10 2010-11 2011-12
Vodafone 0.17 0.19 0.18
Reliance 0.600000000000001
0.670000000000002
0.620000000000002
0.050.150.250.350.450.550.65
Cash Ratio
Ratio
INTERPRETATION:-
Cash ratio shows the total cash available against the current liability. Here this
ratio is the decrease year by year so, it is not good for the company. The ratio of
the company is decrease from the year 2009-10the ratio is 0.17 and the ratio in
the year 2010-11 is 0.18. It has cash ratio indicates that in this year the cash
ratio is satisfying in compare to last year.
53

15.2 LEVERAGE RATIO.
To judge the long term financial position of the firm financial of leverage of
capital structure ratio are calculated. The process of magnify the share holder
return through the use of debt is called “financial leverage” or “financial
gearing” or “ trading on equity.”
Leverage ratio are calculated to measure the financial risk and the ability of
using debt.
.
1 . DEBT EQUITY RATIO.
This ratio indicates to how many times do the creditors contributes for each
time of the owner’s contribution. It is calculated as follow.
54

Total Debt
Debt Equity Ratio = ----------------------------
Net Worth
Total Debt;- Secured loans + Unsecured loans + Sundry Creditors.
Vodafone
YEAR 2009-10 2010-11 2011-12
Total Debt 55922358 83335745 82303553
Net Worth 15816636 32199848 43507195
Ratio 3.54 2.59 1.89
Reliance
YEAR2009-10 2010-11 2011-12
Total Debt 25315385 26334822 57190655
Net Worth 55077171 56813862 58550554
Ratio 0.46 0.65 0.91
55

2009-10 2010-11 2011-12
Vodafone 3.54 2.59 1.89
Reliance 0.46 0.650000000000002
0.91
0.250.751.251.752.252.753.253.75
Debt Equity RatioRa
tio
Interpretation:-
Here Debt-Equity ratio indicate, numerator is an equity part while denominator
is a debt part. So we can easily say that equity part is more than debt part.
.2 INTEREST ON COVERAGE RATIO.
56

This ratio is also known as “Time interest earned ratio”. It measures the debt
servicing the capacity of firm in so far as fixed interest on long term is
concerned.
E.B.I.T
Interest On Coverage Ratio = -----------------------------------
Interest
Vodafone
Years 2009-10 2010-11 2011-12
E.B.I.T 4316143 7488303 9224754
Interest 3426813 5876380 6939261
Ratio 1.25% 1.27% 1.32%
Years 2009-10 2010-11 2011-12
E.B.I.T 3298138 4030289 5396556
Interest 2845009 2524072 3498874
Ratio 1.15 1.59 1.53
57

2009-10 2010-11 2011-12
Vodafone 1.25 1.27 1.32
Reliance 1.15 1.59 1.53
0.10.30.50.70.91.11.31.5
Interest on coverage atioRa
tio
INTERPRETATION:-
The ratio is continuously year by year it is good from the company’s point of
view. In the year 2010-11 it is 1.27% and then increases by 0.05% point it is
good for the company.
15.3 PROFITABILITY RATIO. (%)
58

PROFITABILITY RATIO OF TWO YTPES;-
1. Profitability in relation to sales.
2. Profitability in relation to investment.
1. RETURN ON EQUITY.
This ratio indicates how many times the earnings are obtain as
related to the return provided to the shareholders. It is calculated as follow.
Net Profit After Tax
Return On Equity Ratio = ----------------------- × 100
Net Worth
Net Worth;-
Share capital + reserve & surplus
Years 2009-10 2010-11 2011-12
Net Profit After Tax 863783 1532171 1492690
Net Worth 15816636 32199848 43507195
Ratio 5.46% 4.76% 3.43%
Years 2009-10 2010-11 2011-12
Net Profit After Tax 3298138 4030289 5396556
59

Net Worth 55077171 56813862 58550554
Ratio 3.11 % 3.26% 3.28%
2009-10 2010-11 2011-12
Vodafone 0.0546 0.0476 0.0343
Reliance 0.0311 0.0326000000000001
0.0328000000000001
0.50%
1.50%
2.50%
3.50%
4.50%
5.50%
Return on equity ratio
Ratio
INTERPRETATION:-
From the above calculations we can observe that there is a continuous rise in the
returns provided by the company to the shareholder. This is a good for the
company. For an Rs 1 investment by Shareholder Company gives 3.43 Paisa in
the present year.
2. NET PROFIT RATIO.
60

As the name suggest the net profit ratio is calculated by dividing the net profit
with the sales and multiplying by hundred.A high net profit ratio obtain cost of
production is rising and demand for the product is falling. A firm with a low
profit margin can earn a high rate of return on investment.
Net profit After Tax
Net profit ratio = --------------------------- × 100
Net sales
Years 2009-10 2010-11 2011-12
Net profit 863783 1532171 1492690
Net Sales 77397386 176395209 263421217
Ratio 1.12% 0.87% 0.54%
Years 2009-10 2010-11 2011-12
Net profit 1717764 1852760 1919496
Net Sales 57374086 63974385 75317434
Ratio 2.99% 2.89% 2.55%
61

2009-10 2010-11 2011-12
Vodafone 0.0112 0.00870000000000001
0.00540000000000001
Reliance 0.0299 0.0289 0.0255
0.25%
0.75%
1.25%
1.75%
2.25%
2.75%
Net profit ratioRa
tio
Interpretation:-
Net profit ratio shows relationship between net profit & sales and indicates
management efficiency in manufacturing administrating and selling of products.
As we can see from calculation& graph that the net profit ratio is fluctuating
which not good for the company.Net profit ratio must be continuous and this
good for the company.Net profit ratio which indicates that management
efficiency in mfg., administering, and selling the product. Net profit 0.54%%
which slightly less than previous year.
3 RETURN ON INVESTNENT RATIO.
62

This ratio indicates that the earning obtained for the company are hoe much as
comparable to the capital employed by the company. It is calculated as follow:
E.B.I.T.
Return On Investment Ratio= -------------------------- ×100
Capital Employed
Years 2009-10 2010-11 2011-12
E.B.I.T 4316143 7488303 9224754
Capital Employed 15816636 32199848 43507195
Ratio 22% 23% 21%
Years 2009-10 2010-11 2011-12
E.B.I.T 3298138 4030289 5396556
Capital Employed 55077171 56813862 58550554
Ratio 5% 7% 9%
63

2009-10 2010-11 2011-12
Vodafone 0.22 0.23 0.21
Reliance 0.05 0.07 0.09
3%
8%
13%
18%
23%
Return on investment ratioRa
tio
INTERPRETATION:-
From the above calculations we can observe that is a continuous rise in this
ratio which indicates that the earning of the company is growing consistently.
On a Rs. 1 investment in the year 2009-10 provided a return of 0.22% paisa
while in the year2010-11 financial year the investment of Rs.1 provided a
return of0.23% paisa. in the year2011-12 financial year the investment of Rs.1
provided a return of 0.21%paisa
64
.4 RETURN ON CAPITAL EMPLOYED.
This ratio indicates how many times the earnings are obtain as related to the
return provided to the shareholders. It is calculated as follow.
Net Profit Before Tax
Return On Capital Employed Ratio = -------------------------- × 100
Capital Employed
Capital Employed;-
Share capital + reserve & surplus + Debenture.
Years 2009-10 2010-11 2011-12
Net Profit Before Tax 4316143 7488303 9224754
Capital Employed 15166368 32199848 43507195
Ratio 27.28% 23.25% 21.20
Years 2009-10 2010-11 2011-12
Net Profit Before Tax 1717764 1852760 1919496
Capital Employed 55077171 56813862 58550554
Ratio 5.98 7.09 9.16
65

2009-10 2010-11 2011-12
Vodafone 27.28 23.25 21.2
Reliance 5.98 7.09 9.16
2.5
7.5
12.5
17.5
22.5
27.5
Retrun on capital employed ratioRa
tio
Interpretation:-
From the above calculations we can observe that is a continuous rise in this ratio
which indicates that the earning of the company is growing consistently.
66

1 5. 4 . ACTIVITY RATIO.
The activity ratio are employed to evaluated the efficiency with which the firm
manager utility it’s assets there ratio also called” Turn over ratio “it’s show the
relationship between shares & assets.
.1. NET ASSETS TURN OVER RATIO.
This ratio indicates to how many times the sales of the
company are as compared to the investment of the company in the total assets.
A net asset is obtained as the sum total of the fixed and net current assets of the
company.
Sales
Net assets turn over ratio = ----------------------------
Net Assets
Net Assets;-
Fixed Assets + Current Assets – Current Liabilities.
Years 2009-10 2010-11 2011-12
Sales 77397386 176395209 263421217
Net Assets 6513079 109118824 114387435
Ratio 1.19 1.62 2.30
67

Years 2009-10 2010-11 2011-12
Sales 57374086 63974385 75317434
Net Assets 32524611 35723959 41048529
Ratio 1.76 1.79 1.83
2009-10 2010-11 2011-12
Vodafone 1.19 1.62 2.3
Reliance 1.76 1.79 1.83
0.25
0.75
1.25
1.75
2.25
Net assets turnover ratio
Ratio
INTERPRETATION:-
From the above calculations we can observe that there is an increase in this
ratio over the various financial years. This indicative of the fact that the sales of
the company are increasing for each the we carefully analyze that the last
financial ratio it indicates that the sales of the company were of Rs. 1.19 per
each investment of Rs. 1 in the assets of the company as compared to the first
financial year which indicates that the sales of the company were of Rs. 1.62 for
the investment of each Rs. 1 in the company assets.
68

.2. FIXED ASSETS TURN OVER RATIO.
To ascertain the efficiency and profitability of business, the
total fixed assets are compared to sales. The more the sales in relation to the
amount invested in fixed assets, the more the efficient is the use of fixed assets.
It’s indicating higher efficiency. If the sales are less as compared to investment
in fixed assets, it means that fixed assets are not adequately utilized in the
business.
Sales
Fixed assets turn over ratio= ---------------------------
Fixed Assets
Years 2009-10 2010-11 2011-12
Sales 77397386 176395209 263421217
Fixed Assets 50262670 62953047 64864651
Ratio 1.54 2.80 4.06
Years 2009-10 2010-11 2011-12
Sales 57374086 63974385 75317434
Fixed Assets 101333706 10334261 10716556
Ratio 5.66 6.19 7.02
69

2009-10 2010-11 2011-12
Vodafone 1.54 2.8 4.06
Reliance 5.66 6.19 7.02
0.51.52.53.54.55.56.57.5
Fixed assets turnover ratio
Ratio
INTERPRETATION:-
Higher net fixed assets ratio shows good result and it shows efficient use of
fixed assets. If the ratio is low then the utilization of the fixed assets is not
efficient. Here the ratio is, 1.54, 2.80 and 4.06 in the year, Here the company’s
fixed assets turnover ratio is higher. It shows better position of the company.
70

.3. TOTAL ASSETS TURN OVER RATIO.
The total amount invested in all assets jointly and sales are
offered through them to earn profits. So in order to find out the relation between
total assets turn over ratio.
Sales
Total assets turn over ratio = -----------------------------
Total Assets
Total Assets;-
Fixed Assets + Current Assets.
71
Years 2009-10 2010-11 2011-12
Sales 77397386 176395209 263421217
Total Assets 72160316 117424259 127897511
Ratio 1.07 1.50 2.06
Years 2009-10 2010-11 2011-12
Sales 57374086 63974385 75317434
Total Assets 35996162 396883596 45890041
Ratio 1.59 1.61 1.64

2009-10 2010-11 2011-12
Vodafone 1.07 1.5 2.06
Reliance 1.59 1.61 1.64
0.25
0.75
1.25
1.75
2.25
Total assets turnover ratio
Ratio
INTERPRETATION:-
If the ratio is higher it shows that with less amount of investment in total assets,
the business has a capacity to sell more and as such its profitability is also more.
The ratio of the company in2010-11is 2.06 shows the favorable position of the
business. The ratio is increase year by year for the company.
72

15.5 . PROPRIETERY RATIO.
The proprietary ratio is calculate by dividing the proprietors fund by the total
assets of the firm with multiplying by hundred. Where as the proprietors fund is
the sum of share capital and reserve and surplus and the total assets is the sum
of net assets, investment and net current assets of the firm.
The ratio shows the proportion of proprietors funds to the total assets employed
in the business. The higher the ratio the stronger the financial position of the
enterprise.
Proprietor’s capital
Proprietary ratio =--------------------------------------- × 100
Total Assets
Proprietor’s capital;-
Share capital + reserve & surplus.
Total Assets;-
Fixed assets + Current assets.
Years 2009-10 2010-11 2011-12
Proprietor’s
capital
55077171 56813862 58550554
Total Assets 72160316 117424259 127897511
73
Ratio 21.9% 27.42% 34.01%
Years 2009-10 2010-11 2011-12
Proprietor’s
capital
55077171 56813862 58550554
Total Assets 35996162 396883596 45890041
Ratio
1.53 1.43 1.43
2009-10 2010-11 2011-12
Vodafone 21.9 27.4 34
Reliance 1.53 1.43 1.43
2.5
7.5
12.5
17.5
22.5
27.5
32.5
Proprietary ratio
Ratio
Interpretation:-
The ratio shows the proportion of proprietors funds to the total assets
employed in the business. In above the graph the proprietary ratio is satisfactory
74

position. In the years, 2009-10, 2010-11 and 2011-12 the ratio is, 21.9, 27.42
and 34.01% respectively.
1 6 . CONCLUSION.
75

We have good experience to know about “Vodafone & Reliance” its efficient
financial management. The company is now very good position. It has the
approval of many good standards. This is also improving the in the mind of the
investors and parties related to the company.
The sale of the Vodafone & Reliance is very good, but the company should try
to reduce the cost of production and administration by efficient use of resources.
This way Vodafone & Reliance can improve its profitability ratio.
After observation over all position of the Vodafone & Reliance. we can say that
overall position of company is very sound and company would progress very
fast in the future Reliance compare to Vodafone ..
This current ratio measures Reliance better compare to Vodafone ability to
meet it current obligation. Quick ratio represents the company ability to meet
its immediate obligation .
The return on equity means the rate of return on equity share by the holder of
the share. Return on equity shows the earning of equity shareholders, this shows
that how much rate of return shareholder is good “Vodafone & Reliance”.
18 . ANNEXURE.
76

19. PROFIT 1 1 & LOSS A/C. of V odafone
PARTICULAR 2009-10 2010-11 2011-12
(A). INCOME
Sales a/c 77397386 176395209 263421217
Other income 1630659 5389185 4631825
TOTAL (A) 79028045 181784394 268053042
(B). EXPENDITURE
Raw-material consumed
3519420 14825000 15478826
Manufacturing expenses
14392303 16885063 18009224 Purchase 49218432 138662236 194658333
Other expenses 2682434 3557390 5836720
Interest 3426813 5876380 6939261
Depreciation14,72,500 17,90,022 2384750
Total Expenditure 74711902 174296091 258828288
Profit Before Tax 4316143 7488303 9224754
Provision for Taxation
-Current Tax 698172.00 3273500 5527530
-Deferred Tax 2695271 2473835 1957120
-For Fringe Benefit Tax 58917 208797 247414
Profit after Taxation 863783 1532171 1492690
Surplus at the Beginning 0.50 .32 0.74
BALANCE AVAILABLE FOR APPROPRIATION
863783.50 1532171.32 1492690.74
19. Balance Sheet of . V odafone
PARTICULAR 2009-10 2010-11 2011-12
77

SOURCES OF FUND;-
share holder’s capital 15000000 30000000 40000000
Reserve & surplus 166368 2199848 3507195
LOAN FUNDS:-
Unsecured loans 30079470 11241355 6287820
Secured loans 20420342 66605470 654557889
Sundry Creditors 5422546 5488920 10557844
TOTAL 71738994 115535593 125810746
APPLICATION OF FUNDS;-
FIXED ASSETS 50262670 62953047 64864651
INVESTMENT 75,000 75,000 75,000
CURRENT ASSETS;-
Inventories 4279295 13526986 17583190
Sundry Debtors 4422546 5488920 10557844
Cash & bank balance 1234434 1630314 2541662
Other current assets 16799454 48214311 51609782
loans & advances 600646 692981 790234
Current Assets 21897646 54471212 63032860
Total Current Assets 72160316 117424259 127897511
Less :-Current Liability & Provision 7030237 8305435 13510078
NET CURRENT ASSETS 65130079 109118824 114387435
Miscellaneous Expenditure 1186369 927849 865467
TOTAL 71738994 115535593 125810746
20.1 PROFIT & LOSS A/C. of Reliance
PARTICULAR 2009-10 2010-11 2011-12
(A). INCOME
Sales a/c 57374086 63974385 75317434
78

Other income 208973 228900 225000
TOTAL (A) 57583059 64203285 75542434
(B). EXPENDITURE
Raw-material
consumed
24089306 26824913 32471500
Manufacturing
expenses 8347150 10467085 1106325
Other expenses 7992004 8715933 9246130
Interest 2845009 2524072 3498874
Depreciation 1501728 11640993 13845045
Total
Expenditure
54284921 60172996 70167856
Profit Before Tax 3298138 4030289 5396556
Provision for Taxation 1580374 2177529 3397060
Profit after Taxation 1717764 1852760 1919496
20.1 Balance Sheet 0f Reliance
PARTICULAR 2009-10 2010-11 2011-12
SOURCES OF FUND;-
share holder’s capital 52000000 52000000 52000000
Reserve & surplus 30771716 4813862 6550554
79
LOAN FUNDS:-
Unsecured loans 19791333 19543940 19028260
Secured loans 5524052 6690882 38162395
Sundry Creditors 5422546 5488920 10557844
TOTAL 80392556 83148684 115741209
APPLICATION OF
FUNDS;-
FIXED ASSETS 101333706 10334261 10716556
INVESTMENT 1550001 1550001 1550001
CURRENT ASSETS;-
Inventories 13463272 14840585 14859056
Sundry Debtors 24013570 234001 183690
Cash & bank balance 2106002 2677103 3044191
Other current assets 136420 425270 325000
loans & advances 812346 120690 872500
Current Assets 25862456 28349335 35173485
Total Current Assets 35996162 396883596 45890041
Less :-Current Liability &
Provision
3471551 3959637 4541512
NET CURRENT ASSETS 32524611 35723959 41048529
Miscellaneous Expenditure 47667945 47424725 74692680
TOTAL 80392556 83148684 115741209
80

21. BIBLIOGRAPHY:-
Review:
The financial data collected from the company for three year’s annual reports.
My long book of principles and management accountancy of MBA SEM iv.
Other books referred by me:
1: FINANCIAL MANAGEMENT
I M Pande
9th addition
2: PRINCIPLES OF ACCOUNTANCY
B S Shah Prakashan
5th addition
http://www.google.co.in/
81