AirWatch - EPA Victoria/media/Publications/1215lr.pdf · This edition of the AirWatch materials was...
163
AirWatch Clean air — what’s in it for us? A workbook on local and global air quality for secondary schools
Transcript of AirWatch - EPA Victoria/media/Publications/1215lr.pdf · This edition of the AirWatch materials was...
AirWatchClean air — what’s in it for us?
A workbook on local and global air quality for secondary schools
AirWatchClean air — what’s in it for us?
A workbook on local and global air quality for secondary schools
Clean air — what’s in it for us?
a workbook on local and global air quality for secondary schools
Original text written and compiled by Jennifer Anderton, Margot Finn and Gabrielle Robertson.
Revised and updated by EPA Victoria to include Greenhouse and Energy.
This edition of the AirWatch materials was prepared with assistance from the Victorian Greenhouse Strategy.
For information on monitoring equipment referred to in this manual contact CERES (Incursion Booking Officer) on (03) 9380 1556.
Publication 1215 March 2008
AirWatch
CLEAN AIR!
03 9695 2722 03 9695 2780
Section 1: Teacher information1.1 Welcome to AirWatch 6 1.2 Monitoring 8 1.3 About air quality 9 1.4 Air pollution and weather measurements 11
Section 2: Student introduction2.1 Student survey 14 2.2 Our views 15 2.3 About air pollution 17 2.4 Air pollutants 19 2.5 Greenhouse gases 20
Section 3: Air and weather3.1 Elements of weather 22 3.2 Weather data 24 3.3 The weather map 26 3.4 Weather and air pollution 28 3.5 Inversions 30 3.6 Air movement 31 3.7 Measuring winds aloft 32
Section 4: The burning question4.1 Winter smog 38 4.2 Particles in the air 40 4.3 Car exhausts 42 4.4 Smoky vehicles 43 4.5 Particulates 45 4.6 Visual air quality 48 4.7 Wood heaters and woodsmoke 51 4.8 Woodsmoke and health 55
Section 5: Cars – a big headache5.1 Summer smog 58 5.2 Monitoring nitrogen dioxide 61 5.3 Car usage 64 5.4 Car logs 65 5.5 Vehicle counts 66 5.6 Travel patterns 68 5.7 Smog and health 71
Section 6: Pollen6.1 Pollination 76 6.2 Monitoring pollen 78 6.3 Forecasting pollen count 83 6.4 Pollen count record sheet 84 6.5 Sample pollen count record sheet 85 6.6 The pollen calendar 86 6.7 Pollen identification photographs 89 6.8 Filter holder modification and pollen stain 91 6.9 Resources and reading material 92
Section 7: Other air pollution issues7.1 Sulfur dioxide 94 7.2 Indoor pollution 97 7.3 Allergens in the home 103 7.4 Dust mites 104 7.5 Smoking 106 7.6 Asthma and smoking 107 7.7 Toxic air pollutants 109 7.8 Exposure to toxic air pollutants 112
Section 8: Global air quality8.1 Greenhouse effect 118 8.2 Carbon dioxide 120 8.3 Enhanced greenhouse effect 122 8.4 Global warming and climate change 123 8.5 Ozone 125
Section 9: Energy9.1 Fossil fuels and energy 130 9.2 Household energy 131 9.3 Your household energy use 132 9.4 Green energy 134 9.5 Energy-efficient house design 135
Section 10: Time for action10.1 Community survey 138 10.2 Check it out 140 10.3 What can I do? 141 10.4 Be keen, go green! 143
Section 11: Teacher resources and evaluation 11.1 Sample program 146 11.2 Test items 147 11.3 Appendix 1: NO2 152 11.4 Appendix 2: Air quality record sheet 153 11.5 Appendix 3: Types of air pollution 154 11.6 Appendix 4: Measuring winds aloft 156 11.7 Appendix 5: Tethered balloon data table 157 11.8 Appendix 6: The tethered balloon system 158 11.9 Appendix 7: PM and NO2 calibration sheet 160 11.10 Appendix 8: Visual air quality 161 11.11 Glossary 162
CONTENTS
AIRWATCH PAGE 3

TEACHER INFORMATION
SECT
ION
> 1
WElCOME TO AIRWATCHin this section you will discover what the airwatch resource is all about and how it can be integrated into your curriculum.
AIRWATCH PAGE 5
03 9695 2722 03 9695 2780
Teacher information
1.1 Welcome to AirWatch
Why AirWatch?Clean air is one of our most precious resources because it is essential to our survival and to our quality of life.
Generally, because we can’t see air, taste it or smell it, we ignore it and take it for granted. We become concerned only when its quality is severely diminished but by then, the efforts required to fix the problem are often complex and expensive.
Most states in Australia now face the problem of diminishing air quality in their cities and larger regional centres. Politicians and governments know that technical and regulatory solutions alone will not arrest this decline. The community as a whole must recognise the need for action and be willing to change or modify behaviours that adversely affect our air.
Schools can play a major part in our quest for cleaner air and reduction of greenhouse gas emissions by involving students, developing their awareness of the issues and helping them work towards solutions that will benefit the community. AirWatch is a resource to help them do this.
About AirWatchAirWatch is an exciting resource for teachers and students involving collaborative, inquiry-based learning. Students have the opportunity to experience real scientific endeavour using hands-on monitoring of their local air.
Students are also able to collect other valuable data relating to air quality without requiring monitoring equipment. Information about issues such as vehicle ownership, traffic flow, wood heater ownership and public transport use are important in explaining the air quality in our cities.
AirWatch is a comprehensive resource that examines the causes and effects of air pollution, and investigates social aspects such as ‘attitudes to’, ‘behaviours for’ and ‘knowledge about’ improving air quality in our communities.
There are a variety of activities that teachers and students can use to develop a real understanding of local air pollution, its issues and its solutions.
Students will also investigate global air degradation issues such as the enhanced greenhouse effect and global warming. Students can gain an understanding of the relationship between local air quality and global air quality, and how their actions at a local level contribute to global air quality.
The air monitoring equipmentThe experiments and monitoring methods used in AirWatch were developed by the Division of Atmospheric Research, CSIRO. They were developed on the basis that they must be fun to do, that they show students how air pollution occurs in the atmosphere and that they produce data of reasonable accuracy.
The monitoring equipment allows the students to measure:
1) pollutants in the atmosphere
2) weather that controls pollution concentrations
and
3) where pollutants come from.
The surveysWhile collecting data about pollutants in the air is important, it is also important to understand the causes of pollution and the underlying activities and behaviours which contribute to it. Students are encouraged to collect information relating to human activity, to gain an understanding of behaviours, to assess what people know (or don’t know), and seek possible solutions.
PAGE 6 AIRWATCH
AIRWATCH PAGE �
CLEAN AIR!
03 9695 2722 03 9695 2780
The curriculum materialsThis curriculum package is full of experiments and activities for the students to do. These will allow students to get a complete picture of many of the air quality issues in Australia today.
AirWatch is meant to be flexible so that you, the teacher, can choose how you would like to present this topic and what sort of emphasis you would like to place on different parts of the course. It is not prescriptive and should be adapted to the skills and interest of your class.
It’s all about action!Learning about the problem should be the first step to doing something about it. We hope that through AirWatch, you may encourage your students to actually become involved in some way, big or small, to reduce air pollution locally, including their greenhouse gas emissions. For example, they may decide to do an awareness campaign or organise car-pooling for students and parents at your school. What your students do largely depends on what they find out through their testing and how involved they wish to become in their local environment.
How to implement AirWatchAirWatch can easily fit in with your school organisation and timetabling. You may wish to replace an existing term unit with AirWatch and run it each term throughout the year with different classes. Alternatively, you might like to integrate some of the monitoring and activities across units and subject areas in a whole school approach.
learning areas and outcomesAirWatch facilitates learning across a school curriculum and achieves outcomes in the following learning areas:
ScienceStudents use the enquiry process to learn about the scientific method and communicating scientifically, as well as gaining content knowledge about air pollution and greenhouse issues.
GeographyStudents learn about how people interact with their environment, make informed decisions and implement relevant social action. AirWatch gives them the opportunity to demonstrate active citizenship through their behaviours and practices at school.
Communication and Information Technology (CIT)Students apply organisational, operational and manipulative skills through monitoring and use technology to present and communicate information to a wider audience.
ValuesThrough their studies students examine their attitudes and values with respect to environmental, social and civic responsibilities.
1.1

Social monitoring: human behaviour and attitudesAs air quality is affected by the activities of the general community, it is most important to collect data on how and why people behave the way they do. An analysis of this data can give us an understanding of issues that affect air quality and greenhouse gas emissions. Students can monitor behaviour and attitudes by conducting surveys on travel patterns, vehicle usage, vehicle counts, household heating and energy usage.
This information allows us to understand people’s motivations and develop strategies to change this behaviour to help clean our air and reduce greenhouse gas emissions.
Physical monitoring: air quality dataAs part of this resource students are able to monitor and report on any of the following:
• 24-hour particulate levels
• 3-hour nitrogen dioxide (NO2) levels
• Visual air quality (VAQ)
• Weather — temperature, rainfall, wind speed and wind direction.
Measuring air qualityThe equipment below, called the AirWatch air monitoring kit, can be used to measure particulates and nitrogen dioxide levels. Contact the CERES Incursion Booking Officer on 9380 1556 to find out about the loan equipment.
To collect weather data, schools can use a Stevenson Screen, a weather station or weather data from the Bureau of Meteorology.
Recording dataRecord your data on a table like the one below.
Teacher information
1.2 Monitoring
PAGE 8 AIRWATCH
DateSampling
timeParticulates
(µg/m3)NO2
(ppm)VAQ (km)
Temp (˚C)
Current humidity (%)
Rainfall (prev. 24 hours)
Wind speed (m/s)
Maximum wind speed (m/s)
Wind direction
03 9695 2722 03 9695 2780
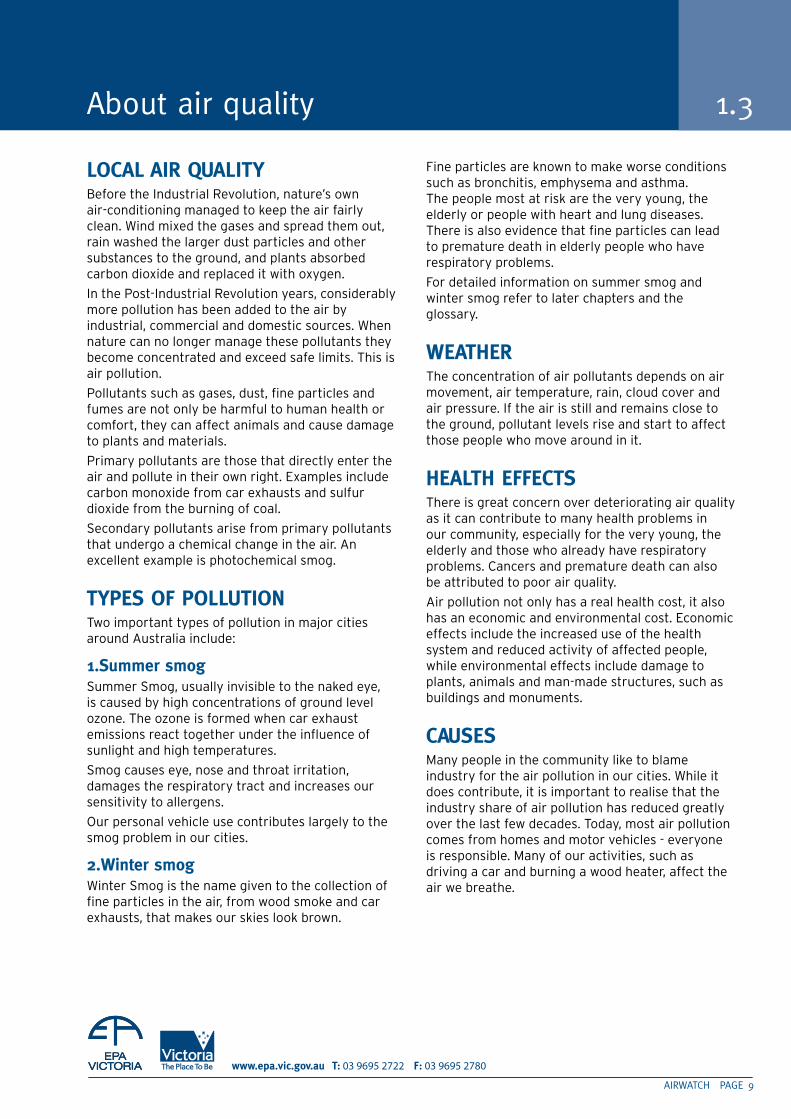
lOCAl AIR quAlITyBefore the Industrial Revolution, nature’s own air-conditioning managed to keep the air fairly clean. Wind mixed the gases and spread them out, rain washed the larger dust particles and other substances to the ground, and plants absorbed carbon dioxide and replaced it with oxygen.
In the Post-Industrial Revolution years, considerably more pollution has been added to the air by industrial, commercial and domestic sources. When nature can no longer manage these pollutants they become concentrated and exceed safe limits. This is air pollution.
Pollutants such as gases, dust, fine particles and fumes are not only be harmful to human health or comfort, they can affect animals and cause damage to plants and materials.
Primary pollutants are those that directly enter the air and pollute in their own right. Examples include carbon monoxide from car exhausts and sulfur dioxide from the burning of coal.
Secondary pollutants arise from primary pollutants that undergo a chemical change in the air. An excellent example is photochemical smog.
TyPES OF POlluTIONTwo important types of pollution in major cities around Australia include:
1. Summer smog Summer Smog, usually invisible to the naked eye, is caused by high concentrations of ground level ozone. The ozone is formed when car exhaust emissions react together under the influence of sunlight and high temperatures.
Smog causes eye, nose and throat irritation, damages the respiratory tract and increases our sensitivity to allergens.
Our personal vehicle use contributes largely to the smog problem in our cities.
2. Winter smogWinter Smog is the name given to the collection of fine particles in the air, from wood smoke and car exhausts, that makes our skies look brown.
Fine particles are known to make worse conditions such as bronchitis, emphysema and asthma. The people most at risk are the very young, the elderly or people with heart and lung diseases. There is also evidence that fine particles can lead to premature death in elderly people who have respiratory problems.
For detailed information on summer smog and winter smog refer to later chapters and the glossary.
WEATHERThe concentration of air pollutants depends on air movement, air temperature, rain, cloud cover and air pressure. If the air is still and remains close to the ground, pollutant levels rise and start to affect those people who move around in it.
HEAlTH EFFECTSThere is great concern over deteriorating air quality as it can contribute to many health problems in our community, especially for the very young, the elderly and those who already have respiratory problems. Cancers and premature death can also be attributed to poor air quality.
Air pollution not only has a real health cost, it also has an economic and environmental cost. Economic effects include the increased use of the health system and reduced activity of affected people, while environmental effects include damage to plants, animals and man-made structures, such as buildings and monuments.
CAuSESMany people in the community like to blame industry for the air pollution in our cities. While it does contribute, it is important to realise that the industry share of air pollution has reduced greatly over the last few decades. Today, most air pollution comes from homes and motor vehicles - everyone is responsible. Many of our activities, such as driving a car and burning a wood heater, affect the air we breathe.
AIRWATCH PAGE 9
About air quality 1.3
PAGE 10 AIRWATCH
ACT lOCAlly – THINk GlObAlly Local air quality will only improve in our cities if the whole community becomes aware of the effect their activities are having and work towards solutions to help clean our air. We must also understand the effect our local activities have on greenhouse gas levels, global warming and possible climate change. By becoming involved in AirWatch your students will learn about their role in reducing air pollution in their neighborhood, and how local action can contribute to a reduction in greenhouse gases globally.
Whilst most sections in this manual provide students with comprehensive and sequential activities on local air pollution issues chapters on greenhouse and global air quality issues and energy have been included. It is important that students understand the relationship between local and global air quality.
GREENHOuSE RESOuRCES:• Greenhouse activities — secondary (version 2)
Eric Bottomley, Gil Freeman, Judy Glick Published by CERES, 8 Lee St. Brunswick East 3057
An excellent resource for extension greenhouse activities not covered in the AirWatch manual.
• ‘understanding climate change’ information booklet
Available from the Victorian Greenhouse Strategy Unit or download from the internet www.greenhouse.vic.gov.au.
• the australian Greenhouse Calculator www.epa.vic.gov.au.
• australian Greenhouse office website
www.greenhouse.gov.au On this website the following resources can be accessed:
Global Warming — Cool It booklet.
Climate Clever website.
Fact sheets, www.greenhouse.gov.au/education/factsheets
• save energy @ school resource
www.energy-toolbox.vic.gov.au/energy-toolbox/schools_information.
—
—
—
Teacher information
1.3
03 9695 2722 03 9695 2780
AIRWATCH PAGE 11
PARTICulATESParticulate matter (PM) is made up of fine particles of solid or droplets of liquid which are light enough to float in the air and be pushed around by the wind. High levels of particulate matter produce a brown haze and visibility reduction.
These particles can cause us health problems depending on their size and composition. Therefore, measuring the level of particles in the air can tell us a lot about the air quality in which we live.
The type of sampling you can do using the AirWatch monitoring equipment is called active low volume sampling. It is active because you are using a pump to draw air in through a filter. Low volume refers to the amount of air you are pumping through in a given time.
NITROGEN dIOxIdENitrogen dioxide (NO2), an orange-brown gas with a pungent odour, causes respiratory illnesses and reduces ventilation (air getting to the lungs), especially in young children, the elderly and those with respiratory illnesses.
It is also a precursor to summer smog, which is fast becoming a major problem in our cities. The NO2 in the atmosphere reacts with oxygen (O2) in the air when it is sunny and the temperatures are high to form ozone (O3) — the major component of summer smog.
These oxides of nitrogen are removed from the air by rain, by plants and by contact with surfaces.
VISuAl AIR quAlITyVisual Air Quality (VAQ) is a measure of visibility. As you look at objects in the distance, how clearly you can see them will depend on the quality of the air in between. If air quality is poor, that is there is a lot of particles in the air, you may not be able to see a certain object. If air quality is good, something that is 30 kilometres or more away may be easily seen.
It is a subjective measurement - that means some people may see things a bit differently to others. However, it is very useful especially when combined with other measurements such as local weather, pollutant measurements such as nephelometer readings, observations of fires and current health status of the people in the area.
WEATHERSimply measuring air pollution alone does not tell you enough. To obtain an understanding about why air quality can vary from day to day, we must measure meteorological conditions as well - such things as winds, temperature, rainfall, cloud cover and pressure conditions.
It is the wind which transports the pollutants and dilutes the pollution on the way. Smog can be worse when air temperatures have been high for several hours and the winds are not strong.
It is common in Australian cities to find higher air pollution when a high pressure system is near and to the east of the city. Air pollution is strongly dependent on rainfall. Some particles in the atmosphere are readily washed out in rain.
OTHER MEASuREMENTSYou may also be taking measurements such as:
• car ownership
• car usage
• wood heater use
• traffic flow
• home energy use.
These measurements are important as they help us understand the underlying behaviours and activities that contribute to poor air quality and greenhouse gas emissions.
This understanding will allow us to identify solutions which will help to change our own and others’ behaviour in order to improve the air quality in our state.
Air pollution and weather measurements 1.4

PAGE 12 AIRWATCH
Teacher information
03 9695 2722 03 9695 2780
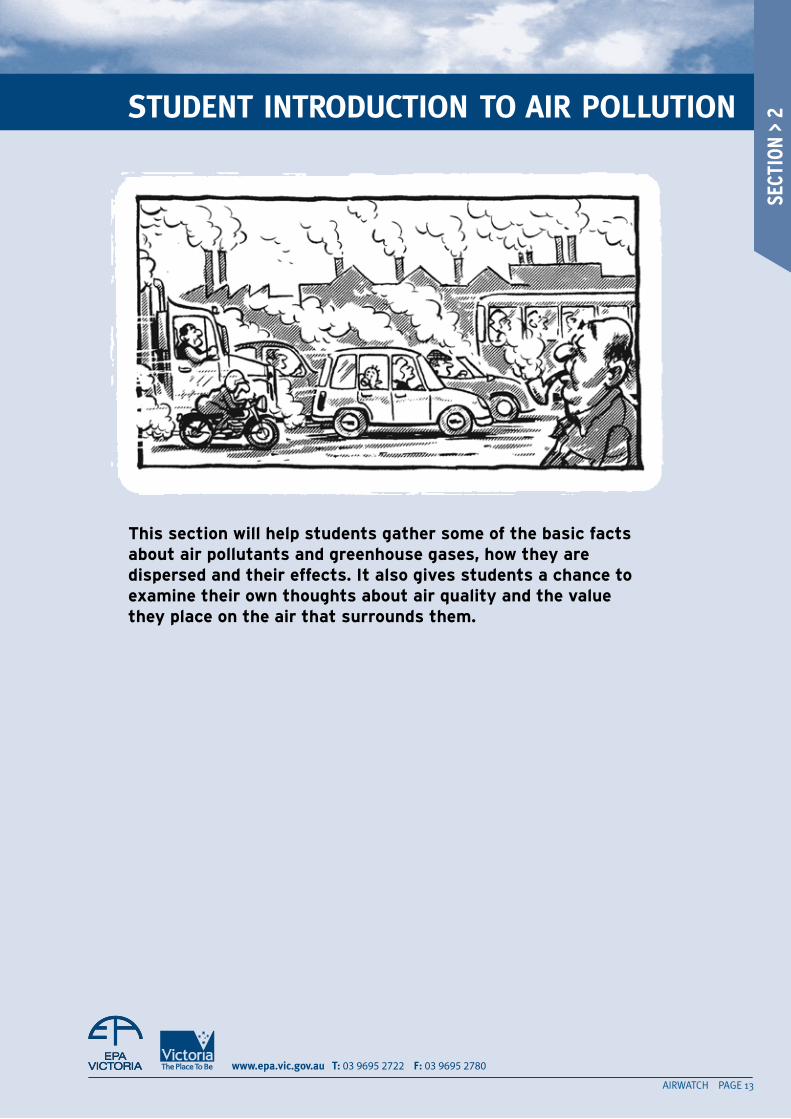
this section will help students gather some of the basic facts about air pollutants and greenhouse gases, how they are dispersed and their effects. it also gives students a chance to examine their own thoughts about air quality and the value they place on the air that surrounds them.
AIRWATCH PAGE 13
STudENT INTROduCTION TO AIR POlluTION
SECT
ION
> 2
School ______________________________________________________________________Year _______________
Dear Student
How much do you know about air pollution? The following survey may help you to find out. This is not a test so if you don’t know the answer, please select this option. Some questions seek your opinion, so answer them honestly and do not select the response you think we want to hear.
1. I think air pollution is getting worse in our city. True False Don’t know
2. Photochemical smog occurs when there is lots of sunlight and high temperatures. True False Don’t know
3. The main component of smog is ozone. True False Don’t know
4. Jogging on high smog days harms your health. True False Don’t know
5. Winter smog is also known as haze. True False Don’t know
6. Burning your wood heater can be bad because it adds fine particles into the air. True False Don’t know
7. Air quality in cities could be improved if more people used public transport. True False Don’t know
8. We contribute to greenhouse gases when we drive our car and use electricity in our home? True False Don’t know
9. I’d be willing to wear warmer clothing inside rather than turning up the heater True False Don’t know
10. I’d be willing to ride a bicycle or catch public transport in order to reduce True False Don’t know air pollution in our area, even if it was inconvenient.
11. I would donate some of my own money to help improve the air quality in our city. True False Don’t know
12. I’m not prepared to make an effort to reduce air pollution because that is the government’s responsibility. True False Don’t know
13. At home, we are encouraged to walk or ride a bike rather than use the car. True False Don’t know
14. I try not to cause air pollution in our area. True False Don’t know
2.1 Student survey
Student introduction to air pollution
PAGE 14 AIRWATCH
The students may like to know the answers to the survey questions. Only questions 2—8 have correct answers. Check the Glossary page for the answers. Other questions are attitudes or beliefs, and therefore cannot be right or wrong.

03 9695 2722 03 9695 2780
AIR POlluTION ANd uSIf you live in a city or large town it is not possible to have a completely unpolluted atmosphere.
1. Look around your local area and list possible sources of pollution around you.
2. If you live in a big city, list other sources which may not be in your area, but may still contribute pollutants to your air. Next to each describe how they contribute to air pollution.
3. Describe what qualities you would like for the air that you use.
4. If you were told that the winter smog (brown haze) sometimes seen in the sky was not particularly harmful, would you be prepared for your air to look that way all the time? Explain.
5. If you were told that the winter smog was harmful to your health, tick which action you would be prepared to undertake:
• stop using your wood heater
• talk to your local member of parliament
• pay more taxes
• participate in an action group
• write to the newspaper.
AIRWATCH PAGE 15
Our views 2.2
The essential problem for those whose job it is to manage air quality is to determine what is clean air.
PAGE 16 AIRWATCH
Student introduction to air pollution
2.2
Some of these actions mean we would have to pay more taxes or change our habits (eg. Stop using cars so much).
6. Is clean air worth it? Explain.
7. What would be a good way for the people of your city to ENSURE clean air now and for the future?
dEbATE THE ISSuEDebate some of these issues in class, either as a formal debate or a class discussion. It might be worth using at least one lesson to prepare a well-reasoned and logical argument.
• Our city does not have an air pollution problem.
• I’m not interested in anyone trying to clean up the air if my parents’ taxes increase.
• People should be made to use their cars less to help overcome the air pollution problems in our city.
• People should care about greenhouse gas emissions
To make sure our air is not only healthy, but that it does not smell and has good visibility, we need to look after it.

03 9695 2722 03 9695 2780
AIRWATCH PAGE 1�
THE ATMOSPHEREThe Earth is surrounded by the atmosphere, which is made up of a mixture of different gases. Over billions of years the composition of the atmosphere has developed into one that can support land-based life.
Figure 1
The Earth’s atmosphere has four main layers. They are the:
• troposphere
• stratosphere
• mesosphere
• thermosphere
Virtually all human activities occur in the troposphere. Mt Everest, the tallest mountain on the planet, is about 9 km high and well within the troposphere. Most commercial airline traffic occurs in the lower part of the stratosphere.
CONSTITuENTS OF AIRThe components of dry air near the Earth’s surface:
Table 1
The main gases in our atmosphere are nitrogen and oxygen plus smaller amounts of gases such as carbon dioxide, water vapour, methane and ozone.
Oxygen is essential for all animals, and plants release oxygen after taking in carbon dioxide.
Carbon dioxide, water vapour, methane and nitrous oxide are called ‘greenhouse gases’. Although they comprise less than 1% of the Earth’s atmosphere they have an important role in sustaining life on Earth.
The atmosphere acts as a blanket wrapped around the Earth and the greenhouse gases trap heat energy from the sun which would normally escape back into space. This is called the ‘greenhouse effect’.
To investigate the greenhouse effect go to section 8 on page 118.
Gas percentage by volume Nitrogen 78.0
Oxygen 21.0
Argon 0.93
Carbon dioxide 0.035
Neon 0.0018
Helium 0.00052
Water vapour varies in the air
About air pollution 2.3
PAGE 18 AIRWATCH
2.3
Student introduction to air pollution
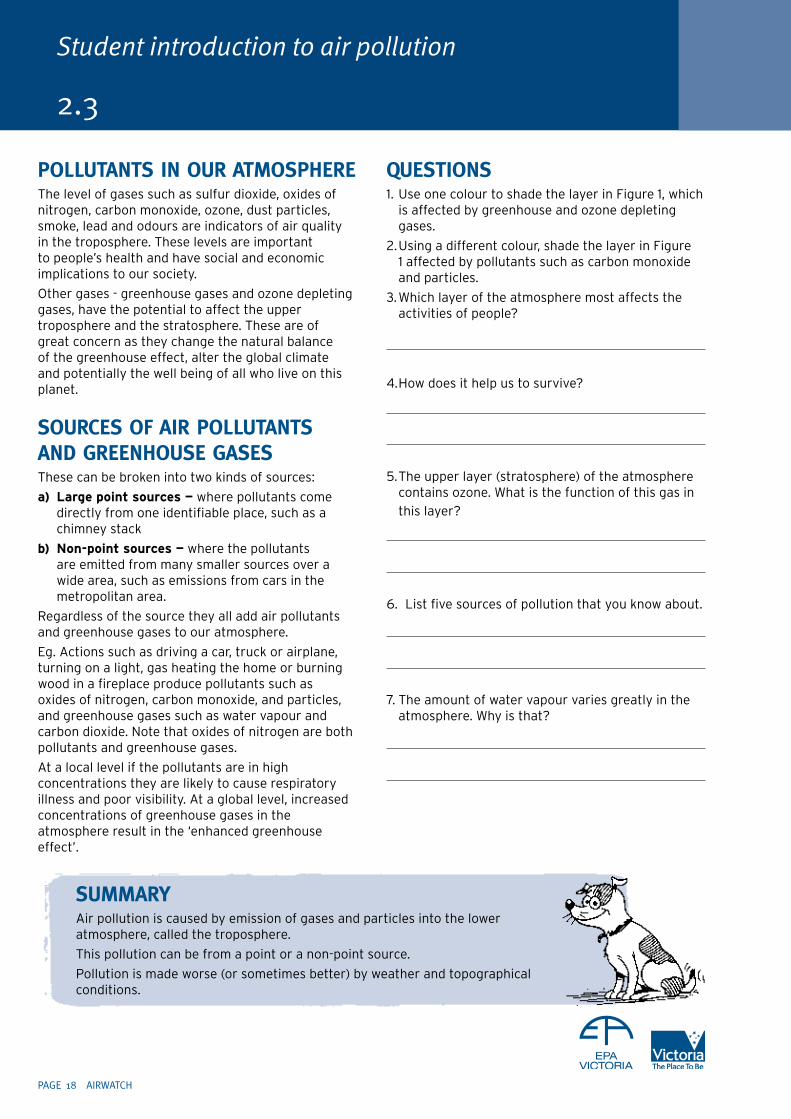
POlluTANTS IN OuR ATMOSPHERE The level of gases such as sulfur dioxide, oxides of nitrogen, carbon monoxide, ozone, dust particles, smoke, lead and odours are indicators of air quality in the troposphere. These levels are important to people’s health and have social and economic implications to our society.
Other gases - greenhouse gases and ozone depleting gases, have the potential to affect the upper troposphere and the stratosphere. These are of great concern as they change the natural balance of the greenhouse effect, alter the global climate and potentially the well being of all who live on this planet.
SOuRCES OF AIR POlluTANTS ANd GREENHOuSE GASES These can be broken into two kinds of sources:
a) large point sources — where pollutants come directly from one identifiable place, such as a chimney stack
b) non-point sources — where the pollutants are emitted from many smaller sources over a wide area, such as emissions from cars in the metropolitan area.
Regardless of the source they all add air pollutants and greenhouse gases to our atmosphere.
Eg. Actions such as driving a car, truck or airplane, turning on a light, gas heating the home or burning wood in a fireplace produce pollutants such as oxides of nitrogen, carbon monoxide, and particles, and greenhouse gases such as water vapour and carbon dioxide. Note that oxides of nitrogen are both pollutants and greenhouse gases.
At a local level if the pollutants are in high concentrations they are likely to cause respiratory illness and poor visibility. At a global level, increased concentrations of greenhouse gases in the atmosphere result in the ‘enhanced greenhouse effect’.
quESTIONS1. Use one colour to shade the layer in Figure 1, which
is affected by greenhouse and ozone depleting gases.
2. Using a different colour, shade the layer in Figure 1 affected by pollutants such as carbon monoxide and particles.
3. Which layer of the atmosphere most affects the activities of people?
4. How does it help us to survive?
5. The upper layer (stratosphere) of the atmosphere contains ozone. What is the function of this gas in
this layer?
6. List five sources of pollution that you know about.
7. The amount of water vapour varies greatly in the atmosphere. Why is that?
SuMMARy Air pollution is caused by emission of gases and particles into the lower
atmosphere, called the troposphere.
This pollution can be from a point or a non-point source.
Pollution is made worse (or sometimes better) by weather and topographical conditions.
03 9695 2722 03 9695 2780
AIRWATCH PAGE 19
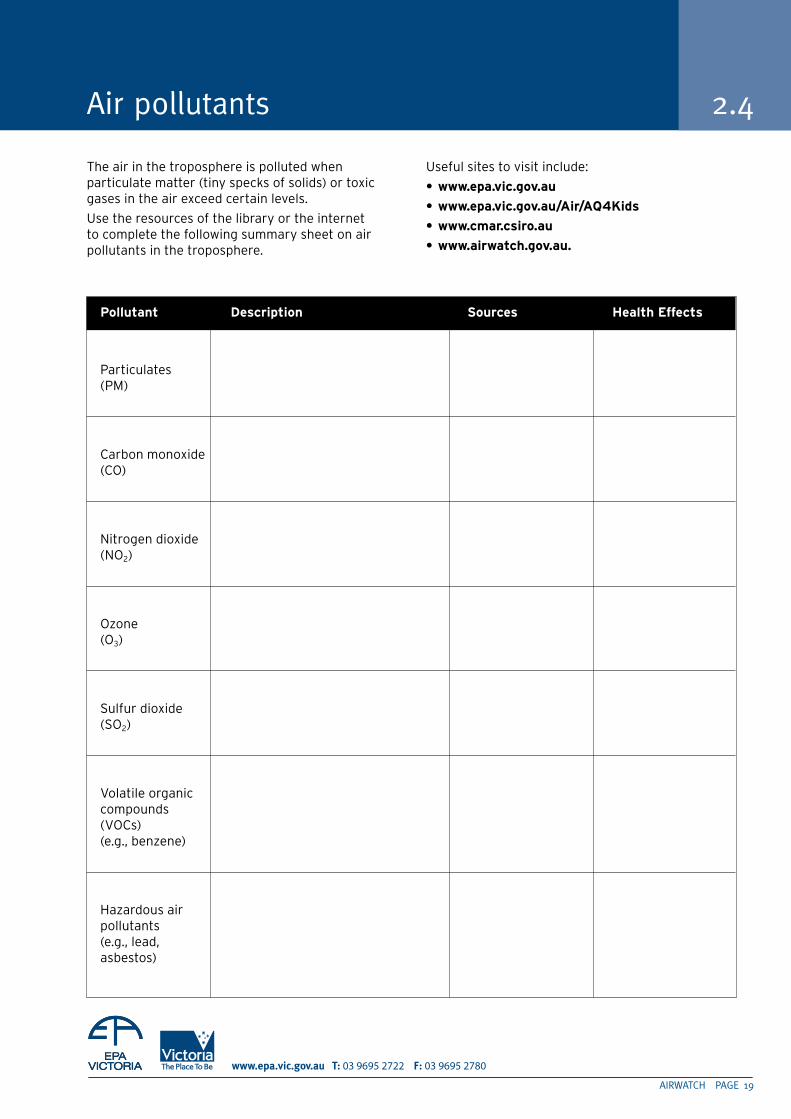
The air in the troposphere is polluted when particulate matter (tiny specks of solids) or toxic gases in the air exceed certain levels.
Use the resources of the library or the internet to complete the following summary sheet on air pollutants in the troposphere.
Useful sites to visit include:
• www.epa.vic.gov.au
• www.epa.vic.gov.au/air/aQ4Kids
• www.cmar.csiro.au
• www.airwatch.gov.au.
Pollutant Description sources health effects
Particulates (PM)
Carbon monoxide (CO)
Nitrogen dioxide (NO2)
Ozone (O3)
Sulfur dioxide (SO2)
Volatile organic compounds (VOCs) (e.g., benzene)
Hazardous air pollutants (e.g., lead, asbestos)
Air pollutants 2.4

Student introduction to air pollution
2.5 Greenhouse gases
PAGE 20 AIRWATCH
Greenhouse gases are gases in our atmosphere that trap heat energy from the sun.
Greenhouse gases occur naturally but can also be made through human activity eg. water vapour, carbon dioxide, methane, nitrous oxide, ozone and aerosols.
Use the resources of the library or the internet to complete the following summary sheet on greenhouse gases.
Q. Which greenhouse gases are only made by human activity?
Useful websites and resources:
• Victorian Greenhouse strategy, www.greenhouse.vic.gov.au.
• australian Greenhouse office, www.greenhouse.gov.au.
• Csiro Centre for Marine & atmospheric research, www.cmar.csiro.au.
• australian Greenhouse Calculator, www.epa.vic.gov.au.
• Bottomley e et al 2000, secondary Greenhouse activities 2, Ceres, Brunswick east. Phone 03 9387 2609
Greenhouse gas Description sources Global effects
Water vapour (H2O)
Carbon dioxide
(CO2)
Methane (CH4)
Nitrous oxide (N2O)
Ozone (O3 )
Aerosols
Chlorofluorocarbons (CFCs)
Hydrofluorocarbons (HFCs)
Perfluorocarbons (PFCs)
Sulphur hexafluoride (SF6)

03 9695 2722 03 9695 2780
AIR ANd WEATHER
AIRWATCH PAGE 21
this section will provide students with an understanding of wind, rainfall and temperature
these aspects of weather are very important, as they significantly affect air pollution.
SECT
ION
> 3
PAGE 22 AIRWATCH
WEATHER MEASuREMENTSSimply measuring air pollution alone does not tell you a lot. To obtain an understanding about why air quality can vary from day to day, we must measure meteorological conditions as well – such things as winds, temperature, rainfall, cloud cover and pressure conditions.
WINdSWind is moving air. It is the wind that transports the pollutants and dilutes the pollution on the way. Knowledge of wind speed and direction can help you calculate in which direction pollutants will travel and how much they will mix with the unpolluted air.
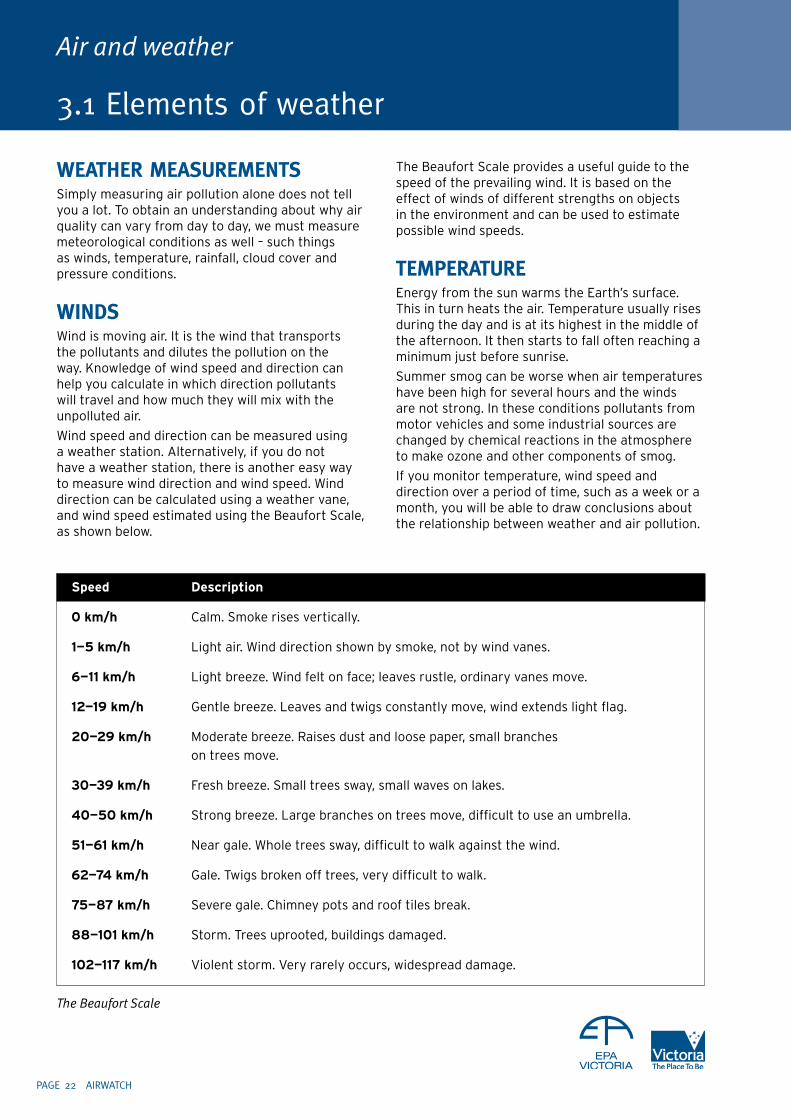
Wind speed and direction can be measured using a weather station. Alternatively, if you do not have a weather station, there is another easy way to measure wind direction and wind speed. Wind direction can be calculated using a weather vane, and wind speed estimated using the Beaufort Scale, as shown below.
The Beaufort Scale provides a useful guide to the speed of the prevailing wind. It is based on the effect of winds of different strengths on objects in the environment and can be used to estimate possible wind speeds.
TEMPERATuREEnergy from the sun warms the Earth’s surface. This in turn heats the air. Temperature usually rises during the day and is at its highest in the middle of the afternoon. It then starts to fall often reaching a minimum just before sunrise.
Summer smog can be worse when air temperatures have been high for several hours and the winds are not strong. In these conditions pollutants from motor vehicles and some industrial sources are changed by chemical reactions in the atmosphere to make ozone and other components of smog.
If you monitor temperature, wind speed and direction over a period of time, such as a week or a month, you will be able to draw conclusions about the relationship between weather and air pollution.
Air and weather
3.1 Elements of weather
speed Description
0 km/h Calm. Smoke rises vertically.
1—5 km/h Light air. Wind direction shown by smoke, not by wind vanes.
6—11 km/h Light breeze. Wind felt on face; leaves rustle, ordinary vanes move.
12—19 km/h Gentle breeze. Leaves and twigs constantly move, wind extends light flag.
20—29 km/h Moderate breeze. Raises dust and loose paper, small branches
on trees move.
30—39 km/h Fresh breeze. Small trees sway, small waves on lakes.
40—50 km/h Strong breeze. Large branches on trees move, difficult to use an umbrella.
51—61 km/h Near gale. Whole trees sway, difficult to walk against the wind.
62—74 km/h Gale. Twigs broken off trees, very difficult to walk.
75—87 km/h Severe gale. Chimney pots and roof tiles break.
88—101 km/h Storm. Trees uprooted, buildings damaged.
102—117 km/h Violent storm. Very rarely occurs, widespread damage.
The Beaufort Scale
03 9695 2722 03 9695 2780
AIRWATCH PAGE 23
AIR PRESSuREAir has weight. It exerts pressure on the Earth’s surface. The higher we are the less air there is above us, and the lower the atmospheric pressure. Air pressure or barometric pressure at sea level fluctuates around 1013 hectopascals (hPa). It can drop to 970 hPa during severe storms. In a high-pressure system it can reach 1040 hPa.
It is common in Australian cities to find higher air pollution when a high-pressure system is near and to the east of the city. The winds are basically northerly before the arrival of the sea breeze in the afternoon, keeping the temperatures higher.
PRECIPITATIONRain, snow, hail and dew are all forms of precipitation. Precipitation is the term used to describe water reaching the ground or ocean from the atmosphere. As the temperature of air falls it contains less water vapour. If the amount of water vapour exceeds what the air can hold at a given temperature (100%) the excess will condense, forming dew, fog, frost or rain.
dEW ANd FROSTTiny droplets of water called dew often form at night on cold surfaces, such as grass and leaves. In deserts, dew may be the only form of moisture available to plants and animals. On clear, still nights the temperature at ground level can fall to below 0°C. When this happens, water vapour can turn into solid crystals of frost. Frost does not usually occur on cloudy nights. Clouds trap heat, acting like a blanket. Frost occurs more often in valleys than in higher areas because cold air is dense and flows down the valley slopes.
FOGWhen warm moist air rapidly cools tiny droplets of water may form and stay suspended in the air. This is fog and is sometimes called low cloud. Warm sea breezes often produce fog when they move over colder land surfaces. Fog is often thicker in valleys and low-lying areas.
RAINFAll ANd AIR POlluTIONAir pollution is strongly dependent on rainfall. Larger particles in the air are readily washed out in light rain. Fine and ultra fine particles require moderate to heavy rain to be washed to the ground. At the time of particulate sampling one should always note rainfall events. It should be noted that pollutant gases are generally not affected by light rain. However, nitrogen dioxide dissolves in water and is washed to the ground.
Rainfall measurements will also be helpful in interpreting other air pollution measurements. For example, if there was exposed soil, windy days would cause much of this to be blown into the atmosphere and raise particulate (PM) readings. However, if there had been rain in the previous 48 hours, the soil may well stay put and hence, particulate readings would be lower.
ACTIVITy1. Describe the different forms of precipitation.
2. Find out using your library or the internet, the names of the different winds which flow across Australia.
3. Visit the Bureau of Meteorology website (www.bom.gov.au) and find the barometric pressure for each of the capital cities in Australia. Which city would be experiencing fine weather?
4. Gather temperature data from this site for the last 24 hours from the closest BoM weather station site to your school. Using this data, graph the temperature for the last 24 hours and indicate on the graph when the minimum and maximum temperature occurred.
3.1

Air and weather
PAGE 24 AIRWATCH
3.2 Weather data
COllECTING WEATHER dATAThe Bureau of Meteorology is Australia’s national weather service provider. In order to prepare a forecast of tomorrow’s weather, the Bureau must first collect a detailed picture of present weather conditions. Weather data is obtained from more than 60 Bureau-staffed observing stations around Australia and data is also provided by a network of more than 400 part-time observers. Information is also gathered from offshore islands, ships, drifting ocean buoys, automatic weather stations, aircraft and satellites.
Weather reports include readings of temperature, air pressure, humidity, wind speed and direction and rainfall. Observations of the amount of cloud cover and the number of hours of sunshine are also recorded. Measurements in the upper atmosphere are recorded in addition to the ‘surface’ observations and include humidity, pressure and wind speeds at different levels of the atmosphere. A weather balloon, tracked by radar, takes these measurements.
All the weather observations are transmitted directly to computers in the Bureau’s Regional Forecasting Centres in each capital city and the weather expected over the next one to four days is determined.
In AirWatch activities, students collect weather data using an automated weather station, or by using other weather sensing equipment, some of which is housed in a Stevenson Screen.
STEVENSON SCREENA Stevenson Screen is a wooden box with a double roof, slatted door and sides, like the one in the picture below. It is painted white and mounted, with the door facing south, so that the floor is 1.2m above ground level at a site that is free from close-by buildings and trees.
weather record sheet
Time Wind Wind Minimum Maximum Humidity Rainfall Cloud & date speed direction temperature temperature (48 hours) cover

03 9695 2722 03 9695 2780
AIRWATCH PAGE 25
3.2
ACTIVITyUsing either your weather instruments in the Stevenson Screen or your fully automated weather station, complete the following:
1. Measure the wind speed and direction using the weather station. If you do not have a weather station then you could use the Beaufort Scale or visit the Bureau of Meteorology at www.bom.gov.au. Record on your Weather Record Sheet.
2. Use your weather station or a maximum and minimum thermometer to measure temperature. Measure the humidity using either the weather station or a wet and dry bulb thermometer. Record results.
3. Record rainfall for the previous 48 hours.
4. Record cloud cover for the sampling period.
Interpretation1. Summarise the meteorological conditions that
have occurred during your sampling period.
2. What effect might these conditions have had on air quality at this time?
3. Would these weather conditions cause air pollution to be concentrated in certain directions? Explain.
ACTIVITy: WEATHERlINkThis activity has been designed to be used with a Davis weather station.
1. Open your Weatherlink software.
2. Click on the icon ‘NOAA summary of current month’, then click on ‘reports’ followed by ‘NOAA summarize month’.
3. Choose a month that has a complete set of data from the first day of the month to the last day and then click ‘OK’.
4. Click on ‘file’ and then ‘print’ to produce a copy of the month’s data.
5. Close the Weatherlink software.
6. Open ‘Excel’ from either your desktop or from the ‘Start’ menu under ‘Programs’.
7. In row 1, place headings in each cell for the following:
• Date • Time • Low temperature • High temperature • Rainfall • Barometric pressure
8. Using the ‘summary of the month’ that you printed off, input the data under each of the appropriate headings.
9. Highlight the ‘rainfall’ column and then click on ‘insert’. Click on ‘chart’ and produce an appropriate graph to show the rainfall for the month.
10. Repeat this procedure for temperature and barometric pressure.
11. Using ‘custom types’ under ‘chart’, choose a line and column graph to display rainfall and temperature.
12. After you have made sure that the graphs are correctly labeled, print off each graph.
EddIE’S ExTRAS13. Summarise what each graph shows
and mark on the graphs where the lowest and highest temperature occurred and compare this to the barometric readings you obtained. Does a relationship exist between temperature and barometric pressure?
Air and weather
3.3 The weather map
PAGE 26 AIRWATCH
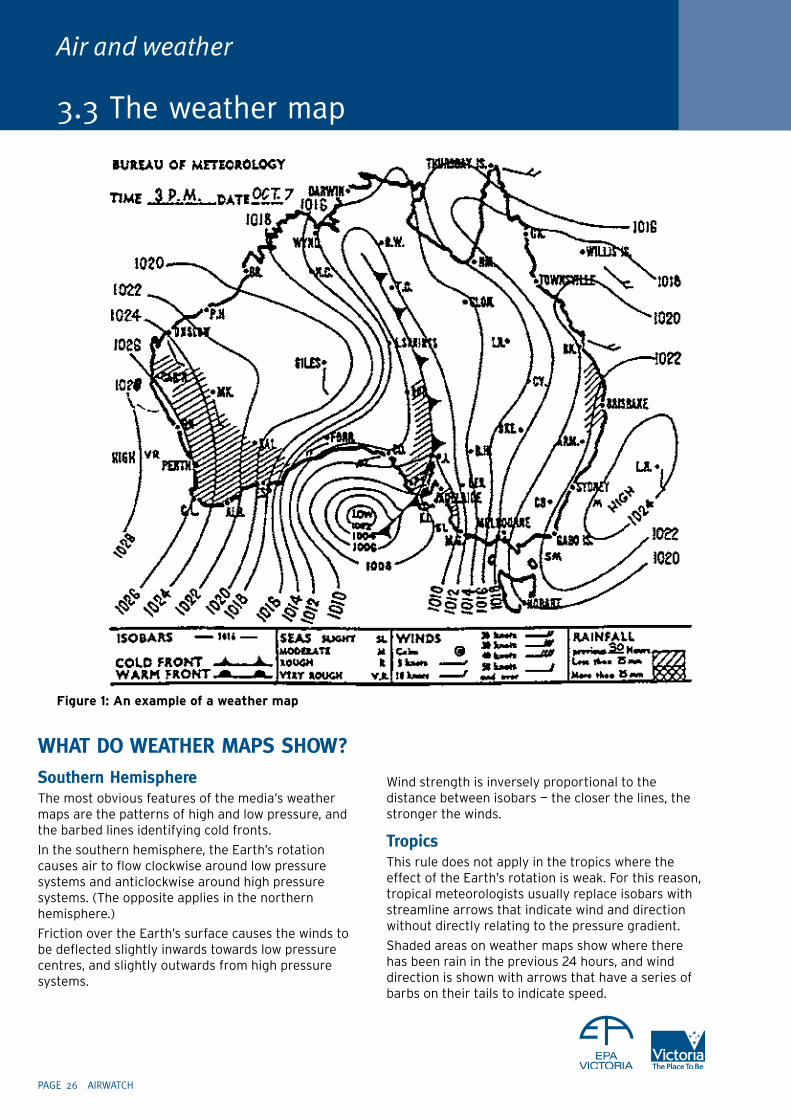
WHAT dO WEATHER MAPS SHOW?Southern HemisphereThe most obvious features of the media’s weather maps are the patterns of high and low pressure, and the barbed lines identifying cold fronts.
In the southern hemisphere, the Earth’s rotation causes air to flow clockwise around low pressure systems and anticlockwise around high pressure systems. (The opposite applies in the northern hemisphere.)
Friction over the Earth’s surface causes the winds to be deflected slightly inwards towards low pressure centres, and slightly outwards from high pressure systems.
Wind strength is inversely proportional to the distance between isobars — the closer the lines, the stronger the winds.
TropicsThis rule does not apply in the tropics where the effect of the Earth’s rotation is weak. For this reason, tropical meteorologists usually replace isobars with streamline arrows that indicate wind and direction without directly relating to the pressure gradient.
Shaded areas on weather maps show where there has been rain in the previous 24 hours, and wind direction is shown with arrows that have a series of barbs on their tails to indicate speed.
figure 1: an example of a weather map
03 9695 2722 03 9695 2780
AIRWATCH PAGE 2�
3.3
WEATHER CHARTSThe coverage on media weather charts is usually limited to the continent and surrounding oceans. The Bureau of Meteorology also produces global charts to take account of weather systems interacting with each other over great distances.
Global charts are necessary when preparing forecasts up to four days ahead, and framing the monthly climate monitoring bulletins. (Provided by the Bureau of Meteorology)
ACTIVITyUsing the weather map in Figure 1, answer the following questions:
1. What is the lowest air pressure recorded on the map?
2. What is the highest air pressure recorded on the map?
3. What name is given to a line joining places of equal barometric pressure?
4. Would a pressure of 1024 hectopascals be high or low?
5. What is the air pressure at:
(a) Alice Springs? ___________________________
(b) Hobart?_________________________________
(c) Perth? __________________________________
6. What is the wind speed and direction at:
(a) Giles? ___________________________________
(b) Willis Island? ____________________________
(c) Rockhampton? ___________________________
7. As the cold front moves forward and passes to the east of Adelaide, what effect will this have on the wind direction at Adelaide?
8. Estimate the wind direction at:
(a) Townsville ________________________________
(b) Thursday Island ___________________________
(c) Port Hedland _____________________________
9. Place arrows on the map to indicate the direction of the winds around the low-pressure centre and the high-pressure centre.
10. Imagine you read the weather report on the television news. Prepare a weather report for Brisbane or Perth.
Air and weather
3.4 Weather and air pollution
PAGE 28 AIRWATCH
FACTORS AFFECTING AIR POlluTIONThe factors that need to be considered when discussing air pollution and what happens to it are:
1. winds
2. turbulent motions
3. inversions
4. coastal influences.
1) WINdSSea and land breezesThe significance of sea and land breezes in air pollution are:
• they tend to have fairly fixed and steady directions, therefore any pollutants move in that direction
• they tend to be shallow flows (they do not go to a great height) so pollutants are trapped and do not mix with the air above.
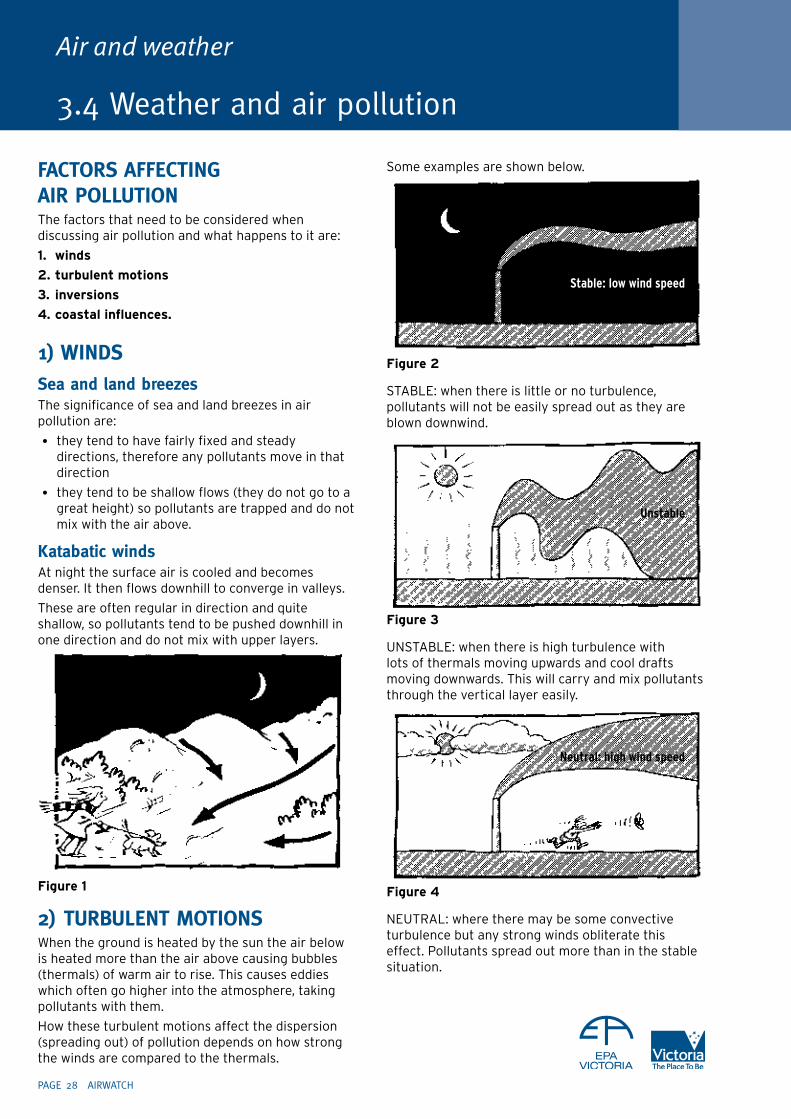
katabatic windsAt night the surface air is cooled and becomes denser. It then flows downhill to converge in valleys.
These are often regular in direction and quite shallow, so pollutants tend to be pushed downhill in one direction and do not mix with upper layers.
figure 1
2) TuRbulENT MOTIONSWhen the ground is heated by the sun the air below is heated more than the air above causing bubbles (thermals) of warm air to rise. This causes eddies which often go higher into the atmosphere, taking pollutants with them.
How these turbulent motions affect the dispersion (spreading out) of pollution depends on how strong the winds are compared to the thermals.
Some examples are shown below.
figure 2
STABLE: when there is little or no turbulence, pollutants will not be easily spread out as they are blown downwind.
figure 3
UNSTABLE: when there is high turbulence with lots of thermals moving upwards and cool drafts moving downwards. This will carry and mix pollutants through the vertical layer easily.
figure 4
NEUTRAL: where there may be some convective turbulence but any strong winds obliterate this effect. Pollutants spread out more than in the stable situation.
Stable: low wind speed
Unstable
Neutral: high wind speed
03 9695 2722 03 9695 2780
3.4
AIRWATCH PAGE 29
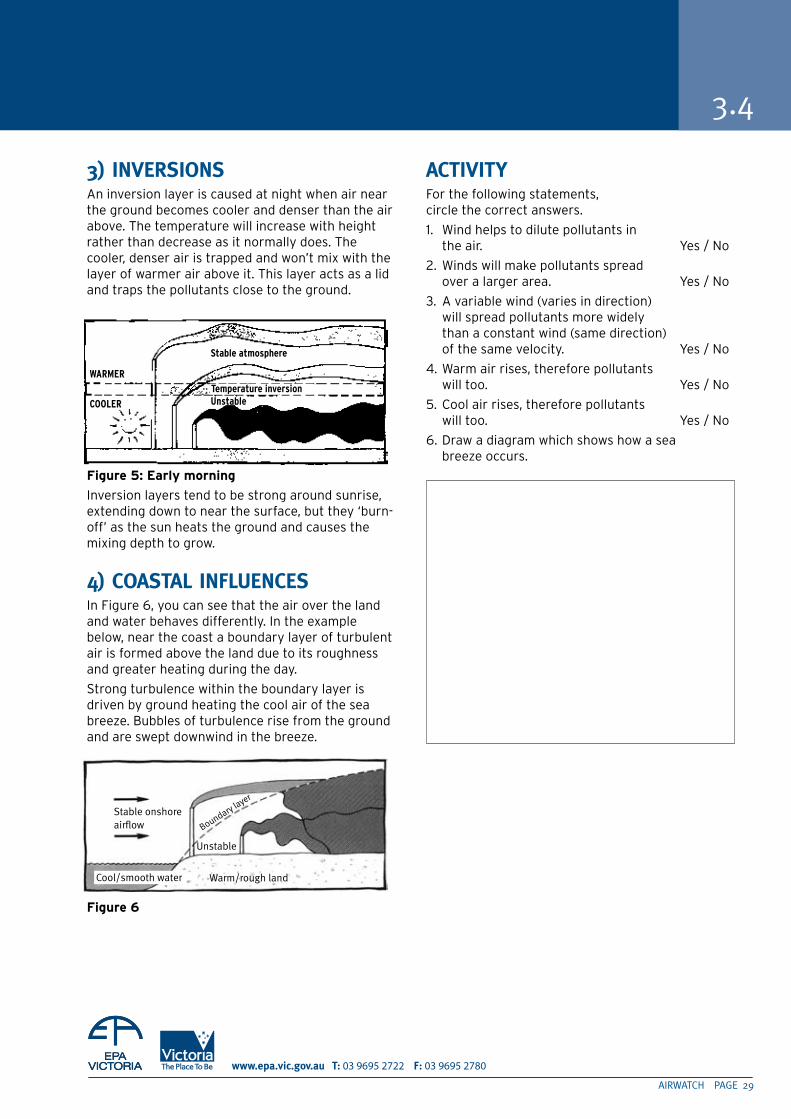
3) INVERSIONSAn inversion layer is caused at night when air near the ground becomes cooler and denser than the air above. The temperature will increase with height rather than decrease as it normally does. The cooler, denser air is trapped and won’t mix with the layer of warmer air above it. This layer acts as a lid and traps the pollutants close to the ground.
figure 5: early morning
Inversion layers tend to be strong around sunrise, extending down to near the surface, but they ‘burn-off’ as the sun heats the ground and causes the mixing depth to grow.
4) COASTAl INFluENCESIn Figure 6, you can see that the air over the land and water behaves differently. In the example below, near the coast a boundary layer of turbulent air is formed above the land due to its roughness and greater heating during the day.
Strong turbulence within the boundary layer is driven by ground heating the cool air of the sea breeze. Bubbles of turbulence rise from the ground and are swept downwind in the breeze.
figure 6
ACTIVITyFor the following statements, circle the correct answers.
1. Wind helps to dilute pollutants in the air. Yes / No
2. Winds will make pollutants spread over a larger area. Yes / No
3. A variable wind (varies in direction) will spread pollutants more widely than a constant wind (same direction) of the same velocity. Yes / No
4. Warm air rises, therefore pollutants will too. Yes / No
5. Cool air rises, therefore pollutants will too. Yes / No
6. Draw a diagram which shows how a sea breeze occurs.
Stable onshore airflow
Cool/smooth water Warm/rough land
Unstable
Boundary layer
WARMERTemperature inversion
Stable atmosphere
COOLER Unstable

3.5 Inversions
Air and weather
kEEPING THE lId ON POlluTIONIn the morning hours, the air over a city is often well mixed up to a height of about 500 metres. Above that, the temperature increases sharply for tens or even hundreds of metres. As cooler air is denser than warmer air, the cooler air will stay trapped near to the ground. This is what is called an ‘inversion’.
The effect of this phenomenon is to limit the height to which pollution can rise. This is like having a lid on top keeping in the air that contains pollutants, such as smoke and car exhaust gases. During the day, they mix with the lower layer of air close to the ground, leading to much higher air pollution where we live than would otherwise happen if the inversion was not present.
The following activity will allow you to see the effect that atmospheric inversions have on the vertical mixing of air pollutants.
Equipment (per group)Sodium chloride solution (~5%)
Cooking oil
Blue food colouring
Glass beaker (100ml)
Micro-pipette and teat
Gauze mat
Tripod
Candle
Test procedure1. Set up the equipment as shown in the diagram
below.
The salty water becomes the model of the lower atmosphere with an inversion at the oil-water surface.
2. Stir the interface a little. Observe how stable it is with internal waves moving to and fro. They die out due to viscous forces on the beaker walls. These also occur in nature.
3. Introduce some dyed fresh water through the pipette. This models the hot gas from a real chimney. Observe that it rises, somewhat diluted, to the inversion level but cannot get through.
4. Slowly heat with the candle to model the daytime mixing due to solar heating. Observe that the dyed water is soon mixed down to the ‘ground’. The chimney emission is said to have ‘fumigated’ down to the ground resulting in high pollution levels where before there were none.
ResultsDraw a diagram of the results at part 3 and 4 of this exercise.
InterpretationDescribe how an inversion layer works to cause higher pollution levels around you.
PAGE 30 AIRWATCH
03 9695 2722 03 9695 2780
WHy POlluTANTS MOVE WHERE THEy dOThe layer of air in which we live is called the troposphere. This is the layer in which the pollution that we produce is dispersed or scattered. How this pollution moves around us depends on how the air in this layer is moving.
If the air is still, many of the pollutants will stay close to the ground and us. If it is turbulent (blustery), pollutants will be dispersed all over the place. If the air is moving in a constant direction, the pollutants will move with it.
The following exercises will allow you to see what the air around you is doing on different days and let you get an idea of the various ways in which pollutants around you may be dispersed. Of course, it may also show you from where pollution may be coming to your area.
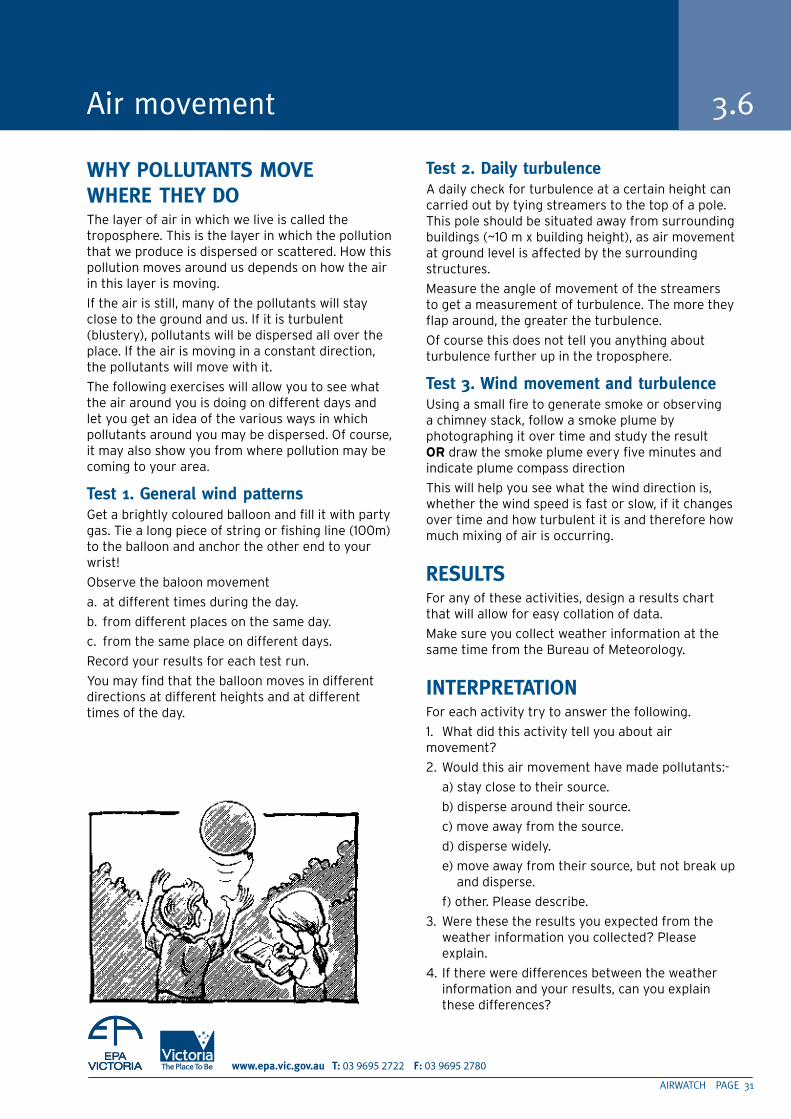
Test 1. General wind patternsGet a brightly coloured balloon and fill it with party gas. Tie a long piece of string or fishing line (100m) to the balloon and anchor the other end to your wrist!
Observe the baloon movement
a. at different times during the day.
b. from different places on the same day.
c. from the same place on different days.
Record your results for each test run.
You may find that the balloon moves in different directions at different heights and at different times of the day.
Test 2. daily turbulenceA daily check for turbulence at a certain height can carried out by tying streamers to the top of a pole. This pole should be situated away from surrounding buildings (~10 m x building height), as air movement at ground level is affected by the surrounding structures.
Measure the angle of movement of the streamers to get a measurement of turbulence. The more they flap around, the greater the turbulence.
Of course this does not tell you anything about turbulence further up in the troposphere.
Test 3. Wind movement and turbulenceUsing a small fire to generate smoke or observing a chimney stack, follow a smoke plume by photographing it over time and study the result or draw the smoke plume every five minutes and indicate plume compass direction
This will help you see what the wind direction is, whether the wind speed is fast or slow, if it changes over time and how turbulent it is and therefore how much mixing of air is occurring.
RESulTSFor any of these activities, design a results chart that will allow for easy collation of data.
Make sure you collect weather information at the same time from the Bureau of Meteorology.
INTERPRETATIONFor each activity try to answer the following.
1. What did this activity tell you about air movement?
2. Would this air movement have made pollutants:-
a) stay close to their source.
b) disperse around their source.
c) move away from the source.
d) disperse widely.
e) move away from their source, but not break up and disperse.
f) other. Please describe.
3. Were these the results you expected from the weather information you collected? Please explain.
4. If there were differences between the weather information and your results, can you explain these differences?
AIRWATCH PAGE 31
Air movement 3.6
bACkGROuNd INFORMATIONPollutants can be dispersed by the wind and the extent of dispersion varies from one day to the next depending upon the wind speed, wind direction, and rainfall. Wind speed and direction also can vary with height. Wind may be calm at ground level but quite strong at 100m and then change its direction and speed again at 200m height. Several changes in speed and/or direction can occur through one vertical profile.
Changes in wind speed and direction with height can be observed by looking at industrial smoke plumes. A chimney smoke plume may rise slowly and vertically at first, then suddenly change direction and rate of dispersion when it reaches a channel of faster moving air.
Particularly at night in clear conditions, the winds at the height of industrial sources of pollution (chimney stacks) can be very different to the wind conditions measured at the ground. The winds also vary greatly aloft in valleys and mountainous regions and near the coast during sea breezes. It is important to know something about winds aloft for characterising the air pollution potential of a region. Surveys of the winds in the lowest 100-500m above the ground are usually important.
Measuring winds aloft using the Tethered Balloon System allows you to observe what happens to the wind at ground level up to heights of 500m. The activity is only useable in light winds at ground level.
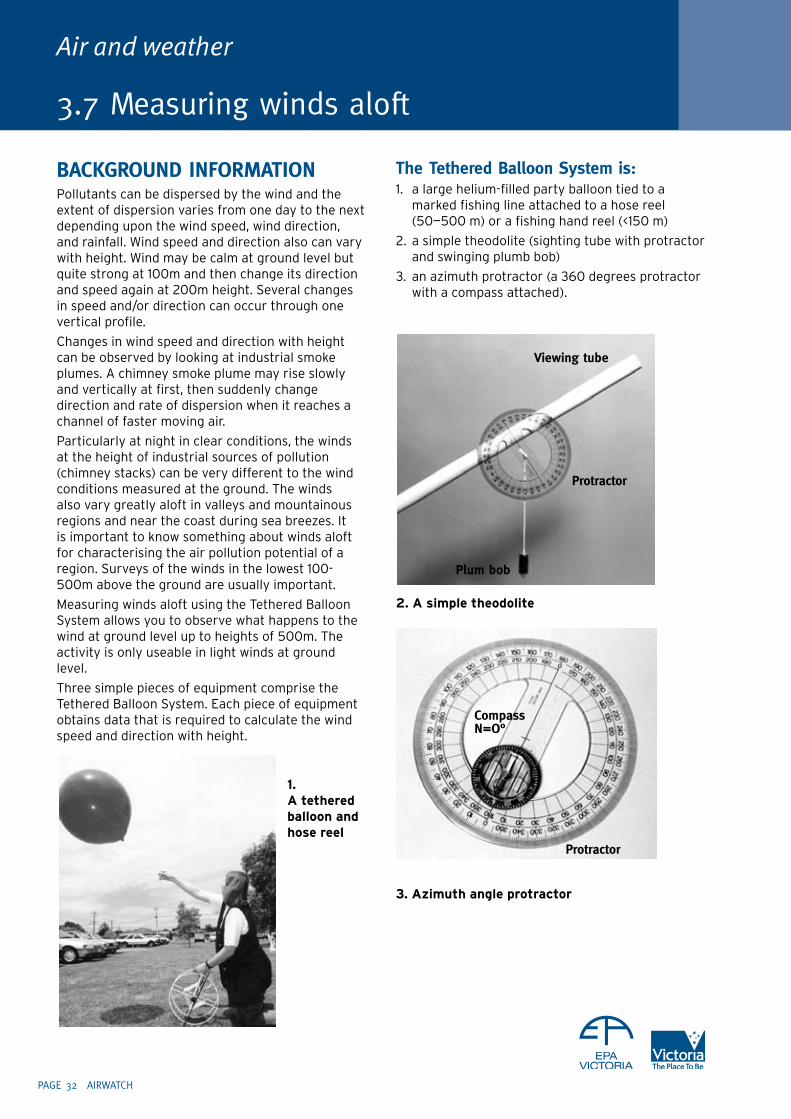
Three simple pieces of equipment comprise the Tethered Balloon System. Each piece of equipment obtains data that is required to calculate the wind speed and direction with height.
1. a tethered balloon and hose reel
The Tethered balloon System is: 1. a large helium-filled party balloon tied to a
marked fishing line attached to a hose reel (50—500 m) or a fishing hand reel (<150 m)
2. a simple theodolite (sighting tube with protractor and swinging plumb bob)
3. an azimuth protractor (a 360 degrees protractor with a compass attached).
2. a simple theodolite
3. azimuth angle protractor
Air and weather
3.7 Measuring winds aloft
PAGE 32 AIRWATCH
Viewing tube
Protractor
Plum bob
Protractor
Compass N=O°
03 9695 2722 03 9695 2780
AIRWATCH PAGE 33
3.7
ACTIVITy: MEASuRING WINdS AlOFT Aim:• To record, at regular intervals with increasing
tether length, the angle of elevation and azimuth of a tethered balloon.
• To calculate the height of the balloon during the experiment.
• To calculate wind speed with height using a computer program BALLOON.EXE
in this activity you will collect the following data:
• the length of tether (reading from the scale on the fishing line)
• angle of elevation of the balloon from the horizontal (reading from theodolite)
• azimuth - the angle of the balloon from NORTH in a clockwise direction (reading from compass/protractor)
The height of the balloon at each reading can be calculated by trigonometry, using the series of measurements of length of tether and the angle of elevation. Approximate the height of the balloon as you go by simple trigonometry (example in box below). This is important because if the balloon is to be flown at heights above 100m then a permit must be obtained from the Civil Aviation Safety Authority (CASA).
The BALLOON.EXE program calculates the exact height. The angle of elevation, the azimuth angle and the length of tether are used to calculate the wind speed and direction for each height reading.
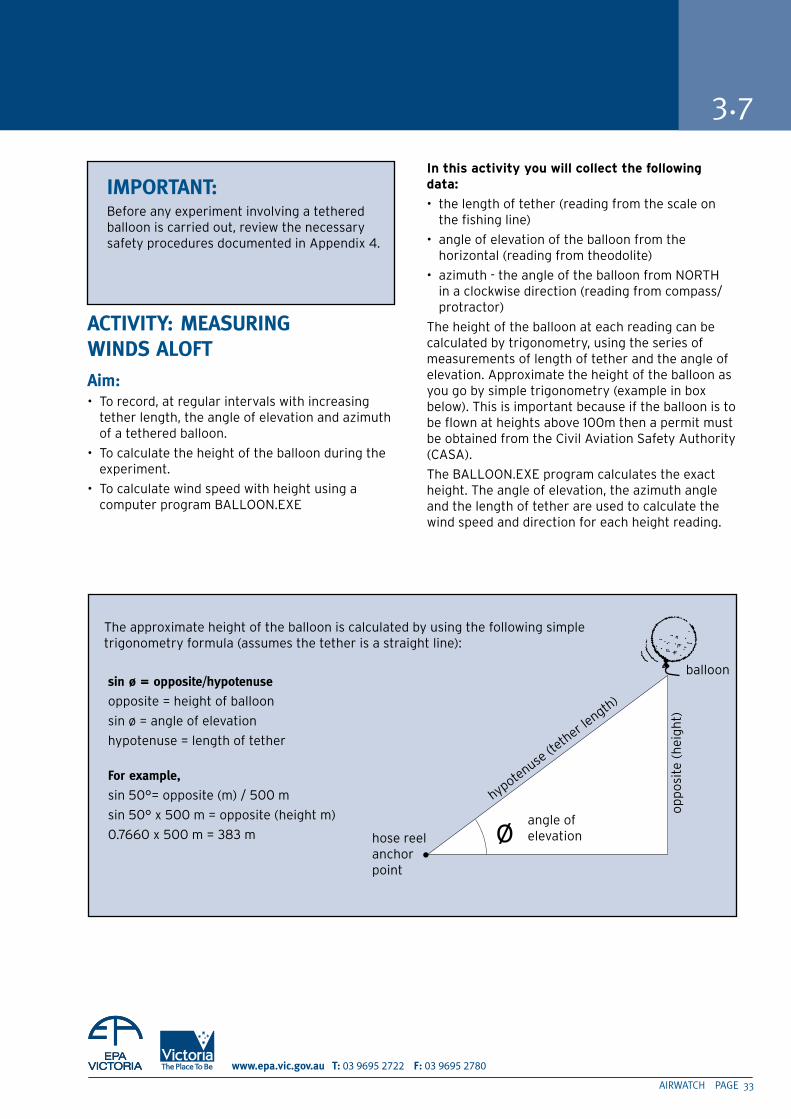
The approximate height of the balloon is calculated by using the following simple trigonometry formula (assumes the tether is a straight line):
sin ø = opposite/hypotenuse
opposite = height of balloon
sin ø = angle of elevation
hypotenuse = length of tether
For example,
sin 50°= opposite (m) / 500 m
sin 50° x 500 m = opposite (height m)
0.7660 x 500 m = 383 m øhypotenuse
(teth
er length
)
op
po
site
(h
eig
ht)
hose reel anchor point
angle of elevation
balloon
IMPORTANT: Before any experiment involving a tethered
balloon is carried out, review the necessary safety procedures documented in Appendix 4.
Air and weather
3.7
EquIPMENT:To assemble the Tethered Balloon System refer to the instructions in Section 11.8, Appendix 6.
SITE PROCEduRE: Setting up at the site • hose reel tether: Align the launching side
of the reel downwind and peg the hose reel at each corner. fishing reel tether: Hold the reel securely whilst inflating the balloon and anchoring it to the reel.
• Inflate the balloon to a circumference of ~1800 mm or ~575 mm diameter. The easiest way to inflate to the correct size is to cut a 1800 mm piece of string and wrap the string around the middle of the balloon as it inflates. Tie off the balloon when the string ends meet. Be careful that you do not let go of the balloon!
• Tie a short piece of string to the balloon, and tie the string to the swivel on the fishing line.
• The balloon is now ready to launch.
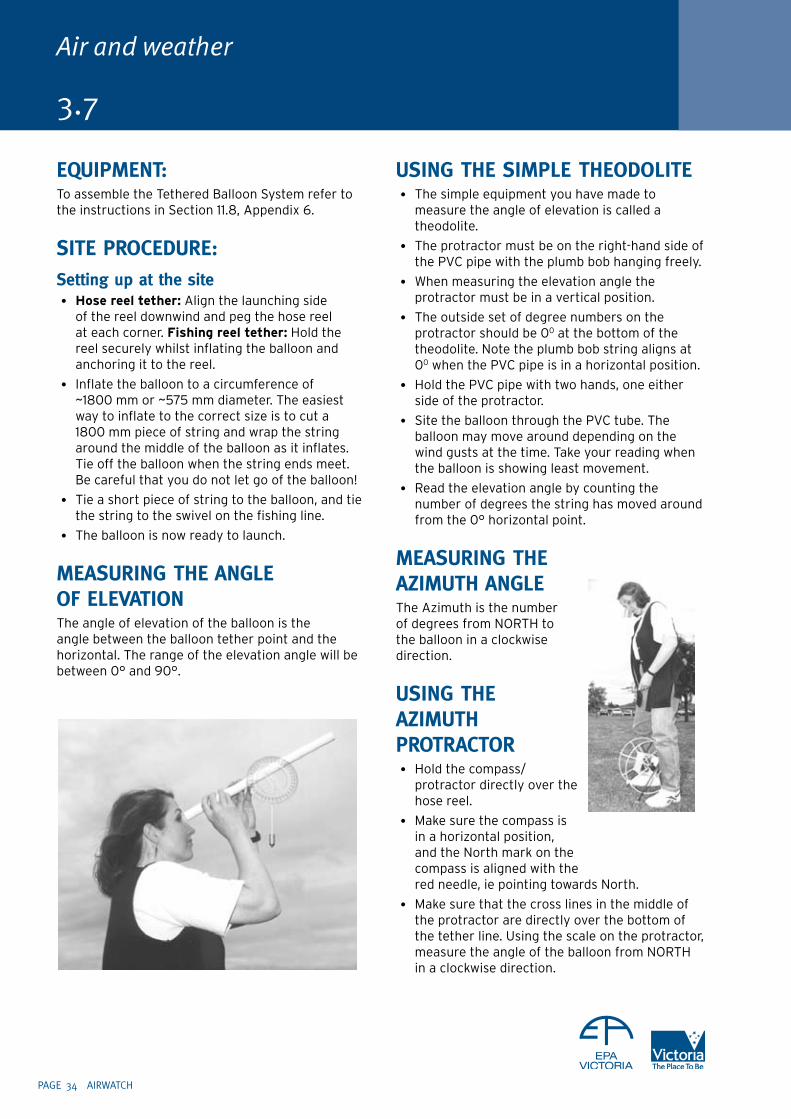
MEASuRING THE ANGlE OF ElEVATIONThe angle of elevation of the balloon is the angle between the balloon tether point and the horizontal. The range of the elevation angle will be between 0° and 90°.
uSING THE SIMPlE THEOdOlITE • The simple equipment you have made to
measure the angle of elevation is called a theodolite.
• The protractor must be on the right-hand side of the PVC pipe with the plumb bob hanging freely.
• When measuring the elevation angle the protractor must be in a vertical position.
• The outside set of degree numbers on the protractor should be 00 at the bottom of the theodolite. Note the plumb bob string aligns at 00 when the PVC pipe is in a horizontal position.
• Hold the PVC pipe with two hands, one either side of the protractor.
• Site the balloon through the PVC tube. The balloon may move around depending on the wind gusts at the time. Take your reading when the balloon is showing least movement.
• Read the elevation angle by counting the number of degrees the string has moved around from the 0° horizontal point.
MEASuRING THE AzIMuTH ANGlEThe Azimuth is the number of degrees from NORTH to the balloon in a clockwise direction.
uSING THE AzIMuTH PROTRACTOR • Hold the compass/
protractor directly over the hose reel.
• Make sure the compass is in a horizontal position, and the North mark on the compass is aligned with the red needle, ie pointing towards North.
• Make sure that the cross lines in the middle of the protractor are directly over the bottom of the tether line. Using the scale on the protractor, measure the angle of the balloon from NORTH in a clockwise direction.
PAGE 34 AIRWATCH
03 9695 2722 03 9695 2780
3.7
RECORd yOuR dATA IN THE TAblE IN APPENdIx 5
CONduCTING THE ExPERIMENT• Launch 50 m of tether, and lock the reel.
Record the angle of elevation using the simple theodolite and the azimuth angle using the Azimuth protractor. Record time, weather observations, cloud detail.
• Repeat at 50 m intervals to 500 m or less if you wish. If you are flying the 150 m hand-held reel record the angle of elevation and azimuth angle every 10 m.
• Upon winding in the balloon, be sure to relieve the strain on the hose reel, otherwise it will collapse!
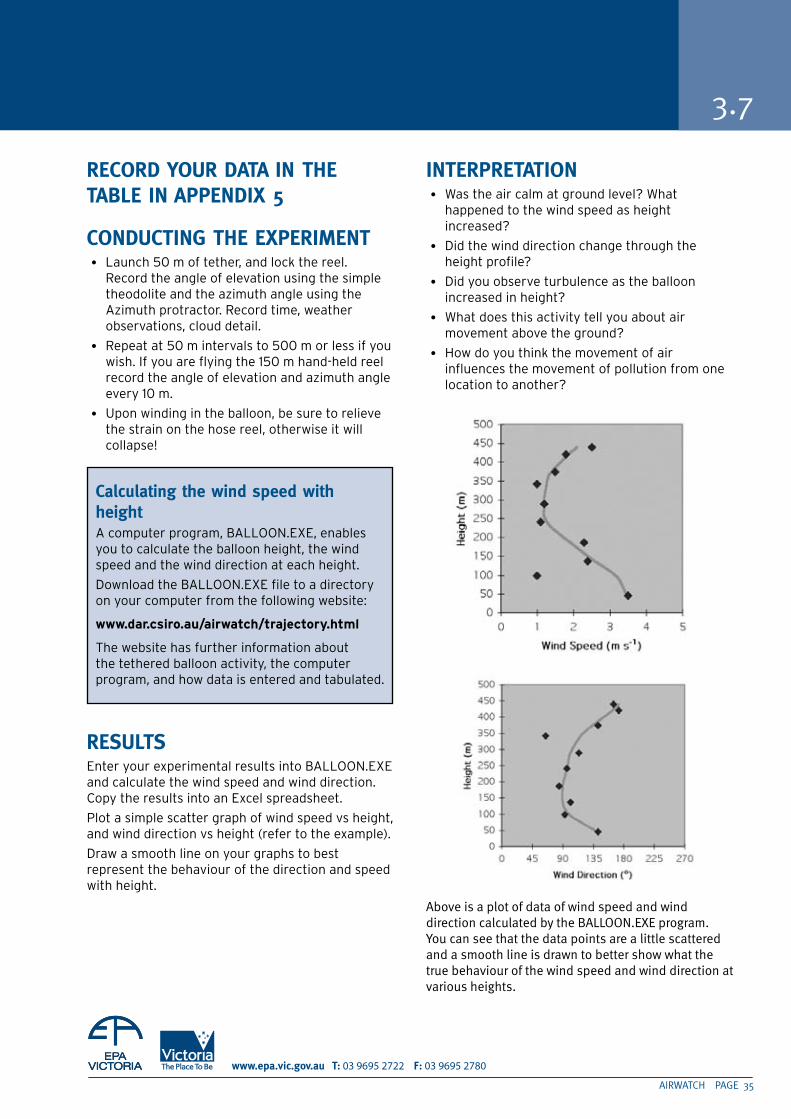
RESulTSEnter your experimental results into BALLOON.EXE and calculate the wind speed and wind direction. Copy the results into an Excel spreadsheet.
Plot a simple scatter graph of wind speed vs height, and wind direction vs height (refer to the example).
Draw a smooth line on your graphs to best represent the behaviour of the direction and speed with height.
INTERPRETATION• Was the air calm at ground level? What
happened to the wind speed as height increased?
• Did the wind direction change through the height profile?
• Did you observe turbulence as the balloon increased in height?
• What does this activity tell you about air movement above the ground?
• How do you think the movement of air influences the movement of pollution from one location to another?
Above is a plot of data of wind speed and wind direction calculated by the BALLOON.EXE program. You can see that the data points are a little scattered and a smooth line is drawn to better show what the true behaviour of the wind speed and wind direction at various heights.
AIRWATCH PAGE 35
Calculating the wind speed with height A computer program, BALLOON.EXE, enables you to calculate the balloon height, the wind speed and the wind direction at each height.
Download the BALLOON.EXE file to a directory on your computer from the following website:
www.dar.csiro.au/airwatch/trajectory.html
The website has further information about the tethered balloon activity, the computer program, and how data is entered and tabulated.

Air and weather
3.7
EddIE’S ExTRAS:A house chimney is emitting smoke where you carried out this activity.
Would the air movement you observed in your experiment have made the smoke:
(a) stay close to the chimney
(b) disperse around the chimney
(c) move away from the chimney
(d) disperse widely
(e) move away from the chimney, but not break up and disperse
or
(f) other — please describe.
PAGE 36 AIRWATCH
03 9695 2722 03 9695 2780
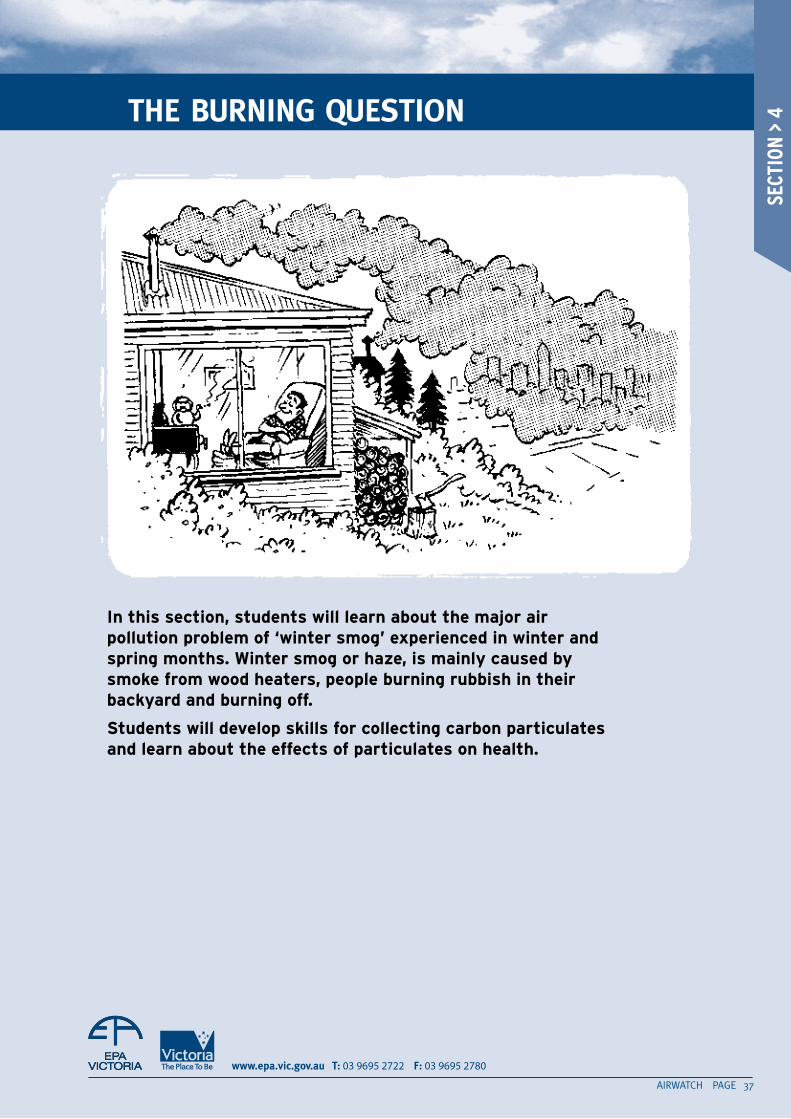
in this section, students will learn about the major air pollution problem of ‘winter smog’ experienced in winter and spring months. winter smog or haze, is mainly caused by smoke from wood heaters, people burning rubbish in their backyard and burning off.
students will develop skills for collecting carbon particulates and learn about the effects of particulates on health.
THE buRNING quESTION
AIRWATCH PAGE 3�
SECT
ION
> 4
A micrometre (µm) is one thousandth of a millimetre.
GAzE AT THE HAzEHave you ever noticed a smoky brown smudge on the horizon or the smoke trails from a chimney or forest fire? Do you know what you were looking at on these occasions?
We call this situation winter smog or haze. What you were looking at were tiny particles or ‘respirable’ particulates floating in the air. These particles scatter sunlight away from the observer making the skyline look brown and the air dirty and spoiling the view. They can also be the cause of runny noses and coughing but worse still they can be inhaled right into our lungs making worse conditions such as bronchitis and asthma and may even cause death.
Most cities have the highest concentration of winter smog in the colder months due to the use of wood-fires and weather. It occurs when there is little or no wind and is usually seen in the early morning and disappears by midday.
Ever since humans discovered fire, we have been releasing particulates into the air and causing problems. However, it is only recently that scientists have discovered the bad news. Winter Smog has been causing problems for a long time – we just didn’t know it!
EddIE’S ExTRAS Go to the referenCe section of the Australian Greenhouse Calculator. Look at the winter pollution animation.
Go to the ‘Cause and formation of winter pollution’ hotlink under the animations.
a Draw a 5-row x 2-column table (by hand or on the computer) which fills an A4 page in portrait view.
b In the left hand column draw each of the five storyboards which illustrate the steps in winter smog formation.
c In the right-hand column describe what is happening in each picture.
Include a title for your table.
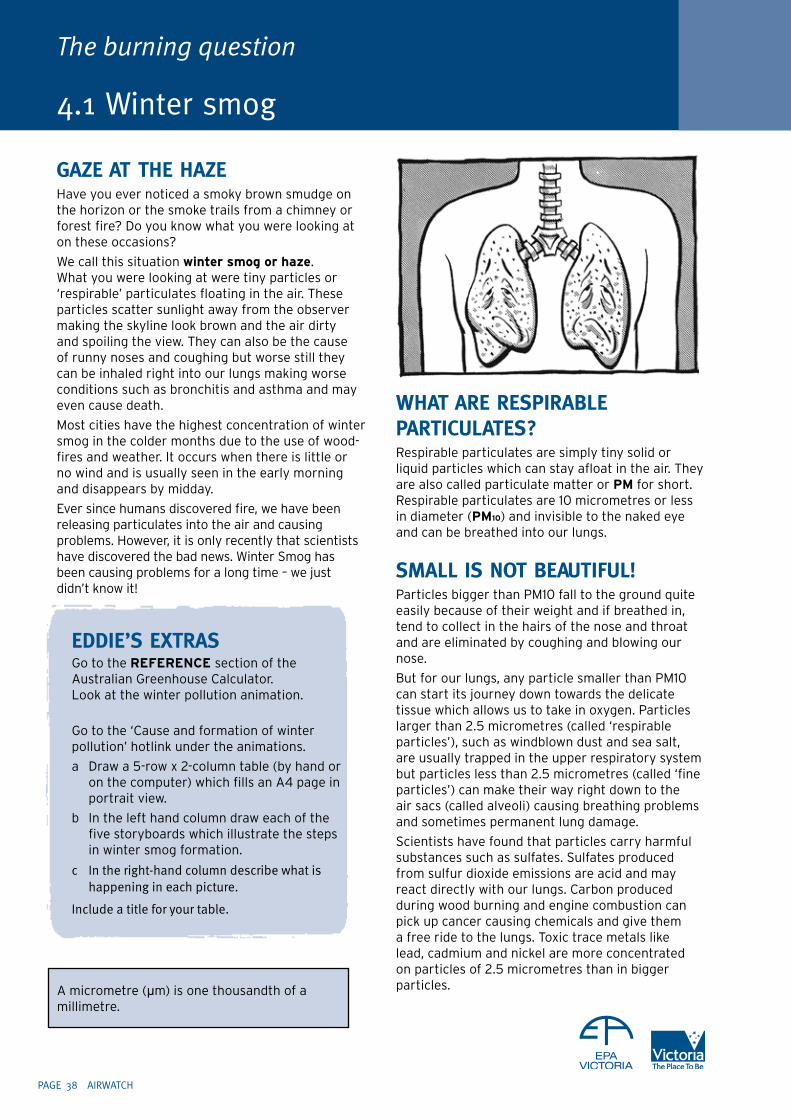
WHAT ARE RESPIRAblE PARTICulATES?Respirable particulates are simply tiny solid or liquid particles which can stay afloat in the air. They are also called particulate matter or PM for short. Respirable particulates are 10 micrometres or less in diameter (PM10) and invisible to the naked eye and can be breathed into our lungs.
SMAll IS NOT bEAuTIFul!Particles bigger than PM10 fall to the ground quite easily because of their weight and if breathed in, tend to collect in the hairs of the nose and throat and are eliminated by coughing and blowing our nose.
But for our lungs, any particle smaller than PM10 can start its journey down towards the delicate tissue which allows us to take in oxygen. Particles larger than 2.5 micrometres (called ‘respirable particles’), such as windblown dust and sea salt, are usually trapped in the upper respiratory system but particles less than 2.5 micrometres (called ‘fine particles’) can make their way right down to the air sacs (called alveoli) causing breathing problems and sometimes permanent lung damage.
Scientists have found that particles carry harmful substances such as sulfates. Sulfates produced from sulfur dioxide emissions are acid and may react directly with our lungs. Carbon produced during wood burning and engine combustion can pick up cancer causing chemicals and give them a free ride to the lungs. Toxic trace metals like lead, cadmium and nickel are more concentrated on particles of 2.5 micrometres than in bigger particles.
The burning question
4.1 Winter smog
PAGE 38 AIRWATCH
03 9695 2722 03 9695 2780
WHERE dOES THE PM COME FROM?Some of the PM comes from natural sources such as fires, vegetation and dust but much of it is caused by human activity such as motor vehicle use, industry, slow combustion heaters and burning off.
What is important to realise is that this problem of winter smog is not caused by large industries alone. Everyone contributes to this problem by producing small amounts every day. Using your car releases soot, hundreds of different organic compounds are released from the exhaust of your vehicle and the tyres of your car kick up dust as you travel.
One source of particles is the slow combustion heater that can emit particulates 24 hours a day regardless of the weather. Add to this fireplaces, cigarette smoke and other burning. And remember, these particulates are not being released from some tall smoke stack miles away from you but in our streets, in our backyards and in our living rooms right under our noses and finding their way into our lungs.
FINE PARTICulATES ARE NOT FINEPM10 is now considered one of the worst kinds of air pollution. Findings of studies into particulates are quite alarming: exposure to high levels of PM10 can play a role in many kinds of respiratory disease, including bronchitis, pneumonia and emphysema. Even more serious is the significant rise in the number of premature deaths of senior citizens and people who already have heart or lung problems and the very young.
ACTIVITy 2This activity shows what conditions promote particles in the air.
(A) AMOuNT OF AIRYour teacher will light up a fire outside in a suitable container. When the fire is burning well, put a lid on to partially cover the fire. Keep moving the lid until the fire is almost completely covered.
1. What happens to the fire as you do this?
2. What is the lid doing to the fire?
3. Predict what would happen if you made it completely airtight.
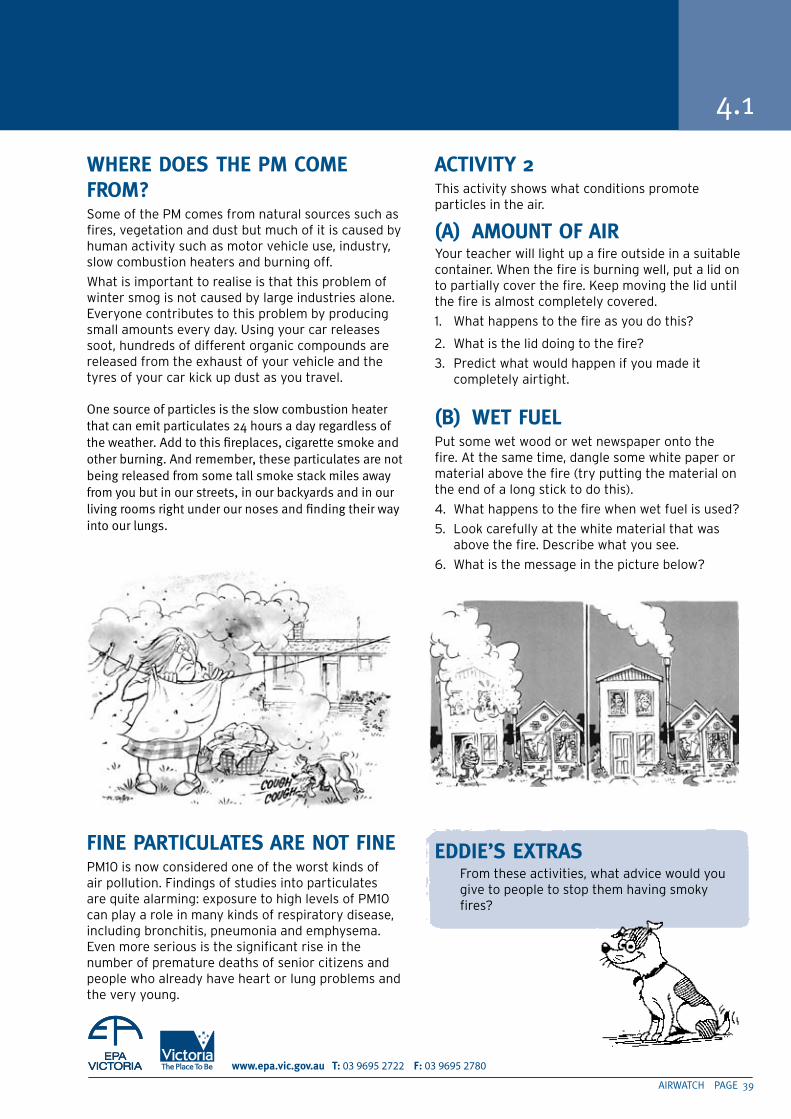
(b) WET FuElPut some wet wood or wet newspaper onto the fire. At the same time, dangle some white paper or material above the fire (try putting the material on the end of a long stick to do this).
4. What happens to the fire when wet fuel is used?
5. Look carefully at the white material that was above the fire. Describe what you see.
6. What is the message in the picture below?
EddIE’S ExTRAS From these activities, what advice would you
give to people to stop them having smoky fires?
4.1
AIRWATCH PAGE 39

The burning question
4.2 Particles in the air
The air around us has never been completely clean. It has always contained materials from natural sources. For example, volcanoes erupt and spew smoke and dust into the air, rotting plants and animals emit gases into the air and waves throw into the air small drops of water which contain salt. Other natural pollutants are dust, smoke from bushfires and pollen from plants.
All these pollutants were here before people lived on the earth. However, the activities of humans now add extra pollutants to the air, some of which are poisonous or too concentrated, causing health problems for individuals and affecting the place in which they live.
The trouble with trying to find the substances that pollute our air is that many of them are invisible gases.
PARTICulATE MATTERHowever, one very easily visible air pollutant is particulate matter (PM). PM is made up of tiny particles of solid or droplets of liquid.
The natural sources of particulate matter are such things as pollen and dust. Man-made particles come from coal and oil burnt in power plants, fuel burning in cars and trucks, wood fires, slow combustion heaters and of course, industry.
In the cooler months in Melbourne (and in many towns) most particles come from burning wood for home heating.
Particulates can be harmful to our health, affect plant and animal life and affect buildings and other structures.
To get an idea of what the particulates are like around your area, you can try this simple way of collecting them. First you have to make up your Particle Collector.
EquIPMENT (PER GROuP)Ruler Sticky tape
Compass String
Cardboard Marker pen
Scalpel Plastic bag
MAkING yOuR PARTIClE COllECTOR (PC)1. Using a ruler to measure, cut a strip of
cardboard that is 5 cm wide and 25 cm long.
2. Cut 5 holes, each about 2 cm in diameter, in the strip.
3. Use a hole punch to put a small hole in one end of the strip. Tie a string through the hole; the string will be used to hang the strip at a selected site.
4. Put a long piece of clear tape over one side of the strip. Be sure to completely cover all 5 holes. (Depending upon the width of the tape, you may need 2 or more pieces.)
The sticky side of the tape will collect the particles from the air. Make sure you do not touch the sticky side of the tape over the holes.
PAGE 40 AIRWATCH
03 9695 2722 03 9695 2780
ACTIVITy – lOCATING yOuR PCa) Choose three locations and site testers at these
locations around your school or neighbourhood for 24 hours. Write on your tester/s the date, your name and the location.
b) Keep one tester in a clean plastic bag as your control.
c) Design a results sheet with the date, the place you hung your particle collector, wind strength, wind direction, cloud cover, temperature and tester description. If your school has a weather station, refer to the software for wind information. Otherwise, visit the Bureau of Meteorology at www.bom.gov.au and click on your state, then ‘Observations’ to find the wind information for the last 24-hour period.
d) Remove the testers after 24 hours and record the information in your results sheet. (If you store 5 collectors in a plastic bag and place a new one out each day, you could compare the results on each particle collector to determine which days were high pollution days.)
ANAlySISCompare all your PCs to the control in the plastic bag.
e) What conclusions can you make about the particulate air pollutants in the test areas?
f) Is there a difference in the amount of particles based on where the air strips were placed?
g) Can any of your observations be explained using your weather information?
FOllOW-uPIf possible, try to collect PC information throughout the different seasons. Write a summary paragraph about the activity.
4.2
AIRWATCH PAGE 41
AN AlTERNATIVE• Hang out your PC for two days. Then bring it
in and cut off the bottom section containing one hole of sticky tape.
• Put out the remaining PC for another 2 days and then cut off another hole.
• Continue until you have run out of PC. This should give you some record for the accumulation of particles over a 10-day period.
WHAT CAN I dO TO HElP?• Try to use the car less. Have a talk to the
family and see where you can save on trips in the car. Even if you left the car home once a week, the reduction in emissions would be noticeable. Less driving also means less dust kicked up by cars and less particles emitted.
• Make sure the family car is well tuned for minimum emissions.
• If you have a slow combustion heater, cut down its use and use it correctly.
• Avoid wet, green or treated wood for your fires.
• Avoid backyard burning by finding alternatives such as composting and recycling.
• If you do have to burn, avoid those times such as clear and calm nights, where the smoke will linger around you and your neighbours.
• Go outside and check how much smoke is coming out of the chimney. If there is a lot, open up the flue.
All of these actions reduce the amount of air pollution and greenhouse gases you and your family generate.

The burning question
4.3 Car exhausts
More than half the pollution in our cities is caused by vehicles such as cars, planes, trucks and some trains. Cars, forming the greatest proportion of these vehicles, release pollutants such as carbon monoxide, nitrogen oxides and particulate matter. The level of lead has fallen in the past ten years and this was (mainly) because lead levels in petrol were greatly reduced.
In the following activity, we are going to examine the exhaust of various types of cars to see which produces the greatest visible pollution.
Visible pollution can be caused by particulate matter that is made of particles of solids and droplets of liquids light enough to float.
EquIPMENT (PER GROuP)Tin can.
1.5-metre stick.
Masking tape.
Filter paper (or use coffee filters ).
ACTIVITyNOTE: This activity must be done in the open air and the handbrake must be on. Make sure you do not touch the tail pipe as it will be hot.
1. Make up your car-testing device as shown in the diagram. Before fastening on the filter papers, label it with the make, model, engine type and year of the car you are going to test.
2. Hold the open end of the can over the tailpipe while the car is running. Leave it there for 30 seconds or for as long as it takes to get a coloration on the paper.
••••
3. Take off the filter paper and stick it onto a display board.
4. Replace the filter with another, and repeat the test on another car (variations to test would be new vs old, different fuelled cars, Australian vs overseas models etc).
5. Make up a display board for your results.
INTERPRETATION1. What can you infer from the results of your
experiment on car exhausts?
2. Is there anything you would do to make this experiment better?
3. What other applications could be found for this type of testing?
4. Does the car that produced the dirtiest filter necessarily produce the most air pollution? Explain (remember you are looking at visible pollution).
5. How does the car contribute to:
(a) winter smog
(b) summer smog
EddIE’S ExTRAS • Find out how many motor vehicles are
registered in Victoria. Are emission inspections required?
• Find out what anti-pollution devices are available as standard equipment on cars today. How long have these been available?
PAGE 42 AIRWATCH
03 9695 2722 03 9695 2780
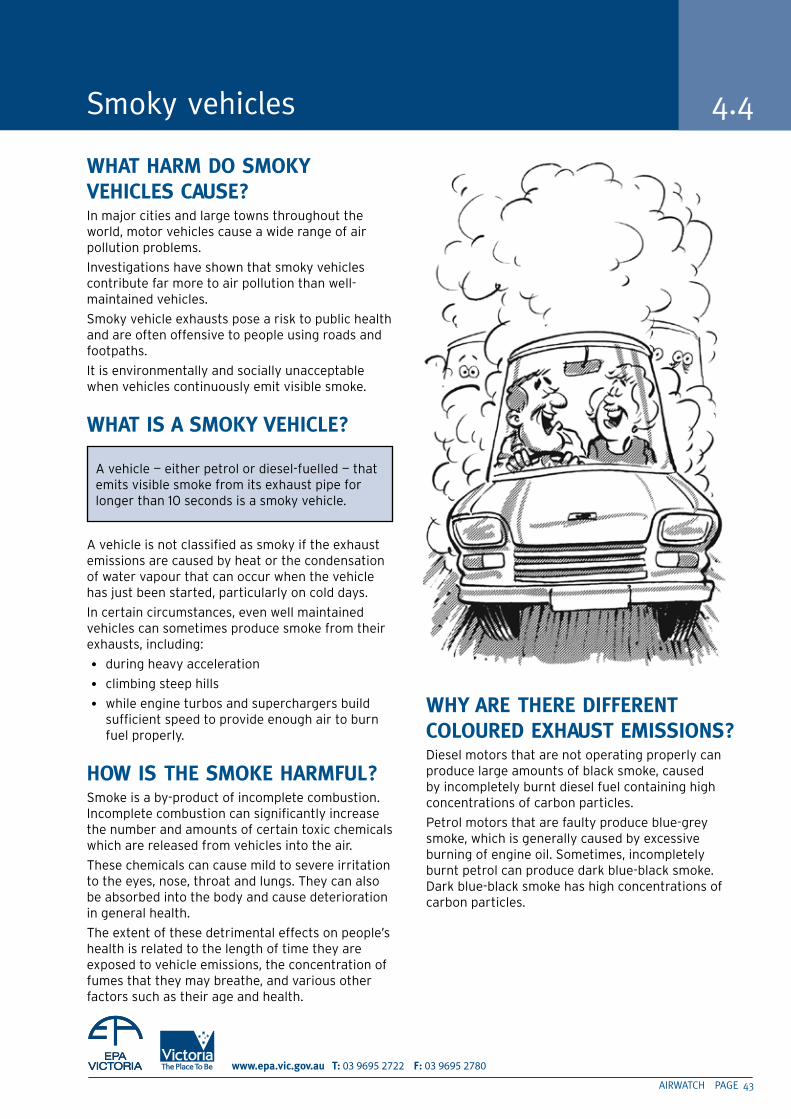
WHAT HARM dO SMOky VEHIClES CAuSE?In major cities and large towns throughout the world, motor vehicles cause a wide range of air pollution problems.
Investigations have shown that smoky vehicles contribute far more to air pollution than well-maintained vehicles.
Smoky vehicle exhausts pose a risk to public health and are often offensive to people using roads and footpaths.
It is environmentally and socially unacceptable when vehicles continuously emit visible smoke.
WHAT IS A SMOky VEHIClE?
A vehicle is not classified as smoky if the exhaust emissions are caused by heat or the condensation of water vapour that can occur when the vehicle has just been started, particularly on cold days.
In certain circumstances, even well maintained vehicles can sometimes produce smoke from their exhausts, including:
• during heavy acceleration
• climbing steep hills
• while engine turbos and superchargers build sufficient speed to provide enough air to burn fuel properly.
HOW IS THE SMOkE HARMFul?Smoke is a by-product of incomplete combustion. Incomplete combustion can significantly increase the number and amounts of certain toxic chemicals which are released from vehicles into the air.
These chemicals can cause mild to severe irritation to the eyes, nose, throat and lungs. They can also be absorbed into the body and cause deterioration in general health.
The extent of these detrimental effects on people’s health is related to the length of time they are exposed to vehicle emissions, the concentration of fumes that they may breathe, and various other factors such as their age and health.
WHy ARE THERE dIFFERENT COlOuREd ExHAuST EMISSIONS?Diesel motors that are not operating properly can produce large amounts of black smoke, caused by incompletely burnt diesel fuel containing high concentrations of carbon particles.
Petrol motors that are faulty produce blue-grey smoke, which is generally caused by excessive burning of engine oil. Sometimes, incompletely burnt petrol can produce dark blue-black smoke. Dark blue-black smoke has high concentrations of carbon particles.
Smoky vehicles 4.4
AIRWATCH PAGE 43
A vehicle — either petrol or diesel-fuelled — that emits visible smoke from its exhaust pipe for longer than 10 seconds is a smoky vehicle.
WHAT CAuSES A VEHIClE TO bE SMOky?There are many reasons why a vehicle may emit continuous smoke. This list is a guide only and does not always apply to both diesel and petrol motors:
• Spark plugs need replacement or cleaning.
• Ignition timing needs adjustment.
• Worn piston rings, pistons, cylinder bores.
• Valve stem guides or seals need replacing.
• Sump over-filled with engine oil.
• Blocked air cleaner.
• Faulty electronic or mechanical controls such as a choke.
• Poor, contaminated or incorrect density or grade of fuel.
• Blocked or damaged fuel filter.
• Incorrectly set or damaged fuel injectors or fuel pump.
• Incorrectly set or damaged turbo or super chargers.
AbOuT SuRVEySA survey will help you to estimate the extent of the smoky vehicle problem in your city. You may choose to do a different survey to the one suggested below.
dOING THE SuRVEy1. Choose a busy flat road where cars do not have to
accelerate. Survey 200 cars and note any smoky vehicles by filling in the survey sheet below.
2. Collect information from all other groups in the class. This will give you a large sample to work on.
INTERPRETATION1. Calculate the percentage of smoky vehicles found
in your survey.
2. Comment on this percentage.
3. Was there any pattern to smoky vehicles? For example, were they all old cars or a particular make?
4. How could this information be useful in combating air pollution?
5. What do you think should be done about smoky vehicles?
4.4
The burning question
PAGE 44 AIRWATCH
REMEMbER:• A smoky vehicle is one that gives off visible smoke for 10 seconds but is not climbing steep hills or
accelerating heavily.
• You can report smoky vehicles to the EPA on 9695 2755 (you must register first).
Date ______________ Time _____________ Place _________________________________________________
Car type Year Registration
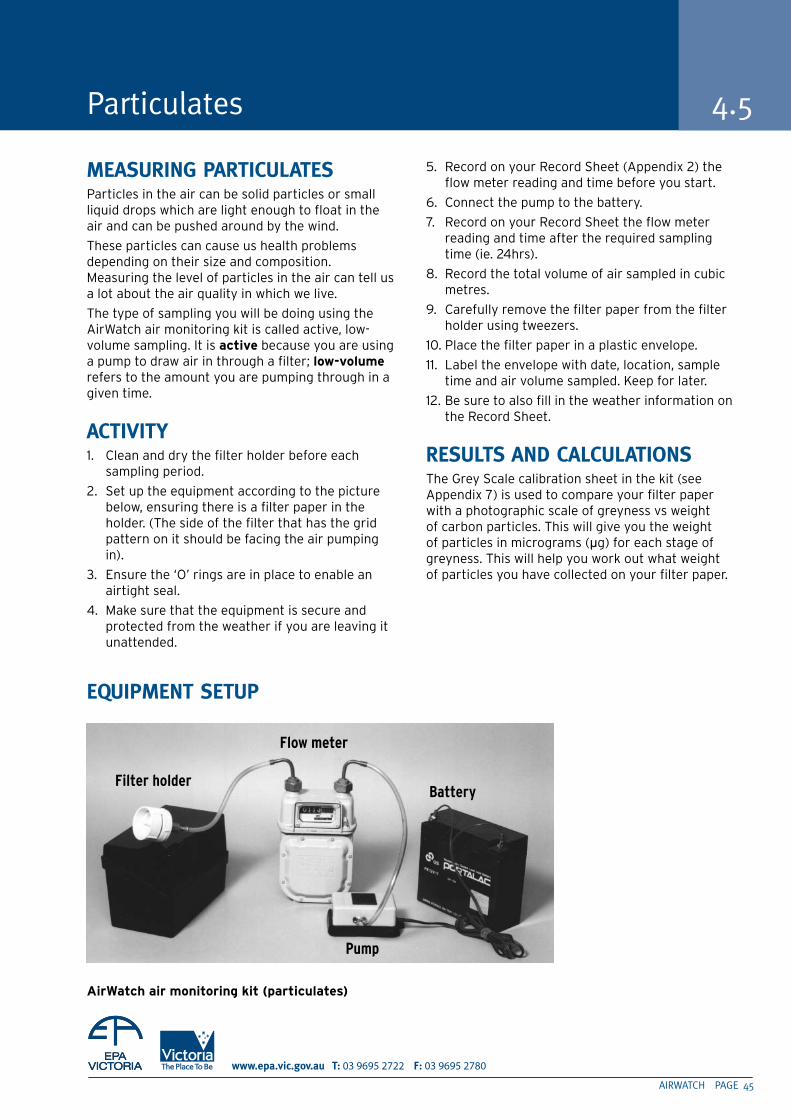
03 9695 2722 03 9695 2780
MEASuRING PARTICulATESParticles in the air can be solid particles or small liquid drops which are light enough to float in the air and can be pushed around by the wind.
These particles can cause us health problems depending on their size and composition. Measuring the level of particles in the air can tell us a lot about the air quality in which we live.
The type of sampling you will be doing using the AirWatch air monitoring kit is called active, low-volume sampling. It is active because you are using a pump to draw air in through a filter; low-volume refers to the amount you are pumping through in a given time.
ACTIVITy1. Clean and dry the filter holder before each
sampling period.
2. Set up the equipment according to the picture below, ensuring there is a filter paper in the holder. (The side of the filter that has the grid pattern on it should be facing the air pumping in).
3. Ensure the ‘O’ rings are in place to enable an airtight seal.
4. Make sure that the equipment is secure and protected from the weather if you are leaving it unattended.
EquIPMENT SETuP
5. Record on your Record Sheet (Appendix 2) the flow meter reading and time before you start.
6. Connect the pump to the battery.
7. Record on your Record Sheet the flow meter reading and time after the required sampling time (ie. 24hrs).
8. Record the total volume of air sampled in cubic metres.
9. Carefully remove the filter paper from the filter holder using tweezers.
10. Place the filter paper in a plastic envelope.
11. Label the envelope with date, location, sample time and air volume sampled. Keep for later.
12. Be sure to also fill in the weather information on the Record Sheet.
RESulTS ANd CAlCulATIONSThe Grey Scale calibration sheet in the kit (see Appendix 7) is used to compare your filter paper with a photographic scale of greyness vs weight of carbon particles. This will give you the weight of particles in micrograms (µg) for each stage of greyness. This will help you work out what weight of particles you have collected on your filter paper.
Particulates 4.5
airwatch air monitoring kit (particulates)
Battery
Pump
Filter holder
Flow meter
AIRWATCH PAGE 45

The burning question
4.5
STEP 1Compare your filter paper with the Grey Scale and decide which sample on the grey scale matches your sample. Intermediate values may be chosen.
Be careful — the sample you have collected on your filter paper may be browner than your grey scale. This is because the grey scale was produced in a laboratory. Your sample may include other aerosols (particles floating in the air) such as soil particles. Look for the intensity of colouration.
STEP 2Using the Grey Scale graph, find the number you have estimated and read off the corresponding value in micrograms.
STEP 3Record the weight of the particles on your filter paper on your record sheet.
STEP 4To calculate the concentration of particles in the air use:
STEP 5The carbon particles you have collected are visible on your filter paper. There are other particles on your paper that you have collected that are white or colourless. To account for these you need to multiply your result in Step 4 by a ‘Multiplying Factor’.
The multiplying factor applies only to particles monitored using the AirWatch equipment.
The AirWatch ‘grey scale’ and graph estimates the mass of the carbon-based component of PM10. The other particles in the air, although colourless or white, are still important when calculating the total mass of PM10 on the filter paper.
The multiplier factor in the table accounts for the white or colourless volatile organic particles on the filter paper that does not contribute to the filter paper grey colour. A description of the general region and conditions where the measurements were made is an important factor when choosing the multiplier from the table. The mass in µg/m3 of the carbon-based component is multiplied by the factor from the table. This gives an estimate of the total PM10 fine particle concentration.
THE MulTIPlyING FACTORMultiplier factor for particle sample to estimate PM10
* ‘fires’ includes wood heaters, scrub or rubbish burning.
** ‘traffic’ means vehicles on the road.
Description of region and season Multiplier
Smoky region due to fires*, 10 usually in winter time, may be some or moderate traffic** (e.g., Launceston in winter).
Region of some fires*, usually 6 in winter time, moderate to heavy traffic** (e.g., Melbourne, Sydney in winter).
Region where fires* are expected 3 but none obvious, usually in winter, moderate traffic**. Can be due to burn-offs (e.g., Canberra, Brisbane in winter, Perth in winter/spring).
Moderate to heavy traffic** with 2—3 motor vehicles in good condition. No fires*. Usually in summer (e.g., Melbourne, Sydney in summer).
Light winds, no fires*, usually in 1—2 winter mixed traffic** and some in poor condition (e.g., Adelaide in winter).
PAGE 46 AIRWATCH
Concentration = Weight of particles on filter (µg)
(µg/m3) Volume of air sampled (m3)
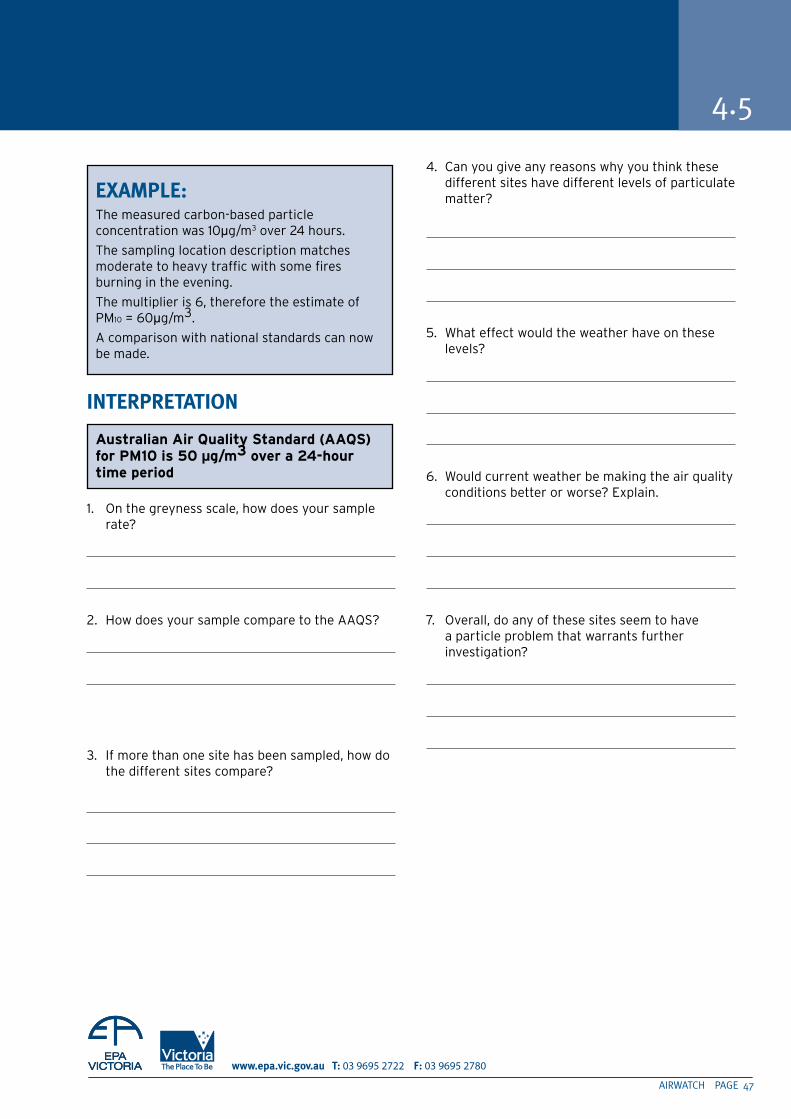
03 9695 2722 03 9695 2780
INTERPRETATION
1. On the greyness scale, how does your sample rate?
2. How does your sample compare to the AAQS?
3. If more than one site has been sampled, how do the different sites compare?
4. Can you give any reasons why you think these different sites have different levels of particulate matter?
5. What effect would the weather have on these levels?
6. Would current weather be making the air quality conditions better or worse? Explain.
7. Overall, do any of these sites seem to have a particle problem that warrants further investigation?
4.5
AIRWATCH PAGE 4�
australian air Quality standard (aaQs) for PM10 is 50 µg/m3 over a 24-hour time period
ExAMPlE:The measured carbon-based particle concentration was 10µg/m3 over 24 hours.
The sampling location description matches moderate to heavy traffic with some fires burning in the evening.
The multiplier is 6, therefore the estimate of PM10 = 60µg/m3.
A comparison with national standards can now be made.

VISuAl AIR quAlITy (VAq)Visual air quality (VaQ) is a measure of visibility. As you look at objects at a distance, how clearly you can see them will depend on the quality of the air in between. If air quality is bad, that is, if there are a lot of particles or other pollutants in the air, you may not be able to see a certain object. If air quality is good, something that is kilometres away may be easily seen.
It is a subjective measurement — that means some people may see things a bit differently to others. However, it is very useful especially when combined with other measurements such as local weather, pollutant measurements such as nephelometer readings, observations of fires, and current health status of the people in the area.
VAQ methods have been used in airshed studies in the La Trobe Valley in Victoria and in metropolitan Brisbane.
VAq STudy ExPlAINEdThe VAQ study can involve two parts:
CHOOSING THE SET lOCATIONThe location from which all the sites are to be viewed must be high so that you have a clear view into the distance. Suitable locations include a roof balcony, a lookout on top of a hill, a window high up on a building.
Refer to Appendix 8: Visual air quality.
TARGET SITES FOR VAq The viewing of a target site must be clear and unobstructed. It could be a prominent feature like a tower, a hill, a bridge or a building.
If possible you need to choose a site within each of the distance ranges from your set location,
i.e., 0—13 km, 13—20 km, 20—30 km, >30 km, >50 km.
This will coincide with the ‘Visual distance vs Air quality’ scale (on the following page) determined by EPA Victoria. You will be able to calculate these distances by using information from the road directory.
SETTING uP1. Choose your set location and target sites.
2. Calculate the distance target sites are away from the set location using maps.
3. Photograph the target sites from the set location [optional].
4. Stick the photograph of each target on a map and draw lines from the set location, indicating distances.
RECORdING5. On a daily basis, photograph the target sites from
the set location.
6. At the same time, complete the field record sheet. Look at the key on the next page to help you rate each site.
7. Gather weather information for each day. Data can be accessed on the Bureau of Meteorology website (www.bom.gov.au) or you can obtain the data from your weather station or Stevenson Screen.
8. Visibility is measured hourly at EPA air monitoring stations. On the days you record VAQ, if possible, obtain ‘visibility reduction’ data from the air monitoring stations close to your target sites. For instance, if one of your target sites is the Melbourne CBD buildings then the appropriate EPA station would be the City station located in Richmond.
‘Visibility reduction’ is measured by an instrument called a nephelometer. It records how much light is
The burning question
4.6 Visual air quality
PAGE 48 AIRWATCH
1. A photographic study over several days/weeks of prominent sites taken from a set location.
2. Observations of the above sites from the set location.
To estimate the visual range you must assess which target is more visible than others.
For example, a target tower at 22 km may be hard to see, while a building at 16 km is quite clear.
Then the visual range is approximately 16 km.
Observation point
4km
24km
16km
32km
8km
Visual air quality
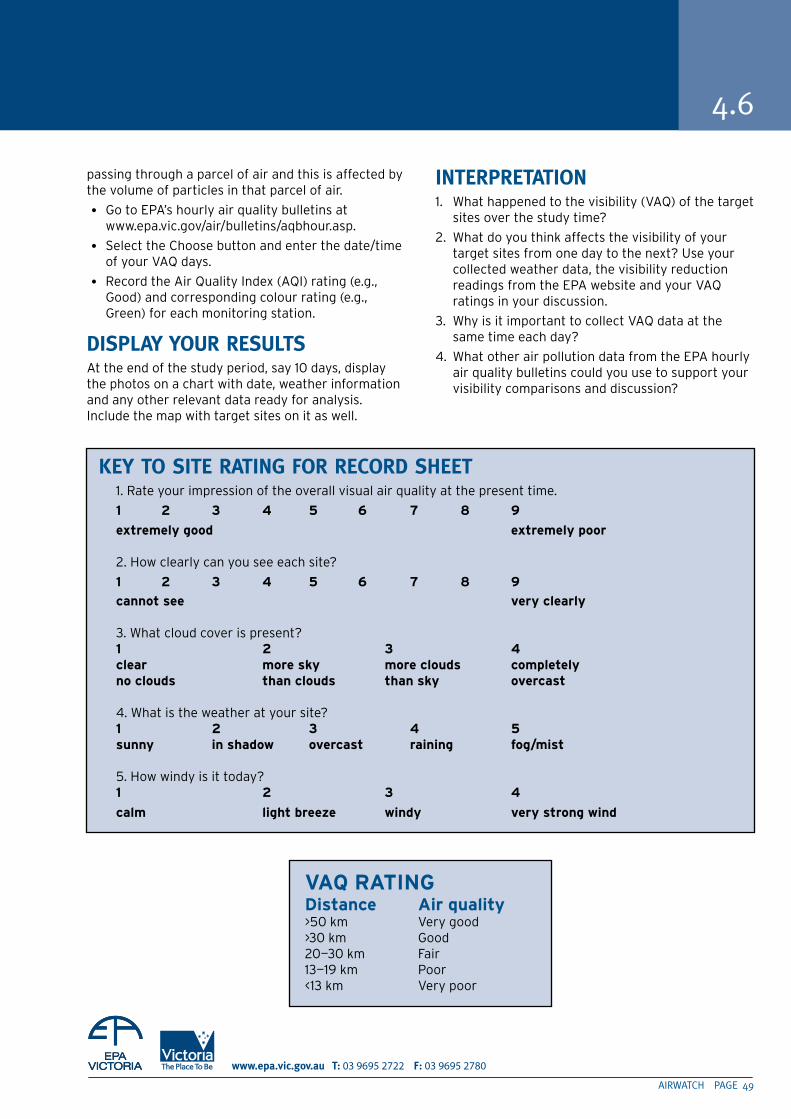
03 9695 2722 03 9695 2780
4.6
AIRWATCH PAGE 49
kEy TO SITE RATING FOR RECORd SHEET 1. Rate your impression of the overall visual air quality at the present time.
1 2 3 4 5 6 7 8 9
extremely good extremely poor 2. How clearly can you see each site?
1 2 3 4 5 6 7 8 9
cannot see very clearly 3. What cloud cover is present? 1 2 3 4 clear more sky more clouds completely no clouds than clouds than sky overcast 4. What is the weather at your site? 1 2 3 4 5 sunny in shadow overcast raining fog/mist 5. How windy is it today? 1 2 3 4
calm light breeze windy very strong wind
VaQ ratinG Distance air quality >50 km Very good >30 km Good 20—30 km Fair 13—19 km Poor <13 km Very poor
passing through a parcel of air and this is affected by the volume of particles in that parcel of air.
• Go to EPA’s hourly air quality bulletins at www.epa.vic.gov/air/bulletins/aqbhour.asp.
• Select the Choose button and enter the date/time of your VAQ days.
• Record the Air Quality Index (AQI) rating (e.g., Good) and corresponding colour rating (e.g., Green) for each monitoring station.
dISPlAy yOuR RESulTSAt the end of the study period, say 10 days, display the photos on a chart with date, weather information and any other relevant data ready for analysis. Include the map with target sites on it as well.
INTERPRETATION1. What happened to the visibility (VAQ) of the target
sites over the study time?
2. What do you think affects the visibility of your target sites from one day to the next? Use your collected weather data, the visibility reduction readings from the EPA website and your VAQ ratings in your discussion.
3. Why is it important to collect VAQ data at the same time each day?
4. What other air pollution data from the EPA hourly air quality bulletins could you use to support your visibility comparisons and discussion?
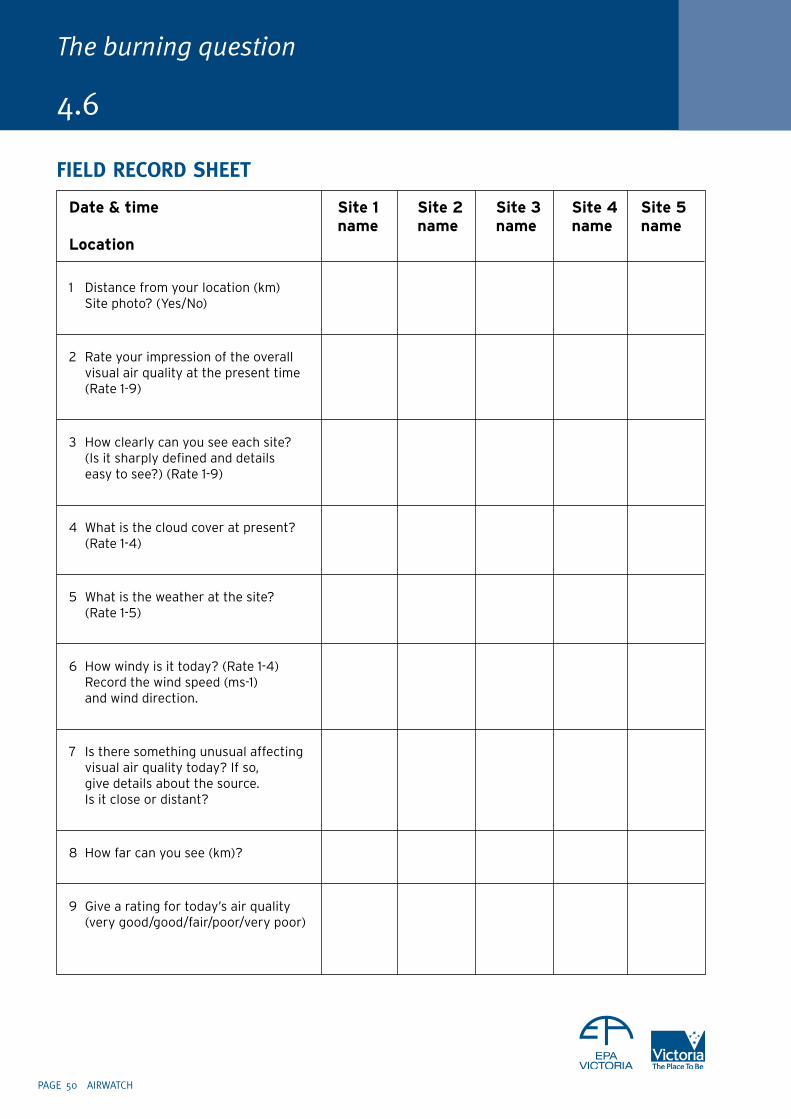
The burning question
4.6
FIEld RECORd SHEET
Date & time site 1 site 2 site 3 site 4 site 5 name name name name name location
1 Distance from your location (km) Site photo? (Yes/No)
2 Rate your impression of the overall visual air quality at the present time (Rate 1-9)
3 How clearly can you see each site? (Is it sharply defined and details easy to see?) (Rate 1-9)
4 What is the cloud cover at present? (Rate 1-4)
5 What is the weather at the site? (Rate 1-5)
6 How windy is it today? (Rate 1-4) Record the wind speed (ms-1) and wind direction.
7 Is there something unusual affecting visual air quality today? If so, give details about the source. Is it close or distant?
8 How far can you see (km)?
9 Give a rating for today’s air quality (very good/good/fair/poor/very poor)
PAGE 50 AIRWATCH
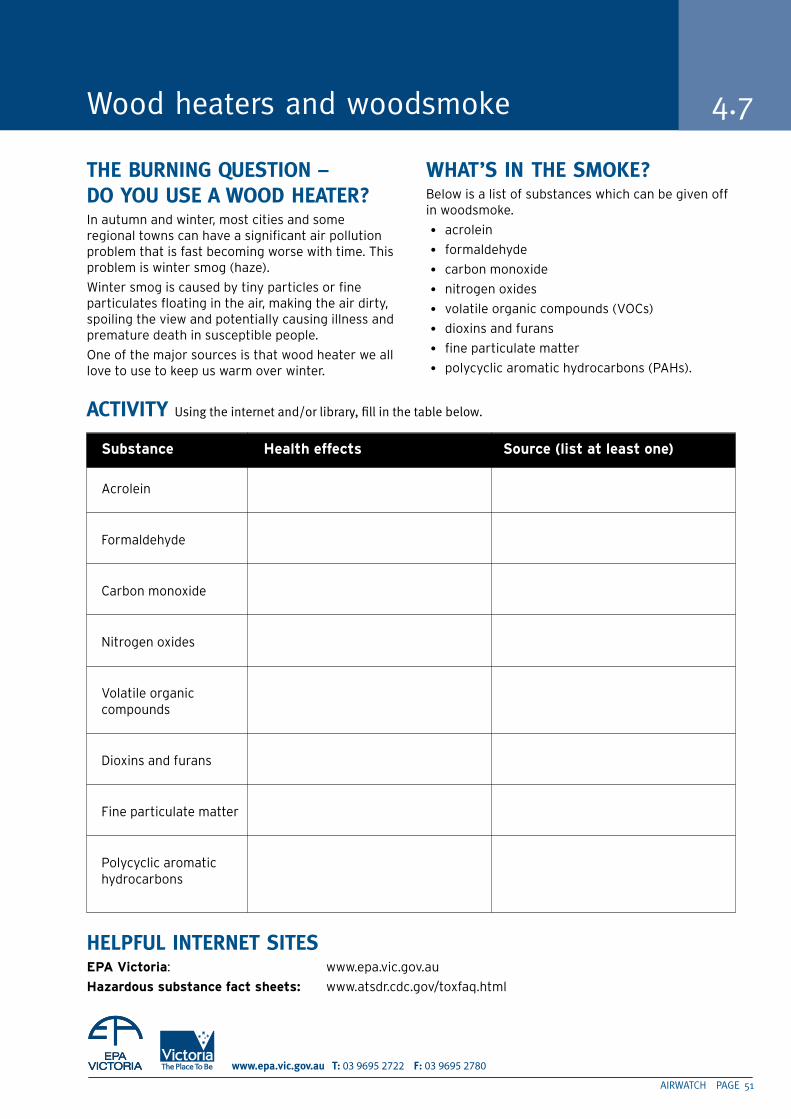
03 9695 2722 03 9695 2780
THE buRNING quESTION – dO yOu uSE A WOOd HEATER? In autumn and winter, most cities and some regional towns can have a significant air pollution problem that is fast becoming worse with time. This problem is winter smog (haze).
Winter smog is caused by tiny particles or fine particulates floating in the air, making the air dirty, spoiling the view and potentially causing illness and premature death in susceptible people.
One of the major sources is that wood heater we all love to use to keep us warm over winter.
WHAT’S IN THE SMOkE? Below is a list of substances which can be given off in woodsmoke.
• acrolein
• formaldehyde
• carbon monoxide
• nitrogen oxides
• volatile organic compounds (VOCs)
• dioxins and furans
• fine particulate matter
• polycyclic aromatic hydrocarbons (PAHs).
Wood heaters and woodsmoke 4.7
substance health effects source (list at least one)
Acrolein
Formaldehyde
Carbon monoxide
Nitrogen oxides
Volatile organic compounds
Dioxins and furans
Fine particulate matter
Polycyclic aromatic hydrocarbons
AIRWATCH PAGE 51
ACTIVITy Using the internet and/or library, fill in the table below.
HElPFul INTERNET SITESePa Victoria: www.epa.vic.gov.au
hazardous substance fact sheets: www.atsdr.cdc.gov/toxfaq.html
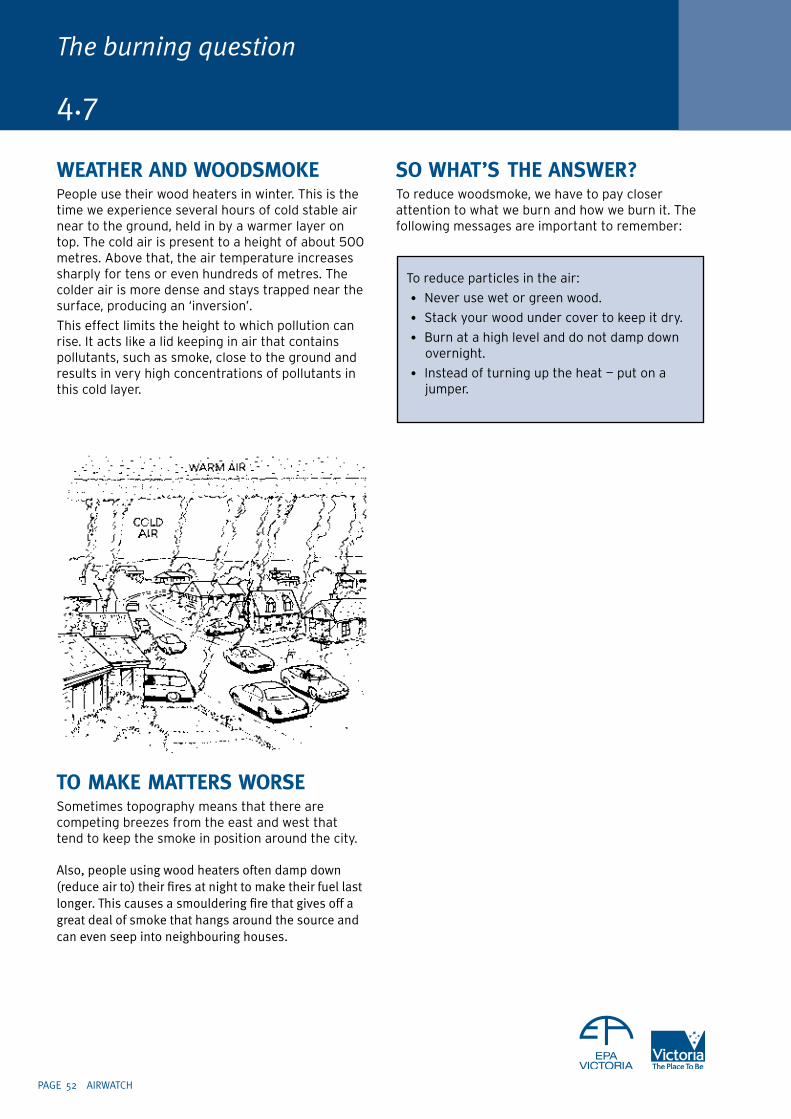
WEATHER ANd WOOdSMOkEPeople use their wood heaters in winter. This is the time we experience several hours of cold stable air near to the ground, held in by a warmer layer on top. The cold air is present to a height of about 500 metres. Above that, the air temperature increases sharply for tens or even hundreds of metres. The colder air is more dense and stays trapped near the surface, producing an ‘inversion’.
This effect limits the height to which pollution can rise. It acts like a lid keeping in air that contains pollutants, such as smoke, close to the ground and results in very high concentrations of pollutants in this cold layer.
TO MAkE MATTERS WORSESometimes topography means that there are competing breezes from the east and west that tend to keep the smoke in position around the city.
Also, people using wood heaters often damp down (reduce air to) their fires at night to make their fuel last longer. This causes a smouldering fire that gives off a great deal of smoke that hangs around the source and can even seep into neighbouring houses.
SO WHAT’S THE ANSWER?To reduce woodsmoke, we have to pay closer attention to what we burn and how we burn it. The following messages are important to remember:
The burning question
4.7
PAGE 52 AIRWATCH
To reduce particles in the air:
• Never use wet or green wood.
• Stack your wood under cover to keep it dry.
• Burn at a high level and do not damp down overnight.
• Instead of turning up the heat — put on a jumper.
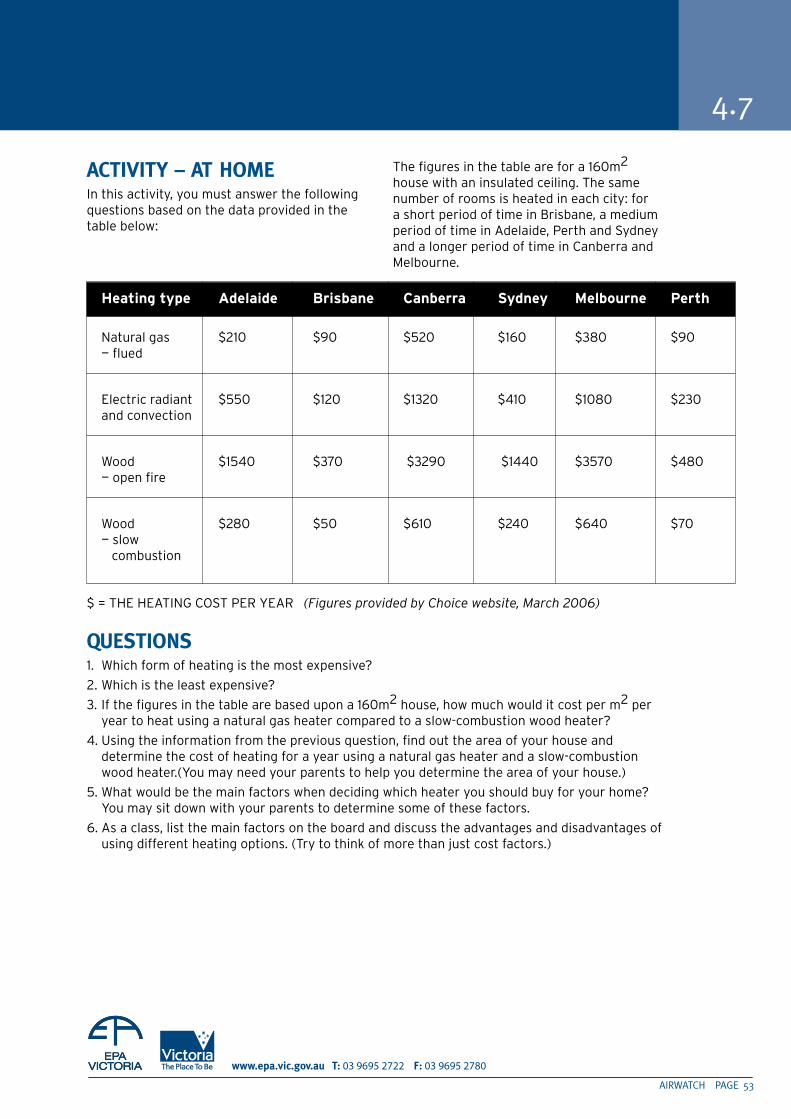
03 9695 2722 03 9695 2780
ACTIVITy – AT HOMEIn this activity, you must answer the following questions based on the data provided in the table below:
The figures in the table are for a 160m2 house with an insulated ceiling. The same number of rooms is heated in each city: for a short period of time in Brisbane, a medium period of time in Adelaide, Perth and Sydney and a longer period of time in Canberra and Melbourne.
4.7
heating type adelaide Brisbane Canberra sydney Melbourne Perth
Natural gas $210 $90 $520 $160 $380 $90 — flued
Electric radiant $550 $120 $1320 $410 $1080 $230 and convection
Wood $1540 $370 $3290 $1440 $3570 $480 — open fire
Wood $280 $50 $610 $240 $640 $70 — slow combustion
$ = THE HEATING COST PER YEAR (Figures provided by Choice website, March 2006)
quESTIONS1. Which form of heating is the most expensive?
2. Which is the least expensive?
3. If the figures in the table are based upon a 160m2 house, how much would it cost per m2 per year to heat using a natural gas heater compared to a slow-combustion wood heater?
4. Using the information from the previous question, find out the area of your house and determine the cost of heating for a year using a natural gas heater and a slow-combustion wood heater.(You may need your parents to help you determine the area of your house.)
5. What would be the main factors when deciding which heater you should buy for your home? You may sit down with your parents to determine some of these factors.
6. As a class, list the main factors on the board and discuss the advantages and disadvantages of using different heating options. (Try to think of more than just cost factors.)
AIRWATCH PAGE 53
The burning question
4.7
MONITORING PARTICulATES FROM WOOdFIRES/WOOd HEATERSin winterDesign a monitoring program using sampling equipment to test for particulates in an area where wood-fires are being used. At the same time, be sure to monitor wind and other weather conditions. You may need to do this for a week or two to see some patterns.
interpretation1. What levels of particulates did you find during your sampling
period?
2. Is this level acceptable according to any of the criteria given?
3. What weather leads to the worst levels of particulates?
4. What advice would you give to minimise the particulate problem in the cooler months?
PAGE 54 AIRWATCH
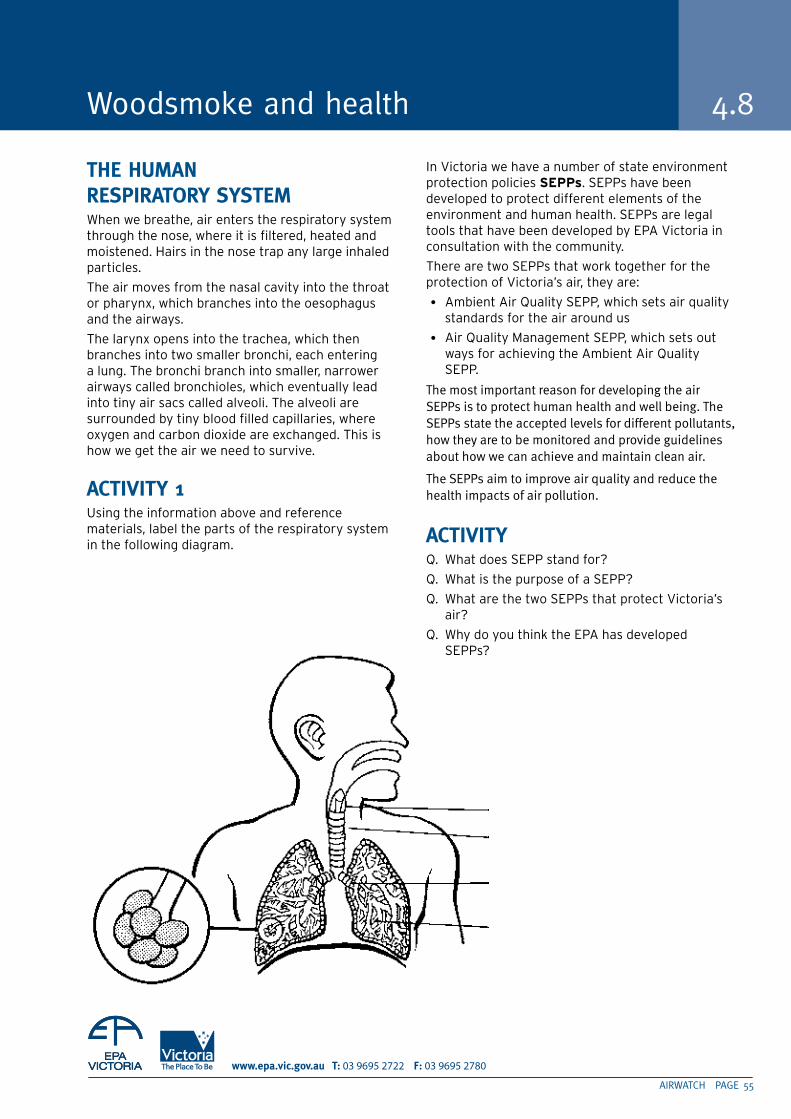
03 9695 2722 03 9695 2780
Woodsmoke and health 4.8
AIRWATCH PAGE 55
THE HuMAN RESPIRATORy SySTEMWhen we breathe, air enters the respiratory system through the nose, where it is filtered, heated and moistened. Hairs in the nose trap any large inhaled particles.
The air moves from the nasal cavity into the throat or pharynx, which branches into the oesophagus and the airways.
The larynx opens into the trachea, which then branches into two smaller bronchi, each entering a lung. The bronchi branch into smaller, narrower airways called bronchioles, which eventually lead into tiny air sacs called alveoli. The alveoli are surrounded by tiny blood filled capillaries, where oxygen and carbon dioxide are exchanged. This is how we get the air we need to survive.
ACTIVITy 1Using the information above and reference materials, label the parts of the respiratory system in the following diagram.
In Victoria we have a number of state environment protection policies sePPs. SEPPs have been developed to protect different elements of the environment and human health. SEPPs are legal tools that have been developed by EPA Victoria in consultation with the community.
There are two SEPPs that work together for the protection of Victoria’s air, they are:
• Ambient Air Quality SEPP, which sets air quality standards for the air around us
• Air Quality Management SEPP, which sets out ways for achieving the Ambient Air Quality SEPP.
The most important reason for developing the air SEPPs is to protect human health and well being. The SEPPs state the accepted levels for different pollutants, how they are to be monitored and provide guidelines about how we can achieve and maintain clean air.
The SEPPs aim to improve air quality and reduce the health impacts of air pollution.
ACTIVITyQ. What does SEPP stand for?
Q. What is the purpose of a SEPP?
Q. What are the two SEPPs that protect Victoria’s air?
Q. Why do you think the EPA has developed SEPPs?

Describe the function of the following:larynx
trachea
Bronchi
Bronchiole
alveoli
The burning question
4.8
AIR POlluTION ANd RESPIRATIONWhen particles, such as carbon particulates from wood heaters and cars, are breathed in, they can cause health problems, especially for the very young, the elderly or people with lung or heart disease. Particles can also make health problems like bronchitis, emphysema and asthma worse and can cause ‘premature’ death.
The respiratory system works in several ways to trap particles and remove them from your airways. The nose contains hairs that trap large particles when they are inhaled. The nasal cavity has a sticky mucous lining with surface hairs called cilia that trap and move the particles towards the nose to be sneezed out.
Smaller particles that are inhaled bypass the nose and nasal cavity and enter the trachea or further into the bronchioles. These structures also have a mucous and cilia lining and the smaller particles are trapped in the cilia and are moved up towards the mouth, where they are either expelled or swallowed.
If very small particles (smaller than PM 2.5) are inhaled and reach the alveoli, they can embed themselves into the walls, causing irritation and scarring. This causes the mucous glands to enlarge and excess mucous to be produced. The build up of mucous can result in breathing difficulties. If carcinogens form part of the particles breathed in, the result can be abnormal growth of cells, leading in some cases to cancer developing.
quESTIONS1. Where do most of the particulates in the air
originate from?
2. Describe some of the effects of particulates on the respiratory system.
3. Which individuals are most at risk from air pollution?
4. Using your library, find out more information on at least two of the conditions you listed in question 2.
5. How many students in your class suffer from asthma? Show diagrammatically how the airways are affected in asthma.
PAGE 56 AIRWATCH
03 9695 2722 03 9695 2780
CARS – A bIG HEAdACHE
the activities in this section will help students to understand how summer smog forms and what activities contribute to this air quality problem.
students will examine issues such as car usage, people’s attitudes to cars, alternative transport and possible actions they can undertake to help reduce air pollution.
AIRWATCH PAGE 5�
SECT
ION
> 5
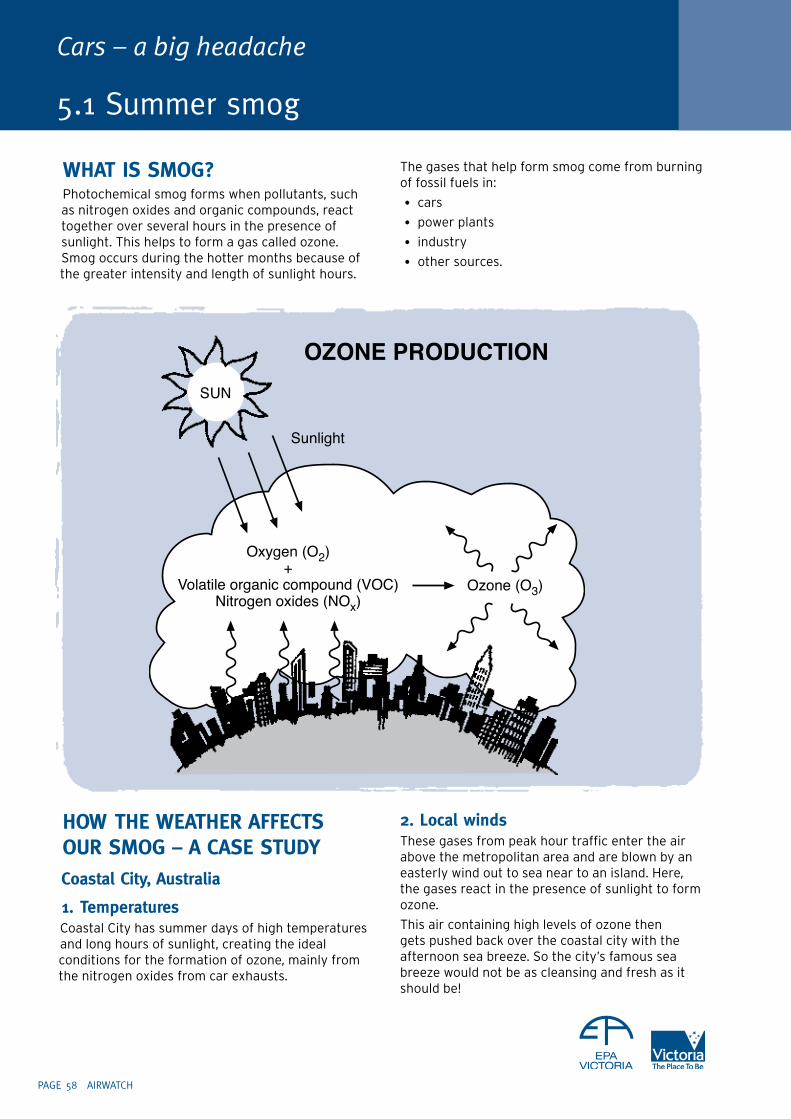
Cars – a big headache
5.1 Summer smog
WHAT IS SMOG?Photochemical smog forms when pollutants, such as nitrogen oxides and organic compounds, react together over several hours in the presence of sunlight. This helps to form a gas called ozone. Smog occurs during the hotter months because of the greater intensity and length of sunlight hours.
The gases that help form smog come from burning of fossil fuels in:
• cars
• power plants
• industry
• other sources.
HOW THE WEATHER AFFECTS OuR SMOG – A CASE STudyCoastal City, Australia
1. TemperaturesCoastal City has summer days of high temperatures and long hours of sunlight, creating the ideal conditions for the formation of ozone, mainly from the nitrogen oxides from car exhausts.
2. local windsThese gases from peak hour traffic enter the air above the metropolitan area and are blown by an easterly wind out to sea near to an island. Here, the gases react in the presence of sunlight to form ozone.
This air containing high levels of ozone then gets pushed back over the coastal city with the afternoon sea breeze. So the city’s famous sea breeze would not be as cleansing and fresh as it should be!
PAGE 58 AIRWATCH
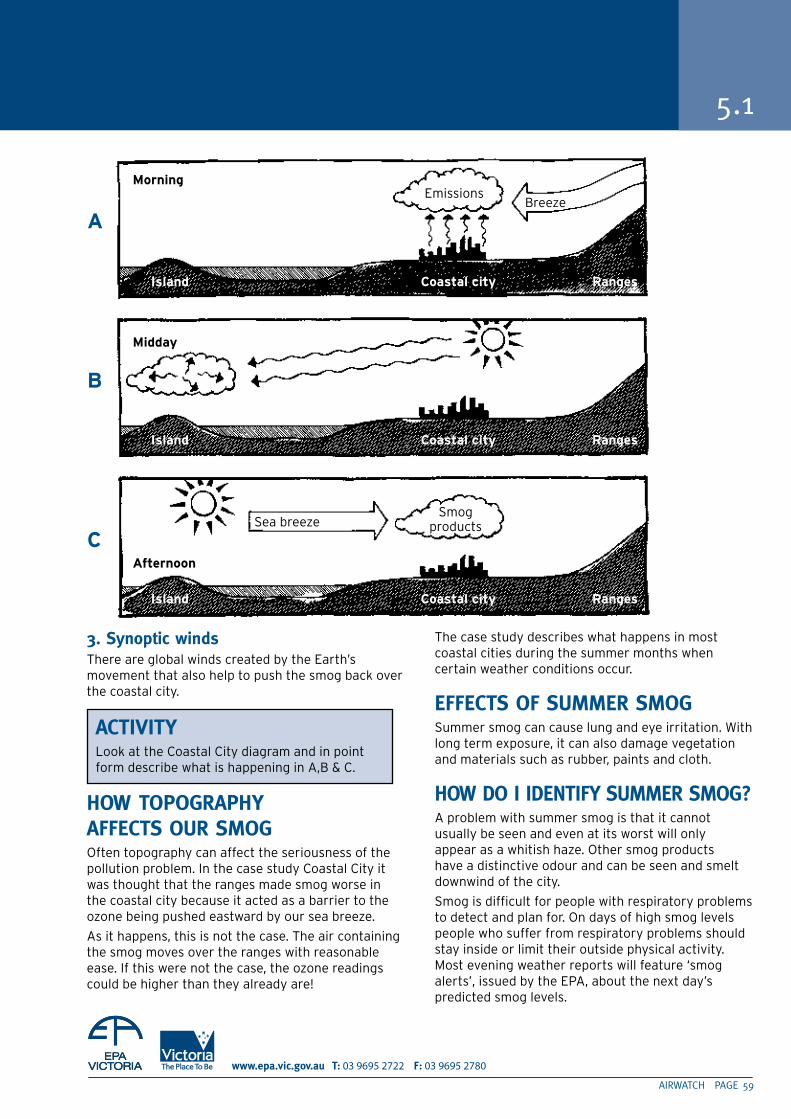
03 9695 2722 03 9695 2780
3. Synoptic winds There are global winds created by the Earth’s movement that also help to push the smog back over the coastal city.
HOW TOPOGRAPHy AFFECTS OuR SMOGOften topography can affect the seriousness of the pollution problem. In the case study Coastal City it was thought that the ranges made smog worse in the coastal city because it acted as a barrier to the ozone being pushed eastward by our sea breeze.
As it happens, this is not the case. The air containing the smog moves over the ranges with reasonable ease. If this were not the case, the ozone readings could be higher than they already are!
The case study describes what happens in most coastal cities during the summer months when certain weather conditions occur.
EFFECTS OF SuMMER SMOGSummer smog can cause lung and eye irritation. With long term exposure, it can also damage vegetation and materials such as rubber, paints and cloth.
HOW dO I IdENTIFy SuMMER SMOG?A problem with summer smog is that it cannot usually be seen and even at its worst will only appear as a whitish haze. Other smog products have a distinctive odour and can be seen and smelt downwind of the city.
Smog is difficult for people with respiratory problems to detect and plan for. On days of high smog levels people who suffer from respiratory problems should stay inside or limit their outside physical activity. Most evening weather reports will feature ‘smog alerts’, issued by the EPA, about the next day’s predicted smog levels.
5.1
a
B
C
EmissionsBreeze
afternoon
Smog products
Midday
Morning
island
island
island
Coastal city
Coastal city
Coastal city
ranges
ranges
ranges
Sea breeze
AIRWATCH PAGE 59
ACTIVITyLook at the Coastal City diagram and in point form describe what is happening in A,B & C.
Cars – a big headache
5.1
THE FORMATION OF SuMMER SMOGGo to the Reference section of the Australian Greenhouse Calculator.
Look at the ‘Summer Pollution’ animation.
Go to the ‘Cause and formation of Summer pollution’ hotlink under the animations.
1 Draw a 5 row x 2 column table (by hand or on the computer) which fills an A4 page in portrait view. Make two copies.
2 In the left-hand column draw each of the nine storyboards which illustrate the steps in summer smog formation.
3. In the right-hand column describe what is happening in each picture.
Include a title for your table.
ACTIVITIES1. The Melbourne airshed (which also includes
the Geelong region) has a particular pattern of air movement called the ‘Melbourne Eddy’ during certain times of the year. Investigate and describe the ‘Melbourne Eddy’ and how summer smog is formed by visiting the EPA website, www.epa.vic.gov.au/air/aq4kids/smog.asp.
2. EPA monitoring stations that measure air quality are located in Melbourne, Geelong and a few of the larger regional towns. Find out where these are, what they monitor and how they monitor.
3. Where is air quality reported to the public?
4. Find smog data for the Melbourne airshed for the last two years. Examine the data and answer the following questions:
(a) On how many days did the one-hour ozone level exceed the National Environmental Protection Measure (NEPM) standard of 0.1 ppm (parts per million) for each year.
(b) How many days, during this period, were they close to the NEPM standard? Which months are the worst for smog?
(c) Which year seemed to have the worst ozone problem?
(d) What time of day do high ozone levels occur?
(e) Why do they occur at this time?
SOluTIONS5. Knowing the causes of smog and taking into
account that it occurs mainly in summer, discuss solutions which would keep ozone levels below NEPM standards at all times of the year.
6. Design a strategy to inform the students in your school about the smog problem in your city and what they can do to help reduce the problem.
EddIE’S ExTRAS Find out more about the National Environment Protection Measure for Ambient Air Quality (NEPM). Write a paragraph or prepare a two- minute talk on NEPM.
PAGE 60 AIRWATCH
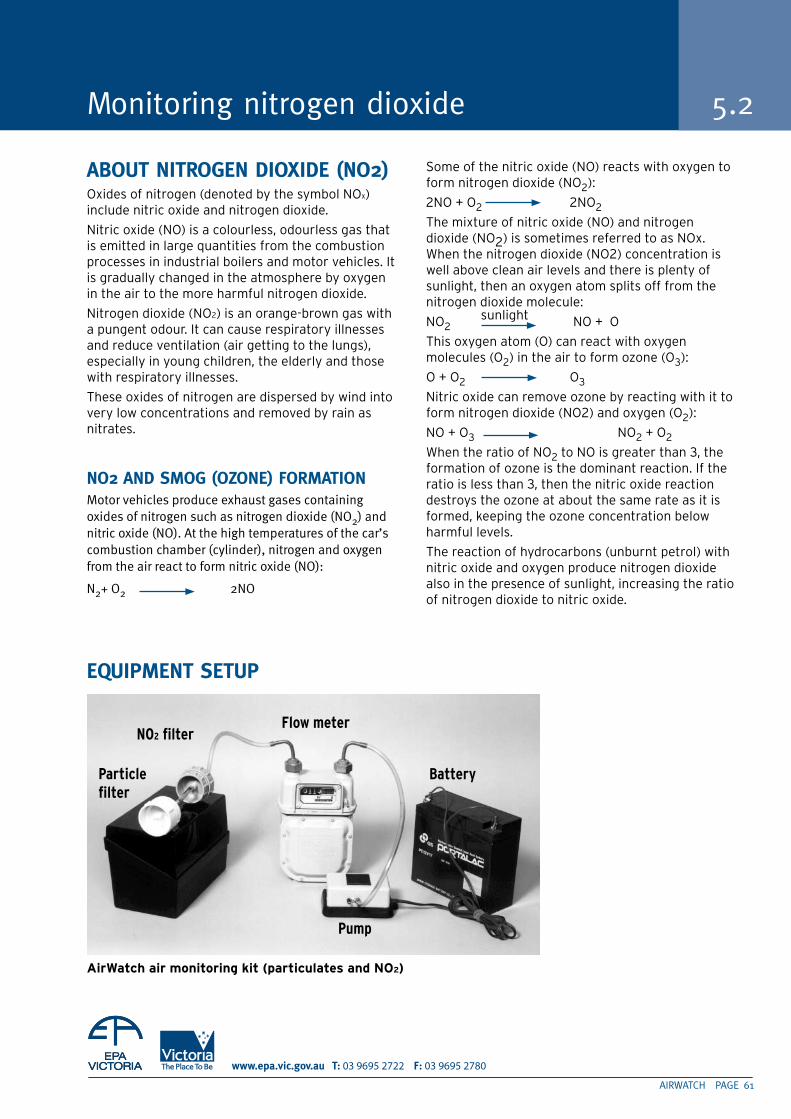
03 9695 2722 03 9695 2780
AbOuT NITROGEN dIOxIdE (NO2)Oxides of nitrogen (denoted by the symbol NOx) include nitric oxide and nitrogen dioxide.
Nitric oxide (NO) is a colourless, odourless gas that is emitted in large quantities from the combustion processes in industrial boilers and motor vehicles. It is gradually changed in the atmosphere by oxygen in the air to the more harmful nitrogen dioxide.
Nitrogen dioxide (NO2) is an orange-brown gas with a pungent odour. It can cause respiratory illnesses and reduce ventilation (air getting to the lungs), especially in young children, the elderly and those with respiratory illnesses.
These oxides of nitrogen are dispersed by wind into very low concentrations and removed by rain as nitrates.
NO2 ANd SMOG (OzONE) FORMATIONMotor vehicles produce exhaust gases containing oxides of nitrogen such as nitrogen dioxide (NO2) and nitric oxide (NO). At the high temperatures of the car’s combustion chamber (cylinder), nitrogen and oxygen from the air react to form nitric oxide (NO):
N2+ O2 2NO
EquIPMENT SETuP
Some of the nitric oxide (NO) reacts with oxygen to form nitrogen dioxide (NO2):
2NO + O2 2NO2
The mixture of nitric oxide (NO) and nitrogen dioxide (NO2) is sometimes referred to as NOx. When the nitrogen dioxide (NO2) concentration is well above clean air levels and there is plenty of sunlight, then an oxygen atom splits off from the nitrogen dioxide molecule:
NO2 sunlight NO + O
This oxygen atom (O) can react with oxygen molecules (O2) in the air to form ozone (O3):
O + O2 O3
Nitric oxide can remove ozone by reacting with it to form nitrogen dioxide (NO2) and oxygen (O2):
NO + O3 NO2 + O2
When the ratio of NO2 to NO is greater than 3, the formation of ozone is the dominant reaction. If the ratio is less than 3, then the nitric oxide reaction destroys the ozone at about the same rate as it is formed, keeping the ozone concentration below harmful levels.
The reaction of hydrocarbons (unburnt petrol) with nitric oxide and oxygen produce nitrogen dioxide also in the presence of sunlight, increasing the ratio of nitrogen dioxide to nitric oxide.
Monitoring nitrogen dioxide 5.2
airwatch air monitoring kit (particulates and no2)
Battery
Pump
Particle filter
Flow meterNO2 filter
AIRWATCH PAGE 61

Cars – a big headache
5.2
WHy MONITOR NO2?We monitor NO2 because it can cause health problems for those who have to live with it and also because it is a precursor to summer smog which is becoming a problem in most major cities in Australia. The NO2 and oxygen (O2) in the atmosphere react with hydrocarbons in the presence of sunlight to form ozone (O3) — the major component of summer smog.
THE ExPERIMENT ExPlAINEdTo measure the amount of NO2 in the air you have to:
1. prepare treated filter papers
2. collect NO2 on the filter papers
3. extract NO2 from the papers
4. react the NO2 with a reagent to form a pink colour
5. compare this colour to a photographic strip or to known standards to estimate the amount of NO2.
The collection of the NO2 will take several hours to accumulate enough NO2 on the filter paper to give a colour change that can be seen.
The reaction to trap the NO2 is:
NOTE: sampling for NO2 is carried out ‘in line’ with the particle sampling just by adding another filter to the particle sampler. The first filter holder collects the particles and the second collects the NO2.
EquIPMENT As well as the kit shown on the previous page you will need:
• precoated fibreglass filter papers (see Appendix 1)
• plastic snap-lock seal bags
• plastic vials for sample comparison
• reagent solution (see Appendix 1)
• pink photographic scale (see Appendix 8)
• HPLC grade (double deionised) water
• flasks, beakers, pipettes.
1. COllECTING THE NO21. Clean and dry the filter holders before sampling.
2. Load the screw-down filter holder for particle sampling.
3. Using tweezers, load the clip-down filter holder with the filter paper that has been coated with the ‘soaking solution’. REMEMBER, this must be a fibreglass filter. Place the filter paper smooth side up, rough side down.
4. Set up the equipment according to the picture, ensuring there is a filter paper in each holder.
5. Make sure the equipment is secure and protected from the weather if you are leaving it unattended.
6. Record on your Record Sheet the flow meter reading and time before you start. (Refer to Appendix 2.)
7. Connect the pump to the battery.
8. Record on your Record Sheet the flow meter reading and time after the required sampling time (i.e., three hours). (Appendix 2)
9. Record the total volume of air sampled in cubic metres.
10. Carefully remove the filters from the filter holders using tweezers.
11. Place each filter in a plastic envelope and seal.
12. Label each envelope with date, location, sample time and air volume sampled. Keep for later testing in a fridge or a dark cupboard.
PAGE 62 AIRWATCH
The nitrogen dioxide test is very sensitive and should give a pink colour after three hours sampling.
If it does not, you may have to increase your sampling time.
Always remember to record the volume of air sampled for whatever time you sample. This value is needed for your calculations.
2NO2 + 3I– 2NO2– + I3
–
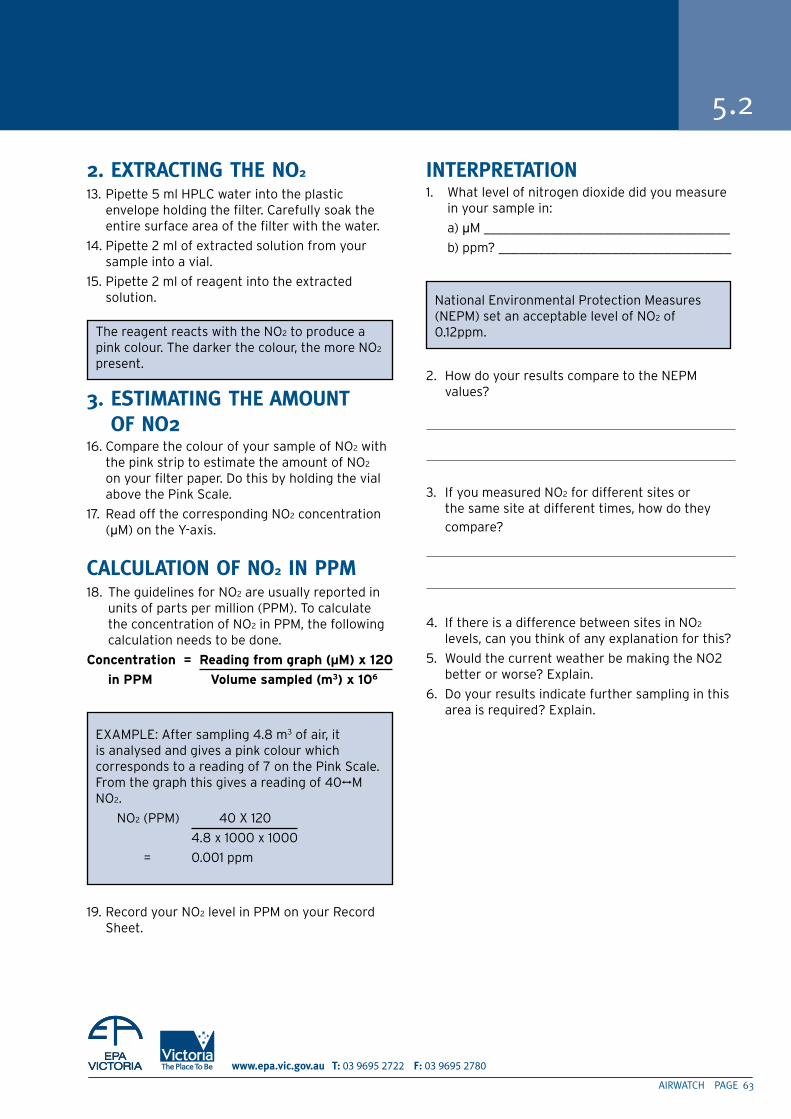
03 9695 2722 03 9695 2780
5.2
AIRWATCH PAGE 63
2. ExTRACTING THE NO2
13. Pipette 5 ml HPLC water into the plastic envelope holding the filter. Carefully soak the entire surface area of the filter with the water.
14. Pipette 2 ml of extracted solution from your sample into a vial.
15. Pipette 2 ml of reagent into the extracted solution.
3. ESTIMATING THE AMOuNT OF NO2
16. Compare the colour of your sample of NO2 with the pink strip to estimate the amount of NO2 on your filter paper. Do this by holding the vial above the Pink Scale.
17. Read off the corresponding NO2 concentration (µM) on the Y-axis.
CAlCulATION OF NO2 IN PPM18. The guidelines for NO2 are usually reported in
units of parts per million (PPM). To calculate the concentration of NO2 in PPM, the following calculation needs to be done.
Concentration = reading from graph (µM) x 120
in PPM Volume sampled (m3) x 106
19. Record your NO2 level in PPM on your Record Sheet.
INTERPRETATION1. What level of nitrogen dioxide did you measure
in your sample in:
a) µM _____________________________________
b) ppm? ___________________________________
2. How do your results compare to the NEPM values?
3. If you measured NO2 for different sites or the same site at different times, how do they
compare?
4. If there is a difference between sites in NO2 levels, can you think of any explanation for this?
5. Would the current weather be making the NO2 better or worse? Explain.
6. Do your results indicate further sampling in this area is required? Explain.
EXAMPLE: After sampling 4.8 m3 of air, it is analysed and gives a pink colour which corresponds to a reading of 7 on the Pink Scale. From the graph this gives a reading of 40µM NO2.
NO2 (PPM) 40 X 120
4.8 x 1000 x 1000
= 0.001 ppm
National Environmental Protection Measures (NEPM) set an acceptable level of NO2 of 0.12ppm. The reagent reacts with the NO2 to produce a
pink colour. The darker the colour, the more NO2 present.
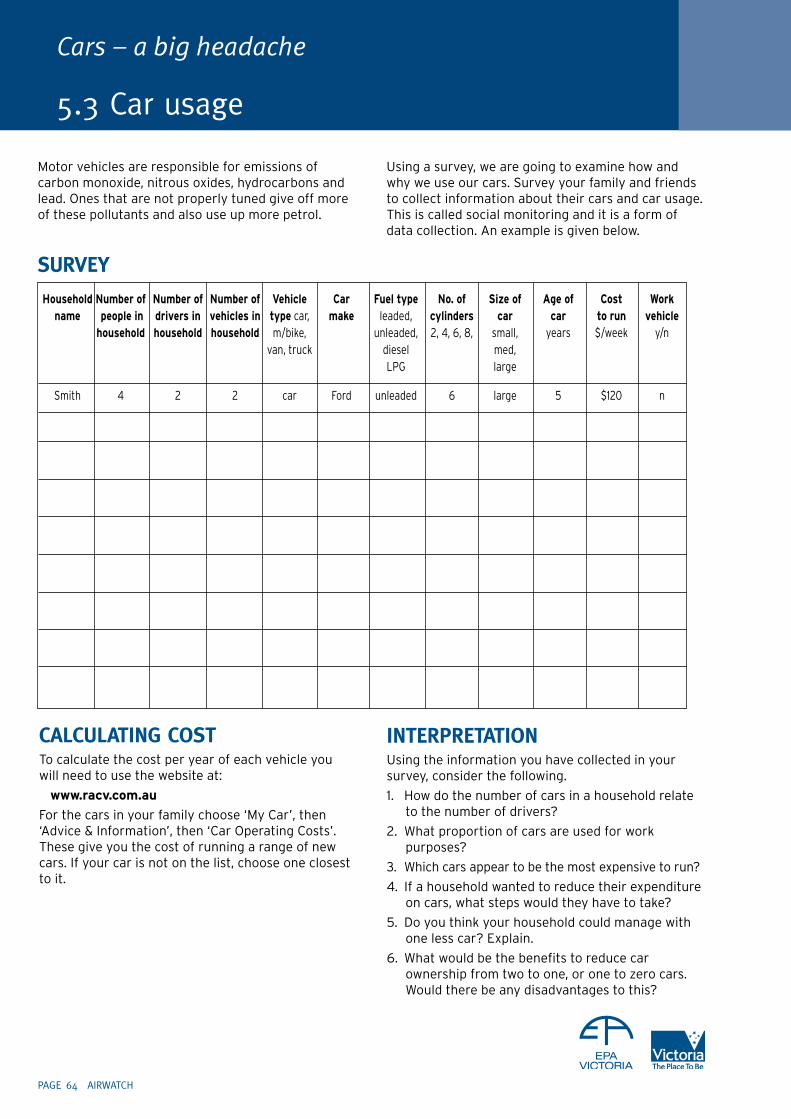
Cars – a big headache
5.3 Car usage
household number of number of number of Vehicle Car fuel type no. of size of age of Cost work name people in drivers in vehicles in type car, make leaded, cylinders car car to run vehicle household household household m/bike, unleaded, 2, 4, 6, 8, small, years $/week y/n van, truck diesel med, LPG large
Smith 4 2 2 car Ford unleaded 6 large 5 $120 n
CAlCulATING COSTTo calculate the cost per year of each vehicle you will need to use the website at:
www.racv.com.au
For the cars in your family choose ‘My Car’, then ‘Advice & Information’, then ‘Car Operating Costs’. These give you the cost of running a range of new cars. If your car is not on the list, choose one closest to it.
INTERPRETATIONUsing the information you have collected in your survey, consider the following.
1. How do the number of cars in a household relate to the number of drivers?
2. What proportion of cars are used for work purposes?
3. Which cars appear to be the most expensive to run?
4. If a household wanted to reduce their expenditure on cars, what steps would they have to take?
5. Do you think your household could manage with one less car? Explain.
6. What would be the benefits to reduce car ownership from two to one, or one to zero cars. Would there be any disadvantages to this?
PAGE 64 AIRWATCH
Motor vehicles are responsible for emissions of carbon monoxide, nitrous oxides, hydrocarbons and lead. Ones that are not properly tuned give off more of these pollutants and also use up more petrol.
SuRVEy
Using a survey, we are going to examine how and why we use our cars. Survey your family and friends to collect information about their cars and car usage. This is called social monitoring and it is a form of data collection. An example is given below.
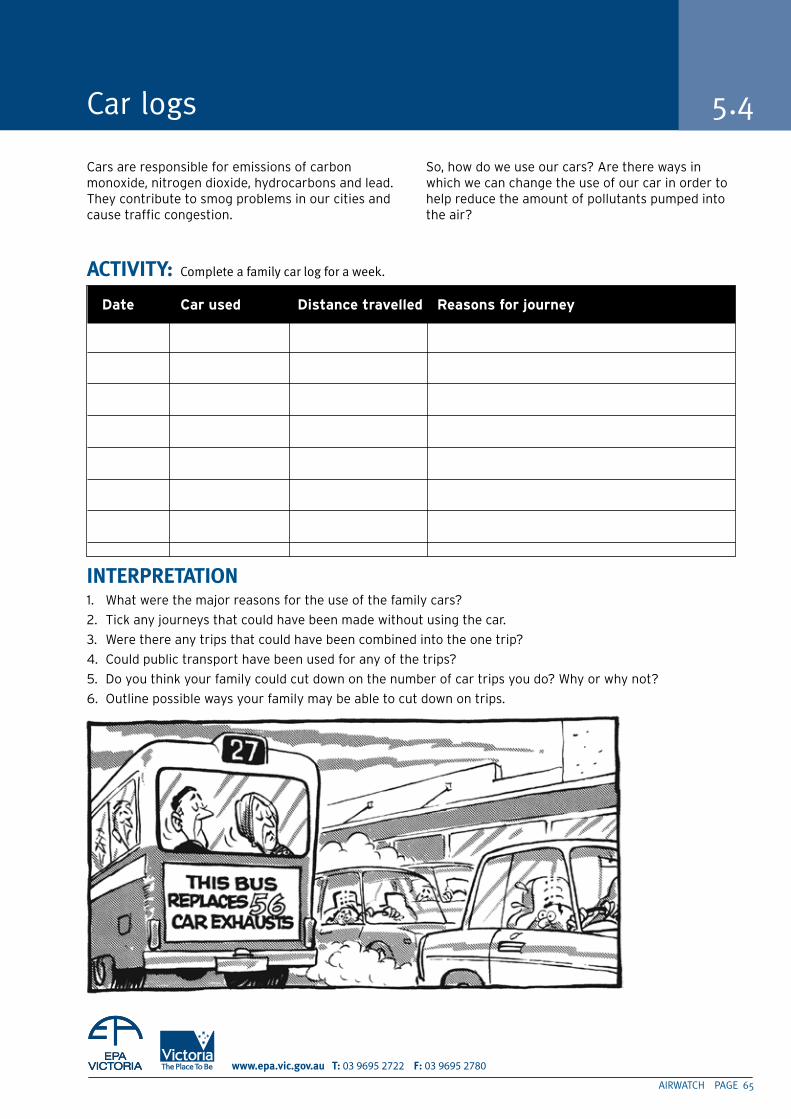
03 9695 2722 03 9695 2780
INTERPRETATION1. What were the major reasons for the use of the family cars?
2. Tick any journeys that could have been made without using the car.
3. Were there any trips that could have been combined into the one trip?
4. Could public transport have been used for any of the trips?
5. Do you think your family could cut down on the number of car trips you do? Why or why not?
6. Outline possible ways your family may be able to cut down on trips.
Car logs 5.4
Cars are responsible for emissions of carbon monoxide, nitrogen dioxide, hydrocarbons and lead. They contribute to smog problems in our cities and cause traffic congestion.
So, how do we use our cars? Are there ways in which we can change the use of our car in order to help reduce the amount of pollutants pumped into the air?
Date Car used Distance travelled reasons for journey
AIRWATCH PAGE 65
ACTIVITy: Complete a family car log for a week.
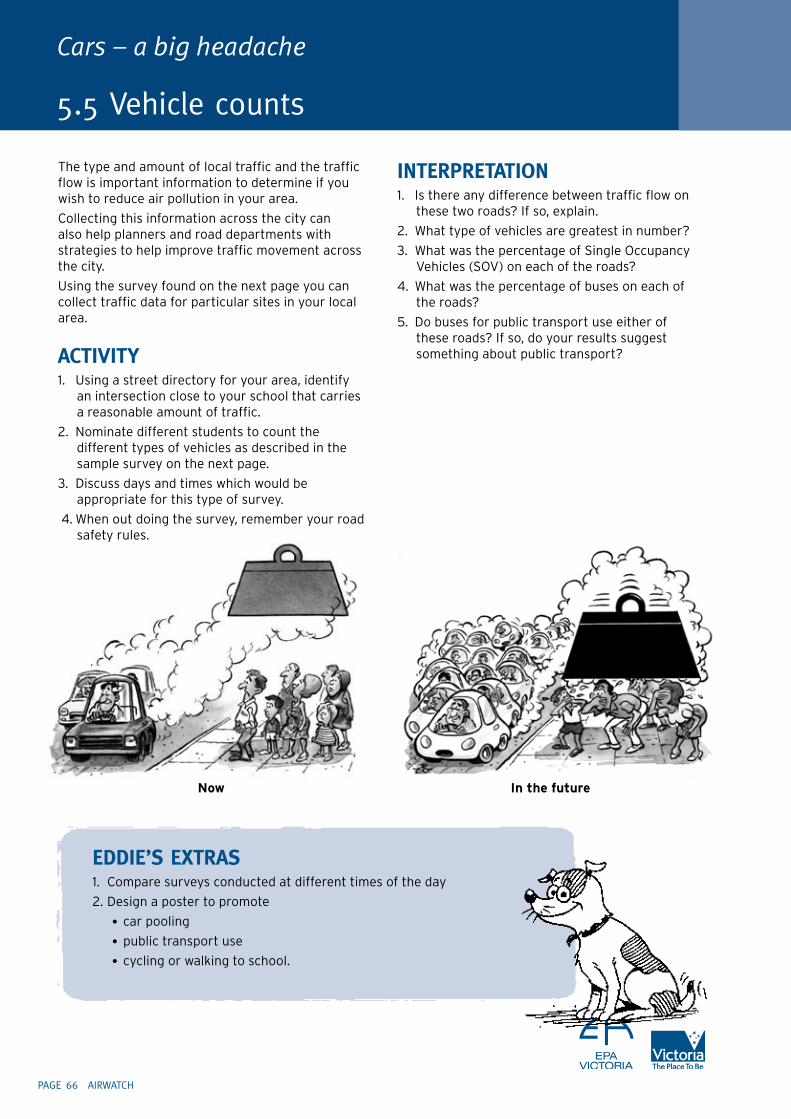
Cars – a big headache
5.5 Vehicle counts
The type and amount of local traffic and the traffic flow is important information to determine if you wish to reduce air pollution in your area.
Collecting this information across the city can also help planners and road departments with strategies to help improve traffic movement across the city.
Using the survey found on the next page you can collect traffic data for particular sites in your local area.
ACTIVITy1. Using a street directory for your area, identify
an intersection close to your school that carries a reasonable amount of traffic.
2. Nominate different students to count the different types of vehicles as described in the sample survey on the next page.
3. Discuss days and times which would be appropriate for this type of survey.
4. When out doing the survey, remember your road safety rules.
INTERPRETATION1. Is there any difference between traffic flow on
these two roads? If so, explain.
2. What type of vehicles are greatest in number?
3. What was the percentage of Single Occupancy Vehicles (SOV) on each of the roads?
4. What was the percentage of buses on each of the roads?
5. Do buses for public transport use either of these roads? If so, do your results suggest something about public transport?
EddIE’S ExTRAS1. Compare surveys conducted at different times of the day
2. Design a poster to promote
• car pooling
• public transport use
• cycling or walking to school.
now in the future
PAGE 66 AIRWATCH
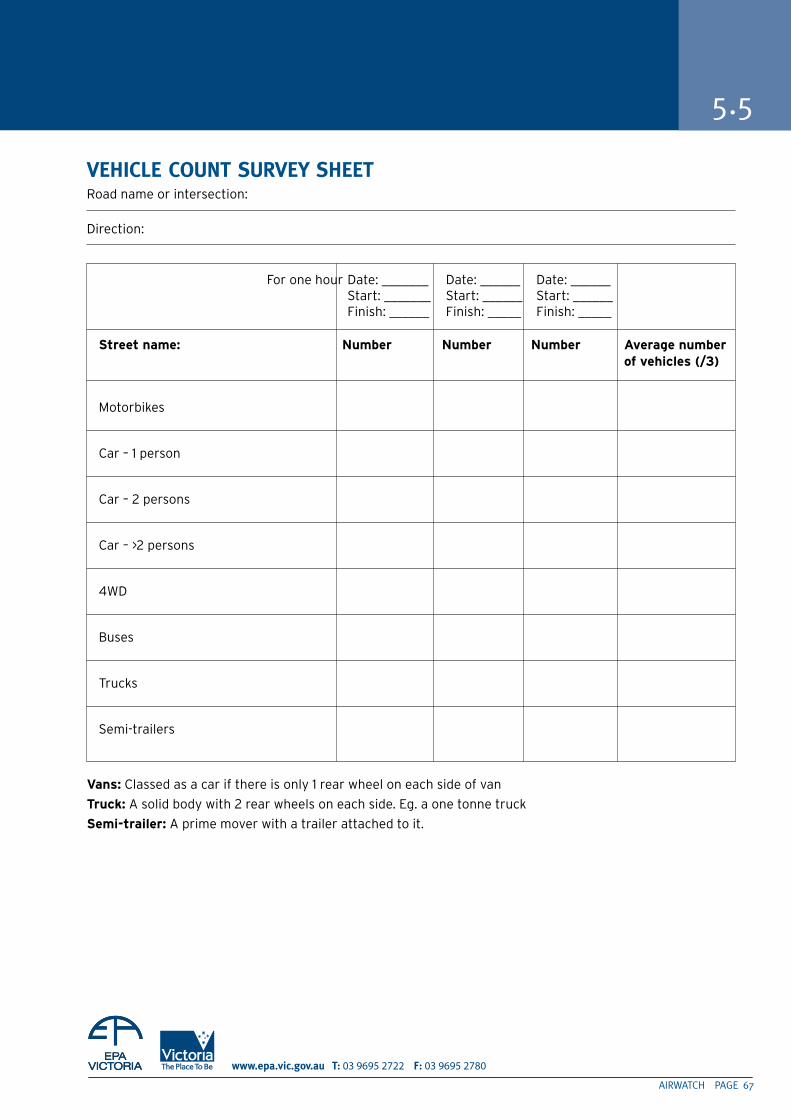
03 9695 2722 03 9695 2780
5.5
VEHIClE COuNT SuRVEy SHEETRoad name or intersection:
Direction:
Vans: Classed as a car if there is only 1 rear wheel on each side of van
truck: A solid body with 2 rear wheels on each side. Eg. a one tonne truck
semi-trailer: A prime mover with a trailer attached to it.
For one hour Date: _______ Date: ______ Date: ______ Start: _______ Start: ______ Start: ______ Finish: ______ Finish: _____ Finish: _____
street name: number number number average number of vehicles (/3)
Motorbikes
Car – 1 person
Car – 2 persons
Car – >2 persons
4WD
Buses
Trucks
Semi-trailers
AIRWATCH PAGE 6�
Cars – a big headache
5.6 Travel patterns
TRAVEl PATTERNSIn cities, the use of cars and other vehicles contribute to air pollution such as smog and to a lesser extent haze. The increased traffic volume is also contributing to traffic congestion, especially in peak-hour commuting.
This has brought about demands in our community for a solution to these problems - some would like bigger and better roads, some would prefer public transport improvements and fewer cars on the roads.
Whatever the solution is, to build more roads, or use alternative transport methods, or a sustainable combination of both, it helps decision makers and planners to know what the travel patterns are in their area so that they can find sensible and appropriate solutions.
In this survey you will be asking people you know about their travel habits, especially those relating to commuting, that is, how they get to and from work.
ACTIVITy1. Each class member is to interview at least one
person they know using the questionnaire on the next page.
2. Back in class, the responses to each question can be collated by producing a histogram for each response. Your teacher will show you how to do this.
3. Using the histograms, discuss what patterns and trends you can see.
ANAlySIS1. When do most people in this sample i) go to work
ii) come home from work?
2. What is the most common mode of travel?
3. What is the least common?
4. What is the most common distance from work?
5. What is the most common travel time?
6. What improvements for each of the following do people most want?
• public transport
• cycling
• walking
• carpooling.
7. Which mode of alternative transport seems most likely to be used if improvements are made?
8. Other than convenience, what is the most common reason for using a car to get to work?
9. Which age group seems to use the cars the most?
dISCuSSIONFrom the information you have gathered in your questionnaire, discuss possible solutions to reduce car usage for commuting by the people in your area.
PAGE 68 AIRWATCH
EddIE’S ExTRASDesign a survey that investigates how people use their cars at times other than going to work. Try to find out how and why they use their car rather than some other alternative.
From the results, suggest possible ways to get people to use their cars less during these times.

03 9695 2722 03 9695 2780
5.6
TRAVEl PATTERN quESTIONNAIRE1. What time do you normally arrive at work?
Before 7.30 7.30 — 7.45
7.45 — 8.00 8.00 — 8.15
8.15 — 8.30 8.30 — 8.45
8.45 — 9.00 9.00 — 10.00
10.00 — 16.30 16.30 — 19.00
After 19.00
2. What time do you normally leave work?
Before 9.00 9.00 — 16.30
16.30 — 16.45 16.45 — 17.00
17.00 — 17.15 17.15 — 17.30
17.30 — 17.45 17.45 — 18.00
18.00 — 18.30 After 18.30
3. How do you usually travel to work?
Bus
Bicycle
Driver, on your own
Driver, with other(s)
As a passenger in another car
On foot
Motorbike
Train
Other
4. Which of the following do you occasionally use instead of your usual form of transport?
(Tick one only)
Bus
Bicycle
Driver, on your own
Driver, with other(s)
As a passenger in another’s car
On foot
Motorbike
Train
Other
5. How far do you travel to work?
Up to 1 km
Between 1 km and 2 km
Between 2 km and 4 km
Between 4 km and 10 km
Between 10 km and 20 km
Over 20 km
6. How long does it currently take you to get to work?
0—15 minutes
16—30 minutes
31—60 minutes
61—90 minutes
Longer than 90 minutes
7. What improvements to public transport would make you more likely to use it?
(Tick one only)
Better connections
Faster service
Cheaper fares
More direct services
Cleaner buses/trains
Better reliability
Specific worker’s buses
Other
None of these
8. What improvements to cycling facilities would make you more likely to cycle to work? (Tick one only)
Changing facilities/showers/lockers at work
Arrangements to buy a bicycle at a discount
Secure cycle parking
Better road facilities
Other
None of these
AIRWATCH PAGE 69

PAGE �0 AIRWATCH
9. What improvements to pedestrian facilities would make you more likely to walk to work? (Tick one only)
More footpaths around your home
More footpaths on the journey to work
Better lit footpaths
Better road crossing facilities
Other
None of these
10. Which of the following would most encourage you to car share? (Tick one only)
Help in finding car share partners
Standby arrangements if let down by car driver
Reserved parking for car sharers
Company incentives/allowances
Other
None of these
11. If improvements were made to allow you to travel to work other than by car, which of the following would you be prepared to use regularly? (Tick one only)
Bus
Rail
Cycle
Walk
Car share
None of these
12. If you travel by car to work, what is your main reason other than convenience for doing so? (Tick one only)
Car essential during the day
Dropping/collecting children
Given a lift
Cheaper than alternatives
Health reasons
Lack of alternative
Other
Do not use a car
13. Age
Under 20
21—24
25—34
35—44
45—54
55 or over
Cars – a big headache
5.6
AIRWATCH PAGE �1
03 9695 2722 03 9695 2780
Ozone is the principal component of ground-level smog. It is formed when hydrocarbon and nitrogen oxide pollution from vehicles, power plants, refineries and other sources react in the atmosphere in the presence of sunlight. Ozone is a powerful oxidizing agent that damages lung tissue.
The effects include increased respiratory symptoms, damage to cells of the respiratory tract, pulmonary inflammation, declines in lung function, increased susceptibility to respiratory infections, and increased risk of hospitalization and early death.
Four groups of people are especially sensitive to ozone: children, people with chronic respiratory bronchitis, emphysema and asthma, persons who exercise or work outdoors, and people who, for reasons that remain unknown, are more sensitive to the physiological effects of ozone.
Important new findings include:
• identification of the possible genetic basis for susceptibility to ozone;
• increasing evidence of a mortality effect of ozone;
• evidence of long-term impacts on lung function from chronic exposure; and
• increased evidence of the effects of ozone on sensitive groups, such as children and asthmatics.
ACTIVITyIn the table below, write down any words bolded above and write their meaning next to them.
Summer smog and health 5.7
words Meanings
PAGE �2 AIRWATCH
Below are summaries of some studies that illustrate how the findings about smog and health effects were discovered.
1. ozone harms the respiratory health of us military academy cadets
Researchers from Columbia University and New York University sought to determine whether changes in lung function (how much air lungs can take in) or respiratory symptoms would occur over the course of a summer among healthy young adults working outdoors in the presence of ozone. The study followed 72 sophomore cadets from the US Military Academy at West Point, New York, during their summer training. All the subjects on average experienced a decline in lung function over the course of the summer. There were also significant increases in reports of cough, chest tightness, and sore throat. The decline in lung function was greatest in the group of military cadets who attended training in Fort Dix, New Jersey, where peak hourly ozone concentrations above 100 ppb occurred frequently. ‘These results suggest a possible adverse respiratory-health impact of exposures to particulate matter and ozone in healthy young adults engaged in intensive outdoor training,’ conclude the authors.
Kinney, PL and Lippmann, M. ‘Respiratory effects of seasonal exposures to ozone and Particles’. Archives of Environmental Health, Vol. 55, No. 3, pp. 210—216, May/June 2000.
2. long-term ozone exposure diminishes respiratory health
Few studies have reported on the respiratory effects of prolonged, multi-year exposures to ozone. This study examined data from health questionnaires and lung function measurements in relation to residence histories to examine the effect of long-term ozone exposures on over 500 non-smoking Yale college students. Investigators found that ‘living for four or more years in regions of the country with high levels of ozone and related copollutants is associated with diminished lung function and more frequent reports of respiratory symptoms.’
Galizia, A and Kinney, PL. ‘Long-term residence in areas of high ozone: Associations with respiratory health in a nationwide sample of nonsmoking young adults’. Environ Health Perspect, Vol. 107, No. 8, pp. 675—679, August 1999.
3. School absences rise with high ozone days
The Children’s Health Study is being carried out in twelve southern California communities that fall along a gradient of air pollution. This study explored the effect of ozone, PM10 and nitrogen dioxide on school absenteeism due to upper- and lower-respiratory illness in a group of fourth-graders. Researchers found that relatively small short-term changes in ozone, but not the other pollutants, were associated with increase in school absences due to respiratory illness in children 9—10 years of age. ‘Because exposures at the levels observed in this study are common, the increase in school absenteeism from respiratory illnesses associated with relatively modest day-to-day changes in ozone concentration documents an important adverse impact of ozone on children’s health and well-being,’ state the authors.
Gilliland FD, Berhane K, Rappaport EB, Thomas DC, Avol E, Gauderman WJ, London SJ, Margolis HG, McConnell R, Islam KT, and Peters JM. ‘The effects of ambient air pollution on school absenteeism due to respiratory illness’. Epidemiology, Vol. 12, No. 1, pp. 43—54, January 2001.
4. ozone is a risk factor for respiratory problems in kids, especially babies, toddlers and adolescents
Burnett et al. (2001) examined the association between air pollution and hospital admissions for acute respiratory problems in babies and toddlers during a 15-year period in Toronto, Canada. A 35 percent increase in the daily hospitalization rate for respiratory problem was associated with average ozone concentrations in the summer, but not during other seasons. The ozone effect persisted after adjustment for other air pollutants and weather.
Burnett RT, Smith-Doiron M, Stieb D, Raizenne ME, Brook JR, Dales RE, Leech JA, Cakmak S, and Krewski D. ‘Association between ozone and hospitalization for acute respiratory diseases in children less than 2 years of age’. American Journal of Epidemiology, Vol. 153, No. 5, pp. 444—452, 2001.
5.7
Cars – a big headache
AIRWATCH PAGE �3
03 9695 2722 03 9695 2780
5. in Brisbane, australia, ozone levels are reasonably constant year round. This large study of daily admissions to public hospitals during the period 1987—1994 found that ozone was consistently associated with admissions for asthma and respiratory disease — with little evidence of a threshold.
Petroeschevsky A, Simpson RW, Thalib L and Rutherford S. ‘Associations between outdoor air pollution and hospital admissions in Brisbane, Australia’. Archives of Environmental Health, Vol. 56(1), pp. 37—52, Jan—Feb 2001.
6. ozone increasingly implicated in premature mortality
A similar study known as the APHEA project – Air Pollution and Health: a European Approach – of six cites in Central and Western Europe examined data on daily deaths and daily air pollution levels. Significant positive associations were found between daily deaths and ozone. Positive associations were also reported for nitrogen dioxide, but study authors believe this may be due to confounding by other vehicle-derived pollutants and needs further study. Thurston and Ito pooled data from 15 studies and estimated a small effect of ozone on total mortality. According to Samet et al.: ‘Taken together, the results of these three studies provide consistent evidence that exposure to ozone also increases the risk of death.’
Tuoloumi G, Katsouyanni K, Zmirou D, Schwartz J, Spix C, de Leon AP, Tobias A, Quennel P, Rabczenko D, Bacharova L, Bisanti L, Vonk JM, and Ponka A.
‘Short-term effects of ambient oxidant exposure on mortality: a combined analysis within the APHEA Project’. American Journal of Epidemiology, Vol. 146: No. 2, pp. 177—185, 1997.
ACTIVITyUsing these studies, answer the following:
Which article or articles support the idea that:
• ozone will affect the way your lungs work when outside exercising
• more infants suffer respiratory problems in summer
• children are more likely to be away with respiratory illnesses on high ozone days
• that ozone causes coughs, chest tightness and sore throat
• that deaths are likely to increase on high ozone days.
5.7

PAGE �4 AIRWATCH

03 9695 2722 03 9695 2780
this section will help students to develop an understanding of wind pollination, what pollen looks like and how it contributes to hayfever and asthma.
POllEN
AIRWATCH PAGE �5
SECT
ION
> 6

PAGE �6 AIRWATCH
The transfer of pollen grains from male to female parts of flowers is called pollination.
The pollen grains are physically transported to the stigma (the female plant part) by air, water or animal carriers. When pollen lands on the stigma a tube extends from a small aperture in the pollen grain wall. The pollen tube penetrates the stigma and grows down the style to the ovary. Pollen carries the sperm to the eggs found in the ovary.
Here the tip of the tube ruptures and sperm cells are transferred into the ovules to fertilize the egg. After fertilization the ovule develops into a seed and often develops into a fruit.
The small flowers of grasses produce large amounts of wind-blown pollen. They also have large stigmas to catch this pollen. Grass pollen is the major pollen type in the air in spring and summer in cool temperate climates such as Melbourne.
PEOPlE ANd POllENFlowering plants are divided into ‘wind’ pollinating and ‘insect’ pollinating. The monitoring activities in this manual are concerned with wind pollinating plant types.
For some people the amount of pollen in the air has a direct effect upon their health. Airborne pollen on its own, or in combination with fine particles in the air, can influence the incidence and severity of asthma and hayfever in the community.
During the flowering season numerous pollen grains are released from the flower and blown around in the air. During dry weather pollen is easily blown into eyes and nasal passages, causing hayfever in sensitive people.
During and after rain (often thunderstorms) some grains of pollen burst, releasing the allergen-containing starch granules. In Melbourne after rain, air samples have been shown to contain up to 50 times more starch granules than air sampled on a sunny day during the grass pollen season. The starch granules are small enough to be breathed in and can enter the bronchi (tubes to the lungs), where they may trigger allergic asthma.
Pollen
6.1 Pollination
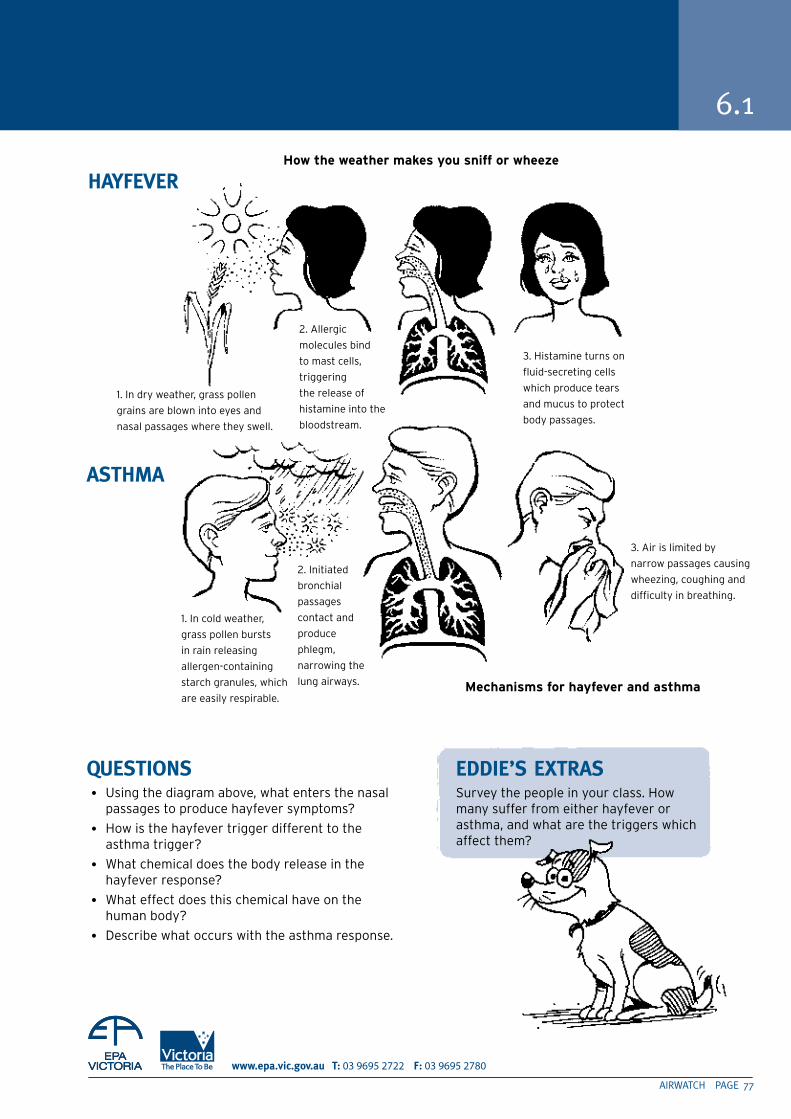
AIRWATCH PAGE ��
03 9695 2722 03 9695 2780
quESTIONS• Using the diagram above, what enters the nasal
passages to produce hayfever symptoms?
• How is the hayfever trigger different to the asthma trigger?
• What chemical does the body release in the hayfever response?
• What effect does this chemical have on the human body?
• Describe what occurs with the asthma response.
how the weather makes you sniff or wheeze
2. Allergic
molecules bind
to mast cells,
triggering
the release of
histamine into the
bloodstream.
3. Histamine turns on
fluid-secreting cells
which produce tears
and mucus to protect
body passages.
3. Air is limited by
narrow passages causing
wheezing, coughing and
difficulty in breathing.
2. Initiated
bronchial
passages
contact and
produce
phlegm,
narrowing the
lung airways.
1. In cold weather,
grass pollen bursts
in rain releasing
allergen-containing
starch granules, which
are easily respirable.
1. In dry weather, grass pollen
grains are blown into eyes and
nasal passages where they swell.
6.1
Mechanisms for hayfever and asthma
HAyFEVER
ASTHMA
EddIE’S ExTRASSurvey the people in your class. How many suffer from either hayfever or asthma, and what are the triggers which affect them?
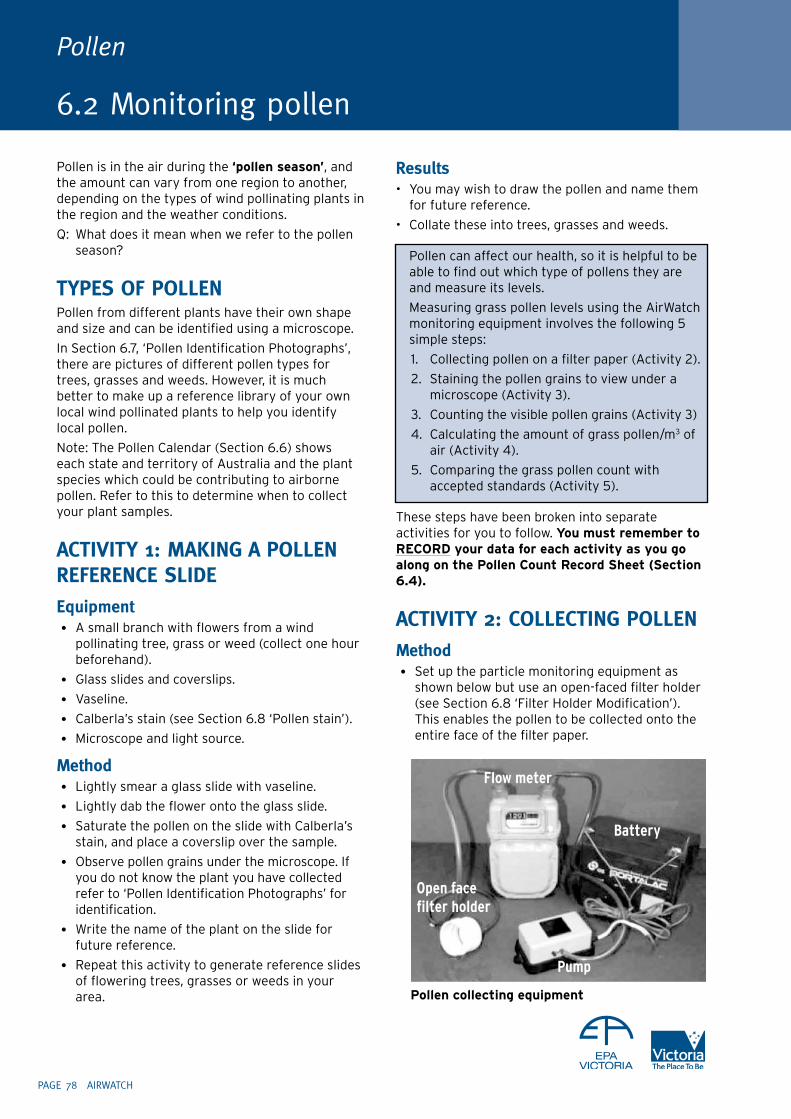
PAGE �8 AIRWATCH
Pollen is in the air during the ‘pollen season’, and the amount can vary from one region to another, depending on the types of wind pollinating plants in the region and the weather conditions.
Q: What does it mean when we refer to the pollen season?
TyPES OF POllENPollen from different plants have their own shape and size and can be identified using a microscope.
In Section 6.7, ‘Pollen Identification Photographs’, there are pictures of different pollen types for trees, grasses and weeds. However, it is much better to make up a reference library of your own local wind pollinated plants to help you identify local pollen.
Note: The Pollen Calendar (Section 6.6) shows each state and territory of Australia and the plant species which could be contributing to airborne pollen. Refer to this to determine when to collect your plant samples.
ACTIVITy 1: MAkING A POllEN REFERENCE SlIdEEquipment• A small branch with flowers from a wind
pollinating tree, grass or weed (collect one hour beforehand).
• Glass slides and coverslips.
• Vaseline.
• Calberla’s stain (see Section 6.8 ‘Pollen stain’).
• Microscope and light source.
Method• Lightly smear a glass slide with vaseline.
• Lightly dab the flower onto the glass slide.
• Saturate the pollen on the slide with Calberla’s stain, and place a coverslip over the sample.
• Observe pollen grains under the microscope. If you do not know the plant you have collected refer to ‘Pollen Identification Photographs’ for identification.
• Write the name of the plant on the slide for future reference.
• Repeat this activity to generate reference slides of flowering trees, grasses or weeds in your area.
Results• You may wish to draw the pollen and name them
for future reference.
• Collate these into trees, grasses and weeds.
Pollen can affect our health, so it is helpful to be able to find out which type of pollens they are and measure its levels.
Measuring grass pollen levels using the AirWatch monitoring equipment involves the following 5 simple steps:
1. Collecting pollen on a filter paper (Activity 2).
2. Staining the pollen grains to view under a microscope (Activity 3).
3. Counting the visible pollen grains (Activity 3)
4. Calculating the amount of grass pollen/m3 of air (Activity 4).
5. Comparing the grass pollen count with accepted standards (Activity 5).
These steps have been broken into separate activities for you to follow. You must remember to reCorD your data for each activity as you go along on the Pollen Count record sheet (section 6.4).
ACTIVITy 2: COllECTING POllEN Method• Set up the particle monitoring equipment as
shown below but use an open-faced filter holder (see Section 6.8 ‘Filter Holder Modification’). This enables the pollen to be collected onto the entire face of the filter paper.
Pollen
6.2 Monitoring pollen
Pollen collecting equipment
Battery
Pump
Open face filter holder
Flow meter
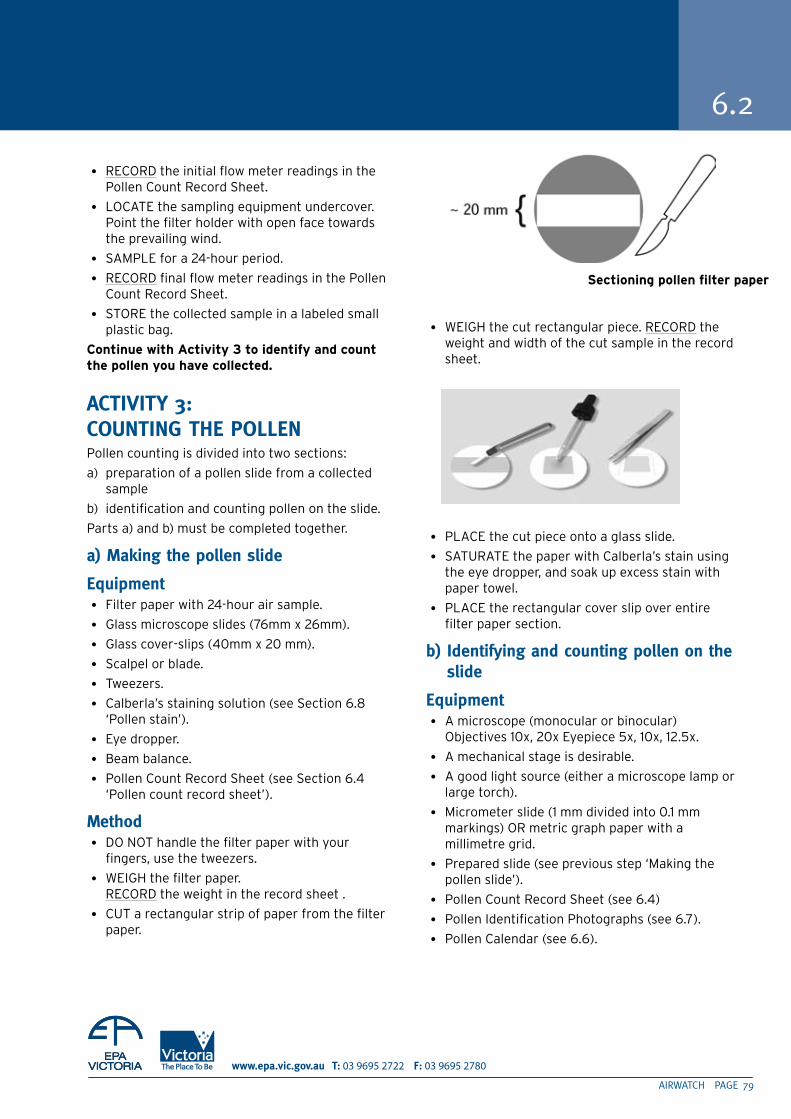
AIRWATCH PAGE �9
03 9695 2722 03 9695 2780
• RECORD the initial flow meter readings in the Pollen Count Record Sheet.
• LOCATE the sampling equipment undercover. Point the filter holder with open face towards the prevailing wind.
• SAMPLE for a 24-hour period.
• RECORD final flow meter readings in the Pollen Count Record Sheet.
• STORE the collected sample in a labeled small plastic bag.
Continue with activity 3 to identify and count the pollen you have collected.
ACTIVITy 3: COuNTING THE POllENPollen counting is divided into two sections:
a) preparation of a pollen slide from a collected sample
b) identification and counting pollen on the slide.
Parts a) and b) must be completed together.
a) Making the pollen slide
Equipment• Filter paper with 24-hour air sample.
• Glass microscope slides (76mm x 26mm).
• Glass cover-slips (40mm x 20 mm).
• Scalpel or blade.
• Tweezers.
• Calberla’s staining solution (see Section 6.8 ‘Pollen stain’).
• Eye dropper.
• Beam balance.
• Pollen Count Record Sheet (see Section 6.4 ‘Pollen count record sheet’).
Method• DO NOT handle the filter paper with your
fingers, use the tweezers.
• WEIGH the filter paper. RECORD the weight in the record sheet .
• CUT a rectangular strip of paper from the filter paper.
• WEIGH the cut rectangular piece. RECORD the weight and width of the cut sample in the record sheet.
• PLACE the cut piece onto a glass slide.
• SATURATE the paper with Calberla’s stain using the eye dropper, and soak up excess stain with paper towel.
• PLACE the rectangular cover slip over entire filter paper section.
b) Identifying and counting pollen on the slide
Equipment• A microscope (monocular or binocular)
Objectives 10x, 20x Eyepiece 5x, 10x, 12.5x.
• A mechanical stage is desirable.
• A good light source (either a microscope lamp or large torch).
• Micrometer slide (1 mm divided into 0.1 mm markings) OR metric graph paper with a millimetre grid.
• Prepared slide (see previous step ‘Making the pollen slide’).
• Pollen Count Record Sheet (see 6.4)
• Pollen Identification Photographs (see 6.7).
• Pollen Calendar (see 6.6).
6.2
sectioning pollen filter paper
PAGE 80 AIRWATCH
Pollen
6.2
Method• Complete the details at the top of a Pollen Count
Record Sheet.
a sample Pollen Count record sheet Page 6.5 will assist you.
• The entire pollen count for each sample must be completed with the same magnification.
• RECORD eyepiece, objective and magnification in the record sheet.
• SET up the microscope and place the prepared slide on the microscope stage.
• SLOWLY traverse across the sample (one traverse is the area you see moving across the length of the filter sample).
• RECORD all pollen grains you observe in your Pollen Record Sheet table. Use the Pollen identification photographs or your reference slides to help you identify the pollen grains.
• TRAVERSE at least 4 times, making sure you do not count over the same area already counted.
quESTIONS1. Were you able to identify all pollen grains?
2. If not, what steps would you take to identify them?
Keep this slide for the activity 4 where you can calculate the level of pollen in pollen grains per cubic metre of air.
ACTIVITy 4: CAlCulATING POllEN lEVElSIn the last activity, you counted the number of grass, tree and weed pollen found on your pollen slide. Only the grass pollens are used to calculate the pollen level given as grass pollen count per cubic metre of air.
The following four steps can be used to calculate the pollen count of your sample:
Step 1. Calculating the diameter of one ‘field of view’You need to know the ‘field of view’ (FOV) of filter paper you are looking at every time you count pollen. The field of view is the bright circle area that you see when you look down the microscope. As the magnification increases, the field of view decreases. The measurement of field of view is
given by the diameter of the area at which you are looking.
Activity a) Check the summary table below and your record
sheet to find out what the field of view was for your slide preparation.
b) RECORD this field of view diameter in the record sheet.
table: field of view summary
If your eyepiece/objective combination is not listed you can work out the diameter (d) of the field of view using one of two methods:
c) Use a micrometer slide (1 mm divided into 0.1 mm markings) to see the diameter of the field of view. Repeat this for each magnification that you may use in the pollen count.
d) Place a small section of millimetre grid graph paper onto a slide so you can view the grid underneath the microscope. Start at your lowest magnification and estimate the diameter of the field of view. Increase the magnification and approximate how much of the 1mm grid you are able to see. Repeat this for each magnification that you may use in the pollen count.
eyepiece objective Magnification Diameter (mm)
5x 10x 50x 2.00
10x 10x 100x 1.40
12.5x 10x 125x 1.20
10x 20x 200x 0.6
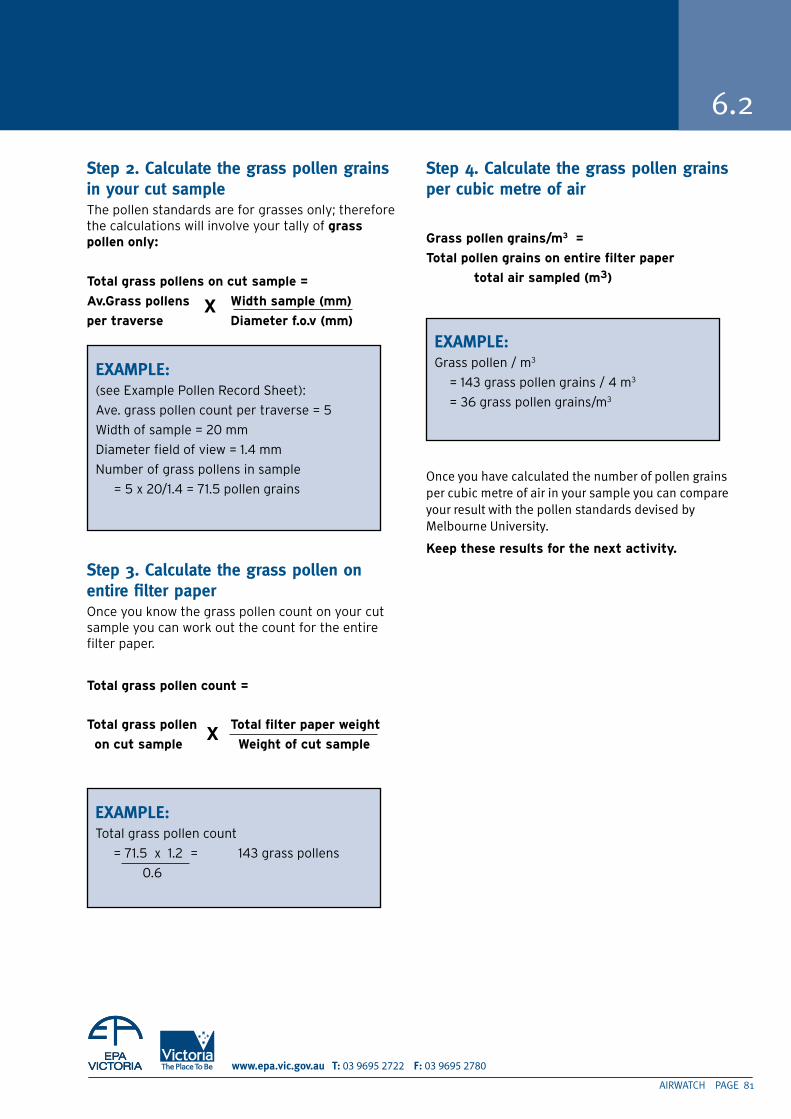
AIRWATCH PAGE 81
03 9695 2722 03 9695 2780
6.2
Step 2. Calculate the grass pollen grains in your cut sampleThe pollen standards are for grasses only; therefore the calculations will involve your tally of grass pollen only:
total grass pollens on cut sample =
av.Grass pollens width sample (mm)
per traverse Diameter f.o.v (mm)
Step 3. Calculate the grass pollen on entire filter paperOnce you know the grass pollen count on your cut sample you can work out the count for the entire filter paper.
total grass pollen count =
total grass pollen total filter paper weight
on cut sample weight of cut sample
Step 4. Calculate the grass pollen grains per cubic metre of air
Grass pollen grains/m3 =
total pollen grains on entire filter paper
total air sampled (m3)
Once you have calculated the number of pollen grains per cubic metre of air in your sample you can compare your result with the pollen standards devised by Melbourne University.
Keep these results for the next activity.
X
ExAMPlE:(see Example Pollen Record Sheet):
Ave. grass pollen count per traverse = 5
Width of sample = 20 mm
Diameter field of view = 1.4 mm
Number of grass pollens in sample
= 5 x 20/1.4 = 71.5 pollen grains
ExAMPlE:Total grass pollen count
= 71.5 x 1.2 = 143 grass pollens
0.6
X
ExAMPlE:Grass pollen / m3
= 143 grass pollen grains / 4 m3
= 36 grass pollen grains/m3
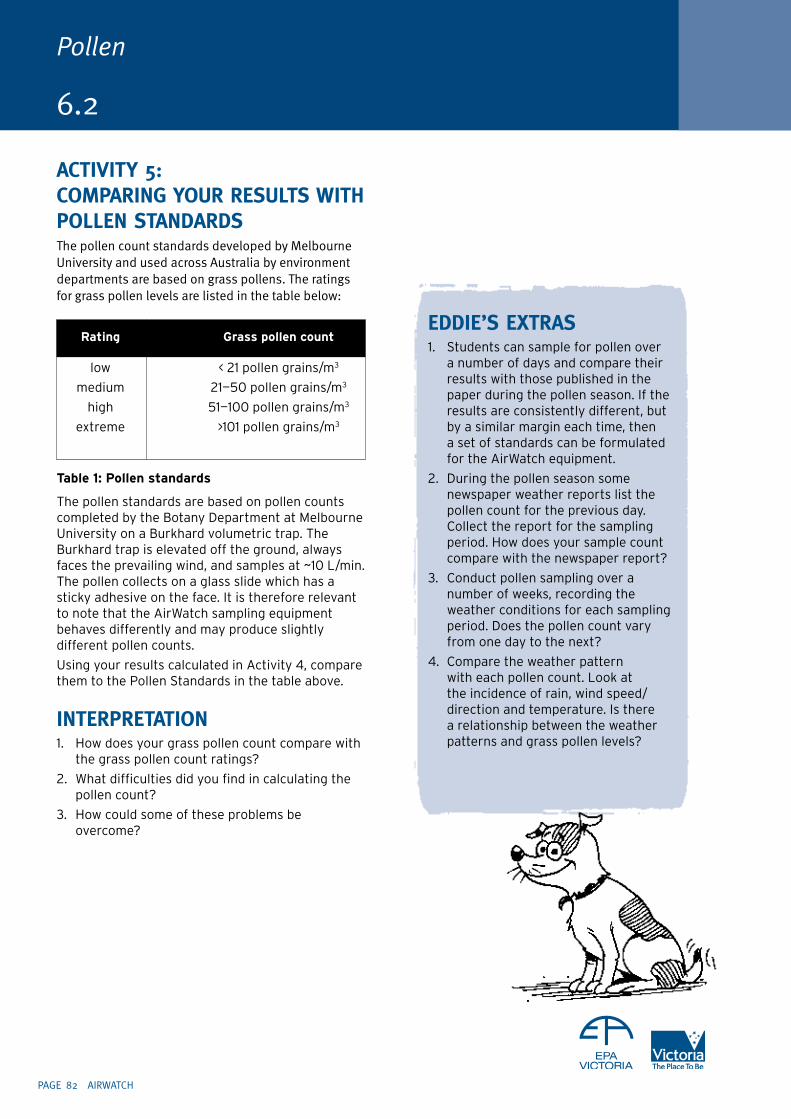
PAGE 82 AIRWATCH
Pollen
6.2
ACTIVITy 5: COMPARING yOuR RESulTS WITH POllEN STANdARdSThe pollen count standards developed by Melbourne University and used across Australia by environment departments are based on grass pollens. The ratings for grass pollen levels are listed in the table below:
table 1: Pollen standards
The pollen standards are based on pollen counts completed by the Botany Department at Melbourne University on a Burkhard volumetric trap. The Burkhard trap is elevated off the ground, always faces the prevailing wind, and samples at ~10 L/min. The pollen collects on a glass slide which has a sticky adhesive on the face. It is therefore relevant to note that the AirWatch sampling equipment behaves differently and may produce slightly different pollen counts.
Using your results calculated in Activity 4, compare them to the Pollen Standards in the table above.
INTERPRETATION1. How does your grass pollen count compare with
the grass pollen count ratings?
2. What difficulties did you find in calculating the pollen count?
3. How could some of these problems be overcome?
EddIE’S ExTRAS1. Students can sample for pollen over
a number of days and compare their results with those published in the paper during the pollen season. If the results are consistently different, but by a similar margin each time, then a set of standards can be formulated for the AirWatch equipment.
2. During the pollen season some newspaper weather reports list the pollen count for the previous day. Collect the report for the sampling period. How does your sample count compare with the newspaper report?
3. Conduct pollen sampling over a number of weeks, recording the weather conditions for each sampling period. Does the pollen count vary from one day to the next?
4. Compare the weather pattern with each pollen count. Look at the incidence of rain, wind speed/direction and temperature. Is there a relationship between the weather patterns and grass pollen levels?
rating Grass pollen count
low < 21 pollen grains/m3
medium 21—50 pollen grains/m3
high 51—100 pollen grains/m3
extreme >101 pollen grains/m3
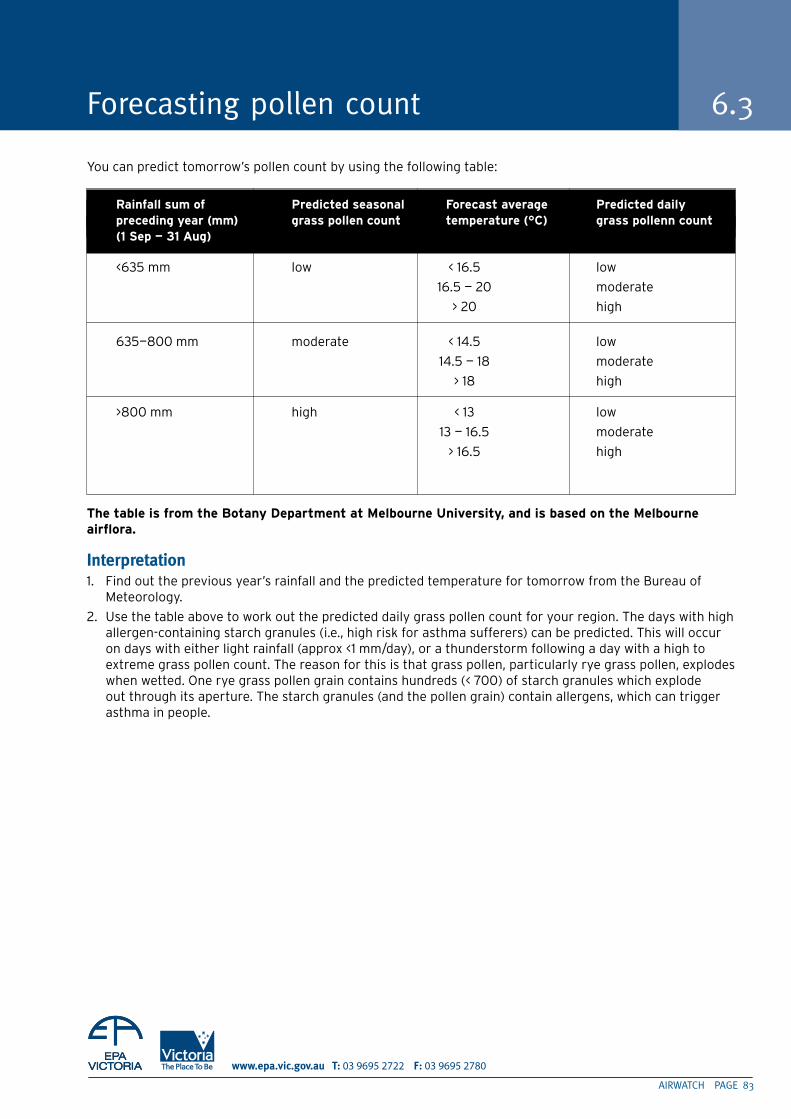
AIRWATCH PAGE 83
03 9695 2722 03 9695 2780
You can predict tomorrow’s pollen count by using the following table:
the table is from the Botany Department at Melbourne university, and is based on the Melbourne airflora.
Interpretation1. Find out the previous year’s rainfall and the predicted temperature for tomorrow from the Bureau of
Meteorology.
2. Use the table above to work out the predicted daily grass pollen count for your region. The days with high allergen-containing starch granules (i.e., high risk for asthma sufferers) can be predicted. This will occur on days with either light rainfall (approx <1 mm/day), or a thunderstorm following a day with a high to extreme grass pollen count. The reason for this is that grass pollen, particularly rye grass pollen, explodes when wetted. One rye grass pollen grain contains hundreds (< 700) of starch granules which explode out through its aperture. The starch granules (and the pollen grain) contain allergens, which can trigger asthma in people.
Forecasting pollen count 6.3
rainfall sum of Predicted seasonal forecast average Predicted daily preceding year (mm) grass pollen count temperature (°C) grass pollenn count (1 sep — 31 aug)
<635 mm low < 16.5 low
16.5 — 20 moderate
> 20 high
635—800 mm moderate < 14.5 low
14.5 — 18 moderate
> 18 high
>800 mm high < 13 low
13 — 16.5 moderate
> 16.5 high
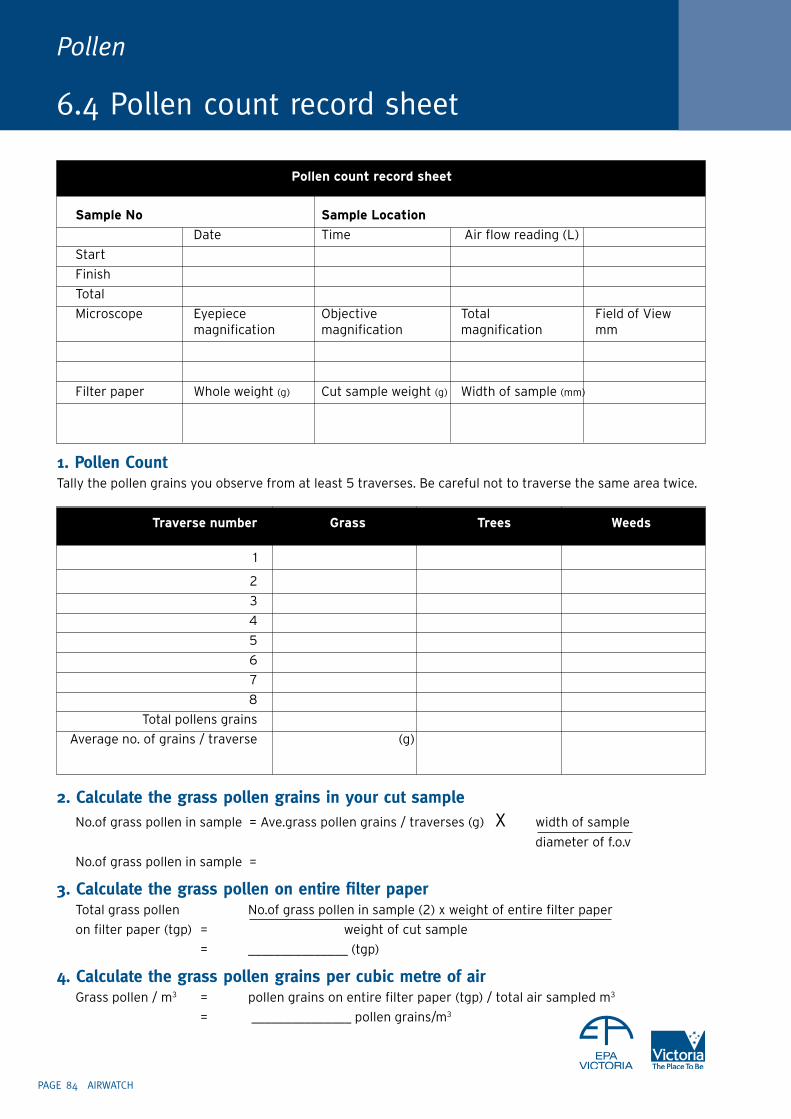
PAGE 84 AIRWATCH
Pollen
6.4 Pollen count record sheet
1. Pollen CountTally the pollen grains you observe from at least 5 traverses. Be careful not to traverse the same area twice.
2. Calculate the grass pollen grains in your cut sample No.of grass pollen in sample = Ave.grass pollen grains / traverses (g) X width of sample
diameter of f.o.v
No.of grass pollen in sample =
3. Calculate the grass pollen on entire filter paper Total grass pollen No.of grass pollen in sample (2) x weight of entire filter paper
on filter paper (tgp) = weight of cut sample
= _______________ (tgp)
4. Calculate the grass pollen grains per cubic metre of air Grass pollen / m3 = pollen grains on entire filter paper (tgp) / total air sampled m3
= _______________ pollen grains/m3
traverse number Grass trees weeds
1
2
3
4
5
6
7
8
Total pollens grains
Average no. of grains / traverse (g)
Pollen count record sheet
sample no sample location
Date Time Air flow reading (L)
Start
Finish
Total
Microscope Eyepiece Objective Total Field of View magnification magnification magnification mm
Filter paper Whole weight (g) Cut sample weight (g) Width of sample (mm)
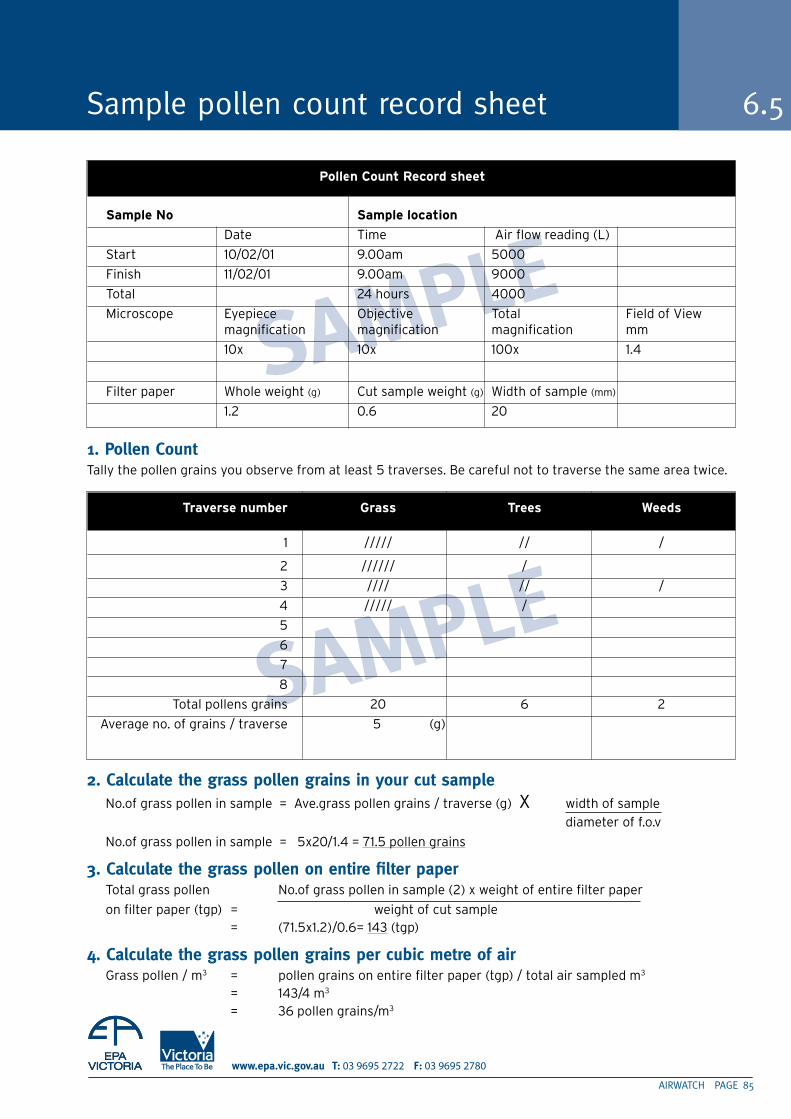
AIRWATCH PAGE 85
03 9695 2722 03 9695 2780
SAMPlE
SAMPlE
1. Pollen CountTally the pollen grains you observe from at least 5 traverses. Be careful not to traverse the same area twice.
2. Calculate the grass pollen grains in your cut sample No.of grass pollen in sample = Ave.grass pollen grains / traverse (g) X width of sample
diameter of f.o.v
No.of grass pollen in sample = 5x20/1.4 = 71.5 pollen grains
3. Calculate the grass pollen on entire filter paper Total grass pollen No.of grass pollen in sample (2) x weight of entire filter paper
on filter paper (tgp) = weight of cut sample = (71.5x1.2)/0.6= 143 (tgp)
4. Calculate the grass pollen grains per cubic metre of air Grass pollen / m3 = pollen grains on entire filter paper (tgp) / total air sampled m3
= 143/4 m3
= 36 pollen grains/m3
Sample pollen count record sheet 6.5
traverse number Grass trees weeds
1 ///// // /
2 ////// /
3 //// // /
4 ///// /
5
6
7
8
Total pollens grains 20 6 2
Average no. of grains / traverse 5 (g)
Pollen Count record sheet
sample no sample location
Date Time Air flow reading (L)
Start 10/02/01 9.00am 5000
Finish 11/02/01 9.00am 9000
Total 24 hours 4000
Microscope Eyepiece Objective Total Field of View magnification magnification magnification mm
10x 10x 100x 1.4
Filter paper Whole weight (g) Cut sample weight (g) Width of sample (mm)
1.2 0.6 20
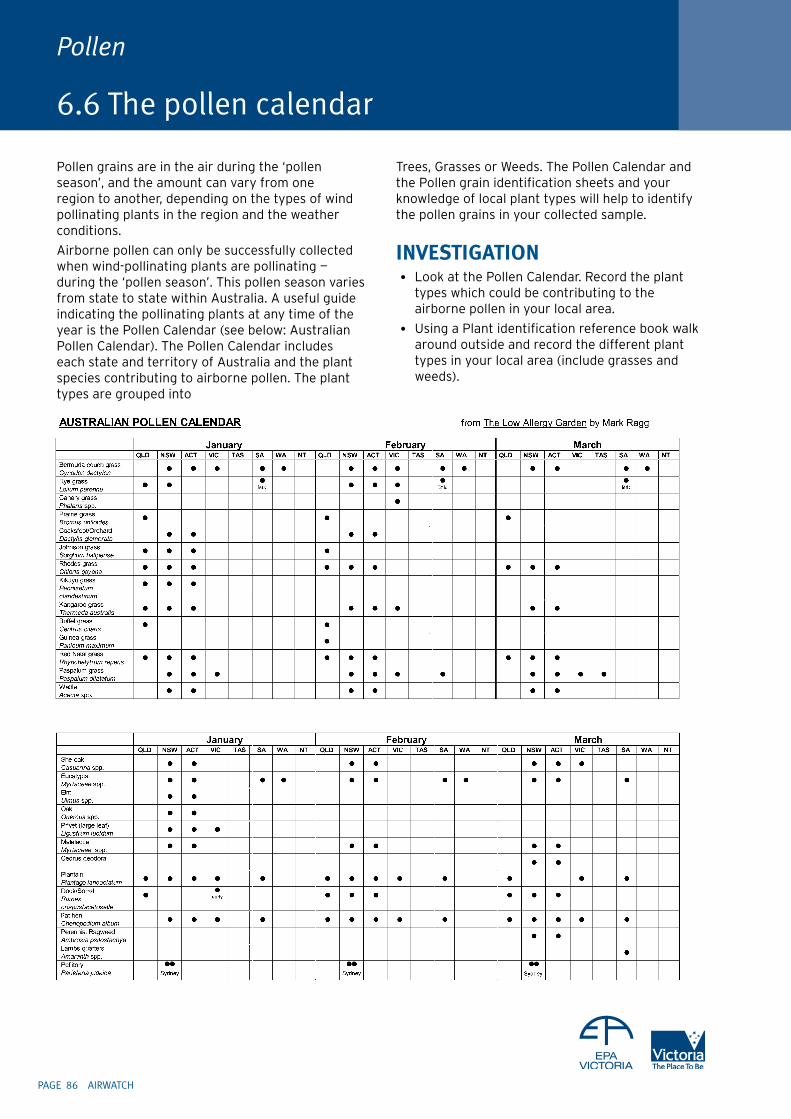
PAGE 86 AIRWATCH
Pollen
6.6 The pollen calendar
Pollen grains are in the air during the ‘pollen season’, and the amount can vary from one region to another, depending on the types of wind pollinating plants in the region and the weather conditions.
Airborne pollen can only be successfully collected when wind-pollinating plants are pollinating — during the ‘pollen season’. This pollen season varies from state to state within Australia. A useful guide indicating the pollinating plants at any time of the year is the Pollen Calendar (see below: Australian Pollen Calendar). The Pollen Calendar includes each state and territory of Australia and the plant species contributing to airborne pollen. The plant types are grouped into
Trees, Grasses or Weeds. The Pollen Calendar and the Pollen grain identification sheets and your knowledge of local plant types will help to identify the pollen grains in your collected sample.
InvestIgatIon• Look at the Pollen Calendar. Record the plant
types which could be contributing to the airborne pollen in your local area.
• Using a Plant identification reference book walk around outside and record the different plant types in your local area (include grasses and weeds).
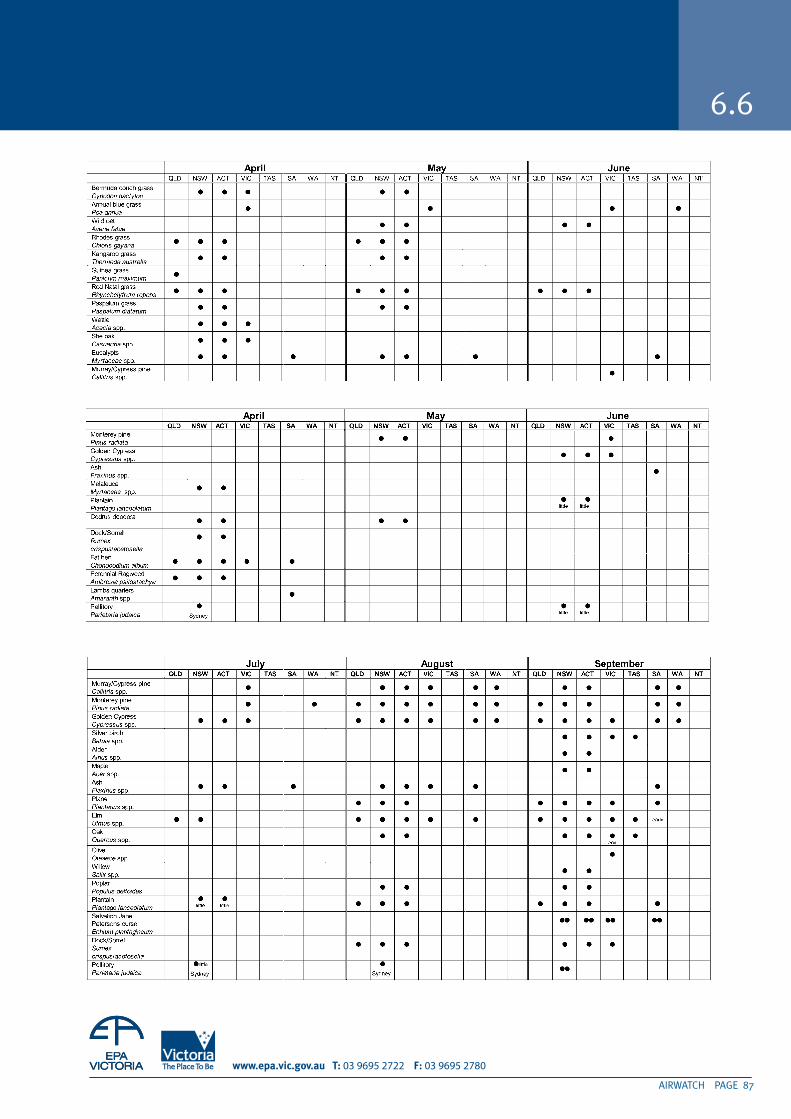
AIRWATCH PAGE 87
www.epa.vic.gov.au T: 03 9695 2722 F: 03 9695 2780
6.6
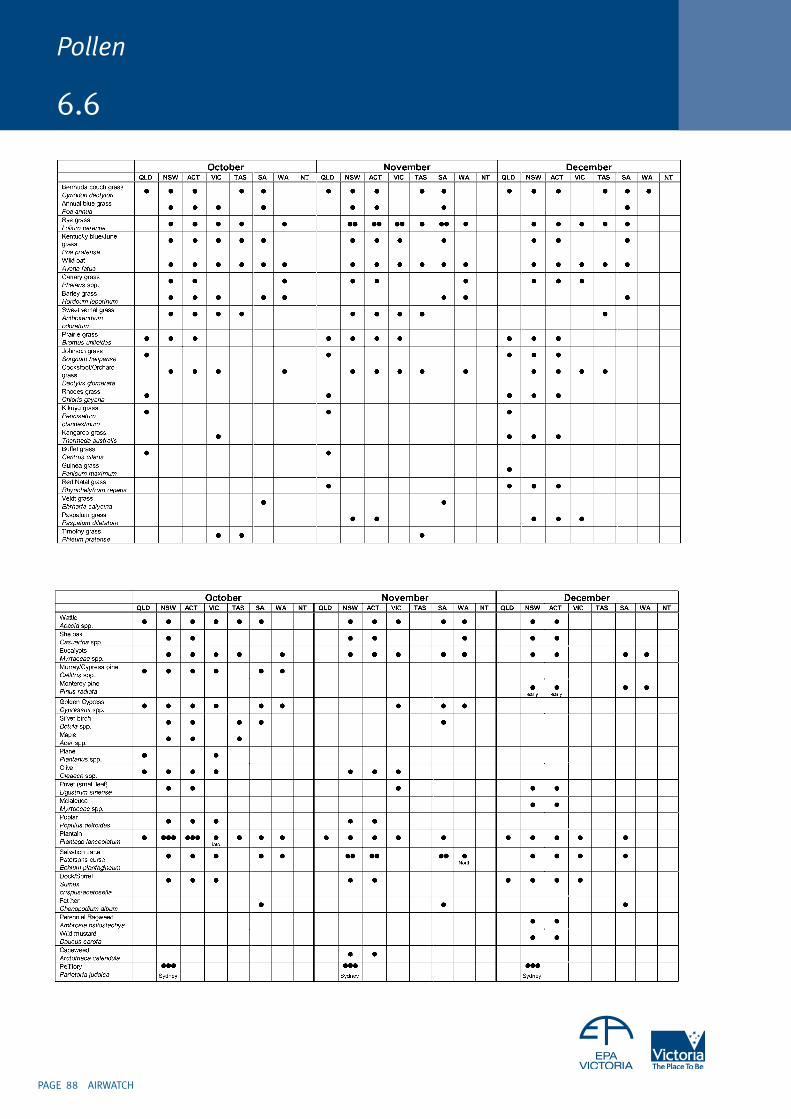
PAGE 88 AIRWATCH
Pollen
6.6

AIRWATCH PAGE 89
03 9695 2722 03 9695 2780
Pollen identification photographs 6.7
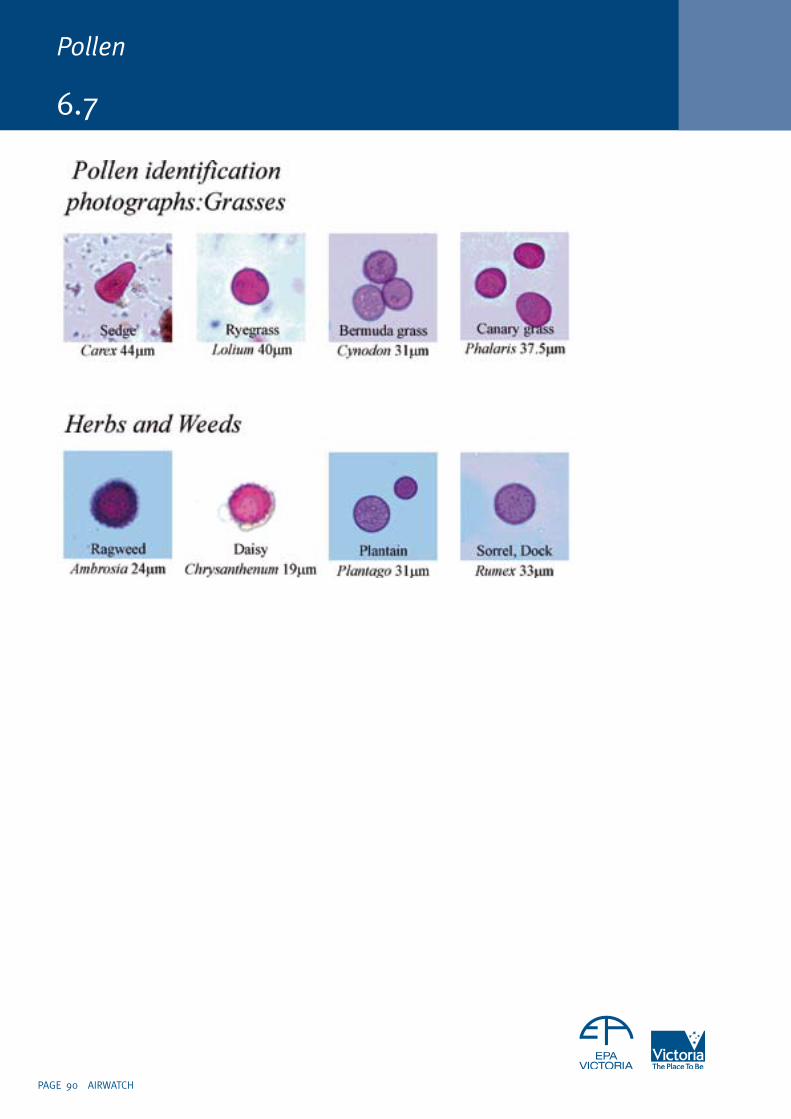
PAGE 90 AIRWATCH
Pollen
6.7
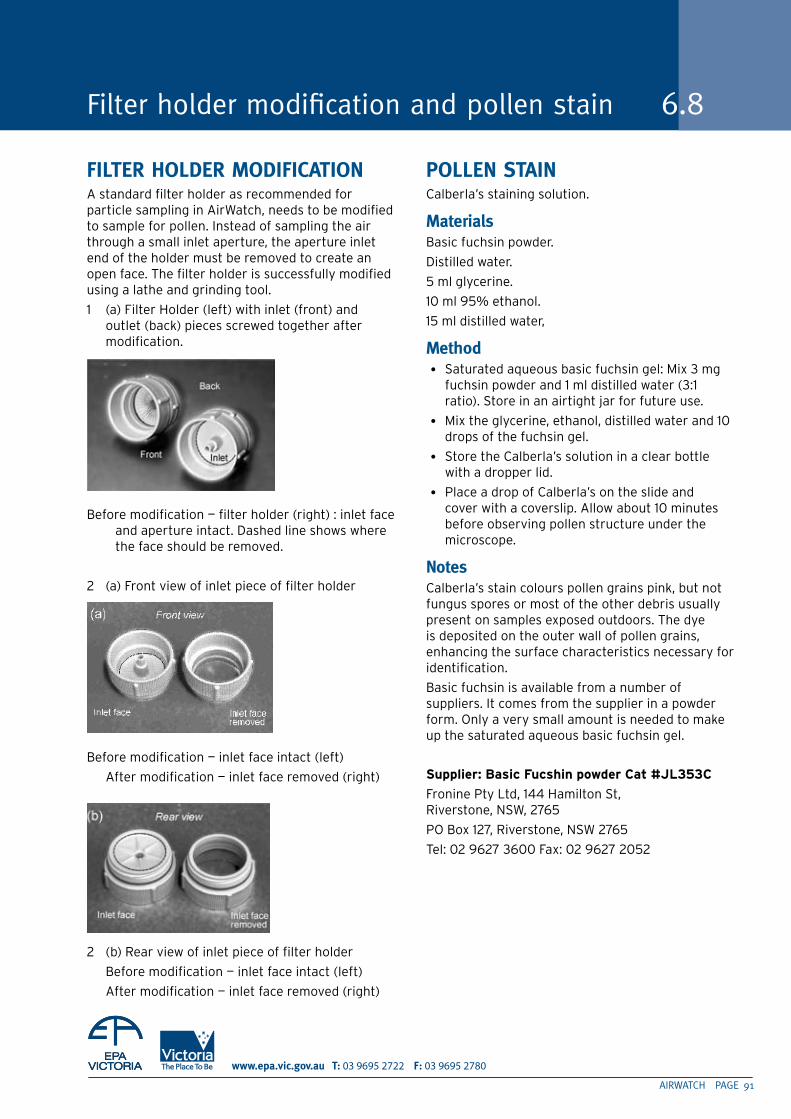
AIRWATCH PAGE 91
03 9695 2722 03 9695 2780
Filter holder modification and pollen stain 6.8
FIlTER HOldER MOdIFICATIONA standard filter holder as recommended for particle sampling in AirWatch, needs to be modified to sample for pollen. Instead of sampling the air through a small inlet aperture, the aperture inlet end of the holder must be removed to create an open face. The filter holder is successfully modified using a lathe and grinding tool.
1 (a) Filter Holder (left) with inlet (front) and outlet (back) pieces screwed together after modification.
Before modification — filter holder (right) : inlet face and aperture intact. Dashed line shows where the face should be removed.
2 (a) Front view of inlet piece of filter holder
Before modification — inlet face intact (left)
After modification — inlet face removed (right)
2 (b) Rear view of inlet piece of filter holder
Before modification — inlet face intact (left)
After modification — inlet face removed (right)
POllEN STAINCalberla’s staining solution.
MaterialsBasic fuchsin powder.
Distilled water.
5 ml glycerine.
10 ml 95% ethanol.
15 ml distilled water,
Method• Saturated aqueous basic fuchsin gel: Mix 3 mg
fuchsin powder and 1 ml distilled water (3:1 ratio). Store in an airtight jar for future use.
• Mix the glycerine, ethanol, distilled water and 10 drops of the fuchsin gel.
• Store the Calberla’s solution in a clear bottle with a dropper lid.
• Place a drop of Calberla’s on the slide and cover with a coverslip. Allow about 10 minutes before observing pollen structure under the microscope.
NotesCalberla’s stain colours pollen grains pink, but not fungus spores or most of the other debris usually present on samples exposed outdoors. The dye is deposited on the outer wall of pollen grains, enhancing the surface characteristics necessary for identification.
Basic fuchsin is available from a number of suppliers. It comes from the supplier in a powder form. Only a very small amount is needed to make up the saturated aqueous basic fuchsin gel.
supplier: Basic fucshin powder Cat #Jl353C
Fronine Pty Ltd, 144 Hamilton St, Riverstone, NSW, 2765
PO Box 127, Riverstone, NSW 2765
Tel: 02 9627 3600 Fax: 02 9627 2052

PAGE 92 AIRWATCH
Pollen
6.9 Resources and reading material
RESOuRCESThe Asthma Foundation in your capital city.
Free information pamphlets are available from each state/territory office about asthma, hayfever and allergies relating to the pollen season.
REAdING MATERIAl• Australian pollen calendar in Chapter 6 from The
low allergy garden by Mark Ragg. Published in Australia and New Zealand by Hodder Headline Australia Pty Limited. ISBN 0 7336 0265 7. Available from bookstores.
An informative discussion on allergies, asthma, pollen, and plant types appropriate for a low allergenic garden. A comprehensive calendar in chapter 6 lists the pollen producing plant types, month by month, for each state and territory in Australia and New Zealand. (The Pollen Calendar in this unit is taken from this book.)
• ‘Seasonal distribution of pollen in the atmosphere of Melbourne: an airborne pollen calendar’ by Eng Kok Ong, Mohan Bir Singh, Robert Bruce Knox, School of Botany, University of Melbourne, Parkville, Victoria 3052, Australia. in Aerobiologia 11 (1995) p 51—55.
• ‘The low-allergen garden’ by Diana J Bass. in Modern Medicine of Australia, September, 1995.
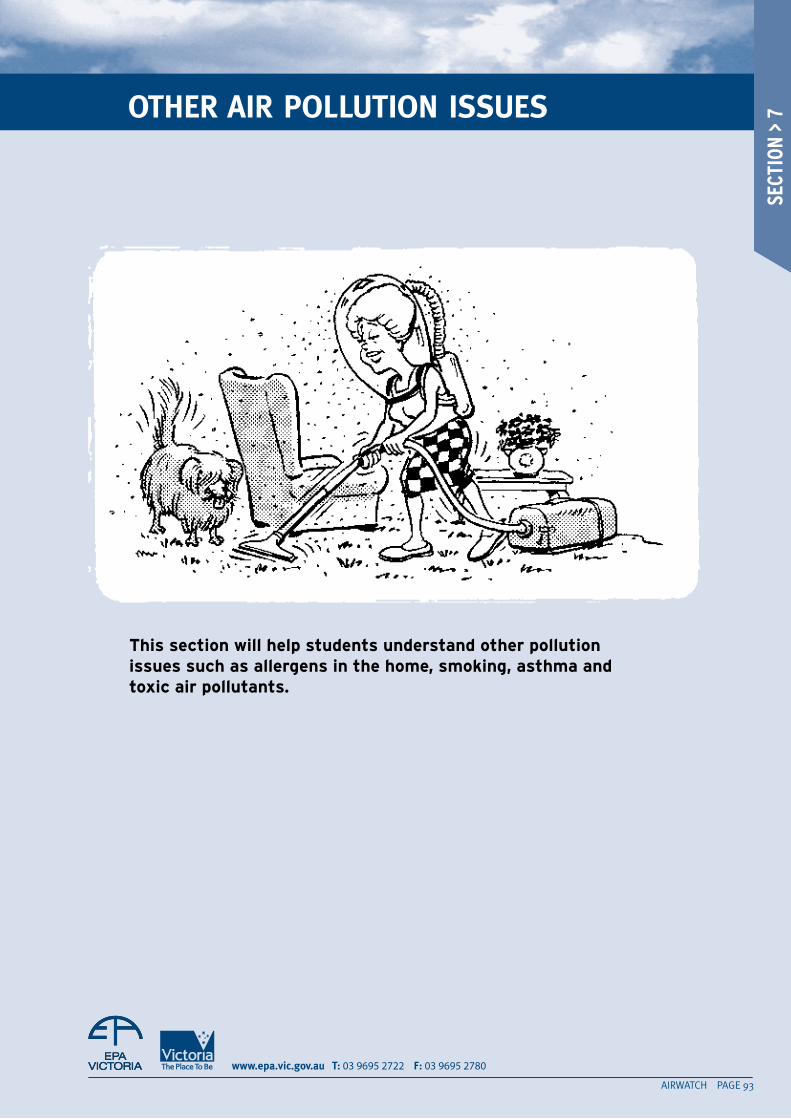
03 9695 2722 03 9695 2780
OTHER AIR POlluTION ISSuES
this section will help students understand other pollution issues such as allergens in the home, smoking, asthma and toxic air pollutants.
AIRWATCH PAGE 93
SECT
ION
> 7
PAGE 94 AIRWATCH
Other air pollution issues
7.1 Sulfur dioxide
ACId GASES — SulFuR dIOxIdEGases such as sulfur dioxide and nitrogen oxides affect our health when they are present in the air and also cause serious environmental concern because they cause ‘acid deposition’. These pollutants interact with sunlight and water vapour in the atmosphere to form acidic chemicals.
An equation shows how the acids are formed
note: these are not balanced equations.
When these fall to the ground in rain they are known as ‘wet deposition’ or ‘acid rain’, as dry particles they are known as ‘dry deposition’.
There is great concern about sources that produce acid-forming emissions as they can be blown by prevailing winds to neighbouring regions or countries. Depending on where they land, these acids can kill surface vegetation and enter surface and groundwater systems, affecting other plants and animals.
THE PH SCAlEAcidity is measured in pH units that go from 0 to 14, where 7 is neutral. Less than 7 is acidic and greater than 7 is alkaline. Because the pH scale is a logarithmic scale a change of one unit in pH means a tenfold change in acidity.
The normal pH of rainwater is between 5 and 6; anything below that is considered acid rain.
The following activities will show how sulfur dioxide emissions can cause acid rain and the effect it can have on vegetation.
EquIPMENT (PER GROuP)• Various liquids (lemon juice, ammonia, distilled
water, tap water, milk).
• Litmus paper.
• Paper cups.
• Beakers.
• pH indicator strips.
• Safety glasses.
• Distilled water.
TEST 11. Put a small amount of each test liquid in
individual pap er cups and label each cup.
2. Test with the litmus paper. Red means it is an acid, blue if it is an alkaline and no change if it is neutral.
3. Record the results on the table below.
questionWhich liquids were:
i) acid?
ii) alkaline?
iii) neutral?
SO2 + H2O —> H2SO4 (sulfuric acid)
NO2 + H2O ——> HNO3 + HNO2 (nitric acid) (nitrous acid)
litmus test result acid/base
Distilled water Tap water Ammonia Milk Lemon juice
AIRWATCH PAGE 95
03 9695 2722 03 9695 2780
7.1
TEST 2Equipment (per group)• Sulfur.
• Deflagrating spoon.
• Gas jar.
• Universal indicator or pH papers.
Method1. Put a small amount of distilled water into a gas
jar and add a few drops of Universal Indicator.
2. Burn a small amount of sulfur on a deflagrating spoon in the gas jar.
3. Fill in the table below (remember one pH unit corresponds to a tenfold change in acidity).
Interpretation1. What was the change in acidity of the water
when the SO2 was added?
2. What effect do you think the resultant water solution would have if you used it for watering your plants?
pH of distilled H2O pH value of distilled Change in value Total change in H2O and SO2 acidity
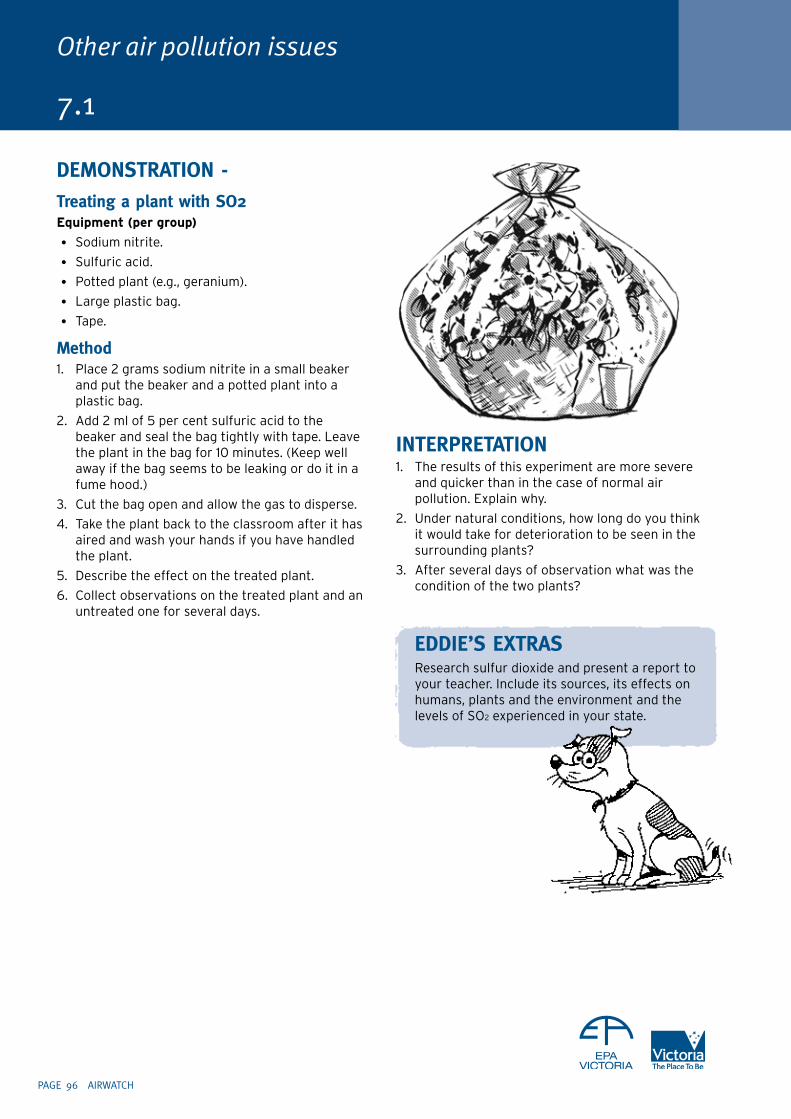
PAGE 96 AIRWATCH
Other air pollution issues
7.1
dEMONSTRATION - Treating a plant with SO2equipment (per group)
• Sodium nitrite.
• Sulfuric acid.
• Potted plant (e.g., geranium).
• Large plastic bag.
• Tape.
Method1. Place 2 grams sodium nitrite in a small beaker
and put the beaker and a potted plant into a plastic bag.
2. Add 2 ml of 5 per cent sulfuric acid to the beaker and seal the bag tightly with tape. Leave the plant in the bag for 10 minutes. (Keep well away if the bag seems to be leaking or do it in a fume hood.)
3. Cut the bag open and allow the gas to disperse.
4. Take the plant back to the classroom after it has aired and wash your hands if you have handled the plant.
5. Describe the effect on the treated plant.
6. Collect observations on the treated plant and an untreated one for several days.
INTERPRETATION1. The results of this experiment are more severe
and quicker than in the case of normal air pollution. Explain why.
2. Under natural conditions, how long do you think it would take for deterioration to be seen in the surrounding plants?
3. After several days of observation what was the condition of the two plants?
EddIE’S ExTRAS Research sulfur dioxide and present a report to
your teacher. Include its sources, its effects on humans, plants and the environment and the levels of SO2 experienced in your state.
AIRWATCH PAGE 9�
03 9695 2722 03 9695 2780
SuRVEy:How healthy is your home?You will be able to survey your home or other buildings to see if they are likely candidates for indoor air pollution. This will be done in three sections as described below.
SECTION 1: HOuSE dESIGN ANd VENTIlATIONOver the past couple of decades changes in the way we have built our homes have meant there has been a decrease in the natural ventilation of houses.
Natural ventilation is the extent to which outdoor air gets into the house when windows and doors are shut. Increasingly, we are keeping our houses closed up during most times of the year and regulating the indoor climate through the use of heating and air conditioning.
These building design changes and ventilation practices can create problems for the quality of the air we breathe in our homes. A reduced exchange of air between outdoors and indoors can cause an accumulation of air contaminants inside the house. Some of these contaminants will have an adverse affect on our health.
In the first section you will score your home on a number of house design characteristics as well as on how often, on average during the different seasons, you open windows and doors. The score at the end will give you an idea of whether there is a high or low possibility of a build up of contaminants in your home. Of course, this is also dependent on the presence of contaminant sources inside the home and this will be determined in subsequent sections.
SECTION 2: INdOOR AllERGENS Several allergens and micro-organisms have been identified inside the home. Exposure to these has important implications for the development of allergies such as asthma, eczema (skin rash) and hayfever. These allergens include house dust mite, fungi, moulds, animal fur and their by-products.
There are many things inside our homes which will act as reservoirs for these allergens. For example carpets, soft furnishings, beds and quilts contain large numbers of house dust mites, damp areas of the home will allow mould and fungi to grow, and animal fur is dependent on the presence of pets, particularly pets that live indoors.
SECTION 3: INdOOR POlluTANTSIn this section, questions will be asked about various known sources of indoor pollutants.
The pollutants include nitrogen dioxide (NO2), volatile organic compounds (VOCs), tobacco smoke (ETS) and car exhausts. All of these can reach higher levels indoors than outdoors depending on the use of products that emit them and the ventilation of the home. They can contribute to several health problems either through short or long term exposures.
The questionnaire will investigate:
1. nitrogen dioxide
2. tobacco smoke
3. automobile exhaust
4. pesticides
5. volatile organic compounds.
1. Nitrogen dioxideWherever a high heat source, such as an open flame, comes into contact with nitrogen in the atmosphere, nitrogen dioxide will be produced. In the home, the major sources of NO2 are gas cookers, gas or kerosene heaters and open fireplaces. Cigarette smoke and automobile exhausts will also increase levels of NO2.
Nitrogen dioxide is an irritant to the skin and mucous membranes of the eye, nose and throat when exposed to high levels. The major controversy surrounding NO2 is its contribution to the development or exacerbation of asthma. Studies have found a link between the use of gas cookers and heaters in the home and the prevalence of asthma in the occupants. This link, however, has not been confirmed. It is important when using gas or kerosene appliances that there is a flue or a chimney attached, or at least good ventilation in the direct vicinity, so that the NO2 gas will escape outdoors.
Indoor pollution 7.2
PAGE 98 AIRWATCH
7.2
2. Tobacco smokeThe health risks of active smoking are well documented (respiratory disease, heart disease, lung and other cancers). It is also well known that passive smoking is a substantial health risk. There are more than 3800 chemicals found in cigarette smoke including 40 known or suspected human carcinogens. The only source of tobacco smoke inside is, obviously, from smoking indoors. Exposure to passive smoking in the home increases the risk of respiratory diseases, such as asthma, in children.
3. Automobile exhaustAutomobile exhaust, like tobacco smoke, is a cocktail of hundreds of chemicals and has been associated with respiratory disorders, cancers, neuro-biological diseases and child development problems. Indoor air levels of exhaust fumes will be affected by the proximity of the home to a major or busy road.
Also, many houses are today built with a garage that is attached to the home and has a door leading directly into the home. Cars may also be parked in an open driveway but directly beneath a bedroom window. Both an attached garage and parking near a window will provide direct access for exhaust fumes to enter the home, particularly when the car is started or is idling as the engine warms up.
4. PesticidesThere are many different types of pesticides. They are nearly all human-made and have been used extensively in agriculture, horticulture, by local councils and in the home. Fortunately one type of pesticide, the organochlorines, has been banned in Australia due to known environmental contamination and suspected health concerns.
There are many pesticides used in and around the home and the more they are used the more chance of exposure. Health effects can range from headaches, nausea and fatigue to, in some cases, suspected carcinogenicity (causing cancer) depending on the type of chemical used. Acute poisoning may also occur if pesticides are ingested or large amounts are inhaled. Some pesticides can be effective without too many risks if used wisely, however, there are many alternatives to controlling weed and insect problems without the need for chemicals.
These alternatives include using natural repellents (eg. eucalyptus oil, tea tree oil, citronella), sticky traps for cockroaches, physical control (eg. squashing unwelcome insects, removing weeds by hand), encouraging natural insect predators (eg. predator insects such as ladybirds and dragonflies and birds), and making sure that a proper inspection is done before allowing pesticide companies to spray the house, sometimes unnecessarily.
5. Volatile organic compoundsNew building materials, paints, insulation, furniture and carpets emit high levels of chemicals collectively known as volatile organic compounds (VOCs). In fact up to 70% of the building materials we use in and around the home contain one or more VOCs. Other sources of VOCs in the home include household cleaners, hairsprays, nail polish, perfumes, deodorants, hair dyes, soaps and correction fluid. From this list you can gain an understanding of how widespread these chemicals are.
Many of the smells you get from these products and those that arise from new carpet, paint or floor polish are caused by VOCs. There are more than 900 separate compounds that have been identified in the indoor air. Generally the levels of emissions from new building materials will decrease with time and this will also depend on the adequacy of ventilation. VOC levels from other sources depend upon how often they are used. New cars also emit high levels of VOC (upholstery, carpet, evaporative emissions)
Not all VOCs are dangerous and levels that have been recorded in homes are generally below that which will adversely affect your health. However, the health effects that can occur with either high levels of exposure or being exposed for a long period vary from skin, eye, nose and throat irritation to nervous system problems (headaches, fatigue, increased chemical sensitivity) and cancer, depending on the chemical.
Other air pollution issues

AIRWATCH PAGE 99
03 9695 2722 03 9695 2780
7.2
SuMMARyAs you can see there are wide and varied sources of indoor air pollutants in our homes. Increasingly we are spending more of our time indoors and, therefore, potentially being exposed to a great number of chemicals. Some estimates have put the time we spend indoors at 90 per cent. This may even be higher in some of the more susceptible groups such as the very young, the elderly and sick people.
There has definitely been an increase in allergic diseases such as asthma, hayfever and eczema, and a recognition of non-specific disorders such as sick building syndrome, multiple chemical sensitivity and chronic fatigue syndrome. All this suggests that increased indoor exposures to a large number of pollutants is having a health cost for the community as a whole.
Research so far has found it very hard to make a direct link between certain chemicals and disease outcomes due to the diversity of exposure sources and difficulty in measuring direct personal exposure levels. However, there is enough evidence to suggest poor indoor air quality can affect our health.
The two important messages from this exercise are:
ACTIVITyComplete the survey for your home, classroom or other buildings of interest.
1. Be aware of the amount and type of chemicals you use in the home (this includes cleaning and cosmetic products as well as paints and building materials), and
2. Make sure your house is adequately ventilated to reduce the chance of pollution build up inside.
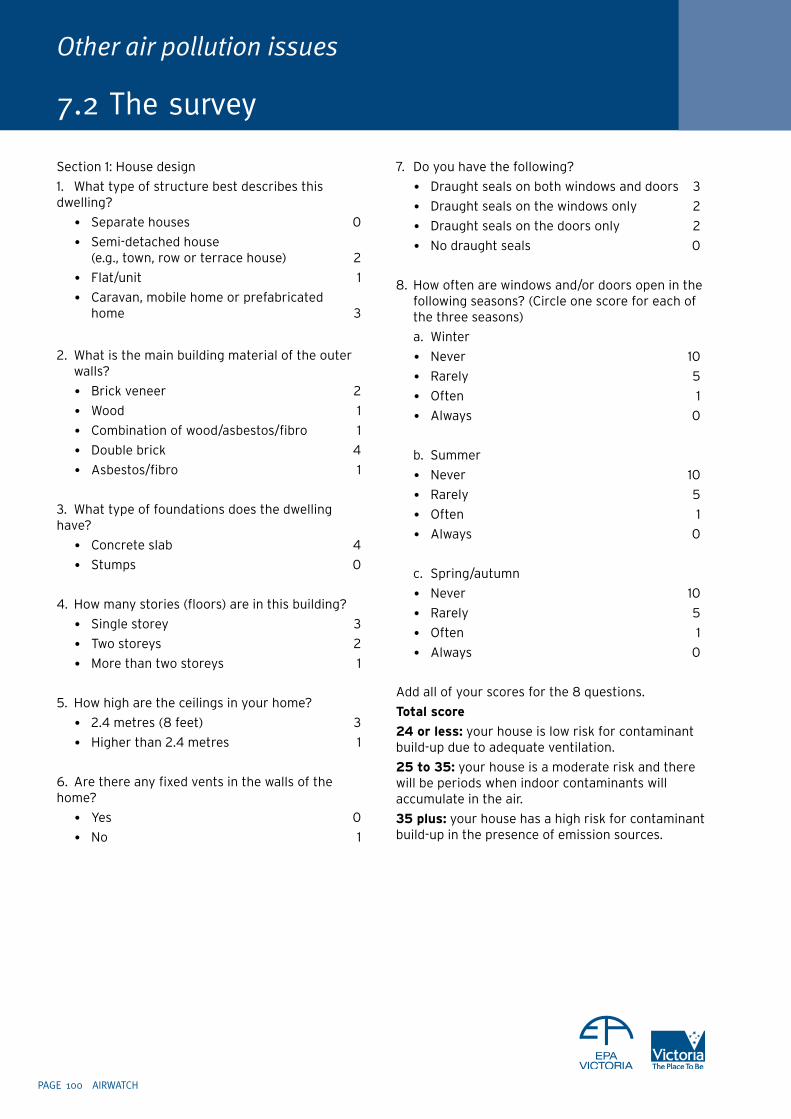
PAGE 100 AIRWATCH
Other air pollution issues
7.2 The survey
Section 1: House design
1. What type of structure best describes this dwelling?
• Separate houses 0
• Semi-detached house (e.g., town, row or terrace house) 2
• Flat/unit 1
• Caravan, mobile home or prefabricated home 3
2. What is the main building material of the outer walls?
• Brick veneer 2
• Wood 1
• Combination of wood/asbestos/fibro 1
• Double brick 4
• Asbestos/fibro 1
3. What type of foundations does the dwelling have?
• Concrete slab 4
• Stumps 0
4. How many stories (floors) are in this building?
• Single storey 3
• Two storeys 2
• More than two storeys 1
5. How high are the ceilings in your home?
• 2.4 metres (8 feet) 3
• Higher than 2.4 metres 1
6. Are there any fixed vents in the walls of the home?
• Yes 0
• No 1
7. Do you have the following?
• Draught seals on both windows and doors 3
• Draught seals on the windows only 2
• Draught seals on the doors only 2
• No draught seals 0
8. How often are windows and/or doors open in the following seasons? (Circle one score for each of the three seasons)
a. Winter
• Never 10
• Rarely 5
• Often 1
• Always 0
b. Summer
• Never 10
• Rarely 5
• Often 1
• Always 0
c. Spring/autumn
• Never 10
• Rarely 5
• Often 1
• Always 0
Add all of your scores for the 8 questions.
total score
24 or less: your house is low risk for contaminant build-up due to adequate ventilation.
25 to 35: your house is a moderate risk and there will be periods when indoor contaminants will accumulate in the air.
35 plus: your house has a high risk for contaminant build-up in the presence of emission sources.

AIRWATCH PAGE 101
03 9695 2722 03 9695 2780
7.2
SECTION 2: AllERGENSNote: the presence of allergens inside the house is mostly not a reflection of home cleanliness and can occur in very clean homes.
9. What is the main type of floor covering in your living rooms?
• Carpet covering 25% or more of the floor space 8
• Carpet covering less than 25% of the floor space 4
• Hard floor (eg. wood, tiles, slate) with rugs 1
• Hard floor (eg. wood, tiles, slate,linoleum) 0
10. Do you have any damp spots on the floor, walls or ceiling in any room?
• Yes 4
• No 0
11. Are there any visible signs of mould in any room?
• Yes 4
• No 0
12. Do you frequently get condensation on the inside of any windows?
• Yes 4
• No 0
13. Do you have any of the following pets?
• Cats 8
• Dogs 4
• Mice, rabbits,hamsters or guinea pigs 3
• Birds 1
• No pets 0
total score
10 or less: you are probably not exposed to many indoor allergens.
11 to 19: you will have moderate allergen exposure.
20 plus: you may be exposed to a high level of indoor allergens.
SECTION 3: POlluTANTSNitrogen dioxide
14. What type of fuel do you use for cooking (circle the most commonly used fuel)?
• Electric 0
• Gas — vented (with flue or chimney) 1
• Gas — unvented (no flue or chimney connected) 3
• Wood 1
15. What is the main source of fuel used to heat the home?
• Electric 0
• Gas — vented (with flue or chimney) 2
• Gas — unvented (no flue or chimney connected) 4
• Kerosene — vented (with flue or chimney) 2
• Kerosene — unvented (no flue or chimney connected) 4
• Wood — open fireplace 2
• Wood — closed 0
Tobacco smoke
16. On average, how many cigarettes per day are smoked indoors? (from all sources)
• None 0
• 1—5 2
• 6—10 6
• 11—15 10
• 16—20 12
• More than 20 15
Vehicle exhaust
17. How far is your home from any major or busy roads?
• Less than 20 metres (i.e., live on one) 8
• Between 20 and 100 metres 5
• Between 100 and 500 metres 3
• More than 500 metres 1
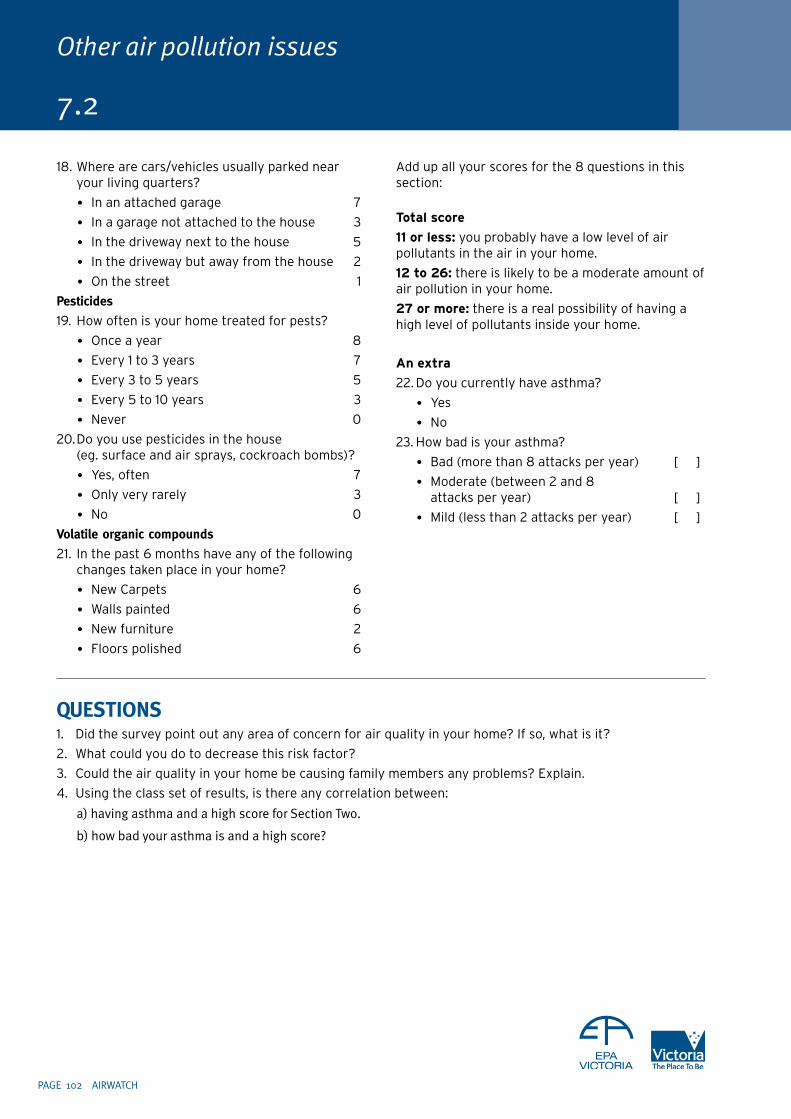
PAGE 102 AIRWATCH
18. Where are cars/vehicles usually parked near your living quarters?
• In an attached garage 7
• In a garage not attached to the house 3
• In the driveway next to the house 5
• In the driveway but away from the house 2
• On the street 1
Pesticides
19. How often is your home treated for pests?
• Once a year 8
• Every 1 to 3 years 7
• Every 3 to 5 years 5
• Every 5 to 10 years 3
• Never 0
20. Do you use pesticides in the house (eg. surface and air sprays, cockroach bombs)?
• Yes, often 7
• Only very rarely 3
• No 0
Volatile organic compounds
21. In the past 6 months have any of the following changes taken place in your home?
• New Carpets 6
• Walls painted 6
• New furniture 2
• Floors polished 6
Add up all your scores for the 8 questions in this section:
total score
11 or less: you probably have a low level of air pollutants in the air in your home.
12 to 26: there is likely to be a moderate amount of air pollution in your home.
27 or more: there is a real possibility of having a high level of pollutants inside your home.
an extra
22. Do you currently have asthma?
• Yes
• No
23. How bad is your asthma?
• Bad (more than 8 attacks per year) [ ]
• Moderate (between 2 and 8 attacks per year) [ ]
• Mild (less than 2 attacks per year) [ ]
Other air pollution issues
7.2
quESTIONS1. Did the survey point out any area of concern for air quality in your home? If so, what is it?
2. What could you do to decrease this risk factor?
3. Could the air quality in your home be causing family members any problems? Explain.
4. Using the class set of results, is there any correlation between:
a) having asthma and a high score for Section Two.
b) how bad your asthma is and a high score?
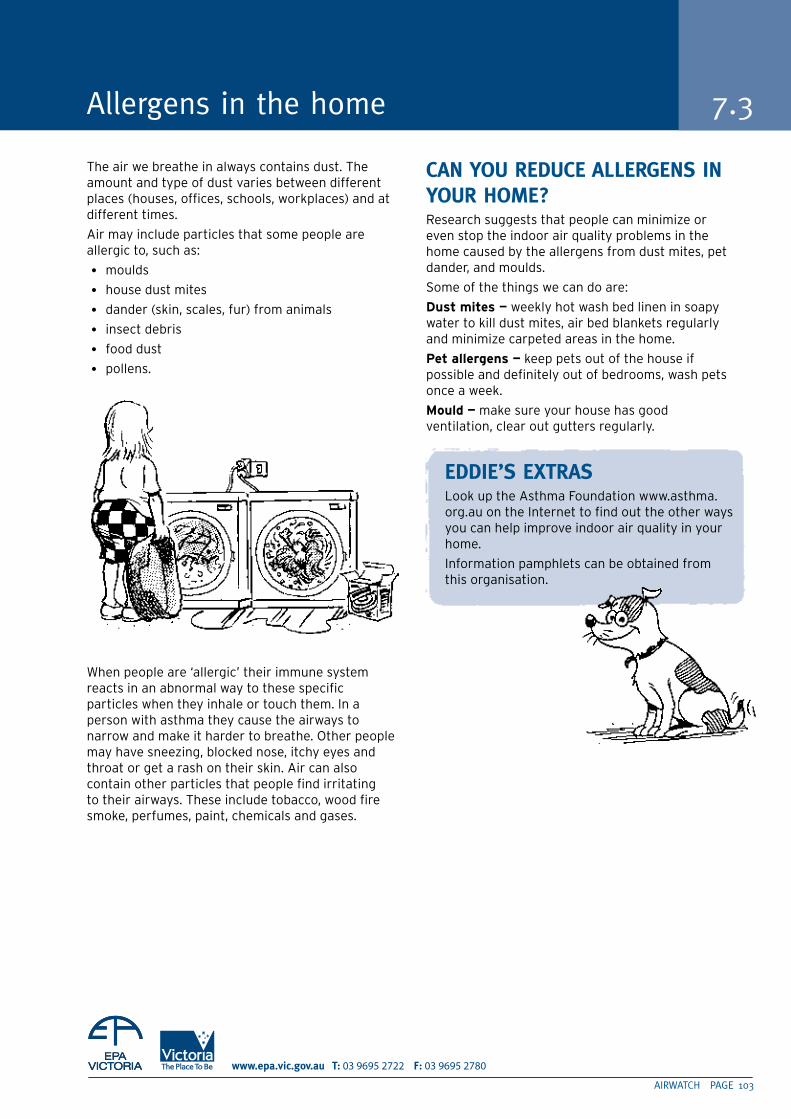
AIRWATCH PAGE 103
03 9695 2722 03 9695 2780
The air we breathe in always contains dust. The amount and type of dust varies between different places (houses, offices, schools, workplaces) and at different times.
Air may include particles that some people are allergic to, such as:
• moulds
• house dust mites
• dander (skin, scales, fur) from animals
• insect debris
• food dust
• pollens.
When people are ‘allergic’ their immune system reacts in an abnormal way to these specific particles when they inhale or touch them. In a person with asthma they cause the airways to narrow and make it harder to breathe. Other people may have sneezing, blocked nose, itchy eyes and throat or get a rash on their skin. Air can also contain other particles that people find irritating to their airways. These include tobacco, wood fire smoke, perfumes, paint, chemicals and gases.
CAN yOu REduCE AllERGENS IN yOuR HOME?Research suggests that people can minimize or even stop the indoor air quality problems in the home caused by the allergens from dust mites, pet dander, and moulds.
Some of the things we can do are:
Dust mites — weekly hot wash bed linen in soapy water to kill dust mites, air bed blankets regularly and minimize carpeted areas in the home.
Pet allergens — keep pets out of the house if possible and definitely out of bedrooms, wash pets once a week.
Mould — make sure your house has good ventilation, clear out gutters regularly.
EddIE’S ExTRAS Look up the Asthma Foundation www.asthma.
org.au on the Internet to find out the other ways you can help improve indoor air quality in your home.
Information pamphlets can be obtained from this organisation.
Allergens in the home 7.3
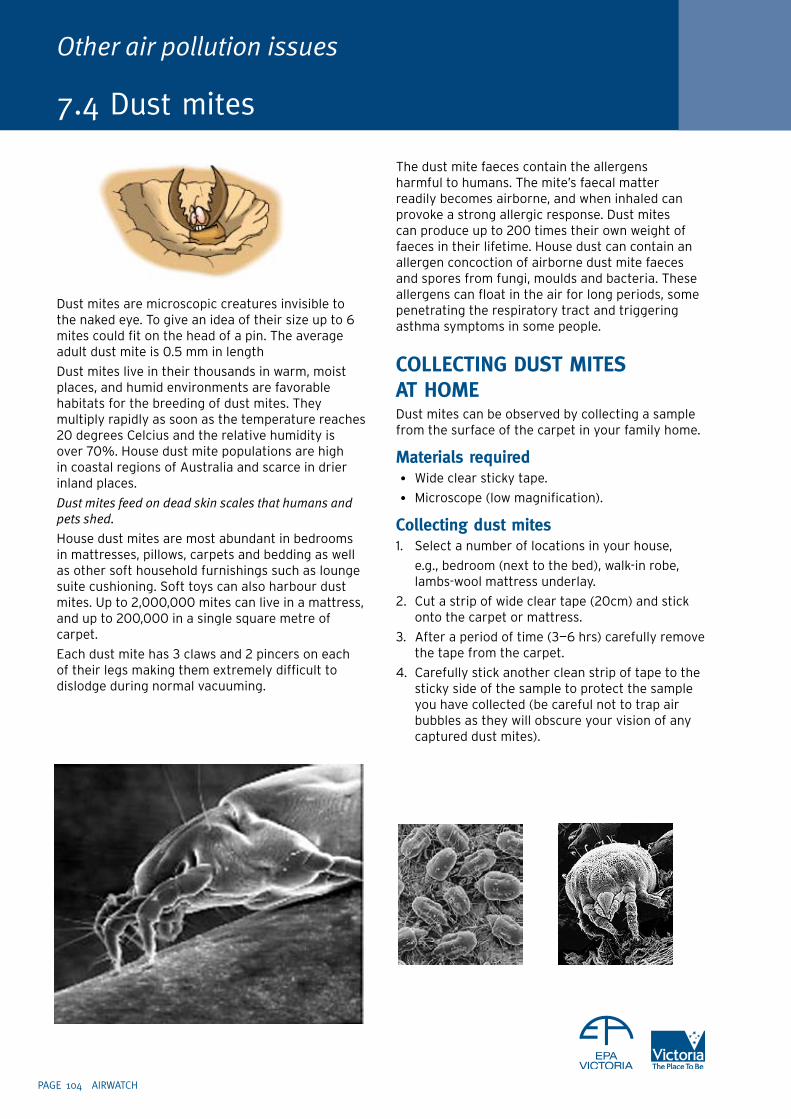
PAGE 104 AIRWATCH
Other air pollution issues
7.4 Dust mites
Dust mites are microscopic creatures invisible to the naked eye. To give an idea of their size up to 6 mites could fit on the head of a pin. The average adult dust mite is 0.5 mm in length
Dust mites live in their thousands in warm, moist places, and humid environments are favorable habitats for the breeding of dust mites. They multiply rapidly as soon as the temperature reaches 20 degrees Celcius and the relative humidity is over 70%. House dust mite populations are high in coastal regions of Australia and scarce in drier inland places.
Dust mites feed on dead skin scales that humans and pets shed.
House dust mites are most abundant in bedrooms in mattresses, pillows, carpets and bedding as well as other soft household furnishings such as lounge suite cushioning. Soft toys can also harbour dust mites. Up to 2,000,000 mites can live in a mattress, and up to 200,000 in a single square metre of carpet.
Each dust mite has 3 claws and 2 pincers on each of their legs making them extremely difficult to dislodge during normal vacuuming.
The dust mite faeces contain the allergens harmful to humans. The mite’s faecal matter readily becomes airborne, and when inhaled can provoke a strong allergic response. Dust mites can produce up to 200 times their own weight of faeces in their lifetime. House dust can contain an allergen concoction of airborne dust mite faeces and spores from fungi, moulds and bacteria. These allergens can float in the air for long periods, some penetrating the respiratory tract and triggering asthma symptoms in some people.
COllECTING duST MITES AT HOMEDust mites can be observed by collecting a sample from the surface of the carpet in your family home.
Materials required• Wide clear sticky tape.
• Microscope (low magnification).
Collecting dust mites1. Select a number of locations in your house,
e.g., bedroom (next to the bed), walk-in robe, lambs-wool mattress underlay.
2. Cut a strip of wide clear tape (20cm) and stick onto the carpet or mattress.
3. After a period of time (3—6 hrs) carefully remove the tape from the carpet.
4. Carefully stick another clean strip of tape to the sticky side of the sample to protect the sample you have collected (be careful not to trap air bubbles as they will obscure your vision of any captured dust mites).

AIRWATCH PAGE 105
03 9695 2722 03 9695 2780
7.4
5. Set up a low powered binocular or monocular microscope to observe dust mite bodies and count populations in your sample. Dust mites are between 0.2 — 0.5 mm in size, therefore a low magnification will enable you to see complete dust mite bodies. Follow the eyepiece/objective specifications in the table to optimize your field of view diameter.
You will notice other larger particles and fragments of rubbish in your sample. Try to distinguish between the dust mites you are wanting to count and the dirt particles, hair fragments and lint.
RESulTS1. Record the dust mite populations in your sample
in the table below.
2. Note the different types of dust mites.
3. Draw each type of dust mite.
4. Record the size of the dust mite using a micrometer or millimetre graph paper.
INTERPRETATION1. Compare the dust mite populations from one
carpet area of a room to another. How do your results compare?
2. Where in your home would you expect dust mite populations to be the greatest? Why?
3. What months of the year do you think dust mite populations might be greatest in your area? Why?
location Dust mite type Diagram and populations
E.g., BEDROOM carpet Type 1: 35
Eye piece Objective Magnification Field of view diam. (mm)
5x 10x 50x 2.00
10x 10x 100x 1.40
12.5x 10x 125x 1.20
10x 20x 200x 0.6
PAGE 106 AIRWATCH
Other air pollution issues
7.5 Smoking
IT AIN’T NO jOkE WHEN yOu SMOkE! We’ve all heard on TV and radio about how bad smoking is for us, but did you know that when a cigarette burns it releases over 4000 substances into your lungs and into the air around you? These substances include carbon monoxide, tar and nicotine.
The following activity will show you what a smoker inhales while smoking.
Equipment (per group)• Ashtray.
• Filter cigarette.
• Matches.
• Masking tape.
• Wooden or metal skewer.
• Lint.
• Empty washing-up liquid bottle.
• Craft knife.
• 10 cm plastic tube about 1 cm in diameter.
Test Procedure1. Pull off the nozzle of the washing-up liquid
bottle and pierce a small hole near the top of the bottle with the skewer.
2. Take the plastic tube and use the skewer to poke a thin twist of lint into the tube.
3. Push one end of the tube into the top of the bottle. If the tube is too small to fit snugly, wrap masking tape around it.
4. Take the cigarette and use masking tape to seal the filter end in the free end of the tube.
5. Squeeze the bottle to push out the air.
6. Cover the hole with a finger while the cigarette is lit.
7. Keeping your finger over the hole, squeeze the bottle back to its full shape in order to draw in cigarette smoke. This shows the way a lung would operate.
8. Remove your finger and squeeze the bottle to push the air out again.
9. Holding the cigarette over the ashtray, repeat steps 7 and 8 until the cigarette has totally burned.
10. Take the cigarette stub from the tube and dispose of it.
11. Pull the tube out of the nozzle. Carefully push out the lint with the skewer.
ObSERVATIONS• Describe the lint before and after the
experiment.
People other than the smoker can be affected by the poisonous cigarette gases. This is called passive smoking.
ACTIVITyFind out as much as you can about passive or secondary smoke.
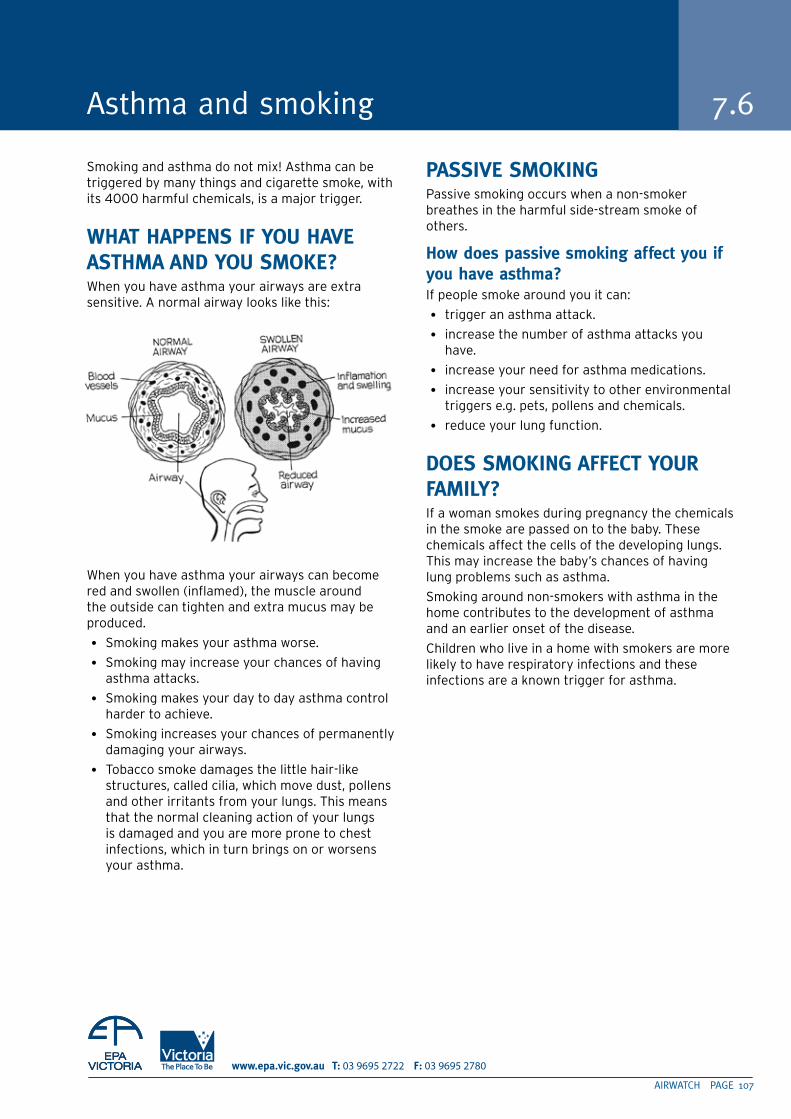
AIRWATCH PAGE 10�
03 9695 2722 03 9695 2780
Asthma and smoking 7.6
Smoking and asthma do not mix! Asthma can be triggered by many things and cigarette smoke, with its 4000 harmful chemicals, is a major trigger.
WHAT HAPPENS IF yOu HAVE ASTHMA ANd yOu SMOkE?When you have asthma your airways are extra sensitive. A normal airway looks like this:
When you have asthma your airways can become red and swollen (inflamed), the muscle around the outside can tighten and extra mucus may be produced.
• Smoking makes your asthma worse.
• Smoking may increase your chances of having asthma attacks.
• Smoking makes your day to day asthma control harder to achieve.
• Smoking increases your chances of permanently damaging your airways.
• Tobacco smoke damages the little hair-like structures, called cilia, which move dust, pollens and other irritants from your lungs. This means that the normal cleaning action of your lungs is damaged and you are more prone to chest infections, which in turn brings on or worsens your asthma.
PASSIVE SMOkINGPassive smoking occurs when a non-smoker breathes in the harmful side-stream smoke of others.
How does passive smoking affect you if you have asthma?If people smoke around you it can:
• trigger an asthma attack.
• increase the number of asthma attacks you have.
• increase your need for asthma medications.
• increase your sensitivity to other environmental triggers e.g. pets, pollens and chemicals.
• reduce your lung function.
dOES SMOkING AFFECT yOuR FAMIly?If a woman smokes during pregnancy the chemicals in the smoke are passed on to the baby. These chemicals affect the cells of the developing lungs. This may increase the baby’s chances of having lung problems such as asthma.
Smoking around non-smokers with asthma in the home contributes to the development of asthma and an earlier onset of the disease.
Children who live in a home with smokers are more likely to have respiratory infections and these infections are a known trigger for asthma.
PAGE 108 AIRWATCH
Other air pollution issues
7.6
REduCING ExPOSuRE TO SMOkEIf you have asthma how do you reduce your exposure to cigarette smoke?
• Don’t smoke.
• Make your home and car smoke free - put some no smoking signs up.
• Avoid smoky environments.
• Ask people not to smoke around you or your children.
• Arrange your workplace to be smoke-free.
• When flying overseas request non-smoking seats away from the smoking area.
• Avoid smoky areas.
ACTIVITy - HISTORy OF AN ASTHMA SuFFERERFind someone you know who has asthma and conduct an interview about their condition. Using this information, pretend you are the sufferer and prepare a talk to make others understand what you experience because of your asthma.
Questions you might ask could include:
• When were you first diagnosed as an asthmatic?
• How frequent are your ‘attacks’?
• Would you describe them as mild, moderate or severe?
• What triggers your attacks?
• Describe what you experience when being affected by asthma.
• What do you do to treat your asthma?
• What is the name of your medication?
• Do you have trouble when you exercise?
• Do you smoke?
• Do you miss work or school because of your asthma? How often?
To give a profile of your interviewee make sure you record information such as age, gender, type of work/school and so on.
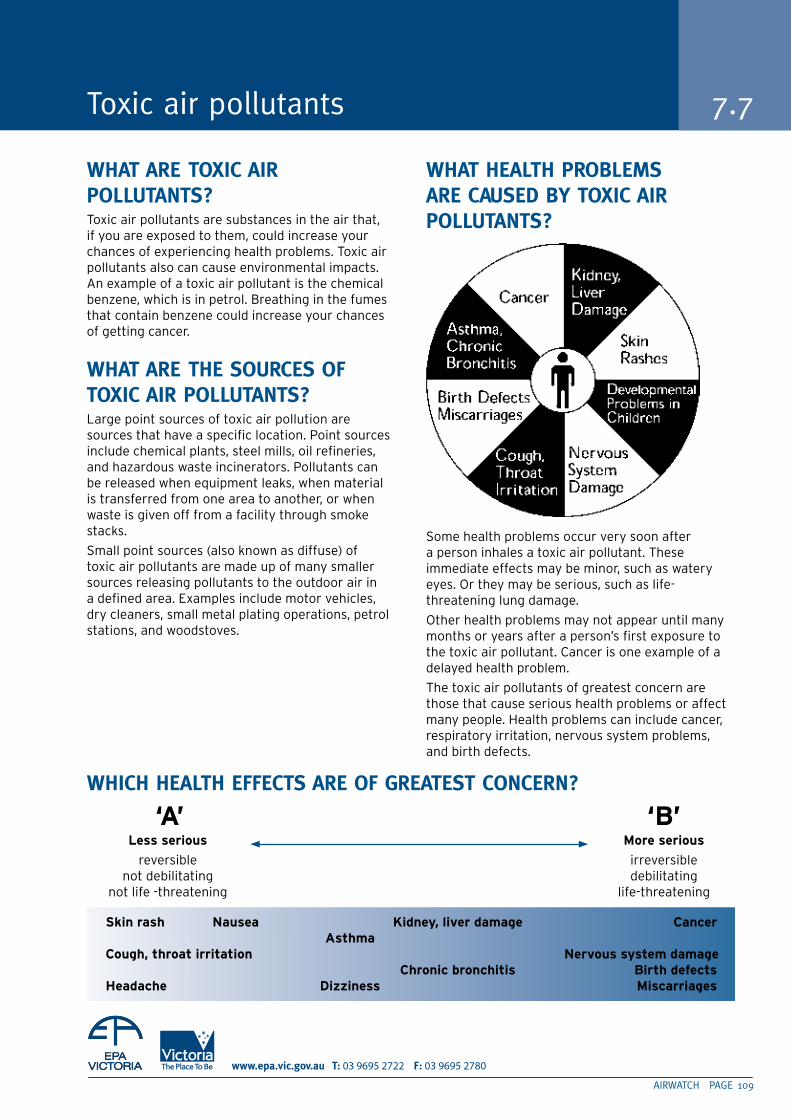
AIRWATCH PAGE 109
03 9695 2722 03 9695 2780
Toxic air pollutants 7.7
WHAT ARE TOxIC AIR POlluTANTS?Toxic air pollutants are substances in the air that, if you are exposed to them, could increase your chances of experiencing health problems. Toxic air pollutants also can cause environmental impacts. An example of a toxic air pollutant is the chemical benzene, which is in petrol. Breathing in the fumes that contain benzene could increase your chances of getting cancer.
WHAT ARE THE SOuRCES OF TOxIC AIR POlluTANTS?Large point sources of toxic air pollution are sources that have a specific location. Point sources include chemical plants, steel mills, oil refineries, and hazardous waste incinerators. Pollutants can be released when equipment leaks, when material is transferred from one area to another, or when waste is given off from a facility through smoke stacks.
Small point sources (also known as diffuse) of toxic air pollutants are made up of many smaller sources releasing pollutants to the outdoor air in a defined area. Examples include motor vehicles, dry cleaners, small metal plating operations, petrol stations, and woodstoves.
WHAT HEAlTH PROblEMS ARE CAuSEd by TOxIC AIR POlluTANTS?
Some health problems occur very soon after a person inhales a toxic air pollutant. These immediate effects may be minor, such as watery eyes. Or they may be serious, such as life-threatening lung damage.
Other health problems may not appear until many months or years after a person’s first exposure to the toxic air pollutant. Cancer is one example of a delayed health problem.
The toxic air pollutants of greatest concern are those that cause serious health problems or affect many people. Health problems can include cancer, respiratory irritation, nervous system problems, and birth defects.
WHICH HEAlTH EFFECTS ARE OF GREATEST CONCERN?
‘a’ ‘B’ less serious More serious
reversible irreversible not debilitating debilitating not life -threatening life-threatening
skin rash nausea Kidney, liver damage Cancer asthma Cough, throat irritation nervous system damage Chronic bronchitis Birth defects headache Dizziness Miscarriages
PAGE 110 AIRWATCH
Other air pollution issues
7.7
ACTIVITy1. Define the following words
Irreversible
Debilitating
Life-threatening
2. Under ‘A’ and ‘B’ in the diagram on the previous page, use the words ‘more’ or ‘less’ to describe the seriousness of the health effects in the table.
Which Toxic Air Pollutants are of Most Concern?Government agencies are most concerned about substances that fit one or more of these descriptions:
• Can cause serious health effects, such as cancer, birth defects, immediate death, or other serious illnesses.
• Are released to the air in large enough amounts to be toxic.
• Reach many people.
AIRWATCH PAGE 111
03 9695 2722 03 9695 2780
7.7
ACTIVITy3. Write a description of each of the following health problems.
4. Tick which one of these could be affected by air pollution.
EddIE’S ExTRAS Wittenoom in Western Australia and Queenstown in Tasmania have
both had serious air pollution problems. Select one of these towns and research the following questions:
1. What air pollutant caused the town’s problem?
2. What diseases did it cause?
3. Describe any effect it had on the surrounding environment.
4. How and when did the town start?
5. Was the air pollution problem in this town solved? If so, how?
6. What is this town like today?
health problem Description
Bronchitis
Down’s Syndrome
Leukaemia
Asthma
Miscarriage
Melanoma
Lymphoma
Chronic Fatigue Syndrome
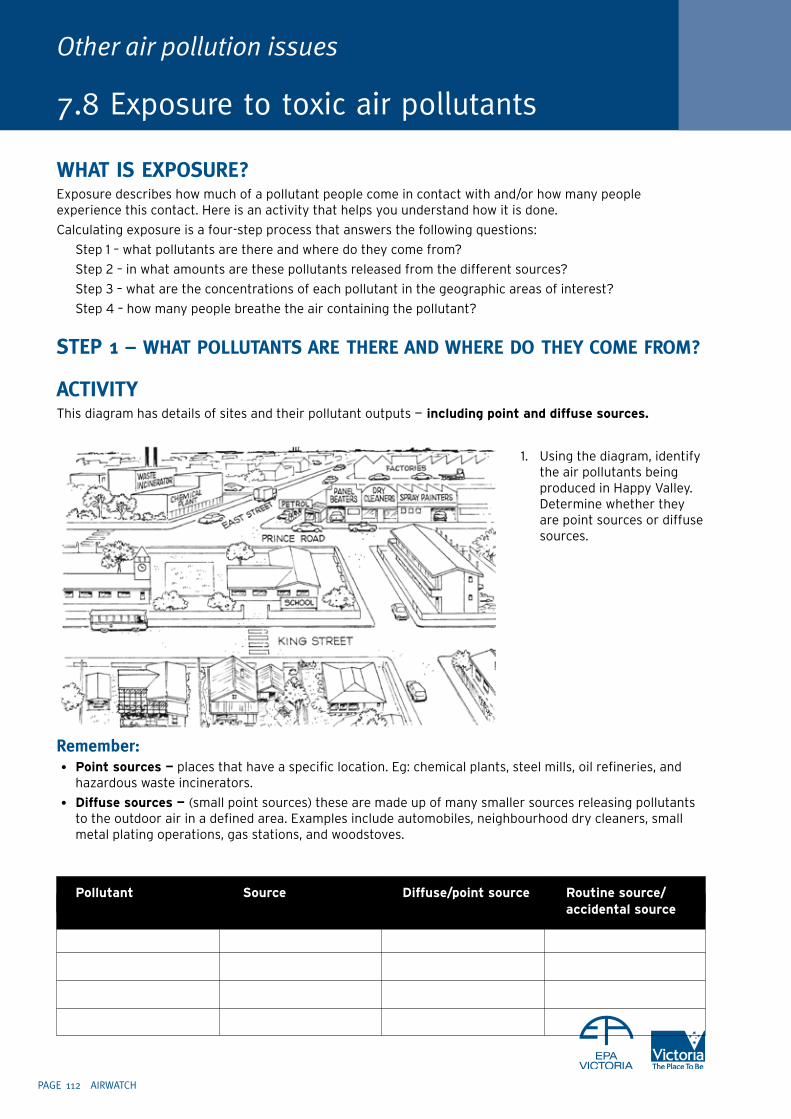
PAGE 112 AIRWATCH
Other air pollution issues
7.8 Exposure to toxic air pollutants
WHAT IS ExPOSuRE?Exposure describes how much of a pollutant people come in contact with and/or how many people experience this contact. Here is an activity that helps you understand how it is done.
Calculating exposure is a four-step process that answers the following questions:
Step 1 – what pollutants are there and where do they come from?
Step 2 – in what amounts are these pollutants released from the different sources?
Step 3 – what are the concentrations of each pollutant in the geographic areas of interest?
Step 4 – how many people breathe the air containing the pollutant?
STEP 1 – WHAT POlluTANTS ARE THERE ANd WHERE dO THEy COME FROM?
ACTIVITyThis diagram has details of sites and their pollutant outputs — including point and diffuse sources.
Remember:• Point sources — places that have a specific location. Eg: chemical plants, steel mills, oil refineries, and
hazardous waste incinerators.
• Diffuse sources — (small point sources) these are made up of many smaller sources releasing pollutants to the outdoor air in a defined area. Examples include automobiles, neighbourhood dry cleaners, small metal plating operations, gas stations, and woodstoves.
1. Using the diagram, identify the air pollutants being produced in Happy Valley. Determine whether they are point sources or diffuse sources.
Pollutant source Diffuse/point source routine source/ accidental source
AIRWATCH PAGE 113
03 9695 2722 03 9695 2780
7.8
EddIE’S ExTRAS Find common products that contain the following toxic air
pollutants and record what harmful effects they can have on humans.
• methylene chloride
• benzene
• chromium
• caustic soda
• perchloroethylene
• hydrogen peroxide
• xylene
• trichloroethylene
STEP 2 – IN WHAT AMOuNTS ARE THESE POlluTANTS RElEASEd FROM THE dIFFERENT SOuRCES?To estimate the amount of a routine release, engineers sometimes use a monitor to sample and measure the pollutant as it is released. The amount per day is then calculated.
Lots of things affect how much is released. For point sources, things that are important include how efficient the plant is, how many stacks there are, how long each day it operates etc.
For diffuse sources, considerations include number of petrol stations in the area, number of wood heaters, small businesses, etc.
ACTIVITy2. In Happy Valley monitoring has determined the figures for the following three pollutants. Calculate how
much pollutant is produced per day.
Pollutant how much average Pollutant pollutant running time per day
Sulfur dioxide from factory 700 µg/hour 10 hours/day
Particles from wood heaters 10 µg/hour 8 hours/day
Benzene from petrol stations 0.001 ppm/hour 14 hours/day
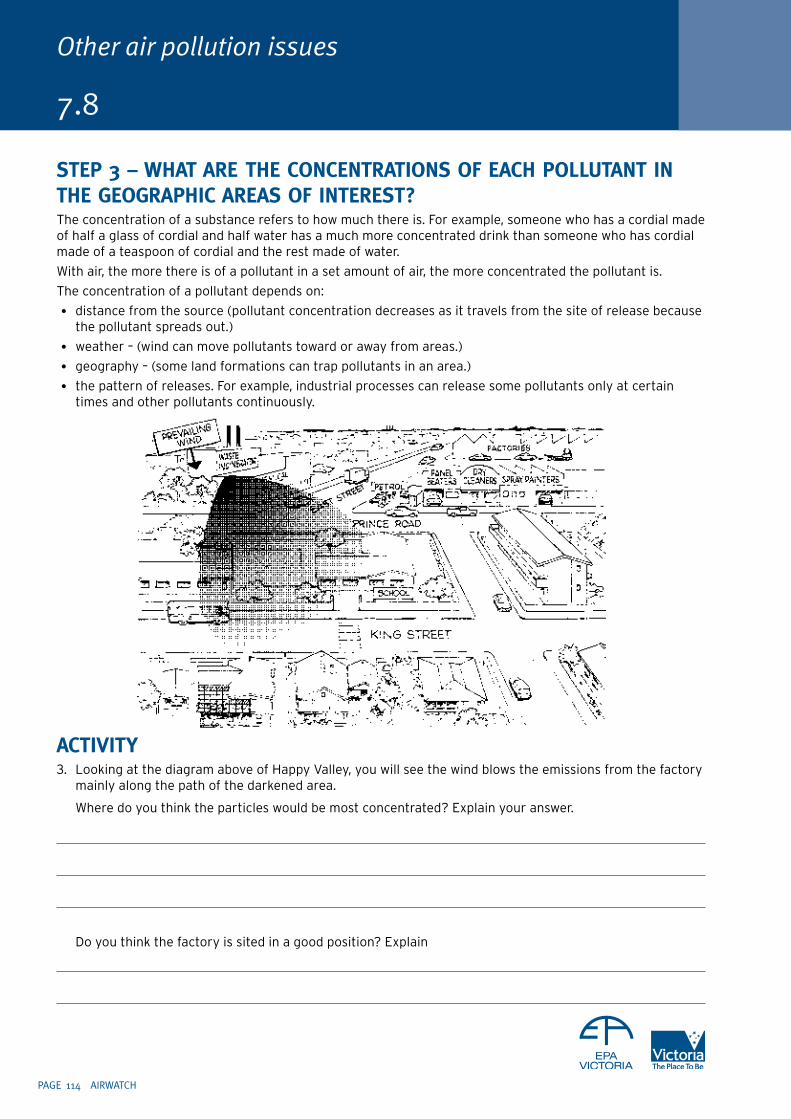
PAGE 114 AIRWATCH
Other air pollution issues
7.8
STEP 3 – WHAT ARE THE CONCENTRATIONS OF EACH POlluTANT IN THE GEOGRAPHIC AREAS OF INTEREST?The concentration of a substance refers to how much there is. For example, someone who has a cordial made of half a glass of cordial and half water has a much more concentrated drink than someone who has cordial made of a teaspoon of cordial and the rest made of water.
With air, the more there is of a pollutant in a set amount of air, the more concentrated the pollutant is.
The concentration of a pollutant depends on:
• distance from the source (pollutant concentration decreases as it travels from the site of release because the pollutant spreads out.)
• weather – (wind can move pollutants toward or away from areas.)
• geography – (some land formations can trap pollutants in an area.)
• the pattern of releases. For example, industrial processes can release some pollutants only at certain times and other pollutants continuously.
ACTIVITy3. Looking at the diagram above of Happy Valley, you will see the wind blows the emissions from the factory
mainly along the path of the darkened area.
Where do you think the particles would be most concentrated? Explain your answer.
Do you think the factory is sited in a good position? Explain
AIRWATCH PAGE 115
03 9695 2722 03 9695 2780
7.8
STEP 4 – HOW MANy PEOPlE bREATHE THE AIR CONTAINING THE POlluTANT?
ACTIVITy4. The diagram of Happy Valley also shows you the populations around the area.
a) Which area has the greatest population? b) Does the pollution affect this population? c) Who would be affected by air pollution more – those people living on Prince Road or King Street?
Explain your answer.
EddIE’S ExTRAS5. Considering the pollution, would you be willing to
live in Happy Valley? Explain your answer.
6. Explain what measure could be taken to improve Happy Valley’s air quality.

PAGE 116 AIRWATCH

03 9695 2722 03 9695 2780
GlObAl AIR quAlITy
AIRWATCH PAGE 11�
You have been studying the effects of pollution at a local level where we live and work.
accumulation of some pollutants in the atmosphere can cause changes to the composition and the way the atmosphere acts. these changes are global and affect many more people around the world, some of whom had no hand in producing these pollutants.
in this section you will study the effects of pollution at a global level.
The Australian Greenhouse Office (AGO) fact sheets are a very readable source of information on the enhanced greenhouse effect and global warming. Use the fact sheets to help answer questions in Chapter 8. Fact sheets can be downloaded from www.greenhouse.gov.au/education/factsheets.
SECT
ION
> 8
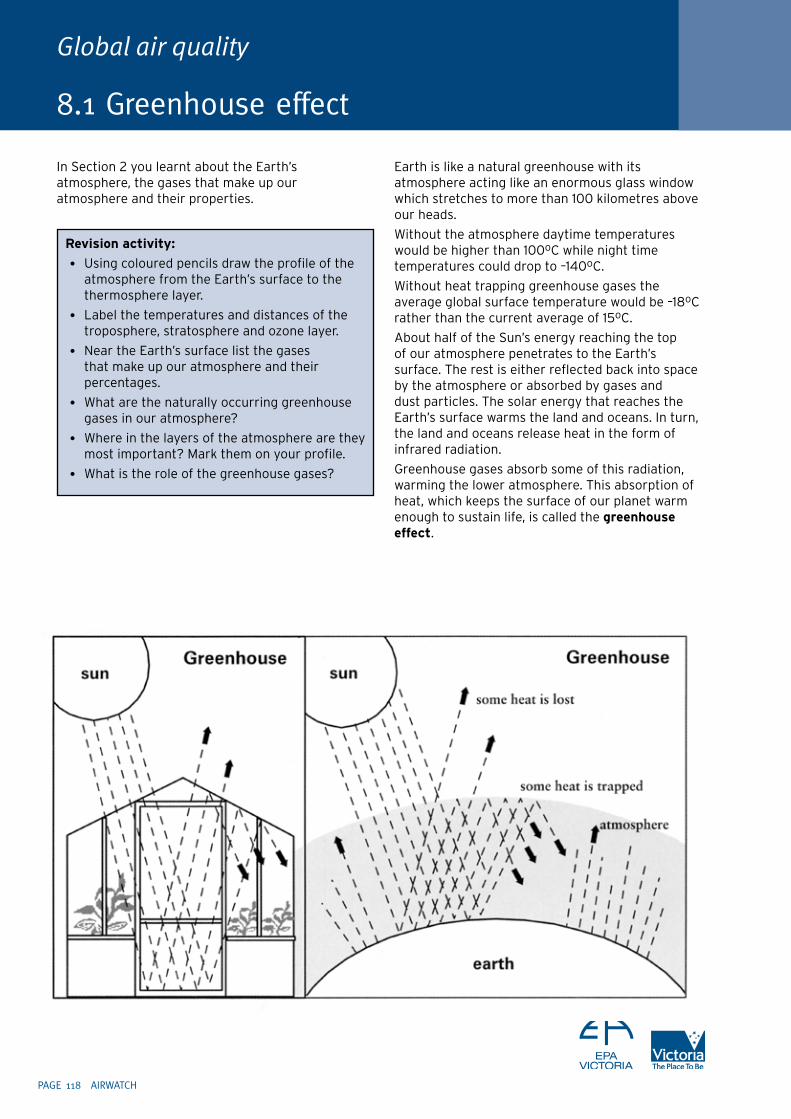
PAGE 118 AIRWATCH
In Section 2 you learnt about the Earth’s atmosphere, the gases that make up our atmosphere and their properties.
Earth is like a natural greenhouse with its atmosphere acting like an enormous glass window which stretches to more than 100 kilometres above our heads.
Without the atmosphere daytime temperatures would be higher than 100oC while night time temperatures could drop to –140oC.
Without heat trapping greenhouse gases the average global surface temperature would be –18oC rather than the current average of 15oC.
About half of the Sun’s energy reaching the top of our atmosphere penetrates to the Earth’s surface. The rest is either reflected back into space by the atmosphere or absorbed by gases and dust particles. The solar energy that reaches the Earth’s surface warms the land and oceans. In turn, the land and oceans release heat in the form of infrared radiation.
Greenhouse gases absorb some of this radiation, warming the lower atmosphere. This absorption of heat, which keeps the surface of our planet warm enough to sustain life, is called the greenhouse effect.
Global air quality
8.1 Greenhouse effect
revision activity:
• Using coloured pencils draw the profile of the atmosphere from the Earth’s surface to the thermosphere layer.
• Label the temperatures and distances of the troposphere, stratosphere and ozone layer.
• Near the Earth’s surface list the gases that make up our atmosphere and their percentages.
• What are the naturally occurring greenhouse gases in our atmosphere?
• Where in the layers of the atmosphere are they most important? Mark them on your profile.
• What is the role of the greenhouse gases?
AIRWATCH PAGE 119
03 9695 2722 03 9695 2780
ACTIVITyHow does the greenhouse effect change air temperature?
EquIPMENT• 2-litre clear plastic drink bottle.
• Blue tack.
• 2 thermometers.
• black paper or cardboard.
• 1 nail.
• Retort stand.
INSTRuCTIONS1. Put a piece of black paper in the bottle. Screw
on the lid.
2. Make a hole in the top of the bottle with the nail. Insert a thermometer into the hole so that the bulb is in the middle of the bottle.
3. Secure the second thermometer onto the retort stand.
4. Place the bottle and the stand in the sunlight, making sure each receives the same amount of sunlight. Record the temperatures on both thermometers in the table below.
5. After 20 minutes in the sun record the temperature again.
INTERPRETATION1. What can you interpret from your results?
2. What does the bottle represent on Earth?
3. What is the function of the black paper?
4. Describe what has happened to cause the difference in temperatures between the two thermometers.
5. Did both thermometers read the same temperature at the beginning of the experiment? If not can you explain why? Is it a problem?
further enquiry: Complete the experiment on a cloudy day. Compare the results of your experiments, and explain any differences in your findings.source: Global Climate Change, Atmospheric Research Information Centre, Manchester University, Manchester, UK
EddIE’S ExTRAS 1. Go to the REFERENCE section of the
Australian Greenhouse Calculator at www.epa.vic.gov.au.
Look at the ‘Greenhouse effect’ storyboards and animation. Read the section ‘What is it?’
2. Refer to the AGO fact sheet ‘The air up there’.
• What scientific techniques do scientists use to determine the greenhouse gas levels 200 or 1000 years ago?
• Over the past 200 years which greenhouse gas in our atmosphere has had the biggest increase?
• Compared to 200 years ago how much more of this gas is there in our atmosphere today? What is the reason for this increase?
8.1
thermometer temperature temperature Difference before (°C) after (°C) (°C)
1
2
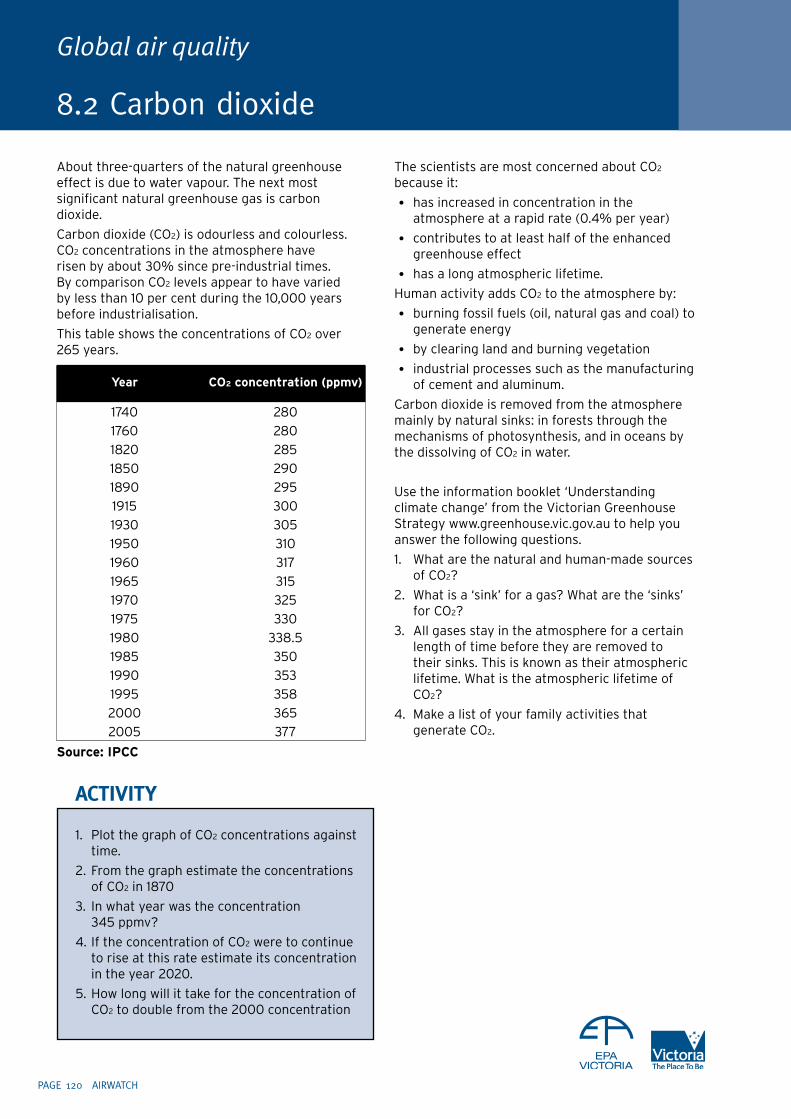
PAGE 120 AIRWATCH
Global air quality
8.2 Carbon dioxide
About three-quarters of the natural greenhouse effect is due to water vapour. The next most significant natural greenhouse gas is carbon dioxide.
Carbon dioxide (CO2) is odourless and colourless. CO2 concentrations in the atmosphere have risen by about 30% since pre-industrial times. By comparison CO2 levels appear to have varied by less than 10 per cent during the 10,000 years before industrialisation.
This table shows the concentrations of CO2 over 265 years.
source: iPCC
ACTIVITy
1. Plot the graph of CO2 concentrations against time.
2. From the graph estimate the concentrations of CO2 in 1870
3. In what year was the concentration 345 ppmv?
4. If the concentration of CO2 were to continue to rise at this rate estimate its concentration in the year 2020.
5. How long will it take for the concentration of CO2 to double from the 2000 concentration
The scientists are most concerned about CO2 because it:
• has increased in concentration in the atmosphere at a rapid rate (0.4% per year)
• contributes to at least half of the enhanced greenhouse effect
• has a long atmospheric lifetime.
Human activity adds CO2 to the atmosphere by:
• burning fossil fuels (oil, natural gas and coal) to generate energy
• by clearing land and burning vegetation
• industrial processes such as the manufacturing of cement and aluminum.
Carbon dioxide is removed from the atmosphere mainly by natural sinks: in forests through the mechanisms of photosynthesis, and in oceans by the dissolving of CO2 in water.
Use the information booklet ‘Understanding climate change’ from the Victorian Greenhouse Strategy www.greenhouse.vic.gov.au to help you answer the following questions.
1. What are the natural and human-made sources of CO2?
2. What is a ‘sink’ for a gas? What are the ‘sinks’ for CO2?
3. All gases stay in the atmosphere for a certain length of time before they are removed to their sinks. This is known as their atmospheric lifetime. What is the atmospheric lifetime of CO2?
4. Make a list of your family activities that generate CO2.
Year Co2 concentration (ppmv)
1740 280
1760 280
1820 285
1850 290
1890 295
1915 300
1930 305
1950 310
1960 317
1965 315
1970 325
1975 330
1980 338.5
1985 350
1990 353
1995 358
2000 365
2005 377

AIRWATCH PAGE 121
03 9695 2722 03 9695 2780
OTHER GREENHOuSE GASESFarm animals and rice growing are responsible for adding methane, a greenhouse gas, to the atmosphere. Artificial fertilisers add another greenhouse gas, nitrous oxide.
Refer to the AGO fact sheet Bad gas.
5. Investigate the natural and human-made sources of methane and nitrous oxide.
6. How could farmers reduce their impact on the enhanced greenhouse effect?
7. How do humans add to global methane levels?
8. Which greenhouse gases are only human-made and what are their sources? Why are they so harmful to our atmosphere?
Although not a greenhouse gas ‘aerosols’ (very small liquid or solid particles) have the property of cooling the atmosphere by reflecting and absorbing solar radiation, and altering the reflective properties of clouds. Soil dust, sea spray and volcanic emissions are aerosols from natural sources. Aerosols have a very short life in the troposphere and scientists believe that their cooling properties do not counteract the global enhanced greenhouse effect.
9. What are the human-made aerosols and what are their sources?
EddIE’S ExTRAS Go to the REFERENCE section on the Australian
Greehnouse Calculator and look at the CARBON cycle information and animation. Complete Activity 3.7, ‘Where does carbon go?’ in the Activities & Resources section.
8.2
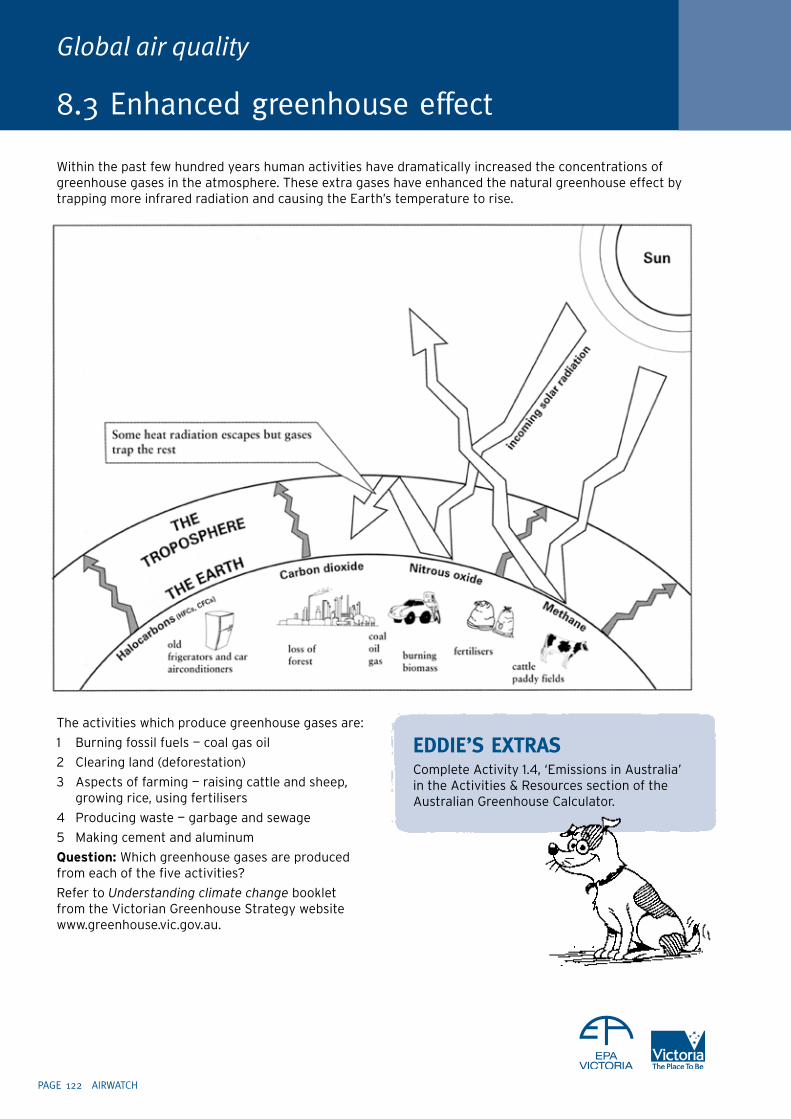
PAGE 122 AIRWATCH
Global air quality
8.3 Enhanced greenhouse effect
The activities which produce greenhouse gases are:
1 Burning fossil fuels — coal gas oil
2 Clearing land (deforestation)
3 Aspects of farming — raising cattle and sheep, growing rice, using fertilisers
4 Producing waste — garbage and sewage
5 Making cement and aluminum
Question: Which greenhouse gases are produced from each of the five activities?
Refer to Understanding climate change booklet from the Victorian Greenhouse Strategy website www.greenhouse.vic.gov.au.
EddIE’S ExTRAS Complete Activity 1.4, ‘Emissions in Australia’
in the Activities & Resources section of the Australian Greenhouse Calculator.
Within the past few hundred years human activities have dramatically increased the concentrations of greenhouse gases in the atmosphere. These extra gases have enhanced the natural greenhouse effect by trapping more infrared radiation and causing the Earth’s temperature to rise.
AIRWATCH PAGE 123
03 9695 2722 03 9695 2780
The climate on Earth is always fluctuating. We’ve had long-term climate events such as ice ages, mini ice ages, warm periods, and short-term weather events such as floods, droughts and cyclones all of which are normal weather events. We are now experiencing an event that is not normal and is a serious climate problem. That event is called global warming.
‘Global warming’ refers to the warming of the Earth as a result of the enhanced greenhouse effect and it is a long term climatic event which can influence the severity and frequency of weather events.
Scientists predict that due to the enhanced greenhouse effect the Earth’s average global surface temperature will rise between 1.4 and 5.8 °C by 2100. So what’s the problem with the Earth getting just a little warmer? Surely a few degrees is not going to cause much change — or is it?
Let’s investigate by doing a very simple experiment.
ExPERIMENT (PER GROuP)• 2 x 100ml beakers
• 2 x rubber stoppers with holes
• ice cubes
INSTRuCTIONS• In one beaker place an ice cube (this represents
icebergs).
• Place a rubber stopper into each beaker.
• Fill each beaker with water so that it is level with the top of the stopper.
• Record the water level in each beaker.
• Put an ice block on top of the stopper in the other beaker. (this represents land ice)
• Leave the beakers until all the ice has melted.
• Record the water level in each beaker again.
RESulTSCalculate the change in levels for each beaker.
Interpretation
1 In which box did the level rise the most?
2 Will sea-ice or land-ice contribute to rise in sea level?
3 It is important to note that sea level will rise before icebergs begin to melt. This is because a rise in the Earth’s temperature will first cause the oceans to expand. Can you explain how this event occurs?
Global warming and climate change 8.4
level before level after Change in level
Sea ice beaker
Land ice beaker
PAGE 124 AIRWATCH
Global air quality
8.4
In 2001 the Intergovernmental Panel on Climate Change (IPCC) met to discuss and approve the latest snapshot of our Earth’s climate. The role of the IPCC is to access scientific, technical and socio-economic data in order to better understand climate change.
Read the AGO fact sheet Global warming in the 20th Century that documents the IPCC findings and predictions for the future to help you answer the following questions.
quESTIONS1 What has recent satellite data revealed about
our planet?
2 What natural activities have contributed to global warming?
3 According to the IPCC why has our average global temperature changed over the past 250 years?
4 Draw up a table and list the negative and positive aspects of a small amount of global warming.
5 According to the IPCC what are the changes Australia and New Zealand will experience in the future due to global climate change?
CHANGES FROM GlObAl WARMINGEven though nobody is quite sure how severe the climate changes due to global warming will be, there are indications that some of the following changes are likely to occur:
• Temperatures around the world will rise.
Every decade the predicted rise in temperature due to the greenhouse effect will be 0.2°C to 0.5°C.
• Sea levels may rise as the oceans expand. This may cause certain low lying areas such as Bangladesh, the Maldives or even perhaps low lying coastal regions of Australia to be submerged. Other areas will become marshy and/or flood more often. Some coastal towns might need to build walls to stop the sea from reaching sea-fronted buildings.
• Complicated changes in weather patterns, such as more severe droughts and floods, resulting in changes in the global distribution of freshwater.
• Agricultural industries may change with some areas becoming unsuitable for current crop production or farming altogether.
• Tropical diseases may spread more widely as the Earth warms. Crop pests and parasites may multiply more rapidly.
• Desert land will encroach upon arable land which once supported people
• Ecosystems will be changed and affect indigenous animal and plant populations
EddIE’S ExTRAS: 1. In small groups discuss what effects the
above changes may have on people socially, culturally, and economically in Australia, and worldwide.
2. What is your town or city’s average January or February daytime temperature?
Estimate what the average temperature will be in (a) 2010 (b) 2050 (c) 2100 (using the boxed highlighted figures)
3 Do you think we should be worried about global warming? Explain
4. Complete Activity 1.5, ‘Australia’s responses to the greenhouse effect’, in the Activities & Resources section of the Australian Greenhouse Calculator.
AIRWATCH PAGE 125
03 9695 2722 03 9695 2780
Ozone 8.5
WHAT IS OzONE?Ozone is a pungent, bluish gas. Its chemical formula is O3 meaning it is made up of three oxygen atoms. Ozone is a greenhouse gas found in the stratosphere and the troposphere. Ozone is much less common than normal oxygen - in the stratosphere there are only three ozone molecules to every two million oxygen molecules. In fact if you removed all other molecules in the stratosphere and compressed the ozone molecules you would have a 5mm layer of ozone around the globe.
bAd OzONEIn the troposphere or lower atmosphere ozone is a trouble maker because it is a pollutant and a greenhouse gas. Tropospheric ozone is generated indirectly from a chemical reaction between pollutants from motor vehicle exhaust, oxygen and strong sunlight.
Ozone formed in the troposphere does not enter the stratosphere.
questions:1. Find out what effects ground level ozone has on
animals, plants and building materials.
2. Ozone is a principal component of summer smog. Draw a diagram to show the reactions for summer smog formation (refer to Section 5.2)
GOOd OzONEIn the stratosphere ozone is our protector! The ozone layer extends from about 15km to 35km above the Earth and protects the Earth like sunscreen protects your skin from the sun. The ozone layer absorbs a portion of ultraviolet radiation from the sun, preventing it from reaching the planet’s surface. Most importantly, it absorbs the portion of ultraviolet light called UVB.
UVB has been linked to many harmful human effects, including various types of skin cancer and cataracts, harm to some crops, certain materials, and some forms of marine life.
Ozone molecules are constantly formed and destroyed in the stratosphere, however the total amount remains relatively stable. Scientists have a good understanding of the natural processes and changes in stratospheric ozone concentrations due to sunspots, the changes in the seasons and changes in the latitudes.
Scientists have collected data over several decades to track normal ozone levels during these natural cycles. Each natural reduction in ozone levels has been followed by a recovery. However, recently scientific evidence has shown that the ozone layer is being depleted well beyond changes due to natural processes.
questions: 3. There are three types of UV radiation — a, B and
C. Find out the difference
4. Use your school library or the internet to find out the harmful effects of uVB.
5. What can you do to protect yourself from UV radiation?
6. What is the meaning of the SPF number on your sunscreen bottle?
EddIE’S ExTRAS Look at the Ozone concentration vs Altitude
graph and side notes on the next page:
1. Where is there the greatest concentration of ozone in our atmosphere?
2. What is the height range of stratospheric ozone?
3. What of the total ozone in our atmosphere is found in the stratosphere?
4. What is the source of ozone close to the ground?
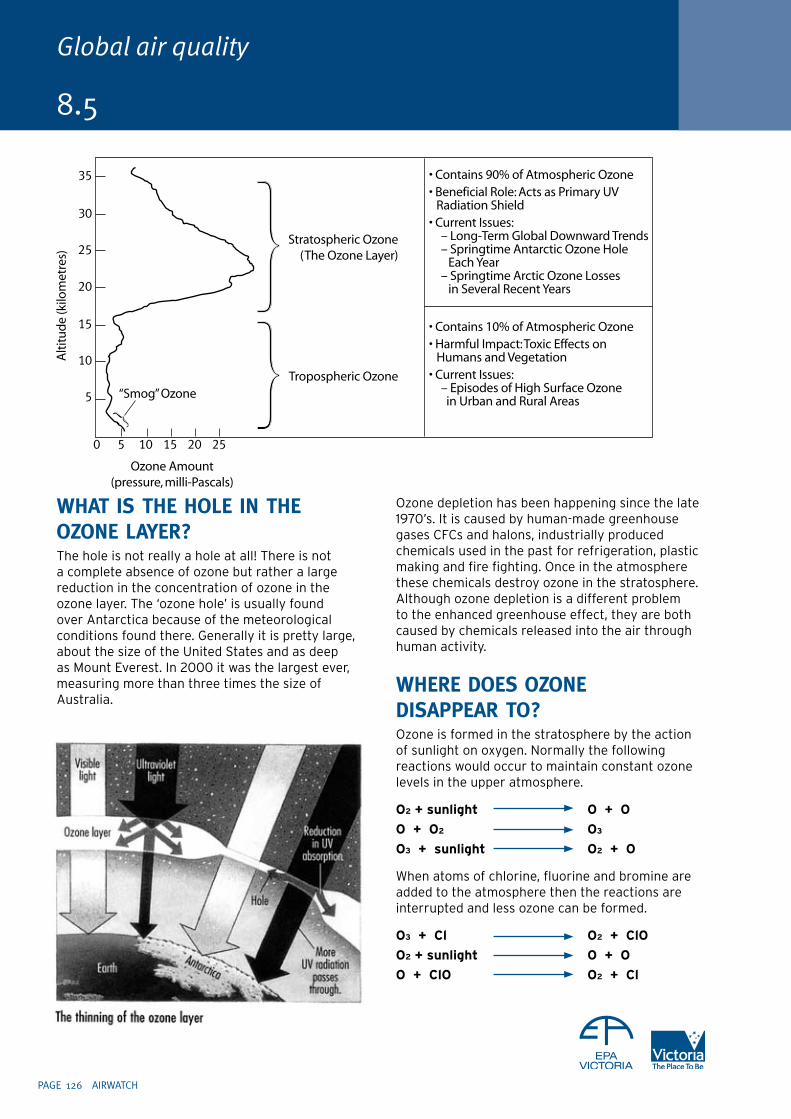
PAGE 126 AIRWATCH
Global air quality
WHAT IS THE HOlE IN THE OzONE lAyER?The hole is not really a hole at all! There is not a complete absence of ozone but rather a large reduction in the concentration of ozone in the ozone layer. The ‘ozone hole’ is usually found over Antarctica because of the meteorological conditions found there. Generally it is pretty large, about the size of the United States and as deep as Mount Everest. In 2000 it was the largest ever, measuring more than three times the size of Australia.
Ozone depletion has been happening since the late 1970’s. It is caused by human-made greenhouse gases CFCs and halons, industrially produced chemicals used in the past for refrigeration, plastic making and fire fighting. Once in the atmosphere these chemicals destroy ozone in the stratosphere. Although ozone depletion is a different problem to the enhanced greenhouse effect, they are both caused by chemicals released into the air through human activity.
WHERE dOES OzONE dISAPPEAR TO?Ozone is formed in the stratosphere by the action of sunlight on oxygen. Normally the following reactions would occur to maintain constant ozone levels in the upper atmosphere.
o2 + sunlight o + o
o + o2 o3
o3 + sunlight o2 + o
When atoms of chlorine, fluorine and bromine are added to the atmosphere then the reactions are interrupted and less ozone can be formed.
o3 + Cl o2 + Clo
o2 + sunlight o + o
o + Clo o2 + Cl
8.5
AIRWATCH PAGE 12�
03 9695 2722 03 9695 2780
WHERE dO OzONE dEPlETING ATOMS COME FROM?Ozone depleting chlorine, bromine and fluorine atoms exist naturally in the atmosphere in very low concentrations. Chlorine, bromine and fluorine atoms are also found in compounds which we use in everyday life: CFCs, HCFCs, methyl bromide and halons.
RESEARCH• CFC’s, HCFCs, methyl bromide and halons are
man-made greenhouse gases. Find out what they are used for.
• Why are hfCs safe to use as a propellant?
• Since 1989 many countries have had programs to phase out the use of ozone depleting substances because of the Montreal Protocol. What is the Montreal Protocol?
• What is Australia’s program for phasing out ozone depleting substances? Is it successful?
CAN I HElP THE OzONE lAyER?As a consumer you can help to reduce the amount of CFC’s and HCFC’s emitted into the atmosphere by:
• using products which contain HFCs as a propellant rather than CFCs and HCFCs.
• purchasing fridges that use butane and propane as refrigerants
• ensuring that the CFCs in old fridges are disposed of correctly
• avoiding goods with foam-blown packaging
EddIE’S ExTRAS Q.1. Why does the ozone layer thin more in the
polar regions?
Q.2. During which season does ozone thin over Antarctica?
Q.3 What would our world look like if the ozone layer were greatly depleted in future years?
Q.4 Fill in the missing information in the table below:
8.5
summary of differences between tropospheric ozone and stratospheric ozone
Troposheric ozone Stratospheric ozone
Location in atmosphere (km)
Is it destroyed by a chemical reaction?
Does it trap heat?

PAGE 128 AIRWATCH
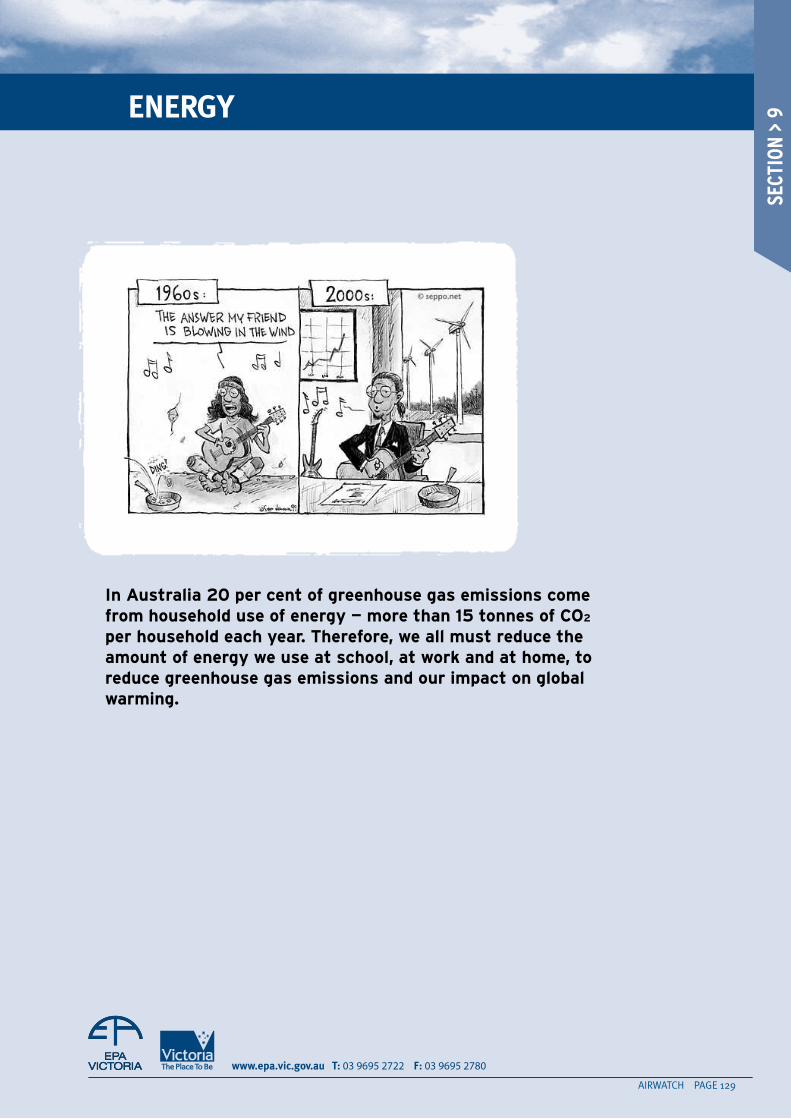
03 9695 2722 03 9695 2780
ENERGy
in australia 20 per cent of greenhouse gas emissions come from household use of energy — more than 15 tonnes of Co2 per household each year. therefore, we all must reduce the amount of energy we use at school, at work and at home, to reduce greenhouse gas emissions and our impact on global warming.
AIRWATCH PAGE 129
SECT
ION
> 9
PAGE 130 AIRWATCH
Nearly three quarters of all greenhouse gases produced in Australia come from the burning of fossil fuels — coal, natural gas and petrol. The energy produced from the burning of fossil fuels allows us to carry out many activities in our daily lives. Switching on a light or watching television, lighting a gas heater or driving a car are just some of our daily activities that use energy and generate greenhouse gases and air pollution.
Fossil fuels were formed many millions of years ago from the remains of plants and animals placed under extreme heat and pressure in the Earth’s crust. They get their name from the fossils that can often be found in coal seams. Fossil fuels contain carbon and when they burn the carbon combines with oxygen to form carbon dioxide (CO2) and heat energy is released.
The burning of fossil fuels also produces a wide range of air pollutants: carbon monoxide, sulfur dioxide, nitrogen oxides and many others. So we are facing a dilemma with our use of fossil fuels. We depend on them in our daily lives, but it comes at a cost to our environment. In turn, this threatens the well-being of many species that now inhabit planet Earth, including humanity. What can we do about it?
• we can be careful about how we use fossil fuels
A lot of energy we produce is simply wasted. Buildings burn more fuel than they need to keep warm because of the design, many cars with one person in them chew up lots of petrol and people keep lights and appliances running even when they are not using them.
In fact unless switched off at the wall most appliances continually consume small amounts of electricity if left on “stand-by”. It is estimated that 10% of household electricity use is due to this factor.
• we can use renewable energy sources
Wind, solar, hydro and biomass power produce near zero greenhouse gases or air pollutants.
• we can reduce the amount of land clearing and increase tree planting.
Forests are an important carbon dioxide ‘sink’ because they absorb CO2. Unfortunately the world forests are being cut down at a rate of 154,000 km2 each year for agriculture, paper, timber and fuel. Deforestation is adding about 10 billion tonnes of CO2 a year to the total amount of CO2 released by energy use and land use.
ACTIVITy • List the things that could be done to reduce
energy wastage.
• Find a country that has a similar land area (km2) to the annual rate of deforestation.
• How could we slow down the rate of destruction of forests or increase the amount of forests?
• What are the other environmental problems caused by deforestation?
Energy
9.1 Fossil fuels and energy

AIRWATCH PAGE 131
03 9695 2722 03 9695 2780
In Australia 20 per cent of greenhouse gas emissions come from households — more than 15 tonnes of CO2 per household each year. A kilogram of CO2 would fill a large refrigerator. A tonne of CO2 would fill the average family home.
The three main sources of household greenhouse gases are from:
• energy use (water heating, electrical appliances, heating/cooling, cooking, lights)
• transport
• wastes (in landfill)
The Global Warming Cool it! booklet from the Australian Greenhouse Office (AGO) provides information for all Australian households about their greenhouse gas emissions and actions that each individual can take to reduce global warming.
The booklet can be downloaded from the AGO website at, www.greenhouse.gov.au/gwci.
ACTIVITy• Draw up the table below as shown.
• Refer to the pie chart and record the average household percentage contribution to greenhouse gas emissions in the table.
• How could your family reduce their energy use and greenhouse gas emissions? List as many ways as possible in the table.
• Do you think your family could save money by reducing the energy they use?
Household energy 9.2
activity or appliance average household ways my family could $ saving in reduction contribution to reduce energy use and of energy use Greenhouse gas % greenhouse gas emissions
Transport
Water heating
Electronic appliances
Home heating/cooling
Fridge/freezer
Lights
Waste
Cooking
Clothes wash/dry dishwashing
EddIE’S ExTRAS Design a poster with a
slogan that encourages households to use less energy.
household greenhouse gas emissions
PAGE 132 AIRWATCH
Energy
In this section you will investigate your household energy consumption, greenhouse gas and pollution emissions, and energy costs. To complete Steps 1—5 use the Australian Greenhouse Calculator Reference section. Go to Activities & Resources.
STEP 1Complete a survey of your household transport usage, energy usage, and waste disposal (household section — activity 4.1)
• Take home a copy of the ‘Home survey’ and ask you family to help you record information about the use of energy in your household.
• Enter the data you have collected into the Australian Greenhouse Calculator scorecard. You can select either the quick or the detailed calculation program.
• You will now have an annual report of your Greenhouse Gas emissions, energy costs and pollution emissions.
• The information in the reports will assist you in completing steps 2 & 3
STEP 2investigate your household energy consumption (household section — activity 4.2)
• For this activity you will need a your family’s energy bills (gas and electricity) over a 1 year period
• The purpose of this activity is to look at your family energy usage over a period of time comparing seasonal variations, the types of appliances using energy, and the reasons for consumption changes
STEP 3 investigate how your household can reduce energy wastage and consumption (household section — activity 4.3)
• Use the Home scorecard to select an energy consumption area which is high.
• Decide on ways in which your family can save energy in this consumption area.
STEP 4work with the other members of your household to write and implement an action plan using the energy saving ideas that you have learnt so far. (household section — activity 4.4)
• This activity compares a current energy bill with a future energy bill after the action plan has been implemented. It will take at least 2-3 months to evaluate depending upon your bill cycles.
STEP 5use the knowledge you have gained to advise ‘clients’ on saving energy. (Household section - Activity 4.5)
• Use the Greenhouse calculator to help you to solve client energy problems.
EddIE’S ExTRAS: 1. Using your Home scorecard from Step 1,
calculate your household greenhouse and pollution emissions if you made the following changes:
making 20% less car trips a week, switching to green power, swapping to low energy lighting, insulating your home recycling more.2. Which of the following actions do you already do
to reduce greenhouse gas emissions? (tick)
Turn off unnecessary lights. Turn off ‘standby’ functions on appliances. Walk, cycle or catch a bus instead of using a
car. If you have air conditioning or heating turn
them down. Every 1 ˚C can help to save up to 10% on your energy bill.
Recycle your rubbish. Don’t buy products with too much packaging. Install a solar powered water heater. Make sure your car is serviced regularly and
the air conditioner correctly regassed. Only use wood and wood products grown in
sustainable forests. Become an active member of groups that can
affect legislation. Can you think of any more actions that will
reduce greenhouse gas emissions and help the environment?
3. Design a poster at your school to promote one of the above actions. Your class could display their posters in a prominent location at your school.
9.3 Your household energy use
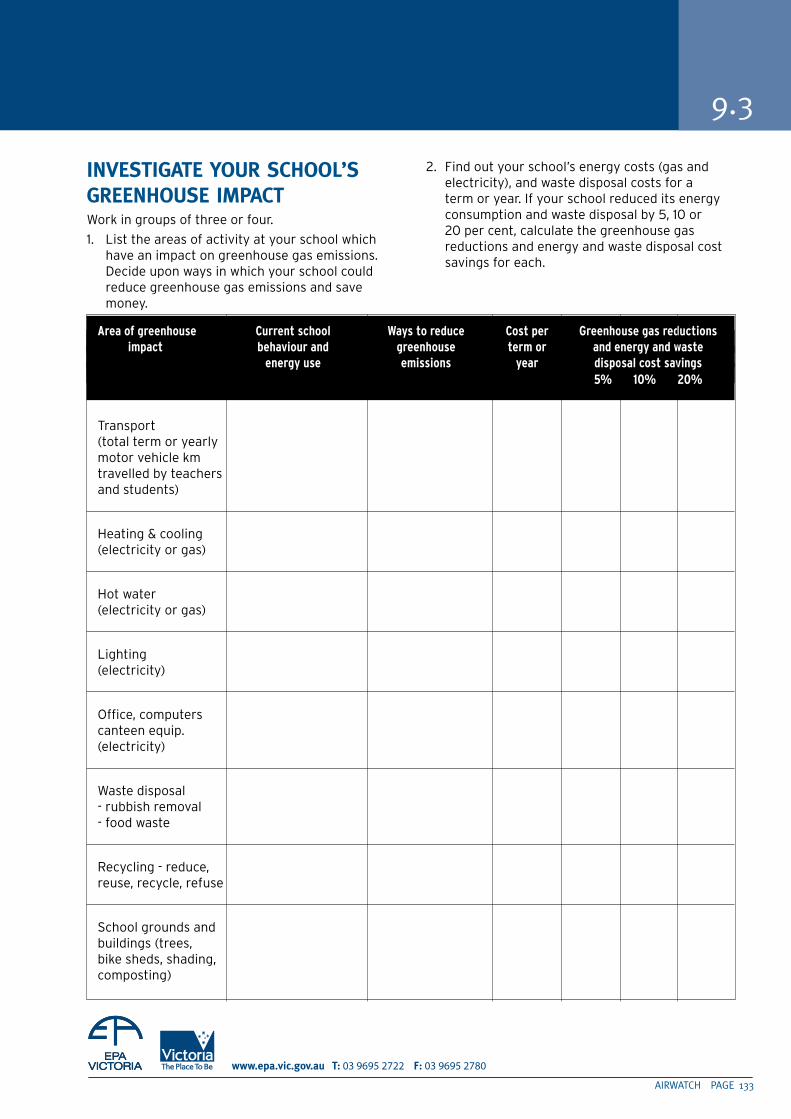
AIRWATCH PAGE 133
03 9695 2722 03 9695 2780
INVESTIGATE yOuR SCHOOl’S GREENHOuSE IMPACTWork in groups of three or four.
1. List the areas of activity at your school which have an impact on greenhouse gas emissions. Decide upon ways in which your school could reduce greenhouse gas emissions and save money.
2. Find out your school’s energy costs (gas and electricity), and waste disposal costs for a term or year. If your school reduced its energy consumption and waste disposal by 5, 10 or 20 per cent, calculate the greenhouse gas reductions and energy and waste disposal cost savings for each.
9.3
Area of greenhouse Current school Ways to reduce Cost per Greenhouse gas reductions impact behaviour and greenhouse term or and energy and waste energy use emissions year disposal cost savings 5% 10% 20%
Transport (total term or yearly motor vehicle km travelled by teachers and students)
Heating & cooling (electricity or gas)
Hot water (electricity or gas)
Lighting (electricity)
Office, computers canteen equip. (electricity)
Waste disposal - rubbish removal - food waste
Recycling - reduce, reuse, recycle, refuse
School grounds and buildings (trees, bike sheds, shading, composting)
PAGE 134 AIRWATCH
Energy
9.4 Green energy
Our modern lives are very dependent upon the energy produced from the burning of fossil fuels. The problem is that these energies pump greenhouse gases into our atmosphere and the resources that produce them are not infinite and will run out one day. Governments worldwide are now trying to find new ways of making environmentally-friendly energy from renewable sources.
questionwhat does ‘renewable energy’ mean?
Renewable energy can come from a number of sources:
• Solar — energy made by using radiant heat from the sun.
• Wind — energy made by harnessing wind power
• Biomass — energy from organic materials
• Hydro wave — energy generated from falling water
• Tidal power — energy from the sea
• Wave power — energy from the wind on the sea
• Geothermal power — energy using heat from deep inside the planet
ACTIVITIESa investigate the renewable energy sources
above using your school and local library and the internet.
Display your research on a poster or in a power-point presentation.
Include how widely used and available each energy source is in Australia.
b Compare renewable and non-renewable energy sources.
Copy the graph ‘Amounts of greenhouse gas from different energy sources’ into your workbook from the ‘Global Warming Cool it’ booklet, page 19. Include solar and wind energy sources on the y-axis. Include the two wood energy sources in your graph.
Many households burn firewood for their home heating. An open fireplace (0.58 kg/kWh) generates much more greenhouse gas (through methane production) than a closed wood heater (0.03 kg/kWh). An open fireplace is also a very inefficient heat source, with as much as 90 per cent of the heat escaping up the chimney.
questions1. Compare the nine energy sources in your graph.
Which energy sources generate the most and the least amount of greenhouse gases?
2. Why does the electricity source in Tasmania generate no greenhouse gases per unit of heat produced?
EddIE’S ExTRAS:Investigating solar powerList the ways in which your household could use solar energy.
useful renewable energy websites: • Sustainability Victoria works to accelerate
Victoria’s progress toward a sustainable energy future. Includes information on renewable energies and energy-efficient house design. www.sustainability.vic.gov.au
• Latest information and resources on energy. www.futureenergy.org
• An excellent renewable energy website. www.darvill.clara.net/altenerg
• ‘The origin of the wind’ — Teacher’s resource. www.originenergy.com.au
• Funsite Sunsite — an introduction to solar energy. www.eeexchange.org/solar
AIRWATCH PAGE 135
03 9695 2722 03 9695 2780
How sustainable and energy efficient is your home? There are many ways that older houses can be modified to become more energy efficient, and new houses can be built to include energy-efficient design and appliances.
EMbOdIEd ENERGyEmbodied energy is a large contributor to Australia’s greenhouse gas emissions. The energy that is consumed by all the processes used to build a home is called the ‘embodied energy’.
• Follow Activity 6.1 from the Australian Greenhouse Calculator (Reference section: Activities & Resources) to investigate the embodied energy in your home.
dESIGNING A GREENHOuSE NEuTRAl HOuSE• Follow Activity 7.2, ‘Drawing a greenhouse
neutral house’, from the Australian Greenhouse Calculator.
The Australian Greenhouse Office booklet Your home design guide will provide information on energy-efficient home design www.greenhouse.gov.au/yourhome
WHAT IS A ‘FIVE STAR’ ENERGy-EFFICIENT HOuSE?All new houses built in Victoria must have a 5-star energy efficiency rating. The average energy efficiency rating of houses in Victoria is currently only two stars. Investigate what this means by
looking at the following website:
www.5starhouse.vic.gov.au
Q: What are the benefits of having a 5-star energy-efficient house?
Q: What do house designers and builders have to consider when building a 5-star energy-efficient house?
Q: How energy efficient is your house?
Energy-efficient house design 9.5
EddIE’S ExTRAS: Design a ‘five star’ energy-efficient house.
Include drawings of your house. Label your ‘energy-efficient’ features with a brief explanation.
PAGE 136 AIRWATCH
EddIE’S ExTRAS
ACTIVITy – CAlCulATING yOuR ECOlOGICAl FOOTPRINTGo to the Ecological Footprint pages on the EPA Victoria website:
www.epa.vic.gov.au/ecologicalfootprint
1. What is an Ecological Footprint? (Look in the About section.)
2. Scroll down to the calculators. There are two calculators for householders — the ‘Personal’ calculator and the ‘Home’ calculator. The Personal calculator is a short quiz which estimates how much productive land and water you need to support what you use and what you discard. Follow the instructions for the Personal calculator.
3. How many Earths would be needed if everyone lived like you?
4. How does your Personal result compare to this?
5. How many global hectares are required to sustain your lifestyle?
6. Which area of your lifestyle requires the greatest global hectares?
7. Cut out a ‘footprint’ shape to represent your global hectare impact.
Use the following scale when creating your footprint: 1 global hectare = 5cm
For example, an Ecological Footprint of 7 global hectares would be 7 x 5cm = 35cm
Decorate your footprint with a collage of images of the resources you use and consume that make up your footprint (use images from magazines and newspapers).
8. Display your class’s footprints around the room, and compare your footprint with other students’.
9. Find out how your Ecological Footprint can be reduced. Go to ‘Change my answers’ in the calculator and change some of your answers. Which areas of your footprint have the biggest impact on your footprint size?
10. Find out the Ecological Footprint (per capita) of other countries (developed and under-developed) using the internet
Eddie’s extension1. Calculate your Household Ecological Footprint in more detail using the Home calculator.
2. You can also calculate your school’s Ecological Footprint using the School calculator.
International studies have shown that if everyone else in the world consumed resources and energy and produced wastes the way Victorians currently do we would need at least three earths to support such behaviours.
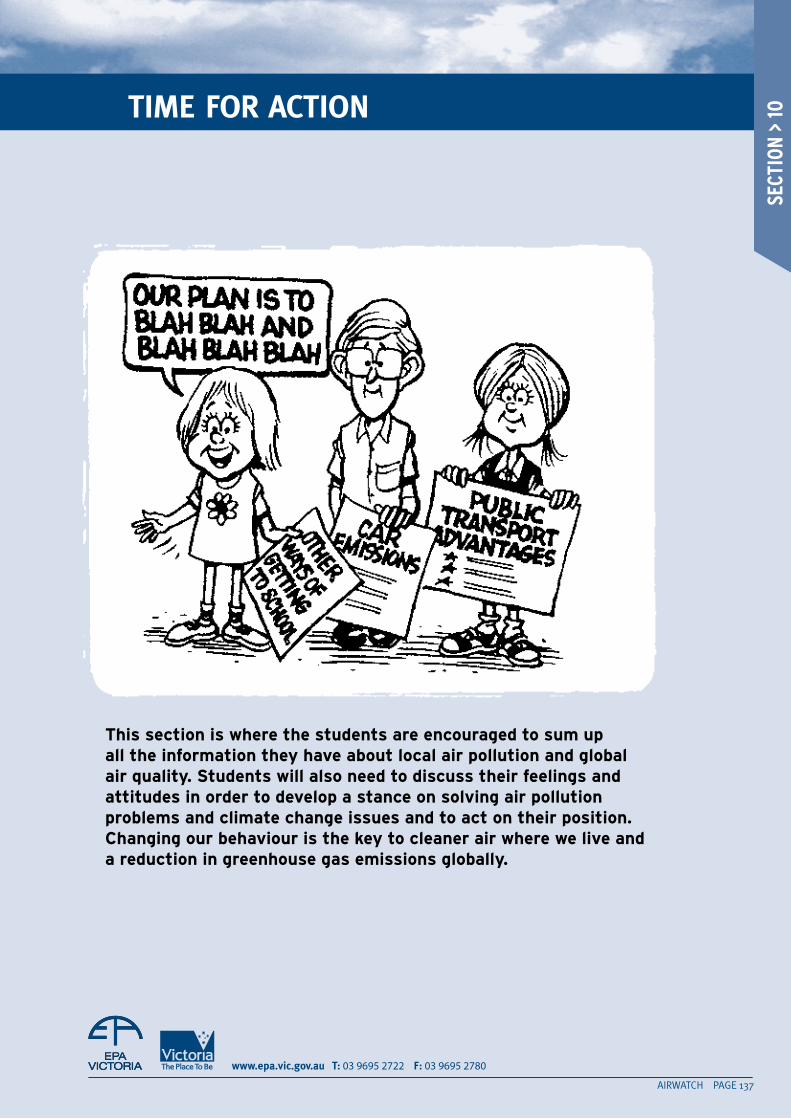
03 9695 2722 03 9695 2780
TIME FOR ACTION
this section is where the students are encouraged to sum up all the information they have about local air pollution and global air quality. students will also need to discuss their feelings and attitudes in order to develop a stance on solving air pollution problems and climate change issues and to act on their position. Changing our behaviour is the key to cleaner air where we live and a reduction in greenhouse gas emissions globally.
AIRWATCH PAGE 13�
SECT
ION
> 10

PAGE 138 AIRWATCH
Time for action
10.1 Community survey
Just how much do the people know about the air quality in their city? Does everyone know about the smog problem in summer? Do they know that some of their activities, such as using their car, contribute to this problem? Have they ever heard of winter smog and, if they have, do they know what causes it or how serious it can be to our health? Do people understand that many of their daily activities contribute to global warming?
Sometimes, it is valuable to collect information about what people know to help you understand why we have problems such as local air pollution and global warming. It may also help us to plan a strategy to make people more aware and willing to help solve the problem.
Below is a survey to collect this sort of information. Obviously, a survey must be designed to help you find out what you want to know. If this survey does not do this, design your own.
You will need a reasonable sample number if your results are to be useful. If there are 30 students in the class, each student would need to do about 10 surveys and then the results for the class collated and interpreted.
The results may give you some ideas about how you can make people more aware about air pollution in your state.
survey Yes no Don’t know
1. This city has an air pollution problem.
2. Photochemical smog mainly occurs in summer.
3. Photochemical smog is mainly caused by emissions from cars.
4. Photochemical smog causes lung damage, eye irritation, damage to buildings and monuments.
5. Winter smog is caused by particles in the air.
6. Particles in the air are dangerous to your health.
7. Winter smog occurs mainly in winter.
8. A major cause of winter smog is particles from slow combustion wood heaters.
9. Winter smog causes respiratory problems.
10. Driving a car, using energy in the home and disposing of waste to landfill all generate greenhouse gases.
11. We can reduce greenhouse gas emissions if we use less energy.
12. Car use in cities should be limited.
13. People should be taxed more to clean up our air.
14. Would you be willing to limit how much you use your car?
15. Its up to governments and industry to worry about greenhouse issues as they produce the majority of greenhouse gases.
16. Would you be willing to reduce how much energy you use in your home? a. If it helped to reduce greenhouse emissions. b. Only if it saved money. c. Even if it cost me more.
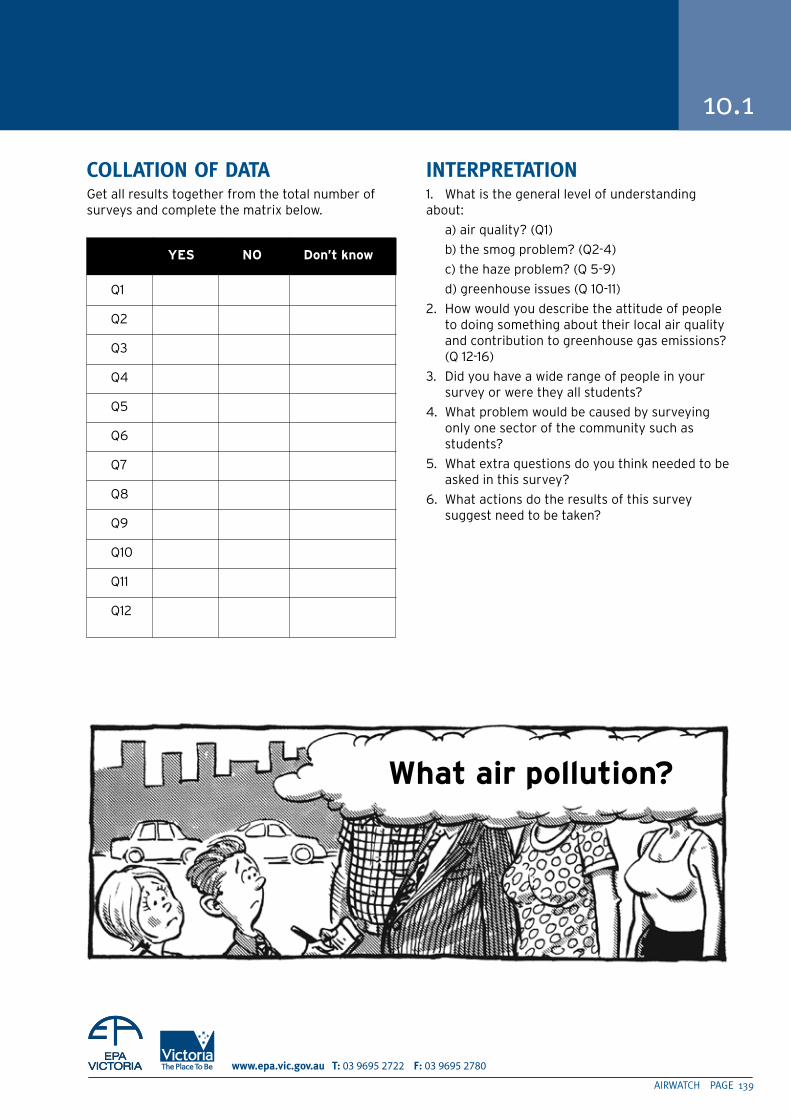
AIRWATCH PAGE 139
03 9695 2722 03 9695 2780
10.1
COllATION OF dATAGet all results together from the total number of surveys and complete the matrix below.
INTERPRETATION1. What is the general level of understanding about:
a) air quality? (Q1)
b) the smog problem? (Q2-4)
c) the haze problem? (Q 5-9)
d) greenhouse issues (Q 10-11)
2. How would you describe the attitude of people to doing something about their local air quality and contribution to greenhouse gas emissions? (Q 12-16)
3. Did you have a wide range of people in your survey or were they all students?
4. What problem would be caused by surveying only one sector of the community such as students?
5. What extra questions do you think needed to be asked in this survey?
6. What actions do the results of this survey suggest need to be taken?
what air pollution?
Yes no Don’t know
Q1
Q2
Q3
Q4
Q5
Q6
Q7
Q8
Q9
Q10
Q11
Q12
PAGE 140 AIRWATCH
Time for action
10.2 Check it out
What has the air quality in your region been like lately? Not sure? Well, it’s time to do a bit of investigating!
Air quality reporting differs from state to state in Australia, so your first task is to check your newspapers and Internet sites to find where weather and air pollution information is reported. When you have, start collecting this information for the following activity.
ACTIVITy1. Collect as many air quality and weather reports for the last month as you can.
2. Draw up a class data sheet as shown below.
INTERPRETATION1. Describe the changes in air quality in your region for the last month.
2. Discuss what factors may have been causing any noticeable changes.
3. Are there any patterns or trends?
4. Does weather seem to have any effect on the level of pollutants?
EddIE’S ExTRAS Collect newspaper articles that are about climate change issues over a number of weeks
or months.
• Summarise the main points in each article you collect
• Do you think Australian citizens are well informed about climate change issues?
Date Max. temp. (°C) Min. temp. (°C) rainfall (mm) winds Pollution info
AIRWATCH PAGE 141
03 9695 2722 03 9695 2780
What can I do? 10.3
Well you’ve learnt a lot about air pollution and global air quality - but are you going to anything about it?
ACTIVITyWhat to do is always a problem. The following activity uses focus groups to decide what your class would like to do to help improve local air quality and greenhouse gas emissions.
Split into groups of 4—6 students.
Exercise 1 Write down as many words that you can which show how you feel when the air is
i) clean and clear ii) polluted.
Each person in the group is to give their lists and explain their feelings.
Exercise 2 As a group brainstorm what could be done to help reduce local air pollution and greenhouse gas emissions. Decide which actions reduce local air pollution, greenhouse gases or both.
• Write these on a piece of butcher’s paper.
Exercise 3 A representative from each group presents these solutions to the class.
Exercise 4 Each group reforms and discusses all the solutions which have been presented and selects those
which the students could actually become involved in.
• Write these on butcher’s paper.
• Add any extras not mentioned on the bottom.
• Put a star next to the two actions you think would be the best for your class to undertake.
Well you’ve learnt a lot about air pollution and global air quality - but are you going to anything about it?
You will have learnt that a lot of the problems with our air are caused by the way we live, how much energy we use, the way we use our cars and our wood heaters. Here is your chance to take some small action that will help improve your local air quality and reduce your greenhouse gas emissions.
EquIPMENTButcher’s paper Coloured dots (sticky)
Blue tac Textas
i’ll ride to school two days
each week
what are you going to do?
PAGE 142 AIRWATCH
Time for action
10.3
Exercise 5 Each group posts their lists around the room and discusses them, focussing on the two preferred
actions for each group.
Exercise 6 • List on the board the two preferred actions from each group.
• The class now has to vote for two to be undertaken by the whole class. To do this give each student 3 sticky coloured dots. They can use these to pick their most preferred options, one dot against three different items or three dots against one item.
Exercise 7 The two actions with the most dots are the ones the students have voted to undertake.
Discuss how these could be implemented and ask students to draw up plans to get these actions started.
I think the whole school should have a ‘walk
to school week’
AIRWATCH PAGE 143
03 9695 2722 03 9695 2780
One practical way your class, even your whole school, could help the environment is to develop an alternative travel day to and from school or a Green Transport Plan.
A Green Transport Plan looks at the ways people get to work or school and then tries to plan ways they can make those trips using ‘greener’ modes of travel, that is walking, cycling, public transport or carpooling.
In order to implement a Green Transport Plan, you will need to work together to determine how students are currently getting to school, what alternative transport modes are available, how you propose to implement the plan and how you will assess the success of the plan.
The following activity will help you to structure and implement your Green Transport Plan.
Be keen, go green! 10.4
Student name Mode of Transport to school Reason for using this mode of transport to school
Summarise this information as a class and determine the numbers of students using the different transport modes.
Step 2As a class, determine what the different transport options are for students to use to get to and from school.
Step 3Discuss what barriers exist for students not using alternative modes of transport.
Step 4Writing your Green Transport Plan
When writing your plan, you may have to consider the following:
• walking or cycling paths
• bus/train timetables and maps
• an appropriate day to implement your plan across the class or the whole school
• who you will need to contact to implement the plan (the Principal, parents, etc.)
• how you will let other students, teachers and parents know about the plan
• a way of assessing if the plan worked in your school and what improvements could be made
• who will undertake which jobs that are in your plan.
ACTIVITyStep 1In groups of 5—6, create a table like the one below, which summarises each member’s transport mode to and from school.
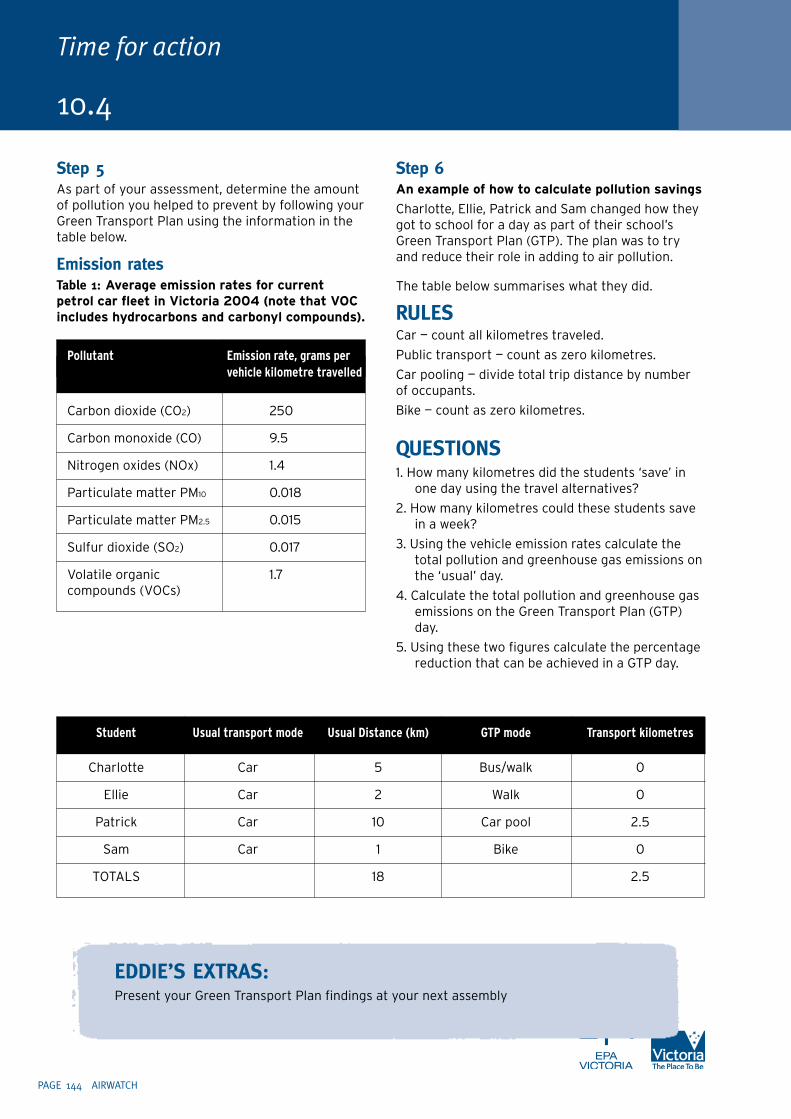
PAGE 144 AIRWATCH
Time for action
Step 5As part of your assessment, determine the amount of pollution you helped to prevent by following your Green Transport Plan using the information in the table below.
Emission ratesTable 1: average emission rates for current petrol car fleet in Victoria 2004 (note that VoC includes hydrocarbons and carbonyl compounds).
Step 6an example of how to calculate pollution savings
Charlotte, Ellie, Patrick and Sam changed how they got to school for a day as part of their school’s Green Transport Plan (GTP). The plan was to try and reduce their role in adding to air pollution.
The table below summarises what they did.
RulESCar — count all kilometres traveled.
Public transport — count as zero kilometres.
Car pooling — divide total trip distance by number of occupants.
Bike — count as zero kilometres.
quESTIONS1. How many kilometres did the students ‘save’ in
one day using the travel alternatives?
2. How many kilometres could these students save in a week?
3. Using the vehicle emission rates calculate the total pollution and greenhouse gas emissions on the ‘usual’ day.
4. Calculate the total pollution and greenhouse gas emissions on the Green Transport Plan (GTP) day.
5. Using these two figures calculate the percentage reduction that can be achieved in a GTP day.
10.4
Student Usual transport mode Usual Distance (km) GTP mode Transport kilometres
Charlotte Car 5 Bus/walk 0
Ellie Car 2 Walk 0
Patrick Car 10 Car pool 2.5
Sam Car 1 Bike 0
TOTALS 18 2.5
Pollutant Emission rate, grams per vehicle kilometre travelled
Carbon dioxide (CO2) 250
Carbon monoxide (CO) 9.5
Nitrogen oxides (NOx) 1.4
Particulate matter PM10 0.018
Particulate matter PM2.5 0.015
Sulfur dioxide (SO2) 0.017
Volatile organic 1.7 compounds (VOCs)
EddIE’S ExTRAS: Present your Green Transport Plan findings at your next assembly
03 9695 2722 03 9695 2780
TEACHER RESOuRCES ANd EVAluATION
in the following section you will find a sample program for using the airwatch resources. this may help you in planning a teaching program that includes sustainability tools or may act as a guide to follow first time through until you have tested out the materials and activities in this course.
included are some test items which may help save you time if you wish to use airwatch resources for your assessment program.
AIRWATCH PAGE 145
SECT
ION
> 11

PAGE 146 AIRWATCH
Teacher resources and evaluation
11.1 Sample program
ObjECTIVES
By the end of this topic students should be able to:
1. describe the following air pollutants — particulates, carbon monoxide, nitrogen dioxide, ozone, sulfur dioxide, volatile organic compounds, asbestos, lead
2. explain how the above pollutants can be released into the air
3. describe the health effects of the above pollutants
4. describe the main causes of air pollution
5. explain how air pollution may be affected by climatic, weather and topographical conditions
6. describe land and sea breezes and how they affect air pollution
7. describe katabatic winds and how they may affect air pollution
8. describe and perform a variety of tests that can be carried out to assess the quality of air in a particular location
9. monitor wind speed and direction, temperature, air pressure and rainfall and relate measurements to air quality measurements
10. obtain air pollution and weather reports from various sources
11. consider the sources of indoor pollution and their implications for our health
12. Compare air quality standards in different states/countries
13. describe the effect of vehicles, smoking, pollen and woodstoves on air pollution and their associated health implications
14. describe this city’s winter smog and summer smog problems
15. describe the following greenhouse gases — carbon dioxide, methane, nitrous oxide
16. explain the difference between tropospheric ozone and stratospheric ozone
17. explain which greenhouse gases are human made
18. describe the greenhouse effect
19. describe the enhanced greenhouse effect and its role in global warming
20. describe the role that we, as part of a community, should play in maintaining good air quality and reducing greenhouse gas emissions.
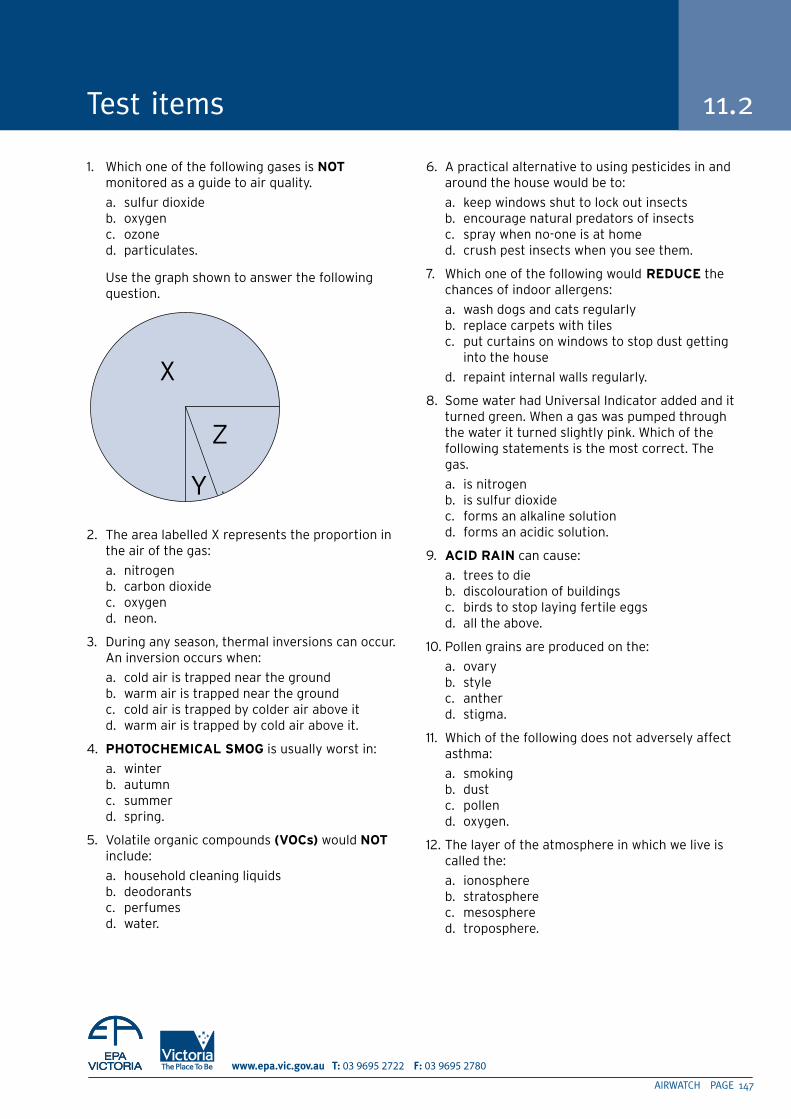
AIRWATCH PAGE 14�
03 9695 2722 03 9695 2780
Test items 11.2
1. Which one of the following gases is not monitored as a guide to air quality.
a. sulfur dioxide b. oxygen c. ozone d. particulates.
Use the graph shown to answer the following question.
2. The area labelled X represents the proportion in the air of the gas:
a. nitrogen b. carbon dioxide c. oxygen d. neon.
3. During any season, thermal inversions can occur. An inversion occurs when:
a. cold air is trapped near the ground b. warm air is trapped near the ground c. cold air is trapped by colder air above it d. warm air is trapped by cold air above it.
4. PhotoCheMiCal sMoG is usually worst in:
a. winter b. autumn c. summer d. spring.
5. Volatile organic compounds (VoCs) would not include:
a. household cleaning liquids b. deodorants c. perfumes d. water.
6. A practical alternative to using pesticides in and around the house would be to:
a. keep windows shut to lock out insects b. encourage natural predators of insects c. spray when no-one is at home d. crush pest insects when you see them.
7. Which one of the following would reDuCe the chances of indoor allergens:
a. wash dogs and cats regularly b. replace carpets with tiles c. put curtains on windows to stop dust getting
into the house
d. repaint internal walls regularly.
8. Some water had Universal Indicator added and it turned green. When a gas was pumped through the water it turned slightly pink. Which of the following statements is the most correct. The gas.
a. is nitrogen b. is sulfur dioxide c. forms an alkaline solution d. forms an acidic solution.
9. aCiD rain can cause:
a. trees to die b. discolouration of buildings c. birds to stop laying fertile eggs d. all the above.
10. Pollen grains are produced on the:
a. ovary b. style c. anther d. stigma.
11. Which of the following does not adversely affect asthma:
a. smoking b. dust c. pollen d. oxygen.
12. The layer of the atmosphere in which we live is called the:
a. ionosphere b. stratosphere c. mesosphere d. troposphere.
X
Y
Z
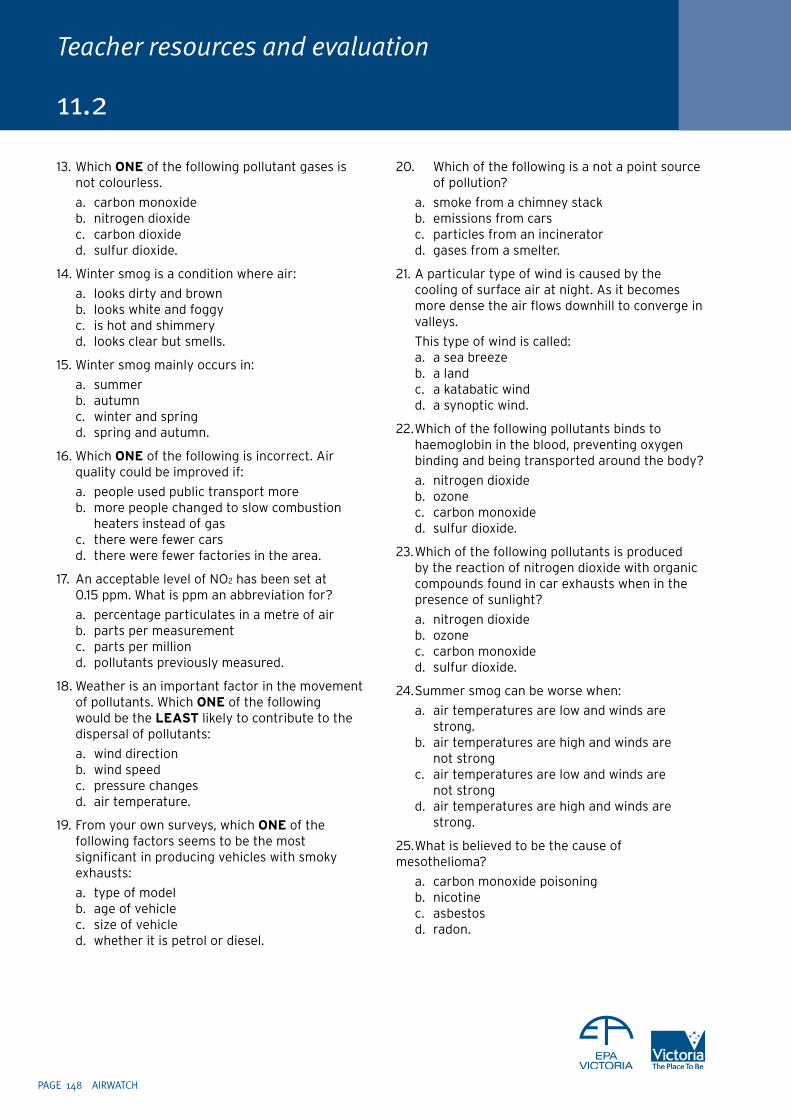
PAGE 148 AIRWATCH
11.2
Teacher resources and evaluation
13. Which one of the following pollutant gases is not colourless.
a. carbon monoxide b. nitrogen dioxide c. carbon dioxide d. sulfur dioxide.
14. Winter smog is a condition where air:
a. looks dirty and brown b. looks white and foggy c. is hot and shimmery d. looks clear but smells.
15. Winter smog mainly occurs in:
a. summer b. autumn c. winter and spring d. spring and autumn.
16. Which one of the following is incorrect. Air quality could be improved if:
a. people used public transport more b. more people changed to slow combustion heaters instead of gas c. there were fewer cars d. there were fewer factories in the area.
17. An acceptable level of NO2 has been set at 0.15 ppm. What is ppm an abbreviation for?
a. percentage particulates in a metre of air b. parts per measurement c. parts per million d. pollutants previously measured.
18. Weather is an important factor in the movement of pollutants. Which one of the following would be the least likely to contribute to the dispersal of pollutants:
a. wind direction b. wind speed c. pressure changes d. air temperature.
19. From your own surveys, which one of the following factors seems to be the most significant in producing vehicles with smoky exhausts:
a. type of model b. age of vehicle c. size of vehicle d. whether it is petrol or diesel.
20. Which of the following is a not a point source of pollution?
a. smoke from a chimney stack b. emissions from cars c. particles from an incinerator d. gases from a smelter.
21. A particular type of wind is caused by the cooling of surface air at night. As it becomes more dense the air flows downhill to converge in valleys.
This type of wind is called: a. a sea breeze b. a land c. a katabatic wind d. a synoptic wind.
22. Which of the following pollutants binds to haemoglobin in the blood, preventing oxygen binding and being transported around the body?
a. nitrogen dioxide b. ozone c. carbon monoxide d. sulfur dioxide.
23. Which of the following pollutants is produced by the reaction of nitrogen dioxide with organic compounds found in car exhausts when in the presence of sunlight?
a. nitrogen dioxide b. ozone c. carbon monoxide d. sulfur dioxide.
24. Summer smog can be worse when:
a. air temperatures are low and winds are strong. b. air temperatures are high and winds are not strong c. air temperatures are low and winds are not strong d. air temperatures are high and winds are strong.
25. What is believed to be the cause of mesothelioma?
a. carbon monoxide poisoning b. nicotine c. asbestos d. radon.

AIRWATCH PAGE 149
03 9695 2722 03 9695 2780
11.2
26. Which of the following is not a gas usually given off in woodsmoke:
a. formaldehyde b. nitrogen oxides c. dioxins d. ozone.
27. Which of the following statements about winter smog is not correct?
a. winter smog is the result of fine particulates floating in the air
b. winter smog can cause runny noses and coughing, bronchitis, asthma attacks and even death c. winter smog is generally a summer problem
d. winter smog usually appears in the early morning and disappears by midday.
28. Which of the following does not significantly contribute to winter smog:
a. the slow combustion heater b. the farmer c. the smoker d. the motorist.
29. Which of the following activities will help reduce winter smog?
a. using wet, green or treated wood for wood heaters b. using backyard burning to get rid of rubbish instead of composting c. burning rubbish on calm, clear nights d. keeping the family car well tuned.
30. Which of the following statements about summer smog is INCORRECT?
a. summer smog forms when pollutants such as nitrogen oxides and organic compounds react together in the presence of sunlight. b. nitrogen oxides and organic compounds react together in the presence of sunlight to form ozone. c. summer smog occurs during the cooler months because of the lesser intensity and length of sunlight. d. the gases which help form summer smog come from burning of fossil fuels in cars, power plants and factories.
31. How can we identify summer smog?
a. by looking for a brown haze on the horizon b. by measuring nitrogen dioxide levels in the stratosphere c. by measuring ozone d. by carrying out a calculation involving wind speed, temperature and VAQ.
32. In the bronchioles, how are small particles expelled?
a. by large hairs trapping the particles and moving the particles out of the nose b. by the body absorbing the particles into the bloodstream c. by mucus trapping the particles and cilia moving the particles up towards the mouth d. by embedding the particles into the alveoli.
33. Which of the following is not a greenhouse gas?
a. carbon dioxide b. methane c. ozone d. nitrous oxides.
34. Which statement is correct?
a. Greenhouse gases naturally occur in the atmosphere. b. Greenhouse gases can be human made. c. Greenhouse gases trap heat from the sun in the atmosphere. d. Greenhouse gases contribute to global warming. e. All of the above.
35. Which actions Do not generate air pollution and greenhouse gases?
a. driving a motor vehicle b. heating water through a solar hot water system c. using electricity in the home, at school and at work d. manufacturing aluminium and cement e. walking or riding a bike to school.
36. Which statements are correct about ozone?
a. Ozone is a greenhouse gas in the troposphere. b. Ozone in the stratosphere is naturally occurring, protects us from harmful UV radiation and can be destroyed by CFCs and halons. c. Ozone is the main component of summer smog. d. Tropospheric ozone forms when motor vehicle exhaust and oxygen react under strong sunlight and high temperatures. e. Ozone is a heat-trapping gas in the troposhere.
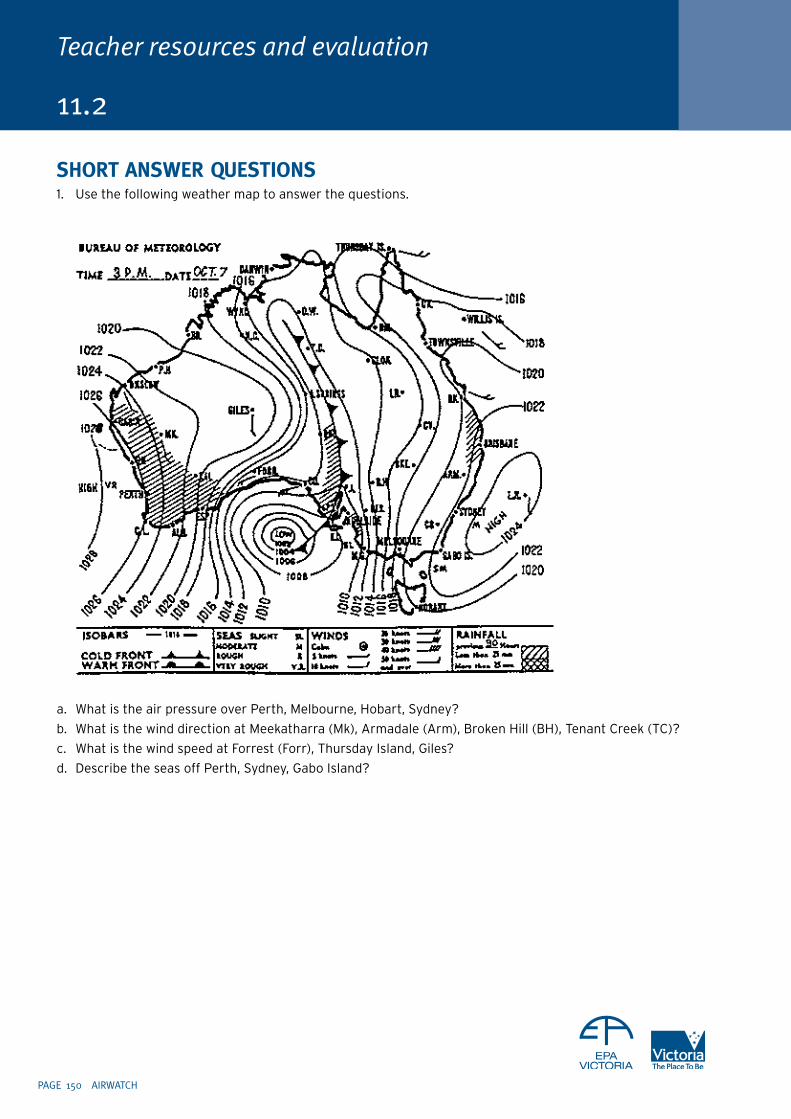
PAGE 150 AIRWATCH
11.2
SHORT ANSWER quESTIONS1. Use the following weather map to answer the questions.
a. What is the air pressure over Perth, Melbourne, Hobart, Sydney?
b. What is the wind direction at Meekatharra (Mk), Armadale (Arm), Broken Hill (BH), Tenant Creek (TC)?
c. What is the wind speed at Forrest (Forr), Thursday Island, Giles?
d. Describe the seas off Perth, Sydney, Gabo Island?
Teacher resources and evaluation
AIRWATCH PAGE 151
03 9695 2722 03 9695 2780
11.2
2. Complete the following table.
3. With the aid of a diagram, explain how a sea breeze forms.
4. Explain the difference between:
a. point sources b. diffuse sources.
5. Choose anY two of the following topics and write a short paragraph about each.
a. Summer smog. What is it, how does it form, what are its effects on human?
b. How can a city improve its air quality?
c. Winter smog. What is it, how does it form, what are its effects on humans?
d. How to improve the design of houses for better energy efficiency.
6. Pick one of the following topics and describe an experiment that could be conducted to measure its significance in the study of air pollution.
a. How winds change at higher altitudes. b. Particulates in the air. c. Visual air quality.
7. Describe two effects of sulfur dioxide on our health.
8. Describe three indoor pollutants and their potential effects on our health.
9. Why is air pollution strongly dependent on wind or heavy rain?
10. Why is the smoke from a car considered to be harmful?
11. Why are particles bigger than PM10 not such a problem as smaller ones?
12. Write a paragraph or draw a diagram to explain the following:
a. the greenhouse effect b. the enhanced greenhouse effect c. global warming and climate change
13. What are five renewable energy sources?
14. Why are renewable energy sources important for our future?
Pollutant source health effects
Decreases ability to Dissolves in blood easily. Less oxygen is carried. exercise.
Produced from fossil fuels containing sulfur
Particulates
PAGE 152 AIRWATCH
APPENdIx 11. Preparing the filter papers
Make sure you wear protective clothing, gloves and eyewear
Making the soaking solution
You need:
• NaOH 0.44 g
• Na1 3.95 g
• methanol 50 ml
• HPLC grade water: HPLC grade water is double deionised and double distilled water
1. All equipment must be cleaned carefully with HPLC water.
2. Weigh NaOH (~ 4 pellets) into a glass flask or dish.
3. Dissolve NaOH in 5ml or less HPLC water.
4. Put the flask on a balance and zero it, then add the NaI.
5. Add methanol. If it goes cloudy, add a little more water.
Coating the FilterRepeat the following procedure for several filters. They can be stored as long as they are individually sealed.
1. Put the filters into the soaking solution. Make sure they are completely soaked.
2. Dry the filters in a nitrogen-free atmosphere, in a desiccator or by using a hairdryer in a room free of smoke or gas heating.
3. Using tweezers, place each filter in a plastic envelope and heat seal or place in a small plastic bag which has a press seal.
4. The filters are now ready to load straight into the holder at the sampling site.
Re-use the plastic envelope to transport the filter back to the laboratory. Exposed filters, if kept sealed and cool, can be stored for weeks to months.
2. Making the reagent solutionThis solution reacts with the NO2 you have collected to form a pink colour. This pink colour can be compared to known amounts in the standard solutions or to the pink photograghic strip. Note that this reagent can only be stored (in a fridge) for about five days.
You need:
• sulfanilamide 2.00 g
• N- 1-naphthylethylenediamine- dihydrochloride (NEDA) 0.05 g
• H3PO4 (conc). 2.00 ml
• HPLC water
1. Weigh 0.05 g NEDA onto a glass dish. Zero balance.
2. Weigh 2 g sulfanilamide onto NEDA.
3. Carefully pour the powders into a 250ml volumetric flask. Wash any remaining powders into the flask with HPLC water.
4. Two-thirds fill the flask with HPLC water.
5. In a fume cupboard very carefully pipette the H3PO4 (it is highly corrosive!).
6. Put the stopper on the flask and shake the reagent vigorously until the solids have dissolved.
7. Label and date the reagent.
Teacher resources and evaluation
11.3 Appendix 1: NO2
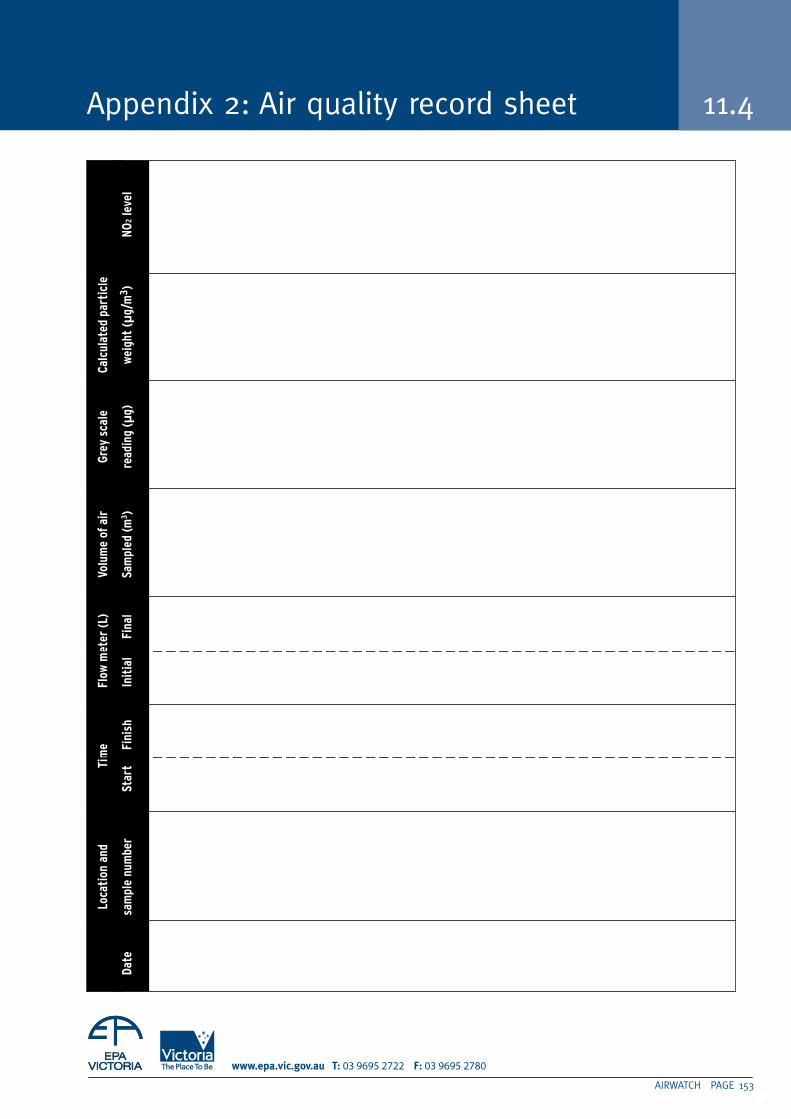
AIRWATCH PAGE 153
03 9695 2722 03 9695 2780
Appendix 2: Air quality record sheet 11.4
Lo
cati
on a
nd
Tim
e Fl
ow m
eter
(L)
Vo
lum
e of
air
Gr
ey s
cale
Ca
lcul
ated
par
ticl
e
Da
te
sam
ple
num
ber
Star
t
Fin
ish
Init
ial
F
inal
Sa
mpl
ed (m
3 ) re
adin
g (µ
g)
wei
ght
(µg/
m3 )
NO
2 lev
el
PAGE 154 AIRWATCH
Teacher resources and evaluation
Summer smog (photochemical smog)Summer smog, which is often invisible to the naked eye, is characterised by high concentrations of ground level ozone. This tends to happen in late spring, during summer and early in autumn when there is lots of sunlight and high temperatures.
Motor vehicles are the major contributor to smog. Industry and other sources also make significant contributions.
Ozone affects the healthy and fit as well as the susceptible members of the population such as the elderly, the young and those with respiratory problems.
The effects of ozone include eye, nose and throat irritations, damage to our respiratory tracts, chest tightness and wheezing. There is also evidence that ozone can increase our sensitivity to allergens, trigger asthma attacks and increase our susceptibility to infection.
Ozone can also damage plants and reduce their ability to photosynthesise as well as damage materials such as plastics, rubber, concrete, stone, cloth, dyes and paintwork.
Winter smog (haze)Winter Smog (haze) occurs when many tiny particles from wood smoke and vehicles make our skies look brown. Winter smog occurs mostly on cold, calm mornings.
The largest source of winter smog forming particles in winter is smoke from domestic wood heaters. In autumn and spring particles come from burning off. Exhaust fumes, especially from diesel engines, also contribute to winter smog.
Winter smog is worst when there is a temperature inversion which occurs on cool, calm nights when the ground and the air near the ground cool down. As it cools the air becomes heavier and will not mix with the warmer air above, so the particles are trapped close to the ground where people can easily breathe them in.
When we breathe in particles, the larger ones are trapped by the fine hairs inside our noses and windpipes. We get rid of these when we blow our noses or cough. However, the smaller particles can travel deep into our lungs and have serious impacts on our health.
Fine particles are known to make bronchitis, emphysema and asthma worse. There is also evidence that they cause premature deaths. The main group at risk are elderly people who have chronic respiratory problems. We should also be aware that particles may contain chemicals which can damage our lungs, or even worse, cause cancer.
When particles settle they add a fine film of “dirt” to the natural and physical environment.
Carbon monoxideCarbon monoxide which is colourless, odourless and very toxic, comes from incomplete burning, industrial processes and biological decay.
Motor vehicles contribute 80 per cent of the carbon monoxide, other sources contribute 18 per cent while industry accounts for only two per cent. Other sources include our homes, gardens, schools, shops and service stations.
One of the most significant individual sources of carbon monoxide is cigarette smoke. Scientific research indicates that smokers, and passive smokers (people who breathe air that contains smoke), are exposed to four times more carbon monoxide than people in a smoke free environment.
Low levels of carbon monoxide can reduce our ability to carry out exercise. Greater levels reduce our ability to concentrate and cause headaches. Very high levels can be fatal.
The health threat of carbon monoxide is greatest for people who suffer from heart disease with a correlation being shown between carbon monoxide levels and hospital admissions of elderly people with heart failure.
11.5 Appendix 3: Types of air pollution

AIRWATCH PAGE 155
03 9695 2722 03 9695 2780
Oxides of nitrogenThe most common of these are nitric oxide and nitrogen dioxide. These help form photochemical smog and also have significant impacts on health.
The largest man-made source of nitrogen oxides is the combustion of fossil fuels. In many cities, motor vehicles contribute as much as 50 per cent of these emissions, while industry contributes less.
While nitric oxide (NO) is relatively safe, it is converted into nitrogen dioxide in the atmosphere. At certain levels, nitrogen dioxide can affect our respiratory system and increase our susceptibility to infection. This is a real problem for babies, older people or for those people with problems such as bronchitis and asthma. There is evidence that nitrogen dioxide can trigger asthma attacks and long term exposure can irreversibly damage our lungs.
Nitrogen dioxide can also age materials such as paint, metals, rubber, fabric, leather, paper and building materials. It can also react with water to form acid rain.
Air toxicsThere are many of these, most of which come from cars and other sources such as cigarette smoke and fuel vapour.
These have wide ranging effects from reduced consciousness and irritation of the respiratory system to increased levels of cancers.
OdoursOdour causes a great deal of concern for many people. Generally odours are annoying. In rare cases, the compound causing the odour may be poisonous and lead to illness in people.
Most odour complaints are related to industries which deal with animals or animal by-products. Examples include poultry farms, piggeries, cattle feedlots and tanneries.
11.5
PAGE 156 AIRWATCH
Teacher resources and evaluation
11.6 Appendix 4: Measuring winds aloft
SAFETy REGulATIONSThere are strict regulations governing the flying of tethered balloons. It is essential that the following information be adhered to.
1. No balloon can be flown within a 4000-metre radius1 of an aerodrome.
2. Tethered balloons may be flown to a height of 300 feet without a permit.
3. A permit must be obtained to fly a tethered balloon at a height greater than 300 feet.
4. Permits can be obtained from the local Civil Aviation Safety Authority. They are usually located at the aerodrome.
5. The permit takes seven days to obtain, and at the time of writing there is no fee. CASA requires that the following details to be documented on the permit. Seven days notice must be given to the Airways Operations Unit of the following:
(a) the date and time of proposed flight/s
As this experiment can only be carried out in light to moderate winds, it is advisable to nominate two or three possible flight days of 2—3 hour duration each, to allow for days that may not be suitable; e.g., Monday 7/9/05 0900—1200hrs Tuesday 8/9/05 0900—1200hrs Friday 11/9/05 1200—1500hr.
CASA notifies the flight tower to inform any pilots flying in the area (NOTAM — ‘notices to airmen’). If any of the dates booked are not required notify CASA.
(b) location of experimental site
The actual location or area of operation with the street directory map reference or latitude and longitude. Key roads at the location should be noted.
(c) maximum height to which the balloon will be flown; e.g., 1640 feet (500 metres)
6. Other regulations to be observed
The balloon can only be flown in circumstances where the visibility is greater than 5000 metres and the balloon’s distance from cloud is greater than 600 metres horizontally and 500 feet (152 metres) vertically.
1 (Note: CASA refers to vertical height in feet and horizontal distance in metres)

AIRWATCH PAGE 15�
03 9695 2722 03 9695 2780
Appendix 5: Tethered balloon data table 11.7
Length Elevation Azimuth Approximate • Time of reading of tether angle angle height of balloon • Cloud cover (metres) (degrees) (degrees) (metres) • Any weather observations
50 m
100 m
200 m
250 m
300 m
350 m
400 m
450 m
500 m

PAGE 158 AIRWATCH
Teacher resources and evaluation
11.8 Appendix 6: The tethered balloon system
Assemble a shorter tether (<150m) system on a hand held reel or a longer tether (up to 500m) on a garden hose reel. The shorter tether system will allow students to measure winds to a height maximum of 100 metres therefore permission from CASA will not be required. The shorter tether can also be used across a large school oval.
MATERIAlS• 500 m fishing line (10 kg breaking strain) and
one garden hose reel or 150 m fishing line on a handheld plastic fishing reel.
• 2 fishing swivels (size 4).
• 50 cm length (20 mm diameter) PVC pipe.
• 2 x 360° protractors (150 mm diameter).
• Compass.
• Plumb bob.
• 1 x 650 mm red, orange or hot-pink balloon.
• D-size bottle of balloon gas (party gas) with regulator (to be hired) or inflate large balloon at party shop earlier in the day.
• Super glue to assemble simple theodolite.
• Black and red permanent marker.
• String.
• 4 hooked tent pegs and hammer (longer tether system only).
• Quick release double ended snap hook (longer tether system only).
ASSEMblING THE EquIPMENTTethered balloon on a hose reel:Mark a code on the fishing line at 10-metre intervals in permanent ink, to a length of 500 m.
(black mark = 10 m, red mark = 100 m )
For example:
• at 10 m — one black 1 cm length mark on the fishing line
• at 20 m — two black 1 cm marks on the fishing line
• at 30 m — three black 1 cm marks on the fishing line, and so on
• at 100 m — one red 1 cm mark
• at 110 m — one red 1 cm mark and one black 1 cm mark
• at 190 m — one red 1 cm mark and nine black 1 cm marks
• at 200 m — two red 1 cm marks on the fishing line, and so on to 500 m.
1. Tie the fishing line to the hose reel, starting at the 500 m mark. Make sure the fishing line is well secured to the hose reel before winding it on. Bind the knot with electrical tape to prevent it from coming undone.
2. Carefully wind the fishing line onto the hose reel.
3. At the 0 m end of the fishing line attach the fishing swivel. This will be the attachment point for the balloon.
4. Attach a quick release dog catch onto the side of the hose reel. This acts as a lock on the reel to prevent it from turning when taking readings.
Tethered balloon on a hand held fishing reel:• Mark a code on the fishing line at 10-metre
intervals in permanent ink to a length of 150 m. Follow marking instructions as above. Follow steps 1—4.
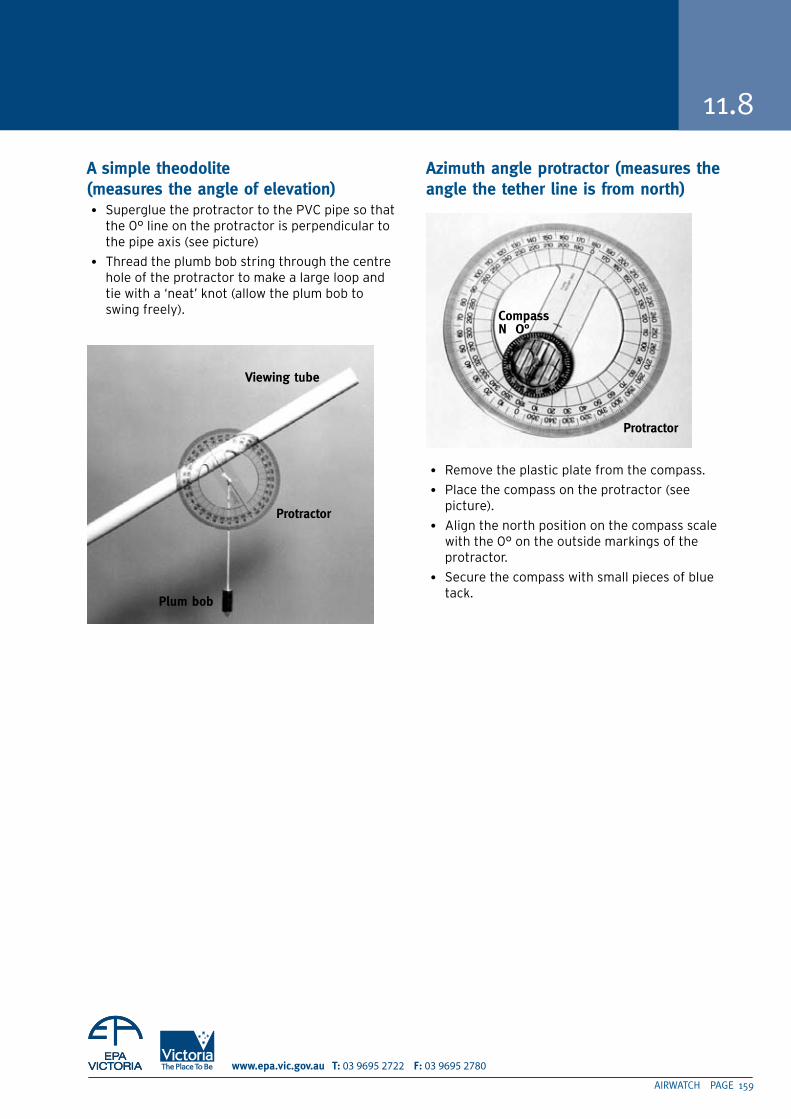
AIRWATCH PAGE 159
03 9695 2722 03 9695 2780
11.8
A simple theodolite (measures the angle of elevation)• Superglue the protractor to the PVC pipe so that
the 0° line on the protractor is perpendicular to the pipe axis (see picture)
• Thread the plumb bob string through the centre hole of the protractor to make a large loop and tie with a ‘neat’ knot (allow the plum bob to swing freely).
Azimuth angle protractor (measures the angle the tether line is from north)
• Remove the plastic plate from the compass.
• Place the compass on the protractor (see picture).
• Align the north position on the compass scale with the 0° on the outside markings of the protractor.
• Secure the compass with small pieces of blue tack.
Viewing tube
Protractor
Plum bob
Protractor
Compass N O°
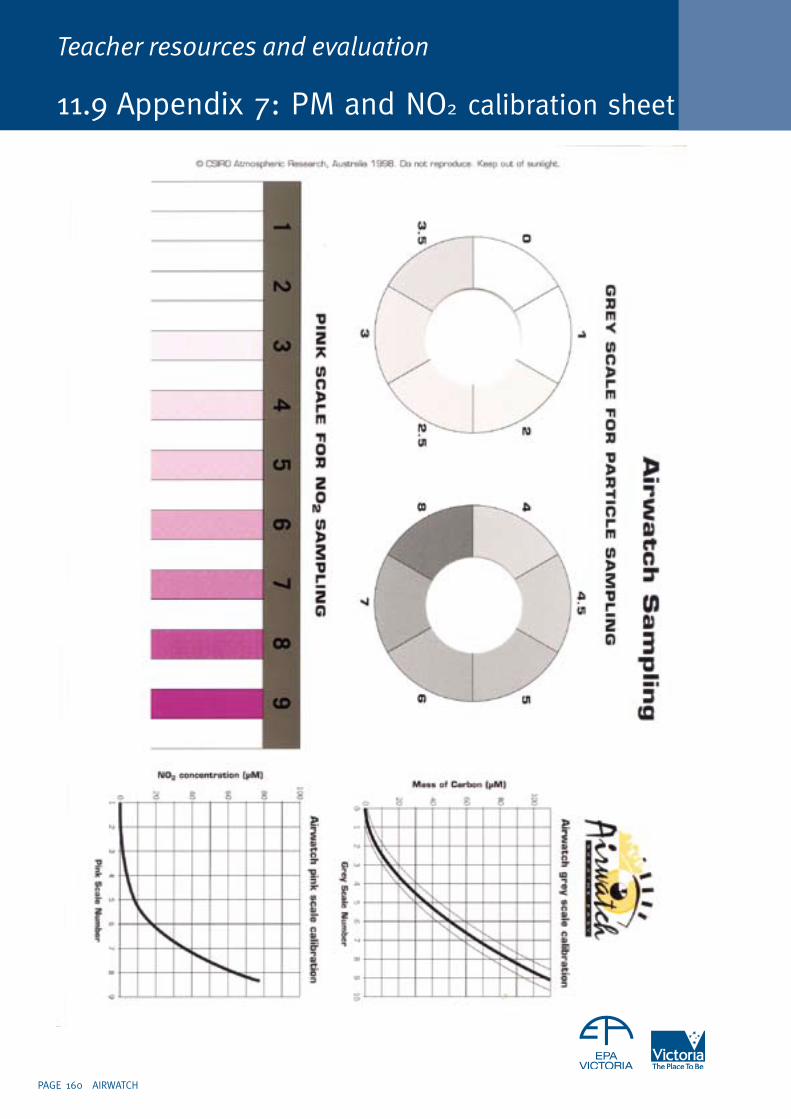
11.9 Appendix 7: PM and NO2 calibration sheet
PAGE 160 AIRWATCH
Teacher resources and evaluation
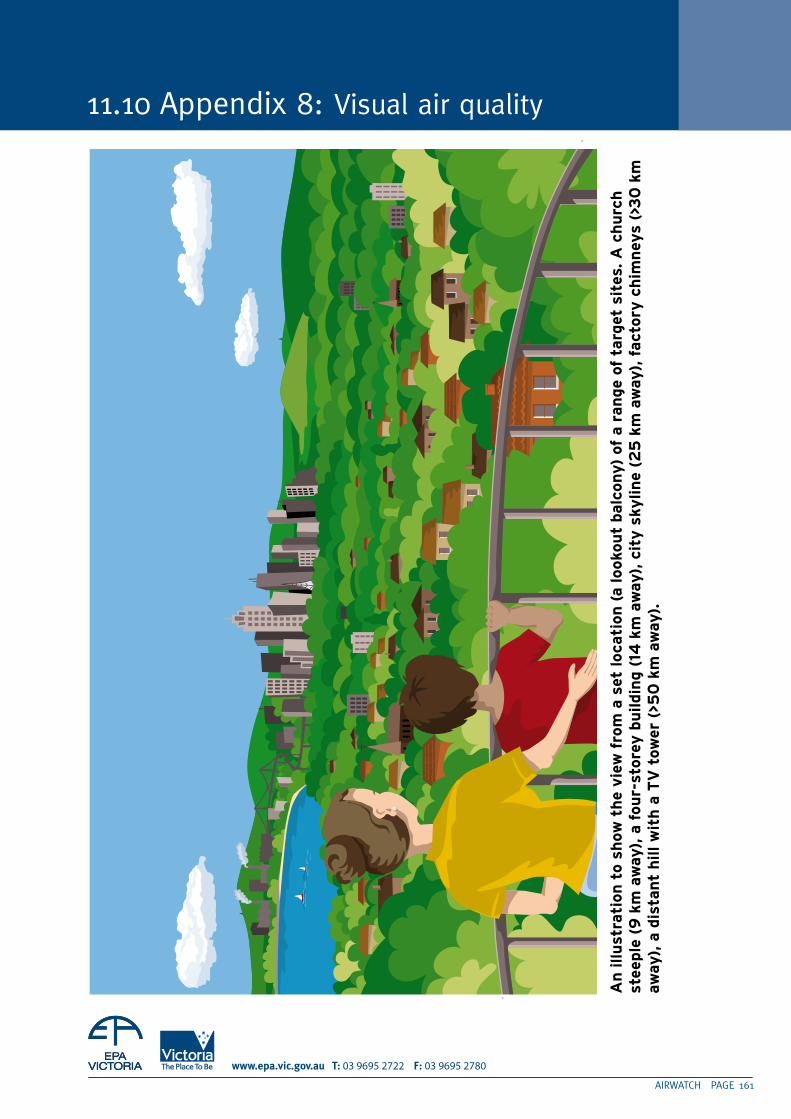
AIRWATCH PAGE 161
11.10 Appendix 8: Visual air quality
03 9695 2722 03 9695 2780
an
illu
stra
tion
to s
how
th
e vie
w f
rom
a s
et loca
tion
(a looko
ut
balc
ony)
of
a r
an
ge
of t
arg
et s
ites
. a
ch
urc
h
stee
ple
(9
km
aw
ay),
a f
ou
r-st
ore
y b
uildin
g (
14 k
m a
way
), c
ity
sky
lin
e (2
5 k
m a
way
), f
act
ory
ch
imn
eys
(>3
0 k
m
away
), a
dis
tant
hill w
ith
a t
V t
ower
(>5
0 k
m a
way
).
PAGE 162 AIRWATCH
air pollution — occurs when the air contains gases, dust, fumes or odour in amounts which are harmful to human health.
air toxics — harmful organic compounds which come from sources such as car exhausts, cigarettes, building materials and cleaning products.
allergens — substances which cause allergic reactions.
Combustion — burning in the presence of oxygen.
Components — parts which make up the whole.
Compound — a substance whose components are chemically combined.
Carbon monoxide (Co) — a poisonous gas formed when incomplete burning occurs.
emissions — the gases discharged into the air from cars, trucks, factories and appliances.
emphysema — a disease of the lungs which makes breathing difficult.
enhanced greenhouse effect — the increasing quantity of carbon dioxide from the burning of fossil fuels together with the release of other gases, is causing an increased greenhouse effect and leading to global warming.
flue — the smoke passage in a chimney.
Global warming — the gradual increase in the overall temperature of the Earth’s atmoshere due to the greenhouse effect.
Greenhouse gas — a gas that contributes to the greenhouse effect by absorbing infrared radiation.
Greenhouse effect — the trapping of the sun’s warmth in the lower atmosphere, due to the greater transparency of the atmosphere to visible radiation from the sun than to infrared radiation emitted from the Eartrh’s surface.
hydrocarbons — compounds made of hydrogen and carbon.
incinerator — furnace for burning.
incomplete combustion — burning where there is insufficient oxygen.
inversion — where a warm layer of air is trapped close to the ground by a more dense cool layer above.
Kindling — wood chopped into small pieces used to start a fire.
Mixture — where two or more substances are mixed but not chemically combined.
Molecule — one or more atoms joined together.
nephelometer — an apparatus used to measure the size and concentration of particles in the air by analysis of light scattered by the particles.
neutralise — to counteract and make ineffective.
nitrogen oxides (nox) — gases which form when fossil fuels are burnt. Some forms, such as nitrogen dioxide, are harmful to human health.
oxygen (o2) — a gas in the air used by humans and animals for respiration.
ozone — the main constituent of smog.
Particulates — solid or liquid particles which float and pollute the air.
Photochemical — chemical reactions which need light for them to happen.
Photosynthesis — a process which uses sunlight to produce an energy source in plants.
renewable energy — a source of energy that is not depleted by use, such as water, wind or solar power.
sink — a body or process which acts to absorb or remove energy or a particular component from a system; e.g., heat sink, CO2 sink.
summer smog — a form of pollution which is characterised by high levels of ozone in the air.
turbulence — air movement which is irregular, indicated by gusts and winds.
winter smog — a form of pollution where tiny particles float in the air, decreasing visibility.
answers to student survey 2.1
Q. 2—T 5—T
3—T 6—T
4—T 8—T
11.11 Glossary
Teacher resources and evaluation