Airline Scheduling Optimization ( Chapter 7 I)
48
CENTER FOR AIR TRANSPORTATION SYSTEMS RESEARCH CENTER FOR AIR TRANSPORTATION SYSTEMS RESEARCH Airline Scheduling Optimization ( Chapter 7 – I) Vivek Kumar (Research Associate, CATSR/GMU) February 28 th , 2011
Transcript of Airline Scheduling Optimization ( Chapter 7 I)

CENTER FOR AIR TRANSPORTATION SYSTEMS RESEARCHCENTER FOR AIR TRANSPORTATION SYSTEMS RESEARCH
Airline Scheduling Optimization
( Chapter 7 – I)
Vivek Kumar
(Research Associate, CATSR/GMU)
February 28th, 2011
2
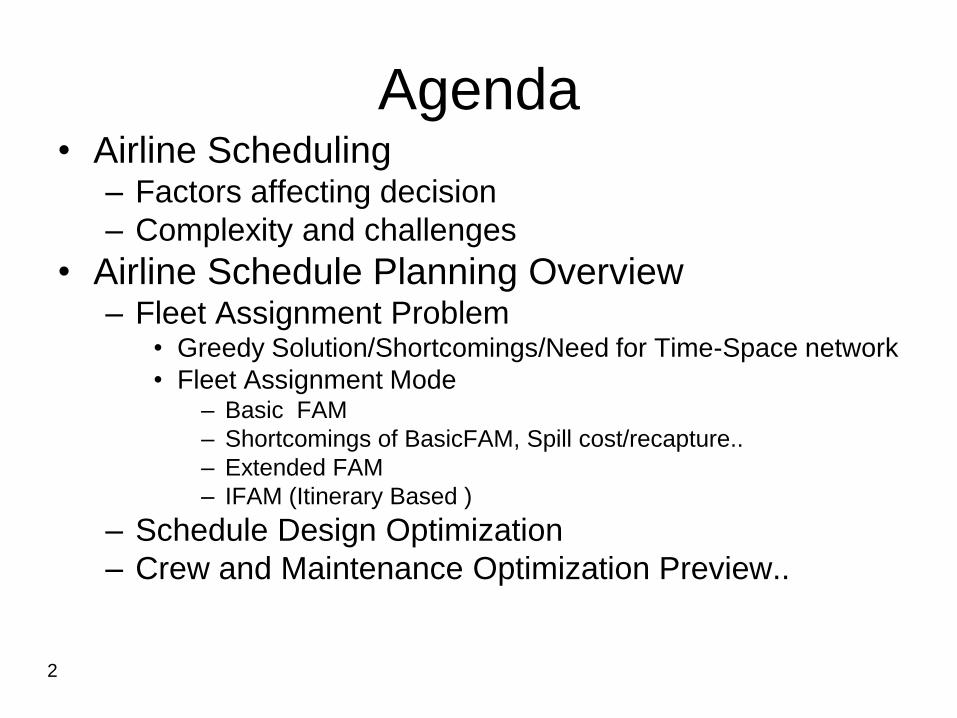
Agenda• Airline Scheduling
– Factors affecting decision
– Complexity and challenges
• Airline Schedule Planning Overview– Fleet Assignment Problem
• Greedy Solution/Shortcomings/Need for Time-Space network
• Fleet Assignment Mode– Basic FAM
– Shortcomings of BasicFAM, Spill cost/recapture..
– Extended FAM
– IFAM (Itinerary Based )
– Schedule Design Optimization
– Crew and Maintenance Optimization Preview..

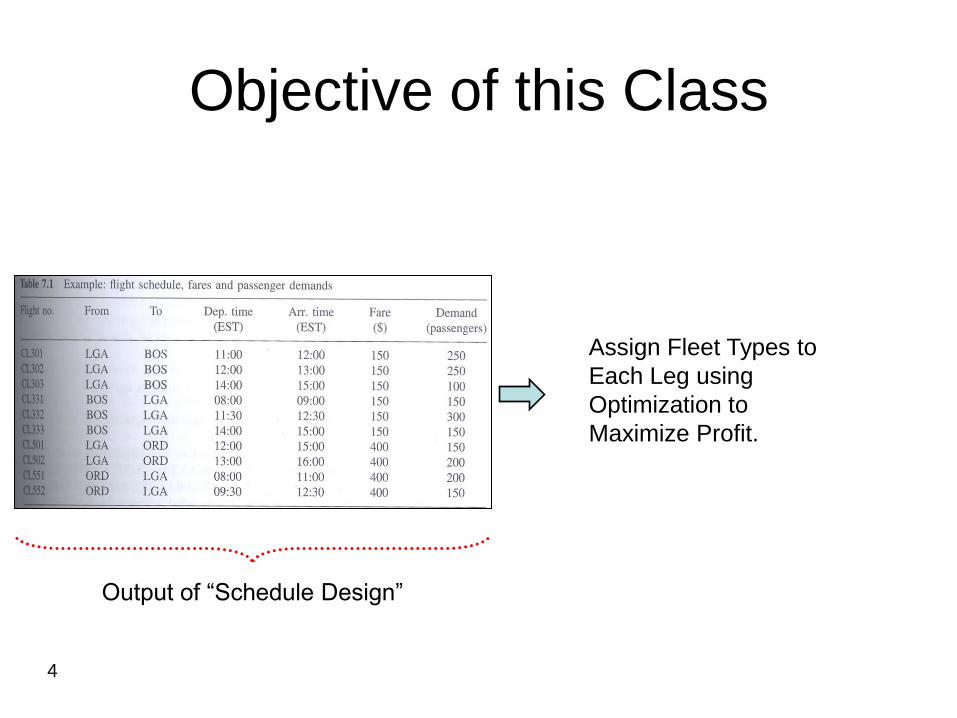
Objective of this Class
3
4
Output of “Schedule Design”
Objective of this Class
Assign Fleet Types to
Each Leg using
Optimization to
Maximize Profit.

5
Factors affecting Airline Scheduling
Decision (MACRO level)
• Market Demand (all PAX not same),
• Fleet composition,
• Location of crews,
• Maintenance bases,– $7.5 million last March against SWA. 46 B737 jets on 59,791 flights in 2006 and 2007 without mandatory fuselage inspections for fatigue
cracking. Six planes had cracks, the FAA says. After SWA became aware it hadn't made the inspections, the airline continued to operate the 46 planes on an additional 1,451 flights.
• Gate restrictions,
• Landing slot restrictions (eg: NY airports),
• For International flights: bilateral agreements

6
Complexity of the Problem is
affected by…
• Airports are not similar – Arr/Dep restrictions, Gates (type/personnel), Equipments..
• Fleet composition– Different operating characteristics, costs, maintenance and crew
requirements, seating capacity …
• Crews– Crews capable of operating only certain aircraft types,
Limitations of when/how they can work…
• Different O-D markets– Different demand volume, profitability/customer demographics..

7
Airline Schedule Planning
challenges..
• STOCHASTIC problem,
– Uncertainty in PAX demand, Pricing of tickets,
Fuel, Crew availability, Weather …
• SIZE of problem
– Break into sub problems and proceed..

8
Route individual aircraft honoring
maintenance restrictions
Airline Schedule Planning
Assign aircraft types to flight legs
such that contribution is maximizedFleet Assignment
Contribution = Revenue - CostsAircraft (Maintenance)
Routing
Schedule Design
Select optimal set of flight legs
in a schedule(Flight legs to operate: Origin, Sch Dep Time,
Approx Arrival Time, Frequency)
Crew Scheduling
Assign crew (pilots and/or flight
attendants) to flight legs
Each problem solved in order, with output of previous subproblem used as input for next subproblem

9
The Fleet Assignment Problem
• Outline
– Problem Definition and Objective
– Fleet Assignment Network
Representation
– Fleet Assignment Model

10
Problem DefinitionGiven:
– Flight Schedule• Each flight covered exactly once by one fleet type
– Number of Aircraft by Equipment Type• Can‟t assign more aircraft than are available, for each
type
– Turn Times by Fleet Type at each Station
– Other Restrictions: Maintenance, Gate, Noise, Runway, etc. (Not addressed in formulation)
– Operating Costs, Spill and Recapture Costs, Total Potential Revenue of Flights, by Fleet Type

11
Problem Objective
Find:
– Cost minimizing (or profit maximizing) assignment of aircraft fleets to scheduled flights such that maintenancerequirements are satisfied, conservation of flow (balance) of aircraft is achieved, and the number of aircraft used does not exceed inventory (in each fleet type)
12
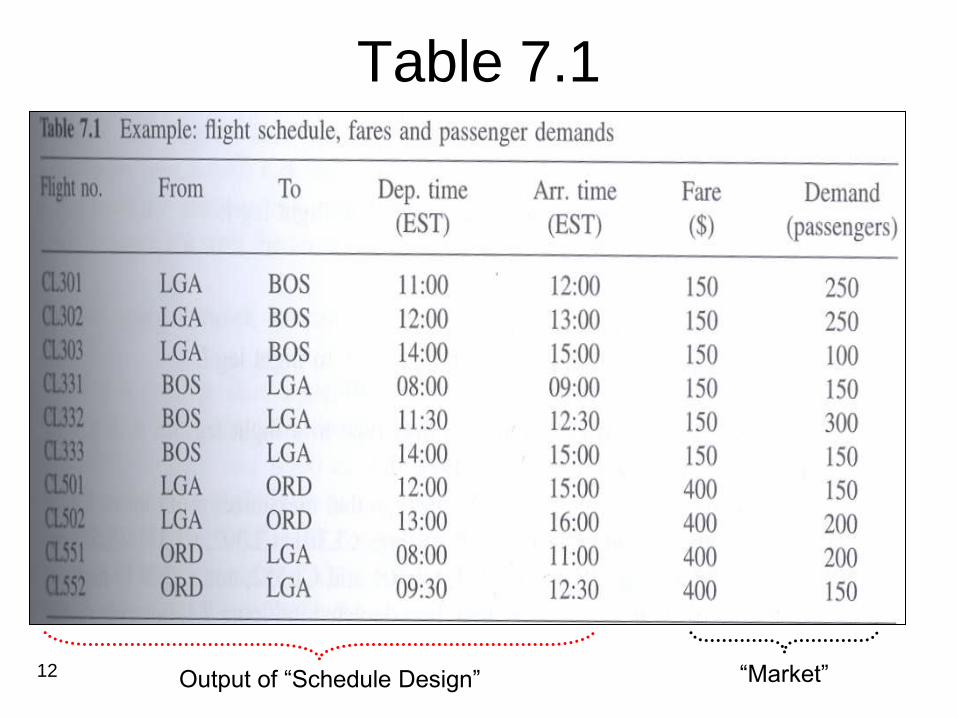
Table 7.1
Output of “Schedule Design” “Market”

13
Figure 7.1 and Table 7.2
14
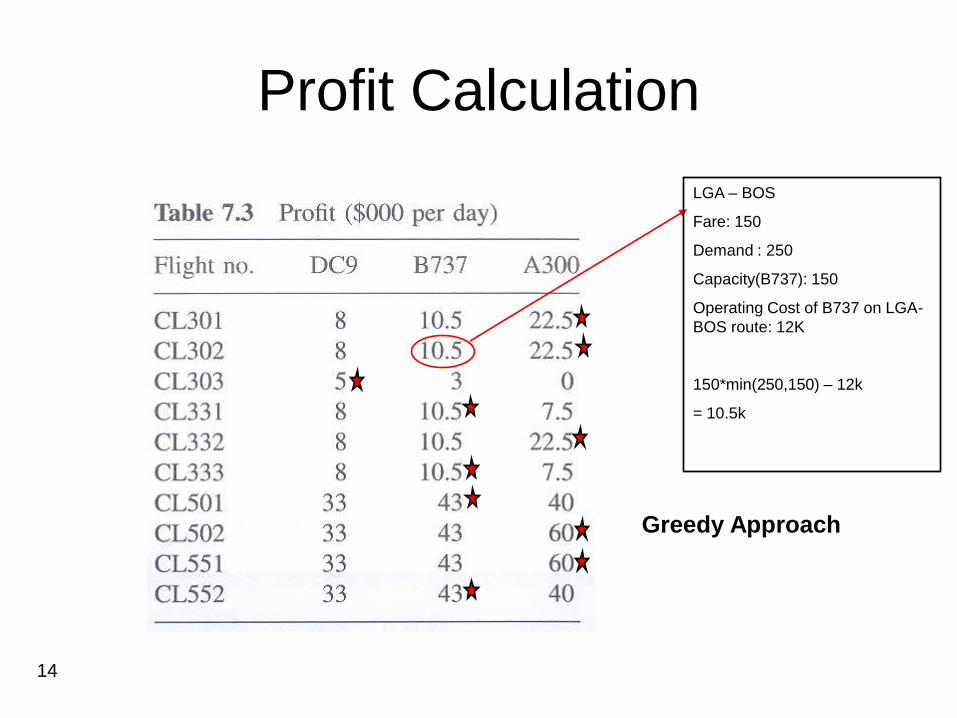
Profit Calculation
Greedy Approach
LGA – BOS
Fare: 150
Demand : 250
Capacity(B737): 150
Operating Cost of B737 on LGA-
BOS route: 12K
150*min(250,150) – 12k
= 10.5k

15
Greedy Solution and
Shortcoming
• Static Network Representation is
INSUFFICIENT to capture the „temporal
nature‟.
– Solution is a Time-Space Network..

16
Figure 7.2

17
Figure 7.3
A300‟s end up at different locations. Profit: 280,500

18
Figure 7.4
A300‟s end up at same location. Profit: 255,000

19
Time-Line Network
20
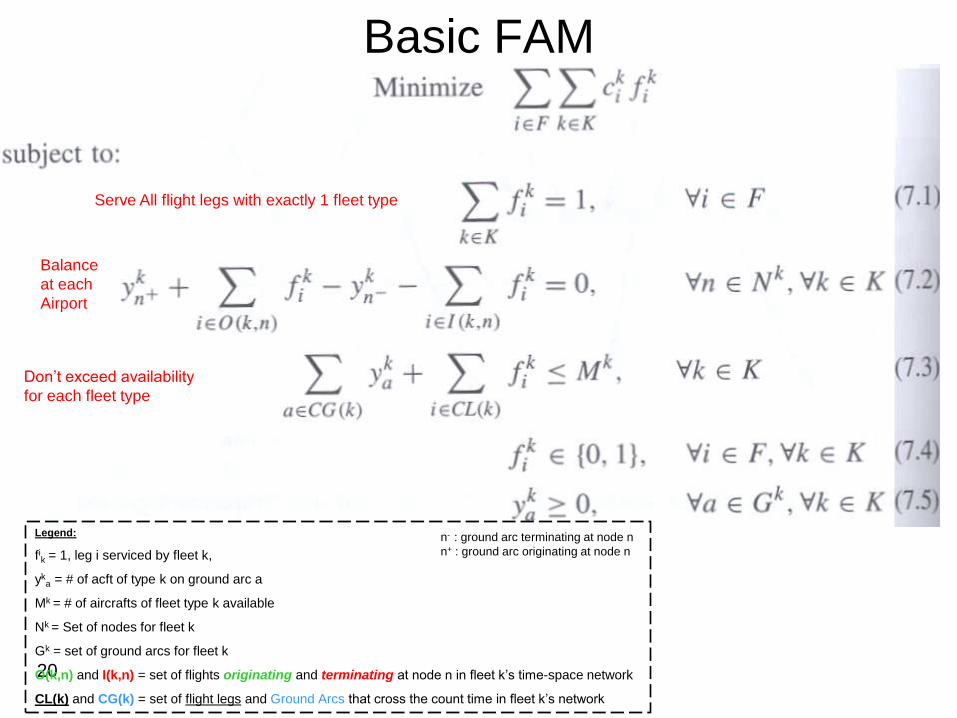
Basic FAM
Serve All flight legs with exactly 1 fleet type
Balance
at each
Airport
Don‟t exceed availability
for each fleet type
Legend:
fik = 1, leg i serviced by fleet k,
yka = # of acft of type k on ground arc a
Mk = # of aircrafts of fleet type k available
Nk = Set of nodes for fleet k
Gk = set of ground arcs for fleet k
O(k,n) and I(k,n) = set of flights originating and terminating at node n in fleet k‟s time-space network
CL(k) and CG(k) = set of flight legs and Ground Arcs that cross the count time in fleet k‟s network
n- : ground arc terminating at node n
n+ : ground arc originating at node n

21
Example
L1L2
L3 L4
N1
N2 N3 N6 N7
N4 N5 N8
2 4
9
8
5
Nodes = {N1,N2,N3,N4,N5,N6,N7,N8} Arcs = {1,2,3,4,5,6,7,8,9}
Ground Arcs = {2,4,5,8,9} Flight Arcs = {1,3,6,7}
i = {L1, L2, L3, L4}
k = {1,2 } ----- {B757, DC90}
M1 = M2 = 2
N1 = N2 = {N1,N2,N3,N4,N5,N6,N7,N8}
G1 = G2 = {2,4,5,8,9}
O(1,N1) = L1 , O(1,N3) = L2 , O(1,N5) = L3 , O(1,N6) = L4, O(1, N2|N4|N7|N8) = null (Same for k = 2)
I(1,N2) = L1 , I(1,N4) = L2 , I(1,N8) = L3 , I(1,N7) = L4, I(1, N1|N3|N5|N6) = null (Same for k = 2)
CG(1) = CG(2) = {8,9}
CL(1 )= CL(2) = Ø
Node + -
N1 Ø 8
N2 2 9
N3 4 2
N4 5 Ø
N5 Ø 5
N6 Ø 4
N7 9 Ø
N8 8 Ø

22
Serve All Flight Legs (7.1)
12
1
1
1
k
Li
k
Li ff
12
2
1
2
k
Li
k
Li ff
12
2
1
2
k
Li
k
Li ff
12
2
1
2
k
Li
k
Li ff

23
Balance Constraint (7.2)
)1,1(
11
1)1,1(
11
10
NIi
k
i
k
NaNOi
k
i
k
Nafyfy
L1 Ø
)4,1(
11
4)4,1(
11
40
NIi
k
i
k
NaNOi
k
i
k
Nafyfy
Ø L2
n=N1
i=1
n=N1
i=1
Ø 8
5 Ø
0 01
1
k
Lif1
8
k
ay
1
5
k
ay 01
2
k
Lif0

24
Count Constraint (7.3)
1
)1(
1
)1(
1 k
kCLi
k
i
kCGa
k
a Mfy
Ø
01
9
1
8
k
a
k
a yy
8,9
2
Legend:
CL(k) and CG(k) = set of flight legs and Ground Arcs that cross the count time in fleet k‟s network
CG(1) = CG(2) = {8,9}
CL(1 )= CL(2) = Ø

25
Number of Variables
i = {L1, L2, L3, L4}
k = {1,2 }
G1 = G2 = {2,4,5,8,9}
i(4) * k(2) = 8 ; f Binary
a(5) * k(2) = 10 ; y (automatically Integer because of balance and non-negativity constraints)
10+8 = 18 variables

26
FAM can be augmented with..
• Noise Restriction constraints
• Maintenance requirements
• Gate restrictions
• Crew considerations
27
Solution Time
• Table 7.4

28
Shortcoming of FAM
• Spill Cost and Recaptures ignored
• Consider only aggregate demand and
average fares.
• Static demand is assumed (no seasonality
etc considered)
29
Extending FAM : Introduction to
Spilling

30
Example
X Y Z
( 75, $300 )
( Demand, Fare )
( 75, $200 ) ( 150, $225 )
10+20
10+39.5
20+20
20+39.5
Max Possible Revenue
= 75*200 + 150*225 + 75*300
= 71,250
31
Spilling
• FAM is leg-based
• Fares/PAX demand is itinerary (O-D pair) based
Itinerary can be multiple legs. Leading to mismatch.
• Problem: Estimate “leg-bases Spill Costs”– Different methods:
• Prorate total itinerary fare to flight legs s.t. their Sum equals total fare– Proration is typical done based on distance . Can also be done based on
profitability, i.e. $/miles etc
– Can also assign entire itinerary fare to each leg. Rationale: PAX will travel ALL or NO legs for any given itinerary
• Assumption: Airline has full discretion in determining which passenger it wishes to accommodate.

32
Revenue Maximizing Strategy for Spilling
X Y Z
( 75, $300 )
( Demand, Fare )
( 75, $200 ) ( 150, $225 )
•If Fleeting I is selected, i.e. Aircraft type A on both legs.
Available seats on each leg = 100
Demand in X-Y leg = 75 (from X-Y) + 75 (from X-Z) = 150
Demand in Y-Z leg = 150 (from Y-Z) + 75 (from X-Z) = 225
Need to spill 50 (150-100) and 125(225-100) PAX from leg 1 and 2 respectively
X-Z Fare (300) < X-Y Fare(200) + Y-Z Fare(225)
Spill 50 X-Z PAX first
X-Y leg is not beyond capacity now
As Fare Y-Z < Fare X-Z, spill (225-50-100) Y-Z PAX

33
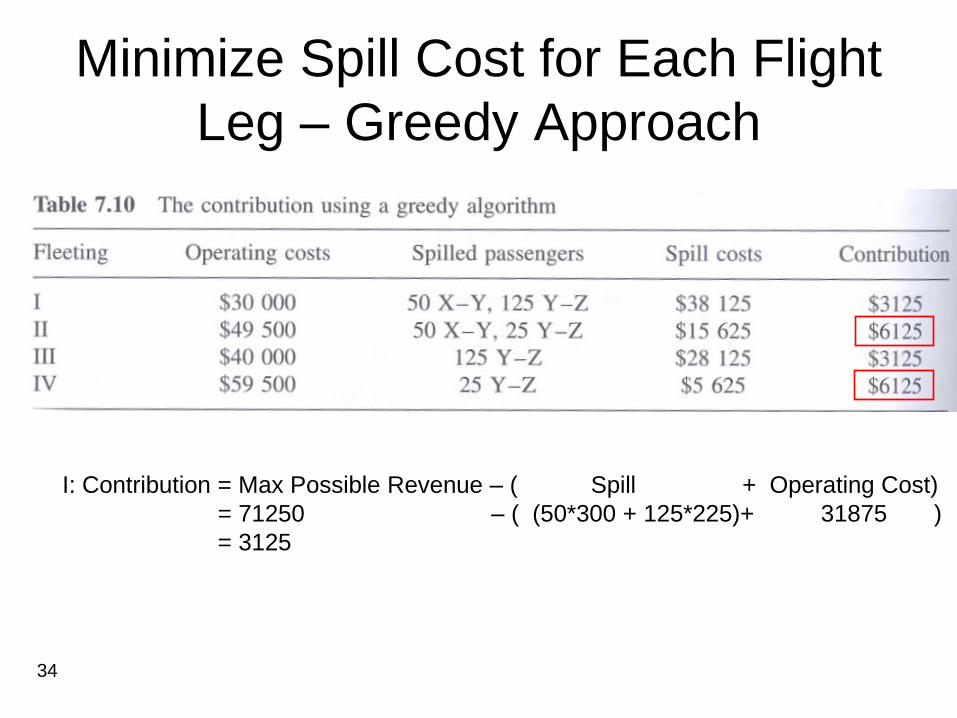
Result Using Revenue Maximizing
Strategy
I: Contribution = Max Possible Revenue – ( Spill + Operating Cost)
= 71250 – ( (50*300 + 75*225)+ 31875 )
= 9375
34
Minimize Spill Cost for Each Flight
Leg – Greedy Approach
I: Contribution = Max Possible Revenue – ( Spill + Operating Cost)
= 71250 – ( (50*300 + 125*225)+ 31875 )
= 3125

35
Need for Mathematical Models and
Optimization Approaches..
• Enumeration of possible fleeting
combinations for real scenarios is
computationally expensive and sometimes
even impossible.
– AAL yielded annual improvement in revenue
of .54 to .77%.
36
IFAM (Itinerary Based FAM) :FAM with network effects

37
Expansion to basic FAM
• Include variables representing the mean number
of PAX assigned to each itinerary in airline‟s
network– tp
r : Expected # of PAX desiring to travel on „p‟ spilled to a
different itinerary „r‟
• Recapture rate:– bp
r : Estimated fraction of PAX spilled from „p‟ and captured in
itinerary „r‟
• Therefore,
– bpp =1 : All PAX desiring to travel on p accept that itinerary
– bpr * tp
r = # of PAX traveling on „r‟ that preferred „p‟

38
Kk
, , ( )r r
k i k i p p r p
k K i L p P r P
Min c f fare b fare t
1,Kk
ikf
0),,(
,,,),,(
,,,tokOi
iktoktokIi
iktokfyfy
kkCLi
ikOo
tok Nfyn
)(,,,
1,0,ikf 0,, toky
Li
tok ,,
Subject to:
iPr Pp
rp
rp
pi
Pr Pp
rp
pi
kkik QtbtSEATSf ,
pPr
rp Dt
0rpt
Li
Pp
Kk
, , ( )r r
k i k i p p r p
k K i L p P r P
Min c f fare b fare t
1,Kk
ikf
0),,(
,,,),,(
,,,tokOi
iktoktokIi
iktokfyfy
kkCLi
ikOo
tok Nfyn
)(,,,
1,0,ikf 0,, toky
Li
tok ,,
Subject to:
iPr Pp
rp
rp
pi
Pr Pp
rp
pi
kkik QtbtSEATSf ,
pPr
rp Dt
0rpt
Li
Pp
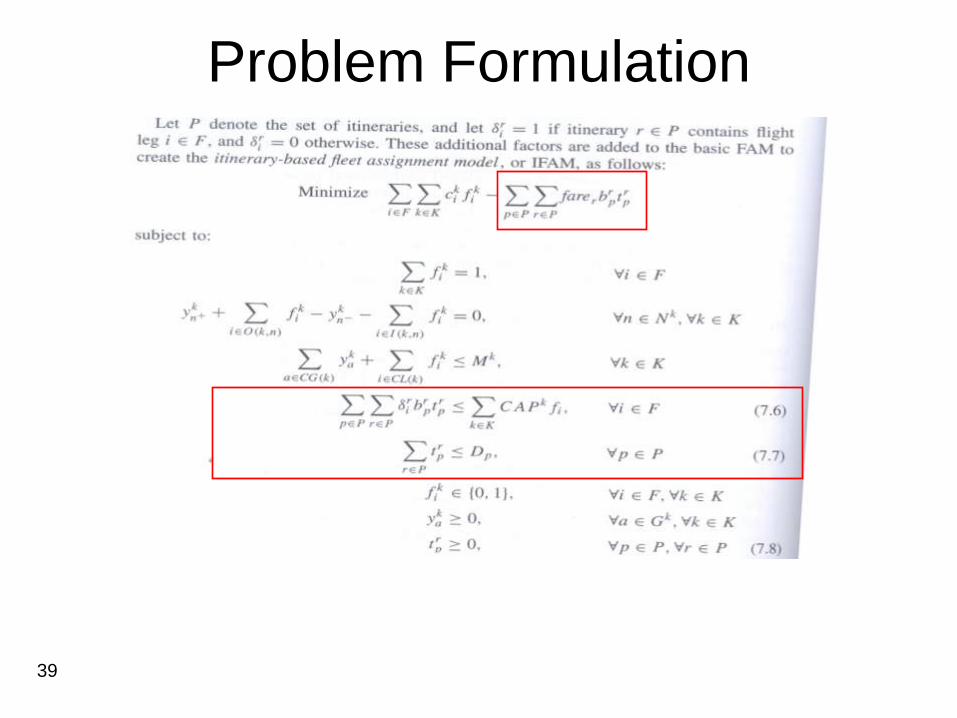
Itinerary-Based FAM (IFAM)
Kniker (1998)
FAM
PMMConsistent Spill + Recapture
Fleet Assignment
39
Problem Formulation

40
IFAM Augmentations
Operating Cost Total Revenue
k
Total # of PAX
travelling on leg i
Max Capacity of the
fleet type servicing
flight leg i
Total # of PAX
travelling on or
spilled from
itinerary p
Unconstrained
demand of P
Variables

41
IFAM vs FAM

42
Route individual aircraft honoring
maintenance restrictions
Assign aircraft types to flight legs
such that contribution is maximized
Contribution = Revenue - Costs
Airline Schedule Planning
Schedule Design
Fleet Assignment
Aircraft (Maintenance)
Routing
Crew Scheduling
Select optimal set of flight legs
in a schedule(Flight legs to operate: Origin, Sch Dep Time,
Approx Arrival Time, Frequency)
Assign crew (pilots and/or flight
attendants) to flight legs
Each problem solved in order, with output of previous subproblem used as input for next subproblem

43
Schedule Design Optimization
• Data might not be available for Optimizing new schedule.
• Building new schedule from scratch may be computationally intractable.
• Dramatic changes to schedule not preferred as degree of consistency from one planning period to next, especially in business markets is highly valued.
44
Incremental Optimization
Also, not always possible to express „BEST‟ schedule mathematically. (example..)
• Allow limited changes to a given/current schedule:– Airlines able to use historical booking data/traffic forecast
– Required planning efforts and time manageable
– Fixed investment at stations can be utilized efficiently (gate/aircraft lease agreements ..)
– Consistency maintained for customers.
• Example: Retiming certain flight legs or replacing small set of unprofitable flight legs., redesigning airline hub connections...

45
Example : Hub Debanking
• Challenges posed:
– Scheduling decision made for ALL flights legs,
not just those at the hubs.
– Fleeting decision renewed. Large/small
example
– Fleeting and Scheduling must be determined
simultaneously. # of schedules is unlimited.

46
Optimizing Flight Retiming and Fleet
Assignment Problem
• Special case of more generalized integrated
schedule design and fleet assignment problem.
• Given: Set of flight legs to be operated
• Decision:
– Flight retiming
– Fleet Assignment
• Approach: In time-space network to include one
flight arc copy for each possible departure time
of each flight leg.
47
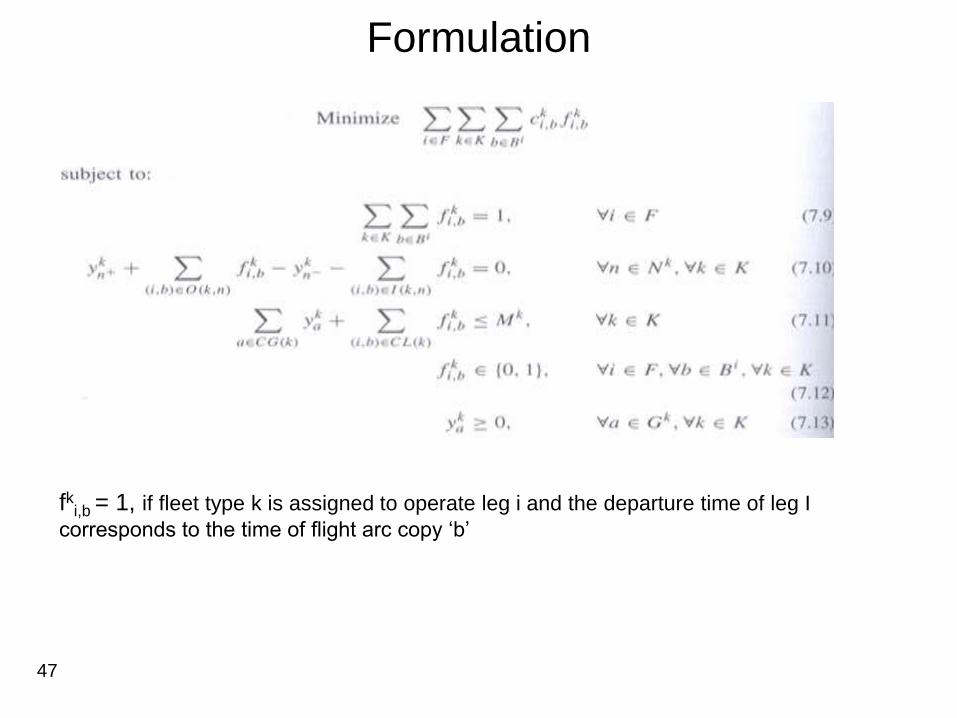
Formulation
fki,b = 1, if fleet type k is assigned to operate leg i and the departure time of leg I
corresponds to the time of flight arc copy „b‟

48
END Part I