
Airline Fleet Fuel Economy18.10.26 · (IEA, 2009; Peeters et al., 2005), as airplane designs get...
69
| THE AUSTRALIAN NATIONAL UNIVERSITY Crawford School of Public Policy Centre for Climate Economics & Policy Flying more efficiently: Joint impacts of fuel prices, capital costs and fleet size on airline fleet fuel economy CCEP Working Paper 1810 November 2018 Zsuzsanna Csereklyei School of Economics, Finance and Marketing, RMIT University David I Stern Crawford School of Public Policy, The Australian National University Abstract We investigate the factors that affect airlines’ choice of fleet fuel economy using plane- level data for 1267 airlines in 174 countries. Larger and newer planes are usually more fuel- efficient. Controlling for the effect of aircraft size and age, we find that the technically achievable fleet fuel economy improves with the size of airlines and the price of fuel and worsens with higher capital costs. The elasticity of fuel economy with respect to the price of fuel is between -0.07 and -0.13. We find evidence for regional differences in fleet fuel economy that are attributable to the adoption of distinct groups of technologies.
Transcript of Airline Fleet Fuel Economy18.10.26 · (IEA, 2009; Peeters et al., 2005), as airplane designs get...
| T H E A U S T R A L I A N N A T I O N A L U N I V E R S I T Y
Crawford School of Public Policy
Crawford School of Public Policy
Centre for Climate Economics & Policy
Flying more efficiently: Joint impacts of fuel prices, capital costs and fleet size on airline fleet fuel economy
CCEP Working Paper 1810 November 2018 Zsuzsanna Csereklyei School of Economics, Finance and Marketing, RMIT University David I Stern Crawford School of Public Policy, The Australian National University Abstract We investigate the factors that affect airlines’ choice of fleet fuel economy using plane-level data for 1267 airlines in 174 countries. Larger and newer planes are usually more fuel- efficient. Controlling for the effect of aircraft size and age, we find that the technically achievable fleet fuel economy improves with the size of airlines and the price of fuel and worsens with higher capital costs. The elasticity of fuel economy with respect to the price of fuel is between -0.07 and -0.13. We find evidence for regional differences in fleet fuel economy that are attributable to the adoption of distinct groups of technologies.
| T H E A U S T R A L I A N N A T I O N A L U N I V E R S I T Y
Keywords: Energy efficiency; air transport JEL Classification: D22; L93; O14; Q40 Acknowledgements: We thank the Australian Research Council for funding under Discovery Project (DP160100756) “Energy Efficiency Innovation, Diffusion and the Rebound Effect.” We thank Alexander Koduah and Bishal Chalise for research assistance and seminar participants at the Arndt-Corden Department of Economics at the Australian National University and the Department of Economics at the University of Sydney for useful comments. Suggested Citation: Csereklyei, Z. and Stern, DI. (2018), Flying more efficiently: joint impacts of fuel prices, capital costs and fleet size on airline fleet fuel economy, CCEP Working Paper 1810, November 2018, Crawford School of Public Policy, The Australian National University. Address for Correspondence: Zsuzsanna Csereklyei School of Economics, Finance and Marketing RMIT University B80, 445 Swanston Street Melbourne VIC 3000, Australia Phone: +61 3 9925 1518 E-mail: [email protected]
The Crawford School of Public Policy is the Australian National University’s public policy school, serving and influencing Australia, Asia and the Pacific through advanced policy research, graduate and executive education, and policy impact.
The Centre for Climate Economics & Policy is an organized research unit at the Crawford School of Public Policy, The Australian National University. The working paper series is intended to facilitate academic and policy discussion, and the views expressed in working papers are those of the authors. Contact for the Centre: Prof Frank Jotzo, [email protected]
2
1. Introduction
The International Energy Agency (IEA) expects that, up to 2040, reductions in energy
intensity will contribute 42% of the reduction in greenhouse gas emissions relative to
business as usual required to achieve the goal of limiting climate change to a 2°C increase in
temperature (IEA, 2016). The IEA expects the majority of this improvement in energy
intensity to come from improvements in the energy efficiency of energy services (IEA, 2014:
285-286). On the other hand, the mechanisms enabling the geographical spread of such
energy saving technological improvements have not been sufficiently investigated (Barretto
and Kemp 2008; Verdolini and Galeotti, 2011). The airline industry is perhaps unique in the
availability of global data on installed equipment at the individual machine (and firm) level
together with information on model energy efficiency. Though carbon emissions from air
travel were less than 11% of transport emissions in 2010 (Sims et al., 2014), they will likely
be of increasing importance (Nava et al., 2017).
These facts raise the question of what factors affect the selection of fleet fuel economy by
airlines across countries. Do increases in fuel price or a reduction of capital costs improve
long-run fleet fuel economy more? Are larger or smaller airlines likelier to invest in fuel
efficiency, while controlling for plane size? Are there any regional variations? In this paper,
we construct a unique dataset for 1267 airlines, using plane-level technical efficiency data to
answer these questions. The purpose of this paper is to understand what determines the
technically achievable efficiency level of airline fleets, assuming airlines intend to utilize
their fleet in the most efficient way, for example flying long-range planes on longer routes.
We do not however study how airlines utilize their existing planes under different economic
circumstances (see Kahn and Nickelsburg, 2016). Therefore, the term “fleet fuel economy”
denotes the technically achievable fleet fuel economy of airlines in this paper.
Our estimates increase the understanding of how key long-run cost components impact on
airline fleet fuel economy, and aid policy design aimed at increasing industrial efficiency as
countries work to deliver their Paris Agreement (2015) emission reductions pledges. Such
policies are especially important, as currently there is no set of agreed international
environmental and emissions standards for air transport (ICAO, 2016), with the Carbon
Offsetting and Reduction Scheme for International Aviation (CORSIA)
scheme only coming into effect in 2021 on a voluntary basis.
3
Our approach extends the literature in several key ways. First, the dataset used is more
comprehensive than in any other publication before. We have collected technical data on over
140 airplanes to determine fleet fuel economy based on the number and type of aircraft flown
for each carrier. The use of this data pose some challenge however, as other data such as
wages had to be approximated for a large number of airlines. Second, we introduce two new
fleet fuel economy measures, which remove the impact of aircraft size and age, thereby
effectively allowing us to concentrate on the effect of non-technical variables with policy
implications.
Simple (or observed) fleet fuel economy is the seat weighted fleet fuel economy of the
various aircraft models used by an airline. Larger (Babikian et al., 2002) and newer aircraft
tend to be more fuel-efficient. Though airlines can improve fuel economy by using larger
planes, the main reasons for using larger aircraft are route distance and traffic volume.
Therefore, we construct a “size-adjusted fleet fuel economy” measure, which removes the
technological effect of aircraft size from aircraft fuel economy before computing fleet fuel
economy. Though a major reason for using newer aircraft is to reduce fuel costs there will
also be other motivations such as improving passenger comfort and reducing maintenance
costs. Therefore, we also compute a “size- and age-adjusted fleet fuel economy.” Finally, this
allows us to report the responsiveness of fleet fuel economy to fuel prices, which has not
been done before. A number of studies deal with the historical and projected development of
aircraft fuel efficiency (Babikian et al. 2002; Lee et al. 2001; Lee, 2010; Peeters et al., 2005,
Zou et al., 2014), the impact of fuel prices on airline operations and finances (Adrangi et al.
2014; GAO, 2014; Kahn and Nickelsburg, 2016; Murphy et al., 2013), airline profitability
(Berry and Jia, 2010; Borenstein, 2011), fleet scheduling and optimization (Naumann and
Suhl, 2013; Rosskopf et al. 2014), and the impact of a carbon price on firm value
(Vespermann and Wittmer, 2011; Scheelhaase et al., 2010, Murphy et al., 2013, Anger and
Koehler, 2010). Also, a few studies estimate cost or production functions for relatively small
numbers of airlines (e.g. Caves et al., 1984; Gillen et al., 1990; Oum and Yu, 1998; Coelli et
al., 1999; Inglada et al., 2006). However, we are not aware of a study of similar scale to ours
that systematically examines the factors affecting airlines’ choice of fuel economy.
Our model is based on a long-run translog cost function where cost depends, inter alia, on the
fuel economy of the planes owned or leased by each airline. We find that higher domestic
fuel prices and greater airline size are associated with better fleet fuel economy. The elasticity
of fuel economy with respect to the price of fuel is between -0.07 and -0.13. Higher capital
4
costs are associated with lower fleet fuel economy. Therefore, policies aiming at higher fuel
prices such as the removal of fuel subsidies or the introduction of carbon taxes would all
result in increased fleet fuel economy. If induced technical change reduced the cost of more
fuel-efficient aircraft, the effect could be larger than this. Reduced costs of credit, for
example through loan guarantees enabling economy investments, would especially benefit
those airlines that face high credit costs. Most such airlines are in developing countries.
The paper is structured as follows: Section 2 reviews the relevant literature, Section 3
introduces our model, Section 4 our data, Section 5 presents the results, and Section 6
concludes.
2. Airline Fuel Economy
Aircraft fuel efficiency has been improving over time (EASA, 2016; GAO, 2014; IEA 2009;
Peeters et al., 2005), even though the rate of efficiency improvement is currently slowing
(IEA, 2009; Peeters et al., 2005), as airplane designs get closer to the technical optimum. At
the same time natural diffusion processes might not “reliably spread the best innovations” in
the market (Greve and Seidel, 2015). The IEA (2009) asserts that in the United States,
technological and operational improvements led to a 60% improvement in the energy
efficiency of aircraft between 1971 and 1998, even though the majority of improvements
happened prior to the 1980s. On the other hand, there was an earlier decline in fuel economy
due to the shift from piston engine to jet engine aircraft. (Peeters et al., 2005) The EASA
(2016) reports that the mean age of European aircraft is increasing. This highlights the
problem that the diffusion of newer, (more) efficient technology is generally slow and
gradual (Jaffe and Stavins, 1994), with the IEA (2009) noting that the average efficiency of
fleet stock may lag 20 years behind new aircraft efficiency.1
Many factors affect airlines’ decisions on the portfolio of planes they choose to hold and
operate, including the average distance of the flights (long or short haul) usually flown, the
fuel economy of the available aircraft, expected fuel prices (IEA, 2009), the price of new and
1 Zou et al. (2014) find by studying 15 large jet operators in the US that the mean airline fuel efficiency in 2010 was 9–20% worse than that of the most efficient carrier, while the least efficient airlines were 25–42% behind industry leaders in terms of efficiency. Therefore, the hypothetical cost savings from enhanced efficiency for mainline airlines could be in the vicinity of a billion dollars in 2010.
5
used aircraft, financing requirements including owning vs. lease decisions (Gavazza, 2011),
and the wages of staff.
For North American airlines the two largest expenditure items are fuel and labor (Neumann
and Suhl, 2013). Kahn and Nickelsburg (2016) estimate2 that fuel prices make up about 25%
of the operating expenses of US airlines, however, when kerosene and aviation fuel prices are
higher, the cost share of fuel can go up to 33% (Adrangi et al. 2014). Larger planes are
usually more fuel efficient per seat-km for a given load factor (Naumann and Suhl, 2013), but
they are also more difficult to fill, therefore, owning or leasing high-capacity airplanes in
times of high fuel prices and low passenger numbers due to economic downturns can be
financially very risky. Borenstein (2011) noted, that in times of high demand, adjustment to
shocks (in taxes or fuel prices) might be relatively smooth, while the large losses of US
airlines during the 2000s were due to demand shocks, when sticky labor costs, high fixed
costs, and high fuel costs coincided with depressed prices.
The IEA (2009) claims that fuel-efficient aircraft can deliver net economic benefits already
after a couple of years of service life. They estimate that given an oil price of USD 120/bbl
that the benefit of upgrading and flying more efficient planes on long haul routes
approximates to annually 6 to 8 million USD. Using a 10% discount rate and assuming 30 -
years useful life, this amounts to about 10 years of undiscounted fuel savings or a net present
value of 60 to 80 million. Assuming a purchase price of 40 million USD, the fuel savings
easily pay for the additional price of newer aircraft.3 These savings are larger the lower the
discount rate is assumed to be. Since the price of oil has fallen to around USD 50/bbl since
the IEA (2009) study was published, these savings have approximately halved resulting in
much less incentive to improve fuel economy. However, the fleets in place in 2015 – the date
of our study – will reflect the high oil prices in many recent years.
2 Kahn and Nickelsburg (2016) establish a binary choice model of airline fleet replacement and operation optimization based on US data. They find that in times of high fuel prices that airlines fly less fuel efficient planes more slowly, scrap older less efficient planes earlier, and use more fuel-efficient planes more. 3 The United States Accountability Office (GAO) notes in its 2014 report that in response to fuel price increases airlines have taken a number of actions, including the “reconfiguration of fleets”, and increasing of operational efficiency. The GAO (2014) reports that many less fuel-efficient aircraft (e.g., Boeing 737-300/400/500 and McDonnell Douglas MD-80) were retired and replaced with technologically more advanced options such as Airbus A320 and Boeing 737-700/800/900. As a result, many manufacturers saw increased demand for more fuel-efficient aircraft in the second half of the 2000s.
6
The relationship between fuel prices and fleet fuel economy has been the focus of
longstanding academic interest. Prominent examples from road transportation include Alcott
and Wozny (2014), who find that consumers value discounted future gasoline costs only 76%
of what they value purchase prices. Li et al. (2009), examine the channels through which
gasoline prices affect fleet fuel economy such as the purchase of new efficient vehicles and
the scrapping of older vintages. Their simulations indicate that a 10% increase in fuel prices
results in 0.22% increase in fleet fuel economy in the short, and 2.04% in the long run. Burke
and Nishitateno (2013) find that 1% increase in gasoline price leads to 0.15-0.2%
improvement in new vehicle fleet fuel economy. Klier and Linn (2010) report that a $1 per
gallon increase in road gasoline prices improves the average fuel economy of new vehicles
by 0.8-1 miles per gallon. Jacobsen and van Benthem (2015) estimate that a $1 per gallon
increase in the price of gasoline results in an additional 0.5% of the fleet of least fuel efficient
vehicles being scrapped while 0.4% of the fleet of most fuel efficient vehicles that would
otherwise be scrapped is not.
Airlines may improve their fleet fuel economy through technological innovation and the
replacement of their stock, or through increasing operational efficiency. Adrangi et al. (2014)
note that efficiency improvements are necessary for long-term survival. These improvements
may arise from hedging, improved scheduling, optimal pricing, through the replacement of
old vintage airplanes in the fleet with advanced technology aircraft (Adrangi et al., 2014) or
from strategic flight planning (Naumann and Suhl, 2013).
Firms however might be constrained in their ability to quickly transition to a significantly
more fuel-efficient fleet. This constraint might arise from the necessity to first sell their older
planes to buy new aircraft, therefore the associated transaction costs might be very high.
Leasing planes makes it easier for airlines to replace their fleets. Accordingly, Gavazza
(2011) finds that leased aircraft have 38% shorter holding durations on average, but fly 6.5%
more hours than owned aircraft. As leasing reduces transaction costs, the number of new
airplane leases have been constantly increasing in recent decades. Benmelech and Bergman
(2011) claim that airlines are likelier to lease than to own aircraft in states with insufficient
creditor rights, while Eisfeldt and Rampini (2009) assert that credit-constrained airlines are
likely to lease more. The Economist (2012) estimated that about 40% of the world’s airline
fleet is now rented. However, Kahn and Nickelsburg (2016) note that in times of higher jet
fuel prices the lease price of efficient aircraft is also higher in the US.
7
A few authors have applied cost function or production frontier approaches to modeling
airline decisions. Compared to these studies, our data set includes far more airlines and has
much wider geographical scope. The tradeoff to reach this level of comprehensiveness is a
lack of accurate firm level data on a number of variables of interest and as a result we use
proxies for some explanatory variables.
Earlier studies (e.g. Caves et al., 1984; Gillen et al., 1990) focused mostly on the North
American airline industry4. More recent studies (e.g. Oum and Yu, 1998; Coelli et al., 1999;
Inglada et al., 2006) have investigated small numbers of international airlines. Oum and Yu
(1998) apply a short-run translog unit cost function and cost share equations to 22 major
international airlines over 1986-93. They use a capital stock index for aircraft and ground
equipment, inter alia aggregate output, labor, energy and materials prices, revenue shares of
freight and mail, average stage length, a TFP index, and time fixed effects. They found that
Non-Japanese Asian carriers were generally more cost competitive than the major U.S.
carriers but Japanese carriers and major European carriers were less cost competitive.
Coelli et al. (1999) apply a translog stochastic production frontier model to 32 international
airlines in the period 1977-1990. The inputs include labor and capital and three
“environmental variables” that explain “inefficiency”: mean stage length, mean number of
seats per aircraft, and load factor. However, they do not consider energy efficiency explicitly.
Inglada et al. (2006) estimate cost and production stochastic frontiers for 20 airlines for 1996-
2000. The cost frontier has random efficiency terms but does not have biased technical
change. Explanatory variables are KLEM prices and output measured in ton kilometers
(using weight of passengers and freight), allowing for variable returns to scale. However, the
study suffers from several endogeneity problems. In particular, capital prices are measured by
capital expenditures divided by capacity and energy prices as energy cost divided by
kilometers. However, all of these prices depend on the fuel economy and capital investment
decisions made by airlines earlier, and so are not exogenous. Our paper addresses these issues
by measuring the cost of capital by interest rates, and energy prices by exogenously
determined gasoline prices and oil reserves.
4 Applying a translog total cost function and share equations to panel data, Caves et al. (1984) found no economies of scale that affected the relative costs of “trunk” and smaller regional airlines in the U.S. Instead, density of traffic within an airline’s network rather than differences in the size of the network explained cost differences.
8
3. Model
We assume that the total operating costs, C, of airline i at time t, is given by the long-run cost
function:
!"# = %('"#, *#, +"#, ,"#, -"#, ."#, /"#, 0) (1)
where Q is output, p is the international price of fuel, d is the domestic price of fuel, r is the
cost of capital, w is the wage rate, E is fleet fuel economy, / is a vector of “environmental
variables”, and the final explanatory variable indicates that technology evolves over time.
While fuel for international flights is effectively untaxed, fuel used for domestic aviation is
taxed in many countries (Keen and Strand, 2007). We measure fleet fuel economy, E, as fuel
consumed per seat-km assuming aircraft are used at full capacity. Therefore, it reflects the
technical characteristics of the installed capital stock rather than actual operational fuel
efficiency, which is influenced by load factors (and could be measured by fuel consumption
per passenger-km). However, this is not a concern as the purpose of our paper is not to study
how airlines utilize their existing stock (flying at maximum range or with a full load factor),
but to understand how they build up their stock, given the assumption they plan to utilize
them most efficiently. For example, we assume that when an airline invests in a long-range
craft, it does not intend to fly it systematically on short-routes. Environmental variables
reflect the type of services provided by an airline – here we try to capture factors such as the
typical flight segment length and plane. Details for all these variables are discussed in the
Data Section below.
If larger aircraft are more fuel-efficient than smaller aircraft, E will depend on the size of
aircraft employed. If newer aircraft are more efficient for a given seat size, E will depend on
the age of the fleet as well. While airlines can choose larger and newer aircraft to improve
fuel economy there are also other reasons why they would choose these over smaller and
older aircraft. Therefore, we also investigate alternative measures of fuel economy, clean of
size and age effects.
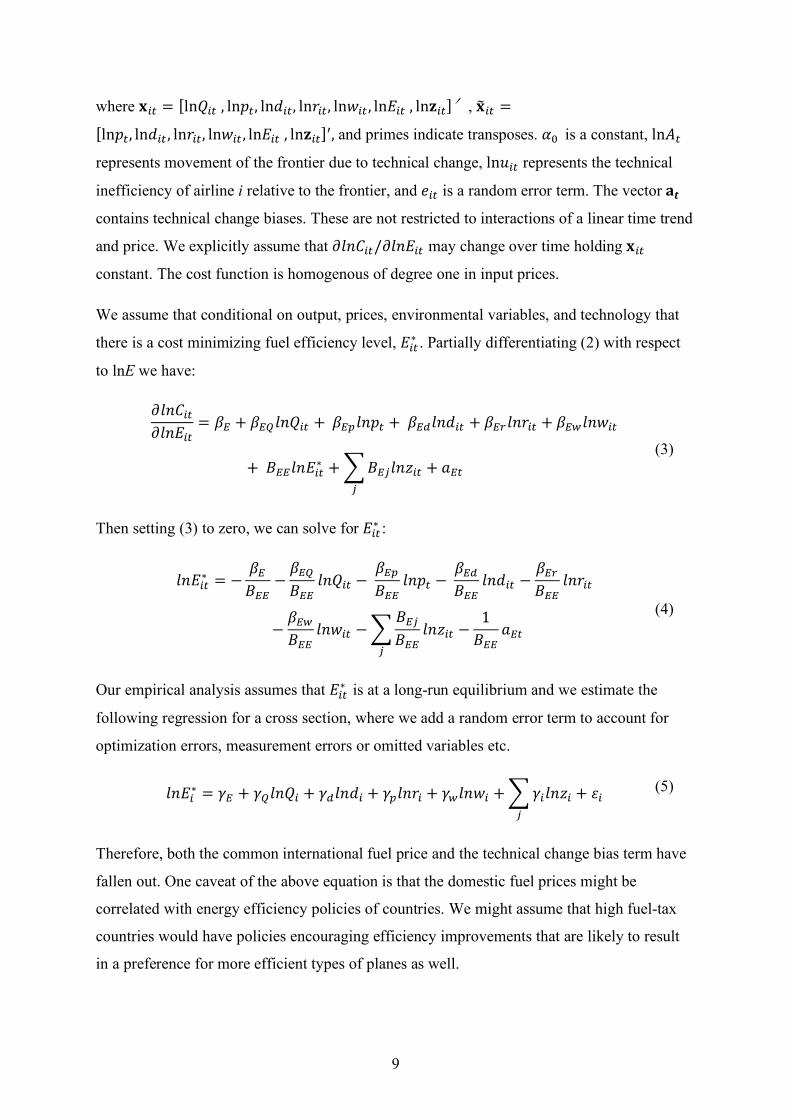
We assume that (1) can be represented by a long-run translog cost function of the following
general form:
23!"# = 45 + 237# + ln:"# + ;′="# + 0.5="#A B="# +CDA=E"#+F"# (2)
9
where ="# = [ln'"#, ln*#, ln+"#, ln,"#, ln-"#, ln."#, ln/"#]�, =E"# =
[ln*#, ln+"#, ln,"#, ln-"#, ln."#, ln/"#]A,and primes indicate transposes. 45 is a constant, ln7#
represents movement of the frontier due to technical change, ln:"# represents the technical
inefficiency of airline i relative to the frontier, and F"# is a random error term. The vector CD
contains technical change biases. These are not restricted to interactions of a linear time trend
and price. We explicitly assume that I23!"#/I23."# may change over time holding ="#
constant. The cost function is homogenous of degree one in input prices.
We assume that conditional on output, prices, environmental variables, and technology that
there is a cost minimizing fuel efficiency level, ."#∗ . Partially differentiating (2) with respect
to lnE we have:
I23!"#I23."#
= LM + LMN23'"# +LMO23*# +LMP23+"# + LMQ23,"# + LMR23-"#
+SMM23."#∗ +TSMU23V"# + WM#
U
(3)
Then setting (3) to zero, we can solve for ."#∗ :
23."#
∗ = −LMSMM
−LMNSMM
23'"# −LMOSMM
23*# −LMPSMM
23+"# −LMQSMM
23,"#
−LMRSMM
23-"# −TSMUSMM
23V"# −1SMM
WM#U
(4)
Our empirical analysis assumes that ."#∗ is at a long-run equilibrium and we estimate the
following regression for a cross section, where we add a random error term to account for
optimization errors, measurement errors or omitted variables etc.
23."∗ = ZM + ZN23'" + ZP23+" + ZO23," + ZR23-" +TZ"23V" + ["
U
(5)
Therefore, both the common international fuel price and the technical change bias term have
fallen out. One caveat of the above equation is that the domestic fuel prices might be
correlated with energy efficiency policies of countries. We might assume that high fuel-tax
countries would have policies encouraging efficiency improvements that are likely to result
in a preference for more efficient types of planes as well.
10
The airlines in the sample vary tremendously in size from 15 to 183554 total seats. It is
plausible that larger airlines will find it easier to adjust to the long-run equilibrium by
maintaining a portfolio of different aircraft models and gradually introducing new models. By
analogy with grouping heteroskedasticity, the variance of the residuals might be inversely
proportional to the total number of seats. The Breusch-Pagan test statistic for
heteroskedasticity related to the total number of seats in the first regression of Table 4 is
69.62, which is distributed as chi-squared with one degree of freedom (p=0.00). Therefore,
we present weighted least squares (WLS) estimates as a robustness check, where the weights
are the square root of the total number of seats available to each airline. We compute robust
standard errors clustered by country for both OLS and WLS models. Using WLS together
with heteroskedasticity consistent standard errors should result “in valid inference, even if the
conditional variance model is misspecified” (Romano and Wolf, 2017, 2).
4. Data
Aircraft data
Our data on the aircraft operated by each airline is taken from the World Airliner Census
(Flightglobal, 2015). The Census gives a snapshot as of 2015 of the type and number of
different types of aircraft operated (owned and leased) by commercial airlines and air-freight
companies throughout the world. After deleting 5 airlines for which we could not determine
their country of registration, we have data on 1267 different airlines.
While the census data include “all commercial jet and turboprop-powered transport aircraft,
built by Western, Chinese or Russian/CIS/Ukrainian manufacturers in service”, as well as
company orders, for the purpose of this study, we excluded not-yet delivered orders from the
dataset. Flightglobal (2015) defines an aircraft “in service” when it is “active (in other words
accumulating flying hours).”
The census data include all cargo, passenger and multi-purpose planes. We excluded aircraft
types that are only used for cargo flights from the dataset,5 as no seat number could be
determined. If a plane is multi-purpose and can be operated both as a passenger plane and as
cargo, we included it. Planes with fewer than 14 seats are excluded from the World Airliner
5 Airbus A330-200F, Airbus C212, Antonov AN-12, Antonov AN-30, Antonov AN-124, Antonov AN-178, Antonov AN-225, Boeing 777F, GAF Nomad, Harbin Y-12, Ilyushin IL-76, Lockheed L-100 HERCULES, Lockheed L-188 ELECTRA, McDonnell-Douglas DC-3
11
Census data. We have allocated airlines to the countries where their company offices are
registered. We determined the locations using information available on the Internet, such as
ch-aviation.com, flightglobal.com, and other sources.
Technical Characteristics and Fuel Economy
We determined the maximum range, maximum fuel capacity, typical number of seats, and the
year of first flight for each of the 143 aircraft types in our dataset. We used original company
documentation from Airbus, Boeing, and other manufacturers, which are openly available on
the Internet. For a small number of older aircraft, and for some specific models of a given
type of aircraft we could not locate technical data. In this case, we took the data of the most
similar model of the same type of aircraft, or the data for a different type of aircraft from the
same manufacturer.6 The exact list of aircraft used, their technical data, and the sources for
the technical data are in the Appendix.
As explained above, we use three alternative measures of fleet fuel economy in our study. We
calculate the simple (observed) fuel economy of aircraft model j, .U, as follows:
.U =
\U]U U
∗ 100 (6)
where F denotes maximum fuel capacity, R maximum range in kilometers, and S is the
typical number of seats.7 Fuel economy of each airline fleet is calculated by weighting
aircraft model fuel economy by the total number of seats available for model j for that airline,
U"# , dividing by the total number of seats on all aircraft available to that airline, "#, and
summing over all models:
."# =T U"#
"#.U
_
U`a
(7)
Thus the metric we have is the average efficiency per seat in a fleet, calculated across the
different aircraft types. Lower values indicate higher fleet fuel economy.
6 These changes are documented in the Technical Appendix. 7 We used typical number of seats in an aircraft. However, in some cases only maximum numbers were available. The exact sources and the seat number specifications are found in the Technical Appendix.
12
To account for the fact that larger aircraft tend to be more fuel-efficient, we also construct an
alternative, “size-adjusted” fuel economy measure, clean of the effect of aircraft size. The
reason we adjust the dependent variable rather than control for size in the regression analysis
is that our intention is to remove only the technology effect of aircraft size on fuel economy.
There may also be a behavioral effect of aircraft size on the choice fuel economy. This is
done by regressing .U on the average number of seats U for that model:
ln .U = Z5 + Zabln U − ln^ccccd +TZefa+eU
g
e`a
+ [_ (8)
where 23^cccc is the mean of 23 U across all aircraft models. Because average aircraft size may
have increased over time, we include K-1 decadal dummies, +e , for each decade prior to the
most recent decade. These control for the time of the first flight of each aircraft model.8 We
then predict size-adjusted fuel economy for each plane model:
.Uh = Fi* jln.U − Zabln U − ln^ccccdk (9)
We then aggregate aircraft model fuel economy to airline level as before, giving us a size-
adjusted fleet fuel economy:
."#h = ∑
mnopmop.Uh_
U`a . (10)
Our third measure, size and age adjusted fleet fuel economy, also removes the effect of model
age from the fleet economy variable:
.Uq = Fi*bln.U − Zabln U − ln^ccccd − ∑ Zefa+eUg
e`a d, (11)
We aggregate as before:
."#q = ∑
mnopmop.Uq_
U`a . (12)
Wages:
We estimate wages (w) based on the available wage data in the ICAO (2015) database. A
small number of airlines have wage data in nominal US dollars converted at market exchange 8 Where data on the year of the first flight was not available, we allocated a decade based on our best guess. These assumptions are documented in the Appendix.
13
rates for 2015 in the ICAO database. For these airlines we compute an average wage for all
staff at the airline. We use mid-year data on staff numbers unless only year-end data were
available. Some of this data is clearly anomalous and we deleted obviously incorrect values.
This includes all average wages above $200,000 and $1,000.9 For airlines without apparently
reliable 2015 data but seemingly reliable wage for earlier years in the database, we used that
earlier wage to project the wage in 2015 using the parameters from a within airline regression
(i.e. using fixed effects for each airline) reported in Table 2. For Venezuela we used 2013
estimates. We could estimate wages for 491 airlines in this manner. The within regression
regresses the logarithm of wages on GDP per capita data both in nominal US dollars
converted at market exchange rates. Table 1 presents these results:
Dependent Variable
Within Regression
ln wage
Between Regression
ln wage 2015USD
ln GDP per capita 0.8317*** ln GDP per capita 2015USD 0.5540***
(0.0443)
(0.0234)
Constant 4.9805***
(0.2357)
N 2480 491
R-squared 0.309
0.598
Heteroskedasticity robust standard errors in parentheses. Standard errors for within regression are clustered by airline.
* p<0.10, ** p<0.05, *** p<0.01
Table 1: Wage Regressions
The regression shows that wages increase by 0.83% for a 1% increase in GDP per capita.
This coefficient is significantly less than 1. We project the 2015 wage rate as follows:
lnrs",t5au = lnrs",v + 0.8317blnz",t5au − lnz",vd (13)
where rs",t5au is the projected wage, r",v is the wage in the base year, and z",t5au and z",v
are GDP per capita in 2015 and the base year respectively in USD converted at market
exchange rates.
9 We did use a value of $834 in 2006 for Kyrgyzstan Airways to project the 2015 value.
14
Where no reliable wage data are available in the ICAO database we use the following
regression procedure: first we converted all apparently reliable nominal wages to 2015 US
Dollars using the US implicit GDP price deflator. We converted the GDP per capita for the
relevant country and year in the same way. We then used the between estimator to estimate a
regression of the log of wages on GDP per capita. The results are also in Table 1. A pooled
OLS regression on the sample of 2480 original data points produces almost identical results.
As we would expect, airline jobs are relatively well paying in poor countries and so the
elasticity is substantially less than unity. We then used the between regression results to
project wages to the remaining airlines using observations on GDP per capita in 2015 in US
dollars converted at market exchange rates in the relevant country:
lnrs",t5au = 4.9805 + 0.5540lnz",t5au (14)
where rs",t5au is the projected wage and z",t5au is 2015 GDP per capita in USD converted at
market exchange rates. Where 2015 data were not available, we used the most recent year
from the World Development Indicators. We used the Penn World Table to obtain values for
2014 for Syria and Taiwan. We used a variety of online sources for a number of small island
countries such as the Cook Islands, Greenland, and Guam and for North Korea.
Interest Rates
Real interest rates (r), which we use as proxy for the cost of capital, were sourced from the
World Bank (2017) and the ECB (2017).10 The World Bank uses the data from the
International Monetary Fund, International Financial Statistics and its GDP deflator, to
calculate real interest rates. As the World Bank data are missing interest rates for a large
number of countries including all countries in the Euro Area, we calculated the real interest
rates for a number of European countries, by using the ECB’s (2017) composite cost of
borrowing on new loans for non-financial corporations and deflating it with the World
Bank’s (2017) deflator.11
10 “Real interest rate is the lending interest rate adjusted for inflation as measured by the GDP deflator. The terms and conditions attached to lending rates differ by country, however, limiting their comparability.” (World Bank definition, series: FR.INR.RINR) 11 “Inflation as measured by the annual growth rate of the GDP implicit deflator shows the rate of price change in the economy as a whole. The GDP implicit deflator is the ratio of GDP in current local currency to GDP in constant local currency.” (World Bank definition, series: NY.GDP.DEFL.KD.ZG).
15
Output
We approximate output, which measures the effect of economies of scale, as the total seats
available to an airline. This assumes that all airlines operate all plane types for the same
fraction of available time with the same loading. Obviously, a more direct measure of traffic
volume such as passenger-miles flown would be a better measure of output. While the IATA
does offer monthly traffic data for some of its member carriers, the reported numbers are
voluntary and only cover at most 130 airlines.
The airline industry is highly heterogeneous within and across countries. As we cover 174
countries in our sample, we had to make a number of simplifying assumptions in order to
estimate our models. One of the limitations of the estimation is the assumption that airlines
use all airplanes with the same loading and for the same fraction of time. In truth, load factors
vary significantly across airlines. Due to the very large number of airlines used, such load
factors were not available, without reducing our sample size ten-fold.
Aviation Fuel Price
Data on aviation fuel prices are not readily available for our dataset on a country level. While
fuel on international flights is untaxed, countries within their jurisdiction may choose to tax
domestic aviation fuel. Fuel prices for international flights at international trading hubs vary
slightly. Also, airlines might not refuel in their country of origin, but might do so while flying
different “legs” of their international routes and fuel prices for domestic and international
airlines in some countries may differ. Platts offers jet fuel price comparison on a regional
(continental) basis for one day of a year, and daily spot prices for several major trading hubs
are only available on a subscription basis. Below is a snapshot of regional jet fuel prices as of
25 April 2017:
16
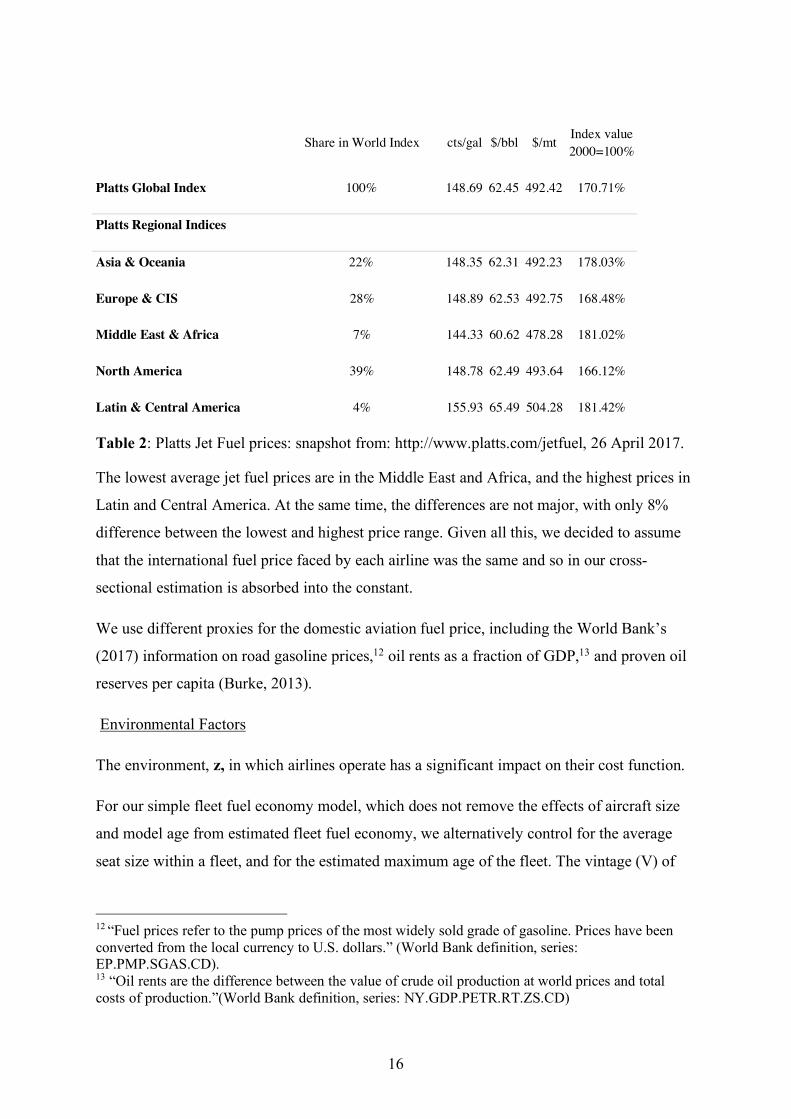
Share in World Index cts/gal $/bbl $/mt Index value 2000=100%
Platts Global Index 100% 148.69 62.45 492.42 170.71%
Platts Regional Indices
Asia & Oceania 22% 148.35 62.31 492.23 178.03%
Europe & CIS 28% 148.89 62.53 492.75 168.48%
Middle East & Africa 7% 144.33 60.62 478.28 181.02%
North America 39% 148.78 62.49 493.64 166.12%
Latin & Central America 4% 155.93 65.49 504.28 181.42%
Table 2: Platts Jet Fuel prices: snapshot from: http://www.platts.com/jetfuel, 26 April 2017.
The lowest average jet fuel prices are in the Middle East and Africa, and the highest prices in
Latin and Central America. At the same time, the differences are not major, with only 8%
difference between the lowest and highest price range. Given all this, we decided to assume
that the international fuel price faced by each airline was the same and so in our cross-
sectional estimation is absorbed into the constant.
We use different proxies for the domestic aviation fuel price, including the World Bank’s
(2017) information on road gasoline prices,12 oil rents as a fraction of GDP,13 and proven oil
reserves per capita (Burke, 2013).
Environmental Factors
The environment, z, in which airlines operate has a significant impact on their cost function.
For our simple fleet fuel economy model, which does not remove the effects of aircraft size
and model age from estimated fleet fuel economy, we alternatively control for the average
seat size within a fleet, and for the estimated maximum age of the fleet. The vintage (V) of
12 “Fuel prices refer to the pump prices of the most widely sold grade of gasoline. Prices have been converted from the local currency to U.S. dollars.” (World Bank definition, series: EP.PMP.SGAS.CD). 13 “Oil rents are the difference between the value of crude oil production at world prices and total costs of production.”(World Bank definition, series: NY.GDP.PETR.RT.ZS.CD)
17
the fleet is calculated by deducting the year of the first (YF) flight for a specific model from
2015:
}",# = 2015 − �\",# (15)
This gives us the maximum age of a specific aircraft flown in a fleet. We take the seat
weighted average of the aircraft age, in a given fleet, giving us effectively the maximum age
of a seat in a fleet.
}"# =T U"#
"#}U
_
U`a
(16)
The average seat size within a fleet is calculated in a similar manner:
"# = T U"#
"#U
_
U`a
(17)
All models also control for country area and population. These variables control for the fact
that larger countries in both population and area might see a higher number of flights between
cities and this might not simply be a function of either area or density. A higher average
distance between cities would increase the share of domestic travel that takes place by air.
While small countries usually would have more international air travel relative to domestic, a
large small population country such as Australia might also have relatively more international
travel than a large more densely populated country such as China. Country area controls for
the increased likelihood of internal flights, which face the domestic fuel price. Both variables
are sourced from the WDI (World Bank, 2017).
We control for the general air-traffic activity in a country by using data on the number of
passengers carried per country (World Bank, 2017).14 We also control for unobserved
geographical and regional characteristics of the area airlines operate in, using dummy
variables for the World Bank’s regional classification including, East Asia and Pacific,
Europe & Central Asia, Latin America & Caribbean, Middle East & North Africa, North
America, South Asia, and Sub-Saharan Africa. East Asia and Pacific is the default region in
our regressions. 14 “Air passengers carried include both domestic and international aircraft passengers of air carriers registered in the country” (World Bank definition, series: EP.PMP.DESL.CD).
18
5. Results
5.1. Characteristics of airline fleet fuel economy
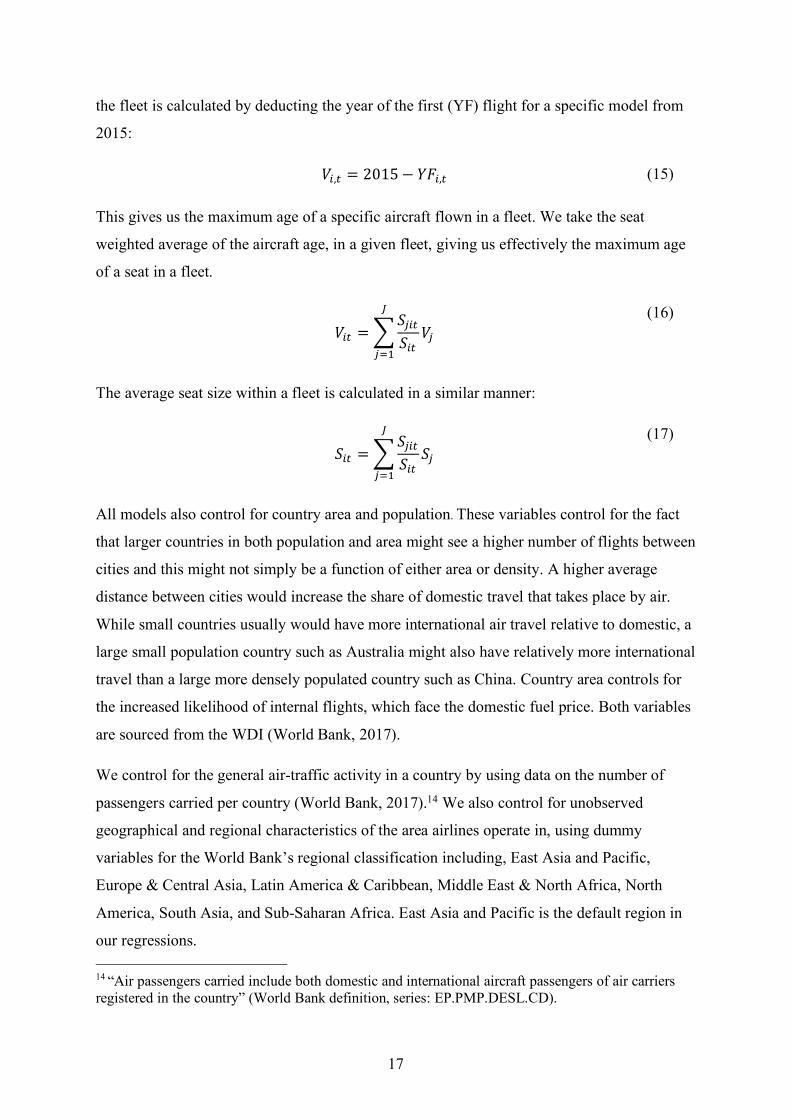
Figure 1 presents the relationship between aircraft seat fuel economy, and the first year of
flight. The Figure shows that on average the fuel economy of new aircraft models has been
improving over the past 70 years, in line with our expectations.
Figure 1: Aircraft fuel economy in the year of first flight for a sample of 143 aircraft models
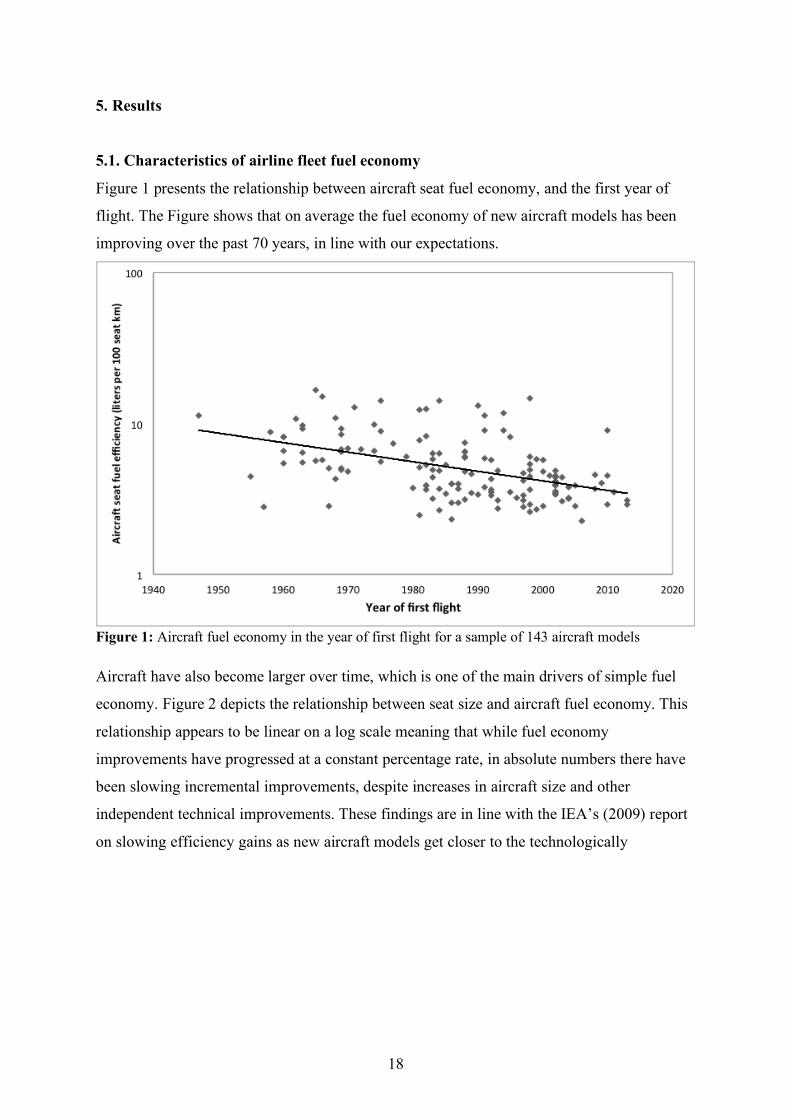
Aircraft have also become larger over time, which is one of the main drivers of simple fuel
economy. Figure 2 depicts the relationship between seat size and aircraft fuel economy. This
relationship appears to be linear on a log scale meaning that while fuel economy
improvements have progressed at a constant percentage rate, in absolute numbers there have
been slowing incremental improvements, despite increases in aircraft size and other
independent technical improvements. These findings are in line with the IEA’s (2009) report
on slowing efficiency gains as new aircraft models get closer to the technologically
19
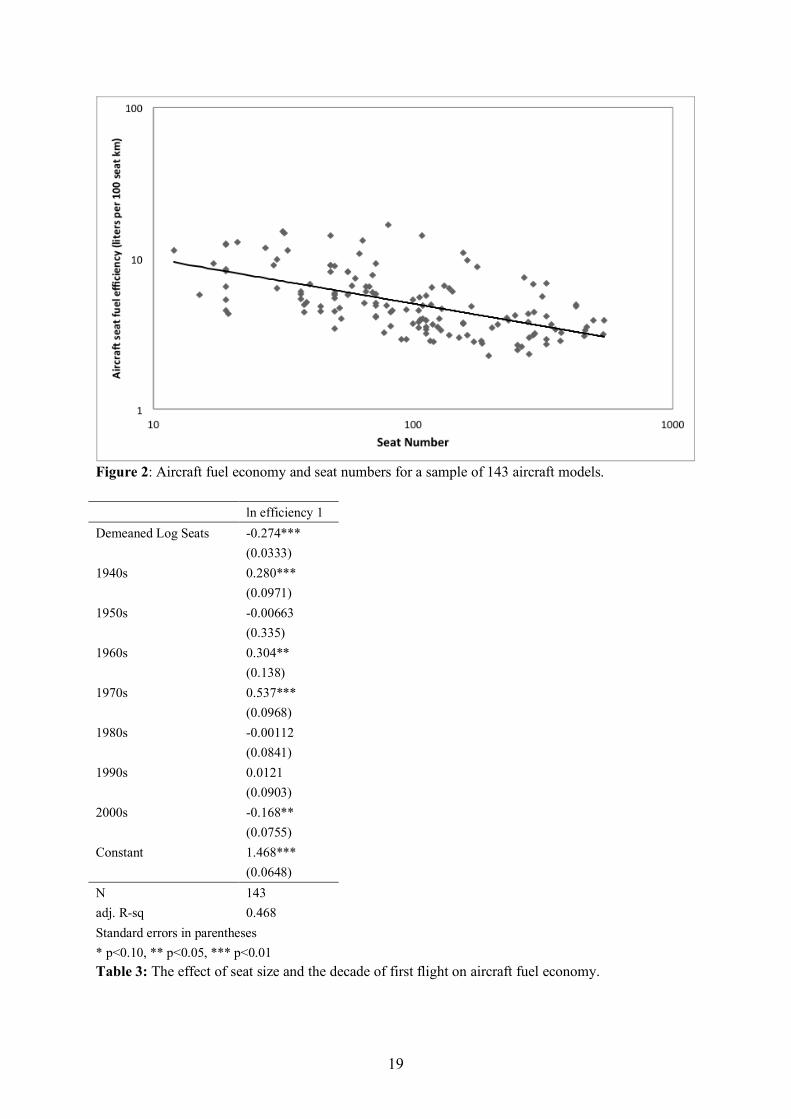
Figure 2: Aircraft fuel economy and seat numbers for a sample of 143 aircraft models.
Table 3: The effect of seat size and the decade of first flight on aircraft fuel economy.
ln efficiency 1 Demeaned Log Seats -0.274***
(0.0333) 1940s 0.280***
(0.0971) 1950s -0.00663
(0.335) 1960s 0.304**
(0.138) 1970s 0.537***
(0.0968) 1980s -0.00112
(0.0841) 1990s 0.0121
(0.0903) 2000s -0.168**
(0.0755) Constant 1.468*** (0.0648) N 143 adj. R-sq 0.468 Standard errors in parentheses * p<0.10, ** p<0.05, *** p<0.01
20
achievable fuel efficiency levels. Noteworthy, older aircraft sometimes get retrofitted with
newer engines and wingtips etc. Our data cannot capture such retrofitting.
Table 3 shows the magnitude of the impact of aircraft size on efficiency, while controlling for
the fact that technology has been changing over time. We find that planes with more seats are
significantly more fuel-efficient independent of the time effect. The numbers indicate that
aircraft introduced in the 1940s, 1960s, and 1970s were significantly less fuel-efficient than
recent aircraft, ceteris paribus. Aircraft introduced in the first decade of the 21st Century were
more fuel-efficient.
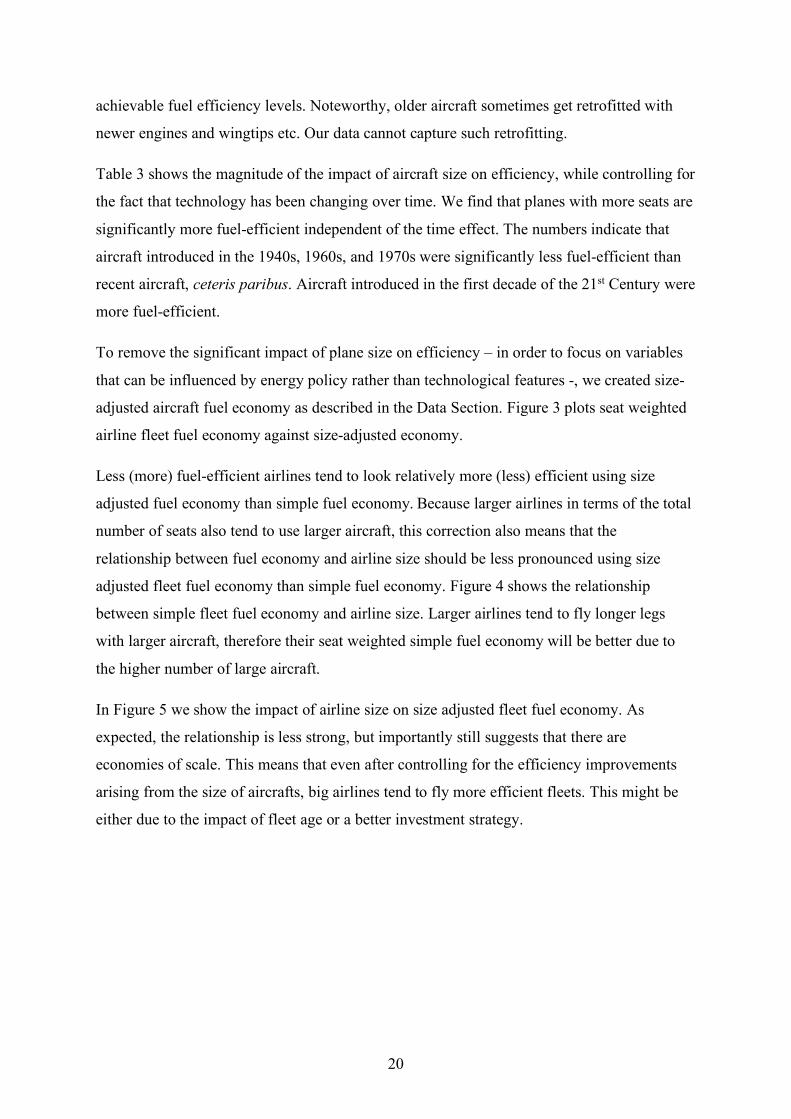
To remove the significant impact of plane size on efficiency – in order to focus on variables
that can be influenced by energy policy rather than technological features -, we created size-
adjusted aircraft fuel economy as described in the Data Section. Figure 3 plots seat weighted
airline fleet fuel economy against size-adjusted economy.
Less (more) fuel-efficient airlines tend to look relatively more (less) efficient using size
adjusted fuel economy than simple fuel economy. Because larger airlines in terms of the total
number of seats also tend to use larger aircraft, this correction also means that the
relationship between fuel economy and airline size should be less pronounced using size
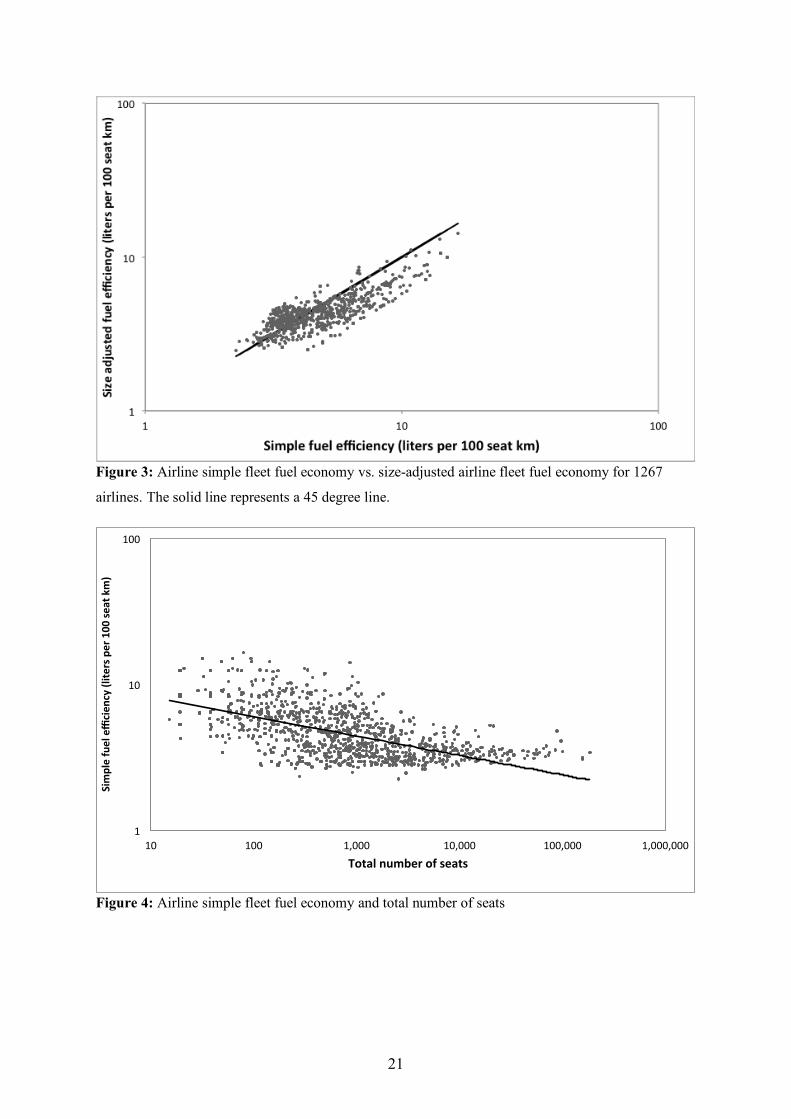
adjusted fleet fuel economy than simple fuel economy. Figure 4 shows the relationship
between simple fleet fuel economy and airline size. Larger airlines tend to fly longer legs
with larger aircraft, therefore their seat weighted simple fuel economy will be better due to
the higher number of large aircraft.
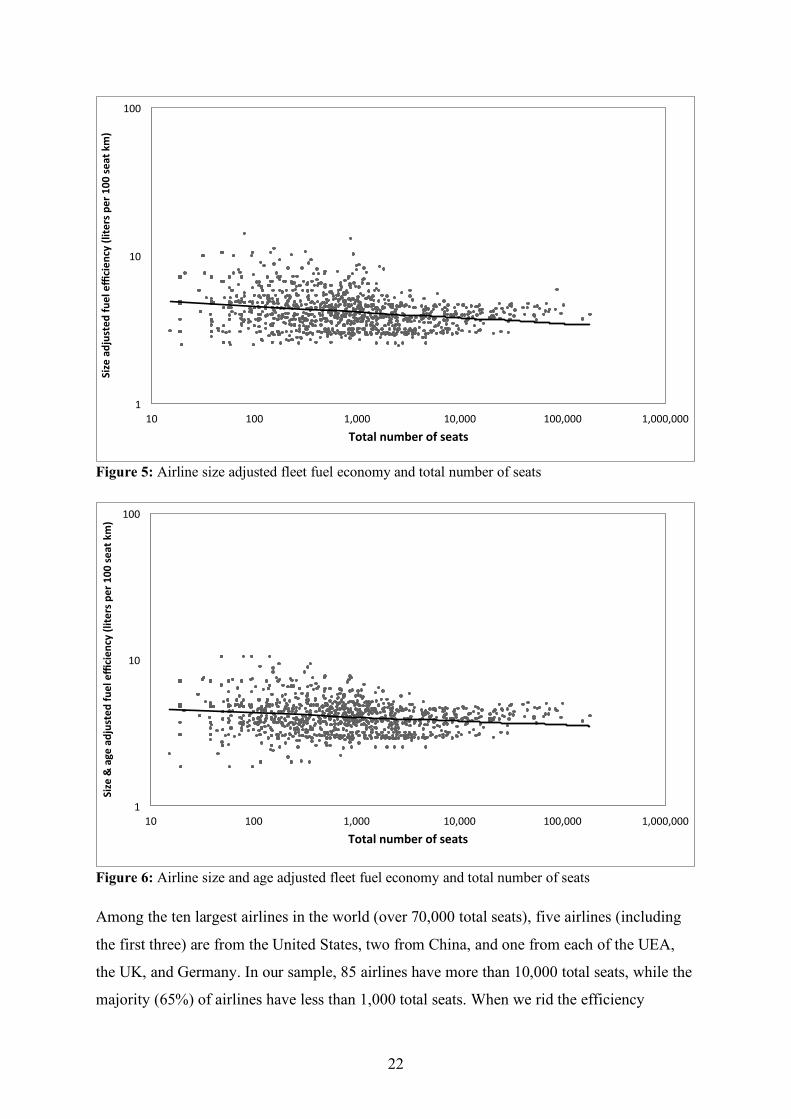
In Figure 5 we show the impact of airline size on size adjusted fleet fuel economy. As
expected, the relationship is less strong, but importantly still suggests that there are
economies of scale. This means that even after controlling for the efficiency improvements
arising from the size of aircrafts, big airlines tend to fly more efficient fleets. This might be
either due to the impact of fleet age or a better investment strategy.
21
Figure 3: Airline simple fleet fuel economy vs. size-adjusted airline fleet fuel economy for 1267
airlines. The solid line represents a 45 degree line.
Figure 4: Airline simple fleet fuel economy and total number of seats
1
10
100
10 100 1,000 10,000 100,000 1,000,000
Simplefuelefficien
cy(lite
rsper100se
atkm)
Totalnumberofseats
22
Figure 5: Airline size adjusted fleet fuel economy and total number of seats
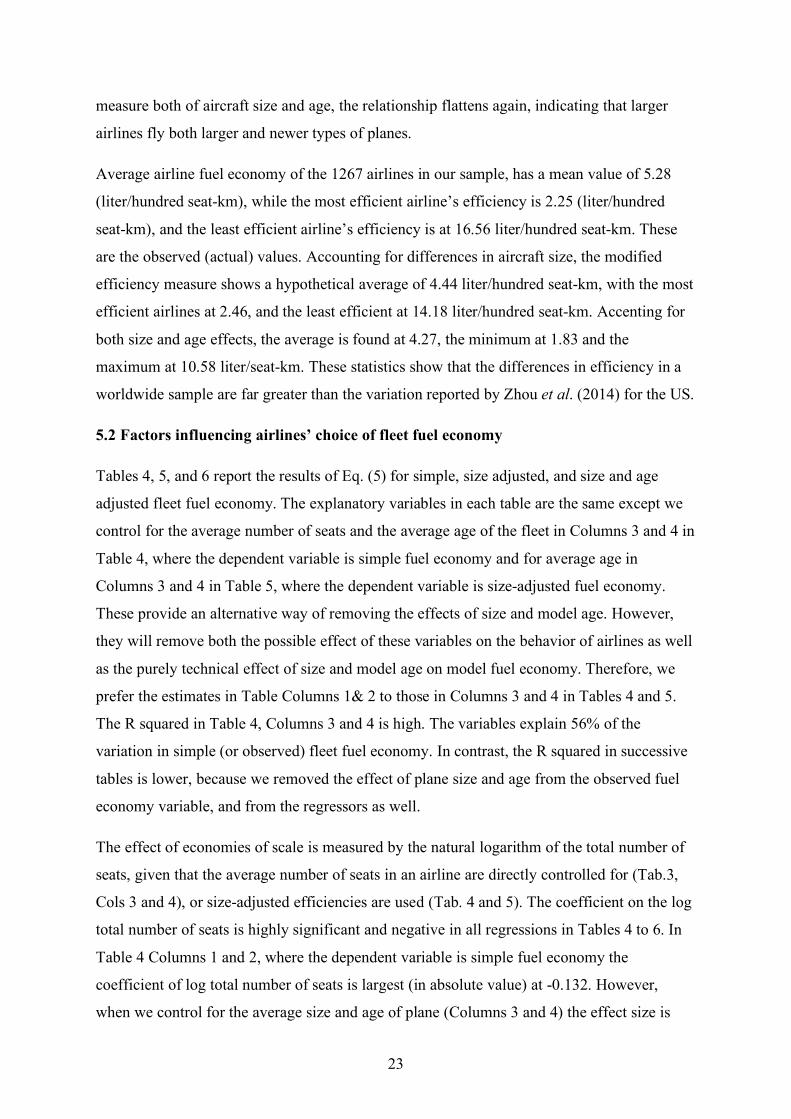
Figure 6: Airline size and age adjusted fleet fuel economy and total number of seats
Among the ten largest airlines in the world (over 70,000 total seats), five airlines (including
the first three) are from the United States, two from China, and one from each of the UEA,
the UK, and Germany. In our sample, 85 airlines have more than 10,000 total seats, while the
majority (65%) of airlines have less than 1,000 total seats. When we rid the efficiency
1
10
100
10 100 1,000 10,000 100,000 1,000,000
Sizeadjustedfuelefficien
cy(lite
rsper100se
atkm)
Totalnumberofseats
1
10
100
10 100 1,000 10,000 100,000 1,000,000
Size&ageadjustedfuelefficien
cy(lite
rsper100se
atkm)
Totalnumberofseats
23
measure both of aircraft size and age, the relationship flattens again, indicating that larger
airlines fly both larger and newer types of planes.
Average airline fuel economy of the 1267 airlines in our sample, has a mean value of 5.28
(liter/hundred seat-km), while the most efficient airline’s efficiency is 2.25 (liter/hundred
seat-km), and the least efficient airline’s efficiency is at 16.56 liter/hundred seat-km. These
are the observed (actual) values. Accounting for differences in aircraft size, the modified
efficiency measure shows a hypothetical average of 4.44 liter/hundred seat-km, with the most
efficient airlines at 2.46, and the least efficient at 14.18 liter/hundred seat-km. Accenting for
both size and age effects, the average is found at 4.27, the minimum at 1.83 and the
maximum at 10.58 liter/seat-km. These statistics show that the differences in efficiency in a
worldwide sample are far greater than the variation reported by Zhou et al. (2014) for the US.
5.2 Factors influencing airlines’ choice of fleet fuel economy
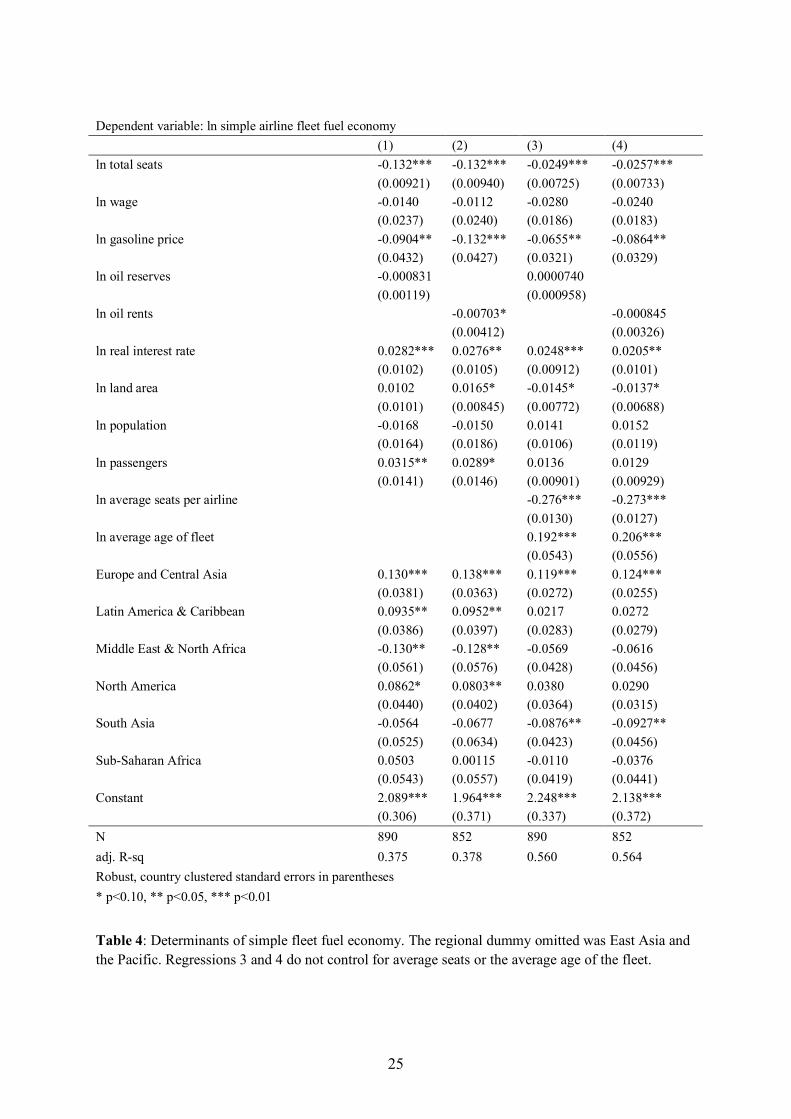
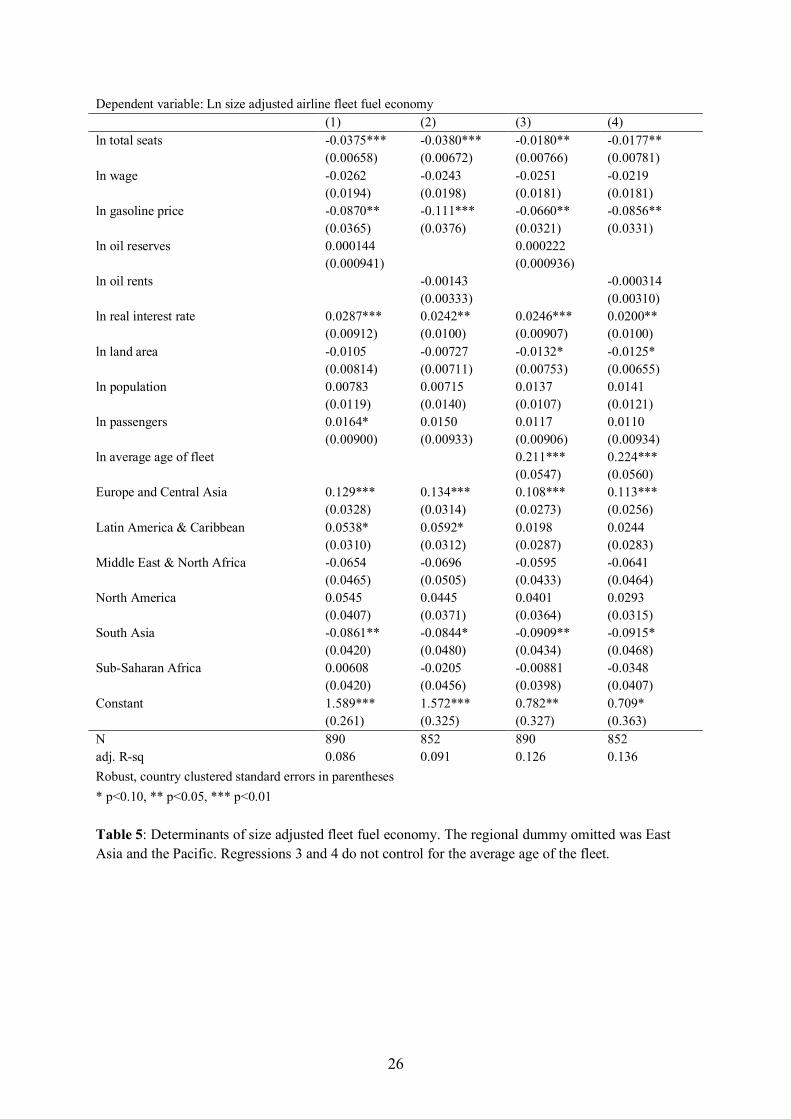
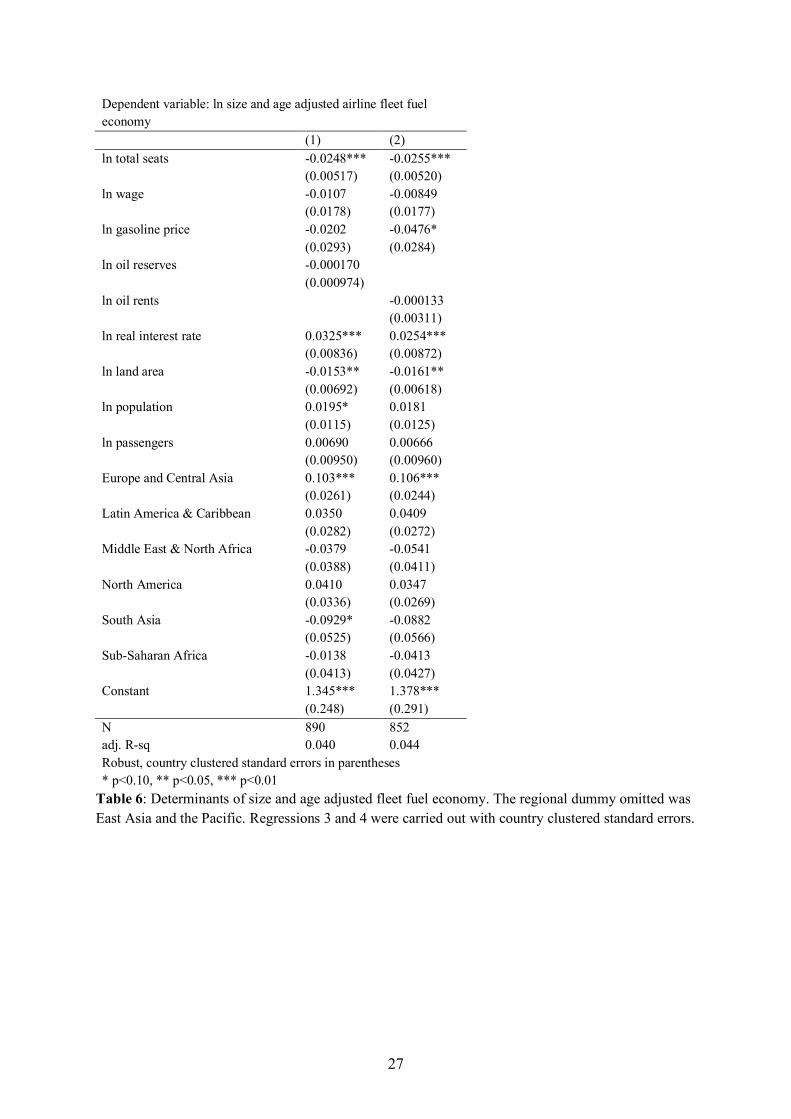
Tables 4, 5, and 6 report the results of Eq. (5) for simple, size adjusted, and size and age
adjusted fleet fuel economy. The explanatory variables in each table are the same except we
control for the average number of seats and the average age of the fleet in Columns 3 and 4 in
Table 4, where the dependent variable is simple fuel economy and for average age in
Columns 3 and 4 in Table 5, where the dependent variable is size-adjusted fuel economy.
These provide an alternative way of removing the effects of size and model age. However,
they will remove both the possible effect of these variables on the behavior of airlines as well
as the purely technical effect of size and model age on model fuel economy. Therefore, we
prefer the estimates in Table Columns 1& 2 to those in Columns 3 and 4 in Tables 4 and 5.
The R squared in Table 4, Columns 3 and 4 is high. The variables explain 56% of the
variation in simple (or observed) fleet fuel economy. In contrast, the R squared in successive
tables is lower, because we removed the effect of plane size and age from the observed fuel
economy variable, and from the regressors as well.
The effect of economies of scale is measured by the natural logarithm of the total number of
seats, given that the average number of seats in an airline are directly controlled for (Tab.3,
Cols 3 and 4), or size-adjusted efficiencies are used (Tab. 4 and 5). The coefficient on the log
total number of seats is highly significant and negative in all regressions in Tables 4 to 6. In
Table 4 Columns 1 and 2, where the dependent variable is simple fuel economy the
coefficient of log total number of seats is largest (in absolute value) at -0.132. However,
when we control for the average size and age of plane (Columns 3 and 4) the effect size is
24
much smaller at -0.025 to -0.026. Here though the partial effect of a change in total seat
number is equivalent to that of a change in the number of planes the airline operates. In Table
5 (Columns 1 and 2) the returns to scale effect is -0.038. Here the dependent variable adjusts
for the technical effect of plane size on fuel economy. In Table 6, where the dependent
variable is adjusted for model age, which reduces the variation in fuel economy further, the
returns to scale effect is only -0.026, though still statistically significant. There may be
various reasons why we find economies of scale. For example, larger firms may get better
deals on new aircraft and have more flexible financing opportunities.
As international or domestic aviation fuel prices were not available, we use road gasoline
prices, oil rents as a % of GDP, and oil reserves, as proxy variables. The results for gasoline
prices are similar for the simple and size-adjusted efficiency measures, with elasticities
ranging from -0.09 to -0.132 for simple fleet fuel economy, and -0.087 to -0.11 for size-
adjusted fleet fuel economy, when we do not control for fleet model age and significant at the
1 or 5% level. In Table 6, where we adjust fuel economy for the model age of the fleet, the
coefficient on the price of gasoline is smaller and not significant at the 5% level. This shows
that the response to variations in fuel price is largely addressed by varying the model age of
planes employed. Our reported elasticities are somewhat smaller than Li et al. ’s (2009) and
Burke and Nishitateno (2013)’s results on car fleet fuel economy, who respectively find that a
1% increase in fuel prices results in a 0.2% improvement in fleet fuel economy, and to a
0.15-0.2% improvement in new vehicle fleet fuel economy. Of course, cars have a much
lower lifespan than aircraft and as we only approximate jet fuel prices these estimates are
likely subject to attenuation due to measurement error (Hausman, 2001). We also
simultaneously control for oil rents as a percentage of GDP and for oil reserves in a country,
both an indicator of fuel prices in general and of subsidies. We do not find the coefficient on
either variable significant, after including gasoline prices.
Wages, which constitute one of the largest operating expenses of airlines were not found to
be significant in any of the regressions in Tables 4 to 6, though the sign of the effect is as
expected. As we estimated wages for many airlines based observations for other airlines and
GDP per capita, this is likely the result of measurement error. We would expect that airlines
operating in poor vs. rich countries would show differences in their airline fleet fuel
economy, although the generally higher interest rates in lower-income countries might be
picking up this effect.
25
Dependent variable: ln simple airline fleet fuel economy (1) (2) (3) (4) ln total seats -0.132*** -0.132*** -0.0249*** -0.0257***
(0.00921) (0.00940) (0.00725) (0.00733) ln wage -0.0140 -0.0112 -0.0280 -0.0240
(0.0237) (0.0240) (0.0186) (0.0183) ln gasoline price -0.0904** -0.132*** -0.0655** -0.0864**
(0.0432) (0.0427) (0.0321) (0.0329) ln oil reserves -0.000831 0.0000740 (0.00119) (0.000958) ln oil rents -0.00703* -0.000845
(0.00412) (0.00326) ln real interest rate 0.0282*** 0.0276** 0.0248*** 0.0205**
(0.0102) (0.0105) (0.00912) (0.0101) ln land area 0.0102 0.0165* -0.0145* -0.0137*
(0.0101) (0.00845) (0.00772) (0.00688) ln population -0.0168 -0.0150 0.0141 0.0152
(0.0164) (0.0186) (0.0106) (0.0119) ln passengers 0.0315** 0.0289* 0.0136 0.0129
(0.0141) (0.0146) (0.00901) (0.00929) ln average seats per airline -0.276*** -0.273***
(0.0130) (0.0127) ln average age of fleet 0.192*** 0.206***
(0.0543) (0.0556) Europe and Central Asia 0.130*** 0.138*** 0.119*** 0.124***
(0.0381) (0.0363) (0.0272) (0.0255) Latin America & Caribbean 0.0935** 0.0952** 0.0217 0.0272
(0.0386) (0.0397) (0.0283) (0.0279) Middle East & North Africa -0.130** -0.128** -0.0569 -0.0616
(0.0561) (0.0576) (0.0428) (0.0456) North America 0.0862* 0.0803** 0.0380 0.0290
(0.0440) (0.0402) (0.0364) (0.0315) South Asia -0.0564 -0.0677 -0.0876** -0.0927**
(0.0525) (0.0634) (0.0423) (0.0456) Sub-Saharan Africa 0.0503 0.00115 -0.0110 -0.0376
(0.0543) (0.0557) (0.0419) (0.0441) Constant 2.089*** 1.964*** 2.248*** 2.138*** (0.306) (0.371) (0.337) (0.372) N 890 852 890 852 adj. R-sq 0.375 0.378 0.560 0.564 Robust, country clustered standard errors in parentheses * p<0.10, ** p<0.05, *** p<0.01 Table 4: Determinants of simple fleet fuel economy. The regional dummy omitted was East Asia and the Pacific. Regressions 3 and 4 do not control for average seats or the average age of the fleet.
26
Dependent variable: Ln size adjusted airline fleet fuel economy (1) (2) (3) (4) ln total seats -0.0375*** -0.0380*** -0.0180** -0.0177**
(0.00658) (0.00672) (0.00766) (0.00781) ln wage -0.0262 -0.0243 -0.0251 -0.0219
(0.0194) (0.0198) (0.0181) (0.0181) ln gasoline price -0.0870** -0.111*** -0.0660** -0.0856**
(0.0365) (0.0376) (0.0321) (0.0331) ln oil reserves 0.000144 0.000222 (0.000941) (0.000936) ln oil rents -0.00143 -0.000314
(0.00333) (0.00310) ln real interest rate 0.0287*** 0.0242** 0.0246*** 0.0200**
(0.00912) (0.0100) (0.00907) (0.0100) ln land area -0.0105 -0.00727 -0.0132* -0.0125*
(0.00814) (0.00711) (0.00753) (0.00655) ln population 0.00783 0.00715 0.0137 0.0141
(0.0119) (0.0140) (0.0107) (0.0121) ln passengers 0.0164* 0.0150 0.0117 0.0110
(0.00900) (0.00933) (0.00906) (0.00934) ln average age of fleet 0.211*** 0.224***
(0.0547) (0.0560) Europe and Central Asia 0.129*** 0.134*** 0.108*** 0.113***
(0.0328) (0.0314) (0.0273) (0.0256) Latin America & Caribbean 0.0538* 0.0592* 0.0198 0.0244
(0.0310) (0.0312) (0.0287) (0.0283) Middle East & North Africa -0.0654 -0.0696 -0.0595 -0.0641
(0.0465) (0.0505) (0.0433) (0.0464) North America 0.0545 0.0445 0.0401 0.0293
(0.0407) (0.0371) (0.0364) (0.0315) South Asia -0.0861** -0.0844* -0.0909** -0.0915*
(0.0420) (0.0480) (0.0434) (0.0468) Sub-Saharan Africa 0.00608 -0.0205 -0.00881 -0.0348
(0.0420) (0.0456) (0.0398) (0.0407) Constant 1.589*** 1.572*** 0.782** 0.709* (0.261) (0.325) (0.327) (0.363) N 890 852 890 852 adj. R-sq 0.086 0.091 0.126 0.136 Robust, country clustered standard errors in parentheses * p<0.10, ** p<0.05, *** p<0.01 Table 5: Determinants of size adjusted fleet fuel economy. The regional dummy omitted was East Asia and the Pacific. Regressions 3 and 4 do not control for the average age of the fleet.
27
Dependent variable: ln size and age adjusted airline fleet fuel economy (1) (2) ln total seats -0.0248*** -0.0255***
(0.00517) (0.00520) ln wage -0.0107 -0.00849
(0.0178) (0.0177) ln gasoline price -0.0202 -0.0476*
(0.0293) (0.0284) ln oil reserves -0.000170 (0.000974) ln oil rents -0.000133
(0.00311) ln real interest rate 0.0325*** 0.0254***
(0.00836) (0.00872) ln land area -0.0153** -0.0161**
(0.00692) (0.00618) ln population 0.0195* 0.0181
(0.0115) (0.0125) ln passengers 0.00690 0.00666
(0.00950) (0.00960) Europe and Central Asia 0.103*** 0.106***
(0.0261) (0.0244) Latin America & Caribbean 0.0350 0.0409
(0.0282) (0.0272) Middle East & North Africa -0.0379 -0.0541
(0.0388) (0.0411) North America 0.0410 0.0347
(0.0336) (0.0269) South Asia -0.0929* -0.0882
(0.0525) (0.0566) Sub-Saharan Africa -0.0138 -0.0413
(0.0413) (0.0427) Constant 1.345*** 1.378*** (0.248) (0.291) N 890 852 adj. R-sq 0.040 0.044 Robust, country clustered standard errors in parentheses * p<0.10, ** p<0.05, *** p<0.01
Table 6: Determinants of size and age adjusted fleet fuel economy. The regional dummy omitted was East Asia and the Pacific. Regressions 3 and 4 were carried out with country clustered standard errors.
28
Dependent Variable: ln simple airline fleet
fuel economy ln size adjusted airline
fleet fuel economy
ln size and age adjusted airline fleet fuel
economy
(1) (2) (3) (4) (5) (6)
ln total seats -0.0856***
-0.0856*** -0.0141** -0.0145** -0.00103 -0.00143
(0.0110) (0.0111) (0.00710) (0.00719) (0.00579) (0.00582) ln wage -0.0239 -0.0236 -0.00432 -0.00594 0.0219 0.0219
(0.0274) (0.0284) (0.0196) (0.0202) (0.0180) (0.0186)
ln gasoline price -0.0752*** -0.104***
-0.0809***
-0.0932*** -0.0559**
-0.0669***
(0.0205) (0.0241) (0.0228) (0.0250) (0.0225) (0.0237) ln oil reserves -0.00126* -0.000444 -0.000394 (0.000750) (0.000723) (0.000761) ln oil rents -0.00660* -0.00167 -0.00127
(0.00351) (0.00310) (0.00281) ln real interest rate 0.0105* 0.0116** 0.0118 0.0107 0.0154** 0.0141*
(0.00574) (0.00564) (0.00758) (0.00774) (0.00671) (0.00717) ln land area 0.00893 0.0133** -0.00632 -0.00294 -0.00882 -0.00758
(0.00640) (0.00573) (0.00585) (0.00461) (0.00537) (0.00501) ln population -0.0231* -0.0205 -0.000428 -0.000109 0.00892 0.00935
(0.0134) (0.0147) (0.0102) (0.0112) (0.0100) (0.0110) ln passengers 0.0346*** 0.0322** 0.00837 0.00654 -0.00240 -0.00274
(0.0131) (0.0135) (0.00995) (0.0100) (0.00970) (0.00990) Europe and Central Asia 0.0692*** 0.0769*** 0.0584*** 0.0666*** 0.0401** 0.0444**
(0.0210) (0.0212) (0.0211) (0.0198) (0.0201) (0.0203) Latin America & Caribbean 0.0563** 0.0605** 0.00121 0.00612 -0.00893 -0.00451
(0.0282) (0.0300) (0.0234) (0.0238) (0.0222) (0.0225) Middle East & North Africa
-0.0785*** -0.0738** -0.0611* -0.0562 -0.0472 -0.0462
(0.0285) (0.0300) (0.0324) (0.0351) (0.0306) (0.0332) North America 0.0504* 0.0603** -0.00243 0.00357 -0.0274 -0.0246
(0.0295) (0.0288) (0.0274) (0.0255) (0.0257) (0.0239)
South Asia -0.0615** -0.0722** -0.0893*** -0.0884**
-0.0894*** -0.0895**
(0.0298) (0.0335) (0.0335) (0.0361) (0.0315) (0.0342) Sub-Saharan Africa 0.0874** 0.0607 0.0312 0.0217 0.0184 0.00616
(0.0415) (0.0437) (0.0346) (0.0384) (0.0351) (0.0385) Constant 1.979*** 1.876*** 1.487*** 1.473*** 1.161*** 1.137*** (0.295) (0.326) (0.237) (0.267) (0.222) (0.254) N 890 852 890 852 890 852 adj. R-sq 0.305 0.303 0.026 0.029 0.009 0.008 Robust, country clustered standard errors in parentheses * p<0.10, ** p<0.05, *** p<0.01
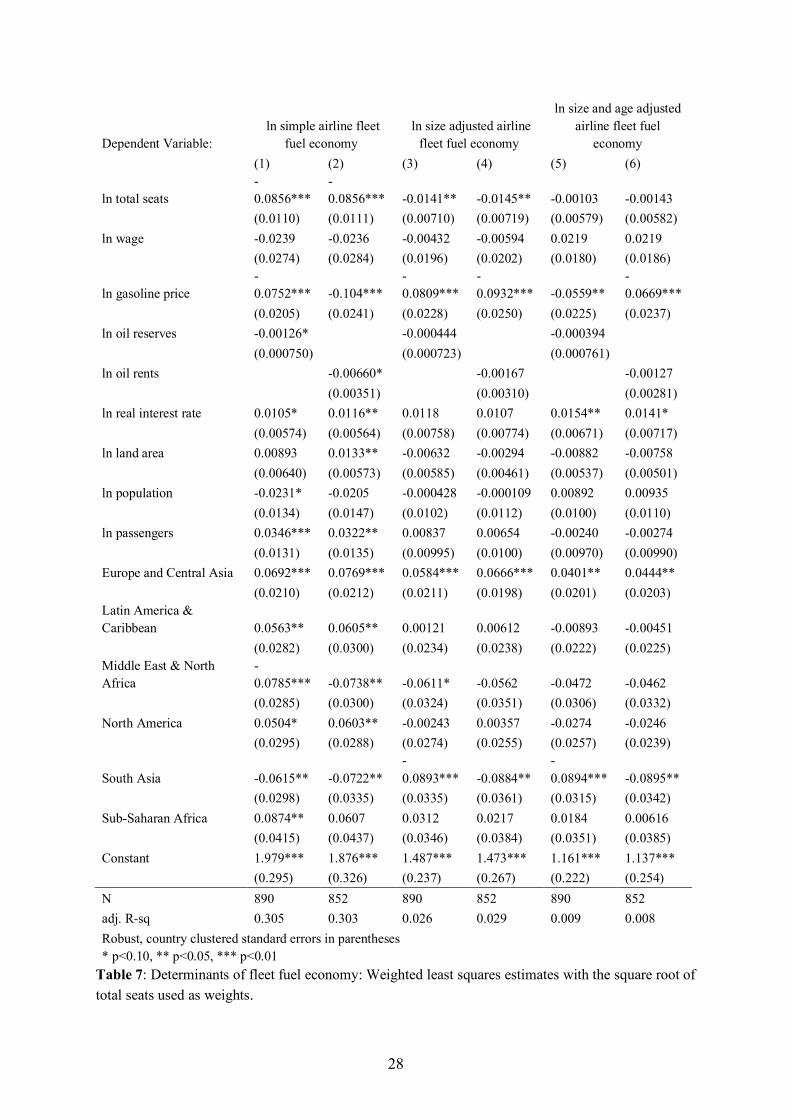
Table 7: Determinants of fleet fuel economy: Weighted least squares estimates with the square root of total seats used as weights.
29
We find that real interest rates are significant at the 1% to 5% level in all specifications, and
have a positive coefficient as expected. This means that a 1% increase in interest rates (for
example from 1.0 to 1.01% in levels), will result in the worsening of long-run fleet fuel
economy between 0.02 to 0.033 %. Higher interest rates not only mean a higher cost of
capital for purchasing aircraft, but are also incorporated in lease-rates, effectively increasing
the cost of renting an aircraft. Therefore, higher interest rates are likely to result in less
investment into newer, efficient technologies.
Finally, we consider the environmental variables. We find that greater land area is associated
with better fuel economy only when we adjust or control for model age. This indicates that
even though we control for the size of the aircraft and the size of the airline, airlines based in
larger countries fly more technically efficient aircraft. Population and passenger numbers
were not found to be a significant driver of fleet fuel economy.
We find compared to the base region of East Asia and the Pacific that Europe and Central
Asia has significantly worse fleet fuel economy. This result is remarkably robust in all three
specifications, and is not only driven by airlines in Russia and the USSR successor states, but
also by airlines in the European Union. The results are not attributable to the age of the fleets
or to the size of the aircraft, but potentially to different technology used in planes of the same
age and seat size. These planes are often manufactured by smaller companies. Compared to
the base region, South-Asia also shows significantly higher efficiency in some specifications
including our central estimates in Columns 3 and 4 in Table 5. In the simple fleet fuel
economy regressions without the fleet age and average seat size controls, a number of
regional dummies are significant. Most of these inferences disappear however, once we
adjust or control for seat size and age.
We present weighted least squares estimates in Table 7 focusing on the size adjusted
estimates in Columns 3 and 4. These are broadly similar to those in Table 5. The returns to
scale effect is smaller here, the dummy for Europe and Central Asia has a smaller effect, and
the coefficient of the South Asia dummy is much more significant.
6. Conclusions and Policy Implications
In this paper, we investigated the impact of plane size and age, fuel prices, capital costs,
wages and airline size on technically achievable fleet fuel economy. We constructed a dataset
30
from plane-level data for 1267 airlines in 2015. Newer and bigger aircraft are more efficient.
We find that, ceteris paribus, larger airlines – as measured by total number of seats – have
higher fleet fuel economy. This suggests that there are economies of scale in fuel efficiency
choice. Larger airlines not only fly larger, and thus more fuel-efficient planes, but they use
more fuel-efficient aircraft independent of the size (and also model age) of aircraft. One of
the explanations is that larger airlines potentially have better access to financing or lower
capital costs and are willing to invest in more fuel-efficient aircraft. We also find that the
elasticity of fleet fuel economy with respect to the price of fuel is between -0.07 to -0.13,
depending on specification, where a negative sign indicates an improvement in fleet fuel
economy with higher fuel prices. This value is only a little lower than previous studies have
reported for road vehicle fleet fuel economy. Higher interest rates are, on the other hand,
associated with worse fleet fuel economy. Wages were not found to have a significant effect.
We find that, despite a wide range of controls, some regional differences persist, which are
independent of the age or the size of the aircraft or the other controls. These differences are
best explained by the evolution of different technological designs for aircraft of the same size
and age throughout the world.
Looking into the future, our findings confirm that airline fleet fuel economy is significantly
though very inelastically responsive to changes in fuel prices as well as credit costs and
availability. The policy implications of these findings are twofold: We see that higher taxes
on domestic aviation fuel, the removal of fuel subsidies, or taxes on aircraft GHG emissions
would in fact result in some improvement of fleet fuel economy through change in the
composition of the fleet. Our estimate of the fuel economy elasticity treats the current price
of aircraft of varying fuel efficiency as an implicit given. Induced technical change could
increase the long-run response by lowering the cost of fuel-efficient aircraft. On the other
hand, there could also be some leakage (Jacobsen and van Benthem, 2015) if global fuel price
increases lowered the price of less fuel-efficient aircraft.
As international agreements on aircraft emissions standards are consistently delayed, and the
introduction of carbon pricing has been limited to regional initiatives, the removal of fuel
subsidies would seem the most plausible course of action. While some states may keep
subsidizing fuel in order to support their national flagship carriers, we have seen several
successful examples of fossil fuel subsidy removal. Long-run efficiency gains may translate
to long-run profits for firms, and the economy, result in cleaner skies and a pathway to
emission reductions of the aviation sector.
31
References
Adrangi, B., Gritta, R. D., Raffiee, K. (2014). “Dynamic interdependence in jet fuel prices
and air carrier revenues”, Atlantic Economic Journal 42: 473–474.
Alcott, H. Wozny, N. (2014). “Gasoline prices, fuel economy and the energy paradox”, The
Review of Economics and Statistics 96(5): 779-795.
Anger, A. Koehler, J. (2010). “Including aviation emissions in the EU ETS: much ado about
nothing? A review”, Transport Policy 17(1): 38-46.
Babikian, R., Lukachko, S. P., Waitz, I. A. (2002). “The historical fuel efficiency
characteristics of regional aircraft from technological, operational, and cost perspectives”,
Journal of Air Transport Management 8: 389–400.
Barreto L., Kemp, R. (2008). “Inclusion of technology diffusion in energy-system models:
some gaps and needs”, Journal of Cleaner Production 16S1: 95-101.
Benmelech, E., Bergman, N. (2011). “Vintage capital and creditor protection”, Journal of
Financial Economics 99: 308–332.
Berry, S. Jia, P. (2010). “Tracing the woes: an empirical analysis of the airline industry”,
American Economic Journal: Microeconomics 2: 1–43.
Borenstein, S. (2011). “Why can’t US airlines make money?” American Economic Review
101(3): 233–237.Burke, P. J. (2013). The national-level energy ladder and its carbon
implications, Environment and Development Economics 18(4): 484–503.
Burke P. J., Nishitateno, S. (2013). “Gasoline prices, gasoline consumption, and new-vehicle
fuel economy: Evidence for a large sample of countries”, Energy Economics 36: 363–370.
Caves, D. W. Christensen, L. R., Tretheway, M. W. (1984). “Economies of density versus
economies of scale - why trunk and local-service airline costs differ”, Rand Journal Of
Economics 15(4): 471-489.
Coelli, T., Perelman, S., Romano, E. (1999). “Accounting for environmental influences in
stochastic frontier models: With application to international airlines”, Journal of Productivity
Analysis 11(3): 251-273.
Economist, The (2012). “Buy or rent?”, http://www.economist.com/node/21543195, print
32
edition: Jan 21st, 2012.
EASA/EEA/EUROCONTROL (2016). European Aviation Environmental Report, DOI:
10.1007/s11293-013-9388-9, ISBN: 978-92-9210-197-8
Eisfeldt, A., Rampini, A. (2006). “Capital reallocation and liquidity”, Journal of Monetary
Economics 53(3): 369–399.
ECB (2017). European Central Bank data: Corporates’ cost of borrowing, %: https://sdw-
wsrest.ecb.europa.eu/service/data/MIR/M.AT+BE+CY+DE+EE+ES+FI+FR+GR+IE+IT+LT
+LU+LV+MT+NL+PT+SI+SK+U2.B.A2I.AM.R.A.2240.EUR.N?startPeriod=2003
Flightglobal (2015). World Airliner Census 2015. https://www.flightglobal.com/asset/3480
GAO- United States Government Accountability Office (2014). Report to Congressional
Committees, Aviation, Impact of Fuel Price Increases on the Aviation Industry, GAO-14-
331.
Gavazza, A. (2011). “Leasing and secondary markets: theory and evidence from commercial
aircraft”, Journal of Political Economy 119(2): 325-377.
Gillen, D. W., Oum, T. H., Tretheway, M.W. (1990). “Airline cost structure and policy
implications: a multi-product approach for Canadian airlines”, Journal of Transport
Economics and Policy 24(1): 9-34.
Greve, H. R., Seidel, M-D. L. (2015). “The thin red line between success and failure: Path
dependence in the diffusion of innovative production technologies”, Strategic Management
Journal 36: 475-496.
Hausman, J. (2001). “Mismeasured variables in econometric analysis: problems from the
right and problems from the left”, Journal of Economic Perspectives 54(4): 57-67.
ICAO - International Civil Aviation Organization (2016). Assembly — 39th Session, Agenda
Item 22: Environmental Protection – International Aviation and Climate Change – Policy,
Standardization and Implementation Support, Working Paper: A39-WP/207, EX/77, 18/8/16
IEA – International Energy Agency (2009). Transport, Energy and CO2, moving towards
sustainability, IEA/OECD 2009, (61 2009 25 1P1) ISBN: 978-92-64-07316-6.
IEA (2014). World Energy Outlook 2014, International Energy Agency.
33
IEA (2016). World Energy Outlook 2016, International Energy Agency.
Inglada, V, Rey, B, Rodriguez-Alvarez, A, Coto-Millan, P. (2006). “Liberalisation and
efficiency in international air transport”, Transportation Research Part A-Policy and Practice
40(2): 95-105.
Jacobsen, M.R., van Benthem, A.A. (2015). “Vehicle Scrappage and Gasoline Policy”,
American Economic Review 105(3): 1312–1338
Jaffe, A., Stavins, R. (1994). “The energy paradox and the diffusion of conservation
technology”, Resource and Energy Economics 16: 91–122.
Kahn, M. E., Nickelsburg, J. (2016). „An economic analysis of U.S. airline fuel economy
dynamics from 1991 to 2015”, NBER Working Paper 22830.
Keen, M. Strand, J. (2007). “Indirect taxes on international aviation”, Fiscal Studies 28(1): 1–
41.
Klier, T., Linn, J. (2010). “The price of gasoline and new vehicle fuel economy: evidence
from monthly sales data”, American Economic Journal: Economic Policy 2: 134–153.
Lee, J. J., Lukachko, S. P., Waitz, I. A., Schafer, A. (2001). “Historical and future trends in
aircraft performance, cost, and emissions”, Annual Review of Energy and the Environment
26: 167–200.
Lee, J. J. (2010). “Can we accelerate the improvement of energy efficiency in aircraft
systems”? Energy Conversion and Management 51: 189–196.
Li, S., Timmins, C., von Haefen R. H. (2009). “How do gasoline prices affect fleet fuel
economy?” American Economic Journal: Economic Policy 1(2): 113–137.
Murphy, F., Li, N. Murphy, B., Cummins, M. (2013). “The link between jet fuel prices,
carbon credits and airline firm value”, Journal of Energy Markets 6(2): 83-97.
Naumann, N., Suhl, L. (2013). “How does fuel price uncertainty affect strategic airline
planning?” Operational Research 13 (3): 343–362.
Nava, C. R., Meleo, L. Cassetta, E. Morelli, G. (2017). “The impact of the EU-ETS on the
aviation sector: competitive effects of abatement efforts by airlines”, Department of
34
Economics and Statistics “Cognetti de Martiis” Campus, Working Paper 10/17.
http://econpapers.repec.org/paper/utodipeco/201710.htm
Oum, T. H., Yu, C. Y. (1998). “Cost competitiveness of major airlines: An international
comparison”, Transportation Research Part A-Policy and Practice 32(6): 407-422.
Peeters, P. M., Middel, J., Hoolhorst, A. (2005). “Fuel efficiency of commercial aircraft�An
overview of historical and future trends”, National Aerospace Laboratory (NLR) Report:
NLR-CR-2005-669.
Romano, J. P., Wolf, M. (2017). “Resurrecting weighted least squares”, Journal of
Econometrics 197: 1–19.
Rosskopf, M., Lehner, S., Gollnick, V. (2014). “Economic -environmental trade-offs in long-
term airline fleet planning”, Journal of Air Transport Management 34: 109-115.
Scheelhaase J., Grimme, W., Schaefer M. (2010). “The inclusion of aviation in the EU
greenhouse gas emissions trading scheme – impacts on competition between European and
non-European network airlines”, Transportation Research Part D: Transport and
Environment 15(1): 14-25.
Sims R., Schaeffer R., Creutzig, F., Cruz-Núñez, X., D’Agosto, M., Dimitriu, D., Figueroa
Meza, M. J., Fulton L., Kobayashi, S., Lah, O., McKinnon, A., Newman, P., Ouyang, M.,
Schauer, J. J., Sperling, D., Tiwari, G. (2014). Transport. In: Climate Change 2014:
Mitigation of Climate Change. Contribution of Working Group III to the Fifth Assessment
Report of the Intergovernmental Panel on Climate Change [Edenhofer, O., Pichs-Madruga,
R., Sokona, Y., Farahani, E., Kadner, S., Seyboth, K., Adler, A., Baum, I., Brunner, S.,
Eickemeier, P., Kriemann, B., Savolainen, J., Schlömer, S., von Stechow, C., Zwickel, T.,
Minx, J. C. (eds.)]. Cambridge University Press, Cambridge, United Kingdom and New
York, NY, USA.
Verdolini, E., Galeotti, M. (2011). “At home and abroad: an empirical analysis of innovation
and diffusion in energy technologies”, Journal of Environmental Economics and
Management 61(2): 119-134.
Vespermann, J., Wittner, A. (2011). “Financial, ecological and managerial impacts of
emission trading schemes: the case of Lufthansa”, Business Strategy and the Environment
20(3): 174-191.
35
World Bank (2017). World Development Indicators. http://data.worldbank.org/data-
catalog/world-development-indicators
Zou, B., Elke, M., Hansen, M., Kafle, N. (2014). “Evaluating air carrier fuel efficiency in the
US airline industry”, Transportation Research Part A 59: 306–330.
Zou, B., Kwan, I., Hansen, M., Rutherford, D., Kafle, N. (2016). Airline Fuel Efficiency:
Assessment Methodologies and Applications in the U.S. Domestic Airline Industry,
Advances in Airline Economics, edited by Peoples, J., Bitzan, J., Emerald Group Publishing.
Appendices:
• List of aircraft types used and technical data
• Sources of technical information
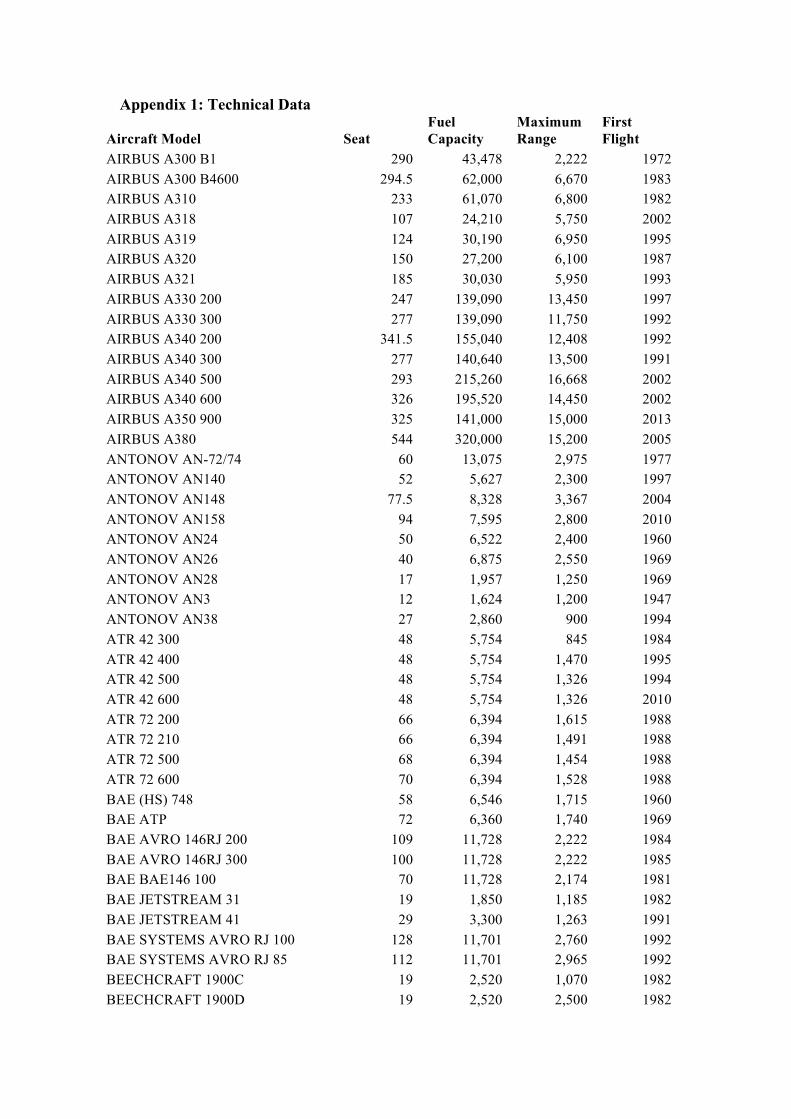
Appendix 1: Technical Data
Aircraft Model Seat Fuel Capacity
Maximum Range
First Flight
AIRBUS A300 B1 290 43,478 2,222 1972 AIRBUS A300 B4600 294.5 62,000 6,670 1983 AIRBUS A310 233 61,070 6,800 1982 AIRBUS A318 107 24,210 5,750 2002 AIRBUS A319 124 30,190 6,950 1995 AIRBUS A320 150 27,200 6,100 1987 AIRBUS A321 185 30,030 5,950 1993 AIRBUS A330 200 247 139,090 13,450 1997 AIRBUS A330 300 277 139,090 11,750 1992 AIRBUS A340 200 341.5 155,040 12,408 1992 AIRBUS A340 300 277 140,640 13,500 1991 AIRBUS A340 500 293 215,260 16,668 2002 AIRBUS A340 600 326 195,520 14,450 2002 AIRBUS A350 900 325 141,000 15,000 2013 AIRBUS A380 544 320,000 15,200 2005 ANTONOV AN-72/74 60 13,075 2,975 1977 ANTONOV AN140 52 5,627 2,300 1997 ANTONOV AN148 77.5 8,328 3,367 2004 ANTONOV AN158 94 7,595 2,800 2010 ANTONOV AN24 50 6,522 2,400 1960 ANTONOV AN26 40 6,875 2,550 1969 ANTONOV AN28 17 1,957 1,250 1969 ANTONOV AN3 12 1,624 1,200 1947 ANTONOV AN38 27 2,860 900 1994 ATR 42 300 48 5,754 845 1984 ATR 42 400 48 5,754 1,470 1995 ATR 42 500 48 5,754 1,326 1994 ATR 42 600 48 5,754 1,326 2010 ATR 72 200 66 6,394 1,615 1988 ATR 72 210 66 6,394 1,491 1988 ATR 72 500 68 6,394 1,454 1988 ATR 72 600 70 6,394 1,528 1988 BAE (HS) 748 58 6,546 1,715 1960 BAE ATP 72 6,360 1,740 1969 BAE AVRO 146RJ 200 109 11,728 2,222 1984 BAE AVRO 146RJ 300 100 11,728 2,222 1985 BAE BAE146 100 70 11,728 2,174 1981 BAE JETSTREAM 31 19 1,850 1,185 1982 BAE JETSTREAM 41 29 3,300 1,263 1991 BAE SYSTEMS AVRO RJ 100 128 11,701 2,760 1992 BAE SYSTEMS AVRO RJ 85 112 11,701 2,965 1992 BEECHCRAFT 1900C 19 2,520 1,070 1982 BEECHCRAFT 1900D 19 2,520 2,500 1982
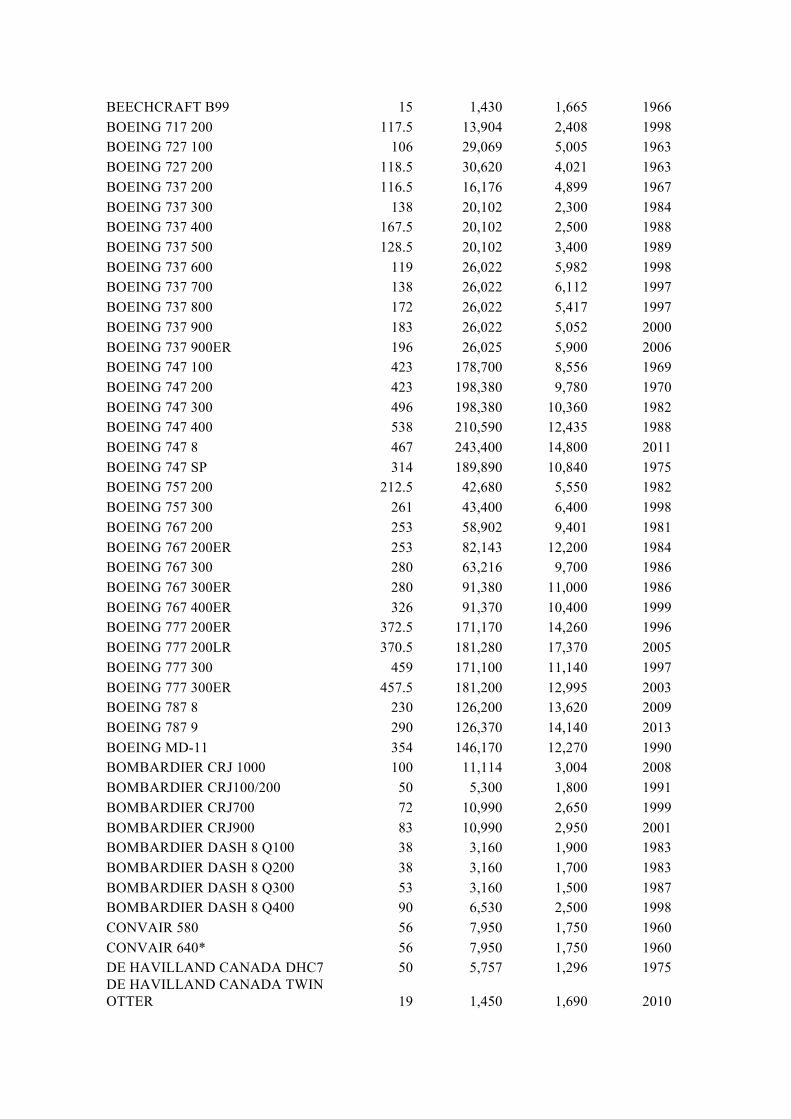
BEECHCRAFT B99 15 1,430 1,665 1966 BOEING 717 200 117.5 13,904 2,408 1998 BOEING 727 100 106 29,069 5,005 1963 BOEING 727 200 118.5 30,620 4,021 1963 BOEING 737 200 116.5 16,176 4,899 1967 BOEING 737 300 138 20,102 2,300 1984 BOEING 737 400 167.5 20,102 2,500 1988 BOEING 737 500 128.5 20,102 3,400 1989 BOEING 737 600 119 26,022 5,982 1998 BOEING 737 700 138 26,022 6,112 1997 BOEING 737 800 172 26,022 5,417 1997 BOEING 737 900 183 26,022 5,052 2000 BOEING 737 900ER 196 26,025 5,900 2006 BOEING 747 100 423 178,700 8,556 1969 BOEING 747 200 423 198,380 9,780 1970 BOEING 747 300 496 198,380 10,360 1982 BOEING 747 400 538 210,590 12,435 1988 BOEING 747 8 467 243,400 14,800 2011 BOEING 747 SP 314 189,890 10,840 1975 BOEING 757 200 212.5 42,680 5,550 1982 BOEING 757 300 261 43,400 6,400 1998 BOEING 767 200 253 58,902 9,401 1981 BOEING 767 200ER 253 82,143 12,200 1984 BOEING 767 300 280 63,216 9,700 1986 BOEING 767 300ER 280 91,380 11,000 1986 BOEING 767 400ER 326 91,370 10,400 1999 BOEING 777 200ER 372.5 171,170 14,260 1996 BOEING 777 200LR 370.5 181,280 17,370 2005 BOEING 777 300 459 171,100 11,140 1997 BOEING 777 300ER 457.5 181,200 12,995 2003 BOEING 787 8 230 126,200 13,620 2009 BOEING 787 9 290 126,370 14,140 2013 BOEING MD-11 354 146,170 12,270 1990 BOMBARDIER CRJ 1000 100 11,114 3,004 2008 BOMBARDIER CRJ100/200 50 5,300 1,800 1991 BOMBARDIER CRJ700 72 10,990 2,650 1999 BOMBARDIER CRJ900 83 10,990 2,950 2001 BOMBARDIER DASH 8 Q100 38 3,160 1,900 1983 BOMBARDIER DASH 8 Q200 38 3,160 1,700 1983 BOMBARDIER DASH 8 Q300 53 3,160 1,500 1987 BOMBARDIER DASH 8 Q400 90 6,530 2,500 1998 CONVAIR 580 56 7,950 1,750 1960 CONVAIR 640* 56 7,950 1,750 1960 DE HAVILLAND CANADA DHC7 50 5,757 1,296 1975 DE HAVILLAND CANADA TWIN OTTER 19 1,450 1,690 2010
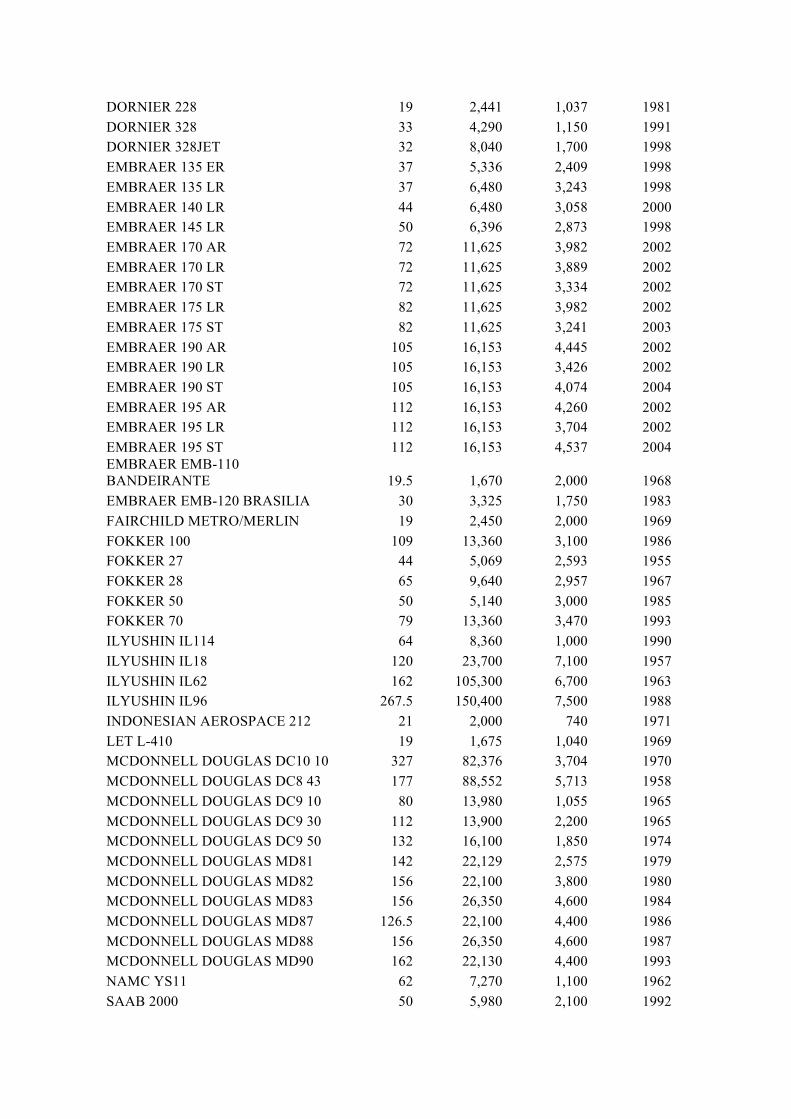
DORNIER 228 19 2,441 1,037 1981 DORNIER 328 33 4,290 1,150 1991 DORNIER 328JET 32 8,040 1,700 1998 EMBRAER 135 ER 37 5,336 2,409 1998 EMBRAER 135 LR 37 6,480 3,243 1998 EMBRAER 140 LR 44 6,480 3,058 2000 EMBRAER 145 LR 50 6,396 2,873 1998 EMBRAER 170 AR 72 11,625 3,982 2002 EMBRAER 170 LR 72 11,625 3,889 2002 EMBRAER 170 ST 72 11,625 3,334 2002 EMBRAER 175 LR 82 11,625 3,982 2002 EMBRAER 175 ST 82 11,625 3,241 2003 EMBRAER 190 AR 105 16,153 4,445 2002 EMBRAER 190 LR 105 16,153 3,426 2002 EMBRAER 190 ST 105 16,153 4,074 2004 EMBRAER 195 AR 112 16,153 4,260 2002 EMBRAER 195 LR 112 16,153 3,704 2002 EMBRAER 195 ST 112 16,153 4,537 2004 EMBRAER EMB-110 BANDEIRANTE 19.5 1,670 2,000 1968 EMBRAER EMB-120 BRASILIA 30 3,325 1,750 1983 FAIRCHILD METRO/MERLIN 19 2,450 2,000 1969 FOKKER 100 109 13,360 3,100 1986 FOKKER 27 44 5,069 2,593 1955 FOKKER 28 65 9,640 2,957 1967 FOKKER 50 50 5,140 3,000 1985 FOKKER 70 79 13,360 3,470 1993 ILYUSHIN IL114 64 8,360 1,000 1990 ILYUSHIN IL18 120 23,700 7,100 1957 ILYUSHIN IL62 162 105,300 6,700 1963 ILYUSHIN IL96 267.5 150,400 7,500 1988 INDONESIAN AEROSPACE 212 21 2,000 740 1971 LET L-410 19 1,675 1,040 1969 MCDONNELL DOUGLAS DC10 10 327 82,376 3,704 1970 MCDONNELL DOUGLAS DC8 43 177 88,552 5,713 1958 MCDONNELL DOUGLAS DC9 10 80 13,980 1,055 1965 MCDONNELL DOUGLAS DC9 30 112 13,900 2,200 1965 MCDONNELL DOUGLAS DC9 50 132 16,100 1,850 1974 MCDONNELL DOUGLAS MD81 142 22,129 2,575 1979 MCDONNELL DOUGLAS MD82 156 22,100 3,800 1980 MCDONNELL DOUGLAS MD83 156 26,350 4,600 1984 MCDONNELL DOUGLAS MD87 126.5 22,100 4,400 1986 MCDONNELL DOUGLAS MD88 156 26,350 4,600 1987 MCDONNELL DOUGLAS MD90 162 22,130 4,400 1993 NAMC YS11 62 7,270 1,100 1962 SAAB 2000 50 5,980 2,100 1992
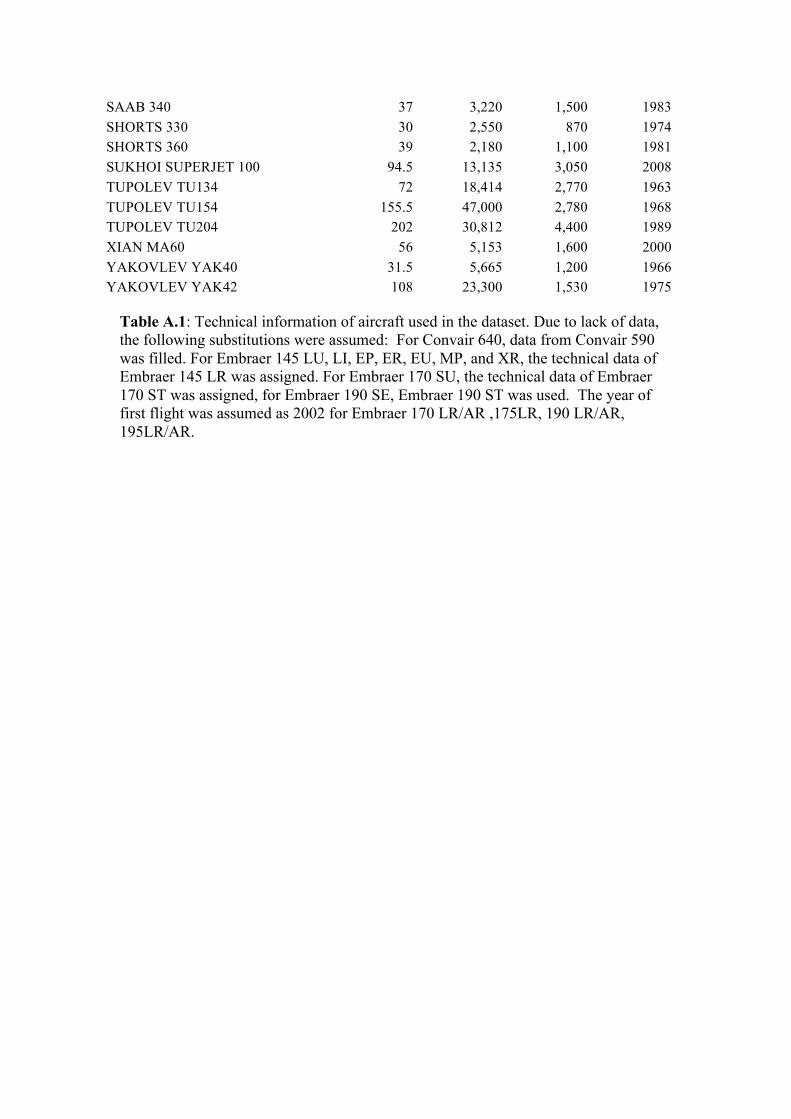
SAAB 340 37 3,220 1,500 1983 SHORTS 330 30 2,550 870 1974 SHORTS 360 39 2,180 1,100 1981 SUKHOI SUPERJET 100 94.5 13,135 3,050 2008 TUPOLEV TU134 72 18,414 2,770 1963 TUPOLEV TU154 155.5 47,000 2,780 1968 TUPOLEV TU204 202 30,812 4,400 1989 XIAN MA60 56 5,153 1,600 2000 YAKOVLEV YAK40 31.5 5,665 1,200 1966 YAKOVLEV YAK42 108 23,300 1,530 1975
Table A.1: Technical information of aircraft used in the dataset. Due to lack of data, the following substitutions were assumed: For Convair 640, data from Convair 590 was filled. For Embraer 145 LU, LI, EP, ER, EU, MP, and XR, the technical data of Embraer 145 LR was assigned. For Embraer 170 SU, the technical data of Embraer 170 ST was assigned, for Embraer 190 SE, Embraer 190 ST was used. The year of first flight was assumed as 2002 for Embraer 170 LR/AR ,175LR, 190 LR/AR, 195LR/AR.
AircraftModels
Appendix 2 Aircraft Model: A300 B1 Aircraft Version: B1 Seats: Average between single-class and three-class seating capacity. Source: http://www.aerospaceweb.org/aircraft/jetliner/a300/ Fuel Capacity: Source: EASA (2016) pp.8 The original data was 34000, but that was measurement was in kg. We converted this number to litres assuming a volume mass of .782 kg/L (number given in EASA, 2016). Maximum Range: First Flight: Source: http://www.actforlibraries.org/all-about-the-a300-airbus/ Aircraft Model: AIRBUS A300 B2 Aircraft Version: 100 Seats: Source: http://www.airbus.com/fileadmin/media_gallery/files/tech_data/AC/AC_A300_20091201.pdf Fuel Capacity: http://www.airbus.com/fileadmin/media_gallery/files/tech_data/AC/AC_A300_20091201.pdf Maximum Range: http://www.actforlibraries.org/all-about-the-a300-airbus/ First Flight: http://www.airbus.com/newsevents/news-events-single/detail/the-first-airbus-setting-new-standards-together/ Aircraft Model: AIRBUS A300 B2 Aircraft Version: 200 Seats: Average between single-class and three-class seating capacity. Source: http://www.airliners.net/aircraft-data/airbus-a300b2b4/17 Fuel Capacity: Source: http://www.airbus.com/fileadmin/media_gallery/files/tech_data/AC/AC_A300_20091201.pdf Maximum Range: Range with maximum passengers and reserves. Source: http://www.airliners.net/aircraft-data/airbus-a300b2b4/17 First Flight: Source: https://en.wikipedia.org/wiki/Airbus_A300 Aircraft Model: AIRBUS A300 B4 Aircraft Version: 100 Seats: Average between single-class and three-class seating capacity. Source: http://www.airliners.net/aircraft-data/airbus-a300b2b4/17 Fuel Capacity: Source: http://www.airbus.com/fileadmin/media_gallery/files/tech_data/AC/AC_A300_20091201.pdf Maximum Range: Source: https://en.wikipedia.org/wiki/Airbus_A300 First Flight: Source: https://en.wikipedia.org/wiki/Airbus_A300 Aircraft Model: AIRBUS A300 B4 Aircraft Version: 200 Seats: Average between single-class and two-class seating capacity. Source: https://www.airlines-inform.com/commercial-aircraft/Airbus-A300.html Fuel Capacity: Source: http://www.airbus.com/fileadmin/media_gallery/files/tech_data/AC/AC_A300_20091201.pdf Maximum Range: Assuming maximum number of passengers and reserves. Source: http://www.airliners.net/aircraft-data/airbus-a300b2b4/17 First Flight: Source: https://en.wikipedia.org/wiki/Airbus_A300
AircraftModels
Aircraft Model: AIRBUS A300 B4 Aircraft Version: 600 Seats: Seating information is for 600R: Seating capacity usually remains the same as the base when a long-range version is created. Source: https://www.airlines-inform.com/commercial-aircraft/Airbus-A300.html Fuel Capacity: Hyperlinked source (pp. 18) specifies 62000-76400 l depending on the engine used. Maximum Range: First Flight: http://www.airbus.com/company/history/the-interactive-timeline/ Aircraft Model: AIRBUS A310 Aircraft Version: 200 Seats: Average between single-class and three-class seating capacity. Source: https://www.airlines-inform.com/commercial-aircraft/Airbus-A310.html Fuel Capacity: Standard fuel capacity. Source: https://www.airlines-inform.com/commercial-aircraft/Airbus-A310.html Maximum Range: Assuming maximum payload. Source: https://www.airlines-inform.com/commercial-aircraft/Airbus-A310.html First Flight: Source: http://www.airbus.com/presscentre/pressreleases/press-release-detail/detail/a310-200-first-flight/ Aircraft Model: AIRBUS A310 Aircraft Version: 300 Seats: Average between single-class and three-class seating capacity. Source: https://www.airlines-inform.com/commercial-aircraft/Airbus-A310.html Fuel Capacity: Standard fuel capacity. Source: https://www.airlines-inform.com/commercial-aircraft/Airbus-A310.html Maximum Range: Assuming maximum payload. Source: https://www.airlines-inform.com/commercial-aircraft/Airbus-A310.html First Flight: http://www.airbus.com/company/history/the-interactive-timeline/ Aircraft Model: AIRBUS A318 Aircraft Version: A318 Seats: Typical seating capacity. Source: Airbus Family booklet (2016) Fuel Capacity: Source: Airbus Family booklet (2016) Maximum Range: Source: Airbus Family booklet (2016) First Flight: Source: http://www.airbus.com/presscentre/pressreleases/press-release-detail/detail/a318-takes-off-on-maiden-flight/ Aircraft Model: AIRBUS A319 Aircraft Version: A319 Seats: Typical seating capacity. Source: Airbus Family booklet (2016) Fuel Capacity: Source: Airbus Family booklet (2016) Maximum Range: Source: Airbus Family booklet (2016) First Flight: Source: http://www.dailypost.co.uk/business/business-news/airbus-a319-celebrates-20th-anniversary-9930148 Aircraft Model: AIRBUS A320 Aircraft Version: A320 Seats: Typical seating capacity. Source: Airbus Family booklet (2016) Fuel Capacity: Source: Airbus Family booklet (2016) Maximum Range: Source: Airbus Family booklet (2016) First Flight: Source: http://www.airbus.com/presscentre/pressreleases/press-release-detail/detail/a320-roll-out-and-first-flight/
AircraftModels
Aircraft Model: AIRBUS A321 Aircraft Version: A321 Seats: Typical seating capacity. Source: Airbus Family booklet (2016) Fuel Capacity: Source: Airbus Family booklet (2016) Maximum Range: Source: Airbus Family booklet (2016) First Flight: Source: http://www.airliners.net/aircraft-data/airbus-a321/24 Aircraft Model: AIRBUS A330 Aircraft Version: 200 Seats: Typical seating capacity. Source: Airbus Family booklet (2016) Fuel Capacity: Source: Airbus Family booklet (2016) Maximum Range: Source: Airbus Family booklet (2016) First Flight: Source: http://www.airliners.net/aircraft-data/airbus-a330-200/26 Aircraft Model: AIRBUS A330 Aircraft Version: 300 Seats: Typical seating capacity. Source: Airbus Family booklet (2016) Fuel Capacity: Source: Airbus Family booklet (2016) Maximum Range: Source: Airbus Family booklet (2016) First Flight: Source: http://www.airbus.com/company/history/the-interactive-timeline/ Aircraft Model: AIRBUS 340 Aircraft Version: 200 Seats: Average between single-class and three-class. Source: https://www.airlines-inform.com/commercial-aircraft/Airbus-A340-200.html Fuel Capacity: Standard fuel capacity. Source: http://www.airbus.com/aircraftfamilies/previous-generation-aircraft/a340family/a340-200/ Maximum Range: http://www.airbus.com/aircraftfamilies/previous-generation-aircraft/a340family/ First Flight: Source: http://www.airbus.com/company/history/the-interactive-timeline/ Aircraft Model: AIRBUS 340 Aircraft Version: 300 Seats: Typical number of seats. Source: http://www.airbus.com/aircraftfamilies/previous-generation-aircraft/a340family/a340-300/ Fuel Capacity: Alternative source: http://www.airbus.com/aircraftfamilies/previous-generation-aircraft/a340family/a340-300/ Maximum Range: Alternative source: http://www.airbus.com/aircraftfamilies/previous-generation-aircraft/a340family/a340-300/ First Flight: Source: http://www.airliners.net/aircraft-data/airbus-a340-200300/27 Aircraft Model: AIRBUS 340 Aircraft Version: 500 Seats: Typical number of seats. Source: http://www.airbus.com/aircraftfamilies/previous-generation-aircraft/a340family/a340-500/ Fuel Capacity: Source: http://www.airbus.com/aircraftfamilies/previous-generation-aircraft/a340family/a340-500/ Maximum Range: Source: http://www.airbus.com/aircraftfamilies/previous-generation-aircraft/a340family/a340-500/ First Flight: Source: http://www.airliners.net/aircraft-data/airbus-a340-500600/28 Aircraft Model: AIRBUS 340 Aircraft Version: 600 Seats: Typical number of seats.
AircraftModels
Source: http://www.airbus.com/aircraftfamilies/previous-generation-aircraft/a340family/a340-600/ Fuel Capacity: Source: http://www.airbus.com/aircraftfamilies/previous-generation-aircraft/a340family/a340-600/ Maximum Range: Source: http://www.airbus.com/aircraftfamilies/previous-generation-aircraft/a340family/a340-600/ First Flight: Source: http://www.airliners.net/aircraft-data/airbus-a340-500600/28 Aircraft Model: AIRBUS A350 Aircraft Version: 900 Seats: Typical number of seats. Source: http://www.airbus.com/aircraftfamilies/passengeraircraft/a350xwbfamily/a350-900/ Fuel Capacity: Source: http://www.airbus.com/aircraftfamilies/passengeraircraft/a350xwbfamily/a350-900/ Maximum Range: Source: http://www.airbus.com/aircraftfamilies/passengeraircraft/a350xwbfamily/a350-900/ First Flight: Source: https://en.wikipedia.org/wiki/Airbus_A350_XWB Aircraft Model: AIRBUS 380 Aircraft Version: A380 Seats: Typical seating capacity. Source: Airbus Family booklet (2016) pp. 11 Fuel Capacity: http://www.airbus.com/fileadmin/media_gallery/files/brochures_publications/aircraft_families/Airbus-Family-figures-booklet-March2016.pdf Maximum Range: http://www.airbus.com/fileadmin/media_gallery/files/brochures_publications/aircraft_families/Airbus-Family-figures-booklet-March2016.pdf First Flight: Source: https://airwaysmag.com/airchive/flashback-friday-10th-anniversary-of-airbus-a380s-maiden-flight/ Aircraft Model: ANTONOV Aircraft Version: AN-72/74 Seats: Average of 72 and 74 seating capacity. Source(s): (72) http://www.airliners.net/aircraft-data/antonov-an-7274/39; (74) http://www.antonov.com/aircraft/passenger-aircraft/an-74 Fuel Capacity: Average of 72 and 74 fuel capacities. Source: http://www.dutchops.com/AC_Data/Antonov/Antonov_74/Antonov_An72_74.htm Maximum Range: Average of 72 and 74 given maximum fuel and reserves. Source: http://www.airliners.net/aircraft-data/antonov-an-7274/39 First Flight: Refers to 72.Source: http://www.airliners.net/aircraft-data/antonov-an-7274/39 Aircraft Model: ANTONOV Aircraft Version: AN-140 Seats: Source: http://www.airliners.net/aircraft-data/antonov-an-140/405 Fuel Capacity: The original data was 4400, but that was measurement was in kg. We converted this number to litres assuming a volume mass of .782 kg/L (number given in EASA, 2016). Source: https://www.airlines-inform.com/commercial-aircraft/An-140.html Maximum Range: Average of AI-30s and PW127s (both with 52 passengers). Source: http://www.airliners.net/aircraft-data/antonov-an-140/405 First Flight: Source: http://www.airliners.net/aircraft-data/antonov-an-140/405 Aircraft Model: ANTONOV Aircraft Version: AN148 Seats: Average of three variation types (-100A, -100B, and -100E). Source: https://www.airlines-inform.com/commercial-aircraft/An-148.html Fuel Capacity: Doesn't specify aircraft variation, we took -100B.
AircraftModels
Source: https://www.aircraftcompare.com/helicopter-airplane/Antonov-An-148/388 Maximum Range: Average of three variation types (-100A, -100B, and -100E) assuming maximum payload. Source: https://www.airlines-inform.com/commercial-aircraft/An-148.html First Flight: Source: http://www.antonov.com/aircraft/passenger-aircraft/an-148 Aircraft Model: ANTONOV Aircraft Version: AN-158 Seats: Average of two different class layouts on offer. Source: http://www.antonov.com/aircraft/passenger-aircraft/an-158 Fuel Capacity: The original data was 11900, but that was measurement was in kg. We converted this number to litres assuming a volume mass of .782 kg/L (number given in EASA, 2016). NB: Variations are -200, whereas most sources reference -100. Source: http://www.antonov.com/media/archive/FAMILY%20OVERVIEW.pdf Maximum Range: Average of two different class layouts on offer. Source: http://www.antonov.com/aircraft/passenger-aircraft/an-158 First Flight: Source: http://www.antonov.com/aircraft/passenger-aircraft/an-158 Aircraft Model: ANTONOV Aircraft Version: AN-24 Seats: Source: http://www.airliners.net/aircraft-data/antonov-an-24263032-xian-y-7/37 Fuel Capacity: The original data was 5100, but that was measurement was in kg. We converted this number to litres assuming a volume mass of .782 kg/L (number given in EASA, 2016). Source: https://www.airlines-inform.com/commercial-aircraft/An-24.html Maximum Range: Maximum range with maximum fuel. Other sources claim 550km with maximum payload. Source: http://www.airliners.net/aircraft-data/antonov-an-24263032-xian-y-7/37 First Flight: Source: http://www.airliners.net/aircraft-data/antonov-an-24263032-xian-y-7/37 Aircraft Model: ANTONOV Aircraft Version: AN-26 Seats: Source: http://www.antonov.com/aircraft/antonov-gliders-and-airplanes/an-26 Fuel Capacity: Source: http://www.aeromarine.com/An-26.pdf Maximum Range: Source: https://www.airlines-inform.com/commercial-aircraft/An-26.html First Flight: Source: https://www.airlines-inform.com/commercial-aircraft/An-26.html Aircraft Model: ANTONOV Aircraft Version: AN-28 Seats: Source: https://www.airlines-inform.com/commercial-aircraft/An-28.html Fuel Capacity: The original data was 1530, but that was measurement was in kg. We converted this number to litres assuming a volume mass of .782 kg/L (number given in EASA, 2016). Source: https://www.airlines-inform.com/commercial-aircraft/An-28.html Maximum Range: Source: https://www.airlines-inform.com/commercial-aircraft/An-28.html First Flight: Source: https://www.airlines-inform.com/commercial-aircraft/An-28.html Aircraft Model: ANTONOV Aircraft Version: AN-3T Seats: Source: https://www.airlines-inform.com/commercial-aircraft/An-2.html Fuel Capacity: The original data was 1270, but that was measurement was in kg. We converted this number to litres assuming a volume mass of .782 kg/L (number given in EASA, 2016). Source: https://www.airlines-inform.com/commercial-aircraft/An-2.html Maximum Range: Source: https://www.airlines-inform.com/commercial-aircraft/An-2.html First Flight: Source: https://www.airlines-inform.com/commercial-aircraft/An-2.html Aircraft Model: ANTONOV Aircraft Version: AN38 Seats: Source: https://www.airlines-inform.com/commercial-aircraft/An-38.html
AircraftModels
Fuel Capacity: Source: https://www.airlines-inform.com/commercial-aircraft/An-38.html Maximum Range: NB: alternative sources (i.e., http://www.airliners.net/aircraft-data/antonov-an-38/404) suggest a higher range. Source: https://www.airlines-inform.com/commercial-aircraft/An-38.html First Flight: Source: https://www.airlines-inform.com/commercial-aircraft/An-38.html Aircraft Model: ATR42 Aircraft Version: 300 Seats: Source: http://www.atraircraft.com/products_app/media/pdf/FAMILY_septembre2014.pdf Fuel Capacity: The original data was 4500, but that was measurement was in kg. We converted this number to litres assuming a volume mass of .782 kg/L (number given in EASA, 2016). Source: http://www.atraircraft.com/products_app/media/pdf/FAMILY_septembre2014.pdf Maximum Range: Source: http://www.atraircraft.com/products_app/media/pdf/FAMILY_septembre2014.pdf First Flight: Source: http://www.airliners.net/aircraft-data/atr-atr-42/41 Aircraft Model: ATR42 Aircraft Version: 400 Seats: Source: http://www.atraircraft.com/products_app/media/pdf/FAMILY_septembre2014.pdf Fuel Capacity: The original data was 4500, but that was measurement was in kg. We converted this number to litres assuming a volume mass of .782 kg/L (number given in EASA, 2016). Source: http://www.atraircraft.com/products_app/media/pdf/FAMILY_septembre2014.pdf Maximum Range: Source: http://www.atraircraft.com/products_app/media/pdf/FAMILY_septembre2014.pdf First Flight: Source: https://www.flightglobal.com/news/articles/atr-42-400-first-flight-25364/ Aircraft Model: ATR42 Aircraft Version: 500 Seats: Source: http://www.atraircraft.com/products_app/media/pdf/FAMILY_septembre2014.pdf Fuel Capacity: The original data was 4500, but that was measurement was in kg. We converted this number to litres assuming a volume mass of .782 kg/L (number given in EASA, 2016). Source: http://www.atraircraft.com/products_app/media/pdf/FAMILY_septembre2014.pdf Maximum Range: Source: http://www.atraircraft.com/products_app/media/pdf/FAMILY_septembre2014.pdf First Flight: Source: http://airlinergallery.nl/atr42.htm Aircraft Model: ATR42 Aircraft Version: 600 Seats: Source: http://www.atraircraft.com/products_app/media/pdf/FAMILY_septembre2014.pdf Fuel Capacity: The original data was 4500, but that was measurement was in kg. We converted this number to litres assuming a volume mass of .782 kg/L (number given in EASA, 2016). Source: http://www.atraircraft.com/products_app/media/pdf/FAMILY_septembre2014.pdf Maximum Range: Source: http://www.atraircraft.com/products_app/media/pdf/FAMILY_septembre2014.pdf First Flight: Source: http://www.ainonline.com/aviation-news/2010-03-04/atr-42-600-completes-first-flight Aircraft Model: ATR72 Aircraft Version: 200 Seats: Source: http://www.atraircraft.com/products_app/media/pdf/FAMILY_septembre2014.pdf Fuel Capacity: The original data was 5000, but that was measurement was in kg. We converted this number to litres assuming a volume mass of .782 kg/L (number given in EASA, 2016). Source: http://www.atraircraft.com/products_app/media/pdf/FAMILY_septembre2014.pdf Maximum Range: Source: http://www.atraircraft.com/products_app/media/pdf/FAMILY_septembre2014.pdf
AircraftModels
First Flight: Source: http://www.scmp.com/news/china/article/1702538/taiwan-crash-puts-atr-72-600-airliner-back-spotlight Aircraft Model: ATR72 Aircraft Version: 210 Seats: Source: http://www.atraircraft.com/products_app/media/pdf/FAMILY_septembre2014.pdf Fuel Capacity: The original data was 5000, but that was measurement was in kg. We converted this number to litres assuming a volume mass of .782 kg/L (number given in EASA, 2016). Source: http://www.atraircraft.com/products_app/media/pdf/FAMILY_septembre2014.pdf Maximum Range: Source: http://www.atraircraft.com/products_app/media/pdf/FAMILY_septembre2014.pdf First Flight: Source: https://www.airlines-inform.com/commercial-aircraft/ATR-72.html Aircraft Model: ATR72 Aircraft Version: 500 Seats: Source: http://www.atraircraft.com/products_app/media/pdf/FAMILY_septembre2014.pdf Fuel Capacity: The original data was 5000, but that was measurement was in kg. We converted this number to litres assuming a volume mass of .782 kg/L (number given in EASA, 2016). Source: http://www.atraircraft.com/products_app/media/pdf/FAMILY_septembre2014.pdf Maximum Range: Source: http://www.atraircraft.com/products_app/media/pdf/FAMILY_septembre2014.pdf First Flight: Source: https://www.airlines-inform.com/commercial-aircraft/ATR-72.html Aircraft Model: ATR72 Aircraft Version: 600 Seats: Source: http://www.atraircraft.com/products_app/media/pdf/FAMILY_septembre2014.pdf Fuel Capacity: The original data was 5000, but that was measurement was in kg. We converted this number to litres assuming a volume mass of .782 kg/L (number given in EASA, 2016). Source: http://www.atraircraft.com/products_app/media/pdf/FAMILY_septembre2014.pdf Maximum Range: Source: http://www.atraircraft.com/products_app/media/pdf/FAMILY_septembre2014.pdf First Flight: Source: https://www.airlines-inform.com/commercial-aircraft/ATR-72.html Aircraft Model: BAE (HS) 748 Aircraft Version: HS 148 Series 2A Seats: Source: http://www.airliners.net/aircraft-data/hawker-siddeley-hs-748/57 Fuel Capacity: Source: https://www.easa.europa.eu/system/files/dfu/TCDS_EASA.A.397_HS748_Iss_02_20150115.pdf Maximum Range: Assuming maximum payload and reserves. Source: http://www.airliners.net/aircraft-data/hawker-siddeley-hs-748/57 First Flight: Source: http://www.airliners.net/aircraft-data/hawker-siddeley-hs-748/57 Aircraft Model: BAE ATP Aircraft Version: ATP Seats: Source: http://www.flugzeuginfo.net/acdata_php/acdata_atp_en.php Fuel Capacity: Source: https://www.airlines-inform.com/commercial-aircraft/BAe-ATP.html Maximum Range: Source: https://www.airlines-inform.com/commercial-aircraft/BAe-ATP.html First Flight: Source: http://www.flugzeuginfo.net/acdata_php/acdata_atp_en.php Aircraft Model: BAE SYSTEMS AVRO RJ Aircraft Version: RJ85 / (146RJ 200 – original version) Seats: Source: http://www.airliners.net/aircraft-data/british-aerospace-avro-rj7085100/47 Fuel Capacity: Source: https://www.regional-services.com/wp-content/uploads/2016/01/Remote-Runway-Operations.pdf
AircraftModels
Maximum Range: Source: http://www.qualitywingssim.com/files/ultimate_146_collection/docs/QualityWings_Ultimate_146_Collection_Users_Manual_SP4.pdf First Flight: Source: http://www.flugzeuginfo.net/acdata_php/acdata_bae1462_en.php Aircraft Model: BAE SYSTEMS AVRO RJ Aircraft Version: RJ100 (146 RJ300 – original version) Seats: Source: http://www.airliners.net/aircraft-data/british-aerospace-avro-rj7085100/47 Fuel Capacity: Source: https://www.regional-services.com/wp-content/uploads/2016/01/Remote-Runway-Operations.pdf Maximum Range: Source: http://www.qualitywingssim.com/files/ultimate_146_collection/docs/QualityWings_Ultimate_146_Collection_Users_Manual_SP4.pdf First Flight: Source: http://www.flugzeuginfo.net/acdata_php/acdata_bae1463_en.php Aircraft Model: BAE Aircraft Version: 146-100 Seats: Source: https://www.airlines-inform.com/commercial-aircraft/BAe-146.html Fuel Capacity: Source: https://www.airlines-inform.com/commercial-aircraft/BAe-146.html Maximum Range: Source: https://www.airlines-inform.com/commercial-aircraft/BAe-146.html First Flight: Source: http://www.qualitywingssim.com/files/ultimate_146_collection/docs/QualityWings_Ultimate_146_Collection_Users_Manual_SP4.pdf Aircraft Model: BAE Aircraft Version: JETSTREAM 31 Seats: Source: http://www.airliners.net/aircraft-data/british-aerospace-jetstream-31super-31/55 Fuel Capacity: Source: https://www.airlines-inform.com/commercial-aircraft/Jetstream-31.html Maximum Range: Assuming maximum passengers and reserves. Source: http://www.airliners.net/aircraft-data/british-aerospace-jetstream-31super-31/55 First Flight: Source: http://www.airliners.net/aircraft-data/british-aerospace-jetstream-31super-31/55 Aircraft Model: BAE Aircraft Version: JETSTREAM-41 Seats: Source: http://www.airliners.net/aircraft-data/british-aerospace-jetstream-41/56 Fuel Capacity: Source: https://www.airlines-inform.com/commercial-aircraft/Jetstream-41.html Maximum Range: Assuming maximum passengers and reserves. Source: http://www.airliners.net/aircraft-data/british-aerospace-jetstream-41/56 First Flight: Source: http://www.airliners.net/aircraft-data/british-aerospace-jetstream-41/56 Aircraft Model: BEECHCRAFT Aircraft Version: 1900C Seats: Source: http://www.airliners.net/aircraft-data/raytheon-beechcraft-1900/329 Fuel Capacity: Source: https://www.airlines-inform.com/commercial-aircraft/Beech-1900.html, with Maximum Range: Maximum range with full payload, Source: https://www.airlines-inform.com/commercial-aircraft/Beech-1900.html First Flight: Source: http://www.airliners.net/aircraft-data/raytheon-beechcraft-1900/329 Aircraft Model: BEECHCRAFT Aircraft Version: 1900D Seats: Source: https://www.airlines-inform.com/commercial-aircraft/Beech-1900.html Fuel Capacity: Source: https://www.airlines-inform.com/commercial-aircraft/Beech-1900.html Maximum Range: Maximum range, Source: https://www.airlines-inform.com/commercial-aircraft/Beech-1900.html First Flight: Source: https://www.airlines-inform.com/commercial-aircraft/Beech-1900.html
AircraftModels
Aircraft Model: BEECHCRAFT Aircraft Version: B99 Seats: Source: http://www.airliners.net/aircraft-data/beech-99-airliner/66 Fuel Capacity: The original data was 1119, but that was measurement was in kg. We converted this number to litres assuming a volume mass of .782 kg/L (number given in EASA, 2016). Source: http://all-aero.com/index.php/59-planes-b-c/1402-beech-99-commuter Maximum Range: Assuming maximum cruising speed. Source: http://www.airliners.net/aircraft-data/beech-99-airliner/66 First Flight: Source: http://www.airliners.net/aircraft-data/beech-99-airliner/66 Aircraft Model: BOEING Aircraft Version: 707-120 Seats: Source: http://www.boeing.com/history/products/707.page Fuel Capacity: Fuel capacity for -120B not -120. Maximum Range: Source: http://www.boeing.com/history/products/707.page First Flight: Source: http://www.boeing.com/history/products/707.page Aircraft Model: BOEING Aircraft Version: 717-200 Seats: Average between maximum one-class seating and two-class seating. Source: http://www.qantas.com/travel/airlines/aircraft-seat-map-boeing-712/global/en Fuel Capacity: Source: http://www.qantas.com/travel/airlines/aircraft-seat-map-boeing-712/global/en Maximum Range: Assuming maximum payload. Source: http://www.qantas.com/travel/airlines/aircraft-seat-map-boeing-712/global/en First Flight: Source: http://www.boeing.com/history/products/717-md-95.page Aircraft Model: BOEING Aircraft Version: 727-100 Seats: Typical mixed-class. Source: http://www.boeing.com/resources/boeingdotcom/commercial/airports/acaps/727.pdf Fuel Capacity: Source: http://www.boeing.com/resources/boeingdotcom/commercial/airports/acaps/727.pdf Maximum Range: Source: http://www.boeing.com/history/products/727.page First Flight: Source: http://www.boeing.com/history/products/707.page Aircraft Model: BOEING Aircraft Version: 727-200 advanced Seats: Average between certified and mixed-class. Source: http://www.boeing.com/resources/boeingdotcom/commercial/airports/acaps/727.pdf Fuel Capacity: Source: http://www.boeing.com/resources/boeingdotcom/commercial/airports/acaps/727.pdf Maximum Range: Source: http://www.flugzeuginfo.net/acdata_php/acdata_727_en.php First Flight: Source: http://www.flugzeuginfo.net/acdata_php/acdata_727_en.php Aircraft Model: BOEING Aircraft Version: 737-100 Seats: Average between FAA exit limit and two-class. Source: http://www.boeing.com/resources/boeingdotcom/commercial/airports/acaps/737.pdf Fuel Capacity: Average of three listed usable fuel capacities. http://www.boeing.com/resources/boeingdotcom/commercial/airports/acaps/737.pdf Maximum Range: Source: http://www.flugzeuginfo.net/acdata_php/acdata_7371_en.php First Flight: Source: http://www.boeing.com/history/products/737-classic.page
AircraftModels
Aircraft Model: BOEING Aircraft Version: 737-200 Seats: Average between FAA exit limit and two-class. Source: http://www.boeing.com/resources/boeingdotcom/commercial/airports/acaps/737.pdf Fuel Capacity: Average of 5 listed fuel capacities. Source: http://www.boeing.com/resources/boeingdotcom/commercial/airports/acaps/737.pdf Maximum Range: Source: http://www.flugzeuginfo.net/acdata_php/acdata_7372_en.php First Flight: Source: http://www.flugzeuginfo.net/acdata_php/acdata_7372_en.php Aircraft Model: BEOING Aircraft Version: 737-300 Seats: Source: http://www.boeing.com/resources/boeingdotcom/commercial/airports/acaps/737.pdf Fuel Capacity: Assuming a CFM56-3B1 engine is used. Source: http://www.boeing.com/resources/boeingdotcom/commercial/airports/acaps/737.pdf Maximum Range: Assuming a CFM56-3B1 engine is used and maximum payload. Source: https://www.airlines-inform.com/commercial-aircraft/Boeing-737-300.html First Flight: Source: https://www.airlines-inform.com/commercial-aircraft/Boeing-737-300.html Aircraft Model: BOEING Aircraft Version: 737-400 Seats: Average between FAA exit limit and two-class. http://www.boeing.com/resources/boeingdotcom/commercial/airports/acaps/737.pdf Fuel Capacity: Assuming a CFM56-3B2 engine is used. Source: http://www.boeing.com/resources/boeingdotcom/commercial/airports/acaps/737.pdf Maximum Range: Assuming a CFM56-3B2 engine is used and maximum payload. Source: https://www.airlines-inform.com/commercial-aircraft/Boeing-737-400.html First Flight: Source: https://www.airlines-inform.com/commercial-aircraft/Boeing-737-400.html Aircraft Model: BOEING Aircraft Version: 737-500 Seats: Average between FAA exit limit and two-class. http://www.boeing.com/resources/boeingdotcom/commercial/airports/acaps/737.pdf Fuel Capacity: Assuming a CFM56-3B2 engine is used. Source: http://www.boeing.com/resources/boeingdotcom/commercial/airports/acaps/737.pdf Maximum Range: Assuming a CFM56-B31 engine is used and maximum payload. Source: https://www.airlines-inform.com/commercial-aircraft/Boeing-737-500.html First Flight: Source: https://www.airlines-inform.com/commercial-aircraft/Boeing-737-500.html Aircraft Model: BOEING Aircraft Version: 737-600 Seats: Average between all-economy and two-class. http://www.boeing.com/resources/boeingdotcom/commercial/airports/acaps/737.pdf Fuel Capacity: Source: http://www.boeing.com/assets/pdf/commercial/airports/acaps/737.pdf Maximum Range: Source: http://boeing.mediaroom.com/1998-06-29-China-to-Purchase-10-Boeing-Next-Generation-737-Jetliners First Flight: Source: https://www.airlines-inform.com/commercial-aircraft/Boeing-737-600.html Aircraft Model: BOEING Aircraft Version: 737-700 Seats: Average between all-economy and two-class. Source: http://www.boeing.com/resources/boeingdotcom/commercial/airports/acaps/737.pdf Fuel Capacity: Source: http://www.boeing.com/assets/pdf/commercial/airports/acaps/737.pdf Maximum Range: Source: http://boeing.mediaroom.com/1998-06-29-China-to-Purchase-10-Boeing-Next-Generation-737-Jetliners First Flight: Source: https://www.airlines-inform.com/commercial-aircraft/Boeing-737-700.html
AircraftModels
Aircraft Model: BOEING Aircraft Version: 737-800 Seats: Source: http://www.boeing.com/resources/boeingdotcom/commercial/airports/acaps/737.pdf Fuel Capacity: Source: http://www.boeing.com/assets/pdf/commercial/airports/acaps/737.pdf Maximum Range: Source: http://boeing.mediaroom.com/1998-06-29-China-to-Purchase-10-Boeing-Next-Generation-737-Jetliners First Flight: Source: https://www.airlines-inform.com/commercial-aircraft/Boeing-737-800.html Aircraft Model: BOEING Aircraft Version: 737-900 Seats: Average between all-economy and two-class. Source: http://www.boeing.com/resources/boeingdotcom/commercial/airports/acaps/737.pdf Fuel Capacity: Source: http://www.boeing.com/assets/pdf/commercial/airports/acaps/737.pdf Maximum Range: Source: http://boeing.mediaroom.com/1998-06-29-China-to-Purchase-10-Boeing-Next-Generation-737-Jetliners First Flight: Source: https://www.airlines-inform.com/commercial-aircraft/Boeing-737-900.html Aircraft Model: BOEING Aircraft Version: 737-900ER Seats: Average between FAA exit limit and two-class. Source: http://www.boeing.com/resources/boeingdotcom/commercial/airports/acaps/737.pdf Fuel Capacity: Source: http://www.boeing.com/assets/pdf/commercial/airports/acaps/737.pdf Maximum Range: Source: http://boeing.mediaroom.com/2006-05-31-Boeing-Begins-Assembling-the-First-737-900ER First Flight: Source: https://en.wikipedia.org/wiki/Boeing_737 Aircraft Model: BOEING Aircraft Version: 747-100 Seats: Average between all-economy and three-class. Source: http://www.flugzeuginfo.net/acdata_php/acdata_7471_en.php Fuel Capacity: Source: http://www.boeing.com/resources/boeingdotcom/commercial/airports/acaps/747_123sp.pdf Maximum Range: Source: http://www.boeing.com/resources/boeingdotcom/company/about_bca/startup/pdf/historical/747-100_-200_-300_-SP_passenger.pdf First Flight: Source: https://www.airlines-inform.com/commercial-aircraft/Boeing-747-100.html Aircraft Model: BOEING Aircraft Version: 747-200B Seats: Average between all-economy and three-class. Source: http://www.flugzeuginfo.net/acdata_php/acdata_7472_en.php Fuel Capacity: Source: https://www.airlines-inform.com/commercial-aircraft/Boeing-747-200.html Maximum Range: Assuming maximum payload. (Range may differ with engine type). Source: https://www.airlines-inform.com/commercial-aircraft/Boeing-747-200.html First Flight: Source: https://www.airlines-inform.com/commercial-aircraft/Boeing-747-200.html Aircraft Model: BOEING Aircraft Version: 747-300 Seats: Average between one-class and three-class. Source: https://www.airlines-inform.com/commercial-aircraft/Boeing-747-300.html Fuel Capacity: Source: https://www.airlines-inform.com/commercial-aircraft/Boeing-747-300.html Maximum Range: Source: https://www.airlines-inform.com/commercial-aircraft/Boeing-747-300.html
AircraftModels
First Flight: Source: https://www.airlines-inform.com/commercial-aircraft/Boeing-747-300.html Aircraft Model: BOEING Aircraft Version: 747-400 Seats: Average between one-class and three-class. Source: https://www.airlines-inform.com/commercial-aircraft/Boeing-747-400.html Fuel Capacity: (Fuel capacity may differ with engine type) Source: https://www.airlines-inform.com/commercial-aircraft/Boeing-747-400.html Maximum Range: Assuming maximum payload. (Range may differ with engine type) Source: https://www.airlines-inform.com/commercial-aircraft/Boeing-747-400.html First Flight: Source: https://www.airlines-inform.com/commercial-aircraft/Boeing-747-400.html Aircraft Model: BOEING Aircraft Version: 747-8I Seats: Source: Typical seating capacity. Fuel Capacity: Source: https://www.airlines-inform.com/commercial-aircraft/Boeing-747-8.html Maximum Range: Source: https://www.airlines-inform.com/commercial-aircraft/Boeing-747-8.html First Flight: Source: http://www.flugzeuginfo.net/acdata_php/acdata_boeing_7478_dt.php Aircraft Model: BOEING Aircraft Version: 747-SP Seats: Average: class-type not specified. Source: http://www.flugzeuginfo.net/acdata_php/acdata_boeing_747sp_dt.php Fuel Capacity: Average between two engine types: RB211-524C2 and CF6-45A2/B2. Source: http://www.boeing.com/resources/boeingdotcom/commercial/airports/acaps/747_123sp.pdf Maximum Range: Source: http://www.flugzeuginfo.net/acdata_php/acdata_boeing_747sp_dt.php First Flight: Source: http://www.flugzeuginfo.net/acdata_php/acdata_boeing_747sp_dt.php Aircraft Model: BOEING Aircraft Version: 757-200 Seats: Average between four-door configuration and two-class. Source: http://www.flugzeuginfo.net/acdata_php/acdata_7572_en.php Fuel Capacity: Source: http://www.boeing.com/resources/boeingdotcom/commercial/airports/acaps/757_23.pdf Maximum Range: Source: https://www.airlines-inform.com/commercial-aircraft/Boeing-757-200.html First Flight: Source: https://www.airlines-inform.com/commercial-aircraft/Boeing-757-200.html Aircraft Model: BOEING Aircraft Version: 757-300 Seats: Average between all-economy and dual-class. Source: http://www.boeing.com/resources/boeingdotcom/commercial/airports/acaps/757_23.pdf Fuel Capacity: http://www.boeing.com/resources/boeingdotcom/company/about_bca/startup/pdf/historical/757_passenger.pdf Maximum Range: Source: https://www.airlines-inform.com/commercial-aircraft/Boeing-757-300.html First Flight: Source: https://www.airlines-inform.com/commercial-aircraft/Boeing-757-300.html Aircraft Model: BOEING Aircraft Version: 767-200 Seats: Average between FAA exit limit and (with second over the wing exit door) mixed-class. Source: http://www.boeing.com/resources/boeingdotcom/commercial/airports/acaps/767.pdf Fuel Capacity: Fuel capacity may differ with engine type) Source: http://www.boeing.com/resources/boeingdotcom/commercial/airports/acaps/767.pdf
AircraftModels
Maximum Range: Source: http://www.flugzeuginfo.net/acdata_php/acdata_7672_en.php First Flight: http://www.boeing.com/history/products/767.page Aircraft Model: BOEING Aircraft Version: 767-200ER Seats: Average between FAA exit limit and (with second over the wing exit door) mixed-class. Source: http://www.boeing.com/resources/boeingdotcom/commercial/airports/acaps/767.pdf Fuel Capacity: (Fuel capacity may differ with engine type) Source: http://www.boeing.com/resources/boeingdotcom/commercial/airports/acaps/767.pdf Maximum Range: Source: https://www.airlines-inform.com/commercial-aircraft/Boeing-767-200.html First Flight: Source: http://www.airliners.net/aircraft-data/boeing-767-200/103 Aircraft Model: BOEING Aircraft Version: 767-300 Seats: Average between mid-cabin door and two-class. Source: http://www.boeing.com/resources/boeingdotcom/commercial/airports/acaps/767.pdf Fuel Capacity: http://www.boeing.com/assets/pdf/commercial/airports/acaps/767.pdf Maximum Range: Source: https://www.airlines-inform.com/commercial-aircraft/Boeing-767-300.html First Flight: Source: http://www.airliners.net/aircraft-data/boeing-767-300/104 Aircraft Model: BOEING Aircraft Version: 767-300ER Seats: Average between mid-cabin door and two-class. Source: http://www.boeing.com/resources/boeingdotcom/commercial/airports/acaps/767.pdf Fuel Capacity: http://www.boeing.com/assets/pdf/commercial/airports/acaps/767.pdf Maximum Range: Source: https://www.airlines-inform.com/commercial-aircraft/Boeing-767-300.html First Flight: Source: http://www.airliners.net/aircraft-data/boeing-767-300/104 Aircraft Model: BOEING Aircraft Version: 767-400ER Seats: Average between all-economy and three-class. Source: http://www.boeing.com/resources/boeingdotcom/commercial/airports/acaps/767.pdf Fuel Capacity: http://www.boeing.com/assets/pdf/commercial/airports/acaps/767.pdf Maximum Range: Source: https://www.airlines-inform.com/commercial-aircraft/Boeing-767-400.html First Flight: Source: http://www.boeing.com/history/products/767.page Aircraft Model: BOEING Aircraft Version: 777-200 Seats: Average between one-class and three-class. Source: http://www.flugzeuginfo.net/acdata_php/acdata_7772_dt.php Fuel Capacity: Maximum Range: Source: http://www.aerospace-technology.com/projects/boeing777/ First Flight: Source: http://www.flugzeuginfo.net/acdata_php/acdata_7772_dt.php Aircraft Model: BOEING Aircraft Version: 777-200ER Seats: 200ER has the same number of passengers as Version 200. Source: http://www.aerospace-technology.com/projects/boeing777/ Fuel Capacity: Source: https://www.airlines-inform.com/commercial-aircraft/Boeing-777-300.html Maximum Range: Source: http://www.flugzeuginfo.net/acdata_php/acdata_7773_dt.php First Flight: Source: http://www.skytamer.com/Boeing_777-200.html
AircraftModels
Aircraft Model: BOEING Aircraft Version: 777-300 Seats: Average between one-class and three-class. Source: https://www.airlines-inform.com/commercial-aircraft/Boeing-777-300.html Fuel Capacity: Source: https://www.airlines-inform.com/commercial-aircraft/Boeing-777-300.html Maximum Range: Source: http://www.flugzeuginfo.net/acdata_php/acdata_7773_dt.php First Flight: Source: http://www.skytamer.com/Boeing_777-200.html Aircraft Model: BOEING Aircraft Version: 777-300ER Seats: Average between one-class and three-class. Source: https://www.airlines-inform.com/commercial-aircraft/Boeing-777-300.html Fuel Capacity: Source: https://www.airlines-inform.com/commercial-aircraft/Boeing-777-300.html Maximum Range: (Range may vary with different engine type) Source: https://www.airlines-inform.com/commercial-aircraft/Boeing-777-300.html First Flight: Source: http://www.aerospace-technology.com/projects/boeing777/ Aircraft Model: BOEING Aircraft Version: 777-200LR Seats: Average between one-class and three-class. Source: https://www.airlines-inform.com/commercial-aircraft/Boeing-777-200.html Fuel Capacity: Source: http://www.topspeed.com/aviation/aviation-reviews/boeing/2006-boeing-777-200lr-ar87989.html Maximum Range: Source: http://www.topspeed.com/aviation/aviation-reviews/boeing/2006-boeing-777-200lr-ar87989.html First Flight: Source: http://www.aerospace-technology.com/projects/boeing777/ Aircraft Model: BOEING Aircraft Version: 787-8 Dreamliner Seats: Average between one-class and three-class. Source: http://www.aerospace-technology.com/projects/dreamliner/ Fuel Capacity: Source: https://www.airlines-inform.com/commercial-aircraft/Boeing-787.html Maximum Range: http://www.boeing.com/commercial/787/#/by-design First Flight: Source: https://www.airlines-inform.com/commercial-aircraft/Boeing-787.html Aircraft Model: BOEING Aircraft Version: 787-9 Dreamliner Seats: Typical seating capacity. Source: http://www.flugzeuginfo.net/acdata_php/acdata_boeing_7879_dt.php Fuel Capacity: Source: https://www.airlines-inform.com/commercial-aircraft/Boeing-787-9.html Maximum Range: http://www.boeing.com/commercial/787/#/by-design First Flight: Source: http://www.flugzeuginfo.net/acdata_php/acdata_boeing_7879_dt.php Aircraft Model: BOEING Aircraft Version: MD-11 Seats: Average between single- and three-class seating capacities. Source: http://www.airliners.net/aircraft-data/mcdonnell-douglas-md-11/112 Fuel Capacity: Source: https://www.airlines-inform.com/commercial-aircraft/MD-11.html Maximum Range: Source: https://www.airlines-inform.com/commercial-aircraft/MD-11.html First Flight: Source: http://www.boeing.com/history/products/md-11-commercial-transport.page Aircraft Model: BOEING Aircraft Version: MD-81
AircraftModels
Seats: Typical (two-class) seating capacity. Source: http://www.airliners.net/aircraft-data/mcdonnell-douglas-md-81828388/109 Fuel Capacity: Usable fuel capacity. Source: http://www.boeing.com/assets/pdf/commercial/airports/acaps/md80.pdf Maximum Range: Source: http://www.boeing.com/history/products/md-80-and-md-90-commercial-transport.page First Flight: Source: http://www.boeing.com/history/products/md-80-and-md-90-commercial-transport.page Aircraft Model: BOEING Aircraft Version: MD-82 Seats: Average between single-class and two-class seating capacity. Source: https://www.airlines-inform.com/commercial-aircraft/MD-80.html Fuel Capacity: Standard fuel capacity. Source: https://www.airlines-inform.com/commercial-aircraft/MD-80.html Maximum Range: Assuming maximum payload. Source: https://www.airlines-inform.com/commercial-aircraft/MD-80.html First Flight: Based on: http://www.airliners.net/aircraft-data/mcdonnell-douglas-md-81828388/109. Source: https://www.airlines-inform.com/commercial-aircraft/MD-80.html Aircraft Model: BOEING Aircraft Version: MD-83 Seats: Average between single-class and two-class seating capacity. Source: https://www.airlines-inform.com/commercial-aircraft/MD-80.html Fuel Capacity: Standard fuel capacity. Source: https://www.airlines-inform.com/commercial-aircraft/MD-80.html Maximum Range: Assuming maximum payload. Source: https://www.airlines-inform.com/commercial-aircraft/MD-80.html First Flight: Aircraft Model: BOEING Aircraft Version: MD-87 Seats: Average between single-class and two-class seating capacity. Source: https://www.airlines-inform.com/commercial-aircraft/MD-80.html Fuel Capacity: Standard fuel capacity. Source: https://www.airlines-inform.com/commercial-aircraft/MD-80.html Maximum Range: Assuming maximum payload. Source: https://www.airlines-inform.com/commercial-aircraft/MD-80.html First Flight: Source: http://www.airliners.net/aircraft-data/mcdonnell-douglas-md-87/278 Aircraft Model: BOEING Aircraft Version: MD-88 Seats: Average between single-class and two-class seating capacity. Source: https://www.airlines-inform.com/commercial-aircraft/MD-80.html Fuel Capacity: Standard fuel capacity. Source: https://www.airlines-inform.com/commercial-aircraft/MD-80.html Maximum Range: Assuming maximum payload. Source: https://www.airlines-inform.com/commercial-aircraft/MD-80.html First Flight: Source: http://www.airliners.net/aircraft-data/mcdonnell-douglas-md-81828388/109 Aircraft Model: BOEING Aircraft Version: MD-90-30 Seats: Average between single-class and two-class seating capacity. Source: https://www.airlines-inform.com/commercial-aircraft/MD-90.html
AircraftModels
Fuel Capacity: Standard fuel capacity. Source: https://www.airlines-inform.com/commercial-aircraft/MD-90.html Maximum Range: Assuming maximum payload. Source: https://www.airlines-inform.com/commercial-aircraft/MD-90.html First Flight: Source: http://www.boeing.com/history/products/md-80-and-md-90-commercial-transport.page Aircraft Model: BOEING Aircraft Version: MD-90-30ER Seats: Average between single-class and two-class seating capacity. (Assuming same capacity based on: http://www.boeing.com/assets/pdf/commercial/airports/acaps/md90.pdf) Source: https://www.airlines-inform.com/commercial-aircraft/MD-90.html Fuel Capacity: Usable fuel capacity. Source: http://www.boeing.com/assets/pdf/commercial/airports/acaps/md90.pdf Maximum Range: Source: http://www.boeing.com/history/products/md-80-and-md-90-commercial-transport.page First Flight: Aircraft Model: BOMBARDIER Aircraft Version: CRJ1000ER Seats: Typical seating capacity. Source: http://www.flugzeuginfo.net/acdata_php/acdata_bombardier_crj1000_en.php Fuel Capacity: Source: http://www.flyradius.com/bombardier-crj1000/specifications Maximum Range: Source: http://commercialaircraft.bombardier.com/content/dam/Websites/bca/literature/crj/CRJ%20Series_CRJ%201000_Factsheet_201607_EN.pdf First Flight: Source: http://www.flugzeuginfo.net/acdata_php/acdata_bombardier_crj1000_en.php Aircraft Model: BOMBARDIER Aircraft Version: CRJ1000EL Seats: Typical seating capacity. Source: http://www.flugzeuginfo.net/acdata_php/acdata_bombardier_crj1000_en.php Fuel Capacity: Source: http://www.flyradius.com/bombardier-crj1000/specifications Maximum Range: Source: http://commercialaircraft.bombardier.com/content/dam/Websites/bca/literature/crj/CRJ%20Series_CRJ%201000_Factsheet_201607_EN.pdf First Flight: Source: http://www.flugzeuginfo.net/acdata_php/acdata_bombardier_crj1000_en.php Aircraft Model: BOMBARDIER Aircraft Version: CRJ100ER Seats: Source: https://www.airlines-inform.com/commercial-aircraft/CRJ-family.html Fuel Capacity: Source: https://www.airlines-inform.com/commercial-aircraft/Bombardier-CRJ-200.html Maximum Range: Source: https://www.airlines-inform.com/commercial-aircraft/Bombardier-CRJ-200.html First Flight: Source: https://www.airlines-inform.com/commercial-aircraft/CRJ-family.html Aircraft Model: BOMBARDIER Aircraft Version: CRJ100LR Seats: Source: https://www.airlines-inform.com/commercial-aircraft/CRJ-family.html Fuel Capacity: Source: https://www.airlines-inform.com/commercial-aircraft/Bombardier-CRJ-200.html Maximum Range: Source: https://airwaysmag.com/airchive/flashback-friday-the-bombardier-crj-family/ First Flight: Source: https://www.airlines-inform.com/commercial-aircraft/CRJ-family.html
AircraftModels
Aircraft Model: BOMBARDIER Aircraft Version: CRJ200ER Seats: Source: https://www.airlines-inform.com/commercial-aircraft/CRJ-family.html Fuel Capacity: Source: https://www.airlines-inform.com/commercial-aircraft/Bombardier-CRJ-200.html Maximum Range: Source: https://www.airlines-inform.com/commercial-aircraft/Bombardier-CRJ-200.html First Flight: Source: http://www.flugzeuginfo.net/acdata_php/acdata_crj200_en.php Aircraft Model: BOMBARDIER Aircraft Version: CRJ200LR Seats: Source: https://www.airlines-inform.com/commercial-aircraft/CRJ-family.html Fuel Capacity: Source: https://www.airlines-inform.com/commercial-aircraft/Bombardier-CRJ-200.html Maximum Range: Source: https://www.airlines-inform.com/commercial-aircraft/Bombardier-CRJ-200.html First Flight: Source: http://www.flugzeuginfo.net/acdata_php/acdata_crj200_en.php Aircraft Model: BOMBARDIER Aircraft Version: CRJ700 Seats: Average between maximum and dual-class seating capacity. Source: http://commercialaircraft.bombardier.com/content/dam/Websites/bca/literature/crj/CRJ%20Series_Brochure_201607_EN.pdf Fuel Capacity: Source: https://www.airlines-inform.com/commercial-aircraft/Bombardier-CRJ-700.html Maximum Range: Source: https://www.airlines-inform.com/commercial-aircraft/Bombardier-CRJ-700.html First Flight: Source: https://www.airlines-inform.com/commercial-aircraft/Bombardier-CRJ-700.html Aircraft Model: BOMBARDIER Aircraft Version: CRJ700ER Seats: Source: https://www.airlines-inform.com/commercial-aircraft/Bombardier-CRJ-700.html Fuel Capacity: Source: https://www.airlines-inform.com/commercial-aircraft/Bombardier-CRJ-700.html Maximum Range: Source: https://www.airlines-inform.com/commercial-aircraft/Bombardier-CRJ-700.html First Flight: Source: https://www.airlines-inform.com/commercial-aircraft/Bombardier-CRJ-700.html Aircraft Model: BOMBARDIER Aircraft Version: CRJ700LR Seats: Source: https://www.airlines-inform.com/commercial-aircraft/Bombardier-CRJ-700.html Fuel Capacity: Source: https://www.airlines-inform.com/commercial-aircraft/Bombardier-CRJ-700.html Maximum Range: Source: https://www.airlines-inform.com/commercial-aircraft/Bombardier-CRJ-700.html First Flight: Source: https://www.airlines-inform.com/commercial-aircraft/Bombardier-CRJ-700.html Aircraft Model: BOMBARDIER Aircraft Version: CRJ900ER
AircraftModels
Seats: Average between maximum and triple-class seating capacity. Source: http://commercialaircraft.bombardier.com/content/dam/Websites/bca/literature/crj/CRJ%20Series_Brochure_201607_EN.pdf Fuel Capacity: Source: https://www.airlines-inform.com/commercial-aircraft/Bombardier-CRJ-900.html Maximum Range: Source: https://www.airlines-inform.com/commercial-aircraft/Bombardier-CRJ-900.html First Flight: Source: https://www.airlines-inform.com/commercial-aircraft/Bombardier-CRJ-900.html Aircraft Model: BOMBARDIER Aircraft Version: CRJ900LR Seats: Average between maximum and triple-class seating capacity. Source: http://commercialaircraft.bombardier.com/content/dam/Websites/bca/literature/crj/CRJ%20Series_Brochure_201607_EN.pdf Fuel Capacity: Source: https://www.airlines-inform.com/commercial-aircraft/Bombardier-CRJ-900.html Maximum Range: Source: https://www.airlines-inform.com/commercial-aircraft/Bombardier-CRJ-900.html First Flight: Source: https://www.airlines-inform.com/commercial-aircraft/Bombardier-CRJ-900.html Aircraft Model: BOMBARDIER Aircraft Version: DASH 8 Q100 Seats: Source: https://www.airlines-inform.com/commercial-aircraft/Dash-8Q200.html Fuel Capacity: Source: https://www.airlines-inform.com/commercial-aircraft/Dash-8Q200.html Maximum Range: Source: https://www.airlines-inform.com/commercial-aircraft/Dash-8Q200.html First Flight: Source: https://www.airlines-inform.com/commercial-aircraft/Dash8-family.html Aircraft Model: BOMBARDIER Aircraft Version: DASH 8 Q200 Seats: Source: https://www.airlines-inform.com/commercial-aircraft/Dash-8Q200.html Fuel Capacity: Source: https://www.airlines-inform.com/commercial-aircraft/Dash-8Q200.html Maximum Range: Source: https://www.airlines-inform.com/commercial-aircraft/Dash-8Q200.html First Flight: Source: https://www.airlines-inform.com/commercial-aircraft/Dash8-family.html Aircraft Model: BOMBARDIER Aircraft Version: DASH 8 Q300 Seats: Average between economy-class and standard seating capacity. Source: https://www.airlines-inform.com/commercial-aircraft/Dash-8Q300.html Fuel Capacity: Source: https://www.airlines-inform.com/commercial-aircraft/Dash-8Q300.html Maximum Range: Average between low, medium, and high. Source: https://www.airlines-inform.com/commercial-aircraft/Dash-8Q300.html First Flight: Source: https://www.airlines-inform.com/commercial-aircraft/Dash-8Q300.html Aircraft Model: BOMBARDIER Aircraft Version: DASH 8 Q400 Seats: Maximum seating capacity. Source: http://commercialaircraft.bombardier.com/content/dam/Websites/bca/literature/q400/Q%20Series_factsheets_201607_EN.pdf Fuel Capacity: Source: https://www.airlines-inform.com/commercial-aircraft/Dash-8Q400.html Maximum Range: Source: https://www.airlines-inform.com/commercial-aircraft/Dash-8Q400.html First Flight: Source: https://www.airlines-inform.com/commercial-aircraft/Dash-8Q400.html Aircraft Model: CONVAIR
AircraftModels
Aircraft Version: CV-580 Seats: Fuel Capacity: Maximum Range: First Flight: Source: https://www.airlines-inform.com/commercial-aircraft/Convair-580.html Aircraft Model: CONVAIR Aircraft Version: CV-640 Seats: Source: http://www.flugzeuginfo.net/acdata_php/acdata_cv640_en.php Fuel Capacity: Maximum Range: Source: http://www.flugzeuginfo.net/acdata_php/acdata_cv640_en.php First Flight: Source: http://www.flugzeuginfo.net/acdata_php/acdata_cv640_en.php Aircraft Model: DE HAVILLAND CANADA Aircraft Version: DHC7 Seats: Source: http://www.flugzeuginfo.net/acdata_php/acdata_dhc7_en.php Fuel Capacity: The original data was 4502, but that was measurement was in kg. We converted this number to litres assuming a volume mass of .782 kg/L (number given in EASA, 2016). Source: http://members.aon.at/~slenz/dash7.html Maximum Range: Source: http://www.flugzeuginfo.net/acdata_php/acdata_dhc7_en.php First Flight: Source: http://www.flugzeuginfo.net/acdata_php/acdata_dhc7_en.php Aircraft Model: DE HAVILLAND CANADA TWIN OTTER Aircraft Version: DHC-6-400 (Viking) Seats: Source: http://www.aerospace-technology.com/projects/vikingdhc6400/ Fuel Capacity: Maximum Range: Source: http://www.aerospace-technology.com/projects/vikingdhc6400/ First Flight: Source: http://www.aerospace-technology.com/projects/vikingdhc6400/ Aircraft Model: DORNIER Aircraft Version: 228 Seats: Source: http://www.airforce-technology.com/projects/dornier-do-228-light-transport-aircraft/ Fuel Capacity: Maximum fuel capacity. Source: https://www.easa.europa.eu/system/files/dfu/TCDS%20%20EASA%20A%20359%20Dornier%20228%20Issue%205.pdf Maximum Range: Source: http://www.airforce-technology.com/projects/dornier-do-228-light-transport-aircraft/ First Flight: Source: http://www.airforce-technology.com/projects/dornier-do-228-light-transport-aircraft/ Aircraft Model: DORNIER Aircraft Version: 328 Seats: Source: https://www.airlines-inform.com/commercial-aircraft/Dornier-328.html Fuel Capacity: Source: https://www.airlines-inform.com/commercial-aircraft/Dornier-328.html Maximum Range: Source: https://www.airlines-inform.com/commercial-aircraft/Dornier-328.html First Flight: Source: https://www.airlines-inform.com/commercial-aircraft/Dornier-328.html Aircraft Model: DORNIER Aircraft Version: 328JET Seats: Source: https://www.airlines-inform.com/commercial-aircraft/Dornier-328Jet.html Fuel Capacity: Source: https://www.airlines-inform.com/commercial-aircraft/Dornier-328Jet.html Maximum Range: Source: https://www.airlines-inform.com/commercial-aircraft/Dornier-328Jet.html First Flight: Source: http://www.flugzeuginfo.net/acdata_php/acdata_do328jet_en.php
AircraftModels
Aircraft Model: EMBRAER Aircraft Version: EMB-110 BANDEIRANTE Seats: Standard fuel capacity. Source: https://www.airlines-inform.com/commercial-aircraft/Embraer-110-Bandeirante.html Fuel Capacity: Source: http://www.flugzeuginfo.net/acdata_php/acdata_emb110_en.php Maximum Range: Source: http://www.flugzeuginfo.net/acdata_php/acdata_emb110_en.php First Flight: Source: http://www.flugzeuginfo.net/acdata_php/acdata_emb110_en.php Aircraft Model: EMBRAER Aircraft Version: EMB-120 BRASILIA Seats: Source: http://www.flugzeuginfo.net/acdata_php/acdata_emb120_en.php Fuel Capacity: The original data was 2600, but that was measurement was in kg. We converted this number to litres assuming a volume mass of .782 kg/L (number given in EASA, 2016). Source: https://www.forecastinternational.com/archive/disp_old_pdf.cfm?ARC_ID=329 Maximum Range: Source: http://www.flugzeuginfo.net/acdata_php/acdata_emb120_en.php First Flight: Source: http://www.flugzeuginfo.net/acdata_php/acdata_emb120_en.php Aircraft Model: EMBRAER Aircraft Version: ERJ145LR Seats: Source: http://www.embraercommercialaviation.com/AircraftPDF/E145_Cabin.pdf Fuel Capacity: Maximum useable fuel. Source: http://www.embraercommercialaviation.com/AircraftPDF/E145_Weights.pdf Maximum Range: Assuming a maximum landing weight. Source: http://www.embraercommercialaviation.com/AircraftPDF/E145_Performance.pdf First Flight: Source: http://www.aerospace-technology.com/projects/erj145/ Aircraft Model: EMBRAER Aircraft Version: ERJ145LU Seats: Fuel Capacity: Source: https://en.wikipedia.org/wiki/Embraer_ERJ_145_family Maximum Range: First Flight: Aircraft Model: EMBRAER Aircraft Version: ERJ145LI Seats: Fuel Capacity: Maximum Range: First Flight: Aircraft Model: EMBRAER Aircraft Version: ERJ145EP Seats: Fuel Capacity: Source: https://en.wikipedia.org/wiki/Embraer_ERJ_145_family Maximum Range: First Flight: Aircraft Model: EMBARER Aircraft Version: ERJ145ER Seats: Fuel Capacity: Source: https://en.wikipedia.org/wiki/Embraer_ERJ_145_family Maximum Range: Range with 50 passengers at long-range cruising speed. Source: http://www.airliners.net/aircraft-data/embraer-erj-145/198 First Flight:
AircraftModels
Aircraft Model: EMBRAER Aircraft Version: ERJ145EU Seats: Fuel Capacity: Maximum Range: First Flight: Aircraft Model: EMBRAER Aircraft Version: ERJ145MP Seats: Fuel Capacity: Maximum Range: Source: http://www.embraercommercialaviation.com/AircraftPDF/E145_Performance.pdf First Flight: Aircraft Model: EMBRAER Aircraft Version: ERJ145XR Seats: Source: http://www.embraercommercialaviation.com/Pages/ERJ-145XR.aspx Fuel Capacity: Maximum Range: Source: http://www.embraercommercialaviation.com/AircraftPDF/E145XR_Performance.pdf First Flight: Source: http://www.airliners.net/aircraft-data/embraer-erj-145/198 Aircraft Model: EMBRAER Aircraft Version: ERJ135LR Seats: Source: http://www.embraercommercialaviation.com/AircraftPDF/E145XR_Performance.pdf Fuel Capacity: Standard fuel capacity. Source: https://www.airlines-inform.com/commercial-aircraft/Embraer-ERJ-135.html Maximum Range: Assuming full-load of passengers. Source: http://www.embraercommercialaviation.com/AircraftPDF/E135_Performance.pdf First Flight: Source: https://www.airlines-inform.com/commercial-aircraft/Embraer-ERJ-135.html Aircraft Model: EMBRAER Aircraft Version: ERJ135ER Seats: Source: http://www.aerospace-technology.com/projects/erj-135/ Fuel Capacity: The original data was 4173, but that was measurement was in kg. We converted this number to litres assuming a volume mass of .782 kg/L (number given in EASA, 2016). Source: http://www.aerospace-technology.com/projects/erj-135/ Maximum Range: Assuming a full-load of passengers. Source: http://www.embraercommercialaviation.com/AircraftPDF/E135_Performance.pdf First Flight: Source: http://www.aerospace-technology.com/projects/erj-135/ Aircraft Model: EMBRAER Aircraft Version: ERJ140LR Seats: Source: http://www.embraercommercialaviation.com/AircraftPDF/E140_Cabin.pdf Fuel Capacity: Standard fuel capacity. Source: https://www.airlines-inform.com/commercial-aircraft/Embraer-ERJ-140.html Maximum Range: Assuming full-load of passengers. Source: http://www.embraercommercialaviation.com/AircraftPDF/E140_Performance.pdf` First Flight: Source: https://www.airlines-inform.com/commercial-aircraft/Embraer-ERJ-140.html Aircraft Model: EMBRAER Aircraft Version: ERJ170ST Seats: Average between high-capacity single-class and dual-class. Source: http://www.embraercommercialaviation.com/AircraftPDF/E170_Cabin.pdf
AircraftModels
Fuel Capacity: Maximum usable fuel. Source: http://www.embraercommercialaviation.com/AircraftPDF/E170_Weights.pdf Maximum Range: Assuming full-load of passengers, long-range cruise speed, and typical mission reserves. Source: http://www.embraercommercialaviation.com/AircraftPDF/E170_Performance.pdf First Flight: Source: https://www.airlines-inform.com/commercial-aircraft/Embraer-170.html Aircraft Model: EMBRAER Aircraft Version: ERJ170LR Seats: Average between high-capacity single-class and dual-class. Source: http://www.embraercommercialaviation.com/AircraftPDF/E170_Cabin.pdf Fuel Capacity: Maximum usable fuel. Source: http://www.embraercommercialaviation.com/AircraftPDF/E170_Weights.pdf Maximum Range: Assuming full-load of passengers, long-range cruise speed, and typical mission reserves. Source: http://www.embraercommercialaviation.com/AircraftPDF/E170_Performance.pdf First Flight: Aircraft Model: EMBRAER Aircraft Version: ERJ170AR Seats: Average between high-capacity single-class and dual-class. Source: http://www.embraercommercialaviation.com/AircraftPDF/E170_Cabin.pdf Fuel Capacity: Maximum usable fuel. Source: http://www.embraercommercialaviation.com/AircraftPDF/E170_Weights.pdf Maximum Range: Assuming full-load of passengers, long-range cruise speed, and typical mission reserves. Source: http://www.embraercommercialaviation.com/AircraftPDF/E170_Performance.pdf First Flight: Aircraft Model: EMBRAER Aircraft Version: E175ST Seats: Average between high-capacity single-class and dual-class. Source: http://www.embraercommercialaviation.com/AircraftPDF/E175_Cabin.pdf Fuel Capacity: Maximum usable fuel. Source: http://www.embraercommercialaviation.com/AircraftPDF/E175_Performance.pdf Maximum Range: Assuming full-load of passengers, long-range cruise speed, and typical mission reserves. Source: http://www.embraercommercialaviation.com/AircraftPDF/E175_Performance.pdf First Flight: Source: http://www.airliners.net/aircraft-data/embraer-erj-170175190195/406 Aircraft Model: EMBRAER Aircraft Version: E175LR Seats: Average between high-capacity single-class and dual-class. Source: http://www.embraercommercialaviation.com/AircraftPDF/E175_Cabin.pdf Fuel Capacity: Maximum usable fuel. Source: http://www.embraercommercialaviation.com/AircraftPDF/E175_Performance.pdf Maximum Range: Assuming full-load of passengers, long-range cruise speed, and typical mission reserves. Source: http://www.embraercommercialaviation.com/AircraftPDF/E175_Performance.pdf First Flight: Aircraft Model: EMBRAER Aircraft Version: E190ST Seats: Average between high-capacity single-class and dual-class. Source: http://www.embraercommercialaviation.com/AircraftPDF/E190_Cabin.pdf Fuel Capacity: Maximum usable fuel. Source: http://www.embraercommercialaviation.com/AircraftPDF/E190_Weights.pdf Maximum Range: Assuming full-load of passengers, long-range cruise speed, and typical mission reserves.
AircraftModels
Source: http://www.embraercommercialaviation.com/AircraftPDF/E190_Performance.pdf First Flight: Source: http://www.airliners.net/aircraft-data/embraer-erj-170175190195/406 Aircraft Model: EMBRAER Aircraft Version: E190LR Seats: Average between high-capacity single-class and dual-class. Source: http://www.embraercommercialaviation.com/AircraftPDF/E190_Cabin.pdf Fuel Capacity: Maximum usable fuel. Source: http://www.embraercommercialaviation.com/AircraftPDF/E190_Weights.pdf Maximum Range: Assuming full-load of passengers, long-range cruise speed, and typical mission reserves. Source: http://www.embraercommercialaviation.com/AircraftPDF/E190_Performance.pdf First Flight: Aircraft Model: EMBRAER Aircraft Version: E190AR Seats: Average between high-capacity single-class and dual-class. Source: http://www.embraercommercialaviation.com/AircraftPDF/E190_Cabin.pdf Fuel Capacity: Maximum usable fuel. Source: http://www.embraercommercialaviation.com/AircraftPDF/E190_Weights.pdf Maximum Range: Assuming full-load of passengers, long-range cruise speed, and typical mission reserves. Source: http://www.embraercommercialaviation.com/AircraftPDF/E190_Performance.pdf First Flight: Aircraft Model: EMBRAER Aircraft Version: E195ST Seats: Average between high-capacity single-class and dual-class. Source: http://www.embraercommercialaviation.com/AircraftPDF/E195_Cabin.pdf Fuel Capacity: Maximum usable fuel. Source: http://www.embraercommercialaviation.com/AircraftPDF/E195_Weights.pdf Maximum Range: Assuming full-load of passengers, long-range cruise speed, and typical mission reserves. Source: http://www.embraercommercialaviation.com/AircraftPDF/E195_Performance.pdf First Flight: Source: http://www.airliners.net/aircraft-data/embraer-erj-170175190195/406 Aircraft Model: EMBRAER Aircraft Version: E195LR Seats: Average between high-capacity single-class and dual-class. Source: http://www.embraercommercialaviation.com/AircraftPDF/E195_Cabin.pdf Fuel Capacity: Maximum usable fuel. Source: http://www.embraercommercialaviation.com/AircraftPDF/E195_Weights.pdf Maximum Range: Assuming full-load of passengers, long-range cruise speed, and typical mission reserves. Source: http://www.embraercommercialaviation.com/AircraftPDF/E195_Performance.pdf First Flight: Aircraft Model: EMBRAER Aircraft Version: E195AR Seats: Average between high-capacity single-class and dual-class. Source: http://www.embraercommercialaviation.com/AircraftPDF/E195_Cabin.pdf Fuel Capacity: Maximum usable fuel. Source: http://www.embraercommercialaviation.com/AircraftPDF/E195_Weights.pdf Maximum Range: Assuming full-load of passengers, long-range cruise speed, and typical mission reserves. Source: http://www.embraercommercialaviation.com/AircraftPDF/E195_Performance.pdf First Flight: Aircraft Model: FAIRCHILD Aircraft Version: METRO/MERLIN
AircraftModels
Seats: Source: https://www.airlines-inform.com/commercial-aircraft/Fairchild-Metro.html Fuel Capacity: Standard fuel capacity. Source: https://www.airlines-inform.com/commercial-aircraft/Fairchild-Metro.html Maximum Range: Assuming maximum payload. Source: https://www.airlines-inform.com/commercial-aircraft/Fairchild-Metro.html First Flight: Source: https://www.airlines-inform.com/commercial-aircraft/Fairchild-Metro.html Aircraft Model: FOKKER Aircraft Version: F100 Seats: Typical seating capacity. Source: http://www.flugzeuginfo.net/acdata_php/acdata_fokker100_en.php Fuel Capacity: Standard fuel capacity. Source: https://www.airlines-inform.com/commercial-aircraft/Fokker-100.html Maximum Range: Assuming maximum payload. Source: https://www.airlines-inform.com/commercial-aircraft/Fokker-100.html First Flight: Source: https://www.airlines-inform.com/commercial-aircraft/Fokker-100.html Aircraft Model: FOKKER Aircraft Version: F27 FRIENDSHIP Seats: Maximum single-class. Source: http://www.mutleyshangar.com/reviews/ag/f27/f27.htm Fuel Capacity: Maximum capacity. Source: http://www.mutleyshangar.com/reviews/ag/f27/f27.htm Maximum Range: Assuming a full fuel-load and maximum take-off weight. Source: http://www.mutleyshangar.com/reviews/ag/f27/f27.htm First Flight: Source: http://www.airliners.net/aircraft-data/fokker-f-27-fairchild-f-27-fh-227/217 Aircraft Model: FOKKER Aircraft Version: F28 FELLOWSHIP (MK3000) Seats: Maximum. Source: http://www.airliners.net/aircraft-data/fokker-f-28-fellowship/219 Fuel Capacity: Maximum Range: Average between high-speed cruise and long-range cruise, both with maximum seating capacity. Source: http://www.airliners.net/aircraft-data/fokker-f-28-fellowship/219 First Flight: Source: http://www.airliners.net/aircraft-data/fokker-f-28-fellowship/219 Aircraft Model: FOKKER Aircraft Version: 50HP Seats: Maximum single-class. Source: https://www.airlines-inform.com/commercial-aircraft/Fokker-50.html Fuel Capacity: Standard fuel capacity. Source: https://www.airlines-inform.com/commercial-aircraft/Fokker-50.html Maximum Range: Assuming maximum payload. Source: https://www.airlines-inform.com/commercial-aircraft/Fokker-50.html First Flight: Source: https://www.airlines-inform.com/commercial-aircraft/Fokker-50.html Aircraft Model: FOKKER Aircraft Version: 70 Seats: Maximum single-class Source: https://www.airlines-inform.com/commercial-aircraft/Fokker-70.html Fuel Capacity: Standard fuel capacity. Source: https://www.airlines-inform.com/commercial-aircraft/Fokker-70.html Maximum Range: Assuming maximum payload. Source: https://www.airlines-inform.com/commercial-aircraft/Fokker-70.html First Flight: Source: https://www.airlines-inform.com/commercial-aircraft/Fokker-70.html Aircraft Model: ILYUSHIN Aircraft Version: IL114
AircraftModels
Seats: Maximum single-class. Source: https://www.airlines-inform.com/commercial-aircraft/Il-114.html Fuel Capacity: Standard fuel capacity. Source: https://www.airlines-inform.com/commercial-aircraft/Il-114.html Maximum Range: Assuming maximum payload. Source: https://www.airlines-inform.com/commercial-aircraft/Il-114.html First Flight: Source: https://www.airlines-inform.com/commercial-aircraft/Il-114.html Aircraft Model: ILYUSHIN Aircraft Version: IL62 Seats: Average between single-class and dual-class seating capacity. Source: https://www.airlines-inform.com/commercial-aircraft/Il-62.html Fuel Capacity: Standard fuel capacity for IL62M. Source: https://www.airlines-inform.com/commercial-aircraft/Il-62.html Maximum Range: Assuming maximum payload. Source: https://www.airlines-inform.com/commercial-aircraft/Il-62.html First Flight: Source: https://www.airlines-inform.com/commercial-aircraft/Il-62.html Aircraft Model: ILYUSHIN Aircraft Version: IL18D Seats: Maximum single-class capacity. Source: https://www.airlines-inform.com/commercial-aircraft/Il-18.html Fuel Capacity: Standard fuel capacity. Source: https://www.airlines-inform.com/commercial-aircraft/Il-18.html Maximum Range: Assuming maximum payload. Source: https://www.airlines-inform.com/commercial-aircraft/Il-18.html First Flight: Source: http://www.airliners.net/aircraft-data/ilyushin-il-18/249 Aircraft Model: ILYUSHIN Aircraft Version: IL96-300 We chose the non-stretched version (-400 being the stretched version). Seats: Average between single-class and three-class seating capacity. Source: https://www.airlines-inform.com/commercial-aircraft/Il-96.html Fuel Capacity: Standard fuel capacity. Source: https://www.airlines-inform.com/commercial-aircraft/Il-96.html Maximum Range: Assuming maximum payload. Source: https://www.airlines-inform.com/commercial-aircraft/Il-96.html First Flight: Source: https://www.airlines-inform.com/commercial-aircraft/Il-96.html Aircraft Model: INDONESIAN AEROSPACE Aircraft Version: C-212-400 AVIOCR Seats: Average between given range: seating information not given. Source: https://www.indonesian-aerospace.com/view.php?m=product&t=aircraft-detil&id=1 Fuel Capacity: Standard fuel capacity. Source: https://www.airlines-inform.com/commercial-aircraft/CASA-212.html Maximum Range: Assuming maximum payload. Source: https://www.airlines-inform.com/commercial-aircraft/CASA-212.html First Flight: Source: https://www.airlines-inform.com/commercial-aircraft/CASA-212.html Aircraft Model: LET Aircraft Version: L-410-UVP-E20 Seats: Maximum single-class. Source: https://www.airlines-inform.com/commercial-aircraft/L-410.html Fuel Capacity: Standard fuel capacity. Source: https://www.airlines-inform.com/commercial-aircraft/L-410.html
AircraftModels
Maximum Range: Assuming maximum payload. Source: https://www.airlines-inform.com/commercial-aircraft/L-410.html First Flight: Source: https://www.airlines-inform.com/commercial-aircraft/L-410.html Aircraft Model: MCDONNELL DOUGLAS Aircraft Version: DC-10CF Seats: Average between maximum and standard seating capacity. Source: http://www.boeing.com/resources/boeingdotcom/company/about_bca/startup/pdf/historical/dc10-passenger.pdf Fuel Capacity: Usable fuel capacity. Source: http://www.boeing.com/resources/boeingdotcom/company/about_bca/startup/pdf/historical/dc10-passenger.pdf Maximum Range: Assuming maximum payload. Source: http://www.boeing.com/commercial/aeromagazine/aero_02/textonly/ps02txt.html First Flight: Source: http://www.airliners.net/aircraft-data/mcdonnell-douglas-dc-10-boeing-md-10/279 Aircraft Model: MCDONNELLL DOUGLAS Aircraft Version: DC8-43 Seats: Maximum seating capacity (class not specified). Source: http://www.boeing.com/assets/pdf/commercial/airports/acaps/dc8.pdf Fuel Capacity: Usable fuel. Source: http://www.boeing.com/assets/pdf/commercial/airports/acaps/dc8.pdf Maximum Range: Source: http://www.boeing.com/news/frontiers/archive/2008/june/i_history.pdf First Flight: Source: http://www.boeing.com/history/products/dc-8.page Aircraft Model: MCDONNEL DOUGLAS Aircraft Version: DC9-30 Seats: Average between single-class and three-class seating capacity. Source: https://www.airlines-inform.com/commercial-aircraft/Douglas-DC-9.html Fuel Capacity: Standard fuel capacity. Source: https://www.airlines-inform.com/commercial-aircraft/Douglas-DC-9.html Maximum Range: Assuming maximum payload. Source: https://www.airlines-inform.com/commercial-aircraft/Douglas-DC-9.html First Flight: Source: https://www.airlines-inform.com/commercial-aircraft/Douglas-DC-9.html Aircraft Model: MCDONNEL DOUGLAS Aircraft Version: DC9-10 Seats: Single-class seating capacity. Source: http://www.airliners.net/aircraft-data/mcdonnell-douglas-dc-9-102030/276 Fuel Capacity: Source: http://planes.axlegeeks.com/l/461/McDonnell-Douglas-DC-9-10 Maximum Range: Assuming maximum payload. Source: http://www.airliners.net/aircraft-data/mcdonnell-douglas-dc-9-102030/276 First Flight: Source: http://www.airliners.net/aircraft-data/mcdonnell-douglas-dc-9-102030/276 Aircraft Model: MCDONNELL DOUGLAS Aircraft Version: DC9-50 Seats: Average between single-class and coach-class seating capacity. Source: http://www.boeing.com/resources/boeingdotcom/company/about_bca/startup/pdf/historical/dc9-passenger.pdf Fuel Capacity: Standard fuel capacity. Source: https://www.airlines-inform.com/commercial-aircraft/Douglas-DC-9.html Maximum Range: Assuming maximum payload. Source: https://www.airlines-inform.com/commercial-aircraft/Douglas-DC-9.html First Flight: Source: http://www.boeing.com/history/products/dc-9.page
AircraftModels
Aircraft Model: NAMC Aircraft Version: YS11A-200 Seats: Single-class seating capacity. Sources: http://www.airliners.net/aircraft-data/namc-ys-11/287 Fuel Capacity: Source: http://www.airvectors.net/avnamc.html Maximum Range: Assuming maximum payload. Source: https://www.airlines-inform.com/commercial-aircraft/YS-11.html First Flight: Source: http://www.worldlibrary.org/articles/namc_ys-11a Aircraft Model: SAAB Aircraft Version: 2000 Seats: Maximum single-class capacity. Source: https://www.airlines-inform.com/commercial-aircraft/SAAB-2000.html Fuel Capacity: Standard fuel capacity. Source: https://www.airlines-inform.com/commercial-aircraft/SAAB-2000.html Maximum Range: Assuming maximum payload. Source: https://www.airlines-inform.com/commercial-aircraft/SAAB-2000.html First Flight: Source: https://www.airlines-inform.com/commercial-aircraft/SAAB-2000.html Aircraft Model: SAAB Aircraft Version: 340B PLUS Seats: Maximum single-class capacity. Source: https://www.airlines-inform.com/commercial-aircraft/SAAB-340.html Fuel Capacity: Standard fuel capacity. Source: https://www.airlines-inform.com/commercial-aircraft/SAAB-340.html Maximum Range: Assuming maximum payload. Source: https://www.airlines-inform.com/commercial-aircraft/SAAB-340.html First Flight: Source: https://www.airlines-inform.com/commercial-aircraft/SAAB-340.html Aircraft Model: SHORTS Aircraft Version: 330-200 Seats: Maximum single-class capacity. Source: https://www.airlines-inform.com/commercial-aircraft/Shorts-330.html Fuel Capacity: Standard fuel capacity. Source: https://www.airlines-inform.com/commercial-aircraft/Shorts-330.html Maximum Range: Assuming maximum payload. Source: https://www.airlines-inform.com/commercial-aircraft/Shorts-330.html First Flight: Source: https://www.airlines-inform.com/commercial-aircraft/Shorts-330.html Aircraft Model: SHORTS Aircraft Version: 360-300 Seats: Maximum single-class capacity. Source: https://www.airlines-inform.com/commercial-aircraft/Shorts-360.html Fuel Capacity: Standard fuel capacity. Source: https://www.airlines-inform.com/commercial-aircraft/Shorts-360.html Maximum Range: Assuming maximum payload. Source: https://www.airlines-inform.com/commercial-aircraft/Shorts-360.html First Flight: Source: https://www.airlines-inform.com/commercial-aircraft/Shorts-360.html Aircraft Model: SUKHOI SUPERJET 100 Aircraft Version: SSJ-95 Seats: Average between maximum and dual-class seating capacity. Source: http://www.airliners.net/aircraft-data/sukhoi-superjet-100/408 Fuel Capacity: Source: http://planes.axlegeeks.com/l/336/Sukhoi-Superjet-100-95
AircraftModels
Maximum Range: Assuming maximum payload. Source: https://www.airlines-inform.com/commercial-aircraft/Superjet-100.html First Flight: Source: https://www.airlines-inform.com/commercial-aircraft/Superjet-100.html Aircraft Model: SUKHOI SUPERJET 100 Aircraft Version: SSJ-95LR Seats: Average between maximum and dual-class seating capacity. Source: http://www.airliners.net/aircraft-data/sukhoi-superjet-100/408 Fuel Capacity: Source: http://planes.axlegeeks.com/l/336/Sukhoi-Superjet-100-95 Maximum Range: Assuming maximum payload. Source: https://www.airlines-inform.com/commercial-aircraft/Superjet-100.html First Flight: Source: https://www.airlines-inform.com/commercial-aircraft/Superjet-100.html Aircraft Model: TUPOLEV Aircraft Version: TU134A Seats: Average between single-class and dual-class seating capacity. Source: https://www.airlines-inform.com/commercial-aircraft/Tu-134.html` Fuel Capacity: The original data was 14400, but that was measurement was in kg. We converted this number to litres assuming a volume mass of .782 kg/L (number given in EASA, 2016). Source: https://www.airlines-inform.com/commercial-aircraft/Tu-134.html Maximum Range: Assuming maximum payload. Source: https://www.airlines-inform.com/commercial-aircraft/Tu-134.html First Flight: Source: https://www.airlines-inform.com/commercial-aircraft/Tu-134.htm\ Aircraft Model: TUPOLEV Aircraft Version: TU154 Seats: Average between maximum single-class and minimum dual-class seating capacity. Source: https://www.airlines-inform.com/commercial-aircraft/Tu-154.html Fuel Capacity: Source: https://en.wikipedia.org/wiki/Tupolev_Tu-154 Maximum Range: Assuming maximum payload. Source: https://www.airlines-inform.com/commercial-aircraft/Tu-154.html First Flight: Source: https://www.airlines-inform.com/commercial-aircraft/Tu-154.html Aircraft Model: TUPOLEV Aircraft Version: TU204-100 Seats: Average between single-class and three-class seating capacity. Source: https://www.airlines-inform.com/commercial-aircraft/Tu-204-100.html Fuel Capacity: Standard fuel capacity. Source: https://www.airlines-inform.com/commercial-aircraft/Tu-204-100.html Maximum Range: Assuming maximum payload. Source: https://www.airlines-inform.com/commercial-aircraft/Tu-204-100.html First Flight: Source: https://www.airlines-inform.com/commercial-aircraft/Tu-204-family.html Aircraft Model: XIAN Aircraft Version: MA60 Seats: Single-class seating capacity. Source: http://www.flugzeuginfo.net/acdata_php/acdata_xian_ma60_en.php Fuel Capacity: The original data was 4030, but that was measurement was in kg. We converted this number to litres assuming a volume mass of .782 kg/L (number given in EASA, 2016). Source: https://www.airlines-inform.com/commercial-aircraft/Xian-MA60.html Maximum Range: Assuming maximum payload. Source: https://www.airlines-inform.com/commercial-aircraft/Xian-MA60.html First Flight: Source: http://www.flugzeuginfo.net/acdata_php/acdata_xian_ma60_en.php Aircraft Model: YAKOVLEV
AircraftModels
Aircraft Version: YAK40 Seats: Average between single-class variations. Source: https://www.airlines-inform.com/commercial-aircraft/Yak-40.html Fuel Capacity: The original data was 4430, but that was measurement was in kg. We converted this number to litres assuming a volume mass of .782 kg/L (number given in EASA, 2016). Source: https://www.airlines-inform.com/commercial-aircraft/Yak-40.html Maximum Range: Assuming maximum payload. Source: https://www.airlines-inform.com/commercial-aircraft/Yak-40.html First Flight: Source: https://www.airlines-inform.com/commercial-aircraft/Yak-40.html Aircraft Model: YAKOVLEV Aircraft Version: YAK42D Seats: Class that each seating capacity refers to was not specified. Source: https://www.forecastinternational.com/archive/disp_old_pdf.cfm?ARC_ID=1055 Fuel Capacity: Maximum capacity. Source: https://www.forecastinternational.com/archive/disp_old_pdf.cfm?ARC_ID=1055 Maximum Range: Assuming normal payload. Source: https://www.forecastinternational.com/archive/disp_old_pdf.cfm?ARC_ID=1055 First Flight: Source: https://www.forecastinternational.com/archive/disp_old_pdf.cfm?ARC_ID=1055 Reference: EASA (2016). EASA, TYPE-CERTIFICATE DATA SHEET: AIRBUS A300, A310 and A300-600, TCDS No. A172, Issue02, 24 November 2016.
Airbus Family booklet (2016). http://www.aircraft.airbus.com/fileadmin/media_gallery/files/brochures_publications/aircraft_families/Airbus-Family-figures-booklet-March2016.pdf


