Airbnb in NYC
12
Airbnb in NYC Housing Report NEW YORK COMMUNITIES FOR CHANGE REAL AFFORDABILITY FOR ALL 2015
Transcript of Airbnb in NYC
Airbnb in NYCHousing Report
NEW YORK COMMUNITIES FOR CHANGE
REAL AFFORDABILITY FOR ALL
2015
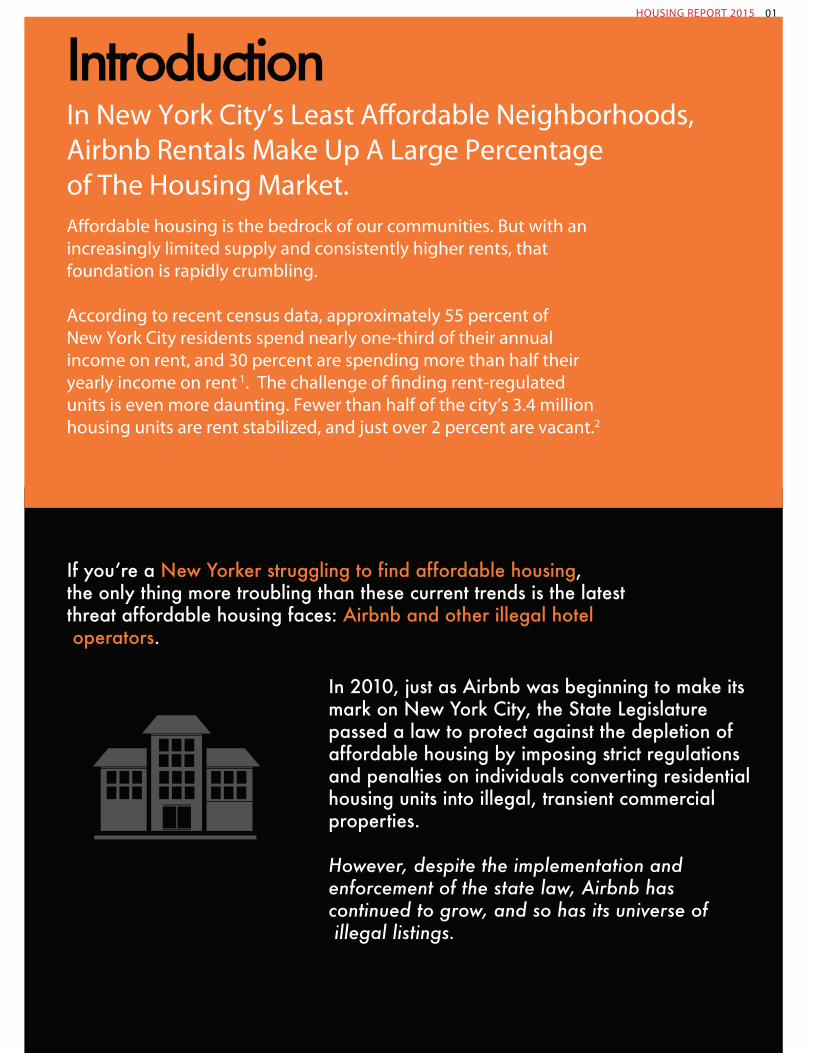
In New York City’s Least A�ordable Neighborhoods, Airbnb Rentals Make Up A Large Percentage of The Housing Market.
Introduction HOUSING REPORT 2015 01
A�ordable housing is the bedrock of our communities. But with an increasingly limited supply and consistently higher rents, that foundation is rapidly crumbling.
According to recent census data, approximately 55 percent of New York City residents spend nearly one-third of their annual income on rent, and 30 percent are spending more than half their yearly income on rent 1. The challenge of �nding rent-regulated units is even more daunting. Fewer than half of the city’s 3.4 millionhousing units are rent stabilized, and just over 2 percent are vacant.2
In 2010, just as Airbnb was beginning to make its mark on New York City, the State Legislature passed a law to protect against the depletion of affordable housing by imposing strict regulations and penalties on individuals converting residential housing units into illegal, transient commercial properties.
However, despite the implementation and enforcement of the state law, Airbnb has continued to grow, and so has its universe of illegal listings.
If youʼre a New Yorker struggling to find affordable housing, the only thing more troubling than these current trends is the latest threat affordable housing faces: Airbnb and other illegal hotel operators.
HOUSING REPORT 2015 02
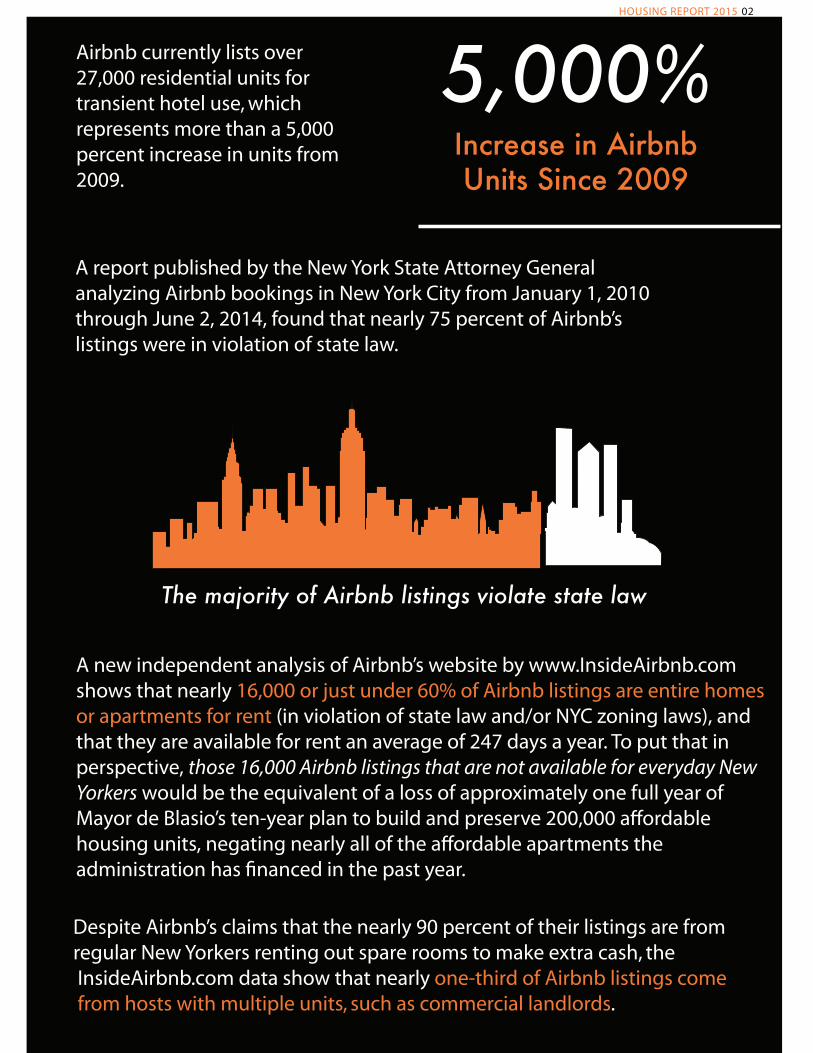
Airbnb currently lists over 27,000 residential units for transient hotel use, which represents more than a 5,000 percent increase in units from 2009.
A new independent analysis of Airbnb’s website by www.InsideAirbnb.com shows that nearly 16,000 or just under 60% of Airbnb listings are entire homes or apartments for rent (in violation of state law and/or NYC zoning laws), and that they are available for rent an average of 247 days a year. To put that in perspective, those 16,000 Airbnb listings that are not available for everyday New Yorkers would be the equivalent of a loss of approximately one full year of Mayor de Blasio’s ten-year plan to build and preserve 200,000 a�ordable housing units, negating nearly all of the a�ordable apartments the administration has �nanced in the past year.
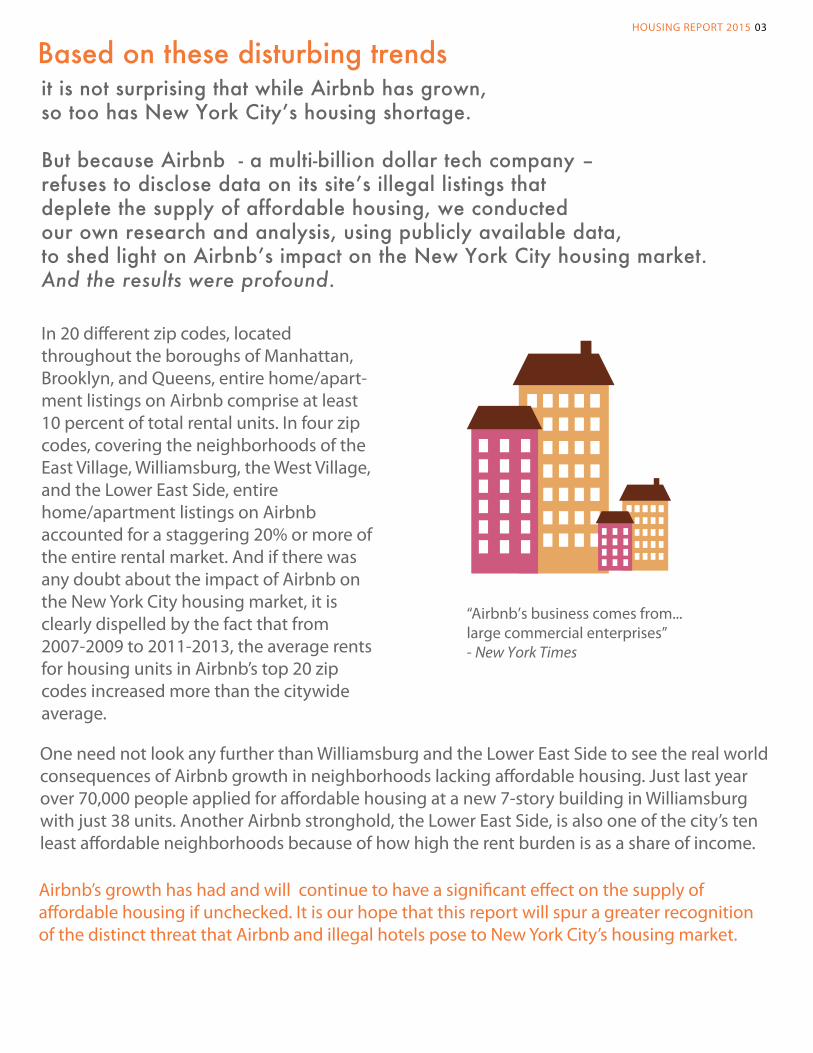
A report published by the New York State Attorney General analyzing Airbnb bookings in New York City from January 1, 2010through June 2, 2014, found that nearly 75 percent of Airbnb’s listings were in violation of state law.
Increase in Airbnb Units Since 2009
5,000%
Despite Airbnb’s claims that the nearly 90 percent of their listings are from regular New Yorkers renting out spare rooms to make extra cash, the InsideAirbnb.com data show that nearly one-third of Airbnb listings come from hosts with multiple units, such as commercial landlords.
The majority of Airbnb listings violate state law
HOUSING REPORT 2015 03
it is not surprising that while Airbnb has grown,so too has New York Cityʼs housing shortage.
But because Airbnb - a multi-billion dollar tech company –refuses to disclose data on its siteʼs illegal listings thatdeplete the supply of affordable housing, we conducted our own research and analysis, using publicly available data,to shed light on Airbnbʼs impact on the New York City housing market. And the results were profound.
“Airbnb’s business comes from...large commercial enterprises” - New York Times
Capabilites
Based on these disturbing trends
In 20 di�erent zip codes, locatedthroughout the boroughs of Manhattan, Brooklyn, and Queens, entire home/apart-ment listings on Airbnb comprise at least 10 percent of total rental units. In four zip codes, covering the neighborhoods of the East Village, Williamsburg, the West Village, and the Lower East Side, entire home/apartment listings on Airbnb accounted for a staggering 20% or more of the entire rental market. And if there was any doubt about the impact of Airbnb on the New York City housing market, it is clearly dispelled by the fact that from 2007-2009 to 2011-2013, the average rents for housing units in Airbnb’s top 20 zip codes increased more than the citywide average.
One need not look any further than Williamsburg and the Lower East Side to see the real world consequences of Airbnb growth in neighborhoods lacking a�ordable housing. Just last year over 70,000 people applied for a�ordable housing at a new 7-story building in Williamsburg with just 38 units. Another Airbnb stronghold, the Lower East Side, is also one of the city’s ten least a�ordable neighborhoods because of how high the rent burden is as a share of income.
Airbnb’s growth has had and will continue to have a signi�cant e�ect on the supply of a�ordable housing if unchecked. It is our hope that this report will spur a greater recognition of the distinct threat that Airbnb and illegal hotels pose to New York City’s housing market.
HOUSING REPORT 2015 04
“Anit aut labo. Nam nus reseque parum qui
“Anit aut labo. Nam nus reseque parum qui
Airbnb has nearly 16,000 entire home/apartment listings in NYC (approximately 60% of their total), which appear to be a clear violation of the 2010 Multiple Dwelling Law and/or the NYC Zoning Code.3
In 20 di�erent zip codes in Manhattan, Brooklyn and Queens, entire home/apartment Airbnb listings comprise at least 10% of total rentals. Housing studies have shown that eliminating inventory from the actual rental market reduces supply and raises rent.
In four di�erent zip codes, covering the neighborhoods of the East Village, Williamsburg, the West Village, and the Lower East Side, entire home/apartment Airbnb listings comprise over 20% of total rentals.
The yearly cumulative monetary value of all Airbnb illegal listings (entire house/apartment rentals) was found to be $393.3 million, or 77% of Airbnb’s overall listings4, compared to $117.9 million for shared or private rooms.
Nearly 33% of Airbnb illegal listings come from hosts with multiple units, such as com-mercial landlords.
The average entire home/apartment listing was available for 247 days per year, and was actually rented out 109 nights per year, largely removing these units from the NYC housing supply.
For entire home/apartment listings within the top 20 zip codes, the average annualavailability was even higher, at nearly 250 days per year and the average number of nights they were actually rented out for was 111 nights per year.
From 2007-2009 to 2011-2013, the average rents for housing units in the top 20 zip codes for Airbnb listings increased more than the citywide average.
In the top 20 zip codes for Airbnb usage, housing units are rented on Airbnb for rates equivalent to more than 300% of the neighborhood’s average rent.
100% of the top 20 zip codes for Airbnb usage in Brooklyn are in zip codes where the average rent increased by at least 32% from 2002-2014.
Topline Findings
MethodologyOverview
Data from an independent “webscrape” of Airbnb by www.InsideAirbnb.com was paired with demographic information from the U.S. Census Bureau’s 2009-2013 American Community Survey (ACS). Data from the New York City Housing and Vacancy Survey is also referenced, but was not used in calculations.
InsideAirbnb.com is an independent website not a�liated with Airbnb, its competitors, and any housing or other advocacy organization. It provides data through a “fair use” licensing agreement when used for “producing a non-commercial derivation to allow public analysis, discussion and community bene�t.5 ” The site aggregates Airbnb listings that can be sorted and analyzed by information required of public listings, including rates, availability, zip code and other characteris-tics. Analysis was performed using available datasets released May 1, 2015.6
ACS 2009-2013 data was released in varying stages in fall 2014, and is the most recent census data available. The U.S. Census Bureau uses a weighted sample for data collected in the �ve-year data range.
Citywide Picture
ACS data show New York has 3,380,513 units of housing and 310,215 vacant units. Based on this figure, Airbnb’s 15,977 entire home/apartment listings make up 4.84% of the total units available for rent. Note that this figure does not include any housing lost via Airbnb rentals listed by room.
The 2014 New York City Housing & Vacancy Survey (HVS) found that the city’s vacancy rate for the survey period to be 3.45%. 7 State law defines a vacancy rate for New York City of fewer than 5% as a housing emergency.8 Note that the “Potential Units Available to Rent” column refers to rental vacancy figures obtained from ACS data for individual zip codes.
Zip Code & Neighborhood Breakdown
For 20 di�erent zip codes in New York City, entire home/apartment Airbnb listings comprise at least 10% of overall rental inventory. For four zip codes, this �gure exceeds 20%.
[See next page for graph]
HOUSING REPORT 2015 05
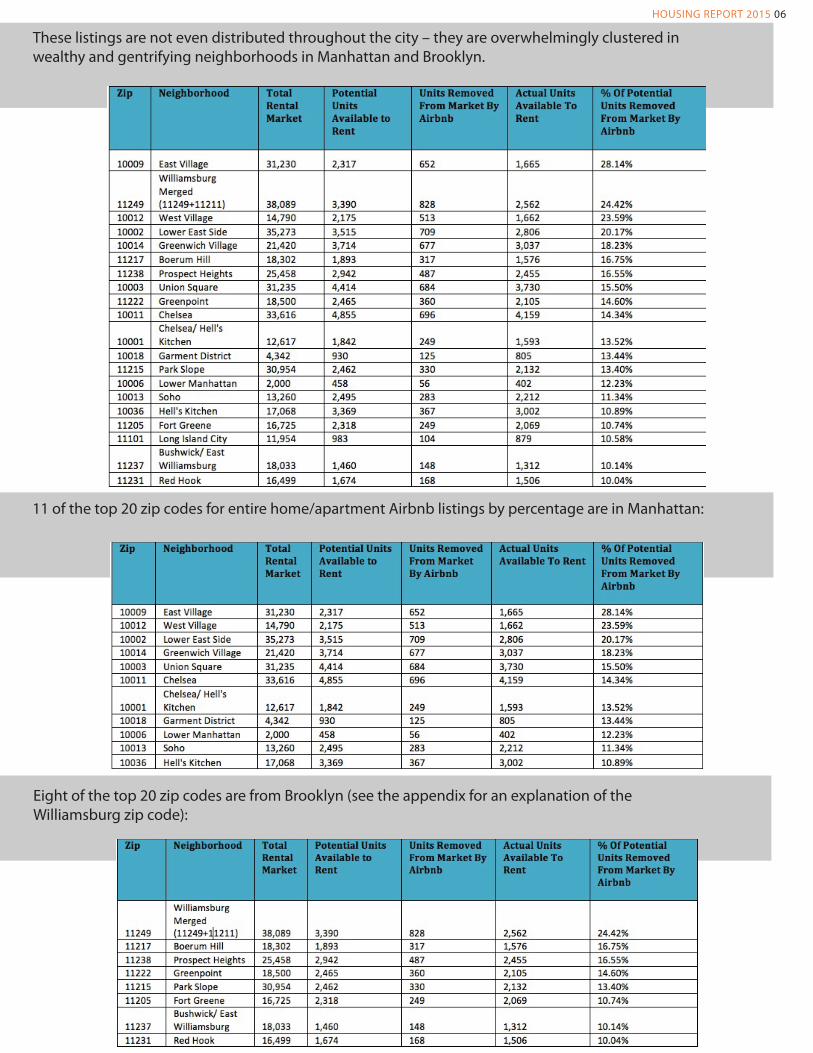
These listings are not even distributed throughout the city – they are overwhelmingly clustered in wealthy and gentrifying neighborhoods in Manhattan and Brooklyn.
11 of the top 20 zip codes for entire home/apartment Airbnb listings by percentage are in Manhattan:
HOUSING REPORT 2015 06
Eight of the top 20 zip codes are from Brooklyn (see the appendix for an explanation of the Williamsburg zip code):
Rooms for Rent Versus Entire Apartments
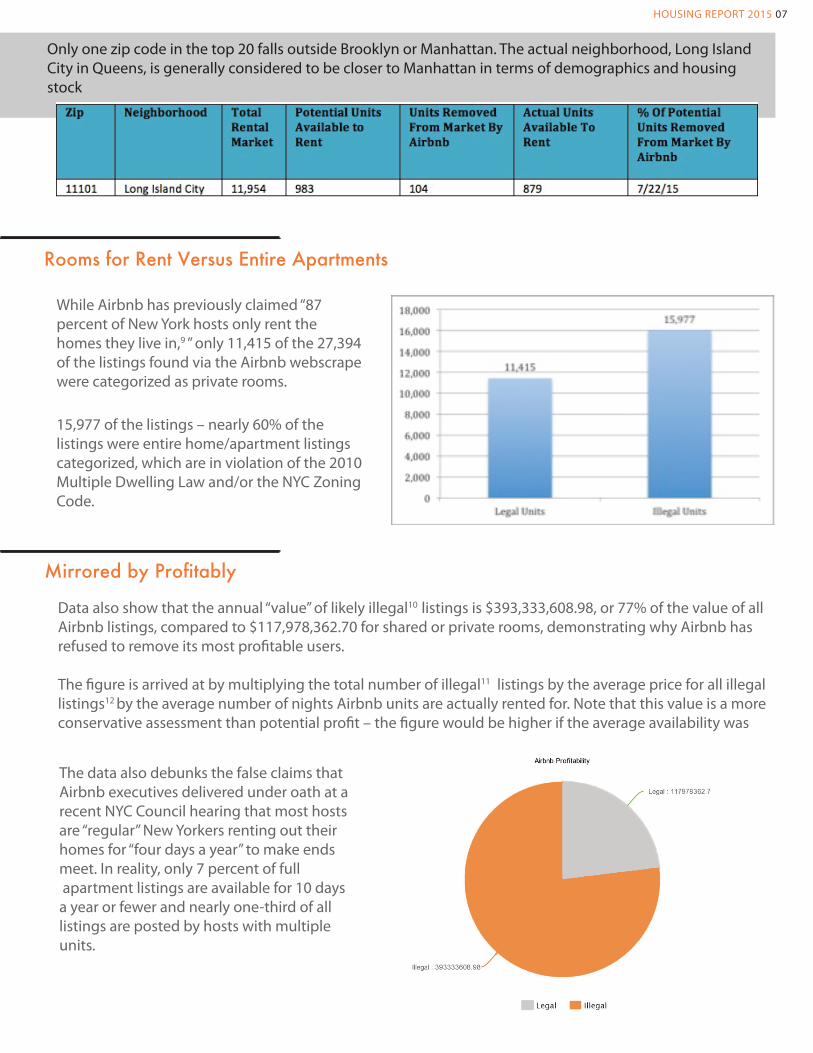
While Airbnb has previously claimed “87 percent of New York hosts only rent the homes they live in,9 ” only 11,415 of the 27,394 of the listings found via the Airbnb webscrape were categorized as private rooms.
Mirrored by Profitably
Data also show that the annual “value” of likely illegal10 listings is $393,333,608.98, or 77% of the value of all Airbnb listings, compared to $117,978,362.70 for shared or private rooms, demonstrating why Airbnb has refused to remove its most pro�table users.
The �gure is arrived at by multiplying the total number of illegal11 listings by the average price for all illegal listings12 by the average number of nights Airbnb units are actually rented for. Note that this value is a more conservative assessment than potential pro�t – the �gure would be higher if the average availability was
The data also debunks the false claims that Airbnb executives delivered under oath at a recent NYC Council hearing that most hosts are “regular” New Yorkers renting out their homes for “four days a year” to make ends meet. In reality, only 7 percent of full apartment listings are available for 10 days a year or fewer and nearly one-third of all listings are posted by hosts with multiple units.
15,977 of the listings – nearly 60% of the listings were entire home/apartment listings categorized, which are in violation of the 2010Multiple Dwelling Law and/or the NYC Zoning Code.
HOUSING REPORT 2015 07
Only one zip code in the top 20 falls outside Brooklyn or Manhattan. The actual neighborhood, Long Island City in Queens, is generally considered to be closer to Manhattan in terms of demographics and housing stock
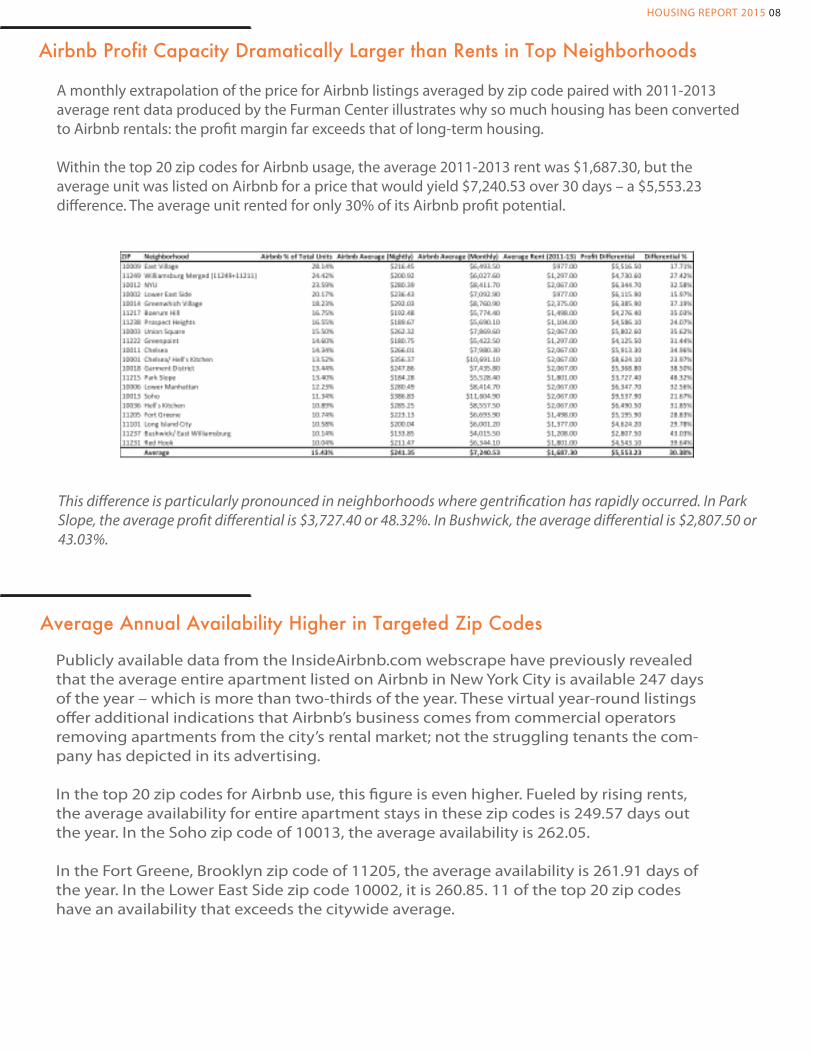
Airbnb Profit Capacity Dramatically Larger than Rents in Top Neighborhoods
A monthly extrapolation of the price for Airbnb listings averaged by zip code paired with 2011-2013 average rent data produced by the Furman Center illustrates why so much housing has been converted to Airbnb rentals: the pro�t margin far exceeds that of long-term housing.
Within the top 20 zip codes for Airbnb usage, the average 2011-2013 rent was $1,687.30, but theaverage unit was listed on Airbnb for a price that would yield $7,240.53 over 30 days – a $5,553.23 di�erence. The average unit rented for only 30% of its Airbnb pro�t potential.
This di�erence is particularly pronounced in neighborhoods where gentri�cation has rapidly occurred. In Park Slope, the average pro�t di�erential is $3,727.40 or 48.32%. In Bushwick, the average di�erential is $2,807.50 or 43.03%.
HOUSING REPORT 2015 08
Publicly available data from the InsideAirbnb.com webscrape have previously revealed that the average entire apartment listed on Airbnb in New York City is available 247 days of the year – which is more than two-thirds of the year. These virtual year-round listings o�er additional indications that Airbnb’s business comes from commercial operators removing apartments from the city’s rental market; not the struggling tenants the com-pany has depicted in its advertising.
In the top 20 zip codes for Airbnb use, this �gure is even higher. Fueled by rising rents, the average availability for entire apartment stays in these zip codes is 249.57 days out the year. In the Soho zip code of 10013, the average availability is 262.05.
In the Fort Greene, Brooklyn zip code of 11205, the average availability is 261.91 days of the year. In the Lower East Side zip code 10002, it is 260.85. 11 of the top 20 zip codes have an availability that exceeds the citywide average.
Average Annual Availability Higher in Targeted Zip Codes
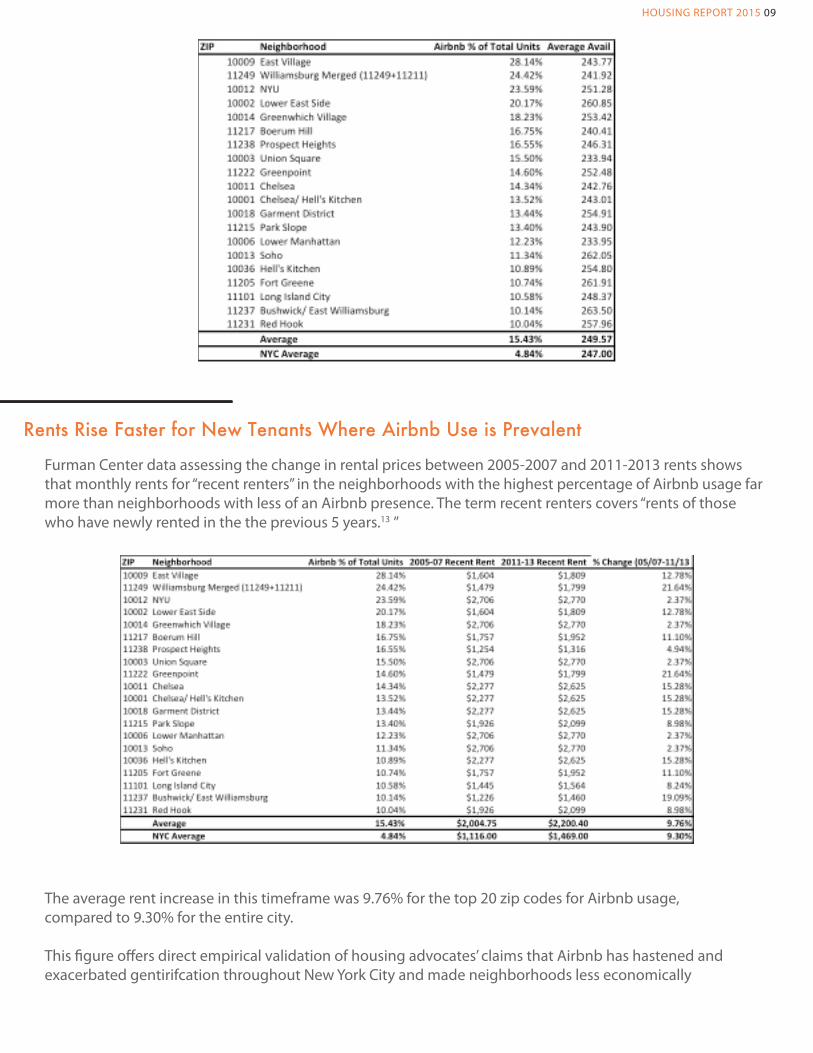
Furman Center data assessing the change in rental prices between 2005-2007 and 2011-2013 rents shows that monthly rents for “recent renters” in the neighborhoods with the highest percentage of Airbnb usage far more than neighborhoods with less of an Airbnb presence. The term recent renters covers “rents of those who have newly rented in the the previous 5 years.13 ”
Rents Rise Faster for New Tenants Where Airbnb Use is Prevalent
The average rent increase in this timeframe was 9.76% for the top 20 zip codes for Airbnb usage, compared to 9.30% for the entire city.
This �gure o�ers direct empirical validation of housing advocates’ claims that Airbnb has hastened and exacerbated gentirifcation throughout New York City and made neighborhoods less economically
HOUSING REPORT 2015 09
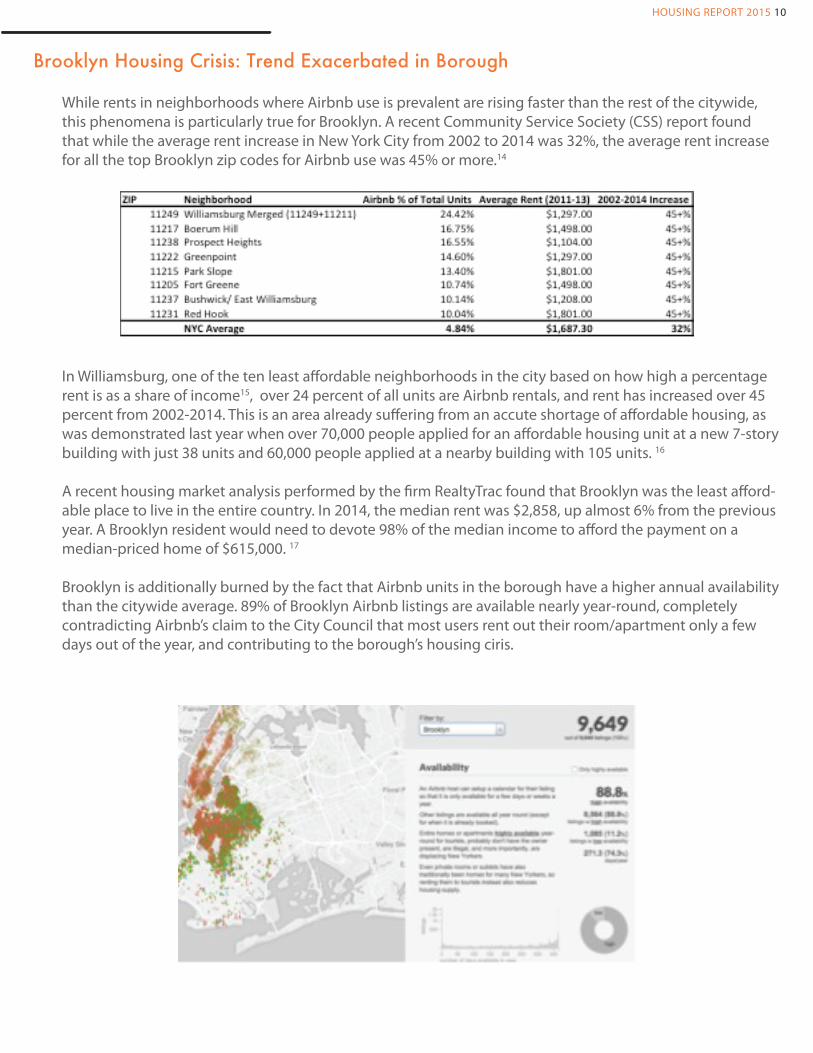
While rents in neighborhoods where Airbnb use is prevalent are rising faster than the rest of the citywide, this phenomena is particularly true for Brooklyn. A recent Community Service Society (CSS) report found that while the average rent increase in New York City from 2002 to 2014 was 32%, the average rent increase for all the top Brooklyn zip codes for Airbnb use was 45% or more.14
In Williamsburg, one of the ten least a�ordable neighborhoods in the city based on how high a percentage rent is as a share of income15, over 24 percent of all units are Airbnb rentals, and rent has increased over 45 percent from 2002-2014. This is an area already su�ering from an accute shortage of a�ordable housing, as was demonstrated last year when over 70,000 people applied for an a�ordable housing unit at a new 7-story building with just 38 units and 60,000 people applied at a nearby building with 105 units. 16
A recent housing market analysis performed by the �rm RealtyTrac found that Brooklyn was the least a�ord-able place to live in the entire country. In 2014, the median rent was $2,858, up almost 6% from the previous year. A Brooklyn resident would need to devote 98% of the median income to a�ord the payment on a median-priced home of $615,000. 17
Brooklyn is additionally burned by the fact that Airbnb units in the borough have a higher annual availability than the citywide average. 89% of Brooklyn Airbnb listings are available nearly year-round, completely contradicting Airbnb’s claim to the City Council that most users rent out their room/apartment only a few days out of the year, and contributing to the borough’s housing ciris.
Brooklyn Housing Crisis: Trend Exacerbated in Borough
HOUSING REPORT 2015 10
APPENDIX AWilliamsburg Methodology
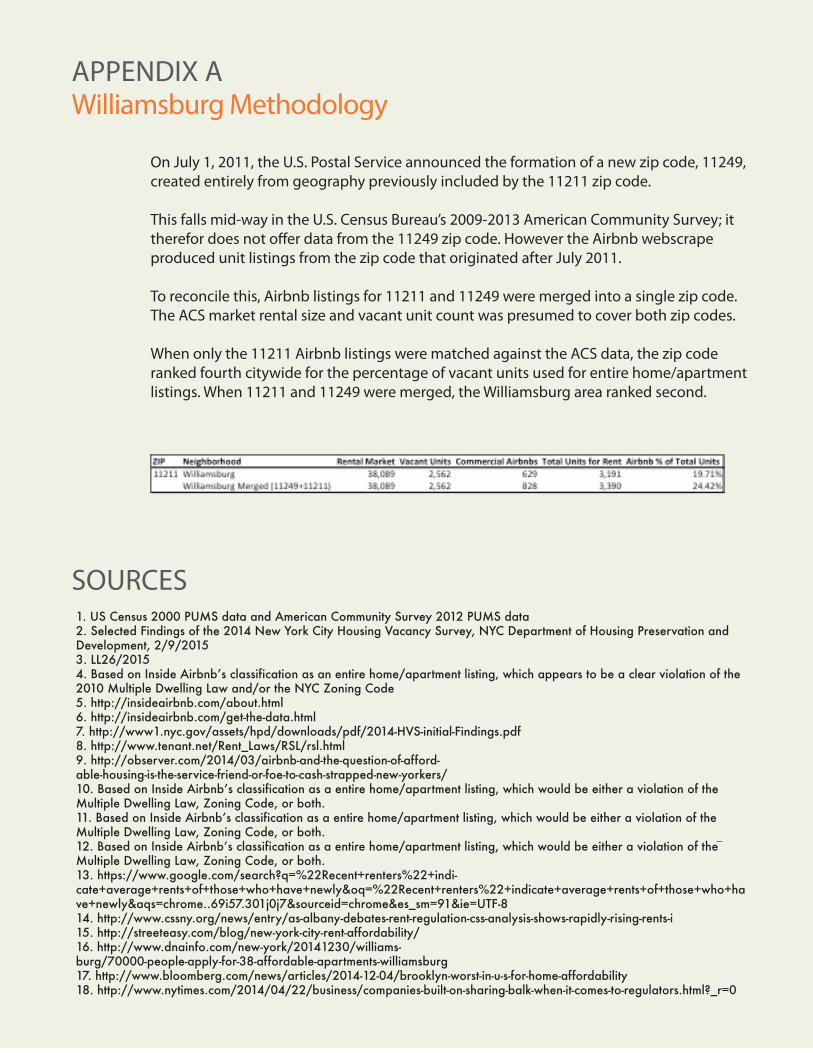
On July 1, 2011, the U.S. Postal Service announced the formation of a new zip code, 11249, created entirely from geography previously included by the 11211 zip code.
This falls mid-way in the U.S. Census Bureau’s 2009-2013 American Community Survey; it therefor does not o�er data from the 11249 zip code. However the Airbnb webscrape produced unit listings from the zip code that originated after July 2011.
To reconcile this, Airbnb listings for 11211 and 11249 were merged into a single zip code. The ACS market rental size and vacant unit count was presumed to cover both zip codes.
When only the 11211 Airbnb listings were matched against the ACS data, the zip code ranked fourth citywide for the percentage of vacant units used for entire home/apartment listings. When 11211 and 11249 were merged, the Williamsburg area ranked second.
SOURCES 1. US Census 2000 PUMS data and American Community Survey 2012 PUMS data2. Selected Findings of the 2014 New York City Housing Vacancy Survey, NYC Department of Housing Preservation and Development, 2/9/20153. LL26/20154. Based on Inside Airbnbʼs classification as an entire home/apartment listing, which appears to be a clear violation of the 2010 Multiple Dwelling Law and/or the NYC Zoning Code5. http://insideairbnb.com/about.html6. http://insideairbnb.com/get-the-data.html7. http://www1.nyc.gov/assets/hpd/downloads/pdf/2014-HVS-initial-Findings.pdf8. http://www.tenant.net/Rent_Laws/RSL/rsl.html9. http://observer.com/2014/03/airbnb-and-the-question-of-afford-able-housing-is-the-service-friend-or-foe-to-cash-strapped-new-yorkers/10. Based on Inside Airbnbʼs classification as a entire home/apartment listing, which would be either a violation of the Multiple Dwelling Law, Zoning Code, or both.11. Based on Inside Airbnbʼs classification as a entire home/apartment listing, which would be either a violation of the Multiple Dwelling Law, Zoning Code, or both.12. Based on Inside Airbnbʼs classification as a entire home/apartment listing, which would be either a violation of the Multiple Dwelling Law, Zoning Code, or both.13. https://www.google.com/search?q=%22Recent+renters%22+indi-cate+average+rents+of+those+who+have+newly&oq=%22Recent+renters%22+indicate+average+rents+of+those+who+have+newly&aqs=chrome..69i57.301j0j7&sourceid=chrome&es_sm=91&ie=UTF-814. http://www.cssny.org/news/entry/as-albany-debates-rent-regulation-css-analysis-shows-rapidly-rising-rents-i15. http://streeteasy.com/blog/new-york-city-rent-affordability/16. http://www.dnainfo.com/new-york/20141230/williams-burg/70000-people-apply-for-38-affordable-apartments-williamsburg17. http://www.bloomberg.com/news/articles/2014-12-04/brooklyn-worst-in-u-s-for-home-affordability18. http://www.nytimes.com/2014/04/22/business/companies-built-on-sharing-balk-when-it-comes-to-regulators.html?_r=0