Video: Business Ethics in the 21 st Century ethics-21st-century/ ethics-21st-century

Muhammad Arshad JalilFRAeS
Air Transport in 21st Century

Global Aviation Industry
Overview

Overview : Aviation IndustryOverview : Aviation Industry
•
Airline direct revenue is in excess of USD 650 billion annually
•
Contributes USD 2.9 Trillion to the global economy•
Aviation industry generates over 29 million jobs
annually•
There are more than 900 airlines in the world,
serving over 1700 airports
Correlation of Economy with Aviation Industry
Aviation Industry & Economy

Aviation Industry & EconomyAviation Industry & Economy
•
Investment in aviation industry has a multiplier factor of 600 ‐
highest in any industry
•
Air transportation impacts economy by : • Providing employment• Access to markets• Access to people• Access to capital• Access to ideas • Access to knowledge• Access to labor supply • Access to skills• Access to opportunity • Access to resources
•
The economy in turn provides capital and generates demand for passenger and freight travel.
Aviation Industry & EconomyAviation Industry & Economy
•
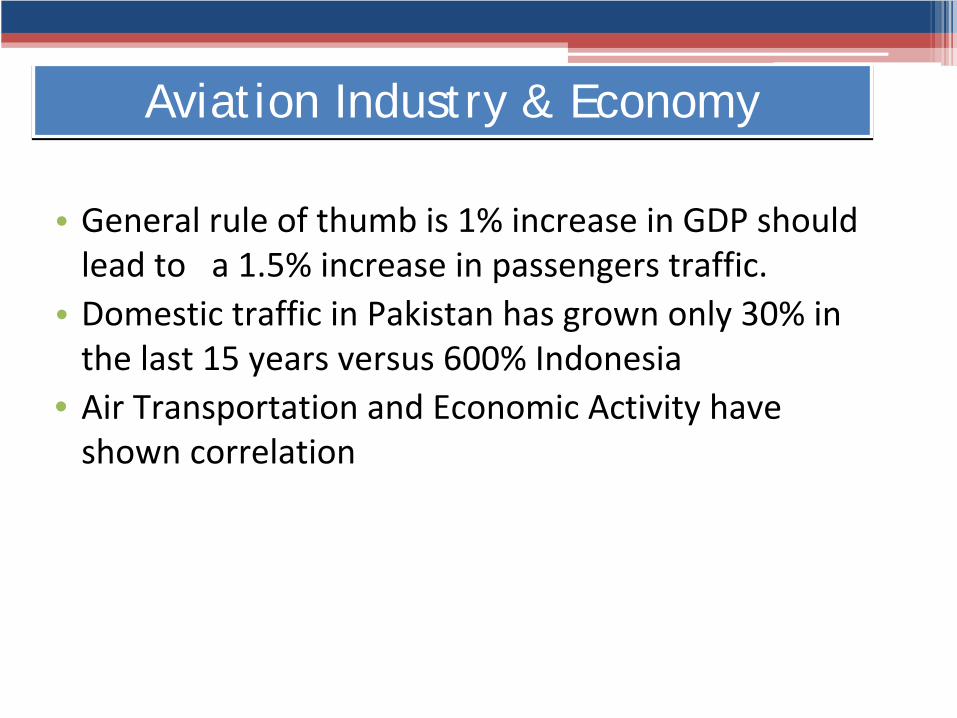
General rule of thumb is 1% increase in GDP should lead to a 1.5% increase in passengers traffic.
•
Domestic traffic in Pakistan has grown only 30% in the last 15 years versus 600% Indonesia
• Air Transportation and Economic Activity have shown correlation

Aviation Industry & Economy (Continue….) Aviation Industry & Economy (Continue….)

Top 10 airlines of 2011 by ASKs
Delta Air Lines 6.8 billions
American Airlines 5.0 billionsUnited Airlines 3.9 billionsEmirates 3.8 billionsLufthansa 3.4 billionsSouthwest Airlines 3.4 billions
Continental Airlines 3.2 billionsAir France 3.0 billionsBritish Airways 3.0 billionsRyanair 2.5 billions
Aviation Industry & EconomyAviation Industry & Economy
Aviation Industry Business Models
Types , Kinds and Case studies

Passengers TransportedLoad
FactorsYield US $ Cents/ RPK
Full Service Airlines1.57 billion 77.1% 6.81
Low Cost Carriers
523 million 81.8% 5.97
Regional Airlines
219 million 73.3% 8.86
Charter Airlines 56 million 99.8% 3.62
Total 2.3 billion ‐‐‐‐‐ ‐‐‐‐‐
Aviation Industry Business Models Aviation Industry Business Models

Traditional Carriers
Evaluation & Threats
•
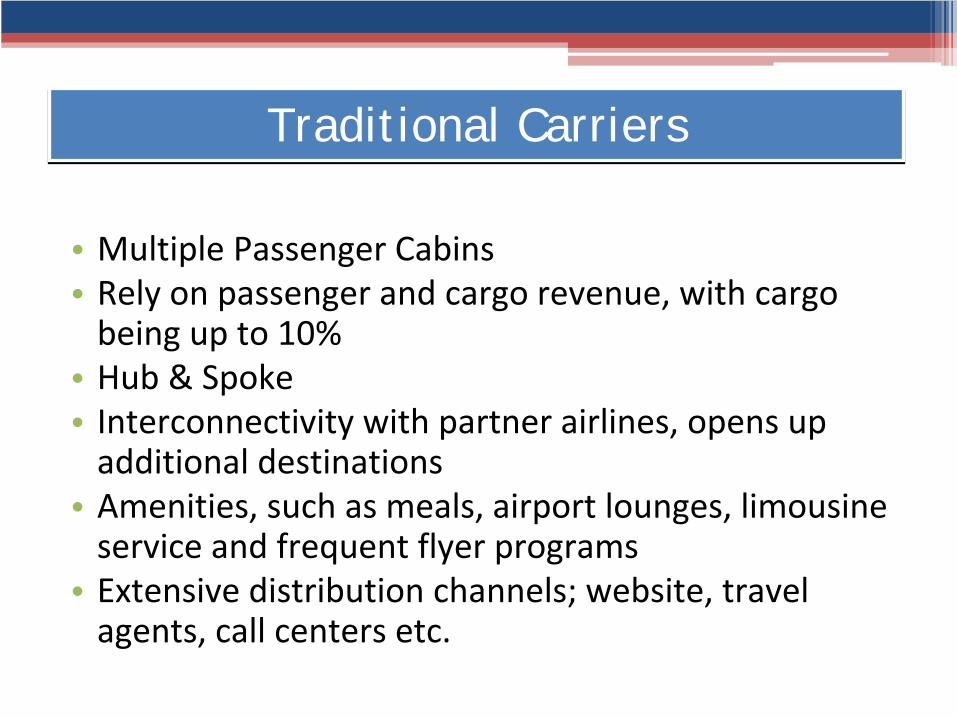
Multiple Passenger Cabins•
Rely on passenger and cargo revenue, with cargo
being up to 10%•
Hub & Spoke
•
Interconnectivity with partner airlines, opens up additional destinations
•
Amenities, such as meals, airport lounges, limousine service and frequent flyer programs
•
Extensive distribution channels; website, travel agents, call centers etc.
Traditional CarriersTraditional Carriers

•
Decades of regulation and complex business models ensure high cost structures, which is sometimes
translated into sustained and recurring losses. For e.g. BA has more than 3.7 Billion USD as deficit in their
pension fund and consequently have to incur significant financial costs
•
Increase in fuel prices and constantly diluting yields are reducing operating margin
•
To counteract this, legacy carriers have undertaken widespread cost cutting measures by eliminating many
of the passenger services, this has lead to the birth of the low cost carrier model
Traditional Carriers : ThreatsTraditional Carriers : Threats

Low Cost Carriers
Comprehensive Evaluation

•
Southwest was the first true LCC in 1971, and to date remains one of the most profitable airlines in history
•
The concept is to eliminate frills, maximize utility of both employees and fixed assets, and improve
revenue through ancillary means•
In 2009, Ryanair’s unit cost was 55% lower than that
of Air France/KLM
Low Cost CarriersLow Cost Carriers

•
LCC charges for services such as checked in baggage, advance seat selection meals and sometimes even
water!•
They operate point to point, and instead of waiting for
connecting passengers and focus on shorter turnaround. Southwest average turnaround is 22 minutes vs 45
minutes for legacy carriers•
LCC rely on ancillary revenue streams generated by 2
unique practices:▫
Dismantling the fare structure and charging for individual flight
products (pre‐assigned seats, meals etc)▫
Cross‐selling third party travel by‐products (hotel booking, car
reservations etc.)
LCC- ExplainedLCC- Explained

21st Century Product
Ancillary Revenue

•
Core Product , Actual Product and Augmented Products
21st Century Product21st Century Product
Core Product Unbundled Product Commission‐
based ancillaries
Safety Mobile Phones Car Rental
Schedule Seat Assignment Hotels
Reliability Food & Drinks Cruises
Seat Exit Golf
Internet Travel Insurance
Baggage Fee Tourists Attraction
Express Check‐in Airport Car Parking

Ancillary Revenue of top 5 airlinesAncillary Revenue of top 5 airlines
Within two years it has more the tripled!
2008 (euro millions) 2006 (euro millions)

Case Studies
Ryanair & Emirates

•
Two of the most successful airlines of the 21st century, but for very different reasons
•
Ryanair is the world’s largest airline in terms of traffic
•
Emirates is one the most profitable airline in the world and has been a key factor in ensuring that 34%
of UAE GDP is a result of Aviation related services
Ryanair Vs EmiratesRyanair Vs Emirates

•
Ryanair operates at an average fare of Euro 39 per passenger and carried over 70 million passenger in 2011!
•
They operate point to point mostly within Europe mostly and offer no frills; where most flights are to
secondary airports more inclined to give Ryanair better deals
•
No frills are offered, and even though they have only online sales, the revenue is enhanced for using the
credit card
Ryanair : OverviewRyanair : Overview

Ryanair has more than tripled b/w 2003‐2009
Ryanair : Pax GrowthRyanair : Pax Growth

Ryanair : Top Ancillary Revenue SourcesRyanair : Top Ancillary Revenue Sources
Ryanair ancillary revenue model(millions of Euros)2002 2003 2001 2005 2006 2007
Car Hire 6.59 9.62 12.23 15.71 19.75 26.51
Food 0.39 0.49 0.69 0.81 1.02 1.83
Beverages 0.8 1.03 1.27 1.35 1.75 2.62
Merchandise 0.16 0.17 0.2 0.27 0.36 0.81
Internet Income 4.83 12.16 17.72 24.36 27.3 39.42
Sale of Rail Ticket 0.63 0.94 1.62 2.05 3 3.62
Sales of Bus tickets 0.17 0.25 0.39 0.59 0.78 1.28
Hotel Accommodation 1.72 3.2 5.47 7.4 11.41 19.27
Insurance 0.29 0.58 0.96 3.73 7.3 9.29
Priority Boarding/Online Check‐in 0 0 0 9.93 18.78 53.59
Visa Card Partnership 0 0.11 0.28 0.46 0.76 1.23
Flight Change Fee 2.03 3.49 5.74 6.55 8.81 11.62
Name Change Fee 2.08 4.43 6.51 8.28 11.08 15.95
Credit/Debit card fee 7.07 15.66 31.29 60.43 76.14 93.15
Infant Fee 0 0 1.27 1.87 2.27 3.3
Excess Baggage 2.2 5.37 11.27 13.33 25.31 17.01
Sports/Music Equipment 0.9 2.08 3.09 3.37 5.46 8.63
Total Ancillary Revenue 29.86 59.58 100 160.49 221.28 309.18
Revenue from Ticket Sales 551 732 925 1128 1433 1875
Ancillary Revenue as a percent of Total Revenue 5.40% 8.10% 10.80% 14.20% 15.40% 16.50%

Ryanair : Ancillary Revenue SourcesRyanair : Ancillary Revenue Sources

Ryanair
: In-flight AdvertisingRyanair
: In-flight Advertising
•
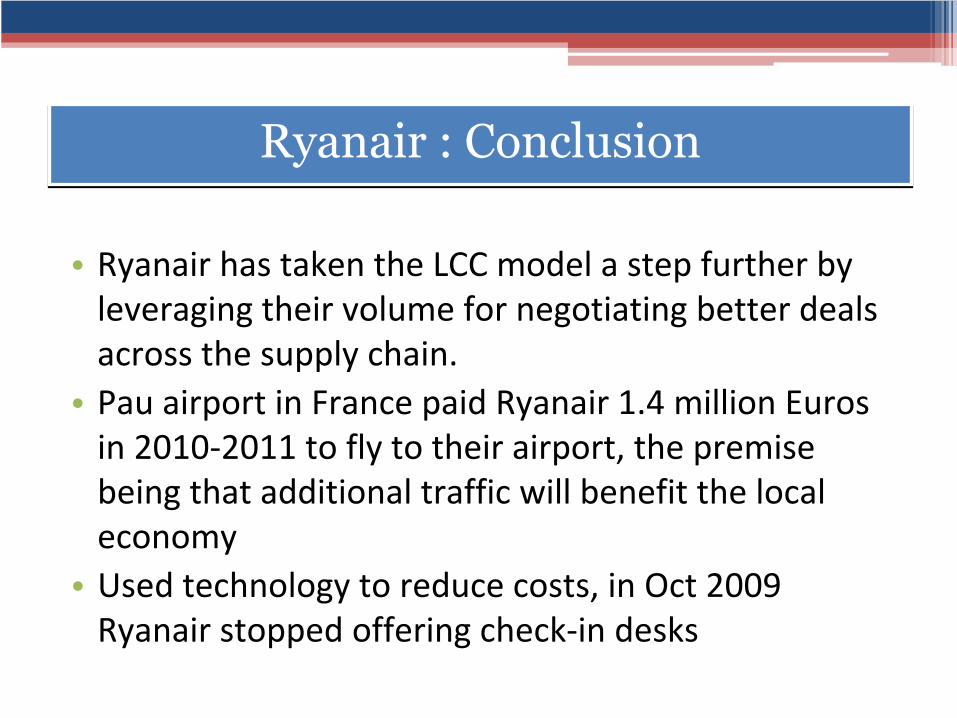
Ryanair
has taken the LCC model a step further by leveraging their volume for negotiating better deals
across the supply chain. •
Pau
airport in France paid Ryanair
1.4 million Euros
in 2010‐2011 to fly to their airport, the premise being that additional traffic will benefit the local economy
•
Used technology to reduce costs, in Oct 2009 Ryanair
stopped offering check‐in desks
Ryanair
: ConclusionRyanair
: Conclusion

•
Some methods of Ryanair
can be viewed as extreme however it is all part of their single minded
determination of reducing costs. For e.g.▫
Ryanair
is not in compliance with EU law for handling
customer complaint. The only way to complain is through fax, or premium calling numbers!
▫
In 2008 Ryanair
came under scrutiny for pressurizing their pilots to reduce the amount of discretionary
reserve fuel uplifted to optimize performance
Ryanair
: ConclusionRyanair
: Conclusion

•
Ryanair
is dynamic, constantly evolving and pushing the boundaries of their operating environment. They have been known to pull out of airports simply
because of either their subsidies withdrawn or increased Airport tariffs.
•
However this single minded determination for ever reducing costs has significantly contributed in the
growth of traffic
Ryanair : ConclusionRyanair : Conclusion
Case Study
Emirates

•
Emirates was started in 1985 with leased aircraft from PIA
•
25 years later it’s the most profitable airline in the world, with a net profit of USD 963 million in
2009/2010•
This has allowed Dubai to shift away from oil
revenue as the single biggest contributor to GDP; today 34% of Dubai GDP is linked to travel and
tourism
Emirates : OverviewEmirates : Overview

•
Dubai is the ideal gateway b/w Europe and Asia, with an estimated 4.5 billion people living within an eight hour
flying radius (Similar to Karachi)•
To effectively target the various market Emirates has
placed on order more than 217 wide body a/c roughly equal to the current fleet size of Cathay Pacific and Iberia
combined!•
Emirates success can be attributed to 3 significant
factors:▫
Effective use of Hub and Spoke;
▫
Cost Conscious▫
Heavy expenditure on branding
Emirates : OverviewEmirates : Overview

•
Traditional legacy carriers succumb to the hub and spoke model and therefore do not have excellent
penetration in non‐regional markets•
Emirates has a very widespread geographical
dispersion and this insulates it from recession in any individual market
•
It is operating in 115 destinations in 6 continents, collects its passengers in Dubai and then
redistributes them across its network
Emirates : Hub & SpokeEmirates : Hub & Spoke

Airlines’
Revenue Share Across RegionsAirlines’
Revenue Share Across Regions
Europe The AmericasAfrica and
Middle EastIndian
subcontinentAsia Pacific
and Australia
British Airways
63.7% 19.3% 9.4% Included in Africa & Middle East
7.6%
Lufthansa 47.2% 26% 6.7% Included in Asia Pacific
20.1%
Air France – KLM
68.6% 15.5% 5.7% Included in Asia Pacific
10.1%
Emirates 35.9% Included in Europe
25.4% 8.9% 29.8%
Singapore Airlines
17.3% 8.3% Included in Indian sub7.8% 66.6%

•
Dubai airport has already increased its capacity from 43 million to 70 million, and has initiated work on a
second airport that will be capable of handling 160million passengers annually!
•
It is optimally utilizing its 6th
freedom rights to connect Europe to Africa and Asia
Emirates : Hub & SpokeEmirates : Hub & Spoke

2000 2005 2010
India 25 78 184
UK 35 78 98
Australia 7 63 97
Germany 14 35 49
China 8 16 49
Thailand 14 24 42
Pakistan 32 36 37
South Africa 7 14 35
Qatar 18 28 35
US 0 7 35
Italy 6 7 34
Singapore 22 36 32
New Zealand 0 28 28
Kuwait 10 11 28
Saudi Arabia 9 15 23
Sri Lanka 15 22 22
Bahrain 14 14 21
France 3 7 21
Emirates weekly departures from each country in 2000, 2005 and 2010Emirates weekly departures from each country in 2000, 2005 and 2010

•
Where Emirates has not initiated some of the more drastic measures seen by LCC they have been very cost
conscious•
Younger fleet (average 5.5 years vs. 11.4 for BA) allows it
to save on fuel and maintenance costs•
Maintenance costs for Emirates are only 1.5% of their
overall expenditure vs. 7.5% for BA•
Emirates is able to source cheap labor from neighboring
Pakistan, India, Sri Lanka, Nepal•
Lack of labor laws ensures that this cost of Emirates do
not rise rapidly
Emirates :Cost ConsciousEmirates :Cost Conscious

Emirates :Cost ConsciousEmirates :Cost ConsciousEmirates cost comparison against British Airways and Singapore Airlines ( Eurocents),
year ending March,2008
Emirates British Airways Singapore Airlines Emirates v British
Airways(%)
Emirates vs
Singapore
Airlines (%)
Fuel/ATK 8.12 11.4 9.71 ‐29 ‐16Labor/ATK 4.36 12.01 5.89 ‐64 ‐26
Landing &
Navigation/ATK 1.45 2.93 1.28 ‐51 13
Handling 1.69 5.42 1.13 ‐69 50Aircraft
Maintenance/ATK 0.5 2.5 0.83 ‐80 ‐40
Depreciation &
Amortization/ATK 1.34 3.84 2.96 ‐65 ‐55
Distribution &
Sales/ATK 2.8 1.99 1.34 41 109
Operating Leases/ATK 2.83 0.38 0.74 645 282
Total Cost/ATK 26.56 43.69 26.75 ‐39 ‐0.7
Total Revenue/ATK 28.78 48.55 30.86 ‐41 ‐6.7

•
Where most airlines have had to cut back on advertising due to stifling losses, Emirates has made
significant investments in landmark events. •
In addition UAE has made sig. efforts to brand
related products such as the Dubai Duty free•
Dubai duty free sales were in excess of 1.1 billion
USD last year (more than 7% of global duty free sales – largest duty free sales in the world
Emirates : BrandingEmirates : Branding

Emirates : BrandingEmirates : Branding
Sponsorship Activities of EmiratesFootball Rugby Golf Cricket Horse Racing
FIFA 2006,2012 and 2014 World Cup
World Cup 2011Dubai Desert
ClassocICC Umpires
National Thoroughbred Racing Association
Arsenal FC and Emirates Stadium , UK
IRB Referees and Match officials
Dubai Ladies Masters
Cricket Australia
Dubai World Cup
AC Milan, Italy Dubai Rugby SevensMalaysian
OpenLord's
TavernersMelbourne Cup ,
Australia
The Emirates CupSouth African Rugby
SevensHong Kong
OpenPro Arch
TournamentSingapore Derby
Paris Saint Germaine London Sevens BMW Open Australian Jockey Club
Hamburg SV Edinburgh SevensAustralian
Open
Olympiacos
CFP , Greece World Cup SevensVolvo Masters
of AsiaAsia Football
Confederation(AFC)Emirates Westerns
Hero Honda Open
•
FAA predicts air travel to double over the next 2 decades•
Air Transport has a bright future in 21st
century however
being a dynamic industry it is likely to evolve and may not be in the same shape as we see today
•
The Ryan Air model is likely to further evolve and we will see different segments of the value chain being targeted
•
The Emirates model focuses on incremental improvement and the fact that a legacy carrier whose
operations are spread in 6 continents made a profit nearing USD 1 Billion amidst a global recession shows
that this industry will flourish in the foreseeable future
ConclusionConclusion
•
The benefits of rapid growth of air transport to the economy are too significant to be ignored
•
The evolving Air Transport industry has forced innovations in other related markets. The entire fuselage of the 787
Dreamliner
is made from composite material thereby allowing for much lower fuel burn. The A320 NEO family has
introduced a revolutionary engine with 20% lower fuel burn•
Moving to Pakistan, we have seen passenger numbers grow
whenever capacity has been added. One of the highest passenger numbers were observed in 1996 when maximum
passenger carriers were operating. Similar phenomenon has been seen since the advent of Bhoja
Air!
Conclusion (continue…)
Conclusion (continue…)

Air Transport in 21st
Century
Thank You For Being Part Of This Event