Air Toxics Hot Spots Program - California Air Resources · PDF fileAir Toxics Hot Spots...
46
Air Toxics Hot Spots Program Inhalation Cancer Unit Risk Factor for Perchloroethylene (PCE; Tetrachloroethylene) Office of Environmental Health Hazard Assessment (OEHHA) Scientific Review Panel Presentation June 24, 2016 Ken Kloc, Staff Toxicologist
Transcript of Air Toxics Hot Spots Program - California Air Resources · PDF fileAir Toxics Hot Spots...
Air Toxics Hot Spots Program
Inhalation Cancer Unit Risk Factor
for Perchloroethylene
(PCE; Tetrachloroethylene)
Office of Environmental Health Hazard
Assessment (OEHHA)
Scientific Review Panel Presentation
June 24, 2016
Ken Kloc, Staff Toxicologist

PCE Cancer Unit Risk Factor Update
Update based on new scientific
information
OEHHA (2009) Methodology:
Air Toxics Hot Spots Program Risk
Assessment Guidelines: Part II, Technical
Support Document for Cancer Potency
Factors; “Cancer TSD”
Added to appendix B of the Cancer TSD
2

PCE Cancer Unit Risk Factor Update
3
Risk Assessment Process
Hazard Identification
Dose-Response Analysis*
Exposure Assessment
Risk Characterization
* Scope of Unit Risk Factor Update document

Perchloroethylene (PCE)
Chemical intermediate, solvent, & cleaning agent
Volatile: vapor pressure = 18.47 mm Hg @ 25oC
2010 Air Emissions in California estimated by Air
Resources Board at 3,832 tons per year
4

Previous OEHHA Evaluation
Listed as a Toxic Air Contaminant (TAC)
in 1991
OEHHA cancer potency analysis in 1992
National Toxicology Program (NTP) 1986
inhalation study (mouse liver tumors)
Simple pharmacokinetic model used to
estimate metabolized doses
1992 URF = 5.9 x 10⁻⁶ (µg/m3)-1
5

Epidemiology
Numerous studies, but none suitable for
quantitative assessment
Epidemiologic studies suggest that PCE
exposure increases three types of cancer in
humans:
Bladder cancer
Non-Hodgkin’s lymphoma
Multiple myeloma
6

PCE Metabolism: Oxidation
7

PCE Metabolism: GSH Conjugation
DP: Dipeptidase
FMO3: Flavin mono-oxygenase 3
N-AcTCVC: N-Acetyl trichlorovinyl cysteine
NAT: N-Acetyl transferase
GGT: γ-Glutamyl transferase
GST: Glutathione-S-transferase
R: Acyl group or hydrogen
SG: Glutathione
TCVG: Trichlorovinyl glutathione
TCVC: Trichlorovinyl cysteine 8

Reactive and Genotoxic or
Tumorigenic Metabolites
Oxidative Pathway GSH Conjugation Pathway
PCE epoxide Dichlorothioketene
Trichloroacetyl chloride Dichloroacetic acid
Oxalyl chloride α,β-Unsaturated sulfoxides
of TCVC and N-AcTCVC
Trichloroacetic acid
9
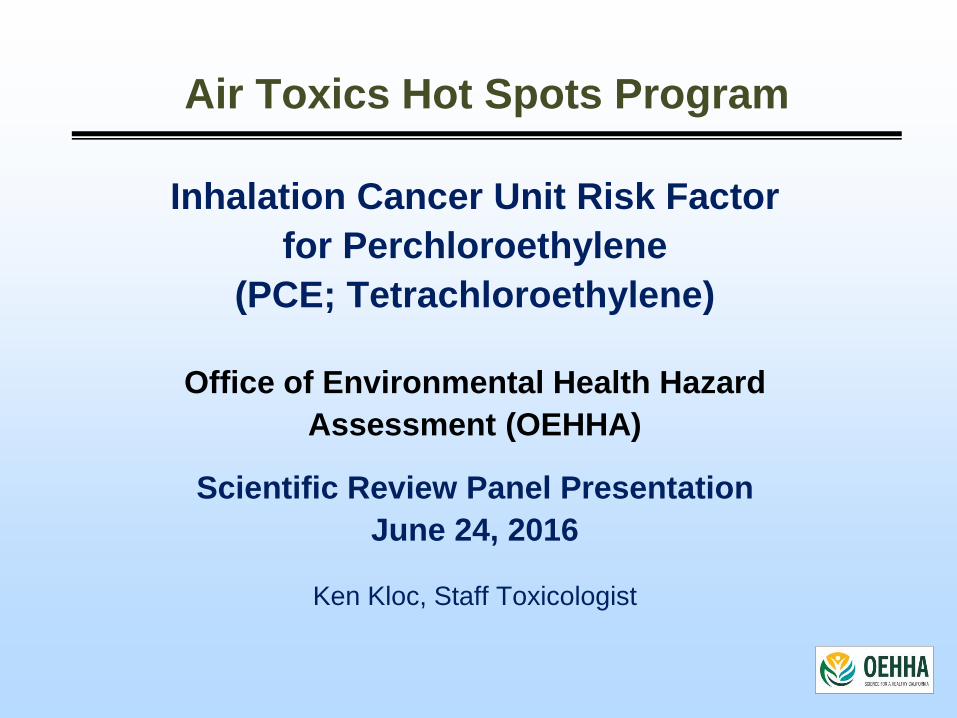
New Studies Used in Update
Japan Industrial Safety & Health Association
study (JISHA, 1993):
Lifetime inhalation exposure to mice and rats
Similar to NTP (1986) in procedures and
reporting
Used additional low-dose groups
Japanese F344 rats have a lower background
rate of mononuclear cell leukemia (MCL)
10

New Studies Used in Update
Chiu and Ginsberg PBPK model (2011):
Used Bayesian Markov Chain Monte Carlo
(MCMC) method
Most likely values (posterior modes) for key
metabolic parameters
Calibrated / evaluated using wide range of data
from rodent and human studies
Included a separate GSH-conjugation pathway
Incorporated trichloroacetic acid toxicokinetics
11

Chiu and Ginsberg PBPK Model
(From: Chiu and Ginsberg, 2011) 12

Bayesian Analysis with PBPK Model
13
Statistical method to determine the most probable
values for important PBPK parameters (rate
constants)
Calibration using in vivo data on PCE & metabolites
Several routes of exposure and elimination (e.g.,
inhalation, oral, intra-venous, exhalation, urinary, etc.)
Most likely values then used in PBPK model to
predict internal doses (“traditional” PBPK)
Can use Bayesian results to estimate inhalation-
only doses

Inhalation-Only Extract of the Chiu and Ginsberg
(2011) Model
Same blood/air flow
compartments as Chiu and
Ginsberg
Includes wash-in / wash-out
Oxidation: liver, kidney, lung
GSH conjugation: liver, kidney
Uses posterior modes and other
parameters from Chiu and
Ginsberg
Reproduces Chiu and Ginsberg
inhalation results
14
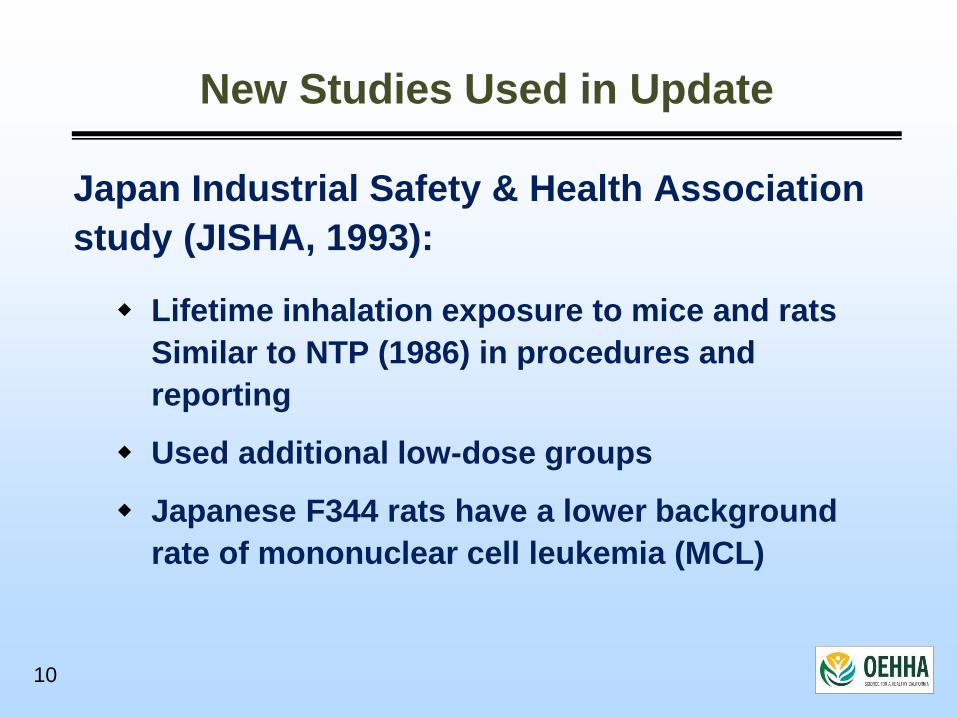
PCE Internal Dose Metrics
Chiu and Ginsberg (2011) PBPK Model Results Inhalation Dose (posterior mode estimates)
Dose metric Exposure Concentration (ppm)
Prediction
Range (at 1 ppm) 0.01 1 10 100
PCE AUC Blood (mg-hr)/(L-d) per ppm (a)
Mouse 2.1 2.2 2.4 2.6 2.2-2.4
Rat 2.25 2.25 2.25 2.25 2.25-2.27
Human 2.0 2.0 2.0 2.0 2.0-2.4
PCE Oxidation Percent of intake that is oxidized (a)
Mouse 18.8 17.4 11.8 7.3 11.5-17.9
Rat 4.2 4.2 4.1 3.3 3.9-4.2
Human 0.98 0.98 0.98 0.98 0.69-1.0
PCE Conjugation Percent of intake that is conjugated (a)
Mouse 0.015 0.016 0.021 0.025 0.0068-0.43
Rat 0.31 0.31 0.31 0.32 0.20-0.50
Human 9.4 9.4 9.4 9.4 0.003-10.0 (bimodal)(b)
(a) Values are also obtained using OEHHA’s model extract at the presented significance level. Data from Chiu and Ginsberg (2011), Tables S-6 through S-8. (b) Values are presented for higher probability, upper mode.
15

NTP 1986 Dose-Response Data
Mice (B6C3F1)
Tumor Type Sex Adjusted Rates(a)(b)
0 100 200
Hepatocellular adenoma or carcinoma M 17/49** 31/47** 41/50**
F 4/44** 17/42** 38/47**
Rats (F344/N)
Tumor Type Sex Adjusted Rates(a)(b)
0 200 400
Mononuclear cell leukemia (MCL) M 28/50* 37/48* 37/50*
F 18/49* 30/50* 29/50*
Renal tubule adenoma or carcinoma M 1/47(c) 3/42 4/40
Brain glioma M 1/44(c) 0/37 4/35
Testicular interstitial cell M 35/49(c) 39/46 41/50
(a) Tumor-incidence denominator adjusted by excluding animals dying before the first corresponding tumor type observed in each study.
(b) Statistical test indicators: (*) P-value < 0.05; (**) P-value < 0.005. Fischer exact test results are as reported by NTP. The control group column indicates the results of trend tests. Both the Cochran-Armitage trend test (reported by NTP) and the exact trend test calculated by OEHHA gave the same indications of significance.
(c) Although testicular tumors and brain glioma did not appear to be significantly increased by the Fischer exact and trend tests, life table tests conducted by NTP did show a significant increase with trends of <0.001, and 0.039 respectively. The life table trend test for kidney was nearly significant at 0.054.
16

JISHA 1993 Dose-Response Data
Mice (Crj:BDFr)
Tumor Type Sex Adjusted Rates(a)(b)
0 10 50 250
Hepatocellular adenoma or carcinoma M 13/46** 21/47 19/47 40/49**
F 3/44** 3/41 7/40 33/46**
Hemangioma or hemangiosarcoma (All site) M 4/46* 2/47 7/47 9/49*
Harderian gland adenoma M 2/41** 2/45 2/37 8/39
Rats (F344/DuCrj)
Tumor Type Sex Adjusted Rates(a)(b)
0 50 200 600
Mononuclear cell leukemia (MCL) M 11/50** 14/48 22/50 27/49*
F 10/50(c) 17/50 16/50 19/50
(a) Tumor-incidence denominator adjusted by excluding animals dying before the first corresponding tumor type observed in each study.
(b) Statistical test indicators: (*) P-value < 0.05; (**) P-value < 0.005. Fischer exact test results are as reported by JISHA, except that mouse, all-site hemangioma/hemangiosarcoma values were calculated by OEHHA. The control group column indicates the results of trend tests. Both the Cochran-Armitage trend test (reported by JISHA) and the exact trend test calculated by OEHHA gave the same indications of significance.
(c) A significant trend was found in a life-table test reported by JISHA, P-value = 0.049.
17
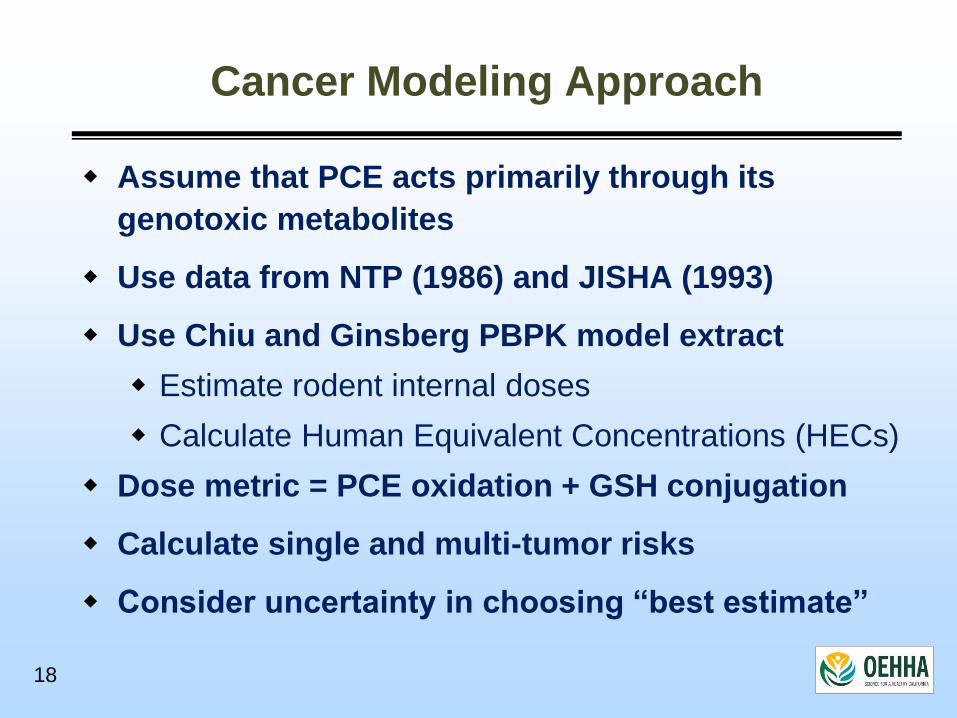
Cancer Modeling Approach
Assume that PCE acts primarily through its
genotoxic metabolites
Use data from NTP (1986) and JISHA (1993)
Use Chiu and Ginsberg PBPK model extract
Estimate rodent internal doses
Calculate Human Equivalent Concentrations (HECs)
Dose metric = PCE oxidation + GSH conjugation
Calculate single and multi-tumor risks
Consider uncertainty in choosing “best estimate”
18

Dose-Response Analysis
US EPA Benchmark Dose Software (BMDS)
Multi-stage cancer model; low-dose linearity
Benchmark risk (BMR) = 5 percent
BMDL: lower 95%-ile of benchmark dose
Use BMDS multi-tumor summation
Cross-species adjustment of BMDL based on
¾-power body-weight scaling
19

Study Sex Tumor Type
BW-Scaled BMDL
(mg/kg-day)
HEC based on
PBPK Model (ppm)
Unit Risk Factor (URF)
per ug/m3
Results from Mouse Studies
JISHA
M
Hepatocellular adenoma or carcinoma
0.350 2.14 3.5E-06
Harderian gland 1.997 12.20 6.0E-07
Hemangioma or Hemangiosarcoma
2.100 12.83 5.7E-07
Combined site 0.300 1.83 4.0E-06
F Hepatocellular adenoma or carcinoma
0.574 3.51 2.1E-06
NTP M
Hepatocellular adenoma or carcinoma
0.272 1.66 4.4E-06
F Hepatocellular adenoma or carcinoma
0.432 2.64 2.8E-06
Results from Rat Studies
JISHA M Mononuclear cell leukemia 0.251 1.53 4.8E-06
F Mononuclear cell leukemia 0.472 2.88 2.6E-06
NTP M
Mononuclear cell leukemia 0.144 0.88 8.4E-06
Testicular interstitial cell 0.136 0.83 8.9E-06
Renal adenoma or carcinoma 0.913 5.57 1.3E-06
Brain glioma 1.426 8.71 8.5E-07
Combined site 0.078 0.47 1.6E-05
F Mononuclear cell leukemia 0.188 1.15 6.4E-06
Multi-Stage Cancer Model Results
20

Multi-Stage Cancer Model Results
Combined-site male mouse risk mainly due to liver tumors
Male Mouse (JISHA) URF
Hepatocellular adenoma or carcinoma 3.5E-06
Harderian gland 6.0E-07
Hemangioma or hemangiosarcoma 5.7E-07
Combined site 4.0E-06
Highest URF: Combined-site risk in male rats in NTP study
(Mostly due to MCL and testicular tumor risks)
Male Rat (NTP) URF
Mononuclear cell leukemia 8.4E-06
Testicular interstitial cell 8.9E-06
Renal adenoma or carcinoma 1.3E-06
Brain glioma 8.5E-07
Combined site 1.6E-05
21

Study Sex Unit Risk Factor (URF)
per ug/m3
Mouse: Hepatocellular adenoma or carcinoma
JISHA M 3.5E-06
NTP M 4.4E-06
JISHA F 2.1E-06
NTP F 2.8E-06
Rat: Mononuclear cell leukemia (MCL)
JISHA M 4.8E-06
NTP M 8.4E-06
JISHA F 2.6E-06
NTP F 6.4E-06
Multi-Stage Cancer Model Results
JISHA – NTP Comparison
22

Considerations in Choosing the URF
Mouse liver tumors and rat MCL
Qualitative and quantitative agreement in the
primary studies
Mouse liver tumors also found in the NCI (1977)
oral study
Judged to be more certain
Other rat tumors in NTP study
Important to consider but less certain
Testicular tumors: high background rate
(control group = 71%)
23

Considerations in Choosing the URF
Male rodents more sensitive than females
URFs clustered in a narrow range: 4.0 x 10⁻⁶
to 1.6 x 10⁻⁵ (µg/m3)-1
Use geometric mean of the male mouse and rat
URFs from both studies
24

Proposed Perchloroethylene Cancer Unit
Risk Factor and Potency Factor
Species Study URF
Male Mouse JISHA (Multiple site) 4.02E-06
NTP (Liver) 4.44E-06
Male Rat JISHA (MCL) 4.81E-06
NTP (Multiple site) 1.57E-05
Geometric Mean 6.06E-06
Therefore: URF = 6.1 x 10⁻⁶ (µg/m3)-1
(when rounded to two significant figures)
Cancer potency factor = 2.1 x 10⁻² (mg/kg-day)-1
(assumes a 70 kg person breathing 20 m3/day of air)
25

Proposed Perchloroethylene Cancer Unit
Risk Factor and Potency Factor

Response to Public Comments
Public comment was received from:
Center for Public Environmental Oversight (CPEO)
U.S. Department of Defense (DoD)
California Chamber of Commerce (CalChamber)
Halogenated Solvents Industry Alliance (HSIA)
Total of 44 individual and compound
comments and were addressed in OEHHA’s
written response
26

Response to Public Comments
Several criticisms were shared by the
commenters
For presentation, the major issues and
OEHHA responses were grouped:
1. Not following US EPA methods
2. PBPK inhalation model
3. Use of the NTP study data
4. Use of rat MCL data
27
Response to Public Comments
Major issues, continued:
5. Use of total metabolized dose
6. Use of multiple tumor types
7. Use of geometric mean for final URF
8. Need for more uncertainty analysis
28

Response to Public Comments
Issue #1: Did not follow US EPA guidelines; should
adopt US EPA (2012) PCE potency value
Response: OEHHA has independent responsibility
under California law to develop cancer potency values
for protecting the health of Californians. Our PCE
potency update is based on our 2009 Cancer TSD
methodology. The Cancer TSD was reviewed and
approved by the Scientific Review Panel on Toxic Air
Contaminants.
29

Response to Public Comments
Issue #1, Continued:
OEHHA agrees with some of US EPA's methods, Thus
portions of the Cancer TSD are consistent with US EPA
guidance. However, OEHHA's methodology is not
exactly the same as US EPA's, and where it differs, it
tends to be more health-protective.
OEHHA used the currently available scientific
information on PCE, and developed a potency estimate
that is consistent with our guidelines, considered
uncertainties in the data, and is health-protective.
30

Issue #2: PBPK model not validated; unclear that it
reproduces Chiu and Ginsberg model results
Response: OEHHA's model extract uses the relevant
inhalation equations and modeling parameter values
from Chiu and Ginsberg (2011), including the posterior
modes for key model parameters, determined via the
MCMC simulation. Chiu and Ginsberg's equations, input
parameters, and model results were peer-reviewed and
validated. Our use of the inhalation-only components of
the Chiu and Ginsberg model is not a reanalysis of the
data.
Response to Public Comments
31

Response to Public Comments
Issue #2, Continued:
Table 1 of the draft presents dose-metric estimates that
were reported by Chiu and Ginsberg (2011) and were
also obtained by OEHHA using its inhalation-only model,
at the level of significance presented in the table. Based
on the concordance of the estimates, the inhalation-only
model adequately reproduces the original model results.
32

Response to Public Comments
Issue #3: OEHHA should not use the NTP (1986) data
Response: Different strains and substrains of rats and
mice used in carcinogenicity testing programs display
genetic and phenotypic variation as a result of
mechanisms such as genetic drift.
The two rodent cancer studies (JISHA & NTP) showed
variability with respect to types of tumor elevated, and
strength of the dose-response relationships. It is
unknown whether the differences are due to genetic
variation, but this observation suggests that data from
each study provides non-redundant information for the
analysis.
33

Response to Public Comments
Issue #4: Should justify / not use Rat MCL data:
Not a relevant tumor type in humans, F344 rats have a
high background rate
Response: OEHHA does not require tumor concordance
between rodents and humans to use rodent data in dose-
response analysis, per our 2009 Cancer TSD.
The draft discussed evidence that rat MCL corresponds
to at least one form of human leukemia: Large Granular
Lyphocyte Leukemia. It may arise from a lymphocyte or
monocyte lineage; the cell of origin appears to reside or
undergo transformation in the spleen.
34

Response to Public Comments
Issue #4 Continued:
US EPA and NRC also noted (during the 2010 peer
review of the US EPA’s PCE analysis):
“discounting a rodent neoplasm simply because it has
no human counterpart is not a scientifically defensible
position. Strict site concordance is not a requirement
for relevance in extrapolation of hazard potential.”
The JISHA (1993) study had a relatively low control
group rate for MCL (20-22%). This was at the high end of
historical laboratory background (6-22%) for the rat
substrain, so a false positive result is unlikely.
35

Response to Public Comments
Issue #5: Justify chosen dose metric; Should not
use GSH conjugation because of large uncertainty
Response: The precise mechanisms by which PCE
causes increased tumor formation are unknown.
However, oxidation and conjugation of PCE in rodents
and humans produce several potentially genotoxic
and/or tumorigenic metabolites. Some of these are
stable enough to circulate widely throughout the
organism. Also, PCE metabolism showed saturation
effects in the rodent studies. Thus, the metabolized dose
is a reasonable choice for the dose metric.
36

Response to Public Comments
Issue #5 Continued:
Dose metrics used by US EPA (oxidation pathway in
liver and PCE AUC for other tissues) avoid use of the
GSH-conjugation pathway but may be less accurate and
are less health-protective than using total metabolism.
The PBPK results for GSH conjugation could be due to
biological variation within the population (as opposed to
modeling uncertainty). Some humans are devoid of one
or more GST isoforms, which may contribute to a large
range of PCE-conjugation levels. Also, there is some
evidence that long-term PCE exposure may induce GST
metabolism.
37

Response to Public Comments
Issue #5 Continued:
There is still substantial uncertainty regarding the
formation of reactive α,β-unsaturated sulfoxides in the
GSH-conjugation pathway, which may be more
important in humans than in rodents.
Including the GST-pathway in the total dose-metric, vs.
using an oxidation-only dose increases the PCE cancer
potency factor approximately 11-fold.
Population variability and toxicokinetic uncertainty is
properly addressed by making appropriate health-
protective assumptions in the cancer potency
assessment.
38

Response to Public Comments
Issue #5 Continued:
OEHHA has included additional discussion in the
document on the uncertainty/variation in the human
PBPK model, and on the choice of a total metabolism
dose-metric over other alternatives.
39

Response to Public Comments
Issue #6: Should not use tumor types other than liver
tumors in mice
Response: The use of data from multiple tumors in the
mouse and rat is based on the 2009 Cancer TSD:
“...for chemicals that induce tumors at multiple sites,
the single-site approach may underestimate the true
carcinogenic potential. For example, the overall
assessment of cancer risk from cigarette smoking […]
is estimated from all the sites at which agent induced
tumors are observed (lung, bladder, leukemia, etc),
combined.”
40

Response to Public Comments
Issue #6 Continued:
In addition, the draft includes sections justifying the use
of rat MCL and renal tumors (α2u-globulin discussion).
OEHHA does not require interspecies tumor
concordance and generally uses all tumor types that
appear to be statistically elevated in the exposed groups.
41

Response to Public Comments
Issue #7: Should justify / not use the geometric mean
of multiple potency estimates; instead choose a
value from a single tumor type
Response: The cancer TSD suggests, as a default
option, identifying a single study that represents the best
estimate of potency, but does not prohibit using
alternative methods (e.g. geometric mean) for deriving
potency factors.
42

Response to Public Comments
Issue #7 Continued:
Both the JISHA (1993) and the NTP (1986) studies
provided acceptable and non-redundant dose-response
information suitable for a quantitative estimate of cancer
potency. Because some of the higher potency estimates
are more uncertain, OEHHA chose a mid-range potency
from the available values (i.e., the geometric mean) as a
best estimate for PCE's cancer potency, a value that the
Office also judged to be adequate to protect public
health.
43

Response to Public Comments
Issue #8: No uncertainty analysis in document; need a
comprehensive uncertainty analysis
Response: OEHHA discussed various uncertainties in the
first draft and we have added to this in the revised
document, covering several of the more important aspects
effecting the potency factor derivation.
Chiu and Ginsberg (2011) provided a detailed quantitative
uncertainty analysis for their PBPK model. US EPA
explored the range of PCE potency estimates obtained
using various dose metrics. OEHHA considered and
referenced all of this information in deriving the PCE
potency update.
44

Response to Public Comments
Issue #8 Continued:
It is neither necessary nor desirable to carry out a
comprehensive uncertainty analysis. The National
Academy of Sciences (Science and Decisions, Advancing
Risk Assessment, 2009) states that:
“If an uncertainty analysis will not substantially
influence outcomes of importance to the decision
maker, resources should not be expended on a
detailed uncertainty analysis...”
45