Air-Steam Hybrid Engine: An Alternative to Internal … Hybrid Engine: ... Air-Steam Hybrid Engine:...
49
Air-Steam Hybrid Engine: An Alternative to Internal Combustion MARCH 2011 FTA Report No. 0013 Federal Transit Administration PREPARED BY Dr. Robert Knight, President Michael J. Brookman Bevilacqua-Knight, Inc Oakland, CA
Transcript of Air-Steam Hybrid Engine: An Alternative to Internal … Hybrid Engine: ... Air-Steam Hybrid Engine:...
Air-Steam Hybrid EngineAn Alternative to Internal Combustion
MARCH 2011
FTA Report No 0013 Federal Transit Administration
PREPARED BY
Dr Robert Knight President Michael J Brookman
Bevilacqua-Knight Inc Oakland CA
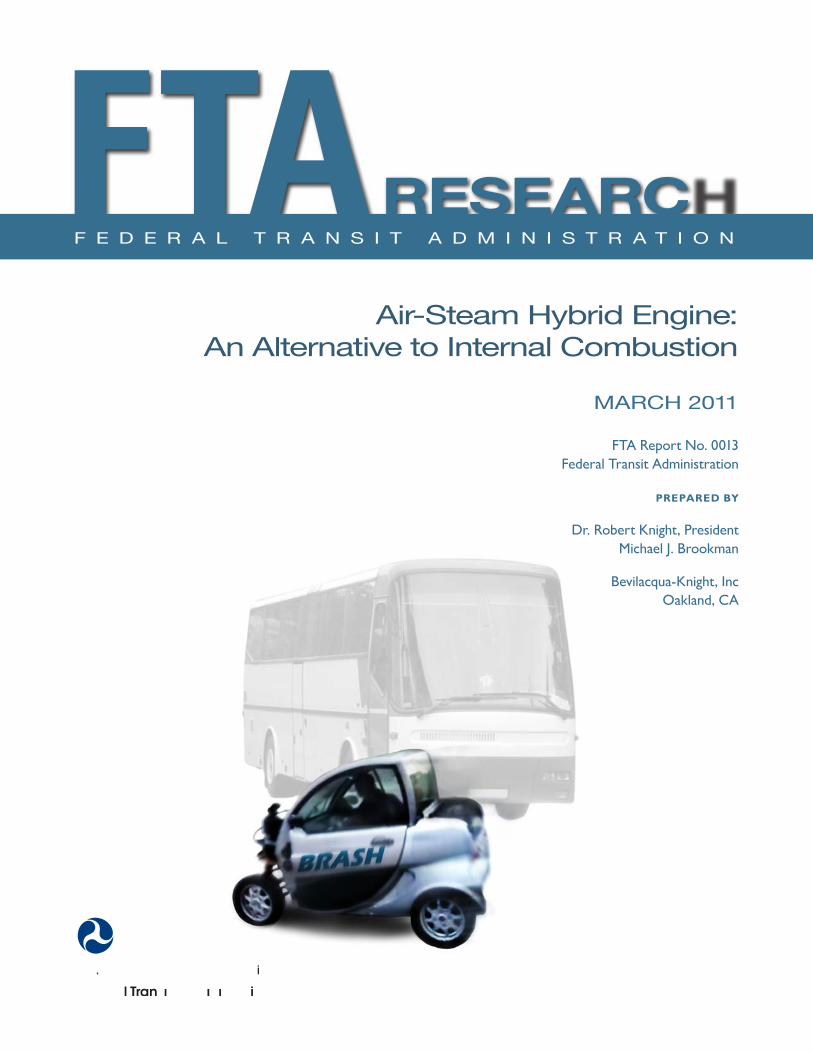
COVER PHOTO Courtesy of BRASH
DISCLAIMER This document is intended as a technical assistance product It is disseminated under the sponsorship of the US Department of Transportation in the interest of information exchange The United States Government assumes no liability for its contents or use thereof The United States Government does not endorse products of manufacturers Trade or manufacturersrsquo names appear herein solely because they are considered essential to the objective of this report
Air-Steam Hybrid EngineAn Alternative to Internal Combustion Cleaner More Efficient Multi-Fuel Compatible Retrofitable
MARCH 2011 FTA Report No 0013
PREPARED BY
Dr Robert Knight President Michael J Brookman Bevilacqua-Knight Inc 1000 Broadway Suite 410 Oakland CA 94607 Phone (510) 444-8707 email rknightbkicom
SPONSORED BY
Federal Transit Administration Office of Research Demonstration and Innovation US Department of Transportation 1200 New Jersey Avenue SE Washington DC 20590
AVAILABLE ONLINE
httpwwwftadotgovresearch
FEDERAL TRANSIT ADMINISTRATION i
Metric Conversion Table
FEDERAL TRANSIT ADMINISTRATION ii
FEDERAL TRANSIT ADMINISTRATION ii
SYMBOL WHEN YOU KNOW MULTIPLY BY TO FIND SYMBOL
LENGTH
in inches 254 millimeters mm
ft feet 0305 meters m
mi miles 161 kilometers km
VOLUME
fl oz fluid ounces 2957 milliliters mL
gal gallons 3785 liters L
ft3 cubic feet 0028 cubic meters m 3
yd3 cubic yards 0765 cubic meters m 3
NOTE volumes greater than 1000 L shall be shown in m3
MASS
oz ounces 2835 grams g
lb pounds 0454 kilograms kg
T short tons (2000 lb) 0907 megagrams
(or metric ton) Mg (or t)
TEMPERATURE (exact degrees)
oF Fahrenheit 5 (F-32)9 or (F-32)18
Celsius oC
Metric Conversion Table
yd yards 0914 meters m
FEDERAL TRANSIT ADMINISTRATION iii
REPORT DOCUMENTATION PAGE Form Approved OMB No 0704-0188
Public reporting burden for this collection of information is estimated to average 1 hour per response including the time for reviewing instrucshytions searching existing data sources gathering and maintaining the data needed and completing and reviewing the collection of information Send comments regarding this burden estimate or any other aspect of this collection of information including suggestions for reducing this burden to Washington Headquarters Services Directorate for Information Operations and Reports 1215 Jefferson Davis Highway Suite 1204 Arlington VA 22202-4302 and to the Office of Management and Budget Paperwork Reduction Project (0704-0188) Washington DC 20503
1 AGENCY USE ONLY 2 REPORT DATE March 2011
3 REPORT TYPE AND DATES COVERED Final Report April to November 2010
4 TITLE AND SUBTITLE Title Air-Steam Hybrid Engine An Alternative to Internal Combustion Subtitle Cleaner More Efficient Multi-Fuel Compatible Retrofitable
5 FUNDING NUMBERS 101-FT1 Proposal No FT1BKIAS DTRT57-10-R-SBIR1
6 AUTHOR(S) Dr Robert Knight President Michael J Brookman Bevilacqua-Knight Inc
7 PERFORMING ORGANIZATION NAME(S) AND ADDRESSE(ES) Bevilacqua-Knight Inc 1000 Broadway Suite 410 Oakland CA 94607
8 PERFORMING ORGANIZATION REPORT NUMBER
FTA Report No 0013
9 SPONSORINGMONITORING AGENCY NAME(S) AND ADDRESS(ES) US Department of Transportation Federal Transit Administration Research Demonstration and Innovation
East Building 1200 New Jersey Avenue SE
Washington DC 20590
10 SPONSORINGMONITORING AGENCY REPORT NUMBER
FTA Report No 0013
11 SUPPLEMENTARY NOTES Sufficient credibility has been achieved from this Phase 1 demonstration and analysis of the air-steam approach to justify additional SBIR support and attract the interest of industrial partners and investors
12A DISTRIBUTIONAVAILABILITY STATEMENT Available From National Technical Information ServiceNTIS 5285 Port Royal Road Springfield VA 22161 phone (703) 605-6000 fax (703) 605-6900 email ordersntisfedworldgov
12B DISTRIBUTION CODE
TRI-20
13 ABSTRACT In this Small Business Innovation Research (SBIR) Phase 1 project an energy-efficient air-steam propulsion system has been developed and patented and key performance attributes have been demonstrated to be superior to those of internal combustion engines A mixed air-steam propellant system can provide immediate power without a boiler and that power can be varied simply by modifying the ratio of water and air in the propellant mix Next steps for this innovation include more detailed performance verification and an analysis of scaling this promising technology to propel buses and trains for mass transit use Successful validation would lead to a vehicle retrofit of a smaller lighter more fuel efficient engine in a standard mid-size or full-size vehicle That engine could operate on a variety of fuels other than refined petroleum These goals are consistent with the DOT SBIR subtopic narrative ldquoEconomical and durable technologies and devices for improving safety for riders and transit agency employees reducing noise and energy consumption or improving the rider experience The innovations must be adaptable to existing bus and rail transit vehicles and systemsrdquo
14 SUBJECT TERMS Air Steam Bio-Fuels Multi-Fuel Retrofit Engine Hybrid External Combustion Bus
15 NUMBER OF PAGES 49
16 PRICE CODE
17 SECURITY CLASSIFICATION OF REPORT
Unclassified
18 SECURITY CLASSIFICATION OF THIS PAGE
Unclassified
19 SECURITY CLASSIFICATION OF ABSTRACT
Unclassified
20 LIMITATION OF ABSTRACT
FEDERAL TRANSIT ADMINISTRATION iii
TABLE OF CONTENTS
1 Executive Summary 3 Section 1 Context for BRASH Societal Challenges and Needs 8 Section 2 Technology Background
13 Section 3 The Air-Steam Hybrid Solution 17 Derivative Uses 19 Section 4 BRASH Test Plan 19 Practical Objectives 20 Analytical Objectives 20 Mechanical Modifications and Test Configuration 22 Electronic Control and Measurement 24 Summary of Effort 25 Summary of RequirementsGoals 25 Summary of Testing 25 Test Conditions 27 Test Assumptions 28 3 Low Speed Test 29 5 Variable High Speed Test 31 Lessons Learned 31 Estimated Fuel Economy 33 Next Development Phase 35 Section 5 Development Plan and Next Steps 37 Section 6 Potential Applications and Societal Value 38 Section 7 Phase I Conclusions 39 Appendix A Heat Transfer Efficiency Modeling Runs 3 and 5 50 and 90 41 Appendix B Acronyms
FEDERAL TRANSIT ADMINISTRATION iv
LIST OF FIGURES
1 Figure 1 Energy Usage in the United States 2 Figure 2 Simplified Model of Air-Steam Hybrid Engine 3 Figure 3 Historic Crude Oil Prices Source Energy Information Administration 4 Figure 4 Projections of World Oil Production 4 Figure 5 Measured Atmospheric CO2
5 Figure 6 Global Warming Projections 6 Figure 7 US Energy Consumption by Fuel (1980ndash2035) 9 Figure 8 Doble Model E 9 Figure 9 Brooks Steam Motors Bus
11 Figure 10 MDI Air Car 11 Figure 11 MDI Air Engine Schematic 13 Figure 12 Does Steam Behave Like an Ideal Gas 14 Figure 13 Heat Required to Raise Air and Water Temperature to 1000degK 14 Figure 14 Schematic of Injector Nozzle Used to Mix Air and Water 15 Figure 15 Air-Steam Hybrid Schematic 17 Figure 16 Fuel Efficiency by Engine Type 19 Figure 17 Smarttrade Car-Size Test Vehicle 21 Figure 18 Quasiturbine Rotary Expander Installed and Interior View 21 Figure 19 Heater Installed (Early Configuration) Insulation to Retain Heat Inner Coil 22 Figure 20 Test Configuration 22 Figure 21 System Components 23 Figure 22 Electronics Schematic for Air-Steam Hybrid 23 Figure 23 Front Screen Display for Air-Steam Hybrid 24 Figure 24 Back Screen Display for Air-Steam Hybrid 25 Figure 25 Vehicle Test Setup 26 Figure 26 Vehicle Cab With Controller Laptop 27 Figure 27 Exhaust Plumes from Expander 27 Figure 28 Hose Failure Due to Overheating 29 Figure 29 Low Speed Test Results in Little Water Vapor 30 Figure 30 Three Images from Run 5 33 Figure 31 MTANew York City Transit Orion VII Next Generation
Hybrid Transit Bus 33 Figure 32 Six-Cylinder Expander Power Generation Load Small 24 VDC Compressor
LIST OF TABLES
28 Table 1 Analysis of Mass Flow Data at Low Speed 30 Table 2 Test 5 Results with Increased Water and Fuel 30 Table 3 Comparison of Mass Flows Runs 3 and 5 32 Table 4 Comparison of Fuel Economies 35 Table 5 Project Funding Summary
FEDERAL TRANSIT ADMINISTRATION v
EXECUTIVE SUMMARY
More than one quarter of all energy consumed in the US is used to support the transportation sector and as shown in Figure 1 nearly all of that transport energy is derived from petroleum1
Why does transportation rely nearly exclusively on petroleum when other sectors rely primarily on other sources of energy A major part of the answer lies in the timed ignition needs of internal combustion engines which require a highly-refined and volatile fuel to provide timely detonation of the fuelair mixture
Figure 1 Energy Usage in
the United States
However the detonation of refined fuels is not a necessary condition to produce useful prime-mover work That work can be extracted from heat alone and that heat can be generated from semi-solid bio-fuels if the work is performed by an external combustion (EC) engine
EC engines have been in use for centuries and still produce 80 percent of electrical capacity in the US2 but EC engines have been disfavored for transportation applications because of startup delay constant ldquotendingrdquo and perceived lower fuel economy The patented BRASH (Binary Recovery Air-Steam Hybrid)
1ldquoPetroleum Basic Statisticsrdquo September 2008 Energy Information Administration US Department of Energy October 14 2008 httpwwweiadoegovbasicsquickoilhtml 2ldquoNet Generation by Energy Source Total (All Sectors)rdquo March 11 2011 US Dept of Energy Energy Information Administration Energy Source Table httpwwweiadoegovcneafelectricityepmtable1_1html
FEDERAL TRANSIT ADMINISTRATION 1
EXECUTIVE SUMMARY
engine technology resolves each of these concerns and presents the first clear alternative to internal combustion in more than 50 years It is projected to produce higher fuel efficiency greater power and lower emissions than a comparable internal combustion (IC) engine It should be particularly well-suited to larger vehicles such as buses The BRASH engine is a binary recovery air-steam hybrid engine The combination of air and water in an EC engine provides immediately available power and should produce much greater fuel economy than a conventional steam or IC engine More significantly the BRASH engine can provide more power with lower emissions from a wider range of fuels than an internal combustion engine A simplified schematic of the BRASH engine is shown in Figure 2 illustrating the following principles
bull Accelerator regulates flow of air water and fuel to heater based on load and wheel speed
bullWater and fuel are metered to maintain heater temperature within optimal performance band
bullOutput demand determines air-water fraction
Figure 2 Simplified Model
of Air-Steam Hybrid Engine
Any fuel that can be metered (liquid solid or gas) can be used and the heat from combustion is used in direct proportion to work done Fuel is consumed in direct proportion to demand Fuel economy with this air-steam system is much higher than steam alone because air requires less heat to move a piston and the systemrsquos superior thermal management will yield practical fuel economy 3ndash4 times that of an internal combustion engine of comparable torque
FEDERAL TRANSIT ADMINISTRATION 2
SECTION Context for BRASH 1 Societal Challengesand Needs
Economic growth in the developed world has been highly dependent on petroleum distillates for nearly a century3 As Figure 3 shows for most of that century the price of oil has remained stable ($10ndash$30 per barrel in 2008 dollars) and relatively low Since the oil embargo of the 1970s and later political instability in large oil-producing regions the price of oil has fluctuated significantly Over the last 40 years each sharp increase in oil prices has been followed by a steep decline in economic activity
Figure 3 Historic Crude
Oil Prices
The long-term trend in oil prices reflects the growing concern that oil quantities are finite while worldwide demand continues to grow4 M King Hubbert first posited in 1956 that US oil production was approaching a maximum rate and past that point when demand exceeded supply prices would rise rapidly to unprecedented levels5 Since Hubbert this model has been extended to worldwide oil reserves and the popular notion of ldquopeak oilrdquo6
Figure 4 shows projections of world oil production beyond 2010 Most models show a decline in supply over the next 20 to 30 years7 This decline in production
3ldquoAnalysis of the Impact of High Oil Prices on the Global Economyrdquo International Energy Agency (IEA) http wwwieaorgtextbasenpsumhigh_oil04sumpdf 4EampP Magazine ldquoGeologists Positive about Future of Oil and Gasrdquo June 10 2009 5Marion King Hubbert ldquoNuclear Energy and the Fossil Fuels Drilling and Production Practicerdquo June 1956 Spring Meeting of the Southern District Division of Production American Petroleum Institute San Antonio Texas Shell Development Company pp 22ndash27 httpwwwhubbertpeakcomhubbert19561956pdf retrieved April 18 2008 6Adam R Brandt ldquoTesting HubbertrdquoEnergy Policy 35(5) May 2007 pp 3074ndash3088 7ldquoMedium-Term Oil Market Reportrdquo July 2007 IEA Public AccessndashOil Market Report httpomrpublicieaorg
FEDERAL TRANSIT ADMINISTRATION 3
SECTION 1 CONTEXT FOR BRASH SOCIETAL CHALLENGES AND NEEDS
would coincide with far greater fuel demand as China India and other parts of the developing world are beginning to embrace the automobile8
Figure 4 Projections
of World Oil Production
The other trend of note related to petroleum usage is the rise of atmospheric CO2 and the growing risk of climate change Figure 5 shows the consistent rise in atmospheric CO2 at the remote Mauna Loa observatory The rise in CO2 levels is attributed to fossil fuel combustion most notably coal-fed power plants and gasoline powered automobiles
Figure 5 Measured
Atmospheric CO2
8Plunkett Research (2008) ldquoAutomobile Industry Introductionrdquo
FEDERAL TRANSIT ADMINISTRATION 4
SECTION 1 CONTEXT FOR BRASH SOCIETAL CHALLENGES AND NEEDS
As shown in Figure 6 the rise in atmospheric CO2 levels correlates with increases in global temperatures As CO2 continues to increase the expectation is further increases in average global temperatures9
Figure 6 Global Warming
Projections
The economic modeling and the environmental modeling point to one conclusion petroleum distillates may be the current source for nearly all of our transportation fuel supplies but its primacy cannot be sustained Whether from a perspective of limited supply and growing demand or the perspective of a growing environmental impact refined petroleum does not provide solutions only difficult and growing problems
Three popular initiativesmdashpetroleum alternatives improved fuel economy and alternative electric vehicle powermdashcannot solve worldrsquos thirst for petroleum distillates
bullPetroleum alternatives like biodiesel or ethanol put fuel in competition for land with our food supply10
bullNoble efforts to increase vehicle fuel economy domestically cannot offset the surging worldwide demand for more vehicles (Figure 7)11
9IPCC ldquoSummary for Policymakersrdquo Climate Change 2007 The Physical Science Basis Contribution of Working Group I to the Fourth Assessment Report of the Intergovernmental Panel on Climate Change Intergovernmental Panel on Climate Change (IPCC)rdquo 2007 httpwwwipccchpdfassessment-reportar4 wg1ar4-wg1-spmpdf retrieved July 3 2009 10The New York Times ldquoFood and Fuel Compete for Landrdquo December 18 2007 httpwwwnytimes com20071218business18foodhtml 11US Information Administration Analysis amp Projections httpwwweiagovoiafforecastinghtml
FEDERAL TRANSIT ADMINISTRATION 5
SECTION 1 CONTEXT FOR BRASH SOCIETAL CHALLENGES AND NEEDS
bullDomestic migration to electric vehicles is constrained by gross vehicle weight and range12 and electric hybrids are still priced at a premium over their non-hybrid versions13
Figure 7 US Energy
Consumption by Fuel
(1980ndash2035)
The goal of lower national fuel consumption is built on the false premise that the transportation sector requires highly-refined fuel Transportation requires highly-refined fuels only if the motive power is derived from timed detonation of a fuel air mixture in the cylinder head In other words the problem is not so much the petroleum itself but rather the virtually universal dependence on internal combustion (IC) engines that require petroleum fuels
If motive power were to come instead from external combustion a far wider array of gas liquid and solid biomassrenewable fuels could be used The goal could shift from ldquomiles per gallonrdquo to ldquoeffective production cost per 100 miles drivenrdquo for a new class of fuels measured by the pound and favored by the rate of production and CO2 absorption during growth
In sum the goal is to reduce the amplitude and slope of the red (ldquoLiquidsrdquo) line in Figure 7 and increase the same parameters of the green (ldquoNonhydro renewablesrdquo) line significantly By migrating to EC vehicles more of the green renewables line can be used in the transportation sector
The driving force behind the world economy is energy It is axiomatic that lower fuel production costs and consumption equals higher economic productivity The solution for the transportation sector is to migrate toward less refined self-renewing fuels
12The New York Times ldquoWill Lithium-Air Battery Rescue Electric Car Drivers from lsquoRange Anxietyrsquordquo May 7 2010 httpwwwnytimescomcwire2010050707climatewire-will-lithium-air-battery-rescue-electric-car-37498html 13ConsumerAffairscom ldquoConsumer Reports Sizes Up Hybrid Costsrdquo March 2006 httpwwwconsumeraffairscomnews04200603cr_hybridshtml
FEDERAL TRANSIT ADMINISTRATION 6
SECTION 1 CONTEXT FOR BRASH SOCIETAL CHALLENGES AND NEEDS
and that can come only through the technical migration toward external combustion BRASH (Binary Recovery Air-Steam Hybrid) technology provides that path
FEDERAL TRANSIT ADMINISTRATION 7
SECTION Technology Background 2 With few exceptions all mechanical work is derived from heat and all that heat is generated by combustion The earliest effective engines were steam engines first put to practical use at the time of US independence Steam engines remained the dominant source for motive power for the next century until its slow but steady displacement by IC engines in the automobile
Henry Ford was first inspired to develop steam traction engines as a better solution than plow horses14
I felt perfectly certain that horses considering all the bother of attending them and the expense of feeding did not earn their keep The obvious thing to do was to design and build a steam engine that would be light enough to run an ordinary wagon or to pull a plow I thought it more important first to develop the tractor To lift farm drudgery off flesh and blood and lay it on steel and motors has been my most constant ambition
Ironically by the 1920s steam traction engines were completely displaced by IC tractors largely the product of the same Henry Ford and his Fordson brand of tractor15
The IC engine was smaller lighter and cheaper to producemdashand considered safer Gasoline- and diesel-powered tractors were more expensive to operate but the most compelling argument for switching was safety in the hands of a lower-skilled operator who no longer had to constantly watch gauges and adjust temperatures and pressures
Similar differences existed in the broader automotive market and the advent of the electric starter effectively ended consumer interest in EC steam cars
Still near the end of the steam car era Stanley Doble White and others offered technically-competitive options The Doble Model E (Figure 8) weighed more than 5500 pounds but achieved in the 1930s the same fuel economy of a comparable IC engine in a contemporary SUVmdash16 mpg The Doble was powered by a four-cylinder engine of 190 cubic inches displacement about the size of an Accord engine but the Doble weighed 67 percent more than the Accord As for emissions one Doble Model E (currently owned by Jay Leno) recently passed California emissions testing with no modifications16
14Henry Ford My Life and Work 1922 15Spencer Yost Antique Tractor Bible 1998 16ldquoJayos Garage 1925 Doble Series E Steam Carrdquo httpwwwjaylenosgaragecomat-the-garagesteam-cars1925-doble-series-e-steam-car
FEDERAL TRANSIT ADMINISTRATION 8
SECTION 2 TECHNOLOGY BACKGROUND
Figure 8 Doble Model E
Doble and Brooks also built passenger buses similar in capacity and weight to contemporary buses The Brooks shown in Figure 9 was powered by a 400-cubic-inch V8 steam engine and carried 29 passengers at 60 mph while turning at 2000 rpm As a cruel twist of fate the public unveiling of the Brooks Steam Bus was announced in October 1929 two weeks before the stock market crash and the onset of the Great Depression17 The company did not survive
Figure 9 Brooks Steam Motors Bus
17Wikipedia ldquoBrooks Steam Motorsrdquo httpenwikipediaorgwikiBrooks_Steam_Motors
FEDERAL TRANSIT ADMINISTRATION 9
SECTION 2 TECHNOLOGY BACKGROUND
The suitability of steam power for mass transit use can be seen from comparison of a very powerful contemporary Ford V-8 Diesel engine (from the Excursion SUV) to the Besler V-Twin Steam engine circa 1938
Ford Turbo Diesel Besler Steam Configuration V-8 V-2 Displacement (cuin) 445 80 Horsepower 175 150 Torque (ft-lbs) 420 1200 Engine wt w transmission (lbs) 930 80
The Besler is roughly one quarter the size and weight of the V-8 Turbo-Diesel but has equivalent horsepower and three times the available torque (the primary determinant of performance) The Detroit Diesel Series 60 six-cylinder engine commonly used in mass transit vehicles produces marginally more torque (1450 ft-lbs) than the Besler from twice the horsepower and with much more fuel
Steam engines make greater use of the energy contained in the fuel by separating the heating phase of the Carnot cycle from the expansion phase and metering fuel burn to more closely match demand A steam engine presents maximum torque at low speed and greater horsepower and torque than comparable IC engines
Another EC technology gaining resurgent interest is compressed air power Recent reports of collaboration between MDI of France and Tata Motors of India suggest a new approach toward EC engines18 Tata Motors a major producer of vehicles on the Indian subcontinent intends to produce the MDI Air Car in the near future with anticipated fuel economy of 106 mpg The latest iteration of the MDI Air Car shown in Figure 10 has a projected range of 848 miles from 8 gallons of fuel or 106 mpg for a 4-passenger vehicle weighing 1870 pounds19
The MDI City Car relies on a six-cylinder 75 HP engineexpander to achieve this performance and in the ldquoprocess [produce] emissions of only 0141 lbs of CO2
per mile That is hellip less than [half] the cleanest vehicle available todayrdquo (Toyota Prius 07 Emissions 034 lbs of CO2 per mile)
18Autobloggreen ldquoA New Agreement between Tata Motors and MDI Bring the Air-Car Closer to Realityrdquo March 21 2007 httpgreenautoblogcom20070321a-new-agreement-between-tata-motors-and-mdi-bring-the-air-car-cl 19Motor Development International (MDI) OneFlowAIR httpwwwmdiluenglishoneflowairphp
FEDERAL TRANSIT ADMINISTRATION 10
SECTION 2 TECHNOLOGY BACKGROUND
Figure 10 MDI Air Car
The schematic for the MDI power plant is shown in Figure 11 The stored air is heated to combustion temperatures and allowed to expand mechanically This is the practical definition of an EC engine where combustion provides heat but the working fluid or propellant is not generated by the combustion process itself
Separating the heating step from the expansion step does not in itself yield higher fuel economy or lower emissions But the regulation of fuel flow to maintain optimum propellant temperature immediately prior to expansion provides both maximum fuel economy and lowest possible emissions In contrast an IC engine ignites fuel at 1800degF and immediately conducts that heat away through its water jacket to drop cylinder temperatures to 200ndash300degF EC engines preserve that heat for useful work
Figure 11 MDI Air Engine
Schematic
FEDERAL TRANSIT ADMINISTRATION 11
SECTION 2 TECHNOLOGY BACKGROUND
Both air and steam engines provide an alternative to the conventional IC engine Both operate from a variety of fuels and offer the potential of lower emissions and higher fuel economy Steam is the more robust of the two (the Besler Steam Twin is much more energetic than the MDI six-cylinder) but the compressed air engine offers an operational simplicity and a lower weight because no boiler or condenser is required Unfortunately it can never provide the power and acceleration of steam
The best of both worlds would be a blending of air and steam into a single engine that offers all of the benefits but without the weight and heat management issues of a boiler and with significantly more power than an air engine alone
FEDERAL TRANSIT ADMINISTRATION 12
SECTION The Air-Steam 3 Hybrid Solution
Air and water are completely different in their physical properties except when they operate as working fluids at high temperatures and pressures At steam operating pressures and temperatures their behavior largely follows ideal gas behavior and each is miscible in the other at all proportions The arrow in Figure 12 indicates the rough path for expansion of the hot high-pressure propellant and shows near ideal gas behavior for steam at these elevated temperatures and pressures
Figure 12 Does Steam
Behave Like an Ideal Gas
Getting to steam operating temperatures and pressures requires that significantly more heat be applied to water than air at STP (standard temperature and pressure) Air requires only 642 kcalmole to reach these operating temperatures while water (steam) requires 5236 kcalmole (due to the 512 kcal heat of vaporization) In this development a baseline flow of air is used to entrain water into the heater section Fuel is consumed in direct proportion to the water fraction to maintain the heater at a near constant temperature The heat required to maintain ldquohot airrdquo temperatures is a small fraction of the heat required to maintain steam temperatures as shown in Figure 13
FEDERAL TRANSIT ADMINISTRATION 13
SECTION 3 THE AIR-STEAM HYBRID SOLUTION
Figure 13 Heat Required
to Raise Air and Water
Temperature to 1000degK
The compressed air fraction provides a safe and consistent flow pressure into the hot section The water once heated to working steam temperature provides a more robust working fluid
The hot mixed propellant is injected into the expander moving a piston and converting heat to motion The expanded propellant thereby drops to condensing temperatures allowing the water portion to drop to a sump for pumped return to the injector The expanded air fraction is then recompressed for return to the injector
The use of an air fraction allows for immediate injection of work-appropriate amounts of water into the hot section no boiler no steam under pressure no fuel wasted (heating steam without immediate purpose) The use of a water fraction (and proportional fuel flow) allows for variable power from a constant temperature system The binary (air-steam) propellant allows for a closed-loop condensing recovery system extending range and economy
Figure 14 Schematic of Injector Nozzle Used to Mix Air
and Water
FEDERAL TRANSIT ADMINISTRATION 14
SECTION 3 THE AIR-STEAM HYBRID SOLUTION
The sum of the process is as follows
Key start begins a modest fuel burn that immediately provides initial hot air flow through the engine
bull Depressing the accelerator increases the water fraction and fuel flow (in direct proportion)
bullThe vehicle moves forward under (airsteamfuel) power in direct proportion to wheel turn
bullThe hot mix expands and the expanded mix condenses the water fraction
bullA small parasitic load recompresses the small air fraction to reinjection pressures
bull Removing the foot from the accelerator returns the flow to hot air only sweeping residual moisture from the cylinders and preventing hydraulic lock (during next cold start)
The engine can operate on any fuel whose flow can be regulated (semi-solid liquid gas) Combustion occurs at high temperature at one atmosphere so much cleaner burning than internal combustion
Figure 15 Air-Steam Hybrid
Schematic
Accelerator regulates flow of air water and fuel to heater based on load and wheel speed Water and fuel are metered to maintain heater temperature within optimal performance band
Output demand determines air-water fraction
Any discussion of fuel efficiency relative to current IC engine technology must first re-emphasize the multi-fuel capability of EC engines In a market so dominated by one fuel customers have accepted the term ldquomiles per gallonrdquo
FEDERAL TRANSIT ADMINISTRATION 15
SECTION 3 THE AIR-STEAM HYBRID SOLUTION
as the basis for comparison But in an open market with many different fuels and widely different heat content (BTUlb) the only common and appropriate denominator is ldquomiles per dollarrdquo (closer to ldquofuel economyrdquo)
To the extent that any EC solution gains market acceptance and the market responds with new and different fuel blends the law of supply and demand dictates that fuel prices for all will drop Until then the remainder of this efficiency discussion will assume all engines require the same petroleum-based fuel
The long-accepted estimate of fuel efficiency for the IC engine is about 25 percent with the remaining 75 percent of the heat content dissipated in equal parts through the hot exhaust the radiator and mechanical losses in the engine Much has been done to raise that efficiency but what remains is one power stroke in four and a high temperature detonation whose heat content is quickly and intentionally dissipated through conduction
In sharp contrast a steam engine is designed to preserve as much heat as possible from combustion and then mete out that heat through the expansion of the working fluid Instead of a 25 percent heat loss through conduction through a radiator conductive loss is limited to 10 percent in efficient steam engines The greatest loss is through the vaporization of water to steam (at 30) yielding useful work of 35 or 40 percent higher than internal combustion Steam vehicles often report significantly lower practical fuel economies as the whole boiler is heated for a relatively short trip (another reason to avoid using a boiler)
Hot air engines involve no change of state therefore avoiding the loss associated with vaporization That can mean fuel efficiencies approaching 65 percent except as noted with the MDI engine a lower power-to-weight capability
The combination of air and steam into a single engine type is expected to yield economies between 35 and 65 percent varying with wheel load A 50 percent net efficiency would double fuel economy over a comparably-sized IC engine but as shown with the Doble and Besler examples the EC engine can be much smaller yielding even greater economies
FEDERAL TRANSIT ADMINISTRATION 16
SECTION 3 THE AIR-STEAM HYBRID SOLUTION
Figure 16 Fuel Efficiency
by Engine Type
Derivative Uses As much as this study is focused on large motive power applications it should be noted that an equally important opportunity for this technology is in stationary power applications similar in configuration to combined heat and power units referred to generally as micro-CHPs Rapid start-up high torque quiet operation and multi-fuel compatibility make it well suited to an integrated heat and electrical power installation
FEDERAL TRANSIT ADMINISTRATION 17
SECTION 3 THE AIR-STEAM HYBRID SOLUTION
Its ability to produce a full range of power options (mechanical pneumatic heat and through attached accessories electrical and hydraulic) in a small modular man-portable configuration also make it particularly well suited to temporary or tactical power requirements Although beyond the scope of the DOT goals for vehicular use this stationary power applicationrsquos potential may be strategically important in market acceptance and adoption by expanding the range of applications and thereby providing economies of scale in all aspects of development production and commercialization activities for all applications
FEDERAL TRANSIT ADMINISTRATION 18
SECTION BRASH Test Plan 4 This Phase I effort followed the Technical Objectives outlined in the proposal as follows
Practical Objectives 1 Modify the Smarttrade sized test vehicle (Figure 17) installing a 10ndash20 HP
equivalent heater a 650 cc displacement 2 HP (nominal) Quasiturbinetrade steam engine pressurized air and water tanks electronic flow regulation of air water and fuel via laptop-based LabVIEW software and solenoid valves
2 Perform test runs to validate the system operation and determine key baseline performance parameters such as
a minimum air fraction to maintain engine operation upper limits for operating temperatures maximum allowable flow rates for water (without reducing effective propellant flow at temperature)
b upper limits of vehicle speed while varying gross vehicle weight and course incline
3 Following baseline performance assessment further objectives included
a an analysis of component placement for ease of maintenance and replacement
b an estimation of comparable volumes and weights to an equivalent IC powertrain in order to verify retrofitability
c an estimation of effective fuel economy while using propane fuel on closed track mileage runs
Figure 17 Smarttrade
Car-Sized Test Vehicle
FEDERAL TRANSIT ADMINISTRATION 19
SECTION 4 BRASH TEST PLAN
4 Over the course of multiple test runs a cumulative assessment of component performance and reliability would lead to a gross verification of BRASH engine integrity and range That in turn could lead to off-site vehicle demonstrations to federal agencies potential industry partners and investors
Analytical Objectives 1 The BRASH engine model has been demonstrated only at a bench level with
rudimentary understanding of its operating principles A key objective in this vehicle build is to increase the thermodynamic modeling of this technology including an analysis of mass flow (air water fuel) and resulting power
2 Early test data would lead to analysis of specific on-vehicle capacities (for air water and fuel) and flow rates for same in order to estimate operating range recovery strategies and rates (recompression and condensation) and the parasitic loads (eg alternators pumps) to sustain useful operation for many hours
3 Over time the vehicle testing under various test conditions (eg varying gross vehicle weight wheel load engine temperature propellant mix) will lead to a body of data to support more complete modeling of water fraction vs torque vs temperature These data are essential to real-world estimation of fuel economy as this technology scales to larger practical vehicle applications
4 With the modeling from 3 in place for steady-state operation practical track runs with frequent starts and stops can further shape the model for real-world use
5 The analysis from steps 1ndash4 will provide sufficient basis for estimating the mass flow heat component capacity recovery factors and fuel economy for scaling this 2 HP test data to larger vehicles in two decade steps first to a 20 HP pickup truck and then further modeling and custom buildup of a 200 HP power plant with a DOT-identified industrial partner
6 This analytical plan is consistent with the overall SBIR program plan as the 2HP effort is confined to Phase I the 20 HP build and test plan would be accomplished in Phase II and the design and build of the 200 HP power plant would be accomplished in Phase III with an established industry partner
The work effort toward completion of these tasks has proceeded on two tracks mechanical modifications to the April test vehicle and electronic control and measurement
Mechanical Modifications and Test Configuration The test vehicle is a modified electric car about the size of a Smarttrade car Earlier modifications included removal of the electric drive train exposing a large working
FEDERAL TRANSIT ADMINISTRATION 20
SECTION 4 BRASH TEST PLAN
space behind the cab This rear space over the rear left wheel contains a 2HP Quasiturbinetrade steam engine20 selected for its compact design and suitable power range for this 700-pound vehicle The placement over the left wheel permits direct drive to that wheel via electric clutch and chain drive
Figure 18 Quasiturbinetrade
Rotary Expander Installed and Interior View
In the center of center of this rear space a heavily-modified propane space heater rated at 30000ndash80000 BTUhr (equivalent to 11ndash31 boiler horsepower [bhp]) was installed Heaters of this type generally are designed to efficiently distribute heat into an adjoining space This heater was heavily modified with high temperature insulation and outer shells to retain useful heat to the 20-ft stainless steel coil passing through its core
Figure 19 Quasiturbinetrade
Rotary Expander Installed and Interior View
the expander and heater (with recent refinements) Also visible under the heater is the pressurized water tank (painted grey) The open space to left of the heater is reserved for drive components The space to the right of the heater is reserved for recovery and recompression of the expanded propellant (Recompression is outside of the current scope to simplify the testing and analysis See discussion section for more information) Other system components include air cylinders and electronic controllers that are mounted forward of the rear firewall in the cab or under the front hood
Figure 20 shows the back of the vehicle with fenders and trim removed revealing
20Quasiturbinetrade Product Details httpquasiturbinepromciqcca
FEDERAL TRANSIT ADMINISTRATION 21
SECTION 4 BRASH TEST PLAN
Figure 20 Test Configuration
Figure 21 System Components
The main system components are shown Minor components and linkage tomechanical output are not included in this report for the sake of simplicity
Electronic Control and Measurement No realistic progress toward a vehicle demonstrator with known and regulated fuel use can proceed without electronic regulation In this build the LabVIEW program and system components from National Instruments were used to create a ldquoglass cockpitrdquo of vehicle controls and performance measurement21 The simplified schematic in Figure 22 shows the planned integration of electronics in this development LabView-compatible components will replace all mechanical flow and measurement components
21More information can be found at National Insturments The LabVIEW Environment httpwwwnicomlabview
FEDERAL TRANSIT ADMINISTRATION 22
SECTION 4 BRASH TEST PLAN
Figure 22 Electronics
Schematic for Air-Steam Hybrid
For the vehicle driver the dashboard collection of gauges has been replaced with a laptop screen similar to the one pictured in Figure 23
Figure 23 Front Screen Display for Air-Steam Hybrid
Certain features on this front screen will reflect user input (OnOff Throttle) while others reflect the dependent variables in the process (Heater Temp Fuel Flow Air and Water Flow) Shown on the bottom screen will be running time-series data on speed wheel load temperature specific fuel consumption and the other variables important to the analytical process The front screen display is generated from programming and controls on the back screen display
FEDERAL TRANSIT ADMINISTRATION 23
SECTION 4 BRASH TEST PLAN
Figure 24 Back Screen Display for Air-Steam Hybrid
LabVIEW software and controllers were chosen because of National Instrumentsrsquo status as the industry leader in rapid control prototyping and In-Vehicle data-logging solutions BKi purchased the LabVIEW componentry through the University of Connecticut Mechanical Engineering Department as part of UConnrsquos ongoing support of the project
By the end of the contract term in October 2010 the air and water regulation components were complete and operational but the fuel regulation and engine speed components were not yet fully operational To generate the most meaningful data under these circumstances the test vehicle was configured for extended operation to determine specific fuel water and air consumption rates The combination of these rates provided the basis for initial estimates of power and efficiency
Summary of Effort Mechanical Modifications
1 Removal of original electrical drive components reinforcement of frame
2 Installation of Quasiturbinetrade 2HP engine modified heater pressurized water tank all pneumatic water and fuel lines
3 Baseline validation testing using manual controls
4 Installation of electronically-regulated flow controllers
Electronic Modification 1 Acquisition of computer electronic regulators and control software
2 LabVIEW systems programming
3 System checkout
FEDERAL TRANSIT ADMINISTRATION 24
SECTION 4 BRASH TEST PLAN
Testing and Analysis 1 Static Safety Testing 2 Baseline vehicle drivetrain testing
3 Vehicle static testing (Runs 3 amp 5)
Summary of RequirementsGoals 1 Safe operation of vehicle during static and motive applications
2 Qualitative demonstration of BRASH engine capability to move test vehicle on flat and inclined road surface
3 Quantitative determination of air water and fuel consumption during timed static test
4 Quantitative determination of air water and fuel consumption while varyshying water and fuel fractions
Summary of Testing Two experiments were performed in late November the first to establish minimum fuel and propellant flow rates for sustained operation at low speed (air-rich mode) and the second to establish reasonable upper limits of fuel and propellant flow at higher engine speeds (steam-rich mode) Variation in the air-steam mix is the underlying theory of operation for the BRASH engine the air fraction provides a baseline flow for initial start-up and low-speed operation but the addition of water (as steam) to the propellant results in a significant boost in range and power These two tests have verified this underlying theory
Test Conditions The two test runs summarized in this report are 3 on November 22 2010 and 5 on November 26 2010 Both tests were performed at the Depot D campus of the University of Connecticut in Storrs The testing was performed outside in seasonal conditions 45-50degF with light winds
Figure 25 Vehicle Test Setup
FEDERAL TRANSIT ADMINISTRATION 25
SECTION 4 BRASH TEST PLAN
Each run was a dynamic test with no load on the two-cylinder Quasiturbinetrade engine The propane cylinder was suspended from a scale for the duration of the test Propane fuel consumption was monitored continuously by digital scale with a display accuracy of 001kg
Each test run lasted for the duration of one high pressure air cylinder Air cylinder start (full) and end (empty) were determined at the start and finish of each run using the same scale and accuracy Water levels initially were determined volumetrically but the results were too inconsistent Displaced volume of liquid water proved a poor measure of the quantity heated to steam and carried forward for productive work For this reason water is an estimated quantity based upon fuel quantity burned less heat absorbed by the air fraction (Further integration of the LabView controller software in the next phase will obviate this work-around)
Each of the complete test runs may be viewed at Brash Engines website httpwwwbrashenginescom Photos from each run appear in the figures that follow Tables 1 and 2 summarize the productive mass flow for air water and propane fuel to produce work from the engine for the test duration
The cab interior in Figure 26 shows the high pressure air cylinder below the steering wheel and the laptop computer (regulating propellant flow) in passenger seat space The LabView controllers reside in the protective case under the laptop
Figure 26 Vehicle Cab with Controller Laptop
During each test hot propellant was allowed to expand and vent to ambient in order to simplify the thermodynamic model and analysis (Note the plumes of water vapor from each exhaust hose and the small puddles of water under each hose in Figure 27)
FEDERAL TRANSIT ADMINISTRATION 26
SECTION 4 BRASH TEST PLAN
Figure 27 Exhaust Plumes from Expander
Development plans include recovering the expanded propellant separating into water and air phases and then recompressing the air fraction for re-use This will both improve efficiency and eliminate the visible vapor plume
Test Assumptions Another estimation used in this study is the efficiency of heat transfer for the propellant through the 20-ft coil of stainless steel inside the insulated heater Figure 28 shows an early ldquoair-onlyrdquo test run with the current heater The hose failure and melting of the steel wire mesh inside (note formed ball in the mesh) indicates 1300degK temperatures exiting the hot section
Figure 28 Hose Failure Due
to Overheating
FEDERAL TRANSIT ADMINISTRATION 27
SECTION 4 BRASH TEST PLAN
Effective heat transfer (as Figure 28 shows) does not equal efficient heat transfer but the ability to deliver 1300degK air from a well-insulated burner suggests a highly efficient transfer of heat The analysis of results assumes a value of 90 efficiency (See Appendix A for a discussion of heat transfer efficiency)
3 Low Speed Test On November 22 2010 Run 3 tested the lower operating limits of the test setup Low limit in this context meant sufficient pressure to maintain expander rotation but low steam and fuel burn The test commenced with a full air cylinder weighing 661 Kg At the end of the test the empty cylinder weighed 460 Kg Over the 7 minutes and 15 seconds of testing 006 Kg of propane was consumed
The mass of air and fuel was determined from before after run test weights As stated earlier determining the quantity of steam produced from the pressurized water tank was problematic because of the quantity of stored water the resistance to water flow under dynamic pressures and the potential for some fraction of the water (in liquid state) to be entrained in the propellant mix
To solve for this unknown the energy required to raise the known quantity of air from ambient to 1000degK (33kcalmol or 0467 BTUg) was subtracted from the energy content of the propane consumed (44 BTUg) and then the efficiency of the heat transfer process was de-rated by 10 percent to yield a net quantity of 1438 BTUs to elevate ambient temperature water to 1000degK steam The result is an estimated 125 grams of water consumed in the 7-minute test
Table 1 summarizes these data and shows a high reliance on the air fraction for the work performed by the 2 HP engine The air cylinder used in this test has a measured free volume of 45 cubic feet (1274 liters at STP) which means sustained flow rates of 62 cubic feet per minute (cfm) or 175 liters per minute In contrast the 125 grams of water passed through as steam produced an estimated equivalent gas volume of 155 liters at STP Note the modest levels of water vapor in Figure 29 Why the greater air fraction relative to water flow in this test
Air (Wt 000Kg) 661 460 201 938 1294 30 36
Water2
(Wt 000Kg)
Propane(Wt 000Kg)
Time (hrmnsc)
1562
123000
1556
123715
00125
006
00715
1438
2640
na
1983
364
na
47
86
54
90
1 Energy value based upon absorbed heat (italicized) from STP to 1000degK (0446 BTUg for Air 115 BTUg water) 2 Determined by difference from propane and air energy assumed value 90 3Arbitrary estimated efficiency of heat transfer not effective work
11222010 - 3 Low Speed Run Air Pressure 60 psi Water Head Pressure 60 psi
Component(BTU) Start End Net Energy1
(BTU) Power
(BTUmin) Power (HP) Efficiency3
Table 1 Analysis of Mass
Flow Data at Low Speed
FEDERAL TRANSIT ADMINISTRATION 28
SECTION 4 BRASH TEST PLAN
Figure 29 Low-Speed Test Results in Little
Water Vapor
In this baseline experiment the single cylinder provides 60 psi air flow and 60 psi static ldquoheadrdquo pressure on the water column The air flow from the cylinder is biased toward the generally less restrictive flow path for air The water column under the same pressure presents a higher viscosity medium passing through a greater number of valves and restrictions At the point of injection the air fraction flows more freely into the hot section In order to bias the mix toward greater water fraction (and greater power) the head pressure on the water column must be increased over the 60 psi air line pressure
Run 4 (not documented here) evaluated head pressures from 110 psi to 70 psi and determined that modest differential pressures retarded the flow from the air fraction and boosted flow of the water fraction Still higher differential pressures effectively stopped air flow altogether reverting the engine operation to ldquosteam onlyrdquo For Run 5 an additional cylinder was used to apply a 70 psi static head pressure on the water column a 10 psi differential over the 60 psi air line pressure
5 Variable High Speed Test On November 26 2010 Run 5 tested the higher differential water pressure as a means to increase the effective water fraction in the propellant mix The test commenced with a full air cylinder weighing 654 Kg At the end of the test the empty cylinder weighed 472 Kg Run 5 was interrupted after 243 minutes to refill the water tank and then testing resumed for an additional 907 minutes Over the whole test 027 Kg of propane was consumed
Using the same analytical basis as Test 3 Test 5 data indicate a substantial increase in work capacity (as measured by fuel consumed and steam generated) over the 3 baseline
FEDERAL TRANSIT ADMINISTRATION 29
112610 - 5 Variable High Speed Run Air Pressure 60 psi Water Head Pressure 70 psi
Air (Wt 000Kg)
Component(BTU) Start End Net Energy1
(BTU) Power
(BTUmin) Power (HP) Efficiency3
654 472 182 849 718 17 7
SECTION 4 BRASH TEST PLAN
Table 3 Comparison of Mass Flows
Water 588 Runs 3 and 5
163 Duration (mn) 725 1180 725 1180 163
Air
Component Run 3 BHP
Run 5 BHP
Net ChngBHP
Run 5 Mass
Transfer (kg)
Net ChangeMass
Transfer (kg)
30 17
197
237
-45 2010 182 -9
Run 3 Mass
Transfer (kg)
276 350
47
86
422
0060
0013
0270
0086
Propane
This difference in steam fraction and power is more clearly seen in Figure 30 (and on the source video at the Brash Engines website)
Figure 30 Three Images from Run 5
Table 2 Test 5 Results with Increased
Water and Fuel Water2
(Wt 000Kg) 0860 9890 8358 197 83
Propane(Wt 000Kg) 1520 1493 27 11880 1004 237 90
Time (hrmnsc) 133000 134150 01150 na na na na
1 Energy value based upon absorbed heat (italics) from STP to 1000degK (0446 BTUg for Air 115 BTUg water) Underlined value is released heat at generally accepted 44 BTUg 2 Determined by difference from propane and air Energy assumed value 90 3 Arbitrary estimated efficiency of heat transfer not effective work
The increase in pressure on the water column by 10 psi reduced air flow by 9 percent but increased the steam fraction considerably and thereby increased the effective boiler horsepower nearly three-fold to 237 bhp (assuming 90 heat transfer) These data are summarized in Table 3
FEDERAL TRANSIT ADMINISTRATION 30
SECTION 4 BRASH TEST PLAN
As with Run 3 start up from Time Zero was immediate burner on air flow begins and water flow under pressure commences immediately Another impressive feature of the mix air-steam propellant system is the ability to start stop and rapidly accelerate as shown in the full Run 5 video Run 5 serves as validation that this patented technology has unique performance benefits over air steam or internal combustion alone
Lessons Learned A comparison of the two test runs verifies some key points
1 The same power plant can produce variable power and fuel economy based upon power demand and airsteam mix
2 Although imprecise at this point in testing fuel consumption appears directly proportional to engine speed The engineexpander will spool up spool down stop and restart in a manner consistent with fuel and propellant flow The Run 5 video on the Brash Engines website verifies this conclusion
3 The use of a defined static air pressure ldquoheadrdquo over the water column at a pressure higher than the defined air line dynamic pressure provides a safe and predictable bias toward flow from the water fraction
4 Although the current test configuration offers sufficient performance for this initial demonstration phase the following observations are in order
a The heater path is too long creating latent response issues
b The airwater injector is not optimized for proper mix or flow capacity
c The incomplete integration of LabVIEW compromises the quality of data
d The absence of a measured variable load on the expander compromises any analysis of power and fuel economy
5 The design migration to a vehicle installation was premature The project should move back to a lab bench study to refine the regulation of components complete the recovery and recompression portions of the system and use electromechanical loads to estimate power and useful work for specific quantities of fuel water and air
6 The Quasiturbinetrade engine technology is promising but too immature for larger-scale modeling Later phases of the project should rely on more conventional multi-cylinder piston-type expander
Estimated Fuel Economy Mass transit authorities have relied on large diesel engines such as the Detroit Diesel Series 50 and Series 60 engines for more than 30 years Reports on fuel economy vary from a high of 60 miles per gallon (Diesel) for longer-range
FEDERAL TRANSIT ADMINISTRATION 31
SECTION 4 BRASH TEST PLAN
commuter services in California23 to a low of 228 miles per gallon (Diesel) for city buses with frequent stops in New York City24 In both cited studies the migration to compressed natural gas (CNG) has resulted in lower fuel economies on a Diesel Gallon Equivalent (DGE) basis
Table 4 summarizes this study (columns 2 and 3) and the next proposed phase (columns 4 and 5) the performance of the current fleet of mass transit buses (columns 6 and 7) and the likely outcome if the Besler engine (described earlier) were employed with the air-steam hybrid technology (columns 8 and 9)
Table 4 Comparison of
Fuel Economies
Air
1
Configuration
Engine
HP
Torque
Fuel
gmin
BTUhr
GGEhr
mpg 60mph
GGE100 mi
$ per GGE
$100 mi
Current
Example
2
3
3
5
4
Bench
5
S-10
6
SB Bus
7
NYCT
8
50 eff
9
30 eff
86
Quasi
2
Prop
82
216
02
3160
03
30
09
Current
237
Quasi
2
Prop
23
607
05
1126
09
30
27
UC 1
40
6 cyl
20
Prop
40
1056
09
648
15
30
46
UC 2
80
6 cyl
40
Mix
80
2112
19
324
31
30
93
MCI102
DD S60
350
1450
Diesel
540
11400
100
60
167
35
583
Diesel
23
439
35
1535
300
Besler
150
1200
Mix
300
792
695
864
1158
16
1853
500
Besler
150
1200
Mix
500
1320
1158
518
1930
16
3088
The Besler engine is shown in two columns The left column reflects the higher efficiency anticipated with the air-steam hybrid mix described earlier as at or near 50 percent The right column reflects the historical efficiency realized with steam engine technology The italicized numbers near the bottom of the column show that even at historical efficiencies the Besler engine would offer equal or better Gasoline Gallon Equivalent (GGE)100 mile ratings of the current diesel technology but migrating toward less refined and (therefore) less expensive fuels would significantly reduce the operating cost ($mile)
23Demonstration of Caterpillar C-10 Dual-Fuel Engines in MCI 102DL3 Commuter Buses National Renewable Energy Laboratory httpwwwnrelgovdocsfy00osti26758pdf p 7 24R Barnitt ldquoNew York City Transit (NYCT) Hybrid (125 Order) and CNG Transit Buses Final Evaluation Resultsrdquo November 2006 National Renewable Energy Laboratory K Chandler Battelle Technical Report NRELTP-540-40125 November 2006 httpwwwnrelgovvehiclesandfuelsfleettestpdfs40125pdf pvii
FEDERAL TRANSIT ADMINISTRATION 32
SECTION 4 BRASH TEST PLAN
There are of course two orders of magnitude difference between the results of Runs 3 and 5 and the daily demands of city and commuter buses but the mere existence of the Besler Twin and the Brooks V-8 400 HP engine suggests an opportunity for fuel economy and fuel variety
Proposed further support for the next phase of development will advance the air-steam hybrid technology by an important order of magnitude This would provide the data confidence to scale to larger vehicle operation and garner the interest of one or more engine or vehicle OEMs
Figure 31 MTANew York City
Transit Orion VII Next Generation
Hybrid Transit Bus
Next Development Phase The next phase of development will incorporate a modern six-cylinder steam engine design with a displacement of 53 cubic inches and capable of sustained 15-25 HP operation The expander will be supplied by Steam Engine Power Inc (httpwwwsteamenginepowercom) This expander will drive an alternator generator to measure effective work output in watts as well as provide sufficient power to satisfy the system parasitic loads of battery recharge exhaust air recompression and all other pump and valve operations
Figure 32 (l to r) Six-Cylinder Expander Power Generation Load
Small 24 VDC Compressor
FEDERAL TRANSIT ADMINISTRATION 33
SECTION 4 BRASH TEST PLAN
Static pressure for the water column will still be supplied via compressed air cylinder but the dynamic air flow will be supplied by an oil-less air compressor of the size and type shown This 24 VDC compressor will recompress the recovered air exiting the expander to 40ndash60 psi pressure and support flows of 3ndash4 cubic feet per minute (cfm) These three components are off-the-shelf enhancements to the system but custom engineering of a new more powerful and more responsive heater completion of the electronic integration and design and fabrication of the recoveryrecompression components are necessary tasks that must be included to make the next generation assembly work to its potential This work will be accomplished largely by Mechanical and Electrical Engineering students at the University of Connecticut under the supervision of faculty and Brash Engines personnel
When this build is complete all operations will be under LabVIEW control All expander operations will be measured for power and work Once the bench version is in control a modified version will be installed in a small pickup truck (eg Chevrolet S-10) for further verification of system performance and robustness
During this phase a new and promising technology will be investigated a new and faster class of solenoid valves from National Instruments These solenoid valves with an unprecedented 3 msec response time have the potential of allowing air-steam retrofit in existing engine blocks The solenoid valves could replace the spark plugs in conventional IC engines and provide the equivalent timed injection of hot propellant mix as the timed firing of a spark plug in the presence of a fuel air mix
If possible these fast solenoids and the black box programming to control them could allow very easy portability to larger vehicles and easier retrofit Potentially a V-6 engine could operate 4 cylinders for expansion and the remaining two cylinders could be used as direct drive compressors with different but equivalent solenoid valves controlling the compression process
FEDERAL TRANSIT ADMINISTRATION 34
SECTION Development Plan 5 and Next Steps
This current effort is a key first-proof of concept for this air-steam hybrid technology but our goals extend well beyond this two-seat 2 HP demonstrator The lessons learned in electronic integration will allow rapid migration to larger platforms using the same basic controls but scaling the expander heater and other mass-flow components to vehicle-appropriate size That project identified as ldquo20 HP Vehiclerdquo and other near-term derivative projects are listed in Table 5
BRASH Project
ProposedFunding Source
Funds Reqd $K Project Description
SUV-size proof-of-concept for reliable 20 HP Vehicle DOTUSPS 300 highway performance maildelivery
vehicle size
Proof-of-concept mass transit busshy200 HP Vehicle DOTDOD 600 retrofit scaled to city bus capacity and
suitable for replacement of over-the-road diesel engines
Table 5 Project Funding
Stationary Power Unit Micro-CHP Equivalent
DARPA 300 Proof-of-concept mass transit bus-retrofit scaled to city bus capacity and suitable for replacement of over-the-road diesel engines
Summary Alternative Processed Solid Fuel DOE EPA DOA 600
Processed mix of hydrolyzed wood pulp processed solid waste and other combustible solids in an extrudable mass with alcohol solutevehiclemdashdemonstrate utility in vehicles as a high energy content clean burning fuel for EC engines
Demonstrate effective pyrolysis of
Binary Solid Gas Fuel
EPA Waste Management BFI
400 processed solid fuels in a binary fuel burner conventional fuel (gasoline natural gas) provides primary heat source for pyrolysis temperatures
Proof of Concept OEM Power Plant
Vehicle OEM (eg Ford GM Caterpillar) 1200
Development of direct replacement BRASH engine alternative to existing OEM IC engine
Black Box Integration of Controller Software
Vehicle OEM (eg Ford GM Caterpillar)
1600 Development of commercial BRASH system alternative to existing OEM IC engine
FEDERAL TRANSIT ADMINISTRATION 35
SECTION 5 DEVELOPMENT PLAN AND NEXT STEPS
The issuance of US Patent 7743872 five months ago has two important consequences for this project First it serves to validate the underlying technology the combination of air and steam in an EC engine is better than steam or air alone Second it provides a basis for full and open discussions with government agencies and large commercial interests in the transportation and power sectors
Our efforts at promotion have been delayed pending successful demonstration of the Smarttrade car vehicle to allow the first detailed real-world performance data to be distributed
Coupling that performance data with the option of migration away from refined petroleum should spark significant interest If we can move to a high lignin-processed wood pulp that costs $045 per gasoline gallon equivalent (an arbitrary value for example only) and consumes more CO2 while growing than is consumed in processing as a fuel and produced from combustion then we succeed as a project and as a global game-changing technology for many uses Improvements in fuel economy are important but of greater importance is the migration to low-process biomass fuels
FEDERAL TRANSIT ADMINISTRATION 36
SECTION Potential Applications and Societal Value 6 The whole premise behind the BRASH air steam hybrid is that external combustion offers a more benign and environmentally-appropriate way to power large vehicles and other portable equipment than refined petroleum-powered internal combustion
bullCombustion heat can be derived from any fuel source including processed solids from fast-growing renewables such as poplar trees waste corn stalks or switch grass
bullThat combustion heat is applied at a rate consistent with the work to be done and not to support idling and other unproductive fuel use
Using a mix of air and steam as working fluids in the engine allows
bullImmediate startup from an ldquoair-onlyrdquo start
bull Managed system pressure through use of a defined head air pressure
bullManaged fuel burn as the air-steam fraction is adjusted to match wheel load
bullAdjusted wheel load reduces fuel burn
Integration of modern control circuitry with external combustion also brings a level of performance operational simplicity and safety heretofore unavailable
FEDERAL TRANSIT ADMINISTRATION 37
SECTION
7 Phase I Conclusions
The last steam train in scheduled service in the US departed on October 11 196225 One year earlier Robert Noyce received the first patent for an integrated circuit26 But for that brief one-year overlap the most powerful motive power technology was never harnessed by the black box controls that grew out of Noycersquos invention so the diesel-powered IC engine championed by Henry Ford won out
Now nearly 50 years later the modern IC engine cannot operate efficiently without the benefit of black box electronicsmdashbut that technology still presents intractable challenges of supply safety and environmental impact The air-steam hybrid technology may offer an alternative and a glimpse of that potential is presented here and viewable in Run 5 on the Brash Engines website at http wwwbrashenginescom
While demonstration in a test vehicle provides a strong visual message that BRASH technology works the commercial success of this technology will depend upon reliable repeatable measurement of power and economy For that data the Phase 2 effort will require a return to laboratory bench testing and effective demonstration of recovery of the water and air fractions
The results of this Phase I project collectively demonstrate the technical feasibility and commercial potential of the BRASH air-steam hybrid engine technology The initial DOT SBIR funding has been highly effective in facilitating this important proof of concept and laying the groundwork for further technology refinement and application
As described earlier the next steps are clear and appear to combine achievable and rapid major advances with low developmental risk SBIR Phase 2 support is needed for those advances due to the still-early stage of development that restricts access to private capital
The immense potential value of this technology has been enhanced and verified in Phase 1 there is now a clear and low-risk path ahead to larger-scale testing further component and controls refinement specific applications prototyping and pre-commercial deployments
25William Rosen The Most Powerful Idea in the World Random House 2010 p 311 26US Patent 2981877
FEDERAL TRANSIT ADMINISTRATION 38
APPENDIX
A Heat Transfer Efficiency Modeling Runs 3 and 5 50 and 90
Much of the analysis for Runs 3 and 5 is based on an assumed efficiency of 90 for heat transfer from the combustion of propane to heating of the water air mix in the coil As a test for the reasonableness of that assumption the same data have been modeled at a much lower 50 factor below
112210 - 3 Low Speed Run Air Pressure 60 psi Water head pressure 60 psi
Water2 00440 5060 4276 101 43 (Wt 000Kg)
Propane 152 1493 237 50 27 11880 1004 (Wt 000Kg)
Time 133000 134150 01150 na na na na (hrmnsc)
1 Energy value based upon absorbed heat (italics) from STP to 1000degK (0446 BTUg for Air 115 BTUg water) Underlined value is released heat at generally accepted 44 BTUg
Air (Wt 000Kg)
Component(BTU) Start Wt End Wt Net Wt Energy1
(BTU) Power
(BTUmin) Power (HP) Efficiency3
661 460 201 938 1294 30 36
Water2
(Wt 000Kg)
Propane(Wt 000Kg)
Time (hrmnsc)
1562
123000
1556
123715
00125
006
00715
380
2640
na
523
364
na
12
86
14
50
na na
Air (Wt 000Kg)
Component(BTU) Start Wt
5 Variable High Speed Run Air Pressure 60 psi Water head pressure 70 psi
End Wt Net Wt Energy1
(BTU) Power
(BTUmin) Power (HP) Efficiency3
654 472 182 849 718 17 7
2 Determined by difference from Propane and Air Energy assumed value 90 3 Arbitrary estimated efficiency of heat transfer not effective work
The two known quantities in each run is the weight of the air moving through the system and the weight of the propane heating that air The variable is the quantity of water heated to steam temperatures and above In Run 3 at 90 efficiency that mass of water calculates to 125 grams at 50 it drops to 33 grams In Run 5 at 90 efficiency that mass of water calculates to 86 grams at 50 it drops to 44 grams
FEDERAL TRANSIT ADMINISTRATION 39
APPENDIX A HEAT TRANSFER EFFICIENCY MODELING RUNS 3 AND 5 50 AND 90
As the comparison tables below show the uncertainty in the efficiency of heat transfer is manifest only in the mass of water heated to steam to do useful work
Data 90 Efficiency
Air
Component Run 3 BHP
Run 5 BHP
Net ChngBHP
-45
Run 3 Mass
Transfer (kg)
Run 5 Mass
Transfer (kg)
Net ChangeMass
Transfer (kg)
30 17
197
237
2010 182 -9
Water
Propane
Duration (mn)
47
86
725
422
0060
0013
725
0270
0086
1180
588
350
163 1180
276
163
Data 50 Efficiency
Air
Component Run 3 BHP
Run 5 BHP
Net ChngBHP
-45
Run 3 Mass
Transfer (kg)
Run 5 Mass
Transfer (kg)
Net ChangeMass
Transfer (kg)
30 17
101
237
2010 182 -9
Water
Propane
Duration (mn)
12
86
725
817
0060
0003
725
0270
0044
1180
1233
350
163 1180
276
163
Regardless of the specific efficiency Run3 reflects an air-rich propellant mix while Run 5 was clearly the more powerful and steam-rich propellant If 50 efficiency is a more realistic figure than 90 the only consequence is more water passing through the heater expander and recovery tank The only consequence for overall system efficiency is the slight but added work required to move the additional water by pump to the top of the water column
FEDERAL TRANSIT ADMINISTRATION 40
APPENDIX Acronyms B
BHP Boiler Horsepower
BRASH Binary Recovery Air-Steam Hybrid
BTU British Thermal Unit
CC Cubic centimeter
CFM Cubit feet per minute
CHP Combined heat and power
CNG Compressed natural gas
CO2 Carbon dioxide
CU Cubic
DARPA Defense Advanced Research Projects Agency
DGE Diesel gallon equivalent
DOT Department of Transportation
EC External combustion
EIA Energy Information Administration
EPA Environmental Protection Agency
FTA Federal Transit Administration
GGE Gasoline gallon equivalent
HP Horsepower
IC Internal combustion
K Kelvin
Kcal Kilocalorie
MPG Miles per gallon
MPH Miles per hour
OEM Original equipment manufacturer
PSI Pounds per square inch
RPM Revolutions per minute
SBIR Small Business Innovation Research
STP Standard temperature and pressure
FEDERAL TRANSIT ADMINISTRATION 41
FEDERAL TRANSIT ADMINISTRATION 128
US Department of TransportationFederal Transit AdministrationEast Building1200 New Jersey Avenue SEWashington DC 20590httpwwwftadotgovresearch
US Department of Transportation Federal Transit Administration East Building 1200 New Jersey Avenue SE Washington DC 20590 httpwwwftadotgovresearch
FEDERAL TRANSIT ADMINISTRATION 42
- Button1
- Button2
- Button3
- Button4
- Button5
- Button6
- Button7
- Button8
- Button9
- Button10
- Button11
- Button12
- Button13
- Button14
- Button15
- Button16
- Button17
- Button18
- Button19
- Button20
- Button21
- Button22
- Button23
- Button24
- Button25
- Button26
- Button27
- Button28
- Button29
- Button30
- Button31
- Button32
- Button33
- Button34
- Button35
- Button36
- Button37
- Button38
- Button39
- Button40
- Button41
- Button42
- Button43
- Button44
- Button45
- Button46
- Button47
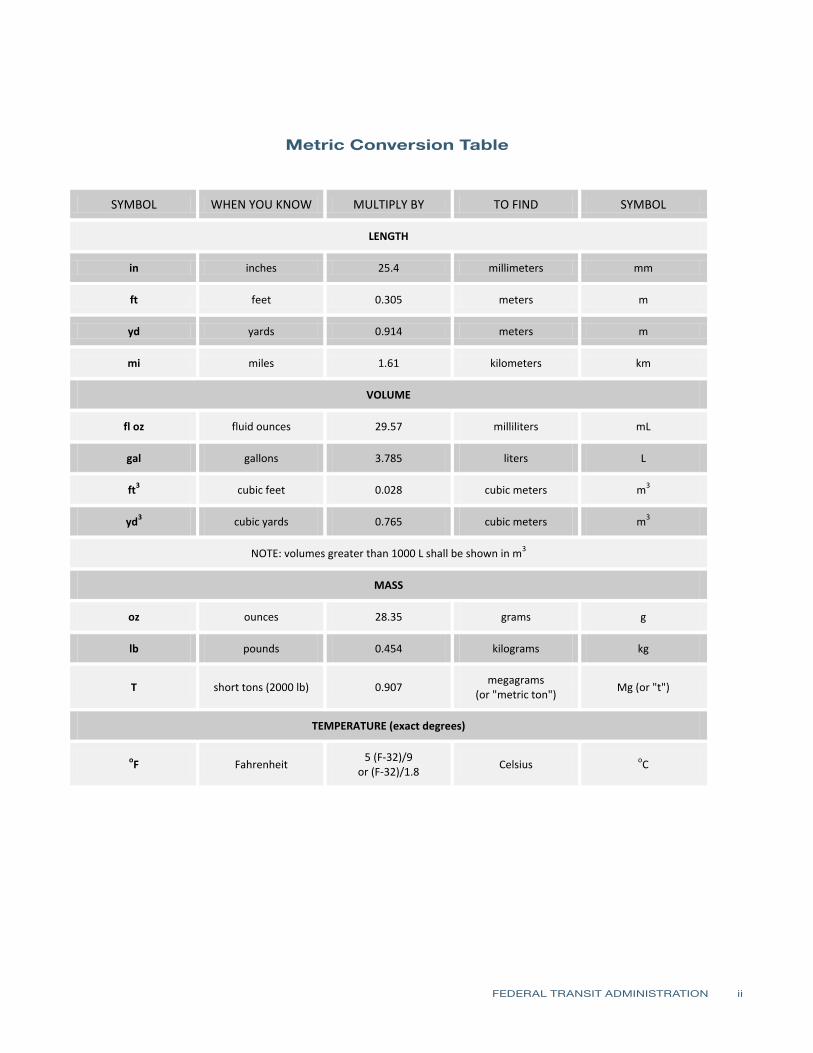
Metric Conversion Table
FEDERAL TRANSIT ADMINISTRATION ii
FEDERAL TRANSIT ADMINISTRATION ii
SYMBOL WHEN YOU KNOW MULTIPLY BY TO FIND SYMBOL
LENGTH
in inches 254 millimeters mm
ft feet 0305 meters m
mi miles 161 kilometers km
VOLUME
fl oz fluid ounces 2957 milliliters mL
gal gallons 3785 liters L
ft3 cubic feet 0028 cubic meters m 3
yd3 cubic yards 0765 cubic meters m 3
NOTE volumes greater than 1000 L shall be shown in m3
MASS
oz ounces 2835 grams g
lb pounds 0454 kilograms kg
T short tons (2000 lb) 0907 megagrams
(or metric ton) Mg (or t)
TEMPERATURE (exact degrees)
oF Fahrenheit 5 (F-32)9 or (F-32)18
Celsius oC
Metric Conversion Table
yd yards 0914 meters m
FEDERAL TRANSIT ADMINISTRATION iii
REPORT DOCUMENTATION PAGE Form Approved OMB No 0704-0188
Public reporting burden for this collection of information is estimated to average 1 hour per response including the time for reviewing instrucshytions searching existing data sources gathering and maintaining the data needed and completing and reviewing the collection of information Send comments regarding this burden estimate or any other aspect of this collection of information including suggestions for reducing this burden to Washington Headquarters Services Directorate for Information Operations and Reports 1215 Jefferson Davis Highway Suite 1204 Arlington VA 22202-4302 and to the Office of Management and Budget Paperwork Reduction Project (0704-0188) Washington DC 20503
1 AGENCY USE ONLY 2 REPORT DATE March 2011
3 REPORT TYPE AND DATES COVERED Final Report April to November 2010
4 TITLE AND SUBTITLE Title Air-Steam Hybrid Engine An Alternative to Internal Combustion Subtitle Cleaner More Efficient Multi-Fuel Compatible Retrofitable
5 FUNDING NUMBERS 101-FT1 Proposal No FT1BKIAS DTRT57-10-R-SBIR1
6 AUTHOR(S) Dr Robert Knight President Michael J Brookman Bevilacqua-Knight Inc
7 PERFORMING ORGANIZATION NAME(S) AND ADDRESSE(ES) Bevilacqua-Knight Inc 1000 Broadway Suite 410 Oakland CA 94607
8 PERFORMING ORGANIZATION REPORT NUMBER
FTA Report No 0013
9 SPONSORINGMONITORING AGENCY NAME(S) AND ADDRESS(ES) US Department of Transportation Federal Transit Administration Research Demonstration and Innovation
East Building 1200 New Jersey Avenue SE
Washington DC 20590
10 SPONSORINGMONITORING AGENCY REPORT NUMBER
FTA Report No 0013
11 SUPPLEMENTARY NOTES Sufficient credibility has been achieved from this Phase 1 demonstration and analysis of the air-steam approach to justify additional SBIR support and attract the interest of industrial partners and investors
12A DISTRIBUTIONAVAILABILITY STATEMENT Available From National Technical Information ServiceNTIS 5285 Port Royal Road Springfield VA 22161 phone (703) 605-6000 fax (703) 605-6900 email ordersntisfedworldgov
12B DISTRIBUTION CODE
TRI-20
13 ABSTRACT In this Small Business Innovation Research (SBIR) Phase 1 project an energy-efficient air-steam propulsion system has been developed and patented and key performance attributes have been demonstrated to be superior to those of internal combustion engines A mixed air-steam propellant system can provide immediate power without a boiler and that power can be varied simply by modifying the ratio of water and air in the propellant mix Next steps for this innovation include more detailed performance verification and an analysis of scaling this promising technology to propel buses and trains for mass transit use Successful validation would lead to a vehicle retrofit of a smaller lighter more fuel efficient engine in a standard mid-size or full-size vehicle That engine could operate on a variety of fuels other than refined petroleum These goals are consistent with the DOT SBIR subtopic narrative ldquoEconomical and durable technologies and devices for improving safety for riders and transit agency employees reducing noise and energy consumption or improving the rider experience The innovations must be adaptable to existing bus and rail transit vehicles and systemsrdquo
14 SUBJECT TERMS Air Steam Bio-Fuels Multi-Fuel Retrofit Engine Hybrid External Combustion Bus
15 NUMBER OF PAGES 49
16 PRICE CODE
17 SECURITY CLASSIFICATION OF REPORT
Unclassified
18 SECURITY CLASSIFICATION OF THIS PAGE
Unclassified
19 SECURITY CLASSIFICATION OF ABSTRACT
Unclassified
20 LIMITATION OF ABSTRACT
FEDERAL TRANSIT ADMINISTRATION iii
TABLE OF CONTENTS
1 Executive Summary 3 Section 1 Context for BRASH Societal Challenges and Needs 8 Section 2 Technology Background
13 Section 3 The Air-Steam Hybrid Solution 17 Derivative Uses 19 Section 4 BRASH Test Plan 19 Practical Objectives 20 Analytical Objectives 20 Mechanical Modifications and Test Configuration 22 Electronic Control and Measurement 24 Summary of Effort 25 Summary of RequirementsGoals 25 Summary of Testing 25 Test Conditions 27 Test Assumptions 28 3 Low Speed Test 29 5 Variable High Speed Test 31 Lessons Learned 31 Estimated Fuel Economy 33 Next Development Phase 35 Section 5 Development Plan and Next Steps 37 Section 6 Potential Applications and Societal Value 38 Section 7 Phase I Conclusions 39 Appendix A Heat Transfer Efficiency Modeling Runs 3 and 5 50 and 90 41 Appendix B Acronyms
FEDERAL TRANSIT ADMINISTRATION iv
LIST OF FIGURES
1 Figure 1 Energy Usage in the United States 2 Figure 2 Simplified Model of Air-Steam Hybrid Engine 3 Figure 3 Historic Crude Oil Prices Source Energy Information Administration 4 Figure 4 Projections of World Oil Production 4 Figure 5 Measured Atmospheric CO2
5 Figure 6 Global Warming Projections 6 Figure 7 US Energy Consumption by Fuel (1980ndash2035) 9 Figure 8 Doble Model E 9 Figure 9 Brooks Steam Motors Bus
11 Figure 10 MDI Air Car 11 Figure 11 MDI Air Engine Schematic 13 Figure 12 Does Steam Behave Like an Ideal Gas 14 Figure 13 Heat Required to Raise Air and Water Temperature to 1000degK 14 Figure 14 Schematic of Injector Nozzle Used to Mix Air and Water 15 Figure 15 Air-Steam Hybrid Schematic 17 Figure 16 Fuel Efficiency by Engine Type 19 Figure 17 Smarttrade Car-Size Test Vehicle 21 Figure 18 Quasiturbine Rotary Expander Installed and Interior View 21 Figure 19 Heater Installed (Early Configuration) Insulation to Retain Heat Inner Coil 22 Figure 20 Test Configuration 22 Figure 21 System Components 23 Figure 22 Electronics Schematic for Air-Steam Hybrid 23 Figure 23 Front Screen Display for Air-Steam Hybrid 24 Figure 24 Back Screen Display for Air-Steam Hybrid 25 Figure 25 Vehicle Test Setup 26 Figure 26 Vehicle Cab With Controller Laptop 27 Figure 27 Exhaust Plumes from Expander 27 Figure 28 Hose Failure Due to Overheating 29 Figure 29 Low Speed Test Results in Little Water Vapor 30 Figure 30 Three Images from Run 5 33 Figure 31 MTANew York City Transit Orion VII Next Generation
Hybrid Transit Bus 33 Figure 32 Six-Cylinder Expander Power Generation Load Small 24 VDC Compressor
LIST OF TABLES
28 Table 1 Analysis of Mass Flow Data at Low Speed 30 Table 2 Test 5 Results with Increased Water and Fuel 30 Table 3 Comparison of Mass Flows Runs 3 and 5 32 Table 4 Comparison of Fuel Economies 35 Table 5 Project Funding Summary
FEDERAL TRANSIT ADMINISTRATION v
EXECUTIVE SUMMARY
More than one quarter of all energy consumed in the US is used to support the transportation sector and as shown in Figure 1 nearly all of that transport energy is derived from petroleum1
Why does transportation rely nearly exclusively on petroleum when other sectors rely primarily on other sources of energy A major part of the answer lies in the timed ignition needs of internal combustion engines which require a highly-refined and volatile fuel to provide timely detonation of the fuelair mixture
Figure 1 Energy Usage in
the United States
However the detonation of refined fuels is not a necessary condition to produce useful prime-mover work That work can be extracted from heat alone and that heat can be generated from semi-solid bio-fuels if the work is performed by an external combustion (EC) engine
EC engines have been in use for centuries and still produce 80 percent of electrical capacity in the US2 but EC engines have been disfavored for transportation applications because of startup delay constant ldquotendingrdquo and perceived lower fuel economy The patented BRASH (Binary Recovery Air-Steam Hybrid)
1ldquoPetroleum Basic Statisticsrdquo September 2008 Energy Information Administration US Department of Energy October 14 2008 httpwwweiadoegovbasicsquickoilhtml 2ldquoNet Generation by Energy Source Total (All Sectors)rdquo March 11 2011 US Dept of Energy Energy Information Administration Energy Source Table httpwwweiadoegovcneafelectricityepmtable1_1html
FEDERAL TRANSIT ADMINISTRATION 1
EXECUTIVE SUMMARY
engine technology resolves each of these concerns and presents the first clear alternative to internal combustion in more than 50 years It is projected to produce higher fuel efficiency greater power and lower emissions than a comparable internal combustion (IC) engine It should be particularly well-suited to larger vehicles such as buses The BRASH engine is a binary recovery air-steam hybrid engine The combination of air and water in an EC engine provides immediately available power and should produce much greater fuel economy than a conventional steam or IC engine More significantly the BRASH engine can provide more power with lower emissions from a wider range of fuels than an internal combustion engine A simplified schematic of the BRASH engine is shown in Figure 2 illustrating the following principles
bull Accelerator regulates flow of air water and fuel to heater based on load and wheel speed
bullWater and fuel are metered to maintain heater temperature within optimal performance band
bullOutput demand determines air-water fraction
Figure 2 Simplified Model
of Air-Steam Hybrid Engine
Any fuel that can be metered (liquid solid or gas) can be used and the heat from combustion is used in direct proportion to work done Fuel is consumed in direct proportion to demand Fuel economy with this air-steam system is much higher than steam alone because air requires less heat to move a piston and the systemrsquos superior thermal management will yield practical fuel economy 3ndash4 times that of an internal combustion engine of comparable torque
FEDERAL TRANSIT ADMINISTRATION 2
SECTION Context for BRASH 1 Societal Challengesand Needs
Economic growth in the developed world has been highly dependent on petroleum distillates for nearly a century3 As Figure 3 shows for most of that century the price of oil has remained stable ($10ndash$30 per barrel in 2008 dollars) and relatively low Since the oil embargo of the 1970s and later political instability in large oil-producing regions the price of oil has fluctuated significantly Over the last 40 years each sharp increase in oil prices has been followed by a steep decline in economic activity
Figure 3 Historic Crude
Oil Prices
The long-term trend in oil prices reflects the growing concern that oil quantities are finite while worldwide demand continues to grow4 M King Hubbert first posited in 1956 that US oil production was approaching a maximum rate and past that point when demand exceeded supply prices would rise rapidly to unprecedented levels5 Since Hubbert this model has been extended to worldwide oil reserves and the popular notion of ldquopeak oilrdquo6
Figure 4 shows projections of world oil production beyond 2010 Most models show a decline in supply over the next 20 to 30 years7 This decline in production
3ldquoAnalysis of the Impact of High Oil Prices on the Global Economyrdquo International Energy Agency (IEA) http wwwieaorgtextbasenpsumhigh_oil04sumpdf 4EampP Magazine ldquoGeologists Positive about Future of Oil and Gasrdquo June 10 2009 5Marion King Hubbert ldquoNuclear Energy and the Fossil Fuels Drilling and Production Practicerdquo June 1956 Spring Meeting of the Southern District Division of Production American Petroleum Institute San Antonio Texas Shell Development Company pp 22ndash27 httpwwwhubbertpeakcomhubbert19561956pdf retrieved April 18 2008 6Adam R Brandt ldquoTesting HubbertrdquoEnergy Policy 35(5) May 2007 pp 3074ndash3088 7ldquoMedium-Term Oil Market Reportrdquo July 2007 IEA Public AccessndashOil Market Report httpomrpublicieaorg
FEDERAL TRANSIT ADMINISTRATION 3
SECTION 1 CONTEXT FOR BRASH SOCIETAL CHALLENGES AND NEEDS
would coincide with far greater fuel demand as China India and other parts of the developing world are beginning to embrace the automobile8
Figure 4 Projections
of World Oil Production
The other trend of note related to petroleum usage is the rise of atmospheric CO2 and the growing risk of climate change Figure 5 shows the consistent rise in atmospheric CO2 at the remote Mauna Loa observatory The rise in CO2 levels is attributed to fossil fuel combustion most notably coal-fed power plants and gasoline powered automobiles
Figure 5 Measured
Atmospheric CO2
8Plunkett Research (2008) ldquoAutomobile Industry Introductionrdquo
FEDERAL TRANSIT ADMINISTRATION 4
SECTION 1 CONTEXT FOR BRASH SOCIETAL CHALLENGES AND NEEDS
As shown in Figure 6 the rise in atmospheric CO2 levels correlates with increases in global temperatures As CO2 continues to increase the expectation is further increases in average global temperatures9
Figure 6 Global Warming
Projections
The economic modeling and the environmental modeling point to one conclusion petroleum distillates may be the current source for nearly all of our transportation fuel supplies but its primacy cannot be sustained Whether from a perspective of limited supply and growing demand or the perspective of a growing environmental impact refined petroleum does not provide solutions only difficult and growing problems
Three popular initiativesmdashpetroleum alternatives improved fuel economy and alternative electric vehicle powermdashcannot solve worldrsquos thirst for petroleum distillates
bullPetroleum alternatives like biodiesel or ethanol put fuel in competition for land with our food supply10
bullNoble efforts to increase vehicle fuel economy domestically cannot offset the surging worldwide demand for more vehicles (Figure 7)11
9IPCC ldquoSummary for Policymakersrdquo Climate Change 2007 The Physical Science Basis Contribution of Working Group I to the Fourth Assessment Report of the Intergovernmental Panel on Climate Change Intergovernmental Panel on Climate Change (IPCC)rdquo 2007 httpwwwipccchpdfassessment-reportar4 wg1ar4-wg1-spmpdf retrieved July 3 2009 10The New York Times ldquoFood and Fuel Compete for Landrdquo December 18 2007 httpwwwnytimes com20071218business18foodhtml 11US Information Administration Analysis amp Projections httpwwweiagovoiafforecastinghtml
FEDERAL TRANSIT ADMINISTRATION 5
SECTION 1 CONTEXT FOR BRASH SOCIETAL CHALLENGES AND NEEDS
bullDomestic migration to electric vehicles is constrained by gross vehicle weight and range12 and electric hybrids are still priced at a premium over their non-hybrid versions13
Figure 7 US Energy
Consumption by Fuel
(1980ndash2035)
The goal of lower national fuel consumption is built on the false premise that the transportation sector requires highly-refined fuel Transportation requires highly-refined fuels only if the motive power is derived from timed detonation of a fuel air mixture in the cylinder head In other words the problem is not so much the petroleum itself but rather the virtually universal dependence on internal combustion (IC) engines that require petroleum fuels
If motive power were to come instead from external combustion a far wider array of gas liquid and solid biomassrenewable fuels could be used The goal could shift from ldquomiles per gallonrdquo to ldquoeffective production cost per 100 miles drivenrdquo for a new class of fuels measured by the pound and favored by the rate of production and CO2 absorption during growth
In sum the goal is to reduce the amplitude and slope of the red (ldquoLiquidsrdquo) line in Figure 7 and increase the same parameters of the green (ldquoNonhydro renewablesrdquo) line significantly By migrating to EC vehicles more of the green renewables line can be used in the transportation sector
The driving force behind the world economy is energy It is axiomatic that lower fuel production costs and consumption equals higher economic productivity The solution for the transportation sector is to migrate toward less refined self-renewing fuels
12The New York Times ldquoWill Lithium-Air Battery Rescue Electric Car Drivers from lsquoRange Anxietyrsquordquo May 7 2010 httpwwwnytimescomcwire2010050707climatewire-will-lithium-air-battery-rescue-electric-car-37498html 13ConsumerAffairscom ldquoConsumer Reports Sizes Up Hybrid Costsrdquo March 2006 httpwwwconsumeraffairscomnews04200603cr_hybridshtml
FEDERAL TRANSIT ADMINISTRATION 6
SECTION 1 CONTEXT FOR BRASH SOCIETAL CHALLENGES AND NEEDS
and that can come only through the technical migration toward external combustion BRASH (Binary Recovery Air-Steam Hybrid) technology provides that path
FEDERAL TRANSIT ADMINISTRATION 7
SECTION Technology Background 2 With few exceptions all mechanical work is derived from heat and all that heat is generated by combustion The earliest effective engines were steam engines first put to practical use at the time of US independence Steam engines remained the dominant source for motive power for the next century until its slow but steady displacement by IC engines in the automobile
Henry Ford was first inspired to develop steam traction engines as a better solution than plow horses14
I felt perfectly certain that horses considering all the bother of attending them and the expense of feeding did not earn their keep The obvious thing to do was to design and build a steam engine that would be light enough to run an ordinary wagon or to pull a plow I thought it more important first to develop the tractor To lift farm drudgery off flesh and blood and lay it on steel and motors has been my most constant ambition
Ironically by the 1920s steam traction engines were completely displaced by IC tractors largely the product of the same Henry Ford and his Fordson brand of tractor15
The IC engine was smaller lighter and cheaper to producemdashand considered safer Gasoline- and diesel-powered tractors were more expensive to operate but the most compelling argument for switching was safety in the hands of a lower-skilled operator who no longer had to constantly watch gauges and adjust temperatures and pressures
Similar differences existed in the broader automotive market and the advent of the electric starter effectively ended consumer interest in EC steam cars
Still near the end of the steam car era Stanley Doble White and others offered technically-competitive options The Doble Model E (Figure 8) weighed more than 5500 pounds but achieved in the 1930s the same fuel economy of a comparable IC engine in a contemporary SUVmdash16 mpg The Doble was powered by a four-cylinder engine of 190 cubic inches displacement about the size of an Accord engine but the Doble weighed 67 percent more than the Accord As for emissions one Doble Model E (currently owned by Jay Leno) recently passed California emissions testing with no modifications16
14Henry Ford My Life and Work 1922 15Spencer Yost Antique Tractor Bible 1998 16ldquoJayos Garage 1925 Doble Series E Steam Carrdquo httpwwwjaylenosgaragecomat-the-garagesteam-cars1925-doble-series-e-steam-car
FEDERAL TRANSIT ADMINISTRATION 8
SECTION 2 TECHNOLOGY BACKGROUND
Figure 8 Doble Model E
Doble and Brooks also built passenger buses similar in capacity and weight to contemporary buses The Brooks shown in Figure 9 was powered by a 400-cubic-inch V8 steam engine and carried 29 passengers at 60 mph while turning at 2000 rpm As a cruel twist of fate the public unveiling of the Brooks Steam Bus was announced in October 1929 two weeks before the stock market crash and the onset of the Great Depression17 The company did not survive
Figure 9 Brooks Steam Motors Bus
17Wikipedia ldquoBrooks Steam Motorsrdquo httpenwikipediaorgwikiBrooks_Steam_Motors
FEDERAL TRANSIT ADMINISTRATION 9
SECTION 2 TECHNOLOGY BACKGROUND
The suitability of steam power for mass transit use can be seen from comparison of a very powerful contemporary Ford V-8 Diesel engine (from the Excursion SUV) to the Besler V-Twin Steam engine circa 1938
Ford Turbo Diesel Besler Steam Configuration V-8 V-2 Displacement (cuin) 445 80 Horsepower 175 150 Torque (ft-lbs) 420 1200 Engine wt w transmission (lbs) 930 80
The Besler is roughly one quarter the size and weight of the V-8 Turbo-Diesel but has equivalent horsepower and three times the available torque (the primary determinant of performance) The Detroit Diesel Series 60 six-cylinder engine commonly used in mass transit vehicles produces marginally more torque (1450 ft-lbs) than the Besler from twice the horsepower and with much more fuel
Steam engines make greater use of the energy contained in the fuel by separating the heating phase of the Carnot cycle from the expansion phase and metering fuel burn to more closely match demand A steam engine presents maximum torque at low speed and greater horsepower and torque than comparable IC engines
Another EC technology gaining resurgent interest is compressed air power Recent reports of collaboration between MDI of France and Tata Motors of India suggest a new approach toward EC engines18 Tata Motors a major producer of vehicles on the Indian subcontinent intends to produce the MDI Air Car in the near future with anticipated fuel economy of 106 mpg The latest iteration of the MDI Air Car shown in Figure 10 has a projected range of 848 miles from 8 gallons of fuel or 106 mpg for a 4-passenger vehicle weighing 1870 pounds19
The MDI City Car relies on a six-cylinder 75 HP engineexpander to achieve this performance and in the ldquoprocess [produce] emissions of only 0141 lbs of CO2
per mile That is hellip less than [half] the cleanest vehicle available todayrdquo (Toyota Prius 07 Emissions 034 lbs of CO2 per mile)
18Autobloggreen ldquoA New Agreement between Tata Motors and MDI Bring the Air-Car Closer to Realityrdquo March 21 2007 httpgreenautoblogcom20070321a-new-agreement-between-tata-motors-and-mdi-bring-the-air-car-cl 19Motor Development International (MDI) OneFlowAIR httpwwwmdiluenglishoneflowairphp
FEDERAL TRANSIT ADMINISTRATION 10
SECTION 2 TECHNOLOGY BACKGROUND
Figure 10 MDI Air Car
The schematic for the MDI power plant is shown in Figure 11 The stored air is heated to combustion temperatures and allowed to expand mechanically This is the practical definition of an EC engine where combustion provides heat but the working fluid or propellant is not generated by the combustion process itself
Separating the heating step from the expansion step does not in itself yield higher fuel economy or lower emissions But the regulation of fuel flow to maintain optimum propellant temperature immediately prior to expansion provides both maximum fuel economy and lowest possible emissions In contrast an IC engine ignites fuel at 1800degF and immediately conducts that heat away through its water jacket to drop cylinder temperatures to 200ndash300degF EC engines preserve that heat for useful work
Figure 11 MDI Air Engine
Schematic
FEDERAL TRANSIT ADMINISTRATION 11
SECTION 2 TECHNOLOGY BACKGROUND
Both air and steam engines provide an alternative to the conventional IC engine Both operate from a variety of fuels and offer the potential of lower emissions and higher fuel economy Steam is the more robust of the two (the Besler Steam Twin is much more energetic than the MDI six-cylinder) but the compressed air engine offers an operational simplicity and a lower weight because no boiler or condenser is required Unfortunately it can never provide the power and acceleration of steam
The best of both worlds would be a blending of air and steam into a single engine that offers all of the benefits but without the weight and heat management issues of a boiler and with significantly more power than an air engine alone
FEDERAL TRANSIT ADMINISTRATION 12
SECTION The Air-Steam 3 Hybrid Solution
Air and water are completely different in their physical properties except when they operate as working fluids at high temperatures and pressures At steam operating pressures and temperatures their behavior largely follows ideal gas behavior and each is miscible in the other at all proportions The arrow in Figure 12 indicates the rough path for expansion of the hot high-pressure propellant and shows near ideal gas behavior for steam at these elevated temperatures and pressures
Figure 12 Does Steam
Behave Like an Ideal Gas
Getting to steam operating temperatures and pressures requires that significantly more heat be applied to water than air at STP (standard temperature and pressure) Air requires only 642 kcalmole to reach these operating temperatures while water (steam) requires 5236 kcalmole (due to the 512 kcal heat of vaporization) In this development a baseline flow of air is used to entrain water into the heater section Fuel is consumed in direct proportion to the water fraction to maintain the heater at a near constant temperature The heat required to maintain ldquohot airrdquo temperatures is a small fraction of the heat required to maintain steam temperatures as shown in Figure 13
FEDERAL TRANSIT ADMINISTRATION 13
SECTION 3 THE AIR-STEAM HYBRID SOLUTION
Figure 13 Heat Required
to Raise Air and Water
Temperature to 1000degK
The compressed air fraction provides a safe and consistent flow pressure into the hot section The water once heated to working steam temperature provides a more robust working fluid
The hot mixed propellant is injected into the expander moving a piston and converting heat to motion The expanded propellant thereby drops to condensing temperatures allowing the water portion to drop to a sump for pumped return to the injector The expanded air fraction is then recompressed for return to the injector
The use of an air fraction allows for immediate injection of work-appropriate amounts of water into the hot section no boiler no steam under pressure no fuel wasted (heating steam without immediate purpose) The use of a water fraction (and proportional fuel flow) allows for variable power from a constant temperature system The binary (air-steam) propellant allows for a closed-loop condensing recovery system extending range and economy
Figure 14 Schematic of Injector Nozzle Used to Mix Air
and Water
FEDERAL TRANSIT ADMINISTRATION 14
SECTION 3 THE AIR-STEAM HYBRID SOLUTION
The sum of the process is as follows
Key start begins a modest fuel burn that immediately provides initial hot air flow through the engine
bull Depressing the accelerator increases the water fraction and fuel flow (in direct proportion)
bullThe vehicle moves forward under (airsteamfuel) power in direct proportion to wheel turn
bullThe hot mix expands and the expanded mix condenses the water fraction
bullA small parasitic load recompresses the small air fraction to reinjection pressures
bull Removing the foot from the accelerator returns the flow to hot air only sweeping residual moisture from the cylinders and preventing hydraulic lock (during next cold start)
The engine can operate on any fuel whose flow can be regulated (semi-solid liquid gas) Combustion occurs at high temperature at one atmosphere so much cleaner burning than internal combustion
Figure 15 Air-Steam Hybrid
Schematic
Accelerator regulates flow of air water and fuel to heater based on load and wheel speed Water and fuel are metered to maintain heater temperature within optimal performance band
Output demand determines air-water fraction
Any discussion of fuel efficiency relative to current IC engine technology must first re-emphasize the multi-fuel capability of EC engines In a market so dominated by one fuel customers have accepted the term ldquomiles per gallonrdquo
FEDERAL TRANSIT ADMINISTRATION 15
SECTION 3 THE AIR-STEAM HYBRID SOLUTION
as the basis for comparison But in an open market with many different fuels and widely different heat content (BTUlb) the only common and appropriate denominator is ldquomiles per dollarrdquo (closer to ldquofuel economyrdquo)
To the extent that any EC solution gains market acceptance and the market responds with new and different fuel blends the law of supply and demand dictates that fuel prices for all will drop Until then the remainder of this efficiency discussion will assume all engines require the same petroleum-based fuel
The long-accepted estimate of fuel efficiency for the IC engine is about 25 percent with the remaining 75 percent of the heat content dissipated in equal parts through the hot exhaust the radiator and mechanical losses in the engine Much has been done to raise that efficiency but what remains is one power stroke in four and a high temperature detonation whose heat content is quickly and intentionally dissipated through conduction
In sharp contrast a steam engine is designed to preserve as much heat as possible from combustion and then mete out that heat through the expansion of the working fluid Instead of a 25 percent heat loss through conduction through a radiator conductive loss is limited to 10 percent in efficient steam engines The greatest loss is through the vaporization of water to steam (at 30) yielding useful work of 35 or 40 percent higher than internal combustion Steam vehicles often report significantly lower practical fuel economies as the whole boiler is heated for a relatively short trip (another reason to avoid using a boiler)
Hot air engines involve no change of state therefore avoiding the loss associated with vaporization That can mean fuel efficiencies approaching 65 percent except as noted with the MDI engine a lower power-to-weight capability
The combination of air and steam into a single engine type is expected to yield economies between 35 and 65 percent varying with wheel load A 50 percent net efficiency would double fuel economy over a comparably-sized IC engine but as shown with the Doble and Besler examples the EC engine can be much smaller yielding even greater economies
FEDERAL TRANSIT ADMINISTRATION 16
SECTION 3 THE AIR-STEAM HYBRID SOLUTION
Figure 16 Fuel Efficiency
by Engine Type
Derivative Uses As much as this study is focused on large motive power applications it should be noted that an equally important opportunity for this technology is in stationary power applications similar in configuration to combined heat and power units referred to generally as micro-CHPs Rapid start-up high torque quiet operation and multi-fuel compatibility make it well suited to an integrated heat and electrical power installation
FEDERAL TRANSIT ADMINISTRATION 17
SECTION 3 THE AIR-STEAM HYBRID SOLUTION
Its ability to produce a full range of power options (mechanical pneumatic heat and through attached accessories electrical and hydraulic) in a small modular man-portable configuration also make it particularly well suited to temporary or tactical power requirements Although beyond the scope of the DOT goals for vehicular use this stationary power applicationrsquos potential may be strategically important in market acceptance and adoption by expanding the range of applications and thereby providing economies of scale in all aspects of development production and commercialization activities for all applications
FEDERAL TRANSIT ADMINISTRATION 18
SECTION BRASH Test Plan 4 This Phase I effort followed the Technical Objectives outlined in the proposal as follows
Practical Objectives 1 Modify the Smarttrade sized test vehicle (Figure 17) installing a 10ndash20 HP
equivalent heater a 650 cc displacement 2 HP (nominal) Quasiturbinetrade steam engine pressurized air and water tanks electronic flow regulation of air water and fuel via laptop-based LabVIEW software and solenoid valves
2 Perform test runs to validate the system operation and determine key baseline performance parameters such as
a minimum air fraction to maintain engine operation upper limits for operating temperatures maximum allowable flow rates for water (without reducing effective propellant flow at temperature)
b upper limits of vehicle speed while varying gross vehicle weight and course incline
3 Following baseline performance assessment further objectives included
a an analysis of component placement for ease of maintenance and replacement
b an estimation of comparable volumes and weights to an equivalent IC powertrain in order to verify retrofitability
c an estimation of effective fuel economy while using propane fuel on closed track mileage runs
Figure 17 Smarttrade
Car-Sized Test Vehicle
FEDERAL TRANSIT ADMINISTRATION 19
SECTION 4 BRASH TEST PLAN
4 Over the course of multiple test runs a cumulative assessment of component performance and reliability would lead to a gross verification of BRASH engine integrity and range That in turn could lead to off-site vehicle demonstrations to federal agencies potential industry partners and investors
Analytical Objectives 1 The BRASH engine model has been demonstrated only at a bench level with
rudimentary understanding of its operating principles A key objective in this vehicle build is to increase the thermodynamic modeling of this technology including an analysis of mass flow (air water fuel) and resulting power
2 Early test data would lead to analysis of specific on-vehicle capacities (for air water and fuel) and flow rates for same in order to estimate operating range recovery strategies and rates (recompression and condensation) and the parasitic loads (eg alternators pumps) to sustain useful operation for many hours
3 Over time the vehicle testing under various test conditions (eg varying gross vehicle weight wheel load engine temperature propellant mix) will lead to a body of data to support more complete modeling of water fraction vs torque vs temperature These data are essential to real-world estimation of fuel economy as this technology scales to larger practical vehicle applications
4 With the modeling from 3 in place for steady-state operation practical track runs with frequent starts and stops can further shape the model for real-world use
5 The analysis from steps 1ndash4 will provide sufficient basis for estimating the mass flow heat component capacity recovery factors and fuel economy for scaling this 2 HP test data to larger vehicles in two decade steps first to a 20 HP pickup truck and then further modeling and custom buildup of a 200 HP power plant with a DOT-identified industrial partner
6 This analytical plan is consistent with the overall SBIR program plan as the 2HP effort is confined to Phase I the 20 HP build and test plan would be accomplished in Phase II and the design and build of the 200 HP power plant would be accomplished in Phase III with an established industry partner
The work effort toward completion of these tasks has proceeded on two tracks mechanical modifications to the April test vehicle and electronic control and measurement
Mechanical Modifications and Test Configuration The test vehicle is a modified electric car about the size of a Smarttrade car Earlier modifications included removal of the electric drive train exposing a large working
FEDERAL TRANSIT ADMINISTRATION 20
SECTION 4 BRASH TEST PLAN
space behind the cab This rear space over the rear left wheel contains a 2HP Quasiturbinetrade steam engine20 selected for its compact design and suitable power range for this 700-pound vehicle The placement over the left wheel permits direct drive to that wheel via electric clutch and chain drive
Figure 18 Quasiturbinetrade
Rotary Expander Installed and Interior View
In the center of center of this rear space a heavily-modified propane space heater rated at 30000ndash80000 BTUhr (equivalent to 11ndash31 boiler horsepower [bhp]) was installed Heaters of this type generally are designed to efficiently distribute heat into an adjoining space This heater was heavily modified with high temperature insulation and outer shells to retain useful heat to the 20-ft stainless steel coil passing through its core
Figure 19 Quasiturbinetrade
Rotary Expander Installed and Interior View
the expander and heater (with recent refinements) Also visible under the heater is the pressurized water tank (painted grey) The open space to left of the heater is reserved for drive components The space to the right of the heater is reserved for recovery and recompression of the expanded propellant (Recompression is outside of the current scope to simplify the testing and analysis See discussion section for more information) Other system components include air cylinders and electronic controllers that are mounted forward of the rear firewall in the cab or under the front hood
Figure 20 shows the back of the vehicle with fenders and trim removed revealing
20Quasiturbinetrade Product Details httpquasiturbinepromciqcca
FEDERAL TRANSIT ADMINISTRATION 21
SECTION 4 BRASH TEST PLAN
Figure 20 Test Configuration
Figure 21 System Components
The main system components are shown Minor components and linkage tomechanical output are not included in this report for the sake of simplicity
Electronic Control and Measurement No realistic progress toward a vehicle demonstrator with known and regulated fuel use can proceed without electronic regulation In this build the LabVIEW program and system components from National Instruments were used to create a ldquoglass cockpitrdquo of vehicle controls and performance measurement21 The simplified schematic in Figure 22 shows the planned integration of electronics in this development LabView-compatible components will replace all mechanical flow and measurement components
21More information can be found at National Insturments The LabVIEW Environment httpwwwnicomlabview
FEDERAL TRANSIT ADMINISTRATION 22
SECTION 4 BRASH TEST PLAN
Figure 22 Electronics
Schematic for Air-Steam Hybrid
For the vehicle driver the dashboard collection of gauges has been replaced with a laptop screen similar to the one pictured in Figure 23
Figure 23 Front Screen Display for Air-Steam Hybrid
Certain features on this front screen will reflect user input (OnOff Throttle) while others reflect the dependent variables in the process (Heater Temp Fuel Flow Air and Water Flow) Shown on the bottom screen will be running time-series data on speed wheel load temperature specific fuel consumption and the other variables important to the analytical process The front screen display is generated from programming and controls on the back screen display
FEDERAL TRANSIT ADMINISTRATION 23
SECTION 4 BRASH TEST PLAN
Figure 24 Back Screen Display for Air-Steam Hybrid
LabVIEW software and controllers were chosen because of National Instrumentsrsquo status as the industry leader in rapid control prototyping and In-Vehicle data-logging solutions BKi purchased the LabVIEW componentry through the University of Connecticut Mechanical Engineering Department as part of UConnrsquos ongoing support of the project
By the end of the contract term in October 2010 the air and water regulation components were complete and operational but the fuel regulation and engine speed components were not yet fully operational To generate the most meaningful data under these circumstances the test vehicle was configured for extended operation to determine specific fuel water and air consumption rates The combination of these rates provided the basis for initial estimates of power and efficiency
Summary of Effort Mechanical Modifications
1 Removal of original electrical drive components reinforcement of frame
2 Installation of Quasiturbinetrade 2HP engine modified heater pressurized water tank all pneumatic water and fuel lines
3 Baseline validation testing using manual controls
4 Installation of electronically-regulated flow controllers
Electronic Modification 1 Acquisition of computer electronic regulators and control software
2 LabVIEW systems programming
3 System checkout
FEDERAL TRANSIT ADMINISTRATION 24
SECTION 4 BRASH TEST PLAN
Testing and Analysis 1 Static Safety Testing 2 Baseline vehicle drivetrain testing
3 Vehicle static testing (Runs 3 amp 5)
Summary of RequirementsGoals 1 Safe operation of vehicle during static and motive applications
2 Qualitative demonstration of BRASH engine capability to move test vehicle on flat and inclined road surface
3 Quantitative determination of air water and fuel consumption during timed static test
4 Quantitative determination of air water and fuel consumption while varyshying water and fuel fractions
Summary of Testing Two experiments were performed in late November the first to establish minimum fuel and propellant flow rates for sustained operation at low speed (air-rich mode) and the second to establish reasonable upper limits of fuel and propellant flow at higher engine speeds (steam-rich mode) Variation in the air-steam mix is the underlying theory of operation for the BRASH engine the air fraction provides a baseline flow for initial start-up and low-speed operation but the addition of water (as steam) to the propellant results in a significant boost in range and power These two tests have verified this underlying theory
Test Conditions The two test runs summarized in this report are 3 on November 22 2010 and 5 on November 26 2010 Both tests were performed at the Depot D campus of the University of Connecticut in Storrs The testing was performed outside in seasonal conditions 45-50degF with light winds
Figure 25 Vehicle Test Setup
FEDERAL TRANSIT ADMINISTRATION 25
SECTION 4 BRASH TEST PLAN
Each run was a dynamic test with no load on the two-cylinder Quasiturbinetrade engine The propane cylinder was suspended from a scale for the duration of the test Propane fuel consumption was monitored continuously by digital scale with a display accuracy of 001kg
Each test run lasted for the duration of one high pressure air cylinder Air cylinder start (full) and end (empty) were determined at the start and finish of each run using the same scale and accuracy Water levels initially were determined volumetrically but the results were too inconsistent Displaced volume of liquid water proved a poor measure of the quantity heated to steam and carried forward for productive work For this reason water is an estimated quantity based upon fuel quantity burned less heat absorbed by the air fraction (Further integration of the LabView controller software in the next phase will obviate this work-around)
Each of the complete test runs may be viewed at Brash Engines website httpwwwbrashenginescom Photos from each run appear in the figures that follow Tables 1 and 2 summarize the productive mass flow for air water and propane fuel to produce work from the engine for the test duration
The cab interior in Figure 26 shows the high pressure air cylinder below the steering wheel and the laptop computer (regulating propellant flow) in passenger seat space The LabView controllers reside in the protective case under the laptop
Figure 26 Vehicle Cab with Controller Laptop
During each test hot propellant was allowed to expand and vent to ambient in order to simplify the thermodynamic model and analysis (Note the plumes of water vapor from each exhaust hose and the small puddles of water under each hose in Figure 27)
FEDERAL TRANSIT ADMINISTRATION 26
SECTION 4 BRASH TEST PLAN
Figure 27 Exhaust Plumes from Expander
Development plans include recovering the expanded propellant separating into water and air phases and then recompressing the air fraction for re-use This will both improve efficiency and eliminate the visible vapor plume
Test Assumptions Another estimation used in this study is the efficiency of heat transfer for the propellant through the 20-ft coil of stainless steel inside the insulated heater Figure 28 shows an early ldquoair-onlyrdquo test run with the current heater The hose failure and melting of the steel wire mesh inside (note formed ball in the mesh) indicates 1300degK temperatures exiting the hot section
Figure 28 Hose Failure Due
to Overheating
FEDERAL TRANSIT ADMINISTRATION 27
SECTION 4 BRASH TEST PLAN
Effective heat transfer (as Figure 28 shows) does not equal efficient heat transfer but the ability to deliver 1300degK air from a well-insulated burner suggests a highly efficient transfer of heat The analysis of results assumes a value of 90 efficiency (See Appendix A for a discussion of heat transfer efficiency)
3 Low Speed Test On November 22 2010 Run 3 tested the lower operating limits of the test setup Low limit in this context meant sufficient pressure to maintain expander rotation but low steam and fuel burn The test commenced with a full air cylinder weighing 661 Kg At the end of the test the empty cylinder weighed 460 Kg Over the 7 minutes and 15 seconds of testing 006 Kg of propane was consumed
The mass of air and fuel was determined from before after run test weights As stated earlier determining the quantity of steam produced from the pressurized water tank was problematic because of the quantity of stored water the resistance to water flow under dynamic pressures and the potential for some fraction of the water (in liquid state) to be entrained in the propellant mix
To solve for this unknown the energy required to raise the known quantity of air from ambient to 1000degK (33kcalmol or 0467 BTUg) was subtracted from the energy content of the propane consumed (44 BTUg) and then the efficiency of the heat transfer process was de-rated by 10 percent to yield a net quantity of 1438 BTUs to elevate ambient temperature water to 1000degK steam The result is an estimated 125 grams of water consumed in the 7-minute test
Table 1 summarizes these data and shows a high reliance on the air fraction for the work performed by the 2 HP engine The air cylinder used in this test has a measured free volume of 45 cubic feet (1274 liters at STP) which means sustained flow rates of 62 cubic feet per minute (cfm) or 175 liters per minute In contrast the 125 grams of water passed through as steam produced an estimated equivalent gas volume of 155 liters at STP Note the modest levels of water vapor in Figure 29 Why the greater air fraction relative to water flow in this test
Air (Wt 000Kg) 661 460 201 938 1294 30 36
Water2
(Wt 000Kg)
Propane(Wt 000Kg)
Time (hrmnsc)
1562
123000
1556
123715
00125
006
00715
1438
2640
na
1983
364
na
47
86
54
90
1 Energy value based upon absorbed heat (italicized) from STP to 1000degK (0446 BTUg for Air 115 BTUg water) 2 Determined by difference from propane and air energy assumed value 90 3Arbitrary estimated efficiency of heat transfer not effective work
11222010 - 3 Low Speed Run Air Pressure 60 psi Water Head Pressure 60 psi
Component(BTU) Start End Net Energy1
(BTU) Power
(BTUmin) Power (HP) Efficiency3
Table 1 Analysis of Mass
Flow Data at Low Speed
FEDERAL TRANSIT ADMINISTRATION 28
SECTION 4 BRASH TEST PLAN
Figure 29 Low-Speed Test Results in Little
Water Vapor
In this baseline experiment the single cylinder provides 60 psi air flow and 60 psi static ldquoheadrdquo pressure on the water column The air flow from the cylinder is biased toward the generally less restrictive flow path for air The water column under the same pressure presents a higher viscosity medium passing through a greater number of valves and restrictions At the point of injection the air fraction flows more freely into the hot section In order to bias the mix toward greater water fraction (and greater power) the head pressure on the water column must be increased over the 60 psi air line pressure
Run 4 (not documented here) evaluated head pressures from 110 psi to 70 psi and determined that modest differential pressures retarded the flow from the air fraction and boosted flow of the water fraction Still higher differential pressures effectively stopped air flow altogether reverting the engine operation to ldquosteam onlyrdquo For Run 5 an additional cylinder was used to apply a 70 psi static head pressure on the water column a 10 psi differential over the 60 psi air line pressure
5 Variable High Speed Test On November 26 2010 Run 5 tested the higher differential water pressure as a means to increase the effective water fraction in the propellant mix The test commenced with a full air cylinder weighing 654 Kg At the end of the test the empty cylinder weighed 472 Kg Run 5 was interrupted after 243 minutes to refill the water tank and then testing resumed for an additional 907 minutes Over the whole test 027 Kg of propane was consumed
Using the same analytical basis as Test 3 Test 5 data indicate a substantial increase in work capacity (as measured by fuel consumed and steam generated) over the 3 baseline
FEDERAL TRANSIT ADMINISTRATION 29
112610 - 5 Variable High Speed Run Air Pressure 60 psi Water Head Pressure 70 psi
Air (Wt 000Kg)
Component(BTU) Start End Net Energy1
(BTU) Power
(BTUmin) Power (HP) Efficiency3
654 472 182 849 718 17 7
SECTION 4 BRASH TEST PLAN
Table 3 Comparison of Mass Flows
Water 588 Runs 3 and 5
163 Duration (mn) 725 1180 725 1180 163
Air
Component Run 3 BHP
Run 5 BHP
Net ChngBHP
Run 5 Mass
Transfer (kg)
Net ChangeMass
Transfer (kg)
30 17
197
237
-45 2010 182 -9
Run 3 Mass
Transfer (kg)
276 350
47
86
422
0060
0013
0270
0086
Propane
This difference in steam fraction and power is more clearly seen in Figure 30 (and on the source video at the Brash Engines website)
Figure 30 Three Images from Run 5
Table 2 Test 5 Results with Increased
Water and Fuel Water2
(Wt 000Kg) 0860 9890 8358 197 83
Propane(Wt 000Kg) 1520 1493 27 11880 1004 237 90
Time (hrmnsc) 133000 134150 01150 na na na na
1 Energy value based upon absorbed heat (italics) from STP to 1000degK (0446 BTUg for Air 115 BTUg water) Underlined value is released heat at generally accepted 44 BTUg 2 Determined by difference from propane and air Energy assumed value 90 3 Arbitrary estimated efficiency of heat transfer not effective work
The increase in pressure on the water column by 10 psi reduced air flow by 9 percent but increased the steam fraction considerably and thereby increased the effective boiler horsepower nearly three-fold to 237 bhp (assuming 90 heat transfer) These data are summarized in Table 3
FEDERAL TRANSIT ADMINISTRATION 30
SECTION 4 BRASH TEST PLAN
As with Run 3 start up from Time Zero was immediate burner on air flow begins and water flow under pressure commences immediately Another impressive feature of the mix air-steam propellant system is the ability to start stop and rapidly accelerate as shown in the full Run 5 video Run 5 serves as validation that this patented technology has unique performance benefits over air steam or internal combustion alone
Lessons Learned A comparison of the two test runs verifies some key points
1 The same power plant can produce variable power and fuel economy based upon power demand and airsteam mix
2 Although imprecise at this point in testing fuel consumption appears directly proportional to engine speed The engineexpander will spool up spool down stop and restart in a manner consistent with fuel and propellant flow The Run 5 video on the Brash Engines website verifies this conclusion
3 The use of a defined static air pressure ldquoheadrdquo over the water column at a pressure higher than the defined air line dynamic pressure provides a safe and predictable bias toward flow from the water fraction
4 Although the current test configuration offers sufficient performance for this initial demonstration phase the following observations are in order
a The heater path is too long creating latent response issues
b The airwater injector is not optimized for proper mix or flow capacity
c The incomplete integration of LabVIEW compromises the quality of data
d The absence of a measured variable load on the expander compromises any analysis of power and fuel economy
5 The design migration to a vehicle installation was premature The project should move back to a lab bench study to refine the regulation of components complete the recovery and recompression portions of the system and use electromechanical loads to estimate power and useful work for specific quantities of fuel water and air
6 The Quasiturbinetrade engine technology is promising but too immature for larger-scale modeling Later phases of the project should rely on more conventional multi-cylinder piston-type expander
Estimated Fuel Economy Mass transit authorities have relied on large diesel engines such as the Detroit Diesel Series 50 and Series 60 engines for more than 30 years Reports on fuel economy vary from a high of 60 miles per gallon (Diesel) for longer-range
FEDERAL TRANSIT ADMINISTRATION 31
SECTION 4 BRASH TEST PLAN
commuter services in California23 to a low of 228 miles per gallon (Diesel) for city buses with frequent stops in New York City24 In both cited studies the migration to compressed natural gas (CNG) has resulted in lower fuel economies on a Diesel Gallon Equivalent (DGE) basis
Table 4 summarizes this study (columns 2 and 3) and the next proposed phase (columns 4 and 5) the performance of the current fleet of mass transit buses (columns 6 and 7) and the likely outcome if the Besler engine (described earlier) were employed with the air-steam hybrid technology (columns 8 and 9)
Table 4 Comparison of
Fuel Economies
Air
1
Configuration
Engine
HP
Torque
Fuel
gmin
BTUhr
GGEhr
mpg 60mph
GGE100 mi
$ per GGE
$100 mi
Current
Example
2
3
3
5
4
Bench
5
S-10
6
SB Bus
7
NYCT
8
50 eff
9
30 eff
86
Quasi
2
Prop
82
216
02
3160
03
30
09
Current
237
Quasi
2
Prop
23
607
05
1126
09
30
27
UC 1
40
6 cyl
20
Prop
40
1056
09
648
15
30
46
UC 2
80
6 cyl
40
Mix
80
2112
19
324
31
30
93
MCI102
DD S60
350
1450
Diesel
540
11400
100
60
167
35
583
Diesel
23
439
35
1535
300
Besler
150
1200
Mix
300
792
695
864
1158
16
1853
500
Besler
150
1200
Mix
500
1320
1158
518
1930
16
3088
The Besler engine is shown in two columns The left column reflects the higher efficiency anticipated with the air-steam hybrid mix described earlier as at or near 50 percent The right column reflects the historical efficiency realized with steam engine technology The italicized numbers near the bottom of the column show that even at historical efficiencies the Besler engine would offer equal or better Gasoline Gallon Equivalent (GGE)100 mile ratings of the current diesel technology but migrating toward less refined and (therefore) less expensive fuels would significantly reduce the operating cost ($mile)
23Demonstration of Caterpillar C-10 Dual-Fuel Engines in MCI 102DL3 Commuter Buses National Renewable Energy Laboratory httpwwwnrelgovdocsfy00osti26758pdf p 7 24R Barnitt ldquoNew York City Transit (NYCT) Hybrid (125 Order) and CNG Transit Buses Final Evaluation Resultsrdquo November 2006 National Renewable Energy Laboratory K Chandler Battelle Technical Report NRELTP-540-40125 November 2006 httpwwwnrelgovvehiclesandfuelsfleettestpdfs40125pdf pvii
FEDERAL TRANSIT ADMINISTRATION 32
SECTION 4 BRASH TEST PLAN
There are of course two orders of magnitude difference between the results of Runs 3 and 5 and the daily demands of city and commuter buses but the mere existence of the Besler Twin and the Brooks V-8 400 HP engine suggests an opportunity for fuel economy and fuel variety
Proposed further support for the next phase of development will advance the air-steam hybrid technology by an important order of magnitude This would provide the data confidence to scale to larger vehicle operation and garner the interest of one or more engine or vehicle OEMs
Figure 31 MTANew York City
Transit Orion VII Next Generation
Hybrid Transit Bus
Next Development Phase The next phase of development will incorporate a modern six-cylinder steam engine design with a displacement of 53 cubic inches and capable of sustained 15-25 HP operation The expander will be supplied by Steam Engine Power Inc (httpwwwsteamenginepowercom) This expander will drive an alternator generator to measure effective work output in watts as well as provide sufficient power to satisfy the system parasitic loads of battery recharge exhaust air recompression and all other pump and valve operations
Figure 32 (l to r) Six-Cylinder Expander Power Generation Load
Small 24 VDC Compressor
FEDERAL TRANSIT ADMINISTRATION 33
SECTION 4 BRASH TEST PLAN
Static pressure for the water column will still be supplied via compressed air cylinder but the dynamic air flow will be supplied by an oil-less air compressor of the size and type shown This 24 VDC compressor will recompress the recovered air exiting the expander to 40ndash60 psi pressure and support flows of 3ndash4 cubic feet per minute (cfm) These three components are off-the-shelf enhancements to the system but custom engineering of a new more powerful and more responsive heater completion of the electronic integration and design and fabrication of the recoveryrecompression components are necessary tasks that must be included to make the next generation assembly work to its potential This work will be accomplished largely by Mechanical and Electrical Engineering students at the University of Connecticut under the supervision of faculty and Brash Engines personnel
When this build is complete all operations will be under LabVIEW control All expander operations will be measured for power and work Once the bench version is in control a modified version will be installed in a small pickup truck (eg Chevrolet S-10) for further verification of system performance and robustness
During this phase a new and promising technology will be investigated a new and faster class of solenoid valves from National Instruments These solenoid valves with an unprecedented 3 msec response time have the potential of allowing air-steam retrofit in existing engine blocks The solenoid valves could replace the spark plugs in conventional IC engines and provide the equivalent timed injection of hot propellant mix as the timed firing of a spark plug in the presence of a fuel air mix
If possible these fast solenoids and the black box programming to control them could allow very easy portability to larger vehicles and easier retrofit Potentially a V-6 engine could operate 4 cylinders for expansion and the remaining two cylinders could be used as direct drive compressors with different but equivalent solenoid valves controlling the compression process
FEDERAL TRANSIT ADMINISTRATION 34
SECTION Development Plan 5 and Next Steps
This current effort is a key first-proof of concept for this air-steam hybrid technology but our goals extend well beyond this two-seat 2 HP demonstrator The lessons learned in electronic integration will allow rapid migration to larger platforms using the same basic controls but scaling the expander heater and other mass-flow components to vehicle-appropriate size That project identified as ldquo20 HP Vehiclerdquo and other near-term derivative projects are listed in Table 5
BRASH Project
ProposedFunding Source
Funds Reqd $K Project Description
SUV-size proof-of-concept for reliable 20 HP Vehicle DOTUSPS 300 highway performance maildelivery
vehicle size
Proof-of-concept mass transit busshy200 HP Vehicle DOTDOD 600 retrofit scaled to city bus capacity and
suitable for replacement of over-the-road diesel engines
Table 5 Project Funding
Stationary Power Unit Micro-CHP Equivalent
DARPA 300 Proof-of-concept mass transit bus-retrofit scaled to city bus capacity and suitable for replacement of over-the-road diesel engines
Summary Alternative Processed Solid Fuel DOE EPA DOA 600
Processed mix of hydrolyzed wood pulp processed solid waste and other combustible solids in an extrudable mass with alcohol solutevehiclemdashdemonstrate utility in vehicles as a high energy content clean burning fuel for EC engines
Demonstrate effective pyrolysis of
Binary Solid Gas Fuel
EPA Waste Management BFI
400 processed solid fuels in a binary fuel burner conventional fuel (gasoline natural gas) provides primary heat source for pyrolysis temperatures
Proof of Concept OEM Power Plant
Vehicle OEM (eg Ford GM Caterpillar) 1200
Development of direct replacement BRASH engine alternative to existing OEM IC engine
Black Box Integration of Controller Software
Vehicle OEM (eg Ford GM Caterpillar)
1600 Development of commercial BRASH system alternative to existing OEM IC engine
FEDERAL TRANSIT ADMINISTRATION 35
SECTION 5 DEVELOPMENT PLAN AND NEXT STEPS
The issuance of US Patent 7743872 five months ago has two important consequences for this project First it serves to validate the underlying technology the combination of air and steam in an EC engine is better than steam or air alone Second it provides a basis for full and open discussions with government agencies and large commercial interests in the transportation and power sectors
Our efforts at promotion have been delayed pending successful demonstration of the Smarttrade car vehicle to allow the first detailed real-world performance data to be distributed
Coupling that performance data with the option of migration away from refined petroleum should spark significant interest If we can move to a high lignin-processed wood pulp that costs $045 per gasoline gallon equivalent (an arbitrary value for example only) and consumes more CO2 while growing than is consumed in processing as a fuel and produced from combustion then we succeed as a project and as a global game-changing technology for many uses Improvements in fuel economy are important but of greater importance is the migration to low-process biomass fuels
FEDERAL TRANSIT ADMINISTRATION 36
SECTION Potential Applications and Societal Value 6 The whole premise behind the BRASH air steam hybrid is that external combustion offers a more benign and environmentally-appropriate way to power large vehicles and other portable equipment than refined petroleum-powered internal combustion
bullCombustion heat can be derived from any fuel source including processed solids from fast-growing renewables such as poplar trees waste corn stalks or switch grass
bullThat combustion heat is applied at a rate consistent with the work to be done and not to support idling and other unproductive fuel use
Using a mix of air and steam as working fluids in the engine allows
bullImmediate startup from an ldquoair-onlyrdquo start
bull Managed system pressure through use of a defined head air pressure
bullManaged fuel burn as the air-steam fraction is adjusted to match wheel load
bullAdjusted wheel load reduces fuel burn
Integration of modern control circuitry with external combustion also brings a level of performance operational simplicity and safety heretofore unavailable
FEDERAL TRANSIT ADMINISTRATION 37
SECTION
7 Phase I Conclusions
The last steam train in scheduled service in the US departed on October 11 196225 One year earlier Robert Noyce received the first patent for an integrated circuit26 But for that brief one-year overlap the most powerful motive power technology was never harnessed by the black box controls that grew out of Noycersquos invention so the diesel-powered IC engine championed by Henry Ford won out
Now nearly 50 years later the modern IC engine cannot operate efficiently without the benefit of black box electronicsmdashbut that technology still presents intractable challenges of supply safety and environmental impact The air-steam hybrid technology may offer an alternative and a glimpse of that potential is presented here and viewable in Run 5 on the Brash Engines website at http wwwbrashenginescom
While demonstration in a test vehicle provides a strong visual message that BRASH technology works the commercial success of this technology will depend upon reliable repeatable measurement of power and economy For that data the Phase 2 effort will require a return to laboratory bench testing and effective demonstration of recovery of the water and air fractions
The results of this Phase I project collectively demonstrate the technical feasibility and commercial potential of the BRASH air-steam hybrid engine technology The initial DOT SBIR funding has been highly effective in facilitating this important proof of concept and laying the groundwork for further technology refinement and application
As described earlier the next steps are clear and appear to combine achievable and rapid major advances with low developmental risk SBIR Phase 2 support is needed for those advances due to the still-early stage of development that restricts access to private capital
The immense potential value of this technology has been enhanced and verified in Phase 1 there is now a clear and low-risk path ahead to larger-scale testing further component and controls refinement specific applications prototyping and pre-commercial deployments
25William Rosen The Most Powerful Idea in the World Random House 2010 p 311 26US Patent 2981877
FEDERAL TRANSIT ADMINISTRATION 38
APPENDIX
A Heat Transfer Efficiency Modeling Runs 3 and 5 50 and 90
Much of the analysis for Runs 3 and 5 is based on an assumed efficiency of 90 for heat transfer from the combustion of propane to heating of the water air mix in the coil As a test for the reasonableness of that assumption the same data have been modeled at a much lower 50 factor below
112210 - 3 Low Speed Run Air Pressure 60 psi Water head pressure 60 psi
Water2 00440 5060 4276 101 43 (Wt 000Kg)
Propane 152 1493 237 50 27 11880 1004 (Wt 000Kg)
Time 133000 134150 01150 na na na na (hrmnsc)
1 Energy value based upon absorbed heat (italics) from STP to 1000degK (0446 BTUg for Air 115 BTUg water) Underlined value is released heat at generally accepted 44 BTUg
Air (Wt 000Kg)
Component(BTU) Start Wt End Wt Net Wt Energy1
(BTU) Power
(BTUmin) Power (HP) Efficiency3
661 460 201 938 1294 30 36
Water2
(Wt 000Kg)
Propane(Wt 000Kg)
Time (hrmnsc)
1562
123000
1556
123715
00125
006
00715
380
2640
na
523
364
na
12
86
14
50
na na
Air (Wt 000Kg)
Component(BTU) Start Wt
5 Variable High Speed Run Air Pressure 60 psi Water head pressure 70 psi
End Wt Net Wt Energy1
(BTU) Power
(BTUmin) Power (HP) Efficiency3
654 472 182 849 718 17 7
2 Determined by difference from Propane and Air Energy assumed value 90 3 Arbitrary estimated efficiency of heat transfer not effective work
The two known quantities in each run is the weight of the air moving through the system and the weight of the propane heating that air The variable is the quantity of water heated to steam temperatures and above In Run 3 at 90 efficiency that mass of water calculates to 125 grams at 50 it drops to 33 grams In Run 5 at 90 efficiency that mass of water calculates to 86 grams at 50 it drops to 44 grams
FEDERAL TRANSIT ADMINISTRATION 39
APPENDIX A HEAT TRANSFER EFFICIENCY MODELING RUNS 3 AND 5 50 AND 90
As the comparison tables below show the uncertainty in the efficiency of heat transfer is manifest only in the mass of water heated to steam to do useful work
Data 90 Efficiency
Air
Component Run 3 BHP
Run 5 BHP
Net ChngBHP
-45
Run 3 Mass
Transfer (kg)
Run 5 Mass
Transfer (kg)
Net ChangeMass
Transfer (kg)
30 17
197
237
2010 182 -9
Water
Propane
Duration (mn)
47
86
725
422
0060
0013
725
0270
0086
1180
588
350
163 1180
276
163
Data 50 Efficiency
Air
Component Run 3 BHP
Run 5 BHP
Net ChngBHP
-45
Run 3 Mass
Transfer (kg)
Run 5 Mass
Transfer (kg)
Net ChangeMass
Transfer (kg)
30 17
101
237
2010 182 -9
Water
Propane
Duration (mn)
12
86
725
817
0060
0003
725
0270
0044
1180
1233
350
163 1180
276
163
Regardless of the specific efficiency Run3 reflects an air-rich propellant mix while Run 5 was clearly the more powerful and steam-rich propellant If 50 efficiency is a more realistic figure than 90 the only consequence is more water passing through the heater expander and recovery tank The only consequence for overall system efficiency is the slight but added work required to move the additional water by pump to the top of the water column
FEDERAL TRANSIT ADMINISTRATION 40
APPENDIX Acronyms B
BHP Boiler Horsepower
BRASH Binary Recovery Air-Steam Hybrid
BTU British Thermal Unit
CC Cubic centimeter
CFM Cubit feet per minute
CHP Combined heat and power
CNG Compressed natural gas
CO2 Carbon dioxide
CU Cubic
DARPA Defense Advanced Research Projects Agency
DGE Diesel gallon equivalent
DOT Department of Transportation
EC External combustion
EIA Energy Information Administration
EPA Environmental Protection Agency
FTA Federal Transit Administration
GGE Gasoline gallon equivalent
HP Horsepower
IC Internal combustion
K Kelvin
Kcal Kilocalorie
MPG Miles per gallon
MPH Miles per hour
OEM Original equipment manufacturer
PSI Pounds per square inch
RPM Revolutions per minute
SBIR Small Business Innovation Research
STP Standard temperature and pressure
FEDERAL TRANSIT ADMINISTRATION 41
FEDERAL TRANSIT ADMINISTRATION 128
US Department of TransportationFederal Transit AdministrationEast Building1200 New Jersey Avenue SEWashington DC 20590httpwwwftadotgovresearch
US Department of Transportation Federal Transit Administration East Building 1200 New Jersey Avenue SE Washington DC 20590 httpwwwftadotgovresearch
FEDERAL TRANSIT ADMINISTRATION 42
- Button1
- Button2
- Button3
- Button4
- Button5
- Button6
- Button7
- Button8
- Button9
- Button10
- Button11
- Button12
- Button13
- Button14
- Button15
- Button16
- Button17
- Button18
- Button19
- Button20
- Button21
- Button22
- Button23
- Button24
- Button25
- Button26
- Button27
- Button28
- Button29
- Button30
- Button31
- Button32
- Button33
- Button34
- Button35
- Button36
- Button37
- Button38
- Button39
- Button40
- Button41
- Button42
- Button43
- Button44
- Button45
- Button46
- Button47
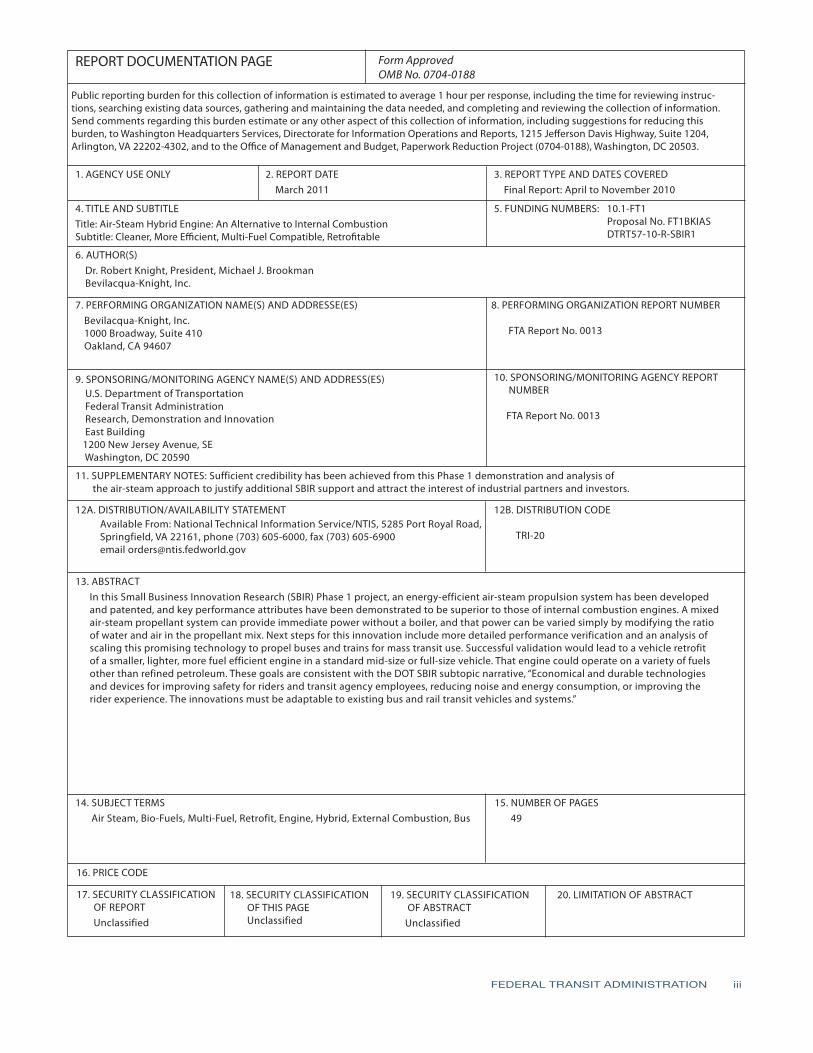
FEDERAL TRANSIT ADMINISTRATION iii
REPORT DOCUMENTATION PAGE Form Approved OMB No 0704-0188
Public reporting burden for this collection of information is estimated to average 1 hour per response including the time for reviewing instrucshytions searching existing data sources gathering and maintaining the data needed and completing and reviewing the collection of information Send comments regarding this burden estimate or any other aspect of this collection of information including suggestions for reducing this burden to Washington Headquarters Services Directorate for Information Operations and Reports 1215 Jefferson Davis Highway Suite 1204 Arlington VA 22202-4302 and to the Office of Management and Budget Paperwork Reduction Project (0704-0188) Washington DC 20503
1 AGENCY USE ONLY 2 REPORT DATE March 2011
3 REPORT TYPE AND DATES COVERED Final Report April to November 2010
4 TITLE AND SUBTITLE Title Air-Steam Hybrid Engine An Alternative to Internal Combustion Subtitle Cleaner More Efficient Multi-Fuel Compatible Retrofitable
5 FUNDING NUMBERS 101-FT1 Proposal No FT1BKIAS DTRT57-10-R-SBIR1
6 AUTHOR(S) Dr Robert Knight President Michael J Brookman Bevilacqua-Knight Inc
7 PERFORMING ORGANIZATION NAME(S) AND ADDRESSE(ES) Bevilacqua-Knight Inc 1000 Broadway Suite 410 Oakland CA 94607
8 PERFORMING ORGANIZATION REPORT NUMBER
FTA Report No 0013
9 SPONSORINGMONITORING AGENCY NAME(S) AND ADDRESS(ES) US Department of Transportation Federal Transit Administration Research Demonstration and Innovation
East Building 1200 New Jersey Avenue SE
Washington DC 20590
10 SPONSORINGMONITORING AGENCY REPORT NUMBER
FTA Report No 0013
11 SUPPLEMENTARY NOTES Sufficient credibility has been achieved from this Phase 1 demonstration and analysis of the air-steam approach to justify additional SBIR support and attract the interest of industrial partners and investors
12A DISTRIBUTIONAVAILABILITY STATEMENT Available From National Technical Information ServiceNTIS 5285 Port Royal Road Springfield VA 22161 phone (703) 605-6000 fax (703) 605-6900 email ordersntisfedworldgov
12B DISTRIBUTION CODE
TRI-20
13 ABSTRACT In this Small Business Innovation Research (SBIR) Phase 1 project an energy-efficient air-steam propulsion system has been developed and patented and key performance attributes have been demonstrated to be superior to those of internal combustion engines A mixed air-steam propellant system can provide immediate power without a boiler and that power can be varied simply by modifying the ratio of water and air in the propellant mix Next steps for this innovation include more detailed performance verification and an analysis of scaling this promising technology to propel buses and trains for mass transit use Successful validation would lead to a vehicle retrofit of a smaller lighter more fuel efficient engine in a standard mid-size or full-size vehicle That engine could operate on a variety of fuels other than refined petroleum These goals are consistent with the DOT SBIR subtopic narrative ldquoEconomical and durable technologies and devices for improving safety for riders and transit agency employees reducing noise and energy consumption or improving the rider experience The innovations must be adaptable to existing bus and rail transit vehicles and systemsrdquo
14 SUBJECT TERMS Air Steam Bio-Fuels Multi-Fuel Retrofit Engine Hybrid External Combustion Bus
15 NUMBER OF PAGES 49
16 PRICE CODE
17 SECURITY CLASSIFICATION OF REPORT
Unclassified
18 SECURITY CLASSIFICATION OF THIS PAGE
Unclassified
19 SECURITY CLASSIFICATION OF ABSTRACT
Unclassified
20 LIMITATION OF ABSTRACT
FEDERAL TRANSIT ADMINISTRATION iii
TABLE OF CONTENTS
1 Executive Summary 3 Section 1 Context for BRASH Societal Challenges and Needs 8 Section 2 Technology Background
13 Section 3 The Air-Steam Hybrid Solution 17 Derivative Uses 19 Section 4 BRASH Test Plan 19 Practical Objectives 20 Analytical Objectives 20 Mechanical Modifications and Test Configuration 22 Electronic Control and Measurement 24 Summary of Effort 25 Summary of RequirementsGoals 25 Summary of Testing 25 Test Conditions 27 Test Assumptions 28 3 Low Speed Test 29 5 Variable High Speed Test 31 Lessons Learned 31 Estimated Fuel Economy 33 Next Development Phase 35 Section 5 Development Plan and Next Steps 37 Section 6 Potential Applications and Societal Value 38 Section 7 Phase I Conclusions 39 Appendix A Heat Transfer Efficiency Modeling Runs 3 and 5 50 and 90 41 Appendix B Acronyms
FEDERAL TRANSIT ADMINISTRATION iv
LIST OF FIGURES
1 Figure 1 Energy Usage in the United States 2 Figure 2 Simplified Model of Air-Steam Hybrid Engine 3 Figure 3 Historic Crude Oil Prices Source Energy Information Administration 4 Figure 4 Projections of World Oil Production 4 Figure 5 Measured Atmospheric CO2
5 Figure 6 Global Warming Projections 6 Figure 7 US Energy Consumption by Fuel (1980ndash2035) 9 Figure 8 Doble Model E 9 Figure 9 Brooks Steam Motors Bus
11 Figure 10 MDI Air Car 11 Figure 11 MDI Air Engine Schematic 13 Figure 12 Does Steam Behave Like an Ideal Gas 14 Figure 13 Heat Required to Raise Air and Water Temperature to 1000degK 14 Figure 14 Schematic of Injector Nozzle Used to Mix Air and Water 15 Figure 15 Air-Steam Hybrid Schematic 17 Figure 16 Fuel Efficiency by Engine Type 19 Figure 17 Smarttrade Car-Size Test Vehicle 21 Figure 18 Quasiturbine Rotary Expander Installed and Interior View 21 Figure 19 Heater Installed (Early Configuration) Insulation to Retain Heat Inner Coil 22 Figure 20 Test Configuration 22 Figure 21 System Components 23 Figure 22 Electronics Schematic for Air-Steam Hybrid 23 Figure 23 Front Screen Display for Air-Steam Hybrid 24 Figure 24 Back Screen Display for Air-Steam Hybrid 25 Figure 25 Vehicle Test Setup 26 Figure 26 Vehicle Cab With Controller Laptop 27 Figure 27 Exhaust Plumes from Expander 27 Figure 28 Hose Failure Due to Overheating 29 Figure 29 Low Speed Test Results in Little Water Vapor 30 Figure 30 Three Images from Run 5 33 Figure 31 MTANew York City Transit Orion VII Next Generation
Hybrid Transit Bus 33 Figure 32 Six-Cylinder Expander Power Generation Load Small 24 VDC Compressor
LIST OF TABLES
28 Table 1 Analysis of Mass Flow Data at Low Speed 30 Table 2 Test 5 Results with Increased Water and Fuel 30 Table 3 Comparison of Mass Flows Runs 3 and 5 32 Table 4 Comparison of Fuel Economies 35 Table 5 Project Funding Summary
FEDERAL TRANSIT ADMINISTRATION v
EXECUTIVE SUMMARY
More than one quarter of all energy consumed in the US is used to support the transportation sector and as shown in Figure 1 nearly all of that transport energy is derived from petroleum1
Why does transportation rely nearly exclusively on petroleum when other sectors rely primarily on other sources of energy A major part of the answer lies in the timed ignition needs of internal combustion engines which require a highly-refined and volatile fuel to provide timely detonation of the fuelair mixture
Figure 1 Energy Usage in
the United States
However the detonation of refined fuels is not a necessary condition to produce useful prime-mover work That work can be extracted from heat alone and that heat can be generated from semi-solid bio-fuels if the work is performed by an external combustion (EC) engine
EC engines have been in use for centuries and still produce 80 percent of electrical capacity in the US2 but EC engines have been disfavored for transportation applications because of startup delay constant ldquotendingrdquo and perceived lower fuel economy The patented BRASH (Binary Recovery Air-Steam Hybrid)
1ldquoPetroleum Basic Statisticsrdquo September 2008 Energy Information Administration US Department of Energy October 14 2008 httpwwweiadoegovbasicsquickoilhtml 2ldquoNet Generation by Energy Source Total (All Sectors)rdquo March 11 2011 US Dept of Energy Energy Information Administration Energy Source Table httpwwweiadoegovcneafelectricityepmtable1_1html
FEDERAL TRANSIT ADMINISTRATION 1
EXECUTIVE SUMMARY
engine technology resolves each of these concerns and presents the first clear alternative to internal combustion in more than 50 years It is projected to produce higher fuel efficiency greater power and lower emissions than a comparable internal combustion (IC) engine It should be particularly well-suited to larger vehicles such as buses The BRASH engine is a binary recovery air-steam hybrid engine The combination of air and water in an EC engine provides immediately available power and should produce much greater fuel economy than a conventional steam or IC engine More significantly the BRASH engine can provide more power with lower emissions from a wider range of fuels than an internal combustion engine A simplified schematic of the BRASH engine is shown in Figure 2 illustrating the following principles
bull Accelerator regulates flow of air water and fuel to heater based on load and wheel speed
bullWater and fuel are metered to maintain heater temperature within optimal performance band
bullOutput demand determines air-water fraction
Figure 2 Simplified Model
of Air-Steam Hybrid Engine
Any fuel that can be metered (liquid solid or gas) can be used and the heat from combustion is used in direct proportion to work done Fuel is consumed in direct proportion to demand Fuel economy with this air-steam system is much higher than steam alone because air requires less heat to move a piston and the systemrsquos superior thermal management will yield practical fuel economy 3ndash4 times that of an internal combustion engine of comparable torque
FEDERAL TRANSIT ADMINISTRATION 2
SECTION Context for BRASH 1 Societal Challengesand Needs
Economic growth in the developed world has been highly dependent on petroleum distillates for nearly a century3 As Figure 3 shows for most of that century the price of oil has remained stable ($10ndash$30 per barrel in 2008 dollars) and relatively low Since the oil embargo of the 1970s and later political instability in large oil-producing regions the price of oil has fluctuated significantly Over the last 40 years each sharp increase in oil prices has been followed by a steep decline in economic activity
Figure 3 Historic Crude
Oil Prices
The long-term trend in oil prices reflects the growing concern that oil quantities are finite while worldwide demand continues to grow4 M King Hubbert first posited in 1956 that US oil production was approaching a maximum rate and past that point when demand exceeded supply prices would rise rapidly to unprecedented levels5 Since Hubbert this model has been extended to worldwide oil reserves and the popular notion of ldquopeak oilrdquo6
Figure 4 shows projections of world oil production beyond 2010 Most models show a decline in supply over the next 20 to 30 years7 This decline in production
3ldquoAnalysis of the Impact of High Oil Prices on the Global Economyrdquo International Energy Agency (IEA) http wwwieaorgtextbasenpsumhigh_oil04sumpdf 4EampP Magazine ldquoGeologists Positive about Future of Oil and Gasrdquo June 10 2009 5Marion King Hubbert ldquoNuclear Energy and the Fossil Fuels Drilling and Production Practicerdquo June 1956 Spring Meeting of the Southern District Division of Production American Petroleum Institute San Antonio Texas Shell Development Company pp 22ndash27 httpwwwhubbertpeakcomhubbert19561956pdf retrieved April 18 2008 6Adam R Brandt ldquoTesting HubbertrdquoEnergy Policy 35(5) May 2007 pp 3074ndash3088 7ldquoMedium-Term Oil Market Reportrdquo July 2007 IEA Public AccessndashOil Market Report httpomrpublicieaorg
FEDERAL TRANSIT ADMINISTRATION 3
SECTION 1 CONTEXT FOR BRASH SOCIETAL CHALLENGES AND NEEDS
would coincide with far greater fuel demand as China India and other parts of the developing world are beginning to embrace the automobile8
Figure 4 Projections
of World Oil Production
The other trend of note related to petroleum usage is the rise of atmospheric CO2 and the growing risk of climate change Figure 5 shows the consistent rise in atmospheric CO2 at the remote Mauna Loa observatory The rise in CO2 levels is attributed to fossil fuel combustion most notably coal-fed power plants and gasoline powered automobiles
Figure 5 Measured
Atmospheric CO2
8Plunkett Research (2008) ldquoAutomobile Industry Introductionrdquo
FEDERAL TRANSIT ADMINISTRATION 4
SECTION 1 CONTEXT FOR BRASH SOCIETAL CHALLENGES AND NEEDS
As shown in Figure 6 the rise in atmospheric CO2 levels correlates with increases in global temperatures As CO2 continues to increase the expectation is further increases in average global temperatures9
Figure 6 Global Warming
Projections
The economic modeling and the environmental modeling point to one conclusion petroleum distillates may be the current source for nearly all of our transportation fuel supplies but its primacy cannot be sustained Whether from a perspective of limited supply and growing demand or the perspective of a growing environmental impact refined petroleum does not provide solutions only difficult and growing problems
Three popular initiativesmdashpetroleum alternatives improved fuel economy and alternative electric vehicle powermdashcannot solve worldrsquos thirst for petroleum distillates
bullPetroleum alternatives like biodiesel or ethanol put fuel in competition for land with our food supply10
bullNoble efforts to increase vehicle fuel economy domestically cannot offset the surging worldwide demand for more vehicles (Figure 7)11
9IPCC ldquoSummary for Policymakersrdquo Climate Change 2007 The Physical Science Basis Contribution of Working Group I to the Fourth Assessment Report of the Intergovernmental Panel on Climate Change Intergovernmental Panel on Climate Change (IPCC)rdquo 2007 httpwwwipccchpdfassessment-reportar4 wg1ar4-wg1-spmpdf retrieved July 3 2009 10The New York Times ldquoFood and Fuel Compete for Landrdquo December 18 2007 httpwwwnytimes com20071218business18foodhtml 11US Information Administration Analysis amp Projections httpwwweiagovoiafforecastinghtml
FEDERAL TRANSIT ADMINISTRATION 5
SECTION 1 CONTEXT FOR BRASH SOCIETAL CHALLENGES AND NEEDS
bullDomestic migration to electric vehicles is constrained by gross vehicle weight and range12 and electric hybrids are still priced at a premium over their non-hybrid versions13
Figure 7 US Energy
Consumption by Fuel
(1980ndash2035)
The goal of lower national fuel consumption is built on the false premise that the transportation sector requires highly-refined fuel Transportation requires highly-refined fuels only if the motive power is derived from timed detonation of a fuel air mixture in the cylinder head In other words the problem is not so much the petroleum itself but rather the virtually universal dependence on internal combustion (IC) engines that require petroleum fuels
If motive power were to come instead from external combustion a far wider array of gas liquid and solid biomassrenewable fuels could be used The goal could shift from ldquomiles per gallonrdquo to ldquoeffective production cost per 100 miles drivenrdquo for a new class of fuels measured by the pound and favored by the rate of production and CO2 absorption during growth
In sum the goal is to reduce the amplitude and slope of the red (ldquoLiquidsrdquo) line in Figure 7 and increase the same parameters of the green (ldquoNonhydro renewablesrdquo) line significantly By migrating to EC vehicles more of the green renewables line can be used in the transportation sector
The driving force behind the world economy is energy It is axiomatic that lower fuel production costs and consumption equals higher economic productivity The solution for the transportation sector is to migrate toward less refined self-renewing fuels
12The New York Times ldquoWill Lithium-Air Battery Rescue Electric Car Drivers from lsquoRange Anxietyrsquordquo May 7 2010 httpwwwnytimescomcwire2010050707climatewire-will-lithium-air-battery-rescue-electric-car-37498html 13ConsumerAffairscom ldquoConsumer Reports Sizes Up Hybrid Costsrdquo March 2006 httpwwwconsumeraffairscomnews04200603cr_hybridshtml
FEDERAL TRANSIT ADMINISTRATION 6
SECTION 1 CONTEXT FOR BRASH SOCIETAL CHALLENGES AND NEEDS
and that can come only through the technical migration toward external combustion BRASH (Binary Recovery Air-Steam Hybrid) technology provides that path
FEDERAL TRANSIT ADMINISTRATION 7
SECTION Technology Background 2 With few exceptions all mechanical work is derived from heat and all that heat is generated by combustion The earliest effective engines were steam engines first put to practical use at the time of US independence Steam engines remained the dominant source for motive power for the next century until its slow but steady displacement by IC engines in the automobile
Henry Ford was first inspired to develop steam traction engines as a better solution than plow horses14
I felt perfectly certain that horses considering all the bother of attending them and the expense of feeding did not earn their keep The obvious thing to do was to design and build a steam engine that would be light enough to run an ordinary wagon or to pull a plow I thought it more important first to develop the tractor To lift farm drudgery off flesh and blood and lay it on steel and motors has been my most constant ambition
Ironically by the 1920s steam traction engines were completely displaced by IC tractors largely the product of the same Henry Ford and his Fordson brand of tractor15
The IC engine was smaller lighter and cheaper to producemdashand considered safer Gasoline- and diesel-powered tractors were more expensive to operate but the most compelling argument for switching was safety in the hands of a lower-skilled operator who no longer had to constantly watch gauges and adjust temperatures and pressures
Similar differences existed in the broader automotive market and the advent of the electric starter effectively ended consumer interest in EC steam cars
Still near the end of the steam car era Stanley Doble White and others offered technically-competitive options The Doble Model E (Figure 8) weighed more than 5500 pounds but achieved in the 1930s the same fuel economy of a comparable IC engine in a contemporary SUVmdash16 mpg The Doble was powered by a four-cylinder engine of 190 cubic inches displacement about the size of an Accord engine but the Doble weighed 67 percent more than the Accord As for emissions one Doble Model E (currently owned by Jay Leno) recently passed California emissions testing with no modifications16
14Henry Ford My Life and Work 1922 15Spencer Yost Antique Tractor Bible 1998 16ldquoJayos Garage 1925 Doble Series E Steam Carrdquo httpwwwjaylenosgaragecomat-the-garagesteam-cars1925-doble-series-e-steam-car
FEDERAL TRANSIT ADMINISTRATION 8
SECTION 2 TECHNOLOGY BACKGROUND
Figure 8 Doble Model E
Doble and Brooks also built passenger buses similar in capacity and weight to contemporary buses The Brooks shown in Figure 9 was powered by a 400-cubic-inch V8 steam engine and carried 29 passengers at 60 mph while turning at 2000 rpm As a cruel twist of fate the public unveiling of the Brooks Steam Bus was announced in October 1929 two weeks before the stock market crash and the onset of the Great Depression17 The company did not survive
Figure 9 Brooks Steam Motors Bus
17Wikipedia ldquoBrooks Steam Motorsrdquo httpenwikipediaorgwikiBrooks_Steam_Motors
FEDERAL TRANSIT ADMINISTRATION 9
SECTION 2 TECHNOLOGY BACKGROUND
The suitability of steam power for mass transit use can be seen from comparison of a very powerful contemporary Ford V-8 Diesel engine (from the Excursion SUV) to the Besler V-Twin Steam engine circa 1938
Ford Turbo Diesel Besler Steam Configuration V-8 V-2 Displacement (cuin) 445 80 Horsepower 175 150 Torque (ft-lbs) 420 1200 Engine wt w transmission (lbs) 930 80
The Besler is roughly one quarter the size and weight of the V-8 Turbo-Diesel but has equivalent horsepower and three times the available torque (the primary determinant of performance) The Detroit Diesel Series 60 six-cylinder engine commonly used in mass transit vehicles produces marginally more torque (1450 ft-lbs) than the Besler from twice the horsepower and with much more fuel
Steam engines make greater use of the energy contained in the fuel by separating the heating phase of the Carnot cycle from the expansion phase and metering fuel burn to more closely match demand A steam engine presents maximum torque at low speed and greater horsepower and torque than comparable IC engines
Another EC technology gaining resurgent interest is compressed air power Recent reports of collaboration between MDI of France and Tata Motors of India suggest a new approach toward EC engines18 Tata Motors a major producer of vehicles on the Indian subcontinent intends to produce the MDI Air Car in the near future with anticipated fuel economy of 106 mpg The latest iteration of the MDI Air Car shown in Figure 10 has a projected range of 848 miles from 8 gallons of fuel or 106 mpg for a 4-passenger vehicle weighing 1870 pounds19
The MDI City Car relies on a six-cylinder 75 HP engineexpander to achieve this performance and in the ldquoprocess [produce] emissions of only 0141 lbs of CO2
per mile That is hellip less than [half] the cleanest vehicle available todayrdquo (Toyota Prius 07 Emissions 034 lbs of CO2 per mile)
18Autobloggreen ldquoA New Agreement between Tata Motors and MDI Bring the Air-Car Closer to Realityrdquo March 21 2007 httpgreenautoblogcom20070321a-new-agreement-between-tata-motors-and-mdi-bring-the-air-car-cl 19Motor Development International (MDI) OneFlowAIR httpwwwmdiluenglishoneflowairphp
FEDERAL TRANSIT ADMINISTRATION 10
SECTION 2 TECHNOLOGY BACKGROUND
Figure 10 MDI Air Car
The schematic for the MDI power plant is shown in Figure 11 The stored air is heated to combustion temperatures and allowed to expand mechanically This is the practical definition of an EC engine where combustion provides heat but the working fluid or propellant is not generated by the combustion process itself
Separating the heating step from the expansion step does not in itself yield higher fuel economy or lower emissions But the regulation of fuel flow to maintain optimum propellant temperature immediately prior to expansion provides both maximum fuel economy and lowest possible emissions In contrast an IC engine ignites fuel at 1800degF and immediately conducts that heat away through its water jacket to drop cylinder temperatures to 200ndash300degF EC engines preserve that heat for useful work
Figure 11 MDI Air Engine
Schematic
FEDERAL TRANSIT ADMINISTRATION 11
SECTION 2 TECHNOLOGY BACKGROUND
Both air and steam engines provide an alternative to the conventional IC engine Both operate from a variety of fuels and offer the potential of lower emissions and higher fuel economy Steam is the more robust of the two (the Besler Steam Twin is much more energetic than the MDI six-cylinder) but the compressed air engine offers an operational simplicity and a lower weight because no boiler or condenser is required Unfortunately it can never provide the power and acceleration of steam
The best of both worlds would be a blending of air and steam into a single engine that offers all of the benefits but without the weight and heat management issues of a boiler and with significantly more power than an air engine alone
FEDERAL TRANSIT ADMINISTRATION 12
SECTION The Air-Steam 3 Hybrid Solution
Air and water are completely different in their physical properties except when they operate as working fluids at high temperatures and pressures At steam operating pressures and temperatures their behavior largely follows ideal gas behavior and each is miscible in the other at all proportions The arrow in Figure 12 indicates the rough path for expansion of the hot high-pressure propellant and shows near ideal gas behavior for steam at these elevated temperatures and pressures
Figure 12 Does Steam
Behave Like an Ideal Gas
Getting to steam operating temperatures and pressures requires that significantly more heat be applied to water than air at STP (standard temperature and pressure) Air requires only 642 kcalmole to reach these operating temperatures while water (steam) requires 5236 kcalmole (due to the 512 kcal heat of vaporization) In this development a baseline flow of air is used to entrain water into the heater section Fuel is consumed in direct proportion to the water fraction to maintain the heater at a near constant temperature The heat required to maintain ldquohot airrdquo temperatures is a small fraction of the heat required to maintain steam temperatures as shown in Figure 13
FEDERAL TRANSIT ADMINISTRATION 13
SECTION 3 THE AIR-STEAM HYBRID SOLUTION
Figure 13 Heat Required
to Raise Air and Water
Temperature to 1000degK
The compressed air fraction provides a safe and consistent flow pressure into the hot section The water once heated to working steam temperature provides a more robust working fluid
The hot mixed propellant is injected into the expander moving a piston and converting heat to motion The expanded propellant thereby drops to condensing temperatures allowing the water portion to drop to a sump for pumped return to the injector The expanded air fraction is then recompressed for return to the injector
The use of an air fraction allows for immediate injection of work-appropriate amounts of water into the hot section no boiler no steam under pressure no fuel wasted (heating steam without immediate purpose) The use of a water fraction (and proportional fuel flow) allows for variable power from a constant temperature system The binary (air-steam) propellant allows for a closed-loop condensing recovery system extending range and economy
Figure 14 Schematic of Injector Nozzle Used to Mix Air
and Water
FEDERAL TRANSIT ADMINISTRATION 14
SECTION 3 THE AIR-STEAM HYBRID SOLUTION
The sum of the process is as follows
Key start begins a modest fuel burn that immediately provides initial hot air flow through the engine
bull Depressing the accelerator increases the water fraction and fuel flow (in direct proportion)
bullThe vehicle moves forward under (airsteamfuel) power in direct proportion to wheel turn
bullThe hot mix expands and the expanded mix condenses the water fraction
bullA small parasitic load recompresses the small air fraction to reinjection pressures
bull Removing the foot from the accelerator returns the flow to hot air only sweeping residual moisture from the cylinders and preventing hydraulic lock (during next cold start)
The engine can operate on any fuel whose flow can be regulated (semi-solid liquid gas) Combustion occurs at high temperature at one atmosphere so much cleaner burning than internal combustion
Figure 15 Air-Steam Hybrid
Schematic
Accelerator regulates flow of air water and fuel to heater based on load and wheel speed Water and fuel are metered to maintain heater temperature within optimal performance band
Output demand determines air-water fraction
Any discussion of fuel efficiency relative to current IC engine technology must first re-emphasize the multi-fuel capability of EC engines In a market so dominated by one fuel customers have accepted the term ldquomiles per gallonrdquo
FEDERAL TRANSIT ADMINISTRATION 15
SECTION 3 THE AIR-STEAM HYBRID SOLUTION
as the basis for comparison But in an open market with many different fuels and widely different heat content (BTUlb) the only common and appropriate denominator is ldquomiles per dollarrdquo (closer to ldquofuel economyrdquo)
To the extent that any EC solution gains market acceptance and the market responds with new and different fuel blends the law of supply and demand dictates that fuel prices for all will drop Until then the remainder of this efficiency discussion will assume all engines require the same petroleum-based fuel
The long-accepted estimate of fuel efficiency for the IC engine is about 25 percent with the remaining 75 percent of the heat content dissipated in equal parts through the hot exhaust the radiator and mechanical losses in the engine Much has been done to raise that efficiency but what remains is one power stroke in four and a high temperature detonation whose heat content is quickly and intentionally dissipated through conduction
In sharp contrast a steam engine is designed to preserve as much heat as possible from combustion and then mete out that heat through the expansion of the working fluid Instead of a 25 percent heat loss through conduction through a radiator conductive loss is limited to 10 percent in efficient steam engines The greatest loss is through the vaporization of water to steam (at 30) yielding useful work of 35 or 40 percent higher than internal combustion Steam vehicles often report significantly lower practical fuel economies as the whole boiler is heated for a relatively short trip (another reason to avoid using a boiler)
Hot air engines involve no change of state therefore avoiding the loss associated with vaporization That can mean fuel efficiencies approaching 65 percent except as noted with the MDI engine a lower power-to-weight capability
The combination of air and steam into a single engine type is expected to yield economies between 35 and 65 percent varying with wheel load A 50 percent net efficiency would double fuel economy over a comparably-sized IC engine but as shown with the Doble and Besler examples the EC engine can be much smaller yielding even greater economies
FEDERAL TRANSIT ADMINISTRATION 16
SECTION 3 THE AIR-STEAM HYBRID SOLUTION
Figure 16 Fuel Efficiency
by Engine Type
Derivative Uses As much as this study is focused on large motive power applications it should be noted that an equally important opportunity for this technology is in stationary power applications similar in configuration to combined heat and power units referred to generally as micro-CHPs Rapid start-up high torque quiet operation and multi-fuel compatibility make it well suited to an integrated heat and electrical power installation
FEDERAL TRANSIT ADMINISTRATION 17
SECTION 3 THE AIR-STEAM HYBRID SOLUTION
Its ability to produce a full range of power options (mechanical pneumatic heat and through attached accessories electrical and hydraulic) in a small modular man-portable configuration also make it particularly well suited to temporary or tactical power requirements Although beyond the scope of the DOT goals for vehicular use this stationary power applicationrsquos potential may be strategically important in market acceptance and adoption by expanding the range of applications and thereby providing economies of scale in all aspects of development production and commercialization activities for all applications
FEDERAL TRANSIT ADMINISTRATION 18
SECTION BRASH Test Plan 4 This Phase I effort followed the Technical Objectives outlined in the proposal as follows
Practical Objectives 1 Modify the Smarttrade sized test vehicle (Figure 17) installing a 10ndash20 HP
equivalent heater a 650 cc displacement 2 HP (nominal) Quasiturbinetrade steam engine pressurized air and water tanks electronic flow regulation of air water and fuel via laptop-based LabVIEW software and solenoid valves
2 Perform test runs to validate the system operation and determine key baseline performance parameters such as
a minimum air fraction to maintain engine operation upper limits for operating temperatures maximum allowable flow rates for water (without reducing effective propellant flow at temperature)
b upper limits of vehicle speed while varying gross vehicle weight and course incline
3 Following baseline performance assessment further objectives included
a an analysis of component placement for ease of maintenance and replacement
b an estimation of comparable volumes and weights to an equivalent IC powertrain in order to verify retrofitability
c an estimation of effective fuel economy while using propane fuel on closed track mileage runs
Figure 17 Smarttrade
Car-Sized Test Vehicle
FEDERAL TRANSIT ADMINISTRATION 19
SECTION 4 BRASH TEST PLAN
4 Over the course of multiple test runs a cumulative assessment of component performance and reliability would lead to a gross verification of BRASH engine integrity and range That in turn could lead to off-site vehicle demonstrations to federal agencies potential industry partners and investors
Analytical Objectives 1 The BRASH engine model has been demonstrated only at a bench level with
rudimentary understanding of its operating principles A key objective in this vehicle build is to increase the thermodynamic modeling of this technology including an analysis of mass flow (air water fuel) and resulting power
2 Early test data would lead to analysis of specific on-vehicle capacities (for air water and fuel) and flow rates for same in order to estimate operating range recovery strategies and rates (recompression and condensation) and the parasitic loads (eg alternators pumps) to sustain useful operation for many hours
3 Over time the vehicle testing under various test conditions (eg varying gross vehicle weight wheel load engine temperature propellant mix) will lead to a body of data to support more complete modeling of water fraction vs torque vs temperature These data are essential to real-world estimation of fuel economy as this technology scales to larger practical vehicle applications
4 With the modeling from 3 in place for steady-state operation practical track runs with frequent starts and stops can further shape the model for real-world use
5 The analysis from steps 1ndash4 will provide sufficient basis for estimating the mass flow heat component capacity recovery factors and fuel economy for scaling this 2 HP test data to larger vehicles in two decade steps first to a 20 HP pickup truck and then further modeling and custom buildup of a 200 HP power plant with a DOT-identified industrial partner
6 This analytical plan is consistent with the overall SBIR program plan as the 2HP effort is confined to Phase I the 20 HP build and test plan would be accomplished in Phase II and the design and build of the 200 HP power plant would be accomplished in Phase III with an established industry partner
The work effort toward completion of these tasks has proceeded on two tracks mechanical modifications to the April test vehicle and electronic control and measurement
Mechanical Modifications and Test Configuration The test vehicle is a modified electric car about the size of a Smarttrade car Earlier modifications included removal of the electric drive train exposing a large working
FEDERAL TRANSIT ADMINISTRATION 20
SECTION 4 BRASH TEST PLAN
space behind the cab This rear space over the rear left wheel contains a 2HP Quasiturbinetrade steam engine20 selected for its compact design and suitable power range for this 700-pound vehicle The placement over the left wheel permits direct drive to that wheel via electric clutch and chain drive
Figure 18 Quasiturbinetrade
Rotary Expander Installed and Interior View
In the center of center of this rear space a heavily-modified propane space heater rated at 30000ndash80000 BTUhr (equivalent to 11ndash31 boiler horsepower [bhp]) was installed Heaters of this type generally are designed to efficiently distribute heat into an adjoining space This heater was heavily modified with high temperature insulation and outer shells to retain useful heat to the 20-ft stainless steel coil passing through its core
Figure 19 Quasiturbinetrade
Rotary Expander Installed and Interior View
the expander and heater (with recent refinements) Also visible under the heater is the pressurized water tank (painted grey) The open space to left of the heater is reserved for drive components The space to the right of the heater is reserved for recovery and recompression of the expanded propellant (Recompression is outside of the current scope to simplify the testing and analysis See discussion section for more information) Other system components include air cylinders and electronic controllers that are mounted forward of the rear firewall in the cab or under the front hood
Figure 20 shows the back of the vehicle with fenders and trim removed revealing
20Quasiturbinetrade Product Details httpquasiturbinepromciqcca
FEDERAL TRANSIT ADMINISTRATION 21
SECTION 4 BRASH TEST PLAN
Figure 20 Test Configuration
Figure 21 System Components
The main system components are shown Minor components and linkage tomechanical output are not included in this report for the sake of simplicity
Electronic Control and Measurement No realistic progress toward a vehicle demonstrator with known and regulated fuel use can proceed without electronic regulation In this build the LabVIEW program and system components from National Instruments were used to create a ldquoglass cockpitrdquo of vehicle controls and performance measurement21 The simplified schematic in Figure 22 shows the planned integration of electronics in this development LabView-compatible components will replace all mechanical flow and measurement components
21More information can be found at National Insturments The LabVIEW Environment httpwwwnicomlabview
FEDERAL TRANSIT ADMINISTRATION 22
SECTION 4 BRASH TEST PLAN
Figure 22 Electronics
Schematic for Air-Steam Hybrid
For the vehicle driver the dashboard collection of gauges has been replaced with a laptop screen similar to the one pictured in Figure 23
Figure 23 Front Screen Display for Air-Steam Hybrid
Certain features on this front screen will reflect user input (OnOff Throttle) while others reflect the dependent variables in the process (Heater Temp Fuel Flow Air and Water Flow) Shown on the bottom screen will be running time-series data on speed wheel load temperature specific fuel consumption and the other variables important to the analytical process The front screen display is generated from programming and controls on the back screen display
FEDERAL TRANSIT ADMINISTRATION 23
SECTION 4 BRASH TEST PLAN
Figure 24 Back Screen Display for Air-Steam Hybrid
LabVIEW software and controllers were chosen because of National Instrumentsrsquo status as the industry leader in rapid control prototyping and In-Vehicle data-logging solutions BKi purchased the LabVIEW componentry through the University of Connecticut Mechanical Engineering Department as part of UConnrsquos ongoing support of the project
By the end of the contract term in October 2010 the air and water regulation components were complete and operational but the fuel regulation and engine speed components were not yet fully operational To generate the most meaningful data under these circumstances the test vehicle was configured for extended operation to determine specific fuel water and air consumption rates The combination of these rates provided the basis for initial estimates of power and efficiency
Summary of Effort Mechanical Modifications
1 Removal of original electrical drive components reinforcement of frame
2 Installation of Quasiturbinetrade 2HP engine modified heater pressurized water tank all pneumatic water and fuel lines
3 Baseline validation testing using manual controls
4 Installation of electronically-regulated flow controllers
Electronic Modification 1 Acquisition of computer electronic regulators and control software
2 LabVIEW systems programming
3 System checkout
FEDERAL TRANSIT ADMINISTRATION 24
SECTION 4 BRASH TEST PLAN
Testing and Analysis 1 Static Safety Testing 2 Baseline vehicle drivetrain testing
3 Vehicle static testing (Runs 3 amp 5)
Summary of RequirementsGoals 1 Safe operation of vehicle during static and motive applications
2 Qualitative demonstration of BRASH engine capability to move test vehicle on flat and inclined road surface
3 Quantitative determination of air water and fuel consumption during timed static test
4 Quantitative determination of air water and fuel consumption while varyshying water and fuel fractions
Summary of Testing Two experiments were performed in late November the first to establish minimum fuel and propellant flow rates for sustained operation at low speed (air-rich mode) and the second to establish reasonable upper limits of fuel and propellant flow at higher engine speeds (steam-rich mode) Variation in the air-steam mix is the underlying theory of operation for the BRASH engine the air fraction provides a baseline flow for initial start-up and low-speed operation but the addition of water (as steam) to the propellant results in a significant boost in range and power These two tests have verified this underlying theory
Test Conditions The two test runs summarized in this report are 3 on November 22 2010 and 5 on November 26 2010 Both tests were performed at the Depot D campus of the University of Connecticut in Storrs The testing was performed outside in seasonal conditions 45-50degF with light winds
Figure 25 Vehicle Test Setup
FEDERAL TRANSIT ADMINISTRATION 25
SECTION 4 BRASH TEST PLAN
Each run was a dynamic test with no load on the two-cylinder Quasiturbinetrade engine The propane cylinder was suspended from a scale for the duration of the test Propane fuel consumption was monitored continuously by digital scale with a display accuracy of 001kg
Each test run lasted for the duration of one high pressure air cylinder Air cylinder start (full) and end (empty) were determined at the start and finish of each run using the same scale and accuracy Water levels initially were determined volumetrically but the results were too inconsistent Displaced volume of liquid water proved a poor measure of the quantity heated to steam and carried forward for productive work For this reason water is an estimated quantity based upon fuel quantity burned less heat absorbed by the air fraction (Further integration of the LabView controller software in the next phase will obviate this work-around)
Each of the complete test runs may be viewed at Brash Engines website httpwwwbrashenginescom Photos from each run appear in the figures that follow Tables 1 and 2 summarize the productive mass flow for air water and propane fuel to produce work from the engine for the test duration
The cab interior in Figure 26 shows the high pressure air cylinder below the steering wheel and the laptop computer (regulating propellant flow) in passenger seat space The LabView controllers reside in the protective case under the laptop
Figure 26 Vehicle Cab with Controller Laptop
During each test hot propellant was allowed to expand and vent to ambient in order to simplify the thermodynamic model and analysis (Note the plumes of water vapor from each exhaust hose and the small puddles of water under each hose in Figure 27)
FEDERAL TRANSIT ADMINISTRATION 26
SECTION 4 BRASH TEST PLAN
Figure 27 Exhaust Plumes from Expander
Development plans include recovering the expanded propellant separating into water and air phases and then recompressing the air fraction for re-use This will both improve efficiency and eliminate the visible vapor plume
Test Assumptions Another estimation used in this study is the efficiency of heat transfer for the propellant through the 20-ft coil of stainless steel inside the insulated heater Figure 28 shows an early ldquoair-onlyrdquo test run with the current heater The hose failure and melting of the steel wire mesh inside (note formed ball in the mesh) indicates 1300degK temperatures exiting the hot section
Figure 28 Hose Failure Due
to Overheating
FEDERAL TRANSIT ADMINISTRATION 27
SECTION 4 BRASH TEST PLAN
Effective heat transfer (as Figure 28 shows) does not equal efficient heat transfer but the ability to deliver 1300degK air from a well-insulated burner suggests a highly efficient transfer of heat The analysis of results assumes a value of 90 efficiency (See Appendix A for a discussion of heat transfer efficiency)
3 Low Speed Test On November 22 2010 Run 3 tested the lower operating limits of the test setup Low limit in this context meant sufficient pressure to maintain expander rotation but low steam and fuel burn The test commenced with a full air cylinder weighing 661 Kg At the end of the test the empty cylinder weighed 460 Kg Over the 7 minutes and 15 seconds of testing 006 Kg of propane was consumed
The mass of air and fuel was determined from before after run test weights As stated earlier determining the quantity of steam produced from the pressurized water tank was problematic because of the quantity of stored water the resistance to water flow under dynamic pressures and the potential for some fraction of the water (in liquid state) to be entrained in the propellant mix
To solve for this unknown the energy required to raise the known quantity of air from ambient to 1000degK (33kcalmol or 0467 BTUg) was subtracted from the energy content of the propane consumed (44 BTUg) and then the efficiency of the heat transfer process was de-rated by 10 percent to yield a net quantity of 1438 BTUs to elevate ambient temperature water to 1000degK steam The result is an estimated 125 grams of water consumed in the 7-minute test
Table 1 summarizes these data and shows a high reliance on the air fraction for the work performed by the 2 HP engine The air cylinder used in this test has a measured free volume of 45 cubic feet (1274 liters at STP) which means sustained flow rates of 62 cubic feet per minute (cfm) or 175 liters per minute In contrast the 125 grams of water passed through as steam produced an estimated equivalent gas volume of 155 liters at STP Note the modest levels of water vapor in Figure 29 Why the greater air fraction relative to water flow in this test
Air (Wt 000Kg) 661 460 201 938 1294 30 36
Water2
(Wt 000Kg)
Propane(Wt 000Kg)
Time (hrmnsc)
1562
123000
1556
123715
00125
006
00715
1438
2640
na
1983
364
na
47
86
54
90
1 Energy value based upon absorbed heat (italicized) from STP to 1000degK (0446 BTUg for Air 115 BTUg water) 2 Determined by difference from propane and air energy assumed value 90 3Arbitrary estimated efficiency of heat transfer not effective work
11222010 - 3 Low Speed Run Air Pressure 60 psi Water Head Pressure 60 psi
Component(BTU) Start End Net Energy1
(BTU) Power
(BTUmin) Power (HP) Efficiency3
Table 1 Analysis of Mass
Flow Data at Low Speed
FEDERAL TRANSIT ADMINISTRATION 28
SECTION 4 BRASH TEST PLAN
Figure 29 Low-Speed Test Results in Little
Water Vapor
In this baseline experiment the single cylinder provides 60 psi air flow and 60 psi static ldquoheadrdquo pressure on the water column The air flow from the cylinder is biased toward the generally less restrictive flow path for air The water column under the same pressure presents a higher viscosity medium passing through a greater number of valves and restrictions At the point of injection the air fraction flows more freely into the hot section In order to bias the mix toward greater water fraction (and greater power) the head pressure on the water column must be increased over the 60 psi air line pressure
Run 4 (not documented here) evaluated head pressures from 110 psi to 70 psi and determined that modest differential pressures retarded the flow from the air fraction and boosted flow of the water fraction Still higher differential pressures effectively stopped air flow altogether reverting the engine operation to ldquosteam onlyrdquo For Run 5 an additional cylinder was used to apply a 70 psi static head pressure on the water column a 10 psi differential over the 60 psi air line pressure
5 Variable High Speed Test On November 26 2010 Run 5 tested the higher differential water pressure as a means to increase the effective water fraction in the propellant mix The test commenced with a full air cylinder weighing 654 Kg At the end of the test the empty cylinder weighed 472 Kg Run 5 was interrupted after 243 minutes to refill the water tank and then testing resumed for an additional 907 minutes Over the whole test 027 Kg of propane was consumed
Using the same analytical basis as Test 3 Test 5 data indicate a substantial increase in work capacity (as measured by fuel consumed and steam generated) over the 3 baseline
FEDERAL TRANSIT ADMINISTRATION 29
112610 - 5 Variable High Speed Run Air Pressure 60 psi Water Head Pressure 70 psi
Air (Wt 000Kg)
Component(BTU) Start End Net Energy1
(BTU) Power
(BTUmin) Power (HP) Efficiency3
654 472 182 849 718 17 7
SECTION 4 BRASH TEST PLAN
Table 3 Comparison of Mass Flows
Water 588 Runs 3 and 5
163 Duration (mn) 725 1180 725 1180 163
Air
Component Run 3 BHP
Run 5 BHP
Net ChngBHP
Run 5 Mass
Transfer (kg)
Net ChangeMass
Transfer (kg)
30 17
197
237
-45 2010 182 -9
Run 3 Mass
Transfer (kg)
276 350
47
86
422
0060
0013
0270
0086
Propane
This difference in steam fraction and power is more clearly seen in Figure 30 (and on the source video at the Brash Engines website)
Figure 30 Three Images from Run 5
Table 2 Test 5 Results with Increased
Water and Fuel Water2
(Wt 000Kg) 0860 9890 8358 197 83
Propane(Wt 000Kg) 1520 1493 27 11880 1004 237 90
Time (hrmnsc) 133000 134150 01150 na na na na
1 Energy value based upon absorbed heat (italics) from STP to 1000degK (0446 BTUg for Air 115 BTUg water) Underlined value is released heat at generally accepted 44 BTUg 2 Determined by difference from propane and air Energy assumed value 90 3 Arbitrary estimated efficiency of heat transfer not effective work
The increase in pressure on the water column by 10 psi reduced air flow by 9 percent but increased the steam fraction considerably and thereby increased the effective boiler horsepower nearly three-fold to 237 bhp (assuming 90 heat transfer) These data are summarized in Table 3
FEDERAL TRANSIT ADMINISTRATION 30
SECTION 4 BRASH TEST PLAN
As with Run 3 start up from Time Zero was immediate burner on air flow begins and water flow under pressure commences immediately Another impressive feature of the mix air-steam propellant system is the ability to start stop and rapidly accelerate as shown in the full Run 5 video Run 5 serves as validation that this patented technology has unique performance benefits over air steam or internal combustion alone
Lessons Learned A comparison of the two test runs verifies some key points
1 The same power plant can produce variable power and fuel economy based upon power demand and airsteam mix
2 Although imprecise at this point in testing fuel consumption appears directly proportional to engine speed The engineexpander will spool up spool down stop and restart in a manner consistent with fuel and propellant flow The Run 5 video on the Brash Engines website verifies this conclusion
3 The use of a defined static air pressure ldquoheadrdquo over the water column at a pressure higher than the defined air line dynamic pressure provides a safe and predictable bias toward flow from the water fraction
4 Although the current test configuration offers sufficient performance for this initial demonstration phase the following observations are in order
a The heater path is too long creating latent response issues
b The airwater injector is not optimized for proper mix or flow capacity
c The incomplete integration of LabVIEW compromises the quality of data
d The absence of a measured variable load on the expander compromises any analysis of power and fuel economy
5 The design migration to a vehicle installation was premature The project should move back to a lab bench study to refine the regulation of components complete the recovery and recompression portions of the system and use electromechanical loads to estimate power and useful work for specific quantities of fuel water and air
6 The Quasiturbinetrade engine technology is promising but too immature for larger-scale modeling Later phases of the project should rely on more conventional multi-cylinder piston-type expander
Estimated Fuel Economy Mass transit authorities have relied on large diesel engines such as the Detroit Diesel Series 50 and Series 60 engines for more than 30 years Reports on fuel economy vary from a high of 60 miles per gallon (Diesel) for longer-range
FEDERAL TRANSIT ADMINISTRATION 31
SECTION 4 BRASH TEST PLAN
commuter services in California23 to a low of 228 miles per gallon (Diesel) for city buses with frequent stops in New York City24 In both cited studies the migration to compressed natural gas (CNG) has resulted in lower fuel economies on a Diesel Gallon Equivalent (DGE) basis
Table 4 summarizes this study (columns 2 and 3) and the next proposed phase (columns 4 and 5) the performance of the current fleet of mass transit buses (columns 6 and 7) and the likely outcome if the Besler engine (described earlier) were employed with the air-steam hybrid technology (columns 8 and 9)
Table 4 Comparison of
Fuel Economies
Air
1
Configuration
Engine
HP
Torque
Fuel
gmin
BTUhr
GGEhr
mpg 60mph
GGE100 mi
$ per GGE
$100 mi
Current
Example
2
3
3
5
4
Bench
5
S-10
6
SB Bus
7
NYCT
8
50 eff
9
30 eff
86
Quasi
2
Prop
82
216
02
3160
03
30
09
Current
237
Quasi
2
Prop
23
607
05
1126
09
30
27
UC 1
40
6 cyl
20
Prop
40
1056
09
648
15
30
46
UC 2
80
6 cyl
40
Mix
80
2112
19
324
31
30
93
MCI102
DD S60
350
1450
Diesel
540
11400
100
60
167
35
583
Diesel
23
439
35
1535
300
Besler
150
1200
Mix
300
792
695
864
1158
16
1853
500
Besler
150
1200
Mix
500
1320
1158
518
1930
16
3088
The Besler engine is shown in two columns The left column reflects the higher efficiency anticipated with the air-steam hybrid mix described earlier as at or near 50 percent The right column reflects the historical efficiency realized with steam engine technology The italicized numbers near the bottom of the column show that even at historical efficiencies the Besler engine would offer equal or better Gasoline Gallon Equivalent (GGE)100 mile ratings of the current diesel technology but migrating toward less refined and (therefore) less expensive fuels would significantly reduce the operating cost ($mile)
23Demonstration of Caterpillar C-10 Dual-Fuel Engines in MCI 102DL3 Commuter Buses National Renewable Energy Laboratory httpwwwnrelgovdocsfy00osti26758pdf p 7 24R Barnitt ldquoNew York City Transit (NYCT) Hybrid (125 Order) and CNG Transit Buses Final Evaluation Resultsrdquo November 2006 National Renewable Energy Laboratory K Chandler Battelle Technical Report NRELTP-540-40125 November 2006 httpwwwnrelgovvehiclesandfuelsfleettestpdfs40125pdf pvii
FEDERAL TRANSIT ADMINISTRATION 32
SECTION 4 BRASH TEST PLAN
There are of course two orders of magnitude difference between the results of Runs 3 and 5 and the daily demands of city and commuter buses but the mere existence of the Besler Twin and the Brooks V-8 400 HP engine suggests an opportunity for fuel economy and fuel variety
Proposed further support for the next phase of development will advance the air-steam hybrid technology by an important order of magnitude This would provide the data confidence to scale to larger vehicle operation and garner the interest of one or more engine or vehicle OEMs
Figure 31 MTANew York City
Transit Orion VII Next Generation
Hybrid Transit Bus
Next Development Phase The next phase of development will incorporate a modern six-cylinder steam engine design with a displacement of 53 cubic inches and capable of sustained 15-25 HP operation The expander will be supplied by Steam Engine Power Inc (httpwwwsteamenginepowercom) This expander will drive an alternator generator to measure effective work output in watts as well as provide sufficient power to satisfy the system parasitic loads of battery recharge exhaust air recompression and all other pump and valve operations
Figure 32 (l to r) Six-Cylinder Expander Power Generation Load
Small 24 VDC Compressor
FEDERAL TRANSIT ADMINISTRATION 33
SECTION 4 BRASH TEST PLAN
Static pressure for the water column will still be supplied via compressed air cylinder but the dynamic air flow will be supplied by an oil-less air compressor of the size and type shown This 24 VDC compressor will recompress the recovered air exiting the expander to 40ndash60 psi pressure and support flows of 3ndash4 cubic feet per minute (cfm) These three components are off-the-shelf enhancements to the system but custom engineering of a new more powerful and more responsive heater completion of the electronic integration and design and fabrication of the recoveryrecompression components are necessary tasks that must be included to make the next generation assembly work to its potential This work will be accomplished largely by Mechanical and Electrical Engineering students at the University of Connecticut under the supervision of faculty and Brash Engines personnel
When this build is complete all operations will be under LabVIEW control All expander operations will be measured for power and work Once the bench version is in control a modified version will be installed in a small pickup truck (eg Chevrolet S-10) for further verification of system performance and robustness
During this phase a new and promising technology will be investigated a new and faster class of solenoid valves from National Instruments These solenoid valves with an unprecedented 3 msec response time have the potential of allowing air-steam retrofit in existing engine blocks The solenoid valves could replace the spark plugs in conventional IC engines and provide the equivalent timed injection of hot propellant mix as the timed firing of a spark plug in the presence of a fuel air mix
If possible these fast solenoids and the black box programming to control them could allow very easy portability to larger vehicles and easier retrofit Potentially a V-6 engine could operate 4 cylinders for expansion and the remaining two cylinders could be used as direct drive compressors with different but equivalent solenoid valves controlling the compression process
FEDERAL TRANSIT ADMINISTRATION 34
SECTION Development Plan 5 and Next Steps
This current effort is a key first-proof of concept for this air-steam hybrid technology but our goals extend well beyond this two-seat 2 HP demonstrator The lessons learned in electronic integration will allow rapid migration to larger platforms using the same basic controls but scaling the expander heater and other mass-flow components to vehicle-appropriate size That project identified as ldquo20 HP Vehiclerdquo and other near-term derivative projects are listed in Table 5
BRASH Project
ProposedFunding Source
Funds Reqd $K Project Description
SUV-size proof-of-concept for reliable 20 HP Vehicle DOTUSPS 300 highway performance maildelivery
vehicle size
Proof-of-concept mass transit busshy200 HP Vehicle DOTDOD 600 retrofit scaled to city bus capacity and
suitable for replacement of over-the-road diesel engines
Table 5 Project Funding
Stationary Power Unit Micro-CHP Equivalent
DARPA 300 Proof-of-concept mass transit bus-retrofit scaled to city bus capacity and suitable for replacement of over-the-road diesel engines
Summary Alternative Processed Solid Fuel DOE EPA DOA 600
Processed mix of hydrolyzed wood pulp processed solid waste and other combustible solids in an extrudable mass with alcohol solutevehiclemdashdemonstrate utility in vehicles as a high energy content clean burning fuel for EC engines
Demonstrate effective pyrolysis of
Binary Solid Gas Fuel
EPA Waste Management BFI
400 processed solid fuels in a binary fuel burner conventional fuel (gasoline natural gas) provides primary heat source for pyrolysis temperatures
Proof of Concept OEM Power Plant
Vehicle OEM (eg Ford GM Caterpillar) 1200
Development of direct replacement BRASH engine alternative to existing OEM IC engine
Black Box Integration of Controller Software
Vehicle OEM (eg Ford GM Caterpillar)
1600 Development of commercial BRASH system alternative to existing OEM IC engine
FEDERAL TRANSIT ADMINISTRATION 35
SECTION 5 DEVELOPMENT PLAN AND NEXT STEPS
The issuance of US Patent 7743872 five months ago has two important consequences for this project First it serves to validate the underlying technology the combination of air and steam in an EC engine is better than steam or air alone Second it provides a basis for full and open discussions with government agencies and large commercial interests in the transportation and power sectors
Our efforts at promotion have been delayed pending successful demonstration of the Smarttrade car vehicle to allow the first detailed real-world performance data to be distributed
Coupling that performance data with the option of migration away from refined petroleum should spark significant interest If we can move to a high lignin-processed wood pulp that costs $045 per gasoline gallon equivalent (an arbitrary value for example only) and consumes more CO2 while growing than is consumed in processing as a fuel and produced from combustion then we succeed as a project and as a global game-changing technology for many uses Improvements in fuel economy are important but of greater importance is the migration to low-process biomass fuels
FEDERAL TRANSIT ADMINISTRATION 36
SECTION Potential Applications and Societal Value 6 The whole premise behind the BRASH air steam hybrid is that external combustion offers a more benign and environmentally-appropriate way to power large vehicles and other portable equipment than refined petroleum-powered internal combustion
bullCombustion heat can be derived from any fuel source including processed solids from fast-growing renewables such as poplar trees waste corn stalks or switch grass
bullThat combustion heat is applied at a rate consistent with the work to be done and not to support idling and other unproductive fuel use
Using a mix of air and steam as working fluids in the engine allows
bullImmediate startup from an ldquoair-onlyrdquo start
bull Managed system pressure through use of a defined head air pressure
bullManaged fuel burn as the air-steam fraction is adjusted to match wheel load
bullAdjusted wheel load reduces fuel burn
Integration of modern control circuitry with external combustion also brings a level of performance operational simplicity and safety heretofore unavailable
FEDERAL TRANSIT ADMINISTRATION 37
SECTION
7 Phase I Conclusions
The last steam train in scheduled service in the US departed on October 11 196225 One year earlier Robert Noyce received the first patent for an integrated circuit26 But for that brief one-year overlap the most powerful motive power technology was never harnessed by the black box controls that grew out of Noycersquos invention so the diesel-powered IC engine championed by Henry Ford won out
Now nearly 50 years later the modern IC engine cannot operate efficiently without the benefit of black box electronicsmdashbut that technology still presents intractable challenges of supply safety and environmental impact The air-steam hybrid technology may offer an alternative and a glimpse of that potential is presented here and viewable in Run 5 on the Brash Engines website at http wwwbrashenginescom
While demonstration in a test vehicle provides a strong visual message that BRASH technology works the commercial success of this technology will depend upon reliable repeatable measurement of power and economy For that data the Phase 2 effort will require a return to laboratory bench testing and effective demonstration of recovery of the water and air fractions
The results of this Phase I project collectively demonstrate the technical feasibility and commercial potential of the BRASH air-steam hybrid engine technology The initial DOT SBIR funding has been highly effective in facilitating this important proof of concept and laying the groundwork for further technology refinement and application
As described earlier the next steps are clear and appear to combine achievable and rapid major advances with low developmental risk SBIR Phase 2 support is needed for those advances due to the still-early stage of development that restricts access to private capital
The immense potential value of this technology has been enhanced and verified in Phase 1 there is now a clear and low-risk path ahead to larger-scale testing further component and controls refinement specific applications prototyping and pre-commercial deployments
25William Rosen The Most Powerful Idea in the World Random House 2010 p 311 26US Patent 2981877
FEDERAL TRANSIT ADMINISTRATION 38
APPENDIX
A Heat Transfer Efficiency Modeling Runs 3 and 5 50 and 90
Much of the analysis for Runs 3 and 5 is based on an assumed efficiency of 90 for heat transfer from the combustion of propane to heating of the water air mix in the coil As a test for the reasonableness of that assumption the same data have been modeled at a much lower 50 factor below
112210 - 3 Low Speed Run Air Pressure 60 psi Water head pressure 60 psi
Water2 00440 5060 4276 101 43 (Wt 000Kg)
Propane 152 1493 237 50 27 11880 1004 (Wt 000Kg)
Time 133000 134150 01150 na na na na (hrmnsc)
1 Energy value based upon absorbed heat (italics) from STP to 1000degK (0446 BTUg for Air 115 BTUg water) Underlined value is released heat at generally accepted 44 BTUg
Air (Wt 000Kg)
Component(BTU) Start Wt End Wt Net Wt Energy1
(BTU) Power
(BTUmin) Power (HP) Efficiency3
661 460 201 938 1294 30 36
Water2
(Wt 000Kg)
Propane(Wt 000Kg)
Time (hrmnsc)
1562
123000
1556
123715
00125
006
00715
380
2640
na
523
364
na
12
86
14
50
na na
Air (Wt 000Kg)
Component(BTU) Start Wt
5 Variable High Speed Run Air Pressure 60 psi Water head pressure 70 psi
End Wt Net Wt Energy1
(BTU) Power
(BTUmin) Power (HP) Efficiency3
654 472 182 849 718 17 7
2 Determined by difference from Propane and Air Energy assumed value 90 3 Arbitrary estimated efficiency of heat transfer not effective work
The two known quantities in each run is the weight of the air moving through the system and the weight of the propane heating that air The variable is the quantity of water heated to steam temperatures and above In Run 3 at 90 efficiency that mass of water calculates to 125 grams at 50 it drops to 33 grams In Run 5 at 90 efficiency that mass of water calculates to 86 grams at 50 it drops to 44 grams
FEDERAL TRANSIT ADMINISTRATION 39
APPENDIX A HEAT TRANSFER EFFICIENCY MODELING RUNS 3 AND 5 50 AND 90
As the comparison tables below show the uncertainty in the efficiency of heat transfer is manifest only in the mass of water heated to steam to do useful work
Data 90 Efficiency
Air
Component Run 3 BHP
Run 5 BHP
Net ChngBHP
-45
Run 3 Mass
Transfer (kg)
Run 5 Mass
Transfer (kg)
Net ChangeMass
Transfer (kg)
30 17
197
237
2010 182 -9
Water
Propane
Duration (mn)
47
86
725
422
0060
0013
725
0270
0086
1180
588
350
163 1180
276
163
Data 50 Efficiency
Air
Component Run 3 BHP
Run 5 BHP
Net ChngBHP
-45
Run 3 Mass
Transfer (kg)
Run 5 Mass
Transfer (kg)
Net ChangeMass
Transfer (kg)
30 17
101
237
2010 182 -9
Water
Propane
Duration (mn)
12
86
725
817
0060
0003
725
0270
0044
1180
1233
350
163 1180
276
163
Regardless of the specific efficiency Run3 reflects an air-rich propellant mix while Run 5 was clearly the more powerful and steam-rich propellant If 50 efficiency is a more realistic figure than 90 the only consequence is more water passing through the heater expander and recovery tank The only consequence for overall system efficiency is the slight but added work required to move the additional water by pump to the top of the water column
FEDERAL TRANSIT ADMINISTRATION 40
APPENDIX Acronyms B
BHP Boiler Horsepower
BRASH Binary Recovery Air-Steam Hybrid
BTU British Thermal Unit
CC Cubic centimeter
CFM Cubit feet per minute
CHP Combined heat and power
CNG Compressed natural gas
CO2 Carbon dioxide
CU Cubic
DARPA Defense Advanced Research Projects Agency
DGE Diesel gallon equivalent
DOT Department of Transportation
EC External combustion
EIA Energy Information Administration
EPA Environmental Protection Agency
FTA Federal Transit Administration
GGE Gasoline gallon equivalent
HP Horsepower
IC Internal combustion
K Kelvin
Kcal Kilocalorie
MPG Miles per gallon
MPH Miles per hour
OEM Original equipment manufacturer
PSI Pounds per square inch
RPM Revolutions per minute
SBIR Small Business Innovation Research
STP Standard temperature and pressure
FEDERAL TRANSIT ADMINISTRATION 41
FEDERAL TRANSIT ADMINISTRATION 128
US Department of TransportationFederal Transit AdministrationEast Building1200 New Jersey Avenue SEWashington DC 20590httpwwwftadotgovresearch
US Department of Transportation Federal Transit Administration East Building 1200 New Jersey Avenue SE Washington DC 20590 httpwwwftadotgovresearch
FEDERAL TRANSIT ADMINISTRATION 42
- Button1
- Button2
- Button3
- Button4
- Button5
- Button6
- Button7
- Button8
- Button9
- Button10
- Button11
- Button12
- Button13
- Button14
- Button15
- Button16
- Button17
- Button18
- Button19
- Button20
- Button21
- Button22
- Button23
- Button24
- Button25
- Button26
- Button27
- Button28
- Button29
- Button30
- Button31
- Button32
- Button33
- Button34
- Button35
- Button36
- Button37
- Button38
- Button39
- Button40
- Button41
- Button42
- Button43
- Button44
- Button45
- Button46
- Button47
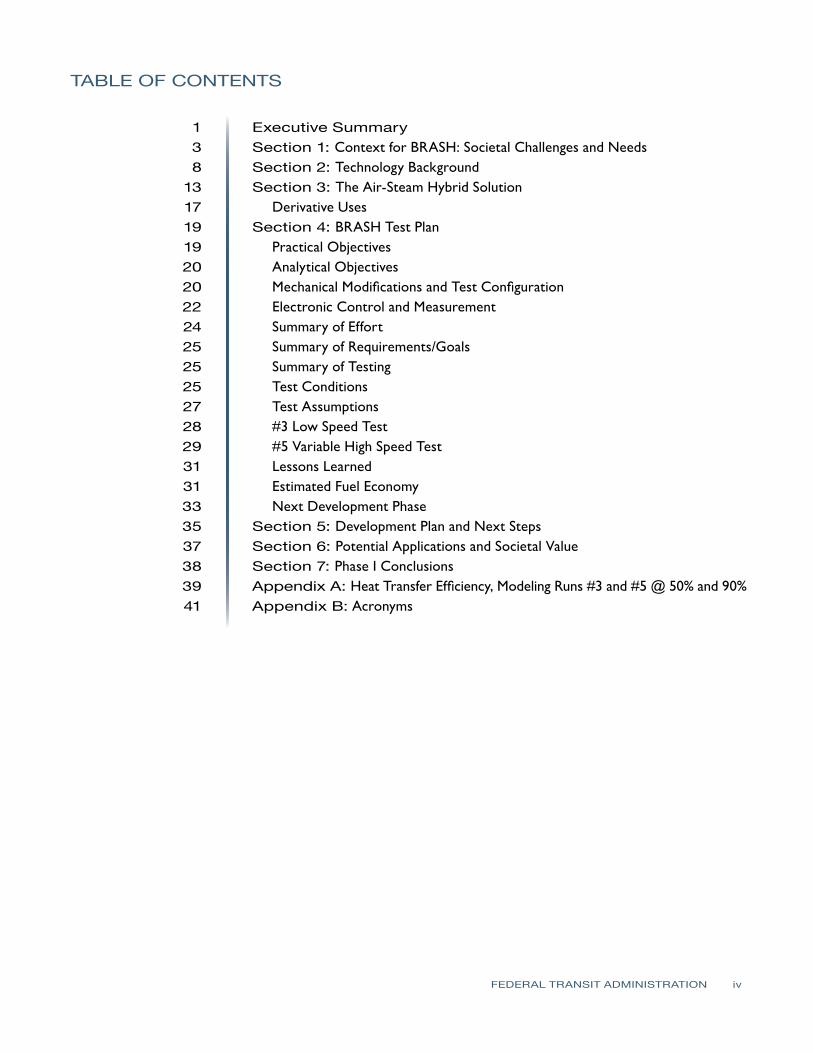
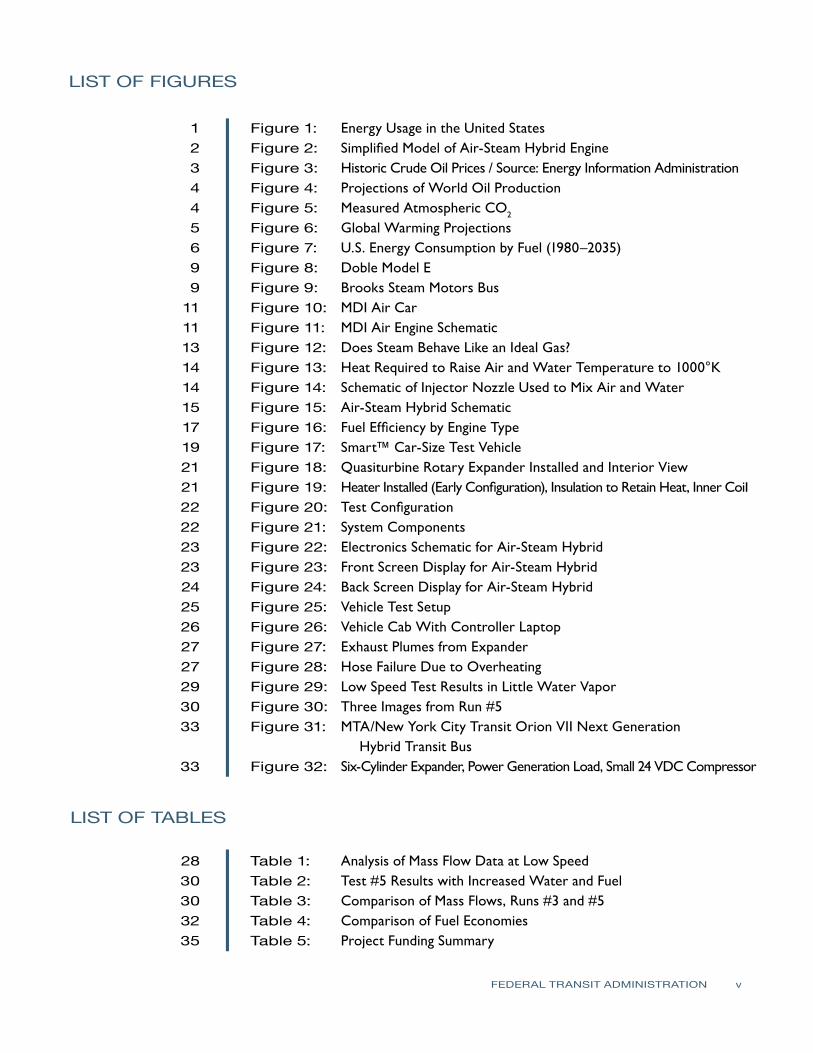
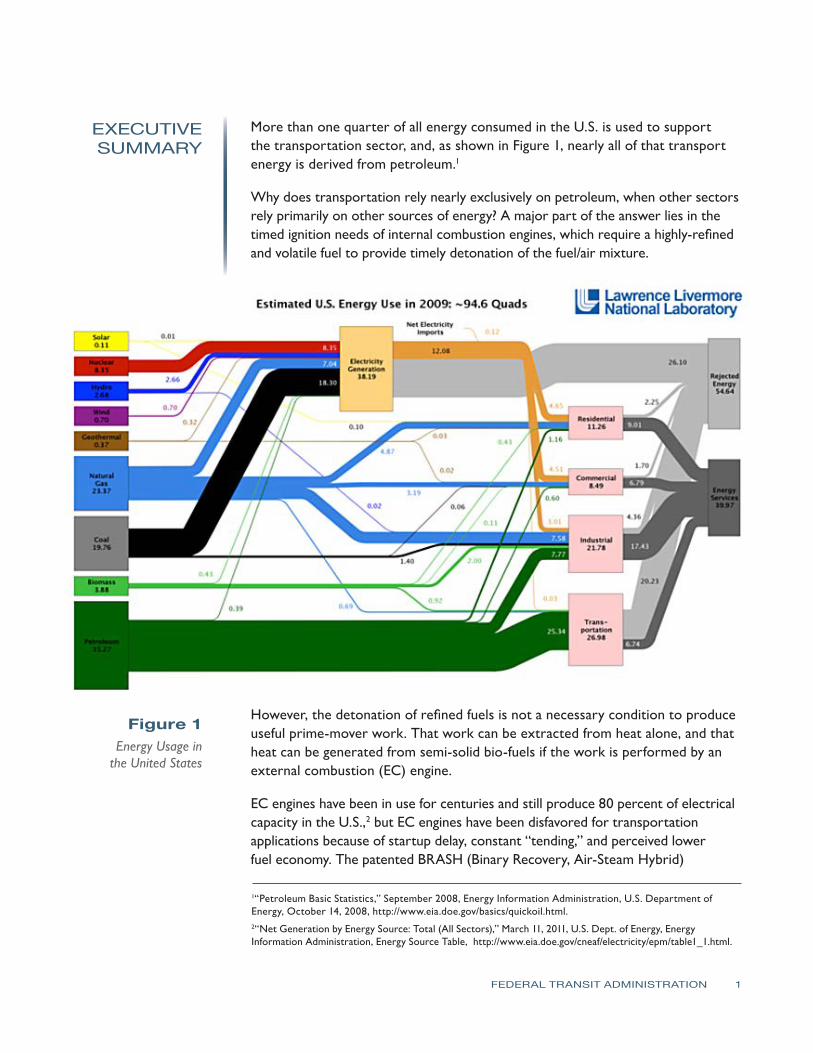
EXECUTIVE SUMMARY
More than one quarter of all energy consumed in the US is used to support the transportation sector and as shown in Figure 1 nearly all of that transport energy is derived from petroleum1
Why does transportation rely nearly exclusively on petroleum when other sectors rely primarily on other sources of energy A major part of the answer lies in the timed ignition needs of internal combustion engines which require a highly-refined and volatile fuel to provide timely detonation of the fuelair mixture
Figure 1 Energy Usage in
the United States
However the detonation of refined fuels is not a necessary condition to produce useful prime-mover work That work can be extracted from heat alone and that heat can be generated from semi-solid bio-fuels if the work is performed by an external combustion (EC) engine
EC engines have been in use for centuries and still produce 80 percent of electrical capacity in the US2 but EC engines have been disfavored for transportation applications because of startup delay constant ldquotendingrdquo and perceived lower fuel economy The patented BRASH (Binary Recovery Air-Steam Hybrid)
1ldquoPetroleum Basic Statisticsrdquo September 2008 Energy Information Administration US Department of Energy October 14 2008 httpwwweiadoegovbasicsquickoilhtml 2ldquoNet Generation by Energy Source Total (All Sectors)rdquo March 11 2011 US Dept of Energy Energy Information Administration Energy Source Table httpwwweiadoegovcneafelectricityepmtable1_1html
FEDERAL TRANSIT ADMINISTRATION 1
EXECUTIVE SUMMARY
engine technology resolves each of these concerns and presents the first clear alternative to internal combustion in more than 50 years It is projected to produce higher fuel efficiency greater power and lower emissions than a comparable internal combustion (IC) engine It should be particularly well-suited to larger vehicles such as buses The BRASH engine is a binary recovery air-steam hybrid engine The combination of air and water in an EC engine provides immediately available power and should produce much greater fuel economy than a conventional steam or IC engine More significantly the BRASH engine can provide more power with lower emissions from a wider range of fuels than an internal combustion engine A simplified schematic of the BRASH engine is shown in Figure 2 illustrating the following principles
bull Accelerator regulates flow of air water and fuel to heater based on load and wheel speed
bullWater and fuel are metered to maintain heater temperature within optimal performance band
bullOutput demand determines air-water fraction
Figure 2 Simplified Model
of Air-Steam Hybrid Engine
Any fuel that can be metered (liquid solid or gas) can be used and the heat from combustion is used in direct proportion to work done Fuel is consumed in direct proportion to demand Fuel economy with this air-steam system is much higher than steam alone because air requires less heat to move a piston and the systemrsquos superior thermal management will yield practical fuel economy 3ndash4 times that of an internal combustion engine of comparable torque
FEDERAL TRANSIT ADMINISTRATION 2
SECTION Context for BRASH 1 Societal Challengesand Needs
Economic growth in the developed world has been highly dependent on petroleum distillates for nearly a century3 As Figure 3 shows for most of that century the price of oil has remained stable ($10ndash$30 per barrel in 2008 dollars) and relatively low Since the oil embargo of the 1970s and later political instability in large oil-producing regions the price of oil has fluctuated significantly Over the last 40 years each sharp increase in oil prices has been followed by a steep decline in economic activity
Figure 3 Historic Crude
Oil Prices
The long-term trend in oil prices reflects the growing concern that oil quantities are finite while worldwide demand continues to grow4 M King Hubbert first posited in 1956 that US oil production was approaching a maximum rate and past that point when demand exceeded supply prices would rise rapidly to unprecedented levels5 Since Hubbert this model has been extended to worldwide oil reserves and the popular notion of ldquopeak oilrdquo6
Figure 4 shows projections of world oil production beyond 2010 Most models show a decline in supply over the next 20 to 30 years7 This decline in production
3ldquoAnalysis of the Impact of High Oil Prices on the Global Economyrdquo International Energy Agency (IEA) http wwwieaorgtextbasenpsumhigh_oil04sumpdf 4EampP Magazine ldquoGeologists Positive about Future of Oil and Gasrdquo June 10 2009 5Marion King Hubbert ldquoNuclear Energy and the Fossil Fuels Drilling and Production Practicerdquo June 1956 Spring Meeting of the Southern District Division of Production American Petroleum Institute San Antonio Texas Shell Development Company pp 22ndash27 httpwwwhubbertpeakcomhubbert19561956pdf retrieved April 18 2008 6Adam R Brandt ldquoTesting HubbertrdquoEnergy Policy 35(5) May 2007 pp 3074ndash3088 7ldquoMedium-Term Oil Market Reportrdquo July 2007 IEA Public AccessndashOil Market Report httpomrpublicieaorg
FEDERAL TRANSIT ADMINISTRATION 3
SECTION 1 CONTEXT FOR BRASH SOCIETAL CHALLENGES AND NEEDS
would coincide with far greater fuel demand as China India and other parts of the developing world are beginning to embrace the automobile8
Figure 4 Projections
of World Oil Production
The other trend of note related to petroleum usage is the rise of atmospheric CO2 and the growing risk of climate change Figure 5 shows the consistent rise in atmospheric CO2 at the remote Mauna Loa observatory The rise in CO2 levels is attributed to fossil fuel combustion most notably coal-fed power plants and gasoline powered automobiles
Figure 5 Measured
Atmospheric CO2
8Plunkett Research (2008) ldquoAutomobile Industry Introductionrdquo
FEDERAL TRANSIT ADMINISTRATION 4
SECTION 1 CONTEXT FOR BRASH SOCIETAL CHALLENGES AND NEEDS
As shown in Figure 6 the rise in atmospheric CO2 levels correlates with increases in global temperatures As CO2 continues to increase the expectation is further increases in average global temperatures9
Figure 6 Global Warming
Projections
The economic modeling and the environmental modeling point to one conclusion petroleum distillates may be the current source for nearly all of our transportation fuel supplies but its primacy cannot be sustained Whether from a perspective of limited supply and growing demand or the perspective of a growing environmental impact refined petroleum does not provide solutions only difficult and growing problems
Three popular initiativesmdashpetroleum alternatives improved fuel economy and alternative electric vehicle powermdashcannot solve worldrsquos thirst for petroleum distillates
bullPetroleum alternatives like biodiesel or ethanol put fuel in competition for land with our food supply10
bullNoble efforts to increase vehicle fuel economy domestically cannot offset the surging worldwide demand for more vehicles (Figure 7)11
9IPCC ldquoSummary for Policymakersrdquo Climate Change 2007 The Physical Science Basis Contribution of Working Group I to the Fourth Assessment Report of the Intergovernmental Panel on Climate Change Intergovernmental Panel on Climate Change (IPCC)rdquo 2007 httpwwwipccchpdfassessment-reportar4 wg1ar4-wg1-spmpdf retrieved July 3 2009 10The New York Times ldquoFood and Fuel Compete for Landrdquo December 18 2007 httpwwwnytimes com20071218business18foodhtml 11US Information Administration Analysis amp Projections httpwwweiagovoiafforecastinghtml
FEDERAL TRANSIT ADMINISTRATION 5
SECTION 1 CONTEXT FOR BRASH SOCIETAL CHALLENGES AND NEEDS
bullDomestic migration to electric vehicles is constrained by gross vehicle weight and range12 and electric hybrids are still priced at a premium over their non-hybrid versions13
Figure 7 US Energy
Consumption by Fuel
(1980ndash2035)
The goal of lower national fuel consumption is built on the false premise that the transportation sector requires highly-refined fuel Transportation requires highly-refined fuels only if the motive power is derived from timed detonation of a fuel air mixture in the cylinder head In other words the problem is not so much the petroleum itself but rather the virtually universal dependence on internal combustion (IC) engines that require petroleum fuels
If motive power were to come instead from external combustion a far wider array of gas liquid and solid biomassrenewable fuels could be used The goal could shift from ldquomiles per gallonrdquo to ldquoeffective production cost per 100 miles drivenrdquo for a new class of fuels measured by the pound and favored by the rate of production and CO2 absorption during growth
In sum the goal is to reduce the amplitude and slope of the red (ldquoLiquidsrdquo) line in Figure 7 and increase the same parameters of the green (ldquoNonhydro renewablesrdquo) line significantly By migrating to EC vehicles more of the green renewables line can be used in the transportation sector
The driving force behind the world economy is energy It is axiomatic that lower fuel production costs and consumption equals higher economic productivity The solution for the transportation sector is to migrate toward less refined self-renewing fuels
12The New York Times ldquoWill Lithium-Air Battery Rescue Electric Car Drivers from lsquoRange Anxietyrsquordquo May 7 2010 httpwwwnytimescomcwire2010050707climatewire-will-lithium-air-battery-rescue-electric-car-37498html 13ConsumerAffairscom ldquoConsumer Reports Sizes Up Hybrid Costsrdquo March 2006 httpwwwconsumeraffairscomnews04200603cr_hybridshtml
FEDERAL TRANSIT ADMINISTRATION 6
SECTION 1 CONTEXT FOR BRASH SOCIETAL CHALLENGES AND NEEDS
and that can come only through the technical migration toward external combustion BRASH (Binary Recovery Air-Steam Hybrid) technology provides that path
FEDERAL TRANSIT ADMINISTRATION 7
SECTION Technology Background 2 With few exceptions all mechanical work is derived from heat and all that heat is generated by combustion The earliest effective engines were steam engines first put to practical use at the time of US independence Steam engines remained the dominant source for motive power for the next century until its slow but steady displacement by IC engines in the automobile
Henry Ford was first inspired to develop steam traction engines as a better solution than plow horses14
I felt perfectly certain that horses considering all the bother of attending them and the expense of feeding did not earn their keep The obvious thing to do was to design and build a steam engine that would be light enough to run an ordinary wagon or to pull a plow I thought it more important first to develop the tractor To lift farm drudgery off flesh and blood and lay it on steel and motors has been my most constant ambition
Ironically by the 1920s steam traction engines were completely displaced by IC tractors largely the product of the same Henry Ford and his Fordson brand of tractor15
The IC engine was smaller lighter and cheaper to producemdashand considered safer Gasoline- and diesel-powered tractors were more expensive to operate but the most compelling argument for switching was safety in the hands of a lower-skilled operator who no longer had to constantly watch gauges and adjust temperatures and pressures
Similar differences existed in the broader automotive market and the advent of the electric starter effectively ended consumer interest in EC steam cars
Still near the end of the steam car era Stanley Doble White and others offered technically-competitive options The Doble Model E (Figure 8) weighed more than 5500 pounds but achieved in the 1930s the same fuel economy of a comparable IC engine in a contemporary SUVmdash16 mpg The Doble was powered by a four-cylinder engine of 190 cubic inches displacement about the size of an Accord engine but the Doble weighed 67 percent more than the Accord As for emissions one Doble Model E (currently owned by Jay Leno) recently passed California emissions testing with no modifications16
14Henry Ford My Life and Work 1922 15Spencer Yost Antique Tractor Bible 1998 16ldquoJayos Garage 1925 Doble Series E Steam Carrdquo httpwwwjaylenosgaragecomat-the-garagesteam-cars1925-doble-series-e-steam-car
FEDERAL TRANSIT ADMINISTRATION 8
SECTION 2 TECHNOLOGY BACKGROUND
Figure 8 Doble Model E
Doble and Brooks also built passenger buses similar in capacity and weight to contemporary buses The Brooks shown in Figure 9 was powered by a 400-cubic-inch V8 steam engine and carried 29 passengers at 60 mph while turning at 2000 rpm As a cruel twist of fate the public unveiling of the Brooks Steam Bus was announced in October 1929 two weeks before the stock market crash and the onset of the Great Depression17 The company did not survive
Figure 9 Brooks Steam Motors Bus
17Wikipedia ldquoBrooks Steam Motorsrdquo httpenwikipediaorgwikiBrooks_Steam_Motors
FEDERAL TRANSIT ADMINISTRATION 9
SECTION 2 TECHNOLOGY BACKGROUND
The suitability of steam power for mass transit use can be seen from comparison of a very powerful contemporary Ford V-8 Diesel engine (from the Excursion SUV) to the Besler V-Twin Steam engine circa 1938
Ford Turbo Diesel Besler Steam Configuration V-8 V-2 Displacement (cuin) 445 80 Horsepower 175 150 Torque (ft-lbs) 420 1200 Engine wt w transmission (lbs) 930 80
The Besler is roughly one quarter the size and weight of the V-8 Turbo-Diesel but has equivalent horsepower and three times the available torque (the primary determinant of performance) The Detroit Diesel Series 60 six-cylinder engine commonly used in mass transit vehicles produces marginally more torque (1450 ft-lbs) than the Besler from twice the horsepower and with much more fuel
Steam engines make greater use of the energy contained in the fuel by separating the heating phase of the Carnot cycle from the expansion phase and metering fuel burn to more closely match demand A steam engine presents maximum torque at low speed and greater horsepower and torque than comparable IC engines
Another EC technology gaining resurgent interest is compressed air power Recent reports of collaboration between MDI of France and Tata Motors of India suggest a new approach toward EC engines18 Tata Motors a major producer of vehicles on the Indian subcontinent intends to produce the MDI Air Car in the near future with anticipated fuel economy of 106 mpg The latest iteration of the MDI Air Car shown in Figure 10 has a projected range of 848 miles from 8 gallons of fuel or 106 mpg for a 4-passenger vehicle weighing 1870 pounds19
The MDI City Car relies on a six-cylinder 75 HP engineexpander to achieve this performance and in the ldquoprocess [produce] emissions of only 0141 lbs of CO2
per mile That is hellip less than [half] the cleanest vehicle available todayrdquo (Toyota Prius 07 Emissions 034 lbs of CO2 per mile)
18Autobloggreen ldquoA New Agreement between Tata Motors and MDI Bring the Air-Car Closer to Realityrdquo March 21 2007 httpgreenautoblogcom20070321a-new-agreement-between-tata-motors-and-mdi-bring-the-air-car-cl 19Motor Development International (MDI) OneFlowAIR httpwwwmdiluenglishoneflowairphp
FEDERAL TRANSIT ADMINISTRATION 10
SECTION 2 TECHNOLOGY BACKGROUND
Figure 10 MDI Air Car
The schematic for the MDI power plant is shown in Figure 11 The stored air is heated to combustion temperatures and allowed to expand mechanically This is the practical definition of an EC engine where combustion provides heat but the working fluid or propellant is not generated by the combustion process itself
Separating the heating step from the expansion step does not in itself yield higher fuel economy or lower emissions But the regulation of fuel flow to maintain optimum propellant temperature immediately prior to expansion provides both maximum fuel economy and lowest possible emissions In contrast an IC engine ignites fuel at 1800degF and immediately conducts that heat away through its water jacket to drop cylinder temperatures to 200ndash300degF EC engines preserve that heat for useful work
Figure 11 MDI Air Engine
Schematic
FEDERAL TRANSIT ADMINISTRATION 11
SECTION 2 TECHNOLOGY BACKGROUND
Both air and steam engines provide an alternative to the conventional IC engine Both operate from a variety of fuels and offer the potential of lower emissions and higher fuel economy Steam is the more robust of the two (the Besler Steam Twin is much more energetic than the MDI six-cylinder) but the compressed air engine offers an operational simplicity and a lower weight because no boiler or condenser is required Unfortunately it can never provide the power and acceleration of steam
The best of both worlds would be a blending of air and steam into a single engine that offers all of the benefits but without the weight and heat management issues of a boiler and with significantly more power than an air engine alone
FEDERAL TRANSIT ADMINISTRATION 12
SECTION The Air-Steam 3 Hybrid Solution
Air and water are completely different in their physical properties except when they operate as working fluids at high temperatures and pressures At steam operating pressures and temperatures their behavior largely follows ideal gas behavior and each is miscible in the other at all proportions The arrow in Figure 12 indicates the rough path for expansion of the hot high-pressure propellant and shows near ideal gas behavior for steam at these elevated temperatures and pressures
Figure 12 Does Steam
Behave Like an Ideal Gas
Getting to steam operating temperatures and pressures requires that significantly more heat be applied to water than air at STP (standard temperature and pressure) Air requires only 642 kcalmole to reach these operating temperatures while water (steam) requires 5236 kcalmole (due to the 512 kcal heat of vaporization) In this development a baseline flow of air is used to entrain water into the heater section Fuel is consumed in direct proportion to the water fraction to maintain the heater at a near constant temperature The heat required to maintain ldquohot airrdquo temperatures is a small fraction of the heat required to maintain steam temperatures as shown in Figure 13
FEDERAL TRANSIT ADMINISTRATION 13
SECTION 3 THE AIR-STEAM HYBRID SOLUTION
Figure 13 Heat Required
to Raise Air and Water
Temperature to 1000degK
The compressed air fraction provides a safe and consistent flow pressure into the hot section The water once heated to working steam temperature provides a more robust working fluid
The hot mixed propellant is injected into the expander moving a piston and converting heat to motion The expanded propellant thereby drops to condensing temperatures allowing the water portion to drop to a sump for pumped return to the injector The expanded air fraction is then recompressed for return to the injector
The use of an air fraction allows for immediate injection of work-appropriate amounts of water into the hot section no boiler no steam under pressure no fuel wasted (heating steam without immediate purpose) The use of a water fraction (and proportional fuel flow) allows for variable power from a constant temperature system The binary (air-steam) propellant allows for a closed-loop condensing recovery system extending range and economy
Figure 14 Schematic of Injector Nozzle Used to Mix Air
and Water
FEDERAL TRANSIT ADMINISTRATION 14
SECTION 3 THE AIR-STEAM HYBRID SOLUTION
The sum of the process is as follows
Key start begins a modest fuel burn that immediately provides initial hot air flow through the engine
bull Depressing the accelerator increases the water fraction and fuel flow (in direct proportion)
bullThe vehicle moves forward under (airsteamfuel) power in direct proportion to wheel turn
bullThe hot mix expands and the expanded mix condenses the water fraction
bullA small parasitic load recompresses the small air fraction to reinjection pressures
bull Removing the foot from the accelerator returns the flow to hot air only sweeping residual moisture from the cylinders and preventing hydraulic lock (during next cold start)
The engine can operate on any fuel whose flow can be regulated (semi-solid liquid gas) Combustion occurs at high temperature at one atmosphere so much cleaner burning than internal combustion
Figure 15 Air-Steam Hybrid
Schematic
Accelerator regulates flow of air water and fuel to heater based on load and wheel speed Water and fuel are metered to maintain heater temperature within optimal performance band
Output demand determines air-water fraction
Any discussion of fuel efficiency relative to current IC engine technology must first re-emphasize the multi-fuel capability of EC engines In a market so dominated by one fuel customers have accepted the term ldquomiles per gallonrdquo
FEDERAL TRANSIT ADMINISTRATION 15
SECTION 3 THE AIR-STEAM HYBRID SOLUTION
as the basis for comparison But in an open market with many different fuels and widely different heat content (BTUlb) the only common and appropriate denominator is ldquomiles per dollarrdquo (closer to ldquofuel economyrdquo)
To the extent that any EC solution gains market acceptance and the market responds with new and different fuel blends the law of supply and demand dictates that fuel prices for all will drop Until then the remainder of this efficiency discussion will assume all engines require the same petroleum-based fuel
The long-accepted estimate of fuel efficiency for the IC engine is about 25 percent with the remaining 75 percent of the heat content dissipated in equal parts through the hot exhaust the radiator and mechanical losses in the engine Much has been done to raise that efficiency but what remains is one power stroke in four and a high temperature detonation whose heat content is quickly and intentionally dissipated through conduction
In sharp contrast a steam engine is designed to preserve as much heat as possible from combustion and then mete out that heat through the expansion of the working fluid Instead of a 25 percent heat loss through conduction through a radiator conductive loss is limited to 10 percent in efficient steam engines The greatest loss is through the vaporization of water to steam (at 30) yielding useful work of 35 or 40 percent higher than internal combustion Steam vehicles often report significantly lower practical fuel economies as the whole boiler is heated for a relatively short trip (another reason to avoid using a boiler)
Hot air engines involve no change of state therefore avoiding the loss associated with vaporization That can mean fuel efficiencies approaching 65 percent except as noted with the MDI engine a lower power-to-weight capability
The combination of air and steam into a single engine type is expected to yield economies between 35 and 65 percent varying with wheel load A 50 percent net efficiency would double fuel economy over a comparably-sized IC engine but as shown with the Doble and Besler examples the EC engine can be much smaller yielding even greater economies
FEDERAL TRANSIT ADMINISTRATION 16
SECTION 3 THE AIR-STEAM HYBRID SOLUTION
Figure 16 Fuel Efficiency
by Engine Type
Derivative Uses As much as this study is focused on large motive power applications it should be noted that an equally important opportunity for this technology is in stationary power applications similar in configuration to combined heat and power units referred to generally as micro-CHPs Rapid start-up high torque quiet operation and multi-fuel compatibility make it well suited to an integrated heat and electrical power installation
FEDERAL TRANSIT ADMINISTRATION 17
SECTION 3 THE AIR-STEAM HYBRID SOLUTION
Its ability to produce a full range of power options (mechanical pneumatic heat and through attached accessories electrical and hydraulic) in a small modular man-portable configuration also make it particularly well suited to temporary or tactical power requirements Although beyond the scope of the DOT goals for vehicular use this stationary power applicationrsquos potential may be strategically important in market acceptance and adoption by expanding the range of applications and thereby providing economies of scale in all aspects of development production and commercialization activities for all applications
FEDERAL TRANSIT ADMINISTRATION 18
SECTION BRASH Test Plan 4 This Phase I effort followed the Technical Objectives outlined in the proposal as follows
Practical Objectives 1 Modify the Smarttrade sized test vehicle (Figure 17) installing a 10ndash20 HP
equivalent heater a 650 cc displacement 2 HP (nominal) Quasiturbinetrade steam engine pressurized air and water tanks electronic flow regulation of air water and fuel via laptop-based LabVIEW software and solenoid valves
2 Perform test runs to validate the system operation and determine key baseline performance parameters such as
a minimum air fraction to maintain engine operation upper limits for operating temperatures maximum allowable flow rates for water (without reducing effective propellant flow at temperature)
b upper limits of vehicle speed while varying gross vehicle weight and course incline
3 Following baseline performance assessment further objectives included
a an analysis of component placement for ease of maintenance and replacement
b an estimation of comparable volumes and weights to an equivalent IC powertrain in order to verify retrofitability
c an estimation of effective fuel economy while using propane fuel on closed track mileage runs
Figure 17 Smarttrade
Car-Sized Test Vehicle
FEDERAL TRANSIT ADMINISTRATION 19
SECTION 4 BRASH TEST PLAN
4 Over the course of multiple test runs a cumulative assessment of component performance and reliability would lead to a gross verification of BRASH engine integrity and range That in turn could lead to off-site vehicle demonstrations to federal agencies potential industry partners and investors
Analytical Objectives 1 The BRASH engine model has been demonstrated only at a bench level with
rudimentary understanding of its operating principles A key objective in this vehicle build is to increase the thermodynamic modeling of this technology including an analysis of mass flow (air water fuel) and resulting power
2 Early test data would lead to analysis of specific on-vehicle capacities (for air water and fuel) and flow rates for same in order to estimate operating range recovery strategies and rates (recompression and condensation) and the parasitic loads (eg alternators pumps) to sustain useful operation for many hours
3 Over time the vehicle testing under various test conditions (eg varying gross vehicle weight wheel load engine temperature propellant mix) will lead to a body of data to support more complete modeling of water fraction vs torque vs temperature These data are essential to real-world estimation of fuel economy as this technology scales to larger practical vehicle applications
4 With the modeling from 3 in place for steady-state operation practical track runs with frequent starts and stops can further shape the model for real-world use
5 The analysis from steps 1ndash4 will provide sufficient basis for estimating the mass flow heat component capacity recovery factors and fuel economy for scaling this 2 HP test data to larger vehicles in two decade steps first to a 20 HP pickup truck and then further modeling and custom buildup of a 200 HP power plant with a DOT-identified industrial partner
6 This analytical plan is consistent with the overall SBIR program plan as the 2HP effort is confined to Phase I the 20 HP build and test plan would be accomplished in Phase II and the design and build of the 200 HP power plant would be accomplished in Phase III with an established industry partner
The work effort toward completion of these tasks has proceeded on two tracks mechanical modifications to the April test vehicle and electronic control and measurement
Mechanical Modifications and Test Configuration The test vehicle is a modified electric car about the size of a Smarttrade car Earlier modifications included removal of the electric drive train exposing a large working
FEDERAL TRANSIT ADMINISTRATION 20
SECTION 4 BRASH TEST PLAN
space behind the cab This rear space over the rear left wheel contains a 2HP Quasiturbinetrade steam engine20 selected for its compact design and suitable power range for this 700-pound vehicle The placement over the left wheel permits direct drive to that wheel via electric clutch and chain drive
Figure 18 Quasiturbinetrade
Rotary Expander Installed and Interior View
In the center of center of this rear space a heavily-modified propane space heater rated at 30000ndash80000 BTUhr (equivalent to 11ndash31 boiler horsepower [bhp]) was installed Heaters of this type generally are designed to efficiently distribute heat into an adjoining space This heater was heavily modified with high temperature insulation and outer shells to retain useful heat to the 20-ft stainless steel coil passing through its core
Figure 19 Quasiturbinetrade
Rotary Expander Installed and Interior View
the expander and heater (with recent refinements) Also visible under the heater is the pressurized water tank (painted grey) The open space to left of the heater is reserved for drive components The space to the right of the heater is reserved for recovery and recompression of the expanded propellant (Recompression is outside of the current scope to simplify the testing and analysis See discussion section for more information) Other system components include air cylinders and electronic controllers that are mounted forward of the rear firewall in the cab or under the front hood
Figure 20 shows the back of the vehicle with fenders and trim removed revealing
20Quasiturbinetrade Product Details httpquasiturbinepromciqcca
FEDERAL TRANSIT ADMINISTRATION 21
SECTION 4 BRASH TEST PLAN
Figure 20 Test Configuration
Figure 21 System Components
The main system components are shown Minor components and linkage tomechanical output are not included in this report for the sake of simplicity
Electronic Control and Measurement No realistic progress toward a vehicle demonstrator with known and regulated fuel use can proceed without electronic regulation In this build the LabVIEW program and system components from National Instruments were used to create a ldquoglass cockpitrdquo of vehicle controls and performance measurement21 The simplified schematic in Figure 22 shows the planned integration of electronics in this development LabView-compatible components will replace all mechanical flow and measurement components
21More information can be found at National Insturments The LabVIEW Environment httpwwwnicomlabview
FEDERAL TRANSIT ADMINISTRATION 22
SECTION 4 BRASH TEST PLAN
Figure 22 Electronics
Schematic for Air-Steam Hybrid
For the vehicle driver the dashboard collection of gauges has been replaced with a laptop screen similar to the one pictured in Figure 23
Figure 23 Front Screen Display for Air-Steam Hybrid
Certain features on this front screen will reflect user input (OnOff Throttle) while others reflect the dependent variables in the process (Heater Temp Fuel Flow Air and Water Flow) Shown on the bottom screen will be running time-series data on speed wheel load temperature specific fuel consumption and the other variables important to the analytical process The front screen display is generated from programming and controls on the back screen display
FEDERAL TRANSIT ADMINISTRATION 23
SECTION 4 BRASH TEST PLAN
Figure 24 Back Screen Display for Air-Steam Hybrid
LabVIEW software and controllers were chosen because of National Instrumentsrsquo status as the industry leader in rapid control prototyping and In-Vehicle data-logging solutions BKi purchased the LabVIEW componentry through the University of Connecticut Mechanical Engineering Department as part of UConnrsquos ongoing support of the project
By the end of the contract term in October 2010 the air and water regulation components were complete and operational but the fuel regulation and engine speed components were not yet fully operational To generate the most meaningful data under these circumstances the test vehicle was configured for extended operation to determine specific fuel water and air consumption rates The combination of these rates provided the basis for initial estimates of power and efficiency
Summary of Effort Mechanical Modifications
1 Removal of original electrical drive components reinforcement of frame
2 Installation of Quasiturbinetrade 2HP engine modified heater pressurized water tank all pneumatic water and fuel lines
3 Baseline validation testing using manual controls
4 Installation of electronically-regulated flow controllers
Electronic Modification 1 Acquisition of computer electronic regulators and control software
2 LabVIEW systems programming
3 System checkout
FEDERAL TRANSIT ADMINISTRATION 24
SECTION 4 BRASH TEST PLAN
Testing and Analysis 1 Static Safety Testing 2 Baseline vehicle drivetrain testing
3 Vehicle static testing (Runs 3 amp 5)
Summary of RequirementsGoals 1 Safe operation of vehicle during static and motive applications
2 Qualitative demonstration of BRASH engine capability to move test vehicle on flat and inclined road surface
3 Quantitative determination of air water and fuel consumption during timed static test
4 Quantitative determination of air water and fuel consumption while varyshying water and fuel fractions
Summary of Testing Two experiments were performed in late November the first to establish minimum fuel and propellant flow rates for sustained operation at low speed (air-rich mode) and the second to establish reasonable upper limits of fuel and propellant flow at higher engine speeds (steam-rich mode) Variation in the air-steam mix is the underlying theory of operation for the BRASH engine the air fraction provides a baseline flow for initial start-up and low-speed operation but the addition of water (as steam) to the propellant results in a significant boost in range and power These two tests have verified this underlying theory
Test Conditions The two test runs summarized in this report are 3 on November 22 2010 and 5 on November 26 2010 Both tests were performed at the Depot D campus of the University of Connecticut in Storrs The testing was performed outside in seasonal conditions 45-50degF with light winds
Figure 25 Vehicle Test Setup
FEDERAL TRANSIT ADMINISTRATION 25
SECTION 4 BRASH TEST PLAN
Each run was a dynamic test with no load on the two-cylinder Quasiturbinetrade engine The propane cylinder was suspended from a scale for the duration of the test Propane fuel consumption was monitored continuously by digital scale with a display accuracy of 001kg
Each test run lasted for the duration of one high pressure air cylinder Air cylinder start (full) and end (empty) were determined at the start and finish of each run using the same scale and accuracy Water levels initially were determined volumetrically but the results were too inconsistent Displaced volume of liquid water proved a poor measure of the quantity heated to steam and carried forward for productive work For this reason water is an estimated quantity based upon fuel quantity burned less heat absorbed by the air fraction (Further integration of the LabView controller software in the next phase will obviate this work-around)
Each of the complete test runs may be viewed at Brash Engines website httpwwwbrashenginescom Photos from each run appear in the figures that follow Tables 1 and 2 summarize the productive mass flow for air water and propane fuel to produce work from the engine for the test duration
The cab interior in Figure 26 shows the high pressure air cylinder below the steering wheel and the laptop computer (regulating propellant flow) in passenger seat space The LabView controllers reside in the protective case under the laptop
Figure 26 Vehicle Cab with Controller Laptop
During each test hot propellant was allowed to expand and vent to ambient in order to simplify the thermodynamic model and analysis (Note the plumes of water vapor from each exhaust hose and the small puddles of water under each hose in Figure 27)
FEDERAL TRANSIT ADMINISTRATION 26
SECTION 4 BRASH TEST PLAN
Figure 27 Exhaust Plumes from Expander
Development plans include recovering the expanded propellant separating into water and air phases and then recompressing the air fraction for re-use This will both improve efficiency and eliminate the visible vapor plume
Test Assumptions Another estimation used in this study is the efficiency of heat transfer for the propellant through the 20-ft coil of stainless steel inside the insulated heater Figure 28 shows an early ldquoair-onlyrdquo test run with the current heater The hose failure and melting of the steel wire mesh inside (note formed ball in the mesh) indicates 1300degK temperatures exiting the hot section
Figure 28 Hose Failure Due
to Overheating
FEDERAL TRANSIT ADMINISTRATION 27
SECTION 4 BRASH TEST PLAN
Effective heat transfer (as Figure 28 shows) does not equal efficient heat transfer but the ability to deliver 1300degK air from a well-insulated burner suggests a highly efficient transfer of heat The analysis of results assumes a value of 90 efficiency (See Appendix A for a discussion of heat transfer efficiency)
3 Low Speed Test On November 22 2010 Run 3 tested the lower operating limits of the test setup Low limit in this context meant sufficient pressure to maintain expander rotation but low steam and fuel burn The test commenced with a full air cylinder weighing 661 Kg At the end of the test the empty cylinder weighed 460 Kg Over the 7 minutes and 15 seconds of testing 006 Kg of propane was consumed
The mass of air and fuel was determined from before after run test weights As stated earlier determining the quantity of steam produced from the pressurized water tank was problematic because of the quantity of stored water the resistance to water flow under dynamic pressures and the potential for some fraction of the water (in liquid state) to be entrained in the propellant mix
To solve for this unknown the energy required to raise the known quantity of air from ambient to 1000degK (33kcalmol or 0467 BTUg) was subtracted from the energy content of the propane consumed (44 BTUg) and then the efficiency of the heat transfer process was de-rated by 10 percent to yield a net quantity of 1438 BTUs to elevate ambient temperature water to 1000degK steam The result is an estimated 125 grams of water consumed in the 7-minute test
Table 1 summarizes these data and shows a high reliance on the air fraction for the work performed by the 2 HP engine The air cylinder used in this test has a measured free volume of 45 cubic feet (1274 liters at STP) which means sustained flow rates of 62 cubic feet per minute (cfm) or 175 liters per minute In contrast the 125 grams of water passed through as steam produced an estimated equivalent gas volume of 155 liters at STP Note the modest levels of water vapor in Figure 29 Why the greater air fraction relative to water flow in this test
Air (Wt 000Kg) 661 460 201 938 1294 30 36
Water2
(Wt 000Kg)
Propane(Wt 000Kg)
Time (hrmnsc)
1562
123000
1556
123715
00125
006
00715
1438
2640
na
1983
364
na
47
86
54
90
1 Energy value based upon absorbed heat (italicized) from STP to 1000degK (0446 BTUg for Air 115 BTUg water) 2 Determined by difference from propane and air energy assumed value 90 3Arbitrary estimated efficiency of heat transfer not effective work
11222010 - 3 Low Speed Run Air Pressure 60 psi Water Head Pressure 60 psi
Component(BTU) Start End Net Energy1
(BTU) Power
(BTUmin) Power (HP) Efficiency3
Table 1 Analysis of Mass
Flow Data at Low Speed
FEDERAL TRANSIT ADMINISTRATION 28
SECTION 4 BRASH TEST PLAN
Figure 29 Low-Speed Test Results in Little
Water Vapor
In this baseline experiment the single cylinder provides 60 psi air flow and 60 psi static ldquoheadrdquo pressure on the water column The air flow from the cylinder is biased toward the generally less restrictive flow path for air The water column under the same pressure presents a higher viscosity medium passing through a greater number of valves and restrictions At the point of injection the air fraction flows more freely into the hot section In order to bias the mix toward greater water fraction (and greater power) the head pressure on the water column must be increased over the 60 psi air line pressure
Run 4 (not documented here) evaluated head pressures from 110 psi to 70 psi and determined that modest differential pressures retarded the flow from the air fraction and boosted flow of the water fraction Still higher differential pressures effectively stopped air flow altogether reverting the engine operation to ldquosteam onlyrdquo For Run 5 an additional cylinder was used to apply a 70 psi static head pressure on the water column a 10 psi differential over the 60 psi air line pressure
5 Variable High Speed Test On November 26 2010 Run 5 tested the higher differential water pressure as a means to increase the effective water fraction in the propellant mix The test commenced with a full air cylinder weighing 654 Kg At the end of the test the empty cylinder weighed 472 Kg Run 5 was interrupted after 243 minutes to refill the water tank and then testing resumed for an additional 907 minutes Over the whole test 027 Kg of propane was consumed
Using the same analytical basis as Test 3 Test 5 data indicate a substantial increase in work capacity (as measured by fuel consumed and steam generated) over the 3 baseline
FEDERAL TRANSIT ADMINISTRATION 29
112610 - 5 Variable High Speed Run Air Pressure 60 psi Water Head Pressure 70 psi
Air (Wt 000Kg)
Component(BTU) Start End Net Energy1
(BTU) Power
(BTUmin) Power (HP) Efficiency3
654 472 182 849 718 17 7
SECTION 4 BRASH TEST PLAN
Table 3 Comparison of Mass Flows
Water 588 Runs 3 and 5
163 Duration (mn) 725 1180 725 1180 163
Air
Component Run 3 BHP
Run 5 BHP
Net ChngBHP
Run 5 Mass
Transfer (kg)
Net ChangeMass
Transfer (kg)
30 17
197
237
-45 2010 182 -9
Run 3 Mass
Transfer (kg)
276 350
47
86
422
0060
0013
0270
0086
Propane
This difference in steam fraction and power is more clearly seen in Figure 30 (and on the source video at the Brash Engines website)
Figure 30 Three Images from Run 5
Table 2 Test 5 Results with Increased
Water and Fuel Water2
(Wt 000Kg) 0860 9890 8358 197 83
Propane(Wt 000Kg) 1520 1493 27 11880 1004 237 90
Time (hrmnsc) 133000 134150 01150 na na na na
1 Energy value based upon absorbed heat (italics) from STP to 1000degK (0446 BTUg for Air 115 BTUg water) Underlined value is released heat at generally accepted 44 BTUg 2 Determined by difference from propane and air Energy assumed value 90 3 Arbitrary estimated efficiency of heat transfer not effective work
The increase in pressure on the water column by 10 psi reduced air flow by 9 percent but increased the steam fraction considerably and thereby increased the effective boiler horsepower nearly three-fold to 237 bhp (assuming 90 heat transfer) These data are summarized in Table 3
FEDERAL TRANSIT ADMINISTRATION 30
SECTION 4 BRASH TEST PLAN
As with Run 3 start up from Time Zero was immediate burner on air flow begins and water flow under pressure commences immediately Another impressive feature of the mix air-steam propellant system is the ability to start stop and rapidly accelerate as shown in the full Run 5 video Run 5 serves as validation that this patented technology has unique performance benefits over air steam or internal combustion alone
Lessons Learned A comparison of the two test runs verifies some key points
1 The same power plant can produce variable power and fuel economy based upon power demand and airsteam mix
2 Although imprecise at this point in testing fuel consumption appears directly proportional to engine speed The engineexpander will spool up spool down stop and restart in a manner consistent with fuel and propellant flow The Run 5 video on the Brash Engines website verifies this conclusion
3 The use of a defined static air pressure ldquoheadrdquo over the water column at a pressure higher than the defined air line dynamic pressure provides a safe and predictable bias toward flow from the water fraction
4 Although the current test configuration offers sufficient performance for this initial demonstration phase the following observations are in order
a The heater path is too long creating latent response issues
b The airwater injector is not optimized for proper mix or flow capacity
c The incomplete integration of LabVIEW compromises the quality of data
d The absence of a measured variable load on the expander compromises any analysis of power and fuel economy
5 The design migration to a vehicle installation was premature The project should move back to a lab bench study to refine the regulation of components complete the recovery and recompression portions of the system and use electromechanical loads to estimate power and useful work for specific quantities of fuel water and air
6 The Quasiturbinetrade engine technology is promising but too immature for larger-scale modeling Later phases of the project should rely on more conventional multi-cylinder piston-type expander
Estimated Fuel Economy Mass transit authorities have relied on large diesel engines such as the Detroit Diesel Series 50 and Series 60 engines for more than 30 years Reports on fuel economy vary from a high of 60 miles per gallon (Diesel) for longer-range
FEDERAL TRANSIT ADMINISTRATION 31
SECTION 4 BRASH TEST PLAN
commuter services in California23 to a low of 228 miles per gallon (Diesel) for city buses with frequent stops in New York City24 In both cited studies the migration to compressed natural gas (CNG) has resulted in lower fuel economies on a Diesel Gallon Equivalent (DGE) basis
Table 4 summarizes this study (columns 2 and 3) and the next proposed phase (columns 4 and 5) the performance of the current fleet of mass transit buses (columns 6 and 7) and the likely outcome if the Besler engine (described earlier) were employed with the air-steam hybrid technology (columns 8 and 9)
Table 4 Comparison of
Fuel Economies
Air
1
Configuration
Engine
HP
Torque
Fuel
gmin
BTUhr
GGEhr
mpg 60mph
GGE100 mi
$ per GGE
$100 mi
Current
Example
2
3
3
5
4
Bench
5
S-10
6
SB Bus
7
NYCT
8
50 eff
9
30 eff
86
Quasi
2
Prop
82
216
02
3160
03
30
09
Current
237
Quasi
2
Prop
23
607
05
1126
09
30
27
UC 1
40
6 cyl
20
Prop
40
1056
09
648
15
30
46
UC 2
80
6 cyl
40
Mix
80
2112
19
324
31
30
93
MCI102
DD S60
350
1450
Diesel
540
11400
100
60
167
35
583
Diesel
23
439
35
1535
300
Besler
150
1200
Mix
300
792
695
864
1158
16
1853
500
Besler
150
1200
Mix
500
1320
1158
518
1930
16
3088
The Besler engine is shown in two columns The left column reflects the higher efficiency anticipated with the air-steam hybrid mix described earlier as at or near 50 percent The right column reflects the historical efficiency realized with steam engine technology The italicized numbers near the bottom of the column show that even at historical efficiencies the Besler engine would offer equal or better Gasoline Gallon Equivalent (GGE)100 mile ratings of the current diesel technology but migrating toward less refined and (therefore) less expensive fuels would significantly reduce the operating cost ($mile)
23Demonstration of Caterpillar C-10 Dual-Fuel Engines in MCI 102DL3 Commuter Buses National Renewable Energy Laboratory httpwwwnrelgovdocsfy00osti26758pdf p 7 24R Barnitt ldquoNew York City Transit (NYCT) Hybrid (125 Order) and CNG Transit Buses Final Evaluation Resultsrdquo November 2006 National Renewable Energy Laboratory K Chandler Battelle Technical Report NRELTP-540-40125 November 2006 httpwwwnrelgovvehiclesandfuelsfleettestpdfs40125pdf pvii
FEDERAL TRANSIT ADMINISTRATION 32
SECTION 4 BRASH TEST PLAN
There are of course two orders of magnitude difference between the results of Runs 3 and 5 and the daily demands of city and commuter buses but the mere existence of the Besler Twin and the Brooks V-8 400 HP engine suggests an opportunity for fuel economy and fuel variety
Proposed further support for the next phase of development will advance the air-steam hybrid technology by an important order of magnitude This would provide the data confidence to scale to larger vehicle operation and garner the interest of one or more engine or vehicle OEMs
Figure 31 MTANew York City
Transit Orion VII Next Generation
Hybrid Transit Bus
Next Development Phase The next phase of development will incorporate a modern six-cylinder steam engine design with a displacement of 53 cubic inches and capable of sustained 15-25 HP operation The expander will be supplied by Steam Engine Power Inc (httpwwwsteamenginepowercom) This expander will drive an alternator generator to measure effective work output in watts as well as provide sufficient power to satisfy the system parasitic loads of battery recharge exhaust air recompression and all other pump and valve operations
Figure 32 (l to r) Six-Cylinder Expander Power Generation Load
Small 24 VDC Compressor
FEDERAL TRANSIT ADMINISTRATION 33
SECTION 4 BRASH TEST PLAN
Static pressure for the water column will still be supplied via compressed air cylinder but the dynamic air flow will be supplied by an oil-less air compressor of the size and type shown This 24 VDC compressor will recompress the recovered air exiting the expander to 40ndash60 psi pressure and support flows of 3ndash4 cubic feet per minute (cfm) These three components are off-the-shelf enhancements to the system but custom engineering of a new more powerful and more responsive heater completion of the electronic integration and design and fabrication of the recoveryrecompression components are necessary tasks that must be included to make the next generation assembly work to its potential This work will be accomplished largely by Mechanical and Electrical Engineering students at the University of Connecticut under the supervision of faculty and Brash Engines personnel
When this build is complete all operations will be under LabVIEW control All expander operations will be measured for power and work Once the bench version is in control a modified version will be installed in a small pickup truck (eg Chevrolet S-10) for further verification of system performance and robustness
During this phase a new and promising technology will be investigated a new and faster class of solenoid valves from National Instruments These solenoid valves with an unprecedented 3 msec response time have the potential of allowing air-steam retrofit in existing engine blocks The solenoid valves could replace the spark plugs in conventional IC engines and provide the equivalent timed injection of hot propellant mix as the timed firing of a spark plug in the presence of a fuel air mix
If possible these fast solenoids and the black box programming to control them could allow very easy portability to larger vehicles and easier retrofit Potentially a V-6 engine could operate 4 cylinders for expansion and the remaining two cylinders could be used as direct drive compressors with different but equivalent solenoid valves controlling the compression process
FEDERAL TRANSIT ADMINISTRATION 34
SECTION Development Plan 5 and Next Steps
This current effort is a key first-proof of concept for this air-steam hybrid technology but our goals extend well beyond this two-seat 2 HP demonstrator The lessons learned in electronic integration will allow rapid migration to larger platforms using the same basic controls but scaling the expander heater and other mass-flow components to vehicle-appropriate size That project identified as ldquo20 HP Vehiclerdquo and other near-term derivative projects are listed in Table 5
BRASH Project
ProposedFunding Source
Funds Reqd $K Project Description
SUV-size proof-of-concept for reliable 20 HP Vehicle DOTUSPS 300 highway performance maildelivery
vehicle size
Proof-of-concept mass transit busshy200 HP Vehicle DOTDOD 600 retrofit scaled to city bus capacity and
suitable for replacement of over-the-road diesel engines
Table 5 Project Funding
Stationary Power Unit Micro-CHP Equivalent
DARPA 300 Proof-of-concept mass transit bus-retrofit scaled to city bus capacity and suitable for replacement of over-the-road diesel engines
Summary Alternative Processed Solid Fuel DOE EPA DOA 600
Processed mix of hydrolyzed wood pulp processed solid waste and other combustible solids in an extrudable mass with alcohol solutevehiclemdashdemonstrate utility in vehicles as a high energy content clean burning fuel for EC engines
Demonstrate effective pyrolysis of
Binary Solid Gas Fuel
EPA Waste Management BFI
400 processed solid fuels in a binary fuel burner conventional fuel (gasoline natural gas) provides primary heat source for pyrolysis temperatures
Proof of Concept OEM Power Plant
Vehicle OEM (eg Ford GM Caterpillar) 1200
Development of direct replacement BRASH engine alternative to existing OEM IC engine
Black Box Integration of Controller Software
Vehicle OEM (eg Ford GM Caterpillar)
1600 Development of commercial BRASH system alternative to existing OEM IC engine
FEDERAL TRANSIT ADMINISTRATION 35
SECTION 5 DEVELOPMENT PLAN AND NEXT STEPS
The issuance of US Patent 7743872 five months ago has two important consequences for this project First it serves to validate the underlying technology the combination of air and steam in an EC engine is better than steam or air alone Second it provides a basis for full and open discussions with government agencies and large commercial interests in the transportation and power sectors
Our efforts at promotion have been delayed pending successful demonstration of the Smarttrade car vehicle to allow the first detailed real-world performance data to be distributed
Coupling that performance data with the option of migration away from refined petroleum should spark significant interest If we can move to a high lignin-processed wood pulp that costs $045 per gasoline gallon equivalent (an arbitrary value for example only) and consumes more CO2 while growing than is consumed in processing as a fuel and produced from combustion then we succeed as a project and as a global game-changing technology for many uses Improvements in fuel economy are important but of greater importance is the migration to low-process biomass fuels
FEDERAL TRANSIT ADMINISTRATION 36
SECTION Potential Applications and Societal Value 6 The whole premise behind the BRASH air steam hybrid is that external combustion offers a more benign and environmentally-appropriate way to power large vehicles and other portable equipment than refined petroleum-powered internal combustion
bullCombustion heat can be derived from any fuel source including processed solids from fast-growing renewables such as poplar trees waste corn stalks or switch grass
bullThat combustion heat is applied at a rate consistent with the work to be done and not to support idling and other unproductive fuel use
Using a mix of air and steam as working fluids in the engine allows
bullImmediate startup from an ldquoair-onlyrdquo start
bull Managed system pressure through use of a defined head air pressure
bullManaged fuel burn as the air-steam fraction is adjusted to match wheel load
bullAdjusted wheel load reduces fuel burn
Integration of modern control circuitry with external combustion also brings a level of performance operational simplicity and safety heretofore unavailable
FEDERAL TRANSIT ADMINISTRATION 37
SECTION
7 Phase I Conclusions
The last steam train in scheduled service in the US departed on October 11 196225 One year earlier Robert Noyce received the first patent for an integrated circuit26 But for that brief one-year overlap the most powerful motive power technology was never harnessed by the black box controls that grew out of Noycersquos invention so the diesel-powered IC engine championed by Henry Ford won out
Now nearly 50 years later the modern IC engine cannot operate efficiently without the benefit of black box electronicsmdashbut that technology still presents intractable challenges of supply safety and environmental impact The air-steam hybrid technology may offer an alternative and a glimpse of that potential is presented here and viewable in Run 5 on the Brash Engines website at http wwwbrashenginescom
While demonstration in a test vehicle provides a strong visual message that BRASH technology works the commercial success of this technology will depend upon reliable repeatable measurement of power and economy For that data the Phase 2 effort will require a return to laboratory bench testing and effective demonstration of recovery of the water and air fractions
The results of this Phase I project collectively demonstrate the technical feasibility and commercial potential of the BRASH air-steam hybrid engine technology The initial DOT SBIR funding has been highly effective in facilitating this important proof of concept and laying the groundwork for further technology refinement and application
As described earlier the next steps are clear and appear to combine achievable and rapid major advances with low developmental risk SBIR Phase 2 support is needed for those advances due to the still-early stage of development that restricts access to private capital
The immense potential value of this technology has been enhanced and verified in Phase 1 there is now a clear and low-risk path ahead to larger-scale testing further component and controls refinement specific applications prototyping and pre-commercial deployments
25William Rosen The Most Powerful Idea in the World Random House 2010 p 311 26US Patent 2981877
FEDERAL TRANSIT ADMINISTRATION 38
APPENDIX
A Heat Transfer Efficiency Modeling Runs 3 and 5 50 and 90
Much of the analysis for Runs 3 and 5 is based on an assumed efficiency of 90 for heat transfer from the combustion of propane to heating of the water air mix in the coil As a test for the reasonableness of that assumption the same data have been modeled at a much lower 50 factor below
112210 - 3 Low Speed Run Air Pressure 60 psi Water head pressure 60 psi
Water2 00440 5060 4276 101 43 (Wt 000Kg)
Propane 152 1493 237 50 27 11880 1004 (Wt 000Kg)
Time 133000 134150 01150 na na na na (hrmnsc)
1 Energy value based upon absorbed heat (italics) from STP to 1000degK (0446 BTUg for Air 115 BTUg water) Underlined value is released heat at generally accepted 44 BTUg
Air (Wt 000Kg)
Component(BTU) Start Wt End Wt Net Wt Energy1
(BTU) Power
(BTUmin) Power (HP) Efficiency3
661 460 201 938 1294 30 36
Water2
(Wt 000Kg)
Propane(Wt 000Kg)
Time (hrmnsc)
1562
123000
1556
123715
00125
006
00715
380
2640
na
523
364
na
12
86
14
50
na na
Air (Wt 000Kg)
Component(BTU) Start Wt
5 Variable High Speed Run Air Pressure 60 psi Water head pressure 70 psi
End Wt Net Wt Energy1
(BTU) Power
(BTUmin) Power (HP) Efficiency3
654 472 182 849 718 17 7
2 Determined by difference from Propane and Air Energy assumed value 90 3 Arbitrary estimated efficiency of heat transfer not effective work
The two known quantities in each run is the weight of the air moving through the system and the weight of the propane heating that air The variable is the quantity of water heated to steam temperatures and above In Run 3 at 90 efficiency that mass of water calculates to 125 grams at 50 it drops to 33 grams In Run 5 at 90 efficiency that mass of water calculates to 86 grams at 50 it drops to 44 grams
FEDERAL TRANSIT ADMINISTRATION 39
APPENDIX A HEAT TRANSFER EFFICIENCY MODELING RUNS 3 AND 5 50 AND 90
As the comparison tables below show the uncertainty in the efficiency of heat transfer is manifest only in the mass of water heated to steam to do useful work
Data 90 Efficiency
Air
Component Run 3 BHP
Run 5 BHP
Net ChngBHP
-45
Run 3 Mass
Transfer (kg)
Run 5 Mass
Transfer (kg)
Net ChangeMass
Transfer (kg)
30 17
197
237
2010 182 -9
Water
Propane
Duration (mn)
47
86
725
422
0060
0013
725
0270
0086
1180
588
350
163 1180
276
163
Data 50 Efficiency
Air
Component Run 3 BHP
Run 5 BHP
Net ChngBHP
-45
Run 3 Mass
Transfer (kg)
Run 5 Mass
Transfer (kg)
Net ChangeMass
Transfer (kg)
30 17
101
237
2010 182 -9
Water
Propane
Duration (mn)
12
86
725
817
0060
0003
725
0270
0044
1180
1233
350
163 1180
276
163
Regardless of the specific efficiency Run3 reflects an air-rich propellant mix while Run 5 was clearly the more powerful and steam-rich propellant If 50 efficiency is a more realistic figure than 90 the only consequence is more water passing through the heater expander and recovery tank The only consequence for overall system efficiency is the slight but added work required to move the additional water by pump to the top of the water column
FEDERAL TRANSIT ADMINISTRATION 40
APPENDIX Acronyms B
BHP Boiler Horsepower
BRASH Binary Recovery Air-Steam Hybrid
BTU British Thermal Unit
CC Cubic centimeter
CFM Cubit feet per minute
CHP Combined heat and power
CNG Compressed natural gas
CO2 Carbon dioxide
CU Cubic
DARPA Defense Advanced Research Projects Agency
DGE Diesel gallon equivalent
DOT Department of Transportation
EC External combustion
EIA Energy Information Administration
EPA Environmental Protection Agency
FTA Federal Transit Administration
GGE Gasoline gallon equivalent
HP Horsepower
IC Internal combustion
K Kelvin
Kcal Kilocalorie
MPG Miles per gallon
MPH Miles per hour
OEM Original equipment manufacturer
PSI Pounds per square inch
RPM Revolutions per minute
SBIR Small Business Innovation Research
STP Standard temperature and pressure
FEDERAL TRANSIT ADMINISTRATION 41
FEDERAL TRANSIT ADMINISTRATION 128
US Department of TransportationFederal Transit AdministrationEast Building1200 New Jersey Avenue SEWashington DC 20590httpwwwftadotgovresearch
US Department of Transportation Federal Transit Administration East Building 1200 New Jersey Avenue SE Washington DC 20590 httpwwwftadotgovresearch
FEDERAL TRANSIT ADMINISTRATION 42
- Button1
- Button2
- Button3
- Button4
- Button5
- Button6
- Button7
- Button8
- Button9
- Button10
- Button11
- Button12
- Button13
- Button14
- Button15
- Button16
- Button17
- Button18
- Button19
- Button20
- Button21
- Button22
- Button23
- Button24
- Button25
- Button26
- Button27
- Button28
- Button29
- Button30
- Button31
- Button32
- Button33
- Button34
- Button35
- Button36
- Button37
- Button38
- Button39
- Button40
- Button41
- Button42
- Button43
- Button44
- Button45
- Button46
- Button47
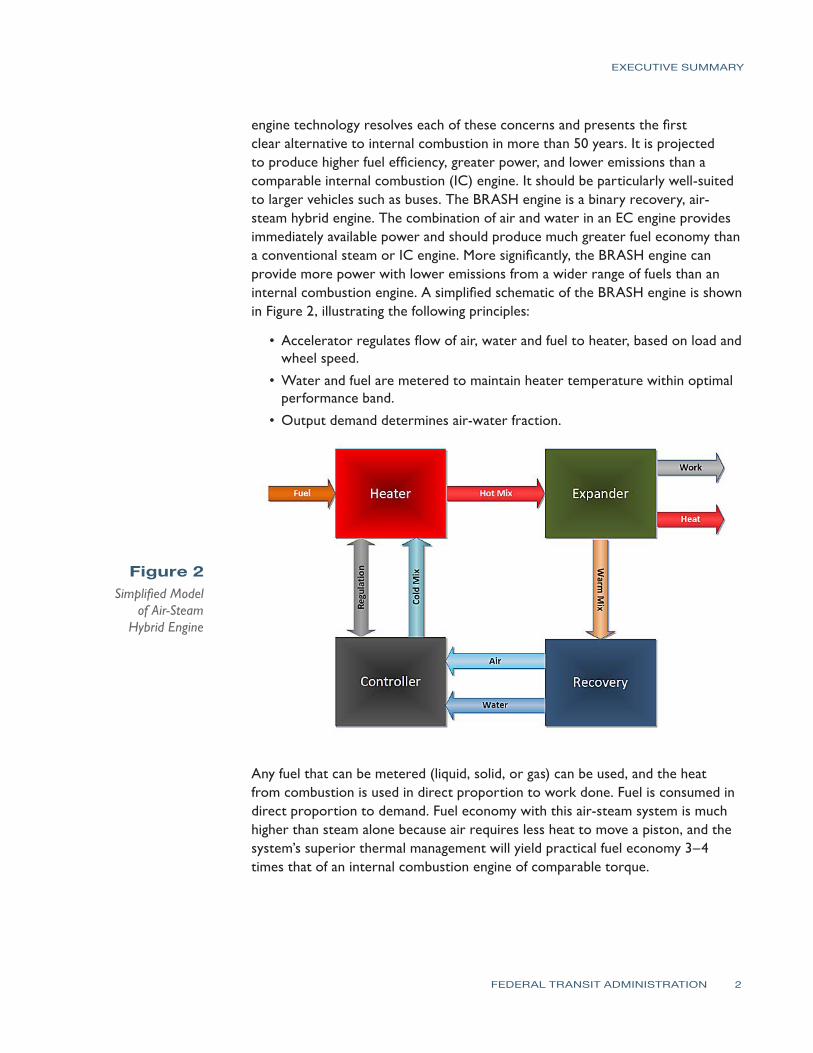
EXECUTIVE SUMMARY
engine technology resolves each of these concerns and presents the first clear alternative to internal combustion in more than 50 years It is projected to produce higher fuel efficiency greater power and lower emissions than a comparable internal combustion (IC) engine It should be particularly well-suited to larger vehicles such as buses The BRASH engine is a binary recovery air-steam hybrid engine The combination of air and water in an EC engine provides immediately available power and should produce much greater fuel economy than a conventional steam or IC engine More significantly the BRASH engine can provide more power with lower emissions from a wider range of fuels than an internal combustion engine A simplified schematic of the BRASH engine is shown in Figure 2 illustrating the following principles
bull Accelerator regulates flow of air water and fuel to heater based on load and wheel speed
bullWater and fuel are metered to maintain heater temperature within optimal performance band
bullOutput demand determines air-water fraction
Figure 2 Simplified Model
of Air-Steam Hybrid Engine
Any fuel that can be metered (liquid solid or gas) can be used and the heat from combustion is used in direct proportion to work done Fuel is consumed in direct proportion to demand Fuel economy with this air-steam system is much higher than steam alone because air requires less heat to move a piston and the systemrsquos superior thermal management will yield practical fuel economy 3ndash4 times that of an internal combustion engine of comparable torque
FEDERAL TRANSIT ADMINISTRATION 2
SECTION Context for BRASH 1 Societal Challengesand Needs
Economic growth in the developed world has been highly dependent on petroleum distillates for nearly a century3 As Figure 3 shows for most of that century the price of oil has remained stable ($10ndash$30 per barrel in 2008 dollars) and relatively low Since the oil embargo of the 1970s and later political instability in large oil-producing regions the price of oil has fluctuated significantly Over the last 40 years each sharp increase in oil prices has been followed by a steep decline in economic activity
Figure 3 Historic Crude
Oil Prices
The long-term trend in oil prices reflects the growing concern that oil quantities are finite while worldwide demand continues to grow4 M King Hubbert first posited in 1956 that US oil production was approaching a maximum rate and past that point when demand exceeded supply prices would rise rapidly to unprecedented levels5 Since Hubbert this model has been extended to worldwide oil reserves and the popular notion of ldquopeak oilrdquo6
Figure 4 shows projections of world oil production beyond 2010 Most models show a decline in supply over the next 20 to 30 years7 This decline in production
3ldquoAnalysis of the Impact of High Oil Prices on the Global Economyrdquo International Energy Agency (IEA) http wwwieaorgtextbasenpsumhigh_oil04sumpdf 4EampP Magazine ldquoGeologists Positive about Future of Oil and Gasrdquo June 10 2009 5Marion King Hubbert ldquoNuclear Energy and the Fossil Fuels Drilling and Production Practicerdquo June 1956 Spring Meeting of the Southern District Division of Production American Petroleum Institute San Antonio Texas Shell Development Company pp 22ndash27 httpwwwhubbertpeakcomhubbert19561956pdf retrieved April 18 2008 6Adam R Brandt ldquoTesting HubbertrdquoEnergy Policy 35(5) May 2007 pp 3074ndash3088 7ldquoMedium-Term Oil Market Reportrdquo July 2007 IEA Public AccessndashOil Market Report httpomrpublicieaorg
FEDERAL TRANSIT ADMINISTRATION 3
SECTION 1 CONTEXT FOR BRASH SOCIETAL CHALLENGES AND NEEDS
would coincide with far greater fuel demand as China India and other parts of the developing world are beginning to embrace the automobile8
Figure 4 Projections
of World Oil Production
The other trend of note related to petroleum usage is the rise of atmospheric CO2 and the growing risk of climate change Figure 5 shows the consistent rise in atmospheric CO2 at the remote Mauna Loa observatory The rise in CO2 levels is attributed to fossil fuel combustion most notably coal-fed power plants and gasoline powered automobiles
Figure 5 Measured
Atmospheric CO2
8Plunkett Research (2008) ldquoAutomobile Industry Introductionrdquo
FEDERAL TRANSIT ADMINISTRATION 4
SECTION 1 CONTEXT FOR BRASH SOCIETAL CHALLENGES AND NEEDS
As shown in Figure 6 the rise in atmospheric CO2 levels correlates with increases in global temperatures As CO2 continues to increase the expectation is further increases in average global temperatures9
Figure 6 Global Warming
Projections
The economic modeling and the environmental modeling point to one conclusion petroleum distillates may be the current source for nearly all of our transportation fuel supplies but its primacy cannot be sustained Whether from a perspective of limited supply and growing demand or the perspective of a growing environmental impact refined petroleum does not provide solutions only difficult and growing problems
Three popular initiativesmdashpetroleum alternatives improved fuel economy and alternative electric vehicle powermdashcannot solve worldrsquos thirst for petroleum distillates
bullPetroleum alternatives like biodiesel or ethanol put fuel in competition for land with our food supply10
bullNoble efforts to increase vehicle fuel economy domestically cannot offset the surging worldwide demand for more vehicles (Figure 7)11
9IPCC ldquoSummary for Policymakersrdquo Climate Change 2007 The Physical Science Basis Contribution of Working Group I to the Fourth Assessment Report of the Intergovernmental Panel on Climate Change Intergovernmental Panel on Climate Change (IPCC)rdquo 2007 httpwwwipccchpdfassessment-reportar4 wg1ar4-wg1-spmpdf retrieved July 3 2009 10The New York Times ldquoFood and Fuel Compete for Landrdquo December 18 2007 httpwwwnytimes com20071218business18foodhtml 11US Information Administration Analysis amp Projections httpwwweiagovoiafforecastinghtml
FEDERAL TRANSIT ADMINISTRATION 5
SECTION 1 CONTEXT FOR BRASH SOCIETAL CHALLENGES AND NEEDS
bullDomestic migration to electric vehicles is constrained by gross vehicle weight and range12 and electric hybrids are still priced at a premium over their non-hybrid versions13
Figure 7 US Energy
Consumption by Fuel
(1980ndash2035)
The goal of lower national fuel consumption is built on the false premise that the transportation sector requires highly-refined fuel Transportation requires highly-refined fuels only if the motive power is derived from timed detonation of a fuel air mixture in the cylinder head In other words the problem is not so much the petroleum itself but rather the virtually universal dependence on internal combustion (IC) engines that require petroleum fuels
If motive power were to come instead from external combustion a far wider array of gas liquid and solid biomassrenewable fuels could be used The goal could shift from ldquomiles per gallonrdquo to ldquoeffective production cost per 100 miles drivenrdquo for a new class of fuels measured by the pound and favored by the rate of production and CO2 absorption during growth
In sum the goal is to reduce the amplitude and slope of the red (ldquoLiquidsrdquo) line in Figure 7 and increase the same parameters of the green (ldquoNonhydro renewablesrdquo) line significantly By migrating to EC vehicles more of the green renewables line can be used in the transportation sector
The driving force behind the world economy is energy It is axiomatic that lower fuel production costs and consumption equals higher economic productivity The solution for the transportation sector is to migrate toward less refined self-renewing fuels
12The New York Times ldquoWill Lithium-Air Battery Rescue Electric Car Drivers from lsquoRange Anxietyrsquordquo May 7 2010 httpwwwnytimescomcwire2010050707climatewire-will-lithium-air-battery-rescue-electric-car-37498html 13ConsumerAffairscom ldquoConsumer Reports Sizes Up Hybrid Costsrdquo March 2006 httpwwwconsumeraffairscomnews04200603cr_hybridshtml
FEDERAL TRANSIT ADMINISTRATION 6
SECTION 1 CONTEXT FOR BRASH SOCIETAL CHALLENGES AND NEEDS
and that can come only through the technical migration toward external combustion BRASH (Binary Recovery Air-Steam Hybrid) technology provides that path
FEDERAL TRANSIT ADMINISTRATION 7
SECTION Technology Background 2 With few exceptions all mechanical work is derived from heat and all that heat is generated by combustion The earliest effective engines were steam engines first put to practical use at the time of US independence Steam engines remained the dominant source for motive power for the next century until its slow but steady displacement by IC engines in the automobile
Henry Ford was first inspired to develop steam traction engines as a better solution than plow horses14
I felt perfectly certain that horses considering all the bother of attending them and the expense of feeding did not earn their keep The obvious thing to do was to design and build a steam engine that would be light enough to run an ordinary wagon or to pull a plow I thought it more important first to develop the tractor To lift farm drudgery off flesh and blood and lay it on steel and motors has been my most constant ambition
Ironically by the 1920s steam traction engines were completely displaced by IC tractors largely the product of the same Henry Ford and his Fordson brand of tractor15
The IC engine was smaller lighter and cheaper to producemdashand considered safer Gasoline- and diesel-powered tractors were more expensive to operate but the most compelling argument for switching was safety in the hands of a lower-skilled operator who no longer had to constantly watch gauges and adjust temperatures and pressures
Similar differences existed in the broader automotive market and the advent of the electric starter effectively ended consumer interest in EC steam cars
Still near the end of the steam car era Stanley Doble White and others offered technically-competitive options The Doble Model E (Figure 8) weighed more than 5500 pounds but achieved in the 1930s the same fuel economy of a comparable IC engine in a contemporary SUVmdash16 mpg The Doble was powered by a four-cylinder engine of 190 cubic inches displacement about the size of an Accord engine but the Doble weighed 67 percent more than the Accord As for emissions one Doble Model E (currently owned by Jay Leno) recently passed California emissions testing with no modifications16
14Henry Ford My Life and Work 1922 15Spencer Yost Antique Tractor Bible 1998 16ldquoJayos Garage 1925 Doble Series E Steam Carrdquo httpwwwjaylenosgaragecomat-the-garagesteam-cars1925-doble-series-e-steam-car
FEDERAL TRANSIT ADMINISTRATION 8
SECTION 2 TECHNOLOGY BACKGROUND
Figure 8 Doble Model E
Doble and Brooks also built passenger buses similar in capacity and weight to contemporary buses The Brooks shown in Figure 9 was powered by a 400-cubic-inch V8 steam engine and carried 29 passengers at 60 mph while turning at 2000 rpm As a cruel twist of fate the public unveiling of the Brooks Steam Bus was announced in October 1929 two weeks before the stock market crash and the onset of the Great Depression17 The company did not survive
Figure 9 Brooks Steam Motors Bus
17Wikipedia ldquoBrooks Steam Motorsrdquo httpenwikipediaorgwikiBrooks_Steam_Motors
FEDERAL TRANSIT ADMINISTRATION 9
SECTION 2 TECHNOLOGY BACKGROUND
The suitability of steam power for mass transit use can be seen from comparison of a very powerful contemporary Ford V-8 Diesel engine (from the Excursion SUV) to the Besler V-Twin Steam engine circa 1938
Ford Turbo Diesel Besler Steam Configuration V-8 V-2 Displacement (cuin) 445 80 Horsepower 175 150 Torque (ft-lbs) 420 1200 Engine wt w transmission (lbs) 930 80
The Besler is roughly one quarter the size and weight of the V-8 Turbo-Diesel but has equivalent horsepower and three times the available torque (the primary determinant of performance) The Detroit Diesel Series 60 six-cylinder engine commonly used in mass transit vehicles produces marginally more torque (1450 ft-lbs) than the Besler from twice the horsepower and with much more fuel
Steam engines make greater use of the energy contained in the fuel by separating the heating phase of the Carnot cycle from the expansion phase and metering fuel burn to more closely match demand A steam engine presents maximum torque at low speed and greater horsepower and torque than comparable IC engines
Another EC technology gaining resurgent interest is compressed air power Recent reports of collaboration between MDI of France and Tata Motors of India suggest a new approach toward EC engines18 Tata Motors a major producer of vehicles on the Indian subcontinent intends to produce the MDI Air Car in the near future with anticipated fuel economy of 106 mpg The latest iteration of the MDI Air Car shown in Figure 10 has a projected range of 848 miles from 8 gallons of fuel or 106 mpg for a 4-passenger vehicle weighing 1870 pounds19
The MDI City Car relies on a six-cylinder 75 HP engineexpander to achieve this performance and in the ldquoprocess [produce] emissions of only 0141 lbs of CO2
per mile That is hellip less than [half] the cleanest vehicle available todayrdquo (Toyota Prius 07 Emissions 034 lbs of CO2 per mile)
18Autobloggreen ldquoA New Agreement between Tata Motors and MDI Bring the Air-Car Closer to Realityrdquo March 21 2007 httpgreenautoblogcom20070321a-new-agreement-between-tata-motors-and-mdi-bring-the-air-car-cl 19Motor Development International (MDI) OneFlowAIR httpwwwmdiluenglishoneflowairphp
FEDERAL TRANSIT ADMINISTRATION 10
SECTION 2 TECHNOLOGY BACKGROUND
Figure 10 MDI Air Car
The schematic for the MDI power plant is shown in Figure 11 The stored air is heated to combustion temperatures and allowed to expand mechanically This is the practical definition of an EC engine where combustion provides heat but the working fluid or propellant is not generated by the combustion process itself
Separating the heating step from the expansion step does not in itself yield higher fuel economy or lower emissions But the regulation of fuel flow to maintain optimum propellant temperature immediately prior to expansion provides both maximum fuel economy and lowest possible emissions In contrast an IC engine ignites fuel at 1800degF and immediately conducts that heat away through its water jacket to drop cylinder temperatures to 200ndash300degF EC engines preserve that heat for useful work
Figure 11 MDI Air Engine
Schematic
FEDERAL TRANSIT ADMINISTRATION 11
SECTION 2 TECHNOLOGY BACKGROUND
Both air and steam engines provide an alternative to the conventional IC engine Both operate from a variety of fuels and offer the potential of lower emissions and higher fuel economy Steam is the more robust of the two (the Besler Steam Twin is much more energetic than the MDI six-cylinder) but the compressed air engine offers an operational simplicity and a lower weight because no boiler or condenser is required Unfortunately it can never provide the power and acceleration of steam
The best of both worlds would be a blending of air and steam into a single engine that offers all of the benefits but without the weight and heat management issues of a boiler and with significantly more power than an air engine alone
FEDERAL TRANSIT ADMINISTRATION 12
SECTION The Air-Steam 3 Hybrid Solution
Air and water are completely different in their physical properties except when they operate as working fluids at high temperatures and pressures At steam operating pressures and temperatures their behavior largely follows ideal gas behavior and each is miscible in the other at all proportions The arrow in Figure 12 indicates the rough path for expansion of the hot high-pressure propellant and shows near ideal gas behavior for steam at these elevated temperatures and pressures
Figure 12 Does Steam
Behave Like an Ideal Gas
Getting to steam operating temperatures and pressures requires that significantly more heat be applied to water than air at STP (standard temperature and pressure) Air requires only 642 kcalmole to reach these operating temperatures while water (steam) requires 5236 kcalmole (due to the 512 kcal heat of vaporization) In this development a baseline flow of air is used to entrain water into the heater section Fuel is consumed in direct proportion to the water fraction to maintain the heater at a near constant temperature The heat required to maintain ldquohot airrdquo temperatures is a small fraction of the heat required to maintain steam temperatures as shown in Figure 13
FEDERAL TRANSIT ADMINISTRATION 13
SECTION 3 THE AIR-STEAM HYBRID SOLUTION
Figure 13 Heat Required
to Raise Air and Water
Temperature to 1000degK
The compressed air fraction provides a safe and consistent flow pressure into the hot section The water once heated to working steam temperature provides a more robust working fluid
The hot mixed propellant is injected into the expander moving a piston and converting heat to motion The expanded propellant thereby drops to condensing temperatures allowing the water portion to drop to a sump for pumped return to the injector The expanded air fraction is then recompressed for return to the injector
The use of an air fraction allows for immediate injection of work-appropriate amounts of water into the hot section no boiler no steam under pressure no fuel wasted (heating steam without immediate purpose) The use of a water fraction (and proportional fuel flow) allows for variable power from a constant temperature system The binary (air-steam) propellant allows for a closed-loop condensing recovery system extending range and economy
Figure 14 Schematic of Injector Nozzle Used to Mix Air
and Water
FEDERAL TRANSIT ADMINISTRATION 14
SECTION 3 THE AIR-STEAM HYBRID SOLUTION
The sum of the process is as follows
Key start begins a modest fuel burn that immediately provides initial hot air flow through the engine
bull Depressing the accelerator increases the water fraction and fuel flow (in direct proportion)
bullThe vehicle moves forward under (airsteamfuel) power in direct proportion to wheel turn
bullThe hot mix expands and the expanded mix condenses the water fraction
bullA small parasitic load recompresses the small air fraction to reinjection pressures
bull Removing the foot from the accelerator returns the flow to hot air only sweeping residual moisture from the cylinders and preventing hydraulic lock (during next cold start)
The engine can operate on any fuel whose flow can be regulated (semi-solid liquid gas) Combustion occurs at high temperature at one atmosphere so much cleaner burning than internal combustion
Figure 15 Air-Steam Hybrid
Schematic
Accelerator regulates flow of air water and fuel to heater based on load and wheel speed Water and fuel are metered to maintain heater temperature within optimal performance band
Output demand determines air-water fraction
Any discussion of fuel efficiency relative to current IC engine technology must first re-emphasize the multi-fuel capability of EC engines In a market so dominated by one fuel customers have accepted the term ldquomiles per gallonrdquo
FEDERAL TRANSIT ADMINISTRATION 15
SECTION 3 THE AIR-STEAM HYBRID SOLUTION
as the basis for comparison But in an open market with many different fuels and widely different heat content (BTUlb) the only common and appropriate denominator is ldquomiles per dollarrdquo (closer to ldquofuel economyrdquo)
To the extent that any EC solution gains market acceptance and the market responds with new and different fuel blends the law of supply and demand dictates that fuel prices for all will drop Until then the remainder of this efficiency discussion will assume all engines require the same petroleum-based fuel
The long-accepted estimate of fuel efficiency for the IC engine is about 25 percent with the remaining 75 percent of the heat content dissipated in equal parts through the hot exhaust the radiator and mechanical losses in the engine Much has been done to raise that efficiency but what remains is one power stroke in four and a high temperature detonation whose heat content is quickly and intentionally dissipated through conduction
In sharp contrast a steam engine is designed to preserve as much heat as possible from combustion and then mete out that heat through the expansion of the working fluid Instead of a 25 percent heat loss through conduction through a radiator conductive loss is limited to 10 percent in efficient steam engines The greatest loss is through the vaporization of water to steam (at 30) yielding useful work of 35 or 40 percent higher than internal combustion Steam vehicles often report significantly lower practical fuel economies as the whole boiler is heated for a relatively short trip (another reason to avoid using a boiler)
Hot air engines involve no change of state therefore avoiding the loss associated with vaporization That can mean fuel efficiencies approaching 65 percent except as noted with the MDI engine a lower power-to-weight capability
The combination of air and steam into a single engine type is expected to yield economies between 35 and 65 percent varying with wheel load A 50 percent net efficiency would double fuel economy over a comparably-sized IC engine but as shown with the Doble and Besler examples the EC engine can be much smaller yielding even greater economies
FEDERAL TRANSIT ADMINISTRATION 16
SECTION 3 THE AIR-STEAM HYBRID SOLUTION
Figure 16 Fuel Efficiency
by Engine Type
Derivative Uses As much as this study is focused on large motive power applications it should be noted that an equally important opportunity for this technology is in stationary power applications similar in configuration to combined heat and power units referred to generally as micro-CHPs Rapid start-up high torque quiet operation and multi-fuel compatibility make it well suited to an integrated heat and electrical power installation
FEDERAL TRANSIT ADMINISTRATION 17
SECTION 3 THE AIR-STEAM HYBRID SOLUTION
Its ability to produce a full range of power options (mechanical pneumatic heat and through attached accessories electrical and hydraulic) in a small modular man-portable configuration also make it particularly well suited to temporary or tactical power requirements Although beyond the scope of the DOT goals for vehicular use this stationary power applicationrsquos potential may be strategically important in market acceptance and adoption by expanding the range of applications and thereby providing economies of scale in all aspects of development production and commercialization activities for all applications
FEDERAL TRANSIT ADMINISTRATION 18
SECTION BRASH Test Plan 4 This Phase I effort followed the Technical Objectives outlined in the proposal as follows
Practical Objectives 1 Modify the Smarttrade sized test vehicle (Figure 17) installing a 10ndash20 HP
equivalent heater a 650 cc displacement 2 HP (nominal) Quasiturbinetrade steam engine pressurized air and water tanks electronic flow regulation of air water and fuel via laptop-based LabVIEW software and solenoid valves
2 Perform test runs to validate the system operation and determine key baseline performance parameters such as
a minimum air fraction to maintain engine operation upper limits for operating temperatures maximum allowable flow rates for water (without reducing effective propellant flow at temperature)
b upper limits of vehicle speed while varying gross vehicle weight and course incline
3 Following baseline performance assessment further objectives included
a an analysis of component placement for ease of maintenance and replacement
b an estimation of comparable volumes and weights to an equivalent IC powertrain in order to verify retrofitability
c an estimation of effective fuel economy while using propane fuel on closed track mileage runs
Figure 17 Smarttrade
Car-Sized Test Vehicle
FEDERAL TRANSIT ADMINISTRATION 19
SECTION 4 BRASH TEST PLAN
4 Over the course of multiple test runs a cumulative assessment of component performance and reliability would lead to a gross verification of BRASH engine integrity and range That in turn could lead to off-site vehicle demonstrations to federal agencies potential industry partners and investors
Analytical Objectives 1 The BRASH engine model has been demonstrated only at a bench level with
rudimentary understanding of its operating principles A key objective in this vehicle build is to increase the thermodynamic modeling of this technology including an analysis of mass flow (air water fuel) and resulting power
2 Early test data would lead to analysis of specific on-vehicle capacities (for air water and fuel) and flow rates for same in order to estimate operating range recovery strategies and rates (recompression and condensation) and the parasitic loads (eg alternators pumps) to sustain useful operation for many hours
3 Over time the vehicle testing under various test conditions (eg varying gross vehicle weight wheel load engine temperature propellant mix) will lead to a body of data to support more complete modeling of water fraction vs torque vs temperature These data are essential to real-world estimation of fuel economy as this technology scales to larger practical vehicle applications
4 With the modeling from 3 in place for steady-state operation practical track runs with frequent starts and stops can further shape the model for real-world use
5 The analysis from steps 1ndash4 will provide sufficient basis for estimating the mass flow heat component capacity recovery factors and fuel economy for scaling this 2 HP test data to larger vehicles in two decade steps first to a 20 HP pickup truck and then further modeling and custom buildup of a 200 HP power plant with a DOT-identified industrial partner
6 This analytical plan is consistent with the overall SBIR program plan as the 2HP effort is confined to Phase I the 20 HP build and test plan would be accomplished in Phase II and the design and build of the 200 HP power plant would be accomplished in Phase III with an established industry partner
The work effort toward completion of these tasks has proceeded on two tracks mechanical modifications to the April test vehicle and electronic control and measurement
Mechanical Modifications and Test Configuration The test vehicle is a modified electric car about the size of a Smarttrade car Earlier modifications included removal of the electric drive train exposing a large working
FEDERAL TRANSIT ADMINISTRATION 20
SECTION 4 BRASH TEST PLAN
space behind the cab This rear space over the rear left wheel contains a 2HP Quasiturbinetrade steam engine20 selected for its compact design and suitable power range for this 700-pound vehicle The placement over the left wheel permits direct drive to that wheel via electric clutch and chain drive
Figure 18 Quasiturbinetrade
Rotary Expander Installed and Interior View
In the center of center of this rear space a heavily-modified propane space heater rated at 30000ndash80000 BTUhr (equivalent to 11ndash31 boiler horsepower [bhp]) was installed Heaters of this type generally are designed to efficiently distribute heat into an adjoining space This heater was heavily modified with high temperature insulation and outer shells to retain useful heat to the 20-ft stainless steel coil passing through its core
Figure 19 Quasiturbinetrade
Rotary Expander Installed and Interior View
the expander and heater (with recent refinements) Also visible under the heater is the pressurized water tank (painted grey) The open space to left of the heater is reserved for drive components The space to the right of the heater is reserved for recovery and recompression of the expanded propellant (Recompression is outside of the current scope to simplify the testing and analysis See discussion section for more information) Other system components include air cylinders and electronic controllers that are mounted forward of the rear firewall in the cab or under the front hood
Figure 20 shows the back of the vehicle with fenders and trim removed revealing
20Quasiturbinetrade Product Details httpquasiturbinepromciqcca
FEDERAL TRANSIT ADMINISTRATION 21
SECTION 4 BRASH TEST PLAN
Figure 20 Test Configuration
Figure 21 System Components
The main system components are shown Minor components and linkage tomechanical output are not included in this report for the sake of simplicity
Electronic Control and Measurement No realistic progress toward a vehicle demonstrator with known and regulated fuel use can proceed without electronic regulation In this build the LabVIEW program and system components from National Instruments were used to create a ldquoglass cockpitrdquo of vehicle controls and performance measurement21 The simplified schematic in Figure 22 shows the planned integration of electronics in this development LabView-compatible components will replace all mechanical flow and measurement components
21More information can be found at National Insturments The LabVIEW Environment httpwwwnicomlabview
FEDERAL TRANSIT ADMINISTRATION 22
SECTION 4 BRASH TEST PLAN
Figure 22 Electronics
Schematic for Air-Steam Hybrid
For the vehicle driver the dashboard collection of gauges has been replaced with a laptop screen similar to the one pictured in Figure 23
Figure 23 Front Screen Display for Air-Steam Hybrid
Certain features on this front screen will reflect user input (OnOff Throttle) while others reflect the dependent variables in the process (Heater Temp Fuel Flow Air and Water Flow) Shown on the bottom screen will be running time-series data on speed wheel load temperature specific fuel consumption and the other variables important to the analytical process The front screen display is generated from programming and controls on the back screen display
FEDERAL TRANSIT ADMINISTRATION 23
SECTION 4 BRASH TEST PLAN
Figure 24 Back Screen Display for Air-Steam Hybrid
LabVIEW software and controllers were chosen because of National Instrumentsrsquo status as the industry leader in rapid control prototyping and In-Vehicle data-logging solutions BKi purchased the LabVIEW componentry through the University of Connecticut Mechanical Engineering Department as part of UConnrsquos ongoing support of the project
By the end of the contract term in October 2010 the air and water regulation components were complete and operational but the fuel regulation and engine speed components were not yet fully operational To generate the most meaningful data under these circumstances the test vehicle was configured for extended operation to determine specific fuel water and air consumption rates The combination of these rates provided the basis for initial estimates of power and efficiency
Summary of Effort Mechanical Modifications
1 Removal of original electrical drive components reinforcement of frame
2 Installation of Quasiturbinetrade 2HP engine modified heater pressurized water tank all pneumatic water and fuel lines
3 Baseline validation testing using manual controls
4 Installation of electronically-regulated flow controllers
Electronic Modification 1 Acquisition of computer electronic regulators and control software
2 LabVIEW systems programming
3 System checkout
FEDERAL TRANSIT ADMINISTRATION 24
SECTION 4 BRASH TEST PLAN
Testing and Analysis 1 Static Safety Testing 2 Baseline vehicle drivetrain testing
3 Vehicle static testing (Runs 3 amp 5)
Summary of RequirementsGoals 1 Safe operation of vehicle during static and motive applications
2 Qualitative demonstration of BRASH engine capability to move test vehicle on flat and inclined road surface
3 Quantitative determination of air water and fuel consumption during timed static test
4 Quantitative determination of air water and fuel consumption while varyshying water and fuel fractions
Summary of Testing Two experiments were performed in late November the first to establish minimum fuel and propellant flow rates for sustained operation at low speed (air-rich mode) and the second to establish reasonable upper limits of fuel and propellant flow at higher engine speeds (steam-rich mode) Variation in the air-steam mix is the underlying theory of operation for the BRASH engine the air fraction provides a baseline flow for initial start-up and low-speed operation but the addition of water (as steam) to the propellant results in a significant boost in range and power These two tests have verified this underlying theory
Test Conditions The two test runs summarized in this report are 3 on November 22 2010 and 5 on November 26 2010 Both tests were performed at the Depot D campus of the University of Connecticut in Storrs The testing was performed outside in seasonal conditions 45-50degF with light winds
Figure 25 Vehicle Test Setup
FEDERAL TRANSIT ADMINISTRATION 25
SECTION 4 BRASH TEST PLAN
Each run was a dynamic test with no load on the two-cylinder Quasiturbinetrade engine The propane cylinder was suspended from a scale for the duration of the test Propane fuel consumption was monitored continuously by digital scale with a display accuracy of 001kg
Each test run lasted for the duration of one high pressure air cylinder Air cylinder start (full) and end (empty) were determined at the start and finish of each run using the same scale and accuracy Water levels initially were determined volumetrically but the results were too inconsistent Displaced volume of liquid water proved a poor measure of the quantity heated to steam and carried forward for productive work For this reason water is an estimated quantity based upon fuel quantity burned less heat absorbed by the air fraction (Further integration of the LabView controller software in the next phase will obviate this work-around)
Each of the complete test runs may be viewed at Brash Engines website httpwwwbrashenginescom Photos from each run appear in the figures that follow Tables 1 and 2 summarize the productive mass flow for air water and propane fuel to produce work from the engine for the test duration
The cab interior in Figure 26 shows the high pressure air cylinder below the steering wheel and the laptop computer (regulating propellant flow) in passenger seat space The LabView controllers reside in the protective case under the laptop
Figure 26 Vehicle Cab with Controller Laptop
During each test hot propellant was allowed to expand and vent to ambient in order to simplify the thermodynamic model and analysis (Note the plumes of water vapor from each exhaust hose and the small puddles of water under each hose in Figure 27)
FEDERAL TRANSIT ADMINISTRATION 26
SECTION 4 BRASH TEST PLAN
Figure 27 Exhaust Plumes from Expander
Development plans include recovering the expanded propellant separating into water and air phases and then recompressing the air fraction for re-use This will both improve efficiency and eliminate the visible vapor plume
Test Assumptions Another estimation used in this study is the efficiency of heat transfer for the propellant through the 20-ft coil of stainless steel inside the insulated heater Figure 28 shows an early ldquoair-onlyrdquo test run with the current heater The hose failure and melting of the steel wire mesh inside (note formed ball in the mesh) indicates 1300degK temperatures exiting the hot section
Figure 28 Hose Failure Due
to Overheating
FEDERAL TRANSIT ADMINISTRATION 27
SECTION 4 BRASH TEST PLAN
Effective heat transfer (as Figure 28 shows) does not equal efficient heat transfer but the ability to deliver 1300degK air from a well-insulated burner suggests a highly efficient transfer of heat The analysis of results assumes a value of 90 efficiency (See Appendix A for a discussion of heat transfer efficiency)
3 Low Speed Test On November 22 2010 Run 3 tested the lower operating limits of the test setup Low limit in this context meant sufficient pressure to maintain expander rotation but low steam and fuel burn The test commenced with a full air cylinder weighing 661 Kg At the end of the test the empty cylinder weighed 460 Kg Over the 7 minutes and 15 seconds of testing 006 Kg of propane was consumed
The mass of air and fuel was determined from before after run test weights As stated earlier determining the quantity of steam produced from the pressurized water tank was problematic because of the quantity of stored water the resistance to water flow under dynamic pressures and the potential for some fraction of the water (in liquid state) to be entrained in the propellant mix
To solve for this unknown the energy required to raise the known quantity of air from ambient to 1000degK (33kcalmol or 0467 BTUg) was subtracted from the energy content of the propane consumed (44 BTUg) and then the efficiency of the heat transfer process was de-rated by 10 percent to yield a net quantity of 1438 BTUs to elevate ambient temperature water to 1000degK steam The result is an estimated 125 grams of water consumed in the 7-minute test
Table 1 summarizes these data and shows a high reliance on the air fraction for the work performed by the 2 HP engine The air cylinder used in this test has a measured free volume of 45 cubic feet (1274 liters at STP) which means sustained flow rates of 62 cubic feet per minute (cfm) or 175 liters per minute In contrast the 125 grams of water passed through as steam produced an estimated equivalent gas volume of 155 liters at STP Note the modest levels of water vapor in Figure 29 Why the greater air fraction relative to water flow in this test
Air (Wt 000Kg) 661 460 201 938 1294 30 36
Water2
(Wt 000Kg)
Propane(Wt 000Kg)
Time (hrmnsc)
1562
123000
1556
123715
00125
006
00715
1438
2640
na
1983
364
na
47
86
54
90
1 Energy value based upon absorbed heat (italicized) from STP to 1000degK (0446 BTUg for Air 115 BTUg water) 2 Determined by difference from propane and air energy assumed value 90 3Arbitrary estimated efficiency of heat transfer not effective work
11222010 - 3 Low Speed Run Air Pressure 60 psi Water Head Pressure 60 psi
Component(BTU) Start End Net Energy1
(BTU) Power
(BTUmin) Power (HP) Efficiency3
Table 1 Analysis of Mass
Flow Data at Low Speed
FEDERAL TRANSIT ADMINISTRATION 28
SECTION 4 BRASH TEST PLAN
Figure 29 Low-Speed Test Results in Little
Water Vapor
In this baseline experiment the single cylinder provides 60 psi air flow and 60 psi static ldquoheadrdquo pressure on the water column The air flow from the cylinder is biased toward the generally less restrictive flow path for air The water column under the same pressure presents a higher viscosity medium passing through a greater number of valves and restrictions At the point of injection the air fraction flows more freely into the hot section In order to bias the mix toward greater water fraction (and greater power) the head pressure on the water column must be increased over the 60 psi air line pressure
Run 4 (not documented here) evaluated head pressures from 110 psi to 70 psi and determined that modest differential pressures retarded the flow from the air fraction and boosted flow of the water fraction Still higher differential pressures effectively stopped air flow altogether reverting the engine operation to ldquosteam onlyrdquo For Run 5 an additional cylinder was used to apply a 70 psi static head pressure on the water column a 10 psi differential over the 60 psi air line pressure
5 Variable High Speed Test On November 26 2010 Run 5 tested the higher differential water pressure as a means to increase the effective water fraction in the propellant mix The test commenced with a full air cylinder weighing 654 Kg At the end of the test the empty cylinder weighed 472 Kg Run 5 was interrupted after 243 minutes to refill the water tank and then testing resumed for an additional 907 minutes Over the whole test 027 Kg of propane was consumed
Using the same analytical basis as Test 3 Test 5 data indicate a substantial increase in work capacity (as measured by fuel consumed and steam generated) over the 3 baseline
FEDERAL TRANSIT ADMINISTRATION 29
112610 - 5 Variable High Speed Run Air Pressure 60 psi Water Head Pressure 70 psi
Air (Wt 000Kg)
Component(BTU) Start End Net Energy1
(BTU) Power
(BTUmin) Power (HP) Efficiency3
654 472 182 849 718 17 7
SECTION 4 BRASH TEST PLAN
Table 3 Comparison of Mass Flows
Water 588 Runs 3 and 5
163 Duration (mn) 725 1180 725 1180 163
Air
Component Run 3 BHP
Run 5 BHP
Net ChngBHP
Run 5 Mass
Transfer (kg)
Net ChangeMass
Transfer (kg)
30 17
197
237
-45 2010 182 -9
Run 3 Mass
Transfer (kg)
276 350
47
86
422
0060
0013
0270
0086
Propane
This difference in steam fraction and power is more clearly seen in Figure 30 (and on the source video at the Brash Engines website)
Figure 30 Three Images from Run 5
Table 2 Test 5 Results with Increased
Water and Fuel Water2
(Wt 000Kg) 0860 9890 8358 197 83
Propane(Wt 000Kg) 1520 1493 27 11880 1004 237 90
Time (hrmnsc) 133000 134150 01150 na na na na
1 Energy value based upon absorbed heat (italics) from STP to 1000degK (0446 BTUg for Air 115 BTUg water) Underlined value is released heat at generally accepted 44 BTUg 2 Determined by difference from propane and air Energy assumed value 90 3 Arbitrary estimated efficiency of heat transfer not effective work
The increase in pressure on the water column by 10 psi reduced air flow by 9 percent but increased the steam fraction considerably and thereby increased the effective boiler horsepower nearly three-fold to 237 bhp (assuming 90 heat transfer) These data are summarized in Table 3
FEDERAL TRANSIT ADMINISTRATION 30
SECTION 4 BRASH TEST PLAN
As with Run 3 start up from Time Zero was immediate burner on air flow begins and water flow under pressure commences immediately Another impressive feature of the mix air-steam propellant system is the ability to start stop and rapidly accelerate as shown in the full Run 5 video Run 5 serves as validation that this patented technology has unique performance benefits over air steam or internal combustion alone
Lessons Learned A comparison of the two test runs verifies some key points
1 The same power plant can produce variable power and fuel economy based upon power demand and airsteam mix
2 Although imprecise at this point in testing fuel consumption appears directly proportional to engine speed The engineexpander will spool up spool down stop and restart in a manner consistent with fuel and propellant flow The Run 5 video on the Brash Engines website verifies this conclusion
3 The use of a defined static air pressure ldquoheadrdquo over the water column at a pressure higher than the defined air line dynamic pressure provides a safe and predictable bias toward flow from the water fraction
4 Although the current test configuration offers sufficient performance for this initial demonstration phase the following observations are in order
a The heater path is too long creating latent response issues
b The airwater injector is not optimized for proper mix or flow capacity
c The incomplete integration of LabVIEW compromises the quality of data
d The absence of a measured variable load on the expander compromises any analysis of power and fuel economy
5 The design migration to a vehicle installation was premature The project should move back to a lab bench study to refine the regulation of components complete the recovery and recompression portions of the system and use electromechanical loads to estimate power and useful work for specific quantities of fuel water and air
6 The Quasiturbinetrade engine technology is promising but too immature for larger-scale modeling Later phases of the project should rely on more conventional multi-cylinder piston-type expander
Estimated Fuel Economy Mass transit authorities have relied on large diesel engines such as the Detroit Diesel Series 50 and Series 60 engines for more than 30 years Reports on fuel economy vary from a high of 60 miles per gallon (Diesel) for longer-range
FEDERAL TRANSIT ADMINISTRATION 31
SECTION 4 BRASH TEST PLAN
commuter services in California23 to a low of 228 miles per gallon (Diesel) for city buses with frequent stops in New York City24 In both cited studies the migration to compressed natural gas (CNG) has resulted in lower fuel economies on a Diesel Gallon Equivalent (DGE) basis
Table 4 summarizes this study (columns 2 and 3) and the next proposed phase (columns 4 and 5) the performance of the current fleet of mass transit buses (columns 6 and 7) and the likely outcome if the Besler engine (described earlier) were employed with the air-steam hybrid technology (columns 8 and 9)
Table 4 Comparison of
Fuel Economies
Air
1
Configuration
Engine
HP
Torque
Fuel
gmin
BTUhr
GGEhr
mpg 60mph
GGE100 mi
$ per GGE
$100 mi
Current
Example
2
3
3
5
4
Bench
5
S-10
6
SB Bus
7
NYCT
8
50 eff
9
30 eff
86
Quasi
2
Prop
82
216
02
3160
03
30
09
Current
237
Quasi
2
Prop
23
607
05
1126
09
30
27
UC 1
40
6 cyl
20
Prop
40
1056
09
648
15
30
46
UC 2
80
6 cyl
40
Mix
80
2112
19
324
31
30
93
MCI102
DD S60
350
1450
Diesel
540
11400
100
60
167
35
583
Diesel
23
439
35
1535
300
Besler
150
1200
Mix
300
792
695
864
1158
16
1853
500
Besler
150
1200
Mix
500
1320
1158
518
1930
16
3088
The Besler engine is shown in two columns The left column reflects the higher efficiency anticipated with the air-steam hybrid mix described earlier as at or near 50 percent The right column reflects the historical efficiency realized with steam engine technology The italicized numbers near the bottom of the column show that even at historical efficiencies the Besler engine would offer equal or better Gasoline Gallon Equivalent (GGE)100 mile ratings of the current diesel technology but migrating toward less refined and (therefore) less expensive fuels would significantly reduce the operating cost ($mile)
23Demonstration of Caterpillar C-10 Dual-Fuel Engines in MCI 102DL3 Commuter Buses National Renewable Energy Laboratory httpwwwnrelgovdocsfy00osti26758pdf p 7 24R Barnitt ldquoNew York City Transit (NYCT) Hybrid (125 Order) and CNG Transit Buses Final Evaluation Resultsrdquo November 2006 National Renewable Energy Laboratory K Chandler Battelle Technical Report NRELTP-540-40125 November 2006 httpwwwnrelgovvehiclesandfuelsfleettestpdfs40125pdf pvii
FEDERAL TRANSIT ADMINISTRATION 32
SECTION 4 BRASH TEST PLAN
There are of course two orders of magnitude difference between the results of Runs 3 and 5 and the daily demands of city and commuter buses but the mere existence of the Besler Twin and the Brooks V-8 400 HP engine suggests an opportunity for fuel economy and fuel variety
Proposed further support for the next phase of development will advance the air-steam hybrid technology by an important order of magnitude This would provide the data confidence to scale to larger vehicle operation and garner the interest of one or more engine or vehicle OEMs
Figure 31 MTANew York City
Transit Orion VII Next Generation
Hybrid Transit Bus
Next Development Phase The next phase of development will incorporate a modern six-cylinder steam engine design with a displacement of 53 cubic inches and capable of sustained 15-25 HP operation The expander will be supplied by Steam Engine Power Inc (httpwwwsteamenginepowercom) This expander will drive an alternator generator to measure effective work output in watts as well as provide sufficient power to satisfy the system parasitic loads of battery recharge exhaust air recompression and all other pump and valve operations
Figure 32 (l to r) Six-Cylinder Expander Power Generation Load
Small 24 VDC Compressor
FEDERAL TRANSIT ADMINISTRATION 33
SECTION 4 BRASH TEST PLAN
Static pressure for the water column will still be supplied via compressed air cylinder but the dynamic air flow will be supplied by an oil-less air compressor of the size and type shown This 24 VDC compressor will recompress the recovered air exiting the expander to 40ndash60 psi pressure and support flows of 3ndash4 cubic feet per minute (cfm) These three components are off-the-shelf enhancements to the system but custom engineering of a new more powerful and more responsive heater completion of the electronic integration and design and fabrication of the recoveryrecompression components are necessary tasks that must be included to make the next generation assembly work to its potential This work will be accomplished largely by Mechanical and Electrical Engineering students at the University of Connecticut under the supervision of faculty and Brash Engines personnel
When this build is complete all operations will be under LabVIEW control All expander operations will be measured for power and work Once the bench version is in control a modified version will be installed in a small pickup truck (eg Chevrolet S-10) for further verification of system performance and robustness
During this phase a new and promising technology will be investigated a new and faster class of solenoid valves from National Instruments These solenoid valves with an unprecedented 3 msec response time have the potential of allowing air-steam retrofit in existing engine blocks The solenoid valves could replace the spark plugs in conventional IC engines and provide the equivalent timed injection of hot propellant mix as the timed firing of a spark plug in the presence of a fuel air mix
If possible these fast solenoids and the black box programming to control them could allow very easy portability to larger vehicles and easier retrofit Potentially a V-6 engine could operate 4 cylinders for expansion and the remaining two cylinders could be used as direct drive compressors with different but equivalent solenoid valves controlling the compression process
FEDERAL TRANSIT ADMINISTRATION 34
SECTION Development Plan 5 and Next Steps
This current effort is a key first-proof of concept for this air-steam hybrid technology but our goals extend well beyond this two-seat 2 HP demonstrator The lessons learned in electronic integration will allow rapid migration to larger platforms using the same basic controls but scaling the expander heater and other mass-flow components to vehicle-appropriate size That project identified as ldquo20 HP Vehiclerdquo and other near-term derivative projects are listed in Table 5
BRASH Project
ProposedFunding Source
Funds Reqd $K Project Description
SUV-size proof-of-concept for reliable 20 HP Vehicle DOTUSPS 300 highway performance maildelivery
vehicle size
Proof-of-concept mass transit busshy200 HP Vehicle DOTDOD 600 retrofit scaled to city bus capacity and
suitable for replacement of over-the-road diesel engines
Table 5 Project Funding
Stationary Power Unit Micro-CHP Equivalent
DARPA 300 Proof-of-concept mass transit bus-retrofit scaled to city bus capacity and suitable for replacement of over-the-road diesel engines
Summary Alternative Processed Solid Fuel DOE EPA DOA 600
Processed mix of hydrolyzed wood pulp processed solid waste and other combustible solids in an extrudable mass with alcohol solutevehiclemdashdemonstrate utility in vehicles as a high energy content clean burning fuel for EC engines
Demonstrate effective pyrolysis of
Binary Solid Gas Fuel
EPA Waste Management BFI
400 processed solid fuels in a binary fuel burner conventional fuel (gasoline natural gas) provides primary heat source for pyrolysis temperatures
Proof of Concept OEM Power Plant
Vehicle OEM (eg Ford GM Caterpillar) 1200
Development of direct replacement BRASH engine alternative to existing OEM IC engine
Black Box Integration of Controller Software
Vehicle OEM (eg Ford GM Caterpillar)
1600 Development of commercial BRASH system alternative to existing OEM IC engine
FEDERAL TRANSIT ADMINISTRATION 35
SECTION 5 DEVELOPMENT PLAN AND NEXT STEPS
The issuance of US Patent 7743872 five months ago has two important consequences for this project First it serves to validate the underlying technology the combination of air and steam in an EC engine is better than steam or air alone Second it provides a basis for full and open discussions with government agencies and large commercial interests in the transportation and power sectors
Our efforts at promotion have been delayed pending successful demonstration of the Smarttrade car vehicle to allow the first detailed real-world performance data to be distributed
Coupling that performance data with the option of migration away from refined petroleum should spark significant interest If we can move to a high lignin-processed wood pulp that costs $045 per gasoline gallon equivalent (an arbitrary value for example only) and consumes more CO2 while growing than is consumed in processing as a fuel and produced from combustion then we succeed as a project and as a global game-changing technology for many uses Improvements in fuel economy are important but of greater importance is the migration to low-process biomass fuels
FEDERAL TRANSIT ADMINISTRATION 36
SECTION Potential Applications and Societal Value 6 The whole premise behind the BRASH air steam hybrid is that external combustion offers a more benign and environmentally-appropriate way to power large vehicles and other portable equipment than refined petroleum-powered internal combustion
bullCombustion heat can be derived from any fuel source including processed solids from fast-growing renewables such as poplar trees waste corn stalks or switch grass
bullThat combustion heat is applied at a rate consistent with the work to be done and not to support idling and other unproductive fuel use
Using a mix of air and steam as working fluids in the engine allows
bullImmediate startup from an ldquoair-onlyrdquo start
bull Managed system pressure through use of a defined head air pressure
bullManaged fuel burn as the air-steam fraction is adjusted to match wheel load
bullAdjusted wheel load reduces fuel burn
Integration of modern control circuitry with external combustion also brings a level of performance operational simplicity and safety heretofore unavailable
FEDERAL TRANSIT ADMINISTRATION 37
SECTION
7 Phase I Conclusions
The last steam train in scheduled service in the US departed on October 11 196225 One year earlier Robert Noyce received the first patent for an integrated circuit26 But for that brief one-year overlap the most powerful motive power technology was never harnessed by the black box controls that grew out of Noycersquos invention so the diesel-powered IC engine championed by Henry Ford won out
Now nearly 50 years later the modern IC engine cannot operate efficiently without the benefit of black box electronicsmdashbut that technology still presents intractable challenges of supply safety and environmental impact The air-steam hybrid technology may offer an alternative and a glimpse of that potential is presented here and viewable in Run 5 on the Brash Engines website at http wwwbrashenginescom
While demonstration in a test vehicle provides a strong visual message that BRASH technology works the commercial success of this technology will depend upon reliable repeatable measurement of power and economy For that data the Phase 2 effort will require a return to laboratory bench testing and effective demonstration of recovery of the water and air fractions
The results of this Phase I project collectively demonstrate the technical feasibility and commercial potential of the BRASH air-steam hybrid engine technology The initial DOT SBIR funding has been highly effective in facilitating this important proof of concept and laying the groundwork for further technology refinement and application
As described earlier the next steps are clear and appear to combine achievable and rapid major advances with low developmental risk SBIR Phase 2 support is needed for those advances due to the still-early stage of development that restricts access to private capital
The immense potential value of this technology has been enhanced and verified in Phase 1 there is now a clear and low-risk path ahead to larger-scale testing further component and controls refinement specific applications prototyping and pre-commercial deployments
25William Rosen The Most Powerful Idea in the World Random House 2010 p 311 26US Patent 2981877
FEDERAL TRANSIT ADMINISTRATION 38
APPENDIX
A Heat Transfer Efficiency Modeling Runs 3 and 5 50 and 90
Much of the analysis for Runs 3 and 5 is based on an assumed efficiency of 90 for heat transfer from the combustion of propane to heating of the water air mix in the coil As a test for the reasonableness of that assumption the same data have been modeled at a much lower 50 factor below
112210 - 3 Low Speed Run Air Pressure 60 psi Water head pressure 60 psi
Water2 00440 5060 4276 101 43 (Wt 000Kg)
Propane 152 1493 237 50 27 11880 1004 (Wt 000Kg)
Time 133000 134150 01150 na na na na (hrmnsc)
1 Energy value based upon absorbed heat (italics) from STP to 1000degK (0446 BTUg for Air 115 BTUg water) Underlined value is released heat at generally accepted 44 BTUg
Air (Wt 000Kg)
Component(BTU) Start Wt End Wt Net Wt Energy1
(BTU) Power
(BTUmin) Power (HP) Efficiency3
661 460 201 938 1294 30 36
Water2
(Wt 000Kg)
Propane(Wt 000Kg)
Time (hrmnsc)
1562
123000
1556
123715
00125
006
00715
380
2640
na
523
364
na
12
86
14
50
na na
Air (Wt 000Kg)
Component(BTU) Start Wt
5 Variable High Speed Run Air Pressure 60 psi Water head pressure 70 psi
End Wt Net Wt Energy1
(BTU) Power
(BTUmin) Power (HP) Efficiency3
654 472 182 849 718 17 7
2 Determined by difference from Propane and Air Energy assumed value 90 3 Arbitrary estimated efficiency of heat transfer not effective work
The two known quantities in each run is the weight of the air moving through the system and the weight of the propane heating that air The variable is the quantity of water heated to steam temperatures and above In Run 3 at 90 efficiency that mass of water calculates to 125 grams at 50 it drops to 33 grams In Run 5 at 90 efficiency that mass of water calculates to 86 grams at 50 it drops to 44 grams
FEDERAL TRANSIT ADMINISTRATION 39
APPENDIX A HEAT TRANSFER EFFICIENCY MODELING RUNS 3 AND 5 50 AND 90
As the comparison tables below show the uncertainty in the efficiency of heat transfer is manifest only in the mass of water heated to steam to do useful work
Data 90 Efficiency
Air
Component Run 3 BHP
Run 5 BHP
Net ChngBHP
-45
Run 3 Mass
Transfer (kg)
Run 5 Mass
Transfer (kg)
Net ChangeMass
Transfer (kg)
30 17
197
237
2010 182 -9
Water
Propane
Duration (mn)
47
86
725
422
0060
0013
725
0270
0086
1180
588
350
163 1180
276
163
Data 50 Efficiency
Air
Component Run 3 BHP
Run 5 BHP
Net ChngBHP
-45
Run 3 Mass
Transfer (kg)
Run 5 Mass
Transfer (kg)
Net ChangeMass
Transfer (kg)
30 17
101
237
2010 182 -9
Water
Propane
Duration (mn)
12
86
725
817
0060
0003
725
0270
0044
1180
1233
350
163 1180
276
163
Regardless of the specific efficiency Run3 reflects an air-rich propellant mix while Run 5 was clearly the more powerful and steam-rich propellant If 50 efficiency is a more realistic figure than 90 the only consequence is more water passing through the heater expander and recovery tank The only consequence for overall system efficiency is the slight but added work required to move the additional water by pump to the top of the water column
FEDERAL TRANSIT ADMINISTRATION 40
APPENDIX Acronyms B
BHP Boiler Horsepower
BRASH Binary Recovery Air-Steam Hybrid
BTU British Thermal Unit
CC Cubic centimeter
CFM Cubit feet per minute
CHP Combined heat and power
CNG Compressed natural gas
CO2 Carbon dioxide
CU Cubic
DARPA Defense Advanced Research Projects Agency
DGE Diesel gallon equivalent
DOT Department of Transportation
EC External combustion
EIA Energy Information Administration
EPA Environmental Protection Agency
FTA Federal Transit Administration
GGE Gasoline gallon equivalent
HP Horsepower
IC Internal combustion
K Kelvin
Kcal Kilocalorie
MPG Miles per gallon
MPH Miles per hour
OEM Original equipment manufacturer
PSI Pounds per square inch
RPM Revolutions per minute
SBIR Small Business Innovation Research
STP Standard temperature and pressure
FEDERAL TRANSIT ADMINISTRATION 41
FEDERAL TRANSIT ADMINISTRATION 128
US Department of TransportationFederal Transit AdministrationEast Building1200 New Jersey Avenue SEWashington DC 20590httpwwwftadotgovresearch
US Department of Transportation Federal Transit Administration East Building 1200 New Jersey Avenue SE Washington DC 20590 httpwwwftadotgovresearch
FEDERAL TRANSIT ADMINISTRATION 42
- Button1
- Button2
- Button3
- Button4
- Button5
- Button6
- Button7
- Button8
- Button9
- Button10
- Button11
- Button12
- Button13
- Button14
- Button15
- Button16
- Button17
- Button18
- Button19
- Button20
- Button21
- Button22
- Button23
- Button24
- Button25
- Button26
- Button27
- Button28
- Button29
- Button30
- Button31
- Button32
- Button33
- Button34
- Button35
- Button36
- Button37
- Button38
- Button39
- Button40
- Button41
- Button42
- Button43
- Button44
- Button45
- Button46
- Button47
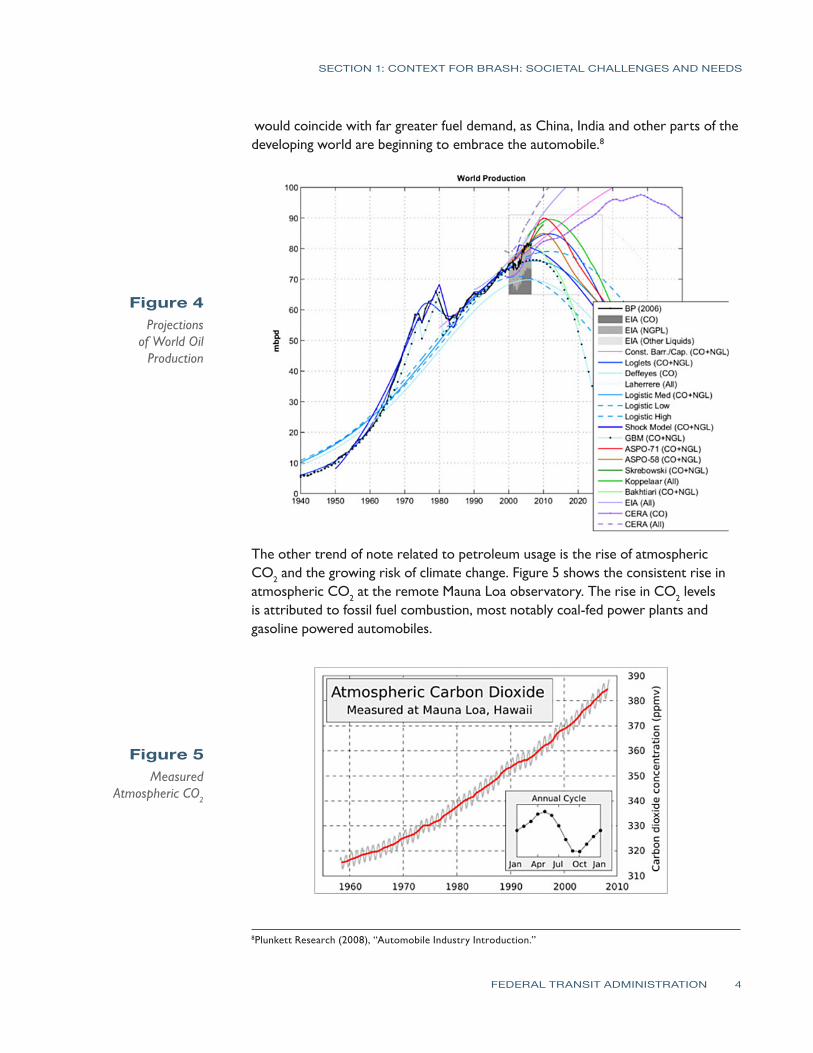
SECTION 1 CONTEXT FOR BRASH SOCIETAL CHALLENGES AND NEEDS
would coincide with far greater fuel demand as China India and other parts of the developing world are beginning to embrace the automobile8
Figure 4 Projections
of World Oil Production
The other trend of note related to petroleum usage is the rise of atmospheric CO2 and the growing risk of climate change Figure 5 shows the consistent rise in atmospheric CO2 at the remote Mauna Loa observatory The rise in CO2 levels is attributed to fossil fuel combustion most notably coal-fed power plants and gasoline powered automobiles
Figure 5 Measured
Atmospheric CO2
8Plunkett Research (2008) ldquoAutomobile Industry Introductionrdquo
FEDERAL TRANSIT ADMINISTRATION 4
SECTION 1 CONTEXT FOR BRASH SOCIETAL CHALLENGES AND NEEDS
As shown in Figure 6 the rise in atmospheric CO2 levels correlates with increases in global temperatures As CO2 continues to increase the expectation is further increases in average global temperatures9
Figure 6 Global Warming
Projections
The economic modeling and the environmental modeling point to one conclusion petroleum distillates may be the current source for nearly all of our transportation fuel supplies but its primacy cannot be sustained Whether from a perspective of limited supply and growing demand or the perspective of a growing environmental impact refined petroleum does not provide solutions only difficult and growing problems
Three popular initiativesmdashpetroleum alternatives improved fuel economy and alternative electric vehicle powermdashcannot solve worldrsquos thirst for petroleum distillates
bullPetroleum alternatives like biodiesel or ethanol put fuel in competition for land with our food supply10
bullNoble efforts to increase vehicle fuel economy domestically cannot offset the surging worldwide demand for more vehicles (Figure 7)11
9IPCC ldquoSummary for Policymakersrdquo Climate Change 2007 The Physical Science Basis Contribution of Working Group I to the Fourth Assessment Report of the Intergovernmental Panel on Climate Change Intergovernmental Panel on Climate Change (IPCC)rdquo 2007 httpwwwipccchpdfassessment-reportar4 wg1ar4-wg1-spmpdf retrieved July 3 2009 10The New York Times ldquoFood and Fuel Compete for Landrdquo December 18 2007 httpwwwnytimes com20071218business18foodhtml 11US Information Administration Analysis amp Projections httpwwweiagovoiafforecastinghtml
FEDERAL TRANSIT ADMINISTRATION 5
SECTION 1 CONTEXT FOR BRASH SOCIETAL CHALLENGES AND NEEDS
bullDomestic migration to electric vehicles is constrained by gross vehicle weight and range12 and electric hybrids are still priced at a premium over their non-hybrid versions13
Figure 7 US Energy
Consumption by Fuel
(1980ndash2035)
The goal of lower national fuel consumption is built on the false premise that the transportation sector requires highly-refined fuel Transportation requires highly-refined fuels only if the motive power is derived from timed detonation of a fuel air mixture in the cylinder head In other words the problem is not so much the petroleum itself but rather the virtually universal dependence on internal combustion (IC) engines that require petroleum fuels
If motive power were to come instead from external combustion a far wider array of gas liquid and solid biomassrenewable fuels could be used The goal could shift from ldquomiles per gallonrdquo to ldquoeffective production cost per 100 miles drivenrdquo for a new class of fuels measured by the pound and favored by the rate of production and CO2 absorption during growth
In sum the goal is to reduce the amplitude and slope of the red (ldquoLiquidsrdquo) line in Figure 7 and increase the same parameters of the green (ldquoNonhydro renewablesrdquo) line significantly By migrating to EC vehicles more of the green renewables line can be used in the transportation sector
The driving force behind the world economy is energy It is axiomatic that lower fuel production costs and consumption equals higher economic productivity The solution for the transportation sector is to migrate toward less refined self-renewing fuels
12The New York Times ldquoWill Lithium-Air Battery Rescue Electric Car Drivers from lsquoRange Anxietyrsquordquo May 7 2010 httpwwwnytimescomcwire2010050707climatewire-will-lithium-air-battery-rescue-electric-car-37498html 13ConsumerAffairscom ldquoConsumer Reports Sizes Up Hybrid Costsrdquo March 2006 httpwwwconsumeraffairscomnews04200603cr_hybridshtml
FEDERAL TRANSIT ADMINISTRATION 6
SECTION 1 CONTEXT FOR BRASH SOCIETAL CHALLENGES AND NEEDS
and that can come only through the technical migration toward external combustion BRASH (Binary Recovery Air-Steam Hybrid) technology provides that path
FEDERAL TRANSIT ADMINISTRATION 7
SECTION Technology Background 2 With few exceptions all mechanical work is derived from heat and all that heat is generated by combustion The earliest effective engines were steam engines first put to practical use at the time of US independence Steam engines remained the dominant source for motive power for the next century until its slow but steady displacement by IC engines in the automobile
Henry Ford was first inspired to develop steam traction engines as a better solution than plow horses14
I felt perfectly certain that horses considering all the bother of attending them and the expense of feeding did not earn their keep The obvious thing to do was to design and build a steam engine that would be light enough to run an ordinary wagon or to pull a plow I thought it more important first to develop the tractor To lift farm drudgery off flesh and blood and lay it on steel and motors has been my most constant ambition
Ironically by the 1920s steam traction engines were completely displaced by IC tractors largely the product of the same Henry Ford and his Fordson brand of tractor15
The IC engine was smaller lighter and cheaper to producemdashand considered safer Gasoline- and diesel-powered tractors were more expensive to operate but the most compelling argument for switching was safety in the hands of a lower-skilled operator who no longer had to constantly watch gauges and adjust temperatures and pressures
Similar differences existed in the broader automotive market and the advent of the electric starter effectively ended consumer interest in EC steam cars
Still near the end of the steam car era Stanley Doble White and others offered technically-competitive options The Doble Model E (Figure 8) weighed more than 5500 pounds but achieved in the 1930s the same fuel economy of a comparable IC engine in a contemporary SUVmdash16 mpg The Doble was powered by a four-cylinder engine of 190 cubic inches displacement about the size of an Accord engine but the Doble weighed 67 percent more than the Accord As for emissions one Doble Model E (currently owned by Jay Leno) recently passed California emissions testing with no modifications16
14Henry Ford My Life and Work 1922 15Spencer Yost Antique Tractor Bible 1998 16ldquoJayos Garage 1925 Doble Series E Steam Carrdquo httpwwwjaylenosgaragecomat-the-garagesteam-cars1925-doble-series-e-steam-car
FEDERAL TRANSIT ADMINISTRATION 8
SECTION 2 TECHNOLOGY BACKGROUND
Figure 8 Doble Model E
Doble and Brooks also built passenger buses similar in capacity and weight to contemporary buses The Brooks shown in Figure 9 was powered by a 400-cubic-inch V8 steam engine and carried 29 passengers at 60 mph while turning at 2000 rpm As a cruel twist of fate the public unveiling of the Brooks Steam Bus was announced in October 1929 two weeks before the stock market crash and the onset of the Great Depression17 The company did not survive
Figure 9 Brooks Steam Motors Bus
17Wikipedia ldquoBrooks Steam Motorsrdquo httpenwikipediaorgwikiBrooks_Steam_Motors
FEDERAL TRANSIT ADMINISTRATION 9
SECTION 2 TECHNOLOGY BACKGROUND
The suitability of steam power for mass transit use can be seen from comparison of a very powerful contemporary Ford V-8 Diesel engine (from the Excursion SUV) to the Besler V-Twin Steam engine circa 1938
Ford Turbo Diesel Besler Steam Configuration V-8 V-2 Displacement (cuin) 445 80 Horsepower 175 150 Torque (ft-lbs) 420 1200 Engine wt w transmission (lbs) 930 80
The Besler is roughly one quarter the size and weight of the V-8 Turbo-Diesel but has equivalent horsepower and three times the available torque (the primary determinant of performance) The Detroit Diesel Series 60 six-cylinder engine commonly used in mass transit vehicles produces marginally more torque (1450 ft-lbs) than the Besler from twice the horsepower and with much more fuel
Steam engines make greater use of the energy contained in the fuel by separating the heating phase of the Carnot cycle from the expansion phase and metering fuel burn to more closely match demand A steam engine presents maximum torque at low speed and greater horsepower and torque than comparable IC engines
Another EC technology gaining resurgent interest is compressed air power Recent reports of collaboration between MDI of France and Tata Motors of India suggest a new approach toward EC engines18 Tata Motors a major producer of vehicles on the Indian subcontinent intends to produce the MDI Air Car in the near future with anticipated fuel economy of 106 mpg The latest iteration of the MDI Air Car shown in Figure 10 has a projected range of 848 miles from 8 gallons of fuel or 106 mpg for a 4-passenger vehicle weighing 1870 pounds19
The MDI City Car relies on a six-cylinder 75 HP engineexpander to achieve this performance and in the ldquoprocess [produce] emissions of only 0141 lbs of CO2
per mile That is hellip less than [half] the cleanest vehicle available todayrdquo (Toyota Prius 07 Emissions 034 lbs of CO2 per mile)
18Autobloggreen ldquoA New Agreement between Tata Motors and MDI Bring the Air-Car Closer to Realityrdquo March 21 2007 httpgreenautoblogcom20070321a-new-agreement-between-tata-motors-and-mdi-bring-the-air-car-cl 19Motor Development International (MDI) OneFlowAIR httpwwwmdiluenglishoneflowairphp
FEDERAL TRANSIT ADMINISTRATION 10
SECTION 2 TECHNOLOGY BACKGROUND
Figure 10 MDI Air Car
The schematic for the MDI power plant is shown in Figure 11 The stored air is heated to combustion temperatures and allowed to expand mechanically This is the practical definition of an EC engine where combustion provides heat but the working fluid or propellant is not generated by the combustion process itself
Separating the heating step from the expansion step does not in itself yield higher fuel economy or lower emissions But the regulation of fuel flow to maintain optimum propellant temperature immediately prior to expansion provides both maximum fuel economy and lowest possible emissions In contrast an IC engine ignites fuel at 1800degF and immediately conducts that heat away through its water jacket to drop cylinder temperatures to 200ndash300degF EC engines preserve that heat for useful work
Figure 11 MDI Air Engine
Schematic
FEDERAL TRANSIT ADMINISTRATION 11
SECTION 2 TECHNOLOGY BACKGROUND
Both air and steam engines provide an alternative to the conventional IC engine Both operate from a variety of fuels and offer the potential of lower emissions and higher fuel economy Steam is the more robust of the two (the Besler Steam Twin is much more energetic than the MDI six-cylinder) but the compressed air engine offers an operational simplicity and a lower weight because no boiler or condenser is required Unfortunately it can never provide the power and acceleration of steam
The best of both worlds would be a blending of air and steam into a single engine that offers all of the benefits but without the weight and heat management issues of a boiler and with significantly more power than an air engine alone
FEDERAL TRANSIT ADMINISTRATION 12
SECTION The Air-Steam 3 Hybrid Solution
Air and water are completely different in their physical properties except when they operate as working fluids at high temperatures and pressures At steam operating pressures and temperatures their behavior largely follows ideal gas behavior and each is miscible in the other at all proportions The arrow in Figure 12 indicates the rough path for expansion of the hot high-pressure propellant and shows near ideal gas behavior for steam at these elevated temperatures and pressures
Figure 12 Does Steam
Behave Like an Ideal Gas
Getting to steam operating temperatures and pressures requires that significantly more heat be applied to water than air at STP (standard temperature and pressure) Air requires only 642 kcalmole to reach these operating temperatures while water (steam) requires 5236 kcalmole (due to the 512 kcal heat of vaporization) In this development a baseline flow of air is used to entrain water into the heater section Fuel is consumed in direct proportion to the water fraction to maintain the heater at a near constant temperature The heat required to maintain ldquohot airrdquo temperatures is a small fraction of the heat required to maintain steam temperatures as shown in Figure 13
FEDERAL TRANSIT ADMINISTRATION 13
SECTION 3 THE AIR-STEAM HYBRID SOLUTION
Figure 13 Heat Required
to Raise Air and Water
Temperature to 1000degK
The compressed air fraction provides a safe and consistent flow pressure into the hot section The water once heated to working steam temperature provides a more robust working fluid
The hot mixed propellant is injected into the expander moving a piston and converting heat to motion The expanded propellant thereby drops to condensing temperatures allowing the water portion to drop to a sump for pumped return to the injector The expanded air fraction is then recompressed for return to the injector
The use of an air fraction allows for immediate injection of work-appropriate amounts of water into the hot section no boiler no steam under pressure no fuel wasted (heating steam without immediate purpose) The use of a water fraction (and proportional fuel flow) allows for variable power from a constant temperature system The binary (air-steam) propellant allows for a closed-loop condensing recovery system extending range and economy
Figure 14 Schematic of Injector Nozzle Used to Mix Air
and Water
FEDERAL TRANSIT ADMINISTRATION 14
SECTION 3 THE AIR-STEAM HYBRID SOLUTION
The sum of the process is as follows
Key start begins a modest fuel burn that immediately provides initial hot air flow through the engine
bull Depressing the accelerator increases the water fraction and fuel flow (in direct proportion)
bullThe vehicle moves forward under (airsteamfuel) power in direct proportion to wheel turn
bullThe hot mix expands and the expanded mix condenses the water fraction
bullA small parasitic load recompresses the small air fraction to reinjection pressures
bull Removing the foot from the accelerator returns the flow to hot air only sweeping residual moisture from the cylinders and preventing hydraulic lock (during next cold start)
The engine can operate on any fuel whose flow can be regulated (semi-solid liquid gas) Combustion occurs at high temperature at one atmosphere so much cleaner burning than internal combustion
Figure 15 Air-Steam Hybrid
Schematic
Accelerator regulates flow of air water and fuel to heater based on load and wheel speed Water and fuel are metered to maintain heater temperature within optimal performance band
Output demand determines air-water fraction
Any discussion of fuel efficiency relative to current IC engine technology must first re-emphasize the multi-fuel capability of EC engines In a market so dominated by one fuel customers have accepted the term ldquomiles per gallonrdquo
FEDERAL TRANSIT ADMINISTRATION 15
SECTION 3 THE AIR-STEAM HYBRID SOLUTION
as the basis for comparison But in an open market with many different fuels and widely different heat content (BTUlb) the only common and appropriate denominator is ldquomiles per dollarrdquo (closer to ldquofuel economyrdquo)
To the extent that any EC solution gains market acceptance and the market responds with new and different fuel blends the law of supply and demand dictates that fuel prices for all will drop Until then the remainder of this efficiency discussion will assume all engines require the same petroleum-based fuel
The long-accepted estimate of fuel efficiency for the IC engine is about 25 percent with the remaining 75 percent of the heat content dissipated in equal parts through the hot exhaust the radiator and mechanical losses in the engine Much has been done to raise that efficiency but what remains is one power stroke in four and a high temperature detonation whose heat content is quickly and intentionally dissipated through conduction
In sharp contrast a steam engine is designed to preserve as much heat as possible from combustion and then mete out that heat through the expansion of the working fluid Instead of a 25 percent heat loss through conduction through a radiator conductive loss is limited to 10 percent in efficient steam engines The greatest loss is through the vaporization of water to steam (at 30) yielding useful work of 35 or 40 percent higher than internal combustion Steam vehicles often report significantly lower practical fuel economies as the whole boiler is heated for a relatively short trip (another reason to avoid using a boiler)
Hot air engines involve no change of state therefore avoiding the loss associated with vaporization That can mean fuel efficiencies approaching 65 percent except as noted with the MDI engine a lower power-to-weight capability
The combination of air and steam into a single engine type is expected to yield economies between 35 and 65 percent varying with wheel load A 50 percent net efficiency would double fuel economy over a comparably-sized IC engine but as shown with the Doble and Besler examples the EC engine can be much smaller yielding even greater economies
FEDERAL TRANSIT ADMINISTRATION 16
SECTION 3 THE AIR-STEAM HYBRID SOLUTION
Figure 16 Fuel Efficiency
by Engine Type
Derivative Uses As much as this study is focused on large motive power applications it should be noted that an equally important opportunity for this technology is in stationary power applications similar in configuration to combined heat and power units referred to generally as micro-CHPs Rapid start-up high torque quiet operation and multi-fuel compatibility make it well suited to an integrated heat and electrical power installation
FEDERAL TRANSIT ADMINISTRATION 17
SECTION 3 THE AIR-STEAM HYBRID SOLUTION
Its ability to produce a full range of power options (mechanical pneumatic heat and through attached accessories electrical and hydraulic) in a small modular man-portable configuration also make it particularly well suited to temporary or tactical power requirements Although beyond the scope of the DOT goals for vehicular use this stationary power applicationrsquos potential may be strategically important in market acceptance and adoption by expanding the range of applications and thereby providing economies of scale in all aspects of development production and commercialization activities for all applications
FEDERAL TRANSIT ADMINISTRATION 18
SECTION BRASH Test Plan 4 This Phase I effort followed the Technical Objectives outlined in the proposal as follows
Practical Objectives 1 Modify the Smarttrade sized test vehicle (Figure 17) installing a 10ndash20 HP
equivalent heater a 650 cc displacement 2 HP (nominal) Quasiturbinetrade steam engine pressurized air and water tanks electronic flow regulation of air water and fuel via laptop-based LabVIEW software and solenoid valves
2 Perform test runs to validate the system operation and determine key baseline performance parameters such as
a minimum air fraction to maintain engine operation upper limits for operating temperatures maximum allowable flow rates for water (without reducing effective propellant flow at temperature)
b upper limits of vehicle speed while varying gross vehicle weight and course incline
3 Following baseline performance assessment further objectives included
a an analysis of component placement for ease of maintenance and replacement
b an estimation of comparable volumes and weights to an equivalent IC powertrain in order to verify retrofitability
c an estimation of effective fuel economy while using propane fuel on closed track mileage runs
Figure 17 Smarttrade
Car-Sized Test Vehicle
FEDERAL TRANSIT ADMINISTRATION 19
SECTION 4 BRASH TEST PLAN
4 Over the course of multiple test runs a cumulative assessment of component performance and reliability would lead to a gross verification of BRASH engine integrity and range That in turn could lead to off-site vehicle demonstrations to federal agencies potential industry partners and investors
Analytical Objectives 1 The BRASH engine model has been demonstrated only at a bench level with
rudimentary understanding of its operating principles A key objective in this vehicle build is to increase the thermodynamic modeling of this technology including an analysis of mass flow (air water fuel) and resulting power
2 Early test data would lead to analysis of specific on-vehicle capacities (for air water and fuel) and flow rates for same in order to estimate operating range recovery strategies and rates (recompression and condensation) and the parasitic loads (eg alternators pumps) to sustain useful operation for many hours
3 Over time the vehicle testing under various test conditions (eg varying gross vehicle weight wheel load engine temperature propellant mix) will lead to a body of data to support more complete modeling of water fraction vs torque vs temperature These data are essential to real-world estimation of fuel economy as this technology scales to larger practical vehicle applications
4 With the modeling from 3 in place for steady-state operation practical track runs with frequent starts and stops can further shape the model for real-world use
5 The analysis from steps 1ndash4 will provide sufficient basis for estimating the mass flow heat component capacity recovery factors and fuel economy for scaling this 2 HP test data to larger vehicles in two decade steps first to a 20 HP pickup truck and then further modeling and custom buildup of a 200 HP power plant with a DOT-identified industrial partner
6 This analytical plan is consistent with the overall SBIR program plan as the 2HP effort is confined to Phase I the 20 HP build and test plan would be accomplished in Phase II and the design and build of the 200 HP power plant would be accomplished in Phase III with an established industry partner
The work effort toward completion of these tasks has proceeded on two tracks mechanical modifications to the April test vehicle and electronic control and measurement
Mechanical Modifications and Test Configuration The test vehicle is a modified electric car about the size of a Smarttrade car Earlier modifications included removal of the electric drive train exposing a large working
FEDERAL TRANSIT ADMINISTRATION 20
SECTION 4 BRASH TEST PLAN
space behind the cab This rear space over the rear left wheel contains a 2HP Quasiturbinetrade steam engine20 selected for its compact design and suitable power range for this 700-pound vehicle The placement over the left wheel permits direct drive to that wheel via electric clutch and chain drive
Figure 18 Quasiturbinetrade
Rotary Expander Installed and Interior View
In the center of center of this rear space a heavily-modified propane space heater rated at 30000ndash80000 BTUhr (equivalent to 11ndash31 boiler horsepower [bhp]) was installed Heaters of this type generally are designed to efficiently distribute heat into an adjoining space This heater was heavily modified with high temperature insulation and outer shells to retain useful heat to the 20-ft stainless steel coil passing through its core
Figure 19 Quasiturbinetrade
Rotary Expander Installed and Interior View
the expander and heater (with recent refinements) Also visible under the heater is the pressurized water tank (painted grey) The open space to left of the heater is reserved for drive components The space to the right of the heater is reserved for recovery and recompression of the expanded propellant (Recompression is outside of the current scope to simplify the testing and analysis See discussion section for more information) Other system components include air cylinders and electronic controllers that are mounted forward of the rear firewall in the cab or under the front hood
Figure 20 shows the back of the vehicle with fenders and trim removed revealing
20Quasiturbinetrade Product Details httpquasiturbinepromciqcca
FEDERAL TRANSIT ADMINISTRATION 21
SECTION 4 BRASH TEST PLAN
Figure 20 Test Configuration
Figure 21 System Components
The main system components are shown Minor components and linkage tomechanical output are not included in this report for the sake of simplicity
Electronic Control and Measurement No realistic progress toward a vehicle demonstrator with known and regulated fuel use can proceed without electronic regulation In this build the LabVIEW program and system components from National Instruments were used to create a ldquoglass cockpitrdquo of vehicle controls and performance measurement21 The simplified schematic in Figure 22 shows the planned integration of electronics in this development LabView-compatible components will replace all mechanical flow and measurement components
21More information can be found at National Insturments The LabVIEW Environment httpwwwnicomlabview
FEDERAL TRANSIT ADMINISTRATION 22
SECTION 4 BRASH TEST PLAN
Figure 22 Electronics
Schematic for Air-Steam Hybrid
For the vehicle driver the dashboard collection of gauges has been replaced with a laptop screen similar to the one pictured in Figure 23
Figure 23 Front Screen Display for Air-Steam Hybrid
Certain features on this front screen will reflect user input (OnOff Throttle) while others reflect the dependent variables in the process (Heater Temp Fuel Flow Air and Water Flow) Shown on the bottom screen will be running time-series data on speed wheel load temperature specific fuel consumption and the other variables important to the analytical process The front screen display is generated from programming and controls on the back screen display
FEDERAL TRANSIT ADMINISTRATION 23
SECTION 4 BRASH TEST PLAN
Figure 24 Back Screen Display for Air-Steam Hybrid
LabVIEW software and controllers were chosen because of National Instrumentsrsquo status as the industry leader in rapid control prototyping and In-Vehicle data-logging solutions BKi purchased the LabVIEW componentry through the University of Connecticut Mechanical Engineering Department as part of UConnrsquos ongoing support of the project
By the end of the contract term in October 2010 the air and water regulation components were complete and operational but the fuel regulation and engine speed components were not yet fully operational To generate the most meaningful data under these circumstances the test vehicle was configured for extended operation to determine specific fuel water and air consumption rates The combination of these rates provided the basis for initial estimates of power and efficiency
Summary of Effort Mechanical Modifications
1 Removal of original electrical drive components reinforcement of frame
2 Installation of Quasiturbinetrade 2HP engine modified heater pressurized water tank all pneumatic water and fuel lines
3 Baseline validation testing using manual controls
4 Installation of electronically-regulated flow controllers
Electronic Modification 1 Acquisition of computer electronic regulators and control software
2 LabVIEW systems programming
3 System checkout
FEDERAL TRANSIT ADMINISTRATION 24
SECTION 4 BRASH TEST PLAN
Testing and Analysis 1 Static Safety Testing 2 Baseline vehicle drivetrain testing
3 Vehicle static testing (Runs 3 amp 5)
Summary of RequirementsGoals 1 Safe operation of vehicle during static and motive applications
2 Qualitative demonstration of BRASH engine capability to move test vehicle on flat and inclined road surface
3 Quantitative determination of air water and fuel consumption during timed static test
4 Quantitative determination of air water and fuel consumption while varyshying water and fuel fractions
Summary of Testing Two experiments were performed in late November the first to establish minimum fuel and propellant flow rates for sustained operation at low speed (air-rich mode) and the second to establish reasonable upper limits of fuel and propellant flow at higher engine speeds (steam-rich mode) Variation in the air-steam mix is the underlying theory of operation for the BRASH engine the air fraction provides a baseline flow for initial start-up and low-speed operation but the addition of water (as steam) to the propellant results in a significant boost in range and power These two tests have verified this underlying theory
Test Conditions The two test runs summarized in this report are 3 on November 22 2010 and 5 on November 26 2010 Both tests were performed at the Depot D campus of the University of Connecticut in Storrs The testing was performed outside in seasonal conditions 45-50degF with light winds
Figure 25 Vehicle Test Setup
FEDERAL TRANSIT ADMINISTRATION 25
SECTION 4 BRASH TEST PLAN
Each run was a dynamic test with no load on the two-cylinder Quasiturbinetrade engine The propane cylinder was suspended from a scale for the duration of the test Propane fuel consumption was monitored continuously by digital scale with a display accuracy of 001kg
Each test run lasted for the duration of one high pressure air cylinder Air cylinder start (full) and end (empty) were determined at the start and finish of each run using the same scale and accuracy Water levels initially were determined volumetrically but the results were too inconsistent Displaced volume of liquid water proved a poor measure of the quantity heated to steam and carried forward for productive work For this reason water is an estimated quantity based upon fuel quantity burned less heat absorbed by the air fraction (Further integration of the LabView controller software in the next phase will obviate this work-around)
Each of the complete test runs may be viewed at Brash Engines website httpwwwbrashenginescom Photos from each run appear in the figures that follow Tables 1 and 2 summarize the productive mass flow for air water and propane fuel to produce work from the engine for the test duration
The cab interior in Figure 26 shows the high pressure air cylinder below the steering wheel and the laptop computer (regulating propellant flow) in passenger seat space The LabView controllers reside in the protective case under the laptop
Figure 26 Vehicle Cab with Controller Laptop
During each test hot propellant was allowed to expand and vent to ambient in order to simplify the thermodynamic model and analysis (Note the plumes of water vapor from each exhaust hose and the small puddles of water under each hose in Figure 27)
FEDERAL TRANSIT ADMINISTRATION 26
SECTION 4 BRASH TEST PLAN
Figure 27 Exhaust Plumes from Expander
Development plans include recovering the expanded propellant separating into water and air phases and then recompressing the air fraction for re-use This will both improve efficiency and eliminate the visible vapor plume
Test Assumptions Another estimation used in this study is the efficiency of heat transfer for the propellant through the 20-ft coil of stainless steel inside the insulated heater Figure 28 shows an early ldquoair-onlyrdquo test run with the current heater The hose failure and melting of the steel wire mesh inside (note formed ball in the mesh) indicates 1300degK temperatures exiting the hot section
Figure 28 Hose Failure Due
to Overheating
FEDERAL TRANSIT ADMINISTRATION 27
SECTION 4 BRASH TEST PLAN
Effective heat transfer (as Figure 28 shows) does not equal efficient heat transfer but the ability to deliver 1300degK air from a well-insulated burner suggests a highly efficient transfer of heat The analysis of results assumes a value of 90 efficiency (See Appendix A for a discussion of heat transfer efficiency)
3 Low Speed Test On November 22 2010 Run 3 tested the lower operating limits of the test setup Low limit in this context meant sufficient pressure to maintain expander rotation but low steam and fuel burn The test commenced with a full air cylinder weighing 661 Kg At the end of the test the empty cylinder weighed 460 Kg Over the 7 minutes and 15 seconds of testing 006 Kg of propane was consumed
The mass of air and fuel was determined from before after run test weights As stated earlier determining the quantity of steam produced from the pressurized water tank was problematic because of the quantity of stored water the resistance to water flow under dynamic pressures and the potential for some fraction of the water (in liquid state) to be entrained in the propellant mix
To solve for this unknown the energy required to raise the known quantity of air from ambient to 1000degK (33kcalmol or 0467 BTUg) was subtracted from the energy content of the propane consumed (44 BTUg) and then the efficiency of the heat transfer process was de-rated by 10 percent to yield a net quantity of 1438 BTUs to elevate ambient temperature water to 1000degK steam The result is an estimated 125 grams of water consumed in the 7-minute test
Table 1 summarizes these data and shows a high reliance on the air fraction for the work performed by the 2 HP engine The air cylinder used in this test has a measured free volume of 45 cubic feet (1274 liters at STP) which means sustained flow rates of 62 cubic feet per minute (cfm) or 175 liters per minute In contrast the 125 grams of water passed through as steam produced an estimated equivalent gas volume of 155 liters at STP Note the modest levels of water vapor in Figure 29 Why the greater air fraction relative to water flow in this test
Air (Wt 000Kg) 661 460 201 938 1294 30 36
Water2
(Wt 000Kg)
Propane(Wt 000Kg)
Time (hrmnsc)
1562
123000
1556
123715
00125
006
00715
1438
2640
na
1983
364
na
47
86
54
90
1 Energy value based upon absorbed heat (italicized) from STP to 1000degK (0446 BTUg for Air 115 BTUg water) 2 Determined by difference from propane and air energy assumed value 90 3Arbitrary estimated efficiency of heat transfer not effective work
11222010 - 3 Low Speed Run Air Pressure 60 psi Water Head Pressure 60 psi
Component(BTU) Start End Net Energy1
(BTU) Power
(BTUmin) Power (HP) Efficiency3
Table 1 Analysis of Mass
Flow Data at Low Speed
FEDERAL TRANSIT ADMINISTRATION 28
SECTION 4 BRASH TEST PLAN
Figure 29 Low-Speed Test Results in Little
Water Vapor
In this baseline experiment the single cylinder provides 60 psi air flow and 60 psi static ldquoheadrdquo pressure on the water column The air flow from the cylinder is biased toward the generally less restrictive flow path for air The water column under the same pressure presents a higher viscosity medium passing through a greater number of valves and restrictions At the point of injection the air fraction flows more freely into the hot section In order to bias the mix toward greater water fraction (and greater power) the head pressure on the water column must be increased over the 60 psi air line pressure
Run 4 (not documented here) evaluated head pressures from 110 psi to 70 psi and determined that modest differential pressures retarded the flow from the air fraction and boosted flow of the water fraction Still higher differential pressures effectively stopped air flow altogether reverting the engine operation to ldquosteam onlyrdquo For Run 5 an additional cylinder was used to apply a 70 psi static head pressure on the water column a 10 psi differential over the 60 psi air line pressure
5 Variable High Speed Test On November 26 2010 Run 5 tested the higher differential water pressure as a means to increase the effective water fraction in the propellant mix The test commenced with a full air cylinder weighing 654 Kg At the end of the test the empty cylinder weighed 472 Kg Run 5 was interrupted after 243 minutes to refill the water tank and then testing resumed for an additional 907 minutes Over the whole test 027 Kg of propane was consumed
Using the same analytical basis as Test 3 Test 5 data indicate a substantial increase in work capacity (as measured by fuel consumed and steam generated) over the 3 baseline
FEDERAL TRANSIT ADMINISTRATION 29
112610 - 5 Variable High Speed Run Air Pressure 60 psi Water Head Pressure 70 psi
Air (Wt 000Kg)
Component(BTU) Start End Net Energy1
(BTU) Power
(BTUmin) Power (HP) Efficiency3
654 472 182 849 718 17 7
SECTION 4 BRASH TEST PLAN
Table 3 Comparison of Mass Flows
Water 588 Runs 3 and 5
163 Duration (mn) 725 1180 725 1180 163
Air
Component Run 3 BHP
Run 5 BHP
Net ChngBHP
Run 5 Mass
Transfer (kg)
Net ChangeMass
Transfer (kg)
30 17
197
237
-45 2010 182 -9
Run 3 Mass
Transfer (kg)
276 350
47
86
422
0060
0013
0270
0086
Propane
This difference in steam fraction and power is more clearly seen in Figure 30 (and on the source video at the Brash Engines website)
Figure 30 Three Images from Run 5
Table 2 Test 5 Results with Increased
Water and Fuel Water2
(Wt 000Kg) 0860 9890 8358 197 83
Propane(Wt 000Kg) 1520 1493 27 11880 1004 237 90
Time (hrmnsc) 133000 134150 01150 na na na na
1 Energy value based upon absorbed heat (italics) from STP to 1000degK (0446 BTUg for Air 115 BTUg water) Underlined value is released heat at generally accepted 44 BTUg 2 Determined by difference from propane and air Energy assumed value 90 3 Arbitrary estimated efficiency of heat transfer not effective work
The increase in pressure on the water column by 10 psi reduced air flow by 9 percent but increased the steam fraction considerably and thereby increased the effective boiler horsepower nearly three-fold to 237 bhp (assuming 90 heat transfer) These data are summarized in Table 3
FEDERAL TRANSIT ADMINISTRATION 30
SECTION 4 BRASH TEST PLAN
As with Run 3 start up from Time Zero was immediate burner on air flow begins and water flow under pressure commences immediately Another impressive feature of the mix air-steam propellant system is the ability to start stop and rapidly accelerate as shown in the full Run 5 video Run 5 serves as validation that this patented technology has unique performance benefits over air steam or internal combustion alone
Lessons Learned A comparison of the two test runs verifies some key points
1 The same power plant can produce variable power and fuel economy based upon power demand and airsteam mix
2 Although imprecise at this point in testing fuel consumption appears directly proportional to engine speed The engineexpander will spool up spool down stop and restart in a manner consistent with fuel and propellant flow The Run 5 video on the Brash Engines website verifies this conclusion
3 The use of a defined static air pressure ldquoheadrdquo over the water column at a pressure higher than the defined air line dynamic pressure provides a safe and predictable bias toward flow from the water fraction
4 Although the current test configuration offers sufficient performance for this initial demonstration phase the following observations are in order
a The heater path is too long creating latent response issues
b The airwater injector is not optimized for proper mix or flow capacity
c The incomplete integration of LabVIEW compromises the quality of data
d The absence of a measured variable load on the expander compromises any analysis of power and fuel economy
5 The design migration to a vehicle installation was premature The project should move back to a lab bench study to refine the regulation of components complete the recovery and recompression portions of the system and use electromechanical loads to estimate power and useful work for specific quantities of fuel water and air
6 The Quasiturbinetrade engine technology is promising but too immature for larger-scale modeling Later phases of the project should rely on more conventional multi-cylinder piston-type expander
Estimated Fuel Economy Mass transit authorities have relied on large diesel engines such as the Detroit Diesel Series 50 and Series 60 engines for more than 30 years Reports on fuel economy vary from a high of 60 miles per gallon (Diesel) for longer-range
FEDERAL TRANSIT ADMINISTRATION 31
SECTION 4 BRASH TEST PLAN
commuter services in California23 to a low of 228 miles per gallon (Diesel) for city buses with frequent stops in New York City24 In both cited studies the migration to compressed natural gas (CNG) has resulted in lower fuel economies on a Diesel Gallon Equivalent (DGE) basis
Table 4 summarizes this study (columns 2 and 3) and the next proposed phase (columns 4 and 5) the performance of the current fleet of mass transit buses (columns 6 and 7) and the likely outcome if the Besler engine (described earlier) were employed with the air-steam hybrid technology (columns 8 and 9)
Table 4 Comparison of
Fuel Economies
Air
1
Configuration
Engine
HP
Torque
Fuel
gmin
BTUhr
GGEhr
mpg 60mph
GGE100 mi
$ per GGE
$100 mi
Current
Example
2
3
3
5
4
Bench
5
S-10
6
SB Bus
7
NYCT
8
50 eff
9
30 eff
86
Quasi
2
Prop
82
216
02
3160
03
30
09
Current
237
Quasi
2
Prop
23
607
05
1126
09
30
27
UC 1
40
6 cyl
20
Prop
40
1056
09
648
15
30
46
UC 2
80
6 cyl
40
Mix
80
2112
19
324
31
30
93
MCI102
DD S60
350
1450
Diesel
540
11400
100
60
167
35
583
Diesel
23
439
35
1535
300
Besler
150
1200
Mix
300
792
695
864
1158
16
1853
500
Besler
150
1200
Mix
500
1320
1158
518
1930
16
3088
The Besler engine is shown in two columns The left column reflects the higher efficiency anticipated with the air-steam hybrid mix described earlier as at or near 50 percent The right column reflects the historical efficiency realized with steam engine technology The italicized numbers near the bottom of the column show that even at historical efficiencies the Besler engine would offer equal or better Gasoline Gallon Equivalent (GGE)100 mile ratings of the current diesel technology but migrating toward less refined and (therefore) less expensive fuels would significantly reduce the operating cost ($mile)
23Demonstration of Caterpillar C-10 Dual-Fuel Engines in MCI 102DL3 Commuter Buses National Renewable Energy Laboratory httpwwwnrelgovdocsfy00osti26758pdf p 7 24R Barnitt ldquoNew York City Transit (NYCT) Hybrid (125 Order) and CNG Transit Buses Final Evaluation Resultsrdquo November 2006 National Renewable Energy Laboratory K Chandler Battelle Technical Report NRELTP-540-40125 November 2006 httpwwwnrelgovvehiclesandfuelsfleettestpdfs40125pdf pvii
FEDERAL TRANSIT ADMINISTRATION 32
SECTION 4 BRASH TEST PLAN
There are of course two orders of magnitude difference between the results of Runs 3 and 5 and the daily demands of city and commuter buses but the mere existence of the Besler Twin and the Brooks V-8 400 HP engine suggests an opportunity for fuel economy and fuel variety
Proposed further support for the next phase of development will advance the air-steam hybrid technology by an important order of magnitude This would provide the data confidence to scale to larger vehicle operation and garner the interest of one or more engine or vehicle OEMs
Figure 31 MTANew York City
Transit Orion VII Next Generation
Hybrid Transit Bus
Next Development Phase The next phase of development will incorporate a modern six-cylinder steam engine design with a displacement of 53 cubic inches and capable of sustained 15-25 HP operation The expander will be supplied by Steam Engine Power Inc (httpwwwsteamenginepowercom) This expander will drive an alternator generator to measure effective work output in watts as well as provide sufficient power to satisfy the system parasitic loads of battery recharge exhaust air recompression and all other pump and valve operations
Figure 32 (l to r) Six-Cylinder Expander Power Generation Load
Small 24 VDC Compressor
FEDERAL TRANSIT ADMINISTRATION 33
SECTION 4 BRASH TEST PLAN
Static pressure for the water column will still be supplied via compressed air cylinder but the dynamic air flow will be supplied by an oil-less air compressor of the size and type shown This 24 VDC compressor will recompress the recovered air exiting the expander to 40ndash60 psi pressure and support flows of 3ndash4 cubic feet per minute (cfm) These three components are off-the-shelf enhancements to the system but custom engineering of a new more powerful and more responsive heater completion of the electronic integration and design and fabrication of the recoveryrecompression components are necessary tasks that must be included to make the next generation assembly work to its potential This work will be accomplished largely by Mechanical and Electrical Engineering students at the University of Connecticut under the supervision of faculty and Brash Engines personnel
When this build is complete all operations will be under LabVIEW control All expander operations will be measured for power and work Once the bench version is in control a modified version will be installed in a small pickup truck (eg Chevrolet S-10) for further verification of system performance and robustness
During this phase a new and promising technology will be investigated a new and faster class of solenoid valves from National Instruments These solenoid valves with an unprecedented 3 msec response time have the potential of allowing air-steam retrofit in existing engine blocks The solenoid valves could replace the spark plugs in conventional IC engines and provide the equivalent timed injection of hot propellant mix as the timed firing of a spark plug in the presence of a fuel air mix
If possible these fast solenoids and the black box programming to control them could allow very easy portability to larger vehicles and easier retrofit Potentially a V-6 engine could operate 4 cylinders for expansion and the remaining two cylinders could be used as direct drive compressors with different but equivalent solenoid valves controlling the compression process
FEDERAL TRANSIT ADMINISTRATION 34
SECTION Development Plan 5 and Next Steps
This current effort is a key first-proof of concept for this air-steam hybrid technology but our goals extend well beyond this two-seat 2 HP demonstrator The lessons learned in electronic integration will allow rapid migration to larger platforms using the same basic controls but scaling the expander heater and other mass-flow components to vehicle-appropriate size That project identified as ldquo20 HP Vehiclerdquo and other near-term derivative projects are listed in Table 5
BRASH Project
ProposedFunding Source
Funds Reqd $K Project Description
SUV-size proof-of-concept for reliable 20 HP Vehicle DOTUSPS 300 highway performance maildelivery
vehicle size
Proof-of-concept mass transit busshy200 HP Vehicle DOTDOD 600 retrofit scaled to city bus capacity and
suitable for replacement of over-the-road diesel engines
Table 5 Project Funding
Stationary Power Unit Micro-CHP Equivalent
DARPA 300 Proof-of-concept mass transit bus-retrofit scaled to city bus capacity and suitable for replacement of over-the-road diesel engines
Summary Alternative Processed Solid Fuel DOE EPA DOA 600
Processed mix of hydrolyzed wood pulp processed solid waste and other combustible solids in an extrudable mass with alcohol solutevehiclemdashdemonstrate utility in vehicles as a high energy content clean burning fuel for EC engines
Demonstrate effective pyrolysis of
Binary Solid Gas Fuel
EPA Waste Management BFI
400 processed solid fuels in a binary fuel burner conventional fuel (gasoline natural gas) provides primary heat source for pyrolysis temperatures
Proof of Concept OEM Power Plant
Vehicle OEM (eg Ford GM Caterpillar) 1200
Development of direct replacement BRASH engine alternative to existing OEM IC engine
Black Box Integration of Controller Software
Vehicle OEM (eg Ford GM Caterpillar)
1600 Development of commercial BRASH system alternative to existing OEM IC engine
FEDERAL TRANSIT ADMINISTRATION 35
SECTION 5 DEVELOPMENT PLAN AND NEXT STEPS
The issuance of US Patent 7743872 five months ago has two important consequences for this project First it serves to validate the underlying technology the combination of air and steam in an EC engine is better than steam or air alone Second it provides a basis for full and open discussions with government agencies and large commercial interests in the transportation and power sectors
Our efforts at promotion have been delayed pending successful demonstration of the Smarttrade car vehicle to allow the first detailed real-world performance data to be distributed
Coupling that performance data with the option of migration away from refined petroleum should spark significant interest If we can move to a high lignin-processed wood pulp that costs $045 per gasoline gallon equivalent (an arbitrary value for example only) and consumes more CO2 while growing than is consumed in processing as a fuel and produced from combustion then we succeed as a project and as a global game-changing technology for many uses Improvements in fuel economy are important but of greater importance is the migration to low-process biomass fuels
FEDERAL TRANSIT ADMINISTRATION 36
SECTION Potential Applications and Societal Value 6 The whole premise behind the BRASH air steam hybrid is that external combustion offers a more benign and environmentally-appropriate way to power large vehicles and other portable equipment than refined petroleum-powered internal combustion
bullCombustion heat can be derived from any fuel source including processed solids from fast-growing renewables such as poplar trees waste corn stalks or switch grass
bullThat combustion heat is applied at a rate consistent with the work to be done and not to support idling and other unproductive fuel use
Using a mix of air and steam as working fluids in the engine allows
bullImmediate startup from an ldquoair-onlyrdquo start
bull Managed system pressure through use of a defined head air pressure
bullManaged fuel burn as the air-steam fraction is adjusted to match wheel load
bullAdjusted wheel load reduces fuel burn
Integration of modern control circuitry with external combustion also brings a level of performance operational simplicity and safety heretofore unavailable
FEDERAL TRANSIT ADMINISTRATION 37
SECTION
7 Phase I Conclusions
The last steam train in scheduled service in the US departed on October 11 196225 One year earlier Robert Noyce received the first patent for an integrated circuit26 But for that brief one-year overlap the most powerful motive power technology was never harnessed by the black box controls that grew out of Noycersquos invention so the diesel-powered IC engine championed by Henry Ford won out
Now nearly 50 years later the modern IC engine cannot operate efficiently without the benefit of black box electronicsmdashbut that technology still presents intractable challenges of supply safety and environmental impact The air-steam hybrid technology may offer an alternative and a glimpse of that potential is presented here and viewable in Run 5 on the Brash Engines website at http wwwbrashenginescom
While demonstration in a test vehicle provides a strong visual message that BRASH technology works the commercial success of this technology will depend upon reliable repeatable measurement of power and economy For that data the Phase 2 effort will require a return to laboratory bench testing and effective demonstration of recovery of the water and air fractions
The results of this Phase I project collectively demonstrate the technical feasibility and commercial potential of the BRASH air-steam hybrid engine technology The initial DOT SBIR funding has been highly effective in facilitating this important proof of concept and laying the groundwork for further technology refinement and application
As described earlier the next steps are clear and appear to combine achievable and rapid major advances with low developmental risk SBIR Phase 2 support is needed for those advances due to the still-early stage of development that restricts access to private capital
The immense potential value of this technology has been enhanced and verified in Phase 1 there is now a clear and low-risk path ahead to larger-scale testing further component and controls refinement specific applications prototyping and pre-commercial deployments
25William Rosen The Most Powerful Idea in the World Random House 2010 p 311 26US Patent 2981877
FEDERAL TRANSIT ADMINISTRATION 38
APPENDIX
A Heat Transfer Efficiency Modeling Runs 3 and 5 50 and 90
Much of the analysis for Runs 3 and 5 is based on an assumed efficiency of 90 for heat transfer from the combustion of propane to heating of the water air mix in the coil As a test for the reasonableness of that assumption the same data have been modeled at a much lower 50 factor below
112210 - 3 Low Speed Run Air Pressure 60 psi Water head pressure 60 psi
Water2 00440 5060 4276 101 43 (Wt 000Kg)
Propane 152 1493 237 50 27 11880 1004 (Wt 000Kg)
Time 133000 134150 01150 na na na na (hrmnsc)
1 Energy value based upon absorbed heat (italics) from STP to 1000degK (0446 BTUg for Air 115 BTUg water) Underlined value is released heat at generally accepted 44 BTUg
Air (Wt 000Kg)
Component(BTU) Start Wt End Wt Net Wt Energy1
(BTU) Power
(BTUmin) Power (HP) Efficiency3
661 460 201 938 1294 30 36
Water2
(Wt 000Kg)
Propane(Wt 000Kg)
Time (hrmnsc)
1562
123000
1556
123715
00125
006
00715
380
2640
na
523
364
na
12
86
14
50
na na
Air (Wt 000Kg)
Component(BTU) Start Wt
5 Variable High Speed Run Air Pressure 60 psi Water head pressure 70 psi
End Wt Net Wt Energy1
(BTU) Power
(BTUmin) Power (HP) Efficiency3
654 472 182 849 718 17 7
2 Determined by difference from Propane and Air Energy assumed value 90 3 Arbitrary estimated efficiency of heat transfer not effective work
The two known quantities in each run is the weight of the air moving through the system and the weight of the propane heating that air The variable is the quantity of water heated to steam temperatures and above In Run 3 at 90 efficiency that mass of water calculates to 125 grams at 50 it drops to 33 grams In Run 5 at 90 efficiency that mass of water calculates to 86 grams at 50 it drops to 44 grams
FEDERAL TRANSIT ADMINISTRATION 39
APPENDIX A HEAT TRANSFER EFFICIENCY MODELING RUNS 3 AND 5 50 AND 90
As the comparison tables below show the uncertainty in the efficiency of heat transfer is manifest only in the mass of water heated to steam to do useful work
Data 90 Efficiency
Air
Component Run 3 BHP
Run 5 BHP
Net ChngBHP
-45
Run 3 Mass
Transfer (kg)
Run 5 Mass
Transfer (kg)
Net ChangeMass
Transfer (kg)
30 17
197
237
2010 182 -9
Water
Propane
Duration (mn)
47
86
725
422
0060
0013
725
0270
0086
1180
588
350
163 1180
276
163
Data 50 Efficiency
Air
Component Run 3 BHP
Run 5 BHP
Net ChngBHP
-45
Run 3 Mass
Transfer (kg)
Run 5 Mass
Transfer (kg)
Net ChangeMass
Transfer (kg)
30 17
101
237
2010 182 -9
Water
Propane
Duration (mn)
12
86
725
817
0060
0003
725
0270
0044
1180
1233
350
163 1180
276
163
Regardless of the specific efficiency Run3 reflects an air-rich propellant mix while Run 5 was clearly the more powerful and steam-rich propellant If 50 efficiency is a more realistic figure than 90 the only consequence is more water passing through the heater expander and recovery tank The only consequence for overall system efficiency is the slight but added work required to move the additional water by pump to the top of the water column
FEDERAL TRANSIT ADMINISTRATION 40
APPENDIX Acronyms B
BHP Boiler Horsepower
BRASH Binary Recovery Air-Steam Hybrid
BTU British Thermal Unit
CC Cubic centimeter
CFM Cubit feet per minute
CHP Combined heat and power
CNG Compressed natural gas
CO2 Carbon dioxide
CU Cubic
DARPA Defense Advanced Research Projects Agency
DGE Diesel gallon equivalent
DOT Department of Transportation
EC External combustion
EIA Energy Information Administration
EPA Environmental Protection Agency
FTA Federal Transit Administration
GGE Gasoline gallon equivalent
HP Horsepower
IC Internal combustion
K Kelvin
Kcal Kilocalorie
MPG Miles per gallon
MPH Miles per hour
OEM Original equipment manufacturer
PSI Pounds per square inch
RPM Revolutions per minute
SBIR Small Business Innovation Research
STP Standard temperature and pressure
FEDERAL TRANSIT ADMINISTRATION 41
FEDERAL TRANSIT ADMINISTRATION 128
US Department of TransportationFederal Transit AdministrationEast Building1200 New Jersey Avenue SEWashington DC 20590httpwwwftadotgovresearch
US Department of Transportation Federal Transit Administration East Building 1200 New Jersey Avenue SE Washington DC 20590 httpwwwftadotgovresearch
FEDERAL TRANSIT ADMINISTRATION 42
- Button1
- Button2
- Button3
- Button4
- Button5
- Button6
- Button7
- Button8
- Button9
- Button10
- Button11
- Button12
- Button13
- Button14
- Button15
- Button16
- Button17
- Button18
- Button19
- Button20
- Button21
- Button22
- Button23
- Button24
- Button25
- Button26
- Button27
- Button28
- Button29
- Button30
- Button31
- Button32
- Button33
- Button34
- Button35
- Button36
- Button37
- Button38
- Button39
- Button40
- Button41
- Button42
- Button43
- Button44
- Button45
- Button46
- Button47
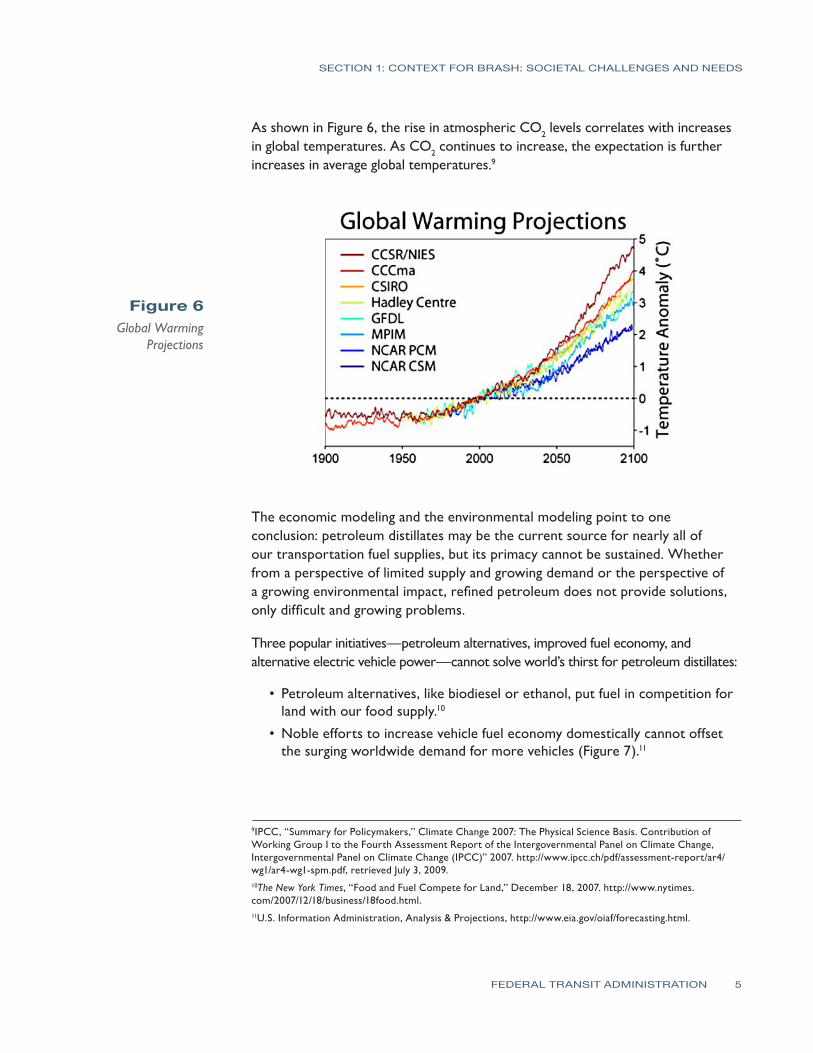
SECTION 1 CONTEXT FOR BRASH SOCIETAL CHALLENGES AND NEEDS
and that can come only through the technical migration toward external combustion BRASH (Binary Recovery Air-Steam Hybrid) technology provides that path
FEDERAL TRANSIT ADMINISTRATION 7
SECTION Technology Background 2 With few exceptions all mechanical work is derived from heat and all that heat is generated by combustion The earliest effective engines were steam engines first put to practical use at the time of US independence Steam engines remained the dominant source for motive power for the next century until its slow but steady displacement by IC engines in the automobile
Henry Ford was first inspired to develop steam traction engines as a better solution than plow horses14
I felt perfectly certain that horses considering all the bother of attending them and the expense of feeding did not earn their keep The obvious thing to do was to design and build a steam engine that would be light enough to run an ordinary wagon or to pull a plow I thought it more important first to develop the tractor To lift farm drudgery off flesh and blood and lay it on steel and motors has been my most constant ambition
Ironically by the 1920s steam traction engines were completely displaced by IC tractors largely the product of the same Henry Ford and his Fordson brand of tractor15
The IC engine was smaller lighter and cheaper to producemdashand considered safer Gasoline- and diesel-powered tractors were more expensive to operate but the most compelling argument for switching was safety in the hands of a lower-skilled operator who no longer had to constantly watch gauges and adjust temperatures and pressures
Similar differences existed in the broader automotive market and the advent of the electric starter effectively ended consumer interest in EC steam cars
Still near the end of the steam car era Stanley Doble White and others offered technically-competitive options The Doble Model E (Figure 8) weighed more than 5500 pounds but achieved in the 1930s the same fuel economy of a comparable IC engine in a contemporary SUVmdash16 mpg The Doble was powered by a four-cylinder engine of 190 cubic inches displacement about the size of an Accord engine but the Doble weighed 67 percent more than the Accord As for emissions one Doble Model E (currently owned by Jay Leno) recently passed California emissions testing with no modifications16
14Henry Ford My Life and Work 1922 15Spencer Yost Antique Tractor Bible 1998 16ldquoJayos Garage 1925 Doble Series E Steam Carrdquo httpwwwjaylenosgaragecomat-the-garagesteam-cars1925-doble-series-e-steam-car
FEDERAL TRANSIT ADMINISTRATION 8
SECTION 2 TECHNOLOGY BACKGROUND
Figure 8 Doble Model E
Doble and Brooks also built passenger buses similar in capacity and weight to contemporary buses The Brooks shown in Figure 9 was powered by a 400-cubic-inch V8 steam engine and carried 29 passengers at 60 mph while turning at 2000 rpm As a cruel twist of fate the public unveiling of the Brooks Steam Bus was announced in October 1929 two weeks before the stock market crash and the onset of the Great Depression17 The company did not survive
Figure 9 Brooks Steam Motors Bus
17Wikipedia ldquoBrooks Steam Motorsrdquo httpenwikipediaorgwikiBrooks_Steam_Motors
FEDERAL TRANSIT ADMINISTRATION 9
SECTION 2 TECHNOLOGY BACKGROUND
The suitability of steam power for mass transit use can be seen from comparison of a very powerful contemporary Ford V-8 Diesel engine (from the Excursion SUV) to the Besler V-Twin Steam engine circa 1938
Ford Turbo Diesel Besler Steam Configuration V-8 V-2 Displacement (cuin) 445 80 Horsepower 175 150 Torque (ft-lbs) 420 1200 Engine wt w transmission (lbs) 930 80
The Besler is roughly one quarter the size and weight of the V-8 Turbo-Diesel but has equivalent horsepower and three times the available torque (the primary determinant of performance) The Detroit Diesel Series 60 six-cylinder engine commonly used in mass transit vehicles produces marginally more torque (1450 ft-lbs) than the Besler from twice the horsepower and with much more fuel
Steam engines make greater use of the energy contained in the fuel by separating the heating phase of the Carnot cycle from the expansion phase and metering fuel burn to more closely match demand A steam engine presents maximum torque at low speed and greater horsepower and torque than comparable IC engines
Another EC technology gaining resurgent interest is compressed air power Recent reports of collaboration between MDI of France and Tata Motors of India suggest a new approach toward EC engines18 Tata Motors a major producer of vehicles on the Indian subcontinent intends to produce the MDI Air Car in the near future with anticipated fuel economy of 106 mpg The latest iteration of the MDI Air Car shown in Figure 10 has a projected range of 848 miles from 8 gallons of fuel or 106 mpg for a 4-passenger vehicle weighing 1870 pounds19
The MDI City Car relies on a six-cylinder 75 HP engineexpander to achieve this performance and in the ldquoprocess [produce] emissions of only 0141 lbs of CO2
per mile That is hellip less than [half] the cleanest vehicle available todayrdquo (Toyota Prius 07 Emissions 034 lbs of CO2 per mile)
18Autobloggreen ldquoA New Agreement between Tata Motors and MDI Bring the Air-Car Closer to Realityrdquo March 21 2007 httpgreenautoblogcom20070321a-new-agreement-between-tata-motors-and-mdi-bring-the-air-car-cl 19Motor Development International (MDI) OneFlowAIR httpwwwmdiluenglishoneflowairphp
FEDERAL TRANSIT ADMINISTRATION 10
SECTION 2 TECHNOLOGY BACKGROUND
Figure 10 MDI Air Car
The schematic for the MDI power plant is shown in Figure 11 The stored air is heated to combustion temperatures and allowed to expand mechanically This is the practical definition of an EC engine where combustion provides heat but the working fluid or propellant is not generated by the combustion process itself
Separating the heating step from the expansion step does not in itself yield higher fuel economy or lower emissions But the regulation of fuel flow to maintain optimum propellant temperature immediately prior to expansion provides both maximum fuel economy and lowest possible emissions In contrast an IC engine ignites fuel at 1800degF and immediately conducts that heat away through its water jacket to drop cylinder temperatures to 200ndash300degF EC engines preserve that heat for useful work
Figure 11 MDI Air Engine
Schematic
FEDERAL TRANSIT ADMINISTRATION 11
SECTION 2 TECHNOLOGY BACKGROUND
Both air and steam engines provide an alternative to the conventional IC engine Both operate from a variety of fuels and offer the potential of lower emissions and higher fuel economy Steam is the more robust of the two (the Besler Steam Twin is much more energetic than the MDI six-cylinder) but the compressed air engine offers an operational simplicity and a lower weight because no boiler or condenser is required Unfortunately it can never provide the power and acceleration of steam
The best of both worlds would be a blending of air and steam into a single engine that offers all of the benefits but without the weight and heat management issues of a boiler and with significantly more power than an air engine alone
FEDERAL TRANSIT ADMINISTRATION 12
SECTION The Air-Steam 3 Hybrid Solution
Air and water are completely different in their physical properties except when they operate as working fluids at high temperatures and pressures At steam operating pressures and temperatures their behavior largely follows ideal gas behavior and each is miscible in the other at all proportions The arrow in Figure 12 indicates the rough path for expansion of the hot high-pressure propellant and shows near ideal gas behavior for steam at these elevated temperatures and pressures
Figure 12 Does Steam
Behave Like an Ideal Gas
Getting to steam operating temperatures and pressures requires that significantly more heat be applied to water than air at STP (standard temperature and pressure) Air requires only 642 kcalmole to reach these operating temperatures while water (steam) requires 5236 kcalmole (due to the 512 kcal heat of vaporization) In this development a baseline flow of air is used to entrain water into the heater section Fuel is consumed in direct proportion to the water fraction to maintain the heater at a near constant temperature The heat required to maintain ldquohot airrdquo temperatures is a small fraction of the heat required to maintain steam temperatures as shown in Figure 13
FEDERAL TRANSIT ADMINISTRATION 13
SECTION 3 THE AIR-STEAM HYBRID SOLUTION
Figure 13 Heat Required
to Raise Air and Water
Temperature to 1000degK
The compressed air fraction provides a safe and consistent flow pressure into the hot section The water once heated to working steam temperature provides a more robust working fluid
The hot mixed propellant is injected into the expander moving a piston and converting heat to motion The expanded propellant thereby drops to condensing temperatures allowing the water portion to drop to a sump for pumped return to the injector The expanded air fraction is then recompressed for return to the injector
The use of an air fraction allows for immediate injection of work-appropriate amounts of water into the hot section no boiler no steam under pressure no fuel wasted (heating steam without immediate purpose) The use of a water fraction (and proportional fuel flow) allows for variable power from a constant temperature system The binary (air-steam) propellant allows for a closed-loop condensing recovery system extending range and economy
Figure 14 Schematic of Injector Nozzle Used to Mix Air
and Water
FEDERAL TRANSIT ADMINISTRATION 14
SECTION 3 THE AIR-STEAM HYBRID SOLUTION
The sum of the process is as follows
Key start begins a modest fuel burn that immediately provides initial hot air flow through the engine
bull Depressing the accelerator increases the water fraction and fuel flow (in direct proportion)
bullThe vehicle moves forward under (airsteamfuel) power in direct proportion to wheel turn
bullThe hot mix expands and the expanded mix condenses the water fraction
bullA small parasitic load recompresses the small air fraction to reinjection pressures
bull Removing the foot from the accelerator returns the flow to hot air only sweeping residual moisture from the cylinders and preventing hydraulic lock (during next cold start)
The engine can operate on any fuel whose flow can be regulated (semi-solid liquid gas) Combustion occurs at high temperature at one atmosphere so much cleaner burning than internal combustion
Figure 15 Air-Steam Hybrid
Schematic
Accelerator regulates flow of air water and fuel to heater based on load and wheel speed Water and fuel are metered to maintain heater temperature within optimal performance band
Output demand determines air-water fraction
Any discussion of fuel efficiency relative to current IC engine technology must first re-emphasize the multi-fuel capability of EC engines In a market so dominated by one fuel customers have accepted the term ldquomiles per gallonrdquo
FEDERAL TRANSIT ADMINISTRATION 15
SECTION 3 THE AIR-STEAM HYBRID SOLUTION
as the basis for comparison But in an open market with many different fuels and widely different heat content (BTUlb) the only common and appropriate denominator is ldquomiles per dollarrdquo (closer to ldquofuel economyrdquo)
To the extent that any EC solution gains market acceptance and the market responds with new and different fuel blends the law of supply and demand dictates that fuel prices for all will drop Until then the remainder of this efficiency discussion will assume all engines require the same petroleum-based fuel
The long-accepted estimate of fuel efficiency for the IC engine is about 25 percent with the remaining 75 percent of the heat content dissipated in equal parts through the hot exhaust the radiator and mechanical losses in the engine Much has been done to raise that efficiency but what remains is one power stroke in four and a high temperature detonation whose heat content is quickly and intentionally dissipated through conduction
In sharp contrast a steam engine is designed to preserve as much heat as possible from combustion and then mete out that heat through the expansion of the working fluid Instead of a 25 percent heat loss through conduction through a radiator conductive loss is limited to 10 percent in efficient steam engines The greatest loss is through the vaporization of water to steam (at 30) yielding useful work of 35 or 40 percent higher than internal combustion Steam vehicles often report significantly lower practical fuel economies as the whole boiler is heated for a relatively short trip (another reason to avoid using a boiler)
Hot air engines involve no change of state therefore avoiding the loss associated with vaporization That can mean fuel efficiencies approaching 65 percent except as noted with the MDI engine a lower power-to-weight capability
The combination of air and steam into a single engine type is expected to yield economies between 35 and 65 percent varying with wheel load A 50 percent net efficiency would double fuel economy over a comparably-sized IC engine but as shown with the Doble and Besler examples the EC engine can be much smaller yielding even greater economies
FEDERAL TRANSIT ADMINISTRATION 16
SECTION 3 THE AIR-STEAM HYBRID SOLUTION
Figure 16 Fuel Efficiency
by Engine Type
Derivative Uses As much as this study is focused on large motive power applications it should be noted that an equally important opportunity for this technology is in stationary power applications similar in configuration to combined heat and power units referred to generally as micro-CHPs Rapid start-up high torque quiet operation and multi-fuel compatibility make it well suited to an integrated heat and electrical power installation
FEDERAL TRANSIT ADMINISTRATION 17
SECTION 3 THE AIR-STEAM HYBRID SOLUTION
Its ability to produce a full range of power options (mechanical pneumatic heat and through attached accessories electrical and hydraulic) in a small modular man-portable configuration also make it particularly well suited to temporary or tactical power requirements Although beyond the scope of the DOT goals for vehicular use this stationary power applicationrsquos potential may be strategically important in market acceptance and adoption by expanding the range of applications and thereby providing economies of scale in all aspects of development production and commercialization activities for all applications
FEDERAL TRANSIT ADMINISTRATION 18
SECTION BRASH Test Plan 4 This Phase I effort followed the Technical Objectives outlined in the proposal as follows
Practical Objectives 1 Modify the Smarttrade sized test vehicle (Figure 17) installing a 10ndash20 HP
equivalent heater a 650 cc displacement 2 HP (nominal) Quasiturbinetrade steam engine pressurized air and water tanks electronic flow regulation of air water and fuel via laptop-based LabVIEW software and solenoid valves
2 Perform test runs to validate the system operation and determine key baseline performance parameters such as
a minimum air fraction to maintain engine operation upper limits for operating temperatures maximum allowable flow rates for water (without reducing effective propellant flow at temperature)
b upper limits of vehicle speed while varying gross vehicle weight and course incline
3 Following baseline performance assessment further objectives included
a an analysis of component placement for ease of maintenance and replacement
b an estimation of comparable volumes and weights to an equivalent IC powertrain in order to verify retrofitability
c an estimation of effective fuel economy while using propane fuel on closed track mileage runs
Figure 17 Smarttrade
Car-Sized Test Vehicle
FEDERAL TRANSIT ADMINISTRATION 19
SECTION 4 BRASH TEST PLAN
4 Over the course of multiple test runs a cumulative assessment of component performance and reliability would lead to a gross verification of BRASH engine integrity and range That in turn could lead to off-site vehicle demonstrations to federal agencies potential industry partners and investors
Analytical Objectives 1 The BRASH engine model has been demonstrated only at a bench level with
rudimentary understanding of its operating principles A key objective in this vehicle build is to increase the thermodynamic modeling of this technology including an analysis of mass flow (air water fuel) and resulting power
2 Early test data would lead to analysis of specific on-vehicle capacities (for air water and fuel) and flow rates for same in order to estimate operating range recovery strategies and rates (recompression and condensation) and the parasitic loads (eg alternators pumps) to sustain useful operation for many hours
3 Over time the vehicle testing under various test conditions (eg varying gross vehicle weight wheel load engine temperature propellant mix) will lead to a body of data to support more complete modeling of water fraction vs torque vs temperature These data are essential to real-world estimation of fuel economy as this technology scales to larger practical vehicle applications
4 With the modeling from 3 in place for steady-state operation practical track runs with frequent starts and stops can further shape the model for real-world use
5 The analysis from steps 1ndash4 will provide sufficient basis for estimating the mass flow heat component capacity recovery factors and fuel economy for scaling this 2 HP test data to larger vehicles in two decade steps first to a 20 HP pickup truck and then further modeling and custom buildup of a 200 HP power plant with a DOT-identified industrial partner
6 This analytical plan is consistent with the overall SBIR program plan as the 2HP effort is confined to Phase I the 20 HP build and test plan would be accomplished in Phase II and the design and build of the 200 HP power plant would be accomplished in Phase III with an established industry partner
The work effort toward completion of these tasks has proceeded on two tracks mechanical modifications to the April test vehicle and electronic control and measurement
Mechanical Modifications and Test Configuration The test vehicle is a modified electric car about the size of a Smarttrade car Earlier modifications included removal of the electric drive train exposing a large working
FEDERAL TRANSIT ADMINISTRATION 20
SECTION 4 BRASH TEST PLAN
space behind the cab This rear space over the rear left wheel contains a 2HP Quasiturbinetrade steam engine20 selected for its compact design and suitable power range for this 700-pound vehicle The placement over the left wheel permits direct drive to that wheel via electric clutch and chain drive
Figure 18 Quasiturbinetrade
Rotary Expander Installed and Interior View
In the center of center of this rear space a heavily-modified propane space heater rated at 30000ndash80000 BTUhr (equivalent to 11ndash31 boiler horsepower [bhp]) was installed Heaters of this type generally are designed to efficiently distribute heat into an adjoining space This heater was heavily modified with high temperature insulation and outer shells to retain useful heat to the 20-ft stainless steel coil passing through its core
Figure 19 Quasiturbinetrade
Rotary Expander Installed and Interior View
the expander and heater (with recent refinements) Also visible under the heater is the pressurized water tank (painted grey) The open space to left of the heater is reserved for drive components The space to the right of the heater is reserved for recovery and recompression of the expanded propellant (Recompression is outside of the current scope to simplify the testing and analysis See discussion section for more information) Other system components include air cylinders and electronic controllers that are mounted forward of the rear firewall in the cab or under the front hood
Figure 20 shows the back of the vehicle with fenders and trim removed revealing
20Quasiturbinetrade Product Details httpquasiturbinepromciqcca
FEDERAL TRANSIT ADMINISTRATION 21
SECTION 4 BRASH TEST PLAN
Figure 20 Test Configuration
Figure 21 System Components
The main system components are shown Minor components and linkage tomechanical output are not included in this report for the sake of simplicity
Electronic Control and Measurement No realistic progress toward a vehicle demonstrator with known and regulated fuel use can proceed without electronic regulation In this build the LabVIEW program and system components from National Instruments were used to create a ldquoglass cockpitrdquo of vehicle controls and performance measurement21 The simplified schematic in Figure 22 shows the planned integration of electronics in this development LabView-compatible components will replace all mechanical flow and measurement components
21More information can be found at National Insturments The LabVIEW Environment httpwwwnicomlabview
FEDERAL TRANSIT ADMINISTRATION 22
SECTION 4 BRASH TEST PLAN
Figure 22 Electronics
Schematic for Air-Steam Hybrid
For the vehicle driver the dashboard collection of gauges has been replaced with a laptop screen similar to the one pictured in Figure 23
Figure 23 Front Screen Display for Air-Steam Hybrid
Certain features on this front screen will reflect user input (OnOff Throttle) while others reflect the dependent variables in the process (Heater Temp Fuel Flow Air and Water Flow) Shown on the bottom screen will be running time-series data on speed wheel load temperature specific fuel consumption and the other variables important to the analytical process The front screen display is generated from programming and controls on the back screen display
FEDERAL TRANSIT ADMINISTRATION 23
SECTION 4 BRASH TEST PLAN
Figure 24 Back Screen Display for Air-Steam Hybrid
LabVIEW software and controllers were chosen because of National Instrumentsrsquo status as the industry leader in rapid control prototyping and In-Vehicle data-logging solutions BKi purchased the LabVIEW componentry through the University of Connecticut Mechanical Engineering Department as part of UConnrsquos ongoing support of the project
By the end of the contract term in October 2010 the air and water regulation components were complete and operational but the fuel regulation and engine speed components were not yet fully operational To generate the most meaningful data under these circumstances the test vehicle was configured for extended operation to determine specific fuel water and air consumption rates The combination of these rates provided the basis for initial estimates of power and efficiency
Summary of Effort Mechanical Modifications
1 Removal of original electrical drive components reinforcement of frame
2 Installation of Quasiturbinetrade 2HP engine modified heater pressurized water tank all pneumatic water and fuel lines
3 Baseline validation testing using manual controls
4 Installation of electronically-regulated flow controllers
Electronic Modification 1 Acquisition of computer electronic regulators and control software
2 LabVIEW systems programming
3 System checkout
FEDERAL TRANSIT ADMINISTRATION 24
SECTION 4 BRASH TEST PLAN
Testing and Analysis 1 Static Safety Testing 2 Baseline vehicle drivetrain testing
3 Vehicle static testing (Runs 3 amp 5)
Summary of RequirementsGoals 1 Safe operation of vehicle during static and motive applications
2 Qualitative demonstration of BRASH engine capability to move test vehicle on flat and inclined road surface
3 Quantitative determination of air water and fuel consumption during timed static test
4 Quantitative determination of air water and fuel consumption while varyshying water and fuel fractions
Summary of Testing Two experiments were performed in late November the first to establish minimum fuel and propellant flow rates for sustained operation at low speed (air-rich mode) and the second to establish reasonable upper limits of fuel and propellant flow at higher engine speeds (steam-rich mode) Variation in the air-steam mix is the underlying theory of operation for the BRASH engine the air fraction provides a baseline flow for initial start-up and low-speed operation but the addition of water (as steam) to the propellant results in a significant boost in range and power These two tests have verified this underlying theory
Test Conditions The two test runs summarized in this report are 3 on November 22 2010 and 5 on November 26 2010 Both tests were performed at the Depot D campus of the University of Connecticut in Storrs The testing was performed outside in seasonal conditions 45-50degF with light winds
Figure 25 Vehicle Test Setup
FEDERAL TRANSIT ADMINISTRATION 25
SECTION 4 BRASH TEST PLAN
Each run was a dynamic test with no load on the two-cylinder Quasiturbinetrade engine The propane cylinder was suspended from a scale for the duration of the test Propane fuel consumption was monitored continuously by digital scale with a display accuracy of 001kg
Each test run lasted for the duration of one high pressure air cylinder Air cylinder start (full) and end (empty) were determined at the start and finish of each run using the same scale and accuracy Water levels initially were determined volumetrically but the results were too inconsistent Displaced volume of liquid water proved a poor measure of the quantity heated to steam and carried forward for productive work For this reason water is an estimated quantity based upon fuel quantity burned less heat absorbed by the air fraction (Further integration of the LabView controller software in the next phase will obviate this work-around)
Each of the complete test runs may be viewed at Brash Engines website httpwwwbrashenginescom Photos from each run appear in the figures that follow Tables 1 and 2 summarize the productive mass flow for air water and propane fuel to produce work from the engine for the test duration
The cab interior in Figure 26 shows the high pressure air cylinder below the steering wheel and the laptop computer (regulating propellant flow) in passenger seat space The LabView controllers reside in the protective case under the laptop
Figure 26 Vehicle Cab with Controller Laptop
During each test hot propellant was allowed to expand and vent to ambient in order to simplify the thermodynamic model and analysis (Note the plumes of water vapor from each exhaust hose and the small puddles of water under each hose in Figure 27)
FEDERAL TRANSIT ADMINISTRATION 26
SECTION 4 BRASH TEST PLAN
Figure 27 Exhaust Plumes from Expander
Development plans include recovering the expanded propellant separating into water and air phases and then recompressing the air fraction for re-use This will both improve efficiency and eliminate the visible vapor plume
Test Assumptions Another estimation used in this study is the efficiency of heat transfer for the propellant through the 20-ft coil of stainless steel inside the insulated heater Figure 28 shows an early ldquoair-onlyrdquo test run with the current heater The hose failure and melting of the steel wire mesh inside (note formed ball in the mesh) indicates 1300degK temperatures exiting the hot section
Figure 28 Hose Failure Due
to Overheating
FEDERAL TRANSIT ADMINISTRATION 27
SECTION 4 BRASH TEST PLAN
Effective heat transfer (as Figure 28 shows) does not equal efficient heat transfer but the ability to deliver 1300degK air from a well-insulated burner suggests a highly efficient transfer of heat The analysis of results assumes a value of 90 efficiency (See Appendix A for a discussion of heat transfer efficiency)
3 Low Speed Test On November 22 2010 Run 3 tested the lower operating limits of the test setup Low limit in this context meant sufficient pressure to maintain expander rotation but low steam and fuel burn The test commenced with a full air cylinder weighing 661 Kg At the end of the test the empty cylinder weighed 460 Kg Over the 7 minutes and 15 seconds of testing 006 Kg of propane was consumed
The mass of air and fuel was determined from before after run test weights As stated earlier determining the quantity of steam produced from the pressurized water tank was problematic because of the quantity of stored water the resistance to water flow under dynamic pressures and the potential for some fraction of the water (in liquid state) to be entrained in the propellant mix
To solve for this unknown the energy required to raise the known quantity of air from ambient to 1000degK (33kcalmol or 0467 BTUg) was subtracted from the energy content of the propane consumed (44 BTUg) and then the efficiency of the heat transfer process was de-rated by 10 percent to yield a net quantity of 1438 BTUs to elevate ambient temperature water to 1000degK steam The result is an estimated 125 grams of water consumed in the 7-minute test
Table 1 summarizes these data and shows a high reliance on the air fraction for the work performed by the 2 HP engine The air cylinder used in this test has a measured free volume of 45 cubic feet (1274 liters at STP) which means sustained flow rates of 62 cubic feet per minute (cfm) or 175 liters per minute In contrast the 125 grams of water passed through as steam produced an estimated equivalent gas volume of 155 liters at STP Note the modest levels of water vapor in Figure 29 Why the greater air fraction relative to water flow in this test
Air (Wt 000Kg) 661 460 201 938 1294 30 36
Water2
(Wt 000Kg)
Propane(Wt 000Kg)
Time (hrmnsc)
1562
123000
1556
123715
00125
006
00715
1438
2640
na
1983
364
na
47
86
54
90
1 Energy value based upon absorbed heat (italicized) from STP to 1000degK (0446 BTUg for Air 115 BTUg water) 2 Determined by difference from propane and air energy assumed value 90 3Arbitrary estimated efficiency of heat transfer not effective work
11222010 - 3 Low Speed Run Air Pressure 60 psi Water Head Pressure 60 psi
Component(BTU) Start End Net Energy1
(BTU) Power
(BTUmin) Power (HP) Efficiency3
Table 1 Analysis of Mass
Flow Data at Low Speed
FEDERAL TRANSIT ADMINISTRATION 28
SECTION 4 BRASH TEST PLAN
Figure 29 Low-Speed Test Results in Little
Water Vapor
In this baseline experiment the single cylinder provides 60 psi air flow and 60 psi static ldquoheadrdquo pressure on the water column The air flow from the cylinder is biased toward the generally less restrictive flow path for air The water column under the same pressure presents a higher viscosity medium passing through a greater number of valves and restrictions At the point of injection the air fraction flows more freely into the hot section In order to bias the mix toward greater water fraction (and greater power) the head pressure on the water column must be increased over the 60 psi air line pressure
Run 4 (not documented here) evaluated head pressures from 110 psi to 70 psi and determined that modest differential pressures retarded the flow from the air fraction and boosted flow of the water fraction Still higher differential pressures effectively stopped air flow altogether reverting the engine operation to ldquosteam onlyrdquo For Run 5 an additional cylinder was used to apply a 70 psi static head pressure on the water column a 10 psi differential over the 60 psi air line pressure
5 Variable High Speed Test On November 26 2010 Run 5 tested the higher differential water pressure as a means to increase the effective water fraction in the propellant mix The test commenced with a full air cylinder weighing 654 Kg At the end of the test the empty cylinder weighed 472 Kg Run 5 was interrupted after 243 minutes to refill the water tank and then testing resumed for an additional 907 minutes Over the whole test 027 Kg of propane was consumed
Using the same analytical basis as Test 3 Test 5 data indicate a substantial increase in work capacity (as measured by fuel consumed and steam generated) over the 3 baseline
FEDERAL TRANSIT ADMINISTRATION 29
112610 - 5 Variable High Speed Run Air Pressure 60 psi Water Head Pressure 70 psi
Air (Wt 000Kg)
Component(BTU) Start End Net Energy1
(BTU) Power
(BTUmin) Power (HP) Efficiency3
654 472 182 849 718 17 7
SECTION 4 BRASH TEST PLAN
Table 3 Comparison of Mass Flows
Water 588 Runs 3 and 5
163 Duration (mn) 725 1180 725 1180 163
Air
Component Run 3 BHP
Run 5 BHP
Net ChngBHP
Run 5 Mass
Transfer (kg)
Net ChangeMass
Transfer (kg)
30 17
197
237
-45 2010 182 -9
Run 3 Mass
Transfer (kg)
276 350
47
86
422
0060
0013
0270
0086
Propane
This difference in steam fraction and power is more clearly seen in Figure 30 (and on the source video at the Brash Engines website)
Figure 30 Three Images from Run 5
Table 2 Test 5 Results with Increased
Water and Fuel Water2
(Wt 000Kg) 0860 9890 8358 197 83
Propane(Wt 000Kg) 1520 1493 27 11880 1004 237 90
Time (hrmnsc) 133000 134150 01150 na na na na
1 Energy value based upon absorbed heat (italics) from STP to 1000degK (0446 BTUg for Air 115 BTUg water) Underlined value is released heat at generally accepted 44 BTUg 2 Determined by difference from propane and air Energy assumed value 90 3 Arbitrary estimated efficiency of heat transfer not effective work
The increase in pressure on the water column by 10 psi reduced air flow by 9 percent but increased the steam fraction considerably and thereby increased the effective boiler horsepower nearly three-fold to 237 bhp (assuming 90 heat transfer) These data are summarized in Table 3
FEDERAL TRANSIT ADMINISTRATION 30
SECTION 4 BRASH TEST PLAN
As with Run 3 start up from Time Zero was immediate burner on air flow begins and water flow under pressure commences immediately Another impressive feature of the mix air-steam propellant system is the ability to start stop and rapidly accelerate as shown in the full Run 5 video Run 5 serves as validation that this patented technology has unique performance benefits over air steam or internal combustion alone
Lessons Learned A comparison of the two test runs verifies some key points
1 The same power plant can produce variable power and fuel economy based upon power demand and airsteam mix
2 Although imprecise at this point in testing fuel consumption appears directly proportional to engine speed The engineexpander will spool up spool down stop and restart in a manner consistent with fuel and propellant flow The Run 5 video on the Brash Engines website verifies this conclusion
3 The use of a defined static air pressure ldquoheadrdquo over the water column at a pressure higher than the defined air line dynamic pressure provides a safe and predictable bias toward flow from the water fraction
4 Although the current test configuration offers sufficient performance for this initial demonstration phase the following observations are in order
a The heater path is too long creating latent response issues
b The airwater injector is not optimized for proper mix or flow capacity
c The incomplete integration of LabVIEW compromises the quality of data
d The absence of a measured variable load on the expander compromises any analysis of power and fuel economy
5 The design migration to a vehicle installation was premature The project should move back to a lab bench study to refine the regulation of components complete the recovery and recompression portions of the system and use electromechanical loads to estimate power and useful work for specific quantities of fuel water and air
6 The Quasiturbinetrade engine technology is promising but too immature for larger-scale modeling Later phases of the project should rely on more conventional multi-cylinder piston-type expander
Estimated Fuel Economy Mass transit authorities have relied on large diesel engines such as the Detroit Diesel Series 50 and Series 60 engines for more than 30 years Reports on fuel economy vary from a high of 60 miles per gallon (Diesel) for longer-range
FEDERAL TRANSIT ADMINISTRATION 31
SECTION 4 BRASH TEST PLAN
commuter services in California23 to a low of 228 miles per gallon (Diesel) for city buses with frequent stops in New York City24 In both cited studies the migration to compressed natural gas (CNG) has resulted in lower fuel economies on a Diesel Gallon Equivalent (DGE) basis
Table 4 summarizes this study (columns 2 and 3) and the next proposed phase (columns 4 and 5) the performance of the current fleet of mass transit buses (columns 6 and 7) and the likely outcome if the Besler engine (described earlier) were employed with the air-steam hybrid technology (columns 8 and 9)
Table 4 Comparison of
Fuel Economies
Air
1
Configuration
Engine
HP
Torque
Fuel
gmin
BTUhr
GGEhr
mpg 60mph
GGE100 mi
$ per GGE
$100 mi
Current
Example
2
3
3
5
4
Bench
5
S-10
6
SB Bus
7
NYCT
8
50 eff
9
30 eff
86
Quasi
2
Prop
82
216
02
3160
03
30
09
Current
237
Quasi
2
Prop
23
607
05
1126
09
30
27
UC 1
40
6 cyl
20
Prop
40
1056
09
648
15
30
46
UC 2
80
6 cyl
40
Mix
80
2112
19
324
31
30
93
MCI102
DD S60
350
1450
Diesel
540
11400
100
60
167
35
583
Diesel
23
439
35
1535
300
Besler
150
1200
Mix
300
792
695
864
1158
16
1853
500
Besler
150
1200
Mix
500
1320
1158
518
1930
16
3088
The Besler engine is shown in two columns The left column reflects the higher efficiency anticipated with the air-steam hybrid mix described earlier as at or near 50 percent The right column reflects the historical efficiency realized with steam engine technology The italicized numbers near the bottom of the column show that even at historical efficiencies the Besler engine would offer equal or better Gasoline Gallon Equivalent (GGE)100 mile ratings of the current diesel technology but migrating toward less refined and (therefore) less expensive fuels would significantly reduce the operating cost ($mile)
23Demonstration of Caterpillar C-10 Dual-Fuel Engines in MCI 102DL3 Commuter Buses National Renewable Energy Laboratory httpwwwnrelgovdocsfy00osti26758pdf p 7 24R Barnitt ldquoNew York City Transit (NYCT) Hybrid (125 Order) and CNG Transit Buses Final Evaluation Resultsrdquo November 2006 National Renewable Energy Laboratory K Chandler Battelle Technical Report NRELTP-540-40125 November 2006 httpwwwnrelgovvehiclesandfuelsfleettestpdfs40125pdf pvii
FEDERAL TRANSIT ADMINISTRATION 32
SECTION 4 BRASH TEST PLAN
There are of course two orders of magnitude difference between the results of Runs 3 and 5 and the daily demands of city and commuter buses but the mere existence of the Besler Twin and the Brooks V-8 400 HP engine suggests an opportunity for fuel economy and fuel variety
Proposed further support for the next phase of development will advance the air-steam hybrid technology by an important order of magnitude This would provide the data confidence to scale to larger vehicle operation and garner the interest of one or more engine or vehicle OEMs
Figure 31 MTANew York City
Transit Orion VII Next Generation
Hybrid Transit Bus
Next Development Phase The next phase of development will incorporate a modern six-cylinder steam engine design with a displacement of 53 cubic inches and capable of sustained 15-25 HP operation The expander will be supplied by Steam Engine Power Inc (httpwwwsteamenginepowercom) This expander will drive an alternator generator to measure effective work output in watts as well as provide sufficient power to satisfy the system parasitic loads of battery recharge exhaust air recompression and all other pump and valve operations
Figure 32 (l to r) Six-Cylinder Expander Power Generation Load
Small 24 VDC Compressor
FEDERAL TRANSIT ADMINISTRATION 33
SECTION 4 BRASH TEST PLAN
Static pressure for the water column will still be supplied via compressed air cylinder but the dynamic air flow will be supplied by an oil-less air compressor of the size and type shown This 24 VDC compressor will recompress the recovered air exiting the expander to 40ndash60 psi pressure and support flows of 3ndash4 cubic feet per minute (cfm) These three components are off-the-shelf enhancements to the system but custom engineering of a new more powerful and more responsive heater completion of the electronic integration and design and fabrication of the recoveryrecompression components are necessary tasks that must be included to make the next generation assembly work to its potential This work will be accomplished largely by Mechanical and Electrical Engineering students at the University of Connecticut under the supervision of faculty and Brash Engines personnel
When this build is complete all operations will be under LabVIEW control All expander operations will be measured for power and work Once the bench version is in control a modified version will be installed in a small pickup truck (eg Chevrolet S-10) for further verification of system performance and robustness
During this phase a new and promising technology will be investigated a new and faster class of solenoid valves from National Instruments These solenoid valves with an unprecedented 3 msec response time have the potential of allowing air-steam retrofit in existing engine blocks The solenoid valves could replace the spark plugs in conventional IC engines and provide the equivalent timed injection of hot propellant mix as the timed firing of a spark plug in the presence of a fuel air mix
If possible these fast solenoids and the black box programming to control them could allow very easy portability to larger vehicles and easier retrofit Potentially a V-6 engine could operate 4 cylinders for expansion and the remaining two cylinders could be used as direct drive compressors with different but equivalent solenoid valves controlling the compression process
FEDERAL TRANSIT ADMINISTRATION 34
SECTION Development Plan 5 and Next Steps
This current effort is a key first-proof of concept for this air-steam hybrid technology but our goals extend well beyond this two-seat 2 HP demonstrator The lessons learned in electronic integration will allow rapid migration to larger platforms using the same basic controls but scaling the expander heater and other mass-flow components to vehicle-appropriate size That project identified as ldquo20 HP Vehiclerdquo and other near-term derivative projects are listed in Table 5
BRASH Project
ProposedFunding Source
Funds Reqd $K Project Description
SUV-size proof-of-concept for reliable 20 HP Vehicle DOTUSPS 300 highway performance maildelivery
vehicle size
Proof-of-concept mass transit busshy200 HP Vehicle DOTDOD 600 retrofit scaled to city bus capacity and
suitable for replacement of over-the-road diesel engines
Table 5 Project Funding
Stationary Power Unit Micro-CHP Equivalent
DARPA 300 Proof-of-concept mass transit bus-retrofit scaled to city bus capacity and suitable for replacement of over-the-road diesel engines
Summary Alternative Processed Solid Fuel DOE EPA DOA 600
Processed mix of hydrolyzed wood pulp processed solid waste and other combustible solids in an extrudable mass with alcohol solutevehiclemdashdemonstrate utility in vehicles as a high energy content clean burning fuel for EC engines
Demonstrate effective pyrolysis of
Binary Solid Gas Fuel
EPA Waste Management BFI
400 processed solid fuels in a binary fuel burner conventional fuel (gasoline natural gas) provides primary heat source for pyrolysis temperatures
Proof of Concept OEM Power Plant
Vehicle OEM (eg Ford GM Caterpillar) 1200
Development of direct replacement BRASH engine alternative to existing OEM IC engine
Black Box Integration of Controller Software
Vehicle OEM (eg Ford GM Caterpillar)
1600 Development of commercial BRASH system alternative to existing OEM IC engine
FEDERAL TRANSIT ADMINISTRATION 35
SECTION 5 DEVELOPMENT PLAN AND NEXT STEPS
The issuance of US Patent 7743872 five months ago has two important consequences for this project First it serves to validate the underlying technology the combination of air and steam in an EC engine is better than steam or air alone Second it provides a basis for full and open discussions with government agencies and large commercial interests in the transportation and power sectors
Our efforts at promotion have been delayed pending successful demonstration of the Smarttrade car vehicle to allow the first detailed real-world performance data to be distributed
Coupling that performance data with the option of migration away from refined petroleum should spark significant interest If we can move to a high lignin-processed wood pulp that costs $045 per gasoline gallon equivalent (an arbitrary value for example only) and consumes more CO2 while growing than is consumed in processing as a fuel and produced from combustion then we succeed as a project and as a global game-changing technology for many uses Improvements in fuel economy are important but of greater importance is the migration to low-process biomass fuels
FEDERAL TRANSIT ADMINISTRATION 36
SECTION Potential Applications and Societal Value 6 The whole premise behind the BRASH air steam hybrid is that external combustion offers a more benign and environmentally-appropriate way to power large vehicles and other portable equipment than refined petroleum-powered internal combustion
bullCombustion heat can be derived from any fuel source including processed solids from fast-growing renewables such as poplar trees waste corn stalks or switch grass
bullThat combustion heat is applied at a rate consistent with the work to be done and not to support idling and other unproductive fuel use
Using a mix of air and steam as working fluids in the engine allows
bullImmediate startup from an ldquoair-onlyrdquo start
bull Managed system pressure through use of a defined head air pressure
bullManaged fuel burn as the air-steam fraction is adjusted to match wheel load
bullAdjusted wheel load reduces fuel burn
Integration of modern control circuitry with external combustion also brings a level of performance operational simplicity and safety heretofore unavailable
FEDERAL TRANSIT ADMINISTRATION 37
SECTION
7 Phase I Conclusions
The last steam train in scheduled service in the US departed on October 11 196225 One year earlier Robert Noyce received the first patent for an integrated circuit26 But for that brief one-year overlap the most powerful motive power technology was never harnessed by the black box controls that grew out of Noycersquos invention so the diesel-powered IC engine championed by Henry Ford won out
Now nearly 50 years later the modern IC engine cannot operate efficiently without the benefit of black box electronicsmdashbut that technology still presents intractable challenges of supply safety and environmental impact The air-steam hybrid technology may offer an alternative and a glimpse of that potential is presented here and viewable in Run 5 on the Brash Engines website at http wwwbrashenginescom
While demonstration in a test vehicle provides a strong visual message that BRASH technology works the commercial success of this technology will depend upon reliable repeatable measurement of power and economy For that data the Phase 2 effort will require a return to laboratory bench testing and effective demonstration of recovery of the water and air fractions
The results of this Phase I project collectively demonstrate the technical feasibility and commercial potential of the BRASH air-steam hybrid engine technology The initial DOT SBIR funding has been highly effective in facilitating this important proof of concept and laying the groundwork for further technology refinement and application
As described earlier the next steps are clear and appear to combine achievable and rapid major advances with low developmental risk SBIR Phase 2 support is needed for those advances due to the still-early stage of development that restricts access to private capital
The immense potential value of this technology has been enhanced and verified in Phase 1 there is now a clear and low-risk path ahead to larger-scale testing further component and controls refinement specific applications prototyping and pre-commercial deployments
25William Rosen The Most Powerful Idea in the World Random House 2010 p 311 26US Patent 2981877
FEDERAL TRANSIT ADMINISTRATION 38
APPENDIX
A Heat Transfer Efficiency Modeling Runs 3 and 5 50 and 90
Much of the analysis for Runs 3 and 5 is based on an assumed efficiency of 90 for heat transfer from the combustion of propane to heating of the water air mix in the coil As a test for the reasonableness of that assumption the same data have been modeled at a much lower 50 factor below
112210 - 3 Low Speed Run Air Pressure 60 psi Water head pressure 60 psi
Water2 00440 5060 4276 101 43 (Wt 000Kg)
Propane 152 1493 237 50 27 11880 1004 (Wt 000Kg)
Time 133000 134150 01150 na na na na (hrmnsc)
1 Energy value based upon absorbed heat (italics) from STP to 1000degK (0446 BTUg for Air 115 BTUg water) Underlined value is released heat at generally accepted 44 BTUg
Air (Wt 000Kg)
Component(BTU) Start Wt End Wt Net Wt Energy1
(BTU) Power
(BTUmin) Power (HP) Efficiency3
661 460 201 938 1294 30 36
Water2
(Wt 000Kg)
Propane(Wt 000Kg)
Time (hrmnsc)
1562
123000
1556
123715
00125
006
00715
380
2640
na
523
364
na
12
86
14
50
na na
Air (Wt 000Kg)
Component(BTU) Start Wt
5 Variable High Speed Run Air Pressure 60 psi Water head pressure 70 psi
End Wt Net Wt Energy1
(BTU) Power
(BTUmin) Power (HP) Efficiency3
654 472 182 849 718 17 7
2 Determined by difference from Propane and Air Energy assumed value 90 3 Arbitrary estimated efficiency of heat transfer not effective work
The two known quantities in each run is the weight of the air moving through the system and the weight of the propane heating that air The variable is the quantity of water heated to steam temperatures and above In Run 3 at 90 efficiency that mass of water calculates to 125 grams at 50 it drops to 33 grams In Run 5 at 90 efficiency that mass of water calculates to 86 grams at 50 it drops to 44 grams
FEDERAL TRANSIT ADMINISTRATION 39
APPENDIX A HEAT TRANSFER EFFICIENCY MODELING RUNS 3 AND 5 50 AND 90
As the comparison tables below show the uncertainty in the efficiency of heat transfer is manifest only in the mass of water heated to steam to do useful work
Data 90 Efficiency
Air
Component Run 3 BHP
Run 5 BHP
Net ChngBHP
-45
Run 3 Mass
Transfer (kg)
Run 5 Mass
Transfer (kg)
Net ChangeMass
Transfer (kg)
30 17
197
237
2010 182 -9
Water
Propane
Duration (mn)
47
86
725
422
0060
0013
725
0270
0086
1180
588
350
163 1180
276
163
Data 50 Efficiency
Air
Component Run 3 BHP
Run 5 BHP
Net ChngBHP
-45
Run 3 Mass
Transfer (kg)
Run 5 Mass
Transfer (kg)
Net ChangeMass
Transfer (kg)
30 17
101
237
2010 182 -9
Water
Propane
Duration (mn)
12
86
725
817
0060
0003
725
0270
0044
1180
1233
350
163 1180
276
163
Regardless of the specific efficiency Run3 reflects an air-rich propellant mix while Run 5 was clearly the more powerful and steam-rich propellant If 50 efficiency is a more realistic figure than 90 the only consequence is more water passing through the heater expander and recovery tank The only consequence for overall system efficiency is the slight but added work required to move the additional water by pump to the top of the water column
FEDERAL TRANSIT ADMINISTRATION 40
APPENDIX Acronyms B
BHP Boiler Horsepower
BRASH Binary Recovery Air-Steam Hybrid
BTU British Thermal Unit
CC Cubic centimeter
CFM Cubit feet per minute
CHP Combined heat and power
CNG Compressed natural gas
CO2 Carbon dioxide
CU Cubic
DARPA Defense Advanced Research Projects Agency
DGE Diesel gallon equivalent
DOT Department of Transportation
EC External combustion
EIA Energy Information Administration
EPA Environmental Protection Agency
FTA Federal Transit Administration
GGE Gasoline gallon equivalent
HP Horsepower
IC Internal combustion
K Kelvin
Kcal Kilocalorie
MPG Miles per gallon
MPH Miles per hour
OEM Original equipment manufacturer
PSI Pounds per square inch
RPM Revolutions per minute
SBIR Small Business Innovation Research
STP Standard temperature and pressure
FEDERAL TRANSIT ADMINISTRATION 41
FEDERAL TRANSIT ADMINISTRATION 128
US Department of TransportationFederal Transit AdministrationEast Building1200 New Jersey Avenue SEWashington DC 20590httpwwwftadotgovresearch
US Department of Transportation Federal Transit Administration East Building 1200 New Jersey Avenue SE Washington DC 20590 httpwwwftadotgovresearch
FEDERAL TRANSIT ADMINISTRATION 42
- Button1
- Button2
- Button3
- Button4
- Button5
- Button6
- Button7
- Button8
- Button9
- Button10
- Button11
- Button12
- Button13
- Button14
- Button15
- Button16
- Button17
- Button18
- Button19
- Button20
- Button21
- Button22
- Button23
- Button24
- Button25
- Button26
- Button27
- Button28
- Button29
- Button30
- Button31
- Button32
- Button33
- Button34
- Button35
- Button36
- Button37
- Button38
- Button39
- Button40
- Button41
- Button42
- Button43
- Button44
- Button45
- Button46
- Button47
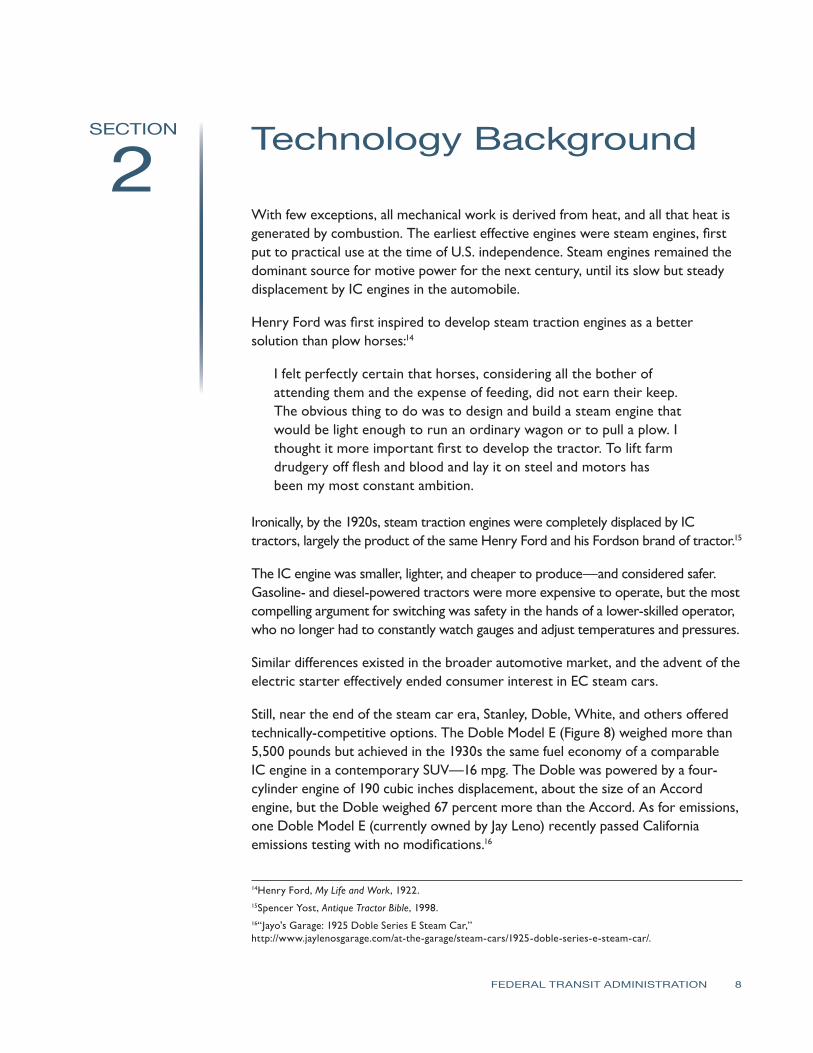
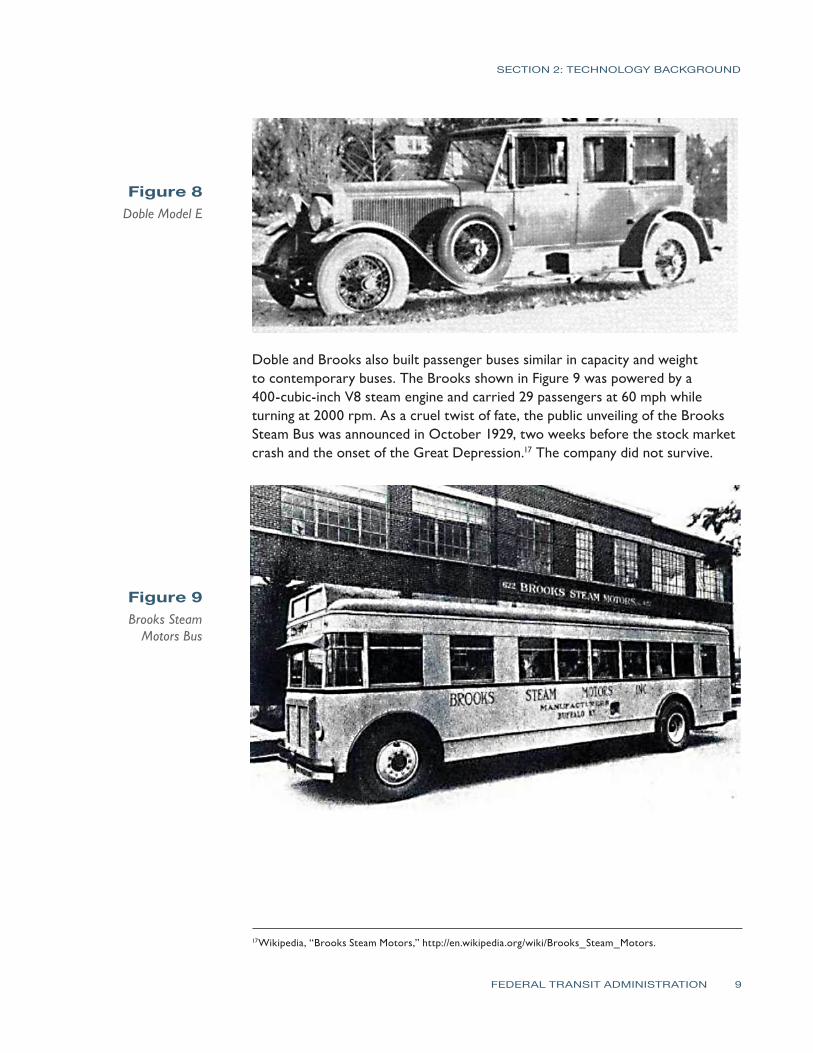
SECTION 2 TECHNOLOGY BACKGROUND
Figure 8 Doble Model E
Doble and Brooks also built passenger buses similar in capacity and weight to contemporary buses The Brooks shown in Figure 9 was powered by a 400-cubic-inch V8 steam engine and carried 29 passengers at 60 mph while turning at 2000 rpm As a cruel twist of fate the public unveiling of the Brooks Steam Bus was announced in October 1929 two weeks before the stock market crash and the onset of the Great Depression17 The company did not survive
Figure 9 Brooks Steam Motors Bus
17Wikipedia ldquoBrooks Steam Motorsrdquo httpenwikipediaorgwikiBrooks_Steam_Motors
FEDERAL TRANSIT ADMINISTRATION 9
SECTION 2 TECHNOLOGY BACKGROUND
The suitability of steam power for mass transit use can be seen from comparison of a very powerful contemporary Ford V-8 Diesel engine (from the Excursion SUV) to the Besler V-Twin Steam engine circa 1938
Ford Turbo Diesel Besler Steam Configuration V-8 V-2 Displacement (cuin) 445 80 Horsepower 175 150 Torque (ft-lbs) 420 1200 Engine wt w transmission (lbs) 930 80
The Besler is roughly one quarter the size and weight of the V-8 Turbo-Diesel but has equivalent horsepower and three times the available torque (the primary determinant of performance) The Detroit Diesel Series 60 six-cylinder engine commonly used in mass transit vehicles produces marginally more torque (1450 ft-lbs) than the Besler from twice the horsepower and with much more fuel
Steam engines make greater use of the energy contained in the fuel by separating the heating phase of the Carnot cycle from the expansion phase and metering fuel burn to more closely match demand A steam engine presents maximum torque at low speed and greater horsepower and torque than comparable IC engines
Another EC technology gaining resurgent interest is compressed air power Recent reports of collaboration between MDI of France and Tata Motors of India suggest a new approach toward EC engines18 Tata Motors a major producer of vehicles on the Indian subcontinent intends to produce the MDI Air Car in the near future with anticipated fuel economy of 106 mpg The latest iteration of the MDI Air Car shown in Figure 10 has a projected range of 848 miles from 8 gallons of fuel or 106 mpg for a 4-passenger vehicle weighing 1870 pounds19
The MDI City Car relies on a six-cylinder 75 HP engineexpander to achieve this performance and in the ldquoprocess [produce] emissions of only 0141 lbs of CO2
per mile That is hellip less than [half] the cleanest vehicle available todayrdquo (Toyota Prius 07 Emissions 034 lbs of CO2 per mile)
18Autobloggreen ldquoA New Agreement between Tata Motors and MDI Bring the Air-Car Closer to Realityrdquo March 21 2007 httpgreenautoblogcom20070321a-new-agreement-between-tata-motors-and-mdi-bring-the-air-car-cl 19Motor Development International (MDI) OneFlowAIR httpwwwmdiluenglishoneflowairphp
FEDERAL TRANSIT ADMINISTRATION 10
SECTION 2 TECHNOLOGY BACKGROUND
Figure 10 MDI Air Car
The schematic for the MDI power plant is shown in Figure 11 The stored air is heated to combustion temperatures and allowed to expand mechanically This is the practical definition of an EC engine where combustion provides heat but the working fluid or propellant is not generated by the combustion process itself
Separating the heating step from the expansion step does not in itself yield higher fuel economy or lower emissions But the regulation of fuel flow to maintain optimum propellant temperature immediately prior to expansion provides both maximum fuel economy and lowest possible emissions In contrast an IC engine ignites fuel at 1800degF and immediately conducts that heat away through its water jacket to drop cylinder temperatures to 200ndash300degF EC engines preserve that heat for useful work
Figure 11 MDI Air Engine
Schematic
FEDERAL TRANSIT ADMINISTRATION 11
SECTION 2 TECHNOLOGY BACKGROUND
Both air and steam engines provide an alternative to the conventional IC engine Both operate from a variety of fuels and offer the potential of lower emissions and higher fuel economy Steam is the more robust of the two (the Besler Steam Twin is much more energetic than the MDI six-cylinder) but the compressed air engine offers an operational simplicity and a lower weight because no boiler or condenser is required Unfortunately it can never provide the power and acceleration of steam
The best of both worlds would be a blending of air and steam into a single engine that offers all of the benefits but without the weight and heat management issues of a boiler and with significantly more power than an air engine alone
FEDERAL TRANSIT ADMINISTRATION 12
SECTION The Air-Steam 3 Hybrid Solution
Air and water are completely different in their physical properties except when they operate as working fluids at high temperatures and pressures At steam operating pressures and temperatures their behavior largely follows ideal gas behavior and each is miscible in the other at all proportions The arrow in Figure 12 indicates the rough path for expansion of the hot high-pressure propellant and shows near ideal gas behavior for steam at these elevated temperatures and pressures
Figure 12 Does Steam
Behave Like an Ideal Gas
Getting to steam operating temperatures and pressures requires that significantly more heat be applied to water than air at STP (standard temperature and pressure) Air requires only 642 kcalmole to reach these operating temperatures while water (steam) requires 5236 kcalmole (due to the 512 kcal heat of vaporization) In this development a baseline flow of air is used to entrain water into the heater section Fuel is consumed in direct proportion to the water fraction to maintain the heater at a near constant temperature The heat required to maintain ldquohot airrdquo temperatures is a small fraction of the heat required to maintain steam temperatures as shown in Figure 13
FEDERAL TRANSIT ADMINISTRATION 13
SECTION 3 THE AIR-STEAM HYBRID SOLUTION
Figure 13 Heat Required
to Raise Air and Water
Temperature to 1000degK
The compressed air fraction provides a safe and consistent flow pressure into the hot section The water once heated to working steam temperature provides a more robust working fluid
The hot mixed propellant is injected into the expander moving a piston and converting heat to motion The expanded propellant thereby drops to condensing temperatures allowing the water portion to drop to a sump for pumped return to the injector The expanded air fraction is then recompressed for return to the injector
The use of an air fraction allows for immediate injection of work-appropriate amounts of water into the hot section no boiler no steam under pressure no fuel wasted (heating steam without immediate purpose) The use of a water fraction (and proportional fuel flow) allows for variable power from a constant temperature system The binary (air-steam) propellant allows for a closed-loop condensing recovery system extending range and economy
Figure 14 Schematic of Injector Nozzle Used to Mix Air
and Water
FEDERAL TRANSIT ADMINISTRATION 14
SECTION 3 THE AIR-STEAM HYBRID SOLUTION
The sum of the process is as follows
Key start begins a modest fuel burn that immediately provides initial hot air flow through the engine
bull Depressing the accelerator increases the water fraction and fuel flow (in direct proportion)
bullThe vehicle moves forward under (airsteamfuel) power in direct proportion to wheel turn
bullThe hot mix expands and the expanded mix condenses the water fraction
bullA small parasitic load recompresses the small air fraction to reinjection pressures
bull Removing the foot from the accelerator returns the flow to hot air only sweeping residual moisture from the cylinders and preventing hydraulic lock (during next cold start)
The engine can operate on any fuel whose flow can be regulated (semi-solid liquid gas) Combustion occurs at high temperature at one atmosphere so much cleaner burning than internal combustion
Figure 15 Air-Steam Hybrid
Schematic
Accelerator regulates flow of air water and fuel to heater based on load and wheel speed Water and fuel are metered to maintain heater temperature within optimal performance band
Output demand determines air-water fraction
Any discussion of fuel efficiency relative to current IC engine technology must first re-emphasize the multi-fuel capability of EC engines In a market so dominated by one fuel customers have accepted the term ldquomiles per gallonrdquo
FEDERAL TRANSIT ADMINISTRATION 15
SECTION 3 THE AIR-STEAM HYBRID SOLUTION
as the basis for comparison But in an open market with many different fuels and widely different heat content (BTUlb) the only common and appropriate denominator is ldquomiles per dollarrdquo (closer to ldquofuel economyrdquo)
To the extent that any EC solution gains market acceptance and the market responds with new and different fuel blends the law of supply and demand dictates that fuel prices for all will drop Until then the remainder of this efficiency discussion will assume all engines require the same petroleum-based fuel
The long-accepted estimate of fuel efficiency for the IC engine is about 25 percent with the remaining 75 percent of the heat content dissipated in equal parts through the hot exhaust the radiator and mechanical losses in the engine Much has been done to raise that efficiency but what remains is one power stroke in four and a high temperature detonation whose heat content is quickly and intentionally dissipated through conduction
In sharp contrast a steam engine is designed to preserve as much heat as possible from combustion and then mete out that heat through the expansion of the working fluid Instead of a 25 percent heat loss through conduction through a radiator conductive loss is limited to 10 percent in efficient steam engines The greatest loss is through the vaporization of water to steam (at 30) yielding useful work of 35 or 40 percent higher than internal combustion Steam vehicles often report significantly lower practical fuel economies as the whole boiler is heated for a relatively short trip (another reason to avoid using a boiler)
Hot air engines involve no change of state therefore avoiding the loss associated with vaporization That can mean fuel efficiencies approaching 65 percent except as noted with the MDI engine a lower power-to-weight capability
The combination of air and steam into a single engine type is expected to yield economies between 35 and 65 percent varying with wheel load A 50 percent net efficiency would double fuel economy over a comparably-sized IC engine but as shown with the Doble and Besler examples the EC engine can be much smaller yielding even greater economies
FEDERAL TRANSIT ADMINISTRATION 16
SECTION 3 THE AIR-STEAM HYBRID SOLUTION
Figure 16 Fuel Efficiency
by Engine Type
Derivative Uses As much as this study is focused on large motive power applications it should be noted that an equally important opportunity for this technology is in stationary power applications similar in configuration to combined heat and power units referred to generally as micro-CHPs Rapid start-up high torque quiet operation and multi-fuel compatibility make it well suited to an integrated heat and electrical power installation
FEDERAL TRANSIT ADMINISTRATION 17
SECTION 3 THE AIR-STEAM HYBRID SOLUTION
Its ability to produce a full range of power options (mechanical pneumatic heat and through attached accessories electrical and hydraulic) in a small modular man-portable configuration also make it particularly well suited to temporary or tactical power requirements Although beyond the scope of the DOT goals for vehicular use this stationary power applicationrsquos potential may be strategically important in market acceptance and adoption by expanding the range of applications and thereby providing economies of scale in all aspects of development production and commercialization activities for all applications
FEDERAL TRANSIT ADMINISTRATION 18
SECTION BRASH Test Plan 4 This Phase I effort followed the Technical Objectives outlined in the proposal as follows
Practical Objectives 1 Modify the Smarttrade sized test vehicle (Figure 17) installing a 10ndash20 HP
equivalent heater a 650 cc displacement 2 HP (nominal) Quasiturbinetrade steam engine pressurized air and water tanks electronic flow regulation of air water and fuel via laptop-based LabVIEW software and solenoid valves
2 Perform test runs to validate the system operation and determine key baseline performance parameters such as
a minimum air fraction to maintain engine operation upper limits for operating temperatures maximum allowable flow rates for water (without reducing effective propellant flow at temperature)
b upper limits of vehicle speed while varying gross vehicle weight and course incline
3 Following baseline performance assessment further objectives included
a an analysis of component placement for ease of maintenance and replacement
b an estimation of comparable volumes and weights to an equivalent IC powertrain in order to verify retrofitability
c an estimation of effective fuel economy while using propane fuel on closed track mileage runs
Figure 17 Smarttrade
Car-Sized Test Vehicle
FEDERAL TRANSIT ADMINISTRATION 19
SECTION 4 BRASH TEST PLAN
4 Over the course of multiple test runs a cumulative assessment of component performance and reliability would lead to a gross verification of BRASH engine integrity and range That in turn could lead to off-site vehicle demonstrations to federal agencies potential industry partners and investors
Analytical Objectives 1 The BRASH engine model has been demonstrated only at a bench level with
rudimentary understanding of its operating principles A key objective in this vehicle build is to increase the thermodynamic modeling of this technology including an analysis of mass flow (air water fuel) and resulting power
2 Early test data would lead to analysis of specific on-vehicle capacities (for air water and fuel) and flow rates for same in order to estimate operating range recovery strategies and rates (recompression and condensation) and the parasitic loads (eg alternators pumps) to sustain useful operation for many hours
3 Over time the vehicle testing under various test conditions (eg varying gross vehicle weight wheel load engine temperature propellant mix) will lead to a body of data to support more complete modeling of water fraction vs torque vs temperature These data are essential to real-world estimation of fuel economy as this technology scales to larger practical vehicle applications
4 With the modeling from 3 in place for steady-state operation practical track runs with frequent starts and stops can further shape the model for real-world use
5 The analysis from steps 1ndash4 will provide sufficient basis for estimating the mass flow heat component capacity recovery factors and fuel economy for scaling this 2 HP test data to larger vehicles in two decade steps first to a 20 HP pickup truck and then further modeling and custom buildup of a 200 HP power plant with a DOT-identified industrial partner
6 This analytical plan is consistent with the overall SBIR program plan as the 2HP effort is confined to Phase I the 20 HP build and test plan would be accomplished in Phase II and the design and build of the 200 HP power plant would be accomplished in Phase III with an established industry partner
The work effort toward completion of these tasks has proceeded on two tracks mechanical modifications to the April test vehicle and electronic control and measurement
Mechanical Modifications and Test Configuration The test vehicle is a modified electric car about the size of a Smarttrade car Earlier modifications included removal of the electric drive train exposing a large working
FEDERAL TRANSIT ADMINISTRATION 20
SECTION 4 BRASH TEST PLAN
space behind the cab This rear space over the rear left wheel contains a 2HP Quasiturbinetrade steam engine20 selected for its compact design and suitable power range for this 700-pound vehicle The placement over the left wheel permits direct drive to that wheel via electric clutch and chain drive
Figure 18 Quasiturbinetrade
Rotary Expander Installed and Interior View
In the center of center of this rear space a heavily-modified propane space heater rated at 30000ndash80000 BTUhr (equivalent to 11ndash31 boiler horsepower [bhp]) was installed Heaters of this type generally are designed to efficiently distribute heat into an adjoining space This heater was heavily modified with high temperature insulation and outer shells to retain useful heat to the 20-ft stainless steel coil passing through its core
Figure 19 Quasiturbinetrade
Rotary Expander Installed and Interior View
the expander and heater (with recent refinements) Also visible under the heater is the pressurized water tank (painted grey) The open space to left of the heater is reserved for drive components The space to the right of the heater is reserved for recovery and recompression of the expanded propellant (Recompression is outside of the current scope to simplify the testing and analysis See discussion section for more information) Other system components include air cylinders and electronic controllers that are mounted forward of the rear firewall in the cab or under the front hood
Figure 20 shows the back of the vehicle with fenders and trim removed revealing
20Quasiturbinetrade Product Details httpquasiturbinepromciqcca
FEDERAL TRANSIT ADMINISTRATION 21
SECTION 4 BRASH TEST PLAN
Figure 20 Test Configuration
Figure 21 System Components
The main system components are shown Minor components and linkage tomechanical output are not included in this report for the sake of simplicity
Electronic Control and Measurement No realistic progress toward a vehicle demonstrator with known and regulated fuel use can proceed without electronic regulation In this build the LabVIEW program and system components from National Instruments were used to create a ldquoglass cockpitrdquo of vehicle controls and performance measurement21 The simplified schematic in Figure 22 shows the planned integration of electronics in this development LabView-compatible components will replace all mechanical flow and measurement components
21More information can be found at National Insturments The LabVIEW Environment httpwwwnicomlabview
FEDERAL TRANSIT ADMINISTRATION 22
SECTION 4 BRASH TEST PLAN
Figure 22 Electronics
Schematic for Air-Steam Hybrid
For the vehicle driver the dashboard collection of gauges has been replaced with a laptop screen similar to the one pictured in Figure 23
Figure 23 Front Screen Display for Air-Steam Hybrid
Certain features on this front screen will reflect user input (OnOff Throttle) while others reflect the dependent variables in the process (Heater Temp Fuel Flow Air and Water Flow) Shown on the bottom screen will be running time-series data on speed wheel load temperature specific fuel consumption and the other variables important to the analytical process The front screen display is generated from programming and controls on the back screen display
FEDERAL TRANSIT ADMINISTRATION 23
SECTION 4 BRASH TEST PLAN
Figure 24 Back Screen Display for Air-Steam Hybrid
LabVIEW software and controllers were chosen because of National Instrumentsrsquo status as the industry leader in rapid control prototyping and In-Vehicle data-logging solutions BKi purchased the LabVIEW componentry through the University of Connecticut Mechanical Engineering Department as part of UConnrsquos ongoing support of the project
By the end of the contract term in October 2010 the air and water regulation components were complete and operational but the fuel regulation and engine speed components were not yet fully operational To generate the most meaningful data under these circumstances the test vehicle was configured for extended operation to determine specific fuel water and air consumption rates The combination of these rates provided the basis for initial estimates of power and efficiency
Summary of Effort Mechanical Modifications
1 Removal of original electrical drive components reinforcement of frame
2 Installation of Quasiturbinetrade 2HP engine modified heater pressurized water tank all pneumatic water and fuel lines
3 Baseline validation testing using manual controls
4 Installation of electronically-regulated flow controllers
Electronic Modification 1 Acquisition of computer electronic regulators and control software
2 LabVIEW systems programming
3 System checkout
FEDERAL TRANSIT ADMINISTRATION 24
SECTION 4 BRASH TEST PLAN
Testing and Analysis 1 Static Safety Testing 2 Baseline vehicle drivetrain testing
3 Vehicle static testing (Runs 3 amp 5)
Summary of RequirementsGoals 1 Safe operation of vehicle during static and motive applications
2 Qualitative demonstration of BRASH engine capability to move test vehicle on flat and inclined road surface
3 Quantitative determination of air water and fuel consumption during timed static test
4 Quantitative determination of air water and fuel consumption while varyshying water and fuel fractions
Summary of Testing Two experiments were performed in late November the first to establish minimum fuel and propellant flow rates for sustained operation at low speed (air-rich mode) and the second to establish reasonable upper limits of fuel and propellant flow at higher engine speeds (steam-rich mode) Variation in the air-steam mix is the underlying theory of operation for the BRASH engine the air fraction provides a baseline flow for initial start-up and low-speed operation but the addition of water (as steam) to the propellant results in a significant boost in range and power These two tests have verified this underlying theory
Test Conditions The two test runs summarized in this report are 3 on November 22 2010 and 5 on November 26 2010 Both tests were performed at the Depot D campus of the University of Connecticut in Storrs The testing was performed outside in seasonal conditions 45-50degF with light winds
Figure 25 Vehicle Test Setup
FEDERAL TRANSIT ADMINISTRATION 25
SECTION 4 BRASH TEST PLAN
Each run was a dynamic test with no load on the two-cylinder Quasiturbinetrade engine The propane cylinder was suspended from a scale for the duration of the test Propane fuel consumption was monitored continuously by digital scale with a display accuracy of 001kg
Each test run lasted for the duration of one high pressure air cylinder Air cylinder start (full) and end (empty) were determined at the start and finish of each run using the same scale and accuracy Water levels initially were determined volumetrically but the results were too inconsistent Displaced volume of liquid water proved a poor measure of the quantity heated to steam and carried forward for productive work For this reason water is an estimated quantity based upon fuel quantity burned less heat absorbed by the air fraction (Further integration of the LabView controller software in the next phase will obviate this work-around)
Each of the complete test runs may be viewed at Brash Engines website httpwwwbrashenginescom Photos from each run appear in the figures that follow Tables 1 and 2 summarize the productive mass flow for air water and propane fuel to produce work from the engine for the test duration
The cab interior in Figure 26 shows the high pressure air cylinder below the steering wheel and the laptop computer (regulating propellant flow) in passenger seat space The LabView controllers reside in the protective case under the laptop
Figure 26 Vehicle Cab with Controller Laptop
During each test hot propellant was allowed to expand and vent to ambient in order to simplify the thermodynamic model and analysis (Note the plumes of water vapor from each exhaust hose and the small puddles of water under each hose in Figure 27)
FEDERAL TRANSIT ADMINISTRATION 26
SECTION 4 BRASH TEST PLAN
Figure 27 Exhaust Plumes from Expander
Development plans include recovering the expanded propellant separating into water and air phases and then recompressing the air fraction for re-use This will both improve efficiency and eliminate the visible vapor plume
Test Assumptions Another estimation used in this study is the efficiency of heat transfer for the propellant through the 20-ft coil of stainless steel inside the insulated heater Figure 28 shows an early ldquoair-onlyrdquo test run with the current heater The hose failure and melting of the steel wire mesh inside (note formed ball in the mesh) indicates 1300degK temperatures exiting the hot section
Figure 28 Hose Failure Due
to Overheating
FEDERAL TRANSIT ADMINISTRATION 27
SECTION 4 BRASH TEST PLAN
Effective heat transfer (as Figure 28 shows) does not equal efficient heat transfer but the ability to deliver 1300degK air from a well-insulated burner suggests a highly efficient transfer of heat The analysis of results assumes a value of 90 efficiency (See Appendix A for a discussion of heat transfer efficiency)
3 Low Speed Test On November 22 2010 Run 3 tested the lower operating limits of the test setup Low limit in this context meant sufficient pressure to maintain expander rotation but low steam and fuel burn The test commenced with a full air cylinder weighing 661 Kg At the end of the test the empty cylinder weighed 460 Kg Over the 7 minutes and 15 seconds of testing 006 Kg of propane was consumed
The mass of air and fuel was determined from before after run test weights As stated earlier determining the quantity of steam produced from the pressurized water tank was problematic because of the quantity of stored water the resistance to water flow under dynamic pressures and the potential for some fraction of the water (in liquid state) to be entrained in the propellant mix
To solve for this unknown the energy required to raise the known quantity of air from ambient to 1000degK (33kcalmol or 0467 BTUg) was subtracted from the energy content of the propane consumed (44 BTUg) and then the efficiency of the heat transfer process was de-rated by 10 percent to yield a net quantity of 1438 BTUs to elevate ambient temperature water to 1000degK steam The result is an estimated 125 grams of water consumed in the 7-minute test
Table 1 summarizes these data and shows a high reliance on the air fraction for the work performed by the 2 HP engine The air cylinder used in this test has a measured free volume of 45 cubic feet (1274 liters at STP) which means sustained flow rates of 62 cubic feet per minute (cfm) or 175 liters per minute In contrast the 125 grams of water passed through as steam produced an estimated equivalent gas volume of 155 liters at STP Note the modest levels of water vapor in Figure 29 Why the greater air fraction relative to water flow in this test
Air (Wt 000Kg) 661 460 201 938 1294 30 36
Water2
(Wt 000Kg)
Propane(Wt 000Kg)
Time (hrmnsc)
1562
123000
1556
123715
00125
006
00715
1438
2640
na
1983
364
na
47
86
54
90
1 Energy value based upon absorbed heat (italicized) from STP to 1000degK (0446 BTUg for Air 115 BTUg water) 2 Determined by difference from propane and air energy assumed value 90 3Arbitrary estimated efficiency of heat transfer not effective work
11222010 - 3 Low Speed Run Air Pressure 60 psi Water Head Pressure 60 psi
Component(BTU) Start End Net Energy1
(BTU) Power
(BTUmin) Power (HP) Efficiency3
Table 1 Analysis of Mass
Flow Data at Low Speed
FEDERAL TRANSIT ADMINISTRATION 28
SECTION 4 BRASH TEST PLAN
Figure 29 Low-Speed Test Results in Little
Water Vapor
In this baseline experiment the single cylinder provides 60 psi air flow and 60 psi static ldquoheadrdquo pressure on the water column The air flow from the cylinder is biased toward the generally less restrictive flow path for air The water column under the same pressure presents a higher viscosity medium passing through a greater number of valves and restrictions At the point of injection the air fraction flows more freely into the hot section In order to bias the mix toward greater water fraction (and greater power) the head pressure on the water column must be increased over the 60 psi air line pressure
Run 4 (not documented here) evaluated head pressures from 110 psi to 70 psi and determined that modest differential pressures retarded the flow from the air fraction and boosted flow of the water fraction Still higher differential pressures effectively stopped air flow altogether reverting the engine operation to ldquosteam onlyrdquo For Run 5 an additional cylinder was used to apply a 70 psi static head pressure on the water column a 10 psi differential over the 60 psi air line pressure
5 Variable High Speed Test On November 26 2010 Run 5 tested the higher differential water pressure as a means to increase the effective water fraction in the propellant mix The test commenced with a full air cylinder weighing 654 Kg At the end of the test the empty cylinder weighed 472 Kg Run 5 was interrupted after 243 minutes to refill the water tank and then testing resumed for an additional 907 minutes Over the whole test 027 Kg of propane was consumed
Using the same analytical basis as Test 3 Test 5 data indicate a substantial increase in work capacity (as measured by fuel consumed and steam generated) over the 3 baseline
FEDERAL TRANSIT ADMINISTRATION 29
112610 - 5 Variable High Speed Run Air Pressure 60 psi Water Head Pressure 70 psi
Air (Wt 000Kg)
Component(BTU) Start End Net Energy1
(BTU) Power
(BTUmin) Power (HP) Efficiency3
654 472 182 849 718 17 7
SECTION 4 BRASH TEST PLAN
Table 3 Comparison of Mass Flows
Water 588 Runs 3 and 5
163 Duration (mn) 725 1180 725 1180 163
Air
Component Run 3 BHP
Run 5 BHP
Net ChngBHP
Run 5 Mass
Transfer (kg)
Net ChangeMass
Transfer (kg)
30 17
197
237
-45 2010 182 -9
Run 3 Mass
Transfer (kg)
276 350
47
86
422
0060
0013
0270
0086
Propane
This difference in steam fraction and power is more clearly seen in Figure 30 (and on the source video at the Brash Engines website)
Figure 30 Three Images from Run 5
Table 2 Test 5 Results with Increased
Water and Fuel Water2
(Wt 000Kg) 0860 9890 8358 197 83
Propane(Wt 000Kg) 1520 1493 27 11880 1004 237 90
Time (hrmnsc) 133000 134150 01150 na na na na
1 Energy value based upon absorbed heat (italics) from STP to 1000degK (0446 BTUg for Air 115 BTUg water) Underlined value is released heat at generally accepted 44 BTUg 2 Determined by difference from propane and air Energy assumed value 90 3 Arbitrary estimated efficiency of heat transfer not effective work
The increase in pressure on the water column by 10 psi reduced air flow by 9 percent but increased the steam fraction considerably and thereby increased the effective boiler horsepower nearly three-fold to 237 bhp (assuming 90 heat transfer) These data are summarized in Table 3
FEDERAL TRANSIT ADMINISTRATION 30
SECTION 4 BRASH TEST PLAN
As with Run 3 start up from Time Zero was immediate burner on air flow begins and water flow under pressure commences immediately Another impressive feature of the mix air-steam propellant system is the ability to start stop and rapidly accelerate as shown in the full Run 5 video Run 5 serves as validation that this patented technology has unique performance benefits over air steam or internal combustion alone
Lessons Learned A comparison of the two test runs verifies some key points
1 The same power plant can produce variable power and fuel economy based upon power demand and airsteam mix
2 Although imprecise at this point in testing fuel consumption appears directly proportional to engine speed The engineexpander will spool up spool down stop and restart in a manner consistent with fuel and propellant flow The Run 5 video on the Brash Engines website verifies this conclusion
3 The use of a defined static air pressure ldquoheadrdquo over the water column at a pressure higher than the defined air line dynamic pressure provides a safe and predictable bias toward flow from the water fraction
4 Although the current test configuration offers sufficient performance for this initial demonstration phase the following observations are in order
a The heater path is too long creating latent response issues
b The airwater injector is not optimized for proper mix or flow capacity
c The incomplete integration of LabVIEW compromises the quality of data
d The absence of a measured variable load on the expander compromises any analysis of power and fuel economy
5 The design migration to a vehicle installation was premature The project should move back to a lab bench study to refine the regulation of components complete the recovery and recompression portions of the system and use electromechanical loads to estimate power and useful work for specific quantities of fuel water and air
6 The Quasiturbinetrade engine technology is promising but too immature for larger-scale modeling Later phases of the project should rely on more conventional multi-cylinder piston-type expander
Estimated Fuel Economy Mass transit authorities have relied on large diesel engines such as the Detroit Diesel Series 50 and Series 60 engines for more than 30 years Reports on fuel economy vary from a high of 60 miles per gallon (Diesel) for longer-range
FEDERAL TRANSIT ADMINISTRATION 31
SECTION 4 BRASH TEST PLAN
commuter services in California23 to a low of 228 miles per gallon (Diesel) for city buses with frequent stops in New York City24 In both cited studies the migration to compressed natural gas (CNG) has resulted in lower fuel economies on a Diesel Gallon Equivalent (DGE) basis
Table 4 summarizes this study (columns 2 and 3) and the next proposed phase (columns 4 and 5) the performance of the current fleet of mass transit buses (columns 6 and 7) and the likely outcome if the Besler engine (described earlier) were employed with the air-steam hybrid technology (columns 8 and 9)
Table 4 Comparison of
Fuel Economies
Air
1
Configuration
Engine
HP
Torque
Fuel
gmin
BTUhr
GGEhr
mpg 60mph
GGE100 mi
$ per GGE
$100 mi
Current
Example
2
3
3
5
4
Bench
5
S-10
6
SB Bus
7
NYCT
8
50 eff
9
30 eff
86
Quasi
2
Prop
82
216
02
3160
03
30
09
Current
237
Quasi
2
Prop
23
607
05
1126
09
30
27
UC 1
40
6 cyl
20
Prop
40
1056
09
648
15
30
46
UC 2
80
6 cyl
40
Mix
80
2112
19
324
31
30
93
MCI102
DD S60
350
1450
Diesel
540
11400
100
60
167
35
583
Diesel
23
439
35
1535
300
Besler
150
1200
Mix
300
792
695
864
1158
16
1853
500
Besler
150
1200
Mix
500
1320
1158
518
1930
16
3088
The Besler engine is shown in two columns The left column reflects the higher efficiency anticipated with the air-steam hybrid mix described earlier as at or near 50 percent The right column reflects the historical efficiency realized with steam engine technology The italicized numbers near the bottom of the column show that even at historical efficiencies the Besler engine would offer equal or better Gasoline Gallon Equivalent (GGE)100 mile ratings of the current diesel technology but migrating toward less refined and (therefore) less expensive fuels would significantly reduce the operating cost ($mile)
23Demonstration of Caterpillar C-10 Dual-Fuel Engines in MCI 102DL3 Commuter Buses National Renewable Energy Laboratory httpwwwnrelgovdocsfy00osti26758pdf p 7 24R Barnitt ldquoNew York City Transit (NYCT) Hybrid (125 Order) and CNG Transit Buses Final Evaluation Resultsrdquo November 2006 National Renewable Energy Laboratory K Chandler Battelle Technical Report NRELTP-540-40125 November 2006 httpwwwnrelgovvehiclesandfuelsfleettestpdfs40125pdf pvii
FEDERAL TRANSIT ADMINISTRATION 32
SECTION 4 BRASH TEST PLAN
There are of course two orders of magnitude difference between the results of Runs 3 and 5 and the daily demands of city and commuter buses but the mere existence of the Besler Twin and the Brooks V-8 400 HP engine suggests an opportunity for fuel economy and fuel variety
Proposed further support for the next phase of development will advance the air-steam hybrid technology by an important order of magnitude This would provide the data confidence to scale to larger vehicle operation and garner the interest of one or more engine or vehicle OEMs
Figure 31 MTANew York City
Transit Orion VII Next Generation
Hybrid Transit Bus
Next Development Phase The next phase of development will incorporate a modern six-cylinder steam engine design with a displacement of 53 cubic inches and capable of sustained 15-25 HP operation The expander will be supplied by Steam Engine Power Inc (httpwwwsteamenginepowercom) This expander will drive an alternator generator to measure effective work output in watts as well as provide sufficient power to satisfy the system parasitic loads of battery recharge exhaust air recompression and all other pump and valve operations
Figure 32 (l to r) Six-Cylinder Expander Power Generation Load
Small 24 VDC Compressor
FEDERAL TRANSIT ADMINISTRATION 33
SECTION 4 BRASH TEST PLAN
Static pressure for the water column will still be supplied via compressed air cylinder but the dynamic air flow will be supplied by an oil-less air compressor of the size and type shown This 24 VDC compressor will recompress the recovered air exiting the expander to 40ndash60 psi pressure and support flows of 3ndash4 cubic feet per minute (cfm) These three components are off-the-shelf enhancements to the system but custom engineering of a new more powerful and more responsive heater completion of the electronic integration and design and fabrication of the recoveryrecompression components are necessary tasks that must be included to make the next generation assembly work to its potential This work will be accomplished largely by Mechanical and Electrical Engineering students at the University of Connecticut under the supervision of faculty and Brash Engines personnel
When this build is complete all operations will be under LabVIEW control All expander operations will be measured for power and work Once the bench version is in control a modified version will be installed in a small pickup truck (eg Chevrolet S-10) for further verification of system performance and robustness
During this phase a new and promising technology will be investigated a new and faster class of solenoid valves from National Instruments These solenoid valves with an unprecedented 3 msec response time have the potential of allowing air-steam retrofit in existing engine blocks The solenoid valves could replace the spark plugs in conventional IC engines and provide the equivalent timed injection of hot propellant mix as the timed firing of a spark plug in the presence of a fuel air mix
If possible these fast solenoids and the black box programming to control them could allow very easy portability to larger vehicles and easier retrofit Potentially a V-6 engine could operate 4 cylinders for expansion and the remaining two cylinders could be used as direct drive compressors with different but equivalent solenoid valves controlling the compression process
FEDERAL TRANSIT ADMINISTRATION 34
SECTION Development Plan 5 and Next Steps
This current effort is a key first-proof of concept for this air-steam hybrid technology but our goals extend well beyond this two-seat 2 HP demonstrator The lessons learned in electronic integration will allow rapid migration to larger platforms using the same basic controls but scaling the expander heater and other mass-flow components to vehicle-appropriate size That project identified as ldquo20 HP Vehiclerdquo and other near-term derivative projects are listed in Table 5
BRASH Project
ProposedFunding Source
Funds Reqd $K Project Description
SUV-size proof-of-concept for reliable 20 HP Vehicle DOTUSPS 300 highway performance maildelivery
vehicle size
Proof-of-concept mass transit busshy200 HP Vehicle DOTDOD 600 retrofit scaled to city bus capacity and
suitable for replacement of over-the-road diesel engines
Table 5 Project Funding
Stationary Power Unit Micro-CHP Equivalent
DARPA 300 Proof-of-concept mass transit bus-retrofit scaled to city bus capacity and suitable for replacement of over-the-road diesel engines
Summary Alternative Processed Solid Fuel DOE EPA DOA 600
Processed mix of hydrolyzed wood pulp processed solid waste and other combustible solids in an extrudable mass with alcohol solutevehiclemdashdemonstrate utility in vehicles as a high energy content clean burning fuel for EC engines
Demonstrate effective pyrolysis of
Binary Solid Gas Fuel
EPA Waste Management BFI
400 processed solid fuels in a binary fuel burner conventional fuel (gasoline natural gas) provides primary heat source for pyrolysis temperatures
Proof of Concept OEM Power Plant
Vehicle OEM (eg Ford GM Caterpillar) 1200
Development of direct replacement BRASH engine alternative to existing OEM IC engine
Black Box Integration of Controller Software
Vehicle OEM (eg Ford GM Caterpillar)
1600 Development of commercial BRASH system alternative to existing OEM IC engine
FEDERAL TRANSIT ADMINISTRATION 35
SECTION 5 DEVELOPMENT PLAN AND NEXT STEPS
The issuance of US Patent 7743872 five months ago has two important consequences for this project First it serves to validate the underlying technology the combination of air and steam in an EC engine is better than steam or air alone Second it provides a basis for full and open discussions with government agencies and large commercial interests in the transportation and power sectors
Our efforts at promotion have been delayed pending successful demonstration of the Smarttrade car vehicle to allow the first detailed real-world performance data to be distributed
Coupling that performance data with the option of migration away from refined petroleum should spark significant interest If we can move to a high lignin-processed wood pulp that costs $045 per gasoline gallon equivalent (an arbitrary value for example only) and consumes more CO2 while growing than is consumed in processing as a fuel and produced from combustion then we succeed as a project and as a global game-changing technology for many uses Improvements in fuel economy are important but of greater importance is the migration to low-process biomass fuels
FEDERAL TRANSIT ADMINISTRATION 36
SECTION Potential Applications and Societal Value 6 The whole premise behind the BRASH air steam hybrid is that external combustion offers a more benign and environmentally-appropriate way to power large vehicles and other portable equipment than refined petroleum-powered internal combustion
bullCombustion heat can be derived from any fuel source including processed solids from fast-growing renewables such as poplar trees waste corn stalks or switch grass
bullThat combustion heat is applied at a rate consistent with the work to be done and not to support idling and other unproductive fuel use
Using a mix of air and steam as working fluids in the engine allows
bullImmediate startup from an ldquoair-onlyrdquo start
bull Managed system pressure through use of a defined head air pressure
bullManaged fuel burn as the air-steam fraction is adjusted to match wheel load
bullAdjusted wheel load reduces fuel burn
Integration of modern control circuitry with external combustion also brings a level of performance operational simplicity and safety heretofore unavailable
FEDERAL TRANSIT ADMINISTRATION 37
SECTION
7 Phase I Conclusions
The last steam train in scheduled service in the US departed on October 11 196225 One year earlier Robert Noyce received the first patent for an integrated circuit26 But for that brief one-year overlap the most powerful motive power technology was never harnessed by the black box controls that grew out of Noycersquos invention so the diesel-powered IC engine championed by Henry Ford won out
Now nearly 50 years later the modern IC engine cannot operate efficiently without the benefit of black box electronicsmdashbut that technology still presents intractable challenges of supply safety and environmental impact The air-steam hybrid technology may offer an alternative and a glimpse of that potential is presented here and viewable in Run 5 on the Brash Engines website at http wwwbrashenginescom
While demonstration in a test vehicle provides a strong visual message that BRASH technology works the commercial success of this technology will depend upon reliable repeatable measurement of power and economy For that data the Phase 2 effort will require a return to laboratory bench testing and effective demonstration of recovery of the water and air fractions
The results of this Phase I project collectively demonstrate the technical feasibility and commercial potential of the BRASH air-steam hybrid engine technology The initial DOT SBIR funding has been highly effective in facilitating this important proof of concept and laying the groundwork for further technology refinement and application
As described earlier the next steps are clear and appear to combine achievable and rapid major advances with low developmental risk SBIR Phase 2 support is needed for those advances due to the still-early stage of development that restricts access to private capital
The immense potential value of this technology has been enhanced and verified in Phase 1 there is now a clear and low-risk path ahead to larger-scale testing further component and controls refinement specific applications prototyping and pre-commercial deployments
25William Rosen The Most Powerful Idea in the World Random House 2010 p 311 26US Patent 2981877
FEDERAL TRANSIT ADMINISTRATION 38
APPENDIX
A Heat Transfer Efficiency Modeling Runs 3 and 5 50 and 90
Much of the analysis for Runs 3 and 5 is based on an assumed efficiency of 90 for heat transfer from the combustion of propane to heating of the water air mix in the coil As a test for the reasonableness of that assumption the same data have been modeled at a much lower 50 factor below
112210 - 3 Low Speed Run Air Pressure 60 psi Water head pressure 60 psi
Water2 00440 5060 4276 101 43 (Wt 000Kg)
Propane 152 1493 237 50 27 11880 1004 (Wt 000Kg)
Time 133000 134150 01150 na na na na (hrmnsc)
1 Energy value based upon absorbed heat (italics) from STP to 1000degK (0446 BTUg for Air 115 BTUg water) Underlined value is released heat at generally accepted 44 BTUg
Air (Wt 000Kg)
Component(BTU) Start Wt End Wt Net Wt Energy1
(BTU) Power
(BTUmin) Power (HP) Efficiency3
661 460 201 938 1294 30 36
Water2
(Wt 000Kg)
Propane(Wt 000Kg)
Time (hrmnsc)
1562
123000
1556
123715
00125
006
00715
380
2640
na
523
364
na
12
86
14
50
na na
Air (Wt 000Kg)
Component(BTU) Start Wt
5 Variable High Speed Run Air Pressure 60 psi Water head pressure 70 psi
End Wt Net Wt Energy1
(BTU) Power
(BTUmin) Power (HP) Efficiency3
654 472 182 849 718 17 7
2 Determined by difference from Propane and Air Energy assumed value 90 3 Arbitrary estimated efficiency of heat transfer not effective work
The two known quantities in each run is the weight of the air moving through the system and the weight of the propane heating that air The variable is the quantity of water heated to steam temperatures and above In Run 3 at 90 efficiency that mass of water calculates to 125 grams at 50 it drops to 33 grams In Run 5 at 90 efficiency that mass of water calculates to 86 grams at 50 it drops to 44 grams
FEDERAL TRANSIT ADMINISTRATION 39
APPENDIX A HEAT TRANSFER EFFICIENCY MODELING RUNS 3 AND 5 50 AND 90
As the comparison tables below show the uncertainty in the efficiency of heat transfer is manifest only in the mass of water heated to steam to do useful work
Data 90 Efficiency
Air
Component Run 3 BHP
Run 5 BHP
Net ChngBHP
-45
Run 3 Mass
Transfer (kg)
Run 5 Mass
Transfer (kg)
Net ChangeMass
Transfer (kg)
30 17
197
237
2010 182 -9
Water
Propane
Duration (mn)
47
86
725
422
0060
0013
725
0270
0086
1180
588
350
163 1180
276
163
Data 50 Efficiency
Air
Component Run 3 BHP
Run 5 BHP
Net ChngBHP
-45
Run 3 Mass
Transfer (kg)
Run 5 Mass
Transfer (kg)
Net ChangeMass
Transfer (kg)
30 17
101
237
2010 182 -9
Water
Propane
Duration (mn)
12
86
725
817
0060
0003
725
0270
0044
1180
1233
350
163 1180
276
163
Regardless of the specific efficiency Run3 reflects an air-rich propellant mix while Run 5 was clearly the more powerful and steam-rich propellant If 50 efficiency is a more realistic figure than 90 the only consequence is more water passing through the heater expander and recovery tank The only consequence for overall system efficiency is the slight but added work required to move the additional water by pump to the top of the water column
FEDERAL TRANSIT ADMINISTRATION 40
APPENDIX Acronyms B
BHP Boiler Horsepower
BRASH Binary Recovery Air-Steam Hybrid
BTU British Thermal Unit
CC Cubic centimeter
CFM Cubit feet per minute
CHP Combined heat and power
CNG Compressed natural gas
CO2 Carbon dioxide
CU Cubic
DARPA Defense Advanced Research Projects Agency
DGE Diesel gallon equivalent
DOT Department of Transportation
EC External combustion
EIA Energy Information Administration
EPA Environmental Protection Agency
FTA Federal Transit Administration
GGE Gasoline gallon equivalent
HP Horsepower
IC Internal combustion
K Kelvin
Kcal Kilocalorie
MPG Miles per gallon
MPH Miles per hour
OEM Original equipment manufacturer
PSI Pounds per square inch
RPM Revolutions per minute
SBIR Small Business Innovation Research
STP Standard temperature and pressure
FEDERAL TRANSIT ADMINISTRATION 41
FEDERAL TRANSIT ADMINISTRATION 128
US Department of TransportationFederal Transit AdministrationEast Building1200 New Jersey Avenue SEWashington DC 20590httpwwwftadotgovresearch
US Department of Transportation Federal Transit Administration East Building 1200 New Jersey Avenue SE Washington DC 20590 httpwwwftadotgovresearch
FEDERAL TRANSIT ADMINISTRATION 42
- Button1
- Button2
- Button3
- Button4
- Button5
- Button6
- Button7
- Button8
- Button9
- Button10
- Button11
- Button12
- Button13
- Button14
- Button15
- Button16
- Button17
- Button18
- Button19
- Button20
- Button21
- Button22
- Button23
- Button24
- Button25
- Button26
- Button27
- Button28
- Button29
- Button30
- Button31
- Button32
- Button33
- Button34
- Button35
- Button36
- Button37
- Button38
- Button39
- Button40
- Button41
- Button42
- Button43
- Button44
- Button45
- Button46
- Button47
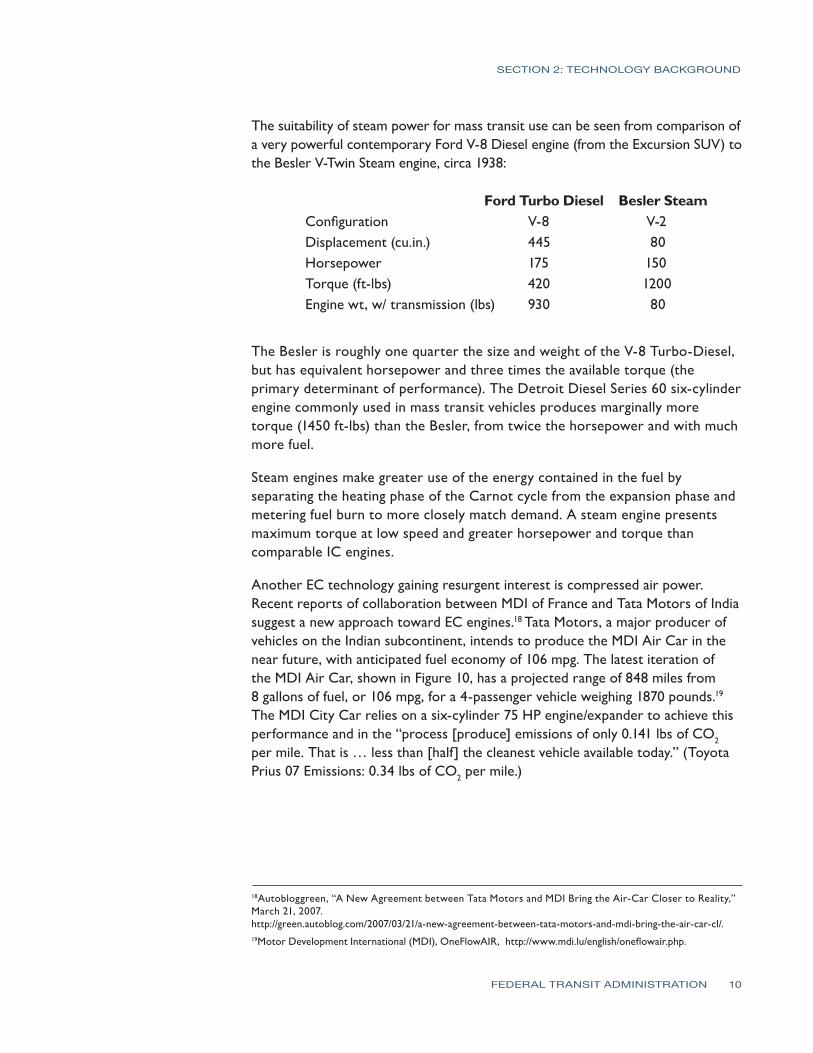
SECTION 2 TECHNOLOGY BACKGROUND
The suitability of steam power for mass transit use can be seen from comparison of a very powerful contemporary Ford V-8 Diesel engine (from the Excursion SUV) to the Besler V-Twin Steam engine circa 1938
Ford Turbo Diesel Besler Steam Configuration V-8 V-2 Displacement (cuin) 445 80 Horsepower 175 150 Torque (ft-lbs) 420 1200 Engine wt w transmission (lbs) 930 80
The Besler is roughly one quarter the size and weight of the V-8 Turbo-Diesel but has equivalent horsepower and three times the available torque (the primary determinant of performance) The Detroit Diesel Series 60 six-cylinder engine commonly used in mass transit vehicles produces marginally more torque (1450 ft-lbs) than the Besler from twice the horsepower and with much more fuel
Steam engines make greater use of the energy contained in the fuel by separating the heating phase of the Carnot cycle from the expansion phase and metering fuel burn to more closely match demand A steam engine presents maximum torque at low speed and greater horsepower and torque than comparable IC engines
Another EC technology gaining resurgent interest is compressed air power Recent reports of collaboration between MDI of France and Tata Motors of India suggest a new approach toward EC engines18 Tata Motors a major producer of vehicles on the Indian subcontinent intends to produce the MDI Air Car in the near future with anticipated fuel economy of 106 mpg The latest iteration of the MDI Air Car shown in Figure 10 has a projected range of 848 miles from 8 gallons of fuel or 106 mpg for a 4-passenger vehicle weighing 1870 pounds19
The MDI City Car relies on a six-cylinder 75 HP engineexpander to achieve this performance and in the ldquoprocess [produce] emissions of only 0141 lbs of CO2
per mile That is hellip less than [half] the cleanest vehicle available todayrdquo (Toyota Prius 07 Emissions 034 lbs of CO2 per mile)
18Autobloggreen ldquoA New Agreement between Tata Motors and MDI Bring the Air-Car Closer to Realityrdquo March 21 2007 httpgreenautoblogcom20070321a-new-agreement-between-tata-motors-and-mdi-bring-the-air-car-cl 19Motor Development International (MDI) OneFlowAIR httpwwwmdiluenglishoneflowairphp
FEDERAL TRANSIT ADMINISTRATION 10
SECTION 2 TECHNOLOGY BACKGROUND
Figure 10 MDI Air Car
The schematic for the MDI power plant is shown in Figure 11 The stored air is heated to combustion temperatures and allowed to expand mechanically This is the practical definition of an EC engine where combustion provides heat but the working fluid or propellant is not generated by the combustion process itself
Separating the heating step from the expansion step does not in itself yield higher fuel economy or lower emissions But the regulation of fuel flow to maintain optimum propellant temperature immediately prior to expansion provides both maximum fuel economy and lowest possible emissions In contrast an IC engine ignites fuel at 1800degF and immediately conducts that heat away through its water jacket to drop cylinder temperatures to 200ndash300degF EC engines preserve that heat for useful work
Figure 11 MDI Air Engine
Schematic
FEDERAL TRANSIT ADMINISTRATION 11
SECTION 2 TECHNOLOGY BACKGROUND
Both air and steam engines provide an alternative to the conventional IC engine Both operate from a variety of fuels and offer the potential of lower emissions and higher fuel economy Steam is the more robust of the two (the Besler Steam Twin is much more energetic than the MDI six-cylinder) but the compressed air engine offers an operational simplicity and a lower weight because no boiler or condenser is required Unfortunately it can never provide the power and acceleration of steam
The best of both worlds would be a blending of air and steam into a single engine that offers all of the benefits but without the weight and heat management issues of a boiler and with significantly more power than an air engine alone
FEDERAL TRANSIT ADMINISTRATION 12
SECTION The Air-Steam 3 Hybrid Solution
Air and water are completely different in their physical properties except when they operate as working fluids at high temperatures and pressures At steam operating pressures and temperatures their behavior largely follows ideal gas behavior and each is miscible in the other at all proportions The arrow in Figure 12 indicates the rough path for expansion of the hot high-pressure propellant and shows near ideal gas behavior for steam at these elevated temperatures and pressures
Figure 12 Does Steam
Behave Like an Ideal Gas
Getting to steam operating temperatures and pressures requires that significantly more heat be applied to water than air at STP (standard temperature and pressure) Air requires only 642 kcalmole to reach these operating temperatures while water (steam) requires 5236 kcalmole (due to the 512 kcal heat of vaporization) In this development a baseline flow of air is used to entrain water into the heater section Fuel is consumed in direct proportion to the water fraction to maintain the heater at a near constant temperature The heat required to maintain ldquohot airrdquo temperatures is a small fraction of the heat required to maintain steam temperatures as shown in Figure 13
FEDERAL TRANSIT ADMINISTRATION 13
SECTION 3 THE AIR-STEAM HYBRID SOLUTION
Figure 13 Heat Required
to Raise Air and Water
Temperature to 1000degK
The compressed air fraction provides a safe and consistent flow pressure into the hot section The water once heated to working steam temperature provides a more robust working fluid
The hot mixed propellant is injected into the expander moving a piston and converting heat to motion The expanded propellant thereby drops to condensing temperatures allowing the water portion to drop to a sump for pumped return to the injector The expanded air fraction is then recompressed for return to the injector
The use of an air fraction allows for immediate injection of work-appropriate amounts of water into the hot section no boiler no steam under pressure no fuel wasted (heating steam without immediate purpose) The use of a water fraction (and proportional fuel flow) allows for variable power from a constant temperature system The binary (air-steam) propellant allows for a closed-loop condensing recovery system extending range and economy
Figure 14 Schematic of Injector Nozzle Used to Mix Air
and Water
FEDERAL TRANSIT ADMINISTRATION 14
SECTION 3 THE AIR-STEAM HYBRID SOLUTION
The sum of the process is as follows
Key start begins a modest fuel burn that immediately provides initial hot air flow through the engine
bull Depressing the accelerator increases the water fraction and fuel flow (in direct proportion)
bullThe vehicle moves forward under (airsteamfuel) power in direct proportion to wheel turn
bullThe hot mix expands and the expanded mix condenses the water fraction
bullA small parasitic load recompresses the small air fraction to reinjection pressures
bull Removing the foot from the accelerator returns the flow to hot air only sweeping residual moisture from the cylinders and preventing hydraulic lock (during next cold start)
The engine can operate on any fuel whose flow can be regulated (semi-solid liquid gas) Combustion occurs at high temperature at one atmosphere so much cleaner burning than internal combustion
Figure 15 Air-Steam Hybrid
Schematic
Accelerator regulates flow of air water and fuel to heater based on load and wheel speed Water and fuel are metered to maintain heater temperature within optimal performance band
Output demand determines air-water fraction
Any discussion of fuel efficiency relative to current IC engine technology must first re-emphasize the multi-fuel capability of EC engines In a market so dominated by one fuel customers have accepted the term ldquomiles per gallonrdquo
FEDERAL TRANSIT ADMINISTRATION 15
SECTION 3 THE AIR-STEAM HYBRID SOLUTION
as the basis for comparison But in an open market with many different fuels and widely different heat content (BTUlb) the only common and appropriate denominator is ldquomiles per dollarrdquo (closer to ldquofuel economyrdquo)
To the extent that any EC solution gains market acceptance and the market responds with new and different fuel blends the law of supply and demand dictates that fuel prices for all will drop Until then the remainder of this efficiency discussion will assume all engines require the same petroleum-based fuel
The long-accepted estimate of fuel efficiency for the IC engine is about 25 percent with the remaining 75 percent of the heat content dissipated in equal parts through the hot exhaust the radiator and mechanical losses in the engine Much has been done to raise that efficiency but what remains is one power stroke in four and a high temperature detonation whose heat content is quickly and intentionally dissipated through conduction
In sharp contrast a steam engine is designed to preserve as much heat as possible from combustion and then mete out that heat through the expansion of the working fluid Instead of a 25 percent heat loss through conduction through a radiator conductive loss is limited to 10 percent in efficient steam engines The greatest loss is through the vaporization of water to steam (at 30) yielding useful work of 35 or 40 percent higher than internal combustion Steam vehicles often report significantly lower practical fuel economies as the whole boiler is heated for a relatively short trip (another reason to avoid using a boiler)
Hot air engines involve no change of state therefore avoiding the loss associated with vaporization That can mean fuel efficiencies approaching 65 percent except as noted with the MDI engine a lower power-to-weight capability
The combination of air and steam into a single engine type is expected to yield economies between 35 and 65 percent varying with wheel load A 50 percent net efficiency would double fuel economy over a comparably-sized IC engine but as shown with the Doble and Besler examples the EC engine can be much smaller yielding even greater economies
FEDERAL TRANSIT ADMINISTRATION 16
SECTION 3 THE AIR-STEAM HYBRID SOLUTION
Figure 16 Fuel Efficiency
by Engine Type
Derivative Uses As much as this study is focused on large motive power applications it should be noted that an equally important opportunity for this technology is in stationary power applications similar in configuration to combined heat and power units referred to generally as micro-CHPs Rapid start-up high torque quiet operation and multi-fuel compatibility make it well suited to an integrated heat and electrical power installation
FEDERAL TRANSIT ADMINISTRATION 17
SECTION 3 THE AIR-STEAM HYBRID SOLUTION
Its ability to produce a full range of power options (mechanical pneumatic heat and through attached accessories electrical and hydraulic) in a small modular man-portable configuration also make it particularly well suited to temporary or tactical power requirements Although beyond the scope of the DOT goals for vehicular use this stationary power applicationrsquos potential may be strategically important in market acceptance and adoption by expanding the range of applications and thereby providing economies of scale in all aspects of development production and commercialization activities for all applications
FEDERAL TRANSIT ADMINISTRATION 18
SECTION BRASH Test Plan 4 This Phase I effort followed the Technical Objectives outlined in the proposal as follows
Practical Objectives 1 Modify the Smarttrade sized test vehicle (Figure 17) installing a 10ndash20 HP
equivalent heater a 650 cc displacement 2 HP (nominal) Quasiturbinetrade steam engine pressurized air and water tanks electronic flow regulation of air water and fuel via laptop-based LabVIEW software and solenoid valves
2 Perform test runs to validate the system operation and determine key baseline performance parameters such as
a minimum air fraction to maintain engine operation upper limits for operating temperatures maximum allowable flow rates for water (without reducing effective propellant flow at temperature)
b upper limits of vehicle speed while varying gross vehicle weight and course incline
3 Following baseline performance assessment further objectives included
a an analysis of component placement for ease of maintenance and replacement
b an estimation of comparable volumes and weights to an equivalent IC powertrain in order to verify retrofitability
c an estimation of effective fuel economy while using propane fuel on closed track mileage runs
Figure 17 Smarttrade
Car-Sized Test Vehicle
FEDERAL TRANSIT ADMINISTRATION 19
SECTION 4 BRASH TEST PLAN
4 Over the course of multiple test runs a cumulative assessment of component performance and reliability would lead to a gross verification of BRASH engine integrity and range That in turn could lead to off-site vehicle demonstrations to federal agencies potential industry partners and investors
Analytical Objectives 1 The BRASH engine model has been demonstrated only at a bench level with
rudimentary understanding of its operating principles A key objective in this vehicle build is to increase the thermodynamic modeling of this technology including an analysis of mass flow (air water fuel) and resulting power
2 Early test data would lead to analysis of specific on-vehicle capacities (for air water and fuel) and flow rates for same in order to estimate operating range recovery strategies and rates (recompression and condensation) and the parasitic loads (eg alternators pumps) to sustain useful operation for many hours
3 Over time the vehicle testing under various test conditions (eg varying gross vehicle weight wheel load engine temperature propellant mix) will lead to a body of data to support more complete modeling of water fraction vs torque vs temperature These data are essential to real-world estimation of fuel economy as this technology scales to larger practical vehicle applications
4 With the modeling from 3 in place for steady-state operation practical track runs with frequent starts and stops can further shape the model for real-world use
5 The analysis from steps 1ndash4 will provide sufficient basis for estimating the mass flow heat component capacity recovery factors and fuel economy for scaling this 2 HP test data to larger vehicles in two decade steps first to a 20 HP pickup truck and then further modeling and custom buildup of a 200 HP power plant with a DOT-identified industrial partner
6 This analytical plan is consistent with the overall SBIR program plan as the 2HP effort is confined to Phase I the 20 HP build and test plan would be accomplished in Phase II and the design and build of the 200 HP power plant would be accomplished in Phase III with an established industry partner
The work effort toward completion of these tasks has proceeded on two tracks mechanical modifications to the April test vehicle and electronic control and measurement
Mechanical Modifications and Test Configuration The test vehicle is a modified electric car about the size of a Smarttrade car Earlier modifications included removal of the electric drive train exposing a large working
FEDERAL TRANSIT ADMINISTRATION 20
SECTION 4 BRASH TEST PLAN
space behind the cab This rear space over the rear left wheel contains a 2HP Quasiturbinetrade steam engine20 selected for its compact design and suitable power range for this 700-pound vehicle The placement over the left wheel permits direct drive to that wheel via electric clutch and chain drive
Figure 18 Quasiturbinetrade
Rotary Expander Installed and Interior View
In the center of center of this rear space a heavily-modified propane space heater rated at 30000ndash80000 BTUhr (equivalent to 11ndash31 boiler horsepower [bhp]) was installed Heaters of this type generally are designed to efficiently distribute heat into an adjoining space This heater was heavily modified with high temperature insulation and outer shells to retain useful heat to the 20-ft stainless steel coil passing through its core
Figure 19 Quasiturbinetrade
Rotary Expander Installed and Interior View
the expander and heater (with recent refinements) Also visible under the heater is the pressurized water tank (painted grey) The open space to left of the heater is reserved for drive components The space to the right of the heater is reserved for recovery and recompression of the expanded propellant (Recompression is outside of the current scope to simplify the testing and analysis See discussion section for more information) Other system components include air cylinders and electronic controllers that are mounted forward of the rear firewall in the cab or under the front hood
Figure 20 shows the back of the vehicle with fenders and trim removed revealing
20Quasiturbinetrade Product Details httpquasiturbinepromciqcca
FEDERAL TRANSIT ADMINISTRATION 21
SECTION 4 BRASH TEST PLAN
Figure 20 Test Configuration
Figure 21 System Components
The main system components are shown Minor components and linkage tomechanical output are not included in this report for the sake of simplicity
Electronic Control and Measurement No realistic progress toward a vehicle demonstrator with known and regulated fuel use can proceed without electronic regulation In this build the LabVIEW program and system components from National Instruments were used to create a ldquoglass cockpitrdquo of vehicle controls and performance measurement21 The simplified schematic in Figure 22 shows the planned integration of electronics in this development LabView-compatible components will replace all mechanical flow and measurement components
21More information can be found at National Insturments The LabVIEW Environment httpwwwnicomlabview
FEDERAL TRANSIT ADMINISTRATION 22
SECTION 4 BRASH TEST PLAN
Figure 22 Electronics
Schematic for Air-Steam Hybrid
For the vehicle driver the dashboard collection of gauges has been replaced with a laptop screen similar to the one pictured in Figure 23
Figure 23 Front Screen Display for Air-Steam Hybrid
Certain features on this front screen will reflect user input (OnOff Throttle) while others reflect the dependent variables in the process (Heater Temp Fuel Flow Air and Water Flow) Shown on the bottom screen will be running time-series data on speed wheel load temperature specific fuel consumption and the other variables important to the analytical process The front screen display is generated from programming and controls on the back screen display
FEDERAL TRANSIT ADMINISTRATION 23
SECTION 4 BRASH TEST PLAN
Figure 24 Back Screen Display for Air-Steam Hybrid
LabVIEW software and controllers were chosen because of National Instrumentsrsquo status as the industry leader in rapid control prototyping and In-Vehicle data-logging solutions BKi purchased the LabVIEW componentry through the University of Connecticut Mechanical Engineering Department as part of UConnrsquos ongoing support of the project
By the end of the contract term in October 2010 the air and water regulation components were complete and operational but the fuel regulation and engine speed components were not yet fully operational To generate the most meaningful data under these circumstances the test vehicle was configured for extended operation to determine specific fuel water and air consumption rates The combination of these rates provided the basis for initial estimates of power and efficiency
Summary of Effort Mechanical Modifications
1 Removal of original electrical drive components reinforcement of frame
2 Installation of Quasiturbinetrade 2HP engine modified heater pressurized water tank all pneumatic water and fuel lines
3 Baseline validation testing using manual controls
4 Installation of electronically-regulated flow controllers
Electronic Modification 1 Acquisition of computer electronic regulators and control software
2 LabVIEW systems programming
3 System checkout
FEDERAL TRANSIT ADMINISTRATION 24
SECTION 4 BRASH TEST PLAN
Testing and Analysis 1 Static Safety Testing 2 Baseline vehicle drivetrain testing
3 Vehicle static testing (Runs 3 amp 5)
Summary of RequirementsGoals 1 Safe operation of vehicle during static and motive applications
2 Qualitative demonstration of BRASH engine capability to move test vehicle on flat and inclined road surface
3 Quantitative determination of air water and fuel consumption during timed static test
4 Quantitative determination of air water and fuel consumption while varyshying water and fuel fractions
Summary of Testing Two experiments were performed in late November the first to establish minimum fuel and propellant flow rates for sustained operation at low speed (air-rich mode) and the second to establish reasonable upper limits of fuel and propellant flow at higher engine speeds (steam-rich mode) Variation in the air-steam mix is the underlying theory of operation for the BRASH engine the air fraction provides a baseline flow for initial start-up and low-speed operation but the addition of water (as steam) to the propellant results in a significant boost in range and power These two tests have verified this underlying theory
Test Conditions The two test runs summarized in this report are 3 on November 22 2010 and 5 on November 26 2010 Both tests were performed at the Depot D campus of the University of Connecticut in Storrs The testing was performed outside in seasonal conditions 45-50degF with light winds
Figure 25 Vehicle Test Setup
FEDERAL TRANSIT ADMINISTRATION 25
SECTION 4 BRASH TEST PLAN
Each run was a dynamic test with no load on the two-cylinder Quasiturbinetrade engine The propane cylinder was suspended from a scale for the duration of the test Propane fuel consumption was monitored continuously by digital scale with a display accuracy of 001kg
Each test run lasted for the duration of one high pressure air cylinder Air cylinder start (full) and end (empty) were determined at the start and finish of each run using the same scale and accuracy Water levels initially were determined volumetrically but the results were too inconsistent Displaced volume of liquid water proved a poor measure of the quantity heated to steam and carried forward for productive work For this reason water is an estimated quantity based upon fuel quantity burned less heat absorbed by the air fraction (Further integration of the LabView controller software in the next phase will obviate this work-around)
Each of the complete test runs may be viewed at Brash Engines website httpwwwbrashenginescom Photos from each run appear in the figures that follow Tables 1 and 2 summarize the productive mass flow for air water and propane fuel to produce work from the engine for the test duration
The cab interior in Figure 26 shows the high pressure air cylinder below the steering wheel and the laptop computer (regulating propellant flow) in passenger seat space The LabView controllers reside in the protective case under the laptop
Figure 26 Vehicle Cab with Controller Laptop
During each test hot propellant was allowed to expand and vent to ambient in order to simplify the thermodynamic model and analysis (Note the plumes of water vapor from each exhaust hose and the small puddles of water under each hose in Figure 27)
FEDERAL TRANSIT ADMINISTRATION 26
SECTION 4 BRASH TEST PLAN
Figure 27 Exhaust Plumes from Expander
Development plans include recovering the expanded propellant separating into water and air phases and then recompressing the air fraction for re-use This will both improve efficiency and eliminate the visible vapor plume
Test Assumptions Another estimation used in this study is the efficiency of heat transfer for the propellant through the 20-ft coil of stainless steel inside the insulated heater Figure 28 shows an early ldquoair-onlyrdquo test run with the current heater The hose failure and melting of the steel wire mesh inside (note formed ball in the mesh) indicates 1300degK temperatures exiting the hot section
Figure 28 Hose Failure Due
to Overheating
FEDERAL TRANSIT ADMINISTRATION 27
SECTION 4 BRASH TEST PLAN
Effective heat transfer (as Figure 28 shows) does not equal efficient heat transfer but the ability to deliver 1300degK air from a well-insulated burner suggests a highly efficient transfer of heat The analysis of results assumes a value of 90 efficiency (See Appendix A for a discussion of heat transfer efficiency)
3 Low Speed Test On November 22 2010 Run 3 tested the lower operating limits of the test setup Low limit in this context meant sufficient pressure to maintain expander rotation but low steam and fuel burn The test commenced with a full air cylinder weighing 661 Kg At the end of the test the empty cylinder weighed 460 Kg Over the 7 minutes and 15 seconds of testing 006 Kg of propane was consumed
The mass of air and fuel was determined from before after run test weights As stated earlier determining the quantity of steam produced from the pressurized water tank was problematic because of the quantity of stored water the resistance to water flow under dynamic pressures and the potential for some fraction of the water (in liquid state) to be entrained in the propellant mix
To solve for this unknown the energy required to raise the known quantity of air from ambient to 1000degK (33kcalmol or 0467 BTUg) was subtracted from the energy content of the propane consumed (44 BTUg) and then the efficiency of the heat transfer process was de-rated by 10 percent to yield a net quantity of 1438 BTUs to elevate ambient temperature water to 1000degK steam The result is an estimated 125 grams of water consumed in the 7-minute test
Table 1 summarizes these data and shows a high reliance on the air fraction for the work performed by the 2 HP engine The air cylinder used in this test has a measured free volume of 45 cubic feet (1274 liters at STP) which means sustained flow rates of 62 cubic feet per minute (cfm) or 175 liters per minute In contrast the 125 grams of water passed through as steam produced an estimated equivalent gas volume of 155 liters at STP Note the modest levels of water vapor in Figure 29 Why the greater air fraction relative to water flow in this test
Air (Wt 000Kg) 661 460 201 938 1294 30 36
Water2
(Wt 000Kg)
Propane(Wt 000Kg)
Time (hrmnsc)
1562
123000
1556
123715
00125
006
00715
1438
2640
na
1983
364
na
47
86
54
90
1 Energy value based upon absorbed heat (italicized) from STP to 1000degK (0446 BTUg for Air 115 BTUg water) 2 Determined by difference from propane and air energy assumed value 90 3Arbitrary estimated efficiency of heat transfer not effective work
11222010 - 3 Low Speed Run Air Pressure 60 psi Water Head Pressure 60 psi
Component(BTU) Start End Net Energy1
(BTU) Power
(BTUmin) Power (HP) Efficiency3
Table 1 Analysis of Mass
Flow Data at Low Speed
FEDERAL TRANSIT ADMINISTRATION 28
SECTION 4 BRASH TEST PLAN
Figure 29 Low-Speed Test Results in Little
Water Vapor
In this baseline experiment the single cylinder provides 60 psi air flow and 60 psi static ldquoheadrdquo pressure on the water column The air flow from the cylinder is biased toward the generally less restrictive flow path for air The water column under the same pressure presents a higher viscosity medium passing through a greater number of valves and restrictions At the point of injection the air fraction flows more freely into the hot section In order to bias the mix toward greater water fraction (and greater power) the head pressure on the water column must be increased over the 60 psi air line pressure
Run 4 (not documented here) evaluated head pressures from 110 psi to 70 psi and determined that modest differential pressures retarded the flow from the air fraction and boosted flow of the water fraction Still higher differential pressures effectively stopped air flow altogether reverting the engine operation to ldquosteam onlyrdquo For Run 5 an additional cylinder was used to apply a 70 psi static head pressure on the water column a 10 psi differential over the 60 psi air line pressure
5 Variable High Speed Test On November 26 2010 Run 5 tested the higher differential water pressure as a means to increase the effective water fraction in the propellant mix The test commenced with a full air cylinder weighing 654 Kg At the end of the test the empty cylinder weighed 472 Kg Run 5 was interrupted after 243 minutes to refill the water tank and then testing resumed for an additional 907 minutes Over the whole test 027 Kg of propane was consumed
Using the same analytical basis as Test 3 Test 5 data indicate a substantial increase in work capacity (as measured by fuel consumed and steam generated) over the 3 baseline
FEDERAL TRANSIT ADMINISTRATION 29
112610 - 5 Variable High Speed Run Air Pressure 60 psi Water Head Pressure 70 psi
Air (Wt 000Kg)
Component(BTU) Start End Net Energy1
(BTU) Power
(BTUmin) Power (HP) Efficiency3
654 472 182 849 718 17 7
SECTION 4 BRASH TEST PLAN
Table 3 Comparison of Mass Flows
Water 588 Runs 3 and 5
163 Duration (mn) 725 1180 725 1180 163
Air
Component Run 3 BHP
Run 5 BHP
Net ChngBHP
Run 5 Mass
Transfer (kg)
Net ChangeMass
Transfer (kg)
30 17
197
237
-45 2010 182 -9
Run 3 Mass
Transfer (kg)
276 350
47
86
422
0060
0013
0270
0086
Propane
This difference in steam fraction and power is more clearly seen in Figure 30 (and on the source video at the Brash Engines website)
Figure 30 Three Images from Run 5
Table 2 Test 5 Results with Increased
Water and Fuel Water2
(Wt 000Kg) 0860 9890 8358 197 83
Propane(Wt 000Kg) 1520 1493 27 11880 1004 237 90
Time (hrmnsc) 133000 134150 01150 na na na na
1 Energy value based upon absorbed heat (italics) from STP to 1000degK (0446 BTUg for Air 115 BTUg water) Underlined value is released heat at generally accepted 44 BTUg 2 Determined by difference from propane and air Energy assumed value 90 3 Arbitrary estimated efficiency of heat transfer not effective work
The increase in pressure on the water column by 10 psi reduced air flow by 9 percent but increased the steam fraction considerably and thereby increased the effective boiler horsepower nearly three-fold to 237 bhp (assuming 90 heat transfer) These data are summarized in Table 3
FEDERAL TRANSIT ADMINISTRATION 30
SECTION 4 BRASH TEST PLAN
As with Run 3 start up from Time Zero was immediate burner on air flow begins and water flow under pressure commences immediately Another impressive feature of the mix air-steam propellant system is the ability to start stop and rapidly accelerate as shown in the full Run 5 video Run 5 serves as validation that this patented technology has unique performance benefits over air steam or internal combustion alone
Lessons Learned A comparison of the two test runs verifies some key points
1 The same power plant can produce variable power and fuel economy based upon power demand and airsteam mix
2 Although imprecise at this point in testing fuel consumption appears directly proportional to engine speed The engineexpander will spool up spool down stop and restart in a manner consistent with fuel and propellant flow The Run 5 video on the Brash Engines website verifies this conclusion
3 The use of a defined static air pressure ldquoheadrdquo over the water column at a pressure higher than the defined air line dynamic pressure provides a safe and predictable bias toward flow from the water fraction
4 Although the current test configuration offers sufficient performance for this initial demonstration phase the following observations are in order
a The heater path is too long creating latent response issues
b The airwater injector is not optimized for proper mix or flow capacity
c The incomplete integration of LabVIEW compromises the quality of data
d The absence of a measured variable load on the expander compromises any analysis of power and fuel economy
5 The design migration to a vehicle installation was premature The project should move back to a lab bench study to refine the regulation of components complete the recovery and recompression portions of the system and use electromechanical loads to estimate power and useful work for specific quantities of fuel water and air
6 The Quasiturbinetrade engine technology is promising but too immature for larger-scale modeling Later phases of the project should rely on more conventional multi-cylinder piston-type expander
Estimated Fuel Economy Mass transit authorities have relied on large diesel engines such as the Detroit Diesel Series 50 and Series 60 engines for more than 30 years Reports on fuel economy vary from a high of 60 miles per gallon (Diesel) for longer-range
FEDERAL TRANSIT ADMINISTRATION 31
SECTION 4 BRASH TEST PLAN
commuter services in California23 to a low of 228 miles per gallon (Diesel) for city buses with frequent stops in New York City24 In both cited studies the migration to compressed natural gas (CNG) has resulted in lower fuel economies on a Diesel Gallon Equivalent (DGE) basis
Table 4 summarizes this study (columns 2 and 3) and the next proposed phase (columns 4 and 5) the performance of the current fleet of mass transit buses (columns 6 and 7) and the likely outcome if the Besler engine (described earlier) were employed with the air-steam hybrid technology (columns 8 and 9)
Table 4 Comparison of
Fuel Economies
Air
1
Configuration
Engine
HP
Torque
Fuel
gmin
BTUhr
GGEhr
mpg 60mph
GGE100 mi
$ per GGE
$100 mi
Current
Example
2
3
3
5
4
Bench
5
S-10
6
SB Bus
7
NYCT
8
50 eff
9
30 eff
86
Quasi
2
Prop
82
216
02
3160
03
30
09
Current
237
Quasi
2
Prop
23
607
05
1126
09
30
27
UC 1
40
6 cyl
20
Prop
40
1056
09
648
15
30
46
UC 2
80
6 cyl
40
Mix
80
2112
19
324
31
30
93
MCI102
DD S60
350
1450
Diesel
540
11400
100
60
167
35
583
Diesel
23
439
35
1535
300
Besler
150
1200
Mix
300
792
695
864
1158
16
1853
500
Besler
150
1200
Mix
500
1320
1158
518
1930
16
3088
The Besler engine is shown in two columns The left column reflects the higher efficiency anticipated with the air-steam hybrid mix described earlier as at or near 50 percent The right column reflects the historical efficiency realized with steam engine technology The italicized numbers near the bottom of the column show that even at historical efficiencies the Besler engine would offer equal or better Gasoline Gallon Equivalent (GGE)100 mile ratings of the current diesel technology but migrating toward less refined and (therefore) less expensive fuels would significantly reduce the operating cost ($mile)
23Demonstration of Caterpillar C-10 Dual-Fuel Engines in MCI 102DL3 Commuter Buses National Renewable Energy Laboratory httpwwwnrelgovdocsfy00osti26758pdf p 7 24R Barnitt ldquoNew York City Transit (NYCT) Hybrid (125 Order) and CNG Transit Buses Final Evaluation Resultsrdquo November 2006 National Renewable Energy Laboratory K Chandler Battelle Technical Report NRELTP-540-40125 November 2006 httpwwwnrelgovvehiclesandfuelsfleettestpdfs40125pdf pvii
FEDERAL TRANSIT ADMINISTRATION 32
SECTION 4 BRASH TEST PLAN
There are of course two orders of magnitude difference between the results of Runs 3 and 5 and the daily demands of city and commuter buses but the mere existence of the Besler Twin and the Brooks V-8 400 HP engine suggests an opportunity for fuel economy and fuel variety
Proposed further support for the next phase of development will advance the air-steam hybrid technology by an important order of magnitude This would provide the data confidence to scale to larger vehicle operation and garner the interest of one or more engine or vehicle OEMs
Figure 31 MTANew York City
Transit Orion VII Next Generation
Hybrid Transit Bus
Next Development Phase The next phase of development will incorporate a modern six-cylinder steam engine design with a displacement of 53 cubic inches and capable of sustained 15-25 HP operation The expander will be supplied by Steam Engine Power Inc (httpwwwsteamenginepowercom) This expander will drive an alternator generator to measure effective work output in watts as well as provide sufficient power to satisfy the system parasitic loads of battery recharge exhaust air recompression and all other pump and valve operations
Figure 32 (l to r) Six-Cylinder Expander Power Generation Load
Small 24 VDC Compressor
FEDERAL TRANSIT ADMINISTRATION 33
SECTION 4 BRASH TEST PLAN
Static pressure for the water column will still be supplied via compressed air cylinder but the dynamic air flow will be supplied by an oil-less air compressor of the size and type shown This 24 VDC compressor will recompress the recovered air exiting the expander to 40ndash60 psi pressure and support flows of 3ndash4 cubic feet per minute (cfm) These three components are off-the-shelf enhancements to the system but custom engineering of a new more powerful and more responsive heater completion of the electronic integration and design and fabrication of the recoveryrecompression components are necessary tasks that must be included to make the next generation assembly work to its potential This work will be accomplished largely by Mechanical and Electrical Engineering students at the University of Connecticut under the supervision of faculty and Brash Engines personnel
When this build is complete all operations will be under LabVIEW control All expander operations will be measured for power and work Once the bench version is in control a modified version will be installed in a small pickup truck (eg Chevrolet S-10) for further verification of system performance and robustness
During this phase a new and promising technology will be investigated a new and faster class of solenoid valves from National Instruments These solenoid valves with an unprecedented 3 msec response time have the potential of allowing air-steam retrofit in existing engine blocks The solenoid valves could replace the spark plugs in conventional IC engines and provide the equivalent timed injection of hot propellant mix as the timed firing of a spark plug in the presence of a fuel air mix
If possible these fast solenoids and the black box programming to control them could allow very easy portability to larger vehicles and easier retrofit Potentially a V-6 engine could operate 4 cylinders for expansion and the remaining two cylinders could be used as direct drive compressors with different but equivalent solenoid valves controlling the compression process
FEDERAL TRANSIT ADMINISTRATION 34
SECTION Development Plan 5 and Next Steps
This current effort is a key first-proof of concept for this air-steam hybrid technology but our goals extend well beyond this two-seat 2 HP demonstrator The lessons learned in electronic integration will allow rapid migration to larger platforms using the same basic controls but scaling the expander heater and other mass-flow components to vehicle-appropriate size That project identified as ldquo20 HP Vehiclerdquo and other near-term derivative projects are listed in Table 5
BRASH Project
ProposedFunding Source
Funds Reqd $K Project Description
SUV-size proof-of-concept for reliable 20 HP Vehicle DOTUSPS 300 highway performance maildelivery
vehicle size
Proof-of-concept mass transit busshy200 HP Vehicle DOTDOD 600 retrofit scaled to city bus capacity and
suitable for replacement of over-the-road diesel engines
Table 5 Project Funding
Stationary Power Unit Micro-CHP Equivalent
DARPA 300 Proof-of-concept mass transit bus-retrofit scaled to city bus capacity and suitable for replacement of over-the-road diesel engines
Summary Alternative Processed Solid Fuel DOE EPA DOA 600
Processed mix of hydrolyzed wood pulp processed solid waste and other combustible solids in an extrudable mass with alcohol solutevehiclemdashdemonstrate utility in vehicles as a high energy content clean burning fuel for EC engines
Demonstrate effective pyrolysis of
Binary Solid Gas Fuel
EPA Waste Management BFI
400 processed solid fuels in a binary fuel burner conventional fuel (gasoline natural gas) provides primary heat source for pyrolysis temperatures
Proof of Concept OEM Power Plant
Vehicle OEM (eg Ford GM Caterpillar) 1200
Development of direct replacement BRASH engine alternative to existing OEM IC engine
Black Box Integration of Controller Software
Vehicle OEM (eg Ford GM Caterpillar)
1600 Development of commercial BRASH system alternative to existing OEM IC engine
FEDERAL TRANSIT ADMINISTRATION 35
SECTION 5 DEVELOPMENT PLAN AND NEXT STEPS
The issuance of US Patent 7743872 five months ago has two important consequences for this project First it serves to validate the underlying technology the combination of air and steam in an EC engine is better than steam or air alone Second it provides a basis for full and open discussions with government agencies and large commercial interests in the transportation and power sectors
Our efforts at promotion have been delayed pending successful demonstration of the Smarttrade car vehicle to allow the first detailed real-world performance data to be distributed
Coupling that performance data with the option of migration away from refined petroleum should spark significant interest If we can move to a high lignin-processed wood pulp that costs $045 per gasoline gallon equivalent (an arbitrary value for example only) and consumes more CO2 while growing than is consumed in processing as a fuel and produced from combustion then we succeed as a project and as a global game-changing technology for many uses Improvements in fuel economy are important but of greater importance is the migration to low-process biomass fuels
FEDERAL TRANSIT ADMINISTRATION 36
SECTION Potential Applications and Societal Value 6 The whole premise behind the BRASH air steam hybrid is that external combustion offers a more benign and environmentally-appropriate way to power large vehicles and other portable equipment than refined petroleum-powered internal combustion
bullCombustion heat can be derived from any fuel source including processed solids from fast-growing renewables such as poplar trees waste corn stalks or switch grass
bullThat combustion heat is applied at a rate consistent with the work to be done and not to support idling and other unproductive fuel use
Using a mix of air and steam as working fluids in the engine allows
bullImmediate startup from an ldquoair-onlyrdquo start
bull Managed system pressure through use of a defined head air pressure
bullManaged fuel burn as the air-steam fraction is adjusted to match wheel load
bullAdjusted wheel load reduces fuel burn
Integration of modern control circuitry with external combustion also brings a level of performance operational simplicity and safety heretofore unavailable
FEDERAL TRANSIT ADMINISTRATION 37
SECTION
7 Phase I Conclusions
The last steam train in scheduled service in the US departed on October 11 196225 One year earlier Robert Noyce received the first patent for an integrated circuit26 But for that brief one-year overlap the most powerful motive power technology was never harnessed by the black box controls that grew out of Noycersquos invention so the diesel-powered IC engine championed by Henry Ford won out
Now nearly 50 years later the modern IC engine cannot operate efficiently without the benefit of black box electronicsmdashbut that technology still presents intractable challenges of supply safety and environmental impact The air-steam hybrid technology may offer an alternative and a glimpse of that potential is presented here and viewable in Run 5 on the Brash Engines website at http wwwbrashenginescom
While demonstration in a test vehicle provides a strong visual message that BRASH technology works the commercial success of this technology will depend upon reliable repeatable measurement of power and economy For that data the Phase 2 effort will require a return to laboratory bench testing and effective demonstration of recovery of the water and air fractions
The results of this Phase I project collectively demonstrate the technical feasibility and commercial potential of the BRASH air-steam hybrid engine technology The initial DOT SBIR funding has been highly effective in facilitating this important proof of concept and laying the groundwork for further technology refinement and application
As described earlier the next steps are clear and appear to combine achievable and rapid major advances with low developmental risk SBIR Phase 2 support is needed for those advances due to the still-early stage of development that restricts access to private capital
The immense potential value of this technology has been enhanced and verified in Phase 1 there is now a clear and low-risk path ahead to larger-scale testing further component and controls refinement specific applications prototyping and pre-commercial deployments
25William Rosen The Most Powerful Idea in the World Random House 2010 p 311 26US Patent 2981877
FEDERAL TRANSIT ADMINISTRATION 38
APPENDIX
A Heat Transfer Efficiency Modeling Runs 3 and 5 50 and 90
Much of the analysis for Runs 3 and 5 is based on an assumed efficiency of 90 for heat transfer from the combustion of propane to heating of the water air mix in the coil As a test for the reasonableness of that assumption the same data have been modeled at a much lower 50 factor below
112210 - 3 Low Speed Run Air Pressure 60 psi Water head pressure 60 psi
Water2 00440 5060 4276 101 43 (Wt 000Kg)
Propane 152 1493 237 50 27 11880 1004 (Wt 000Kg)
Time 133000 134150 01150 na na na na (hrmnsc)
1 Energy value based upon absorbed heat (italics) from STP to 1000degK (0446 BTUg for Air 115 BTUg water) Underlined value is released heat at generally accepted 44 BTUg
Air (Wt 000Kg)
Component(BTU) Start Wt End Wt Net Wt Energy1
(BTU) Power
(BTUmin) Power (HP) Efficiency3
661 460 201 938 1294 30 36
Water2
(Wt 000Kg)
Propane(Wt 000Kg)
Time (hrmnsc)
1562
123000
1556
123715
00125
006
00715
380
2640
na
523
364
na
12
86
14
50
na na
Air (Wt 000Kg)
Component(BTU) Start Wt
5 Variable High Speed Run Air Pressure 60 psi Water head pressure 70 psi
End Wt Net Wt Energy1
(BTU) Power
(BTUmin) Power (HP) Efficiency3
654 472 182 849 718 17 7
2 Determined by difference from Propane and Air Energy assumed value 90 3 Arbitrary estimated efficiency of heat transfer not effective work
The two known quantities in each run is the weight of the air moving through the system and the weight of the propane heating that air The variable is the quantity of water heated to steam temperatures and above In Run 3 at 90 efficiency that mass of water calculates to 125 grams at 50 it drops to 33 grams In Run 5 at 90 efficiency that mass of water calculates to 86 grams at 50 it drops to 44 grams
FEDERAL TRANSIT ADMINISTRATION 39
APPENDIX A HEAT TRANSFER EFFICIENCY MODELING RUNS 3 AND 5 50 AND 90
As the comparison tables below show the uncertainty in the efficiency of heat transfer is manifest only in the mass of water heated to steam to do useful work
Data 90 Efficiency
Air
Component Run 3 BHP
Run 5 BHP
Net ChngBHP
-45
Run 3 Mass
Transfer (kg)
Run 5 Mass
Transfer (kg)
Net ChangeMass
Transfer (kg)
30 17
197
237
2010 182 -9
Water
Propane
Duration (mn)
47
86
725
422
0060
0013
725
0270
0086
1180
588
350
163 1180
276
163
Data 50 Efficiency
Air
Component Run 3 BHP
Run 5 BHP
Net ChngBHP
-45
Run 3 Mass
Transfer (kg)
Run 5 Mass
Transfer (kg)
Net ChangeMass
Transfer (kg)
30 17
101
237
2010 182 -9
Water
Propane
Duration (mn)
12
86
725
817
0060
0003
725
0270
0044
1180
1233
350
163 1180
276
163
Regardless of the specific efficiency Run3 reflects an air-rich propellant mix while Run 5 was clearly the more powerful and steam-rich propellant If 50 efficiency is a more realistic figure than 90 the only consequence is more water passing through the heater expander and recovery tank The only consequence for overall system efficiency is the slight but added work required to move the additional water by pump to the top of the water column
FEDERAL TRANSIT ADMINISTRATION 40
APPENDIX Acronyms B
BHP Boiler Horsepower
BRASH Binary Recovery Air-Steam Hybrid
BTU British Thermal Unit
CC Cubic centimeter
CFM Cubit feet per minute
CHP Combined heat and power
CNG Compressed natural gas
CO2 Carbon dioxide
CU Cubic
DARPA Defense Advanced Research Projects Agency
DGE Diesel gallon equivalent
DOT Department of Transportation
EC External combustion
EIA Energy Information Administration
EPA Environmental Protection Agency
FTA Federal Transit Administration
GGE Gasoline gallon equivalent
HP Horsepower
IC Internal combustion
K Kelvin
Kcal Kilocalorie
MPG Miles per gallon
MPH Miles per hour
OEM Original equipment manufacturer
PSI Pounds per square inch
RPM Revolutions per minute
SBIR Small Business Innovation Research
STP Standard temperature and pressure
FEDERAL TRANSIT ADMINISTRATION 41
FEDERAL TRANSIT ADMINISTRATION 128
US Department of TransportationFederal Transit AdministrationEast Building1200 New Jersey Avenue SEWashington DC 20590httpwwwftadotgovresearch
US Department of Transportation Federal Transit Administration East Building 1200 New Jersey Avenue SE Washington DC 20590 httpwwwftadotgovresearch
FEDERAL TRANSIT ADMINISTRATION 42
- Button1
- Button2
- Button3
- Button4
- Button5
- Button6
- Button7
- Button8
- Button9
- Button10
- Button11
- Button12
- Button13
- Button14
- Button15
- Button16
- Button17
- Button18
- Button19
- Button20
- Button21
- Button22
- Button23
- Button24
- Button25
- Button26
- Button27
- Button28
- Button29
- Button30
- Button31
- Button32
- Button33
- Button34
- Button35
- Button36
- Button37
- Button38
- Button39
- Button40
- Button41
- Button42
- Button43
- Button44
- Button45
- Button46
- Button47
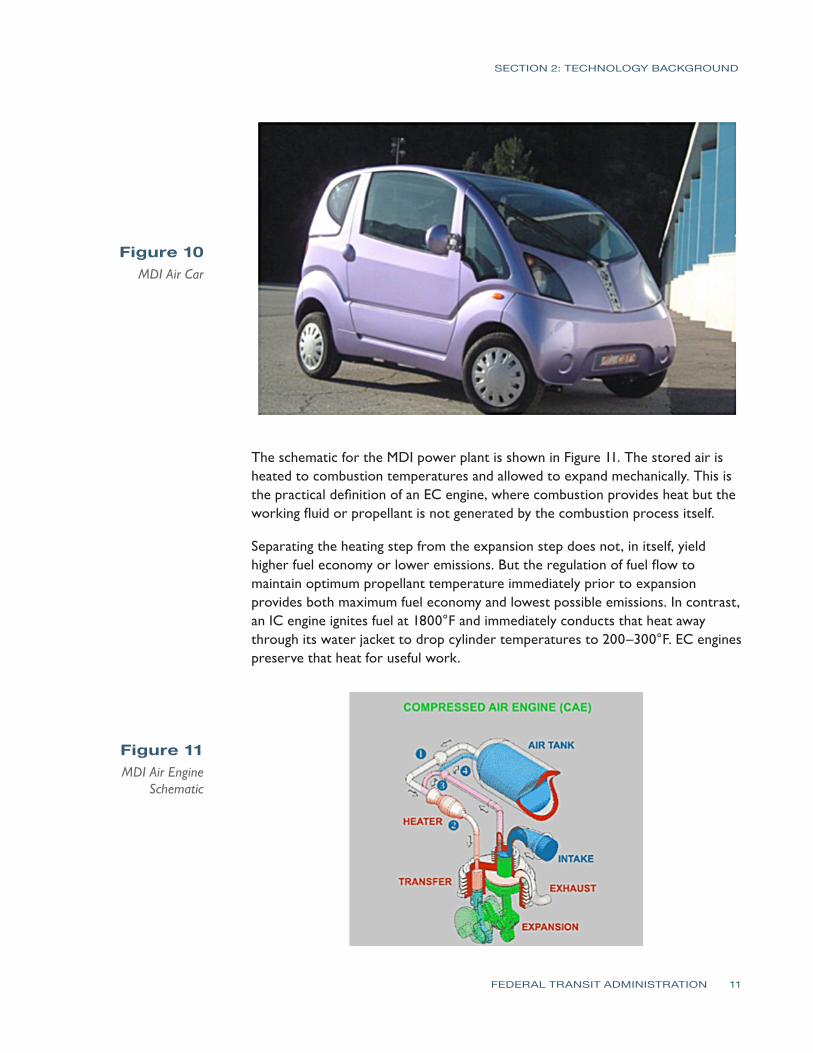
SECTION 2 TECHNOLOGY BACKGROUND
Figure 10 MDI Air Car
The schematic for the MDI power plant is shown in Figure 11 The stored air is heated to combustion temperatures and allowed to expand mechanically This is the practical definition of an EC engine where combustion provides heat but the working fluid or propellant is not generated by the combustion process itself
Separating the heating step from the expansion step does not in itself yield higher fuel economy or lower emissions But the regulation of fuel flow to maintain optimum propellant temperature immediately prior to expansion provides both maximum fuel economy and lowest possible emissions In contrast an IC engine ignites fuel at 1800degF and immediately conducts that heat away through its water jacket to drop cylinder temperatures to 200ndash300degF EC engines preserve that heat for useful work
Figure 11 MDI Air Engine
Schematic
FEDERAL TRANSIT ADMINISTRATION 11
SECTION 2 TECHNOLOGY BACKGROUND
Both air and steam engines provide an alternative to the conventional IC engine Both operate from a variety of fuels and offer the potential of lower emissions and higher fuel economy Steam is the more robust of the two (the Besler Steam Twin is much more energetic than the MDI six-cylinder) but the compressed air engine offers an operational simplicity and a lower weight because no boiler or condenser is required Unfortunately it can never provide the power and acceleration of steam
The best of both worlds would be a blending of air and steam into a single engine that offers all of the benefits but without the weight and heat management issues of a boiler and with significantly more power than an air engine alone
FEDERAL TRANSIT ADMINISTRATION 12
SECTION The Air-Steam 3 Hybrid Solution
Air and water are completely different in their physical properties except when they operate as working fluids at high temperatures and pressures At steam operating pressures and temperatures their behavior largely follows ideal gas behavior and each is miscible in the other at all proportions The arrow in Figure 12 indicates the rough path for expansion of the hot high-pressure propellant and shows near ideal gas behavior for steam at these elevated temperatures and pressures
Figure 12 Does Steam
Behave Like an Ideal Gas
Getting to steam operating temperatures and pressures requires that significantly more heat be applied to water than air at STP (standard temperature and pressure) Air requires only 642 kcalmole to reach these operating temperatures while water (steam) requires 5236 kcalmole (due to the 512 kcal heat of vaporization) In this development a baseline flow of air is used to entrain water into the heater section Fuel is consumed in direct proportion to the water fraction to maintain the heater at a near constant temperature The heat required to maintain ldquohot airrdquo temperatures is a small fraction of the heat required to maintain steam temperatures as shown in Figure 13
FEDERAL TRANSIT ADMINISTRATION 13
SECTION 3 THE AIR-STEAM HYBRID SOLUTION
Figure 13 Heat Required
to Raise Air and Water
Temperature to 1000degK
The compressed air fraction provides a safe and consistent flow pressure into the hot section The water once heated to working steam temperature provides a more robust working fluid
The hot mixed propellant is injected into the expander moving a piston and converting heat to motion The expanded propellant thereby drops to condensing temperatures allowing the water portion to drop to a sump for pumped return to the injector The expanded air fraction is then recompressed for return to the injector
The use of an air fraction allows for immediate injection of work-appropriate amounts of water into the hot section no boiler no steam under pressure no fuel wasted (heating steam without immediate purpose) The use of a water fraction (and proportional fuel flow) allows for variable power from a constant temperature system The binary (air-steam) propellant allows for a closed-loop condensing recovery system extending range and economy
Figure 14 Schematic of Injector Nozzle Used to Mix Air
and Water
FEDERAL TRANSIT ADMINISTRATION 14
SECTION 3 THE AIR-STEAM HYBRID SOLUTION
The sum of the process is as follows
Key start begins a modest fuel burn that immediately provides initial hot air flow through the engine
bull Depressing the accelerator increases the water fraction and fuel flow (in direct proportion)
bullThe vehicle moves forward under (airsteamfuel) power in direct proportion to wheel turn
bullThe hot mix expands and the expanded mix condenses the water fraction
bullA small parasitic load recompresses the small air fraction to reinjection pressures
bull Removing the foot from the accelerator returns the flow to hot air only sweeping residual moisture from the cylinders and preventing hydraulic lock (during next cold start)
The engine can operate on any fuel whose flow can be regulated (semi-solid liquid gas) Combustion occurs at high temperature at one atmosphere so much cleaner burning than internal combustion
Figure 15 Air-Steam Hybrid
Schematic
Accelerator regulates flow of air water and fuel to heater based on load and wheel speed Water and fuel are metered to maintain heater temperature within optimal performance band
Output demand determines air-water fraction
Any discussion of fuel efficiency relative to current IC engine technology must first re-emphasize the multi-fuel capability of EC engines In a market so dominated by one fuel customers have accepted the term ldquomiles per gallonrdquo
FEDERAL TRANSIT ADMINISTRATION 15
SECTION 3 THE AIR-STEAM HYBRID SOLUTION
as the basis for comparison But in an open market with many different fuels and widely different heat content (BTUlb) the only common and appropriate denominator is ldquomiles per dollarrdquo (closer to ldquofuel economyrdquo)
To the extent that any EC solution gains market acceptance and the market responds with new and different fuel blends the law of supply and demand dictates that fuel prices for all will drop Until then the remainder of this efficiency discussion will assume all engines require the same petroleum-based fuel
The long-accepted estimate of fuel efficiency for the IC engine is about 25 percent with the remaining 75 percent of the heat content dissipated in equal parts through the hot exhaust the radiator and mechanical losses in the engine Much has been done to raise that efficiency but what remains is one power stroke in four and a high temperature detonation whose heat content is quickly and intentionally dissipated through conduction
In sharp contrast a steam engine is designed to preserve as much heat as possible from combustion and then mete out that heat through the expansion of the working fluid Instead of a 25 percent heat loss through conduction through a radiator conductive loss is limited to 10 percent in efficient steam engines The greatest loss is through the vaporization of water to steam (at 30) yielding useful work of 35 or 40 percent higher than internal combustion Steam vehicles often report significantly lower practical fuel economies as the whole boiler is heated for a relatively short trip (another reason to avoid using a boiler)
Hot air engines involve no change of state therefore avoiding the loss associated with vaporization That can mean fuel efficiencies approaching 65 percent except as noted with the MDI engine a lower power-to-weight capability
The combination of air and steam into a single engine type is expected to yield economies between 35 and 65 percent varying with wheel load A 50 percent net efficiency would double fuel economy over a comparably-sized IC engine but as shown with the Doble and Besler examples the EC engine can be much smaller yielding even greater economies
FEDERAL TRANSIT ADMINISTRATION 16
SECTION 3 THE AIR-STEAM HYBRID SOLUTION
Figure 16 Fuel Efficiency
by Engine Type
Derivative Uses As much as this study is focused on large motive power applications it should be noted that an equally important opportunity for this technology is in stationary power applications similar in configuration to combined heat and power units referred to generally as micro-CHPs Rapid start-up high torque quiet operation and multi-fuel compatibility make it well suited to an integrated heat and electrical power installation
FEDERAL TRANSIT ADMINISTRATION 17
SECTION 3 THE AIR-STEAM HYBRID SOLUTION
Its ability to produce a full range of power options (mechanical pneumatic heat and through attached accessories electrical and hydraulic) in a small modular man-portable configuration also make it particularly well suited to temporary or tactical power requirements Although beyond the scope of the DOT goals for vehicular use this stationary power applicationrsquos potential may be strategically important in market acceptance and adoption by expanding the range of applications and thereby providing economies of scale in all aspects of development production and commercialization activities for all applications
FEDERAL TRANSIT ADMINISTRATION 18
SECTION BRASH Test Plan 4 This Phase I effort followed the Technical Objectives outlined in the proposal as follows
Practical Objectives 1 Modify the Smarttrade sized test vehicle (Figure 17) installing a 10ndash20 HP
equivalent heater a 650 cc displacement 2 HP (nominal) Quasiturbinetrade steam engine pressurized air and water tanks electronic flow regulation of air water and fuel via laptop-based LabVIEW software and solenoid valves
2 Perform test runs to validate the system operation and determine key baseline performance parameters such as
a minimum air fraction to maintain engine operation upper limits for operating temperatures maximum allowable flow rates for water (without reducing effective propellant flow at temperature)
b upper limits of vehicle speed while varying gross vehicle weight and course incline
3 Following baseline performance assessment further objectives included
a an analysis of component placement for ease of maintenance and replacement
b an estimation of comparable volumes and weights to an equivalent IC powertrain in order to verify retrofitability
c an estimation of effective fuel economy while using propane fuel on closed track mileage runs
Figure 17 Smarttrade
Car-Sized Test Vehicle
FEDERAL TRANSIT ADMINISTRATION 19
SECTION 4 BRASH TEST PLAN
4 Over the course of multiple test runs a cumulative assessment of component performance and reliability would lead to a gross verification of BRASH engine integrity and range That in turn could lead to off-site vehicle demonstrations to federal agencies potential industry partners and investors
Analytical Objectives 1 The BRASH engine model has been demonstrated only at a bench level with
rudimentary understanding of its operating principles A key objective in this vehicle build is to increase the thermodynamic modeling of this technology including an analysis of mass flow (air water fuel) and resulting power
2 Early test data would lead to analysis of specific on-vehicle capacities (for air water and fuel) and flow rates for same in order to estimate operating range recovery strategies and rates (recompression and condensation) and the parasitic loads (eg alternators pumps) to sustain useful operation for many hours
3 Over time the vehicle testing under various test conditions (eg varying gross vehicle weight wheel load engine temperature propellant mix) will lead to a body of data to support more complete modeling of water fraction vs torque vs temperature These data are essential to real-world estimation of fuel economy as this technology scales to larger practical vehicle applications
4 With the modeling from 3 in place for steady-state operation practical track runs with frequent starts and stops can further shape the model for real-world use
5 The analysis from steps 1ndash4 will provide sufficient basis for estimating the mass flow heat component capacity recovery factors and fuel economy for scaling this 2 HP test data to larger vehicles in two decade steps first to a 20 HP pickup truck and then further modeling and custom buildup of a 200 HP power plant with a DOT-identified industrial partner
6 This analytical plan is consistent with the overall SBIR program plan as the 2HP effort is confined to Phase I the 20 HP build and test plan would be accomplished in Phase II and the design and build of the 200 HP power plant would be accomplished in Phase III with an established industry partner
The work effort toward completion of these tasks has proceeded on two tracks mechanical modifications to the April test vehicle and electronic control and measurement
Mechanical Modifications and Test Configuration The test vehicle is a modified electric car about the size of a Smarttrade car Earlier modifications included removal of the electric drive train exposing a large working
FEDERAL TRANSIT ADMINISTRATION 20
SECTION 4 BRASH TEST PLAN
space behind the cab This rear space over the rear left wheel contains a 2HP Quasiturbinetrade steam engine20 selected for its compact design and suitable power range for this 700-pound vehicle The placement over the left wheel permits direct drive to that wheel via electric clutch and chain drive
Figure 18 Quasiturbinetrade
Rotary Expander Installed and Interior View
In the center of center of this rear space a heavily-modified propane space heater rated at 30000ndash80000 BTUhr (equivalent to 11ndash31 boiler horsepower [bhp]) was installed Heaters of this type generally are designed to efficiently distribute heat into an adjoining space This heater was heavily modified with high temperature insulation and outer shells to retain useful heat to the 20-ft stainless steel coil passing through its core
Figure 19 Quasiturbinetrade
Rotary Expander Installed and Interior View
the expander and heater (with recent refinements) Also visible under the heater is the pressurized water tank (painted grey) The open space to left of the heater is reserved for drive components The space to the right of the heater is reserved for recovery and recompression of the expanded propellant (Recompression is outside of the current scope to simplify the testing and analysis See discussion section for more information) Other system components include air cylinders and electronic controllers that are mounted forward of the rear firewall in the cab or under the front hood
Figure 20 shows the back of the vehicle with fenders and trim removed revealing
20Quasiturbinetrade Product Details httpquasiturbinepromciqcca
FEDERAL TRANSIT ADMINISTRATION 21
SECTION 4 BRASH TEST PLAN
Figure 20 Test Configuration
Figure 21 System Components
The main system components are shown Minor components and linkage tomechanical output are not included in this report for the sake of simplicity
Electronic Control and Measurement No realistic progress toward a vehicle demonstrator with known and regulated fuel use can proceed without electronic regulation In this build the LabVIEW program and system components from National Instruments were used to create a ldquoglass cockpitrdquo of vehicle controls and performance measurement21 The simplified schematic in Figure 22 shows the planned integration of electronics in this development LabView-compatible components will replace all mechanical flow and measurement components
21More information can be found at National Insturments The LabVIEW Environment httpwwwnicomlabview
FEDERAL TRANSIT ADMINISTRATION 22
SECTION 4 BRASH TEST PLAN
Figure 22 Electronics
Schematic for Air-Steam Hybrid
For the vehicle driver the dashboard collection of gauges has been replaced with a laptop screen similar to the one pictured in Figure 23
Figure 23 Front Screen Display for Air-Steam Hybrid
Certain features on this front screen will reflect user input (OnOff Throttle) while others reflect the dependent variables in the process (Heater Temp Fuel Flow Air and Water Flow) Shown on the bottom screen will be running time-series data on speed wheel load temperature specific fuel consumption and the other variables important to the analytical process The front screen display is generated from programming and controls on the back screen display
FEDERAL TRANSIT ADMINISTRATION 23
SECTION 4 BRASH TEST PLAN
Figure 24 Back Screen Display for Air-Steam Hybrid
LabVIEW software and controllers were chosen because of National Instrumentsrsquo status as the industry leader in rapid control prototyping and In-Vehicle data-logging solutions BKi purchased the LabVIEW componentry through the University of Connecticut Mechanical Engineering Department as part of UConnrsquos ongoing support of the project
By the end of the contract term in October 2010 the air and water regulation components were complete and operational but the fuel regulation and engine speed components were not yet fully operational To generate the most meaningful data under these circumstances the test vehicle was configured for extended operation to determine specific fuel water and air consumption rates The combination of these rates provided the basis for initial estimates of power and efficiency
Summary of Effort Mechanical Modifications
1 Removal of original electrical drive components reinforcement of frame
2 Installation of Quasiturbinetrade 2HP engine modified heater pressurized water tank all pneumatic water and fuel lines
3 Baseline validation testing using manual controls
4 Installation of electronically-regulated flow controllers
Electronic Modification 1 Acquisition of computer electronic regulators and control software
2 LabVIEW systems programming
3 System checkout
FEDERAL TRANSIT ADMINISTRATION 24
SECTION 4 BRASH TEST PLAN
Testing and Analysis 1 Static Safety Testing 2 Baseline vehicle drivetrain testing
3 Vehicle static testing (Runs 3 amp 5)
Summary of RequirementsGoals 1 Safe operation of vehicle during static and motive applications
2 Qualitative demonstration of BRASH engine capability to move test vehicle on flat and inclined road surface
3 Quantitative determination of air water and fuel consumption during timed static test
4 Quantitative determination of air water and fuel consumption while varyshying water and fuel fractions
Summary of Testing Two experiments were performed in late November the first to establish minimum fuel and propellant flow rates for sustained operation at low speed (air-rich mode) and the second to establish reasonable upper limits of fuel and propellant flow at higher engine speeds (steam-rich mode) Variation in the air-steam mix is the underlying theory of operation for the BRASH engine the air fraction provides a baseline flow for initial start-up and low-speed operation but the addition of water (as steam) to the propellant results in a significant boost in range and power These two tests have verified this underlying theory
Test Conditions The two test runs summarized in this report are 3 on November 22 2010 and 5 on November 26 2010 Both tests were performed at the Depot D campus of the University of Connecticut in Storrs The testing was performed outside in seasonal conditions 45-50degF with light winds
Figure 25 Vehicle Test Setup
FEDERAL TRANSIT ADMINISTRATION 25
SECTION 4 BRASH TEST PLAN
Each run was a dynamic test with no load on the two-cylinder Quasiturbinetrade engine The propane cylinder was suspended from a scale for the duration of the test Propane fuel consumption was monitored continuously by digital scale with a display accuracy of 001kg
Each test run lasted for the duration of one high pressure air cylinder Air cylinder start (full) and end (empty) were determined at the start and finish of each run using the same scale and accuracy Water levels initially were determined volumetrically but the results were too inconsistent Displaced volume of liquid water proved a poor measure of the quantity heated to steam and carried forward for productive work For this reason water is an estimated quantity based upon fuel quantity burned less heat absorbed by the air fraction (Further integration of the LabView controller software in the next phase will obviate this work-around)
Each of the complete test runs may be viewed at Brash Engines website httpwwwbrashenginescom Photos from each run appear in the figures that follow Tables 1 and 2 summarize the productive mass flow for air water and propane fuel to produce work from the engine for the test duration
The cab interior in Figure 26 shows the high pressure air cylinder below the steering wheel and the laptop computer (regulating propellant flow) in passenger seat space The LabView controllers reside in the protective case under the laptop
Figure 26 Vehicle Cab with Controller Laptop
During each test hot propellant was allowed to expand and vent to ambient in order to simplify the thermodynamic model and analysis (Note the plumes of water vapor from each exhaust hose and the small puddles of water under each hose in Figure 27)
FEDERAL TRANSIT ADMINISTRATION 26
SECTION 4 BRASH TEST PLAN
Figure 27 Exhaust Plumes from Expander
Development plans include recovering the expanded propellant separating into water and air phases and then recompressing the air fraction for re-use This will both improve efficiency and eliminate the visible vapor plume
Test Assumptions Another estimation used in this study is the efficiency of heat transfer for the propellant through the 20-ft coil of stainless steel inside the insulated heater Figure 28 shows an early ldquoair-onlyrdquo test run with the current heater The hose failure and melting of the steel wire mesh inside (note formed ball in the mesh) indicates 1300degK temperatures exiting the hot section
Figure 28 Hose Failure Due
to Overheating
FEDERAL TRANSIT ADMINISTRATION 27
SECTION 4 BRASH TEST PLAN
Effective heat transfer (as Figure 28 shows) does not equal efficient heat transfer but the ability to deliver 1300degK air from a well-insulated burner suggests a highly efficient transfer of heat The analysis of results assumes a value of 90 efficiency (See Appendix A for a discussion of heat transfer efficiency)
3 Low Speed Test On November 22 2010 Run 3 tested the lower operating limits of the test setup Low limit in this context meant sufficient pressure to maintain expander rotation but low steam and fuel burn The test commenced with a full air cylinder weighing 661 Kg At the end of the test the empty cylinder weighed 460 Kg Over the 7 minutes and 15 seconds of testing 006 Kg of propane was consumed
The mass of air and fuel was determined from before after run test weights As stated earlier determining the quantity of steam produced from the pressurized water tank was problematic because of the quantity of stored water the resistance to water flow under dynamic pressures and the potential for some fraction of the water (in liquid state) to be entrained in the propellant mix
To solve for this unknown the energy required to raise the known quantity of air from ambient to 1000degK (33kcalmol or 0467 BTUg) was subtracted from the energy content of the propane consumed (44 BTUg) and then the efficiency of the heat transfer process was de-rated by 10 percent to yield a net quantity of 1438 BTUs to elevate ambient temperature water to 1000degK steam The result is an estimated 125 grams of water consumed in the 7-minute test
Table 1 summarizes these data and shows a high reliance on the air fraction for the work performed by the 2 HP engine The air cylinder used in this test has a measured free volume of 45 cubic feet (1274 liters at STP) which means sustained flow rates of 62 cubic feet per minute (cfm) or 175 liters per minute In contrast the 125 grams of water passed through as steam produced an estimated equivalent gas volume of 155 liters at STP Note the modest levels of water vapor in Figure 29 Why the greater air fraction relative to water flow in this test
Air (Wt 000Kg) 661 460 201 938 1294 30 36
Water2
(Wt 000Kg)
Propane(Wt 000Kg)
Time (hrmnsc)
1562
123000
1556
123715
00125
006
00715
1438
2640
na
1983
364
na
47
86
54
90
1 Energy value based upon absorbed heat (italicized) from STP to 1000degK (0446 BTUg for Air 115 BTUg water) 2 Determined by difference from propane and air energy assumed value 90 3Arbitrary estimated efficiency of heat transfer not effective work
11222010 - 3 Low Speed Run Air Pressure 60 psi Water Head Pressure 60 psi
Component(BTU) Start End Net Energy1
(BTU) Power
(BTUmin) Power (HP) Efficiency3
Table 1 Analysis of Mass
Flow Data at Low Speed
FEDERAL TRANSIT ADMINISTRATION 28
SECTION 4 BRASH TEST PLAN
Figure 29 Low-Speed Test Results in Little
Water Vapor
In this baseline experiment the single cylinder provides 60 psi air flow and 60 psi static ldquoheadrdquo pressure on the water column The air flow from the cylinder is biased toward the generally less restrictive flow path for air The water column under the same pressure presents a higher viscosity medium passing through a greater number of valves and restrictions At the point of injection the air fraction flows more freely into the hot section In order to bias the mix toward greater water fraction (and greater power) the head pressure on the water column must be increased over the 60 psi air line pressure
Run 4 (not documented here) evaluated head pressures from 110 psi to 70 psi and determined that modest differential pressures retarded the flow from the air fraction and boosted flow of the water fraction Still higher differential pressures effectively stopped air flow altogether reverting the engine operation to ldquosteam onlyrdquo For Run 5 an additional cylinder was used to apply a 70 psi static head pressure on the water column a 10 psi differential over the 60 psi air line pressure
5 Variable High Speed Test On November 26 2010 Run 5 tested the higher differential water pressure as a means to increase the effective water fraction in the propellant mix The test commenced with a full air cylinder weighing 654 Kg At the end of the test the empty cylinder weighed 472 Kg Run 5 was interrupted after 243 minutes to refill the water tank and then testing resumed for an additional 907 minutes Over the whole test 027 Kg of propane was consumed
Using the same analytical basis as Test 3 Test 5 data indicate a substantial increase in work capacity (as measured by fuel consumed and steam generated) over the 3 baseline
FEDERAL TRANSIT ADMINISTRATION 29
112610 - 5 Variable High Speed Run Air Pressure 60 psi Water Head Pressure 70 psi
Air (Wt 000Kg)
Component(BTU) Start End Net Energy1
(BTU) Power
(BTUmin) Power (HP) Efficiency3
654 472 182 849 718 17 7
SECTION 4 BRASH TEST PLAN
Table 3 Comparison of Mass Flows
Water 588 Runs 3 and 5
163 Duration (mn) 725 1180 725 1180 163
Air
Component Run 3 BHP
Run 5 BHP
Net ChngBHP
Run 5 Mass
Transfer (kg)
Net ChangeMass
Transfer (kg)
30 17
197
237
-45 2010 182 -9
Run 3 Mass
Transfer (kg)
276 350
47
86
422
0060
0013
0270
0086
Propane
This difference in steam fraction and power is more clearly seen in Figure 30 (and on the source video at the Brash Engines website)
Figure 30 Three Images from Run 5
Table 2 Test 5 Results with Increased
Water and Fuel Water2
(Wt 000Kg) 0860 9890 8358 197 83
Propane(Wt 000Kg) 1520 1493 27 11880 1004 237 90
Time (hrmnsc) 133000 134150 01150 na na na na
1 Energy value based upon absorbed heat (italics) from STP to 1000degK (0446 BTUg for Air 115 BTUg water) Underlined value is released heat at generally accepted 44 BTUg 2 Determined by difference from propane and air Energy assumed value 90 3 Arbitrary estimated efficiency of heat transfer not effective work
The increase in pressure on the water column by 10 psi reduced air flow by 9 percent but increased the steam fraction considerably and thereby increased the effective boiler horsepower nearly three-fold to 237 bhp (assuming 90 heat transfer) These data are summarized in Table 3
FEDERAL TRANSIT ADMINISTRATION 30
SECTION 4 BRASH TEST PLAN
As with Run 3 start up from Time Zero was immediate burner on air flow begins and water flow under pressure commences immediately Another impressive feature of the mix air-steam propellant system is the ability to start stop and rapidly accelerate as shown in the full Run 5 video Run 5 serves as validation that this patented technology has unique performance benefits over air steam or internal combustion alone
Lessons Learned A comparison of the two test runs verifies some key points
1 The same power plant can produce variable power and fuel economy based upon power demand and airsteam mix
2 Although imprecise at this point in testing fuel consumption appears directly proportional to engine speed The engineexpander will spool up spool down stop and restart in a manner consistent with fuel and propellant flow The Run 5 video on the Brash Engines website verifies this conclusion
3 The use of a defined static air pressure ldquoheadrdquo over the water column at a pressure higher than the defined air line dynamic pressure provides a safe and predictable bias toward flow from the water fraction
4 Although the current test configuration offers sufficient performance for this initial demonstration phase the following observations are in order
a The heater path is too long creating latent response issues
b The airwater injector is not optimized for proper mix or flow capacity
c The incomplete integration of LabVIEW compromises the quality of data
d The absence of a measured variable load on the expander compromises any analysis of power and fuel economy
5 The design migration to a vehicle installation was premature The project should move back to a lab bench study to refine the regulation of components complete the recovery and recompression portions of the system and use electromechanical loads to estimate power and useful work for specific quantities of fuel water and air
6 The Quasiturbinetrade engine technology is promising but too immature for larger-scale modeling Later phases of the project should rely on more conventional multi-cylinder piston-type expander
Estimated Fuel Economy Mass transit authorities have relied on large diesel engines such as the Detroit Diesel Series 50 and Series 60 engines for more than 30 years Reports on fuel economy vary from a high of 60 miles per gallon (Diesel) for longer-range
FEDERAL TRANSIT ADMINISTRATION 31
SECTION 4 BRASH TEST PLAN
commuter services in California23 to a low of 228 miles per gallon (Diesel) for city buses with frequent stops in New York City24 In both cited studies the migration to compressed natural gas (CNG) has resulted in lower fuel economies on a Diesel Gallon Equivalent (DGE) basis
Table 4 summarizes this study (columns 2 and 3) and the next proposed phase (columns 4 and 5) the performance of the current fleet of mass transit buses (columns 6 and 7) and the likely outcome if the Besler engine (described earlier) were employed with the air-steam hybrid technology (columns 8 and 9)
Table 4 Comparison of
Fuel Economies
Air
1
Configuration
Engine
HP
Torque
Fuel
gmin
BTUhr
GGEhr
mpg 60mph
GGE100 mi
$ per GGE
$100 mi
Current
Example
2
3
3
5
4
Bench
5
S-10
6
SB Bus
7
NYCT
8
50 eff
9
30 eff
86
Quasi
2
Prop
82
216
02
3160
03
30
09
Current
237
Quasi
2
Prop
23
607
05
1126
09
30
27
UC 1
40
6 cyl
20
Prop
40
1056
09
648
15
30
46
UC 2
80
6 cyl
40
Mix
80
2112
19
324
31
30
93
MCI102
DD S60
350
1450
Diesel
540
11400
100
60
167
35
583
Diesel
23
439
35
1535
300
Besler
150
1200
Mix
300
792
695
864
1158
16
1853
500
Besler
150
1200
Mix
500
1320
1158
518
1930
16
3088
The Besler engine is shown in two columns The left column reflects the higher efficiency anticipated with the air-steam hybrid mix described earlier as at or near 50 percent The right column reflects the historical efficiency realized with steam engine technology The italicized numbers near the bottom of the column show that even at historical efficiencies the Besler engine would offer equal or better Gasoline Gallon Equivalent (GGE)100 mile ratings of the current diesel technology but migrating toward less refined and (therefore) less expensive fuels would significantly reduce the operating cost ($mile)
23Demonstration of Caterpillar C-10 Dual-Fuel Engines in MCI 102DL3 Commuter Buses National Renewable Energy Laboratory httpwwwnrelgovdocsfy00osti26758pdf p 7 24R Barnitt ldquoNew York City Transit (NYCT) Hybrid (125 Order) and CNG Transit Buses Final Evaluation Resultsrdquo November 2006 National Renewable Energy Laboratory K Chandler Battelle Technical Report NRELTP-540-40125 November 2006 httpwwwnrelgovvehiclesandfuelsfleettestpdfs40125pdf pvii
FEDERAL TRANSIT ADMINISTRATION 32
SECTION 4 BRASH TEST PLAN
There are of course two orders of magnitude difference between the results of Runs 3 and 5 and the daily demands of city and commuter buses but the mere existence of the Besler Twin and the Brooks V-8 400 HP engine suggests an opportunity for fuel economy and fuel variety
Proposed further support for the next phase of development will advance the air-steam hybrid technology by an important order of magnitude This would provide the data confidence to scale to larger vehicle operation and garner the interest of one or more engine or vehicle OEMs
Figure 31 MTANew York City
Transit Orion VII Next Generation
Hybrid Transit Bus
Next Development Phase The next phase of development will incorporate a modern six-cylinder steam engine design with a displacement of 53 cubic inches and capable of sustained 15-25 HP operation The expander will be supplied by Steam Engine Power Inc (httpwwwsteamenginepowercom) This expander will drive an alternator generator to measure effective work output in watts as well as provide sufficient power to satisfy the system parasitic loads of battery recharge exhaust air recompression and all other pump and valve operations
Figure 32 (l to r) Six-Cylinder Expander Power Generation Load
Small 24 VDC Compressor
FEDERAL TRANSIT ADMINISTRATION 33
SECTION 4 BRASH TEST PLAN
Static pressure for the water column will still be supplied via compressed air cylinder but the dynamic air flow will be supplied by an oil-less air compressor of the size and type shown This 24 VDC compressor will recompress the recovered air exiting the expander to 40ndash60 psi pressure and support flows of 3ndash4 cubic feet per minute (cfm) These three components are off-the-shelf enhancements to the system but custom engineering of a new more powerful and more responsive heater completion of the electronic integration and design and fabrication of the recoveryrecompression components are necessary tasks that must be included to make the next generation assembly work to its potential This work will be accomplished largely by Mechanical and Electrical Engineering students at the University of Connecticut under the supervision of faculty and Brash Engines personnel
When this build is complete all operations will be under LabVIEW control All expander operations will be measured for power and work Once the bench version is in control a modified version will be installed in a small pickup truck (eg Chevrolet S-10) for further verification of system performance and robustness
During this phase a new and promising technology will be investigated a new and faster class of solenoid valves from National Instruments These solenoid valves with an unprecedented 3 msec response time have the potential of allowing air-steam retrofit in existing engine blocks The solenoid valves could replace the spark plugs in conventional IC engines and provide the equivalent timed injection of hot propellant mix as the timed firing of a spark plug in the presence of a fuel air mix
If possible these fast solenoids and the black box programming to control them could allow very easy portability to larger vehicles and easier retrofit Potentially a V-6 engine could operate 4 cylinders for expansion and the remaining two cylinders could be used as direct drive compressors with different but equivalent solenoid valves controlling the compression process
FEDERAL TRANSIT ADMINISTRATION 34
SECTION Development Plan 5 and Next Steps
This current effort is a key first-proof of concept for this air-steam hybrid technology but our goals extend well beyond this two-seat 2 HP demonstrator The lessons learned in electronic integration will allow rapid migration to larger platforms using the same basic controls but scaling the expander heater and other mass-flow components to vehicle-appropriate size That project identified as ldquo20 HP Vehiclerdquo and other near-term derivative projects are listed in Table 5
BRASH Project
ProposedFunding Source
Funds Reqd $K Project Description
SUV-size proof-of-concept for reliable 20 HP Vehicle DOTUSPS 300 highway performance maildelivery
vehicle size
Proof-of-concept mass transit busshy200 HP Vehicle DOTDOD 600 retrofit scaled to city bus capacity and
suitable for replacement of over-the-road diesel engines
Table 5 Project Funding
Stationary Power Unit Micro-CHP Equivalent
DARPA 300 Proof-of-concept mass transit bus-retrofit scaled to city bus capacity and suitable for replacement of over-the-road diesel engines
Summary Alternative Processed Solid Fuel DOE EPA DOA 600
Processed mix of hydrolyzed wood pulp processed solid waste and other combustible solids in an extrudable mass with alcohol solutevehiclemdashdemonstrate utility in vehicles as a high energy content clean burning fuel for EC engines
Demonstrate effective pyrolysis of
Binary Solid Gas Fuel
EPA Waste Management BFI
400 processed solid fuels in a binary fuel burner conventional fuel (gasoline natural gas) provides primary heat source for pyrolysis temperatures
Proof of Concept OEM Power Plant
Vehicle OEM (eg Ford GM Caterpillar) 1200
Development of direct replacement BRASH engine alternative to existing OEM IC engine
Black Box Integration of Controller Software
Vehicle OEM (eg Ford GM Caterpillar)
1600 Development of commercial BRASH system alternative to existing OEM IC engine
FEDERAL TRANSIT ADMINISTRATION 35
SECTION 5 DEVELOPMENT PLAN AND NEXT STEPS
The issuance of US Patent 7743872 five months ago has two important consequences for this project First it serves to validate the underlying technology the combination of air and steam in an EC engine is better than steam or air alone Second it provides a basis for full and open discussions with government agencies and large commercial interests in the transportation and power sectors
Our efforts at promotion have been delayed pending successful demonstration of the Smarttrade car vehicle to allow the first detailed real-world performance data to be distributed
Coupling that performance data with the option of migration away from refined petroleum should spark significant interest If we can move to a high lignin-processed wood pulp that costs $045 per gasoline gallon equivalent (an arbitrary value for example only) and consumes more CO2 while growing than is consumed in processing as a fuel and produced from combustion then we succeed as a project and as a global game-changing technology for many uses Improvements in fuel economy are important but of greater importance is the migration to low-process biomass fuels
FEDERAL TRANSIT ADMINISTRATION 36
SECTION Potential Applications and Societal Value 6 The whole premise behind the BRASH air steam hybrid is that external combustion offers a more benign and environmentally-appropriate way to power large vehicles and other portable equipment than refined petroleum-powered internal combustion
bullCombustion heat can be derived from any fuel source including processed solids from fast-growing renewables such as poplar trees waste corn stalks or switch grass
bullThat combustion heat is applied at a rate consistent with the work to be done and not to support idling and other unproductive fuel use
Using a mix of air and steam as working fluids in the engine allows
bullImmediate startup from an ldquoair-onlyrdquo start
bull Managed system pressure through use of a defined head air pressure
bullManaged fuel burn as the air-steam fraction is adjusted to match wheel load
bullAdjusted wheel load reduces fuel burn
Integration of modern control circuitry with external combustion also brings a level of performance operational simplicity and safety heretofore unavailable
FEDERAL TRANSIT ADMINISTRATION 37
SECTION
7 Phase I Conclusions
The last steam train in scheduled service in the US departed on October 11 196225 One year earlier Robert Noyce received the first patent for an integrated circuit26 But for that brief one-year overlap the most powerful motive power technology was never harnessed by the black box controls that grew out of Noycersquos invention so the diesel-powered IC engine championed by Henry Ford won out
Now nearly 50 years later the modern IC engine cannot operate efficiently without the benefit of black box electronicsmdashbut that technology still presents intractable challenges of supply safety and environmental impact The air-steam hybrid technology may offer an alternative and a glimpse of that potential is presented here and viewable in Run 5 on the Brash Engines website at http wwwbrashenginescom
While demonstration in a test vehicle provides a strong visual message that BRASH technology works the commercial success of this technology will depend upon reliable repeatable measurement of power and economy For that data the Phase 2 effort will require a return to laboratory bench testing and effective demonstration of recovery of the water and air fractions
The results of this Phase I project collectively demonstrate the technical feasibility and commercial potential of the BRASH air-steam hybrid engine technology The initial DOT SBIR funding has been highly effective in facilitating this important proof of concept and laying the groundwork for further technology refinement and application
As described earlier the next steps are clear and appear to combine achievable and rapid major advances with low developmental risk SBIR Phase 2 support is needed for those advances due to the still-early stage of development that restricts access to private capital
The immense potential value of this technology has been enhanced and verified in Phase 1 there is now a clear and low-risk path ahead to larger-scale testing further component and controls refinement specific applications prototyping and pre-commercial deployments
25William Rosen The Most Powerful Idea in the World Random House 2010 p 311 26US Patent 2981877
FEDERAL TRANSIT ADMINISTRATION 38
APPENDIX
A Heat Transfer Efficiency Modeling Runs 3 and 5 50 and 90
Much of the analysis for Runs 3 and 5 is based on an assumed efficiency of 90 for heat transfer from the combustion of propane to heating of the water air mix in the coil As a test for the reasonableness of that assumption the same data have been modeled at a much lower 50 factor below
112210 - 3 Low Speed Run Air Pressure 60 psi Water head pressure 60 psi
Water2 00440 5060 4276 101 43 (Wt 000Kg)
Propane 152 1493 237 50 27 11880 1004 (Wt 000Kg)
Time 133000 134150 01150 na na na na (hrmnsc)
1 Energy value based upon absorbed heat (italics) from STP to 1000degK (0446 BTUg for Air 115 BTUg water) Underlined value is released heat at generally accepted 44 BTUg
Air (Wt 000Kg)
Component(BTU) Start Wt End Wt Net Wt Energy1
(BTU) Power
(BTUmin) Power (HP) Efficiency3
661 460 201 938 1294 30 36
Water2
(Wt 000Kg)
Propane(Wt 000Kg)
Time (hrmnsc)
1562
123000
1556
123715
00125
006
00715
380
2640
na
523
364
na
12
86
14
50
na na
Air (Wt 000Kg)
Component(BTU) Start Wt
5 Variable High Speed Run Air Pressure 60 psi Water head pressure 70 psi
End Wt Net Wt Energy1
(BTU) Power
(BTUmin) Power (HP) Efficiency3
654 472 182 849 718 17 7
2 Determined by difference from Propane and Air Energy assumed value 90 3 Arbitrary estimated efficiency of heat transfer not effective work
The two known quantities in each run is the weight of the air moving through the system and the weight of the propane heating that air The variable is the quantity of water heated to steam temperatures and above In Run 3 at 90 efficiency that mass of water calculates to 125 grams at 50 it drops to 33 grams In Run 5 at 90 efficiency that mass of water calculates to 86 grams at 50 it drops to 44 grams
FEDERAL TRANSIT ADMINISTRATION 39
APPENDIX A HEAT TRANSFER EFFICIENCY MODELING RUNS 3 AND 5 50 AND 90
As the comparison tables below show the uncertainty in the efficiency of heat transfer is manifest only in the mass of water heated to steam to do useful work
Data 90 Efficiency
Air
Component Run 3 BHP
Run 5 BHP
Net ChngBHP
-45
Run 3 Mass
Transfer (kg)
Run 5 Mass
Transfer (kg)
Net ChangeMass
Transfer (kg)
30 17
197
237
2010 182 -9
Water
Propane
Duration (mn)
47
86
725
422
0060
0013
725
0270
0086
1180
588
350
163 1180
276
163
Data 50 Efficiency
Air
Component Run 3 BHP
Run 5 BHP
Net ChngBHP
-45
Run 3 Mass
Transfer (kg)
Run 5 Mass
Transfer (kg)
Net ChangeMass
Transfer (kg)
30 17
101
237
2010 182 -9
Water
Propane
Duration (mn)
12
86
725
817
0060
0003
725
0270
0044
1180
1233
350
163 1180
276
163
Regardless of the specific efficiency Run3 reflects an air-rich propellant mix while Run 5 was clearly the more powerful and steam-rich propellant If 50 efficiency is a more realistic figure than 90 the only consequence is more water passing through the heater expander and recovery tank The only consequence for overall system efficiency is the slight but added work required to move the additional water by pump to the top of the water column
FEDERAL TRANSIT ADMINISTRATION 40
APPENDIX Acronyms B
BHP Boiler Horsepower
BRASH Binary Recovery Air-Steam Hybrid
BTU British Thermal Unit
CC Cubic centimeter
CFM Cubit feet per minute
CHP Combined heat and power
CNG Compressed natural gas
CO2 Carbon dioxide
CU Cubic
DARPA Defense Advanced Research Projects Agency
DGE Diesel gallon equivalent
DOT Department of Transportation
EC External combustion
EIA Energy Information Administration
EPA Environmental Protection Agency
FTA Federal Transit Administration
GGE Gasoline gallon equivalent
HP Horsepower
IC Internal combustion
K Kelvin
Kcal Kilocalorie
MPG Miles per gallon
MPH Miles per hour
OEM Original equipment manufacturer
PSI Pounds per square inch
RPM Revolutions per minute
SBIR Small Business Innovation Research
STP Standard temperature and pressure
FEDERAL TRANSIT ADMINISTRATION 41
FEDERAL TRANSIT ADMINISTRATION 128
US Department of TransportationFederal Transit AdministrationEast Building1200 New Jersey Avenue SEWashington DC 20590httpwwwftadotgovresearch
US Department of Transportation Federal Transit Administration East Building 1200 New Jersey Avenue SE Washington DC 20590 httpwwwftadotgovresearch
FEDERAL TRANSIT ADMINISTRATION 42
- Button1
- Button2
- Button3
- Button4
- Button5
- Button6
- Button7
- Button8
- Button9
- Button10
- Button11
- Button12
- Button13
- Button14
- Button15
- Button16
- Button17
- Button18
- Button19
- Button20
- Button21
- Button22
- Button23
- Button24
- Button25
- Button26
- Button27
- Button28
- Button29
- Button30
- Button31
- Button32
- Button33
- Button34
- Button35
- Button36
- Button37
- Button38
- Button39
- Button40
- Button41
- Button42
- Button43
- Button44
- Button45
- Button46
- Button47
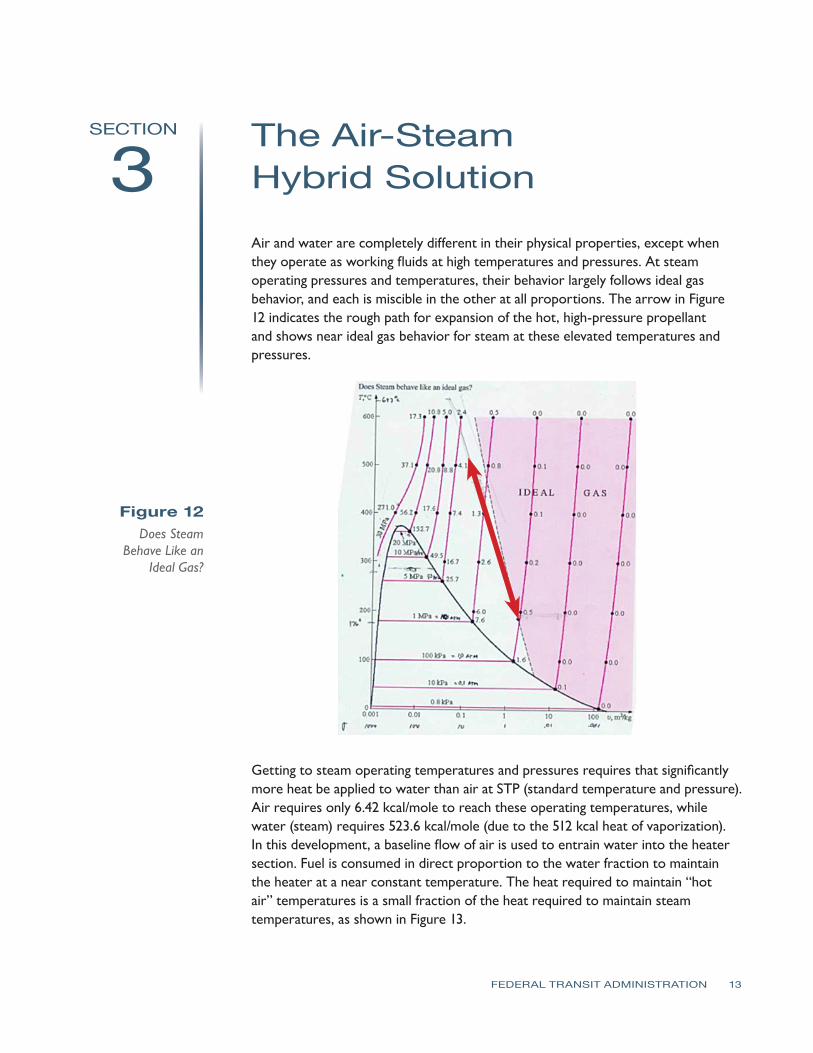
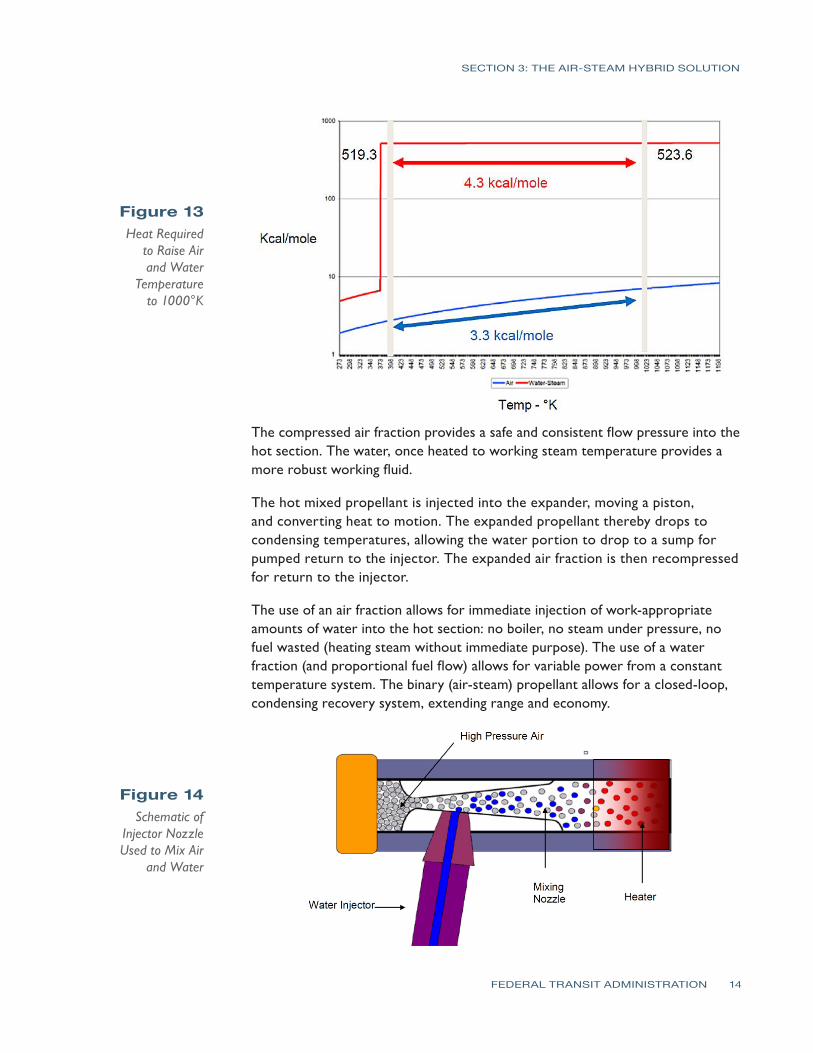
SECTION 3 THE AIR-STEAM HYBRID SOLUTION
Figure 13 Heat Required
to Raise Air and Water
Temperature to 1000degK
The compressed air fraction provides a safe and consistent flow pressure into the hot section The water once heated to working steam temperature provides a more robust working fluid
The hot mixed propellant is injected into the expander moving a piston and converting heat to motion The expanded propellant thereby drops to condensing temperatures allowing the water portion to drop to a sump for pumped return to the injector The expanded air fraction is then recompressed for return to the injector
The use of an air fraction allows for immediate injection of work-appropriate amounts of water into the hot section no boiler no steam under pressure no fuel wasted (heating steam without immediate purpose) The use of a water fraction (and proportional fuel flow) allows for variable power from a constant temperature system The binary (air-steam) propellant allows for a closed-loop condensing recovery system extending range and economy
Figure 14 Schematic of Injector Nozzle Used to Mix Air
and Water
FEDERAL TRANSIT ADMINISTRATION 14
SECTION 3 THE AIR-STEAM HYBRID SOLUTION
The sum of the process is as follows
Key start begins a modest fuel burn that immediately provides initial hot air flow through the engine
bull Depressing the accelerator increases the water fraction and fuel flow (in direct proportion)
bullThe vehicle moves forward under (airsteamfuel) power in direct proportion to wheel turn
bullThe hot mix expands and the expanded mix condenses the water fraction
bullA small parasitic load recompresses the small air fraction to reinjection pressures
bull Removing the foot from the accelerator returns the flow to hot air only sweeping residual moisture from the cylinders and preventing hydraulic lock (during next cold start)
The engine can operate on any fuel whose flow can be regulated (semi-solid liquid gas) Combustion occurs at high temperature at one atmosphere so much cleaner burning than internal combustion
Figure 15 Air-Steam Hybrid
Schematic
Accelerator regulates flow of air water and fuel to heater based on load and wheel speed Water and fuel are metered to maintain heater temperature within optimal performance band
Output demand determines air-water fraction
Any discussion of fuel efficiency relative to current IC engine technology must first re-emphasize the multi-fuel capability of EC engines In a market so dominated by one fuel customers have accepted the term ldquomiles per gallonrdquo
FEDERAL TRANSIT ADMINISTRATION 15
SECTION 3 THE AIR-STEAM HYBRID SOLUTION
as the basis for comparison But in an open market with many different fuels and widely different heat content (BTUlb) the only common and appropriate denominator is ldquomiles per dollarrdquo (closer to ldquofuel economyrdquo)
To the extent that any EC solution gains market acceptance and the market responds with new and different fuel blends the law of supply and demand dictates that fuel prices for all will drop Until then the remainder of this efficiency discussion will assume all engines require the same petroleum-based fuel
The long-accepted estimate of fuel efficiency for the IC engine is about 25 percent with the remaining 75 percent of the heat content dissipated in equal parts through the hot exhaust the radiator and mechanical losses in the engine Much has been done to raise that efficiency but what remains is one power stroke in four and a high temperature detonation whose heat content is quickly and intentionally dissipated through conduction
In sharp contrast a steam engine is designed to preserve as much heat as possible from combustion and then mete out that heat through the expansion of the working fluid Instead of a 25 percent heat loss through conduction through a radiator conductive loss is limited to 10 percent in efficient steam engines The greatest loss is through the vaporization of water to steam (at 30) yielding useful work of 35 or 40 percent higher than internal combustion Steam vehicles often report significantly lower practical fuel economies as the whole boiler is heated for a relatively short trip (another reason to avoid using a boiler)
Hot air engines involve no change of state therefore avoiding the loss associated with vaporization That can mean fuel efficiencies approaching 65 percent except as noted with the MDI engine a lower power-to-weight capability
The combination of air and steam into a single engine type is expected to yield economies between 35 and 65 percent varying with wheel load A 50 percent net efficiency would double fuel economy over a comparably-sized IC engine but as shown with the Doble and Besler examples the EC engine can be much smaller yielding even greater economies
FEDERAL TRANSIT ADMINISTRATION 16
SECTION 3 THE AIR-STEAM HYBRID SOLUTION
Figure 16 Fuel Efficiency
by Engine Type
Derivative Uses As much as this study is focused on large motive power applications it should be noted that an equally important opportunity for this technology is in stationary power applications similar in configuration to combined heat and power units referred to generally as micro-CHPs Rapid start-up high torque quiet operation and multi-fuel compatibility make it well suited to an integrated heat and electrical power installation
FEDERAL TRANSIT ADMINISTRATION 17
SECTION 3 THE AIR-STEAM HYBRID SOLUTION
Its ability to produce a full range of power options (mechanical pneumatic heat and through attached accessories electrical and hydraulic) in a small modular man-portable configuration also make it particularly well suited to temporary or tactical power requirements Although beyond the scope of the DOT goals for vehicular use this stationary power applicationrsquos potential may be strategically important in market acceptance and adoption by expanding the range of applications and thereby providing economies of scale in all aspects of development production and commercialization activities for all applications
FEDERAL TRANSIT ADMINISTRATION 18
SECTION BRASH Test Plan 4 This Phase I effort followed the Technical Objectives outlined in the proposal as follows
Practical Objectives 1 Modify the Smarttrade sized test vehicle (Figure 17) installing a 10ndash20 HP
equivalent heater a 650 cc displacement 2 HP (nominal) Quasiturbinetrade steam engine pressurized air and water tanks electronic flow regulation of air water and fuel via laptop-based LabVIEW software and solenoid valves
2 Perform test runs to validate the system operation and determine key baseline performance parameters such as
a minimum air fraction to maintain engine operation upper limits for operating temperatures maximum allowable flow rates for water (without reducing effective propellant flow at temperature)
b upper limits of vehicle speed while varying gross vehicle weight and course incline
3 Following baseline performance assessment further objectives included
a an analysis of component placement for ease of maintenance and replacement
b an estimation of comparable volumes and weights to an equivalent IC powertrain in order to verify retrofitability
c an estimation of effective fuel economy while using propane fuel on closed track mileage runs
Figure 17 Smarttrade
Car-Sized Test Vehicle
FEDERAL TRANSIT ADMINISTRATION 19
SECTION 4 BRASH TEST PLAN
4 Over the course of multiple test runs a cumulative assessment of component performance and reliability would lead to a gross verification of BRASH engine integrity and range That in turn could lead to off-site vehicle demonstrations to federal agencies potential industry partners and investors
Analytical Objectives 1 The BRASH engine model has been demonstrated only at a bench level with
rudimentary understanding of its operating principles A key objective in this vehicle build is to increase the thermodynamic modeling of this technology including an analysis of mass flow (air water fuel) and resulting power
2 Early test data would lead to analysis of specific on-vehicle capacities (for air water and fuel) and flow rates for same in order to estimate operating range recovery strategies and rates (recompression and condensation) and the parasitic loads (eg alternators pumps) to sustain useful operation for many hours
3 Over time the vehicle testing under various test conditions (eg varying gross vehicle weight wheel load engine temperature propellant mix) will lead to a body of data to support more complete modeling of water fraction vs torque vs temperature These data are essential to real-world estimation of fuel economy as this technology scales to larger practical vehicle applications
4 With the modeling from 3 in place for steady-state operation practical track runs with frequent starts and stops can further shape the model for real-world use
5 The analysis from steps 1ndash4 will provide sufficient basis for estimating the mass flow heat component capacity recovery factors and fuel economy for scaling this 2 HP test data to larger vehicles in two decade steps first to a 20 HP pickup truck and then further modeling and custom buildup of a 200 HP power plant with a DOT-identified industrial partner
6 This analytical plan is consistent with the overall SBIR program plan as the 2HP effort is confined to Phase I the 20 HP build and test plan would be accomplished in Phase II and the design and build of the 200 HP power plant would be accomplished in Phase III with an established industry partner
The work effort toward completion of these tasks has proceeded on two tracks mechanical modifications to the April test vehicle and electronic control and measurement
Mechanical Modifications and Test Configuration The test vehicle is a modified electric car about the size of a Smarttrade car Earlier modifications included removal of the electric drive train exposing a large working
FEDERAL TRANSIT ADMINISTRATION 20
SECTION 4 BRASH TEST PLAN
space behind the cab This rear space over the rear left wheel contains a 2HP Quasiturbinetrade steam engine20 selected for its compact design and suitable power range for this 700-pound vehicle The placement over the left wheel permits direct drive to that wheel via electric clutch and chain drive
Figure 18 Quasiturbinetrade
Rotary Expander Installed and Interior View
In the center of center of this rear space a heavily-modified propane space heater rated at 30000ndash80000 BTUhr (equivalent to 11ndash31 boiler horsepower [bhp]) was installed Heaters of this type generally are designed to efficiently distribute heat into an adjoining space This heater was heavily modified with high temperature insulation and outer shells to retain useful heat to the 20-ft stainless steel coil passing through its core
Figure 19 Quasiturbinetrade
Rotary Expander Installed and Interior View
the expander and heater (with recent refinements) Also visible under the heater is the pressurized water tank (painted grey) The open space to left of the heater is reserved for drive components The space to the right of the heater is reserved for recovery and recompression of the expanded propellant (Recompression is outside of the current scope to simplify the testing and analysis See discussion section for more information) Other system components include air cylinders and electronic controllers that are mounted forward of the rear firewall in the cab or under the front hood
Figure 20 shows the back of the vehicle with fenders and trim removed revealing
20Quasiturbinetrade Product Details httpquasiturbinepromciqcca
FEDERAL TRANSIT ADMINISTRATION 21
SECTION 4 BRASH TEST PLAN
Figure 20 Test Configuration
Figure 21 System Components
The main system components are shown Minor components and linkage tomechanical output are not included in this report for the sake of simplicity
Electronic Control and Measurement No realistic progress toward a vehicle demonstrator with known and regulated fuel use can proceed without electronic regulation In this build the LabVIEW program and system components from National Instruments were used to create a ldquoglass cockpitrdquo of vehicle controls and performance measurement21 The simplified schematic in Figure 22 shows the planned integration of electronics in this development LabView-compatible components will replace all mechanical flow and measurement components
21More information can be found at National Insturments The LabVIEW Environment httpwwwnicomlabview
FEDERAL TRANSIT ADMINISTRATION 22
SECTION 4 BRASH TEST PLAN
Figure 22 Electronics
Schematic for Air-Steam Hybrid
For the vehicle driver the dashboard collection of gauges has been replaced with a laptop screen similar to the one pictured in Figure 23
Figure 23 Front Screen Display for Air-Steam Hybrid
Certain features on this front screen will reflect user input (OnOff Throttle) while others reflect the dependent variables in the process (Heater Temp Fuel Flow Air and Water Flow) Shown on the bottom screen will be running time-series data on speed wheel load temperature specific fuel consumption and the other variables important to the analytical process The front screen display is generated from programming and controls on the back screen display
FEDERAL TRANSIT ADMINISTRATION 23
SECTION 4 BRASH TEST PLAN
Figure 24 Back Screen Display for Air-Steam Hybrid
LabVIEW software and controllers were chosen because of National Instrumentsrsquo status as the industry leader in rapid control prototyping and In-Vehicle data-logging solutions BKi purchased the LabVIEW componentry through the University of Connecticut Mechanical Engineering Department as part of UConnrsquos ongoing support of the project
By the end of the contract term in October 2010 the air and water regulation components were complete and operational but the fuel regulation and engine speed components were not yet fully operational To generate the most meaningful data under these circumstances the test vehicle was configured for extended operation to determine specific fuel water and air consumption rates The combination of these rates provided the basis for initial estimates of power and efficiency
Summary of Effort Mechanical Modifications
1 Removal of original electrical drive components reinforcement of frame
2 Installation of Quasiturbinetrade 2HP engine modified heater pressurized water tank all pneumatic water and fuel lines
3 Baseline validation testing using manual controls
4 Installation of electronically-regulated flow controllers
Electronic Modification 1 Acquisition of computer electronic regulators and control software
2 LabVIEW systems programming
3 System checkout
FEDERAL TRANSIT ADMINISTRATION 24
SECTION 4 BRASH TEST PLAN
Testing and Analysis 1 Static Safety Testing 2 Baseline vehicle drivetrain testing
3 Vehicle static testing (Runs 3 amp 5)
Summary of RequirementsGoals 1 Safe operation of vehicle during static and motive applications
2 Qualitative demonstration of BRASH engine capability to move test vehicle on flat and inclined road surface
3 Quantitative determination of air water and fuel consumption during timed static test
4 Quantitative determination of air water and fuel consumption while varyshying water and fuel fractions
Summary of Testing Two experiments were performed in late November the first to establish minimum fuel and propellant flow rates for sustained operation at low speed (air-rich mode) and the second to establish reasonable upper limits of fuel and propellant flow at higher engine speeds (steam-rich mode) Variation in the air-steam mix is the underlying theory of operation for the BRASH engine the air fraction provides a baseline flow for initial start-up and low-speed operation but the addition of water (as steam) to the propellant results in a significant boost in range and power These two tests have verified this underlying theory
Test Conditions The two test runs summarized in this report are 3 on November 22 2010 and 5 on November 26 2010 Both tests were performed at the Depot D campus of the University of Connecticut in Storrs The testing was performed outside in seasonal conditions 45-50degF with light winds
Figure 25 Vehicle Test Setup
FEDERAL TRANSIT ADMINISTRATION 25
SECTION 4 BRASH TEST PLAN
Each run was a dynamic test with no load on the two-cylinder Quasiturbinetrade engine The propane cylinder was suspended from a scale for the duration of the test Propane fuel consumption was monitored continuously by digital scale with a display accuracy of 001kg
Each test run lasted for the duration of one high pressure air cylinder Air cylinder start (full) and end (empty) were determined at the start and finish of each run using the same scale and accuracy Water levels initially were determined volumetrically but the results were too inconsistent Displaced volume of liquid water proved a poor measure of the quantity heated to steam and carried forward for productive work For this reason water is an estimated quantity based upon fuel quantity burned less heat absorbed by the air fraction (Further integration of the LabView controller software in the next phase will obviate this work-around)
Each of the complete test runs may be viewed at Brash Engines website httpwwwbrashenginescom Photos from each run appear in the figures that follow Tables 1 and 2 summarize the productive mass flow for air water and propane fuel to produce work from the engine for the test duration
The cab interior in Figure 26 shows the high pressure air cylinder below the steering wheel and the laptop computer (regulating propellant flow) in passenger seat space The LabView controllers reside in the protective case under the laptop
Figure 26 Vehicle Cab with Controller Laptop
During each test hot propellant was allowed to expand and vent to ambient in order to simplify the thermodynamic model and analysis (Note the plumes of water vapor from each exhaust hose and the small puddles of water under each hose in Figure 27)
FEDERAL TRANSIT ADMINISTRATION 26
SECTION 4 BRASH TEST PLAN
Figure 27 Exhaust Plumes from Expander
Development plans include recovering the expanded propellant separating into water and air phases and then recompressing the air fraction for re-use This will both improve efficiency and eliminate the visible vapor plume
Test Assumptions Another estimation used in this study is the efficiency of heat transfer for the propellant through the 20-ft coil of stainless steel inside the insulated heater Figure 28 shows an early ldquoair-onlyrdquo test run with the current heater The hose failure and melting of the steel wire mesh inside (note formed ball in the mesh) indicates 1300degK temperatures exiting the hot section
Figure 28 Hose Failure Due
to Overheating
FEDERAL TRANSIT ADMINISTRATION 27
SECTION 4 BRASH TEST PLAN
Effective heat transfer (as Figure 28 shows) does not equal efficient heat transfer but the ability to deliver 1300degK air from a well-insulated burner suggests a highly efficient transfer of heat The analysis of results assumes a value of 90 efficiency (See Appendix A for a discussion of heat transfer efficiency)
3 Low Speed Test On November 22 2010 Run 3 tested the lower operating limits of the test setup Low limit in this context meant sufficient pressure to maintain expander rotation but low steam and fuel burn The test commenced with a full air cylinder weighing 661 Kg At the end of the test the empty cylinder weighed 460 Kg Over the 7 minutes and 15 seconds of testing 006 Kg of propane was consumed
The mass of air and fuel was determined from before after run test weights As stated earlier determining the quantity of steam produced from the pressurized water tank was problematic because of the quantity of stored water the resistance to water flow under dynamic pressures and the potential for some fraction of the water (in liquid state) to be entrained in the propellant mix
To solve for this unknown the energy required to raise the known quantity of air from ambient to 1000degK (33kcalmol or 0467 BTUg) was subtracted from the energy content of the propane consumed (44 BTUg) and then the efficiency of the heat transfer process was de-rated by 10 percent to yield a net quantity of 1438 BTUs to elevate ambient temperature water to 1000degK steam The result is an estimated 125 grams of water consumed in the 7-minute test
Table 1 summarizes these data and shows a high reliance on the air fraction for the work performed by the 2 HP engine The air cylinder used in this test has a measured free volume of 45 cubic feet (1274 liters at STP) which means sustained flow rates of 62 cubic feet per minute (cfm) or 175 liters per minute In contrast the 125 grams of water passed through as steam produced an estimated equivalent gas volume of 155 liters at STP Note the modest levels of water vapor in Figure 29 Why the greater air fraction relative to water flow in this test
Air (Wt 000Kg) 661 460 201 938 1294 30 36
Water2
(Wt 000Kg)
Propane(Wt 000Kg)
Time (hrmnsc)
1562
123000
1556
123715
00125
006
00715
1438
2640
na
1983
364
na
47
86
54
90
1 Energy value based upon absorbed heat (italicized) from STP to 1000degK (0446 BTUg for Air 115 BTUg water) 2 Determined by difference from propane and air energy assumed value 90 3Arbitrary estimated efficiency of heat transfer not effective work
11222010 - 3 Low Speed Run Air Pressure 60 psi Water Head Pressure 60 psi
Component(BTU) Start End Net Energy1
(BTU) Power
(BTUmin) Power (HP) Efficiency3
Table 1 Analysis of Mass
Flow Data at Low Speed
FEDERAL TRANSIT ADMINISTRATION 28
SECTION 4 BRASH TEST PLAN
Figure 29 Low-Speed Test Results in Little
Water Vapor
In this baseline experiment the single cylinder provides 60 psi air flow and 60 psi static ldquoheadrdquo pressure on the water column The air flow from the cylinder is biased toward the generally less restrictive flow path for air The water column under the same pressure presents a higher viscosity medium passing through a greater number of valves and restrictions At the point of injection the air fraction flows more freely into the hot section In order to bias the mix toward greater water fraction (and greater power) the head pressure on the water column must be increased over the 60 psi air line pressure
Run 4 (not documented here) evaluated head pressures from 110 psi to 70 psi and determined that modest differential pressures retarded the flow from the air fraction and boosted flow of the water fraction Still higher differential pressures effectively stopped air flow altogether reverting the engine operation to ldquosteam onlyrdquo For Run 5 an additional cylinder was used to apply a 70 psi static head pressure on the water column a 10 psi differential over the 60 psi air line pressure
5 Variable High Speed Test On November 26 2010 Run 5 tested the higher differential water pressure as a means to increase the effective water fraction in the propellant mix The test commenced with a full air cylinder weighing 654 Kg At the end of the test the empty cylinder weighed 472 Kg Run 5 was interrupted after 243 minutes to refill the water tank and then testing resumed for an additional 907 minutes Over the whole test 027 Kg of propane was consumed
Using the same analytical basis as Test 3 Test 5 data indicate a substantial increase in work capacity (as measured by fuel consumed and steam generated) over the 3 baseline
FEDERAL TRANSIT ADMINISTRATION 29
112610 - 5 Variable High Speed Run Air Pressure 60 psi Water Head Pressure 70 psi
Air (Wt 000Kg)
Component(BTU) Start End Net Energy1
(BTU) Power
(BTUmin) Power (HP) Efficiency3
654 472 182 849 718 17 7
SECTION 4 BRASH TEST PLAN
Table 3 Comparison of Mass Flows
Water 588 Runs 3 and 5
163 Duration (mn) 725 1180 725 1180 163
Air
Component Run 3 BHP
Run 5 BHP
Net ChngBHP
Run 5 Mass
Transfer (kg)
Net ChangeMass
Transfer (kg)
30 17
197
237
-45 2010 182 -9
Run 3 Mass
Transfer (kg)
276 350
47
86
422
0060
0013
0270
0086
Propane
This difference in steam fraction and power is more clearly seen in Figure 30 (and on the source video at the Brash Engines website)
Figure 30 Three Images from Run 5
Table 2 Test 5 Results with Increased
Water and Fuel Water2
(Wt 000Kg) 0860 9890 8358 197 83
Propane(Wt 000Kg) 1520 1493 27 11880 1004 237 90
Time (hrmnsc) 133000 134150 01150 na na na na
1 Energy value based upon absorbed heat (italics) from STP to 1000degK (0446 BTUg for Air 115 BTUg water) Underlined value is released heat at generally accepted 44 BTUg 2 Determined by difference from propane and air Energy assumed value 90 3 Arbitrary estimated efficiency of heat transfer not effective work
The increase in pressure on the water column by 10 psi reduced air flow by 9 percent but increased the steam fraction considerably and thereby increased the effective boiler horsepower nearly three-fold to 237 bhp (assuming 90 heat transfer) These data are summarized in Table 3
FEDERAL TRANSIT ADMINISTRATION 30
SECTION 4 BRASH TEST PLAN
As with Run 3 start up from Time Zero was immediate burner on air flow begins and water flow under pressure commences immediately Another impressive feature of the mix air-steam propellant system is the ability to start stop and rapidly accelerate as shown in the full Run 5 video Run 5 serves as validation that this patented technology has unique performance benefits over air steam or internal combustion alone
Lessons Learned A comparison of the two test runs verifies some key points
1 The same power plant can produce variable power and fuel economy based upon power demand and airsteam mix
2 Although imprecise at this point in testing fuel consumption appears directly proportional to engine speed The engineexpander will spool up spool down stop and restart in a manner consistent with fuel and propellant flow The Run 5 video on the Brash Engines website verifies this conclusion
3 The use of a defined static air pressure ldquoheadrdquo over the water column at a pressure higher than the defined air line dynamic pressure provides a safe and predictable bias toward flow from the water fraction
4 Although the current test configuration offers sufficient performance for this initial demonstration phase the following observations are in order
a The heater path is too long creating latent response issues
b The airwater injector is not optimized for proper mix or flow capacity
c The incomplete integration of LabVIEW compromises the quality of data
d The absence of a measured variable load on the expander compromises any analysis of power and fuel economy
5 The design migration to a vehicle installation was premature The project should move back to a lab bench study to refine the regulation of components complete the recovery and recompression portions of the system and use electromechanical loads to estimate power and useful work for specific quantities of fuel water and air
6 The Quasiturbinetrade engine technology is promising but too immature for larger-scale modeling Later phases of the project should rely on more conventional multi-cylinder piston-type expander
Estimated Fuel Economy Mass transit authorities have relied on large diesel engines such as the Detroit Diesel Series 50 and Series 60 engines for more than 30 years Reports on fuel economy vary from a high of 60 miles per gallon (Diesel) for longer-range
FEDERAL TRANSIT ADMINISTRATION 31
SECTION 4 BRASH TEST PLAN
commuter services in California23 to a low of 228 miles per gallon (Diesel) for city buses with frequent stops in New York City24 In both cited studies the migration to compressed natural gas (CNG) has resulted in lower fuel economies on a Diesel Gallon Equivalent (DGE) basis
Table 4 summarizes this study (columns 2 and 3) and the next proposed phase (columns 4 and 5) the performance of the current fleet of mass transit buses (columns 6 and 7) and the likely outcome if the Besler engine (described earlier) were employed with the air-steam hybrid technology (columns 8 and 9)
Table 4 Comparison of
Fuel Economies
Air
1
Configuration
Engine
HP
Torque
Fuel
gmin
BTUhr
GGEhr
mpg 60mph
GGE100 mi
$ per GGE
$100 mi
Current
Example
2
3
3
5
4
Bench
5
S-10
6
SB Bus
7
NYCT
8
50 eff
9
30 eff
86
Quasi
2
Prop
82
216
02
3160
03
30
09
Current
237
Quasi
2
Prop
23
607
05
1126
09
30
27
UC 1
40
6 cyl
20
Prop
40
1056
09
648
15
30
46
UC 2
80
6 cyl
40
Mix
80
2112
19
324
31
30
93
MCI102
DD S60
350
1450
Diesel
540
11400
100
60
167
35
583
Diesel
23
439
35
1535
300
Besler
150
1200
Mix
300
792
695
864
1158
16
1853
500
Besler
150
1200
Mix
500
1320
1158
518
1930
16
3088
The Besler engine is shown in two columns The left column reflects the higher efficiency anticipated with the air-steam hybrid mix described earlier as at or near 50 percent The right column reflects the historical efficiency realized with steam engine technology The italicized numbers near the bottom of the column show that even at historical efficiencies the Besler engine would offer equal or better Gasoline Gallon Equivalent (GGE)100 mile ratings of the current diesel technology but migrating toward less refined and (therefore) less expensive fuels would significantly reduce the operating cost ($mile)
23Demonstration of Caterpillar C-10 Dual-Fuel Engines in MCI 102DL3 Commuter Buses National Renewable Energy Laboratory httpwwwnrelgovdocsfy00osti26758pdf p 7 24R Barnitt ldquoNew York City Transit (NYCT) Hybrid (125 Order) and CNG Transit Buses Final Evaluation Resultsrdquo November 2006 National Renewable Energy Laboratory K Chandler Battelle Technical Report NRELTP-540-40125 November 2006 httpwwwnrelgovvehiclesandfuelsfleettestpdfs40125pdf pvii
FEDERAL TRANSIT ADMINISTRATION 32
SECTION 4 BRASH TEST PLAN
There are of course two orders of magnitude difference between the results of Runs 3 and 5 and the daily demands of city and commuter buses but the mere existence of the Besler Twin and the Brooks V-8 400 HP engine suggests an opportunity for fuel economy and fuel variety
Proposed further support for the next phase of development will advance the air-steam hybrid technology by an important order of magnitude This would provide the data confidence to scale to larger vehicle operation and garner the interest of one or more engine or vehicle OEMs
Figure 31 MTANew York City
Transit Orion VII Next Generation
Hybrid Transit Bus
Next Development Phase The next phase of development will incorporate a modern six-cylinder steam engine design with a displacement of 53 cubic inches and capable of sustained 15-25 HP operation The expander will be supplied by Steam Engine Power Inc (httpwwwsteamenginepowercom) This expander will drive an alternator generator to measure effective work output in watts as well as provide sufficient power to satisfy the system parasitic loads of battery recharge exhaust air recompression and all other pump and valve operations
Figure 32 (l to r) Six-Cylinder Expander Power Generation Load
Small 24 VDC Compressor
FEDERAL TRANSIT ADMINISTRATION 33
SECTION 4 BRASH TEST PLAN
Static pressure for the water column will still be supplied via compressed air cylinder but the dynamic air flow will be supplied by an oil-less air compressor of the size and type shown This 24 VDC compressor will recompress the recovered air exiting the expander to 40ndash60 psi pressure and support flows of 3ndash4 cubic feet per minute (cfm) These three components are off-the-shelf enhancements to the system but custom engineering of a new more powerful and more responsive heater completion of the electronic integration and design and fabrication of the recoveryrecompression components are necessary tasks that must be included to make the next generation assembly work to its potential This work will be accomplished largely by Mechanical and Electrical Engineering students at the University of Connecticut under the supervision of faculty and Brash Engines personnel
When this build is complete all operations will be under LabVIEW control All expander operations will be measured for power and work Once the bench version is in control a modified version will be installed in a small pickup truck (eg Chevrolet S-10) for further verification of system performance and robustness
During this phase a new and promising technology will be investigated a new and faster class of solenoid valves from National Instruments These solenoid valves with an unprecedented 3 msec response time have the potential of allowing air-steam retrofit in existing engine blocks The solenoid valves could replace the spark plugs in conventional IC engines and provide the equivalent timed injection of hot propellant mix as the timed firing of a spark plug in the presence of a fuel air mix
If possible these fast solenoids and the black box programming to control them could allow very easy portability to larger vehicles and easier retrofit Potentially a V-6 engine could operate 4 cylinders for expansion and the remaining two cylinders could be used as direct drive compressors with different but equivalent solenoid valves controlling the compression process
FEDERAL TRANSIT ADMINISTRATION 34
SECTION Development Plan 5 and Next Steps
This current effort is a key first-proof of concept for this air-steam hybrid technology but our goals extend well beyond this two-seat 2 HP demonstrator The lessons learned in electronic integration will allow rapid migration to larger platforms using the same basic controls but scaling the expander heater and other mass-flow components to vehicle-appropriate size That project identified as ldquo20 HP Vehiclerdquo and other near-term derivative projects are listed in Table 5
BRASH Project
ProposedFunding Source
Funds Reqd $K Project Description
SUV-size proof-of-concept for reliable 20 HP Vehicle DOTUSPS 300 highway performance maildelivery
vehicle size
Proof-of-concept mass transit busshy200 HP Vehicle DOTDOD 600 retrofit scaled to city bus capacity and
suitable for replacement of over-the-road diesel engines
Table 5 Project Funding
Stationary Power Unit Micro-CHP Equivalent
DARPA 300 Proof-of-concept mass transit bus-retrofit scaled to city bus capacity and suitable for replacement of over-the-road diesel engines
Summary Alternative Processed Solid Fuel DOE EPA DOA 600
Processed mix of hydrolyzed wood pulp processed solid waste and other combustible solids in an extrudable mass with alcohol solutevehiclemdashdemonstrate utility in vehicles as a high energy content clean burning fuel for EC engines
Demonstrate effective pyrolysis of
Binary Solid Gas Fuel
EPA Waste Management BFI
400 processed solid fuels in a binary fuel burner conventional fuel (gasoline natural gas) provides primary heat source for pyrolysis temperatures
Proof of Concept OEM Power Plant
Vehicle OEM (eg Ford GM Caterpillar) 1200
Development of direct replacement BRASH engine alternative to existing OEM IC engine
Black Box Integration of Controller Software
Vehicle OEM (eg Ford GM Caterpillar)
1600 Development of commercial BRASH system alternative to existing OEM IC engine
FEDERAL TRANSIT ADMINISTRATION 35
SECTION 5 DEVELOPMENT PLAN AND NEXT STEPS
The issuance of US Patent 7743872 five months ago has two important consequences for this project First it serves to validate the underlying technology the combination of air and steam in an EC engine is better than steam or air alone Second it provides a basis for full and open discussions with government agencies and large commercial interests in the transportation and power sectors
Our efforts at promotion have been delayed pending successful demonstration of the Smarttrade car vehicle to allow the first detailed real-world performance data to be distributed
Coupling that performance data with the option of migration away from refined petroleum should spark significant interest If we can move to a high lignin-processed wood pulp that costs $045 per gasoline gallon equivalent (an arbitrary value for example only) and consumes more CO2 while growing than is consumed in processing as a fuel and produced from combustion then we succeed as a project and as a global game-changing technology for many uses Improvements in fuel economy are important but of greater importance is the migration to low-process biomass fuels
FEDERAL TRANSIT ADMINISTRATION 36
SECTION Potential Applications and Societal Value 6 The whole premise behind the BRASH air steam hybrid is that external combustion offers a more benign and environmentally-appropriate way to power large vehicles and other portable equipment than refined petroleum-powered internal combustion
bullCombustion heat can be derived from any fuel source including processed solids from fast-growing renewables such as poplar trees waste corn stalks or switch grass
bullThat combustion heat is applied at a rate consistent with the work to be done and not to support idling and other unproductive fuel use
Using a mix of air and steam as working fluids in the engine allows
bullImmediate startup from an ldquoair-onlyrdquo start
bull Managed system pressure through use of a defined head air pressure
bullManaged fuel burn as the air-steam fraction is adjusted to match wheel load
bullAdjusted wheel load reduces fuel burn
Integration of modern control circuitry with external combustion also brings a level of performance operational simplicity and safety heretofore unavailable
FEDERAL TRANSIT ADMINISTRATION 37
SECTION
7 Phase I Conclusions
The last steam train in scheduled service in the US departed on October 11 196225 One year earlier Robert Noyce received the first patent for an integrated circuit26 But for that brief one-year overlap the most powerful motive power technology was never harnessed by the black box controls that grew out of Noycersquos invention so the diesel-powered IC engine championed by Henry Ford won out
Now nearly 50 years later the modern IC engine cannot operate efficiently without the benefit of black box electronicsmdashbut that technology still presents intractable challenges of supply safety and environmental impact The air-steam hybrid technology may offer an alternative and a glimpse of that potential is presented here and viewable in Run 5 on the Brash Engines website at http wwwbrashenginescom
While demonstration in a test vehicle provides a strong visual message that BRASH technology works the commercial success of this technology will depend upon reliable repeatable measurement of power and economy For that data the Phase 2 effort will require a return to laboratory bench testing and effective demonstration of recovery of the water and air fractions
The results of this Phase I project collectively demonstrate the technical feasibility and commercial potential of the BRASH air-steam hybrid engine technology The initial DOT SBIR funding has been highly effective in facilitating this important proof of concept and laying the groundwork for further technology refinement and application
As described earlier the next steps are clear and appear to combine achievable and rapid major advances with low developmental risk SBIR Phase 2 support is needed for those advances due to the still-early stage of development that restricts access to private capital
The immense potential value of this technology has been enhanced and verified in Phase 1 there is now a clear and low-risk path ahead to larger-scale testing further component and controls refinement specific applications prototyping and pre-commercial deployments
25William Rosen The Most Powerful Idea in the World Random House 2010 p 311 26US Patent 2981877
FEDERAL TRANSIT ADMINISTRATION 38
APPENDIX
A Heat Transfer Efficiency Modeling Runs 3 and 5 50 and 90
Much of the analysis for Runs 3 and 5 is based on an assumed efficiency of 90 for heat transfer from the combustion of propane to heating of the water air mix in the coil As a test for the reasonableness of that assumption the same data have been modeled at a much lower 50 factor below
112210 - 3 Low Speed Run Air Pressure 60 psi Water head pressure 60 psi
Water2 00440 5060 4276 101 43 (Wt 000Kg)
Propane 152 1493 237 50 27 11880 1004 (Wt 000Kg)
Time 133000 134150 01150 na na na na (hrmnsc)
1 Energy value based upon absorbed heat (italics) from STP to 1000degK (0446 BTUg for Air 115 BTUg water) Underlined value is released heat at generally accepted 44 BTUg
Air (Wt 000Kg)
Component(BTU) Start Wt End Wt Net Wt Energy1
(BTU) Power
(BTUmin) Power (HP) Efficiency3
661 460 201 938 1294 30 36
Water2
(Wt 000Kg)
Propane(Wt 000Kg)
Time (hrmnsc)
1562
123000
1556
123715
00125
006
00715
380
2640
na
523
364
na
12
86
14
50
na na
Air (Wt 000Kg)
Component(BTU) Start Wt
5 Variable High Speed Run Air Pressure 60 psi Water head pressure 70 psi
End Wt Net Wt Energy1
(BTU) Power
(BTUmin) Power (HP) Efficiency3
654 472 182 849 718 17 7
2 Determined by difference from Propane and Air Energy assumed value 90 3 Arbitrary estimated efficiency of heat transfer not effective work
The two known quantities in each run is the weight of the air moving through the system and the weight of the propane heating that air The variable is the quantity of water heated to steam temperatures and above In Run 3 at 90 efficiency that mass of water calculates to 125 grams at 50 it drops to 33 grams In Run 5 at 90 efficiency that mass of water calculates to 86 grams at 50 it drops to 44 grams
FEDERAL TRANSIT ADMINISTRATION 39
APPENDIX A HEAT TRANSFER EFFICIENCY MODELING RUNS 3 AND 5 50 AND 90
As the comparison tables below show the uncertainty in the efficiency of heat transfer is manifest only in the mass of water heated to steam to do useful work
Data 90 Efficiency
Air
Component Run 3 BHP
Run 5 BHP
Net ChngBHP
-45
Run 3 Mass
Transfer (kg)
Run 5 Mass
Transfer (kg)
Net ChangeMass
Transfer (kg)
30 17
197
237
2010 182 -9
Water
Propane
Duration (mn)
47
86
725
422
0060
0013
725
0270
0086
1180
588
350
163 1180
276
163
Data 50 Efficiency
Air
Component Run 3 BHP
Run 5 BHP
Net ChngBHP
-45
Run 3 Mass
Transfer (kg)
Run 5 Mass
Transfer (kg)
Net ChangeMass
Transfer (kg)
30 17
101
237
2010 182 -9
Water
Propane
Duration (mn)
12
86
725
817
0060
0003
725
0270
0044
1180
1233
350
163 1180
276
163
Regardless of the specific efficiency Run3 reflects an air-rich propellant mix while Run 5 was clearly the more powerful and steam-rich propellant If 50 efficiency is a more realistic figure than 90 the only consequence is more water passing through the heater expander and recovery tank The only consequence for overall system efficiency is the slight but added work required to move the additional water by pump to the top of the water column
FEDERAL TRANSIT ADMINISTRATION 40
APPENDIX Acronyms B
BHP Boiler Horsepower
BRASH Binary Recovery Air-Steam Hybrid
BTU British Thermal Unit
CC Cubic centimeter
CFM Cubit feet per minute
CHP Combined heat and power
CNG Compressed natural gas
CO2 Carbon dioxide
CU Cubic
DARPA Defense Advanced Research Projects Agency
DGE Diesel gallon equivalent
DOT Department of Transportation
EC External combustion
EIA Energy Information Administration
EPA Environmental Protection Agency
FTA Federal Transit Administration
GGE Gasoline gallon equivalent
HP Horsepower
IC Internal combustion
K Kelvin
Kcal Kilocalorie
MPG Miles per gallon
MPH Miles per hour
OEM Original equipment manufacturer
PSI Pounds per square inch
RPM Revolutions per minute
SBIR Small Business Innovation Research
STP Standard temperature and pressure
FEDERAL TRANSIT ADMINISTRATION 41
FEDERAL TRANSIT ADMINISTRATION 128
US Department of TransportationFederal Transit AdministrationEast Building1200 New Jersey Avenue SEWashington DC 20590httpwwwftadotgovresearch
US Department of Transportation Federal Transit Administration East Building 1200 New Jersey Avenue SE Washington DC 20590 httpwwwftadotgovresearch
FEDERAL TRANSIT ADMINISTRATION 42
- Button1
- Button2
- Button3
- Button4
- Button5
- Button6
- Button7
- Button8
- Button9
- Button10
- Button11
- Button12
- Button13
- Button14
- Button15
- Button16
- Button17
- Button18
- Button19
- Button20
- Button21
- Button22
- Button23
- Button24
- Button25
- Button26
- Button27
- Button28
- Button29
- Button30
- Button31
- Button32
- Button33
- Button34
- Button35
- Button36
- Button37
- Button38
- Button39
- Button40
- Button41
- Button42
- Button43
- Button44
- Button45
- Button46
- Button47
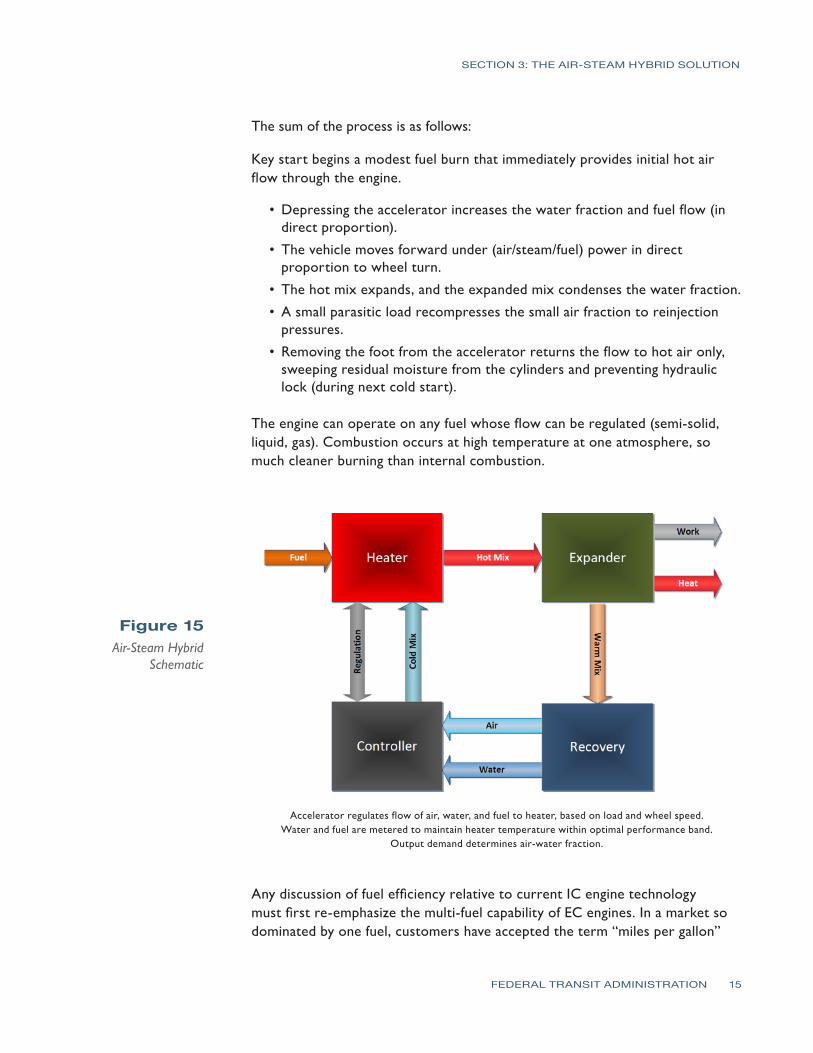
SECTION 3 THE AIR-STEAM HYBRID SOLUTION
The sum of the process is as follows
Key start begins a modest fuel burn that immediately provides initial hot air flow through the engine
bull Depressing the accelerator increases the water fraction and fuel flow (in direct proportion)
bullThe vehicle moves forward under (airsteamfuel) power in direct proportion to wheel turn
bullThe hot mix expands and the expanded mix condenses the water fraction
bullA small parasitic load recompresses the small air fraction to reinjection pressures
bull Removing the foot from the accelerator returns the flow to hot air only sweeping residual moisture from the cylinders and preventing hydraulic lock (during next cold start)
The engine can operate on any fuel whose flow can be regulated (semi-solid liquid gas) Combustion occurs at high temperature at one atmosphere so much cleaner burning than internal combustion
Figure 15 Air-Steam Hybrid
Schematic
Accelerator regulates flow of air water and fuel to heater based on load and wheel speed Water and fuel are metered to maintain heater temperature within optimal performance band
Output demand determines air-water fraction
Any discussion of fuel efficiency relative to current IC engine technology must first re-emphasize the multi-fuel capability of EC engines In a market so dominated by one fuel customers have accepted the term ldquomiles per gallonrdquo
FEDERAL TRANSIT ADMINISTRATION 15
SECTION 3 THE AIR-STEAM HYBRID SOLUTION
as the basis for comparison But in an open market with many different fuels and widely different heat content (BTUlb) the only common and appropriate denominator is ldquomiles per dollarrdquo (closer to ldquofuel economyrdquo)
To the extent that any EC solution gains market acceptance and the market responds with new and different fuel blends the law of supply and demand dictates that fuel prices for all will drop Until then the remainder of this efficiency discussion will assume all engines require the same petroleum-based fuel
The long-accepted estimate of fuel efficiency for the IC engine is about 25 percent with the remaining 75 percent of the heat content dissipated in equal parts through the hot exhaust the radiator and mechanical losses in the engine Much has been done to raise that efficiency but what remains is one power stroke in four and a high temperature detonation whose heat content is quickly and intentionally dissipated through conduction
In sharp contrast a steam engine is designed to preserve as much heat as possible from combustion and then mete out that heat through the expansion of the working fluid Instead of a 25 percent heat loss through conduction through a radiator conductive loss is limited to 10 percent in efficient steam engines The greatest loss is through the vaporization of water to steam (at 30) yielding useful work of 35 or 40 percent higher than internal combustion Steam vehicles often report significantly lower practical fuel economies as the whole boiler is heated for a relatively short trip (another reason to avoid using a boiler)
Hot air engines involve no change of state therefore avoiding the loss associated with vaporization That can mean fuel efficiencies approaching 65 percent except as noted with the MDI engine a lower power-to-weight capability
The combination of air and steam into a single engine type is expected to yield economies between 35 and 65 percent varying with wheel load A 50 percent net efficiency would double fuel economy over a comparably-sized IC engine but as shown with the Doble and Besler examples the EC engine can be much smaller yielding even greater economies
FEDERAL TRANSIT ADMINISTRATION 16
SECTION 3 THE AIR-STEAM HYBRID SOLUTION
Figure 16 Fuel Efficiency
by Engine Type
Derivative Uses As much as this study is focused on large motive power applications it should be noted that an equally important opportunity for this technology is in stationary power applications similar in configuration to combined heat and power units referred to generally as micro-CHPs Rapid start-up high torque quiet operation and multi-fuel compatibility make it well suited to an integrated heat and electrical power installation
FEDERAL TRANSIT ADMINISTRATION 17
SECTION 3 THE AIR-STEAM HYBRID SOLUTION
Its ability to produce a full range of power options (mechanical pneumatic heat and through attached accessories electrical and hydraulic) in a small modular man-portable configuration also make it particularly well suited to temporary or tactical power requirements Although beyond the scope of the DOT goals for vehicular use this stationary power applicationrsquos potential may be strategically important in market acceptance and adoption by expanding the range of applications and thereby providing economies of scale in all aspects of development production and commercialization activities for all applications
FEDERAL TRANSIT ADMINISTRATION 18
SECTION BRASH Test Plan 4 This Phase I effort followed the Technical Objectives outlined in the proposal as follows
Practical Objectives 1 Modify the Smarttrade sized test vehicle (Figure 17) installing a 10ndash20 HP
equivalent heater a 650 cc displacement 2 HP (nominal) Quasiturbinetrade steam engine pressurized air and water tanks electronic flow regulation of air water and fuel via laptop-based LabVIEW software and solenoid valves
2 Perform test runs to validate the system operation and determine key baseline performance parameters such as
a minimum air fraction to maintain engine operation upper limits for operating temperatures maximum allowable flow rates for water (without reducing effective propellant flow at temperature)
b upper limits of vehicle speed while varying gross vehicle weight and course incline
3 Following baseline performance assessment further objectives included
a an analysis of component placement for ease of maintenance and replacement
b an estimation of comparable volumes and weights to an equivalent IC powertrain in order to verify retrofitability
c an estimation of effective fuel economy while using propane fuel on closed track mileage runs
Figure 17 Smarttrade
Car-Sized Test Vehicle
FEDERAL TRANSIT ADMINISTRATION 19
SECTION 4 BRASH TEST PLAN
4 Over the course of multiple test runs a cumulative assessment of component performance and reliability would lead to a gross verification of BRASH engine integrity and range That in turn could lead to off-site vehicle demonstrations to federal agencies potential industry partners and investors
Analytical Objectives 1 The BRASH engine model has been demonstrated only at a bench level with
rudimentary understanding of its operating principles A key objective in this vehicle build is to increase the thermodynamic modeling of this technology including an analysis of mass flow (air water fuel) and resulting power
2 Early test data would lead to analysis of specific on-vehicle capacities (for air water and fuel) and flow rates for same in order to estimate operating range recovery strategies and rates (recompression and condensation) and the parasitic loads (eg alternators pumps) to sustain useful operation for many hours
3 Over time the vehicle testing under various test conditions (eg varying gross vehicle weight wheel load engine temperature propellant mix) will lead to a body of data to support more complete modeling of water fraction vs torque vs temperature These data are essential to real-world estimation of fuel economy as this technology scales to larger practical vehicle applications
4 With the modeling from 3 in place for steady-state operation practical track runs with frequent starts and stops can further shape the model for real-world use
5 The analysis from steps 1ndash4 will provide sufficient basis for estimating the mass flow heat component capacity recovery factors and fuel economy for scaling this 2 HP test data to larger vehicles in two decade steps first to a 20 HP pickup truck and then further modeling and custom buildup of a 200 HP power plant with a DOT-identified industrial partner
6 This analytical plan is consistent with the overall SBIR program plan as the 2HP effort is confined to Phase I the 20 HP build and test plan would be accomplished in Phase II and the design and build of the 200 HP power plant would be accomplished in Phase III with an established industry partner
The work effort toward completion of these tasks has proceeded on two tracks mechanical modifications to the April test vehicle and electronic control and measurement
Mechanical Modifications and Test Configuration The test vehicle is a modified electric car about the size of a Smarttrade car Earlier modifications included removal of the electric drive train exposing a large working
FEDERAL TRANSIT ADMINISTRATION 20
SECTION 4 BRASH TEST PLAN
space behind the cab This rear space over the rear left wheel contains a 2HP Quasiturbinetrade steam engine20 selected for its compact design and suitable power range for this 700-pound vehicle The placement over the left wheel permits direct drive to that wheel via electric clutch and chain drive
Figure 18 Quasiturbinetrade
Rotary Expander Installed and Interior View
In the center of center of this rear space a heavily-modified propane space heater rated at 30000ndash80000 BTUhr (equivalent to 11ndash31 boiler horsepower [bhp]) was installed Heaters of this type generally are designed to efficiently distribute heat into an adjoining space This heater was heavily modified with high temperature insulation and outer shells to retain useful heat to the 20-ft stainless steel coil passing through its core
Figure 19 Quasiturbinetrade
Rotary Expander Installed and Interior View
the expander and heater (with recent refinements) Also visible under the heater is the pressurized water tank (painted grey) The open space to left of the heater is reserved for drive components The space to the right of the heater is reserved for recovery and recompression of the expanded propellant (Recompression is outside of the current scope to simplify the testing and analysis See discussion section for more information) Other system components include air cylinders and electronic controllers that are mounted forward of the rear firewall in the cab or under the front hood
Figure 20 shows the back of the vehicle with fenders and trim removed revealing
20Quasiturbinetrade Product Details httpquasiturbinepromciqcca
FEDERAL TRANSIT ADMINISTRATION 21
SECTION 4 BRASH TEST PLAN
Figure 20 Test Configuration
Figure 21 System Components
The main system components are shown Minor components and linkage tomechanical output are not included in this report for the sake of simplicity
Electronic Control and Measurement No realistic progress toward a vehicle demonstrator with known and regulated fuel use can proceed without electronic regulation In this build the LabVIEW program and system components from National Instruments were used to create a ldquoglass cockpitrdquo of vehicle controls and performance measurement21 The simplified schematic in Figure 22 shows the planned integration of electronics in this development LabView-compatible components will replace all mechanical flow and measurement components
21More information can be found at National Insturments The LabVIEW Environment httpwwwnicomlabview
FEDERAL TRANSIT ADMINISTRATION 22
SECTION 4 BRASH TEST PLAN
Figure 22 Electronics
Schematic for Air-Steam Hybrid
For the vehicle driver the dashboard collection of gauges has been replaced with a laptop screen similar to the one pictured in Figure 23
Figure 23 Front Screen Display for Air-Steam Hybrid
Certain features on this front screen will reflect user input (OnOff Throttle) while others reflect the dependent variables in the process (Heater Temp Fuel Flow Air and Water Flow) Shown on the bottom screen will be running time-series data on speed wheel load temperature specific fuel consumption and the other variables important to the analytical process The front screen display is generated from programming and controls on the back screen display
FEDERAL TRANSIT ADMINISTRATION 23
SECTION 4 BRASH TEST PLAN
Figure 24 Back Screen Display for Air-Steam Hybrid
LabVIEW software and controllers were chosen because of National Instrumentsrsquo status as the industry leader in rapid control prototyping and In-Vehicle data-logging solutions BKi purchased the LabVIEW componentry through the University of Connecticut Mechanical Engineering Department as part of UConnrsquos ongoing support of the project
By the end of the contract term in October 2010 the air and water regulation components were complete and operational but the fuel regulation and engine speed components were not yet fully operational To generate the most meaningful data under these circumstances the test vehicle was configured for extended operation to determine specific fuel water and air consumption rates The combination of these rates provided the basis for initial estimates of power and efficiency
Summary of Effort Mechanical Modifications
1 Removal of original electrical drive components reinforcement of frame
2 Installation of Quasiturbinetrade 2HP engine modified heater pressurized water tank all pneumatic water and fuel lines
3 Baseline validation testing using manual controls
4 Installation of electronically-regulated flow controllers
Electronic Modification 1 Acquisition of computer electronic regulators and control software
2 LabVIEW systems programming
3 System checkout
FEDERAL TRANSIT ADMINISTRATION 24
SECTION 4 BRASH TEST PLAN
Testing and Analysis 1 Static Safety Testing 2 Baseline vehicle drivetrain testing
3 Vehicle static testing (Runs 3 amp 5)
Summary of RequirementsGoals 1 Safe operation of vehicle during static and motive applications
2 Qualitative demonstration of BRASH engine capability to move test vehicle on flat and inclined road surface
3 Quantitative determination of air water and fuel consumption during timed static test
4 Quantitative determination of air water and fuel consumption while varyshying water and fuel fractions
Summary of Testing Two experiments were performed in late November the first to establish minimum fuel and propellant flow rates for sustained operation at low speed (air-rich mode) and the second to establish reasonable upper limits of fuel and propellant flow at higher engine speeds (steam-rich mode) Variation in the air-steam mix is the underlying theory of operation for the BRASH engine the air fraction provides a baseline flow for initial start-up and low-speed operation but the addition of water (as steam) to the propellant results in a significant boost in range and power These two tests have verified this underlying theory
Test Conditions The two test runs summarized in this report are 3 on November 22 2010 and 5 on November 26 2010 Both tests were performed at the Depot D campus of the University of Connecticut in Storrs The testing was performed outside in seasonal conditions 45-50degF with light winds
Figure 25 Vehicle Test Setup
FEDERAL TRANSIT ADMINISTRATION 25
SECTION 4 BRASH TEST PLAN
Each run was a dynamic test with no load on the two-cylinder Quasiturbinetrade engine The propane cylinder was suspended from a scale for the duration of the test Propane fuel consumption was monitored continuously by digital scale with a display accuracy of 001kg
Each test run lasted for the duration of one high pressure air cylinder Air cylinder start (full) and end (empty) were determined at the start and finish of each run using the same scale and accuracy Water levels initially were determined volumetrically but the results were too inconsistent Displaced volume of liquid water proved a poor measure of the quantity heated to steam and carried forward for productive work For this reason water is an estimated quantity based upon fuel quantity burned less heat absorbed by the air fraction (Further integration of the LabView controller software in the next phase will obviate this work-around)
Each of the complete test runs may be viewed at Brash Engines website httpwwwbrashenginescom Photos from each run appear in the figures that follow Tables 1 and 2 summarize the productive mass flow for air water and propane fuel to produce work from the engine for the test duration
The cab interior in Figure 26 shows the high pressure air cylinder below the steering wheel and the laptop computer (regulating propellant flow) in passenger seat space The LabView controllers reside in the protective case under the laptop
Figure 26 Vehicle Cab with Controller Laptop
During each test hot propellant was allowed to expand and vent to ambient in order to simplify the thermodynamic model and analysis (Note the plumes of water vapor from each exhaust hose and the small puddles of water under each hose in Figure 27)
FEDERAL TRANSIT ADMINISTRATION 26
SECTION 4 BRASH TEST PLAN
Figure 27 Exhaust Plumes from Expander
Development plans include recovering the expanded propellant separating into water and air phases and then recompressing the air fraction for re-use This will both improve efficiency and eliminate the visible vapor plume
Test Assumptions Another estimation used in this study is the efficiency of heat transfer for the propellant through the 20-ft coil of stainless steel inside the insulated heater Figure 28 shows an early ldquoair-onlyrdquo test run with the current heater The hose failure and melting of the steel wire mesh inside (note formed ball in the mesh) indicates 1300degK temperatures exiting the hot section
Figure 28 Hose Failure Due
to Overheating
FEDERAL TRANSIT ADMINISTRATION 27
SECTION 4 BRASH TEST PLAN
Effective heat transfer (as Figure 28 shows) does not equal efficient heat transfer but the ability to deliver 1300degK air from a well-insulated burner suggests a highly efficient transfer of heat The analysis of results assumes a value of 90 efficiency (See Appendix A for a discussion of heat transfer efficiency)
3 Low Speed Test On November 22 2010 Run 3 tested the lower operating limits of the test setup Low limit in this context meant sufficient pressure to maintain expander rotation but low steam and fuel burn The test commenced with a full air cylinder weighing 661 Kg At the end of the test the empty cylinder weighed 460 Kg Over the 7 minutes and 15 seconds of testing 006 Kg of propane was consumed
The mass of air and fuel was determined from before after run test weights As stated earlier determining the quantity of steam produced from the pressurized water tank was problematic because of the quantity of stored water the resistance to water flow under dynamic pressures and the potential for some fraction of the water (in liquid state) to be entrained in the propellant mix
To solve for this unknown the energy required to raise the known quantity of air from ambient to 1000degK (33kcalmol or 0467 BTUg) was subtracted from the energy content of the propane consumed (44 BTUg) and then the efficiency of the heat transfer process was de-rated by 10 percent to yield a net quantity of 1438 BTUs to elevate ambient temperature water to 1000degK steam The result is an estimated 125 grams of water consumed in the 7-minute test
Table 1 summarizes these data and shows a high reliance on the air fraction for the work performed by the 2 HP engine The air cylinder used in this test has a measured free volume of 45 cubic feet (1274 liters at STP) which means sustained flow rates of 62 cubic feet per minute (cfm) or 175 liters per minute In contrast the 125 grams of water passed through as steam produced an estimated equivalent gas volume of 155 liters at STP Note the modest levels of water vapor in Figure 29 Why the greater air fraction relative to water flow in this test
Air (Wt 000Kg) 661 460 201 938 1294 30 36
Water2
(Wt 000Kg)
Propane(Wt 000Kg)
Time (hrmnsc)
1562
123000
1556
123715
00125
006
00715
1438
2640
na
1983
364
na
47
86
54
90
1 Energy value based upon absorbed heat (italicized) from STP to 1000degK (0446 BTUg for Air 115 BTUg water) 2 Determined by difference from propane and air energy assumed value 90 3Arbitrary estimated efficiency of heat transfer not effective work
11222010 - 3 Low Speed Run Air Pressure 60 psi Water Head Pressure 60 psi
Component(BTU) Start End Net Energy1
(BTU) Power
(BTUmin) Power (HP) Efficiency3
Table 1 Analysis of Mass
Flow Data at Low Speed
FEDERAL TRANSIT ADMINISTRATION 28
SECTION 4 BRASH TEST PLAN
Figure 29 Low-Speed Test Results in Little
Water Vapor
In this baseline experiment the single cylinder provides 60 psi air flow and 60 psi static ldquoheadrdquo pressure on the water column The air flow from the cylinder is biased toward the generally less restrictive flow path for air The water column under the same pressure presents a higher viscosity medium passing through a greater number of valves and restrictions At the point of injection the air fraction flows more freely into the hot section In order to bias the mix toward greater water fraction (and greater power) the head pressure on the water column must be increased over the 60 psi air line pressure
Run 4 (not documented here) evaluated head pressures from 110 psi to 70 psi and determined that modest differential pressures retarded the flow from the air fraction and boosted flow of the water fraction Still higher differential pressures effectively stopped air flow altogether reverting the engine operation to ldquosteam onlyrdquo For Run 5 an additional cylinder was used to apply a 70 psi static head pressure on the water column a 10 psi differential over the 60 psi air line pressure
5 Variable High Speed Test On November 26 2010 Run 5 tested the higher differential water pressure as a means to increase the effective water fraction in the propellant mix The test commenced with a full air cylinder weighing 654 Kg At the end of the test the empty cylinder weighed 472 Kg Run 5 was interrupted after 243 minutes to refill the water tank and then testing resumed for an additional 907 minutes Over the whole test 027 Kg of propane was consumed
Using the same analytical basis as Test 3 Test 5 data indicate a substantial increase in work capacity (as measured by fuel consumed and steam generated) over the 3 baseline
FEDERAL TRANSIT ADMINISTRATION 29
112610 - 5 Variable High Speed Run Air Pressure 60 psi Water Head Pressure 70 psi
Air (Wt 000Kg)
Component(BTU) Start End Net Energy1
(BTU) Power
(BTUmin) Power (HP) Efficiency3
654 472 182 849 718 17 7
SECTION 4 BRASH TEST PLAN
Table 3 Comparison of Mass Flows
Water 588 Runs 3 and 5
163 Duration (mn) 725 1180 725 1180 163
Air
Component Run 3 BHP
Run 5 BHP
Net ChngBHP
Run 5 Mass
Transfer (kg)
Net ChangeMass
Transfer (kg)
30 17
197
237
-45 2010 182 -9
Run 3 Mass
Transfer (kg)
276 350
47
86
422
0060
0013
0270
0086
Propane
This difference in steam fraction and power is more clearly seen in Figure 30 (and on the source video at the Brash Engines website)
Figure 30 Three Images from Run 5
Table 2 Test 5 Results with Increased
Water and Fuel Water2
(Wt 000Kg) 0860 9890 8358 197 83
Propane(Wt 000Kg) 1520 1493 27 11880 1004 237 90
Time (hrmnsc) 133000 134150 01150 na na na na
1 Energy value based upon absorbed heat (italics) from STP to 1000degK (0446 BTUg for Air 115 BTUg water) Underlined value is released heat at generally accepted 44 BTUg 2 Determined by difference from propane and air Energy assumed value 90 3 Arbitrary estimated efficiency of heat transfer not effective work
The increase in pressure on the water column by 10 psi reduced air flow by 9 percent but increased the steam fraction considerably and thereby increased the effective boiler horsepower nearly three-fold to 237 bhp (assuming 90 heat transfer) These data are summarized in Table 3
FEDERAL TRANSIT ADMINISTRATION 30
SECTION 4 BRASH TEST PLAN
As with Run 3 start up from Time Zero was immediate burner on air flow begins and water flow under pressure commences immediately Another impressive feature of the mix air-steam propellant system is the ability to start stop and rapidly accelerate as shown in the full Run 5 video Run 5 serves as validation that this patented technology has unique performance benefits over air steam or internal combustion alone
Lessons Learned A comparison of the two test runs verifies some key points
1 The same power plant can produce variable power and fuel economy based upon power demand and airsteam mix
2 Although imprecise at this point in testing fuel consumption appears directly proportional to engine speed The engineexpander will spool up spool down stop and restart in a manner consistent with fuel and propellant flow The Run 5 video on the Brash Engines website verifies this conclusion
3 The use of a defined static air pressure ldquoheadrdquo over the water column at a pressure higher than the defined air line dynamic pressure provides a safe and predictable bias toward flow from the water fraction
4 Although the current test configuration offers sufficient performance for this initial demonstration phase the following observations are in order
a The heater path is too long creating latent response issues
b The airwater injector is not optimized for proper mix or flow capacity
c The incomplete integration of LabVIEW compromises the quality of data
d The absence of a measured variable load on the expander compromises any analysis of power and fuel economy
5 The design migration to a vehicle installation was premature The project should move back to a lab bench study to refine the regulation of components complete the recovery and recompression portions of the system and use electromechanical loads to estimate power and useful work for specific quantities of fuel water and air
6 The Quasiturbinetrade engine technology is promising but too immature for larger-scale modeling Later phases of the project should rely on more conventional multi-cylinder piston-type expander
Estimated Fuel Economy Mass transit authorities have relied on large diesel engines such as the Detroit Diesel Series 50 and Series 60 engines for more than 30 years Reports on fuel economy vary from a high of 60 miles per gallon (Diesel) for longer-range
FEDERAL TRANSIT ADMINISTRATION 31
SECTION 4 BRASH TEST PLAN
commuter services in California23 to a low of 228 miles per gallon (Diesel) for city buses with frequent stops in New York City24 In both cited studies the migration to compressed natural gas (CNG) has resulted in lower fuel economies on a Diesel Gallon Equivalent (DGE) basis
Table 4 summarizes this study (columns 2 and 3) and the next proposed phase (columns 4 and 5) the performance of the current fleet of mass transit buses (columns 6 and 7) and the likely outcome if the Besler engine (described earlier) were employed with the air-steam hybrid technology (columns 8 and 9)
Table 4 Comparison of
Fuel Economies
Air
1
Configuration
Engine
HP
Torque
Fuel
gmin
BTUhr
GGEhr
mpg 60mph
GGE100 mi
$ per GGE
$100 mi
Current
Example
2
3
3
5
4
Bench
5
S-10
6
SB Bus
7
NYCT
8
50 eff
9
30 eff
86
Quasi
2
Prop
82
216
02
3160
03
30
09
Current
237
Quasi
2
Prop
23
607
05
1126
09
30
27
UC 1
40
6 cyl
20
Prop
40
1056
09
648
15
30
46
UC 2
80
6 cyl
40
Mix
80
2112
19
324
31
30
93
MCI102
DD S60
350
1450
Diesel
540
11400
100
60
167
35
583
Diesel
23
439
35
1535
300
Besler
150
1200
Mix
300
792
695
864
1158
16
1853
500
Besler
150
1200
Mix
500
1320
1158
518
1930
16
3088
The Besler engine is shown in two columns The left column reflects the higher efficiency anticipated with the air-steam hybrid mix described earlier as at or near 50 percent The right column reflects the historical efficiency realized with steam engine technology The italicized numbers near the bottom of the column show that even at historical efficiencies the Besler engine would offer equal or better Gasoline Gallon Equivalent (GGE)100 mile ratings of the current diesel technology but migrating toward less refined and (therefore) less expensive fuels would significantly reduce the operating cost ($mile)
23Demonstration of Caterpillar C-10 Dual-Fuel Engines in MCI 102DL3 Commuter Buses National Renewable Energy Laboratory httpwwwnrelgovdocsfy00osti26758pdf p 7 24R Barnitt ldquoNew York City Transit (NYCT) Hybrid (125 Order) and CNG Transit Buses Final Evaluation Resultsrdquo November 2006 National Renewable Energy Laboratory K Chandler Battelle Technical Report NRELTP-540-40125 November 2006 httpwwwnrelgovvehiclesandfuelsfleettestpdfs40125pdf pvii
FEDERAL TRANSIT ADMINISTRATION 32
SECTION 4 BRASH TEST PLAN
There are of course two orders of magnitude difference between the results of Runs 3 and 5 and the daily demands of city and commuter buses but the mere existence of the Besler Twin and the Brooks V-8 400 HP engine suggests an opportunity for fuel economy and fuel variety
Proposed further support for the next phase of development will advance the air-steam hybrid technology by an important order of magnitude This would provide the data confidence to scale to larger vehicle operation and garner the interest of one or more engine or vehicle OEMs
Figure 31 MTANew York City
Transit Orion VII Next Generation
Hybrid Transit Bus
Next Development Phase The next phase of development will incorporate a modern six-cylinder steam engine design with a displacement of 53 cubic inches and capable of sustained 15-25 HP operation The expander will be supplied by Steam Engine Power Inc (httpwwwsteamenginepowercom) This expander will drive an alternator generator to measure effective work output in watts as well as provide sufficient power to satisfy the system parasitic loads of battery recharge exhaust air recompression and all other pump and valve operations
Figure 32 (l to r) Six-Cylinder Expander Power Generation Load
Small 24 VDC Compressor
FEDERAL TRANSIT ADMINISTRATION 33
SECTION 4 BRASH TEST PLAN
Static pressure for the water column will still be supplied via compressed air cylinder but the dynamic air flow will be supplied by an oil-less air compressor of the size and type shown This 24 VDC compressor will recompress the recovered air exiting the expander to 40ndash60 psi pressure and support flows of 3ndash4 cubic feet per minute (cfm) These three components are off-the-shelf enhancements to the system but custom engineering of a new more powerful and more responsive heater completion of the electronic integration and design and fabrication of the recoveryrecompression components are necessary tasks that must be included to make the next generation assembly work to its potential This work will be accomplished largely by Mechanical and Electrical Engineering students at the University of Connecticut under the supervision of faculty and Brash Engines personnel
When this build is complete all operations will be under LabVIEW control All expander operations will be measured for power and work Once the bench version is in control a modified version will be installed in a small pickup truck (eg Chevrolet S-10) for further verification of system performance and robustness
During this phase a new and promising technology will be investigated a new and faster class of solenoid valves from National Instruments These solenoid valves with an unprecedented 3 msec response time have the potential of allowing air-steam retrofit in existing engine blocks The solenoid valves could replace the spark plugs in conventional IC engines and provide the equivalent timed injection of hot propellant mix as the timed firing of a spark plug in the presence of a fuel air mix
If possible these fast solenoids and the black box programming to control them could allow very easy portability to larger vehicles and easier retrofit Potentially a V-6 engine could operate 4 cylinders for expansion and the remaining two cylinders could be used as direct drive compressors with different but equivalent solenoid valves controlling the compression process
FEDERAL TRANSIT ADMINISTRATION 34
SECTION Development Plan 5 and Next Steps
This current effort is a key first-proof of concept for this air-steam hybrid technology but our goals extend well beyond this two-seat 2 HP demonstrator The lessons learned in electronic integration will allow rapid migration to larger platforms using the same basic controls but scaling the expander heater and other mass-flow components to vehicle-appropriate size That project identified as ldquo20 HP Vehiclerdquo and other near-term derivative projects are listed in Table 5
BRASH Project
ProposedFunding Source
Funds Reqd $K Project Description
SUV-size proof-of-concept for reliable 20 HP Vehicle DOTUSPS 300 highway performance maildelivery
vehicle size
Proof-of-concept mass transit busshy200 HP Vehicle DOTDOD 600 retrofit scaled to city bus capacity and
suitable for replacement of over-the-road diesel engines
Table 5 Project Funding
Stationary Power Unit Micro-CHP Equivalent
DARPA 300 Proof-of-concept mass transit bus-retrofit scaled to city bus capacity and suitable for replacement of over-the-road diesel engines
Summary Alternative Processed Solid Fuel DOE EPA DOA 600
Processed mix of hydrolyzed wood pulp processed solid waste and other combustible solids in an extrudable mass with alcohol solutevehiclemdashdemonstrate utility in vehicles as a high energy content clean burning fuel for EC engines
Demonstrate effective pyrolysis of
Binary Solid Gas Fuel
EPA Waste Management BFI
400 processed solid fuels in a binary fuel burner conventional fuel (gasoline natural gas) provides primary heat source for pyrolysis temperatures
Proof of Concept OEM Power Plant
Vehicle OEM (eg Ford GM Caterpillar) 1200
Development of direct replacement BRASH engine alternative to existing OEM IC engine
Black Box Integration of Controller Software
Vehicle OEM (eg Ford GM Caterpillar)
1600 Development of commercial BRASH system alternative to existing OEM IC engine
FEDERAL TRANSIT ADMINISTRATION 35
SECTION 5 DEVELOPMENT PLAN AND NEXT STEPS
The issuance of US Patent 7743872 five months ago has two important consequences for this project First it serves to validate the underlying technology the combination of air and steam in an EC engine is better than steam or air alone Second it provides a basis for full and open discussions with government agencies and large commercial interests in the transportation and power sectors
Our efforts at promotion have been delayed pending successful demonstration of the Smarttrade car vehicle to allow the first detailed real-world performance data to be distributed
Coupling that performance data with the option of migration away from refined petroleum should spark significant interest If we can move to a high lignin-processed wood pulp that costs $045 per gasoline gallon equivalent (an arbitrary value for example only) and consumes more CO2 while growing than is consumed in processing as a fuel and produced from combustion then we succeed as a project and as a global game-changing technology for many uses Improvements in fuel economy are important but of greater importance is the migration to low-process biomass fuels
FEDERAL TRANSIT ADMINISTRATION 36
SECTION Potential Applications and Societal Value 6 The whole premise behind the BRASH air steam hybrid is that external combustion offers a more benign and environmentally-appropriate way to power large vehicles and other portable equipment than refined petroleum-powered internal combustion
bullCombustion heat can be derived from any fuel source including processed solids from fast-growing renewables such as poplar trees waste corn stalks or switch grass
bullThat combustion heat is applied at a rate consistent with the work to be done and not to support idling and other unproductive fuel use
Using a mix of air and steam as working fluids in the engine allows
bullImmediate startup from an ldquoair-onlyrdquo start
bull Managed system pressure through use of a defined head air pressure
bullManaged fuel burn as the air-steam fraction is adjusted to match wheel load
bullAdjusted wheel load reduces fuel burn
Integration of modern control circuitry with external combustion also brings a level of performance operational simplicity and safety heretofore unavailable
FEDERAL TRANSIT ADMINISTRATION 37
SECTION
7 Phase I Conclusions
The last steam train in scheduled service in the US departed on October 11 196225 One year earlier Robert Noyce received the first patent for an integrated circuit26 But for that brief one-year overlap the most powerful motive power technology was never harnessed by the black box controls that grew out of Noycersquos invention so the diesel-powered IC engine championed by Henry Ford won out
Now nearly 50 years later the modern IC engine cannot operate efficiently without the benefit of black box electronicsmdashbut that technology still presents intractable challenges of supply safety and environmental impact The air-steam hybrid technology may offer an alternative and a glimpse of that potential is presented here and viewable in Run 5 on the Brash Engines website at http wwwbrashenginescom
While demonstration in a test vehicle provides a strong visual message that BRASH technology works the commercial success of this technology will depend upon reliable repeatable measurement of power and economy For that data the Phase 2 effort will require a return to laboratory bench testing and effective demonstration of recovery of the water and air fractions
The results of this Phase I project collectively demonstrate the technical feasibility and commercial potential of the BRASH air-steam hybrid engine technology The initial DOT SBIR funding has been highly effective in facilitating this important proof of concept and laying the groundwork for further technology refinement and application
As described earlier the next steps are clear and appear to combine achievable and rapid major advances with low developmental risk SBIR Phase 2 support is needed for those advances due to the still-early stage of development that restricts access to private capital
The immense potential value of this technology has been enhanced and verified in Phase 1 there is now a clear and low-risk path ahead to larger-scale testing further component and controls refinement specific applications prototyping and pre-commercial deployments
25William Rosen The Most Powerful Idea in the World Random House 2010 p 311 26US Patent 2981877
FEDERAL TRANSIT ADMINISTRATION 38
APPENDIX
A Heat Transfer Efficiency Modeling Runs 3 and 5 50 and 90
Much of the analysis for Runs 3 and 5 is based on an assumed efficiency of 90 for heat transfer from the combustion of propane to heating of the water air mix in the coil As a test for the reasonableness of that assumption the same data have been modeled at a much lower 50 factor below
112210 - 3 Low Speed Run Air Pressure 60 psi Water head pressure 60 psi
Water2 00440 5060 4276 101 43 (Wt 000Kg)
Propane 152 1493 237 50 27 11880 1004 (Wt 000Kg)
Time 133000 134150 01150 na na na na (hrmnsc)
1 Energy value based upon absorbed heat (italics) from STP to 1000degK (0446 BTUg for Air 115 BTUg water) Underlined value is released heat at generally accepted 44 BTUg
Air (Wt 000Kg)
Component(BTU) Start Wt End Wt Net Wt Energy1
(BTU) Power
(BTUmin) Power (HP) Efficiency3
661 460 201 938 1294 30 36
Water2
(Wt 000Kg)
Propane(Wt 000Kg)
Time (hrmnsc)
1562
123000
1556
123715
00125
006
00715
380
2640
na
523
364
na
12
86
14
50
na na
Air (Wt 000Kg)
Component(BTU) Start Wt
5 Variable High Speed Run Air Pressure 60 psi Water head pressure 70 psi
End Wt Net Wt Energy1
(BTU) Power
(BTUmin) Power (HP) Efficiency3
654 472 182 849 718 17 7
2 Determined by difference from Propane and Air Energy assumed value 90 3 Arbitrary estimated efficiency of heat transfer not effective work
The two known quantities in each run is the weight of the air moving through the system and the weight of the propane heating that air The variable is the quantity of water heated to steam temperatures and above In Run 3 at 90 efficiency that mass of water calculates to 125 grams at 50 it drops to 33 grams In Run 5 at 90 efficiency that mass of water calculates to 86 grams at 50 it drops to 44 grams
FEDERAL TRANSIT ADMINISTRATION 39
APPENDIX A HEAT TRANSFER EFFICIENCY MODELING RUNS 3 AND 5 50 AND 90
As the comparison tables below show the uncertainty in the efficiency of heat transfer is manifest only in the mass of water heated to steam to do useful work
Data 90 Efficiency
Air
Component Run 3 BHP
Run 5 BHP
Net ChngBHP
-45
Run 3 Mass
Transfer (kg)
Run 5 Mass
Transfer (kg)
Net ChangeMass
Transfer (kg)
30 17
197
237
2010 182 -9
Water
Propane
Duration (mn)
47
86
725
422
0060
0013
725
0270
0086
1180
588
350
163 1180
276
163
Data 50 Efficiency
Air
Component Run 3 BHP
Run 5 BHP
Net ChngBHP
-45
Run 3 Mass
Transfer (kg)
Run 5 Mass
Transfer (kg)
Net ChangeMass
Transfer (kg)
30 17
101
237
2010 182 -9
Water
Propane
Duration (mn)
12
86
725
817
0060
0003
725
0270
0044
1180
1233
350
163 1180
276
163
Regardless of the specific efficiency Run3 reflects an air-rich propellant mix while Run 5 was clearly the more powerful and steam-rich propellant If 50 efficiency is a more realistic figure than 90 the only consequence is more water passing through the heater expander and recovery tank The only consequence for overall system efficiency is the slight but added work required to move the additional water by pump to the top of the water column
FEDERAL TRANSIT ADMINISTRATION 40
APPENDIX Acronyms B
BHP Boiler Horsepower
BRASH Binary Recovery Air-Steam Hybrid
BTU British Thermal Unit
CC Cubic centimeter
CFM Cubit feet per minute
CHP Combined heat and power
CNG Compressed natural gas
CO2 Carbon dioxide
CU Cubic
DARPA Defense Advanced Research Projects Agency
DGE Diesel gallon equivalent
DOT Department of Transportation
EC External combustion
EIA Energy Information Administration
EPA Environmental Protection Agency
FTA Federal Transit Administration
GGE Gasoline gallon equivalent
HP Horsepower
IC Internal combustion
K Kelvin
Kcal Kilocalorie
MPG Miles per gallon
MPH Miles per hour
OEM Original equipment manufacturer
PSI Pounds per square inch
RPM Revolutions per minute
SBIR Small Business Innovation Research
STP Standard temperature and pressure
FEDERAL TRANSIT ADMINISTRATION 41
FEDERAL TRANSIT ADMINISTRATION 128
US Department of TransportationFederal Transit AdministrationEast Building1200 New Jersey Avenue SEWashington DC 20590httpwwwftadotgovresearch
US Department of Transportation Federal Transit Administration East Building 1200 New Jersey Avenue SE Washington DC 20590 httpwwwftadotgovresearch
FEDERAL TRANSIT ADMINISTRATION 42
- Button1
- Button2
- Button3
- Button4
- Button5
- Button6
- Button7
- Button8
- Button9
- Button10
- Button11
- Button12
- Button13
- Button14
- Button15
- Button16
- Button17
- Button18
- Button19
- Button20
- Button21
- Button22
- Button23
- Button24
- Button25
- Button26
- Button27
- Button28
- Button29
- Button30
- Button31
- Button32
- Button33
- Button34
- Button35
- Button36
- Button37
- Button38
- Button39
- Button40
- Button41
- Button42
- Button43
- Button44
- Button45
- Button46
- Button47
SECTION 3 THE AIR-STEAM HYBRID SOLUTION
as the basis for comparison But in an open market with many different fuels and widely different heat content (BTUlb) the only common and appropriate denominator is ldquomiles per dollarrdquo (closer to ldquofuel economyrdquo)
To the extent that any EC solution gains market acceptance and the market responds with new and different fuel blends the law of supply and demand dictates that fuel prices for all will drop Until then the remainder of this efficiency discussion will assume all engines require the same petroleum-based fuel
The long-accepted estimate of fuel efficiency for the IC engine is about 25 percent with the remaining 75 percent of the heat content dissipated in equal parts through the hot exhaust the radiator and mechanical losses in the engine Much has been done to raise that efficiency but what remains is one power stroke in four and a high temperature detonation whose heat content is quickly and intentionally dissipated through conduction
In sharp contrast a steam engine is designed to preserve as much heat as possible from combustion and then mete out that heat through the expansion of the working fluid Instead of a 25 percent heat loss through conduction through a radiator conductive loss is limited to 10 percent in efficient steam engines The greatest loss is through the vaporization of water to steam (at 30) yielding useful work of 35 or 40 percent higher than internal combustion Steam vehicles often report significantly lower practical fuel economies as the whole boiler is heated for a relatively short trip (another reason to avoid using a boiler)
Hot air engines involve no change of state therefore avoiding the loss associated with vaporization That can mean fuel efficiencies approaching 65 percent except as noted with the MDI engine a lower power-to-weight capability
The combination of air and steam into a single engine type is expected to yield economies between 35 and 65 percent varying with wheel load A 50 percent net efficiency would double fuel economy over a comparably-sized IC engine but as shown with the Doble and Besler examples the EC engine can be much smaller yielding even greater economies
FEDERAL TRANSIT ADMINISTRATION 16
SECTION 3 THE AIR-STEAM HYBRID SOLUTION
Figure 16 Fuel Efficiency
by Engine Type
Derivative Uses As much as this study is focused on large motive power applications it should be noted that an equally important opportunity for this technology is in stationary power applications similar in configuration to combined heat and power units referred to generally as micro-CHPs Rapid start-up high torque quiet operation and multi-fuel compatibility make it well suited to an integrated heat and electrical power installation
FEDERAL TRANSIT ADMINISTRATION 17
SECTION 3 THE AIR-STEAM HYBRID SOLUTION
Its ability to produce a full range of power options (mechanical pneumatic heat and through attached accessories electrical and hydraulic) in a small modular man-portable configuration also make it particularly well suited to temporary or tactical power requirements Although beyond the scope of the DOT goals for vehicular use this stationary power applicationrsquos potential may be strategically important in market acceptance and adoption by expanding the range of applications and thereby providing economies of scale in all aspects of development production and commercialization activities for all applications
FEDERAL TRANSIT ADMINISTRATION 18
SECTION BRASH Test Plan 4 This Phase I effort followed the Technical Objectives outlined in the proposal as follows
Practical Objectives 1 Modify the Smarttrade sized test vehicle (Figure 17) installing a 10ndash20 HP
equivalent heater a 650 cc displacement 2 HP (nominal) Quasiturbinetrade steam engine pressurized air and water tanks electronic flow regulation of air water and fuel via laptop-based LabVIEW software and solenoid valves
2 Perform test runs to validate the system operation and determine key baseline performance parameters such as
a minimum air fraction to maintain engine operation upper limits for operating temperatures maximum allowable flow rates for water (without reducing effective propellant flow at temperature)
b upper limits of vehicle speed while varying gross vehicle weight and course incline
3 Following baseline performance assessment further objectives included
a an analysis of component placement for ease of maintenance and replacement
b an estimation of comparable volumes and weights to an equivalent IC powertrain in order to verify retrofitability
c an estimation of effective fuel economy while using propane fuel on closed track mileage runs
Figure 17 Smarttrade
Car-Sized Test Vehicle
FEDERAL TRANSIT ADMINISTRATION 19
SECTION 4 BRASH TEST PLAN
4 Over the course of multiple test runs a cumulative assessment of component performance and reliability would lead to a gross verification of BRASH engine integrity and range That in turn could lead to off-site vehicle demonstrations to federal agencies potential industry partners and investors
Analytical Objectives 1 The BRASH engine model has been demonstrated only at a bench level with
rudimentary understanding of its operating principles A key objective in this vehicle build is to increase the thermodynamic modeling of this technology including an analysis of mass flow (air water fuel) and resulting power
2 Early test data would lead to analysis of specific on-vehicle capacities (for air water and fuel) and flow rates for same in order to estimate operating range recovery strategies and rates (recompression and condensation) and the parasitic loads (eg alternators pumps) to sustain useful operation for many hours
3 Over time the vehicle testing under various test conditions (eg varying gross vehicle weight wheel load engine temperature propellant mix) will lead to a body of data to support more complete modeling of water fraction vs torque vs temperature These data are essential to real-world estimation of fuel economy as this technology scales to larger practical vehicle applications
4 With the modeling from 3 in place for steady-state operation practical track runs with frequent starts and stops can further shape the model for real-world use
5 The analysis from steps 1ndash4 will provide sufficient basis for estimating the mass flow heat component capacity recovery factors and fuel economy for scaling this 2 HP test data to larger vehicles in two decade steps first to a 20 HP pickup truck and then further modeling and custom buildup of a 200 HP power plant with a DOT-identified industrial partner
6 This analytical plan is consistent with the overall SBIR program plan as the 2HP effort is confined to Phase I the 20 HP build and test plan would be accomplished in Phase II and the design and build of the 200 HP power plant would be accomplished in Phase III with an established industry partner
The work effort toward completion of these tasks has proceeded on two tracks mechanical modifications to the April test vehicle and electronic control and measurement
Mechanical Modifications and Test Configuration The test vehicle is a modified electric car about the size of a Smarttrade car Earlier modifications included removal of the electric drive train exposing a large working
FEDERAL TRANSIT ADMINISTRATION 20
SECTION 4 BRASH TEST PLAN
space behind the cab This rear space over the rear left wheel contains a 2HP Quasiturbinetrade steam engine20 selected for its compact design and suitable power range for this 700-pound vehicle The placement over the left wheel permits direct drive to that wheel via electric clutch and chain drive
Figure 18 Quasiturbinetrade
Rotary Expander Installed and Interior View
In the center of center of this rear space a heavily-modified propane space heater rated at 30000ndash80000 BTUhr (equivalent to 11ndash31 boiler horsepower [bhp]) was installed Heaters of this type generally are designed to efficiently distribute heat into an adjoining space This heater was heavily modified with high temperature insulation and outer shells to retain useful heat to the 20-ft stainless steel coil passing through its core
Figure 19 Quasiturbinetrade
Rotary Expander Installed and Interior View
the expander and heater (with recent refinements) Also visible under the heater is the pressurized water tank (painted grey) The open space to left of the heater is reserved for drive components The space to the right of the heater is reserved for recovery and recompression of the expanded propellant (Recompression is outside of the current scope to simplify the testing and analysis See discussion section for more information) Other system components include air cylinders and electronic controllers that are mounted forward of the rear firewall in the cab or under the front hood
Figure 20 shows the back of the vehicle with fenders and trim removed revealing
20Quasiturbinetrade Product Details httpquasiturbinepromciqcca
FEDERAL TRANSIT ADMINISTRATION 21
SECTION 4 BRASH TEST PLAN
Figure 20 Test Configuration
Figure 21 System Components
The main system components are shown Minor components and linkage tomechanical output are not included in this report for the sake of simplicity
Electronic Control and Measurement No realistic progress toward a vehicle demonstrator with known and regulated fuel use can proceed without electronic regulation In this build the LabVIEW program and system components from National Instruments were used to create a ldquoglass cockpitrdquo of vehicle controls and performance measurement21 The simplified schematic in Figure 22 shows the planned integration of electronics in this development LabView-compatible components will replace all mechanical flow and measurement components
21More information can be found at National Insturments The LabVIEW Environment httpwwwnicomlabview
FEDERAL TRANSIT ADMINISTRATION 22
SECTION 4 BRASH TEST PLAN
Figure 22 Electronics
Schematic for Air-Steam Hybrid
For the vehicle driver the dashboard collection of gauges has been replaced with a laptop screen similar to the one pictured in Figure 23
Figure 23 Front Screen Display for Air-Steam Hybrid
Certain features on this front screen will reflect user input (OnOff Throttle) while others reflect the dependent variables in the process (Heater Temp Fuel Flow Air and Water Flow) Shown on the bottom screen will be running time-series data on speed wheel load temperature specific fuel consumption and the other variables important to the analytical process The front screen display is generated from programming and controls on the back screen display
FEDERAL TRANSIT ADMINISTRATION 23
SECTION 4 BRASH TEST PLAN
Figure 24 Back Screen Display for Air-Steam Hybrid
LabVIEW software and controllers were chosen because of National Instrumentsrsquo status as the industry leader in rapid control prototyping and In-Vehicle data-logging solutions BKi purchased the LabVIEW componentry through the University of Connecticut Mechanical Engineering Department as part of UConnrsquos ongoing support of the project
By the end of the contract term in October 2010 the air and water regulation components were complete and operational but the fuel regulation and engine speed components were not yet fully operational To generate the most meaningful data under these circumstances the test vehicle was configured for extended operation to determine specific fuel water and air consumption rates The combination of these rates provided the basis for initial estimates of power and efficiency
Summary of Effort Mechanical Modifications
1 Removal of original electrical drive components reinforcement of frame
2 Installation of Quasiturbinetrade 2HP engine modified heater pressurized water tank all pneumatic water and fuel lines
3 Baseline validation testing using manual controls
4 Installation of electronically-regulated flow controllers
Electronic Modification 1 Acquisition of computer electronic regulators and control software
2 LabVIEW systems programming
3 System checkout
FEDERAL TRANSIT ADMINISTRATION 24
SECTION 4 BRASH TEST PLAN
Testing and Analysis 1 Static Safety Testing 2 Baseline vehicle drivetrain testing
3 Vehicle static testing (Runs 3 amp 5)
Summary of RequirementsGoals 1 Safe operation of vehicle during static and motive applications
2 Qualitative demonstration of BRASH engine capability to move test vehicle on flat and inclined road surface
3 Quantitative determination of air water and fuel consumption during timed static test
4 Quantitative determination of air water and fuel consumption while varyshying water and fuel fractions
Summary of Testing Two experiments were performed in late November the first to establish minimum fuel and propellant flow rates for sustained operation at low speed (air-rich mode) and the second to establish reasonable upper limits of fuel and propellant flow at higher engine speeds (steam-rich mode) Variation in the air-steam mix is the underlying theory of operation for the BRASH engine the air fraction provides a baseline flow for initial start-up and low-speed operation but the addition of water (as steam) to the propellant results in a significant boost in range and power These two tests have verified this underlying theory
Test Conditions The two test runs summarized in this report are 3 on November 22 2010 and 5 on November 26 2010 Both tests were performed at the Depot D campus of the University of Connecticut in Storrs The testing was performed outside in seasonal conditions 45-50degF with light winds
Figure 25 Vehicle Test Setup
FEDERAL TRANSIT ADMINISTRATION 25
SECTION 4 BRASH TEST PLAN
Each run was a dynamic test with no load on the two-cylinder Quasiturbinetrade engine The propane cylinder was suspended from a scale for the duration of the test Propane fuel consumption was monitored continuously by digital scale with a display accuracy of 001kg
Each test run lasted for the duration of one high pressure air cylinder Air cylinder start (full) and end (empty) were determined at the start and finish of each run using the same scale and accuracy Water levels initially were determined volumetrically but the results were too inconsistent Displaced volume of liquid water proved a poor measure of the quantity heated to steam and carried forward for productive work For this reason water is an estimated quantity based upon fuel quantity burned less heat absorbed by the air fraction (Further integration of the LabView controller software in the next phase will obviate this work-around)
Each of the complete test runs may be viewed at Brash Engines website httpwwwbrashenginescom Photos from each run appear in the figures that follow Tables 1 and 2 summarize the productive mass flow for air water and propane fuel to produce work from the engine for the test duration
The cab interior in Figure 26 shows the high pressure air cylinder below the steering wheel and the laptop computer (regulating propellant flow) in passenger seat space The LabView controllers reside in the protective case under the laptop
Figure 26 Vehicle Cab with Controller Laptop
During each test hot propellant was allowed to expand and vent to ambient in order to simplify the thermodynamic model and analysis (Note the plumes of water vapor from each exhaust hose and the small puddles of water under each hose in Figure 27)
FEDERAL TRANSIT ADMINISTRATION 26
SECTION 4 BRASH TEST PLAN
Figure 27 Exhaust Plumes from Expander
Development plans include recovering the expanded propellant separating into water and air phases and then recompressing the air fraction for re-use This will both improve efficiency and eliminate the visible vapor plume
Test Assumptions Another estimation used in this study is the efficiency of heat transfer for the propellant through the 20-ft coil of stainless steel inside the insulated heater Figure 28 shows an early ldquoair-onlyrdquo test run with the current heater The hose failure and melting of the steel wire mesh inside (note formed ball in the mesh) indicates 1300degK temperatures exiting the hot section
Figure 28 Hose Failure Due
to Overheating
FEDERAL TRANSIT ADMINISTRATION 27
SECTION 4 BRASH TEST PLAN
Effective heat transfer (as Figure 28 shows) does not equal efficient heat transfer but the ability to deliver 1300degK air from a well-insulated burner suggests a highly efficient transfer of heat The analysis of results assumes a value of 90 efficiency (See Appendix A for a discussion of heat transfer efficiency)
3 Low Speed Test On November 22 2010 Run 3 tested the lower operating limits of the test setup Low limit in this context meant sufficient pressure to maintain expander rotation but low steam and fuel burn The test commenced with a full air cylinder weighing 661 Kg At the end of the test the empty cylinder weighed 460 Kg Over the 7 minutes and 15 seconds of testing 006 Kg of propane was consumed
The mass of air and fuel was determined from before after run test weights As stated earlier determining the quantity of steam produced from the pressurized water tank was problematic because of the quantity of stored water the resistance to water flow under dynamic pressures and the potential for some fraction of the water (in liquid state) to be entrained in the propellant mix
To solve for this unknown the energy required to raise the known quantity of air from ambient to 1000degK (33kcalmol or 0467 BTUg) was subtracted from the energy content of the propane consumed (44 BTUg) and then the efficiency of the heat transfer process was de-rated by 10 percent to yield a net quantity of 1438 BTUs to elevate ambient temperature water to 1000degK steam The result is an estimated 125 grams of water consumed in the 7-minute test
Table 1 summarizes these data and shows a high reliance on the air fraction for the work performed by the 2 HP engine The air cylinder used in this test has a measured free volume of 45 cubic feet (1274 liters at STP) which means sustained flow rates of 62 cubic feet per minute (cfm) or 175 liters per minute In contrast the 125 grams of water passed through as steam produced an estimated equivalent gas volume of 155 liters at STP Note the modest levels of water vapor in Figure 29 Why the greater air fraction relative to water flow in this test
Air (Wt 000Kg) 661 460 201 938 1294 30 36
Water2
(Wt 000Kg)
Propane(Wt 000Kg)
Time (hrmnsc)
1562
123000
1556
123715
00125
006
00715
1438
2640
na
1983
364
na
47
86
54
90
1 Energy value based upon absorbed heat (italicized) from STP to 1000degK (0446 BTUg for Air 115 BTUg water) 2 Determined by difference from propane and air energy assumed value 90 3Arbitrary estimated efficiency of heat transfer not effective work
11222010 - 3 Low Speed Run Air Pressure 60 psi Water Head Pressure 60 psi
Component(BTU) Start End Net Energy1
(BTU) Power
(BTUmin) Power (HP) Efficiency3
Table 1 Analysis of Mass
Flow Data at Low Speed
FEDERAL TRANSIT ADMINISTRATION 28
SECTION 4 BRASH TEST PLAN
Figure 29 Low-Speed Test Results in Little
Water Vapor
In this baseline experiment the single cylinder provides 60 psi air flow and 60 psi static ldquoheadrdquo pressure on the water column The air flow from the cylinder is biased toward the generally less restrictive flow path for air The water column under the same pressure presents a higher viscosity medium passing through a greater number of valves and restrictions At the point of injection the air fraction flows more freely into the hot section In order to bias the mix toward greater water fraction (and greater power) the head pressure on the water column must be increased over the 60 psi air line pressure
Run 4 (not documented here) evaluated head pressures from 110 psi to 70 psi and determined that modest differential pressures retarded the flow from the air fraction and boosted flow of the water fraction Still higher differential pressures effectively stopped air flow altogether reverting the engine operation to ldquosteam onlyrdquo For Run 5 an additional cylinder was used to apply a 70 psi static head pressure on the water column a 10 psi differential over the 60 psi air line pressure
5 Variable High Speed Test On November 26 2010 Run 5 tested the higher differential water pressure as a means to increase the effective water fraction in the propellant mix The test commenced with a full air cylinder weighing 654 Kg At the end of the test the empty cylinder weighed 472 Kg Run 5 was interrupted after 243 minutes to refill the water tank and then testing resumed for an additional 907 minutes Over the whole test 027 Kg of propane was consumed
Using the same analytical basis as Test 3 Test 5 data indicate a substantial increase in work capacity (as measured by fuel consumed and steam generated) over the 3 baseline
FEDERAL TRANSIT ADMINISTRATION 29
112610 - 5 Variable High Speed Run Air Pressure 60 psi Water Head Pressure 70 psi
Air (Wt 000Kg)
Component(BTU) Start End Net Energy1
(BTU) Power
(BTUmin) Power (HP) Efficiency3
654 472 182 849 718 17 7
SECTION 4 BRASH TEST PLAN
Table 3 Comparison of Mass Flows
Water 588 Runs 3 and 5
163 Duration (mn) 725 1180 725 1180 163
Air
Component Run 3 BHP
Run 5 BHP
Net ChngBHP
Run 5 Mass
Transfer (kg)
Net ChangeMass
Transfer (kg)
30 17
197
237
-45 2010 182 -9
Run 3 Mass
Transfer (kg)
276 350
47
86
422
0060
0013
0270
0086
Propane
This difference in steam fraction and power is more clearly seen in Figure 30 (and on the source video at the Brash Engines website)
Figure 30 Three Images from Run 5
Table 2 Test 5 Results with Increased
Water and Fuel Water2
(Wt 000Kg) 0860 9890 8358 197 83
Propane(Wt 000Kg) 1520 1493 27 11880 1004 237 90
Time (hrmnsc) 133000 134150 01150 na na na na
1 Energy value based upon absorbed heat (italics) from STP to 1000degK (0446 BTUg for Air 115 BTUg water) Underlined value is released heat at generally accepted 44 BTUg 2 Determined by difference from propane and air Energy assumed value 90 3 Arbitrary estimated efficiency of heat transfer not effective work
The increase in pressure on the water column by 10 psi reduced air flow by 9 percent but increased the steam fraction considerably and thereby increased the effective boiler horsepower nearly three-fold to 237 bhp (assuming 90 heat transfer) These data are summarized in Table 3
FEDERAL TRANSIT ADMINISTRATION 30
SECTION 4 BRASH TEST PLAN
As with Run 3 start up from Time Zero was immediate burner on air flow begins and water flow under pressure commences immediately Another impressive feature of the mix air-steam propellant system is the ability to start stop and rapidly accelerate as shown in the full Run 5 video Run 5 serves as validation that this patented technology has unique performance benefits over air steam or internal combustion alone
Lessons Learned A comparison of the two test runs verifies some key points
1 The same power plant can produce variable power and fuel economy based upon power demand and airsteam mix
2 Although imprecise at this point in testing fuel consumption appears directly proportional to engine speed The engineexpander will spool up spool down stop and restart in a manner consistent with fuel and propellant flow The Run 5 video on the Brash Engines website verifies this conclusion
3 The use of a defined static air pressure ldquoheadrdquo over the water column at a pressure higher than the defined air line dynamic pressure provides a safe and predictable bias toward flow from the water fraction
4 Although the current test configuration offers sufficient performance for this initial demonstration phase the following observations are in order
a The heater path is too long creating latent response issues
b The airwater injector is not optimized for proper mix or flow capacity
c The incomplete integration of LabVIEW compromises the quality of data
d The absence of a measured variable load on the expander compromises any analysis of power and fuel economy
5 The design migration to a vehicle installation was premature The project should move back to a lab bench study to refine the regulation of components complete the recovery and recompression portions of the system and use electromechanical loads to estimate power and useful work for specific quantities of fuel water and air
6 The Quasiturbinetrade engine technology is promising but too immature for larger-scale modeling Later phases of the project should rely on more conventional multi-cylinder piston-type expander
Estimated Fuel Economy Mass transit authorities have relied on large diesel engines such as the Detroit Diesel Series 50 and Series 60 engines for more than 30 years Reports on fuel economy vary from a high of 60 miles per gallon (Diesel) for longer-range
FEDERAL TRANSIT ADMINISTRATION 31
SECTION 4 BRASH TEST PLAN
commuter services in California23 to a low of 228 miles per gallon (Diesel) for city buses with frequent stops in New York City24 In both cited studies the migration to compressed natural gas (CNG) has resulted in lower fuel economies on a Diesel Gallon Equivalent (DGE) basis
Table 4 summarizes this study (columns 2 and 3) and the next proposed phase (columns 4 and 5) the performance of the current fleet of mass transit buses (columns 6 and 7) and the likely outcome if the Besler engine (described earlier) were employed with the air-steam hybrid technology (columns 8 and 9)
Table 4 Comparison of
Fuel Economies
Air
1
Configuration
Engine
HP
Torque
Fuel
gmin
BTUhr
GGEhr
mpg 60mph
GGE100 mi
$ per GGE
$100 mi
Current
Example
2
3
3
5
4
Bench
5
S-10
6
SB Bus
7
NYCT
8
50 eff
9
30 eff
86
Quasi
2
Prop
82
216
02
3160
03
30
09
Current
237
Quasi
2
Prop
23
607
05
1126
09
30
27
UC 1
40
6 cyl
20
Prop
40
1056
09
648
15
30
46
UC 2
80
6 cyl
40
Mix
80
2112
19
324
31
30
93
MCI102
DD S60
350
1450
Diesel
540
11400
100
60
167
35
583
Diesel
23
439
35
1535
300
Besler
150
1200
Mix
300
792
695
864
1158
16
1853
500
Besler
150
1200
Mix
500
1320
1158
518
1930
16
3088
The Besler engine is shown in two columns The left column reflects the higher efficiency anticipated with the air-steam hybrid mix described earlier as at or near 50 percent The right column reflects the historical efficiency realized with steam engine technology The italicized numbers near the bottom of the column show that even at historical efficiencies the Besler engine would offer equal or better Gasoline Gallon Equivalent (GGE)100 mile ratings of the current diesel technology but migrating toward less refined and (therefore) less expensive fuels would significantly reduce the operating cost ($mile)
23Demonstration of Caterpillar C-10 Dual-Fuel Engines in MCI 102DL3 Commuter Buses National Renewable Energy Laboratory httpwwwnrelgovdocsfy00osti26758pdf p 7 24R Barnitt ldquoNew York City Transit (NYCT) Hybrid (125 Order) and CNG Transit Buses Final Evaluation Resultsrdquo November 2006 National Renewable Energy Laboratory K Chandler Battelle Technical Report NRELTP-540-40125 November 2006 httpwwwnrelgovvehiclesandfuelsfleettestpdfs40125pdf pvii
FEDERAL TRANSIT ADMINISTRATION 32
SECTION 4 BRASH TEST PLAN
There are of course two orders of magnitude difference between the results of Runs 3 and 5 and the daily demands of city and commuter buses but the mere existence of the Besler Twin and the Brooks V-8 400 HP engine suggests an opportunity for fuel economy and fuel variety
Proposed further support for the next phase of development will advance the air-steam hybrid technology by an important order of magnitude This would provide the data confidence to scale to larger vehicle operation and garner the interest of one or more engine or vehicle OEMs
Figure 31 MTANew York City
Transit Orion VII Next Generation
Hybrid Transit Bus
Next Development Phase The next phase of development will incorporate a modern six-cylinder steam engine design with a displacement of 53 cubic inches and capable of sustained 15-25 HP operation The expander will be supplied by Steam Engine Power Inc (httpwwwsteamenginepowercom) This expander will drive an alternator generator to measure effective work output in watts as well as provide sufficient power to satisfy the system parasitic loads of battery recharge exhaust air recompression and all other pump and valve operations
Figure 32 (l to r) Six-Cylinder Expander Power Generation Load
Small 24 VDC Compressor
FEDERAL TRANSIT ADMINISTRATION 33
SECTION 4 BRASH TEST PLAN
Static pressure for the water column will still be supplied via compressed air cylinder but the dynamic air flow will be supplied by an oil-less air compressor of the size and type shown This 24 VDC compressor will recompress the recovered air exiting the expander to 40ndash60 psi pressure and support flows of 3ndash4 cubic feet per minute (cfm) These three components are off-the-shelf enhancements to the system but custom engineering of a new more powerful and more responsive heater completion of the electronic integration and design and fabrication of the recoveryrecompression components are necessary tasks that must be included to make the next generation assembly work to its potential This work will be accomplished largely by Mechanical and Electrical Engineering students at the University of Connecticut under the supervision of faculty and Brash Engines personnel
When this build is complete all operations will be under LabVIEW control All expander operations will be measured for power and work Once the bench version is in control a modified version will be installed in a small pickup truck (eg Chevrolet S-10) for further verification of system performance and robustness
During this phase a new and promising technology will be investigated a new and faster class of solenoid valves from National Instruments These solenoid valves with an unprecedented 3 msec response time have the potential of allowing air-steam retrofit in existing engine blocks The solenoid valves could replace the spark plugs in conventional IC engines and provide the equivalent timed injection of hot propellant mix as the timed firing of a spark plug in the presence of a fuel air mix
If possible these fast solenoids and the black box programming to control them could allow very easy portability to larger vehicles and easier retrofit Potentially a V-6 engine could operate 4 cylinders for expansion and the remaining two cylinders could be used as direct drive compressors with different but equivalent solenoid valves controlling the compression process
FEDERAL TRANSIT ADMINISTRATION 34
SECTION Development Plan 5 and Next Steps
This current effort is a key first-proof of concept for this air-steam hybrid technology but our goals extend well beyond this two-seat 2 HP demonstrator The lessons learned in electronic integration will allow rapid migration to larger platforms using the same basic controls but scaling the expander heater and other mass-flow components to vehicle-appropriate size That project identified as ldquo20 HP Vehiclerdquo and other near-term derivative projects are listed in Table 5
BRASH Project
ProposedFunding Source
Funds Reqd $K Project Description
SUV-size proof-of-concept for reliable 20 HP Vehicle DOTUSPS 300 highway performance maildelivery
vehicle size
Proof-of-concept mass transit busshy200 HP Vehicle DOTDOD 600 retrofit scaled to city bus capacity and
suitable for replacement of over-the-road diesel engines
Table 5 Project Funding
Stationary Power Unit Micro-CHP Equivalent
DARPA 300 Proof-of-concept mass transit bus-retrofit scaled to city bus capacity and suitable for replacement of over-the-road diesel engines
Summary Alternative Processed Solid Fuel DOE EPA DOA 600
Processed mix of hydrolyzed wood pulp processed solid waste and other combustible solids in an extrudable mass with alcohol solutevehiclemdashdemonstrate utility in vehicles as a high energy content clean burning fuel for EC engines
Demonstrate effective pyrolysis of
Binary Solid Gas Fuel
EPA Waste Management BFI
400 processed solid fuels in a binary fuel burner conventional fuel (gasoline natural gas) provides primary heat source for pyrolysis temperatures
Proof of Concept OEM Power Plant
Vehicle OEM (eg Ford GM Caterpillar) 1200
Development of direct replacement BRASH engine alternative to existing OEM IC engine
Black Box Integration of Controller Software
Vehicle OEM (eg Ford GM Caterpillar)
1600 Development of commercial BRASH system alternative to existing OEM IC engine
FEDERAL TRANSIT ADMINISTRATION 35
SECTION 5 DEVELOPMENT PLAN AND NEXT STEPS
The issuance of US Patent 7743872 five months ago has two important consequences for this project First it serves to validate the underlying technology the combination of air and steam in an EC engine is better than steam or air alone Second it provides a basis for full and open discussions with government agencies and large commercial interests in the transportation and power sectors
Our efforts at promotion have been delayed pending successful demonstration of the Smarttrade car vehicle to allow the first detailed real-world performance data to be distributed
Coupling that performance data with the option of migration away from refined petroleum should spark significant interest If we can move to a high lignin-processed wood pulp that costs $045 per gasoline gallon equivalent (an arbitrary value for example only) and consumes more CO2 while growing than is consumed in processing as a fuel and produced from combustion then we succeed as a project and as a global game-changing technology for many uses Improvements in fuel economy are important but of greater importance is the migration to low-process biomass fuels
FEDERAL TRANSIT ADMINISTRATION 36
SECTION Potential Applications and Societal Value 6 The whole premise behind the BRASH air steam hybrid is that external combustion offers a more benign and environmentally-appropriate way to power large vehicles and other portable equipment than refined petroleum-powered internal combustion
bullCombustion heat can be derived from any fuel source including processed solids from fast-growing renewables such as poplar trees waste corn stalks or switch grass
bullThat combustion heat is applied at a rate consistent with the work to be done and not to support idling and other unproductive fuel use
Using a mix of air and steam as working fluids in the engine allows
bullImmediate startup from an ldquoair-onlyrdquo start
bull Managed system pressure through use of a defined head air pressure
bullManaged fuel burn as the air-steam fraction is adjusted to match wheel load
bullAdjusted wheel load reduces fuel burn
Integration of modern control circuitry with external combustion also brings a level of performance operational simplicity and safety heretofore unavailable
FEDERAL TRANSIT ADMINISTRATION 37
SECTION
7 Phase I Conclusions
The last steam train in scheduled service in the US departed on October 11 196225 One year earlier Robert Noyce received the first patent for an integrated circuit26 But for that brief one-year overlap the most powerful motive power technology was never harnessed by the black box controls that grew out of Noycersquos invention so the diesel-powered IC engine championed by Henry Ford won out
Now nearly 50 years later the modern IC engine cannot operate efficiently without the benefit of black box electronicsmdashbut that technology still presents intractable challenges of supply safety and environmental impact The air-steam hybrid technology may offer an alternative and a glimpse of that potential is presented here and viewable in Run 5 on the Brash Engines website at http wwwbrashenginescom
While demonstration in a test vehicle provides a strong visual message that BRASH technology works the commercial success of this technology will depend upon reliable repeatable measurement of power and economy For that data the Phase 2 effort will require a return to laboratory bench testing and effective demonstration of recovery of the water and air fractions
The results of this Phase I project collectively demonstrate the technical feasibility and commercial potential of the BRASH air-steam hybrid engine technology The initial DOT SBIR funding has been highly effective in facilitating this important proof of concept and laying the groundwork for further technology refinement and application
As described earlier the next steps are clear and appear to combine achievable and rapid major advances with low developmental risk SBIR Phase 2 support is needed for those advances due to the still-early stage of development that restricts access to private capital
The immense potential value of this technology has been enhanced and verified in Phase 1 there is now a clear and low-risk path ahead to larger-scale testing further component and controls refinement specific applications prototyping and pre-commercial deployments
25William Rosen The Most Powerful Idea in the World Random House 2010 p 311 26US Patent 2981877
FEDERAL TRANSIT ADMINISTRATION 38
APPENDIX
A Heat Transfer Efficiency Modeling Runs 3 and 5 50 and 90
Much of the analysis for Runs 3 and 5 is based on an assumed efficiency of 90 for heat transfer from the combustion of propane to heating of the water air mix in the coil As a test for the reasonableness of that assumption the same data have been modeled at a much lower 50 factor below
112210 - 3 Low Speed Run Air Pressure 60 psi Water head pressure 60 psi
Water2 00440 5060 4276 101 43 (Wt 000Kg)
Propane 152 1493 237 50 27 11880 1004 (Wt 000Kg)
Time 133000 134150 01150 na na na na (hrmnsc)
1 Energy value based upon absorbed heat (italics) from STP to 1000degK (0446 BTUg for Air 115 BTUg water) Underlined value is released heat at generally accepted 44 BTUg
Air (Wt 000Kg)
Component(BTU) Start Wt End Wt Net Wt Energy1
(BTU) Power
(BTUmin) Power (HP) Efficiency3
661 460 201 938 1294 30 36
Water2
(Wt 000Kg)
Propane(Wt 000Kg)
Time (hrmnsc)
1562
123000
1556
123715
00125
006
00715
380
2640
na
523
364
na
12
86
14
50
na na
Air (Wt 000Kg)
Component(BTU) Start Wt
5 Variable High Speed Run Air Pressure 60 psi Water head pressure 70 psi
End Wt Net Wt Energy1
(BTU) Power
(BTUmin) Power (HP) Efficiency3
654 472 182 849 718 17 7
2 Determined by difference from Propane and Air Energy assumed value 90 3 Arbitrary estimated efficiency of heat transfer not effective work
The two known quantities in each run is the weight of the air moving through the system and the weight of the propane heating that air The variable is the quantity of water heated to steam temperatures and above In Run 3 at 90 efficiency that mass of water calculates to 125 grams at 50 it drops to 33 grams In Run 5 at 90 efficiency that mass of water calculates to 86 grams at 50 it drops to 44 grams
FEDERAL TRANSIT ADMINISTRATION 39
APPENDIX A HEAT TRANSFER EFFICIENCY MODELING RUNS 3 AND 5 50 AND 90
As the comparison tables below show the uncertainty in the efficiency of heat transfer is manifest only in the mass of water heated to steam to do useful work
Data 90 Efficiency
Air
Component Run 3 BHP
Run 5 BHP
Net ChngBHP
-45
Run 3 Mass
Transfer (kg)
Run 5 Mass
Transfer (kg)
Net ChangeMass
Transfer (kg)
30 17
197
237
2010 182 -9
Water
Propane
Duration (mn)
47
86
725
422
0060
0013
725
0270
0086
1180
588
350
163 1180
276
163
Data 50 Efficiency
Air
Component Run 3 BHP
Run 5 BHP
Net ChngBHP
-45
Run 3 Mass
Transfer (kg)
Run 5 Mass
Transfer (kg)
Net ChangeMass
Transfer (kg)
30 17
101
237
2010 182 -9
Water
Propane
Duration (mn)
12
86
725
817
0060
0003
725
0270
0044
1180
1233
350
163 1180
276
163
Regardless of the specific efficiency Run3 reflects an air-rich propellant mix while Run 5 was clearly the more powerful and steam-rich propellant If 50 efficiency is a more realistic figure than 90 the only consequence is more water passing through the heater expander and recovery tank The only consequence for overall system efficiency is the slight but added work required to move the additional water by pump to the top of the water column
FEDERAL TRANSIT ADMINISTRATION 40
APPENDIX Acronyms B
BHP Boiler Horsepower
BRASH Binary Recovery Air-Steam Hybrid
BTU British Thermal Unit
CC Cubic centimeter
CFM Cubit feet per minute
CHP Combined heat and power
CNG Compressed natural gas
CO2 Carbon dioxide
CU Cubic
DARPA Defense Advanced Research Projects Agency
DGE Diesel gallon equivalent
DOT Department of Transportation
EC External combustion
EIA Energy Information Administration
EPA Environmental Protection Agency
FTA Federal Transit Administration
GGE Gasoline gallon equivalent
HP Horsepower
IC Internal combustion
K Kelvin
Kcal Kilocalorie
MPG Miles per gallon
MPH Miles per hour
OEM Original equipment manufacturer
PSI Pounds per square inch
RPM Revolutions per minute
SBIR Small Business Innovation Research
STP Standard temperature and pressure
FEDERAL TRANSIT ADMINISTRATION 41
FEDERAL TRANSIT ADMINISTRATION 128
US Department of TransportationFederal Transit AdministrationEast Building1200 New Jersey Avenue SEWashington DC 20590httpwwwftadotgovresearch
US Department of Transportation Federal Transit Administration East Building 1200 New Jersey Avenue SE Washington DC 20590 httpwwwftadotgovresearch
FEDERAL TRANSIT ADMINISTRATION 42
- Button1
- Button2
- Button3
- Button4
- Button5
- Button6
- Button7
- Button8
- Button9
- Button10
- Button11
- Button12
- Button13
- Button14
- Button15
- Button16
- Button17
- Button18
- Button19
- Button20
- Button21
- Button22
- Button23
- Button24
- Button25
- Button26
- Button27
- Button28
- Button29
- Button30
- Button31
- Button32
- Button33
- Button34
- Button35
- Button36
- Button37
- Button38
- Button39
- Button40
- Button41
- Button42
- Button43
- Button44
- Button45
- Button46
- Button47
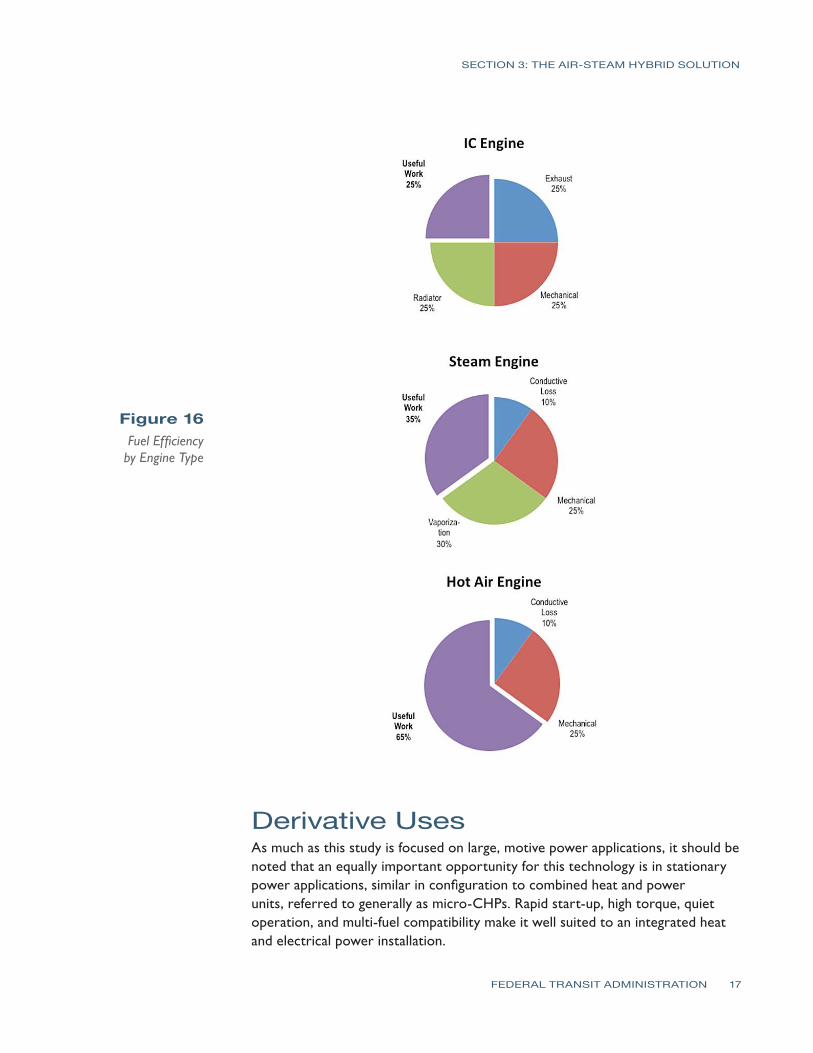
SECTION 3 THE AIR-STEAM HYBRID SOLUTION
Figure 16 Fuel Efficiency
by Engine Type
Derivative Uses As much as this study is focused on large motive power applications it should be noted that an equally important opportunity for this technology is in stationary power applications similar in configuration to combined heat and power units referred to generally as micro-CHPs Rapid start-up high torque quiet operation and multi-fuel compatibility make it well suited to an integrated heat and electrical power installation
FEDERAL TRANSIT ADMINISTRATION 17
SECTION 3 THE AIR-STEAM HYBRID SOLUTION
Its ability to produce a full range of power options (mechanical pneumatic heat and through attached accessories electrical and hydraulic) in a small modular man-portable configuration also make it particularly well suited to temporary or tactical power requirements Although beyond the scope of the DOT goals for vehicular use this stationary power applicationrsquos potential may be strategically important in market acceptance and adoption by expanding the range of applications and thereby providing economies of scale in all aspects of development production and commercialization activities for all applications
FEDERAL TRANSIT ADMINISTRATION 18
SECTION BRASH Test Plan 4 This Phase I effort followed the Technical Objectives outlined in the proposal as follows
Practical Objectives 1 Modify the Smarttrade sized test vehicle (Figure 17) installing a 10ndash20 HP
equivalent heater a 650 cc displacement 2 HP (nominal) Quasiturbinetrade steam engine pressurized air and water tanks electronic flow regulation of air water and fuel via laptop-based LabVIEW software and solenoid valves
2 Perform test runs to validate the system operation and determine key baseline performance parameters such as
a minimum air fraction to maintain engine operation upper limits for operating temperatures maximum allowable flow rates for water (without reducing effective propellant flow at temperature)
b upper limits of vehicle speed while varying gross vehicle weight and course incline
3 Following baseline performance assessment further objectives included
a an analysis of component placement for ease of maintenance and replacement
b an estimation of comparable volumes and weights to an equivalent IC powertrain in order to verify retrofitability
c an estimation of effective fuel economy while using propane fuel on closed track mileage runs
Figure 17 Smarttrade
Car-Sized Test Vehicle
FEDERAL TRANSIT ADMINISTRATION 19
SECTION 4 BRASH TEST PLAN
4 Over the course of multiple test runs a cumulative assessment of component performance and reliability would lead to a gross verification of BRASH engine integrity and range That in turn could lead to off-site vehicle demonstrations to federal agencies potential industry partners and investors
Analytical Objectives 1 The BRASH engine model has been demonstrated only at a bench level with
rudimentary understanding of its operating principles A key objective in this vehicle build is to increase the thermodynamic modeling of this technology including an analysis of mass flow (air water fuel) and resulting power
2 Early test data would lead to analysis of specific on-vehicle capacities (for air water and fuel) and flow rates for same in order to estimate operating range recovery strategies and rates (recompression and condensation) and the parasitic loads (eg alternators pumps) to sustain useful operation for many hours
3 Over time the vehicle testing under various test conditions (eg varying gross vehicle weight wheel load engine temperature propellant mix) will lead to a body of data to support more complete modeling of water fraction vs torque vs temperature These data are essential to real-world estimation of fuel economy as this technology scales to larger practical vehicle applications
4 With the modeling from 3 in place for steady-state operation practical track runs with frequent starts and stops can further shape the model for real-world use
5 The analysis from steps 1ndash4 will provide sufficient basis for estimating the mass flow heat component capacity recovery factors and fuel economy for scaling this 2 HP test data to larger vehicles in two decade steps first to a 20 HP pickup truck and then further modeling and custom buildup of a 200 HP power plant with a DOT-identified industrial partner
6 This analytical plan is consistent with the overall SBIR program plan as the 2HP effort is confined to Phase I the 20 HP build and test plan would be accomplished in Phase II and the design and build of the 200 HP power plant would be accomplished in Phase III with an established industry partner
The work effort toward completion of these tasks has proceeded on two tracks mechanical modifications to the April test vehicle and electronic control and measurement
Mechanical Modifications and Test Configuration The test vehicle is a modified electric car about the size of a Smarttrade car Earlier modifications included removal of the electric drive train exposing a large working
FEDERAL TRANSIT ADMINISTRATION 20
SECTION 4 BRASH TEST PLAN
space behind the cab This rear space over the rear left wheel contains a 2HP Quasiturbinetrade steam engine20 selected for its compact design and suitable power range for this 700-pound vehicle The placement over the left wheel permits direct drive to that wheel via electric clutch and chain drive
Figure 18 Quasiturbinetrade
Rotary Expander Installed and Interior View
In the center of center of this rear space a heavily-modified propane space heater rated at 30000ndash80000 BTUhr (equivalent to 11ndash31 boiler horsepower [bhp]) was installed Heaters of this type generally are designed to efficiently distribute heat into an adjoining space This heater was heavily modified with high temperature insulation and outer shells to retain useful heat to the 20-ft stainless steel coil passing through its core
Figure 19 Quasiturbinetrade
Rotary Expander Installed and Interior View
the expander and heater (with recent refinements) Also visible under the heater is the pressurized water tank (painted grey) The open space to left of the heater is reserved for drive components The space to the right of the heater is reserved for recovery and recompression of the expanded propellant (Recompression is outside of the current scope to simplify the testing and analysis See discussion section for more information) Other system components include air cylinders and electronic controllers that are mounted forward of the rear firewall in the cab or under the front hood
Figure 20 shows the back of the vehicle with fenders and trim removed revealing
20Quasiturbinetrade Product Details httpquasiturbinepromciqcca
FEDERAL TRANSIT ADMINISTRATION 21
SECTION 4 BRASH TEST PLAN
Figure 20 Test Configuration
Figure 21 System Components
The main system components are shown Minor components and linkage tomechanical output are not included in this report for the sake of simplicity
Electronic Control and Measurement No realistic progress toward a vehicle demonstrator with known and regulated fuel use can proceed without electronic regulation In this build the LabVIEW program and system components from National Instruments were used to create a ldquoglass cockpitrdquo of vehicle controls and performance measurement21 The simplified schematic in Figure 22 shows the planned integration of electronics in this development LabView-compatible components will replace all mechanical flow and measurement components
21More information can be found at National Insturments The LabVIEW Environment httpwwwnicomlabview
FEDERAL TRANSIT ADMINISTRATION 22
SECTION 4 BRASH TEST PLAN
Figure 22 Electronics
Schematic for Air-Steam Hybrid
For the vehicle driver the dashboard collection of gauges has been replaced with a laptop screen similar to the one pictured in Figure 23
Figure 23 Front Screen Display for Air-Steam Hybrid
Certain features on this front screen will reflect user input (OnOff Throttle) while others reflect the dependent variables in the process (Heater Temp Fuel Flow Air and Water Flow) Shown on the bottom screen will be running time-series data on speed wheel load temperature specific fuel consumption and the other variables important to the analytical process The front screen display is generated from programming and controls on the back screen display
FEDERAL TRANSIT ADMINISTRATION 23
SECTION 4 BRASH TEST PLAN
Figure 24 Back Screen Display for Air-Steam Hybrid
LabVIEW software and controllers were chosen because of National Instrumentsrsquo status as the industry leader in rapid control prototyping and In-Vehicle data-logging solutions BKi purchased the LabVIEW componentry through the University of Connecticut Mechanical Engineering Department as part of UConnrsquos ongoing support of the project
By the end of the contract term in October 2010 the air and water regulation components were complete and operational but the fuel regulation and engine speed components were not yet fully operational To generate the most meaningful data under these circumstances the test vehicle was configured for extended operation to determine specific fuel water and air consumption rates The combination of these rates provided the basis for initial estimates of power and efficiency
Summary of Effort Mechanical Modifications
1 Removal of original electrical drive components reinforcement of frame
2 Installation of Quasiturbinetrade 2HP engine modified heater pressurized water tank all pneumatic water and fuel lines
3 Baseline validation testing using manual controls
4 Installation of electronically-regulated flow controllers
Electronic Modification 1 Acquisition of computer electronic regulators and control software
2 LabVIEW systems programming
3 System checkout
FEDERAL TRANSIT ADMINISTRATION 24
SECTION 4 BRASH TEST PLAN
Testing and Analysis 1 Static Safety Testing 2 Baseline vehicle drivetrain testing
3 Vehicle static testing (Runs 3 amp 5)
Summary of RequirementsGoals 1 Safe operation of vehicle during static and motive applications
2 Qualitative demonstration of BRASH engine capability to move test vehicle on flat and inclined road surface
3 Quantitative determination of air water and fuel consumption during timed static test
4 Quantitative determination of air water and fuel consumption while varyshying water and fuel fractions
Summary of Testing Two experiments were performed in late November the first to establish minimum fuel and propellant flow rates for sustained operation at low speed (air-rich mode) and the second to establish reasonable upper limits of fuel and propellant flow at higher engine speeds (steam-rich mode) Variation in the air-steam mix is the underlying theory of operation for the BRASH engine the air fraction provides a baseline flow for initial start-up and low-speed operation but the addition of water (as steam) to the propellant results in a significant boost in range and power These two tests have verified this underlying theory
Test Conditions The two test runs summarized in this report are 3 on November 22 2010 and 5 on November 26 2010 Both tests were performed at the Depot D campus of the University of Connecticut in Storrs The testing was performed outside in seasonal conditions 45-50degF with light winds
Figure 25 Vehicle Test Setup
FEDERAL TRANSIT ADMINISTRATION 25
SECTION 4 BRASH TEST PLAN
Each run was a dynamic test with no load on the two-cylinder Quasiturbinetrade engine The propane cylinder was suspended from a scale for the duration of the test Propane fuel consumption was monitored continuously by digital scale with a display accuracy of 001kg
Each test run lasted for the duration of one high pressure air cylinder Air cylinder start (full) and end (empty) were determined at the start and finish of each run using the same scale and accuracy Water levels initially were determined volumetrically but the results were too inconsistent Displaced volume of liquid water proved a poor measure of the quantity heated to steam and carried forward for productive work For this reason water is an estimated quantity based upon fuel quantity burned less heat absorbed by the air fraction (Further integration of the LabView controller software in the next phase will obviate this work-around)
Each of the complete test runs may be viewed at Brash Engines website httpwwwbrashenginescom Photos from each run appear in the figures that follow Tables 1 and 2 summarize the productive mass flow for air water and propane fuel to produce work from the engine for the test duration
The cab interior in Figure 26 shows the high pressure air cylinder below the steering wheel and the laptop computer (regulating propellant flow) in passenger seat space The LabView controllers reside in the protective case under the laptop
Figure 26 Vehicle Cab with Controller Laptop
During each test hot propellant was allowed to expand and vent to ambient in order to simplify the thermodynamic model and analysis (Note the plumes of water vapor from each exhaust hose and the small puddles of water under each hose in Figure 27)
FEDERAL TRANSIT ADMINISTRATION 26
SECTION 4 BRASH TEST PLAN
Figure 27 Exhaust Plumes from Expander
Development plans include recovering the expanded propellant separating into water and air phases and then recompressing the air fraction for re-use This will both improve efficiency and eliminate the visible vapor plume
Test Assumptions Another estimation used in this study is the efficiency of heat transfer for the propellant through the 20-ft coil of stainless steel inside the insulated heater Figure 28 shows an early ldquoair-onlyrdquo test run with the current heater The hose failure and melting of the steel wire mesh inside (note formed ball in the mesh) indicates 1300degK temperatures exiting the hot section
Figure 28 Hose Failure Due
to Overheating
FEDERAL TRANSIT ADMINISTRATION 27
SECTION 4 BRASH TEST PLAN
Effective heat transfer (as Figure 28 shows) does not equal efficient heat transfer but the ability to deliver 1300degK air from a well-insulated burner suggests a highly efficient transfer of heat The analysis of results assumes a value of 90 efficiency (See Appendix A for a discussion of heat transfer efficiency)
3 Low Speed Test On November 22 2010 Run 3 tested the lower operating limits of the test setup Low limit in this context meant sufficient pressure to maintain expander rotation but low steam and fuel burn The test commenced with a full air cylinder weighing 661 Kg At the end of the test the empty cylinder weighed 460 Kg Over the 7 minutes and 15 seconds of testing 006 Kg of propane was consumed
The mass of air and fuel was determined from before after run test weights As stated earlier determining the quantity of steam produced from the pressurized water tank was problematic because of the quantity of stored water the resistance to water flow under dynamic pressures and the potential for some fraction of the water (in liquid state) to be entrained in the propellant mix
To solve for this unknown the energy required to raise the known quantity of air from ambient to 1000degK (33kcalmol or 0467 BTUg) was subtracted from the energy content of the propane consumed (44 BTUg) and then the efficiency of the heat transfer process was de-rated by 10 percent to yield a net quantity of 1438 BTUs to elevate ambient temperature water to 1000degK steam The result is an estimated 125 grams of water consumed in the 7-minute test
Table 1 summarizes these data and shows a high reliance on the air fraction for the work performed by the 2 HP engine The air cylinder used in this test has a measured free volume of 45 cubic feet (1274 liters at STP) which means sustained flow rates of 62 cubic feet per minute (cfm) or 175 liters per minute In contrast the 125 grams of water passed through as steam produced an estimated equivalent gas volume of 155 liters at STP Note the modest levels of water vapor in Figure 29 Why the greater air fraction relative to water flow in this test
Air (Wt 000Kg) 661 460 201 938 1294 30 36
Water2
(Wt 000Kg)
Propane(Wt 000Kg)
Time (hrmnsc)
1562
123000
1556
123715
00125
006
00715
1438
2640
na
1983
364
na
47
86
54
90
1 Energy value based upon absorbed heat (italicized) from STP to 1000degK (0446 BTUg for Air 115 BTUg water) 2 Determined by difference from propane and air energy assumed value 90 3Arbitrary estimated efficiency of heat transfer not effective work
11222010 - 3 Low Speed Run Air Pressure 60 psi Water Head Pressure 60 psi
Component(BTU) Start End Net Energy1
(BTU) Power
(BTUmin) Power (HP) Efficiency3
Table 1 Analysis of Mass
Flow Data at Low Speed
FEDERAL TRANSIT ADMINISTRATION 28
SECTION 4 BRASH TEST PLAN
Figure 29 Low-Speed Test Results in Little
Water Vapor
In this baseline experiment the single cylinder provides 60 psi air flow and 60 psi static ldquoheadrdquo pressure on the water column The air flow from the cylinder is biased toward the generally less restrictive flow path for air The water column under the same pressure presents a higher viscosity medium passing through a greater number of valves and restrictions At the point of injection the air fraction flows more freely into the hot section In order to bias the mix toward greater water fraction (and greater power) the head pressure on the water column must be increased over the 60 psi air line pressure
Run 4 (not documented here) evaluated head pressures from 110 psi to 70 psi and determined that modest differential pressures retarded the flow from the air fraction and boosted flow of the water fraction Still higher differential pressures effectively stopped air flow altogether reverting the engine operation to ldquosteam onlyrdquo For Run 5 an additional cylinder was used to apply a 70 psi static head pressure on the water column a 10 psi differential over the 60 psi air line pressure
5 Variable High Speed Test On November 26 2010 Run 5 tested the higher differential water pressure as a means to increase the effective water fraction in the propellant mix The test commenced with a full air cylinder weighing 654 Kg At the end of the test the empty cylinder weighed 472 Kg Run 5 was interrupted after 243 minutes to refill the water tank and then testing resumed for an additional 907 minutes Over the whole test 027 Kg of propane was consumed
Using the same analytical basis as Test 3 Test 5 data indicate a substantial increase in work capacity (as measured by fuel consumed and steam generated) over the 3 baseline
FEDERAL TRANSIT ADMINISTRATION 29
112610 - 5 Variable High Speed Run Air Pressure 60 psi Water Head Pressure 70 psi
Air (Wt 000Kg)
Component(BTU) Start End Net Energy1
(BTU) Power
(BTUmin) Power (HP) Efficiency3
654 472 182 849 718 17 7
SECTION 4 BRASH TEST PLAN
Table 3 Comparison of Mass Flows
Water 588 Runs 3 and 5
163 Duration (mn) 725 1180 725 1180 163
Air
Component Run 3 BHP
Run 5 BHP
Net ChngBHP
Run 5 Mass
Transfer (kg)
Net ChangeMass
Transfer (kg)
30 17
197
237
-45 2010 182 -9
Run 3 Mass
Transfer (kg)
276 350
47
86
422
0060
0013
0270
0086
Propane
This difference in steam fraction and power is more clearly seen in Figure 30 (and on the source video at the Brash Engines website)
Figure 30 Three Images from Run 5
Table 2 Test 5 Results with Increased
Water and Fuel Water2
(Wt 000Kg) 0860 9890 8358 197 83
Propane(Wt 000Kg) 1520 1493 27 11880 1004 237 90
Time (hrmnsc) 133000 134150 01150 na na na na
1 Energy value based upon absorbed heat (italics) from STP to 1000degK (0446 BTUg for Air 115 BTUg water) Underlined value is released heat at generally accepted 44 BTUg 2 Determined by difference from propane and air Energy assumed value 90 3 Arbitrary estimated efficiency of heat transfer not effective work
The increase in pressure on the water column by 10 psi reduced air flow by 9 percent but increased the steam fraction considerably and thereby increased the effective boiler horsepower nearly three-fold to 237 bhp (assuming 90 heat transfer) These data are summarized in Table 3
FEDERAL TRANSIT ADMINISTRATION 30
SECTION 4 BRASH TEST PLAN
As with Run 3 start up from Time Zero was immediate burner on air flow begins and water flow under pressure commences immediately Another impressive feature of the mix air-steam propellant system is the ability to start stop and rapidly accelerate as shown in the full Run 5 video Run 5 serves as validation that this patented technology has unique performance benefits over air steam or internal combustion alone
Lessons Learned A comparison of the two test runs verifies some key points
1 The same power plant can produce variable power and fuel economy based upon power demand and airsteam mix
2 Although imprecise at this point in testing fuel consumption appears directly proportional to engine speed The engineexpander will spool up spool down stop and restart in a manner consistent with fuel and propellant flow The Run 5 video on the Brash Engines website verifies this conclusion
3 The use of a defined static air pressure ldquoheadrdquo over the water column at a pressure higher than the defined air line dynamic pressure provides a safe and predictable bias toward flow from the water fraction
4 Although the current test configuration offers sufficient performance for this initial demonstration phase the following observations are in order
a The heater path is too long creating latent response issues
b The airwater injector is not optimized for proper mix or flow capacity
c The incomplete integration of LabVIEW compromises the quality of data
d The absence of a measured variable load on the expander compromises any analysis of power and fuel economy
5 The design migration to a vehicle installation was premature The project should move back to a lab bench study to refine the regulation of components complete the recovery and recompression portions of the system and use electromechanical loads to estimate power and useful work for specific quantities of fuel water and air
6 The Quasiturbinetrade engine technology is promising but too immature for larger-scale modeling Later phases of the project should rely on more conventional multi-cylinder piston-type expander
Estimated Fuel Economy Mass transit authorities have relied on large diesel engines such as the Detroit Diesel Series 50 and Series 60 engines for more than 30 years Reports on fuel economy vary from a high of 60 miles per gallon (Diesel) for longer-range
FEDERAL TRANSIT ADMINISTRATION 31
SECTION 4 BRASH TEST PLAN
commuter services in California23 to a low of 228 miles per gallon (Diesel) for city buses with frequent stops in New York City24 In both cited studies the migration to compressed natural gas (CNG) has resulted in lower fuel economies on a Diesel Gallon Equivalent (DGE) basis
Table 4 summarizes this study (columns 2 and 3) and the next proposed phase (columns 4 and 5) the performance of the current fleet of mass transit buses (columns 6 and 7) and the likely outcome if the Besler engine (described earlier) were employed with the air-steam hybrid technology (columns 8 and 9)
Table 4 Comparison of
Fuel Economies
Air
1
Configuration
Engine
HP
Torque
Fuel
gmin
BTUhr
GGEhr
mpg 60mph
GGE100 mi
$ per GGE
$100 mi
Current
Example
2
3
3
5
4
Bench
5
S-10
6
SB Bus
7
NYCT
8
50 eff
9
30 eff
86
Quasi
2
Prop
82
216
02
3160
03
30
09
Current
237
Quasi
2
Prop
23
607
05
1126
09
30
27
UC 1
40
6 cyl
20
Prop
40
1056
09
648
15
30
46
UC 2
80
6 cyl
40
Mix
80
2112
19
324
31
30
93
MCI102
DD S60
350
1450
Diesel
540
11400
100
60
167
35
583
Diesel
23
439
35
1535
300
Besler
150
1200
Mix
300
792
695
864
1158
16
1853
500
Besler
150
1200
Mix
500
1320
1158
518
1930
16
3088
The Besler engine is shown in two columns The left column reflects the higher efficiency anticipated with the air-steam hybrid mix described earlier as at or near 50 percent The right column reflects the historical efficiency realized with steam engine technology The italicized numbers near the bottom of the column show that even at historical efficiencies the Besler engine would offer equal or better Gasoline Gallon Equivalent (GGE)100 mile ratings of the current diesel technology but migrating toward less refined and (therefore) less expensive fuels would significantly reduce the operating cost ($mile)
23Demonstration of Caterpillar C-10 Dual-Fuel Engines in MCI 102DL3 Commuter Buses National Renewable Energy Laboratory httpwwwnrelgovdocsfy00osti26758pdf p 7 24R Barnitt ldquoNew York City Transit (NYCT) Hybrid (125 Order) and CNG Transit Buses Final Evaluation Resultsrdquo November 2006 National Renewable Energy Laboratory K Chandler Battelle Technical Report NRELTP-540-40125 November 2006 httpwwwnrelgovvehiclesandfuelsfleettestpdfs40125pdf pvii
FEDERAL TRANSIT ADMINISTRATION 32
SECTION 4 BRASH TEST PLAN
There are of course two orders of magnitude difference between the results of Runs 3 and 5 and the daily demands of city and commuter buses but the mere existence of the Besler Twin and the Brooks V-8 400 HP engine suggests an opportunity for fuel economy and fuel variety
Proposed further support for the next phase of development will advance the air-steam hybrid technology by an important order of magnitude This would provide the data confidence to scale to larger vehicle operation and garner the interest of one or more engine or vehicle OEMs
Figure 31 MTANew York City
Transit Orion VII Next Generation
Hybrid Transit Bus
Next Development Phase The next phase of development will incorporate a modern six-cylinder steam engine design with a displacement of 53 cubic inches and capable of sustained 15-25 HP operation The expander will be supplied by Steam Engine Power Inc (httpwwwsteamenginepowercom) This expander will drive an alternator generator to measure effective work output in watts as well as provide sufficient power to satisfy the system parasitic loads of battery recharge exhaust air recompression and all other pump and valve operations
Figure 32 (l to r) Six-Cylinder Expander Power Generation Load
Small 24 VDC Compressor
FEDERAL TRANSIT ADMINISTRATION 33
SECTION 4 BRASH TEST PLAN
Static pressure for the water column will still be supplied via compressed air cylinder but the dynamic air flow will be supplied by an oil-less air compressor of the size and type shown This 24 VDC compressor will recompress the recovered air exiting the expander to 40ndash60 psi pressure and support flows of 3ndash4 cubic feet per minute (cfm) These three components are off-the-shelf enhancements to the system but custom engineering of a new more powerful and more responsive heater completion of the electronic integration and design and fabrication of the recoveryrecompression components are necessary tasks that must be included to make the next generation assembly work to its potential This work will be accomplished largely by Mechanical and Electrical Engineering students at the University of Connecticut under the supervision of faculty and Brash Engines personnel
When this build is complete all operations will be under LabVIEW control All expander operations will be measured for power and work Once the bench version is in control a modified version will be installed in a small pickup truck (eg Chevrolet S-10) for further verification of system performance and robustness
During this phase a new and promising technology will be investigated a new and faster class of solenoid valves from National Instruments These solenoid valves with an unprecedented 3 msec response time have the potential of allowing air-steam retrofit in existing engine blocks The solenoid valves could replace the spark plugs in conventional IC engines and provide the equivalent timed injection of hot propellant mix as the timed firing of a spark plug in the presence of a fuel air mix
If possible these fast solenoids and the black box programming to control them could allow very easy portability to larger vehicles and easier retrofit Potentially a V-6 engine could operate 4 cylinders for expansion and the remaining two cylinders could be used as direct drive compressors with different but equivalent solenoid valves controlling the compression process
FEDERAL TRANSIT ADMINISTRATION 34
SECTION Development Plan 5 and Next Steps
This current effort is a key first-proof of concept for this air-steam hybrid technology but our goals extend well beyond this two-seat 2 HP demonstrator The lessons learned in electronic integration will allow rapid migration to larger platforms using the same basic controls but scaling the expander heater and other mass-flow components to vehicle-appropriate size That project identified as ldquo20 HP Vehiclerdquo and other near-term derivative projects are listed in Table 5
BRASH Project
ProposedFunding Source
Funds Reqd $K Project Description
SUV-size proof-of-concept for reliable 20 HP Vehicle DOTUSPS 300 highway performance maildelivery
vehicle size
Proof-of-concept mass transit busshy200 HP Vehicle DOTDOD 600 retrofit scaled to city bus capacity and
suitable for replacement of over-the-road diesel engines
Table 5 Project Funding
Stationary Power Unit Micro-CHP Equivalent
DARPA 300 Proof-of-concept mass transit bus-retrofit scaled to city bus capacity and suitable for replacement of over-the-road diesel engines
Summary Alternative Processed Solid Fuel DOE EPA DOA 600
Processed mix of hydrolyzed wood pulp processed solid waste and other combustible solids in an extrudable mass with alcohol solutevehiclemdashdemonstrate utility in vehicles as a high energy content clean burning fuel for EC engines
Demonstrate effective pyrolysis of
Binary Solid Gas Fuel
EPA Waste Management BFI
400 processed solid fuels in a binary fuel burner conventional fuel (gasoline natural gas) provides primary heat source for pyrolysis temperatures
Proof of Concept OEM Power Plant
Vehicle OEM (eg Ford GM Caterpillar) 1200
Development of direct replacement BRASH engine alternative to existing OEM IC engine
Black Box Integration of Controller Software
Vehicle OEM (eg Ford GM Caterpillar)
1600 Development of commercial BRASH system alternative to existing OEM IC engine
FEDERAL TRANSIT ADMINISTRATION 35
SECTION 5 DEVELOPMENT PLAN AND NEXT STEPS
The issuance of US Patent 7743872 five months ago has two important consequences for this project First it serves to validate the underlying technology the combination of air and steam in an EC engine is better than steam or air alone Second it provides a basis for full and open discussions with government agencies and large commercial interests in the transportation and power sectors
Our efforts at promotion have been delayed pending successful demonstration of the Smarttrade car vehicle to allow the first detailed real-world performance data to be distributed
Coupling that performance data with the option of migration away from refined petroleum should spark significant interest If we can move to a high lignin-processed wood pulp that costs $045 per gasoline gallon equivalent (an arbitrary value for example only) and consumes more CO2 while growing than is consumed in processing as a fuel and produced from combustion then we succeed as a project and as a global game-changing technology for many uses Improvements in fuel economy are important but of greater importance is the migration to low-process biomass fuels
FEDERAL TRANSIT ADMINISTRATION 36
SECTION Potential Applications and Societal Value 6 The whole premise behind the BRASH air steam hybrid is that external combustion offers a more benign and environmentally-appropriate way to power large vehicles and other portable equipment than refined petroleum-powered internal combustion
bullCombustion heat can be derived from any fuel source including processed solids from fast-growing renewables such as poplar trees waste corn stalks or switch grass
bullThat combustion heat is applied at a rate consistent with the work to be done and not to support idling and other unproductive fuel use
Using a mix of air and steam as working fluids in the engine allows
bullImmediate startup from an ldquoair-onlyrdquo start
bull Managed system pressure through use of a defined head air pressure
bullManaged fuel burn as the air-steam fraction is adjusted to match wheel load
bullAdjusted wheel load reduces fuel burn
Integration of modern control circuitry with external combustion also brings a level of performance operational simplicity and safety heretofore unavailable
FEDERAL TRANSIT ADMINISTRATION 37
SECTION
7 Phase I Conclusions
The last steam train in scheduled service in the US departed on October 11 196225 One year earlier Robert Noyce received the first patent for an integrated circuit26 But for that brief one-year overlap the most powerful motive power technology was never harnessed by the black box controls that grew out of Noycersquos invention so the diesel-powered IC engine championed by Henry Ford won out
Now nearly 50 years later the modern IC engine cannot operate efficiently without the benefit of black box electronicsmdashbut that technology still presents intractable challenges of supply safety and environmental impact The air-steam hybrid technology may offer an alternative and a glimpse of that potential is presented here and viewable in Run 5 on the Brash Engines website at http wwwbrashenginescom
While demonstration in a test vehicle provides a strong visual message that BRASH technology works the commercial success of this technology will depend upon reliable repeatable measurement of power and economy For that data the Phase 2 effort will require a return to laboratory bench testing and effective demonstration of recovery of the water and air fractions
The results of this Phase I project collectively demonstrate the technical feasibility and commercial potential of the BRASH air-steam hybrid engine technology The initial DOT SBIR funding has been highly effective in facilitating this important proof of concept and laying the groundwork for further technology refinement and application
As described earlier the next steps are clear and appear to combine achievable and rapid major advances with low developmental risk SBIR Phase 2 support is needed for those advances due to the still-early stage of development that restricts access to private capital
The immense potential value of this technology has been enhanced and verified in Phase 1 there is now a clear and low-risk path ahead to larger-scale testing further component and controls refinement specific applications prototyping and pre-commercial deployments
25William Rosen The Most Powerful Idea in the World Random House 2010 p 311 26US Patent 2981877
FEDERAL TRANSIT ADMINISTRATION 38
APPENDIX
A Heat Transfer Efficiency Modeling Runs 3 and 5 50 and 90
Much of the analysis for Runs 3 and 5 is based on an assumed efficiency of 90 for heat transfer from the combustion of propane to heating of the water air mix in the coil As a test for the reasonableness of that assumption the same data have been modeled at a much lower 50 factor below
112210 - 3 Low Speed Run Air Pressure 60 psi Water head pressure 60 psi
Water2 00440 5060 4276 101 43 (Wt 000Kg)
Propane 152 1493 237 50 27 11880 1004 (Wt 000Kg)
Time 133000 134150 01150 na na na na (hrmnsc)
1 Energy value based upon absorbed heat (italics) from STP to 1000degK (0446 BTUg for Air 115 BTUg water) Underlined value is released heat at generally accepted 44 BTUg
Air (Wt 000Kg)
Component(BTU) Start Wt End Wt Net Wt Energy1
(BTU) Power
(BTUmin) Power (HP) Efficiency3
661 460 201 938 1294 30 36
Water2
(Wt 000Kg)
Propane(Wt 000Kg)
Time (hrmnsc)
1562
123000
1556
123715
00125
006
00715
380
2640
na
523
364
na
12
86
14
50
na na
Air (Wt 000Kg)
Component(BTU) Start Wt
5 Variable High Speed Run Air Pressure 60 psi Water head pressure 70 psi
End Wt Net Wt Energy1
(BTU) Power
(BTUmin) Power (HP) Efficiency3
654 472 182 849 718 17 7
2 Determined by difference from Propane and Air Energy assumed value 90 3 Arbitrary estimated efficiency of heat transfer not effective work
The two known quantities in each run is the weight of the air moving through the system and the weight of the propane heating that air The variable is the quantity of water heated to steam temperatures and above In Run 3 at 90 efficiency that mass of water calculates to 125 grams at 50 it drops to 33 grams In Run 5 at 90 efficiency that mass of water calculates to 86 grams at 50 it drops to 44 grams
FEDERAL TRANSIT ADMINISTRATION 39
APPENDIX A HEAT TRANSFER EFFICIENCY MODELING RUNS 3 AND 5 50 AND 90
As the comparison tables below show the uncertainty in the efficiency of heat transfer is manifest only in the mass of water heated to steam to do useful work
Data 90 Efficiency
Air
Component Run 3 BHP
Run 5 BHP
Net ChngBHP
-45
Run 3 Mass
Transfer (kg)
Run 5 Mass
Transfer (kg)
Net ChangeMass
Transfer (kg)
30 17
197
237
2010 182 -9
Water
Propane
Duration (mn)
47
86
725
422
0060
0013
725
0270
0086
1180
588
350
163 1180
276
163
Data 50 Efficiency
Air
Component Run 3 BHP
Run 5 BHP
Net ChngBHP
-45
Run 3 Mass
Transfer (kg)
Run 5 Mass
Transfer (kg)
Net ChangeMass
Transfer (kg)
30 17
101
237
2010 182 -9
Water
Propane
Duration (mn)
12
86
725
817
0060
0003
725
0270
0044
1180
1233
350
163 1180
276
163
Regardless of the specific efficiency Run3 reflects an air-rich propellant mix while Run 5 was clearly the more powerful and steam-rich propellant If 50 efficiency is a more realistic figure than 90 the only consequence is more water passing through the heater expander and recovery tank The only consequence for overall system efficiency is the slight but added work required to move the additional water by pump to the top of the water column
FEDERAL TRANSIT ADMINISTRATION 40
APPENDIX Acronyms B
BHP Boiler Horsepower
BRASH Binary Recovery Air-Steam Hybrid
BTU British Thermal Unit
CC Cubic centimeter
CFM Cubit feet per minute
CHP Combined heat and power
CNG Compressed natural gas
CO2 Carbon dioxide
CU Cubic
DARPA Defense Advanced Research Projects Agency
DGE Diesel gallon equivalent
DOT Department of Transportation
EC External combustion
EIA Energy Information Administration
EPA Environmental Protection Agency
FTA Federal Transit Administration
GGE Gasoline gallon equivalent
HP Horsepower
IC Internal combustion
K Kelvin
Kcal Kilocalorie
MPG Miles per gallon
MPH Miles per hour
OEM Original equipment manufacturer
PSI Pounds per square inch
RPM Revolutions per minute
SBIR Small Business Innovation Research
STP Standard temperature and pressure
FEDERAL TRANSIT ADMINISTRATION 41
FEDERAL TRANSIT ADMINISTRATION 128
US Department of TransportationFederal Transit AdministrationEast Building1200 New Jersey Avenue SEWashington DC 20590httpwwwftadotgovresearch
US Department of Transportation Federal Transit Administration East Building 1200 New Jersey Avenue SE Washington DC 20590 httpwwwftadotgovresearch
FEDERAL TRANSIT ADMINISTRATION 42
- Button1
- Button2
- Button3
- Button4
- Button5
- Button6
- Button7
- Button8
- Button9
- Button10
- Button11
- Button12
- Button13
- Button14
- Button15
- Button16
- Button17
- Button18
- Button19
- Button20
- Button21
- Button22
- Button23
- Button24
- Button25
- Button26
- Button27
- Button28
- Button29
- Button30
- Button31
- Button32
- Button33
- Button34
- Button35
- Button36
- Button37
- Button38
- Button39
- Button40
- Button41
- Button42
- Button43
- Button44
- Button45
- Button46
- Button47
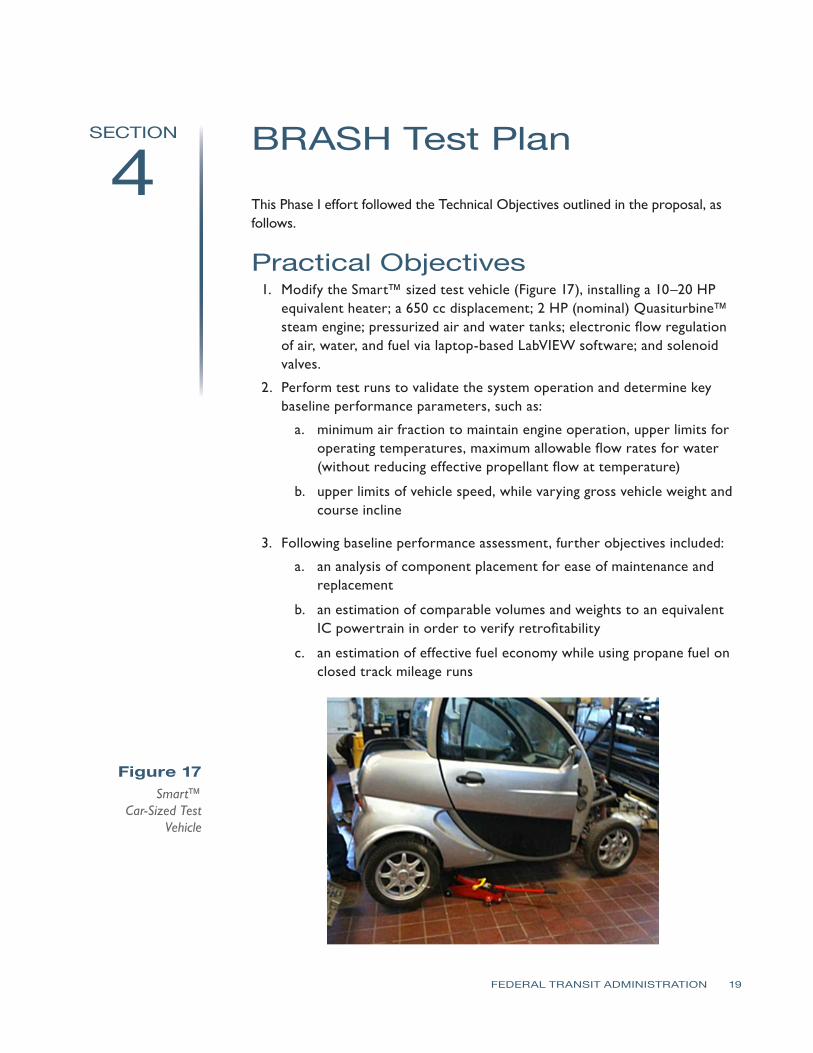

SECTION 4 BRASH TEST PLAN
4 Over the course of multiple test runs a cumulative assessment of component performance and reliability would lead to a gross verification of BRASH engine integrity and range That in turn could lead to off-site vehicle demonstrations to federal agencies potential industry partners and investors
Analytical Objectives 1 The BRASH engine model has been demonstrated only at a bench level with
rudimentary understanding of its operating principles A key objective in this vehicle build is to increase the thermodynamic modeling of this technology including an analysis of mass flow (air water fuel) and resulting power
2 Early test data would lead to analysis of specific on-vehicle capacities (for air water and fuel) and flow rates for same in order to estimate operating range recovery strategies and rates (recompression and condensation) and the parasitic loads (eg alternators pumps) to sustain useful operation for many hours
3 Over time the vehicle testing under various test conditions (eg varying gross vehicle weight wheel load engine temperature propellant mix) will lead to a body of data to support more complete modeling of water fraction vs torque vs temperature These data are essential to real-world estimation of fuel economy as this technology scales to larger practical vehicle applications
4 With the modeling from 3 in place for steady-state operation practical track runs with frequent starts and stops can further shape the model for real-world use
5 The analysis from steps 1ndash4 will provide sufficient basis for estimating the mass flow heat component capacity recovery factors and fuel economy for scaling this 2 HP test data to larger vehicles in two decade steps first to a 20 HP pickup truck and then further modeling and custom buildup of a 200 HP power plant with a DOT-identified industrial partner
6 This analytical plan is consistent with the overall SBIR program plan as the 2HP effort is confined to Phase I the 20 HP build and test plan would be accomplished in Phase II and the design and build of the 200 HP power plant would be accomplished in Phase III with an established industry partner
The work effort toward completion of these tasks has proceeded on two tracks mechanical modifications to the April test vehicle and electronic control and measurement
Mechanical Modifications and Test Configuration The test vehicle is a modified electric car about the size of a Smarttrade car Earlier modifications included removal of the electric drive train exposing a large working
FEDERAL TRANSIT ADMINISTRATION 20
SECTION 4 BRASH TEST PLAN
space behind the cab This rear space over the rear left wheel contains a 2HP Quasiturbinetrade steam engine20 selected for its compact design and suitable power range for this 700-pound vehicle The placement over the left wheel permits direct drive to that wheel via electric clutch and chain drive
Figure 18 Quasiturbinetrade
Rotary Expander Installed and Interior View
In the center of center of this rear space a heavily-modified propane space heater rated at 30000ndash80000 BTUhr (equivalent to 11ndash31 boiler horsepower [bhp]) was installed Heaters of this type generally are designed to efficiently distribute heat into an adjoining space This heater was heavily modified with high temperature insulation and outer shells to retain useful heat to the 20-ft stainless steel coil passing through its core
Figure 19 Quasiturbinetrade
Rotary Expander Installed and Interior View
the expander and heater (with recent refinements) Also visible under the heater is the pressurized water tank (painted grey) The open space to left of the heater is reserved for drive components The space to the right of the heater is reserved for recovery and recompression of the expanded propellant (Recompression is outside of the current scope to simplify the testing and analysis See discussion section for more information) Other system components include air cylinders and electronic controllers that are mounted forward of the rear firewall in the cab or under the front hood
Figure 20 shows the back of the vehicle with fenders and trim removed revealing
20Quasiturbinetrade Product Details httpquasiturbinepromciqcca
FEDERAL TRANSIT ADMINISTRATION 21
SECTION 4 BRASH TEST PLAN
Figure 20 Test Configuration
Figure 21 System Components
The main system components are shown Minor components and linkage tomechanical output are not included in this report for the sake of simplicity
Electronic Control and Measurement No realistic progress toward a vehicle demonstrator with known and regulated fuel use can proceed without electronic regulation In this build the LabVIEW program and system components from National Instruments were used to create a ldquoglass cockpitrdquo of vehicle controls and performance measurement21 The simplified schematic in Figure 22 shows the planned integration of electronics in this development LabView-compatible components will replace all mechanical flow and measurement components
21More information can be found at National Insturments The LabVIEW Environment httpwwwnicomlabview
FEDERAL TRANSIT ADMINISTRATION 22
SECTION 4 BRASH TEST PLAN
Figure 22 Electronics
Schematic for Air-Steam Hybrid
For the vehicle driver the dashboard collection of gauges has been replaced with a laptop screen similar to the one pictured in Figure 23
Figure 23 Front Screen Display for Air-Steam Hybrid
Certain features on this front screen will reflect user input (OnOff Throttle) while others reflect the dependent variables in the process (Heater Temp Fuel Flow Air and Water Flow) Shown on the bottom screen will be running time-series data on speed wheel load temperature specific fuel consumption and the other variables important to the analytical process The front screen display is generated from programming and controls on the back screen display
FEDERAL TRANSIT ADMINISTRATION 23
SECTION 4 BRASH TEST PLAN
Figure 24 Back Screen Display for Air-Steam Hybrid
LabVIEW software and controllers were chosen because of National Instrumentsrsquo status as the industry leader in rapid control prototyping and In-Vehicle data-logging solutions BKi purchased the LabVIEW componentry through the University of Connecticut Mechanical Engineering Department as part of UConnrsquos ongoing support of the project
By the end of the contract term in October 2010 the air and water regulation components were complete and operational but the fuel regulation and engine speed components were not yet fully operational To generate the most meaningful data under these circumstances the test vehicle was configured for extended operation to determine specific fuel water and air consumption rates The combination of these rates provided the basis for initial estimates of power and efficiency
Summary of Effort Mechanical Modifications
1 Removal of original electrical drive components reinforcement of frame
2 Installation of Quasiturbinetrade 2HP engine modified heater pressurized water tank all pneumatic water and fuel lines
3 Baseline validation testing using manual controls
4 Installation of electronically-regulated flow controllers
Electronic Modification 1 Acquisition of computer electronic regulators and control software
2 LabVIEW systems programming
3 System checkout
FEDERAL TRANSIT ADMINISTRATION 24
SECTION 4 BRASH TEST PLAN
Testing and Analysis 1 Static Safety Testing 2 Baseline vehicle drivetrain testing
3 Vehicle static testing (Runs 3 amp 5)
Summary of RequirementsGoals 1 Safe operation of vehicle during static and motive applications
2 Qualitative demonstration of BRASH engine capability to move test vehicle on flat and inclined road surface
3 Quantitative determination of air water and fuel consumption during timed static test
4 Quantitative determination of air water and fuel consumption while varyshying water and fuel fractions
Summary of Testing Two experiments were performed in late November the first to establish minimum fuel and propellant flow rates for sustained operation at low speed (air-rich mode) and the second to establish reasonable upper limits of fuel and propellant flow at higher engine speeds (steam-rich mode) Variation in the air-steam mix is the underlying theory of operation for the BRASH engine the air fraction provides a baseline flow for initial start-up and low-speed operation but the addition of water (as steam) to the propellant results in a significant boost in range and power These two tests have verified this underlying theory
Test Conditions The two test runs summarized in this report are 3 on November 22 2010 and 5 on November 26 2010 Both tests were performed at the Depot D campus of the University of Connecticut in Storrs The testing was performed outside in seasonal conditions 45-50degF with light winds
Figure 25 Vehicle Test Setup
FEDERAL TRANSIT ADMINISTRATION 25
SECTION 4 BRASH TEST PLAN
Each run was a dynamic test with no load on the two-cylinder Quasiturbinetrade engine The propane cylinder was suspended from a scale for the duration of the test Propane fuel consumption was monitored continuously by digital scale with a display accuracy of 001kg
Each test run lasted for the duration of one high pressure air cylinder Air cylinder start (full) and end (empty) were determined at the start and finish of each run using the same scale and accuracy Water levels initially were determined volumetrically but the results were too inconsistent Displaced volume of liquid water proved a poor measure of the quantity heated to steam and carried forward for productive work For this reason water is an estimated quantity based upon fuel quantity burned less heat absorbed by the air fraction (Further integration of the LabView controller software in the next phase will obviate this work-around)
Each of the complete test runs may be viewed at Brash Engines website httpwwwbrashenginescom Photos from each run appear in the figures that follow Tables 1 and 2 summarize the productive mass flow for air water and propane fuel to produce work from the engine for the test duration
The cab interior in Figure 26 shows the high pressure air cylinder below the steering wheel and the laptop computer (regulating propellant flow) in passenger seat space The LabView controllers reside in the protective case under the laptop
Figure 26 Vehicle Cab with Controller Laptop
During each test hot propellant was allowed to expand and vent to ambient in order to simplify the thermodynamic model and analysis (Note the plumes of water vapor from each exhaust hose and the small puddles of water under each hose in Figure 27)
FEDERAL TRANSIT ADMINISTRATION 26
SECTION 4 BRASH TEST PLAN
Figure 27 Exhaust Plumes from Expander
Development plans include recovering the expanded propellant separating into water and air phases and then recompressing the air fraction for re-use This will both improve efficiency and eliminate the visible vapor plume
Test Assumptions Another estimation used in this study is the efficiency of heat transfer for the propellant through the 20-ft coil of stainless steel inside the insulated heater Figure 28 shows an early ldquoair-onlyrdquo test run with the current heater The hose failure and melting of the steel wire mesh inside (note formed ball in the mesh) indicates 1300degK temperatures exiting the hot section
Figure 28 Hose Failure Due
to Overheating
FEDERAL TRANSIT ADMINISTRATION 27
SECTION 4 BRASH TEST PLAN
Effective heat transfer (as Figure 28 shows) does not equal efficient heat transfer but the ability to deliver 1300degK air from a well-insulated burner suggests a highly efficient transfer of heat The analysis of results assumes a value of 90 efficiency (See Appendix A for a discussion of heat transfer efficiency)
3 Low Speed Test On November 22 2010 Run 3 tested the lower operating limits of the test setup Low limit in this context meant sufficient pressure to maintain expander rotation but low steam and fuel burn The test commenced with a full air cylinder weighing 661 Kg At the end of the test the empty cylinder weighed 460 Kg Over the 7 minutes and 15 seconds of testing 006 Kg of propane was consumed
The mass of air and fuel was determined from before after run test weights As stated earlier determining the quantity of steam produced from the pressurized water tank was problematic because of the quantity of stored water the resistance to water flow under dynamic pressures and the potential for some fraction of the water (in liquid state) to be entrained in the propellant mix
To solve for this unknown the energy required to raise the known quantity of air from ambient to 1000degK (33kcalmol or 0467 BTUg) was subtracted from the energy content of the propane consumed (44 BTUg) and then the efficiency of the heat transfer process was de-rated by 10 percent to yield a net quantity of 1438 BTUs to elevate ambient temperature water to 1000degK steam The result is an estimated 125 grams of water consumed in the 7-minute test
Table 1 summarizes these data and shows a high reliance on the air fraction for the work performed by the 2 HP engine The air cylinder used in this test has a measured free volume of 45 cubic feet (1274 liters at STP) which means sustained flow rates of 62 cubic feet per minute (cfm) or 175 liters per minute In contrast the 125 grams of water passed through as steam produced an estimated equivalent gas volume of 155 liters at STP Note the modest levels of water vapor in Figure 29 Why the greater air fraction relative to water flow in this test
Air (Wt 000Kg) 661 460 201 938 1294 30 36
Water2
(Wt 000Kg)
Propane(Wt 000Kg)
Time (hrmnsc)
1562
123000
1556
123715
00125
006
00715
1438
2640
na
1983
364
na
47
86
54
90
1 Energy value based upon absorbed heat (italicized) from STP to 1000degK (0446 BTUg for Air 115 BTUg water) 2 Determined by difference from propane and air energy assumed value 90 3Arbitrary estimated efficiency of heat transfer not effective work
11222010 - 3 Low Speed Run Air Pressure 60 psi Water Head Pressure 60 psi
Component(BTU) Start End Net Energy1
(BTU) Power
(BTUmin) Power (HP) Efficiency3
Table 1 Analysis of Mass
Flow Data at Low Speed
FEDERAL TRANSIT ADMINISTRATION 28
SECTION 4 BRASH TEST PLAN
Figure 29 Low-Speed Test Results in Little
Water Vapor
In this baseline experiment the single cylinder provides 60 psi air flow and 60 psi static ldquoheadrdquo pressure on the water column The air flow from the cylinder is biased toward the generally less restrictive flow path for air The water column under the same pressure presents a higher viscosity medium passing through a greater number of valves and restrictions At the point of injection the air fraction flows more freely into the hot section In order to bias the mix toward greater water fraction (and greater power) the head pressure on the water column must be increased over the 60 psi air line pressure
Run 4 (not documented here) evaluated head pressures from 110 psi to 70 psi and determined that modest differential pressures retarded the flow from the air fraction and boosted flow of the water fraction Still higher differential pressures effectively stopped air flow altogether reverting the engine operation to ldquosteam onlyrdquo For Run 5 an additional cylinder was used to apply a 70 psi static head pressure on the water column a 10 psi differential over the 60 psi air line pressure
5 Variable High Speed Test On November 26 2010 Run 5 tested the higher differential water pressure as a means to increase the effective water fraction in the propellant mix The test commenced with a full air cylinder weighing 654 Kg At the end of the test the empty cylinder weighed 472 Kg Run 5 was interrupted after 243 minutes to refill the water tank and then testing resumed for an additional 907 minutes Over the whole test 027 Kg of propane was consumed
Using the same analytical basis as Test 3 Test 5 data indicate a substantial increase in work capacity (as measured by fuel consumed and steam generated) over the 3 baseline
FEDERAL TRANSIT ADMINISTRATION 29
112610 - 5 Variable High Speed Run Air Pressure 60 psi Water Head Pressure 70 psi
Air (Wt 000Kg)
Component(BTU) Start End Net Energy1
(BTU) Power
(BTUmin) Power (HP) Efficiency3
654 472 182 849 718 17 7
SECTION 4 BRASH TEST PLAN
Table 3 Comparison of Mass Flows
Water 588 Runs 3 and 5
163 Duration (mn) 725 1180 725 1180 163
Air
Component Run 3 BHP
Run 5 BHP
Net ChngBHP
Run 5 Mass
Transfer (kg)
Net ChangeMass
Transfer (kg)
30 17
197
237
-45 2010 182 -9
Run 3 Mass
Transfer (kg)
276 350
47
86
422
0060
0013
0270
0086
Propane
This difference in steam fraction and power is more clearly seen in Figure 30 (and on the source video at the Brash Engines website)
Figure 30 Three Images from Run 5
Table 2 Test 5 Results with Increased
Water and Fuel Water2
(Wt 000Kg) 0860 9890 8358 197 83
Propane(Wt 000Kg) 1520 1493 27 11880 1004 237 90
Time (hrmnsc) 133000 134150 01150 na na na na
1 Energy value based upon absorbed heat (italics) from STP to 1000degK (0446 BTUg for Air 115 BTUg water) Underlined value is released heat at generally accepted 44 BTUg 2 Determined by difference from propane and air Energy assumed value 90 3 Arbitrary estimated efficiency of heat transfer not effective work
The increase in pressure on the water column by 10 psi reduced air flow by 9 percent but increased the steam fraction considerably and thereby increased the effective boiler horsepower nearly three-fold to 237 bhp (assuming 90 heat transfer) These data are summarized in Table 3
FEDERAL TRANSIT ADMINISTRATION 30
SECTION 4 BRASH TEST PLAN
As with Run 3 start up from Time Zero was immediate burner on air flow begins and water flow under pressure commences immediately Another impressive feature of the mix air-steam propellant system is the ability to start stop and rapidly accelerate as shown in the full Run 5 video Run 5 serves as validation that this patented technology has unique performance benefits over air steam or internal combustion alone
Lessons Learned A comparison of the two test runs verifies some key points
1 The same power plant can produce variable power and fuel economy based upon power demand and airsteam mix
2 Although imprecise at this point in testing fuel consumption appears directly proportional to engine speed The engineexpander will spool up spool down stop and restart in a manner consistent with fuel and propellant flow The Run 5 video on the Brash Engines website verifies this conclusion
3 The use of a defined static air pressure ldquoheadrdquo over the water column at a pressure higher than the defined air line dynamic pressure provides a safe and predictable bias toward flow from the water fraction
4 Although the current test configuration offers sufficient performance for this initial demonstration phase the following observations are in order
a The heater path is too long creating latent response issues
b The airwater injector is not optimized for proper mix or flow capacity
c The incomplete integration of LabVIEW compromises the quality of data
d The absence of a measured variable load on the expander compromises any analysis of power and fuel economy
5 The design migration to a vehicle installation was premature The project should move back to a lab bench study to refine the regulation of components complete the recovery and recompression portions of the system and use electromechanical loads to estimate power and useful work for specific quantities of fuel water and air
6 The Quasiturbinetrade engine technology is promising but too immature for larger-scale modeling Later phases of the project should rely on more conventional multi-cylinder piston-type expander
Estimated Fuel Economy Mass transit authorities have relied on large diesel engines such as the Detroit Diesel Series 50 and Series 60 engines for more than 30 years Reports on fuel economy vary from a high of 60 miles per gallon (Diesel) for longer-range
FEDERAL TRANSIT ADMINISTRATION 31
SECTION 4 BRASH TEST PLAN
commuter services in California23 to a low of 228 miles per gallon (Diesel) for city buses with frequent stops in New York City24 In both cited studies the migration to compressed natural gas (CNG) has resulted in lower fuel economies on a Diesel Gallon Equivalent (DGE) basis
Table 4 summarizes this study (columns 2 and 3) and the next proposed phase (columns 4 and 5) the performance of the current fleet of mass transit buses (columns 6 and 7) and the likely outcome if the Besler engine (described earlier) were employed with the air-steam hybrid technology (columns 8 and 9)
Table 4 Comparison of
Fuel Economies
Air
1
Configuration
Engine
HP
Torque
Fuel
gmin
BTUhr
GGEhr
mpg 60mph
GGE100 mi
$ per GGE
$100 mi
Current
Example
2
3
3
5
4
Bench
5
S-10
6
SB Bus
7
NYCT
8
50 eff
9
30 eff
86
Quasi
2
Prop
82
216
02
3160
03
30
09
Current
237
Quasi
2
Prop
23
607
05
1126
09
30
27
UC 1
40
6 cyl
20
Prop
40
1056
09
648
15
30
46
UC 2
80
6 cyl
40
Mix
80
2112
19
324
31
30
93
MCI102
DD S60
350
1450
Diesel
540
11400
100
60
167
35
583
Diesel
23
439
35
1535
300
Besler
150
1200
Mix
300
792
695
864
1158
16
1853
500
Besler
150
1200
Mix
500
1320
1158
518
1930
16
3088
The Besler engine is shown in two columns The left column reflects the higher efficiency anticipated with the air-steam hybrid mix described earlier as at or near 50 percent The right column reflects the historical efficiency realized with steam engine technology The italicized numbers near the bottom of the column show that even at historical efficiencies the Besler engine would offer equal or better Gasoline Gallon Equivalent (GGE)100 mile ratings of the current diesel technology but migrating toward less refined and (therefore) less expensive fuels would significantly reduce the operating cost ($mile)
23Demonstration of Caterpillar C-10 Dual-Fuel Engines in MCI 102DL3 Commuter Buses National Renewable Energy Laboratory httpwwwnrelgovdocsfy00osti26758pdf p 7 24R Barnitt ldquoNew York City Transit (NYCT) Hybrid (125 Order) and CNG Transit Buses Final Evaluation Resultsrdquo November 2006 National Renewable Energy Laboratory K Chandler Battelle Technical Report NRELTP-540-40125 November 2006 httpwwwnrelgovvehiclesandfuelsfleettestpdfs40125pdf pvii
FEDERAL TRANSIT ADMINISTRATION 32
SECTION 4 BRASH TEST PLAN
There are of course two orders of magnitude difference between the results of Runs 3 and 5 and the daily demands of city and commuter buses but the mere existence of the Besler Twin and the Brooks V-8 400 HP engine suggests an opportunity for fuel economy and fuel variety
Proposed further support for the next phase of development will advance the air-steam hybrid technology by an important order of magnitude This would provide the data confidence to scale to larger vehicle operation and garner the interest of one or more engine or vehicle OEMs
Figure 31 MTANew York City
Transit Orion VII Next Generation
Hybrid Transit Bus
Next Development Phase The next phase of development will incorporate a modern six-cylinder steam engine design with a displacement of 53 cubic inches and capable of sustained 15-25 HP operation The expander will be supplied by Steam Engine Power Inc (httpwwwsteamenginepowercom) This expander will drive an alternator generator to measure effective work output in watts as well as provide sufficient power to satisfy the system parasitic loads of battery recharge exhaust air recompression and all other pump and valve operations
Figure 32 (l to r) Six-Cylinder Expander Power Generation Load
Small 24 VDC Compressor
FEDERAL TRANSIT ADMINISTRATION 33
SECTION 4 BRASH TEST PLAN
Static pressure for the water column will still be supplied via compressed air cylinder but the dynamic air flow will be supplied by an oil-less air compressor of the size and type shown This 24 VDC compressor will recompress the recovered air exiting the expander to 40ndash60 psi pressure and support flows of 3ndash4 cubic feet per minute (cfm) These three components are off-the-shelf enhancements to the system but custom engineering of a new more powerful and more responsive heater completion of the electronic integration and design and fabrication of the recoveryrecompression components are necessary tasks that must be included to make the next generation assembly work to its potential This work will be accomplished largely by Mechanical and Electrical Engineering students at the University of Connecticut under the supervision of faculty and Brash Engines personnel
When this build is complete all operations will be under LabVIEW control All expander operations will be measured for power and work Once the bench version is in control a modified version will be installed in a small pickup truck (eg Chevrolet S-10) for further verification of system performance and robustness
During this phase a new and promising technology will be investigated a new and faster class of solenoid valves from National Instruments These solenoid valves with an unprecedented 3 msec response time have the potential of allowing air-steam retrofit in existing engine blocks The solenoid valves could replace the spark plugs in conventional IC engines and provide the equivalent timed injection of hot propellant mix as the timed firing of a spark plug in the presence of a fuel air mix
If possible these fast solenoids and the black box programming to control them could allow very easy portability to larger vehicles and easier retrofit Potentially a V-6 engine could operate 4 cylinders for expansion and the remaining two cylinders could be used as direct drive compressors with different but equivalent solenoid valves controlling the compression process
FEDERAL TRANSIT ADMINISTRATION 34
SECTION Development Plan 5 and Next Steps
This current effort is a key first-proof of concept for this air-steam hybrid technology but our goals extend well beyond this two-seat 2 HP demonstrator The lessons learned in electronic integration will allow rapid migration to larger platforms using the same basic controls but scaling the expander heater and other mass-flow components to vehicle-appropriate size That project identified as ldquo20 HP Vehiclerdquo and other near-term derivative projects are listed in Table 5
BRASH Project
ProposedFunding Source
Funds Reqd $K Project Description
SUV-size proof-of-concept for reliable 20 HP Vehicle DOTUSPS 300 highway performance maildelivery
vehicle size
Proof-of-concept mass transit busshy200 HP Vehicle DOTDOD 600 retrofit scaled to city bus capacity and
suitable for replacement of over-the-road diesel engines
Table 5 Project Funding
Stationary Power Unit Micro-CHP Equivalent
DARPA 300 Proof-of-concept mass transit bus-retrofit scaled to city bus capacity and suitable for replacement of over-the-road diesel engines
Summary Alternative Processed Solid Fuel DOE EPA DOA 600
Processed mix of hydrolyzed wood pulp processed solid waste and other combustible solids in an extrudable mass with alcohol solutevehiclemdashdemonstrate utility in vehicles as a high energy content clean burning fuel for EC engines
Demonstrate effective pyrolysis of
Binary Solid Gas Fuel
EPA Waste Management BFI
400 processed solid fuels in a binary fuel burner conventional fuel (gasoline natural gas) provides primary heat source for pyrolysis temperatures
Proof of Concept OEM Power Plant
Vehicle OEM (eg Ford GM Caterpillar) 1200
Development of direct replacement BRASH engine alternative to existing OEM IC engine
Black Box Integration of Controller Software
Vehicle OEM (eg Ford GM Caterpillar)
1600 Development of commercial BRASH system alternative to existing OEM IC engine
FEDERAL TRANSIT ADMINISTRATION 35
SECTION 5 DEVELOPMENT PLAN AND NEXT STEPS
The issuance of US Patent 7743872 five months ago has two important consequences for this project First it serves to validate the underlying technology the combination of air and steam in an EC engine is better than steam or air alone Second it provides a basis for full and open discussions with government agencies and large commercial interests in the transportation and power sectors
Our efforts at promotion have been delayed pending successful demonstration of the Smarttrade car vehicle to allow the first detailed real-world performance data to be distributed
Coupling that performance data with the option of migration away from refined petroleum should spark significant interest If we can move to a high lignin-processed wood pulp that costs $045 per gasoline gallon equivalent (an arbitrary value for example only) and consumes more CO2 while growing than is consumed in processing as a fuel and produced from combustion then we succeed as a project and as a global game-changing technology for many uses Improvements in fuel economy are important but of greater importance is the migration to low-process biomass fuels
FEDERAL TRANSIT ADMINISTRATION 36
SECTION Potential Applications and Societal Value 6 The whole premise behind the BRASH air steam hybrid is that external combustion offers a more benign and environmentally-appropriate way to power large vehicles and other portable equipment than refined petroleum-powered internal combustion
bullCombustion heat can be derived from any fuel source including processed solids from fast-growing renewables such as poplar trees waste corn stalks or switch grass
bullThat combustion heat is applied at a rate consistent with the work to be done and not to support idling and other unproductive fuel use
Using a mix of air and steam as working fluids in the engine allows
bullImmediate startup from an ldquoair-onlyrdquo start
bull Managed system pressure through use of a defined head air pressure
bullManaged fuel burn as the air-steam fraction is adjusted to match wheel load
bullAdjusted wheel load reduces fuel burn
Integration of modern control circuitry with external combustion also brings a level of performance operational simplicity and safety heretofore unavailable
FEDERAL TRANSIT ADMINISTRATION 37
SECTION
7 Phase I Conclusions
The last steam train in scheduled service in the US departed on October 11 196225 One year earlier Robert Noyce received the first patent for an integrated circuit26 But for that brief one-year overlap the most powerful motive power technology was never harnessed by the black box controls that grew out of Noycersquos invention so the diesel-powered IC engine championed by Henry Ford won out
Now nearly 50 years later the modern IC engine cannot operate efficiently without the benefit of black box electronicsmdashbut that technology still presents intractable challenges of supply safety and environmental impact The air-steam hybrid technology may offer an alternative and a glimpse of that potential is presented here and viewable in Run 5 on the Brash Engines website at http wwwbrashenginescom
While demonstration in a test vehicle provides a strong visual message that BRASH technology works the commercial success of this technology will depend upon reliable repeatable measurement of power and economy For that data the Phase 2 effort will require a return to laboratory bench testing and effective demonstration of recovery of the water and air fractions
The results of this Phase I project collectively demonstrate the technical feasibility and commercial potential of the BRASH air-steam hybrid engine technology The initial DOT SBIR funding has been highly effective in facilitating this important proof of concept and laying the groundwork for further technology refinement and application
As described earlier the next steps are clear and appear to combine achievable and rapid major advances with low developmental risk SBIR Phase 2 support is needed for those advances due to the still-early stage of development that restricts access to private capital
The immense potential value of this technology has been enhanced and verified in Phase 1 there is now a clear and low-risk path ahead to larger-scale testing further component and controls refinement specific applications prototyping and pre-commercial deployments
25William Rosen The Most Powerful Idea in the World Random House 2010 p 311 26US Patent 2981877
FEDERAL TRANSIT ADMINISTRATION 38
APPENDIX
A Heat Transfer Efficiency Modeling Runs 3 and 5 50 and 90
Much of the analysis for Runs 3 and 5 is based on an assumed efficiency of 90 for heat transfer from the combustion of propane to heating of the water air mix in the coil As a test for the reasonableness of that assumption the same data have been modeled at a much lower 50 factor below
112210 - 3 Low Speed Run Air Pressure 60 psi Water head pressure 60 psi
Water2 00440 5060 4276 101 43 (Wt 000Kg)
Propane 152 1493 237 50 27 11880 1004 (Wt 000Kg)
Time 133000 134150 01150 na na na na (hrmnsc)
1 Energy value based upon absorbed heat (italics) from STP to 1000degK (0446 BTUg for Air 115 BTUg water) Underlined value is released heat at generally accepted 44 BTUg
Air (Wt 000Kg)
Component(BTU) Start Wt End Wt Net Wt Energy1
(BTU) Power
(BTUmin) Power (HP) Efficiency3
661 460 201 938 1294 30 36
Water2
(Wt 000Kg)
Propane(Wt 000Kg)
Time (hrmnsc)
1562
123000
1556
123715
00125
006
00715
380
2640
na
523
364
na
12
86
14
50
na na
Air (Wt 000Kg)
Component(BTU) Start Wt
5 Variable High Speed Run Air Pressure 60 psi Water head pressure 70 psi
End Wt Net Wt Energy1
(BTU) Power
(BTUmin) Power (HP) Efficiency3
654 472 182 849 718 17 7
2 Determined by difference from Propane and Air Energy assumed value 90 3 Arbitrary estimated efficiency of heat transfer not effective work
The two known quantities in each run is the weight of the air moving through the system and the weight of the propane heating that air The variable is the quantity of water heated to steam temperatures and above In Run 3 at 90 efficiency that mass of water calculates to 125 grams at 50 it drops to 33 grams In Run 5 at 90 efficiency that mass of water calculates to 86 grams at 50 it drops to 44 grams
FEDERAL TRANSIT ADMINISTRATION 39
APPENDIX A HEAT TRANSFER EFFICIENCY MODELING RUNS 3 AND 5 50 AND 90
As the comparison tables below show the uncertainty in the efficiency of heat transfer is manifest only in the mass of water heated to steam to do useful work
Data 90 Efficiency
Air
Component Run 3 BHP
Run 5 BHP
Net ChngBHP
-45
Run 3 Mass
Transfer (kg)
Run 5 Mass
Transfer (kg)
Net ChangeMass
Transfer (kg)
30 17
197
237
2010 182 -9
Water
Propane
Duration (mn)
47
86
725
422
0060
0013
725
0270
0086
1180
588
350
163 1180
276
163
Data 50 Efficiency
Air
Component Run 3 BHP
Run 5 BHP
Net ChngBHP
-45
Run 3 Mass
Transfer (kg)
Run 5 Mass
Transfer (kg)
Net ChangeMass
Transfer (kg)
30 17
101
237
2010 182 -9
Water
Propane
Duration (mn)
12
86
725
817
0060
0003
725
0270
0044
1180
1233
350
163 1180
276
163
Regardless of the specific efficiency Run3 reflects an air-rich propellant mix while Run 5 was clearly the more powerful and steam-rich propellant If 50 efficiency is a more realistic figure than 90 the only consequence is more water passing through the heater expander and recovery tank The only consequence for overall system efficiency is the slight but added work required to move the additional water by pump to the top of the water column
FEDERAL TRANSIT ADMINISTRATION 40
APPENDIX Acronyms B
BHP Boiler Horsepower
BRASH Binary Recovery Air-Steam Hybrid
BTU British Thermal Unit
CC Cubic centimeter
CFM Cubit feet per minute
CHP Combined heat and power
CNG Compressed natural gas
CO2 Carbon dioxide
CU Cubic
DARPA Defense Advanced Research Projects Agency
DGE Diesel gallon equivalent
DOT Department of Transportation
EC External combustion
EIA Energy Information Administration
EPA Environmental Protection Agency
FTA Federal Transit Administration
GGE Gasoline gallon equivalent
HP Horsepower
IC Internal combustion
K Kelvin
Kcal Kilocalorie
MPG Miles per gallon
MPH Miles per hour
OEM Original equipment manufacturer
PSI Pounds per square inch
RPM Revolutions per minute
SBIR Small Business Innovation Research
STP Standard temperature and pressure
FEDERAL TRANSIT ADMINISTRATION 41
FEDERAL TRANSIT ADMINISTRATION 128
US Department of TransportationFederal Transit AdministrationEast Building1200 New Jersey Avenue SEWashington DC 20590httpwwwftadotgovresearch
US Department of Transportation Federal Transit Administration East Building 1200 New Jersey Avenue SE Washington DC 20590 httpwwwftadotgovresearch
FEDERAL TRANSIT ADMINISTRATION 42
- Button1
- Button2
- Button3
- Button4
- Button5
- Button6
- Button7
- Button8
- Button9
- Button10
- Button11
- Button12
- Button13
- Button14
- Button15
- Button16
- Button17
- Button18
- Button19
- Button20
- Button21
- Button22
- Button23
- Button24
- Button25
- Button26
- Button27
- Button28
- Button29
- Button30
- Button31
- Button32
- Button33
- Button34
- Button35
- Button36
- Button37
- Button38
- Button39
- Button40
- Button41
- Button42
- Button43
- Button44
- Button45
- Button46
- Button47
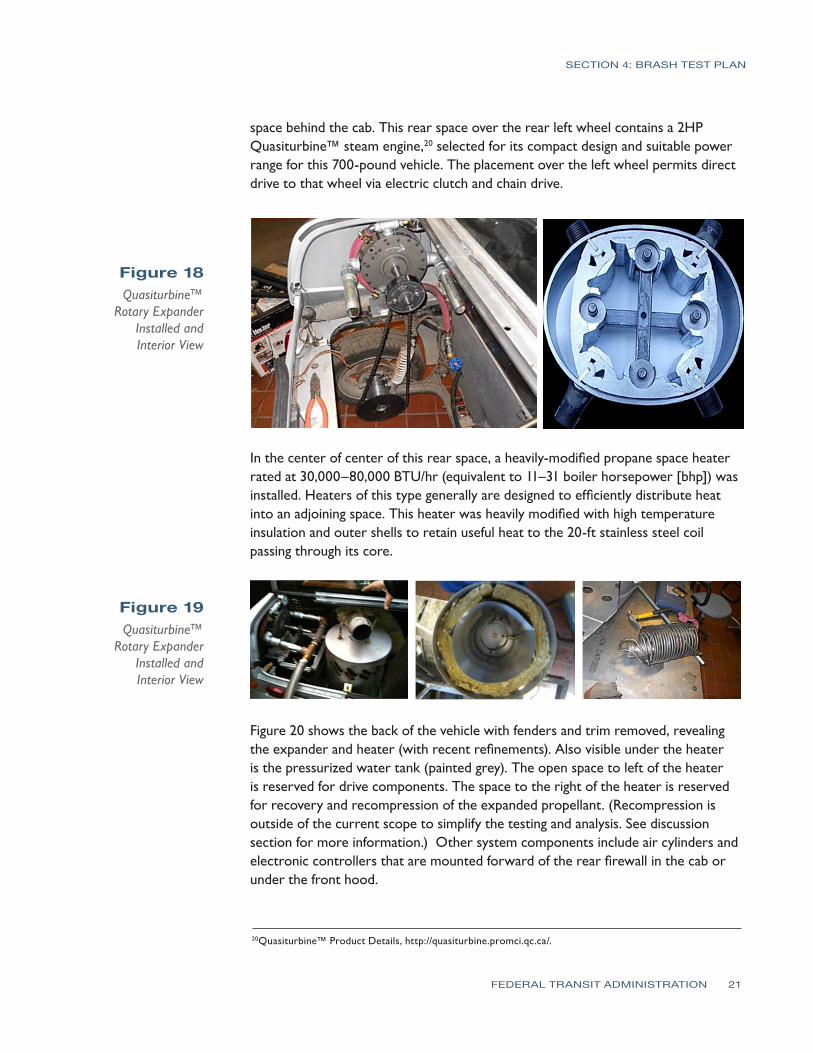
SECTION 4 BRASH TEST PLAN
space behind the cab This rear space over the rear left wheel contains a 2HP Quasiturbinetrade steam engine20 selected for its compact design and suitable power range for this 700-pound vehicle The placement over the left wheel permits direct drive to that wheel via electric clutch and chain drive
Figure 18 Quasiturbinetrade
Rotary Expander Installed and Interior View
In the center of center of this rear space a heavily-modified propane space heater rated at 30000ndash80000 BTUhr (equivalent to 11ndash31 boiler horsepower [bhp]) was installed Heaters of this type generally are designed to efficiently distribute heat into an adjoining space This heater was heavily modified with high temperature insulation and outer shells to retain useful heat to the 20-ft stainless steel coil passing through its core
Figure 19 Quasiturbinetrade
Rotary Expander Installed and Interior View
the expander and heater (with recent refinements) Also visible under the heater is the pressurized water tank (painted grey) The open space to left of the heater is reserved for drive components The space to the right of the heater is reserved for recovery and recompression of the expanded propellant (Recompression is outside of the current scope to simplify the testing and analysis See discussion section for more information) Other system components include air cylinders and electronic controllers that are mounted forward of the rear firewall in the cab or under the front hood
Figure 20 shows the back of the vehicle with fenders and trim removed revealing
20Quasiturbinetrade Product Details httpquasiturbinepromciqcca
FEDERAL TRANSIT ADMINISTRATION 21
SECTION 4 BRASH TEST PLAN
Figure 20 Test Configuration
Figure 21 System Components
The main system components are shown Minor components and linkage tomechanical output are not included in this report for the sake of simplicity
Electronic Control and Measurement No realistic progress toward a vehicle demonstrator with known and regulated fuel use can proceed without electronic regulation In this build the LabVIEW program and system components from National Instruments were used to create a ldquoglass cockpitrdquo of vehicle controls and performance measurement21 The simplified schematic in Figure 22 shows the planned integration of electronics in this development LabView-compatible components will replace all mechanical flow and measurement components
21More information can be found at National Insturments The LabVIEW Environment httpwwwnicomlabview
FEDERAL TRANSIT ADMINISTRATION 22
SECTION 4 BRASH TEST PLAN
Figure 22 Electronics
Schematic for Air-Steam Hybrid
For the vehicle driver the dashboard collection of gauges has been replaced with a laptop screen similar to the one pictured in Figure 23
Figure 23 Front Screen Display for Air-Steam Hybrid
Certain features on this front screen will reflect user input (OnOff Throttle) while others reflect the dependent variables in the process (Heater Temp Fuel Flow Air and Water Flow) Shown on the bottom screen will be running time-series data on speed wheel load temperature specific fuel consumption and the other variables important to the analytical process The front screen display is generated from programming and controls on the back screen display
FEDERAL TRANSIT ADMINISTRATION 23
SECTION 4 BRASH TEST PLAN
Figure 24 Back Screen Display for Air-Steam Hybrid
LabVIEW software and controllers were chosen because of National Instrumentsrsquo status as the industry leader in rapid control prototyping and In-Vehicle data-logging solutions BKi purchased the LabVIEW componentry through the University of Connecticut Mechanical Engineering Department as part of UConnrsquos ongoing support of the project
By the end of the contract term in October 2010 the air and water regulation components were complete and operational but the fuel regulation and engine speed components were not yet fully operational To generate the most meaningful data under these circumstances the test vehicle was configured for extended operation to determine specific fuel water and air consumption rates The combination of these rates provided the basis for initial estimates of power and efficiency
Summary of Effort Mechanical Modifications
1 Removal of original electrical drive components reinforcement of frame
2 Installation of Quasiturbinetrade 2HP engine modified heater pressurized water tank all pneumatic water and fuel lines
3 Baseline validation testing using manual controls
4 Installation of electronically-regulated flow controllers
Electronic Modification 1 Acquisition of computer electronic regulators and control software
2 LabVIEW systems programming
3 System checkout
FEDERAL TRANSIT ADMINISTRATION 24
SECTION 4 BRASH TEST PLAN
Testing and Analysis 1 Static Safety Testing 2 Baseline vehicle drivetrain testing
3 Vehicle static testing (Runs 3 amp 5)
Summary of RequirementsGoals 1 Safe operation of vehicle during static and motive applications
2 Qualitative demonstration of BRASH engine capability to move test vehicle on flat and inclined road surface
3 Quantitative determination of air water and fuel consumption during timed static test
4 Quantitative determination of air water and fuel consumption while varyshying water and fuel fractions
Summary of Testing Two experiments were performed in late November the first to establish minimum fuel and propellant flow rates for sustained operation at low speed (air-rich mode) and the second to establish reasonable upper limits of fuel and propellant flow at higher engine speeds (steam-rich mode) Variation in the air-steam mix is the underlying theory of operation for the BRASH engine the air fraction provides a baseline flow for initial start-up and low-speed operation but the addition of water (as steam) to the propellant results in a significant boost in range and power These two tests have verified this underlying theory
Test Conditions The two test runs summarized in this report are 3 on November 22 2010 and 5 on November 26 2010 Both tests were performed at the Depot D campus of the University of Connecticut in Storrs The testing was performed outside in seasonal conditions 45-50degF with light winds
Figure 25 Vehicle Test Setup
FEDERAL TRANSIT ADMINISTRATION 25
SECTION 4 BRASH TEST PLAN
Each run was a dynamic test with no load on the two-cylinder Quasiturbinetrade engine The propane cylinder was suspended from a scale for the duration of the test Propane fuel consumption was monitored continuously by digital scale with a display accuracy of 001kg
Each test run lasted for the duration of one high pressure air cylinder Air cylinder start (full) and end (empty) were determined at the start and finish of each run using the same scale and accuracy Water levels initially were determined volumetrically but the results were too inconsistent Displaced volume of liquid water proved a poor measure of the quantity heated to steam and carried forward for productive work For this reason water is an estimated quantity based upon fuel quantity burned less heat absorbed by the air fraction (Further integration of the LabView controller software in the next phase will obviate this work-around)
Each of the complete test runs may be viewed at Brash Engines website httpwwwbrashenginescom Photos from each run appear in the figures that follow Tables 1 and 2 summarize the productive mass flow for air water and propane fuel to produce work from the engine for the test duration
The cab interior in Figure 26 shows the high pressure air cylinder below the steering wheel and the laptop computer (regulating propellant flow) in passenger seat space The LabView controllers reside in the protective case under the laptop
Figure 26 Vehicle Cab with Controller Laptop
During each test hot propellant was allowed to expand and vent to ambient in order to simplify the thermodynamic model and analysis (Note the plumes of water vapor from each exhaust hose and the small puddles of water under each hose in Figure 27)
FEDERAL TRANSIT ADMINISTRATION 26
SECTION 4 BRASH TEST PLAN
Figure 27 Exhaust Plumes from Expander
Development plans include recovering the expanded propellant separating into water and air phases and then recompressing the air fraction for re-use This will both improve efficiency and eliminate the visible vapor plume
Test Assumptions Another estimation used in this study is the efficiency of heat transfer for the propellant through the 20-ft coil of stainless steel inside the insulated heater Figure 28 shows an early ldquoair-onlyrdquo test run with the current heater The hose failure and melting of the steel wire mesh inside (note formed ball in the mesh) indicates 1300degK temperatures exiting the hot section
Figure 28 Hose Failure Due
to Overheating
FEDERAL TRANSIT ADMINISTRATION 27
SECTION 4 BRASH TEST PLAN
Effective heat transfer (as Figure 28 shows) does not equal efficient heat transfer but the ability to deliver 1300degK air from a well-insulated burner suggests a highly efficient transfer of heat The analysis of results assumes a value of 90 efficiency (See Appendix A for a discussion of heat transfer efficiency)
3 Low Speed Test On November 22 2010 Run 3 tested the lower operating limits of the test setup Low limit in this context meant sufficient pressure to maintain expander rotation but low steam and fuel burn The test commenced with a full air cylinder weighing 661 Kg At the end of the test the empty cylinder weighed 460 Kg Over the 7 minutes and 15 seconds of testing 006 Kg of propane was consumed
The mass of air and fuel was determined from before after run test weights As stated earlier determining the quantity of steam produced from the pressurized water tank was problematic because of the quantity of stored water the resistance to water flow under dynamic pressures and the potential for some fraction of the water (in liquid state) to be entrained in the propellant mix
To solve for this unknown the energy required to raise the known quantity of air from ambient to 1000degK (33kcalmol or 0467 BTUg) was subtracted from the energy content of the propane consumed (44 BTUg) and then the efficiency of the heat transfer process was de-rated by 10 percent to yield a net quantity of 1438 BTUs to elevate ambient temperature water to 1000degK steam The result is an estimated 125 grams of water consumed in the 7-minute test
Table 1 summarizes these data and shows a high reliance on the air fraction for the work performed by the 2 HP engine The air cylinder used in this test has a measured free volume of 45 cubic feet (1274 liters at STP) which means sustained flow rates of 62 cubic feet per minute (cfm) or 175 liters per minute In contrast the 125 grams of water passed through as steam produced an estimated equivalent gas volume of 155 liters at STP Note the modest levels of water vapor in Figure 29 Why the greater air fraction relative to water flow in this test
Air (Wt 000Kg) 661 460 201 938 1294 30 36
Water2
(Wt 000Kg)
Propane(Wt 000Kg)
Time (hrmnsc)
1562
123000
1556
123715
00125
006
00715
1438
2640
na
1983
364
na
47
86
54
90
1 Energy value based upon absorbed heat (italicized) from STP to 1000degK (0446 BTUg for Air 115 BTUg water) 2 Determined by difference from propane and air energy assumed value 90 3Arbitrary estimated efficiency of heat transfer not effective work
11222010 - 3 Low Speed Run Air Pressure 60 psi Water Head Pressure 60 psi
Component(BTU) Start End Net Energy1
(BTU) Power
(BTUmin) Power (HP) Efficiency3
Table 1 Analysis of Mass
Flow Data at Low Speed
FEDERAL TRANSIT ADMINISTRATION 28
SECTION 4 BRASH TEST PLAN
Figure 29 Low-Speed Test Results in Little
Water Vapor
In this baseline experiment the single cylinder provides 60 psi air flow and 60 psi static ldquoheadrdquo pressure on the water column The air flow from the cylinder is biased toward the generally less restrictive flow path for air The water column under the same pressure presents a higher viscosity medium passing through a greater number of valves and restrictions At the point of injection the air fraction flows more freely into the hot section In order to bias the mix toward greater water fraction (and greater power) the head pressure on the water column must be increased over the 60 psi air line pressure
Run 4 (not documented here) evaluated head pressures from 110 psi to 70 psi and determined that modest differential pressures retarded the flow from the air fraction and boosted flow of the water fraction Still higher differential pressures effectively stopped air flow altogether reverting the engine operation to ldquosteam onlyrdquo For Run 5 an additional cylinder was used to apply a 70 psi static head pressure on the water column a 10 psi differential over the 60 psi air line pressure
5 Variable High Speed Test On November 26 2010 Run 5 tested the higher differential water pressure as a means to increase the effective water fraction in the propellant mix The test commenced with a full air cylinder weighing 654 Kg At the end of the test the empty cylinder weighed 472 Kg Run 5 was interrupted after 243 minutes to refill the water tank and then testing resumed for an additional 907 minutes Over the whole test 027 Kg of propane was consumed
Using the same analytical basis as Test 3 Test 5 data indicate a substantial increase in work capacity (as measured by fuel consumed and steam generated) over the 3 baseline
FEDERAL TRANSIT ADMINISTRATION 29
112610 - 5 Variable High Speed Run Air Pressure 60 psi Water Head Pressure 70 psi
Air (Wt 000Kg)
Component(BTU) Start End Net Energy1
(BTU) Power
(BTUmin) Power (HP) Efficiency3
654 472 182 849 718 17 7
SECTION 4 BRASH TEST PLAN
Table 3 Comparison of Mass Flows
Water 588 Runs 3 and 5
163 Duration (mn) 725 1180 725 1180 163
Air
Component Run 3 BHP
Run 5 BHP
Net ChngBHP
Run 5 Mass
Transfer (kg)
Net ChangeMass
Transfer (kg)
30 17
197
237
-45 2010 182 -9
Run 3 Mass
Transfer (kg)
276 350
47
86
422
0060
0013
0270
0086
Propane
This difference in steam fraction and power is more clearly seen in Figure 30 (and on the source video at the Brash Engines website)
Figure 30 Three Images from Run 5
Table 2 Test 5 Results with Increased
Water and Fuel Water2
(Wt 000Kg) 0860 9890 8358 197 83
Propane(Wt 000Kg) 1520 1493 27 11880 1004 237 90
Time (hrmnsc) 133000 134150 01150 na na na na
1 Energy value based upon absorbed heat (italics) from STP to 1000degK (0446 BTUg for Air 115 BTUg water) Underlined value is released heat at generally accepted 44 BTUg 2 Determined by difference from propane and air Energy assumed value 90 3 Arbitrary estimated efficiency of heat transfer not effective work
The increase in pressure on the water column by 10 psi reduced air flow by 9 percent but increased the steam fraction considerably and thereby increased the effective boiler horsepower nearly three-fold to 237 bhp (assuming 90 heat transfer) These data are summarized in Table 3
FEDERAL TRANSIT ADMINISTRATION 30
SECTION 4 BRASH TEST PLAN
As with Run 3 start up from Time Zero was immediate burner on air flow begins and water flow under pressure commences immediately Another impressive feature of the mix air-steam propellant system is the ability to start stop and rapidly accelerate as shown in the full Run 5 video Run 5 serves as validation that this patented technology has unique performance benefits over air steam or internal combustion alone
Lessons Learned A comparison of the two test runs verifies some key points
1 The same power plant can produce variable power and fuel economy based upon power demand and airsteam mix
2 Although imprecise at this point in testing fuel consumption appears directly proportional to engine speed The engineexpander will spool up spool down stop and restart in a manner consistent with fuel and propellant flow The Run 5 video on the Brash Engines website verifies this conclusion
3 The use of a defined static air pressure ldquoheadrdquo over the water column at a pressure higher than the defined air line dynamic pressure provides a safe and predictable bias toward flow from the water fraction
4 Although the current test configuration offers sufficient performance for this initial demonstration phase the following observations are in order
a The heater path is too long creating latent response issues
b The airwater injector is not optimized for proper mix or flow capacity
c The incomplete integration of LabVIEW compromises the quality of data
d The absence of a measured variable load on the expander compromises any analysis of power and fuel economy
5 The design migration to a vehicle installation was premature The project should move back to a lab bench study to refine the regulation of components complete the recovery and recompression portions of the system and use electromechanical loads to estimate power and useful work for specific quantities of fuel water and air
6 The Quasiturbinetrade engine technology is promising but too immature for larger-scale modeling Later phases of the project should rely on more conventional multi-cylinder piston-type expander
Estimated Fuel Economy Mass transit authorities have relied on large diesel engines such as the Detroit Diesel Series 50 and Series 60 engines for more than 30 years Reports on fuel economy vary from a high of 60 miles per gallon (Diesel) for longer-range
FEDERAL TRANSIT ADMINISTRATION 31
SECTION 4 BRASH TEST PLAN
commuter services in California23 to a low of 228 miles per gallon (Diesel) for city buses with frequent stops in New York City24 In both cited studies the migration to compressed natural gas (CNG) has resulted in lower fuel economies on a Diesel Gallon Equivalent (DGE) basis
Table 4 summarizes this study (columns 2 and 3) and the next proposed phase (columns 4 and 5) the performance of the current fleet of mass transit buses (columns 6 and 7) and the likely outcome if the Besler engine (described earlier) were employed with the air-steam hybrid technology (columns 8 and 9)
Table 4 Comparison of
Fuel Economies
Air
1
Configuration
Engine
HP
Torque
Fuel
gmin
BTUhr
GGEhr
mpg 60mph
GGE100 mi
$ per GGE
$100 mi
Current
Example
2
3
3
5
4
Bench
5
S-10
6
SB Bus
7
NYCT
8
50 eff
9
30 eff
86
Quasi
2
Prop
82
216
02
3160
03
30
09
Current
237
Quasi
2
Prop
23
607
05
1126
09
30
27
UC 1
40
6 cyl
20
Prop
40
1056
09
648
15
30
46
UC 2
80
6 cyl
40
Mix
80
2112
19
324
31
30
93
MCI102
DD S60
350
1450
Diesel
540
11400
100
60
167
35
583
Diesel
23
439
35
1535
300
Besler
150
1200
Mix
300
792
695
864
1158
16
1853
500
Besler
150
1200
Mix
500
1320
1158
518
1930
16
3088
The Besler engine is shown in two columns The left column reflects the higher efficiency anticipated with the air-steam hybrid mix described earlier as at or near 50 percent The right column reflects the historical efficiency realized with steam engine technology The italicized numbers near the bottom of the column show that even at historical efficiencies the Besler engine would offer equal or better Gasoline Gallon Equivalent (GGE)100 mile ratings of the current diesel technology but migrating toward less refined and (therefore) less expensive fuels would significantly reduce the operating cost ($mile)
23Demonstration of Caterpillar C-10 Dual-Fuel Engines in MCI 102DL3 Commuter Buses National Renewable Energy Laboratory httpwwwnrelgovdocsfy00osti26758pdf p 7 24R Barnitt ldquoNew York City Transit (NYCT) Hybrid (125 Order) and CNG Transit Buses Final Evaluation Resultsrdquo November 2006 National Renewable Energy Laboratory K Chandler Battelle Technical Report NRELTP-540-40125 November 2006 httpwwwnrelgovvehiclesandfuelsfleettestpdfs40125pdf pvii
FEDERAL TRANSIT ADMINISTRATION 32
SECTION 4 BRASH TEST PLAN
There are of course two orders of magnitude difference between the results of Runs 3 and 5 and the daily demands of city and commuter buses but the mere existence of the Besler Twin and the Brooks V-8 400 HP engine suggests an opportunity for fuel economy and fuel variety
Proposed further support for the next phase of development will advance the air-steam hybrid technology by an important order of magnitude This would provide the data confidence to scale to larger vehicle operation and garner the interest of one or more engine or vehicle OEMs
Figure 31 MTANew York City
Transit Orion VII Next Generation
Hybrid Transit Bus
Next Development Phase The next phase of development will incorporate a modern six-cylinder steam engine design with a displacement of 53 cubic inches and capable of sustained 15-25 HP operation The expander will be supplied by Steam Engine Power Inc (httpwwwsteamenginepowercom) This expander will drive an alternator generator to measure effective work output in watts as well as provide sufficient power to satisfy the system parasitic loads of battery recharge exhaust air recompression and all other pump and valve operations
Figure 32 (l to r) Six-Cylinder Expander Power Generation Load
Small 24 VDC Compressor
FEDERAL TRANSIT ADMINISTRATION 33
SECTION 4 BRASH TEST PLAN
Static pressure for the water column will still be supplied via compressed air cylinder but the dynamic air flow will be supplied by an oil-less air compressor of the size and type shown This 24 VDC compressor will recompress the recovered air exiting the expander to 40ndash60 psi pressure and support flows of 3ndash4 cubic feet per minute (cfm) These three components are off-the-shelf enhancements to the system but custom engineering of a new more powerful and more responsive heater completion of the electronic integration and design and fabrication of the recoveryrecompression components are necessary tasks that must be included to make the next generation assembly work to its potential This work will be accomplished largely by Mechanical and Electrical Engineering students at the University of Connecticut under the supervision of faculty and Brash Engines personnel
When this build is complete all operations will be under LabVIEW control All expander operations will be measured for power and work Once the bench version is in control a modified version will be installed in a small pickup truck (eg Chevrolet S-10) for further verification of system performance and robustness
During this phase a new and promising technology will be investigated a new and faster class of solenoid valves from National Instruments These solenoid valves with an unprecedented 3 msec response time have the potential of allowing air-steam retrofit in existing engine blocks The solenoid valves could replace the spark plugs in conventional IC engines and provide the equivalent timed injection of hot propellant mix as the timed firing of a spark plug in the presence of a fuel air mix
If possible these fast solenoids and the black box programming to control them could allow very easy portability to larger vehicles and easier retrofit Potentially a V-6 engine could operate 4 cylinders for expansion and the remaining two cylinders could be used as direct drive compressors with different but equivalent solenoid valves controlling the compression process
FEDERAL TRANSIT ADMINISTRATION 34
SECTION Development Plan 5 and Next Steps
This current effort is a key first-proof of concept for this air-steam hybrid technology but our goals extend well beyond this two-seat 2 HP demonstrator The lessons learned in electronic integration will allow rapid migration to larger platforms using the same basic controls but scaling the expander heater and other mass-flow components to vehicle-appropriate size That project identified as ldquo20 HP Vehiclerdquo and other near-term derivative projects are listed in Table 5
BRASH Project
ProposedFunding Source
Funds Reqd $K Project Description
SUV-size proof-of-concept for reliable 20 HP Vehicle DOTUSPS 300 highway performance maildelivery
vehicle size
Proof-of-concept mass transit busshy200 HP Vehicle DOTDOD 600 retrofit scaled to city bus capacity and
suitable for replacement of over-the-road diesel engines
Table 5 Project Funding
Stationary Power Unit Micro-CHP Equivalent
DARPA 300 Proof-of-concept mass transit bus-retrofit scaled to city bus capacity and suitable for replacement of over-the-road diesel engines
Summary Alternative Processed Solid Fuel DOE EPA DOA 600
Processed mix of hydrolyzed wood pulp processed solid waste and other combustible solids in an extrudable mass with alcohol solutevehiclemdashdemonstrate utility in vehicles as a high energy content clean burning fuel for EC engines
Demonstrate effective pyrolysis of
Binary Solid Gas Fuel
EPA Waste Management BFI
400 processed solid fuels in a binary fuel burner conventional fuel (gasoline natural gas) provides primary heat source for pyrolysis temperatures
Proof of Concept OEM Power Plant
Vehicle OEM (eg Ford GM Caterpillar) 1200
Development of direct replacement BRASH engine alternative to existing OEM IC engine
Black Box Integration of Controller Software
Vehicle OEM (eg Ford GM Caterpillar)
1600 Development of commercial BRASH system alternative to existing OEM IC engine
FEDERAL TRANSIT ADMINISTRATION 35
SECTION 5 DEVELOPMENT PLAN AND NEXT STEPS
The issuance of US Patent 7743872 five months ago has two important consequences for this project First it serves to validate the underlying technology the combination of air and steam in an EC engine is better than steam or air alone Second it provides a basis for full and open discussions with government agencies and large commercial interests in the transportation and power sectors
Our efforts at promotion have been delayed pending successful demonstration of the Smarttrade car vehicle to allow the first detailed real-world performance data to be distributed
Coupling that performance data with the option of migration away from refined petroleum should spark significant interest If we can move to a high lignin-processed wood pulp that costs $045 per gasoline gallon equivalent (an arbitrary value for example only) and consumes more CO2 while growing than is consumed in processing as a fuel and produced from combustion then we succeed as a project and as a global game-changing technology for many uses Improvements in fuel economy are important but of greater importance is the migration to low-process biomass fuels
FEDERAL TRANSIT ADMINISTRATION 36
SECTION Potential Applications and Societal Value 6 The whole premise behind the BRASH air steam hybrid is that external combustion offers a more benign and environmentally-appropriate way to power large vehicles and other portable equipment than refined petroleum-powered internal combustion
bullCombustion heat can be derived from any fuel source including processed solids from fast-growing renewables such as poplar trees waste corn stalks or switch grass
bullThat combustion heat is applied at a rate consistent with the work to be done and not to support idling and other unproductive fuel use
Using a mix of air and steam as working fluids in the engine allows
bullImmediate startup from an ldquoair-onlyrdquo start
bull Managed system pressure through use of a defined head air pressure
bullManaged fuel burn as the air-steam fraction is adjusted to match wheel load
bullAdjusted wheel load reduces fuel burn
Integration of modern control circuitry with external combustion also brings a level of performance operational simplicity and safety heretofore unavailable
FEDERAL TRANSIT ADMINISTRATION 37
SECTION
7 Phase I Conclusions
The last steam train in scheduled service in the US departed on October 11 196225 One year earlier Robert Noyce received the first patent for an integrated circuit26 But for that brief one-year overlap the most powerful motive power technology was never harnessed by the black box controls that grew out of Noycersquos invention so the diesel-powered IC engine championed by Henry Ford won out
Now nearly 50 years later the modern IC engine cannot operate efficiently without the benefit of black box electronicsmdashbut that technology still presents intractable challenges of supply safety and environmental impact The air-steam hybrid technology may offer an alternative and a glimpse of that potential is presented here and viewable in Run 5 on the Brash Engines website at http wwwbrashenginescom
While demonstration in a test vehicle provides a strong visual message that BRASH technology works the commercial success of this technology will depend upon reliable repeatable measurement of power and economy For that data the Phase 2 effort will require a return to laboratory bench testing and effective demonstration of recovery of the water and air fractions
The results of this Phase I project collectively demonstrate the technical feasibility and commercial potential of the BRASH air-steam hybrid engine technology The initial DOT SBIR funding has been highly effective in facilitating this important proof of concept and laying the groundwork for further technology refinement and application
As described earlier the next steps are clear and appear to combine achievable and rapid major advances with low developmental risk SBIR Phase 2 support is needed for those advances due to the still-early stage of development that restricts access to private capital
The immense potential value of this technology has been enhanced and verified in Phase 1 there is now a clear and low-risk path ahead to larger-scale testing further component and controls refinement specific applications prototyping and pre-commercial deployments
25William Rosen The Most Powerful Idea in the World Random House 2010 p 311 26US Patent 2981877
FEDERAL TRANSIT ADMINISTRATION 38
APPENDIX
A Heat Transfer Efficiency Modeling Runs 3 and 5 50 and 90
Much of the analysis for Runs 3 and 5 is based on an assumed efficiency of 90 for heat transfer from the combustion of propane to heating of the water air mix in the coil As a test for the reasonableness of that assumption the same data have been modeled at a much lower 50 factor below
112210 - 3 Low Speed Run Air Pressure 60 psi Water head pressure 60 psi
Water2 00440 5060 4276 101 43 (Wt 000Kg)
Propane 152 1493 237 50 27 11880 1004 (Wt 000Kg)
Time 133000 134150 01150 na na na na (hrmnsc)
1 Energy value based upon absorbed heat (italics) from STP to 1000degK (0446 BTUg for Air 115 BTUg water) Underlined value is released heat at generally accepted 44 BTUg
Air (Wt 000Kg)
Component(BTU) Start Wt End Wt Net Wt Energy1
(BTU) Power
(BTUmin) Power (HP) Efficiency3
661 460 201 938 1294 30 36
Water2
(Wt 000Kg)
Propane(Wt 000Kg)
Time (hrmnsc)
1562
123000
1556
123715
00125
006
00715
380
2640
na
523
364
na
12
86
14
50
na na
Air (Wt 000Kg)
Component(BTU) Start Wt
5 Variable High Speed Run Air Pressure 60 psi Water head pressure 70 psi
End Wt Net Wt Energy1
(BTU) Power
(BTUmin) Power (HP) Efficiency3
654 472 182 849 718 17 7
2 Determined by difference from Propane and Air Energy assumed value 90 3 Arbitrary estimated efficiency of heat transfer not effective work
The two known quantities in each run is the weight of the air moving through the system and the weight of the propane heating that air The variable is the quantity of water heated to steam temperatures and above In Run 3 at 90 efficiency that mass of water calculates to 125 grams at 50 it drops to 33 grams In Run 5 at 90 efficiency that mass of water calculates to 86 grams at 50 it drops to 44 grams
FEDERAL TRANSIT ADMINISTRATION 39
APPENDIX A HEAT TRANSFER EFFICIENCY MODELING RUNS 3 AND 5 50 AND 90
As the comparison tables below show the uncertainty in the efficiency of heat transfer is manifest only in the mass of water heated to steam to do useful work
Data 90 Efficiency
Air
Component Run 3 BHP
Run 5 BHP
Net ChngBHP
-45
Run 3 Mass
Transfer (kg)
Run 5 Mass
Transfer (kg)
Net ChangeMass
Transfer (kg)
30 17
197
237
2010 182 -9
Water
Propane
Duration (mn)
47
86
725
422
0060
0013
725
0270
0086
1180
588
350
163 1180
276
163
Data 50 Efficiency
Air
Component Run 3 BHP
Run 5 BHP
Net ChngBHP
-45
Run 3 Mass
Transfer (kg)
Run 5 Mass
Transfer (kg)
Net ChangeMass
Transfer (kg)
30 17
101
237
2010 182 -9
Water
Propane
Duration (mn)
12
86
725
817
0060
0003
725
0270
0044
1180
1233
350
163 1180
276
163
Regardless of the specific efficiency Run3 reflects an air-rich propellant mix while Run 5 was clearly the more powerful and steam-rich propellant If 50 efficiency is a more realistic figure than 90 the only consequence is more water passing through the heater expander and recovery tank The only consequence for overall system efficiency is the slight but added work required to move the additional water by pump to the top of the water column
FEDERAL TRANSIT ADMINISTRATION 40
APPENDIX Acronyms B
BHP Boiler Horsepower
BRASH Binary Recovery Air-Steam Hybrid
BTU British Thermal Unit
CC Cubic centimeter
CFM Cubit feet per minute
CHP Combined heat and power
CNG Compressed natural gas
CO2 Carbon dioxide
CU Cubic
DARPA Defense Advanced Research Projects Agency
DGE Diesel gallon equivalent
DOT Department of Transportation
EC External combustion
EIA Energy Information Administration
EPA Environmental Protection Agency
FTA Federal Transit Administration
GGE Gasoline gallon equivalent
HP Horsepower
IC Internal combustion
K Kelvin
Kcal Kilocalorie
MPG Miles per gallon
MPH Miles per hour
OEM Original equipment manufacturer
PSI Pounds per square inch
RPM Revolutions per minute
SBIR Small Business Innovation Research
STP Standard temperature and pressure
FEDERAL TRANSIT ADMINISTRATION 41
FEDERAL TRANSIT ADMINISTRATION 128
US Department of TransportationFederal Transit AdministrationEast Building1200 New Jersey Avenue SEWashington DC 20590httpwwwftadotgovresearch
US Department of Transportation Federal Transit Administration East Building 1200 New Jersey Avenue SE Washington DC 20590 httpwwwftadotgovresearch
FEDERAL TRANSIT ADMINISTRATION 42
- Button1
- Button2
- Button3
- Button4
- Button5
- Button6
- Button7
- Button8
- Button9
- Button10
- Button11
- Button12
- Button13
- Button14
- Button15
- Button16
- Button17
- Button18
- Button19
- Button20
- Button21
- Button22
- Button23
- Button24
- Button25
- Button26
- Button27
- Button28
- Button29
- Button30
- Button31
- Button32
- Button33
- Button34
- Button35
- Button36
- Button37
- Button38
- Button39
- Button40
- Button41
- Button42
- Button43
- Button44
- Button45
- Button46
- Button47
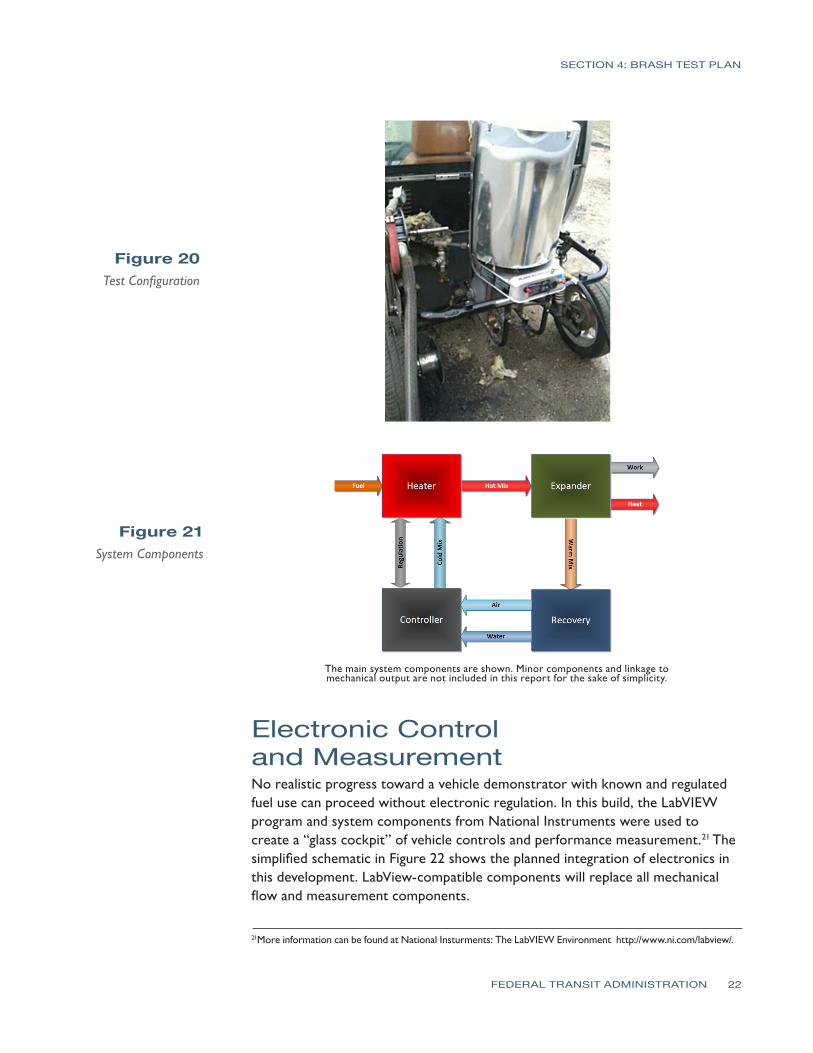
SECTION 4 BRASH TEST PLAN
Figure 20 Test Configuration
Figure 21 System Components
The main system components are shown Minor components and linkage tomechanical output are not included in this report for the sake of simplicity
Electronic Control and Measurement No realistic progress toward a vehicle demonstrator with known and regulated fuel use can proceed without electronic regulation In this build the LabVIEW program and system components from National Instruments were used to create a ldquoglass cockpitrdquo of vehicle controls and performance measurement21 The simplified schematic in Figure 22 shows the planned integration of electronics in this development LabView-compatible components will replace all mechanical flow and measurement components
21More information can be found at National Insturments The LabVIEW Environment httpwwwnicomlabview
FEDERAL TRANSIT ADMINISTRATION 22
SECTION 4 BRASH TEST PLAN
Figure 22 Electronics
Schematic for Air-Steam Hybrid
For the vehicle driver the dashboard collection of gauges has been replaced with a laptop screen similar to the one pictured in Figure 23
Figure 23 Front Screen Display for Air-Steam Hybrid
Certain features on this front screen will reflect user input (OnOff Throttle) while others reflect the dependent variables in the process (Heater Temp Fuel Flow Air and Water Flow) Shown on the bottom screen will be running time-series data on speed wheel load temperature specific fuel consumption and the other variables important to the analytical process The front screen display is generated from programming and controls on the back screen display
FEDERAL TRANSIT ADMINISTRATION 23
SECTION 4 BRASH TEST PLAN
Figure 24 Back Screen Display for Air-Steam Hybrid
LabVIEW software and controllers were chosen because of National Instrumentsrsquo status as the industry leader in rapid control prototyping and In-Vehicle data-logging solutions BKi purchased the LabVIEW componentry through the University of Connecticut Mechanical Engineering Department as part of UConnrsquos ongoing support of the project
By the end of the contract term in October 2010 the air and water regulation components were complete and operational but the fuel regulation and engine speed components were not yet fully operational To generate the most meaningful data under these circumstances the test vehicle was configured for extended operation to determine specific fuel water and air consumption rates The combination of these rates provided the basis for initial estimates of power and efficiency
Summary of Effort Mechanical Modifications
1 Removal of original electrical drive components reinforcement of frame
2 Installation of Quasiturbinetrade 2HP engine modified heater pressurized water tank all pneumatic water and fuel lines
3 Baseline validation testing using manual controls
4 Installation of electronically-regulated flow controllers
Electronic Modification 1 Acquisition of computer electronic regulators and control software
2 LabVIEW systems programming
3 System checkout
FEDERAL TRANSIT ADMINISTRATION 24
SECTION 4 BRASH TEST PLAN
Testing and Analysis 1 Static Safety Testing 2 Baseline vehicle drivetrain testing
3 Vehicle static testing (Runs 3 amp 5)
Summary of RequirementsGoals 1 Safe operation of vehicle during static and motive applications
2 Qualitative demonstration of BRASH engine capability to move test vehicle on flat and inclined road surface
3 Quantitative determination of air water and fuel consumption during timed static test
4 Quantitative determination of air water and fuel consumption while varyshying water and fuel fractions
Summary of Testing Two experiments were performed in late November the first to establish minimum fuel and propellant flow rates for sustained operation at low speed (air-rich mode) and the second to establish reasonable upper limits of fuel and propellant flow at higher engine speeds (steam-rich mode) Variation in the air-steam mix is the underlying theory of operation for the BRASH engine the air fraction provides a baseline flow for initial start-up and low-speed operation but the addition of water (as steam) to the propellant results in a significant boost in range and power These two tests have verified this underlying theory
Test Conditions The two test runs summarized in this report are 3 on November 22 2010 and 5 on November 26 2010 Both tests were performed at the Depot D campus of the University of Connecticut in Storrs The testing was performed outside in seasonal conditions 45-50degF with light winds
Figure 25 Vehicle Test Setup
FEDERAL TRANSIT ADMINISTRATION 25
SECTION 4 BRASH TEST PLAN
Each run was a dynamic test with no load on the two-cylinder Quasiturbinetrade engine The propane cylinder was suspended from a scale for the duration of the test Propane fuel consumption was monitored continuously by digital scale with a display accuracy of 001kg
Each test run lasted for the duration of one high pressure air cylinder Air cylinder start (full) and end (empty) were determined at the start and finish of each run using the same scale and accuracy Water levels initially were determined volumetrically but the results were too inconsistent Displaced volume of liquid water proved a poor measure of the quantity heated to steam and carried forward for productive work For this reason water is an estimated quantity based upon fuel quantity burned less heat absorbed by the air fraction (Further integration of the LabView controller software in the next phase will obviate this work-around)
Each of the complete test runs may be viewed at Brash Engines website httpwwwbrashenginescom Photos from each run appear in the figures that follow Tables 1 and 2 summarize the productive mass flow for air water and propane fuel to produce work from the engine for the test duration
The cab interior in Figure 26 shows the high pressure air cylinder below the steering wheel and the laptop computer (regulating propellant flow) in passenger seat space The LabView controllers reside in the protective case under the laptop
Figure 26 Vehicle Cab with Controller Laptop
During each test hot propellant was allowed to expand and vent to ambient in order to simplify the thermodynamic model and analysis (Note the plumes of water vapor from each exhaust hose and the small puddles of water under each hose in Figure 27)
FEDERAL TRANSIT ADMINISTRATION 26
SECTION 4 BRASH TEST PLAN
Figure 27 Exhaust Plumes from Expander
Development plans include recovering the expanded propellant separating into water and air phases and then recompressing the air fraction for re-use This will both improve efficiency and eliminate the visible vapor plume
Test Assumptions Another estimation used in this study is the efficiency of heat transfer for the propellant through the 20-ft coil of stainless steel inside the insulated heater Figure 28 shows an early ldquoair-onlyrdquo test run with the current heater The hose failure and melting of the steel wire mesh inside (note formed ball in the mesh) indicates 1300degK temperatures exiting the hot section
Figure 28 Hose Failure Due
to Overheating
FEDERAL TRANSIT ADMINISTRATION 27
SECTION 4 BRASH TEST PLAN
Effective heat transfer (as Figure 28 shows) does not equal efficient heat transfer but the ability to deliver 1300degK air from a well-insulated burner suggests a highly efficient transfer of heat The analysis of results assumes a value of 90 efficiency (See Appendix A for a discussion of heat transfer efficiency)
3 Low Speed Test On November 22 2010 Run 3 tested the lower operating limits of the test setup Low limit in this context meant sufficient pressure to maintain expander rotation but low steam and fuel burn The test commenced with a full air cylinder weighing 661 Kg At the end of the test the empty cylinder weighed 460 Kg Over the 7 minutes and 15 seconds of testing 006 Kg of propane was consumed
The mass of air and fuel was determined from before after run test weights As stated earlier determining the quantity of steam produced from the pressurized water tank was problematic because of the quantity of stored water the resistance to water flow under dynamic pressures and the potential for some fraction of the water (in liquid state) to be entrained in the propellant mix
To solve for this unknown the energy required to raise the known quantity of air from ambient to 1000degK (33kcalmol or 0467 BTUg) was subtracted from the energy content of the propane consumed (44 BTUg) and then the efficiency of the heat transfer process was de-rated by 10 percent to yield a net quantity of 1438 BTUs to elevate ambient temperature water to 1000degK steam The result is an estimated 125 grams of water consumed in the 7-minute test
Table 1 summarizes these data and shows a high reliance on the air fraction for the work performed by the 2 HP engine The air cylinder used in this test has a measured free volume of 45 cubic feet (1274 liters at STP) which means sustained flow rates of 62 cubic feet per minute (cfm) or 175 liters per minute In contrast the 125 grams of water passed through as steam produced an estimated equivalent gas volume of 155 liters at STP Note the modest levels of water vapor in Figure 29 Why the greater air fraction relative to water flow in this test
Air (Wt 000Kg) 661 460 201 938 1294 30 36
Water2
(Wt 000Kg)
Propane(Wt 000Kg)
Time (hrmnsc)
1562
123000
1556
123715
00125
006
00715
1438
2640
na
1983
364
na
47
86
54
90
1 Energy value based upon absorbed heat (italicized) from STP to 1000degK (0446 BTUg for Air 115 BTUg water) 2 Determined by difference from propane and air energy assumed value 90 3Arbitrary estimated efficiency of heat transfer not effective work
11222010 - 3 Low Speed Run Air Pressure 60 psi Water Head Pressure 60 psi
Component(BTU) Start End Net Energy1
(BTU) Power
(BTUmin) Power (HP) Efficiency3
Table 1 Analysis of Mass
Flow Data at Low Speed
FEDERAL TRANSIT ADMINISTRATION 28
SECTION 4 BRASH TEST PLAN
Figure 29 Low-Speed Test Results in Little
Water Vapor
In this baseline experiment the single cylinder provides 60 psi air flow and 60 psi static ldquoheadrdquo pressure on the water column The air flow from the cylinder is biased toward the generally less restrictive flow path for air The water column under the same pressure presents a higher viscosity medium passing through a greater number of valves and restrictions At the point of injection the air fraction flows more freely into the hot section In order to bias the mix toward greater water fraction (and greater power) the head pressure on the water column must be increased over the 60 psi air line pressure
Run 4 (not documented here) evaluated head pressures from 110 psi to 70 psi and determined that modest differential pressures retarded the flow from the air fraction and boosted flow of the water fraction Still higher differential pressures effectively stopped air flow altogether reverting the engine operation to ldquosteam onlyrdquo For Run 5 an additional cylinder was used to apply a 70 psi static head pressure on the water column a 10 psi differential over the 60 psi air line pressure
5 Variable High Speed Test On November 26 2010 Run 5 tested the higher differential water pressure as a means to increase the effective water fraction in the propellant mix The test commenced with a full air cylinder weighing 654 Kg At the end of the test the empty cylinder weighed 472 Kg Run 5 was interrupted after 243 minutes to refill the water tank and then testing resumed for an additional 907 minutes Over the whole test 027 Kg of propane was consumed
Using the same analytical basis as Test 3 Test 5 data indicate a substantial increase in work capacity (as measured by fuel consumed and steam generated) over the 3 baseline
FEDERAL TRANSIT ADMINISTRATION 29
112610 - 5 Variable High Speed Run Air Pressure 60 psi Water Head Pressure 70 psi
Air (Wt 000Kg)
Component(BTU) Start End Net Energy1
(BTU) Power
(BTUmin) Power (HP) Efficiency3
654 472 182 849 718 17 7
SECTION 4 BRASH TEST PLAN
Table 3 Comparison of Mass Flows
Water 588 Runs 3 and 5
163 Duration (mn) 725 1180 725 1180 163
Air
Component Run 3 BHP
Run 5 BHP
Net ChngBHP
Run 5 Mass
Transfer (kg)
Net ChangeMass
Transfer (kg)
30 17
197
237
-45 2010 182 -9
Run 3 Mass
Transfer (kg)
276 350
47
86
422
0060
0013
0270
0086
Propane
This difference in steam fraction and power is more clearly seen in Figure 30 (and on the source video at the Brash Engines website)
Figure 30 Three Images from Run 5
Table 2 Test 5 Results with Increased
Water and Fuel Water2
(Wt 000Kg) 0860 9890 8358 197 83
Propane(Wt 000Kg) 1520 1493 27 11880 1004 237 90
Time (hrmnsc) 133000 134150 01150 na na na na
1 Energy value based upon absorbed heat (italics) from STP to 1000degK (0446 BTUg for Air 115 BTUg water) Underlined value is released heat at generally accepted 44 BTUg 2 Determined by difference from propane and air Energy assumed value 90 3 Arbitrary estimated efficiency of heat transfer not effective work
The increase in pressure on the water column by 10 psi reduced air flow by 9 percent but increased the steam fraction considerably and thereby increased the effective boiler horsepower nearly three-fold to 237 bhp (assuming 90 heat transfer) These data are summarized in Table 3
FEDERAL TRANSIT ADMINISTRATION 30
SECTION 4 BRASH TEST PLAN
As with Run 3 start up from Time Zero was immediate burner on air flow begins and water flow under pressure commences immediately Another impressive feature of the mix air-steam propellant system is the ability to start stop and rapidly accelerate as shown in the full Run 5 video Run 5 serves as validation that this patented technology has unique performance benefits over air steam or internal combustion alone
Lessons Learned A comparison of the two test runs verifies some key points
1 The same power plant can produce variable power and fuel economy based upon power demand and airsteam mix
2 Although imprecise at this point in testing fuel consumption appears directly proportional to engine speed The engineexpander will spool up spool down stop and restart in a manner consistent with fuel and propellant flow The Run 5 video on the Brash Engines website verifies this conclusion
3 The use of a defined static air pressure ldquoheadrdquo over the water column at a pressure higher than the defined air line dynamic pressure provides a safe and predictable bias toward flow from the water fraction
4 Although the current test configuration offers sufficient performance for this initial demonstration phase the following observations are in order
a The heater path is too long creating latent response issues
b The airwater injector is not optimized for proper mix or flow capacity
c The incomplete integration of LabVIEW compromises the quality of data
d The absence of a measured variable load on the expander compromises any analysis of power and fuel economy
5 The design migration to a vehicle installation was premature The project should move back to a lab bench study to refine the regulation of components complete the recovery and recompression portions of the system and use electromechanical loads to estimate power and useful work for specific quantities of fuel water and air
6 The Quasiturbinetrade engine technology is promising but too immature for larger-scale modeling Later phases of the project should rely on more conventional multi-cylinder piston-type expander
Estimated Fuel Economy Mass transit authorities have relied on large diesel engines such as the Detroit Diesel Series 50 and Series 60 engines for more than 30 years Reports on fuel economy vary from a high of 60 miles per gallon (Diesel) for longer-range
FEDERAL TRANSIT ADMINISTRATION 31
SECTION 4 BRASH TEST PLAN
commuter services in California23 to a low of 228 miles per gallon (Diesel) for city buses with frequent stops in New York City24 In both cited studies the migration to compressed natural gas (CNG) has resulted in lower fuel economies on a Diesel Gallon Equivalent (DGE) basis
Table 4 summarizes this study (columns 2 and 3) and the next proposed phase (columns 4 and 5) the performance of the current fleet of mass transit buses (columns 6 and 7) and the likely outcome if the Besler engine (described earlier) were employed with the air-steam hybrid technology (columns 8 and 9)
Table 4 Comparison of
Fuel Economies
Air
1
Configuration
Engine
HP
Torque
Fuel
gmin
BTUhr
GGEhr
mpg 60mph
GGE100 mi
$ per GGE
$100 mi
Current
Example
2
3
3
5
4
Bench
5
S-10
6
SB Bus
7
NYCT
8
50 eff
9
30 eff
86
Quasi
2
Prop
82
216
02
3160
03
30
09
Current
237
Quasi
2
Prop
23
607
05
1126
09
30
27
UC 1
40
6 cyl
20
Prop
40
1056
09
648
15
30
46
UC 2
80
6 cyl
40
Mix
80
2112
19
324
31
30
93
MCI102
DD S60
350
1450
Diesel
540
11400
100
60
167
35
583
Diesel
23
439
35
1535
300
Besler
150
1200
Mix
300
792
695
864
1158
16
1853
500
Besler
150
1200
Mix
500
1320
1158
518
1930
16
3088
The Besler engine is shown in two columns The left column reflects the higher efficiency anticipated with the air-steam hybrid mix described earlier as at or near 50 percent The right column reflects the historical efficiency realized with steam engine technology The italicized numbers near the bottom of the column show that even at historical efficiencies the Besler engine would offer equal or better Gasoline Gallon Equivalent (GGE)100 mile ratings of the current diesel technology but migrating toward less refined and (therefore) less expensive fuels would significantly reduce the operating cost ($mile)
23Demonstration of Caterpillar C-10 Dual-Fuel Engines in MCI 102DL3 Commuter Buses National Renewable Energy Laboratory httpwwwnrelgovdocsfy00osti26758pdf p 7 24R Barnitt ldquoNew York City Transit (NYCT) Hybrid (125 Order) and CNG Transit Buses Final Evaluation Resultsrdquo November 2006 National Renewable Energy Laboratory K Chandler Battelle Technical Report NRELTP-540-40125 November 2006 httpwwwnrelgovvehiclesandfuelsfleettestpdfs40125pdf pvii
FEDERAL TRANSIT ADMINISTRATION 32
SECTION 4 BRASH TEST PLAN
There are of course two orders of magnitude difference between the results of Runs 3 and 5 and the daily demands of city and commuter buses but the mere existence of the Besler Twin and the Brooks V-8 400 HP engine suggests an opportunity for fuel economy and fuel variety
Proposed further support for the next phase of development will advance the air-steam hybrid technology by an important order of magnitude This would provide the data confidence to scale to larger vehicle operation and garner the interest of one or more engine or vehicle OEMs
Figure 31 MTANew York City
Transit Orion VII Next Generation
Hybrid Transit Bus
Next Development Phase The next phase of development will incorporate a modern six-cylinder steam engine design with a displacement of 53 cubic inches and capable of sustained 15-25 HP operation The expander will be supplied by Steam Engine Power Inc (httpwwwsteamenginepowercom) This expander will drive an alternator generator to measure effective work output in watts as well as provide sufficient power to satisfy the system parasitic loads of battery recharge exhaust air recompression and all other pump and valve operations
Figure 32 (l to r) Six-Cylinder Expander Power Generation Load
Small 24 VDC Compressor
FEDERAL TRANSIT ADMINISTRATION 33
SECTION 4 BRASH TEST PLAN
Static pressure for the water column will still be supplied via compressed air cylinder but the dynamic air flow will be supplied by an oil-less air compressor of the size and type shown This 24 VDC compressor will recompress the recovered air exiting the expander to 40ndash60 psi pressure and support flows of 3ndash4 cubic feet per minute (cfm) These three components are off-the-shelf enhancements to the system but custom engineering of a new more powerful and more responsive heater completion of the electronic integration and design and fabrication of the recoveryrecompression components are necessary tasks that must be included to make the next generation assembly work to its potential This work will be accomplished largely by Mechanical and Electrical Engineering students at the University of Connecticut under the supervision of faculty and Brash Engines personnel
When this build is complete all operations will be under LabVIEW control All expander operations will be measured for power and work Once the bench version is in control a modified version will be installed in a small pickup truck (eg Chevrolet S-10) for further verification of system performance and robustness
During this phase a new and promising technology will be investigated a new and faster class of solenoid valves from National Instruments These solenoid valves with an unprecedented 3 msec response time have the potential of allowing air-steam retrofit in existing engine blocks The solenoid valves could replace the spark plugs in conventional IC engines and provide the equivalent timed injection of hot propellant mix as the timed firing of a spark plug in the presence of a fuel air mix
If possible these fast solenoids and the black box programming to control them could allow very easy portability to larger vehicles and easier retrofit Potentially a V-6 engine could operate 4 cylinders for expansion and the remaining two cylinders could be used as direct drive compressors with different but equivalent solenoid valves controlling the compression process
FEDERAL TRANSIT ADMINISTRATION 34
SECTION Development Plan 5 and Next Steps
This current effort is a key first-proof of concept for this air-steam hybrid technology but our goals extend well beyond this two-seat 2 HP demonstrator The lessons learned in electronic integration will allow rapid migration to larger platforms using the same basic controls but scaling the expander heater and other mass-flow components to vehicle-appropriate size That project identified as ldquo20 HP Vehiclerdquo and other near-term derivative projects are listed in Table 5
BRASH Project
ProposedFunding Source
Funds Reqd $K Project Description
SUV-size proof-of-concept for reliable 20 HP Vehicle DOTUSPS 300 highway performance maildelivery
vehicle size
Proof-of-concept mass transit busshy200 HP Vehicle DOTDOD 600 retrofit scaled to city bus capacity and
suitable for replacement of over-the-road diesel engines
Table 5 Project Funding
Stationary Power Unit Micro-CHP Equivalent
DARPA 300 Proof-of-concept mass transit bus-retrofit scaled to city bus capacity and suitable for replacement of over-the-road diesel engines
Summary Alternative Processed Solid Fuel DOE EPA DOA 600
Processed mix of hydrolyzed wood pulp processed solid waste and other combustible solids in an extrudable mass with alcohol solutevehiclemdashdemonstrate utility in vehicles as a high energy content clean burning fuel for EC engines
Demonstrate effective pyrolysis of
Binary Solid Gas Fuel
EPA Waste Management BFI
400 processed solid fuels in a binary fuel burner conventional fuel (gasoline natural gas) provides primary heat source for pyrolysis temperatures
Proof of Concept OEM Power Plant
Vehicle OEM (eg Ford GM Caterpillar) 1200
Development of direct replacement BRASH engine alternative to existing OEM IC engine
Black Box Integration of Controller Software
Vehicle OEM (eg Ford GM Caterpillar)
1600 Development of commercial BRASH system alternative to existing OEM IC engine
FEDERAL TRANSIT ADMINISTRATION 35
SECTION 5 DEVELOPMENT PLAN AND NEXT STEPS
The issuance of US Patent 7743872 five months ago has two important consequences for this project First it serves to validate the underlying technology the combination of air and steam in an EC engine is better than steam or air alone Second it provides a basis for full and open discussions with government agencies and large commercial interests in the transportation and power sectors
Our efforts at promotion have been delayed pending successful demonstration of the Smarttrade car vehicle to allow the first detailed real-world performance data to be distributed
Coupling that performance data with the option of migration away from refined petroleum should spark significant interest If we can move to a high lignin-processed wood pulp that costs $045 per gasoline gallon equivalent (an arbitrary value for example only) and consumes more CO2 while growing than is consumed in processing as a fuel and produced from combustion then we succeed as a project and as a global game-changing technology for many uses Improvements in fuel economy are important but of greater importance is the migration to low-process biomass fuels
FEDERAL TRANSIT ADMINISTRATION 36
SECTION Potential Applications and Societal Value 6 The whole premise behind the BRASH air steam hybrid is that external combustion offers a more benign and environmentally-appropriate way to power large vehicles and other portable equipment than refined petroleum-powered internal combustion
bullCombustion heat can be derived from any fuel source including processed solids from fast-growing renewables such as poplar trees waste corn stalks or switch grass
bullThat combustion heat is applied at a rate consistent with the work to be done and not to support idling and other unproductive fuel use
Using a mix of air and steam as working fluids in the engine allows
bullImmediate startup from an ldquoair-onlyrdquo start
bull Managed system pressure through use of a defined head air pressure
bullManaged fuel burn as the air-steam fraction is adjusted to match wheel load
bullAdjusted wheel load reduces fuel burn
Integration of modern control circuitry with external combustion also brings a level of performance operational simplicity and safety heretofore unavailable
FEDERAL TRANSIT ADMINISTRATION 37
SECTION
7 Phase I Conclusions
The last steam train in scheduled service in the US departed on October 11 196225 One year earlier Robert Noyce received the first patent for an integrated circuit26 But for that brief one-year overlap the most powerful motive power technology was never harnessed by the black box controls that grew out of Noycersquos invention so the diesel-powered IC engine championed by Henry Ford won out
Now nearly 50 years later the modern IC engine cannot operate efficiently without the benefit of black box electronicsmdashbut that technology still presents intractable challenges of supply safety and environmental impact The air-steam hybrid technology may offer an alternative and a glimpse of that potential is presented here and viewable in Run 5 on the Brash Engines website at http wwwbrashenginescom
While demonstration in a test vehicle provides a strong visual message that BRASH technology works the commercial success of this technology will depend upon reliable repeatable measurement of power and economy For that data the Phase 2 effort will require a return to laboratory bench testing and effective demonstration of recovery of the water and air fractions
The results of this Phase I project collectively demonstrate the technical feasibility and commercial potential of the BRASH air-steam hybrid engine technology The initial DOT SBIR funding has been highly effective in facilitating this important proof of concept and laying the groundwork for further technology refinement and application
As described earlier the next steps are clear and appear to combine achievable and rapid major advances with low developmental risk SBIR Phase 2 support is needed for those advances due to the still-early stage of development that restricts access to private capital
The immense potential value of this technology has been enhanced and verified in Phase 1 there is now a clear and low-risk path ahead to larger-scale testing further component and controls refinement specific applications prototyping and pre-commercial deployments
25William Rosen The Most Powerful Idea in the World Random House 2010 p 311 26US Patent 2981877
FEDERAL TRANSIT ADMINISTRATION 38
APPENDIX
A Heat Transfer Efficiency Modeling Runs 3 and 5 50 and 90
Much of the analysis for Runs 3 and 5 is based on an assumed efficiency of 90 for heat transfer from the combustion of propane to heating of the water air mix in the coil As a test for the reasonableness of that assumption the same data have been modeled at a much lower 50 factor below
112210 - 3 Low Speed Run Air Pressure 60 psi Water head pressure 60 psi
Water2 00440 5060 4276 101 43 (Wt 000Kg)
Propane 152 1493 237 50 27 11880 1004 (Wt 000Kg)
Time 133000 134150 01150 na na na na (hrmnsc)
1 Energy value based upon absorbed heat (italics) from STP to 1000degK (0446 BTUg for Air 115 BTUg water) Underlined value is released heat at generally accepted 44 BTUg
Air (Wt 000Kg)
Component(BTU) Start Wt End Wt Net Wt Energy1
(BTU) Power
(BTUmin) Power (HP) Efficiency3
661 460 201 938 1294 30 36
Water2
(Wt 000Kg)
Propane(Wt 000Kg)
Time (hrmnsc)
1562
123000
1556
123715
00125
006
00715
380
2640
na
523
364
na
12
86
14
50
na na
Air (Wt 000Kg)
Component(BTU) Start Wt
5 Variable High Speed Run Air Pressure 60 psi Water head pressure 70 psi
End Wt Net Wt Energy1
(BTU) Power
(BTUmin) Power (HP) Efficiency3
654 472 182 849 718 17 7
2 Determined by difference from Propane and Air Energy assumed value 90 3 Arbitrary estimated efficiency of heat transfer not effective work
The two known quantities in each run is the weight of the air moving through the system and the weight of the propane heating that air The variable is the quantity of water heated to steam temperatures and above In Run 3 at 90 efficiency that mass of water calculates to 125 grams at 50 it drops to 33 grams In Run 5 at 90 efficiency that mass of water calculates to 86 grams at 50 it drops to 44 grams
FEDERAL TRANSIT ADMINISTRATION 39
APPENDIX A HEAT TRANSFER EFFICIENCY MODELING RUNS 3 AND 5 50 AND 90
As the comparison tables below show the uncertainty in the efficiency of heat transfer is manifest only in the mass of water heated to steam to do useful work
Data 90 Efficiency
Air
Component Run 3 BHP
Run 5 BHP
Net ChngBHP
-45
Run 3 Mass
Transfer (kg)
Run 5 Mass
Transfer (kg)
Net ChangeMass
Transfer (kg)
30 17
197
237
2010 182 -9
Water
Propane
Duration (mn)
47
86
725
422
0060
0013
725
0270
0086
1180
588
350
163 1180
276
163
Data 50 Efficiency
Air
Component Run 3 BHP
Run 5 BHP
Net ChngBHP
-45
Run 3 Mass
Transfer (kg)
Run 5 Mass
Transfer (kg)
Net ChangeMass
Transfer (kg)
30 17
101
237
2010 182 -9
Water
Propane
Duration (mn)
12
86
725
817
0060
0003
725
0270
0044
1180
1233
350
163 1180
276
163
Regardless of the specific efficiency Run3 reflects an air-rich propellant mix while Run 5 was clearly the more powerful and steam-rich propellant If 50 efficiency is a more realistic figure than 90 the only consequence is more water passing through the heater expander and recovery tank The only consequence for overall system efficiency is the slight but added work required to move the additional water by pump to the top of the water column
FEDERAL TRANSIT ADMINISTRATION 40
APPENDIX Acronyms B
BHP Boiler Horsepower
BRASH Binary Recovery Air-Steam Hybrid
BTU British Thermal Unit
CC Cubic centimeter
CFM Cubit feet per minute
CHP Combined heat and power
CNG Compressed natural gas
CO2 Carbon dioxide
CU Cubic
DARPA Defense Advanced Research Projects Agency
DGE Diesel gallon equivalent
DOT Department of Transportation
EC External combustion
EIA Energy Information Administration
EPA Environmental Protection Agency
FTA Federal Transit Administration
GGE Gasoline gallon equivalent
HP Horsepower
IC Internal combustion
K Kelvin
Kcal Kilocalorie
MPG Miles per gallon
MPH Miles per hour
OEM Original equipment manufacturer
PSI Pounds per square inch
RPM Revolutions per minute
SBIR Small Business Innovation Research
STP Standard temperature and pressure
FEDERAL TRANSIT ADMINISTRATION 41
FEDERAL TRANSIT ADMINISTRATION 128
US Department of TransportationFederal Transit AdministrationEast Building1200 New Jersey Avenue SEWashington DC 20590httpwwwftadotgovresearch
US Department of Transportation Federal Transit Administration East Building 1200 New Jersey Avenue SE Washington DC 20590 httpwwwftadotgovresearch
FEDERAL TRANSIT ADMINISTRATION 42
- Button1
- Button2
- Button3
- Button4
- Button5
- Button6
- Button7
- Button8
- Button9
- Button10
- Button11
- Button12
- Button13
- Button14
- Button15
- Button16
- Button17
- Button18
- Button19
- Button20
- Button21
- Button22
- Button23
- Button24
- Button25
- Button26
- Button27
- Button28
- Button29
- Button30
- Button31
- Button32
- Button33
- Button34
- Button35
- Button36
- Button37
- Button38
- Button39
- Button40
- Button41
- Button42
- Button43
- Button44
- Button45
- Button46
- Button47
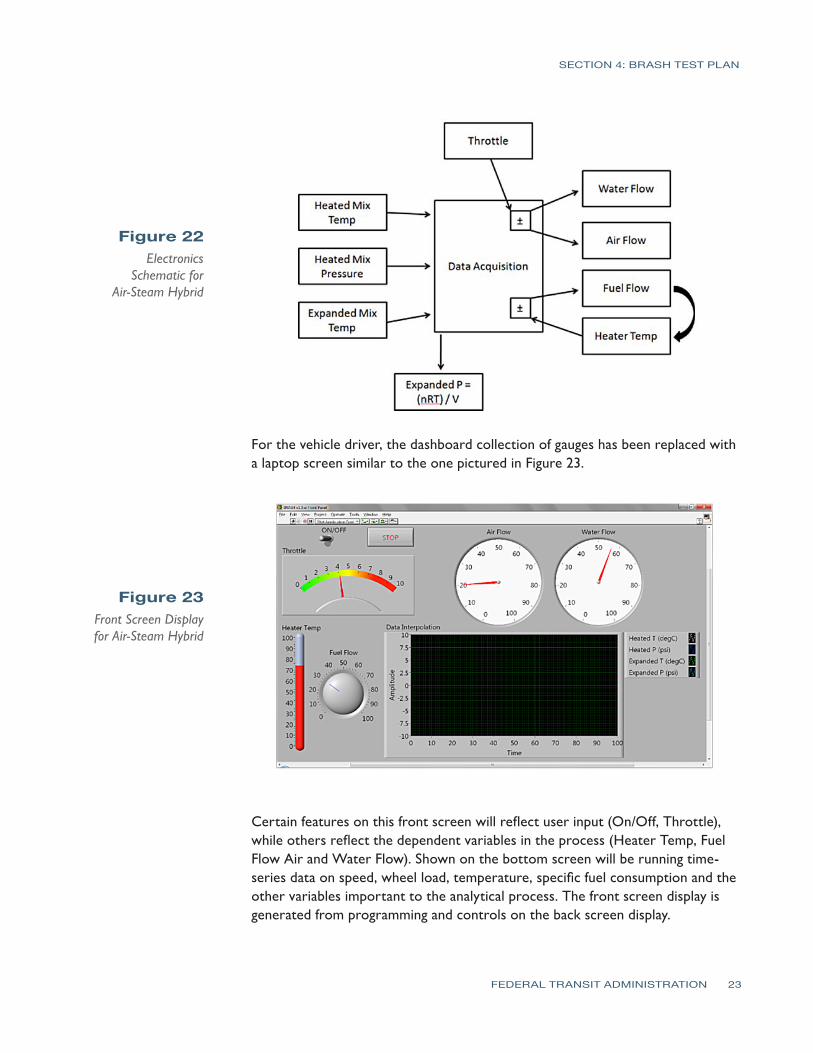
SECTION 4 BRASH TEST PLAN
Figure 22 Electronics
Schematic for Air-Steam Hybrid
For the vehicle driver the dashboard collection of gauges has been replaced with a laptop screen similar to the one pictured in Figure 23
Figure 23 Front Screen Display for Air-Steam Hybrid
Certain features on this front screen will reflect user input (OnOff Throttle) while others reflect the dependent variables in the process (Heater Temp Fuel Flow Air and Water Flow) Shown on the bottom screen will be running time-series data on speed wheel load temperature specific fuel consumption and the other variables important to the analytical process The front screen display is generated from programming and controls on the back screen display
FEDERAL TRANSIT ADMINISTRATION 23
SECTION 4 BRASH TEST PLAN
Figure 24 Back Screen Display for Air-Steam Hybrid
LabVIEW software and controllers were chosen because of National Instrumentsrsquo status as the industry leader in rapid control prototyping and In-Vehicle data-logging solutions BKi purchased the LabVIEW componentry through the University of Connecticut Mechanical Engineering Department as part of UConnrsquos ongoing support of the project
By the end of the contract term in October 2010 the air and water regulation components were complete and operational but the fuel regulation and engine speed components were not yet fully operational To generate the most meaningful data under these circumstances the test vehicle was configured for extended operation to determine specific fuel water and air consumption rates The combination of these rates provided the basis for initial estimates of power and efficiency
Summary of Effort Mechanical Modifications
1 Removal of original electrical drive components reinforcement of frame
2 Installation of Quasiturbinetrade 2HP engine modified heater pressurized water tank all pneumatic water and fuel lines
3 Baseline validation testing using manual controls
4 Installation of electronically-regulated flow controllers
Electronic Modification 1 Acquisition of computer electronic regulators and control software
2 LabVIEW systems programming
3 System checkout
FEDERAL TRANSIT ADMINISTRATION 24
SECTION 4 BRASH TEST PLAN
Testing and Analysis 1 Static Safety Testing 2 Baseline vehicle drivetrain testing
3 Vehicle static testing (Runs 3 amp 5)
Summary of RequirementsGoals 1 Safe operation of vehicle during static and motive applications
2 Qualitative demonstration of BRASH engine capability to move test vehicle on flat and inclined road surface
3 Quantitative determination of air water and fuel consumption during timed static test
4 Quantitative determination of air water and fuel consumption while varyshying water and fuel fractions
Summary of Testing Two experiments were performed in late November the first to establish minimum fuel and propellant flow rates for sustained operation at low speed (air-rich mode) and the second to establish reasonable upper limits of fuel and propellant flow at higher engine speeds (steam-rich mode) Variation in the air-steam mix is the underlying theory of operation for the BRASH engine the air fraction provides a baseline flow for initial start-up and low-speed operation but the addition of water (as steam) to the propellant results in a significant boost in range and power These two tests have verified this underlying theory
Test Conditions The two test runs summarized in this report are 3 on November 22 2010 and 5 on November 26 2010 Both tests were performed at the Depot D campus of the University of Connecticut in Storrs The testing was performed outside in seasonal conditions 45-50degF with light winds
Figure 25 Vehicle Test Setup
FEDERAL TRANSIT ADMINISTRATION 25
SECTION 4 BRASH TEST PLAN
Each run was a dynamic test with no load on the two-cylinder Quasiturbinetrade engine The propane cylinder was suspended from a scale for the duration of the test Propane fuel consumption was monitored continuously by digital scale with a display accuracy of 001kg
Each test run lasted for the duration of one high pressure air cylinder Air cylinder start (full) and end (empty) were determined at the start and finish of each run using the same scale and accuracy Water levels initially were determined volumetrically but the results were too inconsistent Displaced volume of liquid water proved a poor measure of the quantity heated to steam and carried forward for productive work For this reason water is an estimated quantity based upon fuel quantity burned less heat absorbed by the air fraction (Further integration of the LabView controller software in the next phase will obviate this work-around)
Each of the complete test runs may be viewed at Brash Engines website httpwwwbrashenginescom Photos from each run appear in the figures that follow Tables 1 and 2 summarize the productive mass flow for air water and propane fuel to produce work from the engine for the test duration
The cab interior in Figure 26 shows the high pressure air cylinder below the steering wheel and the laptop computer (regulating propellant flow) in passenger seat space The LabView controllers reside in the protective case under the laptop
Figure 26 Vehicle Cab with Controller Laptop
During each test hot propellant was allowed to expand and vent to ambient in order to simplify the thermodynamic model and analysis (Note the plumes of water vapor from each exhaust hose and the small puddles of water under each hose in Figure 27)
FEDERAL TRANSIT ADMINISTRATION 26
SECTION 4 BRASH TEST PLAN
Figure 27 Exhaust Plumes from Expander
Development plans include recovering the expanded propellant separating into water and air phases and then recompressing the air fraction for re-use This will both improve efficiency and eliminate the visible vapor plume
Test Assumptions Another estimation used in this study is the efficiency of heat transfer for the propellant through the 20-ft coil of stainless steel inside the insulated heater Figure 28 shows an early ldquoair-onlyrdquo test run with the current heater The hose failure and melting of the steel wire mesh inside (note formed ball in the mesh) indicates 1300degK temperatures exiting the hot section
Figure 28 Hose Failure Due
to Overheating
FEDERAL TRANSIT ADMINISTRATION 27
SECTION 4 BRASH TEST PLAN
Effective heat transfer (as Figure 28 shows) does not equal efficient heat transfer but the ability to deliver 1300degK air from a well-insulated burner suggests a highly efficient transfer of heat The analysis of results assumes a value of 90 efficiency (See Appendix A for a discussion of heat transfer efficiency)
3 Low Speed Test On November 22 2010 Run 3 tested the lower operating limits of the test setup Low limit in this context meant sufficient pressure to maintain expander rotation but low steam and fuel burn The test commenced with a full air cylinder weighing 661 Kg At the end of the test the empty cylinder weighed 460 Kg Over the 7 minutes and 15 seconds of testing 006 Kg of propane was consumed
The mass of air and fuel was determined from before after run test weights As stated earlier determining the quantity of steam produced from the pressurized water tank was problematic because of the quantity of stored water the resistance to water flow under dynamic pressures and the potential for some fraction of the water (in liquid state) to be entrained in the propellant mix
To solve for this unknown the energy required to raise the known quantity of air from ambient to 1000degK (33kcalmol or 0467 BTUg) was subtracted from the energy content of the propane consumed (44 BTUg) and then the efficiency of the heat transfer process was de-rated by 10 percent to yield a net quantity of 1438 BTUs to elevate ambient temperature water to 1000degK steam The result is an estimated 125 grams of water consumed in the 7-minute test
Table 1 summarizes these data and shows a high reliance on the air fraction for the work performed by the 2 HP engine The air cylinder used in this test has a measured free volume of 45 cubic feet (1274 liters at STP) which means sustained flow rates of 62 cubic feet per minute (cfm) or 175 liters per minute In contrast the 125 grams of water passed through as steam produced an estimated equivalent gas volume of 155 liters at STP Note the modest levels of water vapor in Figure 29 Why the greater air fraction relative to water flow in this test
Air (Wt 000Kg) 661 460 201 938 1294 30 36
Water2
(Wt 000Kg)
Propane(Wt 000Kg)
Time (hrmnsc)
1562
123000
1556
123715
00125
006
00715
1438
2640
na
1983
364
na
47
86
54
90
1 Energy value based upon absorbed heat (italicized) from STP to 1000degK (0446 BTUg for Air 115 BTUg water) 2 Determined by difference from propane and air energy assumed value 90 3Arbitrary estimated efficiency of heat transfer not effective work
11222010 - 3 Low Speed Run Air Pressure 60 psi Water Head Pressure 60 psi
Component(BTU) Start End Net Energy1
(BTU) Power
(BTUmin) Power (HP) Efficiency3
Table 1 Analysis of Mass
Flow Data at Low Speed
FEDERAL TRANSIT ADMINISTRATION 28
SECTION 4 BRASH TEST PLAN
Figure 29 Low-Speed Test Results in Little
Water Vapor
In this baseline experiment the single cylinder provides 60 psi air flow and 60 psi static ldquoheadrdquo pressure on the water column The air flow from the cylinder is biased toward the generally less restrictive flow path for air The water column under the same pressure presents a higher viscosity medium passing through a greater number of valves and restrictions At the point of injection the air fraction flows more freely into the hot section In order to bias the mix toward greater water fraction (and greater power) the head pressure on the water column must be increased over the 60 psi air line pressure
Run 4 (not documented here) evaluated head pressures from 110 psi to 70 psi and determined that modest differential pressures retarded the flow from the air fraction and boosted flow of the water fraction Still higher differential pressures effectively stopped air flow altogether reverting the engine operation to ldquosteam onlyrdquo For Run 5 an additional cylinder was used to apply a 70 psi static head pressure on the water column a 10 psi differential over the 60 psi air line pressure
5 Variable High Speed Test On November 26 2010 Run 5 tested the higher differential water pressure as a means to increase the effective water fraction in the propellant mix The test commenced with a full air cylinder weighing 654 Kg At the end of the test the empty cylinder weighed 472 Kg Run 5 was interrupted after 243 minutes to refill the water tank and then testing resumed for an additional 907 minutes Over the whole test 027 Kg of propane was consumed
Using the same analytical basis as Test 3 Test 5 data indicate a substantial increase in work capacity (as measured by fuel consumed and steam generated) over the 3 baseline
FEDERAL TRANSIT ADMINISTRATION 29
112610 - 5 Variable High Speed Run Air Pressure 60 psi Water Head Pressure 70 psi
Air (Wt 000Kg)
Component(BTU) Start End Net Energy1
(BTU) Power
(BTUmin) Power (HP) Efficiency3
654 472 182 849 718 17 7
SECTION 4 BRASH TEST PLAN
Table 3 Comparison of Mass Flows
Water 588 Runs 3 and 5
163 Duration (mn) 725 1180 725 1180 163
Air
Component Run 3 BHP
Run 5 BHP
Net ChngBHP
Run 5 Mass
Transfer (kg)
Net ChangeMass
Transfer (kg)
30 17
197
237
-45 2010 182 -9
Run 3 Mass
Transfer (kg)
276 350
47
86
422
0060
0013
0270
0086
Propane
This difference in steam fraction and power is more clearly seen in Figure 30 (and on the source video at the Brash Engines website)
Figure 30 Three Images from Run 5
Table 2 Test 5 Results with Increased
Water and Fuel Water2
(Wt 000Kg) 0860 9890 8358 197 83
Propane(Wt 000Kg) 1520 1493 27 11880 1004 237 90
Time (hrmnsc) 133000 134150 01150 na na na na
1 Energy value based upon absorbed heat (italics) from STP to 1000degK (0446 BTUg for Air 115 BTUg water) Underlined value is released heat at generally accepted 44 BTUg 2 Determined by difference from propane and air Energy assumed value 90 3 Arbitrary estimated efficiency of heat transfer not effective work
The increase in pressure on the water column by 10 psi reduced air flow by 9 percent but increased the steam fraction considerably and thereby increased the effective boiler horsepower nearly three-fold to 237 bhp (assuming 90 heat transfer) These data are summarized in Table 3
FEDERAL TRANSIT ADMINISTRATION 30
SECTION 4 BRASH TEST PLAN
As with Run 3 start up from Time Zero was immediate burner on air flow begins and water flow under pressure commences immediately Another impressive feature of the mix air-steam propellant system is the ability to start stop and rapidly accelerate as shown in the full Run 5 video Run 5 serves as validation that this patented technology has unique performance benefits over air steam or internal combustion alone
Lessons Learned A comparison of the two test runs verifies some key points
1 The same power plant can produce variable power and fuel economy based upon power demand and airsteam mix
2 Although imprecise at this point in testing fuel consumption appears directly proportional to engine speed The engineexpander will spool up spool down stop and restart in a manner consistent with fuel and propellant flow The Run 5 video on the Brash Engines website verifies this conclusion
3 The use of a defined static air pressure ldquoheadrdquo over the water column at a pressure higher than the defined air line dynamic pressure provides a safe and predictable bias toward flow from the water fraction
4 Although the current test configuration offers sufficient performance for this initial demonstration phase the following observations are in order
a The heater path is too long creating latent response issues
b The airwater injector is not optimized for proper mix or flow capacity
c The incomplete integration of LabVIEW compromises the quality of data
d The absence of a measured variable load on the expander compromises any analysis of power and fuel economy
5 The design migration to a vehicle installation was premature The project should move back to a lab bench study to refine the regulation of components complete the recovery and recompression portions of the system and use electromechanical loads to estimate power and useful work for specific quantities of fuel water and air
6 The Quasiturbinetrade engine technology is promising but too immature for larger-scale modeling Later phases of the project should rely on more conventional multi-cylinder piston-type expander
Estimated Fuel Economy Mass transit authorities have relied on large diesel engines such as the Detroit Diesel Series 50 and Series 60 engines for more than 30 years Reports on fuel economy vary from a high of 60 miles per gallon (Diesel) for longer-range
FEDERAL TRANSIT ADMINISTRATION 31
SECTION 4 BRASH TEST PLAN
commuter services in California23 to a low of 228 miles per gallon (Diesel) for city buses with frequent stops in New York City24 In both cited studies the migration to compressed natural gas (CNG) has resulted in lower fuel economies on a Diesel Gallon Equivalent (DGE) basis
Table 4 summarizes this study (columns 2 and 3) and the next proposed phase (columns 4 and 5) the performance of the current fleet of mass transit buses (columns 6 and 7) and the likely outcome if the Besler engine (described earlier) were employed with the air-steam hybrid technology (columns 8 and 9)
Table 4 Comparison of
Fuel Economies
Air
1
Configuration
Engine
HP
Torque
Fuel
gmin
BTUhr
GGEhr
mpg 60mph
GGE100 mi
$ per GGE
$100 mi
Current
Example
2
3
3
5
4
Bench
5
S-10
6
SB Bus
7
NYCT
8
50 eff
9
30 eff
86
Quasi
2
Prop
82
216
02
3160
03
30
09
Current
237
Quasi
2
Prop
23
607
05
1126
09
30
27
UC 1
40
6 cyl
20
Prop
40
1056
09
648
15
30
46
UC 2
80
6 cyl
40
Mix
80
2112
19
324
31
30
93
MCI102
DD S60
350
1450
Diesel
540
11400
100
60
167
35
583
Diesel
23
439
35
1535
300
Besler
150
1200
Mix
300
792
695
864
1158
16
1853
500
Besler
150
1200
Mix
500
1320
1158
518
1930
16
3088
The Besler engine is shown in two columns The left column reflects the higher efficiency anticipated with the air-steam hybrid mix described earlier as at or near 50 percent The right column reflects the historical efficiency realized with steam engine technology The italicized numbers near the bottom of the column show that even at historical efficiencies the Besler engine would offer equal or better Gasoline Gallon Equivalent (GGE)100 mile ratings of the current diesel technology but migrating toward less refined and (therefore) less expensive fuels would significantly reduce the operating cost ($mile)
23Demonstration of Caterpillar C-10 Dual-Fuel Engines in MCI 102DL3 Commuter Buses National Renewable Energy Laboratory httpwwwnrelgovdocsfy00osti26758pdf p 7 24R Barnitt ldquoNew York City Transit (NYCT) Hybrid (125 Order) and CNG Transit Buses Final Evaluation Resultsrdquo November 2006 National Renewable Energy Laboratory K Chandler Battelle Technical Report NRELTP-540-40125 November 2006 httpwwwnrelgovvehiclesandfuelsfleettestpdfs40125pdf pvii
FEDERAL TRANSIT ADMINISTRATION 32
SECTION 4 BRASH TEST PLAN
There are of course two orders of magnitude difference between the results of Runs 3 and 5 and the daily demands of city and commuter buses but the mere existence of the Besler Twin and the Brooks V-8 400 HP engine suggests an opportunity for fuel economy and fuel variety
Proposed further support for the next phase of development will advance the air-steam hybrid technology by an important order of magnitude This would provide the data confidence to scale to larger vehicle operation and garner the interest of one or more engine or vehicle OEMs
Figure 31 MTANew York City
Transit Orion VII Next Generation
Hybrid Transit Bus
Next Development Phase The next phase of development will incorporate a modern six-cylinder steam engine design with a displacement of 53 cubic inches and capable of sustained 15-25 HP operation The expander will be supplied by Steam Engine Power Inc (httpwwwsteamenginepowercom) This expander will drive an alternator generator to measure effective work output in watts as well as provide sufficient power to satisfy the system parasitic loads of battery recharge exhaust air recompression and all other pump and valve operations
Figure 32 (l to r) Six-Cylinder Expander Power Generation Load
Small 24 VDC Compressor
FEDERAL TRANSIT ADMINISTRATION 33
SECTION 4 BRASH TEST PLAN
Static pressure for the water column will still be supplied via compressed air cylinder but the dynamic air flow will be supplied by an oil-less air compressor of the size and type shown This 24 VDC compressor will recompress the recovered air exiting the expander to 40ndash60 psi pressure and support flows of 3ndash4 cubic feet per minute (cfm) These three components are off-the-shelf enhancements to the system but custom engineering of a new more powerful and more responsive heater completion of the electronic integration and design and fabrication of the recoveryrecompression components are necessary tasks that must be included to make the next generation assembly work to its potential This work will be accomplished largely by Mechanical and Electrical Engineering students at the University of Connecticut under the supervision of faculty and Brash Engines personnel
When this build is complete all operations will be under LabVIEW control All expander operations will be measured for power and work Once the bench version is in control a modified version will be installed in a small pickup truck (eg Chevrolet S-10) for further verification of system performance and robustness
During this phase a new and promising technology will be investigated a new and faster class of solenoid valves from National Instruments These solenoid valves with an unprecedented 3 msec response time have the potential of allowing air-steam retrofit in existing engine blocks The solenoid valves could replace the spark plugs in conventional IC engines and provide the equivalent timed injection of hot propellant mix as the timed firing of a spark plug in the presence of a fuel air mix
If possible these fast solenoids and the black box programming to control them could allow very easy portability to larger vehicles and easier retrofit Potentially a V-6 engine could operate 4 cylinders for expansion and the remaining two cylinders could be used as direct drive compressors with different but equivalent solenoid valves controlling the compression process
FEDERAL TRANSIT ADMINISTRATION 34
SECTION Development Plan 5 and Next Steps
This current effort is a key first-proof of concept for this air-steam hybrid technology but our goals extend well beyond this two-seat 2 HP demonstrator The lessons learned in electronic integration will allow rapid migration to larger platforms using the same basic controls but scaling the expander heater and other mass-flow components to vehicle-appropriate size That project identified as ldquo20 HP Vehiclerdquo and other near-term derivative projects are listed in Table 5
BRASH Project
ProposedFunding Source
Funds Reqd $K Project Description
SUV-size proof-of-concept for reliable 20 HP Vehicle DOTUSPS 300 highway performance maildelivery
vehicle size
Proof-of-concept mass transit busshy200 HP Vehicle DOTDOD 600 retrofit scaled to city bus capacity and
suitable for replacement of over-the-road diesel engines
Table 5 Project Funding
Stationary Power Unit Micro-CHP Equivalent
DARPA 300 Proof-of-concept mass transit bus-retrofit scaled to city bus capacity and suitable for replacement of over-the-road diesel engines
Summary Alternative Processed Solid Fuel DOE EPA DOA 600
Processed mix of hydrolyzed wood pulp processed solid waste and other combustible solids in an extrudable mass with alcohol solutevehiclemdashdemonstrate utility in vehicles as a high energy content clean burning fuel for EC engines
Demonstrate effective pyrolysis of
Binary Solid Gas Fuel
EPA Waste Management BFI
400 processed solid fuels in a binary fuel burner conventional fuel (gasoline natural gas) provides primary heat source for pyrolysis temperatures
Proof of Concept OEM Power Plant
Vehicle OEM (eg Ford GM Caterpillar) 1200
Development of direct replacement BRASH engine alternative to existing OEM IC engine
Black Box Integration of Controller Software
Vehicle OEM (eg Ford GM Caterpillar)
1600 Development of commercial BRASH system alternative to existing OEM IC engine
FEDERAL TRANSIT ADMINISTRATION 35
SECTION 5 DEVELOPMENT PLAN AND NEXT STEPS
The issuance of US Patent 7743872 five months ago has two important consequences for this project First it serves to validate the underlying technology the combination of air and steam in an EC engine is better than steam or air alone Second it provides a basis for full and open discussions with government agencies and large commercial interests in the transportation and power sectors
Our efforts at promotion have been delayed pending successful demonstration of the Smarttrade car vehicle to allow the first detailed real-world performance data to be distributed
Coupling that performance data with the option of migration away from refined petroleum should spark significant interest If we can move to a high lignin-processed wood pulp that costs $045 per gasoline gallon equivalent (an arbitrary value for example only) and consumes more CO2 while growing than is consumed in processing as a fuel and produced from combustion then we succeed as a project and as a global game-changing technology for many uses Improvements in fuel economy are important but of greater importance is the migration to low-process biomass fuels
FEDERAL TRANSIT ADMINISTRATION 36
SECTION Potential Applications and Societal Value 6 The whole premise behind the BRASH air steam hybrid is that external combustion offers a more benign and environmentally-appropriate way to power large vehicles and other portable equipment than refined petroleum-powered internal combustion
bullCombustion heat can be derived from any fuel source including processed solids from fast-growing renewables such as poplar trees waste corn stalks or switch grass
bullThat combustion heat is applied at a rate consistent with the work to be done and not to support idling and other unproductive fuel use
Using a mix of air and steam as working fluids in the engine allows
bullImmediate startup from an ldquoair-onlyrdquo start
bull Managed system pressure through use of a defined head air pressure
bullManaged fuel burn as the air-steam fraction is adjusted to match wheel load
bullAdjusted wheel load reduces fuel burn
Integration of modern control circuitry with external combustion also brings a level of performance operational simplicity and safety heretofore unavailable
FEDERAL TRANSIT ADMINISTRATION 37
SECTION
7 Phase I Conclusions
The last steam train in scheduled service in the US departed on October 11 196225 One year earlier Robert Noyce received the first patent for an integrated circuit26 But for that brief one-year overlap the most powerful motive power technology was never harnessed by the black box controls that grew out of Noycersquos invention so the diesel-powered IC engine championed by Henry Ford won out
Now nearly 50 years later the modern IC engine cannot operate efficiently without the benefit of black box electronicsmdashbut that technology still presents intractable challenges of supply safety and environmental impact The air-steam hybrid technology may offer an alternative and a glimpse of that potential is presented here and viewable in Run 5 on the Brash Engines website at http wwwbrashenginescom
While demonstration in a test vehicle provides a strong visual message that BRASH technology works the commercial success of this technology will depend upon reliable repeatable measurement of power and economy For that data the Phase 2 effort will require a return to laboratory bench testing and effective demonstration of recovery of the water and air fractions
The results of this Phase I project collectively demonstrate the technical feasibility and commercial potential of the BRASH air-steam hybrid engine technology The initial DOT SBIR funding has been highly effective in facilitating this important proof of concept and laying the groundwork for further technology refinement and application
As described earlier the next steps are clear and appear to combine achievable and rapid major advances with low developmental risk SBIR Phase 2 support is needed for those advances due to the still-early stage of development that restricts access to private capital
The immense potential value of this technology has been enhanced and verified in Phase 1 there is now a clear and low-risk path ahead to larger-scale testing further component and controls refinement specific applications prototyping and pre-commercial deployments
25William Rosen The Most Powerful Idea in the World Random House 2010 p 311 26US Patent 2981877
FEDERAL TRANSIT ADMINISTRATION 38
APPENDIX
A Heat Transfer Efficiency Modeling Runs 3 and 5 50 and 90
Much of the analysis for Runs 3 and 5 is based on an assumed efficiency of 90 for heat transfer from the combustion of propane to heating of the water air mix in the coil As a test for the reasonableness of that assumption the same data have been modeled at a much lower 50 factor below
112210 - 3 Low Speed Run Air Pressure 60 psi Water head pressure 60 psi
Water2 00440 5060 4276 101 43 (Wt 000Kg)
Propane 152 1493 237 50 27 11880 1004 (Wt 000Kg)
Time 133000 134150 01150 na na na na (hrmnsc)
1 Energy value based upon absorbed heat (italics) from STP to 1000degK (0446 BTUg for Air 115 BTUg water) Underlined value is released heat at generally accepted 44 BTUg
Air (Wt 000Kg)
Component(BTU) Start Wt End Wt Net Wt Energy1
(BTU) Power
(BTUmin) Power (HP) Efficiency3
661 460 201 938 1294 30 36
Water2
(Wt 000Kg)
Propane(Wt 000Kg)
Time (hrmnsc)
1562
123000
1556
123715
00125
006
00715
380
2640
na
523
364
na
12
86
14
50
na na
Air (Wt 000Kg)
Component(BTU) Start Wt
5 Variable High Speed Run Air Pressure 60 psi Water head pressure 70 psi
End Wt Net Wt Energy1
(BTU) Power
(BTUmin) Power (HP) Efficiency3
654 472 182 849 718 17 7
2 Determined by difference from Propane and Air Energy assumed value 90 3 Arbitrary estimated efficiency of heat transfer not effective work
The two known quantities in each run is the weight of the air moving through the system and the weight of the propane heating that air The variable is the quantity of water heated to steam temperatures and above In Run 3 at 90 efficiency that mass of water calculates to 125 grams at 50 it drops to 33 grams In Run 5 at 90 efficiency that mass of water calculates to 86 grams at 50 it drops to 44 grams
FEDERAL TRANSIT ADMINISTRATION 39
APPENDIX A HEAT TRANSFER EFFICIENCY MODELING RUNS 3 AND 5 50 AND 90
As the comparison tables below show the uncertainty in the efficiency of heat transfer is manifest only in the mass of water heated to steam to do useful work
Data 90 Efficiency
Air
Component Run 3 BHP
Run 5 BHP
Net ChngBHP
-45
Run 3 Mass
Transfer (kg)
Run 5 Mass
Transfer (kg)
Net ChangeMass
Transfer (kg)
30 17
197
237
2010 182 -9
Water
Propane
Duration (mn)
47
86
725
422
0060
0013
725
0270
0086
1180
588
350
163 1180
276
163
Data 50 Efficiency
Air
Component Run 3 BHP
Run 5 BHP
Net ChngBHP
-45
Run 3 Mass
Transfer (kg)
Run 5 Mass
Transfer (kg)
Net ChangeMass
Transfer (kg)
30 17
101
237
2010 182 -9
Water
Propane
Duration (mn)
12
86
725
817
0060
0003
725
0270
0044
1180
1233
350
163 1180
276
163
Regardless of the specific efficiency Run3 reflects an air-rich propellant mix while Run 5 was clearly the more powerful and steam-rich propellant If 50 efficiency is a more realistic figure than 90 the only consequence is more water passing through the heater expander and recovery tank The only consequence for overall system efficiency is the slight but added work required to move the additional water by pump to the top of the water column
FEDERAL TRANSIT ADMINISTRATION 40
APPENDIX Acronyms B
BHP Boiler Horsepower
BRASH Binary Recovery Air-Steam Hybrid
BTU British Thermal Unit
CC Cubic centimeter
CFM Cubit feet per minute
CHP Combined heat and power
CNG Compressed natural gas
CO2 Carbon dioxide
CU Cubic
DARPA Defense Advanced Research Projects Agency
DGE Diesel gallon equivalent
DOT Department of Transportation
EC External combustion
EIA Energy Information Administration
EPA Environmental Protection Agency
FTA Federal Transit Administration
GGE Gasoline gallon equivalent
HP Horsepower
IC Internal combustion
K Kelvin
Kcal Kilocalorie
MPG Miles per gallon
MPH Miles per hour
OEM Original equipment manufacturer
PSI Pounds per square inch
RPM Revolutions per minute
SBIR Small Business Innovation Research
STP Standard temperature and pressure
FEDERAL TRANSIT ADMINISTRATION 41
FEDERAL TRANSIT ADMINISTRATION 128
US Department of TransportationFederal Transit AdministrationEast Building1200 New Jersey Avenue SEWashington DC 20590httpwwwftadotgovresearch
US Department of Transportation Federal Transit Administration East Building 1200 New Jersey Avenue SE Washington DC 20590 httpwwwftadotgovresearch
FEDERAL TRANSIT ADMINISTRATION 42
- Button1
- Button2
- Button3
- Button4
- Button5
- Button6
- Button7
- Button8
- Button9
- Button10
- Button11
- Button12
- Button13
- Button14
- Button15
- Button16
- Button17
- Button18
- Button19
- Button20
- Button21
- Button22
- Button23
- Button24
- Button25
- Button26
- Button27
- Button28
- Button29
- Button30
- Button31
- Button32
- Button33
- Button34
- Button35
- Button36
- Button37
- Button38
- Button39
- Button40
- Button41
- Button42
- Button43
- Button44
- Button45
- Button46
- Button47
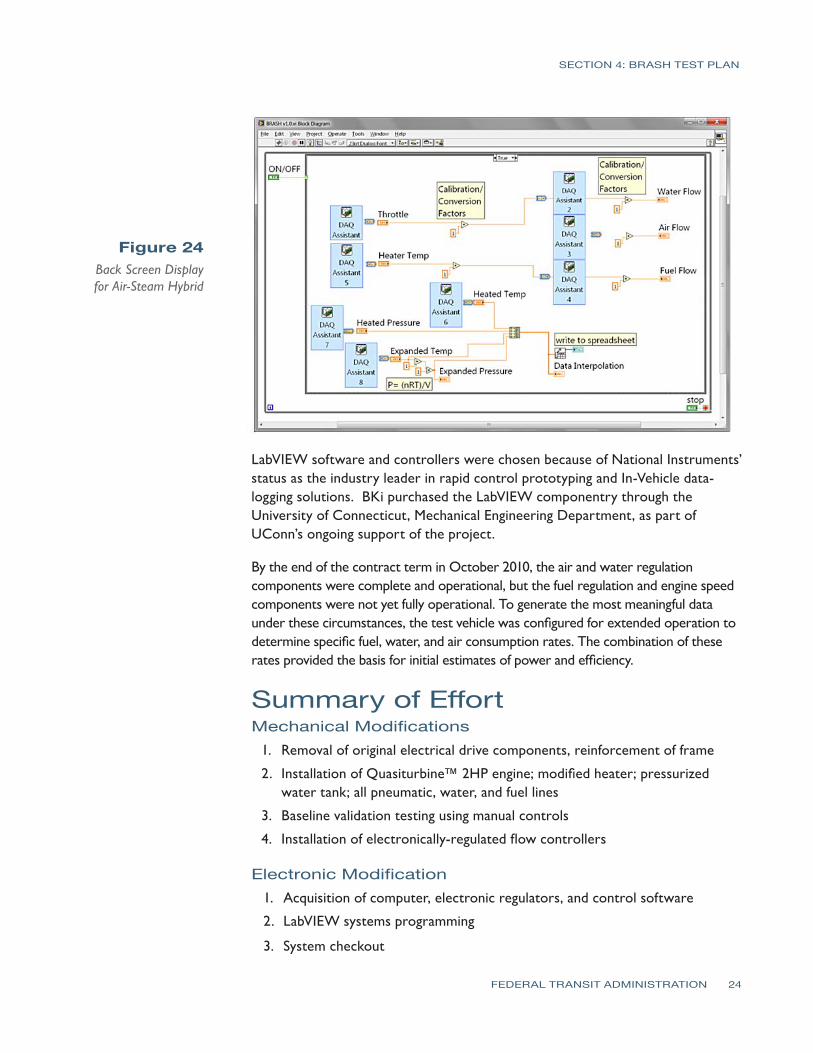
SECTION 4 BRASH TEST PLAN
Figure 24 Back Screen Display for Air-Steam Hybrid
LabVIEW software and controllers were chosen because of National Instrumentsrsquo status as the industry leader in rapid control prototyping and In-Vehicle data-logging solutions BKi purchased the LabVIEW componentry through the University of Connecticut Mechanical Engineering Department as part of UConnrsquos ongoing support of the project
By the end of the contract term in October 2010 the air and water regulation components were complete and operational but the fuel regulation and engine speed components were not yet fully operational To generate the most meaningful data under these circumstances the test vehicle was configured for extended operation to determine specific fuel water and air consumption rates The combination of these rates provided the basis for initial estimates of power and efficiency
Summary of Effort Mechanical Modifications
1 Removal of original electrical drive components reinforcement of frame
2 Installation of Quasiturbinetrade 2HP engine modified heater pressurized water tank all pneumatic water and fuel lines
3 Baseline validation testing using manual controls
4 Installation of electronically-regulated flow controllers
Electronic Modification 1 Acquisition of computer electronic regulators and control software
2 LabVIEW systems programming
3 System checkout
FEDERAL TRANSIT ADMINISTRATION 24
SECTION 4 BRASH TEST PLAN
Testing and Analysis 1 Static Safety Testing 2 Baseline vehicle drivetrain testing
3 Vehicle static testing (Runs 3 amp 5)
Summary of RequirementsGoals 1 Safe operation of vehicle during static and motive applications
2 Qualitative demonstration of BRASH engine capability to move test vehicle on flat and inclined road surface
3 Quantitative determination of air water and fuel consumption during timed static test
4 Quantitative determination of air water and fuel consumption while varyshying water and fuel fractions
Summary of Testing Two experiments were performed in late November the first to establish minimum fuel and propellant flow rates for sustained operation at low speed (air-rich mode) and the second to establish reasonable upper limits of fuel and propellant flow at higher engine speeds (steam-rich mode) Variation in the air-steam mix is the underlying theory of operation for the BRASH engine the air fraction provides a baseline flow for initial start-up and low-speed operation but the addition of water (as steam) to the propellant results in a significant boost in range and power These two tests have verified this underlying theory
Test Conditions The two test runs summarized in this report are 3 on November 22 2010 and 5 on November 26 2010 Both tests were performed at the Depot D campus of the University of Connecticut in Storrs The testing was performed outside in seasonal conditions 45-50degF with light winds
Figure 25 Vehicle Test Setup
FEDERAL TRANSIT ADMINISTRATION 25
SECTION 4 BRASH TEST PLAN
Each run was a dynamic test with no load on the two-cylinder Quasiturbinetrade engine The propane cylinder was suspended from a scale for the duration of the test Propane fuel consumption was monitored continuously by digital scale with a display accuracy of 001kg
Each test run lasted for the duration of one high pressure air cylinder Air cylinder start (full) and end (empty) were determined at the start and finish of each run using the same scale and accuracy Water levels initially were determined volumetrically but the results were too inconsistent Displaced volume of liquid water proved a poor measure of the quantity heated to steam and carried forward for productive work For this reason water is an estimated quantity based upon fuel quantity burned less heat absorbed by the air fraction (Further integration of the LabView controller software in the next phase will obviate this work-around)
Each of the complete test runs may be viewed at Brash Engines website httpwwwbrashenginescom Photos from each run appear in the figures that follow Tables 1 and 2 summarize the productive mass flow for air water and propane fuel to produce work from the engine for the test duration
The cab interior in Figure 26 shows the high pressure air cylinder below the steering wheel and the laptop computer (regulating propellant flow) in passenger seat space The LabView controllers reside in the protective case under the laptop
Figure 26 Vehicle Cab with Controller Laptop
During each test hot propellant was allowed to expand and vent to ambient in order to simplify the thermodynamic model and analysis (Note the plumes of water vapor from each exhaust hose and the small puddles of water under each hose in Figure 27)
FEDERAL TRANSIT ADMINISTRATION 26
SECTION 4 BRASH TEST PLAN
Figure 27 Exhaust Plumes from Expander
Development plans include recovering the expanded propellant separating into water and air phases and then recompressing the air fraction for re-use This will both improve efficiency and eliminate the visible vapor plume
Test Assumptions Another estimation used in this study is the efficiency of heat transfer for the propellant through the 20-ft coil of stainless steel inside the insulated heater Figure 28 shows an early ldquoair-onlyrdquo test run with the current heater The hose failure and melting of the steel wire mesh inside (note formed ball in the mesh) indicates 1300degK temperatures exiting the hot section
Figure 28 Hose Failure Due
to Overheating
FEDERAL TRANSIT ADMINISTRATION 27
SECTION 4 BRASH TEST PLAN
Effective heat transfer (as Figure 28 shows) does not equal efficient heat transfer but the ability to deliver 1300degK air from a well-insulated burner suggests a highly efficient transfer of heat The analysis of results assumes a value of 90 efficiency (See Appendix A for a discussion of heat transfer efficiency)
3 Low Speed Test On November 22 2010 Run 3 tested the lower operating limits of the test setup Low limit in this context meant sufficient pressure to maintain expander rotation but low steam and fuel burn The test commenced with a full air cylinder weighing 661 Kg At the end of the test the empty cylinder weighed 460 Kg Over the 7 minutes and 15 seconds of testing 006 Kg of propane was consumed
The mass of air and fuel was determined from before after run test weights As stated earlier determining the quantity of steam produced from the pressurized water tank was problematic because of the quantity of stored water the resistance to water flow under dynamic pressures and the potential for some fraction of the water (in liquid state) to be entrained in the propellant mix
To solve for this unknown the energy required to raise the known quantity of air from ambient to 1000degK (33kcalmol or 0467 BTUg) was subtracted from the energy content of the propane consumed (44 BTUg) and then the efficiency of the heat transfer process was de-rated by 10 percent to yield a net quantity of 1438 BTUs to elevate ambient temperature water to 1000degK steam The result is an estimated 125 grams of water consumed in the 7-minute test
Table 1 summarizes these data and shows a high reliance on the air fraction for the work performed by the 2 HP engine The air cylinder used in this test has a measured free volume of 45 cubic feet (1274 liters at STP) which means sustained flow rates of 62 cubic feet per minute (cfm) or 175 liters per minute In contrast the 125 grams of water passed through as steam produced an estimated equivalent gas volume of 155 liters at STP Note the modest levels of water vapor in Figure 29 Why the greater air fraction relative to water flow in this test
Air (Wt 000Kg) 661 460 201 938 1294 30 36
Water2
(Wt 000Kg)
Propane(Wt 000Kg)
Time (hrmnsc)
1562
123000
1556
123715
00125
006
00715
1438
2640
na
1983
364
na
47
86
54
90
1 Energy value based upon absorbed heat (italicized) from STP to 1000degK (0446 BTUg for Air 115 BTUg water) 2 Determined by difference from propane and air energy assumed value 90 3Arbitrary estimated efficiency of heat transfer not effective work
11222010 - 3 Low Speed Run Air Pressure 60 psi Water Head Pressure 60 psi
Component(BTU) Start End Net Energy1
(BTU) Power
(BTUmin) Power (HP) Efficiency3
Table 1 Analysis of Mass
Flow Data at Low Speed
FEDERAL TRANSIT ADMINISTRATION 28
SECTION 4 BRASH TEST PLAN
Figure 29 Low-Speed Test Results in Little
Water Vapor
In this baseline experiment the single cylinder provides 60 psi air flow and 60 psi static ldquoheadrdquo pressure on the water column The air flow from the cylinder is biased toward the generally less restrictive flow path for air The water column under the same pressure presents a higher viscosity medium passing through a greater number of valves and restrictions At the point of injection the air fraction flows more freely into the hot section In order to bias the mix toward greater water fraction (and greater power) the head pressure on the water column must be increased over the 60 psi air line pressure
Run 4 (not documented here) evaluated head pressures from 110 psi to 70 psi and determined that modest differential pressures retarded the flow from the air fraction and boosted flow of the water fraction Still higher differential pressures effectively stopped air flow altogether reverting the engine operation to ldquosteam onlyrdquo For Run 5 an additional cylinder was used to apply a 70 psi static head pressure on the water column a 10 psi differential over the 60 psi air line pressure
5 Variable High Speed Test On November 26 2010 Run 5 tested the higher differential water pressure as a means to increase the effective water fraction in the propellant mix The test commenced with a full air cylinder weighing 654 Kg At the end of the test the empty cylinder weighed 472 Kg Run 5 was interrupted after 243 minutes to refill the water tank and then testing resumed for an additional 907 minutes Over the whole test 027 Kg of propane was consumed
Using the same analytical basis as Test 3 Test 5 data indicate a substantial increase in work capacity (as measured by fuel consumed and steam generated) over the 3 baseline
FEDERAL TRANSIT ADMINISTRATION 29
112610 - 5 Variable High Speed Run Air Pressure 60 psi Water Head Pressure 70 psi
Air (Wt 000Kg)
Component(BTU) Start End Net Energy1
(BTU) Power
(BTUmin) Power (HP) Efficiency3
654 472 182 849 718 17 7
SECTION 4 BRASH TEST PLAN
Table 3 Comparison of Mass Flows
Water 588 Runs 3 and 5
163 Duration (mn) 725 1180 725 1180 163
Air
Component Run 3 BHP
Run 5 BHP
Net ChngBHP
Run 5 Mass
Transfer (kg)
Net ChangeMass
Transfer (kg)
30 17
197
237
-45 2010 182 -9
Run 3 Mass
Transfer (kg)
276 350
47
86
422
0060
0013
0270
0086
Propane
This difference in steam fraction and power is more clearly seen in Figure 30 (and on the source video at the Brash Engines website)
Figure 30 Three Images from Run 5
Table 2 Test 5 Results with Increased
Water and Fuel Water2
(Wt 000Kg) 0860 9890 8358 197 83
Propane(Wt 000Kg) 1520 1493 27 11880 1004 237 90
Time (hrmnsc) 133000 134150 01150 na na na na
1 Energy value based upon absorbed heat (italics) from STP to 1000degK (0446 BTUg for Air 115 BTUg water) Underlined value is released heat at generally accepted 44 BTUg 2 Determined by difference from propane and air Energy assumed value 90 3 Arbitrary estimated efficiency of heat transfer not effective work
The increase in pressure on the water column by 10 psi reduced air flow by 9 percent but increased the steam fraction considerably and thereby increased the effective boiler horsepower nearly three-fold to 237 bhp (assuming 90 heat transfer) These data are summarized in Table 3
FEDERAL TRANSIT ADMINISTRATION 30
SECTION 4 BRASH TEST PLAN
As with Run 3 start up from Time Zero was immediate burner on air flow begins and water flow under pressure commences immediately Another impressive feature of the mix air-steam propellant system is the ability to start stop and rapidly accelerate as shown in the full Run 5 video Run 5 serves as validation that this patented technology has unique performance benefits over air steam or internal combustion alone
Lessons Learned A comparison of the two test runs verifies some key points
1 The same power plant can produce variable power and fuel economy based upon power demand and airsteam mix
2 Although imprecise at this point in testing fuel consumption appears directly proportional to engine speed The engineexpander will spool up spool down stop and restart in a manner consistent with fuel and propellant flow The Run 5 video on the Brash Engines website verifies this conclusion
3 The use of a defined static air pressure ldquoheadrdquo over the water column at a pressure higher than the defined air line dynamic pressure provides a safe and predictable bias toward flow from the water fraction
4 Although the current test configuration offers sufficient performance for this initial demonstration phase the following observations are in order
a The heater path is too long creating latent response issues
b The airwater injector is not optimized for proper mix or flow capacity
c The incomplete integration of LabVIEW compromises the quality of data
d The absence of a measured variable load on the expander compromises any analysis of power and fuel economy
5 The design migration to a vehicle installation was premature The project should move back to a lab bench study to refine the regulation of components complete the recovery and recompression portions of the system and use electromechanical loads to estimate power and useful work for specific quantities of fuel water and air
6 The Quasiturbinetrade engine technology is promising but too immature for larger-scale modeling Later phases of the project should rely on more conventional multi-cylinder piston-type expander
Estimated Fuel Economy Mass transit authorities have relied on large diesel engines such as the Detroit Diesel Series 50 and Series 60 engines for more than 30 years Reports on fuel economy vary from a high of 60 miles per gallon (Diesel) for longer-range
FEDERAL TRANSIT ADMINISTRATION 31
SECTION 4 BRASH TEST PLAN
commuter services in California23 to a low of 228 miles per gallon (Diesel) for city buses with frequent stops in New York City24 In both cited studies the migration to compressed natural gas (CNG) has resulted in lower fuel economies on a Diesel Gallon Equivalent (DGE) basis
Table 4 summarizes this study (columns 2 and 3) and the next proposed phase (columns 4 and 5) the performance of the current fleet of mass transit buses (columns 6 and 7) and the likely outcome if the Besler engine (described earlier) were employed with the air-steam hybrid technology (columns 8 and 9)
Table 4 Comparison of
Fuel Economies
Air
1
Configuration
Engine
HP
Torque
Fuel
gmin
BTUhr
GGEhr
mpg 60mph
GGE100 mi
$ per GGE
$100 mi
Current
Example
2
3
3
5
4
Bench
5
S-10
6
SB Bus
7
NYCT
8
50 eff
9
30 eff
86
Quasi
2
Prop
82
216
02
3160
03
30
09
Current
237
Quasi
2
Prop
23
607
05
1126
09
30
27
UC 1
40
6 cyl
20
Prop
40
1056
09
648
15
30
46
UC 2
80
6 cyl
40
Mix
80
2112
19
324
31
30
93
MCI102
DD S60
350
1450
Diesel
540
11400
100
60
167
35
583
Diesel
23
439
35
1535
300
Besler
150
1200
Mix
300
792
695
864
1158
16
1853
500
Besler
150
1200
Mix
500
1320
1158
518
1930
16
3088
The Besler engine is shown in two columns The left column reflects the higher efficiency anticipated with the air-steam hybrid mix described earlier as at or near 50 percent The right column reflects the historical efficiency realized with steam engine technology The italicized numbers near the bottom of the column show that even at historical efficiencies the Besler engine would offer equal or better Gasoline Gallon Equivalent (GGE)100 mile ratings of the current diesel technology but migrating toward less refined and (therefore) less expensive fuels would significantly reduce the operating cost ($mile)
23Demonstration of Caterpillar C-10 Dual-Fuel Engines in MCI 102DL3 Commuter Buses National Renewable Energy Laboratory httpwwwnrelgovdocsfy00osti26758pdf p 7 24R Barnitt ldquoNew York City Transit (NYCT) Hybrid (125 Order) and CNG Transit Buses Final Evaluation Resultsrdquo November 2006 National Renewable Energy Laboratory K Chandler Battelle Technical Report NRELTP-540-40125 November 2006 httpwwwnrelgovvehiclesandfuelsfleettestpdfs40125pdf pvii
FEDERAL TRANSIT ADMINISTRATION 32
SECTION 4 BRASH TEST PLAN
There are of course two orders of magnitude difference between the results of Runs 3 and 5 and the daily demands of city and commuter buses but the mere existence of the Besler Twin and the Brooks V-8 400 HP engine suggests an opportunity for fuel economy and fuel variety
Proposed further support for the next phase of development will advance the air-steam hybrid technology by an important order of magnitude This would provide the data confidence to scale to larger vehicle operation and garner the interest of one or more engine or vehicle OEMs
Figure 31 MTANew York City
Transit Orion VII Next Generation
Hybrid Transit Bus
Next Development Phase The next phase of development will incorporate a modern six-cylinder steam engine design with a displacement of 53 cubic inches and capable of sustained 15-25 HP operation The expander will be supplied by Steam Engine Power Inc (httpwwwsteamenginepowercom) This expander will drive an alternator generator to measure effective work output in watts as well as provide sufficient power to satisfy the system parasitic loads of battery recharge exhaust air recompression and all other pump and valve operations
Figure 32 (l to r) Six-Cylinder Expander Power Generation Load
Small 24 VDC Compressor
FEDERAL TRANSIT ADMINISTRATION 33
SECTION 4 BRASH TEST PLAN
Static pressure for the water column will still be supplied via compressed air cylinder but the dynamic air flow will be supplied by an oil-less air compressor of the size and type shown This 24 VDC compressor will recompress the recovered air exiting the expander to 40ndash60 psi pressure and support flows of 3ndash4 cubic feet per minute (cfm) These three components are off-the-shelf enhancements to the system but custom engineering of a new more powerful and more responsive heater completion of the electronic integration and design and fabrication of the recoveryrecompression components are necessary tasks that must be included to make the next generation assembly work to its potential This work will be accomplished largely by Mechanical and Electrical Engineering students at the University of Connecticut under the supervision of faculty and Brash Engines personnel
When this build is complete all operations will be under LabVIEW control All expander operations will be measured for power and work Once the bench version is in control a modified version will be installed in a small pickup truck (eg Chevrolet S-10) for further verification of system performance and robustness
During this phase a new and promising technology will be investigated a new and faster class of solenoid valves from National Instruments These solenoid valves with an unprecedented 3 msec response time have the potential of allowing air-steam retrofit in existing engine blocks The solenoid valves could replace the spark plugs in conventional IC engines and provide the equivalent timed injection of hot propellant mix as the timed firing of a spark plug in the presence of a fuel air mix
If possible these fast solenoids and the black box programming to control them could allow very easy portability to larger vehicles and easier retrofit Potentially a V-6 engine could operate 4 cylinders for expansion and the remaining two cylinders could be used as direct drive compressors with different but equivalent solenoid valves controlling the compression process
FEDERAL TRANSIT ADMINISTRATION 34
SECTION Development Plan 5 and Next Steps
This current effort is a key first-proof of concept for this air-steam hybrid technology but our goals extend well beyond this two-seat 2 HP demonstrator The lessons learned in electronic integration will allow rapid migration to larger platforms using the same basic controls but scaling the expander heater and other mass-flow components to vehicle-appropriate size That project identified as ldquo20 HP Vehiclerdquo and other near-term derivative projects are listed in Table 5
BRASH Project
ProposedFunding Source
Funds Reqd $K Project Description
SUV-size proof-of-concept for reliable 20 HP Vehicle DOTUSPS 300 highway performance maildelivery
vehicle size
Proof-of-concept mass transit busshy200 HP Vehicle DOTDOD 600 retrofit scaled to city bus capacity and
suitable for replacement of over-the-road diesel engines
Table 5 Project Funding
Stationary Power Unit Micro-CHP Equivalent
DARPA 300 Proof-of-concept mass transit bus-retrofit scaled to city bus capacity and suitable for replacement of over-the-road diesel engines
Summary Alternative Processed Solid Fuel DOE EPA DOA 600
Processed mix of hydrolyzed wood pulp processed solid waste and other combustible solids in an extrudable mass with alcohol solutevehiclemdashdemonstrate utility in vehicles as a high energy content clean burning fuel for EC engines
Demonstrate effective pyrolysis of
Binary Solid Gas Fuel
EPA Waste Management BFI
400 processed solid fuels in a binary fuel burner conventional fuel (gasoline natural gas) provides primary heat source for pyrolysis temperatures
Proof of Concept OEM Power Plant
Vehicle OEM (eg Ford GM Caterpillar) 1200
Development of direct replacement BRASH engine alternative to existing OEM IC engine
Black Box Integration of Controller Software
Vehicle OEM (eg Ford GM Caterpillar)
1600 Development of commercial BRASH system alternative to existing OEM IC engine
FEDERAL TRANSIT ADMINISTRATION 35
SECTION 5 DEVELOPMENT PLAN AND NEXT STEPS
The issuance of US Patent 7743872 five months ago has two important consequences for this project First it serves to validate the underlying technology the combination of air and steam in an EC engine is better than steam or air alone Second it provides a basis for full and open discussions with government agencies and large commercial interests in the transportation and power sectors
Our efforts at promotion have been delayed pending successful demonstration of the Smarttrade car vehicle to allow the first detailed real-world performance data to be distributed
Coupling that performance data with the option of migration away from refined petroleum should spark significant interest If we can move to a high lignin-processed wood pulp that costs $045 per gasoline gallon equivalent (an arbitrary value for example only) and consumes more CO2 while growing than is consumed in processing as a fuel and produced from combustion then we succeed as a project and as a global game-changing technology for many uses Improvements in fuel economy are important but of greater importance is the migration to low-process biomass fuels
FEDERAL TRANSIT ADMINISTRATION 36
SECTION Potential Applications and Societal Value 6 The whole premise behind the BRASH air steam hybrid is that external combustion offers a more benign and environmentally-appropriate way to power large vehicles and other portable equipment than refined petroleum-powered internal combustion
bullCombustion heat can be derived from any fuel source including processed solids from fast-growing renewables such as poplar trees waste corn stalks or switch grass
bullThat combustion heat is applied at a rate consistent with the work to be done and not to support idling and other unproductive fuel use
Using a mix of air and steam as working fluids in the engine allows
bullImmediate startup from an ldquoair-onlyrdquo start
bull Managed system pressure through use of a defined head air pressure
bullManaged fuel burn as the air-steam fraction is adjusted to match wheel load
bullAdjusted wheel load reduces fuel burn
Integration of modern control circuitry with external combustion also brings a level of performance operational simplicity and safety heretofore unavailable
FEDERAL TRANSIT ADMINISTRATION 37
SECTION
7 Phase I Conclusions
The last steam train in scheduled service in the US departed on October 11 196225 One year earlier Robert Noyce received the first patent for an integrated circuit26 But for that brief one-year overlap the most powerful motive power technology was never harnessed by the black box controls that grew out of Noycersquos invention so the diesel-powered IC engine championed by Henry Ford won out
Now nearly 50 years later the modern IC engine cannot operate efficiently without the benefit of black box electronicsmdashbut that technology still presents intractable challenges of supply safety and environmental impact The air-steam hybrid technology may offer an alternative and a glimpse of that potential is presented here and viewable in Run 5 on the Brash Engines website at http wwwbrashenginescom
While demonstration in a test vehicle provides a strong visual message that BRASH technology works the commercial success of this technology will depend upon reliable repeatable measurement of power and economy For that data the Phase 2 effort will require a return to laboratory bench testing and effective demonstration of recovery of the water and air fractions
The results of this Phase I project collectively demonstrate the technical feasibility and commercial potential of the BRASH air-steam hybrid engine technology The initial DOT SBIR funding has been highly effective in facilitating this important proof of concept and laying the groundwork for further technology refinement and application
As described earlier the next steps are clear and appear to combine achievable and rapid major advances with low developmental risk SBIR Phase 2 support is needed for those advances due to the still-early stage of development that restricts access to private capital
The immense potential value of this technology has been enhanced and verified in Phase 1 there is now a clear and low-risk path ahead to larger-scale testing further component and controls refinement specific applications prototyping and pre-commercial deployments
25William Rosen The Most Powerful Idea in the World Random House 2010 p 311 26US Patent 2981877
FEDERAL TRANSIT ADMINISTRATION 38
APPENDIX
A Heat Transfer Efficiency Modeling Runs 3 and 5 50 and 90
Much of the analysis for Runs 3 and 5 is based on an assumed efficiency of 90 for heat transfer from the combustion of propane to heating of the water air mix in the coil As a test for the reasonableness of that assumption the same data have been modeled at a much lower 50 factor below
112210 - 3 Low Speed Run Air Pressure 60 psi Water head pressure 60 psi
Water2 00440 5060 4276 101 43 (Wt 000Kg)
Propane 152 1493 237 50 27 11880 1004 (Wt 000Kg)
Time 133000 134150 01150 na na na na (hrmnsc)
1 Energy value based upon absorbed heat (italics) from STP to 1000degK (0446 BTUg for Air 115 BTUg water) Underlined value is released heat at generally accepted 44 BTUg
Air (Wt 000Kg)
Component(BTU) Start Wt End Wt Net Wt Energy1
(BTU) Power
(BTUmin) Power (HP) Efficiency3
661 460 201 938 1294 30 36
Water2
(Wt 000Kg)
Propane(Wt 000Kg)
Time (hrmnsc)
1562
123000
1556
123715
00125
006
00715
380
2640
na
523
364
na
12
86
14
50
na na
Air (Wt 000Kg)
Component(BTU) Start Wt
5 Variable High Speed Run Air Pressure 60 psi Water head pressure 70 psi
End Wt Net Wt Energy1
(BTU) Power
(BTUmin) Power (HP) Efficiency3
654 472 182 849 718 17 7
2 Determined by difference from Propane and Air Energy assumed value 90 3 Arbitrary estimated efficiency of heat transfer not effective work
The two known quantities in each run is the weight of the air moving through the system and the weight of the propane heating that air The variable is the quantity of water heated to steam temperatures and above In Run 3 at 90 efficiency that mass of water calculates to 125 grams at 50 it drops to 33 grams In Run 5 at 90 efficiency that mass of water calculates to 86 grams at 50 it drops to 44 grams
FEDERAL TRANSIT ADMINISTRATION 39
APPENDIX A HEAT TRANSFER EFFICIENCY MODELING RUNS 3 AND 5 50 AND 90
As the comparison tables below show the uncertainty in the efficiency of heat transfer is manifest only in the mass of water heated to steam to do useful work
Data 90 Efficiency
Air
Component Run 3 BHP
Run 5 BHP
Net ChngBHP
-45
Run 3 Mass
Transfer (kg)
Run 5 Mass
Transfer (kg)
Net ChangeMass
Transfer (kg)
30 17
197
237
2010 182 -9
Water
Propane
Duration (mn)
47
86
725
422
0060
0013
725
0270
0086
1180
588
350
163 1180
276
163
Data 50 Efficiency
Air
Component Run 3 BHP
Run 5 BHP
Net ChngBHP
-45
Run 3 Mass
Transfer (kg)
Run 5 Mass
Transfer (kg)
Net ChangeMass
Transfer (kg)
30 17
101
237
2010 182 -9
Water
Propane
Duration (mn)
12
86
725
817
0060
0003
725
0270
0044
1180
1233
350
163 1180
276
163
Regardless of the specific efficiency Run3 reflects an air-rich propellant mix while Run 5 was clearly the more powerful and steam-rich propellant If 50 efficiency is a more realistic figure than 90 the only consequence is more water passing through the heater expander and recovery tank The only consequence for overall system efficiency is the slight but added work required to move the additional water by pump to the top of the water column
FEDERAL TRANSIT ADMINISTRATION 40
APPENDIX Acronyms B
BHP Boiler Horsepower
BRASH Binary Recovery Air-Steam Hybrid
BTU British Thermal Unit
CC Cubic centimeter
CFM Cubit feet per minute
CHP Combined heat and power
CNG Compressed natural gas
CO2 Carbon dioxide
CU Cubic
DARPA Defense Advanced Research Projects Agency
DGE Diesel gallon equivalent
DOT Department of Transportation
EC External combustion
EIA Energy Information Administration
EPA Environmental Protection Agency
FTA Federal Transit Administration
GGE Gasoline gallon equivalent
HP Horsepower
IC Internal combustion
K Kelvin
Kcal Kilocalorie
MPG Miles per gallon
MPH Miles per hour
OEM Original equipment manufacturer
PSI Pounds per square inch
RPM Revolutions per minute
SBIR Small Business Innovation Research
STP Standard temperature and pressure
FEDERAL TRANSIT ADMINISTRATION 41
FEDERAL TRANSIT ADMINISTRATION 128
US Department of TransportationFederal Transit AdministrationEast Building1200 New Jersey Avenue SEWashington DC 20590httpwwwftadotgovresearch
US Department of Transportation Federal Transit Administration East Building 1200 New Jersey Avenue SE Washington DC 20590 httpwwwftadotgovresearch
FEDERAL TRANSIT ADMINISTRATION 42
- Button1
- Button2
- Button3
- Button4
- Button5
- Button6
- Button7
- Button8
- Button9
- Button10
- Button11
- Button12
- Button13
- Button14
- Button15
- Button16
- Button17
- Button18
- Button19
- Button20
- Button21
- Button22
- Button23
- Button24
- Button25
- Button26
- Button27
- Button28
- Button29
- Button30
- Button31
- Button32
- Button33
- Button34
- Button35
- Button36
- Button37
- Button38
- Button39
- Button40
- Button41
- Button42
- Button43
- Button44
- Button45
- Button46
- Button47
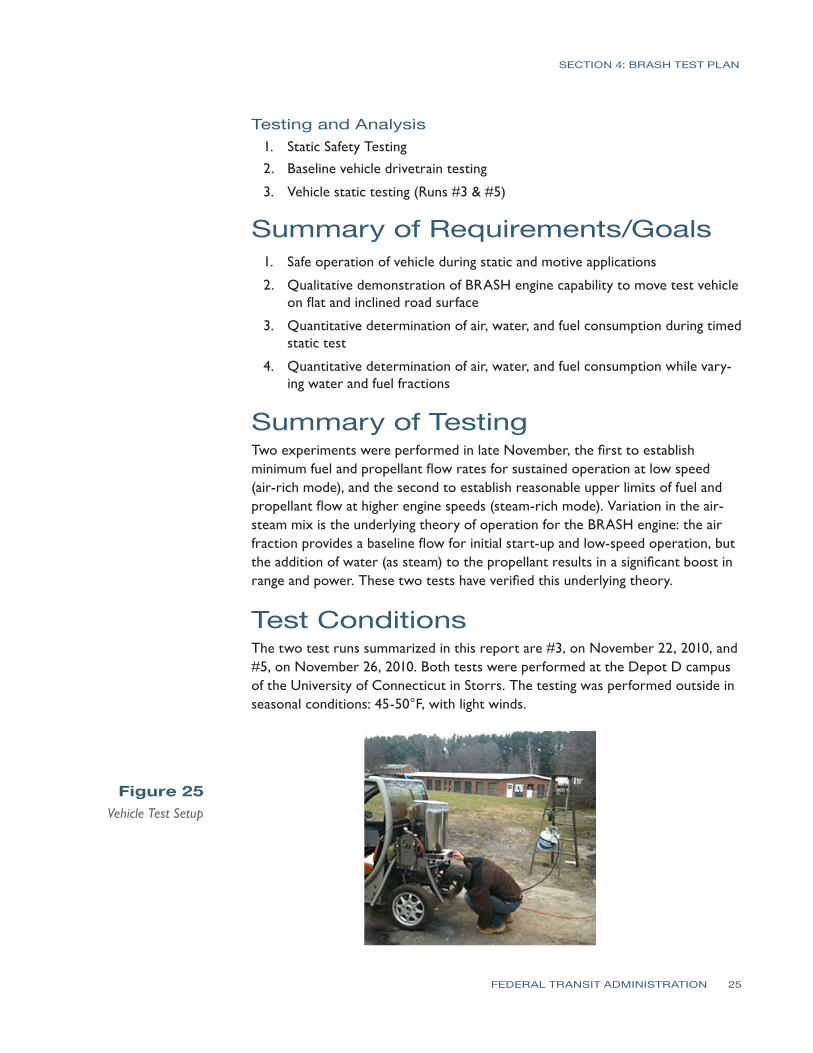
SECTION 4 BRASH TEST PLAN
Testing and Analysis 1 Static Safety Testing 2 Baseline vehicle drivetrain testing
3 Vehicle static testing (Runs 3 amp 5)
Summary of RequirementsGoals 1 Safe operation of vehicle during static and motive applications
2 Qualitative demonstration of BRASH engine capability to move test vehicle on flat and inclined road surface
3 Quantitative determination of air water and fuel consumption during timed static test
4 Quantitative determination of air water and fuel consumption while varyshying water and fuel fractions
Summary of Testing Two experiments were performed in late November the first to establish minimum fuel and propellant flow rates for sustained operation at low speed (air-rich mode) and the second to establish reasonable upper limits of fuel and propellant flow at higher engine speeds (steam-rich mode) Variation in the air-steam mix is the underlying theory of operation for the BRASH engine the air fraction provides a baseline flow for initial start-up and low-speed operation but the addition of water (as steam) to the propellant results in a significant boost in range and power These two tests have verified this underlying theory
Test Conditions The two test runs summarized in this report are 3 on November 22 2010 and 5 on November 26 2010 Both tests were performed at the Depot D campus of the University of Connecticut in Storrs The testing was performed outside in seasonal conditions 45-50degF with light winds
Figure 25 Vehicle Test Setup
FEDERAL TRANSIT ADMINISTRATION 25
SECTION 4 BRASH TEST PLAN
Each run was a dynamic test with no load on the two-cylinder Quasiturbinetrade engine The propane cylinder was suspended from a scale for the duration of the test Propane fuel consumption was monitored continuously by digital scale with a display accuracy of 001kg
Each test run lasted for the duration of one high pressure air cylinder Air cylinder start (full) and end (empty) were determined at the start and finish of each run using the same scale and accuracy Water levels initially were determined volumetrically but the results were too inconsistent Displaced volume of liquid water proved a poor measure of the quantity heated to steam and carried forward for productive work For this reason water is an estimated quantity based upon fuel quantity burned less heat absorbed by the air fraction (Further integration of the LabView controller software in the next phase will obviate this work-around)
Each of the complete test runs may be viewed at Brash Engines website httpwwwbrashenginescom Photos from each run appear in the figures that follow Tables 1 and 2 summarize the productive mass flow for air water and propane fuel to produce work from the engine for the test duration
The cab interior in Figure 26 shows the high pressure air cylinder below the steering wheel and the laptop computer (regulating propellant flow) in passenger seat space The LabView controllers reside in the protective case under the laptop
Figure 26 Vehicle Cab with Controller Laptop
During each test hot propellant was allowed to expand and vent to ambient in order to simplify the thermodynamic model and analysis (Note the plumes of water vapor from each exhaust hose and the small puddles of water under each hose in Figure 27)
FEDERAL TRANSIT ADMINISTRATION 26
SECTION 4 BRASH TEST PLAN
Figure 27 Exhaust Plumes from Expander
Development plans include recovering the expanded propellant separating into water and air phases and then recompressing the air fraction for re-use This will both improve efficiency and eliminate the visible vapor plume
Test Assumptions Another estimation used in this study is the efficiency of heat transfer for the propellant through the 20-ft coil of stainless steel inside the insulated heater Figure 28 shows an early ldquoair-onlyrdquo test run with the current heater The hose failure and melting of the steel wire mesh inside (note formed ball in the mesh) indicates 1300degK temperatures exiting the hot section
Figure 28 Hose Failure Due
to Overheating
FEDERAL TRANSIT ADMINISTRATION 27
SECTION 4 BRASH TEST PLAN
Effective heat transfer (as Figure 28 shows) does not equal efficient heat transfer but the ability to deliver 1300degK air from a well-insulated burner suggests a highly efficient transfer of heat The analysis of results assumes a value of 90 efficiency (See Appendix A for a discussion of heat transfer efficiency)
3 Low Speed Test On November 22 2010 Run 3 tested the lower operating limits of the test setup Low limit in this context meant sufficient pressure to maintain expander rotation but low steam and fuel burn The test commenced with a full air cylinder weighing 661 Kg At the end of the test the empty cylinder weighed 460 Kg Over the 7 minutes and 15 seconds of testing 006 Kg of propane was consumed
The mass of air and fuel was determined from before after run test weights As stated earlier determining the quantity of steam produced from the pressurized water tank was problematic because of the quantity of stored water the resistance to water flow under dynamic pressures and the potential for some fraction of the water (in liquid state) to be entrained in the propellant mix
To solve for this unknown the energy required to raise the known quantity of air from ambient to 1000degK (33kcalmol or 0467 BTUg) was subtracted from the energy content of the propane consumed (44 BTUg) and then the efficiency of the heat transfer process was de-rated by 10 percent to yield a net quantity of 1438 BTUs to elevate ambient temperature water to 1000degK steam The result is an estimated 125 grams of water consumed in the 7-minute test
Table 1 summarizes these data and shows a high reliance on the air fraction for the work performed by the 2 HP engine The air cylinder used in this test has a measured free volume of 45 cubic feet (1274 liters at STP) which means sustained flow rates of 62 cubic feet per minute (cfm) or 175 liters per minute In contrast the 125 grams of water passed through as steam produced an estimated equivalent gas volume of 155 liters at STP Note the modest levels of water vapor in Figure 29 Why the greater air fraction relative to water flow in this test
Air (Wt 000Kg) 661 460 201 938 1294 30 36
Water2
(Wt 000Kg)
Propane(Wt 000Kg)
Time (hrmnsc)
1562
123000
1556
123715
00125
006
00715
1438
2640
na
1983
364
na
47
86
54
90
1 Energy value based upon absorbed heat (italicized) from STP to 1000degK (0446 BTUg for Air 115 BTUg water) 2 Determined by difference from propane and air energy assumed value 90 3Arbitrary estimated efficiency of heat transfer not effective work
11222010 - 3 Low Speed Run Air Pressure 60 psi Water Head Pressure 60 psi
Component(BTU) Start End Net Energy1
(BTU) Power
(BTUmin) Power (HP) Efficiency3
Table 1 Analysis of Mass
Flow Data at Low Speed
FEDERAL TRANSIT ADMINISTRATION 28
SECTION 4 BRASH TEST PLAN
Figure 29 Low-Speed Test Results in Little
Water Vapor
In this baseline experiment the single cylinder provides 60 psi air flow and 60 psi static ldquoheadrdquo pressure on the water column The air flow from the cylinder is biased toward the generally less restrictive flow path for air The water column under the same pressure presents a higher viscosity medium passing through a greater number of valves and restrictions At the point of injection the air fraction flows more freely into the hot section In order to bias the mix toward greater water fraction (and greater power) the head pressure on the water column must be increased over the 60 psi air line pressure
Run 4 (not documented here) evaluated head pressures from 110 psi to 70 psi and determined that modest differential pressures retarded the flow from the air fraction and boosted flow of the water fraction Still higher differential pressures effectively stopped air flow altogether reverting the engine operation to ldquosteam onlyrdquo For Run 5 an additional cylinder was used to apply a 70 psi static head pressure on the water column a 10 psi differential over the 60 psi air line pressure
5 Variable High Speed Test On November 26 2010 Run 5 tested the higher differential water pressure as a means to increase the effective water fraction in the propellant mix The test commenced with a full air cylinder weighing 654 Kg At the end of the test the empty cylinder weighed 472 Kg Run 5 was interrupted after 243 minutes to refill the water tank and then testing resumed for an additional 907 minutes Over the whole test 027 Kg of propane was consumed
Using the same analytical basis as Test 3 Test 5 data indicate a substantial increase in work capacity (as measured by fuel consumed and steam generated) over the 3 baseline
FEDERAL TRANSIT ADMINISTRATION 29
112610 - 5 Variable High Speed Run Air Pressure 60 psi Water Head Pressure 70 psi
Air (Wt 000Kg)
Component(BTU) Start End Net Energy1
(BTU) Power
(BTUmin) Power (HP) Efficiency3
654 472 182 849 718 17 7
SECTION 4 BRASH TEST PLAN
Table 3 Comparison of Mass Flows
Water 588 Runs 3 and 5
163 Duration (mn) 725 1180 725 1180 163
Air
Component Run 3 BHP
Run 5 BHP
Net ChngBHP
Run 5 Mass
Transfer (kg)
Net ChangeMass
Transfer (kg)
30 17
197
237
-45 2010 182 -9
Run 3 Mass
Transfer (kg)
276 350
47
86
422
0060
0013
0270
0086
Propane
This difference in steam fraction and power is more clearly seen in Figure 30 (and on the source video at the Brash Engines website)
Figure 30 Three Images from Run 5
Table 2 Test 5 Results with Increased
Water and Fuel Water2
(Wt 000Kg) 0860 9890 8358 197 83
Propane(Wt 000Kg) 1520 1493 27 11880 1004 237 90
Time (hrmnsc) 133000 134150 01150 na na na na
1 Energy value based upon absorbed heat (italics) from STP to 1000degK (0446 BTUg for Air 115 BTUg water) Underlined value is released heat at generally accepted 44 BTUg 2 Determined by difference from propane and air Energy assumed value 90 3 Arbitrary estimated efficiency of heat transfer not effective work
The increase in pressure on the water column by 10 psi reduced air flow by 9 percent but increased the steam fraction considerably and thereby increased the effective boiler horsepower nearly three-fold to 237 bhp (assuming 90 heat transfer) These data are summarized in Table 3
FEDERAL TRANSIT ADMINISTRATION 30
SECTION 4 BRASH TEST PLAN
As with Run 3 start up from Time Zero was immediate burner on air flow begins and water flow under pressure commences immediately Another impressive feature of the mix air-steam propellant system is the ability to start stop and rapidly accelerate as shown in the full Run 5 video Run 5 serves as validation that this patented technology has unique performance benefits over air steam or internal combustion alone
Lessons Learned A comparison of the two test runs verifies some key points
1 The same power plant can produce variable power and fuel economy based upon power demand and airsteam mix
2 Although imprecise at this point in testing fuel consumption appears directly proportional to engine speed The engineexpander will spool up spool down stop and restart in a manner consistent with fuel and propellant flow The Run 5 video on the Brash Engines website verifies this conclusion
3 The use of a defined static air pressure ldquoheadrdquo over the water column at a pressure higher than the defined air line dynamic pressure provides a safe and predictable bias toward flow from the water fraction
4 Although the current test configuration offers sufficient performance for this initial demonstration phase the following observations are in order
a The heater path is too long creating latent response issues
b The airwater injector is not optimized for proper mix or flow capacity
c The incomplete integration of LabVIEW compromises the quality of data
d The absence of a measured variable load on the expander compromises any analysis of power and fuel economy
5 The design migration to a vehicle installation was premature The project should move back to a lab bench study to refine the regulation of components complete the recovery and recompression portions of the system and use electromechanical loads to estimate power and useful work for specific quantities of fuel water and air
6 The Quasiturbinetrade engine technology is promising but too immature for larger-scale modeling Later phases of the project should rely on more conventional multi-cylinder piston-type expander
Estimated Fuel Economy Mass transit authorities have relied on large diesel engines such as the Detroit Diesel Series 50 and Series 60 engines for more than 30 years Reports on fuel economy vary from a high of 60 miles per gallon (Diesel) for longer-range
FEDERAL TRANSIT ADMINISTRATION 31
SECTION 4 BRASH TEST PLAN
commuter services in California23 to a low of 228 miles per gallon (Diesel) for city buses with frequent stops in New York City24 In both cited studies the migration to compressed natural gas (CNG) has resulted in lower fuel economies on a Diesel Gallon Equivalent (DGE) basis
Table 4 summarizes this study (columns 2 and 3) and the next proposed phase (columns 4 and 5) the performance of the current fleet of mass transit buses (columns 6 and 7) and the likely outcome if the Besler engine (described earlier) were employed with the air-steam hybrid technology (columns 8 and 9)
Table 4 Comparison of
Fuel Economies
Air
1
Configuration
Engine
HP
Torque
Fuel
gmin
BTUhr
GGEhr
mpg 60mph
GGE100 mi
$ per GGE
$100 mi
Current
Example
2
3
3
5
4
Bench
5
S-10
6
SB Bus
7
NYCT
8
50 eff
9
30 eff
86
Quasi
2
Prop
82
216
02
3160
03
30
09
Current
237
Quasi
2
Prop
23
607
05
1126
09
30
27
UC 1
40
6 cyl
20
Prop
40
1056
09
648
15
30
46
UC 2
80
6 cyl
40
Mix
80
2112
19
324
31
30
93
MCI102
DD S60
350
1450
Diesel
540
11400
100
60
167
35
583
Diesel
23
439
35
1535
300
Besler
150
1200
Mix
300
792
695
864
1158
16
1853
500
Besler
150
1200
Mix
500
1320
1158
518
1930
16
3088
The Besler engine is shown in two columns The left column reflects the higher efficiency anticipated with the air-steam hybrid mix described earlier as at or near 50 percent The right column reflects the historical efficiency realized with steam engine technology The italicized numbers near the bottom of the column show that even at historical efficiencies the Besler engine would offer equal or better Gasoline Gallon Equivalent (GGE)100 mile ratings of the current diesel technology but migrating toward less refined and (therefore) less expensive fuels would significantly reduce the operating cost ($mile)
23Demonstration of Caterpillar C-10 Dual-Fuel Engines in MCI 102DL3 Commuter Buses National Renewable Energy Laboratory httpwwwnrelgovdocsfy00osti26758pdf p 7 24R Barnitt ldquoNew York City Transit (NYCT) Hybrid (125 Order) and CNG Transit Buses Final Evaluation Resultsrdquo November 2006 National Renewable Energy Laboratory K Chandler Battelle Technical Report NRELTP-540-40125 November 2006 httpwwwnrelgovvehiclesandfuelsfleettestpdfs40125pdf pvii
FEDERAL TRANSIT ADMINISTRATION 32
SECTION 4 BRASH TEST PLAN
There are of course two orders of magnitude difference between the results of Runs 3 and 5 and the daily demands of city and commuter buses but the mere existence of the Besler Twin and the Brooks V-8 400 HP engine suggests an opportunity for fuel economy and fuel variety
Proposed further support for the next phase of development will advance the air-steam hybrid technology by an important order of magnitude This would provide the data confidence to scale to larger vehicle operation and garner the interest of one or more engine or vehicle OEMs
Figure 31 MTANew York City
Transit Orion VII Next Generation
Hybrid Transit Bus
Next Development Phase The next phase of development will incorporate a modern six-cylinder steam engine design with a displacement of 53 cubic inches and capable of sustained 15-25 HP operation The expander will be supplied by Steam Engine Power Inc (httpwwwsteamenginepowercom) This expander will drive an alternator generator to measure effective work output in watts as well as provide sufficient power to satisfy the system parasitic loads of battery recharge exhaust air recompression and all other pump and valve operations
Figure 32 (l to r) Six-Cylinder Expander Power Generation Load
Small 24 VDC Compressor
FEDERAL TRANSIT ADMINISTRATION 33
SECTION 4 BRASH TEST PLAN
Static pressure for the water column will still be supplied via compressed air cylinder but the dynamic air flow will be supplied by an oil-less air compressor of the size and type shown This 24 VDC compressor will recompress the recovered air exiting the expander to 40ndash60 psi pressure and support flows of 3ndash4 cubic feet per minute (cfm) These three components are off-the-shelf enhancements to the system but custom engineering of a new more powerful and more responsive heater completion of the electronic integration and design and fabrication of the recoveryrecompression components are necessary tasks that must be included to make the next generation assembly work to its potential This work will be accomplished largely by Mechanical and Electrical Engineering students at the University of Connecticut under the supervision of faculty and Brash Engines personnel
When this build is complete all operations will be under LabVIEW control All expander operations will be measured for power and work Once the bench version is in control a modified version will be installed in a small pickup truck (eg Chevrolet S-10) for further verification of system performance and robustness
During this phase a new and promising technology will be investigated a new and faster class of solenoid valves from National Instruments These solenoid valves with an unprecedented 3 msec response time have the potential of allowing air-steam retrofit in existing engine blocks The solenoid valves could replace the spark plugs in conventional IC engines and provide the equivalent timed injection of hot propellant mix as the timed firing of a spark plug in the presence of a fuel air mix
If possible these fast solenoids and the black box programming to control them could allow very easy portability to larger vehicles and easier retrofit Potentially a V-6 engine could operate 4 cylinders for expansion and the remaining two cylinders could be used as direct drive compressors with different but equivalent solenoid valves controlling the compression process
FEDERAL TRANSIT ADMINISTRATION 34
SECTION Development Plan 5 and Next Steps
This current effort is a key first-proof of concept for this air-steam hybrid technology but our goals extend well beyond this two-seat 2 HP demonstrator The lessons learned in electronic integration will allow rapid migration to larger platforms using the same basic controls but scaling the expander heater and other mass-flow components to vehicle-appropriate size That project identified as ldquo20 HP Vehiclerdquo and other near-term derivative projects are listed in Table 5
BRASH Project
ProposedFunding Source
Funds Reqd $K Project Description
SUV-size proof-of-concept for reliable 20 HP Vehicle DOTUSPS 300 highway performance maildelivery
vehicle size
Proof-of-concept mass transit busshy200 HP Vehicle DOTDOD 600 retrofit scaled to city bus capacity and
suitable for replacement of over-the-road diesel engines
Table 5 Project Funding
Stationary Power Unit Micro-CHP Equivalent
DARPA 300 Proof-of-concept mass transit bus-retrofit scaled to city bus capacity and suitable for replacement of over-the-road diesel engines
Summary Alternative Processed Solid Fuel DOE EPA DOA 600
Processed mix of hydrolyzed wood pulp processed solid waste and other combustible solids in an extrudable mass with alcohol solutevehiclemdashdemonstrate utility in vehicles as a high energy content clean burning fuel for EC engines
Demonstrate effective pyrolysis of
Binary Solid Gas Fuel
EPA Waste Management BFI
400 processed solid fuels in a binary fuel burner conventional fuel (gasoline natural gas) provides primary heat source for pyrolysis temperatures
Proof of Concept OEM Power Plant
Vehicle OEM (eg Ford GM Caterpillar) 1200
Development of direct replacement BRASH engine alternative to existing OEM IC engine
Black Box Integration of Controller Software
Vehicle OEM (eg Ford GM Caterpillar)
1600 Development of commercial BRASH system alternative to existing OEM IC engine
FEDERAL TRANSIT ADMINISTRATION 35
SECTION 5 DEVELOPMENT PLAN AND NEXT STEPS
The issuance of US Patent 7743872 five months ago has two important consequences for this project First it serves to validate the underlying technology the combination of air and steam in an EC engine is better than steam or air alone Second it provides a basis for full and open discussions with government agencies and large commercial interests in the transportation and power sectors
Our efforts at promotion have been delayed pending successful demonstration of the Smarttrade car vehicle to allow the first detailed real-world performance data to be distributed
Coupling that performance data with the option of migration away from refined petroleum should spark significant interest If we can move to a high lignin-processed wood pulp that costs $045 per gasoline gallon equivalent (an arbitrary value for example only) and consumes more CO2 while growing than is consumed in processing as a fuel and produced from combustion then we succeed as a project and as a global game-changing technology for many uses Improvements in fuel economy are important but of greater importance is the migration to low-process biomass fuels
FEDERAL TRANSIT ADMINISTRATION 36
SECTION Potential Applications and Societal Value 6 The whole premise behind the BRASH air steam hybrid is that external combustion offers a more benign and environmentally-appropriate way to power large vehicles and other portable equipment than refined petroleum-powered internal combustion
bullCombustion heat can be derived from any fuel source including processed solids from fast-growing renewables such as poplar trees waste corn stalks or switch grass
bullThat combustion heat is applied at a rate consistent with the work to be done and not to support idling and other unproductive fuel use
Using a mix of air and steam as working fluids in the engine allows
bullImmediate startup from an ldquoair-onlyrdquo start
bull Managed system pressure through use of a defined head air pressure
bullManaged fuel burn as the air-steam fraction is adjusted to match wheel load
bullAdjusted wheel load reduces fuel burn
Integration of modern control circuitry with external combustion also brings a level of performance operational simplicity and safety heretofore unavailable
FEDERAL TRANSIT ADMINISTRATION 37
SECTION
7 Phase I Conclusions
The last steam train in scheduled service in the US departed on October 11 196225 One year earlier Robert Noyce received the first patent for an integrated circuit26 But for that brief one-year overlap the most powerful motive power technology was never harnessed by the black box controls that grew out of Noycersquos invention so the diesel-powered IC engine championed by Henry Ford won out
Now nearly 50 years later the modern IC engine cannot operate efficiently without the benefit of black box electronicsmdashbut that technology still presents intractable challenges of supply safety and environmental impact The air-steam hybrid technology may offer an alternative and a glimpse of that potential is presented here and viewable in Run 5 on the Brash Engines website at http wwwbrashenginescom
While demonstration in a test vehicle provides a strong visual message that BRASH technology works the commercial success of this technology will depend upon reliable repeatable measurement of power and economy For that data the Phase 2 effort will require a return to laboratory bench testing and effective demonstration of recovery of the water and air fractions
The results of this Phase I project collectively demonstrate the technical feasibility and commercial potential of the BRASH air-steam hybrid engine technology The initial DOT SBIR funding has been highly effective in facilitating this important proof of concept and laying the groundwork for further technology refinement and application
As described earlier the next steps are clear and appear to combine achievable and rapid major advances with low developmental risk SBIR Phase 2 support is needed for those advances due to the still-early stage of development that restricts access to private capital
The immense potential value of this technology has been enhanced and verified in Phase 1 there is now a clear and low-risk path ahead to larger-scale testing further component and controls refinement specific applications prototyping and pre-commercial deployments
25William Rosen The Most Powerful Idea in the World Random House 2010 p 311 26US Patent 2981877
FEDERAL TRANSIT ADMINISTRATION 38
APPENDIX
A Heat Transfer Efficiency Modeling Runs 3 and 5 50 and 90
Much of the analysis for Runs 3 and 5 is based on an assumed efficiency of 90 for heat transfer from the combustion of propane to heating of the water air mix in the coil As a test for the reasonableness of that assumption the same data have been modeled at a much lower 50 factor below
112210 - 3 Low Speed Run Air Pressure 60 psi Water head pressure 60 psi
Water2 00440 5060 4276 101 43 (Wt 000Kg)
Propane 152 1493 237 50 27 11880 1004 (Wt 000Kg)
Time 133000 134150 01150 na na na na (hrmnsc)
1 Energy value based upon absorbed heat (italics) from STP to 1000degK (0446 BTUg for Air 115 BTUg water) Underlined value is released heat at generally accepted 44 BTUg
Air (Wt 000Kg)
Component(BTU) Start Wt End Wt Net Wt Energy1
(BTU) Power
(BTUmin) Power (HP) Efficiency3
661 460 201 938 1294 30 36
Water2
(Wt 000Kg)
Propane(Wt 000Kg)
Time (hrmnsc)
1562
123000
1556
123715
00125
006
00715
380
2640
na
523
364
na
12
86
14
50
na na
Air (Wt 000Kg)
Component(BTU) Start Wt
5 Variable High Speed Run Air Pressure 60 psi Water head pressure 70 psi
End Wt Net Wt Energy1
(BTU) Power
(BTUmin) Power (HP) Efficiency3
654 472 182 849 718 17 7
2 Determined by difference from Propane and Air Energy assumed value 90 3 Arbitrary estimated efficiency of heat transfer not effective work
The two known quantities in each run is the weight of the air moving through the system and the weight of the propane heating that air The variable is the quantity of water heated to steam temperatures and above In Run 3 at 90 efficiency that mass of water calculates to 125 grams at 50 it drops to 33 grams In Run 5 at 90 efficiency that mass of water calculates to 86 grams at 50 it drops to 44 grams
FEDERAL TRANSIT ADMINISTRATION 39
APPENDIX A HEAT TRANSFER EFFICIENCY MODELING RUNS 3 AND 5 50 AND 90
As the comparison tables below show the uncertainty in the efficiency of heat transfer is manifest only in the mass of water heated to steam to do useful work
Data 90 Efficiency
Air
Component Run 3 BHP
Run 5 BHP
Net ChngBHP
-45
Run 3 Mass
Transfer (kg)
Run 5 Mass
Transfer (kg)
Net ChangeMass
Transfer (kg)
30 17
197
237
2010 182 -9
Water
Propane
Duration (mn)
47
86
725
422
0060
0013
725
0270
0086
1180
588
350
163 1180
276
163
Data 50 Efficiency
Air
Component Run 3 BHP
Run 5 BHP
Net ChngBHP
-45
Run 3 Mass
Transfer (kg)
Run 5 Mass
Transfer (kg)
Net ChangeMass
Transfer (kg)
30 17
101
237
2010 182 -9
Water
Propane
Duration (mn)
12
86
725
817
0060
0003
725
0270
0044
1180
1233
350
163 1180
276
163
Regardless of the specific efficiency Run3 reflects an air-rich propellant mix while Run 5 was clearly the more powerful and steam-rich propellant If 50 efficiency is a more realistic figure than 90 the only consequence is more water passing through the heater expander and recovery tank The only consequence for overall system efficiency is the slight but added work required to move the additional water by pump to the top of the water column
FEDERAL TRANSIT ADMINISTRATION 40
APPENDIX Acronyms B
BHP Boiler Horsepower
BRASH Binary Recovery Air-Steam Hybrid
BTU British Thermal Unit
CC Cubic centimeter
CFM Cubit feet per minute
CHP Combined heat and power
CNG Compressed natural gas
CO2 Carbon dioxide
CU Cubic
DARPA Defense Advanced Research Projects Agency
DGE Diesel gallon equivalent
DOT Department of Transportation
EC External combustion
EIA Energy Information Administration
EPA Environmental Protection Agency
FTA Federal Transit Administration
GGE Gasoline gallon equivalent
HP Horsepower
IC Internal combustion
K Kelvin
Kcal Kilocalorie
MPG Miles per gallon
MPH Miles per hour
OEM Original equipment manufacturer
PSI Pounds per square inch
RPM Revolutions per minute
SBIR Small Business Innovation Research
STP Standard temperature and pressure
FEDERAL TRANSIT ADMINISTRATION 41
FEDERAL TRANSIT ADMINISTRATION 128
US Department of TransportationFederal Transit AdministrationEast Building1200 New Jersey Avenue SEWashington DC 20590httpwwwftadotgovresearch
US Department of Transportation Federal Transit Administration East Building 1200 New Jersey Avenue SE Washington DC 20590 httpwwwftadotgovresearch
FEDERAL TRANSIT ADMINISTRATION 42
- Button1
- Button2
- Button3
- Button4
- Button5
- Button6
- Button7
- Button8
- Button9
- Button10
- Button11
- Button12
- Button13
- Button14
- Button15
- Button16
- Button17
- Button18
- Button19
- Button20
- Button21
- Button22
- Button23
- Button24
- Button25
- Button26
- Button27
- Button28
- Button29
- Button30
- Button31
- Button32
- Button33
- Button34
- Button35
- Button36
- Button37
- Button38
- Button39
- Button40
- Button41
- Button42
- Button43
- Button44
- Button45
- Button46
- Button47
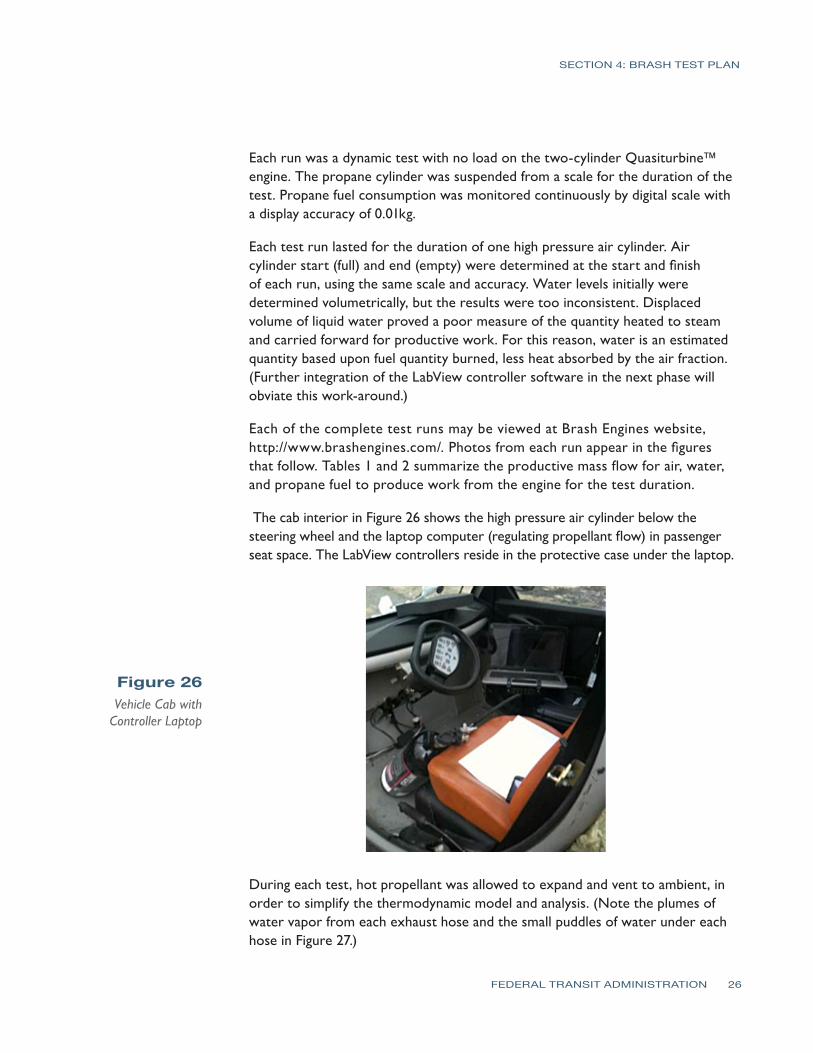
SECTION 4 BRASH TEST PLAN
Each run was a dynamic test with no load on the two-cylinder Quasiturbinetrade engine The propane cylinder was suspended from a scale for the duration of the test Propane fuel consumption was monitored continuously by digital scale with a display accuracy of 001kg
Each test run lasted for the duration of one high pressure air cylinder Air cylinder start (full) and end (empty) were determined at the start and finish of each run using the same scale and accuracy Water levels initially were determined volumetrically but the results were too inconsistent Displaced volume of liquid water proved a poor measure of the quantity heated to steam and carried forward for productive work For this reason water is an estimated quantity based upon fuel quantity burned less heat absorbed by the air fraction (Further integration of the LabView controller software in the next phase will obviate this work-around)
Each of the complete test runs may be viewed at Brash Engines website httpwwwbrashenginescom Photos from each run appear in the figures that follow Tables 1 and 2 summarize the productive mass flow for air water and propane fuel to produce work from the engine for the test duration
The cab interior in Figure 26 shows the high pressure air cylinder below the steering wheel and the laptop computer (regulating propellant flow) in passenger seat space The LabView controllers reside in the protective case under the laptop
Figure 26 Vehicle Cab with Controller Laptop
During each test hot propellant was allowed to expand and vent to ambient in order to simplify the thermodynamic model and analysis (Note the plumes of water vapor from each exhaust hose and the small puddles of water under each hose in Figure 27)
FEDERAL TRANSIT ADMINISTRATION 26
SECTION 4 BRASH TEST PLAN
Figure 27 Exhaust Plumes from Expander
Development plans include recovering the expanded propellant separating into water and air phases and then recompressing the air fraction for re-use This will both improve efficiency and eliminate the visible vapor plume
Test Assumptions Another estimation used in this study is the efficiency of heat transfer for the propellant through the 20-ft coil of stainless steel inside the insulated heater Figure 28 shows an early ldquoair-onlyrdquo test run with the current heater The hose failure and melting of the steel wire mesh inside (note formed ball in the mesh) indicates 1300degK temperatures exiting the hot section
Figure 28 Hose Failure Due
to Overheating
FEDERAL TRANSIT ADMINISTRATION 27
SECTION 4 BRASH TEST PLAN
Effective heat transfer (as Figure 28 shows) does not equal efficient heat transfer but the ability to deliver 1300degK air from a well-insulated burner suggests a highly efficient transfer of heat The analysis of results assumes a value of 90 efficiency (See Appendix A for a discussion of heat transfer efficiency)
3 Low Speed Test On November 22 2010 Run 3 tested the lower operating limits of the test setup Low limit in this context meant sufficient pressure to maintain expander rotation but low steam and fuel burn The test commenced with a full air cylinder weighing 661 Kg At the end of the test the empty cylinder weighed 460 Kg Over the 7 minutes and 15 seconds of testing 006 Kg of propane was consumed
The mass of air and fuel was determined from before after run test weights As stated earlier determining the quantity of steam produced from the pressurized water tank was problematic because of the quantity of stored water the resistance to water flow under dynamic pressures and the potential for some fraction of the water (in liquid state) to be entrained in the propellant mix
To solve for this unknown the energy required to raise the known quantity of air from ambient to 1000degK (33kcalmol or 0467 BTUg) was subtracted from the energy content of the propane consumed (44 BTUg) and then the efficiency of the heat transfer process was de-rated by 10 percent to yield a net quantity of 1438 BTUs to elevate ambient temperature water to 1000degK steam The result is an estimated 125 grams of water consumed in the 7-minute test
Table 1 summarizes these data and shows a high reliance on the air fraction for the work performed by the 2 HP engine The air cylinder used in this test has a measured free volume of 45 cubic feet (1274 liters at STP) which means sustained flow rates of 62 cubic feet per minute (cfm) or 175 liters per minute In contrast the 125 grams of water passed through as steam produced an estimated equivalent gas volume of 155 liters at STP Note the modest levels of water vapor in Figure 29 Why the greater air fraction relative to water flow in this test
Air (Wt 000Kg) 661 460 201 938 1294 30 36
Water2
(Wt 000Kg)
Propane(Wt 000Kg)
Time (hrmnsc)
1562
123000
1556
123715
00125
006
00715
1438
2640
na
1983
364
na
47
86
54
90
1 Energy value based upon absorbed heat (italicized) from STP to 1000degK (0446 BTUg for Air 115 BTUg water) 2 Determined by difference from propane and air energy assumed value 90 3Arbitrary estimated efficiency of heat transfer not effective work
11222010 - 3 Low Speed Run Air Pressure 60 psi Water Head Pressure 60 psi
Component(BTU) Start End Net Energy1
(BTU) Power
(BTUmin) Power (HP) Efficiency3
Table 1 Analysis of Mass
Flow Data at Low Speed
FEDERAL TRANSIT ADMINISTRATION 28
SECTION 4 BRASH TEST PLAN
Figure 29 Low-Speed Test Results in Little
Water Vapor
In this baseline experiment the single cylinder provides 60 psi air flow and 60 psi static ldquoheadrdquo pressure on the water column The air flow from the cylinder is biased toward the generally less restrictive flow path for air The water column under the same pressure presents a higher viscosity medium passing through a greater number of valves and restrictions At the point of injection the air fraction flows more freely into the hot section In order to bias the mix toward greater water fraction (and greater power) the head pressure on the water column must be increased over the 60 psi air line pressure
Run 4 (not documented here) evaluated head pressures from 110 psi to 70 psi and determined that modest differential pressures retarded the flow from the air fraction and boosted flow of the water fraction Still higher differential pressures effectively stopped air flow altogether reverting the engine operation to ldquosteam onlyrdquo For Run 5 an additional cylinder was used to apply a 70 psi static head pressure on the water column a 10 psi differential over the 60 psi air line pressure
5 Variable High Speed Test On November 26 2010 Run 5 tested the higher differential water pressure as a means to increase the effective water fraction in the propellant mix The test commenced with a full air cylinder weighing 654 Kg At the end of the test the empty cylinder weighed 472 Kg Run 5 was interrupted after 243 minutes to refill the water tank and then testing resumed for an additional 907 minutes Over the whole test 027 Kg of propane was consumed
Using the same analytical basis as Test 3 Test 5 data indicate a substantial increase in work capacity (as measured by fuel consumed and steam generated) over the 3 baseline
FEDERAL TRANSIT ADMINISTRATION 29
112610 - 5 Variable High Speed Run Air Pressure 60 psi Water Head Pressure 70 psi
Air (Wt 000Kg)
Component(BTU) Start End Net Energy1
(BTU) Power
(BTUmin) Power (HP) Efficiency3
654 472 182 849 718 17 7
SECTION 4 BRASH TEST PLAN
Table 3 Comparison of Mass Flows
Water 588 Runs 3 and 5
163 Duration (mn) 725 1180 725 1180 163
Air
Component Run 3 BHP
Run 5 BHP
Net ChngBHP
Run 5 Mass
Transfer (kg)
Net ChangeMass
Transfer (kg)
30 17
197
237
-45 2010 182 -9
Run 3 Mass
Transfer (kg)
276 350
47
86
422
0060
0013
0270
0086
Propane
This difference in steam fraction and power is more clearly seen in Figure 30 (and on the source video at the Brash Engines website)
Figure 30 Three Images from Run 5
Table 2 Test 5 Results with Increased
Water and Fuel Water2
(Wt 000Kg) 0860 9890 8358 197 83
Propane(Wt 000Kg) 1520 1493 27 11880 1004 237 90
Time (hrmnsc) 133000 134150 01150 na na na na
1 Energy value based upon absorbed heat (italics) from STP to 1000degK (0446 BTUg for Air 115 BTUg water) Underlined value is released heat at generally accepted 44 BTUg 2 Determined by difference from propane and air Energy assumed value 90 3 Arbitrary estimated efficiency of heat transfer not effective work
The increase in pressure on the water column by 10 psi reduced air flow by 9 percent but increased the steam fraction considerably and thereby increased the effective boiler horsepower nearly three-fold to 237 bhp (assuming 90 heat transfer) These data are summarized in Table 3
FEDERAL TRANSIT ADMINISTRATION 30
SECTION 4 BRASH TEST PLAN
As with Run 3 start up from Time Zero was immediate burner on air flow begins and water flow under pressure commences immediately Another impressive feature of the mix air-steam propellant system is the ability to start stop and rapidly accelerate as shown in the full Run 5 video Run 5 serves as validation that this patented technology has unique performance benefits over air steam or internal combustion alone
Lessons Learned A comparison of the two test runs verifies some key points
1 The same power plant can produce variable power and fuel economy based upon power demand and airsteam mix
2 Although imprecise at this point in testing fuel consumption appears directly proportional to engine speed The engineexpander will spool up spool down stop and restart in a manner consistent with fuel and propellant flow The Run 5 video on the Brash Engines website verifies this conclusion
3 The use of a defined static air pressure ldquoheadrdquo over the water column at a pressure higher than the defined air line dynamic pressure provides a safe and predictable bias toward flow from the water fraction
4 Although the current test configuration offers sufficient performance for this initial demonstration phase the following observations are in order
a The heater path is too long creating latent response issues
b The airwater injector is not optimized for proper mix or flow capacity
c The incomplete integration of LabVIEW compromises the quality of data
d The absence of a measured variable load on the expander compromises any analysis of power and fuel economy
5 The design migration to a vehicle installation was premature The project should move back to a lab bench study to refine the regulation of components complete the recovery and recompression portions of the system and use electromechanical loads to estimate power and useful work for specific quantities of fuel water and air
6 The Quasiturbinetrade engine technology is promising but too immature for larger-scale modeling Later phases of the project should rely on more conventional multi-cylinder piston-type expander
Estimated Fuel Economy Mass transit authorities have relied on large diesel engines such as the Detroit Diesel Series 50 and Series 60 engines for more than 30 years Reports on fuel economy vary from a high of 60 miles per gallon (Diesel) for longer-range
FEDERAL TRANSIT ADMINISTRATION 31
SECTION 4 BRASH TEST PLAN
commuter services in California23 to a low of 228 miles per gallon (Diesel) for city buses with frequent stops in New York City24 In both cited studies the migration to compressed natural gas (CNG) has resulted in lower fuel economies on a Diesel Gallon Equivalent (DGE) basis
Table 4 summarizes this study (columns 2 and 3) and the next proposed phase (columns 4 and 5) the performance of the current fleet of mass transit buses (columns 6 and 7) and the likely outcome if the Besler engine (described earlier) were employed with the air-steam hybrid technology (columns 8 and 9)
Table 4 Comparison of
Fuel Economies
Air
1
Configuration
Engine
HP
Torque
Fuel
gmin
BTUhr
GGEhr
mpg 60mph
GGE100 mi
$ per GGE
$100 mi
Current
Example
2
3
3
5
4
Bench
5
S-10
6
SB Bus
7
NYCT
8
50 eff
9
30 eff
86
Quasi
2
Prop
82
216
02
3160
03
30
09
Current
237
Quasi
2
Prop
23
607
05
1126
09
30
27
UC 1
40
6 cyl
20
Prop
40
1056
09
648
15
30
46
UC 2
80
6 cyl
40
Mix
80
2112
19
324
31
30
93
MCI102
DD S60
350
1450
Diesel
540
11400
100
60
167
35
583
Diesel
23
439
35
1535
300
Besler
150
1200
Mix
300
792
695
864
1158
16
1853
500
Besler
150
1200
Mix
500
1320
1158
518
1930
16
3088
The Besler engine is shown in two columns The left column reflects the higher efficiency anticipated with the air-steam hybrid mix described earlier as at or near 50 percent The right column reflects the historical efficiency realized with steam engine technology The italicized numbers near the bottom of the column show that even at historical efficiencies the Besler engine would offer equal or better Gasoline Gallon Equivalent (GGE)100 mile ratings of the current diesel technology but migrating toward less refined and (therefore) less expensive fuels would significantly reduce the operating cost ($mile)
23Demonstration of Caterpillar C-10 Dual-Fuel Engines in MCI 102DL3 Commuter Buses National Renewable Energy Laboratory httpwwwnrelgovdocsfy00osti26758pdf p 7 24R Barnitt ldquoNew York City Transit (NYCT) Hybrid (125 Order) and CNG Transit Buses Final Evaluation Resultsrdquo November 2006 National Renewable Energy Laboratory K Chandler Battelle Technical Report NRELTP-540-40125 November 2006 httpwwwnrelgovvehiclesandfuelsfleettestpdfs40125pdf pvii
FEDERAL TRANSIT ADMINISTRATION 32
SECTION 4 BRASH TEST PLAN
There are of course two orders of magnitude difference between the results of Runs 3 and 5 and the daily demands of city and commuter buses but the mere existence of the Besler Twin and the Brooks V-8 400 HP engine suggests an opportunity for fuel economy and fuel variety
Proposed further support for the next phase of development will advance the air-steam hybrid technology by an important order of magnitude This would provide the data confidence to scale to larger vehicle operation and garner the interest of one or more engine or vehicle OEMs
Figure 31 MTANew York City
Transit Orion VII Next Generation
Hybrid Transit Bus
Next Development Phase The next phase of development will incorporate a modern six-cylinder steam engine design with a displacement of 53 cubic inches and capable of sustained 15-25 HP operation The expander will be supplied by Steam Engine Power Inc (httpwwwsteamenginepowercom) This expander will drive an alternator generator to measure effective work output in watts as well as provide sufficient power to satisfy the system parasitic loads of battery recharge exhaust air recompression and all other pump and valve operations
Figure 32 (l to r) Six-Cylinder Expander Power Generation Load
Small 24 VDC Compressor
FEDERAL TRANSIT ADMINISTRATION 33
SECTION 4 BRASH TEST PLAN
Static pressure for the water column will still be supplied via compressed air cylinder but the dynamic air flow will be supplied by an oil-less air compressor of the size and type shown This 24 VDC compressor will recompress the recovered air exiting the expander to 40ndash60 psi pressure and support flows of 3ndash4 cubic feet per minute (cfm) These three components are off-the-shelf enhancements to the system but custom engineering of a new more powerful and more responsive heater completion of the electronic integration and design and fabrication of the recoveryrecompression components are necessary tasks that must be included to make the next generation assembly work to its potential This work will be accomplished largely by Mechanical and Electrical Engineering students at the University of Connecticut under the supervision of faculty and Brash Engines personnel
When this build is complete all operations will be under LabVIEW control All expander operations will be measured for power and work Once the bench version is in control a modified version will be installed in a small pickup truck (eg Chevrolet S-10) for further verification of system performance and robustness
During this phase a new and promising technology will be investigated a new and faster class of solenoid valves from National Instruments These solenoid valves with an unprecedented 3 msec response time have the potential of allowing air-steam retrofit in existing engine blocks The solenoid valves could replace the spark plugs in conventional IC engines and provide the equivalent timed injection of hot propellant mix as the timed firing of a spark plug in the presence of a fuel air mix
If possible these fast solenoids and the black box programming to control them could allow very easy portability to larger vehicles and easier retrofit Potentially a V-6 engine could operate 4 cylinders for expansion and the remaining two cylinders could be used as direct drive compressors with different but equivalent solenoid valves controlling the compression process
FEDERAL TRANSIT ADMINISTRATION 34
SECTION Development Plan 5 and Next Steps
This current effort is a key first-proof of concept for this air-steam hybrid technology but our goals extend well beyond this two-seat 2 HP demonstrator The lessons learned in electronic integration will allow rapid migration to larger platforms using the same basic controls but scaling the expander heater and other mass-flow components to vehicle-appropriate size That project identified as ldquo20 HP Vehiclerdquo and other near-term derivative projects are listed in Table 5
BRASH Project
ProposedFunding Source
Funds Reqd $K Project Description
SUV-size proof-of-concept for reliable 20 HP Vehicle DOTUSPS 300 highway performance maildelivery
vehicle size
Proof-of-concept mass transit busshy200 HP Vehicle DOTDOD 600 retrofit scaled to city bus capacity and
suitable for replacement of over-the-road diesel engines
Table 5 Project Funding
Stationary Power Unit Micro-CHP Equivalent
DARPA 300 Proof-of-concept mass transit bus-retrofit scaled to city bus capacity and suitable for replacement of over-the-road diesel engines
Summary Alternative Processed Solid Fuel DOE EPA DOA 600
Processed mix of hydrolyzed wood pulp processed solid waste and other combustible solids in an extrudable mass with alcohol solutevehiclemdashdemonstrate utility in vehicles as a high energy content clean burning fuel for EC engines
Demonstrate effective pyrolysis of
Binary Solid Gas Fuel
EPA Waste Management BFI
400 processed solid fuels in a binary fuel burner conventional fuel (gasoline natural gas) provides primary heat source for pyrolysis temperatures
Proof of Concept OEM Power Plant
Vehicle OEM (eg Ford GM Caterpillar) 1200
Development of direct replacement BRASH engine alternative to existing OEM IC engine
Black Box Integration of Controller Software
Vehicle OEM (eg Ford GM Caterpillar)
1600 Development of commercial BRASH system alternative to existing OEM IC engine
FEDERAL TRANSIT ADMINISTRATION 35
SECTION 5 DEVELOPMENT PLAN AND NEXT STEPS
The issuance of US Patent 7743872 five months ago has two important consequences for this project First it serves to validate the underlying technology the combination of air and steam in an EC engine is better than steam or air alone Second it provides a basis for full and open discussions with government agencies and large commercial interests in the transportation and power sectors
Our efforts at promotion have been delayed pending successful demonstration of the Smarttrade car vehicle to allow the first detailed real-world performance data to be distributed
Coupling that performance data with the option of migration away from refined petroleum should spark significant interest If we can move to a high lignin-processed wood pulp that costs $045 per gasoline gallon equivalent (an arbitrary value for example only) and consumes more CO2 while growing than is consumed in processing as a fuel and produced from combustion then we succeed as a project and as a global game-changing technology for many uses Improvements in fuel economy are important but of greater importance is the migration to low-process biomass fuels
FEDERAL TRANSIT ADMINISTRATION 36
SECTION Potential Applications and Societal Value 6 The whole premise behind the BRASH air steam hybrid is that external combustion offers a more benign and environmentally-appropriate way to power large vehicles and other portable equipment than refined petroleum-powered internal combustion
bullCombustion heat can be derived from any fuel source including processed solids from fast-growing renewables such as poplar trees waste corn stalks or switch grass
bullThat combustion heat is applied at a rate consistent with the work to be done and not to support idling and other unproductive fuel use
Using a mix of air and steam as working fluids in the engine allows
bullImmediate startup from an ldquoair-onlyrdquo start
bull Managed system pressure through use of a defined head air pressure
bullManaged fuel burn as the air-steam fraction is adjusted to match wheel load
bullAdjusted wheel load reduces fuel burn
Integration of modern control circuitry with external combustion also brings a level of performance operational simplicity and safety heretofore unavailable
FEDERAL TRANSIT ADMINISTRATION 37
SECTION
7 Phase I Conclusions
The last steam train in scheduled service in the US departed on October 11 196225 One year earlier Robert Noyce received the first patent for an integrated circuit26 But for that brief one-year overlap the most powerful motive power technology was never harnessed by the black box controls that grew out of Noycersquos invention so the diesel-powered IC engine championed by Henry Ford won out
Now nearly 50 years later the modern IC engine cannot operate efficiently without the benefit of black box electronicsmdashbut that technology still presents intractable challenges of supply safety and environmental impact The air-steam hybrid technology may offer an alternative and a glimpse of that potential is presented here and viewable in Run 5 on the Brash Engines website at http wwwbrashenginescom
While demonstration in a test vehicle provides a strong visual message that BRASH technology works the commercial success of this technology will depend upon reliable repeatable measurement of power and economy For that data the Phase 2 effort will require a return to laboratory bench testing and effective demonstration of recovery of the water and air fractions
The results of this Phase I project collectively demonstrate the technical feasibility and commercial potential of the BRASH air-steam hybrid engine technology The initial DOT SBIR funding has been highly effective in facilitating this important proof of concept and laying the groundwork for further technology refinement and application
As described earlier the next steps are clear and appear to combine achievable and rapid major advances with low developmental risk SBIR Phase 2 support is needed for those advances due to the still-early stage of development that restricts access to private capital
The immense potential value of this technology has been enhanced and verified in Phase 1 there is now a clear and low-risk path ahead to larger-scale testing further component and controls refinement specific applications prototyping and pre-commercial deployments
25William Rosen The Most Powerful Idea in the World Random House 2010 p 311 26US Patent 2981877
FEDERAL TRANSIT ADMINISTRATION 38
APPENDIX
A Heat Transfer Efficiency Modeling Runs 3 and 5 50 and 90
Much of the analysis for Runs 3 and 5 is based on an assumed efficiency of 90 for heat transfer from the combustion of propane to heating of the water air mix in the coil As a test for the reasonableness of that assumption the same data have been modeled at a much lower 50 factor below
112210 - 3 Low Speed Run Air Pressure 60 psi Water head pressure 60 psi
Water2 00440 5060 4276 101 43 (Wt 000Kg)
Propane 152 1493 237 50 27 11880 1004 (Wt 000Kg)
Time 133000 134150 01150 na na na na (hrmnsc)
1 Energy value based upon absorbed heat (italics) from STP to 1000degK (0446 BTUg for Air 115 BTUg water) Underlined value is released heat at generally accepted 44 BTUg
Air (Wt 000Kg)
Component(BTU) Start Wt End Wt Net Wt Energy1
(BTU) Power
(BTUmin) Power (HP) Efficiency3
661 460 201 938 1294 30 36
Water2
(Wt 000Kg)
Propane(Wt 000Kg)
Time (hrmnsc)
1562
123000
1556
123715
00125
006
00715
380
2640
na
523
364
na
12
86
14
50
na na
Air (Wt 000Kg)
Component(BTU) Start Wt
5 Variable High Speed Run Air Pressure 60 psi Water head pressure 70 psi
End Wt Net Wt Energy1
(BTU) Power
(BTUmin) Power (HP) Efficiency3
654 472 182 849 718 17 7
2 Determined by difference from Propane and Air Energy assumed value 90 3 Arbitrary estimated efficiency of heat transfer not effective work
The two known quantities in each run is the weight of the air moving through the system and the weight of the propane heating that air The variable is the quantity of water heated to steam temperatures and above In Run 3 at 90 efficiency that mass of water calculates to 125 grams at 50 it drops to 33 grams In Run 5 at 90 efficiency that mass of water calculates to 86 grams at 50 it drops to 44 grams
FEDERAL TRANSIT ADMINISTRATION 39
APPENDIX A HEAT TRANSFER EFFICIENCY MODELING RUNS 3 AND 5 50 AND 90
As the comparison tables below show the uncertainty in the efficiency of heat transfer is manifest only in the mass of water heated to steam to do useful work
Data 90 Efficiency
Air
Component Run 3 BHP
Run 5 BHP
Net ChngBHP
-45
Run 3 Mass
Transfer (kg)
Run 5 Mass
Transfer (kg)
Net ChangeMass
Transfer (kg)
30 17
197
237
2010 182 -9
Water
Propane
Duration (mn)
47
86
725
422
0060
0013
725
0270
0086
1180
588
350
163 1180
276
163
Data 50 Efficiency
Air
Component Run 3 BHP
Run 5 BHP
Net ChngBHP
-45
Run 3 Mass
Transfer (kg)
Run 5 Mass
Transfer (kg)
Net ChangeMass
Transfer (kg)
30 17
101
237
2010 182 -9
Water
Propane
Duration (mn)
12
86
725
817
0060
0003
725
0270
0044
1180
1233
350
163 1180
276
163
Regardless of the specific efficiency Run3 reflects an air-rich propellant mix while Run 5 was clearly the more powerful and steam-rich propellant If 50 efficiency is a more realistic figure than 90 the only consequence is more water passing through the heater expander and recovery tank The only consequence for overall system efficiency is the slight but added work required to move the additional water by pump to the top of the water column
FEDERAL TRANSIT ADMINISTRATION 40
APPENDIX Acronyms B
BHP Boiler Horsepower
BRASH Binary Recovery Air-Steam Hybrid
BTU British Thermal Unit
CC Cubic centimeter
CFM Cubit feet per minute
CHP Combined heat and power
CNG Compressed natural gas
CO2 Carbon dioxide
CU Cubic
DARPA Defense Advanced Research Projects Agency
DGE Diesel gallon equivalent
DOT Department of Transportation
EC External combustion
EIA Energy Information Administration
EPA Environmental Protection Agency
FTA Federal Transit Administration
GGE Gasoline gallon equivalent
HP Horsepower
IC Internal combustion
K Kelvin
Kcal Kilocalorie
MPG Miles per gallon
MPH Miles per hour
OEM Original equipment manufacturer
PSI Pounds per square inch
RPM Revolutions per minute
SBIR Small Business Innovation Research
STP Standard temperature and pressure
FEDERAL TRANSIT ADMINISTRATION 41
FEDERAL TRANSIT ADMINISTRATION 128
US Department of TransportationFederal Transit AdministrationEast Building1200 New Jersey Avenue SEWashington DC 20590httpwwwftadotgovresearch
US Department of Transportation Federal Transit Administration East Building 1200 New Jersey Avenue SE Washington DC 20590 httpwwwftadotgovresearch
FEDERAL TRANSIT ADMINISTRATION 42
- Button1
- Button2
- Button3
- Button4
- Button5
- Button6
- Button7
- Button8
- Button9
- Button10
- Button11
- Button12
- Button13
- Button14
- Button15
- Button16
- Button17
- Button18
- Button19
- Button20
- Button21
- Button22
- Button23
- Button24
- Button25
- Button26
- Button27
- Button28
- Button29
- Button30
- Button31
- Button32
- Button33
- Button34
- Button35
- Button36
- Button37
- Button38
- Button39
- Button40
- Button41
- Button42
- Button43
- Button44
- Button45
- Button46
- Button47
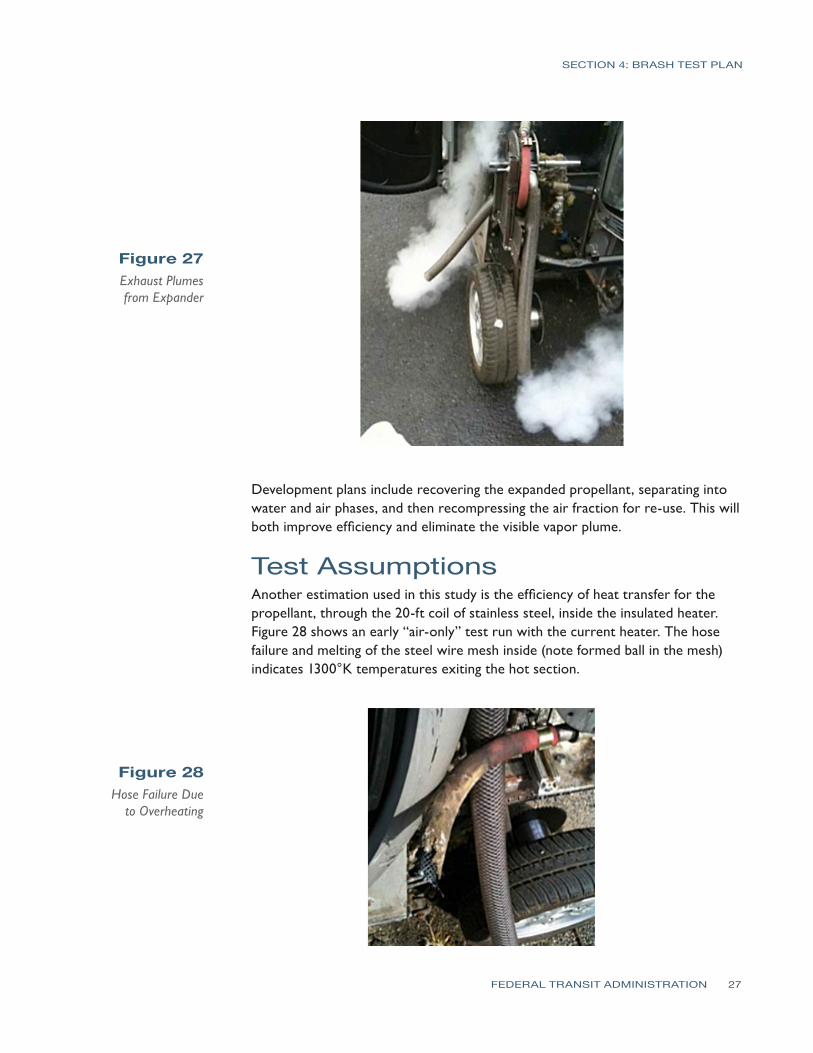
SECTION 4 BRASH TEST PLAN
Figure 27 Exhaust Plumes from Expander
Development plans include recovering the expanded propellant separating into water and air phases and then recompressing the air fraction for re-use This will both improve efficiency and eliminate the visible vapor plume
Test Assumptions Another estimation used in this study is the efficiency of heat transfer for the propellant through the 20-ft coil of stainless steel inside the insulated heater Figure 28 shows an early ldquoair-onlyrdquo test run with the current heater The hose failure and melting of the steel wire mesh inside (note formed ball in the mesh) indicates 1300degK temperatures exiting the hot section
Figure 28 Hose Failure Due
to Overheating
FEDERAL TRANSIT ADMINISTRATION 27
SECTION 4 BRASH TEST PLAN
Effective heat transfer (as Figure 28 shows) does not equal efficient heat transfer but the ability to deliver 1300degK air from a well-insulated burner suggests a highly efficient transfer of heat The analysis of results assumes a value of 90 efficiency (See Appendix A for a discussion of heat transfer efficiency)
3 Low Speed Test On November 22 2010 Run 3 tested the lower operating limits of the test setup Low limit in this context meant sufficient pressure to maintain expander rotation but low steam and fuel burn The test commenced with a full air cylinder weighing 661 Kg At the end of the test the empty cylinder weighed 460 Kg Over the 7 minutes and 15 seconds of testing 006 Kg of propane was consumed
The mass of air and fuel was determined from before after run test weights As stated earlier determining the quantity of steam produced from the pressurized water tank was problematic because of the quantity of stored water the resistance to water flow under dynamic pressures and the potential for some fraction of the water (in liquid state) to be entrained in the propellant mix
To solve for this unknown the energy required to raise the known quantity of air from ambient to 1000degK (33kcalmol or 0467 BTUg) was subtracted from the energy content of the propane consumed (44 BTUg) and then the efficiency of the heat transfer process was de-rated by 10 percent to yield a net quantity of 1438 BTUs to elevate ambient temperature water to 1000degK steam The result is an estimated 125 grams of water consumed in the 7-minute test
Table 1 summarizes these data and shows a high reliance on the air fraction for the work performed by the 2 HP engine The air cylinder used in this test has a measured free volume of 45 cubic feet (1274 liters at STP) which means sustained flow rates of 62 cubic feet per minute (cfm) or 175 liters per minute In contrast the 125 grams of water passed through as steam produced an estimated equivalent gas volume of 155 liters at STP Note the modest levels of water vapor in Figure 29 Why the greater air fraction relative to water flow in this test
Air (Wt 000Kg) 661 460 201 938 1294 30 36
Water2
(Wt 000Kg)
Propane(Wt 000Kg)
Time (hrmnsc)
1562
123000
1556
123715
00125
006
00715
1438
2640
na
1983
364
na
47
86
54
90
1 Energy value based upon absorbed heat (italicized) from STP to 1000degK (0446 BTUg for Air 115 BTUg water) 2 Determined by difference from propane and air energy assumed value 90 3Arbitrary estimated efficiency of heat transfer not effective work
11222010 - 3 Low Speed Run Air Pressure 60 psi Water Head Pressure 60 psi
Component(BTU) Start End Net Energy1
(BTU) Power
(BTUmin) Power (HP) Efficiency3
Table 1 Analysis of Mass
Flow Data at Low Speed
FEDERAL TRANSIT ADMINISTRATION 28
SECTION 4 BRASH TEST PLAN
Figure 29 Low-Speed Test Results in Little
Water Vapor
In this baseline experiment the single cylinder provides 60 psi air flow and 60 psi static ldquoheadrdquo pressure on the water column The air flow from the cylinder is biased toward the generally less restrictive flow path for air The water column under the same pressure presents a higher viscosity medium passing through a greater number of valves and restrictions At the point of injection the air fraction flows more freely into the hot section In order to bias the mix toward greater water fraction (and greater power) the head pressure on the water column must be increased over the 60 psi air line pressure
Run 4 (not documented here) evaluated head pressures from 110 psi to 70 psi and determined that modest differential pressures retarded the flow from the air fraction and boosted flow of the water fraction Still higher differential pressures effectively stopped air flow altogether reverting the engine operation to ldquosteam onlyrdquo For Run 5 an additional cylinder was used to apply a 70 psi static head pressure on the water column a 10 psi differential over the 60 psi air line pressure
5 Variable High Speed Test On November 26 2010 Run 5 tested the higher differential water pressure as a means to increase the effective water fraction in the propellant mix The test commenced with a full air cylinder weighing 654 Kg At the end of the test the empty cylinder weighed 472 Kg Run 5 was interrupted after 243 minutes to refill the water tank and then testing resumed for an additional 907 minutes Over the whole test 027 Kg of propane was consumed
Using the same analytical basis as Test 3 Test 5 data indicate a substantial increase in work capacity (as measured by fuel consumed and steam generated) over the 3 baseline
FEDERAL TRANSIT ADMINISTRATION 29
112610 - 5 Variable High Speed Run Air Pressure 60 psi Water Head Pressure 70 psi
Air (Wt 000Kg)
Component(BTU) Start End Net Energy1
(BTU) Power
(BTUmin) Power (HP) Efficiency3
654 472 182 849 718 17 7
SECTION 4 BRASH TEST PLAN
Table 3 Comparison of Mass Flows
Water 588 Runs 3 and 5
163 Duration (mn) 725 1180 725 1180 163
Air
Component Run 3 BHP
Run 5 BHP
Net ChngBHP
Run 5 Mass
Transfer (kg)
Net ChangeMass
Transfer (kg)
30 17
197
237
-45 2010 182 -9
Run 3 Mass
Transfer (kg)
276 350
47
86
422
0060
0013
0270
0086
Propane
This difference in steam fraction and power is more clearly seen in Figure 30 (and on the source video at the Brash Engines website)
Figure 30 Three Images from Run 5
Table 2 Test 5 Results with Increased
Water and Fuel Water2
(Wt 000Kg) 0860 9890 8358 197 83
Propane(Wt 000Kg) 1520 1493 27 11880 1004 237 90
Time (hrmnsc) 133000 134150 01150 na na na na
1 Energy value based upon absorbed heat (italics) from STP to 1000degK (0446 BTUg for Air 115 BTUg water) Underlined value is released heat at generally accepted 44 BTUg 2 Determined by difference from propane and air Energy assumed value 90 3 Arbitrary estimated efficiency of heat transfer not effective work
The increase in pressure on the water column by 10 psi reduced air flow by 9 percent but increased the steam fraction considerably and thereby increased the effective boiler horsepower nearly three-fold to 237 bhp (assuming 90 heat transfer) These data are summarized in Table 3
FEDERAL TRANSIT ADMINISTRATION 30
SECTION 4 BRASH TEST PLAN
As with Run 3 start up from Time Zero was immediate burner on air flow begins and water flow under pressure commences immediately Another impressive feature of the mix air-steam propellant system is the ability to start stop and rapidly accelerate as shown in the full Run 5 video Run 5 serves as validation that this patented technology has unique performance benefits over air steam or internal combustion alone
Lessons Learned A comparison of the two test runs verifies some key points
1 The same power plant can produce variable power and fuel economy based upon power demand and airsteam mix
2 Although imprecise at this point in testing fuel consumption appears directly proportional to engine speed The engineexpander will spool up spool down stop and restart in a manner consistent with fuel and propellant flow The Run 5 video on the Brash Engines website verifies this conclusion
3 The use of a defined static air pressure ldquoheadrdquo over the water column at a pressure higher than the defined air line dynamic pressure provides a safe and predictable bias toward flow from the water fraction
4 Although the current test configuration offers sufficient performance for this initial demonstration phase the following observations are in order
a The heater path is too long creating latent response issues
b The airwater injector is not optimized for proper mix or flow capacity
c The incomplete integration of LabVIEW compromises the quality of data
d The absence of a measured variable load on the expander compromises any analysis of power and fuel economy
5 The design migration to a vehicle installation was premature The project should move back to a lab bench study to refine the regulation of components complete the recovery and recompression portions of the system and use electromechanical loads to estimate power and useful work for specific quantities of fuel water and air
6 The Quasiturbinetrade engine technology is promising but too immature for larger-scale modeling Later phases of the project should rely on more conventional multi-cylinder piston-type expander
Estimated Fuel Economy Mass transit authorities have relied on large diesel engines such as the Detroit Diesel Series 50 and Series 60 engines for more than 30 years Reports on fuel economy vary from a high of 60 miles per gallon (Diesel) for longer-range
FEDERAL TRANSIT ADMINISTRATION 31
SECTION 4 BRASH TEST PLAN
commuter services in California23 to a low of 228 miles per gallon (Diesel) for city buses with frequent stops in New York City24 In both cited studies the migration to compressed natural gas (CNG) has resulted in lower fuel economies on a Diesel Gallon Equivalent (DGE) basis
Table 4 summarizes this study (columns 2 and 3) and the next proposed phase (columns 4 and 5) the performance of the current fleet of mass transit buses (columns 6 and 7) and the likely outcome if the Besler engine (described earlier) were employed with the air-steam hybrid technology (columns 8 and 9)
Table 4 Comparison of
Fuel Economies
Air
1
Configuration
Engine
HP
Torque
Fuel
gmin
BTUhr
GGEhr
mpg 60mph
GGE100 mi
$ per GGE
$100 mi
Current
Example
2
3
3
5
4
Bench
5
S-10
6
SB Bus
7
NYCT
8
50 eff
9
30 eff
86
Quasi
2
Prop
82
216
02
3160
03
30
09
Current
237
Quasi
2
Prop
23
607
05
1126
09
30
27
UC 1
40
6 cyl
20
Prop
40
1056
09
648
15
30
46
UC 2
80
6 cyl
40
Mix
80
2112
19
324
31
30
93
MCI102
DD S60
350
1450
Diesel
540
11400
100
60
167
35
583
Diesel
23
439
35
1535
300
Besler
150
1200
Mix
300
792
695
864
1158
16
1853
500
Besler
150
1200
Mix
500
1320
1158
518
1930
16
3088
The Besler engine is shown in two columns The left column reflects the higher efficiency anticipated with the air-steam hybrid mix described earlier as at or near 50 percent The right column reflects the historical efficiency realized with steam engine technology The italicized numbers near the bottom of the column show that even at historical efficiencies the Besler engine would offer equal or better Gasoline Gallon Equivalent (GGE)100 mile ratings of the current diesel technology but migrating toward less refined and (therefore) less expensive fuels would significantly reduce the operating cost ($mile)
23Demonstration of Caterpillar C-10 Dual-Fuel Engines in MCI 102DL3 Commuter Buses National Renewable Energy Laboratory httpwwwnrelgovdocsfy00osti26758pdf p 7 24R Barnitt ldquoNew York City Transit (NYCT) Hybrid (125 Order) and CNG Transit Buses Final Evaluation Resultsrdquo November 2006 National Renewable Energy Laboratory K Chandler Battelle Technical Report NRELTP-540-40125 November 2006 httpwwwnrelgovvehiclesandfuelsfleettestpdfs40125pdf pvii
FEDERAL TRANSIT ADMINISTRATION 32
SECTION 4 BRASH TEST PLAN
There are of course two orders of magnitude difference between the results of Runs 3 and 5 and the daily demands of city and commuter buses but the mere existence of the Besler Twin and the Brooks V-8 400 HP engine suggests an opportunity for fuel economy and fuel variety
Proposed further support for the next phase of development will advance the air-steam hybrid technology by an important order of magnitude This would provide the data confidence to scale to larger vehicle operation and garner the interest of one or more engine or vehicle OEMs
Figure 31 MTANew York City
Transit Orion VII Next Generation
Hybrid Transit Bus
Next Development Phase The next phase of development will incorporate a modern six-cylinder steam engine design with a displacement of 53 cubic inches and capable of sustained 15-25 HP operation The expander will be supplied by Steam Engine Power Inc (httpwwwsteamenginepowercom) This expander will drive an alternator generator to measure effective work output in watts as well as provide sufficient power to satisfy the system parasitic loads of battery recharge exhaust air recompression and all other pump and valve operations
Figure 32 (l to r) Six-Cylinder Expander Power Generation Load
Small 24 VDC Compressor
FEDERAL TRANSIT ADMINISTRATION 33
SECTION 4 BRASH TEST PLAN
Static pressure for the water column will still be supplied via compressed air cylinder but the dynamic air flow will be supplied by an oil-less air compressor of the size and type shown This 24 VDC compressor will recompress the recovered air exiting the expander to 40ndash60 psi pressure and support flows of 3ndash4 cubic feet per minute (cfm) These three components are off-the-shelf enhancements to the system but custom engineering of a new more powerful and more responsive heater completion of the electronic integration and design and fabrication of the recoveryrecompression components are necessary tasks that must be included to make the next generation assembly work to its potential This work will be accomplished largely by Mechanical and Electrical Engineering students at the University of Connecticut under the supervision of faculty and Brash Engines personnel
When this build is complete all operations will be under LabVIEW control All expander operations will be measured for power and work Once the bench version is in control a modified version will be installed in a small pickup truck (eg Chevrolet S-10) for further verification of system performance and robustness
During this phase a new and promising technology will be investigated a new and faster class of solenoid valves from National Instruments These solenoid valves with an unprecedented 3 msec response time have the potential of allowing air-steam retrofit in existing engine blocks The solenoid valves could replace the spark plugs in conventional IC engines and provide the equivalent timed injection of hot propellant mix as the timed firing of a spark plug in the presence of a fuel air mix
If possible these fast solenoids and the black box programming to control them could allow very easy portability to larger vehicles and easier retrofit Potentially a V-6 engine could operate 4 cylinders for expansion and the remaining two cylinders could be used as direct drive compressors with different but equivalent solenoid valves controlling the compression process
FEDERAL TRANSIT ADMINISTRATION 34
SECTION Development Plan 5 and Next Steps
This current effort is a key first-proof of concept for this air-steam hybrid technology but our goals extend well beyond this two-seat 2 HP demonstrator The lessons learned in electronic integration will allow rapid migration to larger platforms using the same basic controls but scaling the expander heater and other mass-flow components to vehicle-appropriate size That project identified as ldquo20 HP Vehiclerdquo and other near-term derivative projects are listed in Table 5
BRASH Project
ProposedFunding Source
Funds Reqd $K Project Description
SUV-size proof-of-concept for reliable 20 HP Vehicle DOTUSPS 300 highway performance maildelivery
vehicle size
Proof-of-concept mass transit busshy200 HP Vehicle DOTDOD 600 retrofit scaled to city bus capacity and
suitable for replacement of over-the-road diesel engines
Table 5 Project Funding
Stationary Power Unit Micro-CHP Equivalent
DARPA 300 Proof-of-concept mass transit bus-retrofit scaled to city bus capacity and suitable for replacement of over-the-road diesel engines
Summary Alternative Processed Solid Fuel DOE EPA DOA 600
Processed mix of hydrolyzed wood pulp processed solid waste and other combustible solids in an extrudable mass with alcohol solutevehiclemdashdemonstrate utility in vehicles as a high energy content clean burning fuel for EC engines
Demonstrate effective pyrolysis of
Binary Solid Gas Fuel
EPA Waste Management BFI
400 processed solid fuels in a binary fuel burner conventional fuel (gasoline natural gas) provides primary heat source for pyrolysis temperatures
Proof of Concept OEM Power Plant
Vehicle OEM (eg Ford GM Caterpillar) 1200
Development of direct replacement BRASH engine alternative to existing OEM IC engine
Black Box Integration of Controller Software
Vehicle OEM (eg Ford GM Caterpillar)
1600 Development of commercial BRASH system alternative to existing OEM IC engine
FEDERAL TRANSIT ADMINISTRATION 35
SECTION 5 DEVELOPMENT PLAN AND NEXT STEPS
The issuance of US Patent 7743872 five months ago has two important consequences for this project First it serves to validate the underlying technology the combination of air and steam in an EC engine is better than steam or air alone Second it provides a basis for full and open discussions with government agencies and large commercial interests in the transportation and power sectors
Our efforts at promotion have been delayed pending successful demonstration of the Smarttrade car vehicle to allow the first detailed real-world performance data to be distributed
Coupling that performance data with the option of migration away from refined petroleum should spark significant interest If we can move to a high lignin-processed wood pulp that costs $045 per gasoline gallon equivalent (an arbitrary value for example only) and consumes more CO2 while growing than is consumed in processing as a fuel and produced from combustion then we succeed as a project and as a global game-changing technology for many uses Improvements in fuel economy are important but of greater importance is the migration to low-process biomass fuels
FEDERAL TRANSIT ADMINISTRATION 36
SECTION Potential Applications and Societal Value 6 The whole premise behind the BRASH air steam hybrid is that external combustion offers a more benign and environmentally-appropriate way to power large vehicles and other portable equipment than refined petroleum-powered internal combustion
bullCombustion heat can be derived from any fuel source including processed solids from fast-growing renewables such as poplar trees waste corn stalks or switch grass
bullThat combustion heat is applied at a rate consistent with the work to be done and not to support idling and other unproductive fuel use
Using a mix of air and steam as working fluids in the engine allows
bullImmediate startup from an ldquoair-onlyrdquo start
bull Managed system pressure through use of a defined head air pressure
bullManaged fuel burn as the air-steam fraction is adjusted to match wheel load
bullAdjusted wheel load reduces fuel burn
Integration of modern control circuitry with external combustion also brings a level of performance operational simplicity and safety heretofore unavailable
FEDERAL TRANSIT ADMINISTRATION 37
SECTION
7 Phase I Conclusions
The last steam train in scheduled service in the US departed on October 11 196225 One year earlier Robert Noyce received the first patent for an integrated circuit26 But for that brief one-year overlap the most powerful motive power technology was never harnessed by the black box controls that grew out of Noycersquos invention so the diesel-powered IC engine championed by Henry Ford won out
Now nearly 50 years later the modern IC engine cannot operate efficiently without the benefit of black box electronicsmdashbut that technology still presents intractable challenges of supply safety and environmental impact The air-steam hybrid technology may offer an alternative and a glimpse of that potential is presented here and viewable in Run 5 on the Brash Engines website at http wwwbrashenginescom
While demonstration in a test vehicle provides a strong visual message that BRASH technology works the commercial success of this technology will depend upon reliable repeatable measurement of power and economy For that data the Phase 2 effort will require a return to laboratory bench testing and effective demonstration of recovery of the water and air fractions
The results of this Phase I project collectively demonstrate the technical feasibility and commercial potential of the BRASH air-steam hybrid engine technology The initial DOT SBIR funding has been highly effective in facilitating this important proof of concept and laying the groundwork for further technology refinement and application
As described earlier the next steps are clear and appear to combine achievable and rapid major advances with low developmental risk SBIR Phase 2 support is needed for those advances due to the still-early stage of development that restricts access to private capital
The immense potential value of this technology has been enhanced and verified in Phase 1 there is now a clear and low-risk path ahead to larger-scale testing further component and controls refinement specific applications prototyping and pre-commercial deployments
25William Rosen The Most Powerful Idea in the World Random House 2010 p 311 26US Patent 2981877
FEDERAL TRANSIT ADMINISTRATION 38
APPENDIX
A Heat Transfer Efficiency Modeling Runs 3 and 5 50 and 90
Much of the analysis for Runs 3 and 5 is based on an assumed efficiency of 90 for heat transfer from the combustion of propane to heating of the water air mix in the coil As a test for the reasonableness of that assumption the same data have been modeled at a much lower 50 factor below
112210 - 3 Low Speed Run Air Pressure 60 psi Water head pressure 60 psi
Water2 00440 5060 4276 101 43 (Wt 000Kg)
Propane 152 1493 237 50 27 11880 1004 (Wt 000Kg)
Time 133000 134150 01150 na na na na (hrmnsc)
1 Energy value based upon absorbed heat (italics) from STP to 1000degK (0446 BTUg for Air 115 BTUg water) Underlined value is released heat at generally accepted 44 BTUg
Air (Wt 000Kg)
Component(BTU) Start Wt End Wt Net Wt Energy1
(BTU) Power
(BTUmin) Power (HP) Efficiency3
661 460 201 938 1294 30 36
Water2
(Wt 000Kg)
Propane(Wt 000Kg)
Time (hrmnsc)
1562
123000
1556
123715
00125
006
00715
380
2640
na
523
364
na
12
86
14
50
na na
Air (Wt 000Kg)
Component(BTU) Start Wt
5 Variable High Speed Run Air Pressure 60 psi Water head pressure 70 psi
End Wt Net Wt Energy1
(BTU) Power
(BTUmin) Power (HP) Efficiency3
654 472 182 849 718 17 7
2 Determined by difference from Propane and Air Energy assumed value 90 3 Arbitrary estimated efficiency of heat transfer not effective work
The two known quantities in each run is the weight of the air moving through the system and the weight of the propane heating that air The variable is the quantity of water heated to steam temperatures and above In Run 3 at 90 efficiency that mass of water calculates to 125 grams at 50 it drops to 33 grams In Run 5 at 90 efficiency that mass of water calculates to 86 grams at 50 it drops to 44 grams
FEDERAL TRANSIT ADMINISTRATION 39
APPENDIX A HEAT TRANSFER EFFICIENCY MODELING RUNS 3 AND 5 50 AND 90
As the comparison tables below show the uncertainty in the efficiency of heat transfer is manifest only in the mass of water heated to steam to do useful work
Data 90 Efficiency
Air
Component Run 3 BHP
Run 5 BHP
Net ChngBHP
-45
Run 3 Mass
Transfer (kg)
Run 5 Mass
Transfer (kg)
Net ChangeMass
Transfer (kg)
30 17
197
237
2010 182 -9
Water
Propane
Duration (mn)
47
86
725
422
0060
0013
725
0270
0086
1180
588
350
163 1180
276
163
Data 50 Efficiency
Air
Component Run 3 BHP
Run 5 BHP
Net ChngBHP
-45
Run 3 Mass
Transfer (kg)
Run 5 Mass
Transfer (kg)
Net ChangeMass
Transfer (kg)
30 17
101
237
2010 182 -9
Water
Propane
Duration (mn)
12
86
725
817
0060
0003
725
0270
0044
1180
1233
350
163 1180
276
163
Regardless of the specific efficiency Run3 reflects an air-rich propellant mix while Run 5 was clearly the more powerful and steam-rich propellant If 50 efficiency is a more realistic figure than 90 the only consequence is more water passing through the heater expander and recovery tank The only consequence for overall system efficiency is the slight but added work required to move the additional water by pump to the top of the water column
FEDERAL TRANSIT ADMINISTRATION 40
APPENDIX Acronyms B
BHP Boiler Horsepower
BRASH Binary Recovery Air-Steam Hybrid
BTU British Thermal Unit
CC Cubic centimeter
CFM Cubit feet per minute
CHP Combined heat and power
CNG Compressed natural gas
CO2 Carbon dioxide
CU Cubic
DARPA Defense Advanced Research Projects Agency
DGE Diesel gallon equivalent
DOT Department of Transportation
EC External combustion
EIA Energy Information Administration
EPA Environmental Protection Agency
FTA Federal Transit Administration
GGE Gasoline gallon equivalent
HP Horsepower
IC Internal combustion
K Kelvin
Kcal Kilocalorie
MPG Miles per gallon
MPH Miles per hour
OEM Original equipment manufacturer
PSI Pounds per square inch
RPM Revolutions per minute
SBIR Small Business Innovation Research
STP Standard temperature and pressure
FEDERAL TRANSIT ADMINISTRATION 41
FEDERAL TRANSIT ADMINISTRATION 128
US Department of TransportationFederal Transit AdministrationEast Building1200 New Jersey Avenue SEWashington DC 20590httpwwwftadotgovresearch
US Department of Transportation Federal Transit Administration East Building 1200 New Jersey Avenue SE Washington DC 20590 httpwwwftadotgovresearch
FEDERAL TRANSIT ADMINISTRATION 42
- Button1
- Button2
- Button3
- Button4
- Button5
- Button6
- Button7
- Button8
- Button9
- Button10
- Button11
- Button12
- Button13
- Button14
- Button15
- Button16
- Button17
- Button18
- Button19
- Button20
- Button21
- Button22
- Button23
- Button24
- Button25
- Button26
- Button27
- Button28
- Button29
- Button30
- Button31
- Button32
- Button33
- Button34
- Button35
- Button36
- Button37
- Button38
- Button39
- Button40
- Button41
- Button42
- Button43
- Button44
- Button45
- Button46
- Button47
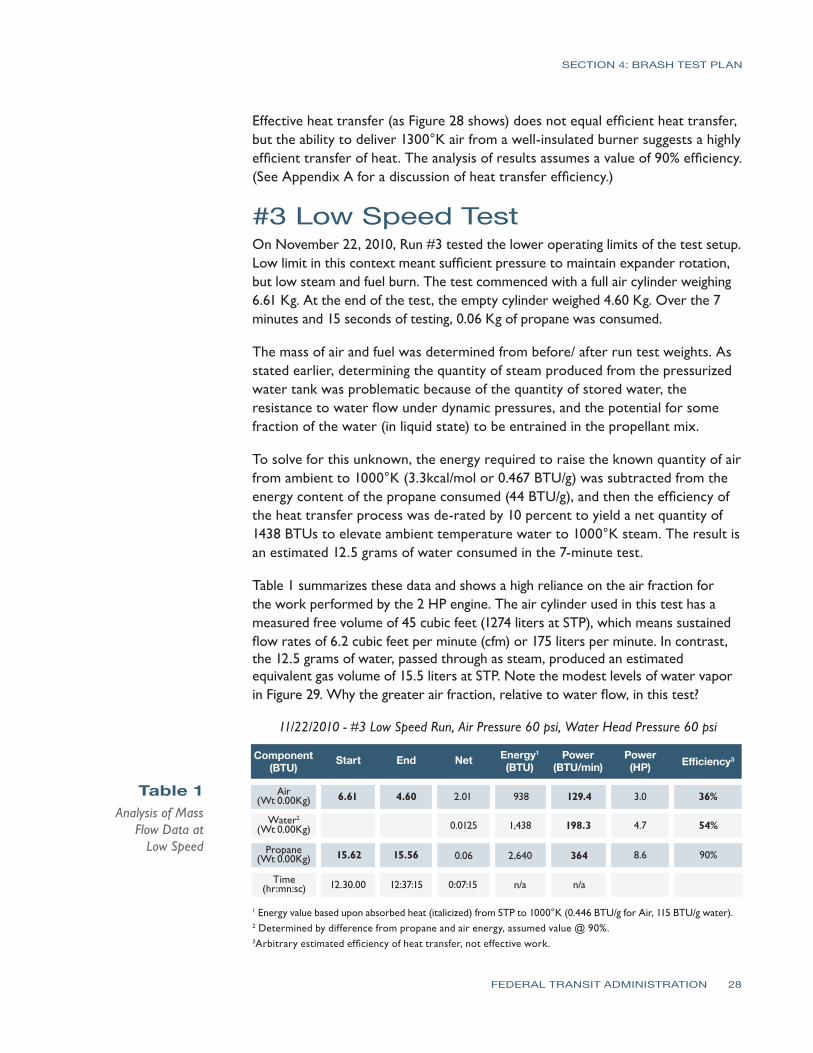
SECTION 4 BRASH TEST PLAN
Effective heat transfer (as Figure 28 shows) does not equal efficient heat transfer but the ability to deliver 1300degK air from a well-insulated burner suggests a highly efficient transfer of heat The analysis of results assumes a value of 90 efficiency (See Appendix A for a discussion of heat transfer efficiency)
3 Low Speed Test On November 22 2010 Run 3 tested the lower operating limits of the test setup Low limit in this context meant sufficient pressure to maintain expander rotation but low steam and fuel burn The test commenced with a full air cylinder weighing 661 Kg At the end of the test the empty cylinder weighed 460 Kg Over the 7 minutes and 15 seconds of testing 006 Kg of propane was consumed
The mass of air and fuel was determined from before after run test weights As stated earlier determining the quantity of steam produced from the pressurized water tank was problematic because of the quantity of stored water the resistance to water flow under dynamic pressures and the potential for some fraction of the water (in liquid state) to be entrained in the propellant mix
To solve for this unknown the energy required to raise the known quantity of air from ambient to 1000degK (33kcalmol or 0467 BTUg) was subtracted from the energy content of the propane consumed (44 BTUg) and then the efficiency of the heat transfer process was de-rated by 10 percent to yield a net quantity of 1438 BTUs to elevate ambient temperature water to 1000degK steam The result is an estimated 125 grams of water consumed in the 7-minute test
Table 1 summarizes these data and shows a high reliance on the air fraction for the work performed by the 2 HP engine The air cylinder used in this test has a measured free volume of 45 cubic feet (1274 liters at STP) which means sustained flow rates of 62 cubic feet per minute (cfm) or 175 liters per minute In contrast the 125 grams of water passed through as steam produced an estimated equivalent gas volume of 155 liters at STP Note the modest levels of water vapor in Figure 29 Why the greater air fraction relative to water flow in this test
Air (Wt 000Kg) 661 460 201 938 1294 30 36
Water2
(Wt 000Kg)
Propane(Wt 000Kg)
Time (hrmnsc)
1562
123000
1556
123715
00125
006
00715
1438
2640
na
1983
364
na
47
86
54
90
1 Energy value based upon absorbed heat (italicized) from STP to 1000degK (0446 BTUg for Air 115 BTUg water) 2 Determined by difference from propane and air energy assumed value 90 3Arbitrary estimated efficiency of heat transfer not effective work
11222010 - 3 Low Speed Run Air Pressure 60 psi Water Head Pressure 60 psi
Component(BTU) Start End Net Energy1
(BTU) Power
(BTUmin) Power (HP) Efficiency3
Table 1 Analysis of Mass
Flow Data at Low Speed
FEDERAL TRANSIT ADMINISTRATION 28
SECTION 4 BRASH TEST PLAN
Figure 29 Low-Speed Test Results in Little
Water Vapor
In this baseline experiment the single cylinder provides 60 psi air flow and 60 psi static ldquoheadrdquo pressure on the water column The air flow from the cylinder is biased toward the generally less restrictive flow path for air The water column under the same pressure presents a higher viscosity medium passing through a greater number of valves and restrictions At the point of injection the air fraction flows more freely into the hot section In order to bias the mix toward greater water fraction (and greater power) the head pressure on the water column must be increased over the 60 psi air line pressure
Run 4 (not documented here) evaluated head pressures from 110 psi to 70 psi and determined that modest differential pressures retarded the flow from the air fraction and boosted flow of the water fraction Still higher differential pressures effectively stopped air flow altogether reverting the engine operation to ldquosteam onlyrdquo For Run 5 an additional cylinder was used to apply a 70 psi static head pressure on the water column a 10 psi differential over the 60 psi air line pressure
5 Variable High Speed Test On November 26 2010 Run 5 tested the higher differential water pressure as a means to increase the effective water fraction in the propellant mix The test commenced with a full air cylinder weighing 654 Kg At the end of the test the empty cylinder weighed 472 Kg Run 5 was interrupted after 243 minutes to refill the water tank and then testing resumed for an additional 907 minutes Over the whole test 027 Kg of propane was consumed
Using the same analytical basis as Test 3 Test 5 data indicate a substantial increase in work capacity (as measured by fuel consumed and steam generated) over the 3 baseline
FEDERAL TRANSIT ADMINISTRATION 29
112610 - 5 Variable High Speed Run Air Pressure 60 psi Water Head Pressure 70 psi
Air (Wt 000Kg)
Component(BTU) Start End Net Energy1
(BTU) Power
(BTUmin) Power (HP) Efficiency3
654 472 182 849 718 17 7
SECTION 4 BRASH TEST PLAN
Table 3 Comparison of Mass Flows
Water 588 Runs 3 and 5
163 Duration (mn) 725 1180 725 1180 163
Air
Component Run 3 BHP
Run 5 BHP
Net ChngBHP
Run 5 Mass
Transfer (kg)
Net ChangeMass
Transfer (kg)
30 17
197
237
-45 2010 182 -9
Run 3 Mass
Transfer (kg)
276 350
47
86
422
0060
0013
0270
0086
Propane
This difference in steam fraction and power is more clearly seen in Figure 30 (and on the source video at the Brash Engines website)
Figure 30 Three Images from Run 5
Table 2 Test 5 Results with Increased
Water and Fuel Water2
(Wt 000Kg) 0860 9890 8358 197 83
Propane(Wt 000Kg) 1520 1493 27 11880 1004 237 90
Time (hrmnsc) 133000 134150 01150 na na na na
1 Energy value based upon absorbed heat (italics) from STP to 1000degK (0446 BTUg for Air 115 BTUg water) Underlined value is released heat at generally accepted 44 BTUg 2 Determined by difference from propane and air Energy assumed value 90 3 Arbitrary estimated efficiency of heat transfer not effective work
The increase in pressure on the water column by 10 psi reduced air flow by 9 percent but increased the steam fraction considerably and thereby increased the effective boiler horsepower nearly three-fold to 237 bhp (assuming 90 heat transfer) These data are summarized in Table 3
FEDERAL TRANSIT ADMINISTRATION 30
SECTION 4 BRASH TEST PLAN
As with Run 3 start up from Time Zero was immediate burner on air flow begins and water flow under pressure commences immediately Another impressive feature of the mix air-steam propellant system is the ability to start stop and rapidly accelerate as shown in the full Run 5 video Run 5 serves as validation that this patented technology has unique performance benefits over air steam or internal combustion alone
Lessons Learned A comparison of the two test runs verifies some key points
1 The same power plant can produce variable power and fuel economy based upon power demand and airsteam mix
2 Although imprecise at this point in testing fuel consumption appears directly proportional to engine speed The engineexpander will spool up spool down stop and restart in a manner consistent with fuel and propellant flow The Run 5 video on the Brash Engines website verifies this conclusion
3 The use of a defined static air pressure ldquoheadrdquo over the water column at a pressure higher than the defined air line dynamic pressure provides a safe and predictable bias toward flow from the water fraction
4 Although the current test configuration offers sufficient performance for this initial demonstration phase the following observations are in order
a The heater path is too long creating latent response issues
b The airwater injector is not optimized for proper mix or flow capacity
c The incomplete integration of LabVIEW compromises the quality of data
d The absence of a measured variable load on the expander compromises any analysis of power and fuel economy
5 The design migration to a vehicle installation was premature The project should move back to a lab bench study to refine the regulation of components complete the recovery and recompression portions of the system and use electromechanical loads to estimate power and useful work for specific quantities of fuel water and air
6 The Quasiturbinetrade engine technology is promising but too immature for larger-scale modeling Later phases of the project should rely on more conventional multi-cylinder piston-type expander
Estimated Fuel Economy Mass transit authorities have relied on large diesel engines such as the Detroit Diesel Series 50 and Series 60 engines for more than 30 years Reports on fuel economy vary from a high of 60 miles per gallon (Diesel) for longer-range
FEDERAL TRANSIT ADMINISTRATION 31
SECTION 4 BRASH TEST PLAN
commuter services in California23 to a low of 228 miles per gallon (Diesel) for city buses with frequent stops in New York City24 In both cited studies the migration to compressed natural gas (CNG) has resulted in lower fuel economies on a Diesel Gallon Equivalent (DGE) basis
Table 4 summarizes this study (columns 2 and 3) and the next proposed phase (columns 4 and 5) the performance of the current fleet of mass transit buses (columns 6 and 7) and the likely outcome if the Besler engine (described earlier) were employed with the air-steam hybrid technology (columns 8 and 9)
Table 4 Comparison of
Fuel Economies
Air
1
Configuration
Engine
HP
Torque
Fuel
gmin
BTUhr
GGEhr
mpg 60mph
GGE100 mi
$ per GGE
$100 mi
Current
Example
2
3
3
5
4
Bench
5
S-10
6
SB Bus
7
NYCT
8
50 eff
9
30 eff
86
Quasi
2
Prop
82
216
02
3160
03
30
09
Current
237
Quasi
2
Prop
23
607
05
1126
09
30
27
UC 1
40
6 cyl
20
Prop
40
1056
09
648
15
30
46
UC 2
80
6 cyl
40
Mix
80
2112
19
324
31
30
93
MCI102
DD S60
350
1450
Diesel
540
11400
100
60
167
35
583
Diesel
23
439
35
1535
300
Besler
150
1200
Mix
300
792
695
864
1158
16
1853
500
Besler
150
1200
Mix
500
1320
1158
518
1930
16
3088
The Besler engine is shown in two columns The left column reflects the higher efficiency anticipated with the air-steam hybrid mix described earlier as at or near 50 percent The right column reflects the historical efficiency realized with steam engine technology The italicized numbers near the bottom of the column show that even at historical efficiencies the Besler engine would offer equal or better Gasoline Gallon Equivalent (GGE)100 mile ratings of the current diesel technology but migrating toward less refined and (therefore) less expensive fuels would significantly reduce the operating cost ($mile)
23Demonstration of Caterpillar C-10 Dual-Fuel Engines in MCI 102DL3 Commuter Buses National Renewable Energy Laboratory httpwwwnrelgovdocsfy00osti26758pdf p 7 24R Barnitt ldquoNew York City Transit (NYCT) Hybrid (125 Order) and CNG Transit Buses Final Evaluation Resultsrdquo November 2006 National Renewable Energy Laboratory K Chandler Battelle Technical Report NRELTP-540-40125 November 2006 httpwwwnrelgovvehiclesandfuelsfleettestpdfs40125pdf pvii
FEDERAL TRANSIT ADMINISTRATION 32
SECTION 4 BRASH TEST PLAN
There are of course two orders of magnitude difference between the results of Runs 3 and 5 and the daily demands of city and commuter buses but the mere existence of the Besler Twin and the Brooks V-8 400 HP engine suggests an opportunity for fuel economy and fuel variety
Proposed further support for the next phase of development will advance the air-steam hybrid technology by an important order of magnitude This would provide the data confidence to scale to larger vehicle operation and garner the interest of one or more engine or vehicle OEMs
Figure 31 MTANew York City
Transit Orion VII Next Generation
Hybrid Transit Bus
Next Development Phase The next phase of development will incorporate a modern six-cylinder steam engine design with a displacement of 53 cubic inches and capable of sustained 15-25 HP operation The expander will be supplied by Steam Engine Power Inc (httpwwwsteamenginepowercom) This expander will drive an alternator generator to measure effective work output in watts as well as provide sufficient power to satisfy the system parasitic loads of battery recharge exhaust air recompression and all other pump and valve operations
Figure 32 (l to r) Six-Cylinder Expander Power Generation Load
Small 24 VDC Compressor
FEDERAL TRANSIT ADMINISTRATION 33
SECTION 4 BRASH TEST PLAN
Static pressure for the water column will still be supplied via compressed air cylinder but the dynamic air flow will be supplied by an oil-less air compressor of the size and type shown This 24 VDC compressor will recompress the recovered air exiting the expander to 40ndash60 psi pressure and support flows of 3ndash4 cubic feet per minute (cfm) These three components are off-the-shelf enhancements to the system but custom engineering of a new more powerful and more responsive heater completion of the electronic integration and design and fabrication of the recoveryrecompression components are necessary tasks that must be included to make the next generation assembly work to its potential This work will be accomplished largely by Mechanical and Electrical Engineering students at the University of Connecticut under the supervision of faculty and Brash Engines personnel
When this build is complete all operations will be under LabVIEW control All expander operations will be measured for power and work Once the bench version is in control a modified version will be installed in a small pickup truck (eg Chevrolet S-10) for further verification of system performance and robustness
During this phase a new and promising technology will be investigated a new and faster class of solenoid valves from National Instruments These solenoid valves with an unprecedented 3 msec response time have the potential of allowing air-steam retrofit in existing engine blocks The solenoid valves could replace the spark plugs in conventional IC engines and provide the equivalent timed injection of hot propellant mix as the timed firing of a spark plug in the presence of a fuel air mix
If possible these fast solenoids and the black box programming to control them could allow very easy portability to larger vehicles and easier retrofit Potentially a V-6 engine could operate 4 cylinders for expansion and the remaining two cylinders could be used as direct drive compressors with different but equivalent solenoid valves controlling the compression process
FEDERAL TRANSIT ADMINISTRATION 34
SECTION Development Plan 5 and Next Steps
This current effort is a key first-proof of concept for this air-steam hybrid technology but our goals extend well beyond this two-seat 2 HP demonstrator The lessons learned in electronic integration will allow rapid migration to larger platforms using the same basic controls but scaling the expander heater and other mass-flow components to vehicle-appropriate size That project identified as ldquo20 HP Vehiclerdquo and other near-term derivative projects are listed in Table 5
BRASH Project
ProposedFunding Source
Funds Reqd $K Project Description
SUV-size proof-of-concept for reliable 20 HP Vehicle DOTUSPS 300 highway performance maildelivery
vehicle size
Proof-of-concept mass transit busshy200 HP Vehicle DOTDOD 600 retrofit scaled to city bus capacity and
suitable for replacement of over-the-road diesel engines
Table 5 Project Funding
Stationary Power Unit Micro-CHP Equivalent
DARPA 300 Proof-of-concept mass transit bus-retrofit scaled to city bus capacity and suitable for replacement of over-the-road diesel engines
Summary Alternative Processed Solid Fuel DOE EPA DOA 600
Processed mix of hydrolyzed wood pulp processed solid waste and other combustible solids in an extrudable mass with alcohol solutevehiclemdashdemonstrate utility in vehicles as a high energy content clean burning fuel for EC engines
Demonstrate effective pyrolysis of
Binary Solid Gas Fuel
EPA Waste Management BFI
400 processed solid fuels in a binary fuel burner conventional fuel (gasoline natural gas) provides primary heat source for pyrolysis temperatures
Proof of Concept OEM Power Plant
Vehicle OEM (eg Ford GM Caterpillar) 1200
Development of direct replacement BRASH engine alternative to existing OEM IC engine
Black Box Integration of Controller Software
Vehicle OEM (eg Ford GM Caterpillar)
1600 Development of commercial BRASH system alternative to existing OEM IC engine
FEDERAL TRANSIT ADMINISTRATION 35
SECTION 5 DEVELOPMENT PLAN AND NEXT STEPS
The issuance of US Patent 7743872 five months ago has two important consequences for this project First it serves to validate the underlying technology the combination of air and steam in an EC engine is better than steam or air alone Second it provides a basis for full and open discussions with government agencies and large commercial interests in the transportation and power sectors
Our efforts at promotion have been delayed pending successful demonstration of the Smarttrade car vehicle to allow the first detailed real-world performance data to be distributed
Coupling that performance data with the option of migration away from refined petroleum should spark significant interest If we can move to a high lignin-processed wood pulp that costs $045 per gasoline gallon equivalent (an arbitrary value for example only) and consumes more CO2 while growing than is consumed in processing as a fuel and produced from combustion then we succeed as a project and as a global game-changing technology for many uses Improvements in fuel economy are important but of greater importance is the migration to low-process biomass fuels
FEDERAL TRANSIT ADMINISTRATION 36
SECTION Potential Applications and Societal Value 6 The whole premise behind the BRASH air steam hybrid is that external combustion offers a more benign and environmentally-appropriate way to power large vehicles and other portable equipment than refined petroleum-powered internal combustion
bullCombustion heat can be derived from any fuel source including processed solids from fast-growing renewables such as poplar trees waste corn stalks or switch grass
bullThat combustion heat is applied at a rate consistent with the work to be done and not to support idling and other unproductive fuel use
Using a mix of air and steam as working fluids in the engine allows
bullImmediate startup from an ldquoair-onlyrdquo start
bull Managed system pressure through use of a defined head air pressure
bullManaged fuel burn as the air-steam fraction is adjusted to match wheel load
bullAdjusted wheel load reduces fuel burn
Integration of modern control circuitry with external combustion also brings a level of performance operational simplicity and safety heretofore unavailable
FEDERAL TRANSIT ADMINISTRATION 37
SECTION
7 Phase I Conclusions
The last steam train in scheduled service in the US departed on October 11 196225 One year earlier Robert Noyce received the first patent for an integrated circuit26 But for that brief one-year overlap the most powerful motive power technology was never harnessed by the black box controls that grew out of Noycersquos invention so the diesel-powered IC engine championed by Henry Ford won out
Now nearly 50 years later the modern IC engine cannot operate efficiently without the benefit of black box electronicsmdashbut that technology still presents intractable challenges of supply safety and environmental impact The air-steam hybrid technology may offer an alternative and a glimpse of that potential is presented here and viewable in Run 5 on the Brash Engines website at http wwwbrashenginescom
While demonstration in a test vehicle provides a strong visual message that BRASH technology works the commercial success of this technology will depend upon reliable repeatable measurement of power and economy For that data the Phase 2 effort will require a return to laboratory bench testing and effective demonstration of recovery of the water and air fractions
The results of this Phase I project collectively demonstrate the technical feasibility and commercial potential of the BRASH air-steam hybrid engine technology The initial DOT SBIR funding has been highly effective in facilitating this important proof of concept and laying the groundwork for further technology refinement and application
As described earlier the next steps are clear and appear to combine achievable and rapid major advances with low developmental risk SBIR Phase 2 support is needed for those advances due to the still-early stage of development that restricts access to private capital
The immense potential value of this technology has been enhanced and verified in Phase 1 there is now a clear and low-risk path ahead to larger-scale testing further component and controls refinement specific applications prototyping and pre-commercial deployments
25William Rosen The Most Powerful Idea in the World Random House 2010 p 311 26US Patent 2981877
FEDERAL TRANSIT ADMINISTRATION 38
APPENDIX
A Heat Transfer Efficiency Modeling Runs 3 and 5 50 and 90
Much of the analysis for Runs 3 and 5 is based on an assumed efficiency of 90 for heat transfer from the combustion of propane to heating of the water air mix in the coil As a test for the reasonableness of that assumption the same data have been modeled at a much lower 50 factor below
112210 - 3 Low Speed Run Air Pressure 60 psi Water head pressure 60 psi
Water2 00440 5060 4276 101 43 (Wt 000Kg)
Propane 152 1493 237 50 27 11880 1004 (Wt 000Kg)
Time 133000 134150 01150 na na na na (hrmnsc)
1 Energy value based upon absorbed heat (italics) from STP to 1000degK (0446 BTUg for Air 115 BTUg water) Underlined value is released heat at generally accepted 44 BTUg
Air (Wt 000Kg)
Component(BTU) Start Wt End Wt Net Wt Energy1
(BTU) Power
(BTUmin) Power (HP) Efficiency3
661 460 201 938 1294 30 36
Water2
(Wt 000Kg)
Propane(Wt 000Kg)
Time (hrmnsc)
1562
123000
1556
123715
00125
006
00715
380
2640
na
523
364
na
12
86
14
50
na na
Air (Wt 000Kg)
Component(BTU) Start Wt
5 Variable High Speed Run Air Pressure 60 psi Water head pressure 70 psi
End Wt Net Wt Energy1
(BTU) Power
(BTUmin) Power (HP) Efficiency3
654 472 182 849 718 17 7
2 Determined by difference from Propane and Air Energy assumed value 90 3 Arbitrary estimated efficiency of heat transfer not effective work
The two known quantities in each run is the weight of the air moving through the system and the weight of the propane heating that air The variable is the quantity of water heated to steam temperatures and above In Run 3 at 90 efficiency that mass of water calculates to 125 grams at 50 it drops to 33 grams In Run 5 at 90 efficiency that mass of water calculates to 86 grams at 50 it drops to 44 grams
FEDERAL TRANSIT ADMINISTRATION 39
APPENDIX A HEAT TRANSFER EFFICIENCY MODELING RUNS 3 AND 5 50 AND 90
As the comparison tables below show the uncertainty in the efficiency of heat transfer is manifest only in the mass of water heated to steam to do useful work
Data 90 Efficiency
Air
Component Run 3 BHP
Run 5 BHP
Net ChngBHP
-45
Run 3 Mass
Transfer (kg)
Run 5 Mass
Transfer (kg)
Net ChangeMass
Transfer (kg)
30 17
197
237
2010 182 -9
Water
Propane
Duration (mn)
47
86
725
422
0060
0013
725
0270
0086
1180
588
350
163 1180
276
163
Data 50 Efficiency
Air
Component Run 3 BHP
Run 5 BHP
Net ChngBHP
-45
Run 3 Mass
Transfer (kg)
Run 5 Mass
Transfer (kg)
Net ChangeMass
Transfer (kg)
30 17
101
237
2010 182 -9
Water
Propane
Duration (mn)
12
86
725
817
0060
0003
725
0270
0044
1180
1233
350
163 1180
276
163
Regardless of the specific efficiency Run3 reflects an air-rich propellant mix while Run 5 was clearly the more powerful and steam-rich propellant If 50 efficiency is a more realistic figure than 90 the only consequence is more water passing through the heater expander and recovery tank The only consequence for overall system efficiency is the slight but added work required to move the additional water by pump to the top of the water column
FEDERAL TRANSIT ADMINISTRATION 40
APPENDIX Acronyms B
BHP Boiler Horsepower
BRASH Binary Recovery Air-Steam Hybrid
BTU British Thermal Unit
CC Cubic centimeter
CFM Cubit feet per minute
CHP Combined heat and power
CNG Compressed natural gas
CO2 Carbon dioxide
CU Cubic
DARPA Defense Advanced Research Projects Agency
DGE Diesel gallon equivalent
DOT Department of Transportation
EC External combustion
EIA Energy Information Administration
EPA Environmental Protection Agency
FTA Federal Transit Administration
GGE Gasoline gallon equivalent
HP Horsepower
IC Internal combustion
K Kelvin
Kcal Kilocalorie
MPG Miles per gallon
MPH Miles per hour
OEM Original equipment manufacturer
PSI Pounds per square inch
RPM Revolutions per minute
SBIR Small Business Innovation Research
STP Standard temperature and pressure
FEDERAL TRANSIT ADMINISTRATION 41
FEDERAL TRANSIT ADMINISTRATION 128
US Department of TransportationFederal Transit AdministrationEast Building1200 New Jersey Avenue SEWashington DC 20590httpwwwftadotgovresearch
US Department of Transportation Federal Transit Administration East Building 1200 New Jersey Avenue SE Washington DC 20590 httpwwwftadotgovresearch
FEDERAL TRANSIT ADMINISTRATION 42
- Button1
- Button2
- Button3
- Button4
- Button5
- Button6
- Button7
- Button8
- Button9
- Button10
- Button11
- Button12
- Button13
- Button14
- Button15
- Button16
- Button17
- Button18
- Button19
- Button20
- Button21
- Button22
- Button23
- Button24
- Button25
- Button26
- Button27
- Button28
- Button29
- Button30
- Button31
- Button32
- Button33
- Button34
- Button35
- Button36
- Button37
- Button38
- Button39
- Button40
- Button41
- Button42
- Button43
- Button44
- Button45
- Button46
- Button47
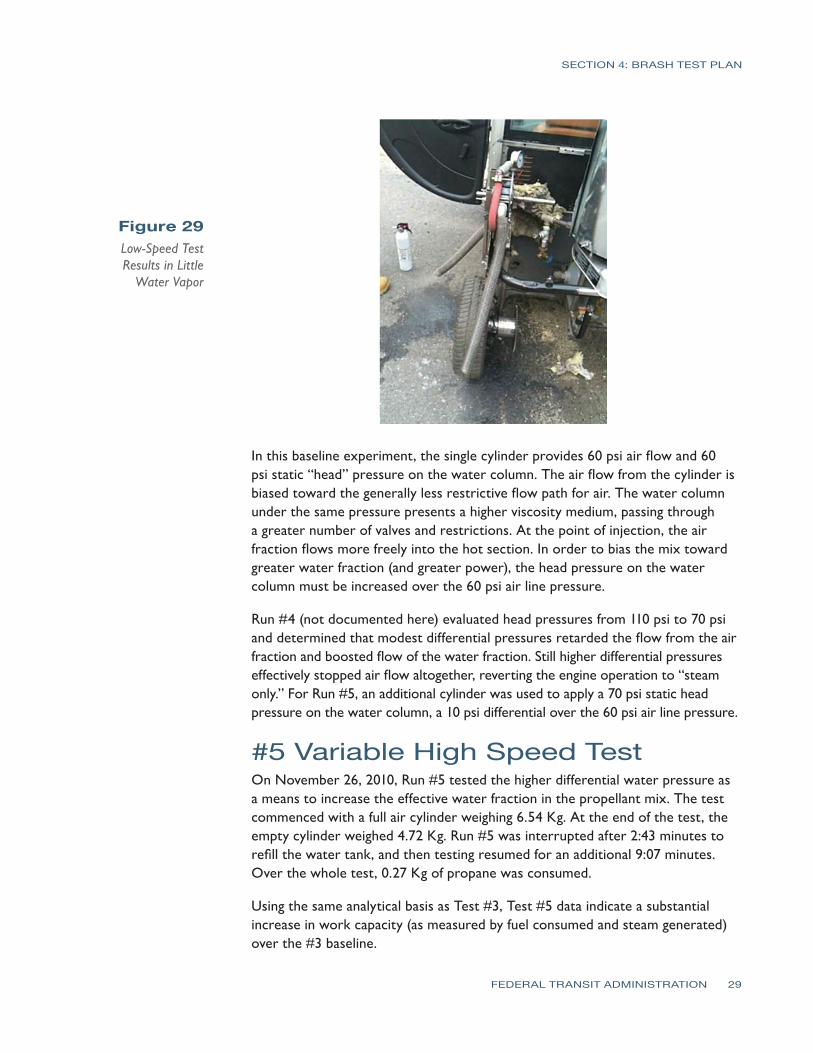
SECTION 4 BRASH TEST PLAN
Figure 29 Low-Speed Test Results in Little
Water Vapor
In this baseline experiment the single cylinder provides 60 psi air flow and 60 psi static ldquoheadrdquo pressure on the water column The air flow from the cylinder is biased toward the generally less restrictive flow path for air The water column under the same pressure presents a higher viscosity medium passing through a greater number of valves and restrictions At the point of injection the air fraction flows more freely into the hot section In order to bias the mix toward greater water fraction (and greater power) the head pressure on the water column must be increased over the 60 psi air line pressure
Run 4 (not documented here) evaluated head pressures from 110 psi to 70 psi and determined that modest differential pressures retarded the flow from the air fraction and boosted flow of the water fraction Still higher differential pressures effectively stopped air flow altogether reverting the engine operation to ldquosteam onlyrdquo For Run 5 an additional cylinder was used to apply a 70 psi static head pressure on the water column a 10 psi differential over the 60 psi air line pressure
5 Variable High Speed Test On November 26 2010 Run 5 tested the higher differential water pressure as a means to increase the effective water fraction in the propellant mix The test commenced with a full air cylinder weighing 654 Kg At the end of the test the empty cylinder weighed 472 Kg Run 5 was interrupted after 243 minutes to refill the water tank and then testing resumed for an additional 907 minutes Over the whole test 027 Kg of propane was consumed
Using the same analytical basis as Test 3 Test 5 data indicate a substantial increase in work capacity (as measured by fuel consumed and steam generated) over the 3 baseline
FEDERAL TRANSIT ADMINISTRATION 29
112610 - 5 Variable High Speed Run Air Pressure 60 psi Water Head Pressure 70 psi
Air (Wt 000Kg)
Component(BTU) Start End Net Energy1
(BTU) Power
(BTUmin) Power (HP) Efficiency3
654 472 182 849 718 17 7
SECTION 4 BRASH TEST PLAN
Table 3 Comparison of Mass Flows
Water 588 Runs 3 and 5
163 Duration (mn) 725 1180 725 1180 163
Air
Component Run 3 BHP
Run 5 BHP
Net ChngBHP
Run 5 Mass
Transfer (kg)
Net ChangeMass
Transfer (kg)
30 17
197
237
-45 2010 182 -9
Run 3 Mass
Transfer (kg)
276 350
47
86
422
0060
0013
0270
0086
Propane
This difference in steam fraction and power is more clearly seen in Figure 30 (and on the source video at the Brash Engines website)
Figure 30 Three Images from Run 5
Table 2 Test 5 Results with Increased
Water and Fuel Water2
(Wt 000Kg) 0860 9890 8358 197 83
Propane(Wt 000Kg) 1520 1493 27 11880 1004 237 90
Time (hrmnsc) 133000 134150 01150 na na na na
1 Energy value based upon absorbed heat (italics) from STP to 1000degK (0446 BTUg for Air 115 BTUg water) Underlined value is released heat at generally accepted 44 BTUg 2 Determined by difference from propane and air Energy assumed value 90 3 Arbitrary estimated efficiency of heat transfer not effective work
The increase in pressure on the water column by 10 psi reduced air flow by 9 percent but increased the steam fraction considerably and thereby increased the effective boiler horsepower nearly three-fold to 237 bhp (assuming 90 heat transfer) These data are summarized in Table 3
FEDERAL TRANSIT ADMINISTRATION 30
SECTION 4 BRASH TEST PLAN
As with Run 3 start up from Time Zero was immediate burner on air flow begins and water flow under pressure commences immediately Another impressive feature of the mix air-steam propellant system is the ability to start stop and rapidly accelerate as shown in the full Run 5 video Run 5 serves as validation that this patented technology has unique performance benefits over air steam or internal combustion alone
Lessons Learned A comparison of the two test runs verifies some key points
1 The same power plant can produce variable power and fuel economy based upon power demand and airsteam mix
2 Although imprecise at this point in testing fuel consumption appears directly proportional to engine speed The engineexpander will spool up spool down stop and restart in a manner consistent with fuel and propellant flow The Run 5 video on the Brash Engines website verifies this conclusion
3 The use of a defined static air pressure ldquoheadrdquo over the water column at a pressure higher than the defined air line dynamic pressure provides a safe and predictable bias toward flow from the water fraction
4 Although the current test configuration offers sufficient performance for this initial demonstration phase the following observations are in order
a The heater path is too long creating latent response issues
b The airwater injector is not optimized for proper mix or flow capacity
c The incomplete integration of LabVIEW compromises the quality of data
d The absence of a measured variable load on the expander compromises any analysis of power and fuel economy
5 The design migration to a vehicle installation was premature The project should move back to a lab bench study to refine the regulation of components complete the recovery and recompression portions of the system and use electromechanical loads to estimate power and useful work for specific quantities of fuel water and air
6 The Quasiturbinetrade engine technology is promising but too immature for larger-scale modeling Later phases of the project should rely on more conventional multi-cylinder piston-type expander
Estimated Fuel Economy Mass transit authorities have relied on large diesel engines such as the Detroit Diesel Series 50 and Series 60 engines for more than 30 years Reports on fuel economy vary from a high of 60 miles per gallon (Diesel) for longer-range
FEDERAL TRANSIT ADMINISTRATION 31
SECTION 4 BRASH TEST PLAN
commuter services in California23 to a low of 228 miles per gallon (Diesel) for city buses with frequent stops in New York City24 In both cited studies the migration to compressed natural gas (CNG) has resulted in lower fuel economies on a Diesel Gallon Equivalent (DGE) basis
Table 4 summarizes this study (columns 2 and 3) and the next proposed phase (columns 4 and 5) the performance of the current fleet of mass transit buses (columns 6 and 7) and the likely outcome if the Besler engine (described earlier) were employed with the air-steam hybrid technology (columns 8 and 9)
Table 4 Comparison of
Fuel Economies
Air
1
Configuration
Engine
HP
Torque
Fuel
gmin
BTUhr
GGEhr
mpg 60mph
GGE100 mi
$ per GGE
$100 mi
Current
Example
2
3
3
5
4
Bench
5
S-10
6
SB Bus
7
NYCT
8
50 eff
9
30 eff
86
Quasi
2
Prop
82
216
02
3160
03
30
09
Current
237
Quasi
2
Prop
23
607
05
1126
09
30
27
UC 1
40
6 cyl
20
Prop
40
1056
09
648
15
30
46
UC 2
80
6 cyl
40
Mix
80
2112
19
324
31
30
93
MCI102
DD S60
350
1450
Diesel
540
11400
100
60
167
35
583
Diesel
23
439
35
1535
300
Besler
150
1200
Mix
300
792
695
864
1158
16
1853
500
Besler
150
1200
Mix
500
1320
1158
518
1930
16
3088
The Besler engine is shown in two columns The left column reflects the higher efficiency anticipated with the air-steam hybrid mix described earlier as at or near 50 percent The right column reflects the historical efficiency realized with steam engine technology The italicized numbers near the bottom of the column show that even at historical efficiencies the Besler engine would offer equal or better Gasoline Gallon Equivalent (GGE)100 mile ratings of the current diesel technology but migrating toward less refined and (therefore) less expensive fuels would significantly reduce the operating cost ($mile)
23Demonstration of Caterpillar C-10 Dual-Fuel Engines in MCI 102DL3 Commuter Buses National Renewable Energy Laboratory httpwwwnrelgovdocsfy00osti26758pdf p 7 24R Barnitt ldquoNew York City Transit (NYCT) Hybrid (125 Order) and CNG Transit Buses Final Evaluation Resultsrdquo November 2006 National Renewable Energy Laboratory K Chandler Battelle Technical Report NRELTP-540-40125 November 2006 httpwwwnrelgovvehiclesandfuelsfleettestpdfs40125pdf pvii
FEDERAL TRANSIT ADMINISTRATION 32
SECTION 4 BRASH TEST PLAN
There are of course two orders of magnitude difference between the results of Runs 3 and 5 and the daily demands of city and commuter buses but the mere existence of the Besler Twin and the Brooks V-8 400 HP engine suggests an opportunity for fuel economy and fuel variety
Proposed further support for the next phase of development will advance the air-steam hybrid technology by an important order of magnitude This would provide the data confidence to scale to larger vehicle operation and garner the interest of one or more engine or vehicle OEMs
Figure 31 MTANew York City
Transit Orion VII Next Generation
Hybrid Transit Bus
Next Development Phase The next phase of development will incorporate a modern six-cylinder steam engine design with a displacement of 53 cubic inches and capable of sustained 15-25 HP operation The expander will be supplied by Steam Engine Power Inc (httpwwwsteamenginepowercom) This expander will drive an alternator generator to measure effective work output in watts as well as provide sufficient power to satisfy the system parasitic loads of battery recharge exhaust air recompression and all other pump and valve operations
Figure 32 (l to r) Six-Cylinder Expander Power Generation Load
Small 24 VDC Compressor
FEDERAL TRANSIT ADMINISTRATION 33
SECTION 4 BRASH TEST PLAN
Static pressure for the water column will still be supplied via compressed air cylinder but the dynamic air flow will be supplied by an oil-less air compressor of the size and type shown This 24 VDC compressor will recompress the recovered air exiting the expander to 40ndash60 psi pressure and support flows of 3ndash4 cubic feet per minute (cfm) These three components are off-the-shelf enhancements to the system but custom engineering of a new more powerful and more responsive heater completion of the electronic integration and design and fabrication of the recoveryrecompression components are necessary tasks that must be included to make the next generation assembly work to its potential This work will be accomplished largely by Mechanical and Electrical Engineering students at the University of Connecticut under the supervision of faculty and Brash Engines personnel
When this build is complete all operations will be under LabVIEW control All expander operations will be measured for power and work Once the bench version is in control a modified version will be installed in a small pickup truck (eg Chevrolet S-10) for further verification of system performance and robustness
During this phase a new and promising technology will be investigated a new and faster class of solenoid valves from National Instruments These solenoid valves with an unprecedented 3 msec response time have the potential of allowing air-steam retrofit in existing engine blocks The solenoid valves could replace the spark plugs in conventional IC engines and provide the equivalent timed injection of hot propellant mix as the timed firing of a spark plug in the presence of a fuel air mix
If possible these fast solenoids and the black box programming to control them could allow very easy portability to larger vehicles and easier retrofit Potentially a V-6 engine could operate 4 cylinders for expansion and the remaining two cylinders could be used as direct drive compressors with different but equivalent solenoid valves controlling the compression process
FEDERAL TRANSIT ADMINISTRATION 34
SECTION Development Plan 5 and Next Steps
This current effort is a key first-proof of concept for this air-steam hybrid technology but our goals extend well beyond this two-seat 2 HP demonstrator The lessons learned in electronic integration will allow rapid migration to larger platforms using the same basic controls but scaling the expander heater and other mass-flow components to vehicle-appropriate size That project identified as ldquo20 HP Vehiclerdquo and other near-term derivative projects are listed in Table 5
BRASH Project
ProposedFunding Source
Funds Reqd $K Project Description
SUV-size proof-of-concept for reliable 20 HP Vehicle DOTUSPS 300 highway performance maildelivery
vehicle size
Proof-of-concept mass transit busshy200 HP Vehicle DOTDOD 600 retrofit scaled to city bus capacity and
suitable for replacement of over-the-road diesel engines
Table 5 Project Funding
Stationary Power Unit Micro-CHP Equivalent
DARPA 300 Proof-of-concept mass transit bus-retrofit scaled to city bus capacity and suitable for replacement of over-the-road diesel engines
Summary Alternative Processed Solid Fuel DOE EPA DOA 600
Processed mix of hydrolyzed wood pulp processed solid waste and other combustible solids in an extrudable mass with alcohol solutevehiclemdashdemonstrate utility in vehicles as a high energy content clean burning fuel for EC engines
Demonstrate effective pyrolysis of
Binary Solid Gas Fuel
EPA Waste Management BFI
400 processed solid fuels in a binary fuel burner conventional fuel (gasoline natural gas) provides primary heat source for pyrolysis temperatures
Proof of Concept OEM Power Plant
Vehicle OEM (eg Ford GM Caterpillar) 1200
Development of direct replacement BRASH engine alternative to existing OEM IC engine
Black Box Integration of Controller Software
Vehicle OEM (eg Ford GM Caterpillar)
1600 Development of commercial BRASH system alternative to existing OEM IC engine
FEDERAL TRANSIT ADMINISTRATION 35
SECTION 5 DEVELOPMENT PLAN AND NEXT STEPS
The issuance of US Patent 7743872 five months ago has two important consequences for this project First it serves to validate the underlying technology the combination of air and steam in an EC engine is better than steam or air alone Second it provides a basis for full and open discussions with government agencies and large commercial interests in the transportation and power sectors
Our efforts at promotion have been delayed pending successful demonstration of the Smarttrade car vehicle to allow the first detailed real-world performance data to be distributed
Coupling that performance data with the option of migration away from refined petroleum should spark significant interest If we can move to a high lignin-processed wood pulp that costs $045 per gasoline gallon equivalent (an arbitrary value for example only) and consumes more CO2 while growing than is consumed in processing as a fuel and produced from combustion then we succeed as a project and as a global game-changing technology for many uses Improvements in fuel economy are important but of greater importance is the migration to low-process biomass fuels
FEDERAL TRANSIT ADMINISTRATION 36
SECTION Potential Applications and Societal Value 6 The whole premise behind the BRASH air steam hybrid is that external combustion offers a more benign and environmentally-appropriate way to power large vehicles and other portable equipment than refined petroleum-powered internal combustion
bullCombustion heat can be derived from any fuel source including processed solids from fast-growing renewables such as poplar trees waste corn stalks or switch grass
bullThat combustion heat is applied at a rate consistent with the work to be done and not to support idling and other unproductive fuel use
Using a mix of air and steam as working fluids in the engine allows
bullImmediate startup from an ldquoair-onlyrdquo start
bull Managed system pressure through use of a defined head air pressure
bullManaged fuel burn as the air-steam fraction is adjusted to match wheel load
bullAdjusted wheel load reduces fuel burn
Integration of modern control circuitry with external combustion also brings a level of performance operational simplicity and safety heretofore unavailable
FEDERAL TRANSIT ADMINISTRATION 37
SECTION
7 Phase I Conclusions
The last steam train in scheduled service in the US departed on October 11 196225 One year earlier Robert Noyce received the first patent for an integrated circuit26 But for that brief one-year overlap the most powerful motive power technology was never harnessed by the black box controls that grew out of Noycersquos invention so the diesel-powered IC engine championed by Henry Ford won out
Now nearly 50 years later the modern IC engine cannot operate efficiently without the benefit of black box electronicsmdashbut that technology still presents intractable challenges of supply safety and environmental impact The air-steam hybrid technology may offer an alternative and a glimpse of that potential is presented here and viewable in Run 5 on the Brash Engines website at http wwwbrashenginescom
While demonstration in a test vehicle provides a strong visual message that BRASH technology works the commercial success of this technology will depend upon reliable repeatable measurement of power and economy For that data the Phase 2 effort will require a return to laboratory bench testing and effective demonstration of recovery of the water and air fractions
The results of this Phase I project collectively demonstrate the technical feasibility and commercial potential of the BRASH air-steam hybrid engine technology The initial DOT SBIR funding has been highly effective in facilitating this important proof of concept and laying the groundwork for further technology refinement and application
As described earlier the next steps are clear and appear to combine achievable and rapid major advances with low developmental risk SBIR Phase 2 support is needed for those advances due to the still-early stage of development that restricts access to private capital
The immense potential value of this technology has been enhanced and verified in Phase 1 there is now a clear and low-risk path ahead to larger-scale testing further component and controls refinement specific applications prototyping and pre-commercial deployments
25William Rosen The Most Powerful Idea in the World Random House 2010 p 311 26US Patent 2981877
FEDERAL TRANSIT ADMINISTRATION 38
APPENDIX
A Heat Transfer Efficiency Modeling Runs 3 and 5 50 and 90
Much of the analysis for Runs 3 and 5 is based on an assumed efficiency of 90 for heat transfer from the combustion of propane to heating of the water air mix in the coil As a test for the reasonableness of that assumption the same data have been modeled at a much lower 50 factor below
112210 - 3 Low Speed Run Air Pressure 60 psi Water head pressure 60 psi
Water2 00440 5060 4276 101 43 (Wt 000Kg)
Propane 152 1493 237 50 27 11880 1004 (Wt 000Kg)
Time 133000 134150 01150 na na na na (hrmnsc)
1 Energy value based upon absorbed heat (italics) from STP to 1000degK (0446 BTUg for Air 115 BTUg water) Underlined value is released heat at generally accepted 44 BTUg
Air (Wt 000Kg)
Component(BTU) Start Wt End Wt Net Wt Energy1
(BTU) Power
(BTUmin) Power (HP) Efficiency3
661 460 201 938 1294 30 36
Water2
(Wt 000Kg)
Propane(Wt 000Kg)
Time (hrmnsc)
1562
123000
1556
123715
00125
006
00715
380
2640
na
523
364
na
12
86
14
50
na na
Air (Wt 000Kg)
Component(BTU) Start Wt
5 Variable High Speed Run Air Pressure 60 psi Water head pressure 70 psi
End Wt Net Wt Energy1
(BTU) Power
(BTUmin) Power (HP) Efficiency3
654 472 182 849 718 17 7
2 Determined by difference from Propane and Air Energy assumed value 90 3 Arbitrary estimated efficiency of heat transfer not effective work
The two known quantities in each run is the weight of the air moving through the system and the weight of the propane heating that air The variable is the quantity of water heated to steam temperatures and above In Run 3 at 90 efficiency that mass of water calculates to 125 grams at 50 it drops to 33 grams In Run 5 at 90 efficiency that mass of water calculates to 86 grams at 50 it drops to 44 grams
FEDERAL TRANSIT ADMINISTRATION 39
APPENDIX A HEAT TRANSFER EFFICIENCY MODELING RUNS 3 AND 5 50 AND 90
As the comparison tables below show the uncertainty in the efficiency of heat transfer is manifest only in the mass of water heated to steam to do useful work
Data 90 Efficiency
Air
Component Run 3 BHP
Run 5 BHP
Net ChngBHP
-45
Run 3 Mass
Transfer (kg)
Run 5 Mass
Transfer (kg)
Net ChangeMass
Transfer (kg)
30 17
197
237
2010 182 -9
Water
Propane
Duration (mn)
47
86
725
422
0060
0013
725
0270
0086
1180
588
350
163 1180
276
163
Data 50 Efficiency
Air
Component Run 3 BHP
Run 5 BHP
Net ChngBHP
-45
Run 3 Mass
Transfer (kg)
Run 5 Mass
Transfer (kg)
Net ChangeMass
Transfer (kg)
30 17
101
237
2010 182 -9
Water
Propane
Duration (mn)
12
86
725
817
0060
0003
725
0270
0044
1180
1233
350
163 1180
276
163
Regardless of the specific efficiency Run3 reflects an air-rich propellant mix while Run 5 was clearly the more powerful and steam-rich propellant If 50 efficiency is a more realistic figure than 90 the only consequence is more water passing through the heater expander and recovery tank The only consequence for overall system efficiency is the slight but added work required to move the additional water by pump to the top of the water column
FEDERAL TRANSIT ADMINISTRATION 40
APPENDIX Acronyms B
BHP Boiler Horsepower
BRASH Binary Recovery Air-Steam Hybrid
BTU British Thermal Unit
CC Cubic centimeter
CFM Cubit feet per minute
CHP Combined heat and power
CNG Compressed natural gas
CO2 Carbon dioxide
CU Cubic
DARPA Defense Advanced Research Projects Agency
DGE Diesel gallon equivalent
DOT Department of Transportation
EC External combustion
EIA Energy Information Administration
EPA Environmental Protection Agency
FTA Federal Transit Administration
GGE Gasoline gallon equivalent
HP Horsepower
IC Internal combustion
K Kelvin
Kcal Kilocalorie
MPG Miles per gallon
MPH Miles per hour
OEM Original equipment manufacturer
PSI Pounds per square inch
RPM Revolutions per minute
SBIR Small Business Innovation Research
STP Standard temperature and pressure
FEDERAL TRANSIT ADMINISTRATION 41
FEDERAL TRANSIT ADMINISTRATION 128
US Department of TransportationFederal Transit AdministrationEast Building1200 New Jersey Avenue SEWashington DC 20590httpwwwftadotgovresearch
US Department of Transportation Federal Transit Administration East Building 1200 New Jersey Avenue SE Washington DC 20590 httpwwwftadotgovresearch
FEDERAL TRANSIT ADMINISTRATION 42
- Button1
- Button2
- Button3
- Button4
- Button5
- Button6
- Button7
- Button8
- Button9
- Button10
- Button11
- Button12
- Button13
- Button14
- Button15
- Button16
- Button17
- Button18
- Button19
- Button20
- Button21
- Button22
- Button23
- Button24
- Button25
- Button26
- Button27
- Button28
- Button29
- Button30
- Button31
- Button32
- Button33
- Button34
- Button35
- Button36
- Button37
- Button38
- Button39
- Button40
- Button41
- Button42
- Button43
- Button44
- Button45
- Button46
- Button47
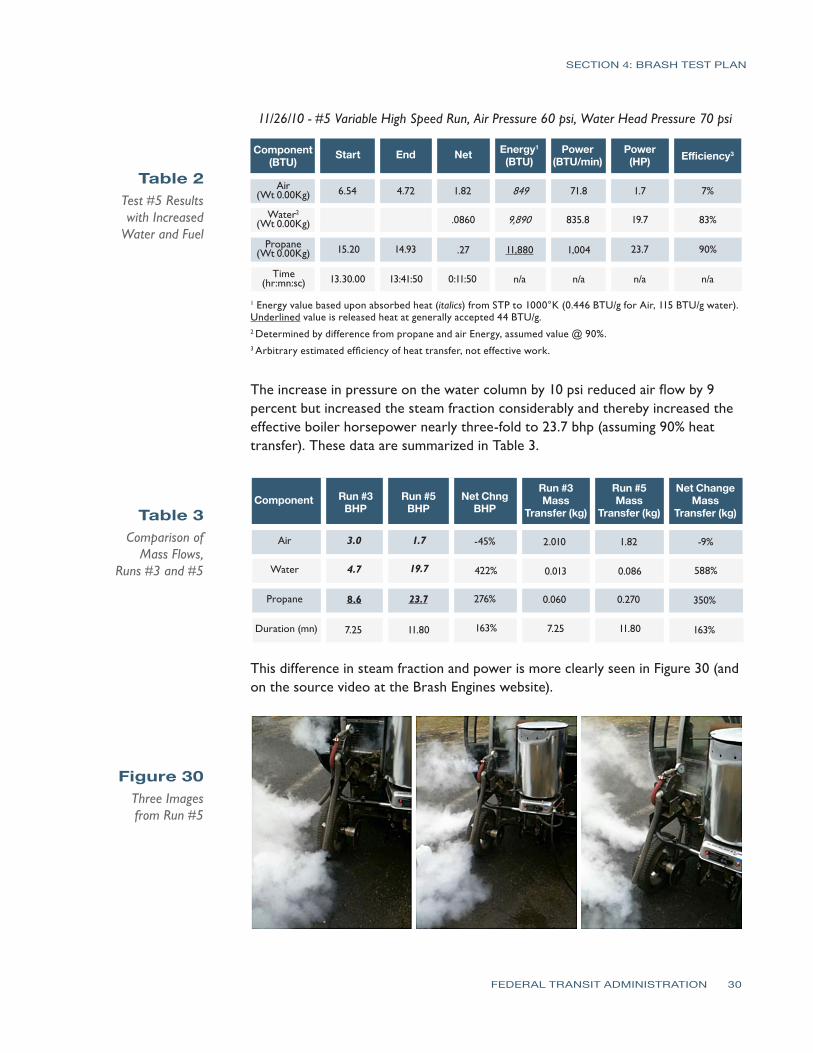
SECTION 4 BRASH TEST PLAN
As with Run 3 start up from Time Zero was immediate burner on air flow begins and water flow under pressure commences immediately Another impressive feature of the mix air-steam propellant system is the ability to start stop and rapidly accelerate as shown in the full Run 5 video Run 5 serves as validation that this patented technology has unique performance benefits over air steam or internal combustion alone
Lessons Learned A comparison of the two test runs verifies some key points
1 The same power plant can produce variable power and fuel economy based upon power demand and airsteam mix
2 Although imprecise at this point in testing fuel consumption appears directly proportional to engine speed The engineexpander will spool up spool down stop and restart in a manner consistent with fuel and propellant flow The Run 5 video on the Brash Engines website verifies this conclusion
3 The use of a defined static air pressure ldquoheadrdquo over the water column at a pressure higher than the defined air line dynamic pressure provides a safe and predictable bias toward flow from the water fraction
4 Although the current test configuration offers sufficient performance for this initial demonstration phase the following observations are in order
a The heater path is too long creating latent response issues
b The airwater injector is not optimized for proper mix or flow capacity
c The incomplete integration of LabVIEW compromises the quality of data
d The absence of a measured variable load on the expander compromises any analysis of power and fuel economy
5 The design migration to a vehicle installation was premature The project should move back to a lab bench study to refine the regulation of components complete the recovery and recompression portions of the system and use electromechanical loads to estimate power and useful work for specific quantities of fuel water and air
6 The Quasiturbinetrade engine technology is promising but too immature for larger-scale modeling Later phases of the project should rely on more conventional multi-cylinder piston-type expander
Estimated Fuel Economy Mass transit authorities have relied on large diesel engines such as the Detroit Diesel Series 50 and Series 60 engines for more than 30 years Reports on fuel economy vary from a high of 60 miles per gallon (Diesel) for longer-range
FEDERAL TRANSIT ADMINISTRATION 31
SECTION 4 BRASH TEST PLAN
commuter services in California23 to a low of 228 miles per gallon (Diesel) for city buses with frequent stops in New York City24 In both cited studies the migration to compressed natural gas (CNG) has resulted in lower fuel economies on a Diesel Gallon Equivalent (DGE) basis
Table 4 summarizes this study (columns 2 and 3) and the next proposed phase (columns 4 and 5) the performance of the current fleet of mass transit buses (columns 6 and 7) and the likely outcome if the Besler engine (described earlier) were employed with the air-steam hybrid technology (columns 8 and 9)
Table 4 Comparison of
Fuel Economies
Air
1
Configuration
Engine
HP
Torque
Fuel
gmin
BTUhr
GGEhr
mpg 60mph
GGE100 mi
$ per GGE
$100 mi
Current
Example
2
3
3
5
4
Bench
5
S-10
6
SB Bus
7
NYCT
8
50 eff
9
30 eff
86
Quasi
2
Prop
82
216
02
3160
03
30
09
Current
237
Quasi
2
Prop
23
607
05
1126
09
30
27
UC 1
40
6 cyl
20
Prop
40
1056
09
648
15
30
46
UC 2
80
6 cyl
40
Mix
80
2112
19
324
31
30
93
MCI102
DD S60
350
1450
Diesel
540
11400
100
60
167
35
583
Diesel
23
439
35
1535
300
Besler
150
1200
Mix
300
792
695
864
1158
16
1853
500
Besler
150
1200
Mix
500
1320
1158
518
1930
16
3088
The Besler engine is shown in two columns The left column reflects the higher efficiency anticipated with the air-steam hybrid mix described earlier as at or near 50 percent The right column reflects the historical efficiency realized with steam engine technology The italicized numbers near the bottom of the column show that even at historical efficiencies the Besler engine would offer equal or better Gasoline Gallon Equivalent (GGE)100 mile ratings of the current diesel technology but migrating toward less refined and (therefore) less expensive fuels would significantly reduce the operating cost ($mile)
23Demonstration of Caterpillar C-10 Dual-Fuel Engines in MCI 102DL3 Commuter Buses National Renewable Energy Laboratory httpwwwnrelgovdocsfy00osti26758pdf p 7 24R Barnitt ldquoNew York City Transit (NYCT) Hybrid (125 Order) and CNG Transit Buses Final Evaluation Resultsrdquo November 2006 National Renewable Energy Laboratory K Chandler Battelle Technical Report NRELTP-540-40125 November 2006 httpwwwnrelgovvehiclesandfuelsfleettestpdfs40125pdf pvii
FEDERAL TRANSIT ADMINISTRATION 32
SECTION 4 BRASH TEST PLAN
There are of course two orders of magnitude difference between the results of Runs 3 and 5 and the daily demands of city and commuter buses but the mere existence of the Besler Twin and the Brooks V-8 400 HP engine suggests an opportunity for fuel economy and fuel variety
Proposed further support for the next phase of development will advance the air-steam hybrid technology by an important order of magnitude This would provide the data confidence to scale to larger vehicle operation and garner the interest of one or more engine or vehicle OEMs
Figure 31 MTANew York City
Transit Orion VII Next Generation
Hybrid Transit Bus
Next Development Phase The next phase of development will incorporate a modern six-cylinder steam engine design with a displacement of 53 cubic inches and capable of sustained 15-25 HP operation The expander will be supplied by Steam Engine Power Inc (httpwwwsteamenginepowercom) This expander will drive an alternator generator to measure effective work output in watts as well as provide sufficient power to satisfy the system parasitic loads of battery recharge exhaust air recompression and all other pump and valve operations
Figure 32 (l to r) Six-Cylinder Expander Power Generation Load
Small 24 VDC Compressor
FEDERAL TRANSIT ADMINISTRATION 33
SECTION 4 BRASH TEST PLAN
Static pressure for the water column will still be supplied via compressed air cylinder but the dynamic air flow will be supplied by an oil-less air compressor of the size and type shown This 24 VDC compressor will recompress the recovered air exiting the expander to 40ndash60 psi pressure and support flows of 3ndash4 cubic feet per minute (cfm) These three components are off-the-shelf enhancements to the system but custom engineering of a new more powerful and more responsive heater completion of the electronic integration and design and fabrication of the recoveryrecompression components are necessary tasks that must be included to make the next generation assembly work to its potential This work will be accomplished largely by Mechanical and Electrical Engineering students at the University of Connecticut under the supervision of faculty and Brash Engines personnel
When this build is complete all operations will be under LabVIEW control All expander operations will be measured for power and work Once the bench version is in control a modified version will be installed in a small pickup truck (eg Chevrolet S-10) for further verification of system performance and robustness
During this phase a new and promising technology will be investigated a new and faster class of solenoid valves from National Instruments These solenoid valves with an unprecedented 3 msec response time have the potential of allowing air-steam retrofit in existing engine blocks The solenoid valves could replace the spark plugs in conventional IC engines and provide the equivalent timed injection of hot propellant mix as the timed firing of a spark plug in the presence of a fuel air mix
If possible these fast solenoids and the black box programming to control them could allow very easy portability to larger vehicles and easier retrofit Potentially a V-6 engine could operate 4 cylinders for expansion and the remaining two cylinders could be used as direct drive compressors with different but equivalent solenoid valves controlling the compression process
FEDERAL TRANSIT ADMINISTRATION 34
SECTION Development Plan 5 and Next Steps
This current effort is a key first-proof of concept for this air-steam hybrid technology but our goals extend well beyond this two-seat 2 HP demonstrator The lessons learned in electronic integration will allow rapid migration to larger platforms using the same basic controls but scaling the expander heater and other mass-flow components to vehicle-appropriate size That project identified as ldquo20 HP Vehiclerdquo and other near-term derivative projects are listed in Table 5
BRASH Project
ProposedFunding Source
Funds Reqd $K Project Description
SUV-size proof-of-concept for reliable 20 HP Vehicle DOTUSPS 300 highway performance maildelivery
vehicle size
Proof-of-concept mass transit busshy200 HP Vehicle DOTDOD 600 retrofit scaled to city bus capacity and
suitable for replacement of over-the-road diesel engines
Table 5 Project Funding
Stationary Power Unit Micro-CHP Equivalent
DARPA 300 Proof-of-concept mass transit bus-retrofit scaled to city bus capacity and suitable for replacement of over-the-road diesel engines
Summary Alternative Processed Solid Fuel DOE EPA DOA 600
Processed mix of hydrolyzed wood pulp processed solid waste and other combustible solids in an extrudable mass with alcohol solutevehiclemdashdemonstrate utility in vehicles as a high energy content clean burning fuel for EC engines
Demonstrate effective pyrolysis of
Binary Solid Gas Fuel
EPA Waste Management BFI
400 processed solid fuels in a binary fuel burner conventional fuel (gasoline natural gas) provides primary heat source for pyrolysis temperatures
Proof of Concept OEM Power Plant
Vehicle OEM (eg Ford GM Caterpillar) 1200
Development of direct replacement BRASH engine alternative to existing OEM IC engine
Black Box Integration of Controller Software
Vehicle OEM (eg Ford GM Caterpillar)
1600 Development of commercial BRASH system alternative to existing OEM IC engine
FEDERAL TRANSIT ADMINISTRATION 35
SECTION 5 DEVELOPMENT PLAN AND NEXT STEPS
The issuance of US Patent 7743872 five months ago has two important consequences for this project First it serves to validate the underlying technology the combination of air and steam in an EC engine is better than steam or air alone Second it provides a basis for full and open discussions with government agencies and large commercial interests in the transportation and power sectors
Our efforts at promotion have been delayed pending successful demonstration of the Smarttrade car vehicle to allow the first detailed real-world performance data to be distributed
Coupling that performance data with the option of migration away from refined petroleum should spark significant interest If we can move to a high lignin-processed wood pulp that costs $045 per gasoline gallon equivalent (an arbitrary value for example only) and consumes more CO2 while growing than is consumed in processing as a fuel and produced from combustion then we succeed as a project and as a global game-changing technology for many uses Improvements in fuel economy are important but of greater importance is the migration to low-process biomass fuels
FEDERAL TRANSIT ADMINISTRATION 36
SECTION Potential Applications and Societal Value 6 The whole premise behind the BRASH air steam hybrid is that external combustion offers a more benign and environmentally-appropriate way to power large vehicles and other portable equipment than refined petroleum-powered internal combustion
bullCombustion heat can be derived from any fuel source including processed solids from fast-growing renewables such as poplar trees waste corn stalks or switch grass
bullThat combustion heat is applied at a rate consistent with the work to be done and not to support idling and other unproductive fuel use
Using a mix of air and steam as working fluids in the engine allows
bullImmediate startup from an ldquoair-onlyrdquo start
bull Managed system pressure through use of a defined head air pressure
bullManaged fuel burn as the air-steam fraction is adjusted to match wheel load
bullAdjusted wheel load reduces fuel burn
Integration of modern control circuitry with external combustion also brings a level of performance operational simplicity and safety heretofore unavailable
FEDERAL TRANSIT ADMINISTRATION 37
SECTION
7 Phase I Conclusions
The last steam train in scheduled service in the US departed on October 11 196225 One year earlier Robert Noyce received the first patent for an integrated circuit26 But for that brief one-year overlap the most powerful motive power technology was never harnessed by the black box controls that grew out of Noycersquos invention so the diesel-powered IC engine championed by Henry Ford won out
Now nearly 50 years later the modern IC engine cannot operate efficiently without the benefit of black box electronicsmdashbut that technology still presents intractable challenges of supply safety and environmental impact The air-steam hybrid technology may offer an alternative and a glimpse of that potential is presented here and viewable in Run 5 on the Brash Engines website at http wwwbrashenginescom
While demonstration in a test vehicle provides a strong visual message that BRASH technology works the commercial success of this technology will depend upon reliable repeatable measurement of power and economy For that data the Phase 2 effort will require a return to laboratory bench testing and effective demonstration of recovery of the water and air fractions
The results of this Phase I project collectively demonstrate the technical feasibility and commercial potential of the BRASH air-steam hybrid engine technology The initial DOT SBIR funding has been highly effective in facilitating this important proof of concept and laying the groundwork for further technology refinement and application
As described earlier the next steps are clear and appear to combine achievable and rapid major advances with low developmental risk SBIR Phase 2 support is needed for those advances due to the still-early stage of development that restricts access to private capital
The immense potential value of this technology has been enhanced and verified in Phase 1 there is now a clear and low-risk path ahead to larger-scale testing further component and controls refinement specific applications prototyping and pre-commercial deployments
25William Rosen The Most Powerful Idea in the World Random House 2010 p 311 26US Patent 2981877
FEDERAL TRANSIT ADMINISTRATION 38
APPENDIX
A Heat Transfer Efficiency Modeling Runs 3 and 5 50 and 90
Much of the analysis for Runs 3 and 5 is based on an assumed efficiency of 90 for heat transfer from the combustion of propane to heating of the water air mix in the coil As a test for the reasonableness of that assumption the same data have been modeled at a much lower 50 factor below
112210 - 3 Low Speed Run Air Pressure 60 psi Water head pressure 60 psi
Water2 00440 5060 4276 101 43 (Wt 000Kg)
Propane 152 1493 237 50 27 11880 1004 (Wt 000Kg)
Time 133000 134150 01150 na na na na (hrmnsc)
1 Energy value based upon absorbed heat (italics) from STP to 1000degK (0446 BTUg for Air 115 BTUg water) Underlined value is released heat at generally accepted 44 BTUg
Air (Wt 000Kg)
Component(BTU) Start Wt End Wt Net Wt Energy1
(BTU) Power
(BTUmin) Power (HP) Efficiency3
661 460 201 938 1294 30 36
Water2
(Wt 000Kg)
Propane(Wt 000Kg)
Time (hrmnsc)
1562
123000
1556
123715
00125
006
00715
380
2640
na
523
364
na
12
86
14
50
na na
Air (Wt 000Kg)
Component(BTU) Start Wt
5 Variable High Speed Run Air Pressure 60 psi Water head pressure 70 psi
End Wt Net Wt Energy1
(BTU) Power
(BTUmin) Power (HP) Efficiency3
654 472 182 849 718 17 7
2 Determined by difference from Propane and Air Energy assumed value 90 3 Arbitrary estimated efficiency of heat transfer not effective work
The two known quantities in each run is the weight of the air moving through the system and the weight of the propane heating that air The variable is the quantity of water heated to steam temperatures and above In Run 3 at 90 efficiency that mass of water calculates to 125 grams at 50 it drops to 33 grams In Run 5 at 90 efficiency that mass of water calculates to 86 grams at 50 it drops to 44 grams
FEDERAL TRANSIT ADMINISTRATION 39
APPENDIX A HEAT TRANSFER EFFICIENCY MODELING RUNS 3 AND 5 50 AND 90
As the comparison tables below show the uncertainty in the efficiency of heat transfer is manifest only in the mass of water heated to steam to do useful work
Data 90 Efficiency
Air
Component Run 3 BHP
Run 5 BHP
Net ChngBHP
-45
Run 3 Mass
Transfer (kg)
Run 5 Mass
Transfer (kg)
Net ChangeMass
Transfer (kg)
30 17
197
237
2010 182 -9
Water
Propane
Duration (mn)
47
86
725
422
0060
0013
725
0270
0086
1180
588
350
163 1180
276
163
Data 50 Efficiency
Air
Component Run 3 BHP
Run 5 BHP
Net ChngBHP
-45
Run 3 Mass
Transfer (kg)
Run 5 Mass
Transfer (kg)
Net ChangeMass
Transfer (kg)
30 17
101
237
2010 182 -9
Water
Propane
Duration (mn)
12
86
725
817
0060
0003
725
0270
0044
1180
1233
350
163 1180
276
163
Regardless of the specific efficiency Run3 reflects an air-rich propellant mix while Run 5 was clearly the more powerful and steam-rich propellant If 50 efficiency is a more realistic figure than 90 the only consequence is more water passing through the heater expander and recovery tank The only consequence for overall system efficiency is the slight but added work required to move the additional water by pump to the top of the water column
FEDERAL TRANSIT ADMINISTRATION 40
APPENDIX Acronyms B
BHP Boiler Horsepower
BRASH Binary Recovery Air-Steam Hybrid
BTU British Thermal Unit
CC Cubic centimeter
CFM Cubit feet per minute
CHP Combined heat and power
CNG Compressed natural gas
CO2 Carbon dioxide
CU Cubic
DARPA Defense Advanced Research Projects Agency
DGE Diesel gallon equivalent
DOT Department of Transportation
EC External combustion
EIA Energy Information Administration
EPA Environmental Protection Agency
FTA Federal Transit Administration
GGE Gasoline gallon equivalent
HP Horsepower
IC Internal combustion
K Kelvin
Kcal Kilocalorie
MPG Miles per gallon
MPH Miles per hour
OEM Original equipment manufacturer
PSI Pounds per square inch
RPM Revolutions per minute
SBIR Small Business Innovation Research
STP Standard temperature and pressure
FEDERAL TRANSIT ADMINISTRATION 41
FEDERAL TRANSIT ADMINISTRATION 128
US Department of TransportationFederal Transit AdministrationEast Building1200 New Jersey Avenue SEWashington DC 20590httpwwwftadotgovresearch
US Department of Transportation Federal Transit Administration East Building 1200 New Jersey Avenue SE Washington DC 20590 httpwwwftadotgovresearch
FEDERAL TRANSIT ADMINISTRATION 42
- Button1
- Button2
- Button3
- Button4
- Button5
- Button6
- Button7
- Button8
- Button9
- Button10
- Button11
- Button12
- Button13
- Button14
- Button15
- Button16
- Button17
- Button18
- Button19
- Button20
- Button21
- Button22
- Button23
- Button24
- Button25
- Button26
- Button27
- Button28
- Button29
- Button30
- Button31
- Button32
- Button33
- Button34
- Button35
- Button36
- Button37
- Button38
- Button39
- Button40
- Button41
- Button42
- Button43
- Button44
- Button45
- Button46
- Button47
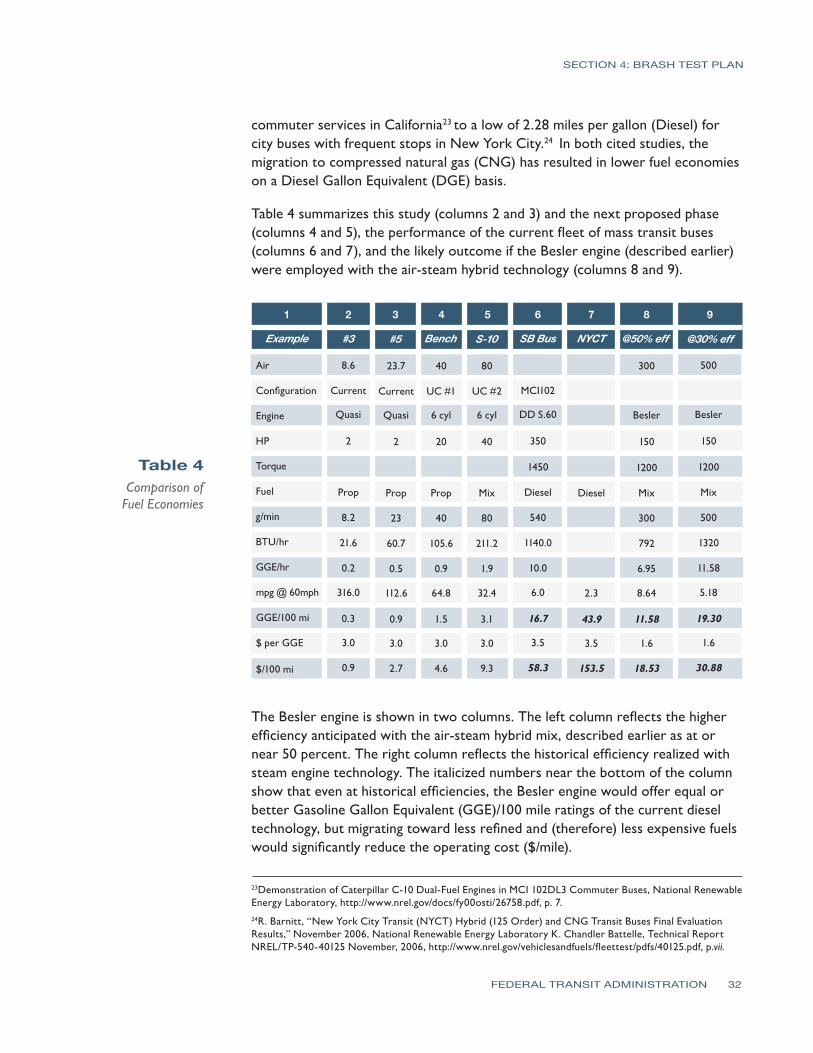
SECTION 4 BRASH TEST PLAN
commuter services in California23 to a low of 228 miles per gallon (Diesel) for city buses with frequent stops in New York City24 In both cited studies the migration to compressed natural gas (CNG) has resulted in lower fuel economies on a Diesel Gallon Equivalent (DGE) basis
Table 4 summarizes this study (columns 2 and 3) and the next proposed phase (columns 4 and 5) the performance of the current fleet of mass transit buses (columns 6 and 7) and the likely outcome if the Besler engine (described earlier) were employed with the air-steam hybrid technology (columns 8 and 9)
Table 4 Comparison of
Fuel Economies
Air
1
Configuration
Engine
HP
Torque
Fuel
gmin
BTUhr
GGEhr
mpg 60mph
GGE100 mi
$ per GGE
$100 mi
Current
Example
2
3
3
5
4
Bench
5
S-10
6
SB Bus
7
NYCT
8
50 eff
9
30 eff
86
Quasi
2
Prop
82
216
02
3160
03
30
09
Current
237
Quasi
2
Prop
23
607
05
1126
09
30
27
UC 1
40
6 cyl
20
Prop
40
1056
09
648
15
30
46
UC 2
80
6 cyl
40
Mix
80
2112
19
324
31
30
93
MCI102
DD S60
350
1450
Diesel
540
11400
100
60
167
35
583
Diesel
23
439
35
1535
300
Besler
150
1200
Mix
300
792
695
864
1158
16
1853
500
Besler
150
1200
Mix
500
1320
1158
518
1930
16
3088
The Besler engine is shown in two columns The left column reflects the higher efficiency anticipated with the air-steam hybrid mix described earlier as at or near 50 percent The right column reflects the historical efficiency realized with steam engine technology The italicized numbers near the bottom of the column show that even at historical efficiencies the Besler engine would offer equal or better Gasoline Gallon Equivalent (GGE)100 mile ratings of the current diesel technology but migrating toward less refined and (therefore) less expensive fuels would significantly reduce the operating cost ($mile)
23Demonstration of Caterpillar C-10 Dual-Fuel Engines in MCI 102DL3 Commuter Buses National Renewable Energy Laboratory httpwwwnrelgovdocsfy00osti26758pdf p 7 24R Barnitt ldquoNew York City Transit (NYCT) Hybrid (125 Order) and CNG Transit Buses Final Evaluation Resultsrdquo November 2006 National Renewable Energy Laboratory K Chandler Battelle Technical Report NRELTP-540-40125 November 2006 httpwwwnrelgovvehiclesandfuelsfleettestpdfs40125pdf pvii
FEDERAL TRANSIT ADMINISTRATION 32
SECTION 4 BRASH TEST PLAN
There are of course two orders of magnitude difference between the results of Runs 3 and 5 and the daily demands of city and commuter buses but the mere existence of the Besler Twin and the Brooks V-8 400 HP engine suggests an opportunity for fuel economy and fuel variety
Proposed further support for the next phase of development will advance the air-steam hybrid technology by an important order of magnitude This would provide the data confidence to scale to larger vehicle operation and garner the interest of one or more engine or vehicle OEMs
Figure 31 MTANew York City
Transit Orion VII Next Generation
Hybrid Transit Bus
Next Development Phase The next phase of development will incorporate a modern six-cylinder steam engine design with a displacement of 53 cubic inches and capable of sustained 15-25 HP operation The expander will be supplied by Steam Engine Power Inc (httpwwwsteamenginepowercom) This expander will drive an alternator generator to measure effective work output in watts as well as provide sufficient power to satisfy the system parasitic loads of battery recharge exhaust air recompression and all other pump and valve operations
Figure 32 (l to r) Six-Cylinder Expander Power Generation Load
Small 24 VDC Compressor
FEDERAL TRANSIT ADMINISTRATION 33
SECTION 4 BRASH TEST PLAN
Static pressure for the water column will still be supplied via compressed air cylinder but the dynamic air flow will be supplied by an oil-less air compressor of the size and type shown This 24 VDC compressor will recompress the recovered air exiting the expander to 40ndash60 psi pressure and support flows of 3ndash4 cubic feet per minute (cfm) These three components are off-the-shelf enhancements to the system but custom engineering of a new more powerful and more responsive heater completion of the electronic integration and design and fabrication of the recoveryrecompression components are necessary tasks that must be included to make the next generation assembly work to its potential This work will be accomplished largely by Mechanical and Electrical Engineering students at the University of Connecticut under the supervision of faculty and Brash Engines personnel
When this build is complete all operations will be under LabVIEW control All expander operations will be measured for power and work Once the bench version is in control a modified version will be installed in a small pickup truck (eg Chevrolet S-10) for further verification of system performance and robustness
During this phase a new and promising technology will be investigated a new and faster class of solenoid valves from National Instruments These solenoid valves with an unprecedented 3 msec response time have the potential of allowing air-steam retrofit in existing engine blocks The solenoid valves could replace the spark plugs in conventional IC engines and provide the equivalent timed injection of hot propellant mix as the timed firing of a spark plug in the presence of a fuel air mix
If possible these fast solenoids and the black box programming to control them could allow very easy portability to larger vehicles and easier retrofit Potentially a V-6 engine could operate 4 cylinders for expansion and the remaining two cylinders could be used as direct drive compressors with different but equivalent solenoid valves controlling the compression process
FEDERAL TRANSIT ADMINISTRATION 34
SECTION Development Plan 5 and Next Steps
This current effort is a key first-proof of concept for this air-steam hybrid technology but our goals extend well beyond this two-seat 2 HP demonstrator The lessons learned in electronic integration will allow rapid migration to larger platforms using the same basic controls but scaling the expander heater and other mass-flow components to vehicle-appropriate size That project identified as ldquo20 HP Vehiclerdquo and other near-term derivative projects are listed in Table 5
BRASH Project
ProposedFunding Source
Funds Reqd $K Project Description
SUV-size proof-of-concept for reliable 20 HP Vehicle DOTUSPS 300 highway performance maildelivery
vehicle size
Proof-of-concept mass transit busshy200 HP Vehicle DOTDOD 600 retrofit scaled to city bus capacity and
suitable for replacement of over-the-road diesel engines
Table 5 Project Funding
Stationary Power Unit Micro-CHP Equivalent
DARPA 300 Proof-of-concept mass transit bus-retrofit scaled to city bus capacity and suitable for replacement of over-the-road diesel engines
Summary Alternative Processed Solid Fuel DOE EPA DOA 600
Processed mix of hydrolyzed wood pulp processed solid waste and other combustible solids in an extrudable mass with alcohol solutevehiclemdashdemonstrate utility in vehicles as a high energy content clean burning fuel for EC engines
Demonstrate effective pyrolysis of
Binary Solid Gas Fuel
EPA Waste Management BFI
400 processed solid fuels in a binary fuel burner conventional fuel (gasoline natural gas) provides primary heat source for pyrolysis temperatures
Proof of Concept OEM Power Plant
Vehicle OEM (eg Ford GM Caterpillar) 1200
Development of direct replacement BRASH engine alternative to existing OEM IC engine
Black Box Integration of Controller Software
Vehicle OEM (eg Ford GM Caterpillar)
1600 Development of commercial BRASH system alternative to existing OEM IC engine
FEDERAL TRANSIT ADMINISTRATION 35
SECTION 5 DEVELOPMENT PLAN AND NEXT STEPS
The issuance of US Patent 7743872 five months ago has two important consequences for this project First it serves to validate the underlying technology the combination of air and steam in an EC engine is better than steam or air alone Second it provides a basis for full and open discussions with government agencies and large commercial interests in the transportation and power sectors
Our efforts at promotion have been delayed pending successful demonstration of the Smarttrade car vehicle to allow the first detailed real-world performance data to be distributed
Coupling that performance data with the option of migration away from refined petroleum should spark significant interest If we can move to a high lignin-processed wood pulp that costs $045 per gasoline gallon equivalent (an arbitrary value for example only) and consumes more CO2 while growing than is consumed in processing as a fuel and produced from combustion then we succeed as a project and as a global game-changing technology for many uses Improvements in fuel economy are important but of greater importance is the migration to low-process biomass fuels
FEDERAL TRANSIT ADMINISTRATION 36
SECTION Potential Applications and Societal Value 6 The whole premise behind the BRASH air steam hybrid is that external combustion offers a more benign and environmentally-appropriate way to power large vehicles and other portable equipment than refined petroleum-powered internal combustion
bullCombustion heat can be derived from any fuel source including processed solids from fast-growing renewables such as poplar trees waste corn stalks or switch grass
bullThat combustion heat is applied at a rate consistent with the work to be done and not to support idling and other unproductive fuel use
Using a mix of air and steam as working fluids in the engine allows
bullImmediate startup from an ldquoair-onlyrdquo start
bull Managed system pressure through use of a defined head air pressure
bullManaged fuel burn as the air-steam fraction is adjusted to match wheel load
bullAdjusted wheel load reduces fuel burn
Integration of modern control circuitry with external combustion also brings a level of performance operational simplicity and safety heretofore unavailable
FEDERAL TRANSIT ADMINISTRATION 37
SECTION
7 Phase I Conclusions
The last steam train in scheduled service in the US departed on October 11 196225 One year earlier Robert Noyce received the first patent for an integrated circuit26 But for that brief one-year overlap the most powerful motive power technology was never harnessed by the black box controls that grew out of Noycersquos invention so the diesel-powered IC engine championed by Henry Ford won out
Now nearly 50 years later the modern IC engine cannot operate efficiently without the benefit of black box electronicsmdashbut that technology still presents intractable challenges of supply safety and environmental impact The air-steam hybrid technology may offer an alternative and a glimpse of that potential is presented here and viewable in Run 5 on the Brash Engines website at http wwwbrashenginescom
While demonstration in a test vehicle provides a strong visual message that BRASH technology works the commercial success of this technology will depend upon reliable repeatable measurement of power and economy For that data the Phase 2 effort will require a return to laboratory bench testing and effective demonstration of recovery of the water and air fractions
The results of this Phase I project collectively demonstrate the technical feasibility and commercial potential of the BRASH air-steam hybrid engine technology The initial DOT SBIR funding has been highly effective in facilitating this important proof of concept and laying the groundwork for further technology refinement and application
As described earlier the next steps are clear and appear to combine achievable and rapid major advances with low developmental risk SBIR Phase 2 support is needed for those advances due to the still-early stage of development that restricts access to private capital
The immense potential value of this technology has been enhanced and verified in Phase 1 there is now a clear and low-risk path ahead to larger-scale testing further component and controls refinement specific applications prototyping and pre-commercial deployments
25William Rosen The Most Powerful Idea in the World Random House 2010 p 311 26US Patent 2981877
FEDERAL TRANSIT ADMINISTRATION 38
APPENDIX
A Heat Transfer Efficiency Modeling Runs 3 and 5 50 and 90
Much of the analysis for Runs 3 and 5 is based on an assumed efficiency of 90 for heat transfer from the combustion of propane to heating of the water air mix in the coil As a test for the reasonableness of that assumption the same data have been modeled at a much lower 50 factor below
112210 - 3 Low Speed Run Air Pressure 60 psi Water head pressure 60 psi
Water2 00440 5060 4276 101 43 (Wt 000Kg)
Propane 152 1493 237 50 27 11880 1004 (Wt 000Kg)
Time 133000 134150 01150 na na na na (hrmnsc)
1 Energy value based upon absorbed heat (italics) from STP to 1000degK (0446 BTUg for Air 115 BTUg water) Underlined value is released heat at generally accepted 44 BTUg
Air (Wt 000Kg)
Component(BTU) Start Wt End Wt Net Wt Energy1
(BTU) Power
(BTUmin) Power (HP) Efficiency3
661 460 201 938 1294 30 36
Water2
(Wt 000Kg)
Propane(Wt 000Kg)
Time (hrmnsc)
1562
123000
1556
123715
00125
006
00715
380
2640
na
523
364
na
12
86
14
50
na na
Air (Wt 000Kg)
Component(BTU) Start Wt
5 Variable High Speed Run Air Pressure 60 psi Water head pressure 70 psi
End Wt Net Wt Energy1
(BTU) Power
(BTUmin) Power (HP) Efficiency3
654 472 182 849 718 17 7
2 Determined by difference from Propane and Air Energy assumed value 90 3 Arbitrary estimated efficiency of heat transfer not effective work
The two known quantities in each run is the weight of the air moving through the system and the weight of the propane heating that air The variable is the quantity of water heated to steam temperatures and above In Run 3 at 90 efficiency that mass of water calculates to 125 grams at 50 it drops to 33 grams In Run 5 at 90 efficiency that mass of water calculates to 86 grams at 50 it drops to 44 grams
FEDERAL TRANSIT ADMINISTRATION 39
APPENDIX A HEAT TRANSFER EFFICIENCY MODELING RUNS 3 AND 5 50 AND 90
As the comparison tables below show the uncertainty in the efficiency of heat transfer is manifest only in the mass of water heated to steam to do useful work
Data 90 Efficiency
Air
Component Run 3 BHP
Run 5 BHP
Net ChngBHP
-45
Run 3 Mass
Transfer (kg)
Run 5 Mass
Transfer (kg)
Net ChangeMass
Transfer (kg)
30 17
197
237
2010 182 -9
Water
Propane
Duration (mn)
47
86
725
422
0060
0013
725
0270
0086
1180
588
350
163 1180
276
163
Data 50 Efficiency
Air
Component Run 3 BHP
Run 5 BHP
Net ChngBHP
-45
Run 3 Mass
Transfer (kg)
Run 5 Mass
Transfer (kg)
Net ChangeMass
Transfer (kg)
30 17
101
237
2010 182 -9
Water
Propane
Duration (mn)
12
86
725
817
0060
0003
725
0270
0044
1180
1233
350
163 1180
276
163
Regardless of the specific efficiency Run3 reflects an air-rich propellant mix while Run 5 was clearly the more powerful and steam-rich propellant If 50 efficiency is a more realistic figure than 90 the only consequence is more water passing through the heater expander and recovery tank The only consequence for overall system efficiency is the slight but added work required to move the additional water by pump to the top of the water column
FEDERAL TRANSIT ADMINISTRATION 40
APPENDIX Acronyms B
BHP Boiler Horsepower
BRASH Binary Recovery Air-Steam Hybrid
BTU British Thermal Unit
CC Cubic centimeter
CFM Cubit feet per minute
CHP Combined heat and power
CNG Compressed natural gas
CO2 Carbon dioxide
CU Cubic
DARPA Defense Advanced Research Projects Agency
DGE Diesel gallon equivalent
DOT Department of Transportation
EC External combustion
EIA Energy Information Administration
EPA Environmental Protection Agency
FTA Federal Transit Administration
GGE Gasoline gallon equivalent
HP Horsepower
IC Internal combustion
K Kelvin
Kcal Kilocalorie
MPG Miles per gallon
MPH Miles per hour
OEM Original equipment manufacturer
PSI Pounds per square inch
RPM Revolutions per minute
SBIR Small Business Innovation Research
STP Standard temperature and pressure
FEDERAL TRANSIT ADMINISTRATION 41
FEDERAL TRANSIT ADMINISTRATION 128
US Department of TransportationFederal Transit AdministrationEast Building1200 New Jersey Avenue SEWashington DC 20590httpwwwftadotgovresearch
US Department of Transportation Federal Transit Administration East Building 1200 New Jersey Avenue SE Washington DC 20590 httpwwwftadotgovresearch
FEDERAL TRANSIT ADMINISTRATION 42
- Button1
- Button2
- Button3
- Button4
- Button5
- Button6
- Button7
- Button8
- Button9
- Button10
- Button11
- Button12
- Button13
- Button14
- Button15
- Button16
- Button17
- Button18
- Button19
- Button20
- Button21
- Button22
- Button23
- Button24
- Button25
- Button26
- Button27
- Button28
- Button29
- Button30
- Button31
- Button32
- Button33
- Button34
- Button35
- Button36
- Button37
- Button38
- Button39
- Button40
- Button41
- Button42
- Button43
- Button44
- Button45
- Button46
- Button47
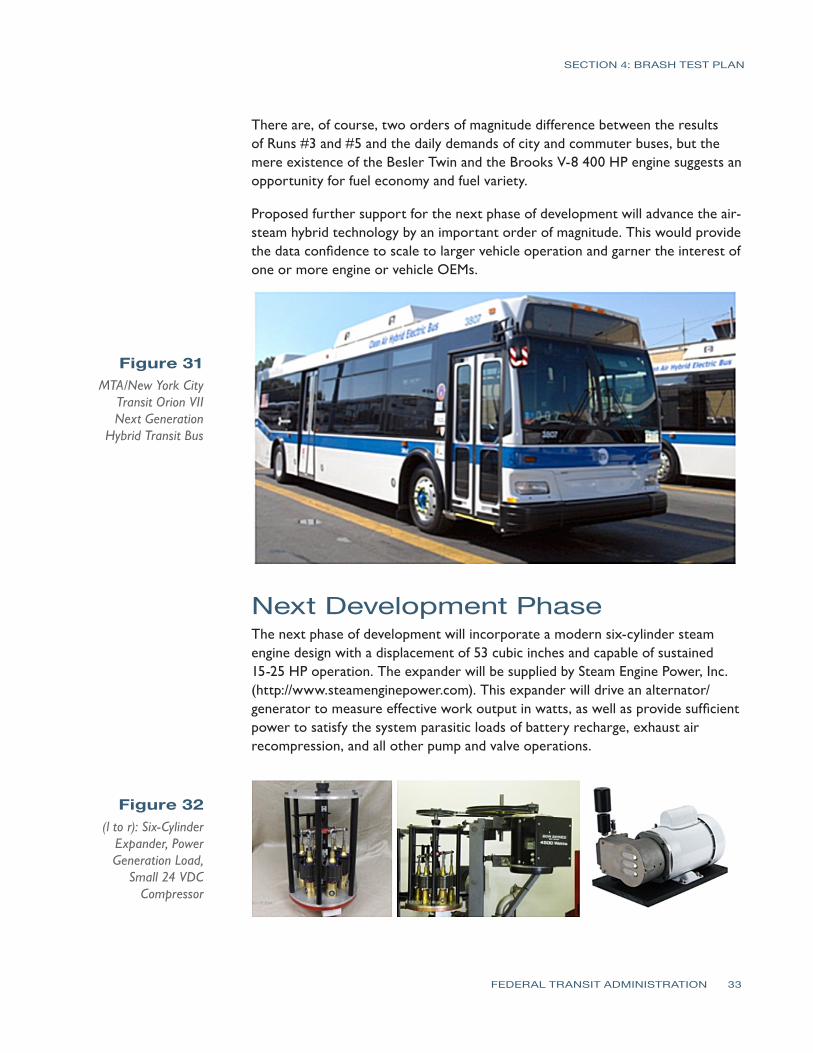
SECTION 4 BRASH TEST PLAN
There are of course two orders of magnitude difference between the results of Runs 3 and 5 and the daily demands of city and commuter buses but the mere existence of the Besler Twin and the Brooks V-8 400 HP engine suggests an opportunity for fuel economy and fuel variety
Proposed further support for the next phase of development will advance the air-steam hybrid technology by an important order of magnitude This would provide the data confidence to scale to larger vehicle operation and garner the interest of one or more engine or vehicle OEMs
Figure 31 MTANew York City
Transit Orion VII Next Generation
Hybrid Transit Bus
Next Development Phase The next phase of development will incorporate a modern six-cylinder steam engine design with a displacement of 53 cubic inches and capable of sustained 15-25 HP operation The expander will be supplied by Steam Engine Power Inc (httpwwwsteamenginepowercom) This expander will drive an alternator generator to measure effective work output in watts as well as provide sufficient power to satisfy the system parasitic loads of battery recharge exhaust air recompression and all other pump and valve operations
Figure 32 (l to r) Six-Cylinder Expander Power Generation Load
Small 24 VDC Compressor
FEDERAL TRANSIT ADMINISTRATION 33
SECTION 4 BRASH TEST PLAN
Static pressure for the water column will still be supplied via compressed air cylinder but the dynamic air flow will be supplied by an oil-less air compressor of the size and type shown This 24 VDC compressor will recompress the recovered air exiting the expander to 40ndash60 psi pressure and support flows of 3ndash4 cubic feet per minute (cfm) These three components are off-the-shelf enhancements to the system but custom engineering of a new more powerful and more responsive heater completion of the electronic integration and design and fabrication of the recoveryrecompression components are necessary tasks that must be included to make the next generation assembly work to its potential This work will be accomplished largely by Mechanical and Electrical Engineering students at the University of Connecticut under the supervision of faculty and Brash Engines personnel
When this build is complete all operations will be under LabVIEW control All expander operations will be measured for power and work Once the bench version is in control a modified version will be installed in a small pickup truck (eg Chevrolet S-10) for further verification of system performance and robustness
During this phase a new and promising technology will be investigated a new and faster class of solenoid valves from National Instruments These solenoid valves with an unprecedented 3 msec response time have the potential of allowing air-steam retrofit in existing engine blocks The solenoid valves could replace the spark plugs in conventional IC engines and provide the equivalent timed injection of hot propellant mix as the timed firing of a spark plug in the presence of a fuel air mix
If possible these fast solenoids and the black box programming to control them could allow very easy portability to larger vehicles and easier retrofit Potentially a V-6 engine could operate 4 cylinders for expansion and the remaining two cylinders could be used as direct drive compressors with different but equivalent solenoid valves controlling the compression process
FEDERAL TRANSIT ADMINISTRATION 34
SECTION Development Plan 5 and Next Steps
This current effort is a key first-proof of concept for this air-steam hybrid technology but our goals extend well beyond this two-seat 2 HP demonstrator The lessons learned in electronic integration will allow rapid migration to larger platforms using the same basic controls but scaling the expander heater and other mass-flow components to vehicle-appropriate size That project identified as ldquo20 HP Vehiclerdquo and other near-term derivative projects are listed in Table 5
BRASH Project
ProposedFunding Source
Funds Reqd $K Project Description
SUV-size proof-of-concept for reliable 20 HP Vehicle DOTUSPS 300 highway performance maildelivery
vehicle size
Proof-of-concept mass transit busshy200 HP Vehicle DOTDOD 600 retrofit scaled to city bus capacity and
suitable for replacement of over-the-road diesel engines
Table 5 Project Funding
Stationary Power Unit Micro-CHP Equivalent
DARPA 300 Proof-of-concept mass transit bus-retrofit scaled to city bus capacity and suitable for replacement of over-the-road diesel engines
Summary Alternative Processed Solid Fuel DOE EPA DOA 600
Processed mix of hydrolyzed wood pulp processed solid waste and other combustible solids in an extrudable mass with alcohol solutevehiclemdashdemonstrate utility in vehicles as a high energy content clean burning fuel for EC engines
Demonstrate effective pyrolysis of
Binary Solid Gas Fuel
EPA Waste Management BFI
400 processed solid fuels in a binary fuel burner conventional fuel (gasoline natural gas) provides primary heat source for pyrolysis temperatures
Proof of Concept OEM Power Plant
Vehicle OEM (eg Ford GM Caterpillar) 1200
Development of direct replacement BRASH engine alternative to existing OEM IC engine
Black Box Integration of Controller Software
Vehicle OEM (eg Ford GM Caterpillar)
1600 Development of commercial BRASH system alternative to existing OEM IC engine
FEDERAL TRANSIT ADMINISTRATION 35
SECTION 5 DEVELOPMENT PLAN AND NEXT STEPS
The issuance of US Patent 7743872 five months ago has two important consequences for this project First it serves to validate the underlying technology the combination of air and steam in an EC engine is better than steam or air alone Second it provides a basis for full and open discussions with government agencies and large commercial interests in the transportation and power sectors
Our efforts at promotion have been delayed pending successful demonstration of the Smarttrade car vehicle to allow the first detailed real-world performance data to be distributed
Coupling that performance data with the option of migration away from refined petroleum should spark significant interest If we can move to a high lignin-processed wood pulp that costs $045 per gasoline gallon equivalent (an arbitrary value for example only) and consumes more CO2 while growing than is consumed in processing as a fuel and produced from combustion then we succeed as a project and as a global game-changing technology for many uses Improvements in fuel economy are important but of greater importance is the migration to low-process biomass fuels
FEDERAL TRANSIT ADMINISTRATION 36
SECTION Potential Applications and Societal Value 6 The whole premise behind the BRASH air steam hybrid is that external combustion offers a more benign and environmentally-appropriate way to power large vehicles and other portable equipment than refined petroleum-powered internal combustion
bullCombustion heat can be derived from any fuel source including processed solids from fast-growing renewables such as poplar trees waste corn stalks or switch grass
bullThat combustion heat is applied at a rate consistent with the work to be done and not to support idling and other unproductive fuel use
Using a mix of air and steam as working fluids in the engine allows
bullImmediate startup from an ldquoair-onlyrdquo start
bull Managed system pressure through use of a defined head air pressure
bullManaged fuel burn as the air-steam fraction is adjusted to match wheel load
bullAdjusted wheel load reduces fuel burn
Integration of modern control circuitry with external combustion also brings a level of performance operational simplicity and safety heretofore unavailable
FEDERAL TRANSIT ADMINISTRATION 37
SECTION
7 Phase I Conclusions
The last steam train in scheduled service in the US departed on October 11 196225 One year earlier Robert Noyce received the first patent for an integrated circuit26 But for that brief one-year overlap the most powerful motive power technology was never harnessed by the black box controls that grew out of Noycersquos invention so the diesel-powered IC engine championed by Henry Ford won out
Now nearly 50 years later the modern IC engine cannot operate efficiently without the benefit of black box electronicsmdashbut that technology still presents intractable challenges of supply safety and environmental impact The air-steam hybrid technology may offer an alternative and a glimpse of that potential is presented here and viewable in Run 5 on the Brash Engines website at http wwwbrashenginescom
While demonstration in a test vehicle provides a strong visual message that BRASH technology works the commercial success of this technology will depend upon reliable repeatable measurement of power and economy For that data the Phase 2 effort will require a return to laboratory bench testing and effective demonstration of recovery of the water and air fractions
The results of this Phase I project collectively demonstrate the technical feasibility and commercial potential of the BRASH air-steam hybrid engine technology The initial DOT SBIR funding has been highly effective in facilitating this important proof of concept and laying the groundwork for further technology refinement and application
As described earlier the next steps are clear and appear to combine achievable and rapid major advances with low developmental risk SBIR Phase 2 support is needed for those advances due to the still-early stage of development that restricts access to private capital
The immense potential value of this technology has been enhanced and verified in Phase 1 there is now a clear and low-risk path ahead to larger-scale testing further component and controls refinement specific applications prototyping and pre-commercial deployments
25William Rosen The Most Powerful Idea in the World Random House 2010 p 311 26US Patent 2981877
FEDERAL TRANSIT ADMINISTRATION 38
APPENDIX
A Heat Transfer Efficiency Modeling Runs 3 and 5 50 and 90
Much of the analysis for Runs 3 and 5 is based on an assumed efficiency of 90 for heat transfer from the combustion of propane to heating of the water air mix in the coil As a test for the reasonableness of that assumption the same data have been modeled at a much lower 50 factor below
112210 - 3 Low Speed Run Air Pressure 60 psi Water head pressure 60 psi
Water2 00440 5060 4276 101 43 (Wt 000Kg)
Propane 152 1493 237 50 27 11880 1004 (Wt 000Kg)
Time 133000 134150 01150 na na na na (hrmnsc)
1 Energy value based upon absorbed heat (italics) from STP to 1000degK (0446 BTUg for Air 115 BTUg water) Underlined value is released heat at generally accepted 44 BTUg
Air (Wt 000Kg)
Component(BTU) Start Wt End Wt Net Wt Energy1
(BTU) Power
(BTUmin) Power (HP) Efficiency3
661 460 201 938 1294 30 36
Water2
(Wt 000Kg)
Propane(Wt 000Kg)
Time (hrmnsc)
1562
123000
1556
123715
00125
006
00715
380
2640
na
523
364
na
12
86
14
50
na na
Air (Wt 000Kg)
Component(BTU) Start Wt
5 Variable High Speed Run Air Pressure 60 psi Water head pressure 70 psi
End Wt Net Wt Energy1
(BTU) Power
(BTUmin) Power (HP) Efficiency3
654 472 182 849 718 17 7
2 Determined by difference from Propane and Air Energy assumed value 90 3 Arbitrary estimated efficiency of heat transfer not effective work
The two known quantities in each run is the weight of the air moving through the system and the weight of the propane heating that air The variable is the quantity of water heated to steam temperatures and above In Run 3 at 90 efficiency that mass of water calculates to 125 grams at 50 it drops to 33 grams In Run 5 at 90 efficiency that mass of water calculates to 86 grams at 50 it drops to 44 grams
FEDERAL TRANSIT ADMINISTRATION 39
APPENDIX A HEAT TRANSFER EFFICIENCY MODELING RUNS 3 AND 5 50 AND 90
As the comparison tables below show the uncertainty in the efficiency of heat transfer is manifest only in the mass of water heated to steam to do useful work
Data 90 Efficiency
Air
Component Run 3 BHP
Run 5 BHP
Net ChngBHP
-45
Run 3 Mass
Transfer (kg)
Run 5 Mass
Transfer (kg)
Net ChangeMass
Transfer (kg)
30 17
197
237
2010 182 -9
Water
Propane
Duration (mn)
47
86
725
422
0060
0013
725
0270
0086
1180
588
350
163 1180
276
163
Data 50 Efficiency
Air
Component Run 3 BHP
Run 5 BHP
Net ChngBHP
-45
Run 3 Mass
Transfer (kg)
Run 5 Mass
Transfer (kg)
Net ChangeMass
Transfer (kg)
30 17
101
237
2010 182 -9
Water
Propane
Duration (mn)
12
86
725
817
0060
0003
725
0270
0044
1180
1233
350
163 1180
276
163
Regardless of the specific efficiency Run3 reflects an air-rich propellant mix while Run 5 was clearly the more powerful and steam-rich propellant If 50 efficiency is a more realistic figure than 90 the only consequence is more water passing through the heater expander and recovery tank The only consequence for overall system efficiency is the slight but added work required to move the additional water by pump to the top of the water column
FEDERAL TRANSIT ADMINISTRATION 40
APPENDIX Acronyms B
BHP Boiler Horsepower
BRASH Binary Recovery Air-Steam Hybrid
BTU British Thermal Unit
CC Cubic centimeter
CFM Cubit feet per minute
CHP Combined heat and power
CNG Compressed natural gas
CO2 Carbon dioxide
CU Cubic
DARPA Defense Advanced Research Projects Agency
DGE Diesel gallon equivalent
DOT Department of Transportation
EC External combustion
EIA Energy Information Administration
EPA Environmental Protection Agency
FTA Federal Transit Administration
GGE Gasoline gallon equivalent
HP Horsepower
IC Internal combustion
K Kelvin
Kcal Kilocalorie
MPG Miles per gallon
MPH Miles per hour
OEM Original equipment manufacturer
PSI Pounds per square inch
RPM Revolutions per minute
SBIR Small Business Innovation Research
STP Standard temperature and pressure
FEDERAL TRANSIT ADMINISTRATION 41
FEDERAL TRANSIT ADMINISTRATION 128
US Department of TransportationFederal Transit AdministrationEast Building1200 New Jersey Avenue SEWashington DC 20590httpwwwftadotgovresearch
US Department of Transportation Federal Transit Administration East Building 1200 New Jersey Avenue SE Washington DC 20590 httpwwwftadotgovresearch
FEDERAL TRANSIT ADMINISTRATION 42
- Button1
- Button2
- Button3
- Button4
- Button5
- Button6
- Button7
- Button8
- Button9
- Button10
- Button11
- Button12
- Button13
- Button14
- Button15
- Button16
- Button17
- Button18
- Button19
- Button20
- Button21
- Button22
- Button23
- Button24
- Button25
- Button26
- Button27
- Button28
- Button29
- Button30
- Button31
- Button32
- Button33
- Button34
- Button35
- Button36
- Button37
- Button38
- Button39
- Button40
- Button41
- Button42
- Button43
- Button44
- Button45
- Button46
- Button47
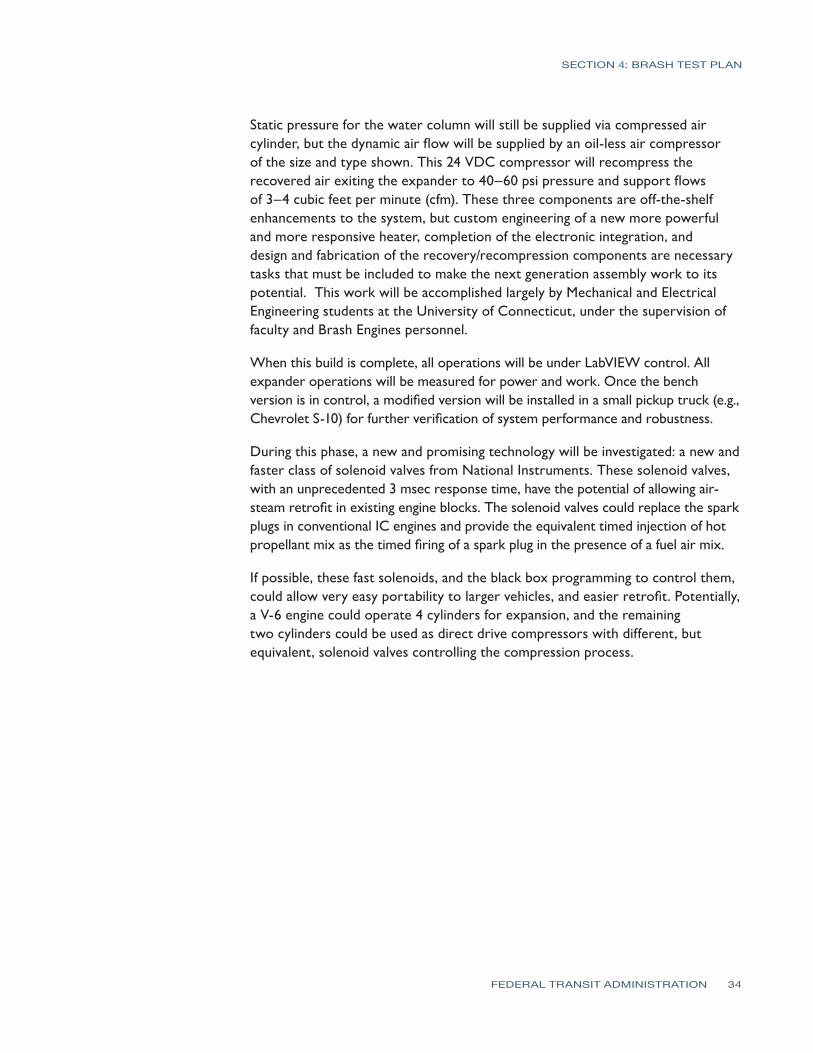
SECTION 4 BRASH TEST PLAN
Static pressure for the water column will still be supplied via compressed air cylinder but the dynamic air flow will be supplied by an oil-less air compressor of the size and type shown This 24 VDC compressor will recompress the recovered air exiting the expander to 40ndash60 psi pressure and support flows of 3ndash4 cubic feet per minute (cfm) These three components are off-the-shelf enhancements to the system but custom engineering of a new more powerful and more responsive heater completion of the electronic integration and design and fabrication of the recoveryrecompression components are necessary tasks that must be included to make the next generation assembly work to its potential This work will be accomplished largely by Mechanical and Electrical Engineering students at the University of Connecticut under the supervision of faculty and Brash Engines personnel
When this build is complete all operations will be under LabVIEW control All expander operations will be measured for power and work Once the bench version is in control a modified version will be installed in a small pickup truck (eg Chevrolet S-10) for further verification of system performance and robustness
During this phase a new and promising technology will be investigated a new and faster class of solenoid valves from National Instruments These solenoid valves with an unprecedented 3 msec response time have the potential of allowing air-steam retrofit in existing engine blocks The solenoid valves could replace the spark plugs in conventional IC engines and provide the equivalent timed injection of hot propellant mix as the timed firing of a spark plug in the presence of a fuel air mix
If possible these fast solenoids and the black box programming to control them could allow very easy portability to larger vehicles and easier retrofit Potentially a V-6 engine could operate 4 cylinders for expansion and the remaining two cylinders could be used as direct drive compressors with different but equivalent solenoid valves controlling the compression process
FEDERAL TRANSIT ADMINISTRATION 34
SECTION Development Plan 5 and Next Steps
This current effort is a key first-proof of concept for this air-steam hybrid technology but our goals extend well beyond this two-seat 2 HP demonstrator The lessons learned in electronic integration will allow rapid migration to larger platforms using the same basic controls but scaling the expander heater and other mass-flow components to vehicle-appropriate size That project identified as ldquo20 HP Vehiclerdquo and other near-term derivative projects are listed in Table 5
BRASH Project
ProposedFunding Source
Funds Reqd $K Project Description
SUV-size proof-of-concept for reliable 20 HP Vehicle DOTUSPS 300 highway performance maildelivery
vehicle size
Proof-of-concept mass transit busshy200 HP Vehicle DOTDOD 600 retrofit scaled to city bus capacity and
suitable for replacement of over-the-road diesel engines
Table 5 Project Funding
Stationary Power Unit Micro-CHP Equivalent
DARPA 300 Proof-of-concept mass transit bus-retrofit scaled to city bus capacity and suitable for replacement of over-the-road diesel engines
Summary Alternative Processed Solid Fuel DOE EPA DOA 600
Processed mix of hydrolyzed wood pulp processed solid waste and other combustible solids in an extrudable mass with alcohol solutevehiclemdashdemonstrate utility in vehicles as a high energy content clean burning fuel for EC engines
Demonstrate effective pyrolysis of
Binary Solid Gas Fuel
EPA Waste Management BFI
400 processed solid fuels in a binary fuel burner conventional fuel (gasoline natural gas) provides primary heat source for pyrolysis temperatures
Proof of Concept OEM Power Plant
Vehicle OEM (eg Ford GM Caterpillar) 1200
Development of direct replacement BRASH engine alternative to existing OEM IC engine
Black Box Integration of Controller Software
Vehicle OEM (eg Ford GM Caterpillar)
1600 Development of commercial BRASH system alternative to existing OEM IC engine
FEDERAL TRANSIT ADMINISTRATION 35
SECTION 5 DEVELOPMENT PLAN AND NEXT STEPS
The issuance of US Patent 7743872 five months ago has two important consequences for this project First it serves to validate the underlying technology the combination of air and steam in an EC engine is better than steam or air alone Second it provides a basis for full and open discussions with government agencies and large commercial interests in the transportation and power sectors
Our efforts at promotion have been delayed pending successful demonstration of the Smarttrade car vehicle to allow the first detailed real-world performance data to be distributed
Coupling that performance data with the option of migration away from refined petroleum should spark significant interest If we can move to a high lignin-processed wood pulp that costs $045 per gasoline gallon equivalent (an arbitrary value for example only) and consumes more CO2 while growing than is consumed in processing as a fuel and produced from combustion then we succeed as a project and as a global game-changing technology for many uses Improvements in fuel economy are important but of greater importance is the migration to low-process biomass fuels
FEDERAL TRANSIT ADMINISTRATION 36
SECTION Potential Applications and Societal Value 6 The whole premise behind the BRASH air steam hybrid is that external combustion offers a more benign and environmentally-appropriate way to power large vehicles and other portable equipment than refined petroleum-powered internal combustion
bullCombustion heat can be derived from any fuel source including processed solids from fast-growing renewables such as poplar trees waste corn stalks or switch grass
bullThat combustion heat is applied at a rate consistent with the work to be done and not to support idling and other unproductive fuel use
Using a mix of air and steam as working fluids in the engine allows
bullImmediate startup from an ldquoair-onlyrdquo start
bull Managed system pressure through use of a defined head air pressure
bullManaged fuel burn as the air-steam fraction is adjusted to match wheel load
bullAdjusted wheel load reduces fuel burn
Integration of modern control circuitry with external combustion also brings a level of performance operational simplicity and safety heretofore unavailable
FEDERAL TRANSIT ADMINISTRATION 37
SECTION
7 Phase I Conclusions
The last steam train in scheduled service in the US departed on October 11 196225 One year earlier Robert Noyce received the first patent for an integrated circuit26 But for that brief one-year overlap the most powerful motive power technology was never harnessed by the black box controls that grew out of Noycersquos invention so the diesel-powered IC engine championed by Henry Ford won out
Now nearly 50 years later the modern IC engine cannot operate efficiently without the benefit of black box electronicsmdashbut that technology still presents intractable challenges of supply safety and environmental impact The air-steam hybrid technology may offer an alternative and a glimpse of that potential is presented here and viewable in Run 5 on the Brash Engines website at http wwwbrashenginescom
While demonstration in a test vehicle provides a strong visual message that BRASH technology works the commercial success of this technology will depend upon reliable repeatable measurement of power and economy For that data the Phase 2 effort will require a return to laboratory bench testing and effective demonstration of recovery of the water and air fractions
The results of this Phase I project collectively demonstrate the technical feasibility and commercial potential of the BRASH air-steam hybrid engine technology The initial DOT SBIR funding has been highly effective in facilitating this important proof of concept and laying the groundwork for further technology refinement and application
As described earlier the next steps are clear and appear to combine achievable and rapid major advances with low developmental risk SBIR Phase 2 support is needed for those advances due to the still-early stage of development that restricts access to private capital
The immense potential value of this technology has been enhanced and verified in Phase 1 there is now a clear and low-risk path ahead to larger-scale testing further component and controls refinement specific applications prototyping and pre-commercial deployments
25William Rosen The Most Powerful Idea in the World Random House 2010 p 311 26US Patent 2981877
FEDERAL TRANSIT ADMINISTRATION 38
APPENDIX
A Heat Transfer Efficiency Modeling Runs 3 and 5 50 and 90
Much of the analysis for Runs 3 and 5 is based on an assumed efficiency of 90 for heat transfer from the combustion of propane to heating of the water air mix in the coil As a test for the reasonableness of that assumption the same data have been modeled at a much lower 50 factor below
112210 - 3 Low Speed Run Air Pressure 60 psi Water head pressure 60 psi
Water2 00440 5060 4276 101 43 (Wt 000Kg)
Propane 152 1493 237 50 27 11880 1004 (Wt 000Kg)
Time 133000 134150 01150 na na na na (hrmnsc)
1 Energy value based upon absorbed heat (italics) from STP to 1000degK (0446 BTUg for Air 115 BTUg water) Underlined value is released heat at generally accepted 44 BTUg
Air (Wt 000Kg)
Component(BTU) Start Wt End Wt Net Wt Energy1
(BTU) Power
(BTUmin) Power (HP) Efficiency3
661 460 201 938 1294 30 36
Water2
(Wt 000Kg)
Propane(Wt 000Kg)
Time (hrmnsc)
1562
123000
1556
123715
00125
006
00715
380
2640
na
523
364
na
12
86
14
50
na na
Air (Wt 000Kg)
Component(BTU) Start Wt
5 Variable High Speed Run Air Pressure 60 psi Water head pressure 70 psi
End Wt Net Wt Energy1
(BTU) Power
(BTUmin) Power (HP) Efficiency3
654 472 182 849 718 17 7
2 Determined by difference from Propane and Air Energy assumed value 90 3 Arbitrary estimated efficiency of heat transfer not effective work
The two known quantities in each run is the weight of the air moving through the system and the weight of the propane heating that air The variable is the quantity of water heated to steam temperatures and above In Run 3 at 90 efficiency that mass of water calculates to 125 grams at 50 it drops to 33 grams In Run 5 at 90 efficiency that mass of water calculates to 86 grams at 50 it drops to 44 grams
FEDERAL TRANSIT ADMINISTRATION 39
APPENDIX A HEAT TRANSFER EFFICIENCY MODELING RUNS 3 AND 5 50 AND 90
As the comparison tables below show the uncertainty in the efficiency of heat transfer is manifest only in the mass of water heated to steam to do useful work
Data 90 Efficiency
Air
Component Run 3 BHP
Run 5 BHP
Net ChngBHP
-45
Run 3 Mass
Transfer (kg)
Run 5 Mass
Transfer (kg)
Net ChangeMass
Transfer (kg)
30 17
197
237
2010 182 -9
Water
Propane
Duration (mn)
47
86
725
422
0060
0013
725
0270
0086
1180
588
350
163 1180
276
163
Data 50 Efficiency
Air
Component Run 3 BHP
Run 5 BHP
Net ChngBHP
-45
Run 3 Mass
Transfer (kg)
Run 5 Mass
Transfer (kg)
Net ChangeMass
Transfer (kg)
30 17
101
237
2010 182 -9
Water
Propane
Duration (mn)
12
86
725
817
0060
0003
725
0270
0044
1180
1233
350
163 1180
276
163
Regardless of the specific efficiency Run3 reflects an air-rich propellant mix while Run 5 was clearly the more powerful and steam-rich propellant If 50 efficiency is a more realistic figure than 90 the only consequence is more water passing through the heater expander and recovery tank The only consequence for overall system efficiency is the slight but added work required to move the additional water by pump to the top of the water column
FEDERAL TRANSIT ADMINISTRATION 40
APPENDIX Acronyms B
BHP Boiler Horsepower
BRASH Binary Recovery Air-Steam Hybrid
BTU British Thermal Unit
CC Cubic centimeter
CFM Cubit feet per minute
CHP Combined heat and power
CNG Compressed natural gas
CO2 Carbon dioxide
CU Cubic
DARPA Defense Advanced Research Projects Agency
DGE Diesel gallon equivalent
DOT Department of Transportation
EC External combustion
EIA Energy Information Administration
EPA Environmental Protection Agency
FTA Federal Transit Administration
GGE Gasoline gallon equivalent
HP Horsepower
IC Internal combustion
K Kelvin
Kcal Kilocalorie
MPG Miles per gallon
MPH Miles per hour
OEM Original equipment manufacturer
PSI Pounds per square inch
RPM Revolutions per minute
SBIR Small Business Innovation Research
STP Standard temperature and pressure
FEDERAL TRANSIT ADMINISTRATION 41
FEDERAL TRANSIT ADMINISTRATION 128
US Department of TransportationFederal Transit AdministrationEast Building1200 New Jersey Avenue SEWashington DC 20590httpwwwftadotgovresearch
US Department of Transportation Federal Transit Administration East Building 1200 New Jersey Avenue SE Washington DC 20590 httpwwwftadotgovresearch
FEDERAL TRANSIT ADMINISTRATION 42
- Button1
- Button2
- Button3
- Button4
- Button5
- Button6
- Button7
- Button8
- Button9
- Button10
- Button11
- Button12
- Button13
- Button14
- Button15
- Button16
- Button17
- Button18
- Button19
- Button20
- Button21
- Button22
- Button23
- Button24
- Button25
- Button26
- Button27
- Button28
- Button29
- Button30
- Button31
- Button32
- Button33
- Button34
- Button35
- Button36
- Button37
- Button38
- Button39
- Button40
- Button41
- Button42
- Button43
- Button44
- Button45
- Button46
- Button47
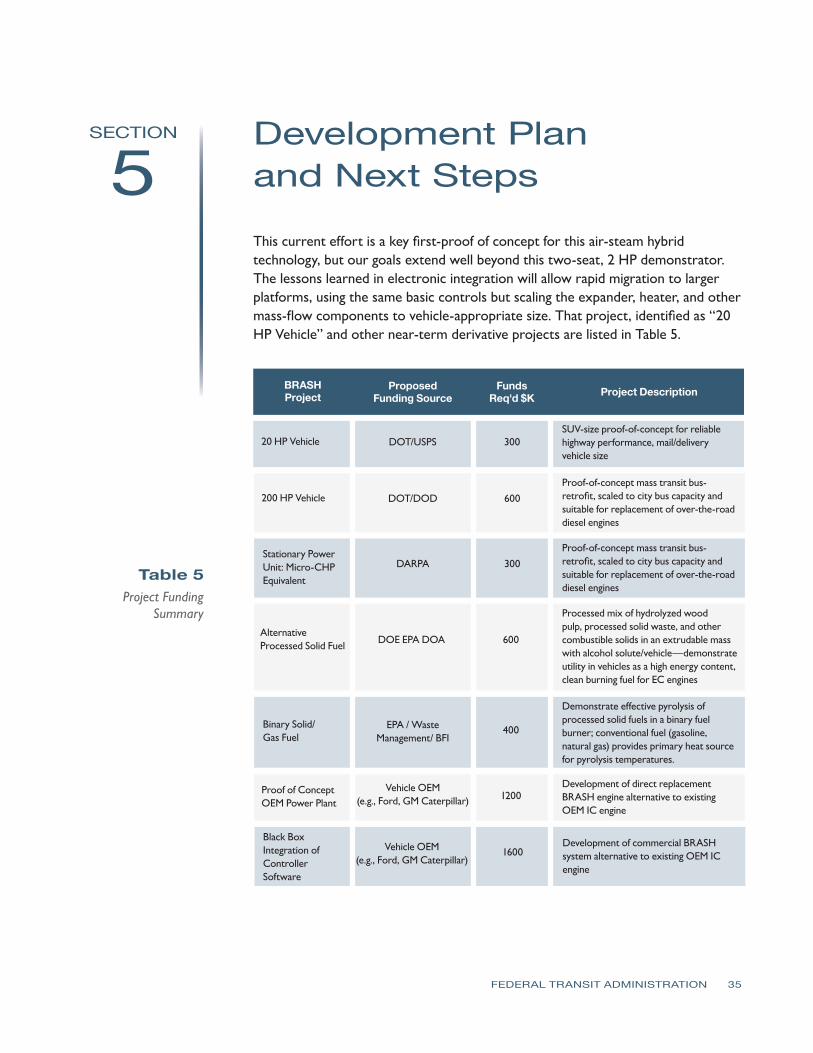
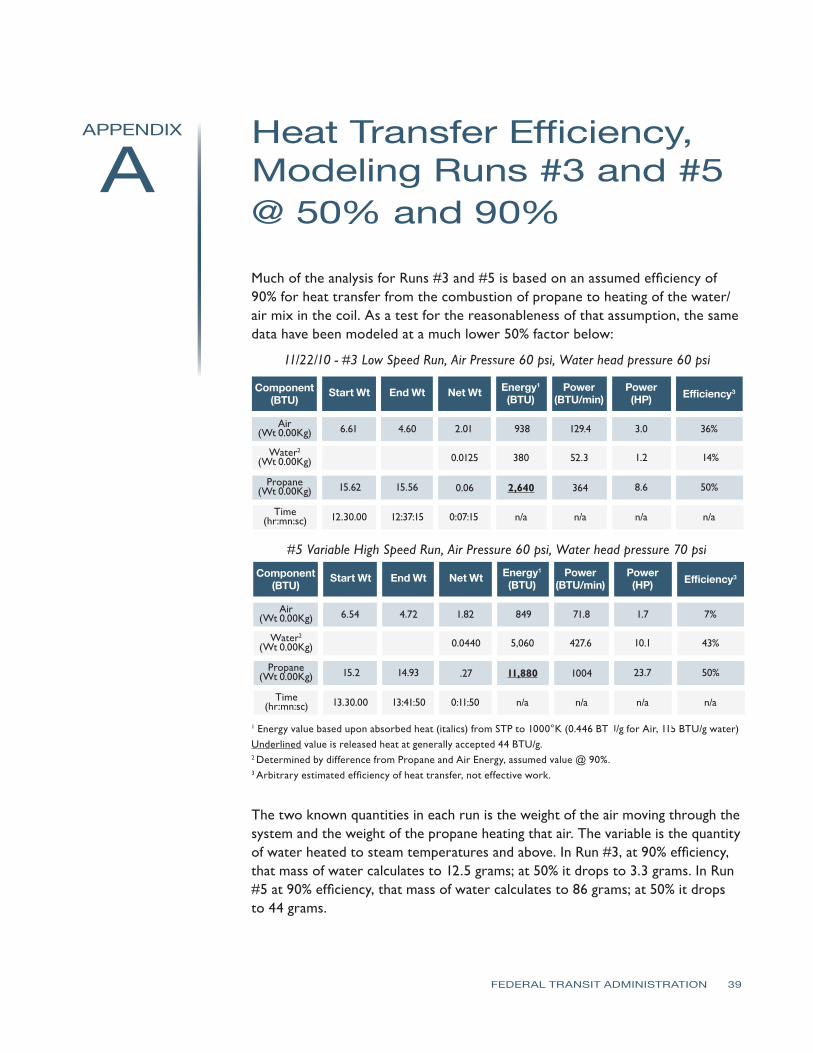
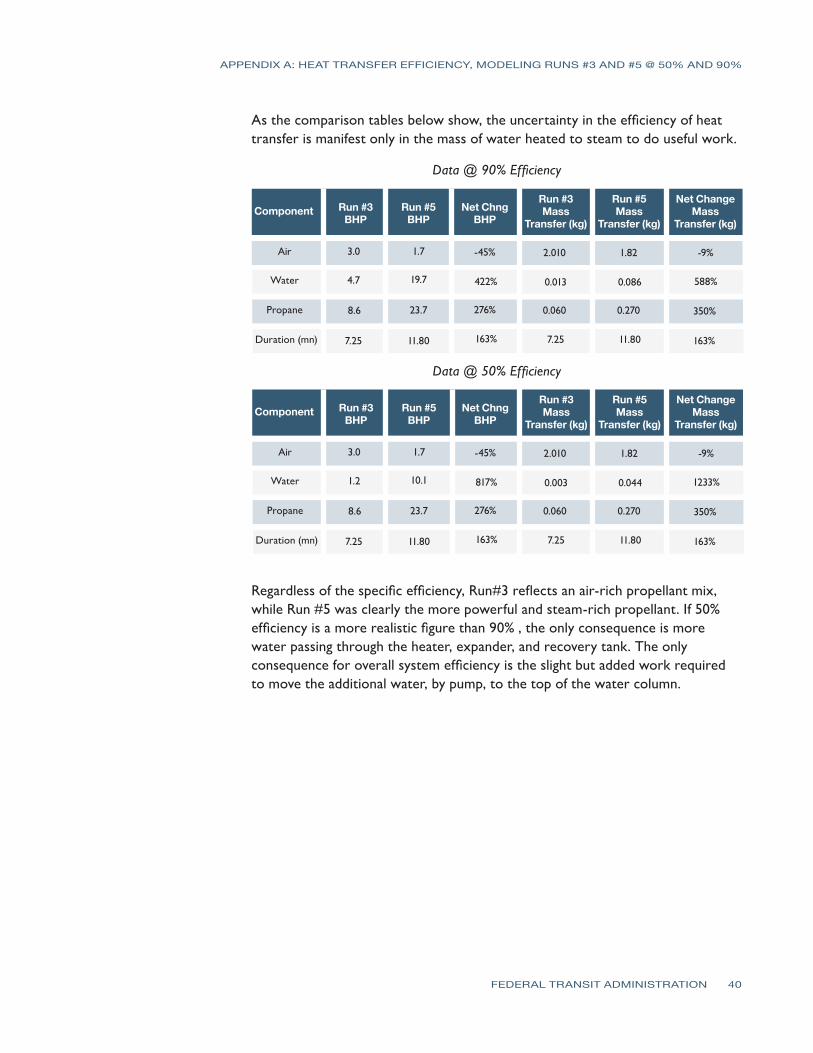