
Air source heat pump water heater: Dynamic modeling, optimal energy management and mini-tubes...
15
Air source heat pump water heater: Dynamic modeling, optimal energy management and mini-tubes condensers Oussama Ibrahim a, c , Farouk Fardoun a, * , Rafic Younes b , Hasna Louahlia-Gualous c a University Institute of Technology, Department GIM, Lebanese University Campus, P.O. Box 813, Saida, Lebanon b Faculty of Engineering, Lebanese University, Beirut, Lebanon c Université de Caen Base Normandie, LUSAC, IUT de Cherbourg Manche, 50000 Saint Lô, France article info Article history: Received 19 July 2013 Received in revised form 30 October 2013 Accepted 6 November 2013 Available online xxx Keywords: Heat pump water heater Dynamic modeling Optimization Lebanese context Greenhouse gas emissions Energy management abstract This paper presents a dynamic simulation model to predict the performance of an ASHPWH (air source heat pump water heater). The developed model is used to assess its performance in the Lebanese context. It is shown that for the four Lebanese climatic zones, the expected monthly values of the average COP (coefficient of performance) varies from 2.9 to 5, leading to high efficiencies compared with conventional electric water heaters. The energy savings and GHG (greenhouse gas) emissions reduction are investi- gated for each zone. Furthermore, it is recommended to use the ASHPWH during the period of highest daily ambient temperatures (noon or afternoon), assuming that the electricity tariff and hot water loads are constant. In addition, an optimal management model for the ASHPWH is developed and applied for a typical winter day of Beirut. Moreover, the developed dynamic model of ASHPWH is used to compare the performance of three similar systems that differ only with the condenser geometry, where results show that using mini-condenser geometries increase the COP (coefficient of performance) and consequently, more energy is saved as well as more GHG emissions are reduced. In addition, the condenser “surface compactness” is increased giving rise to an efficient compact heat exchanger. Ó 2013 Elsevier Ltd. All rights reserved. 1. Introduction Lebanon is a Mediterranean country that meets nearly all its energy needs from the importation of oil products, because it currently lacks the conventional fossil fuel energy resources and is not effectively benefiting from the available renewable energy re- sources. With a relatively high standards of living and high popu- lation density, energy demand is continuously increasing and consequently exerting high burden on the country’s expenditures and environmental pollution. Like other Mediterranean countries, domestic hot water production, in Lebanon, constitutes an impor- tant portion of the residential energy consumption, which is usu- ally met using low-efficient conventional EWHs (electric water heaters). Hence, reducing water heating energy demand could significantly save energy, protect nature and reduce expenditures. Almost 75% of the population use EWHs, 22% use wood, oil or gas water heaters and 3% use solar thermal systems [1]. Lebanon has a high population density with about four million people living in a small area (10,452 km 2 ). In addition, the population is concentrated in zones 1 and 2 and therefore, most Lebanese live in apartments of high story buildings. Wood, oil and gas water heaters are not favored because they emit their exhaust pollutant gases on-site, which increase the local pollution and raise the health bill. As for solar thermal systems, they appear to be very beneficial in such 300 days-sunny country; however, the lack of the necessary installation area for the majority of Lebanese is restricting this alternative. Thus, searching for a green-onsite, efficient device for domestic water heating is important for this country. Electric water heaters are usually simple, but not desirable in the view of energy performance, since the overall efficiency-in con- verting the potential energy of fossil fuels into electrical energy and then into thermal energy-becomes quite low. Compared to these electric water heaters, heat pump water heating systems can up- grade the ambient low-grade energy [2] and supply much more heat just with the same amount of electrical energy input. The ASHPWH (air source heat pump water heater), based on the prin- ciple of Carnot cycle, absorbs heat from air at lower temperature, * Corresponding author. Tel.: þ961 3789135, þ961 7750190; fax: þ961 7750199. E-mail addresses: [email protected] (O. Ibrahim), [email protected] (F. Fardoun), [email protected] (R. Younes), [email protected] (H. Louahlia-Gualous). Contents lists available at ScienceDirect Energy journal homepage: www.elsevier.com/locate/energy 0360-5442/$ e see front matter Ó 2013 Elsevier Ltd. All rights reserved. http://dx.doi.org/10.1016/j.energy.2013.11.017 Energy xxx (2013) 1e15 Please cite this article in press as: Ibrahim O, et al., Air source heat pump water heater: Dynamic modeling, optimal energy management and mini-tubes condensers, Energy (2013), http://dx.doi.org/10.1016/j.energy.2013.11.017
Transcript of Air source heat pump water heater: Dynamic modeling, optimal energy management and mini-tubes...

lable at ScienceDirect
Energy xxx (2013) 1e15
Contents lists avai
Energy
journal homepage: www.elsevier .com/locate/energy
Air source heat pump water heater: Dynamic modeling, optimalenergy management and mini-tubes condensers
Oussama Ibrahim a,c, Farouk Fardoun a,*, Rafic Younes b, Hasna Louahlia-Gualous c
aUniversity Institute of Technology, Department GIM, Lebanese University Campus, P.O. Box 813, Saida, Lebanonb Faculty of Engineering, Lebanese University, Beirut, LebanoncUniversité de Caen Base Normandie, LUSAC, IUT de Cherbourg Manche, 50000 Saint Lô, France
a r t i c l e i n f o
Article history:Received 19 July 2013Received in revised form30 October 2013Accepted 6 November 2013Available online xxx
Keywords:Heat pump water heaterDynamic modelingOptimizationLebanese contextGreenhouse gas emissionsEnergy management
* Corresponding author. Tel.: þ961 3789135, þ961E-mail addresses: [email protected] (O.
(F. Fardoun), [email protected] (R. Younes)(H. Louahlia-Gualous).
0360-5442/$ e see front matter � 2013 Elsevier Ltd.http://dx.doi.org/10.1016/j.energy.2013.11.017
Please cite this article in press as: Ibrahim Omini-tubes condensers, Energy (2013), http
a b s t r a c t
This paper presents a dynamic simulation model to predict the performance of an ASHPWH (air sourceheat pump water heater). The developed model is used to assess its performance in the Lebanese context.It is shown that for the four Lebanese climatic zones, the expected monthly values of the average COP(coefficient of performance) varies from 2.9 to 5, leading to high efficiencies compared with conventionalelectric water heaters. The energy savings and GHG (greenhouse gas) emissions reduction are investi-gated for each zone. Furthermore, it is recommended to use the ASHPWH during the period of highestdaily ambient temperatures (noon or afternoon), assuming that the electricity tariff and hot water loadsare constant. In addition, an optimal management model for the ASHPWH is developed and applied for atypical winter day of Beirut. Moreover, the developed dynamic model of ASHPWH is used to compare theperformance of three similar systems that differ only with the condenser geometry, where results showthat using mini-condenser geometries increase the COP (coefficient of performance) and consequently,more energy is saved as well as more GHG emissions are reduced. In addition, the condenser “surfacecompactness” is increased giving rise to an efficient compact heat exchanger.
� 2013 Elsevier Ltd. All rights reserved.
1. Introduction
Lebanon is a Mediterranean country that meets nearly all itsenergy needs from the importation of oil products, because itcurrently lacks the conventional fossil fuel energy resources and isnot effectively benefiting from the available renewable energy re-sources. With a relatively high standards of living and high popu-lation density, energy demand is continuously increasing andconsequently exerting high burden on the country’s expendituresand environmental pollution. Like other Mediterranean countries,domestic hot water production, in Lebanon, constitutes an impor-tant portion of the residential energy consumption, which is usu-ally met using low-efficient conventional EWHs (electric waterheaters). Hence, reducing water heating energy demand couldsignificantly save energy, protect nature and reduce expenditures.Almost 75% of the population use EWHs, 22% use wood, oil or gas
7750190; fax: þ961 7750199.Ibrahim), [email protected], [email protected]
All rights reserved.
, et al., Air source heat pump://dx.doi.org/10.1016/j.energy
water heaters and 3% use solar thermal systems [1]. Lebanon has ahigh population density with about four million people living in asmall area (10,452 km2). In addition, the population is concentratedin zones 1 and 2 and therefore, most Lebanese live in apartments ofhigh story buildings.
Wood, oil and gas water heaters are not favored because theyemit their exhaust pollutant gases on-site, which increase the localpollution and raise the health bill. As for solar thermal systems,they appear to be very beneficial in such 300 days-sunny country;however, the lack of the necessary installation area for the majorityof Lebanese is restricting this alternative. Thus, searching for agreen-onsite, efficient device for domestic water heating isimportant for this country.
Electric water heaters are usually simple, but not desirable in theview of energy performance, since the overall efficiency-in con-verting the potential energy of fossil fuels into electrical energy andthen into thermal energy-becomes quite low. Compared to theseelectric water heaters, heat pump water heating systems can up-grade the ambient low-grade energy [2] and supply much moreheat just with the same amount of electrical energy input. TheASHPWH (air source heat pump water heater), based on the prin-ciple of Carnot cycle, absorbs heat from air at lower temperature,
water heater: Dynamic modeling, optimal energy management and.2013.11.017

Nomenclature
VariableA area [m2]COP instantaneous coefficient of performanceCp specific heat [J/kg.K]Cv characteristic constant of expansion valve [e]D diameter [mm]dt time step [s]e internal energy [J/kg]E electrical energy consumed [kWh]ES electrical energy saving [%]f frequency [Hz]g gravitational acceleration [m/s2]h enthalpy [J/kg]HC heating cycle: heating 150 L water volume from 15 �C
to 55 �CIE indirect emission factor [kg CO2eq/kWh]k thermal conductivity [W/m.K]L length [m]m mass [kg]_m mass flow rate [kg/s]N number of tubes [e]P pressure [Pa]p number of poles [e]PE electrical power [W]pt pitch [m]Q heat energy [kWh]Q heat capacity [W]s slip ratio [e]S entropy [J/kg]SC surface compactness [m�1]T temperature [oC]t time [s]u velocity [m/s]V volume [m3]_W input power [W]x vapor ratio of refrigerant [e]Z zone [e]z spatial coordinate [m]a convective heat transfer coefficient [W/m2.K]u rotational speed [rps]
h efficiency [e]g void fraction [e]gm mean void fraction [e]r density [kg/m3]d thickness of fin [mm]b coefficient of thermal expansion [1/K]m dynamic viscosity [Pa.s]
Subscripts1,2,3 1st, 2nd, 3rd regiona Airavg averagec condenserch characteristiccs cross sectione evaporatorel electricf saturated liquidg saturated gasi,in inner, insideisen isentropick compressorlon longitudinal tubem mechanicalo outos operating superheatr refrigerantR reservoirss static superheatth thermaltra transverse tubev valvevol volumetricw wallwat water
Dimensionless numbersGr Grashof number, Gr ¼ L3chgr
2bj:DT j:=m2Nu mean Nusselt number, Nu ¼ aD/kPr Prandtl number, Pr ¼ mCp/kRa Rayleigh number, Ra ¼ Gr.PrRe Reynolds number, Re ¼ ruD/m
O. Ibrahim et al. / Energy xxx (2013) 1e152
and transfers it into a water tank-heat sink at higher temperature.The mechanical energy consumed to drive the system is relatively asmall proportion (w30%) of the transferred energy [3,4]. The per-formance of the air source heat pump is highly dependent on thelocal ambient temperature. According to the United NationsDevelopment Program study concerning climatic zoning forbuildings in Lebanon [5], Lebanon was divided into four climaticzones; Zone 1: Coastal, Zone 2: Western Mid-Mountain, Zone 3:Inland Plateau, and Zone 4: High Mountain. Moreover, five weatherfiles were created based on data from five meteorological stations(Beirut & Bayssour for zone 1, Qartaba for zone 2, Zahle for zone 3,Cedars for zone 4). Two files were created for the zone 1, since thiszone has the highest population density. Based on these weatherfiles, it was found that the balance point of a simple ASHPWH(without back-up or defrosting system) is quite less than theambient temperature for all Lebanese climatic zones all around theyear [6]. Being a renewable energy, high efficient device [7] as wellas having a low installation cost [8], the simple ASHPWH has an
Please cite this article in press as: Ibrahim O, et al., Air source heat pumpmini-tubes condensers, Energy (2013), http://dx.doi.org/10.1016/j.energy
advantage permitting a higher interest of this technology in such adeveloping country.
Several studies were carried out on modeling and experimentalinvestigations of air source heat pump water heaters. Fu et al. [9]presented a dynamic model of air-to-water dual-mode heatpump with screw compressor having four-step capacities. Dynamicmodels were used for the heat exchangers, condenser and evapo-rator, which were divided into several control volumes according tothe refrigerant phase (superheated vapor, two-phase and sub-cooled liquid). The dynamic responses of adding compressor ca-pacity in step-wise manner were studied and compared toexperimental measurements that revealed good agreement. Meiet al. [10] studied, experimentally, different HPWHs with naturalconvection immersed condensers. The described set of experi-ments demonstrated the viability of this type of HPWHs that isaimed to eliminate the application of electric resistance heatingcompletely. Kim et al. [11] presented a dynamic model of a waterheating system driven by a heat pump to investigate the transient
water heater: Dynamic modeling, optimal energy management and.2013.11.017

O. Ibrahim et al. / Energy xxx (2013) 1e15 3
thermal behavior of the system which was composed of a heatpump and a hot water circulation loop. Finite volume method wasapplied to describe the heat exchangers, and lumped parametermodels were used to analyze the compressor and the hot waterreservoir. Dynamic simulations were carried out for various reser-voir sizes. Simulation results show that the smaller size waterreservoir was found to have larger transient performance degra-dation, and the larger size caused additional heat loss during thehot water storage period. Therefore, the reservoir size should beoptimized in the design process to minimize both the performancedegradation and the heat loss. Morrison et al. [12] presented aprocedure for annual load cycle rating of ASHPWHs where twocondenser designs were studied, a separate heat exchanger designwith water pumped to it from the storage tank and a wrap-aroundcondenser coil on the tank. The results showed that the seconddesign had a higher annual COP (coefficient of performance).Furthermore, the study indicated that the effect of ambient tem-perature on the system performance is more significant than theeffect of initial water temperature during the heating process.Techarungpaisan et al. [13] presented a steady state simulationmodel to predict the performance of a small split type air condi-tioner with integratedwater heater and validated it experimentally.Zhang et al. [14] studied the system optimization of ASHPWH. TheASHPWH system consisted of a heat pump and a water tank withthe condenser coil installed inside the tank to release heat to thewater side by natural convection. The capillary tube length, thefilling quantity of refrigerant, the condenser coil tube length andsystem component matching were discussed accordingly. From thetesting results, it could be seen that the system performance COPcould be improved by optimizing the stated parameters. Ji et al. [15]presented a distributed model of an ASHP (air-source heat pump)system and its experimental setup using an immersed watercondenser. Dynamic performance of the ASHP was then evaluatedby both simulation and experiment. The results indicated that thesystem COP (coefficient of performance) decreased as thecondenser temperature increased, ranging from 4.41 to 2.32. Guoet al. [16] conducted an experimental and simulation research in
Table 1Summary for the literature review.
Year Reference Type of study Place/climaticdata
Appwate
Modeling(simulation)
Experimental Spacheat
2003 [9] 〿 〿 China 〿
2003 [10] 〿
2004 [11] 〿
2004 [12] 〿 〿 Sydney, Australia
2007 [13] 〿 〿 Thailand 〿
2007 [14] 〿 China
2009 [15] 〿 〿
2011 [16] 〿 〿 Shanghai, China
Please cite this article in press as: Ibrahim O, et al., Air source heat pumpmini-tubes condensers, Energy (2013), http://dx.doi.org/10.1016/j.energy
addition to operation optimization of ASHPWH. Results indicatedthat 1) the average COP ranged from 2.82 to 5.51 under typicalconditions, 2) the recommended outside area ratio of condensercoil to evaporator is 0.14e0.31 when the evaporator outside area isbetween 6 and 6.5 m2, 3) the optimal start-up time was at noonperiod, between 12:00 and 14:00, if there was no electricity pricedifference between day and night and near 22:00 other wise and 4)setting water temperature should be higher than 46 �C in summerand 50 �C in other seasons. Table 1 summarizes the most importantfindings of the presented literature review.
In this paper, a dynamic model of an ASHPWH is formulatedusing the moving boundary approach for the heat exchangers. Thisapproach was previously used to model an air to air heat pump[17]; however, in this study, the approach is applied to an ASHPWHwhere the condenser is immersed in a water tank and is cooled bynatural convection. Hence, to the best of authors’ knowledge, thispaper presents a new application using the moving boundaryapproach to model a naturally, water-cooled condenser. Moreover,the developed model is used to assess the system performance inthe Lebanese climate and to illustrate its energy and greenhousegas reductions compared with conventional electric water heaters.In addition, an optimal management model to determine the op-timum operational time-intervals of an ASHPWH, which wouldyield the minimum operational cost during a certain period of time,is defined and applied to a specific case study. The advantage of theoptimal management model is demonstrated by comparing theobtained results with those obtained for conventionally-controlledASHPWH using a thermostat. Furthermore, the effect of using mini-tubes condensers on the performance of ASHPWH is investigatedenergetically and environmentally.
2. Mathematical modeling of ASHPWH
A typical ASHPWH is modeled in this section. Static models arechosen to simulate the actuator components since the dynamics ofcompressors and expansion devices are generally much faster thanthose of the heat exchangers [18e20]. The compressor is
lication other thanr heating
Results
eing
Spacecooling
〿 Heating mode: Twat ¼ 45 �C;Cooling mode: Twat ¼ 7 �CQc & COP are greater for U-tube style than bayonetcondensersQc & COP increased as a function of the numberof circuitsin the U-tube style condensers (COP7-circuit ¼ 2.7 &Qc,7-circuit ¼ 3.662 W at Ta ¼ 27 �C & Twat-avg ¼ 54 �C)As VR b, heat loss b and as VRa, performance a
For 40 Mj/day peak winter load:COPintegral-c ¼ 2.3 and annual energy saving ¼ 56%;COPexternal-c ¼ 1.8 and annual energy saving ¼ 44%
〿 The steady state simulation model is quite accurate inpredicting important system parameters750 W heat pump with 150 L and 1125 W heat pumpwith 200 L are more suitable for residential uses.For system (150 L, 1125 W):COPwinter ¼ 2.61 (Ta ¼ 0 �C);COPsummer ¼ 5.66 (Ta ¼ 35 �C);COPspring/autumn ¼ 4.817 (Ta ¼ 25 �C)COP ¼ 2.32e4.41COPavg,summer ¼ 5.51 (Ta ¼ 35 �C);COPavg,winter ¼ 2.82 (Ta ¼ 5 �C)
water heater: Dynamic modeling, optimal energy management and.2013.11.017
O. Ibrahim et al. / Energy xxx (2013) 1e154
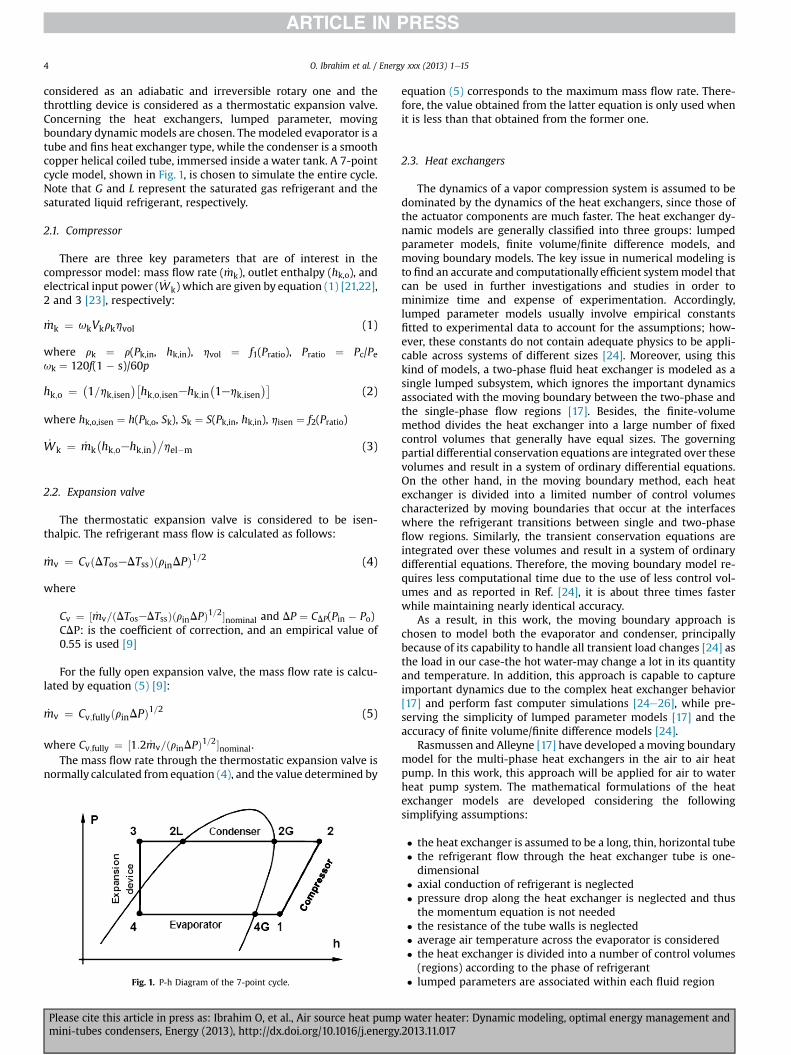
considered as an adiabatic and irreversible rotary one and thethrottling device is considered as a thermostatic expansion valve.Concerning the heat exchangers, lumped parameter, movingboundary dynamic models are chosen. The modeled evaporator is atube and fins heat exchanger type, while the condenser is a smoothcopper helical coiled tube, immersed inside a water tank. A 7-pointcycle model, shown in Fig. 1, is chosen to simulate the entire cycle.Note that G and L represent the saturated gas refrigerant and thesaturated liquid refrigerant, respectively.
2.1. Compressor
There are three key parameters that are of interest in thecompressor model: mass flow rate ( _mk), outlet enthalpy (hk,o), andelectrical input power ( _Wk) which are given by equation (1) [21,22],2 and 3 [23], respectively:
_mk ¼ ukVkrkhvol (1)
where rk ¼ r(Pk,in, hk,in), hvol ¼ f1(Pratio), Pratio ¼ Pc/Peuk ¼ 120f(1 � s)/60p
hk;o ¼ �1=hk;isen
��hk;o;isenehk;in
�1ehk;isen
��(2)
where hk,o,isen ¼ h(Pk,o, Sk), Sk ¼ S(Pk,in, hk,in), hisen ¼ f2(Pratio)
_Wk ¼ _mk�hk;oehk;in
��hel�m (3)
2.2. Expansion valve
The thermostatic expansion valve is considered to be isen-thalpic. The refrigerant mass flow is calculated as follows:
_mv ¼ CvðDToseDTssÞðrinDPÞ1=2 (4)
where
Cv ¼ ½ _mv=ðDToseDTssÞðrinDPÞ1=2�nominal and DP ¼ CDP(Pin � Po)CDP: is the coefficient of correction, and an empirical value of0.55 is used [9]
For the fully open expansion valve, the mass flow rate is calcu-lated by equation (5) [9]:
_mv ¼ Cv;fullyðrinDPÞ1=2 (5)
where Cv;fully ¼ ½1:2 _mv=ðrinDPÞ1=2�nominal.The mass flow rate through the thermostatic expansion valve is
normally calculated from equation (4), and the value determined by
Fig. 1. P-h Diagram of the 7-point cycle.
Please cite this article in press as: Ibrahim O, et al., Air source heat pumpmini-tubes condensers, Energy (2013), http://dx.doi.org/10.1016/j.energy
equation (5) corresponds to the maximum mass flow rate. There-fore, the value obtained from the latter equation is only used whenit is less than that obtained from the former one.
2.3. Heat exchangers
The dynamics of a vapor compression system is assumed to bedominated by the dynamics of the heat exchangers, since those ofthe actuator components are much faster. The heat exchanger dy-namic models are generally classified into three groups: lumpedparameter models, finite volume/finite difference models, andmoving boundary models. The key issue in numerical modeling isto find an accurate and computationally efficient systemmodel thatcan be used in further investigations and studies in order tominimize time and expense of experimentation. Accordingly,lumped parameter models usually involve empirical constantsfitted to experimental data to account for the assumptions; how-ever, these constants do not contain adequate physics to be appli-cable across systems of different sizes [24]. Moreover, using thiskind of models, a two-phase fluid heat exchanger is modeled as asingle lumped subsystem, which ignores the important dynamicsassociated with the moving boundary between the two-phase andthe single-phase flow regions [17]. Besides, the finite-volumemethod divides the heat exchanger into a large number of fixedcontrol volumes that generally have equal sizes. The governingpartial differential conservation equations are integrated over thesevolumes and result in a system of ordinary differential equations.On the other hand, in the moving boundary method, each heatexchanger is divided into a limited number of control volumescharacterized by moving boundaries that occur at the interfaceswhere the refrigerant transitions between single and two-phaseflow regions. Similarly, the transient conservation equations areintegrated over these volumes and result in a system of ordinarydifferential equations. Therefore, the moving boundary model re-quires less computational time due to the use of less control vol-umes and as reported in Ref. [24], it is about three times fasterwhile maintaining nearly identical accuracy.
As a result, in this work, the moving boundary approach ischosen to model both the evaporator and condenser, principallybecause of its capability to handle all transient load changes [24] asthe load in our case-the hot water-may change a lot in its quantityand temperature. In addition, this approach is capable to captureimportant dynamics due to the complex heat exchanger behavior[17] and perform fast computer simulations [24e26], while pre-serving the simplicity of lumped parameter models [17] and theaccuracy of finite volume/finite difference models [24].
Rasmussen and Alleyne [17] have developed amoving boundarymodel for the multi-phase heat exchangers in the air to air heatpump. In this work, this approach will be applied for air to waterheat pump system. The mathematical formulations of the heatexchanger models are developed considering the followingsimplifying assumptions:
� the heat exchanger is assumed to be a long, thin, horizontal tube� the refrigerant flow through the heat exchanger tube is one-dimensional
� axial conduction of refrigerant is neglected� pressure drop along the heat exchanger is neglected and thusthe momentum equation is not needed
� the resistance of the tube walls is neglected� average air temperature across the evaporator is considered� the heat exchanger is divided into a number of control volumes(regions) according to the phase of refrigerant
� lumped parameters are associated within each fluid region
water heater: Dynamic modeling, optimal energy management and.2013.11.017

Fig. 2. Evaporator with two fluid regions.
O. Ibrahim et al. / Energy xxx (2013) 1e15 5
� the fluid properties, in the two-phase regions, are determinedby assuming a mean void fraction (gm) which is defined as theratio of vapor volume to total volume
� average fluid properties for single phase regions are used
As stated in the assumptions, the fluid properties, in the two-phase region, are determined using a mean void fraction (equa-tion (6)), which is determined by integrating the void fractioncorrelation (equation (7)) over the entire region. In this study, theZivi-void fraction correlation is used [27]:
gm ¼ 1=ðx2ex1ÞZ
g ¼ 1=bþ 1=ðx2ex1Þ
�ha=b2 log½ðbx1 þ aÞ=ðbx2 þ aÞ�
(6)
where
a ¼ (rg/rf)2/3 and b ¼ 1 � a.x1, x2: refrigerant quality at inlet & outlet of two-phase regionrespectively
266664
Y11 Y12 0 0 0Y21 Y22 Y23 0 0Y31 Y32 Y33 0 00 0 0 Y44 0Y51 0 0 0 Y55
377775 _xe ¼
266666666664
_min�hin � hg
�þ ai1Ai
�L1
Ltotal
ðTw1 � Tr1Þ
_mout�hg � hout
�þ ai2Ai
�L2Ltotal
ðTw2 � Tr2Þ
_min þ _mo
aoAoðTa � Tw1Þ � ai1AiðTw1 � Tr1ÞaoAoðTa � Tw2Þ � ai2AiðTw2 � Tr2Þ
377777777775
(13)
g ¼ 1=�1þ ½ð1exÞ=x�
�rg=rf
2=3(7)
Fig. 3. Condenser with three fluid regions.
The governing PDEs (partial differential equations) for conser-vation of refrigerant mass and energy are illustrated in equations(8) and (9).
vr
vtþ V$ðr u!Þ ¼ 0 (8)
vr�eþ u!u!
2
vt
þV$
�r u!
�hþ u!u!
2
��¼V$ q!þr f
!u!þV$ðs$ u!ÞþQ
(9)
where u! is the fluid velocity vector, f!
is the body force vector, q! isheat flux vector, and s is the shear stress tensor.
Using the assumptions stated previously, the governing PDEsare simplified to one-dimensional PDEs illustrated in equations (10)and (11). In addition, the tube wall energy balance is given byequation (12) [17]:
dðrAcsÞ=dt þ d _m=dz ¼ 0 (10)
dðrAcsheAcsPÞ=dt þ dð _mhÞ=dz ¼ aipDiðTweTrÞ (11)
�CprA
�wdTw=dt ¼ aipDiðTreTwÞeaopDoðTaeTwÞ (12)
Please cite this article in press as: Ibrahim O, et al., Air source heat pumpmini-tubes condensers, Energy (2013), http://dx.doi.org/10.1016/j.energy
Fig. 2 shows a schematic of an evaporator. According to thephase of refrigerant, an evaporator can be divided into two distinctregions: two-phase region, and superheat region.
Equations (10)e(12) are integrated along each of the stated re-gions to obtain the governing equations for the conservation ofrefrigerant mass, refrigerant energy, and heat exchanger wall en-ergy, which are independent of spatial parameters. After that,defining the state vector xe ¼ [L1 Pe ho Tw1 Tw2]T for the evaporatorand algebraically combining the derived governing equations, thegoverning equation of evaporator dynamics reduces to thefollowing compact state space form:
where L1 is the length of the two-phase region (first region), Tw1and Tw2 are the temperatures of the evaporator tubewall in the firstregion and the superheated region (second region), respectively.Expressions of all elements in matrix [Y] are found in Ref. [17].
Similar to the evaporator, the condenser is divided, by the phaseof refrigerant, into three regions (superheated, two-phase andsubcooled) as shown in Fig. 3. Similar derivation is carried out forthe condenser dynamics resulting in equation of the form½B�* _Xc ¼ f , with the state vector xc ¼ [Lc1 Lc2 Pc hco Tcw1 Tcw2 Tcw3]T,where B is a matrix, f is vector, Lc1 and Lc2 are the lengths of thesuperheated region (first region) and two-phase region (secondregion), respectively, Tcw1, Tcw2 and Tcw3 are the temperatures of thecondenser tube wall in the first region, second region and sub-cooled region (third region), respectively.
2.4. Water reservoir
Hot water reservoir stores heated water ready for being sup-plied to the demand site or the placewhere the hotwater is needed.In the modeling procedure, three assumptions are made as follows:
water heater: Dynamic modeling, optimal energy management and.2013.11.017

Fig. 4. Flow chart of the dynamic simulation program of ASHPWH.
O. Ibrahim et al. / Energy xxx (2013) 1e156
(1) uniform temperature in the hot water reservoir (stratification isnot considered), (2) the total amount of hot water in the reservoir isconserved (No water consumption during heating process) and (3)the water reservoir is well insulated and heat losses to the sur-rounding ambient is neglected.
It should be noted that the mean water temperature (Twat) isfirst initialized at the beginning of the calculation procedure, thenew value of mean water temperature (Twat,new) will be calculatedfrom equation (14). If Twat,new does not meet the target hot tem-perature value, the new value is used in the next step of iteration.This procedure is repeated until Twat reaches a pre-specified valuewhich is 55 �C in this case.
Twat;new ¼ Twat þ�Qc*3:6*106
.�mCp
�wat (14)
2.5. Heat transfer coefficients
The single-phase refrigerant side heat transfer coefficient iscomputed from the well known Gnielinski correlation:
Nu ¼hðf =8ÞðRee1000ÞPr
i.h1þ 12:7ðf =8Þ1=2
�Pr2=3e1
i
(15)
where f ¼ 1/(0.79ln(Re) � 1.64)2.The heat transfer coefficient of the two-phase region inside the
condenser is calculated by the correlations illustrated in equation(16) [9]:
Nu ¼ 5:03Re1=3Pr1=3 Re < 55;0000:0265Re0:8Pr1=3 Re � 55;000
(16)
where Re ¼ 0.5G[1 þ (rf/rg)1/2]Di/mf and G ¼ 4 _m=pD2i .
The heat transfer coefficient of the two-phase region inside theevaporator is given by equation (17) [28]:
Nu ¼ 10�2�Re2Kf
0:4(17)
where Kf ¼ Dh/Lg.The water-side natural heat transfer coefficient is calculated
using the following correlation for Nusselt number [26]:
Nu ¼ 0:6þ
�0:387Ra1=6
.�1þ ð0:559=PrÞ9=16
8=27�2(18)
The air-side heat transfer coefficient is given as follows [9]:
a ¼ 61:67u0:63a (19)
2.6. General flow chart
The individual component models are coded into “MATLAB”software and the simulation program is used to predict systemparameters of interest such as hot water temperature, condensingand evaporating pressures, heating capacity, electrical power inputand coefficient of performance COP. The most important steps inthe solution algorithm are:
1) Input physical parameters of the heat exchangers,compressor, expansion valve and water reservoir
2) Input the ambient air, initial water and set watertemperatures
Please cite this article in press as: Ibrahim O, et al., Air source heat pumpmini-tubes condensers, Energy (2013), http://dx.doi.org/10.1016/j.energy
3) Initialize time, reservoir water temperature and state vectorvariables (xe and xc) of the evaporator and condenser
4) The state vector variables are calculated using the iterativePredictoreCorrector method. In addition, the under relaxa-tion method is used to ensure convergence
5) The partial derivatives existing in the governing equationsare calculated using the interpolate functions existing inMATLAB software after building a convenient database forrefrigerant properties
6) Refrigerant properties are calculated using REFPROPsoftware
7) The compressor, condenser and expansion valve subroutinesare executed consecutively
8) The outlet mass flow rate from the condenser is compared tothat of the expansion valve. If the difference is greater than acertain pre-specified tolerance, Pc is adjusted positively ornegatively depending on the mass flow rate difference
9) The evaporator subroutine is executed and the outletenthalpy from the condenser is compared to that at theevaporator inlet. If the difference is greater than a certainpre-specified tolerance, Pe is adjusted positively or negativelydepending on the enthalpy difference
10) The water temperature in reservoir is calculated according toequation (12). If it is less than the set temperature, the time isupdated and the model is re-executed from step 7
11) Steps 7 to 10 are repeated until the set water temperature isreached
A flow chart illustrating the dynamic model procedure of thepresented ASHPWH is shown in Fig. 4.
3. Validation of the model
The proposed ASHPWH dynamic simulation program is vali-dated using the experimental investigations presented by Guo et al.[16]. The experimental setup was composed of a rotary compressor,thermostatic expansion valve, finned and tube air cooled
water heater: Dynamic modeling, optimal energy management and.2013.11.017
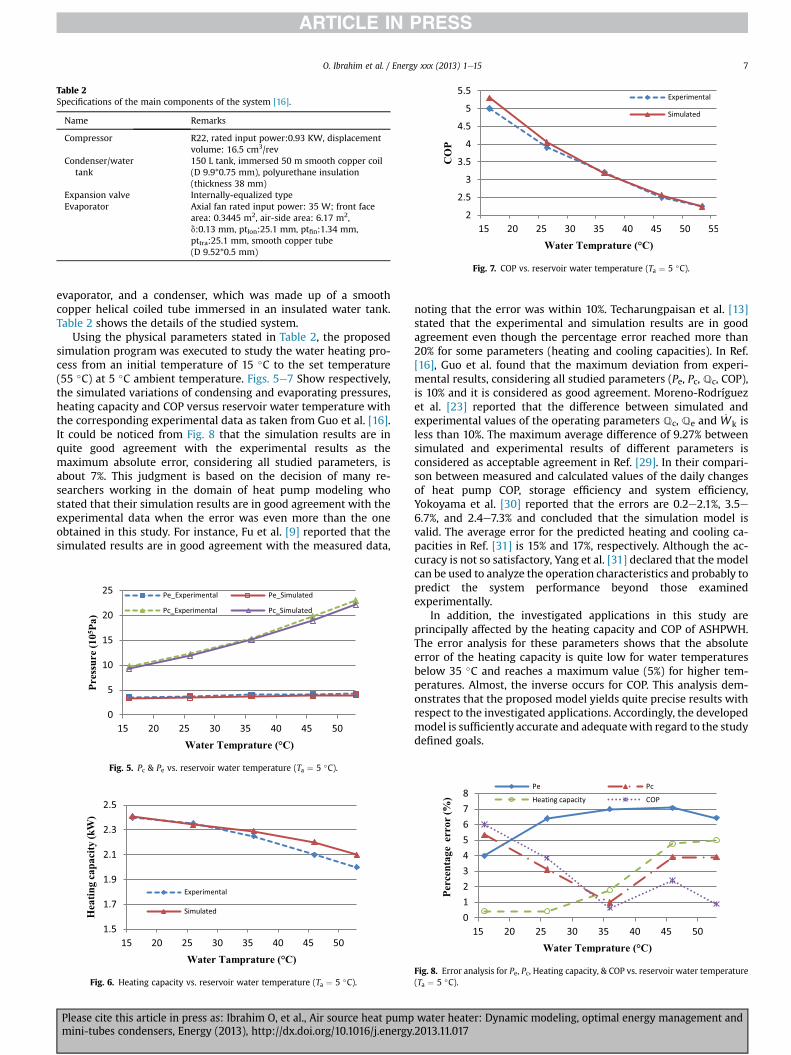
Table 2Specifications of the main components of the system [16].
Name Remarks
Compressor R22, rated input power:0.93 KW, displacementvolume: 16.5 cm3/rev
Condenser/watertank
150 L tank, immersed 50 m smooth copper coil(D 9.9*0.75 mm), polyurethane insulation(thickness 38 mm)
Expansion valve Internally-equalized typeEvaporator Axial fan rated input power: 35 W; front face
area: 0.3445 m2, air-side area: 6.17 m2,d:0.13 mm, ptlon:25.1 mm, ptfin:1.34 mm,pttra:25.1 mm, smooth copper tube(D 9.52*0.5 mm)
Fig. 7. COP vs. reservoir water temperature (Ta ¼ 5 �C).
O. Ibrahim et al. / Energy xxx (2013) 1e15 7
evaporator, and a condenser, which was made up of a smoothcopper helical coiled tube immersed in an insulated water tank.Table 2 shows the details of the studied system.
Using the physical parameters stated in Table 2, the proposedsimulation program was executed to study the water heating pro-cess from an initial temperature of 15 �C to the set temperature(55 �C) at 5 �C ambient temperature. Figs. 5e7 Show respectively,the simulated variations of condensing and evaporating pressures,heating capacity and COP versus reservoir water temperature withthe corresponding experimental data as taken from Guo et al. [16].It could be noticed from Fig. 8 that the simulation results are inquite good agreement with the experimental results as themaximum absolute error, considering all studied parameters, isabout 7%. This judgment is based on the decision of many re-searchers working in the domain of heat pump modeling whostated that their simulation results are in good agreement with theexperimental data when the error was even more than the oneobtained in this study. For instance, Fu et al. [9] reported that thesimulated results are in good agreement with the measured data,
Fig. 5. Pc & Pe vs. reservoir water temperature (Ta ¼ 5 �C).
Fig. 6. Heating capacity vs. reservoir water temperature (Ta ¼ 5 �C).
Please cite this article in press as: Ibrahim O, et al., Air source heat pumpmini-tubes condensers, Energy (2013), http://dx.doi.org/10.1016/j.energy
noting that the error was within 10%. Techarungpaisan et al. [13]stated that the experimental and simulation results are in goodagreement even though the percentage error reached more than20% for some parameters (heating and cooling capacities). In Ref.[16], Guo et al. found that the maximum deviation from experi-mental results, considering all studied parameters (Pe, Pc, Qc, COP),is 10% and it is considered as good agreement. Moreno-Rodríguezet al. [23] reported that the difference between simulated andexperimental values of the operating parameters Qc, Qe and _Wk isless than 10%. The maximum average difference of 9.27% betweensimulated and experimental results of different parameters isconsidered as acceptable agreement in Ref. [29]. In their compari-son between measured and calculated values of the daily changesof heat pump COP, storage efficiency and system efficiency,Yokoyama et al. [30] reported that the errors are 0.2e2.1%, 3.5e6.7%, and 2.4e7.3% and concluded that the simulation model isvalid. The average error for the predicted heating and cooling ca-pacities in Ref. [31] is 15% and 17%, respectively. Although the ac-curacy is not so satisfactory, Yang et al. [31] declared that the modelcan be used to analyze the operation characteristics and probably topredict the system performance beyond those examinedexperimentally.
In addition, the investigated applications in this study areprincipally affected by the heating capacity and COP of ASHPWH.The error analysis for these parameters shows that the absoluteerror of the heating capacity is quite low for water temperaturesbelow 35 �C and reaches a maximum value (5%) for higher tem-peratures. Almost, the inverse occurs for COP. This analysis dem-onstrates that the proposed model yields quite precise results withrespect to the investigated applications. Accordingly, the developedmodel is sufficiently accurate and adequatewith regard to the studydefined goals.
Fig. 8. Error analysis for Pe, Pc, Heating capacity, & COP vs. reservoir water temperature(Ta ¼ 5 �C).
water heater: Dynamic modeling, optimal energy management and.2013.11.017

Fig. 11. Climatic zones for Lebanon [5].
Fig. 9. Average COP vs. condenser length.
O. Ibrahim et al. / Energy xxx (2013) 1e158
As the model has been validated, it is used to optimize thecondenser length. For this purpose, several simulations for theASHPWH specified in Table 1 were performed, but with variouscondenser lengths and at amoderate ambient temperature of 15 �C.Results show that the average COP is almost converging towards anasymptotic value of 4.05, as the condenser length increases (Fig. 9).Seeking for the highest average COP with the shortest condenserlength, different criteria are adopted: 1) the minimum of the sec-ond derivative of “COPaverage-condenser length” curve, consideringthat this minimum implies that there is very slight improvement inthe COPaverage value with increase of condenser length; 2) 95% ofthe asymptotic value of COPaverage in “COPaverage-condenser length”curve and 3) the minimum of total daily cost, which is composed ofthe operational cost in addition to the initial system cost for eachinvestigated condenser-tube length. Different parameters for thecost analysis correspond to the local Lebanese electricity tariff andmarket. Noting that, increasing the condenser-tube length induceslower operating cost and higher initial cost. Therefore, the opti-mum condenser-tube length corresponds to the minimum totalcost. It is worth tomention that the average daily load is consideredto be one HC (heating cycle), which is defined as heating 150 Lwater volume from 15 �C to 55 �C. From the first criteria, it is foundthat the optimum solution is in the interval [50e60 m]. The secondand third criteria lead to an optimum condenser length of 50 m(Figs. 9 and 10). Therefore, the adopted optimum condenser lengthis 50 m.
It is worth to noting that the average COP is calculated, ac-cording to equation (20):
COPaverage ¼Z �
mCpdT�wat=
ZPEconsumed*dt (20)
Fig. 10. Total daily cost vs. condenser length.
Please cite this article in press as: Ibrahim O, et al., Air source heat pumpmini-tubes condensers, Energy (2013), http://dx.doi.org/10.1016/j.energy
4. Performance analysis in Lebanese context and comparisonwith electric water heater
Lebanon is located on the eastern coast of the MediterraneanSea. The Mediterranean Climate is characterized by mild rainywinters and hot dry summers. But, besides being a Mediterranean,Lebanon is a mountainous country with over half of its area lyingabove 1000 m. There are two parallel ranges of mountains runningnorth to south with the Bekaa valley lying between these twomountain ranges. Therefore, the climate of Lebanon is alpine in themountains and Mediterranean in Bekaa and along the coast. In2005, the United Nations Development Program achieved a studyconcerning climatic zoning for buildings in Lebanon [5]. This studyresulted in the establishment of four climatic zones (Fig. 11). Table 3shows the four climatic zones with the corresponding altitudethresholds. Moreover, weather files for all zones were createdbased on data from meteorological stations. Fig. 12 presents themonthly mean ambient temperatures for all zones.
Reviewing the meteorological data for the four Lebanese cli-matic zones, the hourly ambient dry bulb temperature data over aglobal year are picked up [5]. Analyzing these data, several ambienttemperatures representing different periods of the year have beenchosen to simulate the performance of the presented ASHPWH,specified in Section 4. It should be noted that the water tank isplaced inside the domestic locality. This assumption allows us toconsider a constant average initial temperature of 15 �C for thetank-water, which is important for the comparison purposes. Theset water temperature is considered 55 �C. The variations of theaverage COP and the total time needed for one heating cycle versusambient temperature are shown in Figs. 13 and 14, respectively.From these figures, it is observed that the average COP increases
Table 3Altitude threshold of climatic zones.
Climatic zone Altitude [m]
Zone 1: Coastal 0e700Zone 2: Western Mid-Mountain 700e1400Zone 3: Inland Plateau 700e1150Zone 4: High Mountain Littoral side: over 1400
Inland side: over 1150
water heater: Dynamic modeling, optimal energy management and.2013.11.017

Fig. 14. Total time needed per HC vs. ambient temperature.Fig. 12. Monthly mean ambient temperature for Lebanese climatic zones (Data source:[5]).
O. Ibrahim et al. / Energy xxx (2013) 1e15 9
while the elapsed time decreases with the ambient air temperaturerise. Thus, as the ambient temperature rises, more thermal energyis available to be pumped from air to the water reservoir andaccordingly quite important time is saved.
Using the curve fitting method, two empirical correlations areformulated to determine the average COP (equation (21)) and thetime elapsed (equation (22)) per one HC in function of ambient airtemperature. It is worth to note that the average COP, in this study,does not depend on the variation of water temperature, because itis always calculated over the same HC at different ambient tem-peratures and thus, it depends only on the variation of ambienttemperature.
COPaverage ¼ �7:083*10�7T4a þ 2:833*10�5T3a þ 2:52*10�4T2aþ 0:056Ta þ 2:919
(21)
Time ¼ 4:1667*10�7T4ae3:6667*10�5T3a
þ 0:0019T2ae0:0871Ta þ 3:4223 (22)
where �5 �C < Ta < 35 �C.The monthly average dry bulb temperatures for the Lebanese
cities: Beirut (zone 1), Qartaba (zone 2), Zahle (zone 3) and Cedars(zone 4) are selected [5]. Using equation (21), the average COP iscalculated for each temperature and then the total electrical energyconsumed per one HC is deduced using equation (20) (Fig. 15). It isclearly shown that the electrical energy consumption increases inwinter and decreases in summer. Moreover, zone 1 (Beirut) has theleast energy consumption as it is situated on coast and conse-quently, it has relatively high ambient temperatures year round. Onthe contrary, Cedars (zone 4) is greatest energy consumer as it hasthe least ambient temperatures year round.
Fig. 13. Average COP vs. ambient temperature.
Please cite this article in press as: Ibrahim O, et al., Air source heat pumpmini-tubes condensers, Energy (2013), http://dx.doi.org/10.1016/j.energy
In the aim of proving the importance and the advantage ofASHPWH, consider one HC, as defined above, using a 1 kW-con-ventional EWH (electric water heater) of 0.9-electrical efficiency. Itis worth to mention that most Lebanese residents are equippedwith electric water heaters. The total amount of end-use electricalenergy needed is 7.74 kWh, which is calculated according toequation (23):
EEWH ¼ ð1=helÞhmwatCpwat
�Twat;finaleTwat;initial
i.3;600;000
(23)
Fig. 16 displays the end-use electrical energy savings realized bythe ASHPWH relative to conventional EWH, calculated according toequation (24), in different Lebanese climatic zones all around theyear. It shows great savings ranging between 69% and 82%.Consecutively, the reductions in primary energy consumption, GHG(greenhouse gas) emissions and operating costs will follow almostthe same trend of percentage savings as that of the end-use elec-trical energy savings. According to zones, zone 1 has the greatestenergy savings contrary to zone 4, while zones 2 and 3 experienceclose savings in all months except for January and March, wherezone 2 is clearly more efficient.
ES ¼ 100*ðEEWHeEASHPWHÞ=EEWH (24)
Fig. 17 illustrates the time elapsed to achieve one HC in differentLebanese climatic zones for different annual periods. It is revealedthat the time needed varies between 3.45 and 1.9 h due to thevariation of ambient temperature. These values are quite less than7.74 h-the time needed to heat water using the considered EWH,even though it has higher electrical power.
Fig. 18 shows the monthly absolute amount of GHG, in kg of CO2equivalent (kg CO2-eq), emitted by the ASHPWH per one HC indifferent Lebanese climatic zones. It is worth to mention that theelectricity generation follows the assumptions below:
Fig. 15. Monthly electrical energy consumed per one HC.
water heater: Dynamic modeling, optimal energy management and.2013.11.017

Fig. 18. Monthly GHG emitted by ASHPWH per one HC while it is 7.47 kg CO2-eq forEWH.
Table 4Percentage share of energy sources in electricity generation and correspondingthermal power plant efficiencies in Lebanon for the year 2008 (Data source: [32]).
Fig. 16. Monthly percentage of end-use electrical energy savings.
O. Ibrahim et al. / Energy xxx (2013) 1e1510
� The energy sources share in electricity generation and the cor-responding thermal power plant efficiencies are considered thesame as that for the case of Lebanon in 2008. These data areillustrated in Table 4
� The electrical energy purchased is considered to be generated bya thermal power plant with an efficiency of 50% and uses NG(natural gas) as a fuel
� Technical loss constitute 15%� Non-technical loss is neglected
Additionally, Table 5 shows, for some fuel types, the total (directand indirect) amount of equivalent mass of CO2 emitted per kWhthon a NCV (net calorific value) basis.
The GHG (greenhouse gas) emissions are calculated as follows:
GHG¼Xi
h�ððE=0:85Þ*%shareÞ=hpowerplant
*kgCO2�eq=kWhth
i
(25)
where i: counter that c electricity production.It is obvious that an important amount of GHG emissions could
be reduced by using ASHPWH instead of EWH which emits about7.47 kg CO2-eq per one HC. Moreover, GHG emissions decrease withambient temperature increase for ASHPWH (Fig. 18).
In the view of the illustrated results and aiming to study thevariation of electrical energy consumption per one HC during awhole day, the day time is divided into three periods: morning(6:00 to 10:00), noon (10:00 to 14:00) and afternoon (14:00 to18:00) and the night time is divided into two periods: evening(18:00 to 24:00) and night (24:00 to 6:00). After that, the hourlyambient temperatures for a typical day in February are selected forthe four Lebanese cities representing the four climatic zones: Beirut(Z1), Qartaba (Z2), Zahle (Z3) and Cedars (Z4) [5]. The average
Fig. 17. Monthly time elapsed per one HC using ASHPWH while it is 7.74 h for EWH.
Please cite this article in press as: Ibrahim O, et al., Air source heat pumpmini-tubes condensers, Energy (2013), http://dx.doi.org/10.1016/j.energy
temperature for each of the defined periods is calculated and then,using equations (8) and (9), the electrical energy consumed per oneHC during each period is determined (Fig. 19).
It is noticed that the minimum energy consumption for the fourzones is during the noon (Z2 & Z3) or afternoon (Z1 & Z4) periods.This is expected since these periods experience the highest ambienttemperatures. Thus, the noon or afternoon, according to the region,is the optimum time period to utilize the ASHPWH, assuming thatthe electricity tariff and hot water loads are constant.
5. Management problem
The aim of this section is to define an optimal managementmodel that has the capability to determine the optimum opera-tional time-intervals of the ASHPWH, which would yield the min-imum operational cost during a certain period of time providedthat the water temperature is maintained above a pre-specifiedminimum value. Thus, an objective function “f” that should beminimized is defined as follows:
f ¼Xt
PEi*Dt*costelec*10�3 t ¼ tinitial/tfinal (26)
where:
� Dt: the operational time-interval of ASHPWH during a certainperiod of time [h]
� costelec: cost of electricity consumed [$/kWh]
Energy source Percent share (%) Efficiency of correspondingpower plant (%)
Gas oil (1)a 52.53 47Gas oil (2)b 4.69 28Heavy fuel oil 34.44 33Hydro 3.3 e
Purchase (natural gas) 5.04 50
a GO(1) refers to the gas oil used by the Zahrani & Beddawi power plants.b GO(2) refers to gas oil used by Tyre and Baalbek power plants.
Table 5CO2 emissions of some fuel types (Data source: [33]).
Fuel type Gas oil Heavy fuel oil Natural gas
kg CO2-eq/kWhth (NCV basis) 0.3474 0.33255 0.22419
water heater: Dynamic modeling, optimal energy management and.2013.11.017

O. Ibrahim et al. / Energy xxx (2013) 1e15 11
Additionally, the following constraints are adopted:
Table 6Coefficients of polynomial PEi.
p00 481.7p10 10.4p01 �4.351p20 �1.24p11 0.5677
Twat � 45 �C t ¼ tinitial/tfinalTwat � 55 �C t ¼ tinitial/tfinal10 � Dt � 60 min or Dt ¼ 0 t ¼ tinitial/tfinalTwatðtÞ ¼ Twatðt � 1Þ þ �
PEi*COP*Dt*10�3 � Qload � Qloss���
m*Cp=3;600;000�wat t ¼ tinitial/tfinal
TwatðtinitialÞ ¼ 55 �C
Several simulations have been performed using the developedmodel for ASHPWH at various ambient temperatures. Simulationresults are then used to select different data for PEi and COP forvarious values of ambient air and water temperatures. Then, theobtained data are used to formulate modeling polynomials for boththe input power (equation (27)) and COP (equation (28)) ofASHPWH as a function of two parameters; the ambient tempera-ture and the water temperature, using the surface fitting tool ofMatlab software. Tables 6and 7 illustrate the coefficients of poly-nomials “PEi” and “COP”, respectively.
PEi ¼ p00þ p10*Ta þ p01*Twat þ p20*T2a þ p11*Ta*Twat
þ p02*T2wat þ p30*T3a þ p21*T2a *Twat þ p12*Ta*T2wat
(27)
COP ¼ c00þ c10*Ta þ c01*Twat þ c20*T2a þ c11*Ta*Twat
þ c02*T2wat þ c30*T3a þ c21*T2a *Twat þ c12*Ta*T2wat
(28)
The developed optimization model is applied for a typicalwinter day of Beirut-Lebanon. The variations of ambient tempera-ture and hot water consumption profile of the considered typicalday are illustrated in Figs. 20 and 21, respectively.
Thus, the ambient temperature data is used as input for thedeveloped polynomial equations of both the input power and COP.As for the hot water consumption profile, it is used to evaluate Qloadat different periods of the chosen typical day, using equation (29).
Qload ¼ _m*Cp*�Tconsumee Ttap
�*dt=3;600;000 (29)
where
� Tconsume: the temperature of the consumed hot water, which isconsidered 45 �C in this study
Fig. 19. Electrical energy consumed per one HC during different day periods fordifferent Lebanese climatic zones during February.
Please cite this article in press as: Ibrahim O, et al., Air source heat pumpmini-tubes condensers, Energy (2013), http://dx.doi.org/10.1016/j.energy
� Ttap: the tap water temperature; it is determined using equation(30) [35]
Ttap ¼ 1:28þ 0:19Tmean1 þ 0:79Tmean2 (30)
where
Tmean1: daily average outdoor air temperature on the sameday (�C)Tmean2: average outdoor air temperature for past seven days (�C)
Note that, in this study, themiddle day of the season is chosen tocalculate the tap water for a typical day of the studied season.
Concerning the electricity cost, the Lebanese electricity sector isconstituted of two electricity sources; the formal grid electricityand informal private power generators [36,37]. Hence, the electricaltariff is not uniform and depends on the energy source being used.Two typical daily electricity profiles, which are illustrated inFig. 22a and b, represent the major electricity cases in “Great Bei-rut”. These two profiles are assumed to be equally distributedduring the whole year. In this study, the profile shown in Fig. 22a iscalled profile (a) and the other is denoted profile (b). Note that thecost of grid electricity is about 17 US cent/kWh [38] and that of theelectricity produced by private generators is about 31 US cent/kWh[39].
Therefore, the optimal management model is solved for the twoelectricity profiles using “Lingo” software [40]. Simulation resultsindicate the optimum operational time-interval of ASHPWH during
p02 0.1946p30 0.0201p21 �0.002125p12 �0.003316
Table 7Coefficients of polynomial COP.
c00 3.185c10 0.4046c01 �0.04929c20 �0.005833c11 �0.00727c02 0.00023c30 5.722e-5c21 2.75e-5c12 4.6e-5
water heater: Dynamic modeling, optimal energy management and.2013.11.017

Fig. 23. Optimum operational time during each hour of a typical winter day of Beirut.
Fig. 24. Optimum variation of water temperature during a typical winter day of Beirut.
Fig. 20. Ambient temperature for a typical winter day of Beirut.
Fig. 21. Hot water consumption profiles for typical days of each season in Lebanon(Data source: [34]).
O. Ibrahim et al. / Energy xxx (2013) 1e1512
each hour for a typical winter day of Beirut for the two electricityprofiles (a) and (b). Fig. 23 reveals that, for the electricity profile (a),the system operates only when the cheaper grid electricity is on;however, for electricity profile (b), the system operates about90min during the period of grid electricity and about 16min duringthe period of generator electricity. Thus, the management modelsuggests the ASHPWH operation periods to be maximized, whenthe electricity tariff is low and therefore, the operational cost isminimized.
Fig. 24 shows the variation of the average temperature of waterin the reservoir during a typical winter day of Beirut for the twoelectricity profiles. It is clear that the water temperature isapproximately the same from hour 22 to hour 9 for the two profilesand it is higher for electricity profile (a) between hours 13 and 17.
The same case study is investigated using the same ASHPWHbut controlled via a thermostat. It is shown that a significantportion of the energetic operational bill for a typical winter day inBeirut could be saved using an ASHPWH controlled according to theproposed management model-findings, when compared with thelater control method (thermostat). Fig. 25 reveals bill savings ofabout 47% and 41% considering electricity profiles (a) and (b),respectively.
Fig. 22. Typical daily electricity profiles in Great Beirut (a) 16 h grid & 8
Please cite this article in press as: Ibrahim O, et al., Air source heat pumpmini-tubes condensers, Energy (2013), http://dx.doi.org/10.1016/j.energy
From the practical point of view, the proposed optimal man-agement model could be used as a part of a BEMS (building energymanagement system). BEMS is a computer-based control systemthat controls and monitors the building’s mechanical and electricalequipment. Therefore, specifying certain inputs such as 1) differentdomestic hot water load profiles for different periods of the yearand different days of the week (week-end or work days), 2) elec-tricity profiles and 3) empirical or simulator performancemodel forthe ASHPWH, the presented model is believed to be a part of theinternal algorithm or the simulator of a BEMS that is responsible fordomestic water heating control in residences.
6. ASHPWH with mini-tubes condenser
In earlier studies, it has been shown that the heat transfer co-efficients increase with decreasing diameter of the tubes in heatexchangers [41e43]. This has led to a greater reliance on the use ofmini-channels in industry to produce compact heat exchangers formany applications. Currently, mini-channel heat exchangers arewidely used in air conditioning systems of vehicles [44,45]. How-ever, the use of this type of heat exchangers in residential appli-cations is still under investigation.
h generator [profile (a)]; (b) 8 h grid & 16 h generator [profile (b)].
water heater: Dynamic modeling, optimal energy management and.2013.11.017
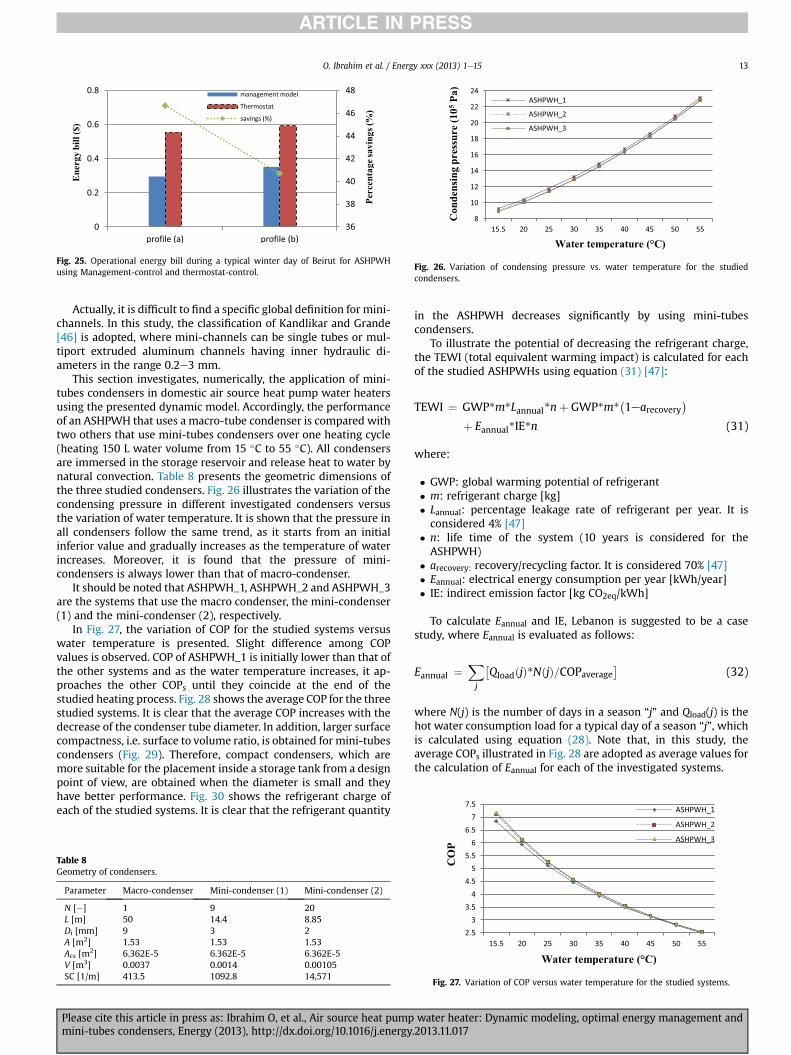
Fig. 26. Variation of condensing pressure vs. water temperature for the studiedcondensers.
Fig. 25. Operational energy bill during a typical winter day of Beirut for ASHPWHusing Management-control and thermostat-control.
O. Ibrahim et al. / Energy xxx (2013) 1e15 13
Actually, it is difficult to find a specific global definition for mini-channels. In this study, the classification of Kandlikar and Grande[46] is adopted, where mini-channels can be single tubes or mul-tiport extruded aluminum channels having inner hydraulic di-ameters in the range 0.2e3 mm.
This section investigates, numerically, the application of mini-tubes condensers in domestic air source heat pump water heatersusing the presented dynamic model. Accordingly, the performanceof an ASHPWH that uses a macro-tube condenser is compared withtwo others that use mini-tubes condensers over one heating cycle(heating 150 L water volume from 15 �C to 55 �C). All condensersare immersed in the storage reservoir and release heat to water bynatural convection. Table 8 presents the geometric dimensions ofthe three studied condensers. Fig. 26 illustrates the variation of thecondensing pressure in different investigated condensers versusthe variation of water temperature. It is shown that the pressure inall condensers follow the same trend, as it starts from an initialinferior value and gradually increases as the temperature of waterincreases. Moreover, it is found that the pressure of mini-condensers is always lower than that of macro-condenser.
It should be noted that ASHPWH_1, ASHPWH_2 and ASHPWH_3are the systems that use the macro condenser, the mini-condenser(1) and the mini-condenser (2), respectively.
In Fig. 27, the variation of COP for the studied systems versuswater temperature is presented. Slight difference among COPvalues is observed. COP of ASHPWH_1 is initially lower than that ofthe other systems and as the water temperature increases, it ap-proaches the other COPs until they coincide at the end of thestudied heating process. Fig. 28 shows the average COP for the threestudied systems. It is clear that the average COP increases with thedecrease of the condenser tube diameter. In addition, larger surfacecompactness, i.e. surface to volume ratio, is obtained for mini-tubescondensers (Fig. 29). Therefore, compact condensers, which aremore suitable for the placement inside a storage tank from a designpoint of view, are obtained when the diameter is small and theyhave better performance. Fig. 30 shows the refrigerant charge ofeach of the studied systems. It is clear that the refrigerant quantity
Table 8Geometry of condensers.
Parameter Macro-condenser Mini-condenser (1) Mini-condenser (2)
N [e] 1 9 20L [m] 50 14.4 8.85Di [mm] 9 3 2A [m2] 1.53 1.53 1.53Acs [m2] 6.362E-5 6.362E-5 6.362E-5V [m3] 0.0037 0.0014 0.00105SC [1/m] 413.5 1092.8 14,571
Please cite this article in press as: Ibrahim O, et al., Air source heat pumpmini-tubes condensers, Energy (2013), http://dx.doi.org/10.1016/j.energy
in the ASHPWH decreases significantly by using mini-tubescondensers.
To illustrate the potential of decreasing the refrigerant charge,the TEWI (total equivalent warming impact) is calculated for eachof the studied ASHPWHs using equation (31) [47]:
TEWI ¼ GWP*m*Lannual*nþ GWP*m*�1earecovery
�þ Eannual*IE*n (31)
where:
� GWP: global warming potential of refrigerant� m: refrigerant charge [kg]� Lannual: percentage leakage rate of refrigerant per year. It isconsidered 4% [47]
� n: life time of the system (10 years is considered for theASHPWH)
� arecovery: recovery/recycling factor. It is considered 70% [47]� Eannual: electrical energy consumption per year [kWh/year]� IE: indirect emission factor [kg CO2eq/kWh]
To calculate Eannual and IE, Lebanon is suggested to be a casestudy, where Eannual is evaluated as follows:
Eannual ¼Xj
�QloadðjÞ*NðjÞ=COPaverage
�(32)
where N(j) is the number of days in a season “j” and Qload(j) is thehot water consumption load for a typical day of a season “j”, whichis calculated using equation (28). Note that, in this study, theaverage COPs illustrated in Fig. 28 are adopted as average values forthe calculation of Eannual for each of the investigated systems.
Fig. 27. Variation of COP versus water temperature for the studied systems.
water heater: Dynamic modeling, optimal energy management and.2013.11.017

Fig. 30. Refrigerant charge for the studied systems.Fig. 28. Average COP of the studied systems.
O. Ibrahim et al. / Energy xxx (2013) 1e1514
The indirect emission factor is evaluated using the equation(33):
IE ¼Xi
h�%shareðiÞ*kg CO2eq=kWhthðiÞ
��hpower plantðiÞ
i
(33)
where “i” corresponds to the energy source used in electricityproduction, knowing that the profile structure for the Lebaneseelectricity sector follows the assumptions stated previously insection 4.
Thus, TEWI is evaluated for each of the studied systems in theLebanese context. It is proved that using a mini-tubes condenserreduces significantly the total amount of equivalent CO2 emittedduring the life cycle of an air source heat pumpwater heater. Fig. 31shows that compared with ASHPWH_1, a decrease of about 18.5%and 21.3% are achieved using ASHPWH_2 and ASHPWH_3,respectively.
7. Conclusion
A dynamic simulation program was developed using MATLABsoftware to study the transient characteristics of an ASHPWH (airsource heat pumpwater heater). Heat exchangers weremodeled bylumped parameter-moving boundary approach while actuatorcomponents were modeled by static designs. The models werebased on the fundamental principles of heat transfer, thermody-namics and fluid mechanics. The simulation programwas validatedusing experimental data [16]. Consequently, the performance of aspecified ASHPWH was studied versus ambient temperature in thedifferent four Lebanese climatic zones. It was shown that for allLebanese climatic zones; the expected monthly values of theaverage COP per one HC (heating cycle) will vary from 2.9 to 5,
Fig. 29. Surface compactness of the studied systems.
Please cite this article in press as: Ibrahim O, et al., Air source heat pumpmini-tubes condensers, Energy (2013), http://dx.doi.org/10.1016/j.energy
leading to very high efficiencies compared to conventional electricwater heaters. Therefore, this leads to significant savings in end-useelectrical energy consumption (69%e82%), GHG emissions andoperating costs. According to climatic zones, zone 1 experiences thegreatest savings using ASHPWH unlike zone 4, while zones 2 and 3experience close savings. These results are attributed to the averageambient temperatures in each zone, where zone 1 has the highestvalues, whereas zone 4 has the lowest values and zones 2 and 3havemedian values all around the year. Furthermore, it was noticedthat the lowest electrical energy consumption for one HC during afull day is in the period of highest daily ambient temperature (noonor afternoon). Thus, it is recommended to use the ASHPWH duringthis period, assuming that the electricity tariff and hot water loadsare constant.
Moreover, an optimal management model is formulated for theASHPWH. The developed optimization model is applied for atypical winter day of Beirut, where the results illustrate the opti-mum operational time during each hour for two different elec-tricity profiles. Following the resulted operation trend, more than41% of the energy bill is saved comparing with a conventionally-controlled ASHPWH by a thermostat. Furthermore, the presentedmanagement model is believed to be a part of the internal algo-rithm or the simulator of a building energy management systemthat is responsible for domestic water heating control in residences.
In addition, the developed model for ASHPWH is used tocompare the performance of three similar systems with differentcondenser geometries. One uses a macro-tube condenser havinginternal diameter of 9 mm (ASHPWH_1) and the two others usemini-tube condensers having internal diameters of 3 mm(ASHPWH_2) and 2 mm (ASHPWH_3). It is considered that allcondensers have the same external surface area as well as the sameoverall cross sectional area. Simulation results revealed that mini-
Fig. 31. TEWI for the studied systems.
water heater: Dynamic modeling, optimal energy management and.2013.11.017
O. Ibrahim et al. / Energy xxx (2013) 1e15 15
condensers increase the average coefficient of performance andthus, more energy is saved as well as it increases the “surfacecompactness” factor, i.e. the surface to volume ratio, giving rise toan efficient compact heat exchanger. Also, using these condensergeometries, the refrigerant charge is significantly decreased andconsequently, more greenhouse gas emissions are reduced.Furthermore, the total equivalent warming impact is evaluated foreach of the investigated systems in the Lebanese context.Comparedwith ASHPWH_1, a decrease of about 18.5% and 21.3% areachieved using ASHPWH_2 and ASHPWH_3, respectively.
Finally, further investigations are to be carried out in order toimprove the ASHPWH dynamic model through the development ofmore sophisticated models for the actuator components.
Acknowledgment
The authors would like to thank the Azm research center atEDST-Lebanese University as well as the Lebanese National Councilfor Scientific Research (CNRS) for their support.
References
[1] World Bank. Lebanon social impact analysis-electricity and water sectors;2009. Report No. 48993-LB.
[2] Bakirci K, Ozyurt O, Comakli K, Comakli O. Energy analysis of a solar-groundsource heat pump system with vertical closed-loop for heating applications.Energy 2011;36:3224e32.
[3] Hepbasli A, Kalinci Y. A review of heat pump water heating systems. RenewSustain Energy Rev 2009;13:1211e29.
[4] Li DHW, Yang L, Lam JC. Zero energy buildings and sustainable developmentimplications e a review. Energy 2013;54:1e10.
[5] UNDP-United Nations Development Program. Climatic zoning for buildings inLebanon; 2005.
[6] Internal report, estimation of the balance point for an air source heat pumpwater heater in different Lebanese zones. University Institute of Technology,Lebanese University; 2012.
[7] Michopoulos A, Zachariadis T, Kyriakis N. Operation characteristics andexperience of a ground source heat pump system with a vertical ground heatexchanger. Energy 2013;51:349e57.
[8] Kwon O, Cha D, Park C. Performance evaluation of a two-stage compressionheat pump system for district heating using waste energy. Energy 2013;57:375e81.
[9] Fu L, Ding G, Zhang C. Dynamic simulation of air-to-water dual-mode heatpump with screw compressor. Appl Therm Eng 2003;23:1629e45.
[10] Mei VC, Chen FC, Domitrovic RE, Kilpatrick JK, Carter JA. A study of a naturalconvection immersed condenser heat pump water heater. ASHRAE Trans2003;109. Part 2.
[11] Kim M, Kim MS, Chung JD. Transient thermal behavior of a water heatersystem driven by a heat pump. Int J Refrig 2004;27:415e21.
[12] Morrison GL, Anderson T, Behnia M. Seasonal performance rating of heatpump water heaters. Solar Energy 2004;76:147e52.
[13] Techarungpaisan P, Theerakulpisut S, Priprem S. Modeling of a split type airconditioner with integrated water heater. Energy Convers Manag 2007;48:1222e37.
[14] Zhang J, Wang RZ, Wu JY. System optimization and experimental research onair source heat pump water heater. Appl Therm Eng 2007;27:1029e35.
[15] Ji J, Fu H, He H, Pei G. Performance analysis of an air-source heat pump usingan immersed water condenser. Front Energy Power Eng China 2009;4(2):234e45.
[16] Guo JJ, Wu JY, Wang RZ, Li S. Experimental research and operation optimizationof an air-source heat pump water heater. Appl Energy 2011;88:4128e38.
[17] Rasmussen BP, Alleyne AG. Dynamic modeling and advanced control of airconditioning and refrigeration system; 2006. ACRC: TR-244.
[18] Fardoun F, Ibrahim O, Zoughaib A. Dynamic modeling of an air source heatpump water heater. In: 10th International Energy Agency (IEA) Heat PumpConference 2011. Tokyo, Japan.
[19] Fardoun F, Ibrahim O, Zoughaib A. Quasi-steady state modeling of an airsource heat pump water heater. Energy Procedia 2011;6:325e30.
[20] Fardoun F, Hajjar M, Fardoun H. Heat pump designing and optimization tool.In: International Conference on Advances in Computational Tools for Engi-neering Applications. Beirut, Lebanon: ACTEA; 2009.
Please cite this article in press as: Ibrahim O, et al., Air source heat pumpmini-tubes condensers, Energy (2013), http://dx.doi.org/10.1016/j.energy
[21] Li YW, Wang RZ, Wu JY, Xu YX. Experimental performance analysis andoptimization of a direct expansion solar-assisted heat pump water heater.Energy 2007;32:1361e74.
[22] Kong XQ, Zhang D, Li Y, Yang QM. Thermal performance analysis of a direct-expansion solar-assisted heat pump water heater. Energy 2011;36:6830e8.
[23] Moreno-Rodríguez A, González-Gil A, Izquierdo M, Garcia-Hernando N. Theo-retical model and experimental validation of a direct-expansion solar assistedheat pump for domestic hot water applications. Energy 2012;45:704e15.
[24] Bendapudi S, Braun JE, Groll EA. A comparison of moving-boundary and finite-volume formulations for transients in centrifugal chillers. Int J Refrig 2008;31:1437e52.
[25] Li B, Alleyne AG. A full dynamic model of a HVAC vapor compression cycleinteracting with a dynamic environment. In: American Control Conference. St.Louis, MO, USA: Hyatt Regency Riverfront; June 10-12, 2009.
[26] McKinley TL, Alleyne AG. An advanced nonlinear switched heat exchangermodel for vapor compression cycles using the moving-boundary method. Int JRefrig 2008;31:1253e64.
[27] ASHRAE-American Society of Heating, Refrigerating and Air-ConditioningEngineers. Two-phase flow. HandbookCD, fundamentals; 2001.
[28] Granryd E, Ekroth I, Lundqvist P, Melinder Â, Palm B, Rohlin P. Refrigeratingengineering. Stockholm: Royal Institute of Technology, KTH; 2005 [26]Churchill SW and Chu HHS. Correlating equations for laminar and turbulentfree convection from a horizontal cylinder. International Journal of heat andmass transfer 1975, 18:1049e53.
[29] Sanaye S, Chahartaghi M, Asgari H. Dynamic modeling of gas engine drivenheat pump system in cooling mode. Energy 2013;55:195e208.
[30] Yokoyama R, Shimizu T, Ito K, Takemura K. Influence of ambient temperatureson performance of a CO2 heat pump water heating system. Energy 2007;32:388e98.
[31] Yang JL, Ma YT, Li MX, Hu J. Modeling and simulating the transcritical CO2 heatpump system. Energy 2010;35:4812e8.
[32] EDL-Electricité du Liban. Annual report of the institution business during theyear 2008, issued in December 2010.
[33] 2011 Guidelines to Defra/DECC’s GHG Conversion factors for CompanyReporting. Produced by AEA for the Department of Energy and ClimateChange (DECC) and the Department for Environment, Food and Rural Affairs(Defra), version 1.2, updated on August 8, 2011.
[34] Houri A, Salloum H, Ali A, Abdel Razik AK, Houri L. Assessment of energy andfinancial performance of a solar hot water system in a single family dwelling:case study from Marjeyoun-South Lebanon. LCEC-The Lebanese Center forEnergy Conservation; 2009.
[35] Shimoda Y, Okamura T, Yamaguchi Y, Yamaguchi Y, Taniguchi A, Morikawa T.City-level energy and CO2 reduction effect by introducing new residentialwater heaters. Energy 2010;35:4880e91.
[36] Ibrahim O, Fardoun F, Younes R, Louahlia-Gualous H. Energy status in Lebanonand electricity generation reform plan based on cost and pollution optimi-zation. Renew Sustain Energy Rev 2013;20:255e78.
[37] Ibrahim O, Fardoun F, Younes R, Louahlia-Gualous H, Ghandour M. Multi-variable optimization for future electricity-plan scenarios in Lebanon. EnergyPolicy 2013;58:49e56.
[38] MEW-Ministry of Energy and Water. The minister: Jebran Bassil. Policy paperfor the electricity sector; June 2010.
[39] Energy ministry sets price for generator services. The Daily Star. Availablefrom: http://dailystar.com.lb/Business/Lebanon/2012/Nov-02/193610-energy-ministry-sets-price-for-generator-services.ashx#axzz2SWuN7Y6L;November 2, 2012.
[40] Lingo user’s guide. Lindo systems Inc; 2011<www.lindosystems.org>.[41] Tuckerman DB, Pease RF. High performance heat sinking for VLSI. IEEE Elec-
tron Device Lett 1981;EDL-2:126e9.[42] Yan YY, Lin TF. Condensation heat transfer and pressure drop of refrigerant R-
134a in a small pipe. Int J Heat Mass Transf 1999;42:697e708.[43] Yang CY, Webb RL. Condensation of R12 in small hydraulic diameter extruded
aluminum tubes with and without micro-fins. Int J Heat Mass Transf 1996;39:791e800.
[44] Shin JS, Kim MH. An experimental study of condensation heat transfer inside amini-channel with a new measurement technique. Int J Multiphase Flow2004;30:311e25.
[45] Matkovic M, Cavallini A, Del Col D, Rossetto L. Experimental study oncondensation heat transfer inside a single circular minichannel. Int J HeatMass Transf 2009;52:2311e23.
[46] Kandlikar SG, Grande WJ. Evolution of microchannel flow passages-thermohydraulic performance and fabrication technology. Heat Transf Eng2003;24:3e17.
[47] The Australian Institute Of Refrigeration, Air Conditioning And Heating.Methods of calculating total equivalent warming impact (TEWI) 2012, bestpractice guidelines; 2012.
water heater: Dynamic modeling, optimal energy management and.2013.11.017


