Air Quality Technical Report Honolulu High-Capacity Transit Corridor...
32
Air Quality Technical Report Honolulu High-Capacity Transit Corridor Project December 18, 2006 Prepared for: City and County of Honolulu and Federal Transit Administration Prepared by: Parsons Brinckerhoff AR00066169
Transcript of Air Quality Technical Report Honolulu High-Capacity Transit Corridor...
Air Quality Technical Report Honolulu High-Capacity Transit Corridor
Project
December 18, 2006
Prepared for: City and County of Honolulu
and Federal Transit Administration
Prepared by: Parsons Brinckerhoff
AR00066169

Table of Contents
SUMMARY S-1
CHAPTER 1 INTRODUCTION 1-1
Project Description 1-1 Description of the Study Corridor 1-1 Alternatives under Consideration 1-3
Project Purpose 1-5
Project Area Needs 1-6 Improved Mobility for Travelers Facing Increasingly Severe Traffic Congestion 1-6 Improved Transportation System Reliability 1-6 Accessibility to New Development in Twa/Kapolei/Makakilo as a Way of Supporting Policy to Develop the Area as a Second Urban Center 1-7 Improved Transportation Equity for All Travelers 1-7
Project Schedule 1-7
CHAPTER 2 STUDIES AND COORDINATION 2-1
Clean Air Act Amendments of 1990 2-1
National and State Ambient Air Quality Standards 2-1
Criteria Pollutants and Their Effects 2-2
Mobile Source Air Toxics 2-5
CHAPTER 3 METHODOLOGY 3-1
Regulatory and Monitored Air Quality Information 3-1
Regional Air Quality Analysis 3-1 VOC and NOx 3-1 PM10 and PM2 5 3-1 Mobile Source Air Toxics 3-2 Carbon Monoxide 3-2
CHAPTER 4 AFFECTED ENVIRONMENT 4-1
Air Quality Levels and Compliance 4-1
Ambient Air Quality in the Study Area 4-1 Local Meteorology 4-1 Monitored Air Quality 4-2
CHAPTER 5 IMPACTS 5-1
Regional Assessment 5-1 VOC, CO, NOx, PM10 and PM2 5 Impacts 5-1 MSAT Impacts 5-2
Construction Impacts on Air Quality 5-4
Air Quality Technical Report Page i Honolulu High-Capacity Transit Corridor Project
AR00066170

CHAPTER 6 MITIGATION 6-1
Operation 6-1
Construction 6-1 Site Preparation 6-1 Construction 6-1 Post-Construction 6-1 Mobile Source Emissions 6-2
REFERENCES R-1
List of Tables
Table S-1. Summary of 2030 Transportation Air Quality Emissions S-1
Table 1-1. Fixed Guideway Alternative Analysis Sections and Alignments 1-5
Table 2-1. National and State Ambient Air Quality Standards 2-2
Table 4-1. Ambient Air Quality Monitor Data 2003-2005 4-3
Table 5-1. Year 2030 Regional Pollutant Burdens (kg/day) 5-3
List of Figures
Figure 1-1. Project Vicinity 1-1
Figure 1-2. Areas and Districts in the Study Corridor 1-2
Figure 1-3. Project Schedule 1-8
Figure 2-1. Relative Particulate Matter Size 2-4
Page ii Air Quality Technical Report Honolulu High-Capacity Transit Corridor Project
AR00066171

Acronyms Used in this Document
AA Alternatives Analysis CAA Clear Air Act CAAA Clean Air Act Amendments CFR Code of Federal Regulations CO carbon monoxide DBEDT Department of Business, Economic Development and Tourism DP Development Plan DTS Department of Transportation Services EIS Environmental Impact Statement EPA Environmental Protection Agency FTA Federal Transit Administration H25 Hydrogen Sulfide HC hydrocarbons HDOH Hawai'i Department of Health kg Kilogram MSAT Mobile Source Air Toxics NAAQS National Ambient Air Quality Standards NEPA National Environmental Policy Act NOx nitrogen oxides OMPO 0' ahu Metropolitan Planning Organization ORTP 0`ahu Regional Transportation Plan 03 ozone Pb lead PMio particulate matter (particles smaller than or equal to 10 microns in size) PM2 5 particulate matter (particles smaller than or equal to 2.5 microns in size) SO2 sulfur dioxide TIP Transportation Improvement Plan TSM Transportation System Management UH University of Hawai`i VMT Vehicle Miles Traveled VOC Volatile Organic Compounds
Air Quality Technical Report Page iii Honolulu High-Capacity Transit Corridor Project
AR00066172

Summary
The City and County of Honolulu Department of Transportation Services (DTS), in coordination with the U.S. Department of Transportation Federal Transit Administration (FTA), is preparing an Alternatives Analysis (AA) and an Environmental Impact Statement (EIS) to evaluate alternatives that would provide high-capacity transit service on 0`ahu. The project's purpose and need focus on meeting the area's current and future regional transportation needs. The project is listed on 0`ahu's Transportation Improvement Plan (TIP).
This report evaluates the quantity of air pollutant emissions that would occur with each of the project alternatives. Air pollutants that can be traced principally to motor vehicles are relevant to the evaluation of project impacts. These pollutants include carbon monoxide (CO), volatile organic compounds (VOC), nitrogen oxides (N0x), particulate matter (PM io and PM2 5), and the six priority Mobile Source Air Toxics (MSAT). The State of Hawai`i is designated as an attainment area for CO, ozone (03), PMio and PM2 5.
Project construction-related air quality effects would be limited to short-term increased fugitive dust and mobile-source emissions.
Project operation-related air quality effects are predicted based on the anticipated vehicle miles traveled (VMT) and average network speed for each alternative. Alternative 2 (Transportation System Management (TSM)) and Alternative 4 (Fixed Guideway) are predicted to slightly reduce regional pollutant levels compared to Alternative 1 (No Build). Alternative 3 (Managed Lane) is predicted to slightly increase regional pollutant levels compared to the No Build Alternative (Table 5-1). The project is not expected to measurably increase MSAT levels.
Table S-1. Summary of 2030 Transportation An- Quality Emissions
Alternative
Alternative 1: No Build Alternative
Daily Emissions (kg/day)
VOC CO NOx PIV110 P M2.5
No Build 8,042 142,975 4,784 424 203 Alternative 2: TSM Alternative TSM 7,980 142,010 4,747 420 201 Alternative 3: Managed Lane Alternative Two-Direction Option 8,031 143,542 4,801 424 203 Reversible Option 8,338 147,043 4,926 438 210 Alternative 4: Fixed Guideway Alternative Fixed Guideway — Minimum 7,755 139,002 4,644 410 196 Fixed Guideway — Maximum 7,796 139,742 4,669 412 197
kg = kilogram
Air Quality Technical Report
Page S-1 Honolulu High-Capacity Transit Corridor Project
AR00066173

WrI Poloh,
411/1 Kau.,
H,
Pacific Ocean
Wadmole Cl
Watallole
Anunnariu
NarlakH11
WW1 HL,A1
ISLAND OF OAHU Honolulu High-Capacity Transit Corridor Project
A
Salt Lgke
di.1111111,1
n arston Do - wn
■14;;*rsity
WIcik
ahalm Head
.RCES L,qi Alias GIS v4.0 19213,1nicimilicr Delmey System MS}, Mareli 1 ,X49. Crly and Carly of 1-15ndulu, Otither 1g98
Med.
411. Nol To Scale
Chapter 1
Introduction The City and County of Honolulu Department of Transportation Services (DTS), in coordination with the U.S. Department of Transportation Federal Transit Administration (FTA), has carried out an Alternatives Analysis (AA) to evaluate alternatives that would provide high-capacity transit service on 0' ahu. The primary project study area is the travel corridor between Kapolei and the University of Hawai`i at Manoa (UH Manoa) (Figure 1-1). This corridor includes the majority of housing and employment on 0`ahu. The east-west length of the corridor is approximately 23 miles. The north-south width of the corridor is at most four miles, as much of the corridor is bounded by the Ko`olau and Wai` anae Mountain Ranges to the north and the Pacific Ocean to the south.
Figure 1-1. Project Vicinity
Project Description Description of the Study Corridor
The study corridor extends from Kapolei in the west (Wai` anae or 'Ewa direction) to the University of Hawai`i at Manoa (UH Manoa) in the east (Koko Head direction), and is confined by the Wai` anae and Ko`olau Mountain Ranges to the north (mauka direction) and the Pacific Ocean to the south (makai direction). Between Pearl City and `Aiea, the corridor's width is less than one mile between the Pacific Ocean and the base of the Ko`olau Mountains.
Air Quality Technical Report
Page 1-1 Honolulu High-Capacity Transit Corridor Project
AR00066174
CENTRAL CiAHU'
OW TOWN
KAIA'AKO
LEGEND
Study Corndor
Major Roads
0 0250S 1 15
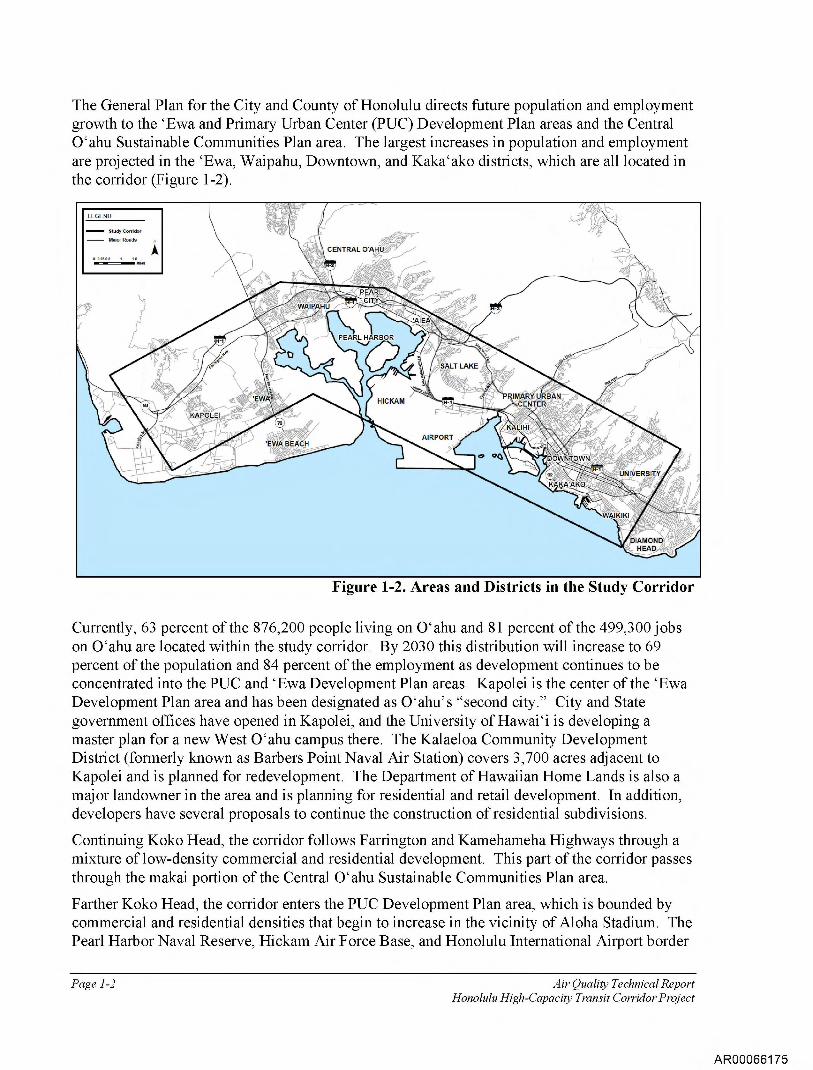
Figure 1-2. Areas and Districts in the Study Corridor
Currently, 63 percent of the 876,200 people living on 0' ahu and 81 percent of the 499,300 jobs on 0`ahu are located within the study corridor. By 2030 this distribution will increase to 69 percent of the population and 84 percent of the employment as development continues to be concentrated into the PUC and 'Ewa Development Plan areas. Kapolei is the center of the 'Ewa Development Plan area and has been designated as 0' ahu' s "second city." City and State government offices have opened in Kapolei, and the University of Hawai‘i is developing a master plan for a new West 0' ahu campus there. The Kalaeloa Community Development District (formerly known as Barbers Point Naval Air Station) covers 3,700 acres adjacent to Kapolei and is planned for redevelopment. The Department of Hawaiian Home Lands is also a major landowner in the area and is planning for residential and retail development. In addition, developers have several proposals to continue the construction of residential subdivisions.
Continuing Koko Head, the corridor follows Farrington and Kamehameha Highways through a mixture of low-density commercial and residential development. This part of the corridor passes through the makai portion of the Central 0' ahu Sustainable Communities Plan area.
Farther Koko Head, the corridor enters the PUC Development Plan area, which is bounded by commercial and residential densities that begin to increase in the vicinity of Aloha Stadium. The Pearl Harbor Naval Reserve, Hickam Air Force Base, and Honolulu International Airport border
The General Plan for the City and County of Honolulu directs future population and employment growth to the 'Ewa and Primary Urban Center (PUC) Development Plan areas and the Central 0' ahu Sustainable Communities Plan area. The largest increases in population and employment are projected in the 'Ewa, Waipahu, Downtown, and Kaka`ako districts, which are all located in the corridor (Figure 1-2).
Page 1-2 Air Quality Technical Report Honolulu High-Capacity Transit Corridor Project
AR00066175
the corridor on the makai side. Military and civilian housing are the dominant land uses mauka of Interstate Route H-1 (H-1 Freeway), with a concentration of high-density housing along Salt Lake Boulevard.
As the corridor continues Koko Head across Moanalua Stream, the land use becomes increasingly dense. Industrial and port land uses dominate along the harbor, shifting to primarily commercial uses along Dillingham Boulevard, a mixture of residential and commercial uses along North King Street, and primarily residential use mauka of the H-1 Freeway.
Koko Head of Nu'uanu Stream, the corridor continues through Chinatown and Downtown. The Chinatown and Downtown areas, with 62,300 jobs, have the highest employment density in the corridor. The Kaka` ako and Ala Moana neighborhoods, comprised historically of low-rise industrial and commercial uses, are being revitalized with several high-rise residential towers currently under construction. Ala Moana Center, both a major transit hub and shopping destination, is served by more than 2,000 weekday bus trips and visited by more than 56 million shoppers annually.
The corridor continues to Waikiki and through the McCully neighborhood to UH Manoa. Today, Waikiki has more than 20,000 residents and provides more than 44,000 jobs. It is one of the densest tourist areas in the world, serving approximately 72,000 visitors daily (DBEDT, 2003). UH Manoa is the other major destination at the Koko Head end of the corridor. It has an enrollment of more than 20,000 students and approximately 6,000 staff (UH, 2005). Approximately 60 percent of students do not live within walking distance of campus (UH, 2002) and must travel by vehicle or transit to attend classes.
Alternatives under Consideration
Four alternatives will be evaluated in the Alternatives Analysis (AA) report. They were developed through a screening process that considered alternatives identified through previous transit studies, a field review of the study corridor, an analysis of current housing and employment data for the corridor, a literature review of technology modes, work completed by the 0' ahu Metropolitan Planning Organization (OMPO) for its Draft 2030 Regional Transportation Plan, and public and agency comments received during a formal project scoping process held in accordance with requirements of the National Environmental Policy Act (NEPA) and the Hawai`i EIS Law (Chapter 343). The four alternatives are described in detail in the Honolulu High-Capacity Transit Corridor Project Alternatives Analysis Definition of Alternatives Report (DTS, 2006a). The alternatives identified for evaluation in the AA report are as follows:
1. No Build Alternative
2. Transportation System Management Alternative
3. Managed Lane Alternative
4. Fixed Guideway Alternative
Alternative 1: No Build
The No Build Alternative includes existing transit and highway facilities and committed transportation projects anticipated to be operational by 2030. Committed transportation projects
Air Quality Technical Report Page 1-3 Honolulu High-Capacity Transit Corridor Project
AR00066176

are those programmed in the 0`ahu 2030 Regional Transportation Plan prepared by OMPO. The committed highway elements of the No Build Alternative will also be included in the build alternatives (discussed below).
The No Build Alternative's transit component would include an increase in fleet size to accommodate growth in population, while allowing service frequencies to remain the same as today. The specific number of buses, as well as required ancillary facilities, will be determined during the preparation of the AA.
Alternative 2: Transportation System Management
The Transportation System Management (TSM) Alternative would provide an enhanced bus system based on a hub-and-spoke route network and relatively low-cost capital improvements on selected roadway facilities to give priority to buses. The TSM Alternative would include the same committed highway projects as assumed for the No Build Alternative.
Alternative 3: Managed Lane
The Managed Lane Alternative would include construction of a two-lane, grade-separated facility between Waipahu and Downtown Honolulu for use by buses, paratransit vehicles, and vanpool vehicles. High-occupancy vehicles (HOV) and toll-paying, single-occupant vehicles also would be allowed to use the facility provided that sufficient capacity would be available to maintain free-flow speeds for buses and the above-noted paratransit and vanpool vehicles. Variable pricing strategies for single-occupant vehicles would be implemented to ensure free-flow speeds for high-occupancy vehicles.
Intermediate bus access points would be provided in the vicinity of Aloha Stadium and Middle Street. Buses using the managed lane facility would be restructured and enhanced, providing additional service between Kapolei and other points 'Ewa of the PUC, as well as Downtown Honolulu and UH Manoa.
Alternative 4: Fixed Guideway
The Fixed Guideway Alternative would include the construction and operation of a fixed-guideway transit system between Kapolei and UH Manoa. The system could use any fixed-guideway transit technology approved by FTA and meeting performance requirements, and could be automated or employ drivers.
Station and supporting facility locations are currently being identified and would include a vehicle maintenance facility and park-and-ride lots. Bus service would be reconfigured to bring riders on local buses to nearby fixed-guideway transit stations.
Although this alternative would be designed to be within existing street or highway rights-of-way as much as possible, property acquisition in various locations is expected to be necessary. Future extensions of the system to Central 0' ahu, East Honolulu, or within the corridor are possible, but are not being addressed in detail at present.
A broad range of modal technologies were considered for application to the Fixed Guideway Alternative, including light rail transit, personal rapid transit, automated people mover, monorail, magnetic levitation (maglev), commuter rail, and emerging technologies still in the developmental stage. Several technologies were selected in an earlier screening process and will be considered as possible options for the fixed-guideway technology. Technologies that were
Page 1-4 Air Quality Technical Report Honolulu High-Capacity Transit Corridor Project
AR00066177

not carried forward from the screening process include personal rapid transit, commuter rail, and the emerging technologies. The screening process is documented in the Honolulu High-Capacity Transit Corridor Project Screening Report (DTS, 2006b).
The study corridor for the Fixed Guideway Alternative will be evaluated in five sections to simplify analysis and impact evaluation in the AA process and report. In general, each alignment under consideration within each of the five sections may be combined with any alignment in the adjacent sections.
Each alignment has distinctive characteristics and environmental impacts and provides different service options. Therefore, each alignment will be evaluated individually and compared to the other alignments in each section. The sections that will be evaluated and the alignments being evaluated for each section are listed in Table 1-1. In addition to the combinations of alignments, a shorter 20-mile Alignment also was evaluated.
Table 1-1. Fixed Guideway Alternative Analysis Sections and Alignments
Section Alignments Being Considered
I. Kapolei to Fort Weaver Road Kamokila Boulevard/Farrington Highway
Kapolei Parkway/North-South Road
Saratoga Avenue/North-South Road
Geiger Road/Fort Weaver Road
II. Fort Weaver Road to Aloha Stadium Farrington Highway/Kamehameha Highway
III. Aloha Stadium to Middle Street Salt Lake Boulevard
Makai of the Airport Viaduct
Mauka of the Airport Viaduct
Aolele Street
IV. Middle Street to Iwilei North King Street
Dillingham Boulevard
V. Iwilei to UH Manoa Hotel Street/Kawaiaha`o Street/Kapi`olani Boulevard with or without Waikiki Branch
Hotel Street/Waimanu Street/Kapi`olani Boulevard with or without Waikiki Branch
Nimitz Highway/Queen Street/Kapi`olani Boulevard with or without Waikiki Branch
Nimitz Highway/Halekauwila Street/Kapi`olani Boulevard with or without Waikiki Branch
Beretania Street/South King Street
Waikiki Branch
Project Purpose The purpose of the Honolulu High-Capacity Transit Corridor Project is to provide improved mobility for persons traveling in the highly congested east-west transportation corridor between Kapolei and UH Manoa, confined by the Wai` anae and Ko`olau Mountain Ranges to the north and the Pacific Ocean to the south. The project would provide faster, more reliable public
Air Quality Technical Report
Page 1-5 Honolulu High-Capacity Transit Corridor Project
AR00066178

transportation services in the corridor than those currently operating in mixed-flow traffic. The project would also provide an alternative to private automobile travel and improve linkages between Kapolei, the urban core, UH Manoa, Waikiki, and urban areas in-between. Implementation of the project, in conjunction with other improvements included in the 2030 0' ahu Regional Transportation Plan (ORTP), would moderate anticipated traffic congestion in the corridor. The project also supports the goals of the 0`ahu General Plan and the ORTP by serving areas designated for urban growth.
Project Area Needs Improved Mobility for Travelers Facing Increasingly Severe Traffic Congestion
The existing transportation infrastructure in the corridor between Kapolei and UH Manoa is overburdened handling current levels of travel demand. Motorists experience substantial traffic congestion and delay at most times of the day during both the weekdays and weekends. Average weekday peak-period speeds on the H-1 Freeway are currently less than 20 miles per hour (mph) in many places and will degrade even further by 2030. Transit vehicles are caught in the same congestion. Travelers on 0' ahu' s roadways currently experience 51,000 vehicle hours of delay, a measure of how much time is lost daily by travelers stuck in traffic, on a typical weekday. This is projected to increase to more than 71,000 daily vehicle hours of delay by 2030, assuming implementation of all of the planned improvements listed in the ORTP (except for a fixed guideway system). Without these improvements, the ORTP indicates that daily vehicle-hours of delay could increase to as much as 326,000 vehicle hours.
Current a.m. peak-period travel times for motorists from West 0`ahu to Downtown average between 45 and 81 minutes. By 2030, after including all of the planned roadway improvements in the ORTP, this travel time is projected to increase to between 53 and 83 minutes. Average bus speeds in the system have been decreasing steadily as congestion has increased. Currently, express bus travel times from 'Ewa Beach to Downtown range from 45 to 76 minutes and local bus travel times from 'Ewa Beach to Downtown range from 65 to 110 minutes during the peak period. By 2030, these travel times are projected to increase by 20 percent on an average weekday. Within the urban core, most major arterial streets will experience increasing peak-period congestion, including Ala Moana Boulevard, Dillingham Boulevard, Kalakaua Avenue, Kapi` olani Boulevard, King Street, and Nimitz Highway. Expansion of the roadway system between Kapolei and UH Manoa is constrained by physical barriers and by dense urban neighborhoods that abut many existing roadways. Given the current and increasing levels of congestion, a need exists to offer an alternative way to travel within the corridor independent of current and projected highway congestion.
Improved Transportation System Reliability
As roadways become more congested, they become more susceptible to substantial delays caused by incidents, such as traffic accidents or heavy rain. Even a single driver unexpectedly braking can have a ripple effect delaying hundreds of cars. Because of the operating conditions in the study corridor, current travel times are not reliable for either transit or automobile trips. To get to their destination on time, travelers must allow extra time in their schedules to account for the uncertainty of travel time. This is inefficient and results in lost productivity. Because the bus system primarily operates in mixed-traffic, transit users experience the same level of travel
Page 1-6 Air Quality Technical Report Honolulu High-Capacity Transit Corridor Project
AR00066179
time uncertainty as automobile users. A need exists to reduce transit travel times and provide a more reliable transit system.
Accessibility to New Development in Ewa/Kapolei/Makakilo as a Way of Supporting Policy to Develop the Area as a Second Urban Center
The General Plan for the City and County of Honolulu projects the highest population growth rates for the island will occur in the 'Ewa Development Plan area (comprised of the 'Ewa, Kapolei, and Makakilo communities), which is expected to grow by 170 percent between 2000 and 2030. This growth represents nearly 50 percent of the total growth projected for the entire island. The Wai`anae, Wahiawa, North Shore, Windward, Waimanalo, and East Honolulu areas will have population growth of between zero and 16 percent because of this policy, which keeps the country "country." Kapolei, which is developing as a "second city" to Downtown Honolulu, is projected to grow by nearly 600 percent to 81,100 people, the 'Ewa neighborhood by 100 percent, and Makakilo by 125 percent between 2000 and 2030. Accessibility to the overall 'Ewa Development Plan area is currently severely impaired by the congested roadway network, which will only get worse in the future. This area is less likely to develop as planned unless it is accessible to Downtown and other parts of 0' ahu; therefore, the 'Ewa, Kapolei, and Makakilo area needs improved accessibility to support its future growth as planned.
Improved Transportation Equity for All Travelers
Many lower-income and minority workers live in the corridor outside of the urban core and commute to work in the PUC Development Plan area. Many lower-income workers also rely on transit because of its affordability. In addition, daily parking costs in Downtown Honolulu are among the highest in the United States (Colliers, 2005), further limiting this population's access to Downtown. Improvements to transit capacity and reliability will serve all transportation system users, including low-income and under-represented populations.
Project Schedule Projects developed through the FTA New Starts process progress through many stages from system planning to operation of the project. The Honolulu High-Capacity Transit Corridor Project is currently in the Alternatives Analysis phase, which includes defining and evaluating specific alternatives to address the purpose of and needs for the project as discussed in this chapter. The anticipated project development schedule for completion of the 20-mile Alignment is shown in Figure 1-3.
Air Quality Technical Report Page 1-7 Honolulu High-Capacity Transit Corridor Project
AR00066180

Scoping
Alternatives Analysis
Select Locally Preferred Alternative
NEPA and Chapter 343 Environmental Review
IN
Preliminary Engineering
Final Design
Construction
Opening of First Phase
2005 2006 2007 2008 2009 2010 2011 2012 2013 2014 2015 2016 2017 2018
Figure 1-3. Project Schedule
Page 1-8 Air Quality Technical Report Honolulu High-Capacity Transit Corridor Project
AR00066181

Chapter 2 Studies and Coordination Air pollution is a general term that refers to one or more chemical substances that degrade the quality of the atmosphere. Air quality describes the amount of pollution in the air. Individual air pollutants degrade the atmosphere by reducing visibility, damaging property, reducing the productivity or vigor of crops or natural vegetation, or reducing human or animal health. This report evaluates the quantity of air pollutant emissions that would occur with each of the project alternatives.
Clean Air Act Amendments of 1990 The Clean Air Act Amendments (CAAA) of 1990 and the Final Transportation Conformity Rule (40 CFR, Parts 51 and 93) direct the Environmental Protection Agency (EPA) to implement environmental policies and regulations that will ensure acceptable air quality levels. The Clean Air Act (CAA) and the Final Transportation Conformity Rule affect proposed transportation projects. According to Title I, Section 176 (c) 2 of the CAA:
"No federal agency may approve, accept or fund any transportation plan, program or project unless such plan, program, or project has been found to conform to any applicable State Implementation Plan (SIP) in effect under this act."
The Final Conformity Rule defines "conformity" as follows:
"Conformity to an implementation plan's purpose of eliminating or reducing the severity and number of violations of the National Ambient Air Quality Standards (NAAQS) and achieving expeditious attainment of such standards; and
That such activities will not:
• cause or contribute to any new violation of any NAAQS in any area, • increase the frequency or severity of any existing violation of any NAAQS
in any area, or • delay timely attainment of any NAAQS or any required interim emission
reductions or other milestones in any area."
National and State Ambient Air Quality Standards As required by the CAA, NAAQS have been established for six major air pollutants. These pollutants, known as criteria pollutants, are carbon monoxide (CO), nitrogen dioxide (NO2), ozone (0 3), particulate matter (PMio and PM2.5), sulfur dioxide (SO2) and lead (Pb). The State of Hawai`i has also established ambient air quality standards. These standards are either the same or more stringent than the corresponding federal standards.
The State and federal standards are summarized in Table 2-1. "Primary" standards have been established to protect public health. "Secondary" standards are intended to protect the nation's welfare and account for air pollutant effects on soil, water, visibility, materials, vegetation and other aspects of the general welfare.
Air Quality Technical Report Page 2-1 Honolulu High-Capacity Transit Corridor Project
AR00066182

Table 2-1. National and State Ambient An- Quality Standards
Pollutant
Standards
Hawai`i State Standard
Federal Primary Standarda (Health)
Federal Secondary Standard" (Welfare)
Carbon Monoxide (CO) 1 Hour 10 mg/m3 (9 ppm) 40 mg/m3 (35 ppm) 40 mg/m3 (35 ppm) 8 Hour 5 mg/m3 (4.5 ppm) 10 mg/m 3 (9 ppm) 10 mg/m3 (9 ppm)
Nitrogen Dioxide
1 Hour ---- ---- ---- 24 Hour ---- ---- ----
Annual (Arithmetic) 70 ug/m3 (0.04 ppm) 100 ug/m3 (0.05 ppm) 100 ug/m3 (0.05
PMloc 24 Hour 150 ug/m3 150 ug/m3 150 ug/m3 Annual (Arithmetic) 50 ug/m3 50 ug/m3 50 ug/m3
PM2.5d 24 Hour ---- 65 ug/m3 65 ug/m3
Annual (Arithmetic) ---- 15 ug/m3 15 ug/m3
Ozone (03)
8 Hour 157 ug/m3 (0.08 ppm) I 157 ug/m3 (0.08 ppm) I 157 ug/m3 (0.08
Sulfur Dioxide
3 Hour 1,300 ug/m3 (0.5 ppm)
---- 1,300 ug/m3 (0.5 ppm)
24 Hour 365 ug/m 3 (0.14 ppm) 365 ug/m 3 (0.14 ppm) ----
Annual (Arithmetic) 80 ug/m3 (0.03 ppm) 80 ug/m3 (0.03 ppm) ----
Lead (Pb)
3 Months 1.5 ug/m 3 I 1.5 ug/m3 I 1.5 ug/m 3
Hydrogen Sulfide
1 Hour 35 ug/m3 I ----
a Designated to prevent against adverse effects on public health
b Designated to prevent against adverse effects on public welfare, including effects on comfort, visibility, vegetation,
animals, aesthetic values, and soiling and deterioration of materials.
c Particulate matter 10 microns or less in diameter
d Particulate matter 2.5 microns or less in diameter.
Source: State of Hawaii, Department of Health, Clean Air Branch — Hawaii Administrative Rules, Title 11, Chapter 59.
Code of Federal Regulations, Title 40, Part 50, January 2006.
Criteria Pollutants and Their Effects Pollutants that have established national standards are referred to as criteria pollutants. The sources of these pollutants, their effects on human health and the nation's welfare, and their final deposition in the atmosphere vary considerably. A brief description of each pollutant follows.
Carbon Monoxide
Page 2-2 Air Quality Technical Report Honolulu High-Capacity Transit Corridor Project
AR00066183

Carbon monoxide (CO), a colorless gas, interferes with the transfer of oxygen to the brain. CO is emitted almost exclusively from the incomplete combustion of fossil fuels. Prolonged exposure to high levels of CO can cause headaches, drowsiness, loss of equilibrium, or heart disease. CO concentrations can vary greatly over relatively short distances. Relatively high concentrations are typically found near congested intersections, along heavily used roadways carrying slow-moving traffic, and in areas where atmospheric dispersion is inhibited by urban "street canyon" conditions. Consequently, CO concentrations must be predicted on a localized (or micro-scale) basis.
Nitrogen Dioxide Nitrogen dioxide (NO2), a brownish gas, irritates the lungs. NO2 can cause breathing difficulties at high concentrations. Like ozone (0 3), NO2 is not directly emitted but is formed through a reaction between nitric oxide (NO) and atmospheric oxygen. NO and NO2 are collectively referred to as nitrogen oxides (NOx) and are major contributors to ozone formation. NO 2 also contributes to the formation of PM 10, small liquid and solid particles that are less than 10 microns in diameter (see the following discussion of PMio). At atmospheric concentrations, NO 2 is only potentially irritating. In high concentrations, the result is a brownish-red cast to the atmosphere and reduced visibility. There is some indication of a relationship between NO 2 and chronic pulmonary fibrosis. Some increase in bronchitis in children (two and three years old) has also been observed at concentrations below 0.3 parts per million (ppm).
Particulate Matter Particulate matter pollution is composed of solid particles or liquid droplets small enough to remain suspended in the air. This can include dust, soot, smoke, salts, acids, and metals and can be irritating, but is usually not poisonous. Particulate matter pollution can also form when industrial emissions and gases emitted from motor vehicles undergo chemical reactions in the atmosphere. The main health effect of airborne particulate matter is on the respiratory system.
Particulate matter pollution can also include bits of solid or liquid substances that can be highly toxic. Of particular concern are particles smaller than or equal to 10 microns (PM 10) and 2.5 microns (PM2.5) in size.
PM10 refers to particulate matter less than 10 microns in diameter, or about 1/7 th the thickness of a strand of human hair (Figure 4-1). Major sources of PA/1 10 include motor vehicles; wood-burning stoves and fireplaces; dust from construction, landfills, and agriculture; wildfires and brush/waste burning; industrial sources; windblown dust from open lands; and atmospheric chemical and photochemical reactions. These suspended particulates produce haze and reduce visibility.
Air Quality Technical Report Page 2-3 Honolulu High-Capacity Transit Corridor Project
AR00066184

Figure 2-1. Relative Particulate Matter Size
PM2.5 refers to particulates that are 2.5 microns or less in diameter, roughly 1128 th the diameter of a strand of human hair. PM 2 . 5 results from fuel combustion (from motor vehicles, power generation, and industrial facilities), residential fireplaces, and wood stoves. PM2.5 can also be formed in the atmosphere from gases such as sulfur dioxide (SO 2), nitrogen oxides (N0x), and volatile organic compounds (VOC). Like PMio, PM2.5 can penetrate the human respiratory system's natural defenses and damage the respiratory tract when inhaled. Particles 2.5 to 10 microns in diameter tend to collect in the upper portion of the respiratory system, but particles 2.5 microns or less are so tiny that they can penetrate deeper into the lungs and damage lung tissues.
Ozone Ozone (03), a colorless toxic gas, enters the blood stream and interferes with the transfer of oxygen, depriving sensitive tissues in the heart and brain of oxygen. 0 3 also damages vegetation by inhibiting its growth. Although 03 is not directly emitted, it forms in the atmosphere through a chemical reaction between VOC and NOx, which are emitted from industrial sources and automobiles. Substantial 03 formations generally require a stable atmosphere with strong sunlight.
Sulfur Dioxide Sulfur dioxide (SO2) is a product of high-sulfur fuel combustion. The main sources of SO2 are coal and oil used combustion in power stations, industry, and for domestic heating. Industrial chemical manufacturing is another source. SO 2 is an irritant gas that attacks the throat and lungs. It can cause acute respiratory symptoms and diminished
Page 2-4 Air Quality Technical Report Honolulu High-Capacity Transit Corridor Project
AR00066185

ventilator (pulmonary) function in children. SO 2 can also yellow plant leaves and erode iron and steel.
Lead
Lead (Pb) is a stable element that persists and accumulates in the environment and in animals. Its principal effects in humans are on the blood-forming, nervous, and renal systems. Lead levels in the urban environment from mobile sources have significantly decreased due to the federally-mandated switch to lead-free gasoline.
Hydrogen Sulfide Hydrogen sulfide (H2 S) is a colorless, toxic, flammable gas that causes the foul odor of rotten eggs. It often results when bacteria breaks down organic matter in the absence of oxygen. It also occurs in volcanic gases. H 2 S is considered a broad-spectrum poison, meaning that it can poison several different systems in the body, although the nervous system is most affected.
Mobile Source Air Toxics In addition to the criteria pollutants for which there are NAAQS, the EPA also regulates air toxics. Toxic air pollutants are pollutants known or suspected to cause cancer or other serious health effects. Most air toxics originate from human-made sources, including on-road mobile sources, non-road mobile sources (e.g., airplanes), area sources (e.g., dry cleaners) and stationary sources (e.g., factories or refineries).
The CAA identifies 188 air toxics, of which 21 are associated with mobile sources. Of these 21, EPA has identified the following six as being priority Mobile Source Air Toxics (MSAT):
• Benzene • Formaldehyde • Diesel Particulate Matter/Diesel Exhaust Organic Gases • Acetaldehyde • Acrolein • 1,3-Butadiene
Air Quality Technical Report Page 2-5 Honolulu High-Capacity Transit Corridor Project
AR00066186

Chapter 3 Methodology
Regulatory and Monitored Air Quality Information The most current existing ambient air quality monitoring information from the Hawai`i Department of Health (HDOH) was collected and summarized for the area. This chapter compares this information to the national and state Ambient Air Quality Standards. The area's attainment status under the Clean Air Act Amendments (CAAA) is also discussed. 0' ahu is in attainment with all NAAQS.
Regional Air Quality Analysis Pollutants that can be traced principally to motor vehicles are relevant to this evaluation of project impacts. These pollutants include CO, VOC, NOx, PM 10, PM2.5 and the six priority MSAT discussed previously. Transportation sources account for a small percentage of regional SO 2 and Pb emissions; therefore, a detailed analysis is not required. The generation of electricity to operate the Fixed Guideway Alternative may produce emissions, but they should be offset by the reductions generated by reduced vehicle miles traveled (VMT). For this analysis, the regional impacts of CO, VOC, NOx, PM10, PM2.5 and MSAT emissions are evaluated. After selection of the Locally Preferred Alternative (LPA), a micro-scale CO analysis will be conducted, if necessary.
A regional mobile source pollutant burdens analysis was conducted for this project. The pollutants analyzed for the project alternatives included hydrocarbons (HC), NOx, PMio, and CO. VMT and the associated traffic simulation network speeds were used. Emissions factors were obtained through EPA's mobile source emission model, MOBILE6.2, in accordance with the Hawai`i Department of Health Clean Air Branch's recommendation. This analysis compares regional pollutant burdens (the total quantity of each pollutant released in the region) for each alternative. Changes in regional emission levels were estimated to describe the potential effect the alternatives may have on regional air quality.
VOC and NOx
VOC and NOx emissions from automotive sources are a concern, primarily because they are precursors to the formation of ozone and particulate matter. Ozone is formed through a series of reactions that occur in the atmosphere in the presence of sunlight. Because the reactions are slow and occur as the pollutants diffuse downwind, elevated ozone levels are often found many miles from sources of the precursor pollutants. Because of this, the effects of VOC and NOx emissions are generally examined on a regional or meso-scale basis.
P11/110 and PM2.5
PMio and PM2 5 impacts are both regional and local. A significant portion of particulate matter, especially PM io, comes from disturbed vacant land, construction activity, and dust from paved roads. PM 2 5 also comes from these sources. Motor vehicle exhaust,
Air Quality Technical Report Page 3-1 Honolulu High-Capacity Transit Corridor Project
AR00066187

particularly from diesel vehicles, is also a source of PMio and PM 2 5. It is appropriate to predict concentrations of PM io and PM2 5 on both a regional and a localized basis.
On March 10, 2006, the EPA issued a Final Rule regarding the localized or "hot-spot" analysis of PM2 5 and PM io (40 CFR Part 93). This rule requires that PMio and PM25 hot-spot analyses be performed only for transportation projects where significant diesel traffic occurs in areas that do not meet the appropriate particulate matter air quality standards. Because the project area is classified as being in attainment for PK ° and PM2 5, a hot-spot analysis is not required.
Mobile Source Air Toxics
MSAT impacts are both regional and local. Through the issuance of EPA's Final Rule regarding emission control of Hazardous Air Pollutants from Mobile Sources (66FR17229), it was determined that many existing and newly promulgated mobile source emission control programs would result in a reduction of MSATs. The Federal Highway Administration (FHWA) projects that even if an area experienced a 64-percent increase in VMT, these programs will reduce on-highway emissions of benzene, formaldehyde, 1,3-butadiene, and acetaldehyde by 57 percent to 65 percent, and will reduce on-highway diesel PM emissions by 87 percent, within the area (FHWA, 2006).
As a result, the EPA concluded that no further motor vehicle emission standards or fuel standards are necessary to further control MSATs.
On February 3, 2006, FHWA issued Interim Guidance regarding MSAT analysis in National Environmental Policy Act (NEPA) documentation. Given the emerging state of the science and of project-level analysis techniques regarding MSAT, no established criteria exist for determining when MSAT emissions should be considered a significant issue. FHWA has suggested the following three-tiered approach to determining potential project-induced MSAT impacts:
• Tier 1 — No analysis for projects that have no potential for meaningful MSAT effects • Tier 2 — Qualitative analysis for projects with a low potential for MSAT effects • Tier 3 — Quantitative analysis to differentiate alternatives for projects with a higher
potential for MSAT effects.
FHWA has developed this approach because the technical tools currently available are not able to predict the project-specific health impacts of emission changes associated with project alternatives.
Based on this recommended tiering approach, the Honolulu High-Capacity Transit Corridor Project falls within the Tier 2 approach. The amount of MSATs emitted would be proportional to the VMT, assuming the vehicle mix does not change.
Carbon Monoxide
CO impacts are both regional and local. Vehicle emissions are the major sources of CO. Even under the worst meteorological conditions and most congested traffic conditions, high concentrations are limited to within a relatively short distance (300 — 600 feet) of
Page 3-2 Air Quality Technical Report Honolulu High-Capacity Transit Corridor Project
AR00066188
heavily traveled roadways. Consequently, it is appropriate to predict CO concentrations on both a regional and a localized (or micro-scale) basis. A micro-scale study of the project's CO impacts will be conducted, if necessary, based on the results of a screening analysis to be completed when detailed localized traffic information is available.
Air Quality Technical Report Page 3-3 Honolulu High-Capacity Transit Corridor Project
AR00066189

Chapter 4 Affected Environment
Air Quality Levels and Compliance
Section 107 of the 1977 Clean Air Act Amendments (CAAA) requires the EPA to publish a list of all geographic areas that are in compliance with the National Ambient Air Quality Standards (NAAQS), and areas that do not attain the NAAQS. Areas not in compliance are called nonattainment areas. Areas for which insufficient data is available to make a determination are unclassified, and treated as being in compliance (attainment areas) until proven otherwise. Designation of an area is made on a pollutant-by-pollutant basis. The State of Hawai`i is designated as an attainment area for CO, 0 3 , PK° and PM2.5.
Transportation projects are analyzed as part of a regional transportation network developed by a county or state. The Hawai`i Statewide Transportation Plan goals are to:
• Achieve an integrated multimodal transportation system that provides mobility and accessibility for people and goods;
• Ensure the safety and security of the air, land and water transportation systems; • Protect and enhance Hawaii's unique environment and improve the quality of life; • Support Hawaii's economic vitality; and • Implement a statewide planning process that is comprehensive, cooperative, and
continuing.
Projects included in this regional transportation network are found in the Transportation Improvement Plan (TIP). The Honolulu High-Capacity Transit Corridor Project is listed in the area's TIP and complies with the goals set forth in the Statewide Transportation Plan.
Ambient Air Quality in the Study Area Local Meteorology
0' ahu, where Honolulu is located, is the third largest of the Hawaiian Islands. The Ko`olau Range, with an average elevation of 2,000 feet, parallels the northeastern coast. The Wai` anae Mountains, somewhat higher in elevation, parallel the west coast. Honolulu Airport, the business district, the Waikiki district, and a number of Honolulu's residential areas lie along the southern coastal plain.
Hawaii's climate is unusually pleasant for the tropics. Its outstanding features are the persistence of the trade winds, the remarkable variability in rainfall over short distances, the leeward lowlands' sunniness in contrast to persistent cloudiness over nearby mountain crests, the equable temperature, and the general infrequency of severe storms.
The prevailing wind throughout the year is a northeasterly trade wind. Its average frequency varies from over 90 percent during the summer to only 50 percent in January.
Air Quality Technical Report Page 4-1 Honolulu High-Capacity Transit Corridor Project
AR00066190

Heavy mountain rainfall sustains Honolulu's water supply. 0' ahu is driest along the Wai` anae Coast, where rainfall drops to about 20 inches a year. Daytime showers, usually light, often occur while the sun continues to shine — a phenomenon referred to locally as "liquid sunshine".
The moderate temperature range is associated with the small seasonal variation in the energy received from the sun and the tempering effect of the surrounding ocean. Honolulu Airport has recorded temperatures as high as the lower 90s and as low as the lower 50s.
Because of the trade winds, even the warmest months are usually comfortable. However, when the trade winds diminish or give way to southerly winds, a situation known locally as "Kona" weather (or "Kona" storms when stormy), the humidity may become oppressively high.
Intense rains during the October to April winter season sometimes cause serious flash flooding. Thunderstorms are infrequent and mild, and hail seldom occurs. Small tornadoes or waterspouts may do some damage infrequently. Only a few tropical cyclones have struck Hawai`i, although others have come near enough for their outlying winds, waves, clouds, and rain to affect the Islands.
Monitored Air Quality
Air pollutant levels in Hawai`i are monitored by a network of sampling stations operated under the supervision of the Hawai`i Department of Health (EIDOH) at various locations around 0`ahu. The monitoring locations used for this study are listed in Table 4-1, with a summary of the pollutants monitored at each station.
Page 4-2 Air Quality Technical Report Honolulu High-Capacity Transit Corridor Project
AR00066191
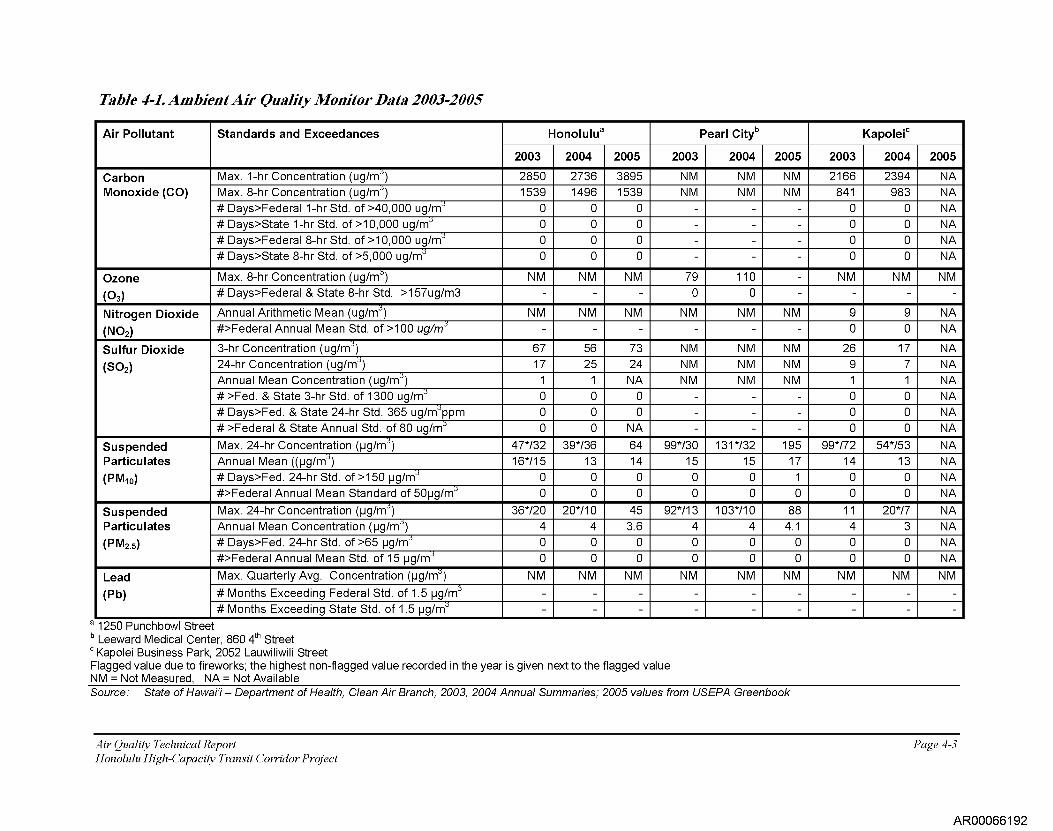
Table 4-1. Ambient Air Quality Monitor Data 2003-2005
Air Pollutant Standards and Exceedances Honolulu a Pearl City b Kapoler
2003 2004 2005 2003 2004 2005 2003 2004 2005
Carbon Monoxide (CO)
Max. 1-hr Concentration (ug/m 3 ) 2850 2736 3895 NM NM NM 2166 2394 NA Max. 8-hr Concentration (ug/m 3 ) 1539 1496 1539 NM NM NM 841 983 NA # Days>Federal 1-hr Std. of >40,000 ug/m 3 0 0 0 - - - 0 0 NA # Days>State 1-hr Std. of >10,000 ug/m 3 0 0 0 - - - 0 0 NA # Days>Federal 8-hr Std. of >10,000 ug/m 3 0 0 0 - - - 0 0 NA # Days>State 8-hr Std. of >5,000 ug/m 3 0 0 0 - - - 0 0 NA
Ozone
(03)
Max. 8-hr Concentration (ug/m 3 ) NM NM NM 79 110 - NM NM NM # Days>Federal & State 8-hr Std. >157ug/m3 - - - 0 0 - - - -
Nitrogen Dioxide
(NO2)
Annual Arithmetic Mean (ug/m 3 ) NM NM NM NM NM NM 9 9 NA #>Federal Annual Mean Std. of >100 ug/e - - - - - - 0 0 NA
Sulfur Dioxide
(SO2)
3-hr Concentration (ug/m 3 ) 67 56 73 NM NM NM 26 17 NA 24-hr Concentration (ug/m 3 ) 17 25 24 NM NM NM 9 7 NA Annual Mean Concentration (ug/m 3 ) 1 1 NA NM NM NM 1 1 NA # >Fed. & State 3-hr Std. of 1300 ug/m 3 0 0 0 - - - 0 0 NA # Days>Fed. & State 24-hr Std. 365 ug/m 3 ppm 0 0 0 - - - 0 0 NA # >Federal & State Annual Std. of 80 ug/m 3 0 0 NA - - - 0 0 NA
Suspended Particulates
(PMio)
Max. 24-hr Concentration (pg/m 3 ) 47*/32 39*/36 64 99*/30 131*/32 195 99*/72 54*/53 NA Annual Mean ((pg/m 3 ) 16*115 13 14 15 15 17 14 13 NA # Days>Fed. 24-hr Std. of >150 pg/m 3 0 0 0 0 0 1 0 0 NA #>Federal Annual Mean Standard of 50pg/m 3 0 0 0 0 0 0 0 0 NA
Suspended Particulates
(PM2.5)
Max. 24-hr Concentration (pg/m 3 ) 36*/20 20*/10 45 92*113 103*110 88 11 20*/7 NA Annual Mean Concentration (pg/m 3 ) 4 4 3.6 4 4 4.1 4 3 NA # Days>Fed. 24-hr Std. of >65 pg/m 3 0 0 0 0 0 0 0 0 NA #>Federal Annual Mean Std. of 15 pg/m 3 0 0 0 0 0 0 0 0 NA
Lead
(Pb)
Max. Quarterly Avg. Concentration (pg/m 3 ) NM NM NM NM NM NM NM NM NM
# Months Exceeding Federal Std. of 1.5 pg/m3 - - - - - - - - - # Months Exceeding State Std. of 1.5 pg/m 3 - - - - - - - - -
a 1250 Punchbowl Street b Leeward Medical Center, 860 4 th Street c Kapolei Business Park, 2052 Lauwiliwili Street Flagged value due to fireworks; the highest non-flagged value recorded in the year is given next to the flagged value NM = Not Measured, NA = Not Available Source: State of Hawai`i — Department of Health, Clean Air Branch, 2003, 2004 Annual Summaries; 2005 values from USEPA Greenbook
Air Quality Technical Report
Page 4-3 Honolulu High-Capacity Transit Corridor Project
AR00066192

Chapter 5 Impacts
Regional Assessment voc, CO, NOx, PA/110 and PM2.5Impacts
As shown in Table 5-1, a regional analysis of VOC, CO, NOx, PM10 and PM2 5 based on VMT and average network speed was conducted for each of the build alternatives and compared to the No Build Alternative. Emissions factors were obtained through EPA's mobile source emission model, MOBILE6.2, in accordance with the Hawaii's Department of Health Clean Air Branch's recommendation.
Alternative 1: No Build
The No Build Alternative provides a baseline to which other alternatives may be compared. 8,042 kilograms (kg) of VOCs, 142,975 kg of CO, 4,784 kg of NOx, 424 kg of PM10 and 203 kg of PM2 5 are predicted to be generated daily by transportation sources on 0`ahu in 2030 (Table 5-1).
Alternative 2: Transportation System Management
Alternative 2 (the TSM Alternative) is predicted to demonstrate a 0.8-percent reduction in VMT and a slight increase in overall network speed (42.6 mph to 42.7 mph) compared to the No Build Alternative. This would result in predicted pollution reductions ranging from 0.7 to 1.0 percent, compared to the No Build Alternative.
Alternative 3: Managed Lane
The Managed Lane Alternative with the two-direction option is predicted to demonstrate a 0.04-percent increase in VMT and a slight increase in overall network speed (42.6 to 43.0 mph) compared the No Build Alternative. This would result in a predicted 0.1- percent decrease in VOC burden, compared to the No Build Alternative. The other pollutants analyzed are predicted to either not change (PM10 and PM 2 . 5) or demonstrate increased pollutant burdens of 0.4 percent, compared to the No Build Alternative.
The Managed Lane Alternative with reversible option is predicted to demonstrate a 1.8- percent increase in VMT and a slight reduction in overall network speed (42.6 to 42.3 mph) compared the No Build Alternative. This would result in predicted pollution increases ranging from 2.8 to 3.7 percent, compared to the No Build Alternative.
Alternative 4: Fixed Guideway
The Fixed Guideway Alternative was evaluated using the minimum and maximum predicted change in VMT it would create. The spread is due to the different alignments the fixed guideway could take and the ridership associated with each possible alignment. The Fixed Guideway Alternative is predicted to demonstrate a 2.7 to 3.2-percent decrease in VMT and a slight increase in overall network speed (42.6 to 43.1 mph) compared to the No Build Alternative. This would result in predicted pollution reductions of 2.3 to 3.6 percent, compared to the No Build Alternative.
Air Quality Technical Report Page 5-1 Honolulu High-Capacity Transit Corridor Project
AR00066193

MSAT Impacts
Based on the recommended three-tiered approach (discussed in Chapter 3), the Honolulu High-Capacity Transit Corridor Project falls within the Tier 2 approach. The amount of MSATs emitted would be proportional to the VMT, assuming the vehicle mix does not change. As shown in Table 5-1, Alternative 2 and Alternative 4 (both extremes) are both predicted to decrease overall VMT. This reduction ranges from 0.8 to 3.2 percent. Alternative 3 (both options) is predicted to increase overall VMT by 0.04 to 1.8 percent. Considering these relatively small changes and EPA's planned reductions in overall MSAT levels, the project is predicted to generally produce no meaningful MSAT effects.
Because of the project's fixed guideway aspect, VMT may increase in localized areas (such as station locations), and may decrease in other areas. Therefore, it is possible that localized increases and decreases in MSAT emissions may occur. However, even if these increases do occur, they too will be substantially reduced due to implementation of EPA's vehicle and fuel regulations.
In summary, it is expected that the build alternatives would have no quantifiable impact on MSAT emissions in the project's study area, compared to the No Build Alternative, because only a slight change in VMT is expected with the build alternatives. In comparing various project alternatives, MSAT levels could be higher in some locations than others, but current tools and science are not adequate to quantify these levels. However on a regional basis, EPA's vehicle and fuel regulations coupled with fleet turnover will over time cause substantial reductions that, in almost all cases, will cause region-wide MSAT levels to be significantly lower than today.
Page 5-2 Air Quality Technical Report Honolulu High-Capacity Transit Corridor Project
AR00066194
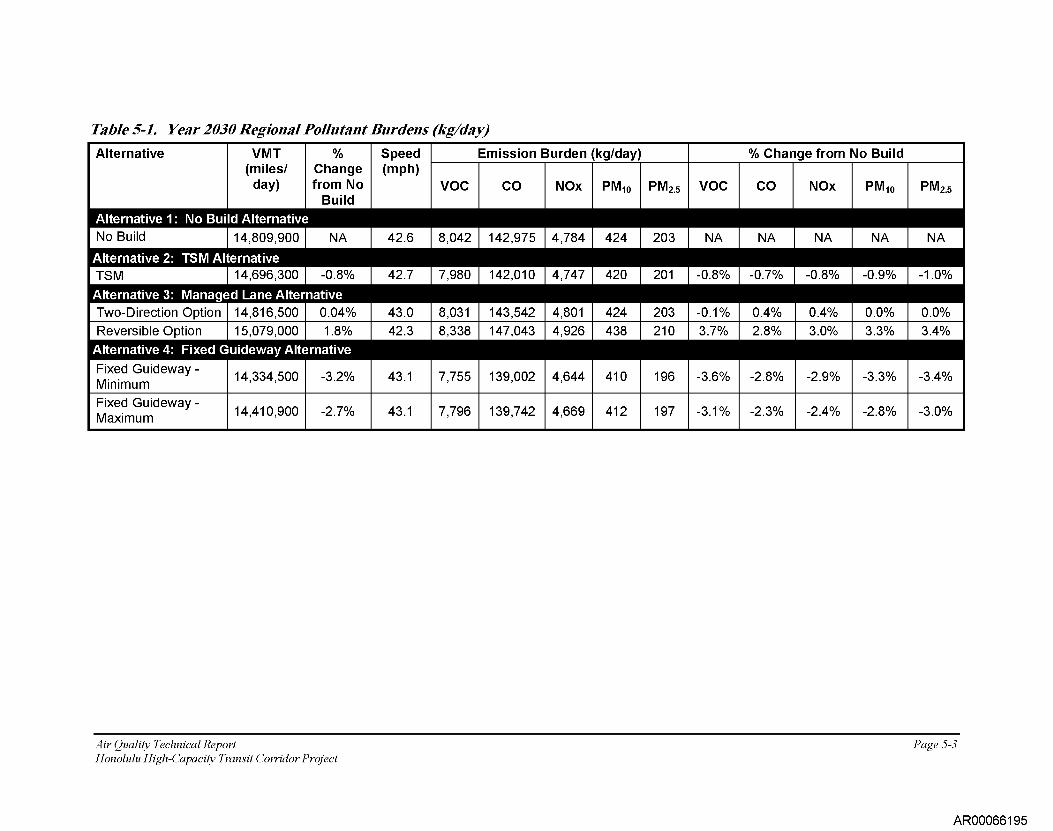
Table 5-1. Year 2030 Regional Pollutant Burdens (kg/day)
Alternative
Alternative 1: No Build No Build
Alternative 2: TSM Alternative TSM
Alternative 3: Managed Two-Direction Option
VMT (miles/
day)
Alternative
14,809,900
14,696,300
Lane Alternative 14,816,500
% Change from No
Build
NA
-0.8%
0.04%
Speed (mph)
42.6
42.7
43.0
Emission Burden (kg/day) % Change from No Build
VOC
8,042
7,980
8,031
CO
142,975
142,010
143,542
NOx
4,784
4,747
4,801
PM io
424
420
424
PM2.5
203
201
203
VOC
NA
-0.8%
-0.1%
CO
NA
-0.7%
0.4%
NOx
NA
-0.8%
0.4%
PM io
NA
-0.9%
0.0%
PM2.5
NA
-1.0%
0.0%
Reversible Option
Alternative 4: Fixed Guideway
Fixed Guideway - Minimum
15,079,000
14,334,500
Alternative
1.8%
-3.2%
42.3
43.1
8,338
7,755
147,043
139,002
4,926
4,644
438
410
210
196
3.7%
-3.6%
2.8%
-2.8%
3.0%
-2.9%
3.3%
-3.3%
3.4%
-3.4%
Fixed Guideway - Maximum 14,410,900 -2.7% 43.1 7,796 139,742 4,669 412 197 -3.1% -2.3% -2.4% -2.8% -3.0%
Air Quality Technical Report
Page 5-3 Honolulu High-Capacity Transit Corridor Project
AR00066195
Construction Impacts on Air Quality Construction-related effects of the project would be limited to short-term increased fugitive dust and mobile-source emissions during construction. At this stage of the project, a detailed construction plan has not been developed. Once a plan is developed, the need for a detailed air quality construction analysis will be assessed.
State and local regulations regarding dust control and other air quality emission reduction controls should be followed.
Fugitive dust is airborne particulate matter, generally of a relatively large particulate size. Haul trucks, concrete trucks, delivery trucks, and earth-moving vehicles operating around the construction sites would generate fugitive dust during construction. This fugitive dust would primarily result from particulate matter re-suspended ("kicked up") by vehicle movement over paved and unpaved roads, dirt tracked onto paved surfaces from unpaved areas at access points, and material blown from uncovered haul trucks.
The distance that particles drift from their source generally depends on their size, the emission height, and the wind speed. Small particles (30 to 100 micron range) can travel several hundred feet before settling to the ground, but most fugitive dust is comprised of relatively large particles (greater than 100 microns in diameter). These particles are responsible for the reduced visibility often associated with this type of construction. Given their relatively large size, these particles tend to settle within 20 to 30 feet of their source.
Page 5-4 Air Quality Technical Report Honolulu High-Capacity Transit Corridor Project
AR00066196

Chapter 6 Mitigation
Operation Because no substantial air quality impacts are anticipated to result from operation of any of the project alternatives, mitigation would not be required. Any measures to reduce automobile travel would reduce air pollutant emissions. Technologies for electricity generation that do not include combustion would reduce air pollutant emissions for the Fixed Guideway Alternative.
Construction In order to minimize the amount of construction dust generated, the following guidelines should be followed. The following preventive and mitigative measures should be taken to minimize the potential particulate pollution problem.
Site Preparation
• Minimize land disturbance • Use watering trucks to minimize dust • Cover trucks when hauling dirt • Stabilize the surface of dirt piles if they are not removed immediately • Use windbreaks to prevent accidental dust pollution • Limit vehicular paths and stabilize these temporary roads • Pave all unpaved construction roads and parking areas to road grade for a length of
no less than 50 feet from points where these roads and parking areas exit the construction site. This will help prevent dirt from washing onto paved roadways.
Construction
• Cover trucks when transferring materials • Use dust suppressants on unpaved traveled paths • Minimize unnecessary vehicular and machinery activities • Minimize dirt track-out by washing or cleaning trucks before leaving the construction
site. An alternative would be to pave no less than 50 feet of the exit road just before entering the public road.
Post-Construction
• Re-vegetate any disturbed land not used • Remove unused material • Remove dirt piles • Re-vegetate all vehicular paths created during construction, to avoid future off-road
vehicular activities
Air Quality Technical Report Page 6-1 Honolulu High-Capacity Transit Corridor Project
AR00066197

Mobile Source Emissions
Because CO emissions from motor vehicles generally increase with decreasing vehicle speed, traffic disruption during construction (e.g., temporary reduction of roadway capacity and increased queue lengths) could result in short-term, elevated concentrations of CO. In order to minimize the amount of emissions generated, every effort should be made during the construction phase to limit disruption to traffic, especially during peak travel hours.
Page 6-2 Air Quality Technical Report Honolulu High-Capacity Transit Corridor Project
AR00066198
References
Chiddix and Simpson, 2004. Next Stop Honolulu: Story of the 0 `ahu Railway and Land Company. Jim Chiddix and MacKinnon Simpson. Sugar Cane Press, Honolulu.
Census, 2002. Population of Counties by Decennial Census: 1900 to 1990. U.S. Bureau of the Census.
DBEDT, 2003. The Economic Contribution of Waikiki. Department of Business, Economic Development and Tourism.
DT 5, 1992. Final Environmental Impact Statement: Honolulu Rapid Transit Program. City and County of Honolulu Department of Transportation Services and U.S. DOT Federal Transit Administration.
DTS, 2006a. Honolulu High-Capacity Transit Corridor Project Alternatives Analysis Definition of Alternatives Report. City and County of Honolulu Department of Transportation Services.
DTS, 2006b. Honolulu High-Capacity Transit Corridor Project Screening Report. City and County of Honolulu Department of Transportation Services.
FHWA, 2006. FHWA Interim Guidance on Air Toxic Analysis in NEPA Documents — February 3, 2006, http://Www.fhwa.dot.gov/environment/airtoxic/020306guidmem.htm
OMPO, 1984. HALI 2000 Study Alternatives Analysis Final Report. 0' ahu Metropolitan Planning Organization.
OMPO, 1995. 0 `ahu Regional Transportation Plan. 0' ahu Metropolitan Planning Organization.
OMPO, 2001. Transportation for 0 `ahu Plan TOP 2025. 0' ahu Metropolitan Planning Organization.
OMPO, 2004. Exploring Public Attitudes on 0 `ahu about Transportation Issues, a Telephone Survey among 0 `ahu Residents. 0' ahu Metropolitan Planning Organization.
OTPP, 1967. 0 `ahu Transportation Study Summary Report. 0' ahu Transportation Planning Program.
State of Hawai'i, Department of Health, Clean Air Branch.
UH, 2005. Common Data Set 2004-2005, University of Hawai`i at Manoa. University of Hawai`i Institutional Research Office.
UH, 2002. Trends in the College Experiences of Undergraduates at the University of Haw ai '1 at Manoa from 1990 to 2002. University of Hawai`i Office of the Vice President for Student Affairs.
Air Quality Technical Report Page R-1 Honolulu High-Capacity Transit Corridor Project
AR00066199

United States Department of Transportation, Federal Highway Administration, 2006. Interim Guidance on Air Toxic Analysis in NEPA Documents.
United Stated Environmental Protection Agency, 2006. Airs Data, http://www . .epa.gov/air/data/geosel.html
United Stated Environmental Protection Agency, 2002. User 's Guide to MOBILE6. I and MOBILE6.2: Mobile Source Emission Factor Model.
Page R-2 Air Quality Technical Report Honolulu High-Capacity Transit Corridor Project
AR00066200