
Digital Marketing Minnesota - Mobile Advertising January, 2015

Air Quality in Minnesota2013 Report to the Legislature
Minnesota Pollution Control Agency January 2013

Air Quality in Minnesota | 2013 Report
Approximate cost to prepare this report: Staff time $23,800, production $90.
This report was printed in limited quantities.
The electronic version is available on the MPCA
web site at www.pca.state.mn.us/yhizb6a
Report Coordinator:
Mary Dymond
Technical Information Contributors:
David Bael, Peter Ciborowski, Anne Claflin,
Barbara Conti, Fran, Crotty, Mary Dymond,
Kristie Ellickson, Henry Fisher, Britt Gangeness,
Lisa Herschberger, Anne Jackson, Heather
Magee-Hill, Cassie McMahon, Laura Millberg,
Mike Mondloch, Phil Muessig, Catherine
Neuschler, Stephanie Souter, Mark Sulzbach,
Edward Swain, Rebecca Walter, and Chun Yi Wu.
Report Editor:
Ralph Pribble
Report Designers:
Paul Andre, Scott Andre, Theresa Gaffey
For further information:
Overview and Legislation
David Thornton, Assistant Commissioner
(651)757-2018
Air Quality Programs
Frank Kohlasch, Manager —Air Assessment
(651)757-2500
lraq-1sy3
CONTENTSWhy we care about air pollution 2
Air pollution in Minnesota 3
Pollutants with federal ambient air standards 4
Other air pollutants 5
How air pollution forms 5
Air Quality Index and air quality alert days 8
Primary Minnesota sources of pollutants of concern 11
Residential wood burning 11
Residential garbage burning 12
Stationary diesel generators 13
Feature: Mobile sources of air pollution 14
Mercury emission reductions in Minnesota 16
Challenges 18
Changing standards 18
Climate change 18
Greenhouse gas status & trends 20
Environmental justice/equity 21
Emerging issues 21
More MPCA efforts to improve air quality 22
Clean Air Dialogue 22
Other MPCA partnerships and initiatives 23
Monitoring the air 24
Conclusion 25
Appendix A: Mercury emissions from electricity generation 26
Appendix B: PM2.5 design value concentrations relative to CASAC lower boundaries 29
Endnotes 30
Minnesota Pollution Control Agency
www.pca.state.mn.us

Minnesota has a good record of complying with federal air quality standards; nearly all areas of the state have met standards since 2002. It is important for the health of Minnesotans and the economy of Minnesota to continue to meet these standards. Report page 4
Exceeding a federal ambient air standard would require Minnesota to adopt strict and expensive new air quality regulations to reduce air pollution levels. If fine particles and ozone are reduced, we could expect to see billions of dollars in health benefits. Report page 3
1. Although urban air quality is generally good, levels of fine particles and other pollutants are elevated in the Twin Cities metropolitan area and other Minnesota cities, compared to most of Greater Minnesota. Report pages 5-9
2. Researchers continue to find serious health effects at ever lower levels of air pollution. Report page 5
3. As more stringent standards are adopted, Minnesota becomes less likely to meet the revised thresholds. Taking actions to ensure Minnesota meets the standards may be especially challenging because poor air quality days occur for complex reasons, including forces such as weather patterns, pollutant mixing, and pollution coming in from other states. Report pages 5-8
4. Past work to improve air quality has focused on large individual sources of pollu-tion. Continuing to meet new standards and protecting human health will require looking at individually small, but collectively important sources. Report pages 3-4
SummaryReport to the Legislature
Air Quality in Minnesota: 2013
Topics • Air quality • Air pollution
Key points
Why is it important?
What is the issue?
Overall air quality in Minnesota has improved over the past 20 years, but current levels of air pollution are still of concern.
Minnesota’s air quality is improving despite increases in population and economic activity.
0%
50%
100%
1990 1994 1998 2002 2006 2010
Comparison of growth areas and emissions in MinnesotaPe
rcen
t ch
ange
sin
ce 1
990
Real gross state productVehicle miles traveledEnergy consumptionPopulationAggregate emissions (NOx, SO2, VOC, PM2.5)Greenhouse gases (tons of CO2e)
Real gross state product
Vehicle miles traveled
Energy consumptionPopulation
Greenhouse gases (tons of CO2e)
Aggregate emissions (NOX, SO2, VOC, PM2.5)
Comparison of growth areas and emissions in Minnesota
1990 1994 1998 2002 2006 2010
100%
50%
0%
Perc
ent c
han
ge
sin
ce 1
990
Sources: Bureau of Economic Analysis, U.S. Federal High-way Administration, MPCA Greenhouse Gas Inventory Data, State Demographers Office, MPCA Emissions Inventory Database

Air Quality in Minnesota | 2013 Report
Non-point sources becoming more important
Point sources that are traditionally regulated (factories, power plants) are becoming a smaller part of Minnesota’s air concerns.
The majority of the air pollutants of most concern today come from smaller wide-spread sources that are not regulated in the way power plants and factories are. These non-point sources include cars, trucks, construction equipment, residential wood burning, and residential garbage burning. The current regulatory structure will not help much with pollution from these sources. Report pages 3-4
In addition to its ongoing efforts involving point sources, the MPCA is focusing on strategies to reduce emissions or human exposure from several nonpoint sources—selected in order to reach the agency’s strategic plan goals of improving ambient air and to address changing federal air regulations.
These strategies will require an increased need for partnerships and will be multi-pollutant. Report page 22.
The agency will be focusing on the following sources of air pollution:
∫ Residential wood burning Report page 11
∫ Residential garbage burning Report page 12
∫ Stationary diesel generators Report page 13
∫ Mobile sources, both on-road vehicles and off-road vehicles and equipment Report page 14
∫ Mercury emissions sources Report page 16
Air Quality in MInnesota: 2013 Report to the Legislature is available at www.pca.state.mn.us/yhizb6a
Catherine [email protected]
Action areas
Minnesota Pollution Control Agency
Full report
Contact
www.pca.state.mn.us January 2013
Challenges
Point sources are becoming a smaller part of the air quality problems in Minnesota.
MN 2008 Emissions Inven-
tory: NOX, SO2, PM2.5, VOCs
Permitted sources (point)26%
Onroad vehicles28%
Off-road vehicles & equipment20%
Non- permitted sources (residential and commercial)26%

1Minnesota Pollution Control Agency
FOREWORD
The Minnesota Pollution Control Agency has a statutory requirement (Minn. Stat. §115D.15 and §116.925) to report to the Minnesota Legislature biennially on the status of toxic air contaminants and the MPCA’s strategies to reduce the emissions of air pollutants. The MPCA uses this report as an occasion to discuss the most pressing outdoor air-quality issues facing Minnesota and to explore the opportunities available for emission reductions.
Although overall air quality in Minnesota has improved over the past two decades, there remain reasons for concern about the levels of air pollution in Minnesota. One reason for concern is that levels of fine particles (defined as particles less than 2.5 microns in diameter, noted as PM2.5) and other pollutants are elevated in the Twin Cities metropolitan area and other Minnesota cities, compared to most of Greater Minnesota. On any given day air pollution can reach levels that cause health and environmental concerns. Improving air quality on such days is difficult because air pollution has complex causes, including weather patterns, pollutant mixing and pollution coming in from other states. Finally, researchers continue to find serious health effects at ever lower levels of air pollution, and the U.S. Environmental Protection Agency (EPA) is continually reviewing and tightening their air-quality standards as a result. Revisions to the standards in coming years may result in Minnesota falling out of compliance, leading to federal requirements for expensive regulatory action.

2 Air Quality in Minnesota | 2013 Report
Why we care about air pollution
Clean air means healthier people
Air pollution can cause breathing problems, itchy throats, burning eyes, and trigger asthma and bronchitis attacks. It contributes to cancer, heart attacks, and other serious illnesses. Even healthy, athletic adults can be harmed by breathing air pollutants. Young children may be more susceptible to health problems from air pollution because of their small size and rapid breathing. The elderly and people with heart and lung conditions are also at increased risk of harm from air pollution. And breathing in air pollution isn’t the only way Minnesotans are affected. Some air pollutants, such as mercury, settle out of the air into Minnesota’s lakes and streams, where it can accumulate in fish and lead to cautions to limit consumption.
Clean air means healthier ecosystems
Pollutants in Minnesota’s air reduce visibility, creating a haze that can affect scenic views in pristine places such as the Boundary Waters Canoe Area and Voyageurs National Park, as well as in the state’s urban areas. In addition, emissions of greenhouse gases, such as carbon dioxide and methane, contribute to climate change which will cause significant changes to Minnesota’s ecosystems. Minnesota’s lakes and streams can also be harmed by air pollution that causes acid rain.
Clean air means a more secure future
Cleaning up Minnesota’s air can reduce future health and ecological costs. According to a 2011 estimate by the EPA, the health benefits from meeting the requirements of the 1990 Clean Air Act Amendments greatly exceed the costs to control air pollution. The benefits of cleaner air come from avoiding costs associated with adverse health impacts from air pollution such as lost work or school time, doctor and hospital visits, and premature death. Air pollution also has other undesirable impacts including diminished enjoyment of outdoor recreational activities, accelerated damage to materials, reduced visibility, crop loss, and damage to ecosystems.
Cost of poor air quality
The Clean Air Act requires that EPA set federal ambient air standards to protect human health and the environment without consideration for the costs of meeting those standards. As researchers identify health effects at lower levels of air pollution, EPA correspondingly revises the federal standards.
However, as standards are lowered, regulators, regulated parties, and other stakeholders pay

3Minnesota Pollution Control Agency
considerable attention to the costs and benefits of meeting the standards. The costs of reducing pollution include installing control equipment and undertaking work practices or other strategies to reduce emissions. These costs vary widely depending on the pollutant, the type of control equipment available, and how much pollution reduction is necessary.
Minnesota will also face economic costs from the emission of greenhouse gases and the resulting changing climate. While it is difficult to estimate the potential costs of a warming climate to Minnesota, they are potentially high due to increased damage from floods and violent storms, changes to precipitation patterns leading to droughts, shifts in the location of forests and grasslands, loss of species that cannot adapt quickly to new climates, and impacts to health from more poor air quality days and heat-related illnesses.
Benefits of air quality improvement in Minnesota
The MPCA has calculated rough estimates of the total health benefits of improving air quality in Minnesota. For each incremental reduction of one microgram per cubic meter (µg/m3) in annual ambient PM2.5 concentration across the state of Minnesota, there would be annual health benefits in 2020 of about $2 billion. Each incremental reduction of one part per billion (ppb) in ozone concentration would produce annual health benefits in 2020 around $150 million.1 About half of these benefits would accrue to the 11-county metro area, with the remainder in Greater Minnesota.2
For simplicity, these estimates assume the same incremental air quality improvements for all areas of Minnesota, regardless of initial pollution levels. Areas that already have considerably cleaner air than is required by federal standards, however, would likely not see the same ambient concentration reductions as more polluted areas. Thus, these estimates may overestimate the overall statewide health benefits of incremental air quality improvements. These estimates were done in conjunction with the Clean Air Dialogue process (see page 22).
Air pollution in MinnesotaTypically, when we think about sources of air pollution, we think about buildings with big smokestacks like power plants and factories. Yet the amount of air pollution coming from sources such as factories and electric utilities has decreased significantly over the last 20 years, as a result of controls put in place under the Clean Air Act.
Minnesota’s emissions inventory shows that point sources only contribute about a quarter of overall emissions of several of the regulated air pollutants of major concern in Minnesota.3
Point source pollutants have seen significant declines (2000–2010)
For the period 2000–2010, percent decrease in total emissions for specific pollutants
!"#$ !"# $% $&'( )"* +",'--- %&%'()*+,- .(+.. ,*'-/)+.- %.)'0*(+*( ,.',))+)/*((( %&&')%)+.% ,/+)) (%'%)(+(& %.0'*0(+&0 ,/'*(,+0.*((' %(/'(,)+,) .,+%, .0'-,/+-% %.,'%.0+-( .0'/-*+((*((* %&.'((&+/* ..+%. ,%'(,)+,( %,/'(0%+). .-'0((+/&*((. %(-'*,(+)* .,+,% ,,'%()+*0 %,-'-*0+*0 .)',,*+(**((/ %(-'&))+%% ..+,% ,,'-*0+., %,,'/0*+(0 .*'/,/+)0*((0 %(*',),+,. %&+%0 ,/'(&%+0. %.0'0*&+-/ .)'/-,+..*((1 %,('/*,+*. %,+%& .-'(/(+%( %%-'.,/+*0 .('(%,+*&*((2 %,,',&(+.% %%+-) .-'-*(+,& %/0'/%.+(. .(',)*+*0*((3 %%)',..+(& %/+)* .-'()-+/- 00'.&&+&) ..')*,+-(*((- **')%&+%% )+00 ./'0*,+/* *%'/.)+%- %0'/%-+%%2010 -,'.(0 -+&, .)'0*/ ).'&,- ./'&)0
49%71% 44% 44% 41%
1
Lead PM10 NOx SO2 VOC
Minnesota Point Source Criteria Pollutant Inventory
4 Air Quality in Minnesota | 2013 Report
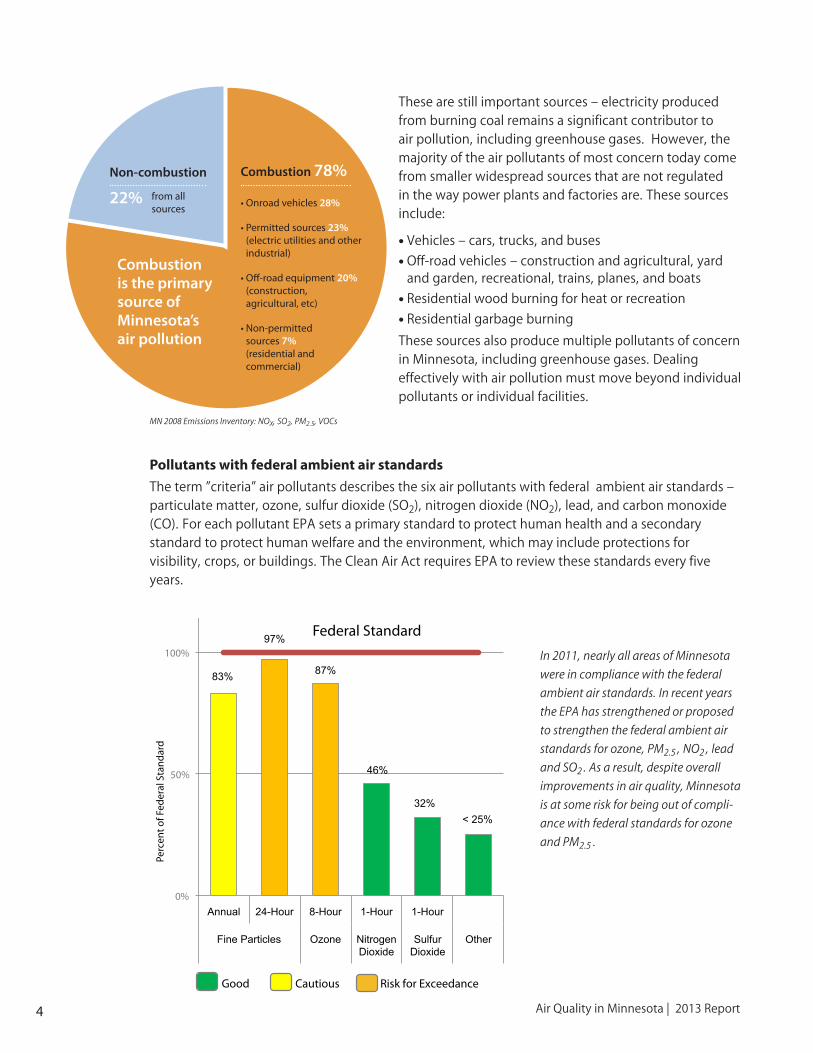
These are still important sources – electricity produced from burning coal remains a significant contributor to air pollution, including greenhouse gases. However, the majority of the air pollutants of most concern today come from smaller widespread sources that are not regulated in the way power plants and factories are. These sources include:
• Vehicles – cars, trucks, and buses
• Off-road vehicles – construction and agricultural, yard and garden, recreational, trains, planes, and boats
• Residential wood burning for heat or recreation
• Residential garbage burning
These sources also produce multiple pollutants of concern in Minnesota, including greenhouse gases. Dealing effectively with air pollution must move beyond individual pollutants or individual facilities.
Pollutants with federal ambient air standards
The term ”criteria” air pollutants describes the six air pollutants with federal ambient air standards – particulate matter, ozone, sulfur dioxide (SO2), nitrogen dioxide (NO2), lead, and carbon monoxide (CO). For each pollutant EPA sets a primary standard to protect human health and a secondary standard to protect human welfare and the environment, which may include protections for visibility, crops, or buildings. The Clean Air Act requires EPA to review these standards every five years.
Non-combustion
22%
Combustion 78%
• Onroad vehicles 28%
• Permitted sources 23% (electric utilities and other industrial)
• Off-road equipment 20% (construction, agricultural, etc)
• Non-permitted sources 7% (residential and commercial)
83%
97%
87%
46%
32% < 25%
Federal Standard
0%
50%
100%
Annual 24-Hour 8-Hour 1-Hour 1-Hour
Fine Particles Ozone Nitrogen Dioxide
Sulfur Dioxide
Other
Perc
ent o
f Fed
eral
Sta
ndar
d
Good Cautious Risk for Exceedance
83%
97%
87%
46%
32% < 25%
Federal Standard
0%
50%
100%
Annual 24-Hour 8-Hour 1-Hour 1-Hour
Fine Particles Ozone Nitrogen Dioxide
Sulfur Dioxide
Other
Perc
ent o
f Fed
eral
Sta
ndar
d
Good Cautious Risk for Exceedance
In 2011, nearly all areas of Minnesota
were in compliance with the federal
ambient air standards. In recent years
the EPA has strengthened or proposed
to strengthen the federal ambient air
standards for ozone, PM2.5 , NO2 , lead
and SO2 . As a result, despite overall
improvements in air quality, Minnesota
is at some risk for being out of compli-
ance with federal standards for ozone
and PM2.5 .
Combustion is the primary source of Minnesota’s air pollution
MN 2008 Emissions Inventory: NOX, SO2, PM2.5, VOCs
from all sources

5Minnesota Pollution Control Agency
Air quality in Minnesota has steadily improved since the passage of the Clean Air Act in 1970. The greatest improvements have come through reductions of CO, NO2, SO2 and lead. While concentrations of PM2.5 and ozone have also improved over time, the levels of these pollutants are affected not only by Minnesota’s emissions, but by variations in meteorology, movement of air pollution from other states, and reactions in the atmosphere. The levels of PM2.5 and ozone in Minnesota’s air have the potential to exceed federal ambient standards. As research continues to find that these pollutants cause adverse health effects at ever lower concentrations, EPA is making these standards more stringent.
Other air pollutants
There are hundreds of other chemicals in Minnesota’s air that can cause serious health problems. Referred to as “air toxics,” there are no federal ambient air standards for these pollutants. Many of these chemicals interact in the air in complex ways. For example, air toxics such as formaldehyde and acrolein are volatile organic compounds (VOCs) that contribute to the formation of ozone during the summer months. Other air toxics are metals or organic chemicals that can also exist in the form of PM2.5. Some air toxics can migrate into the food chain.
MPCA has identified widespread air toxics in Minnesota’s air at levels that could affect the health of Minnesotans. In 2010 MPCA began developing strategies to reduce the levels of these pollutants. The toxic pollutants of primary concern are fine particles from diesel emissions, polycyclic aromatic hydrocarbons, dioxins and furans, formaldehyde, and acrolein. All of these are widespread combustion products. Fine particles from all sources are also of concern because of potentially significant health effects and impacts on visibility in pristine areas.
How air pollution forms
Two key air pollutants for Minnesota are PM2.5 and ozone, because they are being found to cause adverse health effects at ever lower concentrations. Strengthened standards underscore the need to consider reducing their emissions. To achieve reductions of these pollutants, it is important to understand their sources and how they form in the atmosphere.
Fine particles
Fine particles (defined as particles less than 2.5 microns in diameter, noted as PM2.5) are a complex mixture of extremely small particles and liquid droplets made up of a number of components including acids, organic chemicals, metals, and soil or dust.
These particles are released into the environment when coal, gasoline, diesel, wood and other fuels are burned, and are also created in the air by chemical reactions among other pollutants. Gasoline and diesel combustion in cars, trucks, buses, tractor trailers and construction equipment, known as mobile sources, contribute a third to half of PM2.5 concentrations in highly populated urban areas.5 Much of the remaining fine particles in urban air form from ammonium sulfate and ammonium nitrate, compounds created when sulfur dioxide (SO2) and nitrogen oxides (NOX) react with ammonia in the atmosphere. Coal burning, primarily at power plants, is the major source of SO2. Coal burning and mobile sources are the major sources of NOX. Fertilizers and livestock are important sources of ammonia.
PM2.5 in Minnesota’s airMinnesota currently meets the annual and daily standards for PM2.5 but is at risk for falling out of compliance. PM2.5 is regulated to ensure public health protection from both longer term (annual) and shorter term (daily) exposures. In December of 2012, the EPA strengthened the annual ambient
Nitrogen Oxides
are a gaseous
mix of nitric
oxide (NO) and
nitrogen dioxide
(NO2)
6 Air Quality in Minnesota | 2013 Report
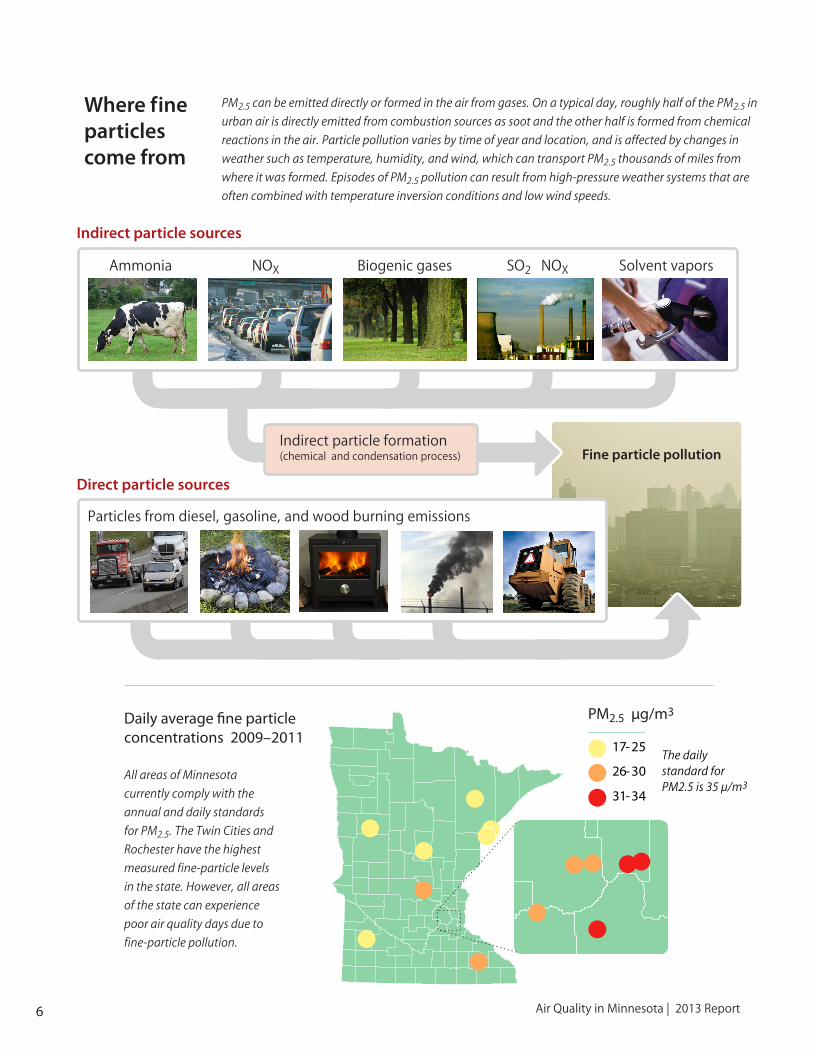
Where fine particles come from
Ammonia
Particles from diesel, gasoline, and wood burning emissions
NOX Biogenic gases SO2 NOX Solvent vapors
Indirect particle formation(chemical and condensation process) Fine particle pollution
Indirect particle sources
Direct particle sources
PM2.5 can be emitted directly or formed in the air from gases. On a typical day, roughly half of the PM2.5 in
urban air is directly emitted from combustion sources as soot and the other half is formed from chemical
reactions in the air. Particle pollution varies by time of year and location, and is affected by changes in
weather such as temperature, humidity, and wind, which can transport PM2.5 thousands of miles from
where it was formed. Episodes of PM2.5 pollution can result from high-pressure weather systems that are
often combined with temperature inversion conditions and low wind speeds.
All areas of Minnesota
currently comply with the
annual and daily standards
for PM2.5. The Twin Cities and
Rochester have the highest
measured fine-particle levels
in the state. However, all areas
of the state can experience
poor air quality days due to
fine-particle pollution.
Daily average fine particle concentrations 2009–2011
21
17 - 25
26 - 30
31 - 34
PM2.5 µg/m3
The daily standard for PM2.5 is 35 µ/m3
PM2.5 µg/m3

7Minnesota Pollution Control Agency
air standard to 12 µg/m3 in response to new scientific information on the health effects of fine-particle pollution. The EPA retained the existing daily standard of 35 µg/m3 set in 2006. Compliance is evaluated annually using the most recent three years of data. All areas of the state currently meet these standards. However, in 2010 two PM2.5 monitors in St. Paul exceeded the daily standard. These exceedances were driven by abnormally stagnant weather conditions over the winter of 2009-2010. While fine-particle levels have returned to compliance, the 2010 exceedances highlight the risk for future noncompliance with the fine-particle ambient standard.
PM2.5 and regional haze“Regional haze” is a reduction in visibility due to PM2.5 in the atmosphere, for which EPA established a regulatory program to reduce haze caused by man-made air pollution at national parks and wilderness areas. In 2009, the MPCA completed an EPA-required implementation plan laying out strategies for reducing pollutants that contribute to regional haze in the Boundary Waters Canoe Area Wilderness, Voyageurs National Park, and Isle Royale National Park (part of Michigan). The plan was updated and submitted to EPA in 2012. The EPA approved the majority of Minnesota’s plan as meeting the federal requirements in June 2012, with the exception of MPCA’s determination of appropriate controls for taconite facilities. Instead, EPA proposed its own implementation plan for the taconite facilities that requires installation of a specific kind of NOX emission control at each facility and SO2 emission control at some facilities. EPA is scheduled to finalize the plan in January 2013.
Ozone
Ozone is a colorless gas composed of three atoms of oxygen. In the upper atmosphere it helps protect the earth from the sun’s ultraviolet radiation, but at ground level it can be a harmful pollutant. Ground-level ozone is not emitted directly, but is created in the air through a reaction of
Ultraviolet light transforms VOCs and NOX into ozone
VOCs NOx VOCs NOx
Ozone Ozone
VOCs
Tailpipe emissions, fuel vapors
Smokestack emissions and vapors from some chemicals, fuels
Heating system and and vapors from some chemicals, fuels
How ground-level ozone formsPollutants called VOCs
and NOx mix in the air and
then are transformed by
UV light into ground-level
ozone. High levels of ozone
are harmful to humans,
especially those with
respiratory health issues.
Temperature, wind and
amount of sunshine are
important variables: hot,
sunny days often produce
higher levels of ground-
level ozone.

8 Air Quality in Minnesota | 2013 Report
NOX and VOCs mixing in the presence of sunlight. VOCs come from cars, factories and many other sources. NOX is a group of highly reactive gases emitted to the air mostly from burning fuel. Levels of ozone are dependent on the amount and ratios of VOCs and NOX in the air as well as weather conditions including sunlight, temperature, and wind speed and direction.
Ozone in Minnesota’s airAll areas of Minnesota currently meet the federal ambient 8-hour standard for ozone but Minnesota is at risk for being out of compliance. In 2008, EPA tightened the federal eight-hour ambient air standard for ozone to 75 parts per billion (ppb). EPA plans to propose a revised ozone standard in September 2013, with a final standard planned for 2014. Preliminary documents indicate that EPA believes the scientific evidence on the health impacts of ozone shows that the current ambient standard is insufficient to protect public health.6 EPA’s Clean Air Scientific Advisory Committee has recommended that a new ambient standard be set in the range of 60–70 ppb to ensure public health protection with an adequate margin of safety. In 2010, EPA proposed a revised ozone standard in the range of 60 – 70 ppb but withdrew the proposal in fall 2011. Many areas of Minnesota would not meet the revised standard if the EPA sets the standard at the lowest end of the advisory committee’s recommended range.
The amount of ozone pollution in the atmosphere depends not only on the amount of NOX and VOCs released into the air, but also on weather conditions. High levels of ozone are typically seen on sunny days with light winds and temperatures above 90 degrees F. If global climate change results in more days that are favorable for ozone formation, further reductions in NOX and VOC emissions may be required to ensure continued compliance with the federal ambient ozone standard.
Air Quality Index and air quality alert days
MPCA reports an hourly Air Quality Index (AQI) for nine areas in Minnesota, providing real-time air quality information so that citizens can make informed decisions to protect their health. The AQI assigns a numeric index value to measured air pollutants which are then categorized as good, moderate, unhealthy for sensitive groups, or unhealthy for everyone. MPCA calls an air quality alert when the AQI is expected to be unhealthy for sensitive groups or worse. In Minnesota, most days have good air quality, but there are days when air quality becomes moderate or unhealthy for sensitive groups.
ppbOzone
49–54
55–60
61–65
The 8-hour standard for ozone is 75 ppb
Statewide ozone eight-hour concentrations 2009–2011
In general, ozone levels are highest in the Twin Cities
metropolitan area, with the highest readings in
suburban areas downwind of the urban core. In 2011,
Blaine recorded the highest ozone value in the state.
9Minnesota Pollution Control Agency
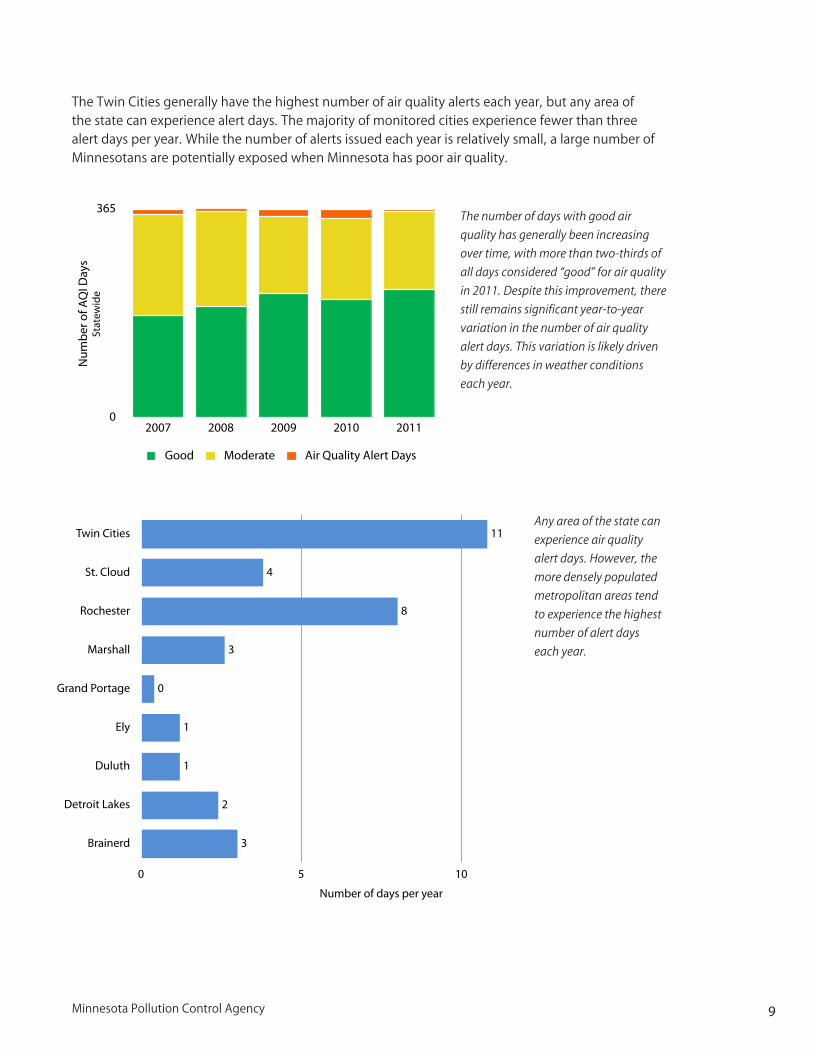
The Twin Cities generally have the highest number of air quality alerts each year, but any area of the state can experience alert days. The majority of monitored cities experience fewer than three alert days per year. While the number of alerts issued each year is relatively small, a large number of Minnesotans are potentially exposed when Minnesota has poor air quality.
0
365
2007 2008 2009 2010 2011
Num
ber
of A
QI D
ays
Good Moderate Air Quality Alert Days
Stat
ewid
e
The number of days with good air
quality has generally been increasing
over time, with more than two-thirds of
all days considered “good” for air quality
in 2011. Despite this improvement, there
still remains significant year-to-year
variation in the number of air quality
alert days. This variation is likely driven
by differences in weather conditions
each year.
Twin Cities
St. Cloud
Rochester
Marshall
Grand Portage
Ely
Duluth
Detroit Lakes
Brainerd
0 5 10 15
3
2
1
1
0
3
8
4
11
Average number of Air Quality Alert Days (2007-2011)
Number of days per year
Any area of the state can
experience air quality
alert days. However, the
more densely populated
metropolitan areas tend
to experience the highest
number of alert days
each year.

10 Air Quality in Minnesota | 2013 Report
Pollutants Primary sources7 Potential health effects
Fine particles directly emitted from combustion sources8
Associated with serious health effects like heart attacks, acute and chronic bronchitis, asthma episodes, reduced lung function, and increased respiratory illness in young children.9 36 % 16% 17% 13%
Fine particlesdiesel exhaust
Aggravates allergies and asthma and can cause lung cancer with prolonged exposure
48% 30% 10%
Nitrogen oxides (ozone precursor)
Can worsen bronchitis, emphysema and asthma and increase risk of premature death from heart or lung disease10
29% 25% 23 % 19%
Polycyclic aromatic hydrocarbons
Some PAHs are carcinogens, can cause harm by direct inhalation and by uptake into the food chain
38% 31% 15%
Dioxins and furans
Potent carcinogens, cause the most harm by accumulating in meat, fish and dairy products. Especially harmful for pregnant women, nursing infants, children and the elderly.
57% 11 26%
Pollutants of concern and their primary sources
Construction and mining equipment
Diesel on-road heavy-duty trucks, delivery trucks, buses
Gasoline light-duty vehicles & trucks
Agricultural equipment
Point sources (emissions from facilities)
Residential woodburning (wood stoves, boilers, campfires)
Residential garbage burning (e.g. burn barrels)

11Minnesota Pollution Control Agency
Primary Minnesota sources of pollutants of concern
The chart on the previous page shows several of the pollutants of most concern, some of their primary emissions sources, and potential health effects. For each pollutant, the source symbols are arranged from greatest to smallest source, left to right. Ozone, formaldehyde and acrolein are not represented since these pollutants are generally formed from the reaction of other pollutants in the air rather than being emitted directly from combustion.
As can be seen in the table, the pollutants of greatest concern are widespread combustion products from sources that are not regulated in the same way as power plants and factories. MPCA’s 2010 efforts to develop strategies to reduce the levels of pollutants of concern resulted in a decision to focus on strategies involving emissions or exposure reduction measures for several of these non-point sources in addition to the MPCA’s ongoing efforts involving point sources. The following source categories were selected for emphasis in order to reach the MPCA’s Strategic Plan goal of improving ambient air and to address continuing federal air regulatory changes.
Residential wood burning
Minnesotans burn wood at home for many reasons, including heating, cooking, recreation, and brush disposal. In many parts of the state, particularly rural areas, wood stoves and outdoor wood boilers are used for supplemental or primary home heating. Fuelwood demand increased in Minnesota from 2003 to 2008. When traditional heating fuels such as natural gas and fuel oil increase in price, more Minnesotans turn to wood stoves and outdoor wood boilers.
Wood smoke is unhealthy Wood smoke contains many different chemicals and compounds. Exposure to these chemicals can lead to both short-term and long-term health effects. Chemicals and particles from wood smoke can irritate eyes, noses and throats, can exacerbate asthma, and are associated with increased respiratory symptoms. Exposure to wood smoke may increase susceptibility to infectious lung disease and, at high doses, may permanently damage lung tissue. Young children as well as people with asthma and other chronic lung diseases are particularly susceptible to the adverse effects of wood smoke.
Burning cleaner Solid fuels such as wood tend to have more impurities, causing them to emit more pollutants than liquid or gaseous fuels. Combined with a lack of pollution controls and often too-short stacks, this causes wood-burning stoves and heaters to emit more air pollutants than furnaces burning natural gas or fuel oil.
Dry, seasoned wood—whether in a campfire or wood stove—produces far less smoke than unseasoned wood. Wood should be burned only when the moisture level is 20% or less. It may take six or more months to properly dry.
Natural gas is a much cleaner fuel choice than wood in terms of emissions of PM2.5 and many other air pollutants such as carbon monoxide, formaldehyde, polycyclic aromatic hydrocarbons, and
Fuelwood use in Minnesota increased from 2003 to 2008
2002 / 2003 2007 / 2008
1 million cords
(12 month period)

12 Air Quality in Minnesota | 2013 Report
benzene. Though new EPA-certified wood stoves are cleaner than uncertified stoves or fireplaces, they still produce 100 times more harmful fine-particle pollution than a gas furnace for the same amount of heat.
Residential garbage burning
Today’s garbage is a mix of plastics and other man-made products that release cancer-causing pollutants and other toxic materials. Even seemingly harmless items like white office paper, junk
mail, and pizza boxes give off toxic smoke. Too many rural residents still burn garbage at home, where low burn temperatures result in incomplete combustion and lack of air emissions controls results in uncontrolled air pollution. Pound for pound, garbage burned in a home burn barrel gives off many times more dioxins and furans than a municipal incinerator which is designed for efficient
combustion conditions and pollution control. Home garbage burning creates about a fourth of all the airborne dioxins and furans from Minnesota air emissions sources and also contributes to direct emissions of PM2.5 and formaldehyde. Dioxins are toxic and get into the food chain. PM2.5 and formaldehyde are unhealthy to breathe.
In Minnesota, open garbage burning is illegal for all residents. Still, approximately 230,000 Minnesota households, or 39% of all rural residents, burn their garbage. There are many reasons for this: lack of garbage hauling services or garbage/recycling drop-off collection sites, convenience, cost and habit. The MPCA conducted a pilot study to help rural counties implement education, outreach, and garbage/recycling drop-off collection sites. A follow-up survey found the use of open burning as a means to dispose of garbage fell approximately 12%. In order for the MPCA to reach its target of reducing households burning garbage by 75%, about 170,000 more households need to stop burning trash. For more information on burning garbage and what is being done about it in Minnesota, go to: www.pca.state.mn.us/burnbarrel
An example of
how dioxin in the
smoke from burn-
ing garbage can
end up in our food.
When livestock
eat feed that has
been contaminated
with dioxin, they
concentrate the
chemical in their
milk and meat.

13Minnesota Pollution Control Agency
Stationary diesel generators
Fuel combustion in engines releases pollutants that can directly harm people as well as pollutants that may contribute to regional air quality problems. Because stationary diesel generators typically have long operating lives, many older generators with minimal or no emission controls remain in service. These older units are a priority concern for MPCA.
Many stationary diesel generators operate in urban areas serving businesses, hospitals and schools. These are locations where diesel emissions may possibly adversely affect large numbers of people, especially those most susceptible – children, elderly, and those already suffering from respiratory and cardiovascular issues. Evidence shows that exposure to diesel exhaust can result in adverse respiratory effects, aggravate allergies, or exacerbate asthma symptoms. Prolonged exposure can even cause lung cancer. Diesel exhaust is mostly comprised of PM2.5. Studies show human exposure to urban airborne PM2.5 can also have cardiovascular effects and contribute to premature death. MPCA is working with several partner organizations to reach out to owners of these units on how to minimize air emission impacts.
A typical diesel generator installation at a nursing home located near resident rooms. Low smokestacks result in
poor air dispersion, and people can be exposed to exhaust through windows and building air intake vents.

14 Air Quality in Minnesota | 2013 Report
Feature: Mobile sources of air pollution
Mobile sources, both on-road vehicles and off-road vehicles and equipment, are significant contributors to air pollution in Minnesota. EPA’s 2008 emissions inventory shows that on- and off-road mobile sources account for approximately half of the total amount of NOX, SO2, PM2.5 and VOCs emitted in Minnesota, and contribute significantly to the formation of ground-level ozone. Transportation accounts for roughly 25% of greenhouse gas emissions in Minnesota.
There is growing concern about health impacts from air pollutants associated with traffic emissions. Studies have shown that people who live, work, or attend school near major roads have an increased incidence and severity of health problems that may be related to air pollution from roadway traffic. Despite significant reductions in tailpipe emissions over the past 40 years, particularly from standard passenger cars and trucks, we still have a long way to go in reducing mobile-source pollution because there are more cars driving more miles over the past decade.
Health impacts of vehicle emissions
Although vehicles are getting cleaner, exposure to their emissions still can have significant health effects for people living or working near high-traffic areas. Health effects include reduced lung function and impaired development in children, asthma, cardiovascular disease, low birth weight, pre-term newborns, and premature death.
Air-pollution health risks are generally higher in urban areas, where there is a high concentration of moving vehicles. Studies of traffic emissions note that areas 1000-1600 feet from highways and other major roads are most impacted by traffic-related pollution. An estimated 30% to 45% of people living in large North American cities live within such zones.12
On-road gasoline vehicles
Tailpipe emissions from on-road gasoline vehicles have steadily declined since passage of the Clean Air Act in 1970. Tightening standards, voluntary agreements, and changes in fuel formulation reduced emissions from on-road gasoline vehicles up to 44% between 1970 and 2002. These reductions occurred despite increases in numbers of vehicles on the road and total number of vehicle miles traveled. This emission reduction trend among gasoline on-road vehicles is predicted to continue and could be accelerated by removing aging vehicles from our roads.
According to an EPA study of light-duty vehicles, 13% of vehicles are responsible for more than 50% of the PM2.5 emissions from on-road vehicles13. These are older, dirtier vehicles, of which there is often a higher concentration in high-traffic zones. Identifying and repairing or retiring these high-polluting vehicles would have a positive impact on both local and regional air quality.
Air pollution from traffic can extend 1600
feet from roadways into surrounding
neighborhoods, resulting in adverse
health effects to people living,
working or attending school near
major roadways.

15Minnesota Pollution Control Agency
Diesel emissions
Emissions from diesel-powered vehicles and non-road diesel engines (especially heavy-duty vehicles and engines) do not have the same history of regulation as gasoline engines. Emissions standards were applied to on-road diesel vehicles and non-road engines decades later than on-road gasoline vehicles.
In contrast to reductions from gasoline vehicles, NOX emissions from heavy-duty diesel trucks increased more than 90% between 1970 and 2002.Yet EPA anticipates that implementation of recent vehicle emissions standards and the inevitable fleet turnover with newer, cleaner vehicles (especially on-road gasoline and diesel vehicles) will significantly reduce total annual NOX emissions from mobile sources in the U.S.
Other pollutants show similar trends. Recent vehicle emissions standards for on-road and off-road diesel vehicles as well as gradual replacement with newer, cleaner vehicles will significantly reduce PM2.5 emissions from diesel mobile sources in Minnesota over the next few decades.
More work is needed
Emissions data suggest that the three most significant sources of diesel particle emissions are agricultural equipment, off-road construction and mining equipment, and on-road heavy-duty trucks. It is common for diesel engines to last 20 to 40 years. Many older vehicles and engines without emissions controls are still in use and turnover to a new fleet of clean equipment can be very slow. Acceleration of efforts to replace or retrofit emission controls on these vehicles or to remove them from roadways would have a significant effect on VOC, NOX and PM2.5 emissions, and would be especially beneficial for people living and working close to where this equipment is operated.
MPCA diesel initiatives
MPCA efforts to reduce diesel engine emissions began with targeting school buses to better protect school children.
2002 2009 2014 2020Off-road diesel 2,430 2,152 1,753 1,227On-road diesel 5,180 3,562 2,272 1,492Off-road gasoline 513 416 280 243On-road gasoline 6,094 3,633 2,403 1,473
0
2,000
4,000
6,000
8,000
10,000
12,000
14,000
16,000
2002 2009 2014 2020 2030
Thou
sand
s of
Ton
s
Annual Mobile Source U.S. NOx Emission Projections
On-road gasoline
Off-road gasoline
On-road diesel
Off-road diesel
NOX emissions from on- and off-
road mobile sources are projected to
significantly decrease across the country
over the next two decades. Similar trends
are expected for PM2.5. Because PM2.5
emissions increase in colder weather,
Minnesota’s emission projections are
expected to be somewhat different from
national projections.
Heavy-duty trucks, agricultural equipment, and
construction and mining equipment are the most
significant sources of diesel PM2.5 across Minnesota. While
there are standards regulating new equipment, older
engines can last 20-40 years.
Other6%
Locomotives6%
Construction and Mining Equipment 11%
Agricultural Equipment29%
Onroad heavy duty buses2%
Onroad light duty vehicles2%
Onroad heavy duty vehicles45%
Diesel PM2.5 Statewide Emissions 2008
Source: EPA
2008 Minnesota Emissions Inventory

16 Air Quality in Minnesota | 2013 Report
Since 2006, more than 3,000 eligible school buses in Minnesota have been retrofitted with emission reduction devices. A final push to reach the last buses will end in 2013. This successful effort involved public and private partnerships to utilize state, federal and private funding.
MPCA concurrently worked on a smaller scale to reduce idling emissions from long-haul trucks, retrofit publicly-owned heavy-duty trucks in the metro area, and implement emission-reducing technologies in a variety of heavy-duty diesel fleets and other diesel engines across Minnesota.
MPCA’s recent diesel retrofit efforts focused on construction equipment that operates in the metro area. Three MPCA federal grant projects for diesel were completed in the summer of 2012, resulting in:
• Retrofitting 40 Metropolitan Airport Commission airport support vehicles
• Replacing old engines in five 100-ton cranes operating on Twin Cities metro bridge projects
• Funding the incremental cost to make six new delivery trucks used for Twin Cities-area deliveries into electric-diesel hybrids
For diesel grant project stories and information visit www.pca.state.mn.us/wfhy4c4
Mercury emission reductions in Minnesota
In response to widespread mercury contamination of sport fish, MPCA developed a statewide mercury Total Maximum Daily Load (TMDL), which established an estimate of the maximum amount of mercury that Minnesota’s water bodies can receive and still meet water-quality standards.
In developing the TMDL, MPCA determined that virtually all of the mercury in Minnesota’s surface water was deposited from the atmosphere. The TMDL showed that the level of atmospheric mercury from man-made sources must be reduced by 93% from the 1990 baseline. The goal of the TMDL is to reduce mercury emitted from all Minnesota sources to 789 pounds annually, thus ultimately helping to reduce fish contamination.
0
500
1,000
1,500
2,000
2,500
3,000
3,500
2005 2008 2018 2025
Mer
cury
Em
issi
ons
(pou
nds)
Largely resulting from the purposeful use of mercury
Incidental to material processing (mostly mining)
Incidental to energy production (mostly coal)
TMDL goal of 789 lb
Projected emissions
2025 Goal
Mercury
emissions are
projected to
continue to
decline from
three important
Minnesota
sectors.

17Minnesota Pollution Control Agency
The implementation plan to reach this goal by 2025 was completed in October 2009. The largest mercury emission sources are coal-fired power plants, taconite processing, and the use and disposal of mercury-containing products. The implementation plan sets milestones and goals for each of these sectors in order to meet the goal by 2025.
Reductions from coal-fired power plants are ahead of schedule
The mercury reductions called for in the Mercury Emission Reduction Act of 2006 (Minn. Stat. 216B.68 to Minn. Stat. 216B.688) are contributing significantly to achieving the TMDL reduction goals for the electric utility sector. This law requires reductions from the state’s three largest coal-burning power plants by the end of 2014, and current progress is very promising. In December 2011, EPA adopted mercury and air toxics emission standards requiring mercury control for all coal-fired utility boilers in the United States. These two regulations put Minnesota’s utilities on track to achieve greater reductions than the goals set in the mercury TMDL implementation plan, and four or five years earlier than planned.
Research at ferrous processing facilities identifies promising control methods
As accounted for in the Mercury TMDL implementation plan, mercury emissions from the ferrous mining sector will increase in the next few years due to the startup of a new taconite furnace at Essar Steel and increased production at Mesabi Nugget. Future reductions are anticipated to meet the 2025 goal, because Minnesota’s taconite-processing industry is working to identify and test pollution-control technologies suited to its unique needs. Initial testing at operating taconite facilities in 2011 and 2012 evaluated many methods for controlling mercury emissions; several were found to have the potential to control mercury to levels that will allow the industry to achieve its 75% reduction goal. Future research on mercury controls will focus on further evaluation of technical feasibility and consideration of environmental, energy and economic impacts.
Partnerships engage new stakeholders to reduce mercury in products
MPCA plans to increase communication with businesses and institutions that have not traditionally been familiar with MPCA and its work. Based on emission trends, addressing the continued presence of mercury in products and dental amalgam will be critical to achieving the 2025 TMDL goal. MPCA is working with the University of Minnesota, local funeral directors, and the Department of Health to build a partnership around the goal of reducing mercury emissions from dental amalgam at crematoria. Their goal this biennium is to work with these interests to develop higher-quality mercury emission estimates. In addition, MPCA is working on identifying meaningful incentives for manufacturers to cease production of mercury-containing switches and measuring devices. Finally, the MPCA is reinvigorating its outreach to salvage-yard operators. The first step is to conduct a salvage, scrap processing, and demolition workshop for state and local compliance and enforcement staff so that those inspectors have a better understanding and appreciation of the salvage business along with awareness of the environmental problems that mercury wastes can create.
MPCA Rulemaking to promote best practices
MPCA is working to adopt a new rule addressing Minnesota’s mercury emissions inventory and reduction requirements; the rule will incorporate federal mercury emissions control requirements into state law. These federal standards include requirements for utilities, industrial boilers, and sewage sludge incinerators. Additionally the rule will require minimization plans and best management practices to reduce mercury emissions in the state.

18 Air Quality in Minnesota | 2013 Report
Challenges
Changing standards
Minnesota has a good record of complying with federal ambient air standards, with nearly all areas of the state in attainment since 2002. It is important for the health of Minnesotans and the economy of Minnesota to continue to meet these standards. Exceeding a federal ambient air standard would require Minnesota to adopt strict and expensive new air quality regulations to reduce air pollution levels.
Despite overall improvements in air quality, revised standards may be more difficult to meet as EPA makes them more stringent to protect human health. Current air pollution levels in Minnesota are near federal ambient standards. As future revisions continue to strengthen the standards, the risk that Minnesota will fall out of compliance will increase.
Climate change
Climate change has the potential to disrupt ecological, economic and social systems in ways that impact both global and local environments. Once emitted, carbon dioxide, a heat-trapping greenhouse gas, remains in the atmosphere for very long periods of time. As a result, once the climate warms, it will not return to present conditions for 1000 years or longer, making changes essentially permanent for the next 50 generations of Minnesotans.
There is strong evidence that Minnesota ecosystems are already changing as a result of a warmer climate. The warming trend observed since 1980 in Minnesota and other north central states is the steepest, most intense in the continental US. In general, Minnesota’s climate is getting warmer and wetter, and is showing an increased frequency of extreme storm events.
Rate of increase: 1.4°F/century
Rate of increase: 2.8°F/century
36.0
38.0
40.0
42.0
44.0
46.0
1890 1910 1930 1950 1970 1990 2010
Tem
p, °F
Minnesota Average Annual Temperature Since 1890, the
mean annual
surface temperature
in Minnesota has
increased about 1° F.
Half of that increase
has occurred in the
last 25 years. Warmer
temperatures will
directly affect growing
conditions, vegetation
patterns, lake water
levels, and wildlife
populations.
Source: State Climatology Office - DNR Division of Ecological and Water Resources and University of Minnesota
Minnesota average annual temperature

19Minnesota Pollution Control Agency
Minnesota plant hardiness zones are changing. A
new hardiness zone (5) entered Minnesota by 2006
while Zone 3 retreated northward.
Source: MN DNR Climate Change and Renewable Energy: Management Foundations, August 2011
0
0.05
0.1
0.15
0.2
0.25
1910 1920 1930 1940 1950 1960 1970 1980 1990 2000 2010
Perc
ent o
f day
s p
er y
ear
(5-y
r run
ning
ave
rage
) Upper Midwest Extremes in 1-Day Precipitation:
Warm Season (April-September)
Upper Midwest extremes in one-day precipitation: Warm season (April–September)
Minnesota’s climate
has grown wetter, with
the frequency of intense
rainfall increasing. The
frequency of extreme
precipitation events has
increased since 1978.
Source: National Oceanic and Atmospheric Administration, National Climatic Data Center
In Minnesota lakes, ice-out shifted to earlier dates
by 1.3 days per decade between 1965 and 2002,
and ice-in shifted later by 7.5 days per decade
between 1979-2002.
Zone 5
1990 2006
Plant hardiness zones
Zone 4
Zone 3Zone 3
Zone 4

20 Air Quality in Minnesota | 2013 Report
Greenhouse gas status & trends
In 2007, the Minnesota Legislature enacted long-term reduction goals for greenhouse gases (GHG) (Minn. Stat. 216H.02). With 2005 as a baseline, the goals are a 15% reduction of GHG emissions from all sources by 2015, a 30% reduction by 2025, and an 80% reduction by 2050. As of 2010, in-state GHG emissions were roughly 5% below 2005 levels, about a third of the way to meeting the statutory
2015 goal. Most of the reduction has come from reducing the use of coal in the electric power sector and reductions in gasoline and jet fuel use. Much of the reduction in coal use is the result of the 2007 Renewable Energy Standard, which required Minnesota utilities to submit plans to the Legislature for achieving GHG reduction goals. This requirement has spurred an increase in wind generation to about 14% of total in-state power generation (from 3% in 2005). Travel on Minnesota highways has been flat since 2005. In conjunction with increasing vehicle fuel economy, this has led to about a 6% reduction in GHG emissions from highway transportation.
Electric power improvements
In-state electric power generation accounts for about 25%, 17%, and 70% of Minnesota’s GHG, NOX and SO2 emissions, respectively. Since 2000, emissions of GHG, NOX, and SO2 from in-state power generation sources have declined 11%, 58%, and 54%, respectively. In the case of NOX and SO2, most of this reduction resulted from the installation of pollution-control equipment and the conversion of old coal-fired generating units to cleaner-burning fuels. About one-third of the reduction resulted from the use of new, renewable power generation such as wind power. In the case of GHGs, about 90 percent of the reduction in emissions resulted from the introduction of these new clean power sources.
As of 2011, about 17% of in-state energy sources were renewable. Under the Minnesota Renewable Energy Standard, this is expected to double by 2025. With the increasing use of inherently clean generating sources, progress in reducing pollutant emissions from electric power generation should continue well into the future.
100
110
120
130
140
150
160
170
1990 1995 2000 2005 2010
CO2-
equi
vale
nt (m
illio
ns o
f sho
rt to
ns)
Mill
ion
s
Minnesota Greenhouse Gas Emissions: 1990-2010
Historical emissions
2015 goal
2025 goal
-
5
10
15
20
25
30
35
40
45
50
-
20
40
60
80
100
120
140
2000 2001 2002 2003 2004 2005 2006 2007 2008 2009 2010
CO2-
equi
vale
nt (
Mill
ions
of t
ons)
M
illio
ns
SO2
and
NO
x (T
hous
ands
of t
ons)
Th
ousa
nds
Air Emissions from Minnesota Power Plants
Nox SO2 GHGs
21Minnesota Pollution Control Agency
Environmental justice/equity
In 2007 MPCA began quarterly communications to inform individuals and organizations about ongoing MPCA activities aimed at ensuring environmental justice. This resulted in an agency-wide policy in April 2008 on environmental justice principles and practices, the creation of an MPCA environmental justice web page, and the implementation of the policy into MPCA programs. In 2012, MPCA adopted an Environmental Equity policy update to reaffirm MPCA’s commitment to environmental justice and equity principles.
Since 2011, MPCA:
• Increased its outreach efforts to economically-disadvantaged and minority communities
• Updated its agency-wide policy
• Created an environmental equity policy group of senior leadership to guide MPCA’s environmental equity efforts
• Committed to working with EPA to implement environmental equity principles through permitting and community outreach
The 2012 environmental equity policy restated MPCA’s commitment to ensure fair treatment and meaningful involvement of all people regardless of race, color, national origin, or income with respect to the development, implementation, and enforcement of environmental laws, regulations, and policies. The fair treatment principle means MPCA will seek to ensure that no group of people bears a disproportionate share of the negative environmental consequences resulting from industrial, governmental, and commercial operations or policies. The meaningful involvement principle means that MPCA will seek to provide that:
• People have an opportunity to participate in decisions about activities that may affect their environment and/or health
• The public’s contribution can influence the MPCA’s decisions
• People’s concerns will be considered in the decision-making process, and
• Decision makers seek out and facilitate the involvement of those potentially affected.
This commitment is based on EPA’s definition of environmental justice and is in line with EPA’s environmental roadmap titled “Plan EJ 2014”.
Fulfilling this commitment is not easy. Each community has a unique situation with complicated issues. Thus MPCA has begun working with individual communities to better understand current environmental, economic, and health conditions of priority areas and future plans. In updating air permits in South Minneapolis (see below), MPCA is putting more emphasis on identifying interested parties and seeking their input earlier and throughout the process of permit development. The lessons learned from these initiatives are being applied to other areas, such as in North Minneapolis.
Emerging issues
Cumulative risk
Cumulative risk assessment, an approach of looking holistically at multiple sources of environmental risk, is growing and evolving. The interest in cumulative risks is driven by scientific findings, public concern, expanded data availability, and practical experience. Communities are acutely aware that exposures are not limited to one pollutant, from one source, through one pathway at a time. Environmental health-related agencies must effectively integrate and respond to the increasing number of public comments, concerns, and requests raised due to this growing awareness.

22 Air Quality in Minnesota | 2013 Report
In particular, under a state law passed in 2008 (Minn. Stat. 116.07, subd. 4a), MPCA must analyze and consider “cumulative levels and effects” for any permit decision made in a specific area of South Minneapolis. While cumulative risk analysis tools are available and are sometimes used for permitting projects in areas where there are already a number of sources, the statute requires such analysis for every project in the defined area. Two permitting projects have occurred there since the legislation became law. MPCA continues to update the methodology used to implement this statutory requirement and inform cumulative risk analysis used in other settings, such as environmental review.
More MPCA efforts to improve air quality
Clean Air Dialogue
Environmental Initiative (EI) is a Minnesota-based nonprofit that builds partnerships to develop collaborative solutions to environmental problems. The MPCA is working with EI to engage in conversations with Minnesotans through an effort called the Clean Air Dialogue (Dialogue). The primary purpose of the Dialogue is to ensure Minnesota will continue to meet federal air quality standards as they are tightened in the coming years. Another key goal is reducing risks to human health from air pollution. The Dialogue hopes to meet these goals by developing cost-effective, multi-pollutant strategies supported by a broad base of Minnesota individuals, community groups, industry, and local and state units of government.
It has become clear that improving Minnesota’s air quality to this extent entails taking a hard look at the non-point, non-regulated sources that contribute significantly to many of the air-pollution problems we are experiencing today. Because many of these sources are small and widespread and relate to everyday activities of average Minnesotans, it is difficult to achieve reductions. The Dialogue will be an important part of developing solutions that can help.
The Clean Air Dialogue work group is the main stakeholder group that will ultimately prepare recommendations for improving air quality. The work group is supported by several technical sub-teams, further extending the opportunity for input to even more stakeholders. The groups have representation from state and local governments, industry sectors, and nonprofits.
Each technical work group is focused on a source sector or type of potential emission reduction strategy. The following work groups met throughout the fall of 2012 to study and develop strategies to reduce emissions from their respective sources.
• Area sources – Smaller sources of air pollution like consumer solvents and emissions from small businesses
• Energy efficiency/renewable energy – End-user energy efficiency programs and increased use of cleaner energy sources
• Mobile diesel – School buses, dump trucks, and other heavy-duty vehicles
• Point sources – Larger stationary sources of air pollution such as industrial sites or power plants, this group includes stationary diesel engines
• Transit demand management/light-duty vehicles – Strategies to reduce or redistribute single-occupancy commuter travel and reduce emissions from light-duty vehicles
• Wood smoke – Any residential wood burning
Recommendations from the technical working groups will be presented to the main work group,

23Minnesota Pollution Control Agency
who will decide which strategies to move forward. These strategies may range from suggested rules and regulations to voluntary initiatives and incentive programs. A final report with all the recommended strategies will be completed in mid 2013.
Ozone Advance/PM Advance
EPA offers the Ozone Advance program to support states that are working to ensure they remain in attainment with the new ozone standard. The Ozone Advance program requires that subscribing states establish a stakeholder process to identify actions to help the state meet air quality goals. Minnesota signed up for the program in 2012, and the Clean Air Dialogue work group serves as the stakeholder group. EPA has indicated it likely will offer a similar program for PM2.5 (EPA announced a revised PM2.5 standard on December 14, 2012). Program participants will receive EPA assistance in looking at strategies to improve air quality if they are needed to develop plans to meet federal ambient standards and may receive credit for implemented strategies.
Costs of meeting ambient standards
The Clean Air Dialogue work group will look at the costs of reducing emissions if parts of Minnesota do not meet the revised ozone or fine-particle ambient air standards. This effort is designed to update a 1999 study commissioned by the Minnesota Chamber of Commerce to estimate the economic impact of violating the ozone standard in the Twin Cities. That study focused on the costs of implementing emission controls on point sources, mobile sources, and area sources in order to comply with the federal ozone rules if Minnesota had violated the standard in the early 2000s. Using information from emissions reductions in Milwaukee, the study estimated the annual costs of the necessary emission reductions as between $189 and $266 million.14
Other MPCA partnerships and initiatives
Electric vehicles
Electric vehicles (EVs) have no tailpipe emissions and are the only alternative ”fuel” technology that can directly use clean, renewable energy. Depending on the source of the electricity used, electric vehicles can produce zero air emissions. MPCA initiated and provides leadership for the Drive Electric Minnesota partnership, a group of local governments, utilities, businesses and nonprofits promoting the use of EVs. The partnership has resulted in the installation of more than 50 plug-in charging stations in the Twin Cities and procurement of 25 EVs for public and private fleets. www.afdc.energy.gov/locator/stations/
MPCA’s Green Building Program
This program supports community efforts to advance sustainable building practices in Minnesota. These practices go beyond a building‘s footprint to include the building’s location, the upstream and downstream energy consumption of water supply and treatment, and the embodied energy of materials. www.pca.state.mn.us/yhiz6ef
Minnesota Green Corps
This is an AmeriCorps program receiving federal dollars for implementation. Green Corps places individuals with local governments, non-profits, universities and schools, where they spend a year working on focused environmental projects. Members serve in many areas of sustainability, including some that that have effects on air quality, for example energy conservation and mobile sources. www.pca.state.mn.us/clyp7a7

24 Air Quality in Minnesota | 2013 Report
Minnesota Green Step Cities
MPCA is one of seven partners in this two-year-old program that offers cities assistance and recognition to help achieve their sustainability and quality-of-life goals, and encourage civic innovation. This free voluntary program is based on best practices that can be implemented by completing one or more actions that are focused on cost savings and energy use. greenstep.pca.state.mn.us
Eco Experience & Living Green
The Eco Experience building at the Minnesota State fair draws over 250,000 visitors annually. Among a wide variety of environmental topics, MPCA and a number of partners provide the public with information about air quality and provide examples of how to reduce air pollution. Topics in the building’s 2012 air quality exhibit included fuel efficiency tips for vehicles, electric vehicles, wood smoke, and burn barrels. www.ecoexperience.org
Living Green 365 includes a monthly e-newsletter sent to 11,000+ subscribers and a Facebook page with 3,700 followers. Air quality topics are frequently covered, including air pollution from vehicles, transit options, and wood smoke. www.livinggreen.org
Monitoring the air
PAH monitoring in Minneapolis
MPCA, the Minnesota Department of Health, and the Mille Lacs Band of Ojibwe’s Department of Natural Resources and Environment received EPA funding to monitor levels of polycyclic aromatic hydrocarbons (PAHs) in the air in Minneapolis communities that may be disproportionately affected by air pollution. Minneapolis’s Phillips neighborhood was selected as the monitoring location.
PAHs, many of which are potentially carcinogenic to breathe and eat, are emitted to the air mainly from combustion sources, but are also emitted through volatilization of petroleum and petroleum products. Incomplete combustion, such as uncontrolled burning (wildfires, structure fires, backyard burning, etc.) and internal combustion engines (cars, trucks, lawn and garden equipment, recreational equipment, stationary engines, etc.), tend to produce greater amounts of PAHs than controlled combustion of homogeneous fuels (e.g., natural gas). The monitoring is planned to start in Spring 2013 and continue for two years. Monitored concentrations of PAHs will be compared to health values to estimate risks from exposure.
North Minneapolis air quality response project
Air dispersion modeling conducted for Northern Metals Recycling and nearby sources in August 2012 indicated a potential modeled exceedance of the federal standard for PM2.5 in and around the Mississippi River corridor in North Minneapolis. The modeling identified that Northern Metals itself is a very small contributor to the modeled exceedance, and that another local facility may be a larger contributor.
The MPCA is working with the North Minneapolis community to place a PM2.5 monitor in the industrial area which will be used to verify modeling results and assess compliance with the federal fine-particle standards. Additionally, the MPCA’s Air Quality Permits Section has begun working with facilities in the area to ensure that the MPCA has accurate emissions information to better understand the area’s air quality. The MPCA will work with these facilities to determine what reductions or best management practices can be implemented to reduce their impact on the air quality of North Minneapolis.

25Minnesota Pollution Control Agency
Near-road monitoring: NO2
In 2010, EPA finalized a new one-hour standard for NO2. All monitored areas of Minnesota currently meet the new NO2 standard. Studies have indicated that the highest pollution levels are likely near heavily trafficked roadways, so there is a special concern for NO2 levels near these roadways. To better understand air pollution from heavily trafficked roadways, the MPCA will deploy a new monitoring station in the I-94/I-35W commons in Minneapolis that will begin operating January 1, 2013, and will monitor for NO2 and other air pollutants.
ConclusionAlthough Minnesota’s air quality has continued to improve through implementation of the Clean Air Act, research shows serious public health effects at lower levels of pollution. In response, EPA recently adopted or proposed stricter standards for NO2, SO2, lead, and particulate matter. EPA announced a revised PM2.5 standard in December 2012, and expects to propose a revised standard for ozone in 2013. Both are expected to be stricter than the current standards.
The good news is that, in the long run, more stringent standards will result in cleaner air and better health for Minnesotans. Unfortunately, implementation of these new standards will also create challenges in the near term for the state and the Minnesota business community. The new standards, along with new reporting and permitting regulations for greenhouse gases, and the need to reduce the risks posed by air toxics, will present a unique challenge for MPCA in coming years. The MPCA will need to work with partners to find ways to reduce air emissions from sources not traditionally regulated by the MPCA in order to reduce health risks and meet federal standards. The MPCA plans to use its resources strategically to target combustion sources that will reduce multiple pollutants simultaneously. This will be achieved by leveraging community outreach and voluntary programs and partnerships, as well as through traditional regulatory methods.

26 Air Quality in Minnesota | 2013 Report
Appendix A: Mercury emissions associated with electricity production and consumption in Minnesota, 2008-2010
Introduction
In accordance with Minnesota Statute §116.925, this appendix reports mercury emissions associated with electricity production. Although not required by the statute, electricity consumption in Minnesota is also reported. In 2007, the Minnesota Pollution Control Agency (MPCA) established an emissions reduction goal and is now implementing stakeholder recommendations to meet the goal. The electric utility sector has made changes to reduce mercury and is on track to meet the interim mercury emission reduction goals in 2018. More information about Minnesota’s mercury emissions and reduction strategies can be found at www.pca.state.mn.us/air/mercury.html.
Mercury emissions from electricity generation
Minnesota Statute §116.925 requires producers and retailers of electricity to report the amount of mercury emitted through the generation of electricity. This law also requires MPCA to summarize this information in its biennial air toxics report to the Legislature. Emissions from 2008, 2009 and 2010 are summarized in the following pages.
Minnesota law exempts certain electric-generation facilities from reporting mercury emissions: (1) those that operate less than 240 hours per year, (2) combustion units that generate fewer than 150 British thermal units (Btu) per hour, (3) generation units with a maximum output of 15 megawatts or less, and (4) combustion facilities that emit less than three pounds of mercury in a given year. Therefore, generation facilities that do not emit any mercury, such as nuclear, wind and hydroelectric, are not reported here.
Although not required to annually report to MPCA, this table includes some combustion facilities that emit less than three pounds per year because of excellent pollution control or because they use low mercury fuel, such as natural gas. In addition, because of variation in operating conditions, some facilities may emit more than three pounds one year and less than three pounds in another. When emissions are less than three pounds, the actual emissions are either given or listed as exempt, depending on the wishes of the facility’s management.
Submissions are from 62 generation units in Minnesota. The major fuel for most units was coal, although some facilities depend on municipal solid waste, oil or natural gas for fuel.
For 2008, facilities in Minnesota reported the emission of 1,256 pounds of mercury in the production of 38,672,526 MWh of electricity. For 2009, reported emissions decreased to 1,102 pounds of mercury in the production of 32,168,308 MWh. In 2010 mercury emissions decreased again to 963 lbs for 32,312,585 MWh of electricity generated.

27Minnesota Pollution Control Agency
Company Generating FacilityMajor Fuel
Type(s) 2010 Electricity
Produced (MWh)
2010 Mercury Emissions
(lb)
2009 Electricity Produced
(MWh)
2009 Mercury
Emissions (lb)
2008 Electric-ity Produced
(MWh)
2008 Mercury
Emissions (lb)
Austin NE Power Plant Unit 1 coal, gas 0 0.18 - 2.25 - 2.25
Covanta Hennepin Energy Resource Co
Unit 1c MSWa 121,456 4.32 106,141 6.21 128,325 4.20
Covanta Hennepin Energy Resource Co
Unit 2c MSWa 121,375 7.09 112,631 3.47 123,589 2.95
Fairbault Energy Park FEP 13100071 oil, gas 259,024 0.00 174,378 0.042 282,614 0.03
Fairbault Energy Park MRS-01900059 oil, gas 458 0.00 577 0.000 744 0.00
Great River Energy Arrowhead Station oil 214 0.00 122 0 25 0.00
Great River Energy Cambridge Stationc,d oil 29,911 0.00 38,138 0 67,711 0.00
Great River Energy Elk River Stationc oil, gas, MSWa 131,502 13.50 157,446 6.7 193,973 7.50
Great River Energy Lakefield Station c,d oil, gas 115,853 0.00 55,196 0 115,853 0.00
Great River Energy Maple Lake Stationc,d oil 191 0.00 300 0 201 0.00
Great River Energy Pleasant Valley Stationc,d oil, gas 121,202 0.00 60,113 0 65,999 0.00
Great River Energy Rock Lake Stationc,d oil 202 0.00 268 0 156 0.00
Great River Energy St. Bonifacius Stationc oil 1,847 0.00 3,751 0 1,394 0.00
Hibbing Public Utilities Unit 1Ah,c coal,oil totaled in sum totaled in sum
45,320 3.753 2.55
Hibbing Public Utilities Unit 2Ah,c coal,oil totaled in sum totaled in sum
47,369 3.923 2.56
Hibbing Public Utilities Unit 7Ah,c wood N/A N/A - 0
Hibbing Public Utilities Unit 4A wood, oil totaled in sum totaled in sum
87,394 3.28 2.40
Hibbing Public Utilities Unit 3Ah coal,oil totaled in sum totaled in sum
47,657 3.95 3.61
Hibbing Public Utilities Total for all units wood, coal, oil 155,012 13.90 176,729
Interstate Power and Light Company, Sherburn, MN
Fox lake Power Station #3f oil, gas 21,396 0.00 13,140 0 20,434
Marshall Municipal Utilities GE Turbine oil 203 0.00 158 0.000 210 1.48
Minnesota Power(Taconite Harbor Energy Center)
Taconite Harbor Energy Center Unit 1
coal, oil 429,839 30.65 373,063 16.26 446,374 19.28
Minnesota Power(Taconite Harbor Energy Center)
Taconite Harbor Energy Center Unit 2
coal, oil 392,816 14.98 320,900 6.3 503,128 1.69
Minnesota Power(Taconite Harbor Energy Center)
Taconite Harbor Energy Center Unit 3
coal, oil 419,165 18.18 364,300 14.57 519,132 21.23
Minnesota Power Boswell Unit 1 coal, oil 440,157 4.71 373,830 3.81 507,696 5.30
Minnesota Power Boswell Unit 2 coal, oil 471,726 4.38 436,727 4.38 475,539 4.82
Minnesota Power Boswell unit 3 coal, oil 2,518,442 7.62 1,563,601
62.94 5,602,570 121.41
Minnesota Power Boswell Unit 4e coal, oil 2,903,360 149.37 3,777,495
155.1 3,482,829 151.02
Minnesota Power Hibbard 3-4 coal, gas 163,944 15.93 40,704 1.134 61,635 4.84
Minnesota Power Laskin Unit 1 & 2 coal, oil 516,366 16.53 510,505 16.71 659,429 20.40
Minnesota Power (Rapids Energy Center)
Rapids Energy Center 5-6c coal, wood 126,794 1.70 122,779 0.81 106,171 2.66
Northshore Mining Co. Silver Bay Power Plant PB 1c coal, oil, gas 320,057 22.92 320,057 16.57
Northshore Mining Co. Silver Bay Power Plant PB 2c coal, gas 518,171 16.89 518,171 16.75
Xcel Energy AS King 1 coal, gas, pe-troleum coke
3,796,850 50.50 3,759,090
50 3,456,590 45.20
Xcel Energy Black Dog 3 coal, gas 411,610 23.00 569,980 33 475,300 27.70
Xcel Energy Black Dog 4 coal, gas 901,790 47.30 30 45.8 1,102,600 61.80
Xcel Energy Black Dog 5c,d gas N/A N/A 475,430 0 347,427 0.00

28 Air Quality in Minnesota | 2013 Report
Xcel Energy Blue Lake 1-3c oil, gas 803 0.00 1,143 0 952 0.00
Xcel Energy Blue Lake 4 oil 251 0.00 377 0 -
Xcel Energy Blue Lake 7-8c,d gas 122,252 0.00 17,705 0 20,388 0.00
Xcel Energy Granite City 1-4c,d oil, gas 795 0.00 351 0 144 0.00
Xcel Energy High Bridge 5 coal, gas N/A N/A - 0.00
Xcel Energy High Bridge 6 coal, gas N/A N/A - 0.00
Xcel Energy High Bridge 7-8 coal, gas N/A N/A N/A N/A 422,329 0.00
Xcel Energy High Bridge 13-16 natural gas 916,690 0.00 735,798 0 -
Xcel Energy Inver Hills 1-6c oil, gas 49,384 0.00 14,193 0 25,371 0.00
Xcel Energy Key City 4-7 gas 517 0.00 56 0 4 0.00
Xcel Energy Minnesota Valley 4c,d coal, oil, gas - 0.00 - 0 - 0.00
Xcel Energy Red Wing 1 Waste-to-Energy
gas, RDFb 55,346 1.50 55,448 1.3 56,050 2.20
Xcel Energy Red Wing 2 Waste-to-Energy
gas, RDFb 55,762 2.80 58,925 1.8 60,649 3.40
Xcel Energy Riverside 6/7 coal, oil, gas N/A N/A N/A N/A 508,663 23.30
Xcel Energy Riverside 15-16 natural gas 637,347 0.00 313,094 0 -
Xcel Energy Riverside 8 coal, oil, coke N/A N/A N/A N/A 1,184,492 48.90
Xcel Energy Sherburne 1 coal, oil 4,833,300 199.00 5,055,150
221.9 5,086,790 221.70
Xcel Energy Sherburne 2 coal, oil 4,031,600 166.40 4,922,090
219.3 4,867,970 213.40
Xcel Energy / Southern Minnesota Municpal Power
Sherburne 3 coal, oil 5,286,392 90.60 6,110,042
182.9 5,410,592 155.80
Xcel Energy Wilmarth 1 Waste-to-Energyc
RDFb, gas 55,416 2.10 53,443 2 64,641 3.20
Xcel Energy Wilmarth 2 Waste-to-Energyc
RDFb, gas 47,479 1.20 54,794 1.4 46,344 1.20
Otter Tail Power Hoot Lake #2 & 3 coal, oil 398,123 16.98 599,138 18.99 396,253 15.74
Rochester Public Utilities Silver Lake 1 coal, gas 256 0.01 561 0.007 2,918 0.08
Rochester Public Utilities Silver Lake 2 coal, gas 328 0.40 7,657 0.593 23,239 0.40
Rochester Public Utilities Silver Lake 3 coal, gas 17,858 0.70 2,618 0.115 52,379 1.88
Rochester Public Utilities Silver Lake 4 coal, gas 12,053 0.00 41,488 0.047 135,545 1.58
Rochester Public Utilities Cascade Creek Station 1 oil, gas 12 0.00 771 0.001 101 0.00
Rochester Public Utilities Cascade Creek Station 2-3 oil, gas 567 0.00 11,430 0 25,744 0.00
Sappi-Cloquet Power Boiler 7h oil, gas, wood N/A 0.67 N/A 0.900 N/A 0.98
Sappi-Cloquet Power Boiler 8h gas N/A 0.00 N/A 0.000 N/A 0.00
Sappi-Cloquet Power Boiler 9h oil, gas, wood N/A 1.67 N/A 2.647 N/A 2.91
Sappi-Cloquet Power Boiler 10h gas N/A 2.05 N/A 0.973 N/A 0.99
Southern Minnesota Mu-nicipal Power Agency
Faribault Energy Park oil, gas 139,670 0.00 251,168 0
Southern Minnesota Mu-nicipal Power Agency
Minnesota River Station Combustion Turbined
oil, gas 996 0.00 - 0 -
Verso Paper- Sartell BBC Turbine/Boiler coal, oil, wood, sludge
86,103 0.06 75,935 0.159 76,645 5.44
Virginia Public Utilities Commission
Virginia Public Utilities coal, gas, wood
114,970 10.41 110,242
Willmar Municipal Utilities Boiler 3 coal, natural gas 37,344 2.34 36,066 2.625 441,644 3.00
Willmar Municipal Utilities Boiler 2 natural gas 37 0.00 92 0.000 75 0.00
Totals 32,312,585 963 32,168,308 1,102 38,672,526 1,256
Company Generating FacilityMajor Fuel
Type(s) 2010 Electricity
Produced (MWh)
2010 Mercury Emissions
(lb)
2009 Electricity Produced
(MWh)
2009 Mercury
Emissions (lb)
2008 Electric-ity Produced
(MWh)
2008 Mercury
Emissions (lb)

29Minnesota Pollution Control Agency
Appendix B: PM2.5 design value concentrations relative to CASAC lower boundariesThe Clean Air Scientific Advisory Committee (CASAC) is charged with providing independent scientific advice to EPA on setting the National Ambient Air Quality Standards. CASAC often recommends a range for the standard. The following charts show where ambient air concentrations in Minnesota stand compared to the most stringent PM2.5 standards recommended by CASAC in 2006.
While CASAC recommended a level 30 µg/m3 in 2006, the committee also stated the following in a September 29, 2006, letter to the EPA Administrator: “We are pleased with the Agency’s decision in the final PM NAAQS rule to decrease the daily primary PM2.5 standard to a level consistent with the CASAC’s recommendation (35 µg/m3), as this decrease will provide additional health protection in some cities.” The CASAC was critical of EPA in 2006 because EPA chose not to revise the annual PM2.5 standard.
In December 2012, EPA announced that it would maintain the 24-hour PM2.5 standard at 35 µg/m3 and reduce the annual standard to 12 µg/m3. CASAC continues to support EPA’s approach, stating in a 2010 letter to EPA that “CASAC concludes that the levels under consideration are supported by the epidemiological and toxicological evidence, as well as by the risk and air quality information compiled in the Integrated Science Assessment (December 2009), Quantitative Health Risk Assessment for Particular Matter (June 2010) and summarized in the Second Draft Policy Assessment.”
0
5
10
15
20
25
30
35
PM2.
5 C
once
ntra
tion
(μg/
m3)
Daily PM2.5 Design Value concentrations vs CASAC recommended lower daily boundary (30 μg/m3)
2009-2011 Lowest CASAC Recommendation
0
2
4
6
8
10
12
PM2.
5 C
once
ntra
tion
(μg/
m3)
2009-2011 Lowest CASAC Recommendation
Daily PM2.5 Design Value concentrations vs CASAC recommended lower daily boundary (30 µg/m3)
Annual PM2.5 Design Value concentrations vs CASAC recommended lower annual boundary (11 µg/m3)
Company Generating FacilityMajor Fuel
Type(s) 2010 Electricity
Produced (MWh)
2010 Mercury Emissions
(lb)
2009 Electricity Produced
(MWh)
2009 Mercury
Emissions (lb)
2008 Electric-ity Produced
(MWh)
2008 Mercury
Emissions (lb)

30 Air Quality in Minnesota | 2013 Report
ENDNOTES1. In 2006 dollars
2. There are many levels of uncertainty in quantifying both changes in health impacts and their economic values. At this stage these benefits estimates should only be used to get a very rough sense of the order of magnitude of benefits from air quality improvements.
3. MPCA is required by statute to estimate and report the total amount of air pollution emitted in the state during the most recent calendar year for which data are available, including percent increases and decreases over the previous period. In April 2012, MPCA submitted the most recent data (2005) in the Annual Pollution Report to the Legislature, which can be found at: www.pca.state.mn.us/index.php/view-document.html?gid=17613. The next Pollution Report will be published in 2014. 2008 emissions can be found in The Great Lakes Commission’s Centralized Air Emis-sions Repository On-Line, carol.glin.net/
4. Lead concentrations measured near Gopher Resources, a battery recycler in Eagan, exceeded the revised 2008 lead standard. Monitoring data show that mitigation efforts have lowered the concentra-tions and the area is expected to be in compliance following the 2013 monitoring year.
5. Desert Research Institute study conducted for MPCA
6. Policy Assessment for the Review of the Ozone National Ambient Air Quality Standards. First External Review Draft, released August 16, 2012. www.epa.gov/ttn/naaqs/standards/ozone/data/20120816pa.pdf
7. From Minnesota’s 2008 emissions inventory. Percentages indicate the approximate amount of total emissions of pollutant of concern emitted by primary source categories in Minnesota; for simplicity, sources contributing less than 10% are not listed. Emissions from wildfires, agricultural and prescribed burning are not included and can be significant, depending on the year.
8. Sources shown here emit PM2.5 directly; a large amount of PM2.5 in Minnesota’s air is formed indirectly in the atmosphere from reaction of gases.
9. PM2.5 is also of concern because levels in Minnesota are near federal air quality standards and particles can impact visibility in pristine areas.
10. Ozone levels in Minnesota are near levels proposed for future federal air quality standards.
11. Point source dioxin/furan emissions are primarily from aluminum smelting and copper foundry furnaces.
12. Health Effects Institute, New HEI report on Exposure to Traffic Finds Evidence of Health Effects in Children Near Major Roads, and continuing Data Gaps, Jan 13, 2010 (pubs.healtheffects.org/getfile.php?u=551)
13. US EPA Analysis of Particulate Matter Emissions from Light-Duty Gasoline Vehicles in Kansas City, April 2008
14. In 1999 dollars (www.environmental-initiative.org/images/files/MNChamber-ozone.pdf )


Minnesota Pollution Control Agency www.pca.state.mn.us lraq-1sy3