Air Pressure NATS 101-06 Lecture 11 Air Pressure.
49
NATS 101-06 Lecture 11 Air Pressure Air Pressure
-
date post
19-Dec-2015 -
Category
Documents
-
view
216 -
download
1
Transcript of Air Pressure NATS 101-06 Lecture 11 Air Pressure.
NATS 101-06Lecture 11
Air PressureAir Pressure
Review
• ELR-Environmental Lapse RateTemp change w/height measured by a thermometer hanging from a balloonDAR and MAR are Temp change w/height for an air parcel (i.e. the air inside balloon)
• Why Do Supercooled Water Droplets Exist?Freezing needs embryo ice crystalFirst one, in pure water, is difficult to make
Review
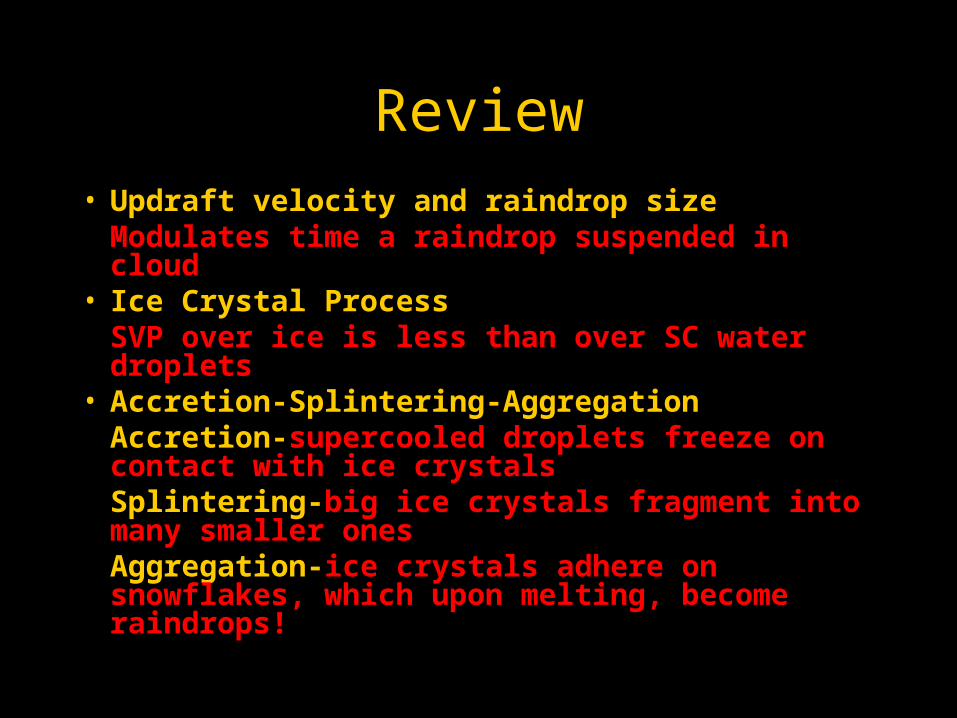
• Updraft velocity and raindrop sizeModulates time a raindrop suspended in cloud
• Ice Crystal ProcessSVP over ice is less than over SC water droplets
• Accretion-Splintering-AggregationAccretion-supercooled droplets freeze on contact with ice crystalsSplintering-big ice crystals fragment into many smaller onesAggregation-ice crystals adhere on snowflakes, which upon melting, become raindrops!
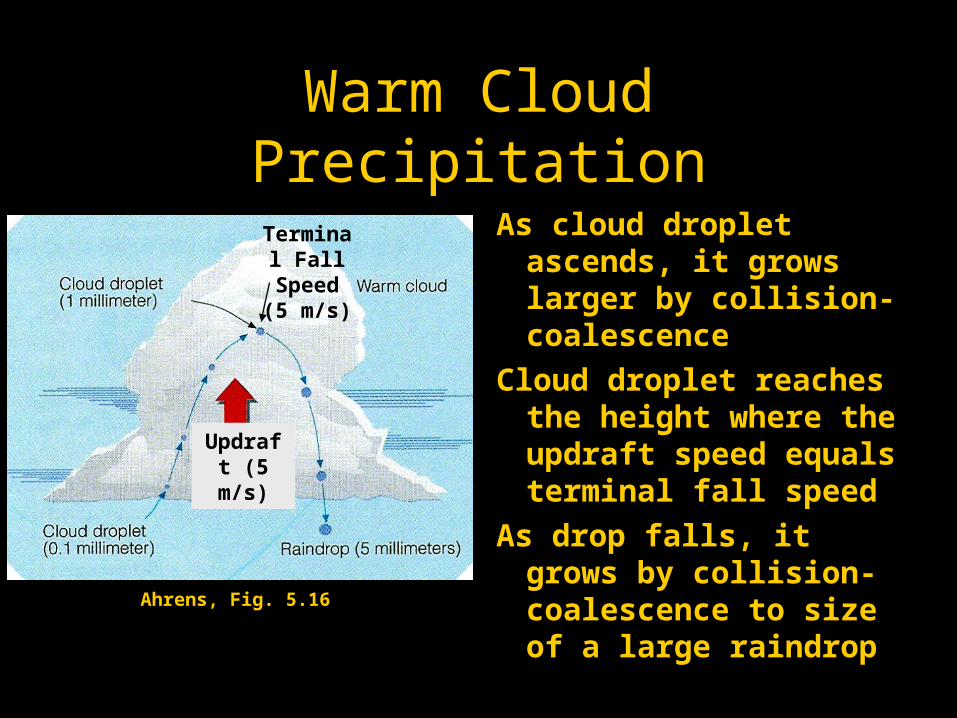
Warm Cloud Precipitation
As cloud droplet ascends, it grows larger by collision-coalescence
Cloud droplet reaches the height where the updraft speed equals terminal fall speed
As drop falls, it grows by collision-coalescence to size of a large raindrop
Ahrens, Fig. 5.16
Updraft (5 m/s)
Terminal Fall Speed
(5 m/s)
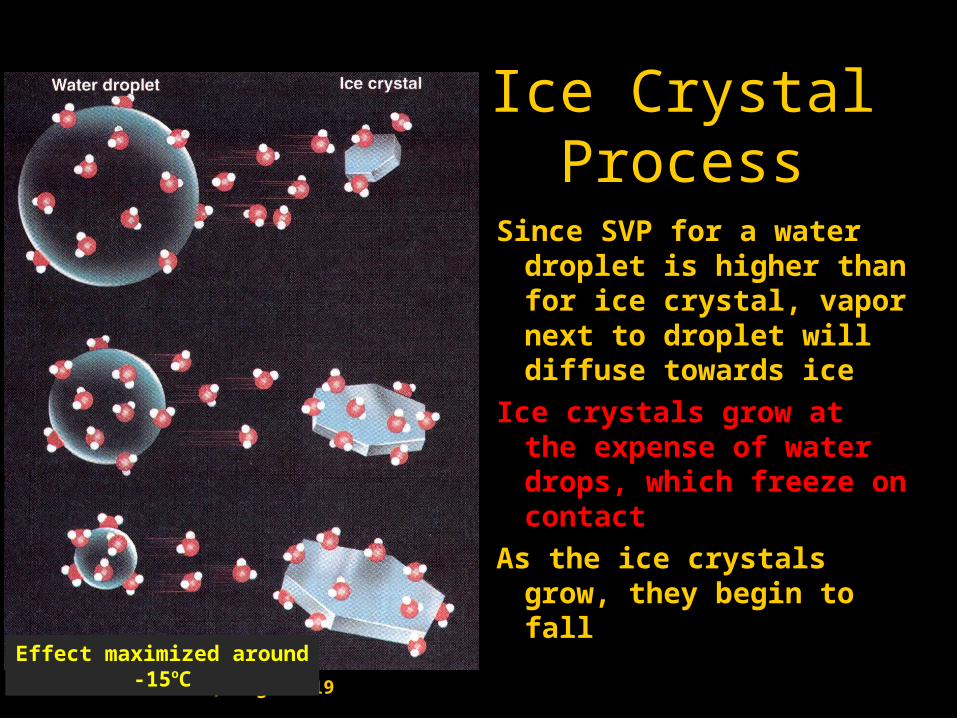
Ice Crystal Process
Since SVP for a water droplet is higher than for ice crystal, vapor next to droplet will diffuse towards ice
Ice crystals grow at the expense of water drops, which freeze on contact
As the ice crystals grow, they begin to fall
Ahrens, Fig. 5.19
Effect maximized around -15oC
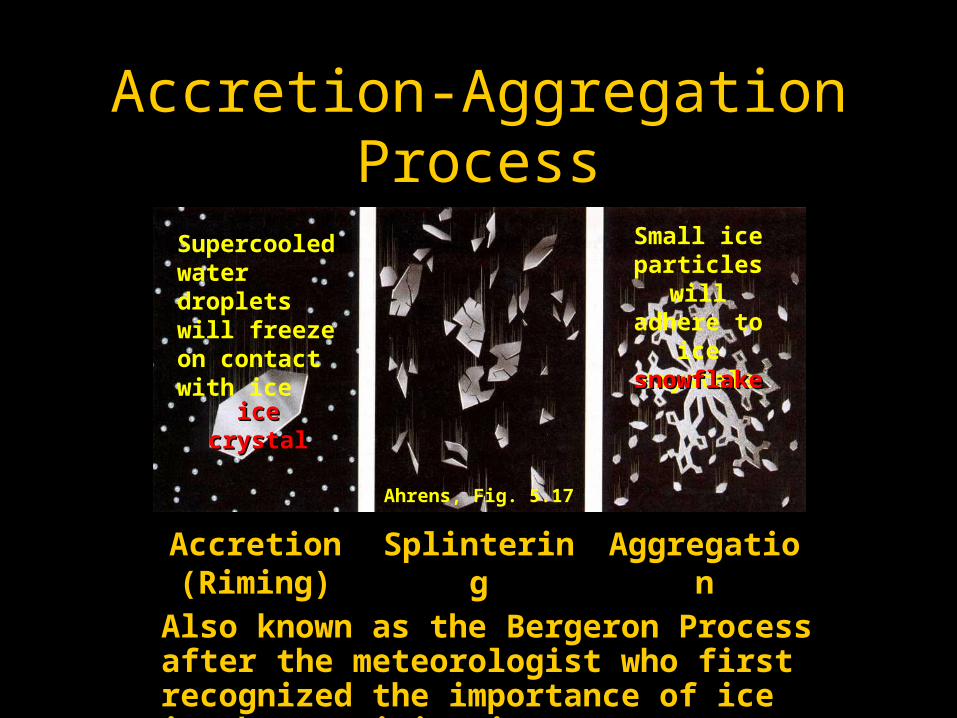
Accretion-Aggregation Process
Accretion (Riming)
Aggregation
Supercooled water droplets will freeze on contact with ice
ice crystalice crystal
Small ice particles will adhere to ice
crystals
snowflakesnowflake
Splintering
Ahrens, Fig. 5.17
Also known as the Bergeron Process after the meteorologist who first recognized the importance of ice in the precipitation process
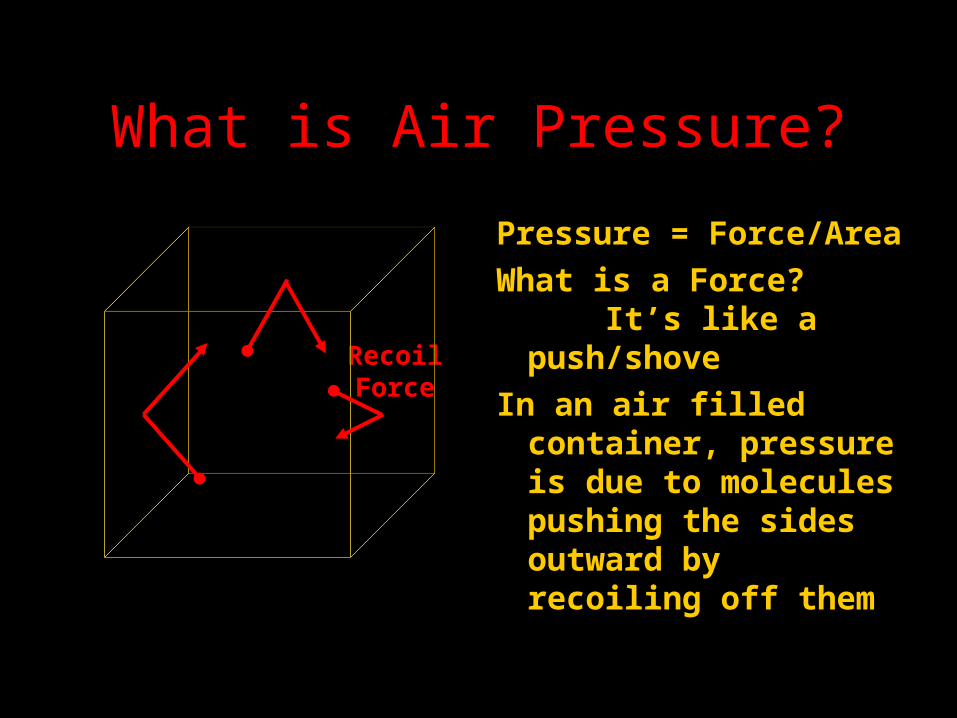
Recoil Force
What is Air Pressure?
Pressure = Force/Area
What is a Force? It’s like a push/shove
In an air filled container, pressure is due to molecules pushing the sides outward by recoiling off them
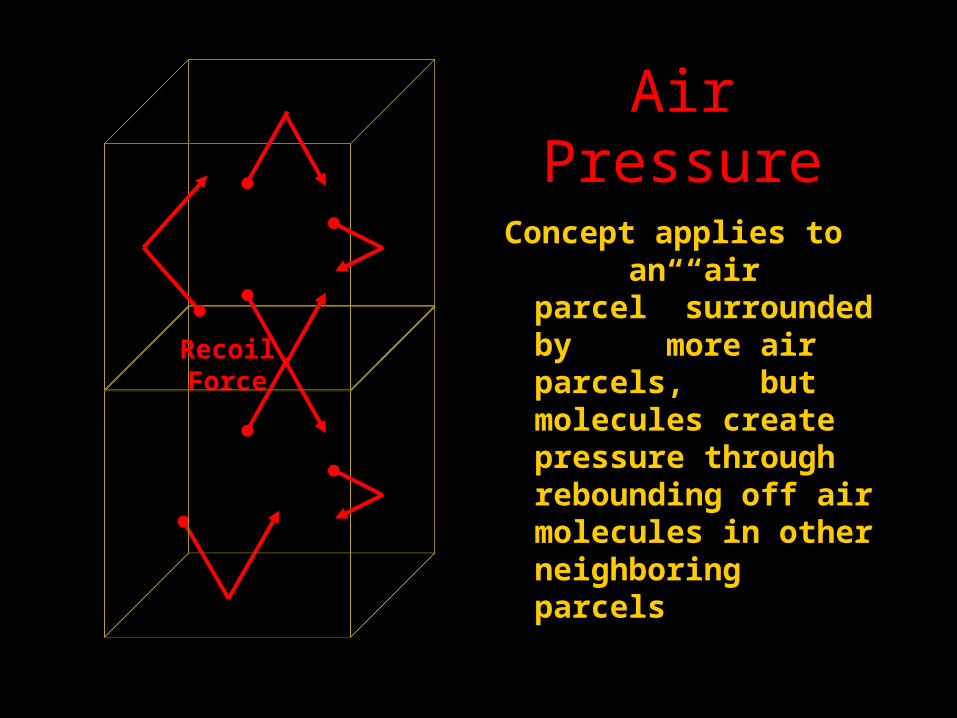
Air Pressure
Concept applies to an “air parcel” surrounded by more air parcels, but molecules create pressure through rebounding off air molecules in other neighboring parcels
Recoil Force
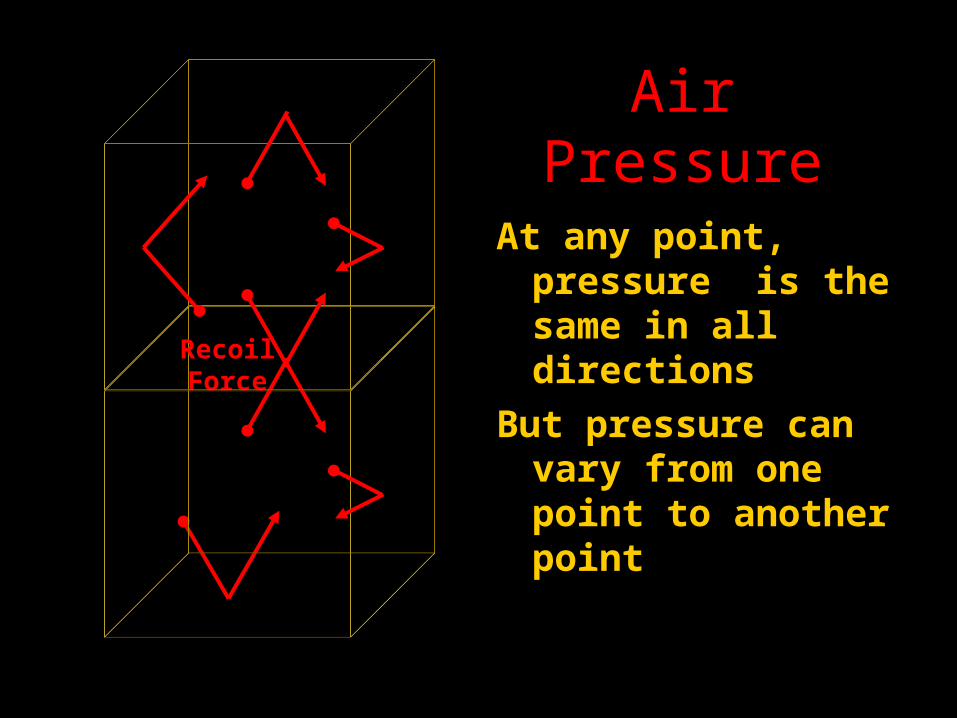
Air Pressure
At any point, pressure is the same in all directions
But pressure can vary from one point to another point
Recoil Force
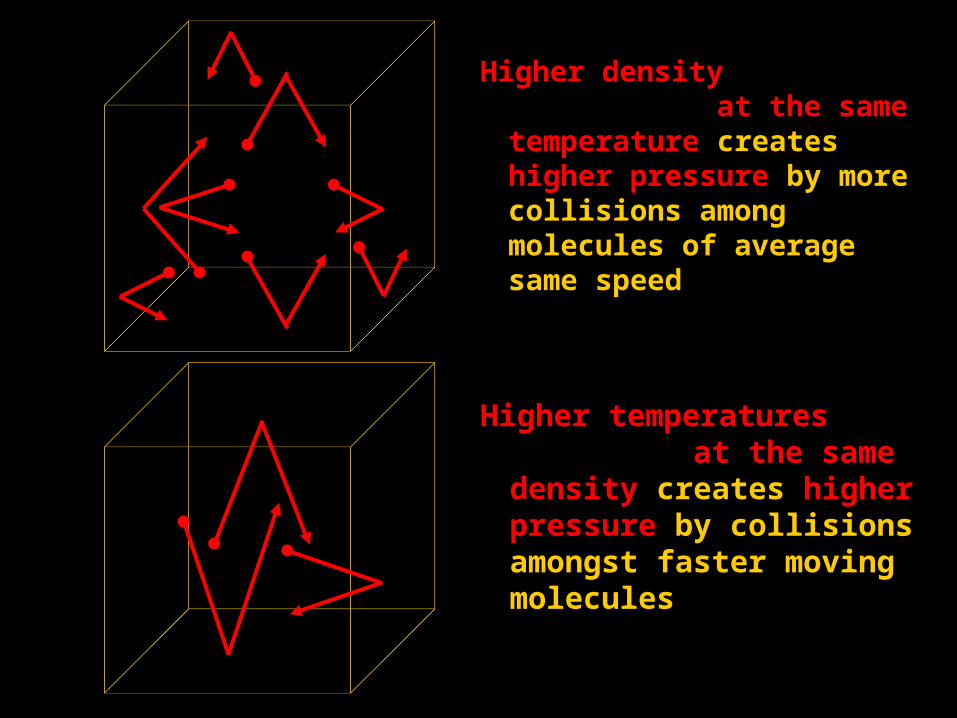
Higher density at the same temperature creates higher pressure by more collisions among molecules of average same speed
Higher temperatures at the same density creates higher pressure by collisions amongst faster moving molecules
Ideal Gas Law
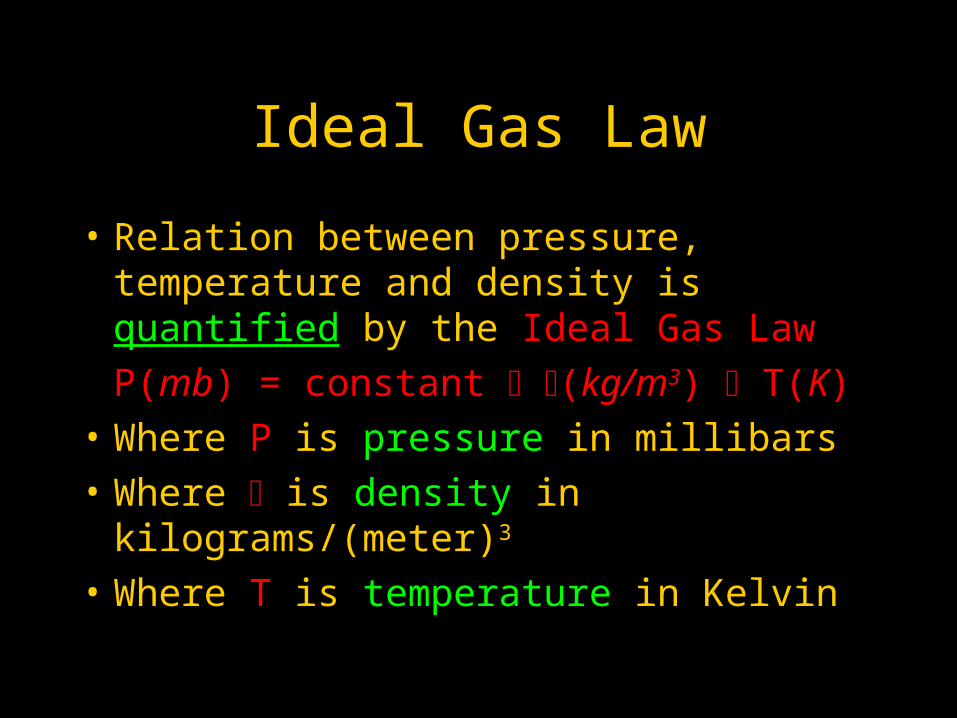
• Relation between pressure, temperature and density is quantified by the Ideal Gas Law
P(mb) = constant (kg/m3) T(K)
• Where P is pressure in millibars
• Where is density in kilograms/(meter)3
• Where T is temperature in Kelvin
Ideal Gas Law
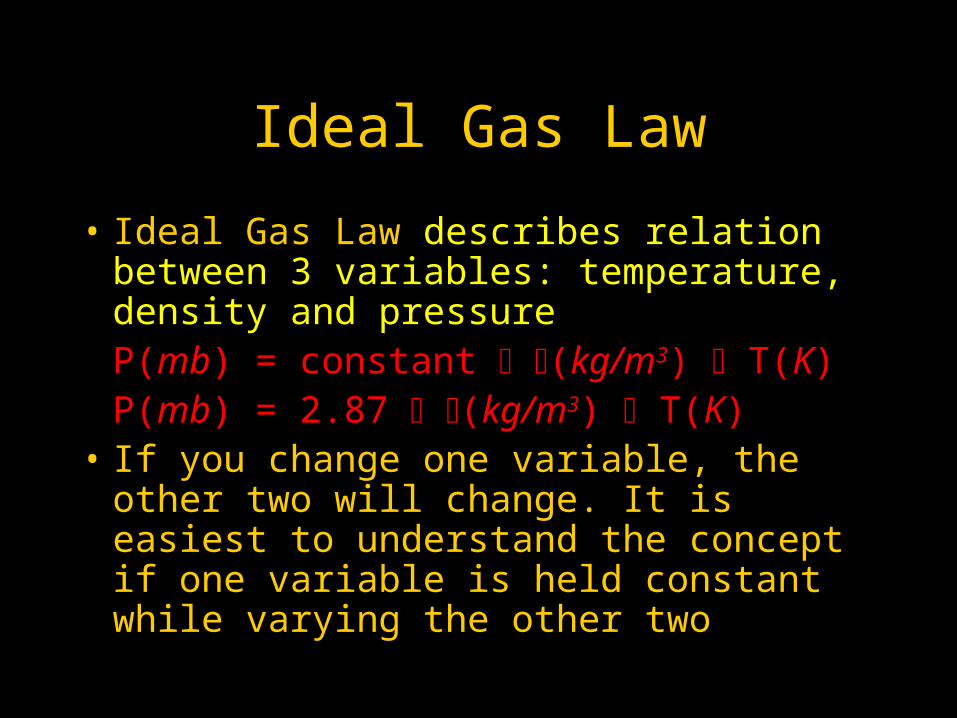
• Ideal Gas Law describes relation between 3 variables: temperature, density and pressureP(mb) = constant (kg/m3) T(K)P(mb) = 2.87 (kg/m3) T(K)
• If you change one variable, the other two will change. It is easiest to understand the concept if one variable is held constant while varying the other two
Ideal Gas Law
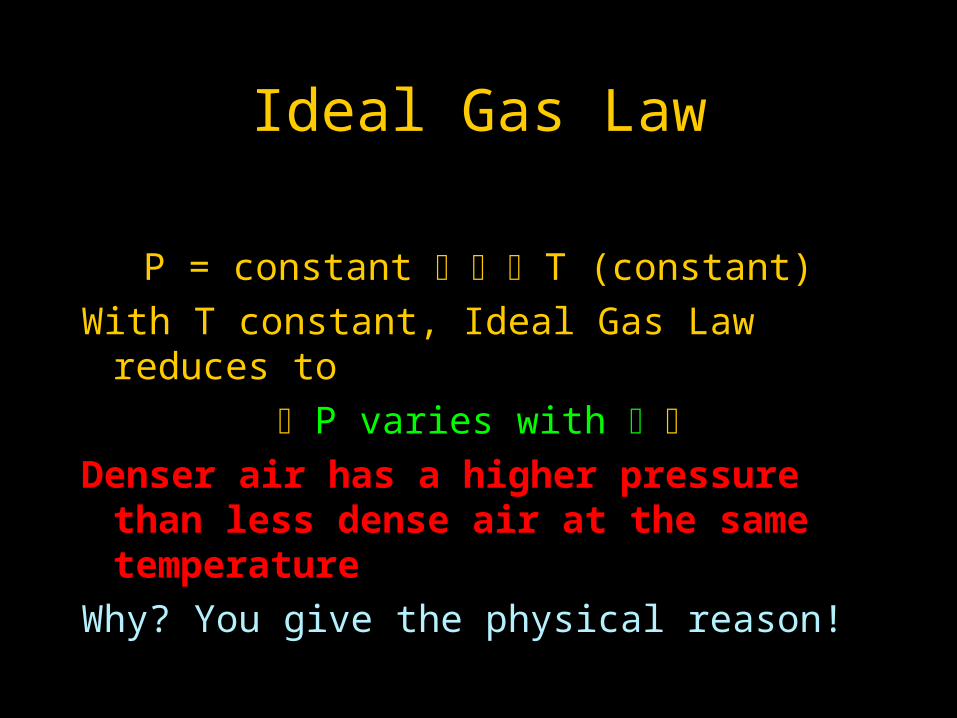
P = constant T (constant)
With T constant, Ideal Gas Law reduces to
P varies with Denser air has a higher pressure than less
dense air at the same temperature
Why? You give the physical reason!
Ideal Gas Law
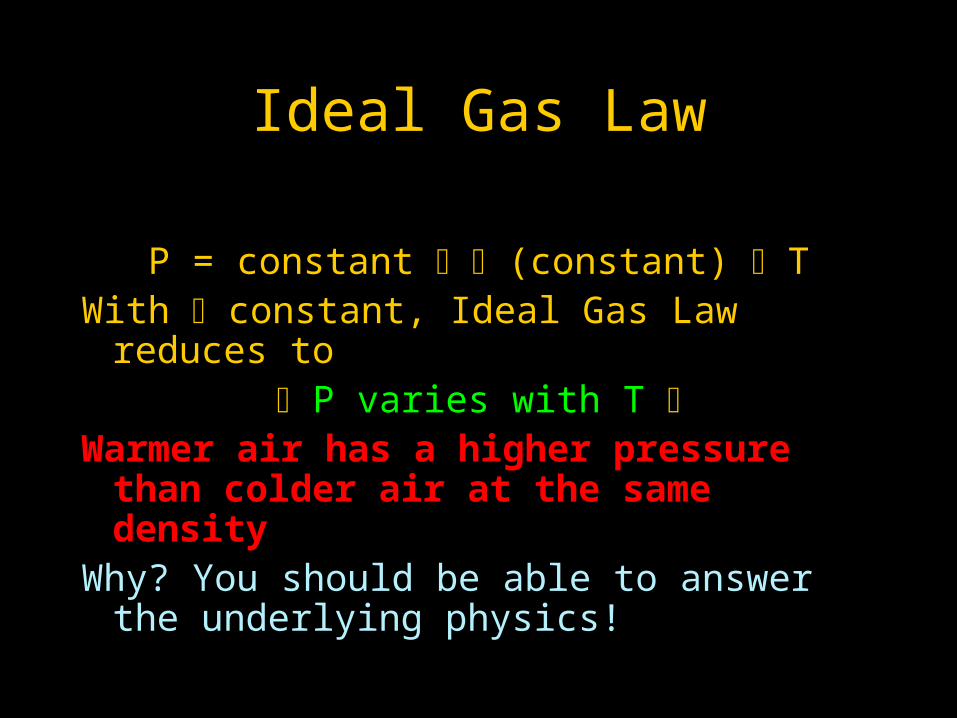
P = constant (constant) TWith constant, Ideal Gas Law reduces to
P varies with T Warmer air has a higher pressure than
colder air at the same densityWhy? You should be able to answer the
underlying physics!
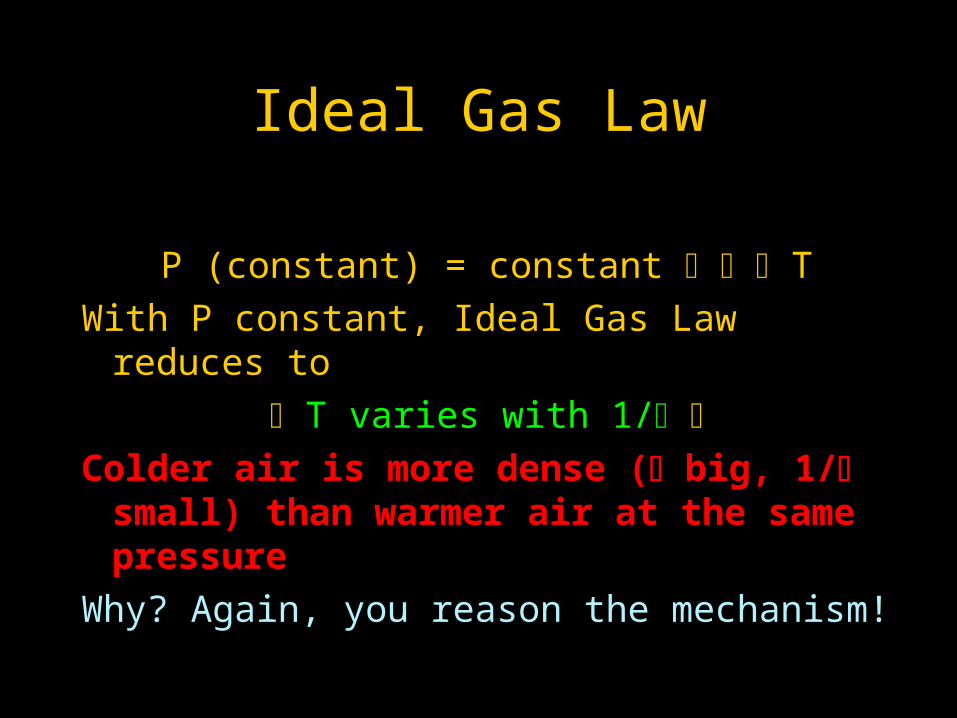
Ideal Gas Law
P (constant) = constant TWith P constant, Ideal Gas Law reduces to
T varies with 1/ Colder air is more dense ( big, 1/ small)
than warmer air at the same pressure
Why? Again, you reason the mechanism!
Summary
• Ideal Gas Law Relates
Temperature-Density-Pressure
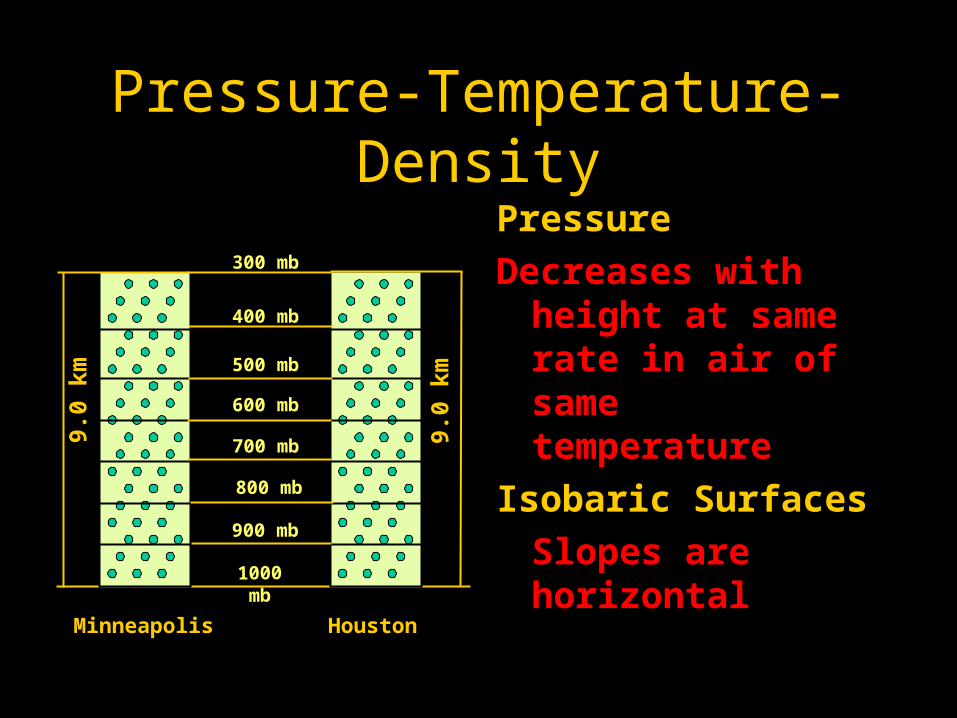
Pressure-Temperature-Density
9.0
km
300 mb
1000 mb
400 mb
500 mb
600 mb
700 mb
800 mb
900 mb
Minneapolis Houston
9.0
km
Pressure
Decreases with height at same rate in air of same temperature
Isobaric Surfaces
Slopes are horizontal
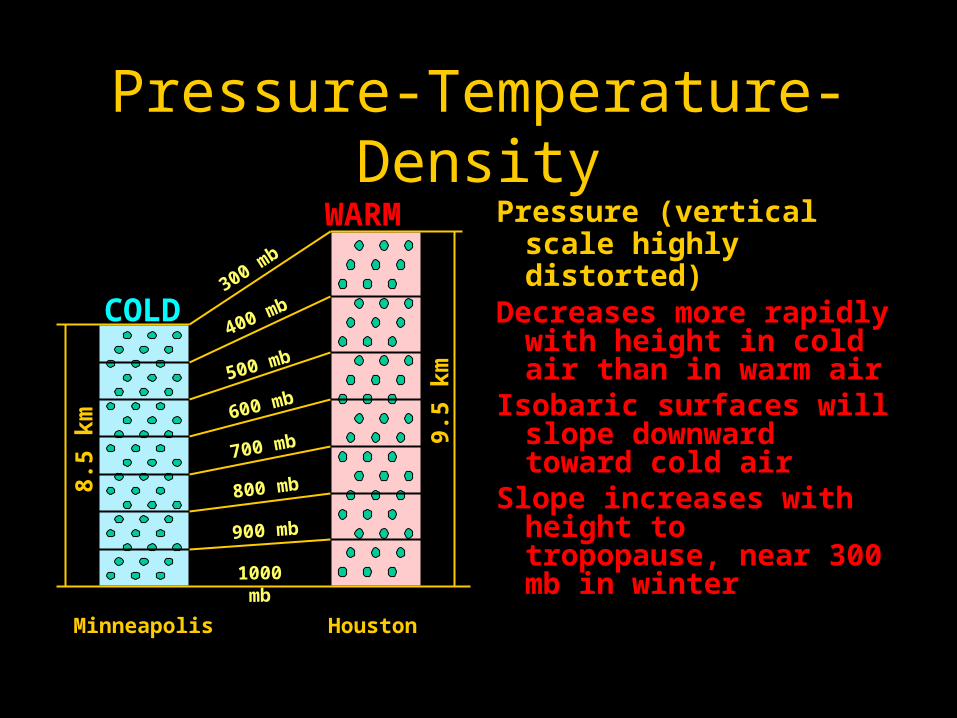
Pressure-Temperature-Density
Pressure (vertical scale highly distorted)
Decreases more rapidly with height in cold air than in warm air
Isobaric surfaces will slope downward toward cold air
Slope increases with height to tropopause, near 300 mb in winter
8.5
km 9.5
km
300 mb
1000 mb
400 mb
500 mb
600 mb
700 mb
800 mb
900 mb
Minneapolis Houston
COLD
WARM
Pressure-Temperature-Density8.
5 km 9.
5 km
300 mb
1000 mb
400 mb
500 mb
600 mb
700 mb
800 mb
900 mb
Minneapolis Houston
HHLL
LLHH
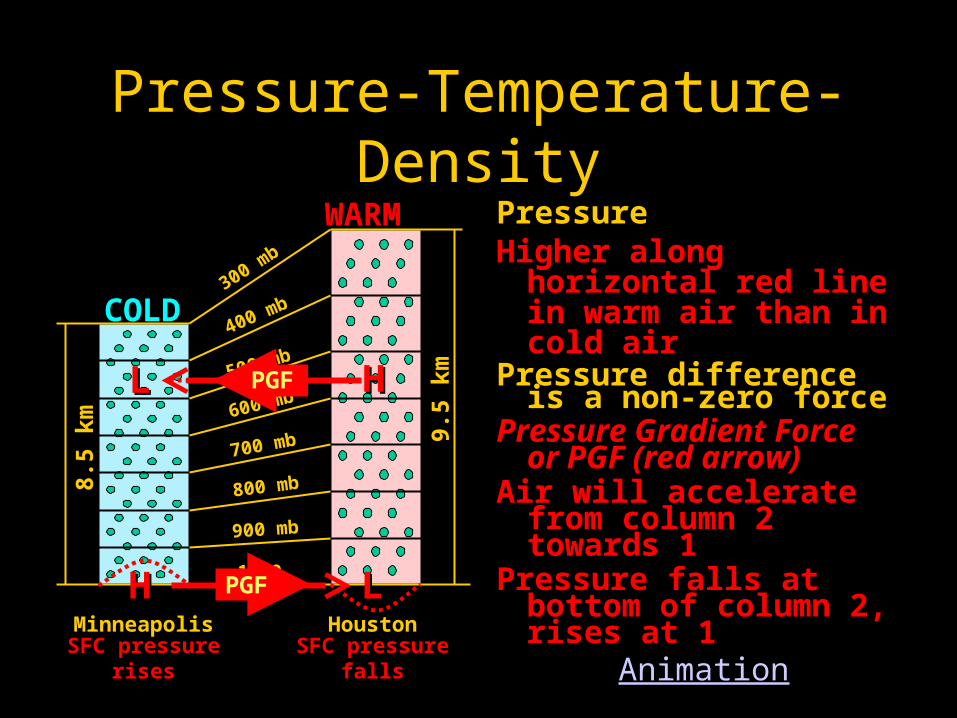
PressureHigher along horizontal
red line in warm air than in cold air
Pressure difference is a non-zero force
Pressure Gradient Force Pressure Gradient Force or PGF (red arrow)or PGF (red arrow)
Air will accelerate from column 2 towards 1
Pressure falls at bottom of column 2, rises at 1
AnimationSFC pressure rises SFC pressure falls
PGF
PGF
COLD
WARM
Summary
• Ideal Gas Law Implies
Pressure decreases more rapidly with height in cold air than in warm air.
• Consequently…..
Horizontal temperature differences lead to horizontal pressure differences!
And horizontal pressure differences lead to air motion…or the wind!
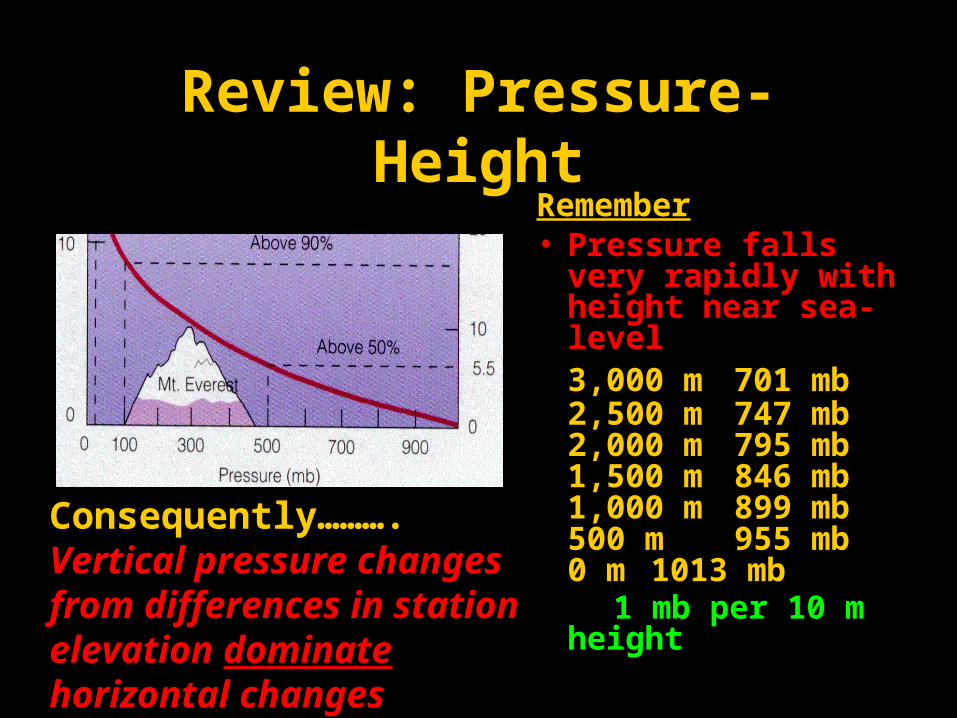
Review: Pressure-HeightRemember• Pressure falls very
rapidly with height near sea-level 3,000 m 701 mb2,500 m 747 mb2,000 m 795 mb1,500 m 846 mb1,000 m 899 mb500 m 955 mb0 m 1013 mb
1 mb per 10 m height
Consequently………. Vertical pressure changes from differences in station elevation dominate horizontal changes
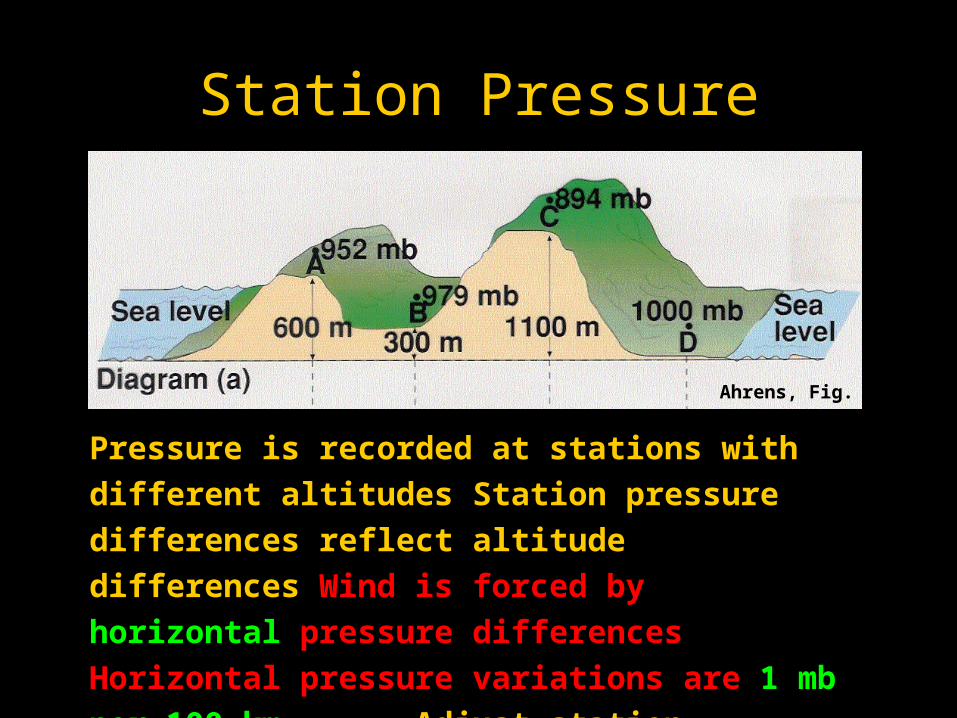
Station Pressure
Pressure is recorded at stations with different altitudes
Station pressure differences reflect altitude differences
Wind is forced by horizontal pressure differences
Horizontal pressure variations are 1 mb per 100 km
Adjust station pressures to one standard level:Mean Sea Level
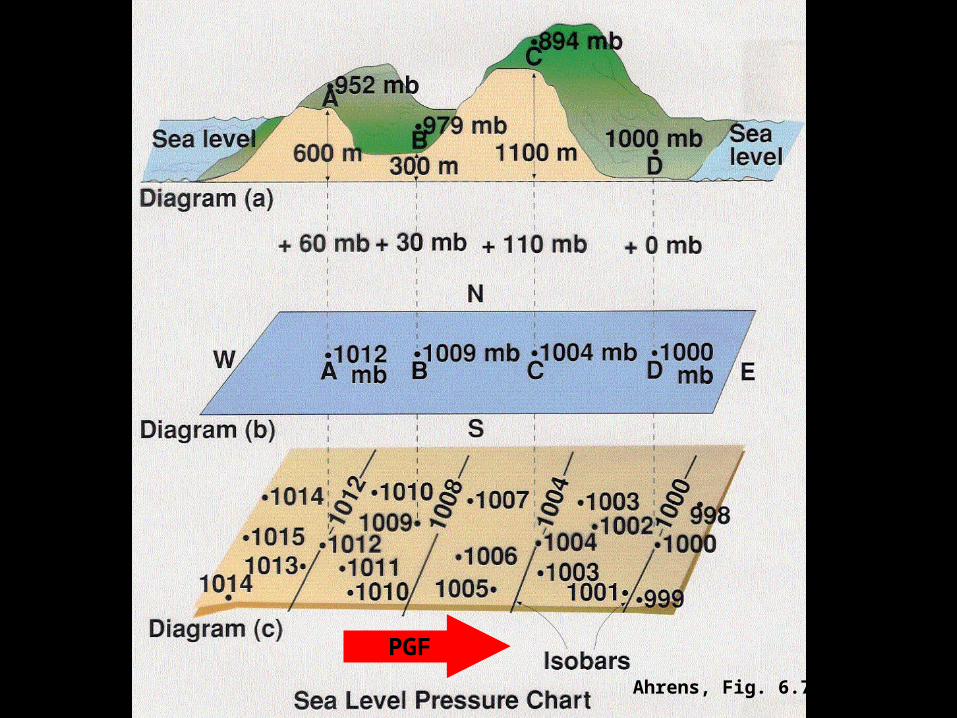
Ahrens, Fig. 6.7
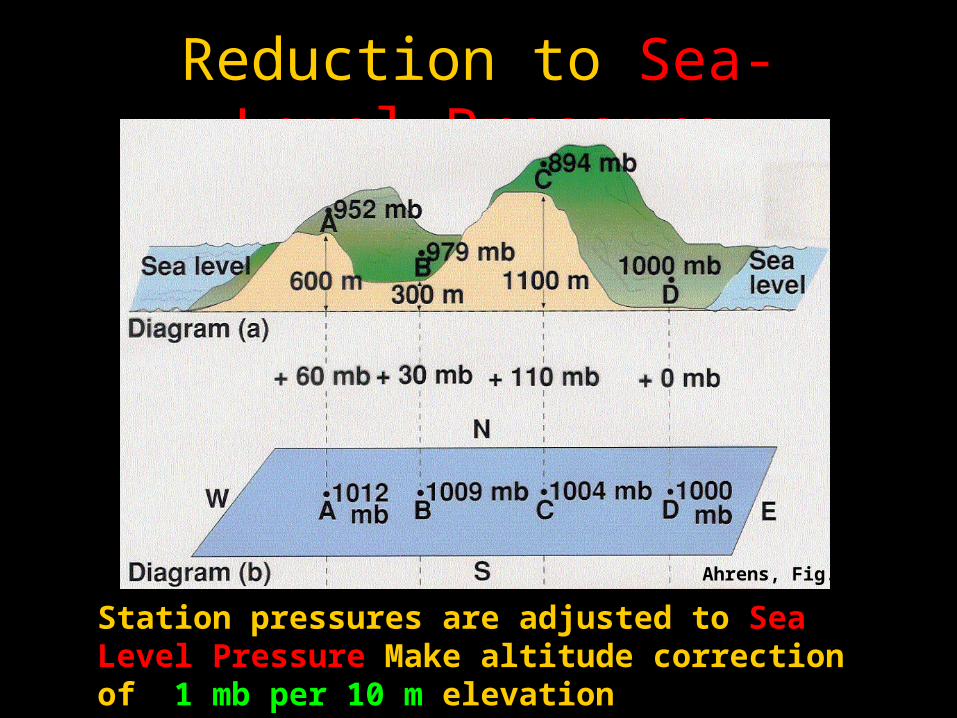
Reduction to Sea-Level-Pressure
Station pressures are adjusted to Sea Level PressureSea Level Pressure Make altitude correction of 1 mb per 10 m elevation
Ahrens, Fig. 6.7
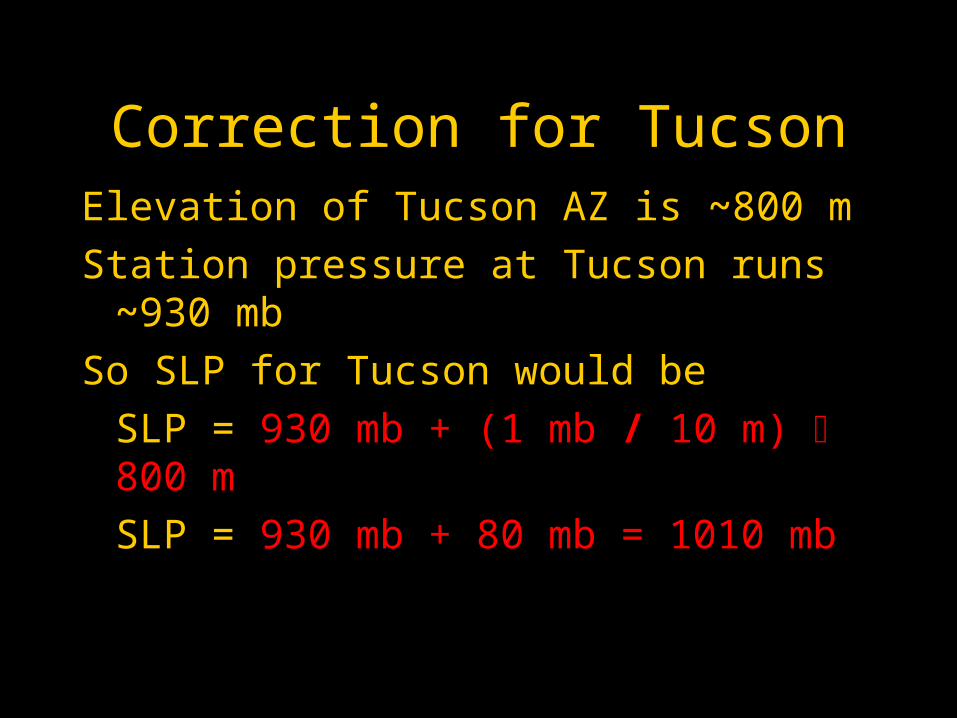
Correction for TucsonElevation of Tucson AZ is ~800 m
Station pressure at Tucson runs ~930 mb
So SLP for Tucson would be
SLP = 930 mb + (1 mb / 10 m) 800 m
SLP = 930 mb + 80 mb = 1010 mb
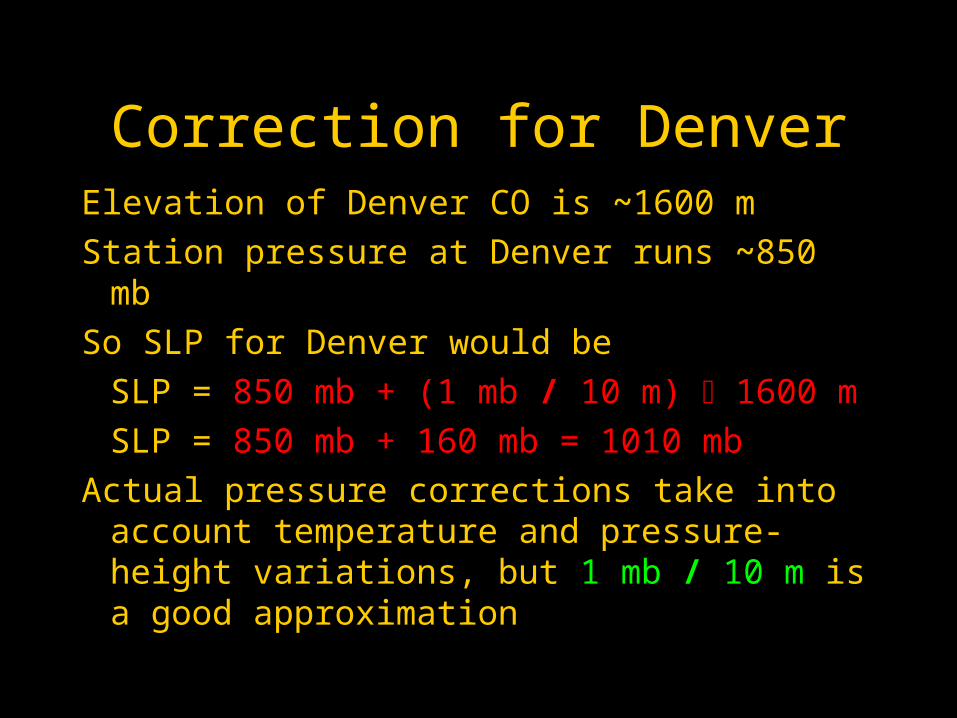
Correction for DenverElevation of Denver CO is ~1600 m
Station pressure at Denver runs ~850 mb
So SLP for Denver would be
SLP = 850 mb + (1 mb / 10 m) 1600 m
SLP = 850 mb + 160 mb = 1010 mb
Actual pressure corrections take into account temperature and pressure-height variations, but 1 mb / 10 m is a good approximation
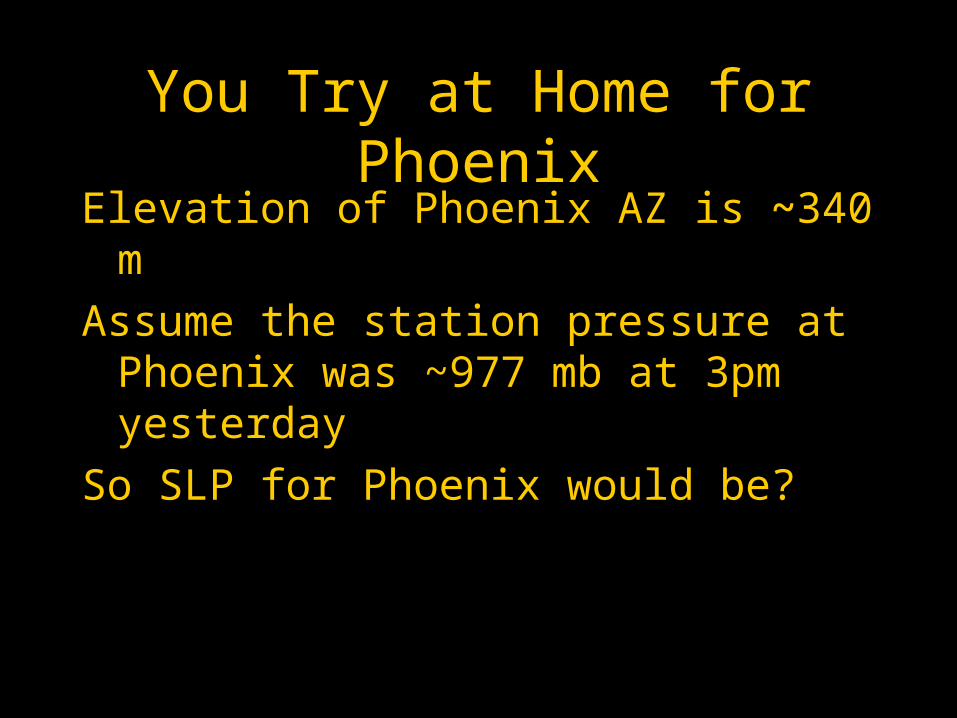
You Try at Home for PhoenixElevation of Phoenix AZ is ~340 m
Assume the station pressure at Phoenix was ~977 mb at 3pm yesterday
So SLP for Phoenix would be?
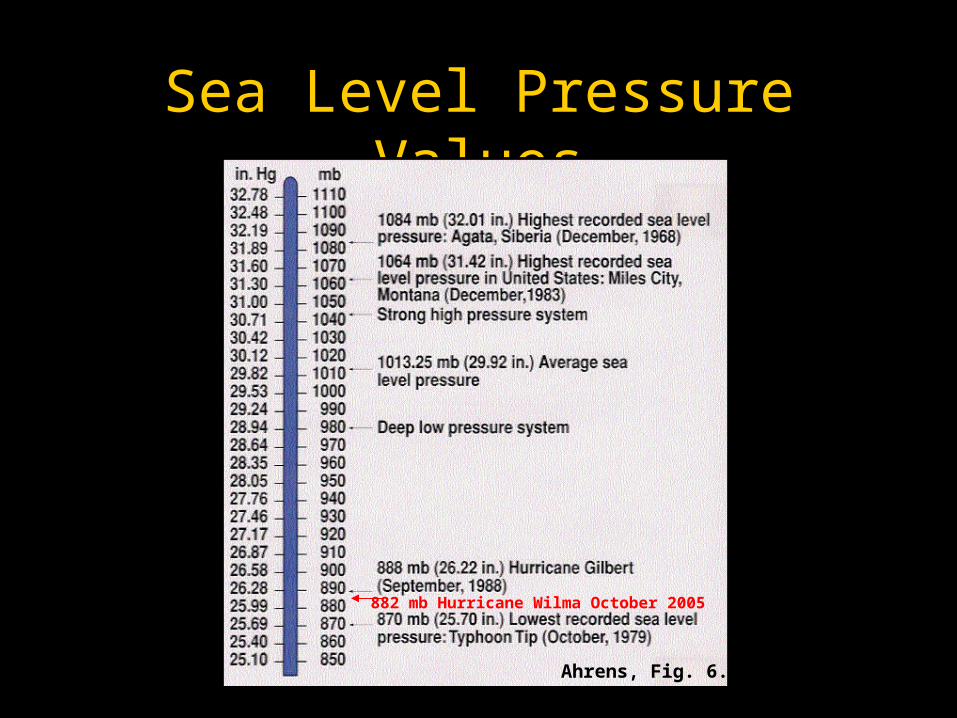
Sea Level Pressure Values
Ahrens, Fig. 6.3
882 mb Hurricane Wilma October 2005
Summary
• Because horizontal pressure differences are the force that drives the wind
Station pressures are adjusted to one standard level…Mean Sea Level…to remove the dominating impact of different elevations on pressure change
Ahrens, Fig. 6.7
PGF
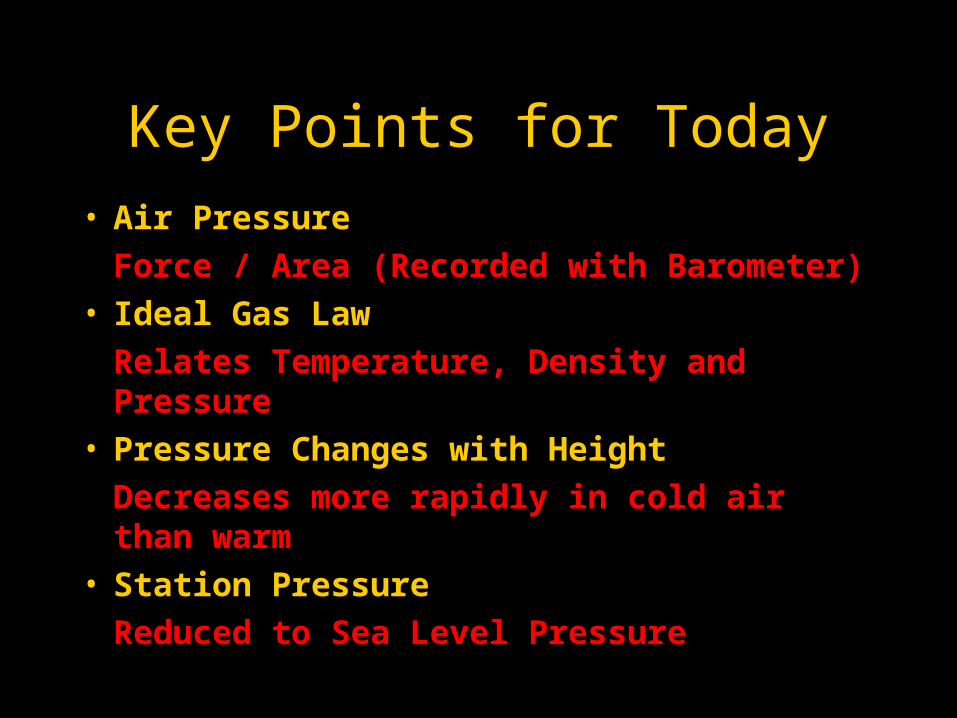
Key Points for Today
• Air Pressure
Force / Area (Recorded with Barometer)• Ideal Gas Law
Relates Temperature, Density and Pressure• Pressure Changes with Height
Decreases more rapidly in cold air than warm • Station Pressure
Reduced to Sea Level Pressure
Isobaric Maps
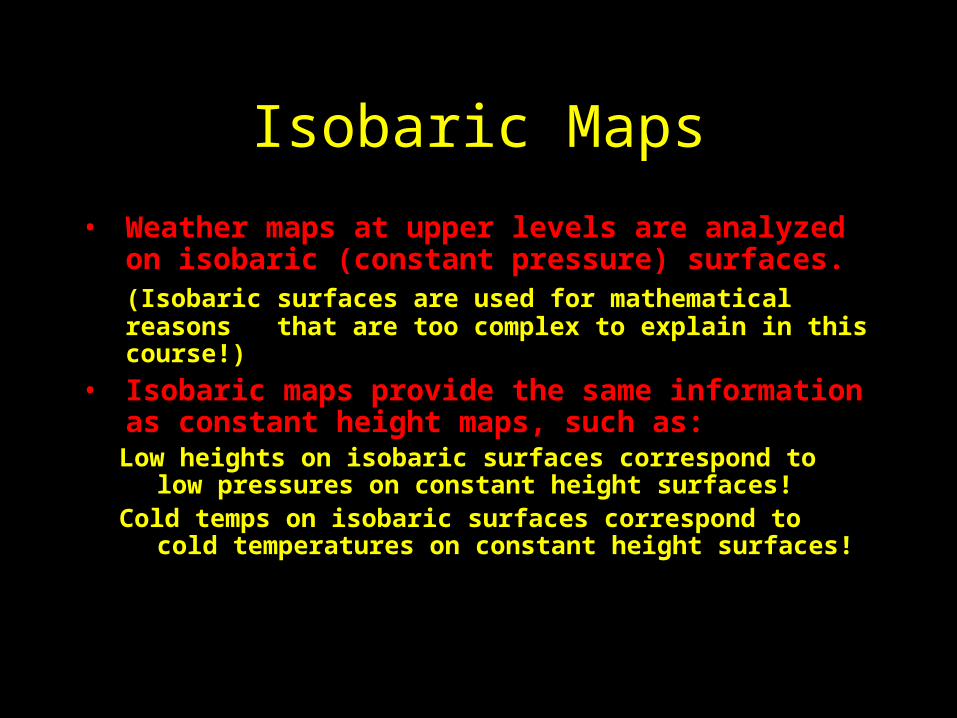
• Weather maps at upper levels are analyzed on isobaric (constant pressure) surfaces.(Isobaric surfaces are used for mathematical reasons
that are too complex to explain in this course!)
• Isobaric maps provide the same information as constant height maps, such as:
Low heights on isobaric surfaces correspond to low pressures on constant height surfaces!
Cold temps on isobaric surfaces correspond to cold temperatures on constant height surfaces!
Isobaric Maps
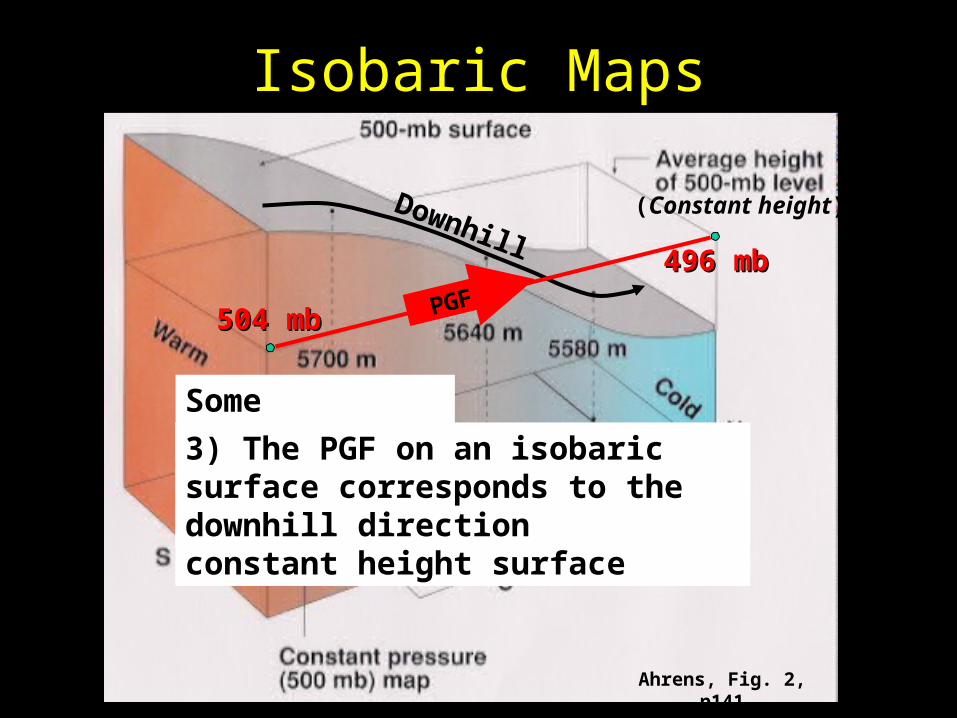
Ahrens, Fig. 2, p141
504 mb504 mb
496 mb496 mb
PGF
Downhill(Constant height)
Some generalities:
1) High/Low heights on an isobar surface correspond to High/Low pressures on a constant height surface
2) Warm/Cold temps on an isobaric surface correspond to Warm/Cold temps on a constant height surface
3) The PGF on an isobaric surface corresponds to the downhill direction
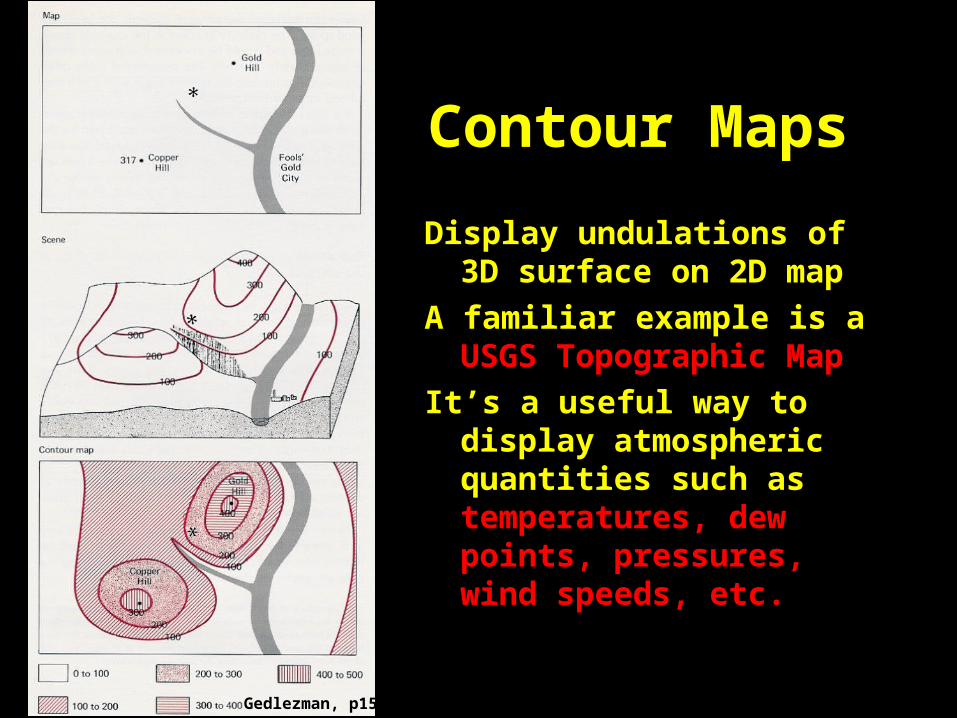
Contour Maps
Display undulations of 3D surface on 2D map
A familiar example is a USGS Topographic Map
It’s a useful way to display atmospheric quantities such as temperatures, dew points, pressures, wind speeds, etc.
Gedlezman, p15
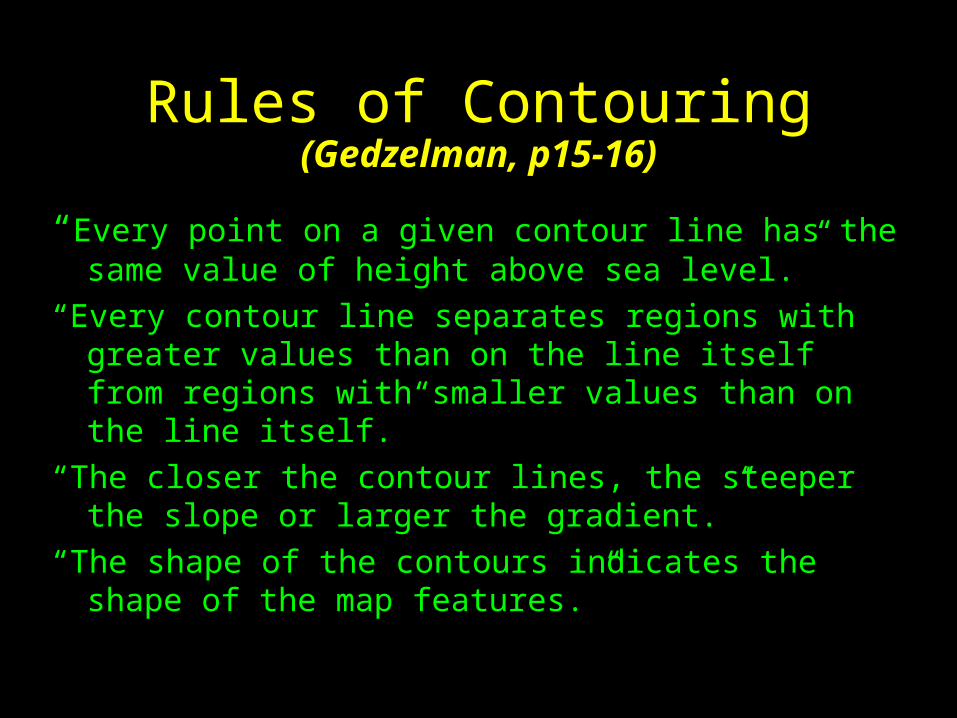
Rules of Contouring(Gedzelman, p15-16)
“Every point on a given contour line has the same value of height above sea level.”
“Every contour line separates regions with greater values than on the line itself from regions with smaller values than on the line itself.”
“The closer the contour lines, the steeper the slope or larger the gradient.”
“The shape of the contours indicates the shape of the map features.”
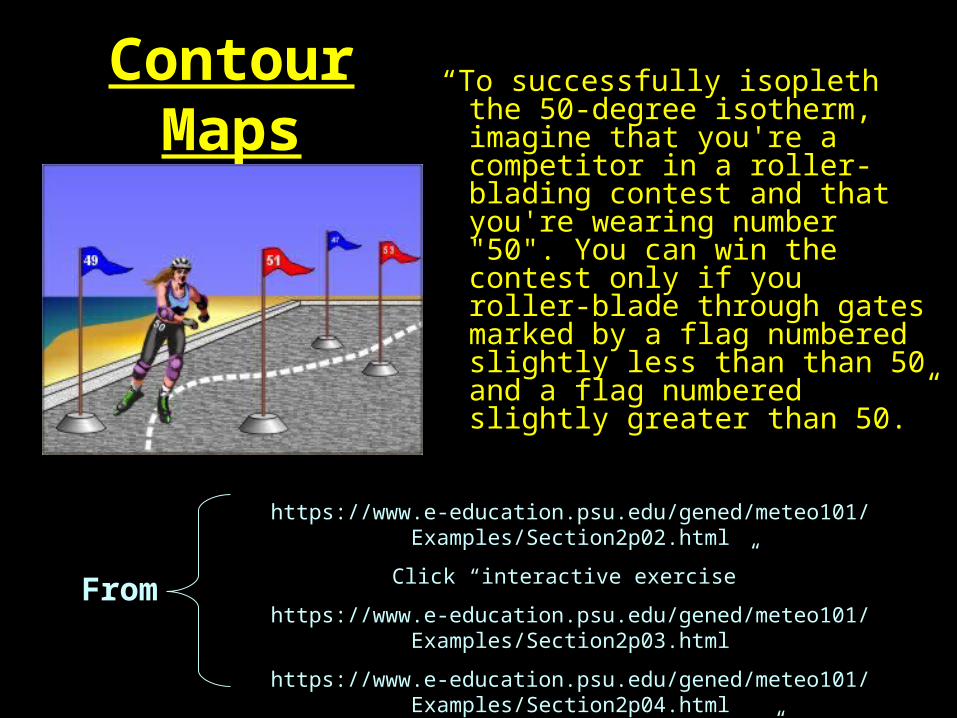
Contour Maps “To successfully isopleth the 50-degree isotherm, imagine that you're a competitor in a roller-blading contest and that you're wearing number "50". You can win the contest only if you roller-blade through gates marked by a flag numbered slightly less than than 50 and a flag numbered slightly greater than 50.”
https://www.e-education.psu.edu/gened/meteo101/Examples/Section2p02.html
Click “interactive exercise”
https://www.e-education.psu.edu/gened/meteo101/Examples/Section2p03.html
https://www.e-education.psu.edu/gened/meteo101/Examples/Section2p04.html
Click “interactive isotherm map”
From
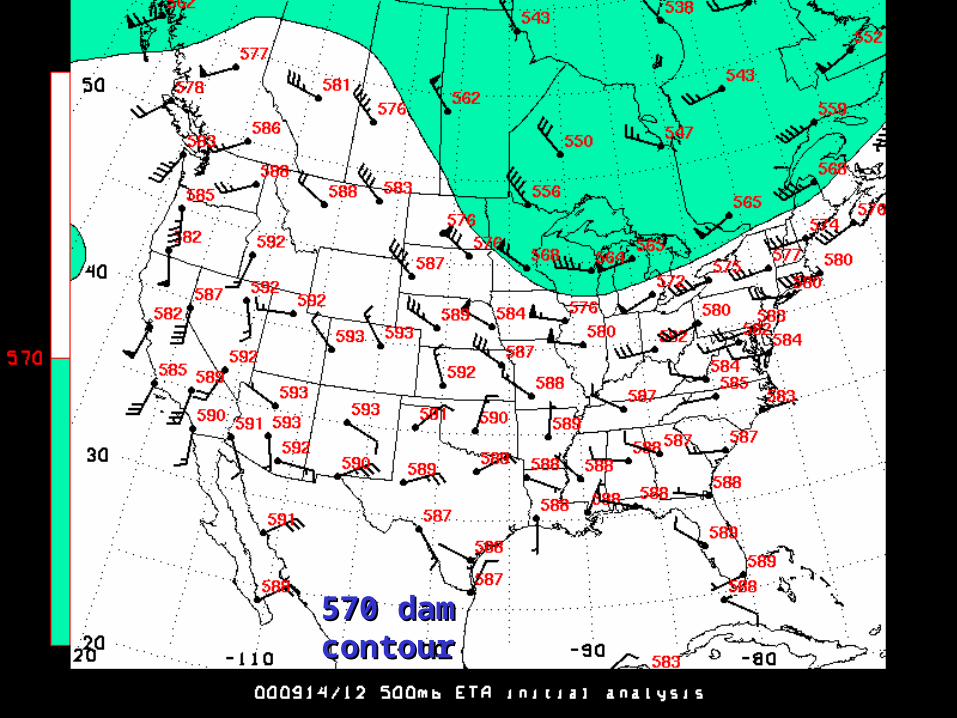
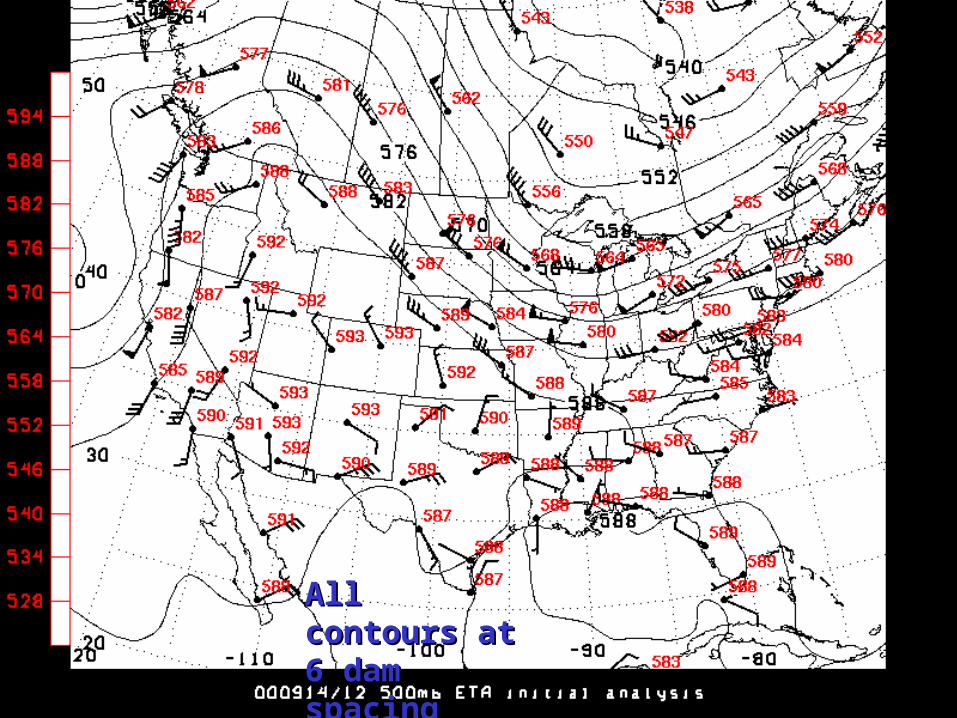
570 dam contour570 dam contour
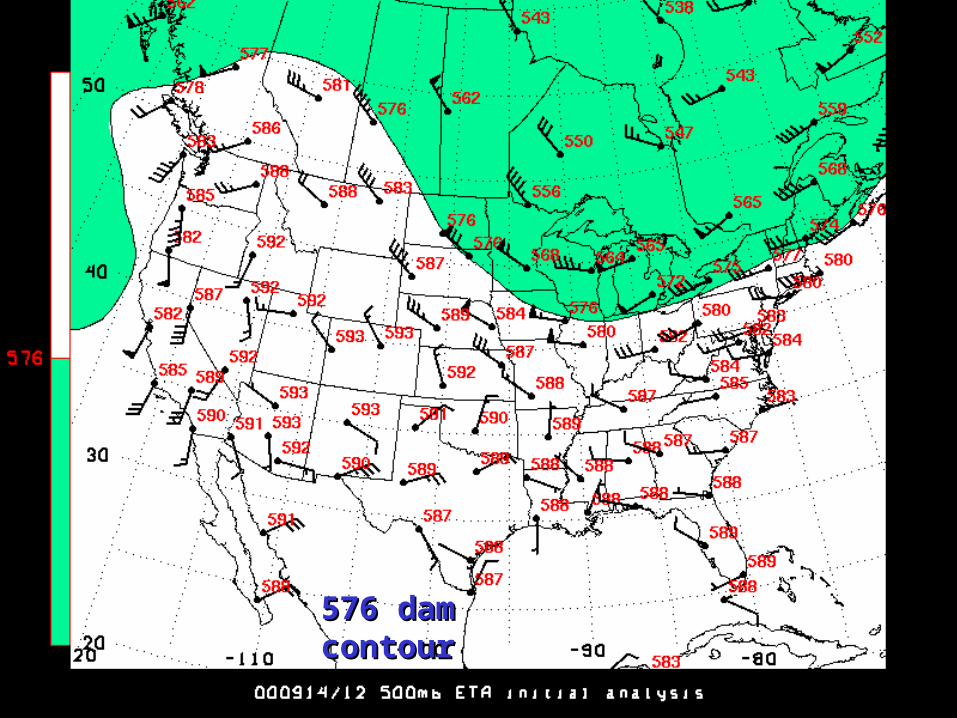
576 dam contour576 dam contour
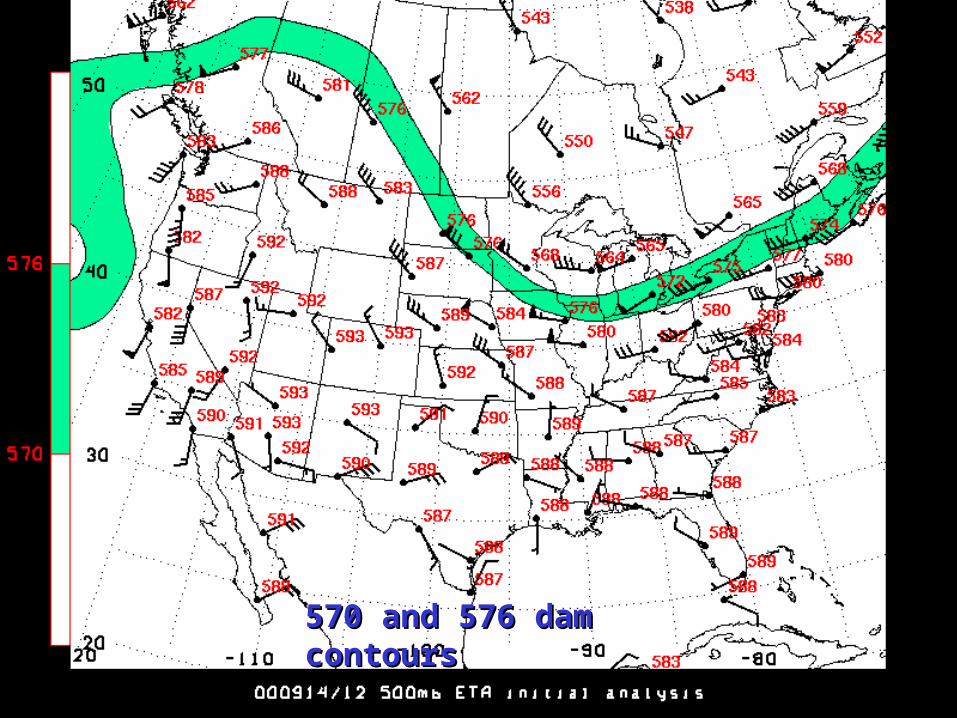
570 and 576 dam contours570 and 576 dam contours
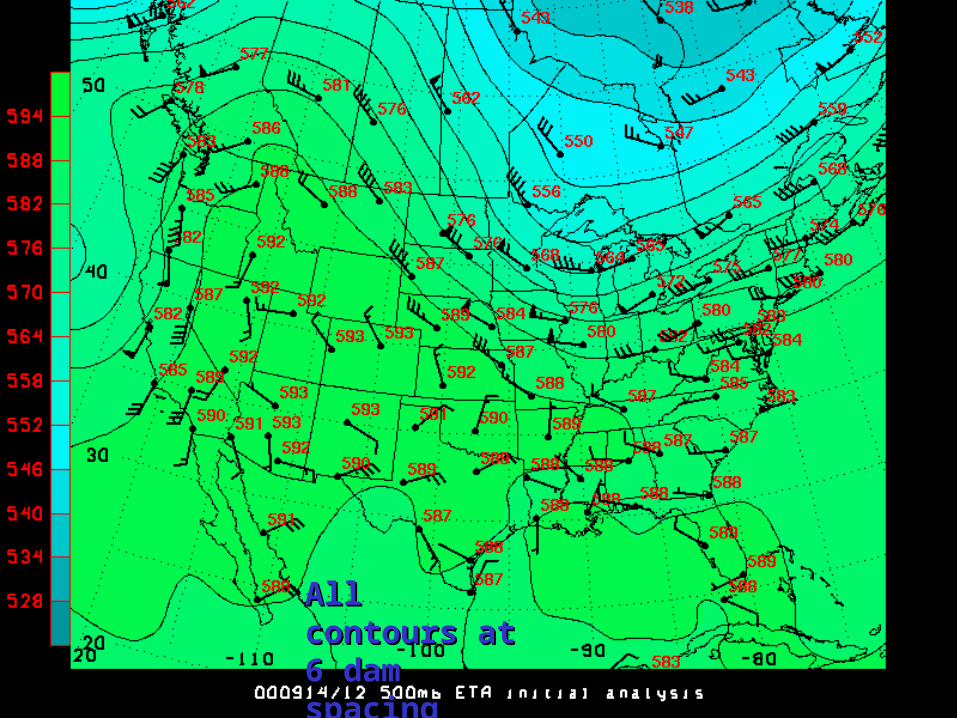
All contours at All contours at 6 dam spacing6 dam spacing
All contours at All contours at 6 dam spacing6 dam spacing
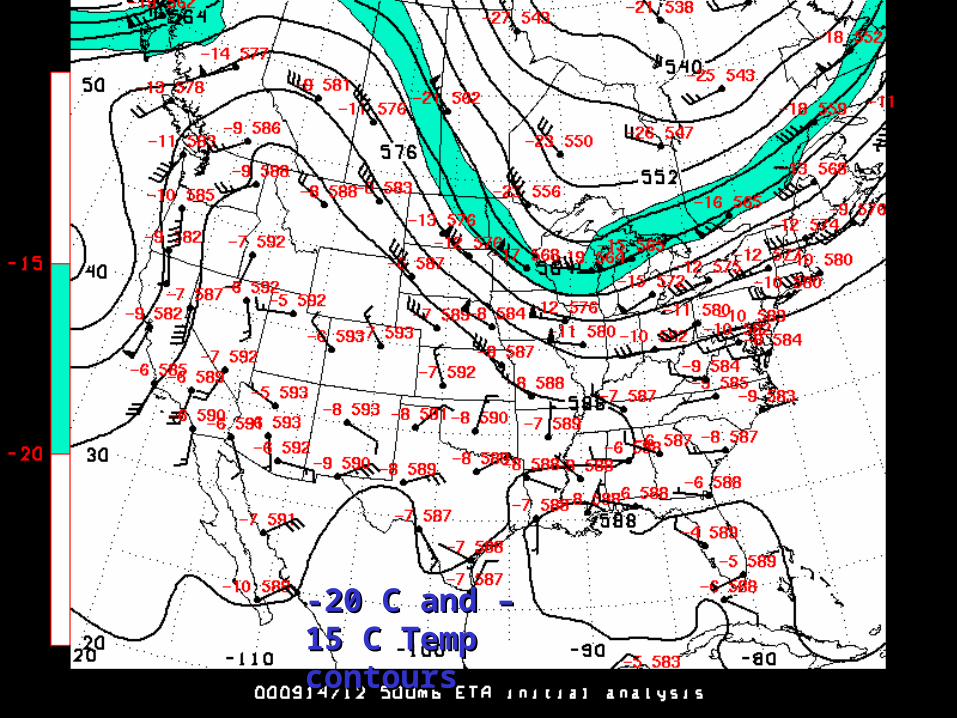
-20 C and –15 C -20 C and –15 C Temp contoursTemp contours
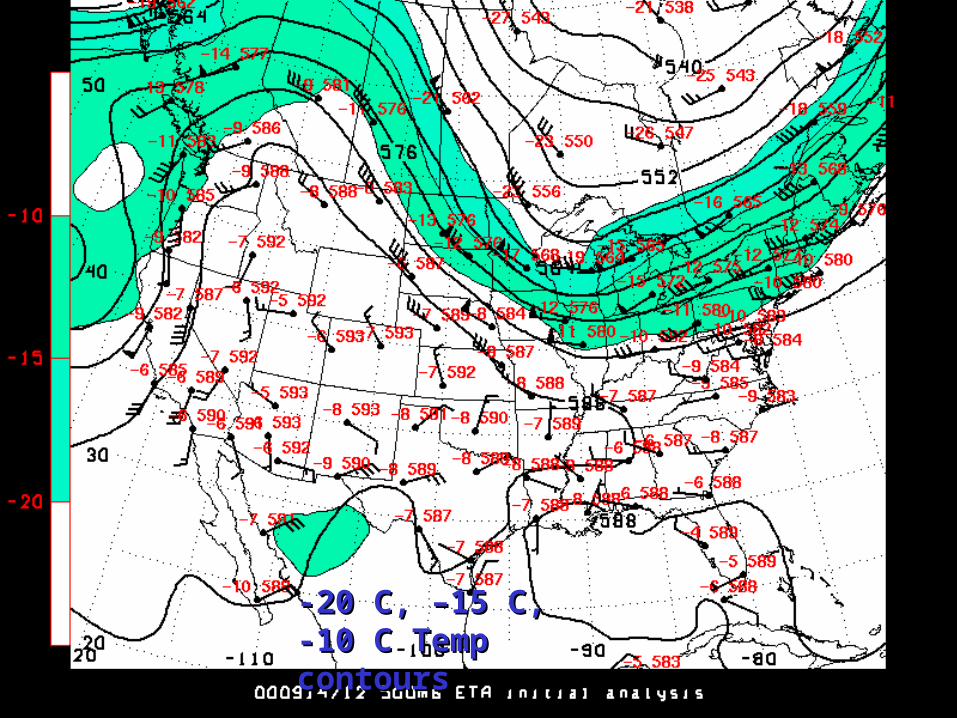
-20 C, –15 C, -10 C -20 C, –15 C, -10 C Temp contoursTemp contours
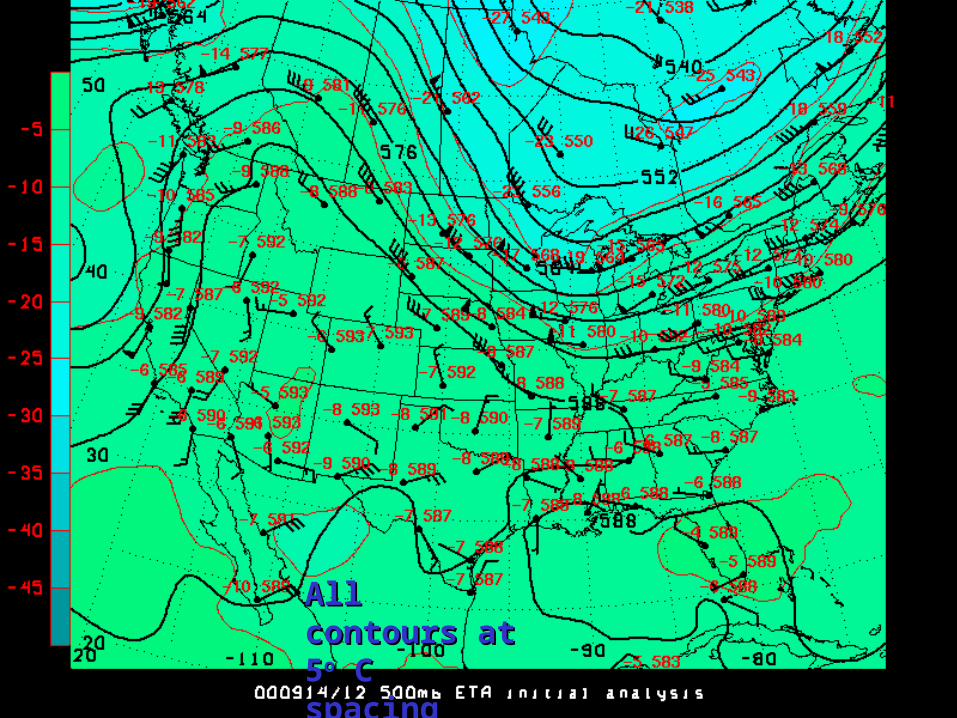
All contours at All contours at 55oo C spacing C spacing
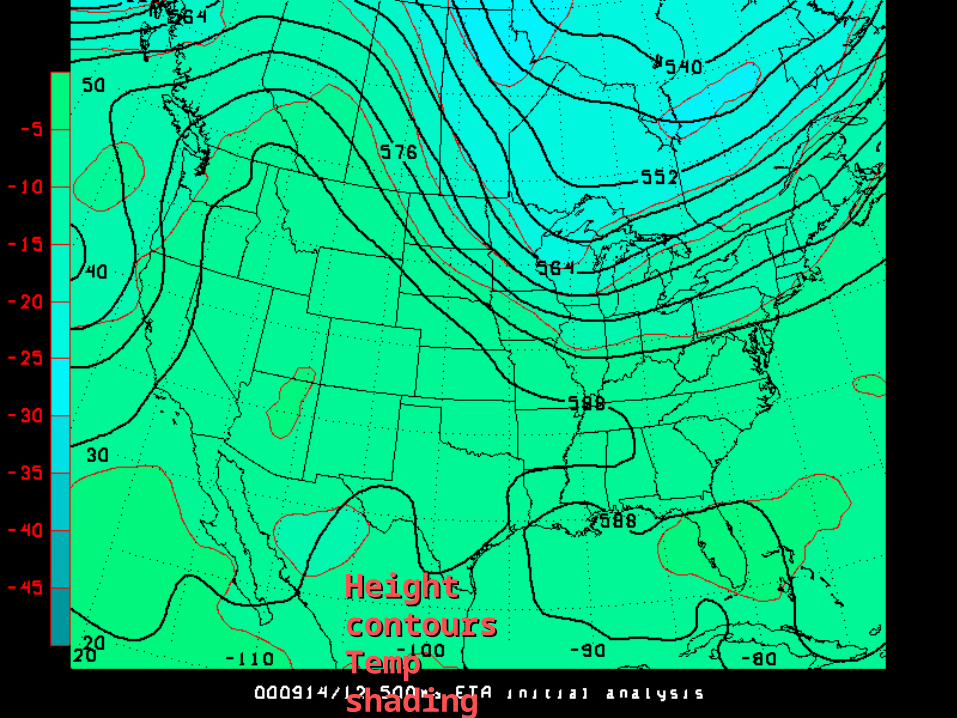
Height contours Height contours Temp shadingTemp shading
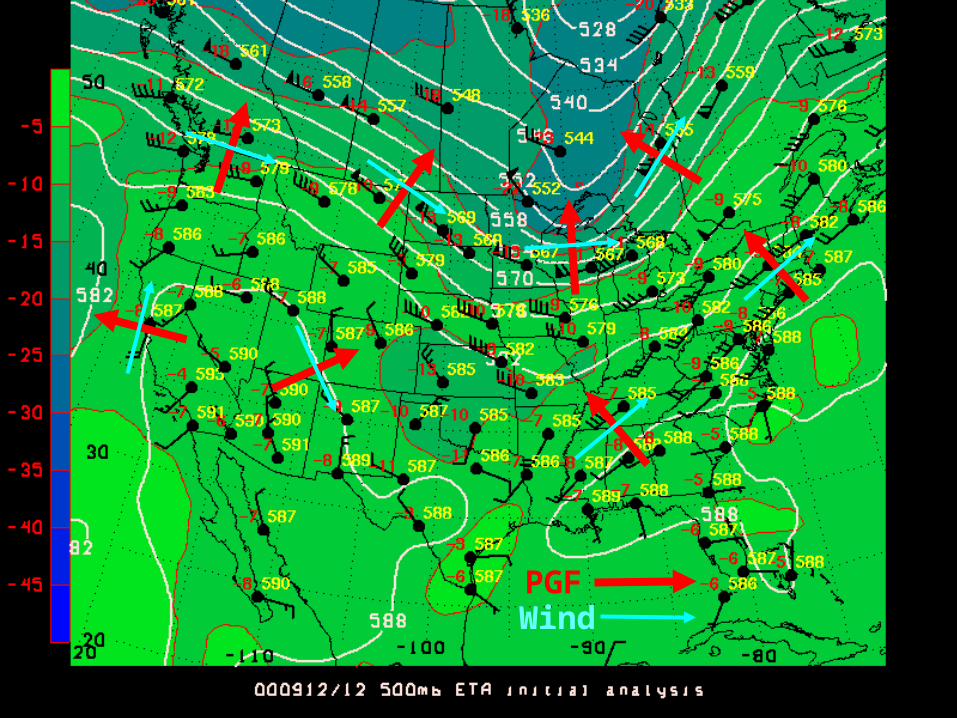
PGFWind
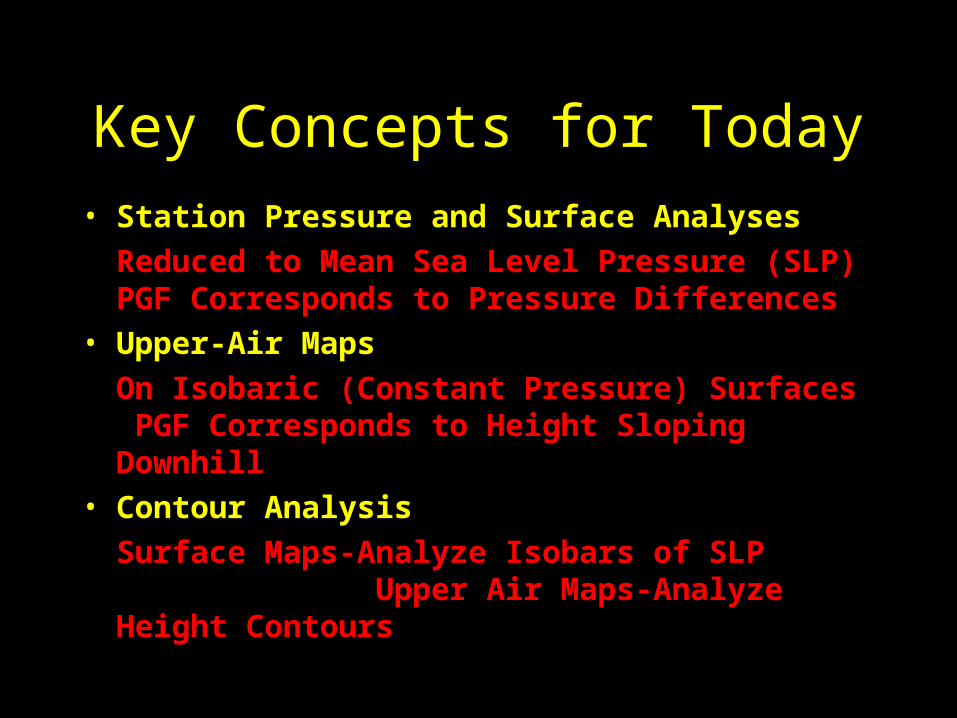
Key Concepts for Today • Station Pressure and Surface Analyses
Reduced to Mean Sea Level Pressure (SLP) PGF Corresponds to Pressure Differences
• Upper-Air Maps
On Isobaric (Constant Pressure) Surfaces PGF Corresponds to Height Sloping Downhill
• Contour Analysis
Surface Maps-Analyze Isobars of SLP Upper Air Maps-Analyze Height Contours
Key Concepts for Today
• Wind Direction and PGF
Winds more than 1 to 2 km above the ground are perpendicular to PGF!
Analogous a marble rolling not downhill, but at a constant elevation with lower altitudes to the left of the marble’s direction
Assignment
• Reading - Ahrens pg 148-149
include Focus on Special Topic: Isobaric Maps• Problems - 6.9, 6.10
Assignment
Topic – Newton’s Laws
Reading - Ahrens pg 150-157
Problems - 6.12, 6.13, 6.17, 6.19, 6.22