Air Pollution in the Niger Delta Area of · PDF fileAbstract: Air pollution in the Niger Delta...
24
International Journal of Fisheries and Aquatic Sciences 1(2): 94-117, 2012 ISSN: 2049-8411 E-ISSN: 2049-842X © Maxwell Scientific Organization, 2012 Submitted: April 18, 2012 Accepted: May 14, 2012 Published: October 20, 2012 Corresponding Author: J.F.N. Abowei, Department of Biological Sciences, Faculty of Science, Niger Delta University, Wilberforce Island, Nigeria 94 Air Pollution in the Niger Delta Area of Nigeria 1 C.C. Tawari and 2 J.F.N. Abowei 1 Department of Fisheries and Livestock Production, Faculty of Agriculture, Niger Delta University, Wilberforce Island, Bayelsa State, Nigeria 2 Department of Biological Sciences, Faculty of Science, Niger Delta University, Wilberforce Island, Nigeria Abstract: Air pollution in the Niger Delta Area of Nigeria was reviewed to create awareness of its consequences and minimize it. Air pollution is one of the major environmental problems confronting the Niger Delta Area (NDA) yet information regarding this is very scanty. The NDA is Nigeria’s most endowed region in terms of oil mineral reserves and one of the most industrialized after Lagos, Nigeria’s former administrative capital. The operations of these industries especially the upstream and downstream petroleum sectors as well as a variety of other anthropogenically related activities including biomass combustion, refuse burning and traffic emissions releases a barrage of substances like volatile organics, oxides of carbon, nitrogen, sulphur, particulate matter, heavy metals and other toxics at levels that most times exceed both the national and international guidelines. Apart from compromising the quality of the atmosphere most of the air pollution in the region is observed to have local and regional effects such as the formation of acid rain, water pollution, soil pollution and impacts on plants and wild life, effects on materials and artifacts and recently contributing to the global warming effects. While most of these claims may be true a great majority has not been substantiated scientifically and is rather based on assumptions or being speculative. There are numerous challenges facing air quality studies in NDA. Like in most developing nations the issues are multifaceted and the most acute have been lack of equipment, inadequate expertise, lack of infrastructure and weak policy frame work. This and many other factors has been the bane to achieving the much desired goals towards preserving the quality of the ecosystems and safeguarding the health of the public in the region. A brief description of the Niger delta area, the possible sources/classification, fate, effects, of air pollution in the region with highlights of a few case scenarios of air pollution from community automobile traffic and industries as well as common related health problems are discussed in the study to create the needed awareness and solutions are proffered. Keywords: Air pollution, control measures, effects, fate, Niger Delta, ources/classification INTRODUCTION Air pollution is the introduction of chemicals, particulate matter, or biological materials that cause harm or discomfort to humans or other living organisms, or cause damage to the natural environment or built environment, into the atmosphere. It can be defined as the presence in the outdoor or indoor atmosphere of one or more gaseous or particulate contaminants in quantities, characteristics and of duration such as to be injurious to human, plant or animal life or to property, or which unreasonably interferes with the comfortable enjoyment of life and property (Odigure, 1998). It has been difficult to achieve cooperation for air pollution control in developing countries like Nigeria, whose chief concern is to provide such basic need as food, shelter and employment for her populace. A substance in the air that can cause harm to humans and the environment is known as an air pollutant. Pollutants can be in the form of solid particles, liquid droplets, or gases. In addition, they may be natural or man-made (Anderson, 2005). The atmosphere is a complex dynamic natural gaseous system that is essential to support life on planet Earth. Stratospheric ozone depletion due to air pollution has long been recognized as a threat to human health as well as to the Earth's ecosystems. Indoor air pollution and urban air quality are listed as two of the world's worst pollution problems in the 2008 Blacksmith Institute World's Worst Polluted Places report (Anderson, 2005). Air pollution (Plate 1) is something that we cannot really ignore now-a-days. This is evident from the moment we step out of our house and are greeted with black colored smog that hits us directly reminding us
Transcript of Air Pollution in the Niger Delta Area of · PDF fileAbstract: Air pollution in the Niger Delta...
International Journal of Fisheries and Aquatic Sciences 1(2): 94-117, 2012 ISSN: 2049-8411 E-ISSN: 2049-842X © Maxwell Scientific Organization, 2012 Submitted: April 18, 2012 Accepted: May 14, 2012 Published: October 20, 2012
Corresponding Author: J.F.N. Abowei, Department of Biological Sciences, Faculty of Science, Niger Delta University,
Wilberforce Island, Nigeria 94
Air Pollution in the Niger Delta Area of Nigeria
1C.C. Tawari and 2J.F.N. Abowei
1Department of Fisheries and Livestock Production, Faculty of Agriculture, Niger Delta University, Wilberforce Island, Bayelsa State, Nigeria
2Department of Biological Sciences, Faculty of Science, Niger Delta University, Wilberforce Island, Nigeria
Abstract: Air pollution in the Niger Delta Area of Nigeria was reviewed to create awareness of its consequences and minimize it. Air pollution is one of the major environmental problems confronting the Niger Delta Area (NDA) yet information regarding this is very scanty. The NDA is Nigeria’s most endowed region in terms of oil mineral reserves and one of the most industrialized after Lagos, Nigeria’s former administrative capital. The operations of these industries especially the upstream and downstream petroleum sectors as well as a variety of other anthropogenically related activities including biomass combustion, refuse burning and traffic emissions releases a barrage of substances like volatile organics, oxides of carbon, nitrogen, sulphur, particulate matter, heavy metals and other toxics at levels that most times exceed both the national and international guidelines. Apart from compromising the quality of the atmosphere most of the air pollution in the region is observed to have local and regional effects such as the formation of acid rain, water pollution, soil pollution and impacts on plants and wild life, effects on materials and artifacts and recently contributing to the global warming effects. While most of these claims may be true a great majority has not been substantiated scientifically and is rather based on assumptions or being speculative. There are numerous challenges facing air quality studies in NDA. Like in most developing nations the issues are multifaceted and the most acute have been lack of equipment, inadequate expertise, lack of infrastructure and weak policy frame work. This and many other factors has been the bane to achieving the much desired goals towards preserving the quality of the ecosystems and safeguarding the health of the public in the region. A brief description of the Niger delta area, the possible sources/classification, fate, effects, of air pollution in the region with highlights of a few case scenarios of air pollution from community automobile traffic and industries as well as common related health problems are discussed in the study to create the needed awareness and solutions are proffered. Keywords: Air pollution, control measures, effects, fate, Niger Delta, ources/classification
INTRODUCTION
Air pollution is the introduction of chemicals,
particulate matter, or biological materials that cause harm or discomfort to humans or other living organisms, or cause damage to the natural environment or built environment, into the atmosphere. It can be defined as the presence in the outdoor or indoor atmosphere of one or more gaseous or particulate contaminants in quantities, characteristics and of duration such as to be injurious to human, plant or animal life or to property, or which unreasonably interferes with the comfortable enjoyment of life and property (Odigure, 1998). It has been difficult to achieve cooperation for air pollution control in developing countries like Nigeria, whose chief concern is to provide such basic need as food, shelter and employment for her populace.
A substance in the air that can cause harm to humans and the environment is known as an air pollutant. Pollutants can be in the form of solid particles, liquid droplets, or gases. In addition, they may be natural or man-made (Anderson, 2005). The atmosphere is a complex dynamic natural gaseous system that is essential to support life on planet Earth. Stratospheric ozone depletion due to air pollution has long been recognized as a threat to human health as well as to the Earth's ecosystems. Indoor air pollution and urban air quality are listed as two of the world's worst pollution problems in the 2008 Blacksmith Institute World's Worst Polluted Places report (Anderson, 2005).
Air pollution (Plate 1) is something that we cannot really ignore now-a-days. This is evident from the moment we step out of our house and are greeted with black colored smog that hits us directly reminding us

Int. J. Fish. Aquat. Sci., 1(2): 94-117, 2012
95
Plate 1: Niger delta air pollution Oyekunle (1999) that breathing clean air is more of a distant dream. It is so easy for us to endlessly rant and rave about the causes of air pollution and its ill effects, but little do we realize that each person is responsible for all the causes of air pollution and the situation that we face today. Take a look around you at the dismal state of affairs. The thick smog that is seen in the morning hours is not really due to somebody else but rather due to each and every one of us. Here is a look at the causes of air pollution and how it can affect us if the matter is not taken care of at this stage itself.
Air pollution is one of the major environmental problems confronting the Niger Delta Area (NDA) yet information regarding this is very scanty. Aside from data collected by a few individuals and corporate organizations at scattered locations, there is no comprehensive and empirical database on the magnitude of the hazard and its deleterious effects on the ecosystems and people in the region. Also the existing network of meteorological stations is too coarse to provide data covering the whole of the region. The NDA is Nigeria’s most endowed region in terms of oil mineral reserves and one of the most industrialized after Lagos, Nigeria’s former administrative capital. The operations of these industries especially the upstream and downstream petroleum sectors as well as a variety of other anthropogenically related activities including biomass combustion, refuse burning and traffic emissions releases a barrage of substances like volatile organics, oxides of carbon, nitrogen, sulphur, particulate matter, heavy metals and other toxics at levels that most times exceed both the national and international guidelines.
Apart from compromising the quality of the atmosphere most of the air pollution in the region is
observed to have local and regional effects such as the formation of acid rain, water pollution, soil pollution and impacts on plants and wild life, effects on materials and artifacts and recently contributing to the global warming effects. While most of these claims may be true a great majority has not been substantiated scientifically and is rather based on assumptions or being speculative. There are numerous challenges facing air quality studies in NDA. Like in most developing nations the issues are multifaceted and the most acute have been lack of equipment, inadequate expertise, lack of infrastructure and weak policy frame work. This and many other factors has been the bane to achieving the much desired goals towards preserving the quality of the ecosystems and safeguarding the health of the public in the region.
Ever since the discovery of oil in Nigeria in the 1950’s, the country has been suffering the negative environmental consequences of oil development. The growth of the country’s oil industry, combined with a population explosion and a lack of environmental regulation, led to substantial damage to Nigeria’s environment especially in the Niger Delta region, the centre of the country’s oil industry (Oyekunle, 1999). The country also faces environmental challenges from air pollution and desertification, with the encroachment of the Sahara desert in north and severe air pollution in over crowded cities such as Kaduna, Lagos and Abuja (Ifeanyichukwu, 2002). The Niger Delta’s main environmental challenges result from oil spillage, gas flaring and deforestation. Gas flaring is the one the hottest environmental issues in Nigeria. Flaring is the controlled burning of the waste natural gas associated with oil production (Bassal, 1981).
One of the main sources is the “solution gas” trapped in underground oil supplies, which is released when oil is brought to the surface. Flaring is used to eliminate gas when the volume is insufficient to warrant recovery or collection, it would be uneconomic. In recent years, however, the expansion of oil drilling has resulted in more flaring, triggering public reactions ranging from annoyance to allegation of serious health consequences for animal and people (Alakpodia, 1980). Flaring sometimes results in an unpleasant, “rotten egg” smell. There is no conclusive evidence of chronic or long-term effects to human health (Strauss, 1975).
Nevertheless, even with the end of gas flaring, air pollution is likely to remain a problem in Nigeria as other sources such as automobiles and diesel-fired electricity generators contributes to the choking air in the city, which are plagued by daily smog that covers the skyline of the central city (Ifeanyichukwu, 2002).

Int. J. Fish. Aquat. Sci., 1(2): 94-117, 2012
96
Fig. 1: Political map of the Niger delta area Studies carried out by the Federal Environmental Protection Agency (1991) (FEPA) show a moderate-to-high concentration of pollutants such as carbon monoxide, sulphur dioxide, nitrogen oxides, organic acids, particulate matters and hydrocarbon in the atmosphere.
The majority of these come from automotive engines and industries. Since air pollution cause damages to the vegetation and materials on earth apart from damaging the human and animal health, a high degree of air pollution control is essential. But the difficulty to make definite statement about the precise health effect of air pollution is another titanic problem. This may be due to some problems associated with their damages. Some of these reasons are (Perry, 1984): • It is usually impossible to determine the degree of
exposure of a given individual to a specific problem.
• Pollutants are numerous and varied and many of them are difficult to detect. Techniques for monitoring pollutants are inadequate and long-term records are almost unavailable.
• Research is complicated because pollutants that do not cause problems when tested alone maybe dangerous in combustion with other pollutants.
• Degree of air pollution is correlated with other factors, such as degree of exposure to various kinds of stress, other kinds of pollution and food additives. However, through the rapid development of modern analytical technique has simulated an exponential increase in the number and the sophistication of industrial cities pollution studies and hence the near perfect strategy of controlling these air pollution hazards is through the use of appropriate air pollution model (Perry, 1984).
The Niger Delta (Fig. 1) covers 20,000 km² within
wetlands of 70,000 km² formed primarily by sediment deposition. Home to 20 million people and 40 different ethnic groups, this floodplain makes up 7.5% of Nigeria's total land mass. It is the largest wetland and maintains the third-largest drainage basin in Africa. The Delta's environment can be broken down into four ecological zones: coastal barrier islands, mangrove swamp forests, freshwater swamps and lowland rainforests. This incredibly well-endowed ecosystem contains one of the highest concentrations of biodiversity on the planet, in addition to supporting abundant flora and fauna, arable terrain that can sustain a wide variety of crops, lumber or agricultural trees and more species of freshwater fish than any ecosystem in West Africa.
Int. J. Fish. Aquat. Sci., 1(2): 94-117, 2012
97
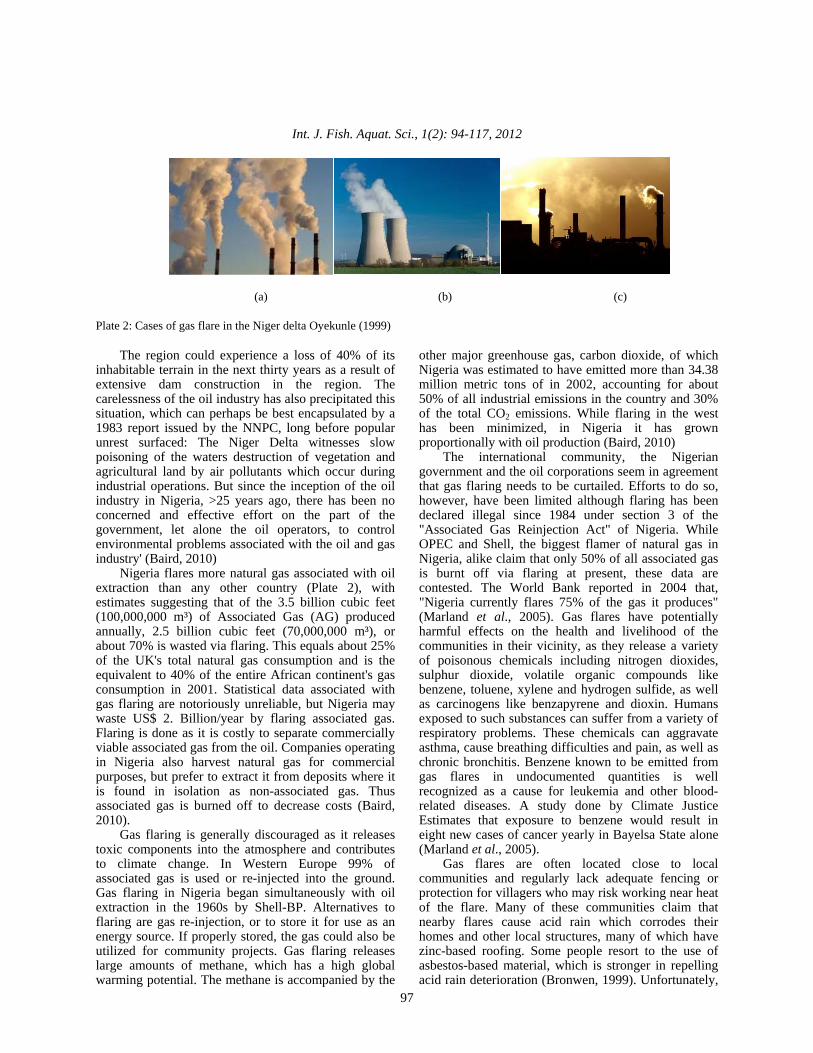
(a) (b) (c) Plate 2: Cases of gas flare in the Niger delta Oyekunle (1999)
The region could experience a loss of 40% of its inhabitable terrain in the next thirty years as a result of extensive dam construction in the region. The carelessness of the oil industry has also precipitated this situation, which can perhaps be best encapsulated by a 1983 report issued by the NNPC, long before popular unrest surfaced: The Niger Delta witnesses slow poisoning of the waters destruction of vegetation and agricultural land by air pollutants which occur during industrial operations. But since the inception of the oil industry in Nigeria, >25 years ago, there has been no concerned and effective effort on the part of the government, let alone the oil operators, to control environmental problems associated with the oil and gas industry' (Baird, 2010)
Nigeria flares more natural gas associated with oil extraction than any other country (Plate 2), with estimates suggesting that of the 3.5 billion cubic feet (100,000,000 m³) of Associated Gas (AG) produced annually, 2.5 billion cubic feet (70,000,000 m³), or about 70% is wasted via flaring. This equals about 25% of the UK's total natural gas consumption and is the equivalent to 40% of the entire African continent's gas consumption in 2001. Statistical data associated with gas flaring are notoriously unreliable, but Nigeria may waste US$ 2. Billion/year by flaring associated gas. Flaring is done as it is costly to separate commercially viable associated gas from the oil. Companies operating in Nigeria also harvest natural gas for commercial purposes, but prefer to extract it from deposits where it is found in isolation as non-associated gas. Thus associated gas is burned off to decrease costs (Baird, 2010).
Gas flaring is generally discouraged as it releases toxic components into the atmosphere and contributes to climate change. In Western Europe 99% of associated gas is used or re-injected into the ground. Gas flaring in Nigeria began simultaneously with oil extraction in the 1960s by Shell-BP. Alternatives to flaring are gas re-injection, or to store it for use as an energy source. If properly stored, the gas could also be utilized for community projects. Gas flaring releases large amounts of methane, which has a high global warming potential. The methane is accompanied by the
other major greenhouse gas, carbon dioxide, of which Nigeria was estimated to have emitted more than 34.38 million metric tons of in 2002, accounting for about 50% of all industrial emissions in the country and 30% of the total CO2 emissions. While flaring in the west has been minimized, in Nigeria it has grown proportionally with oil production (Baird, 2010)
The international community, the Nigerian government and the oil corporations seem in agreement that gas flaring needs to be curtailed. Efforts to do so, however, have been limited although flaring has been declared illegal since 1984 under section 3 of the "Associated Gas Reinjection Act" of Nigeria. While OPEC and Shell, the biggest flamer of natural gas in Nigeria, alike claim that only 50% of all associated gas is burnt off via flaring at present, these data are contested. The World Bank reported in 2004 that, "Nigeria currently flares 75% of the gas it produces" (Marland et al., 2005). Gas flares have potentially harmful effects on the health and livelihood of the communities in their vicinity, as they release a variety of poisonous chemicals including nitrogen dioxides, sulphur dioxide, volatile organic compounds like benzene, toluene, xylene and hydrogen sulfide, as well as carcinogens like benzapyrene and dioxin. Humans exposed to such substances can suffer from a variety of respiratory problems. These chemicals can aggravate asthma, cause breathing difficulties and pain, as well as chronic bronchitis. Benzene known to be emitted from gas flares in undocumented quantities is well recognized as a cause for leukemia and other blood-related diseases. A study done by Climate Justice Estimates that exposure to benzene would result in eight new cases of cancer yearly in Bayelsa State alone (Marland et al., 2005).
Gas flares are often located close to local communities and regularly lack adequate fencing or protection for villagers who may risk working near heat of the flare. Many of these communities claim that nearby flares cause acid rain which corrodes their homes and other local structures, many of which have zinc-based roofing. Some people resort to the use of asbestos-based material, which is stronger in repelling acid rain deterioration (Bronwen, 1999). Unfortunately,
Int. J. Fish. Aquat. Sci., 1(2): 94-117, 2012
98
this only contributes to their declining health and the health of their environment. Asbestos exposure increases the risk of forming lung cancer, mesothelioma and asbestosis (Bronwen, 1999). Whether or not flares contribute to acid rain is debatable, as some independent studies conducted have found that the sulphur dioxide and nitrous oxide content of most flares was insufficient to establish a link between flaring and acid rain. Other studies from U.S. Energy Information Administration (EIA) report that gas flaring is "a major contributor to air pollution and acid rain" (Bronwen, 1999).
Older flares are rarely relocated away from villages and are known to coat the land and communities in the area with soot and to damage adjacent vegetation. Almost no vegetation can grow in the area directly surrounding the flare due to the prevailing heat (Brown, 1999). In November 2005 a judgment by the Federal High Court of Nigeria ordered that gas flaring must stop in a Niger Delta community as it violates guaranteed constitutional rights to life and dignity. In a case brought against the Shell Petroleum Development Company of Nigeria (Shell), Justice C.V. Nwokorie ruled in Benin City that "the damaging and wasteful practice of flaring cannot lawfully continue." As of May 2011, Shell has not ceased gas flaring in Nigeria (Fuggile, 2004).
Table 1 shows Concentration of pollutants with respect to distances from the point of flaring for the month of July 2003; While, Table 2 shows the concentration of pollutant at various distances.
A brief description of the Niger delta area, the possible sources/ classification, fate, effects, of air pollution in the region with highlights of a few case scenarios of air pollution from community automobile traffic and industries as well as common related health problems and proffered solutions creates the needed awareness. Sources and classification of air pollution: Sources of air pollution refer to the various locations, activities or factors which are responsible for the releasing of pollutants into the atmosphere. These sources can be classified into two major categories which are: Anthropogenic sources (human activity) mostly related to burning different kinds of fuel:
• "Stationary Sources" include smoke stacks of power plants, manufacturing facilities (factories) and waste incinerators, as well as furnaces and other types of fuel-burning heating devices
• "Mobile Sources" include motor vehicles, marine vessels, aircraft and the effect of sound etc.,
• Chemicals, dust and controlled burn practices in agriculture and forestry management. Controlled or prescribed burning is a technique sometimes used in forest management, farming, prairie restoration or greenhouse gas abatement. Fire is a natural part of both forest and grassland ecology and controlled fire can be a tool for foresters. Controlled burning stimulates the germination of some desirable forest trees, thus renewing the forest
• Fumes from paint, hair spray, varnish, aerosol sprays and other solvents
• Waste deposition in landfills, which generate methane. Methane is not toxic; however, it is highly flammable and may form explosive mixtures with air. Methane is also an asphyxiant and may displace oxygen in an enclosed space. Asphyxia or suffocation may result if the oxygen concentration is reduced to below 19.5% by displacement
• Military, such as nuclear weapons, toxic gases, germ warfare and rocketry
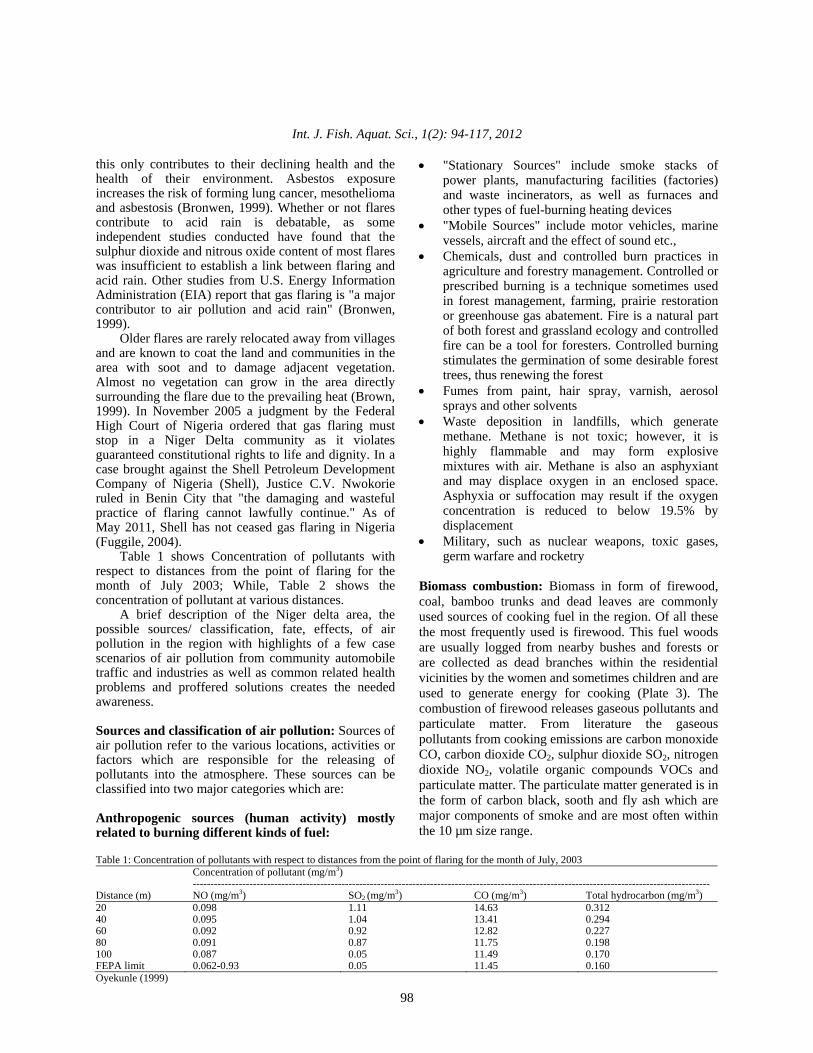
Biomass combustion: Biomass in form of firewood, coal, bamboo trunks and dead leaves are commonly used sources of cooking fuel in the region. Of all these the most frequently used is firewood. This fuel woods are usually logged from nearby bushes and forests or are collected as dead branches within the residential vicinities by the women and sometimes children and are used to generate energy for cooking (Plate 3). The combustion of firewood releases gaseous pollutants and particulate matter. From literature the gaseous pollutants from cooking emissions are carbon monoxide CO, carbon dioxide CO2, sulphur dioxide SO2, nitrogen dioxide NO2, volatile organic compounds VOCs and particulate matter. The particulate matter generated is in the form of carbon black, sooth and fly ash which are major components of smoke and are most often within the 10 µm size range.
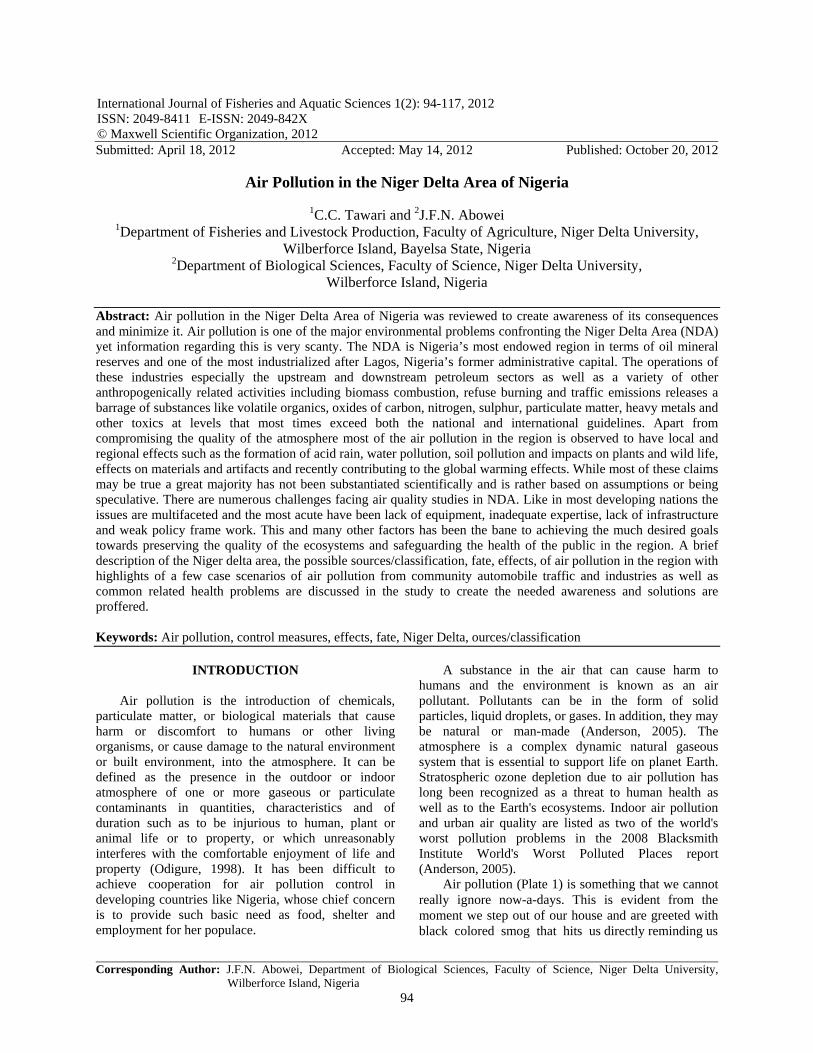
Table 1: Concentration of pollutants with respect to distances from the point of flaring for the month of July, 2003
Concentration of pollutant (mg/m3)--------------------------------------------------------------------------------------------------------------------------------------------------
Distance (m) NO (mg/m3) SO2 (mg/m3) CO (mg/m3) Total hydrocarbon (mg/m3)20 0.098 1.11 14.63 0.312 40 0.095 1.04 13.41 0.294 60 0.092 0.92 12.82 0.227 80 0.091 0.87 11.75 0.198 100 0.087 0.05 11.49 0.170 FEPA limit 0.062-0.93 0.05 11.45 0.160 Oyekunle (1999)
Int. J. Fish. Aquat. Sci., 1(2): 94-117, 2012
99
Table 2: Concentration of pollutant various distances Distance. (M) 20 40 60 80 100 200 300 400 500 600 700 800 900 1000 NO 0.08 0.08 0.08 0.08 0.07 0.05 0.05 0.04 0.03 0.03 0.02 0.02 0.02 0.02 65% SO2 0.97 0.92 0.90 0.88 0.04 0.03 0.23 0.02 0.01 0.01 0.01 0.01 0.01 0.01 Con. (mg/m3) Co 12.70 11.4 10.90 9.70 0.98 9.07 6.13 4.63 3.73 3.12 2.68 2.36 2.10 1.89 THC 0.20 0.19 0.16 0.16 0.11 0.10 0.97 0.09 0.09 0.08 0.07 0.06 0.06 0.05 NO 0.09 0.09 0.09 0.09 0.08 0.06 0.06 0.04 0.04 0.03 0.03 0.22 0.02 0.02 75% SO2 1.12 1.06 1.04 1.01 0.04 0.04 0.03 0.02 0.02 0.01 0.01 0.01 0.01 0.01 Con. (mg/m3) Co 14.6 13.20 12.62 11.20 11.17 10.46 7.07 5.35 4.30 3.60 3.10 2.72 2.42 2.18 THC 0.23 0.22 0.18 0.18 0.12 0.11 0.11 0.11 0.10 0.10 0.83 0.07 0.07 0.06 NO 0.11 0.11 0.10 0.10 0.10 0.07 0.07 0.05 0.04 0.03 0.03 0.03 0.02 0.02 85% SO2 1.30 1.20 1.18 1.15 0.05 0.05 0.03 0.02 0.02 0.02 0.01 0.01 0.01 0.01 Con. (mg/m3) Co 16.59 14.97 14.31 12.69 12.61 11.86 8.01 6.07 4.86 0.08 3.51 0.83 2.74 2.47 THC 0.32 0.25 0.21 0.20 0.13 0.13 0.13 0.12 0.11 0.11 0.09 0.08 0.07 0.07 Oyekunle (1999)
Plate 3: Cooking fuel emissions from biomass combustion
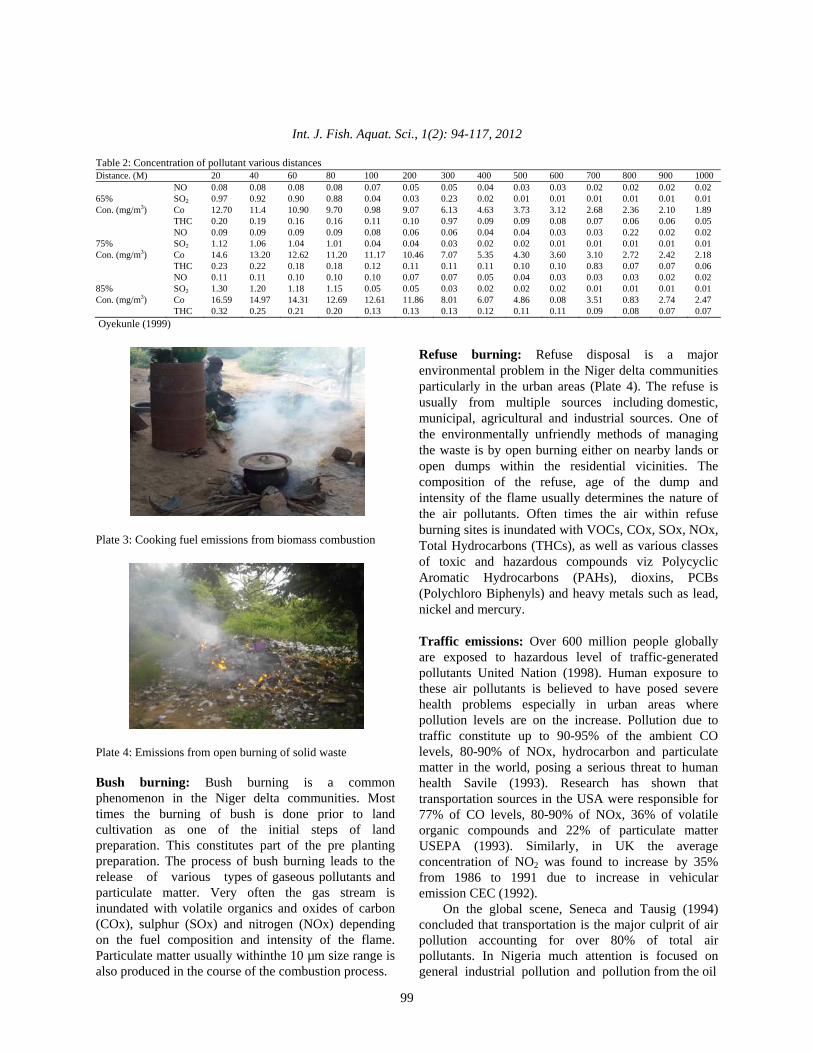
Plate 4: Emissions from open burning of solid waste Bush burning: Bush burning is a common phenomenon in the Niger delta communities. Most times the burning of bush is done prior to land cultivation as one of the initial steps of land preparation. This constitutes part of the pre planting preparation. The process of bush burning leads to the release of various types of gaseous pollutants and particulate matter. Very often the gas stream is inundated with volatile organics and oxides of carbon (COx), sulphur (SOx) and nitrogen (NOx) depending on the fuel composition and intensity of the flame. Particulate matter usually withinthe 10 µm size range is also produced in the course of the combustion process.
Refuse burning: Refuse disposal is a major environmental problem in the Niger delta communities particularly in the urban areas (Plate 4). The refuse is usually from multiple sources including domestic, municipal, agricultural and industrial sources. One of the environmentally unfriendly methods of managing the waste is by open burning either on nearby lands or open dumps within the residential vicinities. The composition of the refuse, age of the dump and intensity of the flame usually determines the nature of the air pollutants. Often times the air within refuse burning sites is inundated with VOCs, COx, SOx, NOx, Total Hydrocarbons (THCs), as well as various classes of toxic and hazardous compounds viz Polycyclic Aromatic Hydrocarbons (PAHs), dioxins, PCBs (Polychloro Biphenyls) and heavy metals such as lead, nickel and mercury. Traffic emissions: Over 600 million people globally are exposed to hazardous level of traffic-generated pollutants United Nation (1998). Human exposure to these air pollutants is believed to have posed severe health problems especially in urban areas where pollution levels are on the increase. Pollution due to traffic constitute up to 90-95% of the ambient CO levels, 80-90% of NOx, hydrocarbon and particulate matter in the world, posing a serious threat to human health Savile (1993). Research has shown that transportation sources in the USA were responsible for 77% of CO levels, 80-90% of NOx, 36% of volatile organic compounds and 22% of particulate matter USEPA (1993). Similarly, in UK the average concentration of NO2 was found to increase by 35% from 1986 to 1991 due to increase in vehicular emission CEC (1992).
On the global scene, Seneca and Tausig (1994) concluded that transportation is the major culprit of air pollution accounting for over 80% of total air pollutants. In Nigeria much attention is focused on general industrial pollution and pollution from the oil
Int. J. Fish. Aquat. Sci., 1(2): 94-117, 2012
100
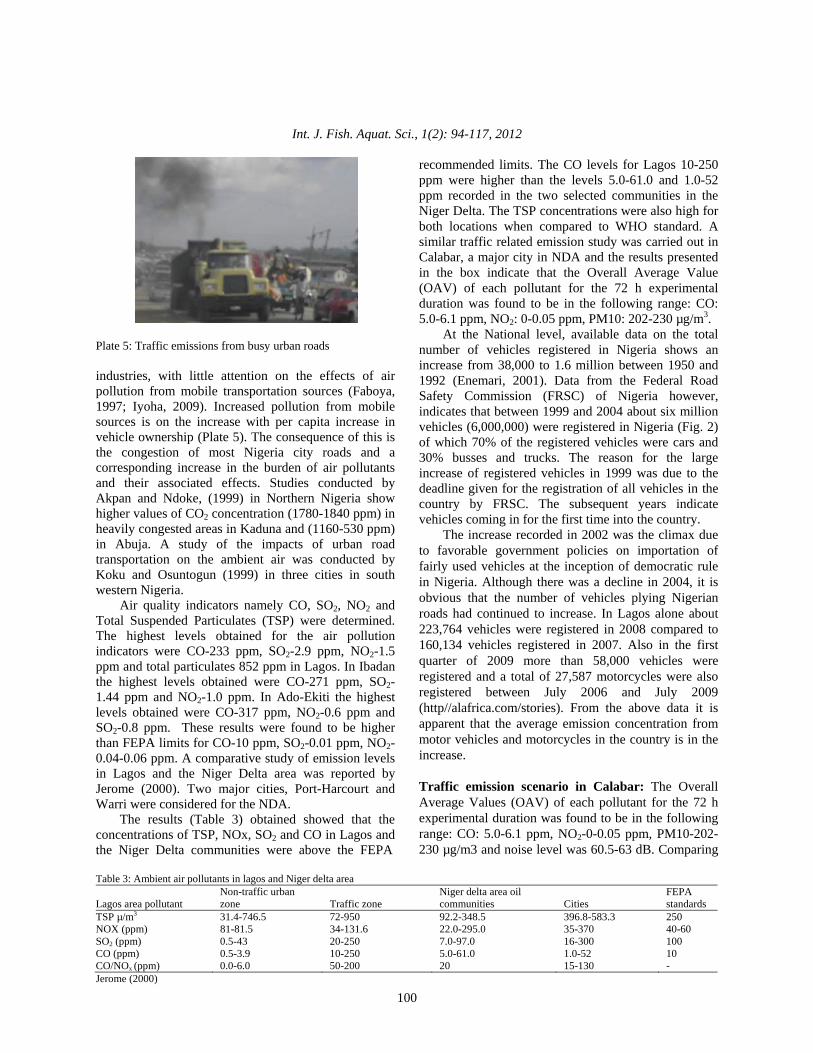
Plate 5: Traffic emissions from busy urban roads industries, with little attention on the effects of air pollution from mobile transportation sources (Faboya, 1997; Iyoha, 2009). Increased pollution from mobile sources is on the increase with per capita increase in vehicle ownership (Plate 5). The consequence of this is the congestion of most Nigeria city roads and a corresponding increase in the burden of air pollutants and their associated effects. Studies conducted by Akpan and Ndoke, (1999) in Northern Nigeria show higher values of CO2 concentration (1780-1840 ppm) in heavily congested areas in Kaduna and (1160-530 ppm) in Abuja. A study of the impacts of urban road transportation on the ambient air was conducted by Koku and Osuntogun (1999) in three cities in south western Nigeria.
Air quality indicators namely CO, SO2, NO2 and Total Suspended Particulates (TSP) were determined. The highest levels obtained for the air pollution indicators were CO-233 ppm, SO2-2.9 ppm, NO2-1.5 ppm and total particulates 852 ppm in Lagos. In Ibadan the highest levels obtained were CO-271 ppm, SO2-1.44 ppm and NO2-1.0 ppm. In Ado-Ekiti the highest levels obtained were CO-317 ppm, NO2-0.6 ppm and SO2-0.8 ppm. These results were found to be higher than FEPA limits for CO-10 ppm, SO2-0.01 ppm, NO2-0.04-0.06 ppm. A comparative study of emission levels in Lagos and the Niger Delta area was reported by Jerome (2000). Two major cities, Port-Harcourt and Warri were considered for the NDA.
The results (Table 3) obtained showed that the concentrations of TSP, NOx, SO2 and CO in Lagos and the Niger Delta communities were above the FEPA
recommended limits. The CO levels for Lagos 10-250 ppm were higher than the levels 5.0-61.0 and 1.0-52 ppm recorded in the two selected communities in the Niger Delta. The TSP concentrations were also high for both locations when compared to WHO standard. A similar traffic related emission study was carried out in Calabar, a major city in NDA and the results presented in the box indicate that the Overall Average Value (OAV) of each pollutant for the 72 h experimental duration was found to be in the following range: CO: 5.0-6.1 ppm, NO2: 0-0.05 ppm, PM10: 202-230 µg/m3.
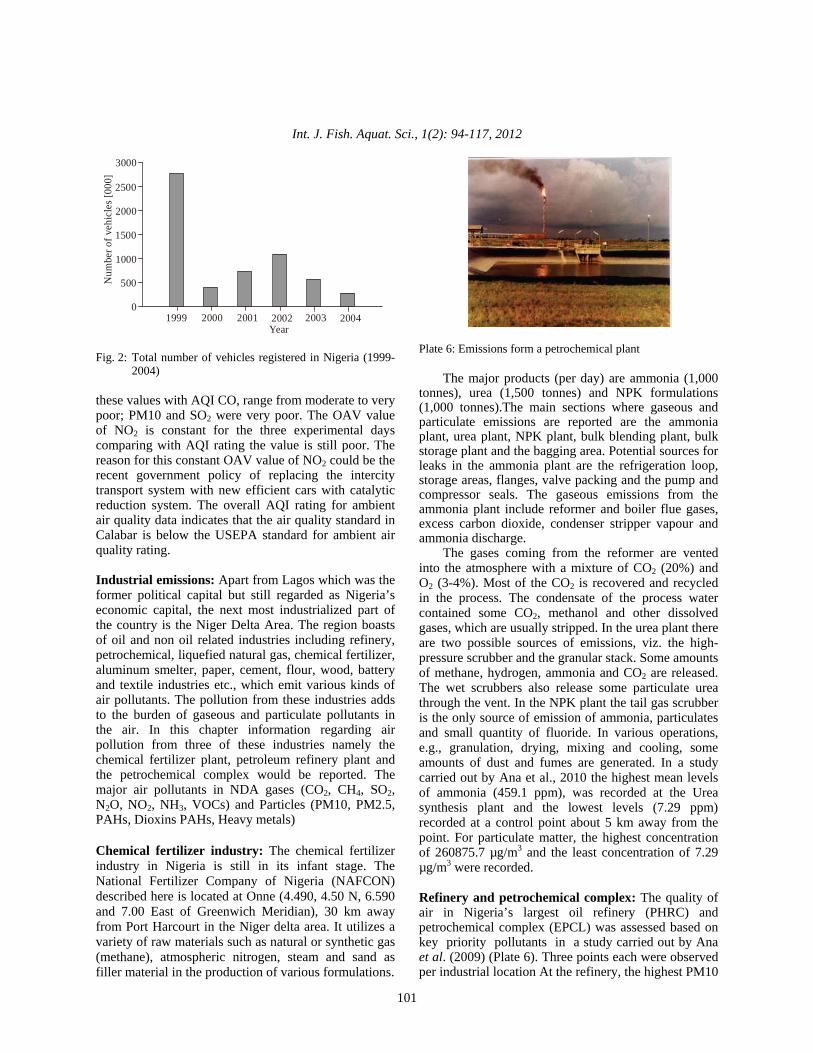
At the National level, available data on the total number of vehicles registered in Nigeria shows an increase from 38,000 to 1.6 million between 1950 and 1992 (Enemari, 2001). Data from the Federal Road Safety Commission (FRSC) of Nigeria however, indicates that between 1999 and 2004 about six million vehicles (6,000,000) were registered in Nigeria (Fig. 2) of which 70% of the registered vehicles were cars and 30% busses and trucks. The reason for the large increase of registered vehicles in 1999 was due to the deadline given for the registration of all vehicles in the country by FRSC. The subsequent years indicate vehicles coming in for the first time into the country.
The increase recorded in 2002 was the climax due to favorable government policies on importation of fairly used vehicles at the inception of democratic rule in Nigeria. Although there was a decline in 2004, it is obvious that the number of vehicles plying Nigerian roads had continued to increase. In Lagos alone about 223,764 vehicles were registered in 2008 compared to 160,134 vehicles registered in 2007. Also in the first quarter of 2009 more than 58,000 vehicles were registered and a total of 27,587 motorcycles were also registered between July 2006 and July 2009 (http//alafrica.com/stories). From the above data it is apparent that the average emission concentration from motor vehicles and motorcycles in the country is in the increase. Traffic emission scenario in Calabar: The Overall Average Values (OAV) of each pollutant for the 72 h experimental duration was found to be in the following range: CO: 5.0-6.1 ppm, NO2-0-0.05 ppm, PM10-202-230 µg/m3 and noise level was 60.5-63 dB. Comparing
Table 3: Ambient air pollutants in lagos and Niger delta area
Lagos area pollutant Non-traffic urban zone Traffic zone
Niger delta area oil communities Cities
FEPA standards
TSP µ/m3 31.4-746.5 72-950 92.2-348.5 396.8-583.3 250 NOX (ppm) 81-81.5 34-131.6 22.0-295.0 35-370 40-60 SO2 (ppm) 0.5-43 20-250 7.0-97.0 16-300 100 CO (ppm) 0.5-3.9 10-250 5.0-61.0 1.0-52 10 CO/NOx (ppm) 0.0-6.0 50-200 20 15-130 - Jerome (2000)
Int. J. Fish. Aquat. Sci., 1(2): 94-117, 2012
101
Fig. 2: Total number of vehicles registered in Nigeria (1999-
2004) these values with AQI CO, range from moderate to very poor; PM10 and SO2 were very poor. The OAV value of NO2 is constant for the three experimental days comparing with AQI rating the value is still poor. The reason for this constant OAV value of NO2 could be the recent government policy of replacing the intercity transport system with new efficient cars with catalytic reduction system. The overall AQI rating for ambient air quality data indicates that the air quality standard in Calabar is below the USEPA standard for ambient air quality rating. Industrial emissions: Apart from Lagos which was the former political capital but still regarded as Nigeria’s economic capital, the next most industrialized part of the country is the Niger Delta Area. The region boasts of oil and non oil related industries including refinery, petrochemical, liquefied natural gas, chemical fertilizer, aluminum smelter, paper, cement, flour, wood, battery and textile industries etc., which emit various kinds of air pollutants. The pollution from these industries adds to the burden of gaseous and particulate pollutants in the air. In this chapter information regarding air pollution from three of these industries namely the chemical fertilizer plant, petroleum refinery plant and the petrochemical complex would be reported. The major air pollutants in NDA gases (CO2, CH4, SO2, N2O, NO2, NH3, VOCs) and Particles (PM10, PM2.5, PAHs, Dioxins PAHs, Heavy metals) Chemical fertilizer industry: The chemical fertilizer industry in Nigeria is still in its infant stage. The National Fertilizer Company of Nigeria (NAFCON) described here is located at Onne (4.490, 4.50 N, 6.590 and 7.00 East of Greenwich Meridian), 30 km away from Port Harcourt in the Niger delta area. It utilizes a variety of raw materials such as natural or synthetic gas (methane), atmospheric nitrogen, steam and sand as filler material in the production of various formulations.
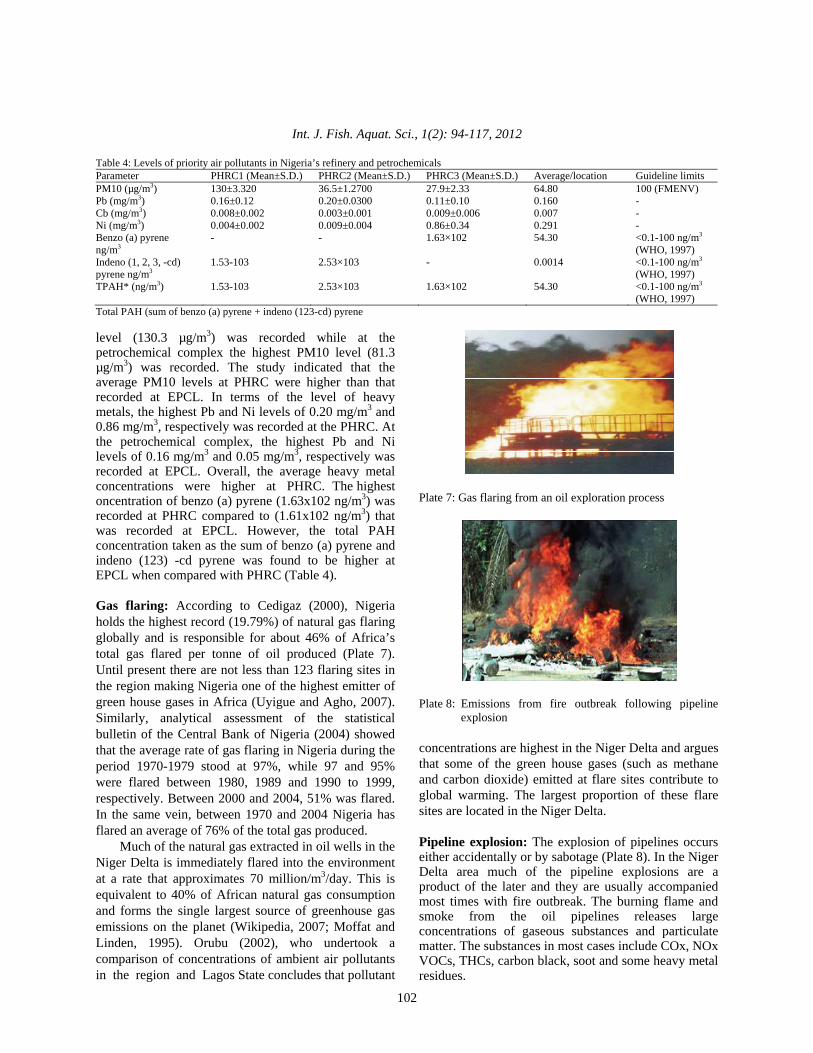
Plate 6: Emissions form a petrochemical plant
The major products (per day) are ammonia (1,000 tonnes), urea (1,500 tonnes) and NPK formulations (1,000 tonnes).The main sections where gaseous and particulate emissions are reported are the ammonia plant, urea plant, NPK plant, bulk blending plant, bulk storage plant and the bagging area. Potential sources for leaks in the ammonia plant are the refrigeration loop, storage areas, flanges, valve packing and the pump and compressor seals. The gaseous emissions from the ammonia plant include reformer and boiler flue gases, excess carbon dioxide, condenser stripper vapour and ammonia discharge.
The gases coming from the reformer are vented into the atmosphere with a mixture of CO2 (20%) and O2 (3-4%). Most of the CO2 is recovered and recycled in the process. The condensate of the process water contained some CO2, methanol and other dissolved gases, which are usually stripped. In the urea plant there are two possible sources of emissions, viz. the high-pressure scrubber and the granular stack. Some amounts of methane, hydrogen, ammonia and CO2 are released. The wet scrubbers also release some particulate urea through the vent. In the NPK plant the tail gas scrubber is the only source of emission of ammonia, particulates and small quantity of fluoride. In various operations, e.g., granulation, drying, mixing and cooling, some amounts of dust and fumes are generated. In a study carried out by Ana et al., 2010 the highest mean levels of ammonia (459.1 ppm), was recorded at the Urea synthesis plant and the lowest levels (7.29 ppm) recorded at a control point about 5 km away from the point. For particulate matter, the highest concentration of 260875.7 µg/m3 and the least concentration of 7.29 µg/m3 were recorded. Refinery and petrochemical complex: The quality of air in Nigeria’s largest oil refinery (PHRC) and petrochemical complex (EPCL) was assessed based on key priority pollutants in a study carried out by Ana et al. (2009) (Plate 6). Three points each were observed per industrial location At the refinery, the highest PM10
0
500
1000
1500
2000
2500
3000
1999 2000 2001 2002 2003 2004Year
Num
ber o
f veh
icle
s [00
0]
Int. J. Fish. Aquat. Sci., 1(2): 94-117, 2012
102
Table 4: Levels of priority air pollutants in Nigeria’s refinery and petrochemicals Parameter PHRC1 (Mean±S.D.) PHRC2 (Mean±S.D.) PHRC3 (Mean±S.D.) Average/location Guideline limits PM10 (µg/m3) 130±3.320 36.5±1.2700 27.9±2.33 64.80 100 (FMENV) Pb (mg/m3) 0.16±0.12 0.20±0.0300 0.11±0.10 0.160 - Cb (mg/m3) 0.008±0.002 0.003±0.001 0.009±0.006 0.007 - Ni (mg/m3) 0.004±0.002 0.009±0.004 0.86±0.34 0.291 - Benzo (a) pyrene ng/m3
- - 1.63×10² 54.30 <0.1-100 ng/m3 (WHO, 1997)
Indeno (1, 2, 3, -cd) pyrene ng/m3
1.53-103 2.53×10³ - 0.0014 <0.1-100 ng/m3 (WHO, 1997)
TPAH* (ng/m3) 1.53-103 2.53×10³ 1.63×10² 54.30 <0.1-100 ng/m3 (WHO, 1997)
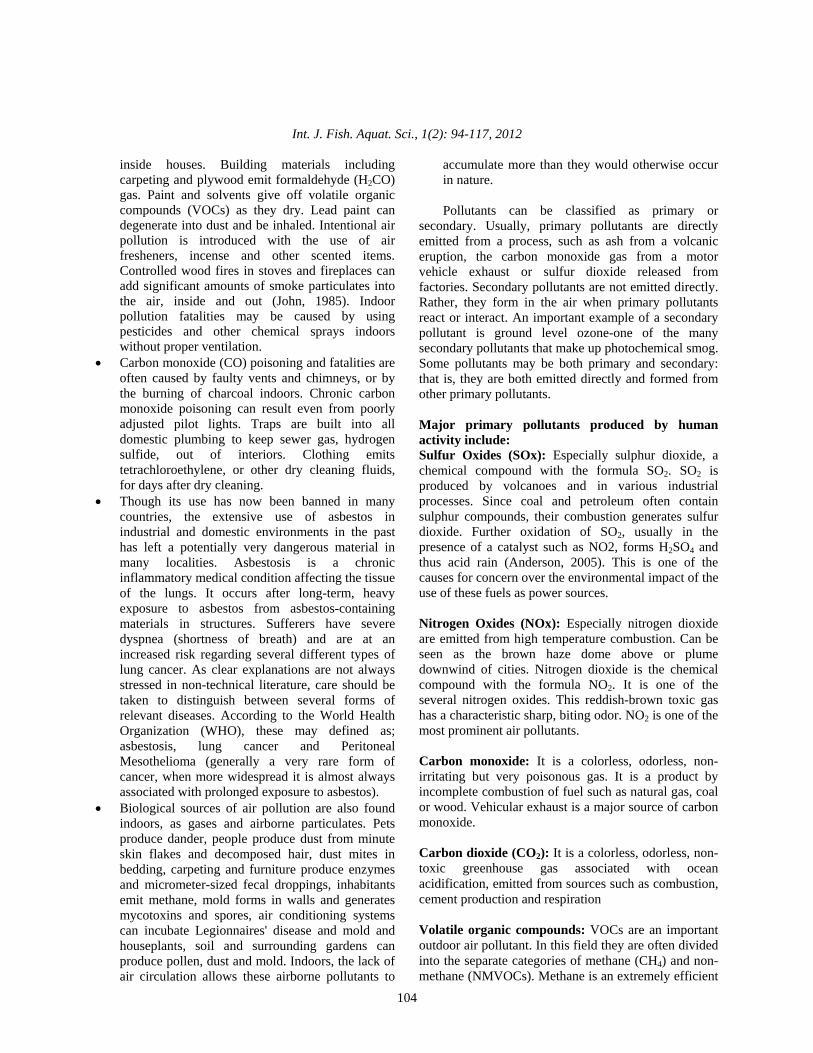
Total PAH (sum of benzo (a) pyrene + indeno (123-cd) pyrene level (130.3 µg/m3) was recorded while at the petrochemical complex the highest PM10 level (81.3 µg/m3) was recorded. The study indicated that the average PM10 levels at PHRC were higher than that recorded at EPCL. In terms of the level of heavy metals, the highest Pb and Ni levels of 0.20 mg/m3 and 0.86 mg/m3, respectively was recorded at the PHRC. At the petrochemical complex, the highest Pb and Ni levels of 0.16 mg/m3 and 0.05 mg/m3, respectively was recorded at EPCL. Overall, the average heavy metal concentrations were higher at PHRC. The highest oncentration of benzo (a) pyrene (1.63x10² ng/m3) was recorded at PHRC compared to (1.61x10² ng/m3) that was recorded at EPCL. However, the total PAH concentration taken as the sum of benzo (a) pyrene and indeno (123) -cd pyrene was found to be higher at EPCL when compared with PHRC (Table 4). Gas flaring: According to Cedigaz (2000), Nigeria holds the highest record (19.79%) of natural gas flaring globally and is responsible for about 46% of Africa’s total gas flared per tonne of oil produced (Plate 7). Until present there are not less than 123 flaring sites in the region making Nigeria one of the highest emitter of green house gases in Africa (Uyigue and Agho, 2007). Similarly, analytical assessment of the statistical bulletin of the Central Bank of Nigeria (2004) showed that the average rate of gas flaring in Nigeria during the period 1970-1979 stood at 97%, while 97 and 95% were flared between 1980, 1989 and 1990 to 1999, respectively. Between 2000 and 2004, 51% was flared. In the same vein, between 1970 and 2004 Nigeria has flared an average of 76% of the total gas produced.
Much of the natural gas extracted in oil wells in the Niger Delta is immediately flared into the environment at a rate that approximates 70 million/m3/day. This is equivalent to 40% of African natural gas consumption and forms the single largest source of greenhouse gas emissions on the planet (Wikipedia, 2007; Moffat and Linden, 1995). Orubu (2002), who undertook a comparison of concentrations of ambient air pollutants in the region and Lagos State concludes that pollutant
Plate 7: Gas flaring from an oil exploration process
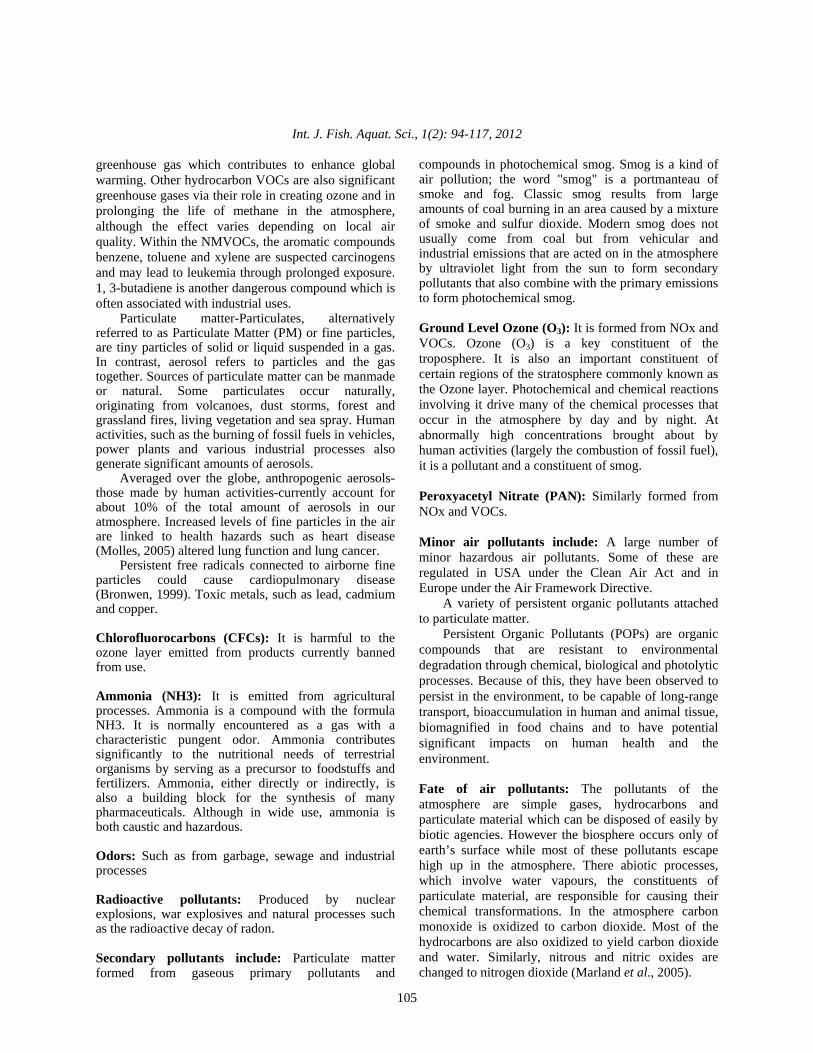
Plate 8: Emissions from fire outbreak following pipeline
explosion concentrations are highest in the Niger Delta and argues that some of the green house gases (such as methane and carbon dioxide) emitted at flare sites contribute to global warming. The largest proportion of these flare sites are located in the Niger Delta. Pipeline explosion: The explosion of pipelines occurs either accidentally or by sabotage (Plate 8). In the Niger Delta area much of the pipeline explosions are a product of the later and they are usually accompanied most times with fire outbreak. The burning flame and smoke from the oil pipelines releases large concentrations of gaseous substances and particulate matter. The substances in most cases include COx, NOx VOCs, THCs, carbon black, soot and some heavy metal residues.

Int. J. Fish. Aquat. Sci., 1(2): 94-117, 2012
103
Table 5: Levels of air quality parameters in two Niger delta communities Air quality at Eleme and Ahoada east ---------------------------------------------------------------------------------------------------------------------------------------------------------------------------------------------------
Sample parameter Eleme Mean±S.D. Range
Ahoada east Mean±S.D. Range National guideline limits t-statistic p-value
TSP (mg/m3) 123.4±14.9 37.2-260.6 53.5±26.3 8.84-161.4 100 (mg/m3) -6.118 0.0001** Fe (mg/m3) 0.09±0.06 0.09-0.10 0.027±0.006 0.01-0.05 None -2.764 0.0171* Zn (mg/m3) 0.05±0.03 0.02-0.10 0.05±0.02 0.03-0.42 -do- 0.000 1.0000 Pb (mg/m3) 0.06±0.03 0.03-0.10 0.14±0.03 0.03-0.13 -do- 4.939 0.0003** Cd (mg/m3) 0.009±0.01 0.002-0.02 0.006±0.003 0.004-0.01 -do- -0.760 0.4618 Ni (mg/m3) 0.03±0.02 0.02-0.05 0.03±0.02 0.01-0.05 -do- 0.000 1.0000 PAH (ng/m3) 7.99×10³ 3.48×10⁻¹ 1.21×10⁻³ 2.50×10⁻⁵ <0.1- 7.62×10⁶ 0.000**
±1.31×10⁴ 1.88×10⁴ ±2.77×10 -3 7.49×10⁻² 100 ng/m3 (1.91×10²) (6.43×10⁻⁶)
*: Significant; **: Highly significant values in brackets represent median values for PAH in the various locations Multiple air pollution sources: Within the Niger delta communities there are diverse sources of air pollution. The common air pollution sources are biomass combustion, bush burning, automobile emissions, generator emissions, pipeline explosions, industrial emissions and gas flaring. The measurement of air quality for some specific priority pollutants viz ammonia, particulate matter and Polycyclic aromatic hydrocarbons at specific locations within the communities has been carried out using standard procedures (Ana et al., 2010, 2009). The mean values of the parameters are presented in Table 5. Meteorological conditions in the Niger delta: The Niger Delta has a humid, semi-hot equatorial climate. Temperature ranges are small and constant throughout the year. It’s hottest month records 28°C (82.4 F) and its coolest month 26°C (78.8°F) with the temperature range of not more than 2ºC (5°F). Precipitation is heavy, between 1824 mm to over 4000 mm along the coast. Rain falls throughout the year with a short break in August and a longer break from December to January. The heavy rainfall experienced in the area leads to floods in urban areas and communities along the rivers. Also due to the heavy and frequent rainfalls, soils consisting mainly of silt and clay become saturated, reducing infiltration to the barest minimum and encouraging run-off. Rainfall induced run-off is directed mainly to the back swamps in the upper and middle parts of the delta. In the coastal zone, there is an even smaller topographic gradient that makes run-off difficult. Natural sources: • Dust from natural sources, usually large areas of
land with little or no vegetation • Methane, emitted by the digestion of food by
animals, for example cattle • Radon gas from radioactive decay within the
Earth's crust. Radon is a colorless, odorless, naturally occurring, radioactive noble gas that is formed from the decay of radium. It is considered to be a health hazard. Radon gas from natural
• sources can accumulate in buildings, especially in confined areas such as the basement and it is the second most frequent cause of lung cancer, after cigarette smoking
• Smoke and carbon monoxide from wildfires • Vegetation, in some regions, emits environmentally
significant amounts of VOCs on warmer days. These VOCs react with primary anthropogenic pollutants-specifically, NOx, SO2 and anthropogenic organic carbon compounds-to produce a seasonal haze of secondary pollutants (Janice, 2002)
• Volcanic activity, which produce sulfur, chlorine and ash particulates
Emission factors: Air pollutant emission factors are representative values that people attempt to relate the quantity of a pollutant released to the ambient air with an activity associated with the release of that pollutant. These factors are usually expressed as the weight of pollutant divided by a unit weight, volume, distance, or duration of the activity emitting the pollutant (e.g., kilograms of particulate emitted per mega gram of coal burned). Such factors facilitate estimation of emissions from various sources of air pollution. In most cases, these factors are simply averages of all available data of acceptable quality and are generally assumed to be representative of long-term averages.
The United States Environmental Protection Agency has published a compilation of air pollutant emission factors for a multitude of industrial sources (Fuggile, 2004) The United Kingdom, Australia, Canada and many other countries have published similar compilations, as well as the European Environment Agency (Janice, 2002). Indoor Air Quality (IAQ): • A lack of ventilation indoors concentrates air
pollution where people often spend the majority of their time. Radon (Rn) gas, a carcinogen, is exuded from the Earth in certain locations and trapped
Int. J. Fish. Aquat. Sci., 1(2): 94-117, 2012
104
inside houses. Building materials including carpeting and plywood emit formaldehyde (H2CO) gas. Paint and solvents give off volatile organic compounds (VOCs) as they dry. Lead paint can degenerate into dust and be inhaled. Intentional air pollution is introduced with the use of air fresheners, incense and other scented items. Controlled wood fires in stoves and fireplaces can add significant amounts of smoke particulates into the air, inside and out (John, 1985). Indoor pollution fatalities may be caused by using pesticides and other chemical sprays indoors without proper ventilation.
• Carbon monoxide (CO) poisoning and fatalities are often caused by faulty vents and chimneys, or by the burning of charcoal indoors. Chronic carbon monoxide poisoning can result even from poorly adjusted pilot lights. Traps are built into all domestic plumbing to keep sewer gas, hydrogen sulfide, out of interiors. Clothing emits tetrachloroethylene, or other dry cleaning fluids, for days after dry cleaning.
• Though its use has now been banned in many countries, the extensive use of asbestos in industrial and domestic environments in the past has left a potentially very dangerous material in many localities. Asbestosis is a chronic inflammatory medical condition affecting the tissue of the lungs. It occurs after long-term, heavy exposure to asbestos from asbestos-containing materials in structures. Sufferers have severe dyspnea (shortness of breath) and are at an increased risk regarding several different types of lung cancer. As clear explanations are not always stressed in non-technical literature, care should be taken to distinguish between several forms of relevant diseases. According to the World Health Organization (WHO), these may defined as; asbestosis, lung cancer and Peritoneal Mesothelioma (generally a very rare form of cancer, when more widespread it is almost always associated with prolonged exposure to asbestos).
• Biological sources of air pollution are also found indoors, as gases and airborne particulates. Pets produce dander, people produce dust from minute skin flakes and decomposed hair, dust mites in bedding, carpeting and furniture produce enzymes and micrometer-sized fecal droppings, inhabitants emit methane, mold forms in walls and generates mycotoxins and spores, air conditioning systems can incubate Legionnaires' disease and mold and houseplants, soil and surrounding gardens can produce pollen, dust and mold. Indoors, the lack of air circulation allows these airborne pollutants to
accumulate more than they would otherwise occur in nature. Pollutants can be classified as primary or
secondary. Usually, primary pollutants are directly emitted from a process, such as ash from a volcanic eruption, the carbon monoxide gas from a motor vehicle exhaust or sulfur dioxide released from factories. Secondary pollutants are not emitted directly. Rather, they form in the air when primary pollutants react or interact. An important example of a secondary pollutant is ground level ozone-one of the many secondary pollutants that make up photochemical smog. Some pollutants may be both primary and secondary: that is, they are both emitted directly and formed from other primary pollutants. Major primary pollutants produced by human activity include: Sulfur Oxides (SOx): Especially sulphur dioxide, a chemical compound with the formula SO2. SO2 is produced by volcanoes and in various industrial processes. Since coal and petroleum often contain sulphur compounds, their combustion generates sulfur dioxide. Further oxidation of SO2, usually in the presence of a catalyst such as NO2, forms H2SO4 and thus acid rain (Anderson, 2005). This is one of the causes for concern over the environmental impact of the use of these fuels as power sources. Nitrogen Oxides (NOx): Especially nitrogen dioxide are emitted from high temperature combustion. Can be seen as the brown haze dome above or plume downwind of cities. Nitrogen dioxide is the chemical compound with the formula NO2. It is one of the several nitrogen oxides. This reddish-brown toxic gas has a characteristic sharp, biting odor. NO2 is one of the most prominent air pollutants. Carbon monoxide: It is a colorless, odorless, non-irritating but very poisonous gas. It is a product by incomplete combustion of fuel such as natural gas, coal or wood. Vehicular exhaust is a major source of carbon monoxide. Carbon dioxide (CO2): It is a colorless, odorless, non-toxic greenhouse gas associated with ocean acidification, emitted from sources such as combustion, cement production and respiration Volatile organic compounds: VOCs are an important outdoor air pollutant. In this field they are often divided into the separate categories of methane (CH4) and non-methane (NMVOCs). Methane is an extremely efficient
Int. J. Fish. Aquat. Sci., 1(2): 94-117, 2012
105
greenhouse gas which contributes to enhance global warming. Other hydrocarbon VOCs are also significant greenhouse gases via their role in creating ozone and in prolonging the life of methane in the atmosphere, although the effect varies depending on local air quality. Within the NMVOCs, the aromatic compounds benzene, toluene and xylene are suspected carcinogens and may lead to leukemia through prolonged exposure. 1, 3-butadiene is another dangerous compound which is often associated with industrial uses.
Particulate matter-Particulates, alternatively referred to as Particulate Matter (PM) or fine particles, are tiny particles of solid or liquid suspended in a gas. In contrast, aerosol refers to particles and the gas together. Sources of particulate matter can be manmade or natural. Some particulates occur naturally, originating from volcanoes, dust storms, forest and grassland fires, living vegetation and sea spray. Human activities, such as the burning of fossil fuels in vehicles, power plants and various industrial processes also generate significant amounts of aerosols.
Averaged over the globe, anthropogenic aerosols-those made by human activities-currently account for about 10% of the total amount of aerosols in our atmosphere. Increased levels of fine particles in the air are linked to health hazards such as heart disease (Molles, 2005) altered lung function and lung cancer.
Persistent free radicals connected to airborne fine particles could cause cardiopulmonary disease (Bronwen, 1999). Toxic metals, such as lead, cadmium and copper.
Chlorofluorocarbons (CFCs): It is harmful to the ozone layer emitted from products currently banned from use.
Ammonia (NH3): It is emitted from agricultural processes. Ammonia is a compound with the formula NH3. It is normally encountered as a gas with a characteristic pungent odor. Ammonia contributes significantly to the nutritional needs of terrestrial organisms by serving as a precursor to foodstuffs and fertilizers. Ammonia, either directly or indirectly, is also a building block for the synthesis of many pharmaceuticals. Although in wide use, ammonia is both caustic and hazardous. Odors: Such as from garbage, sewage and industrial processes Radioactive pollutants: Produced by nuclear explosions, war explosives and natural processes such as the radioactive decay of radon. Secondary pollutants include: Particulate matter formed from gaseous primary pollutants and
compounds in photochemical smog. Smog is a kind of air pollution; the word "smog" is a portmanteau of smoke and fog. Classic smog results from large amounts of coal burning in an area caused by a mixture of smoke and sulfur dioxide. Modern smog does not usually come from coal but from vehicular and industrial emissions that are acted on in the atmosphere by ultraviolet light from the sun to form secondary pollutants that also combine with the primary emissions to form photochemical smog. Ground Level Ozone (O3): It is formed from NOx and VOCs. Ozone (O3) is a key constituent of the troposphere. It is also an important constituent of certain regions of the stratosphere commonly known as the Ozone layer. Photochemical and chemical reactions involving it drive many of the chemical processes that occur in the atmosphere by day and by night. At abnormally high concentrations brought about by human activities (largely the combustion of fossil fuel), it is a pollutant and a constituent of smog. Peroxyacetyl Nitrate (PAN): Similarly formed from NOx and VOCs. Minor air pollutants include: A large number of minor hazardous air pollutants. Some of these are regulated in USA under the Clean Air Act and in Europe under the Air Framework Directive.
A variety of persistent organic pollutants attached to particulate matter.
Persistent Organic Pollutants (POPs) are organic compounds that are resistant to environmental degradation through chemical, biological and photolytic processes. Because of this, they have been observed to persist in the environment, to be capable of long-range transport, bioaccumulation in human and animal tissue, biomagnified in food chains and to have potential significant impacts on human health and the environment. Fate of air pollutants: The pollutants of the atmosphere are simple gases, hydrocarbons and particulate material which can be disposed of easily by biotic agencies. However the biosphere occurs only of earth’s surface while most of these pollutants escape high up in the atmosphere. There abiotic processes, which involve water vapours, the constituents of particulate material, are responsible for causing their chemical transformations. In the atmosphere carbon monoxide is oxidized to carbon dioxide. Most of the hydrocarbons are also oxidized to yield carbon dioxide and water. Similarly, nitrous and nitric oxides are changed to nitrogen dioxide (Marland et al., 2005).
Int. J. Fish. Aquat. Sci., 1(2): 94-117, 2012
106
These oxides dissolve in minute droplets of water or fine film of water on aerosol surface to yield the corresponding acids. If ammonia is present in the atmosphere, it also dissolved in water to form ammonium hydroxide. A variety of chemical reactions occur on aerosol surface in the atmosphere between these reactants. Aerosoles containing other constituents such as chlorides, carbonates and other salts also take part in the atmospheric reactions (Fuggle, 2004). Depending on the quantities of various constituents present in the atmosphere and the extent of the atmospheric reactions, aerosols bearing various acids such as carbonic, nitric and sulphuric acids and their salts such as carbonates, nitrates and sulphates are formed. These are brought down in bulk as rains, dews or snow. Gases present in amounts larger than those needed to saturate the carrying medium (Water) are left in the atmosphere (Milton, 2005).
From the release of large concentration of oxides of nitrogen and sulphur in the Niger delta environment it is glaring that some cases of acidified rain occur in the region. Although literature is deplete in this area it is obvious that such phenomenon is experienced. Olobaniyi and Efe (2007) also show elevated levels of lead (0.56 mg/L) and low pH values ranging from 5.10-6.35 in rain water collected in Warri and environs. Akpoborie et al. (2000) also report low pH values from water obtained from shallow hand dug wells in Ughelli, Warri and Okurekpo all in Delta State. Most combustion processes lead to the release of oxides of nitrogen and lower fractions of hydrocarbons and in the presence of uv radiation the resultant smog could lead to decrease in visibility. Although not readily reported this is a common phenomenon in a region like the Niger delta that has large hydrocarbon deposits and various episodes of combustion processes.
Some 45.8 billion kw of heat are discharged into the atmosphere of the Niger-Delta from 1.8 billion ft3 of gas everyday (Aaron, 2006). Ogbuigwe (1998), reports that temperatures produced at flare sites could be as high as 1,600°C. Temperature as high as 400°C at an average distance of 43.8 m from flare sites in Isoko, Delta State have been recorded. Studies by Alakpodia (1989, 1995) showed that flares have negative effects on vegetation growth, animal life and ecological equilibrium in the Niger Delta area. Heat Production kills vegetation around the heat area. It suppresses the growth of flowering plants and reduces agricultural productivity and wild life biodiversity.
The presence of acidified rain water in the environment increases the corrosion rate of roofing sheets, monuments and other economic structures. In the Niger delta area there is glaring evidence of the impacts of corrosion on several building structures and
arts work and these cases have been observed to deteriorate at rather alarming rates. Awosika and Foluronsho (2006) documented projected impacts of sea level rise SLR on the Nigerian coastal area and resources to include: large scale inundation, increased coastal erosion, salt water intrusion into coastal aquifers, habitat modification with direct effects on wild life distribution, increased frequency of high intensity rainfall events and associated increased run off, elevated erosion rates, flash floods and increased frequency of ocean storm surges. Other models projected a loss of up to 15,000 km2 by the year 2100 as a result of a 1 m (SLR) while Magbagbeola (2002) projects flooding of over 18,000 km2 land areas within the delta in an SLR of 1m in the next 100 years.
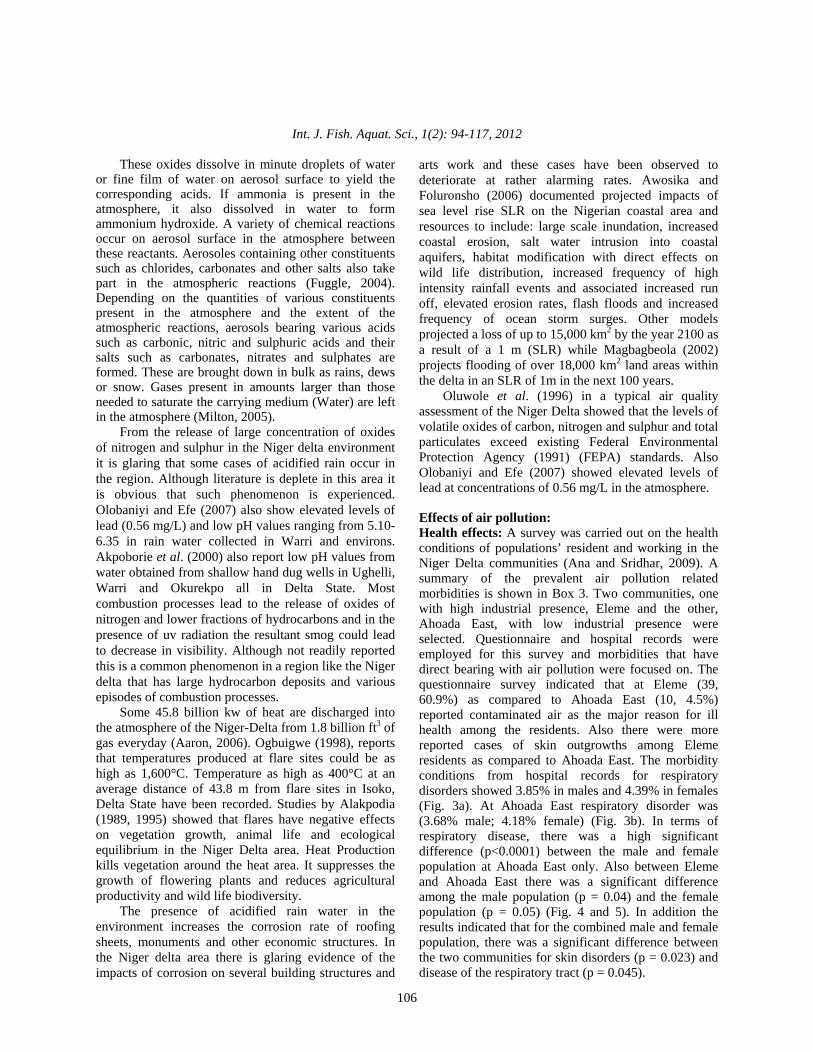
Oluwole et al. (1996) in a typical air quality assessment of the Niger Delta showed that the levels of volatile oxides of carbon, nitrogen and sulphur and total particulates exceed existing Federal Environmental Protection Agency (1991) (FEPA) standards. Also Olobaniyi and Efe (2007) showed elevated levels of lead at concentrations of 0.56 mg/L in the atmosphere. Effects of air pollution: Health effects: A survey was carried out on the health conditions of populations’ resident and working in the Niger Delta communities (Ana and Sridhar, 2009). A summary of the prevalent air pollution related morbidities is shown in Box 3. Two communities, one with high industrial presence, Eleme and the other, Ahoada East, with low industrial presence were selected. Questionnaire and hospital records were employed for this survey and morbidities that have direct bearing with air pollution were focused on. The questionnaire survey indicated that at Eleme (39, 60.9%) as compared to Ahoada East (10, 4.5%) reported contaminated air as the major reason for ill health among the residents. Also there were more reported cases of skin outgrowths among Eleme residents as compared to Ahoada East. The morbidity conditions from hospital records for respiratory disorders showed 3.85% in males and 4.39% in females (Fig. 3a). At Ahoada East respiratory disorder was (3.68% male; 4.18% female) (Fig. 3b). In terms of respiratory disease, there was a high significant difference (p<0.0001) between the male and female population at Ahoada East only. Also between Eleme and Ahoada East there was a significant difference among the male population (p = 0.04) and the female population (p = 0.05) (Fig. 4 and 5). In addition the results indicated that for the combined male and female population, there was a significant difference between the two communities for skin disorders (p = 0.023) and disease of the respiratory tract (p = 0.045).
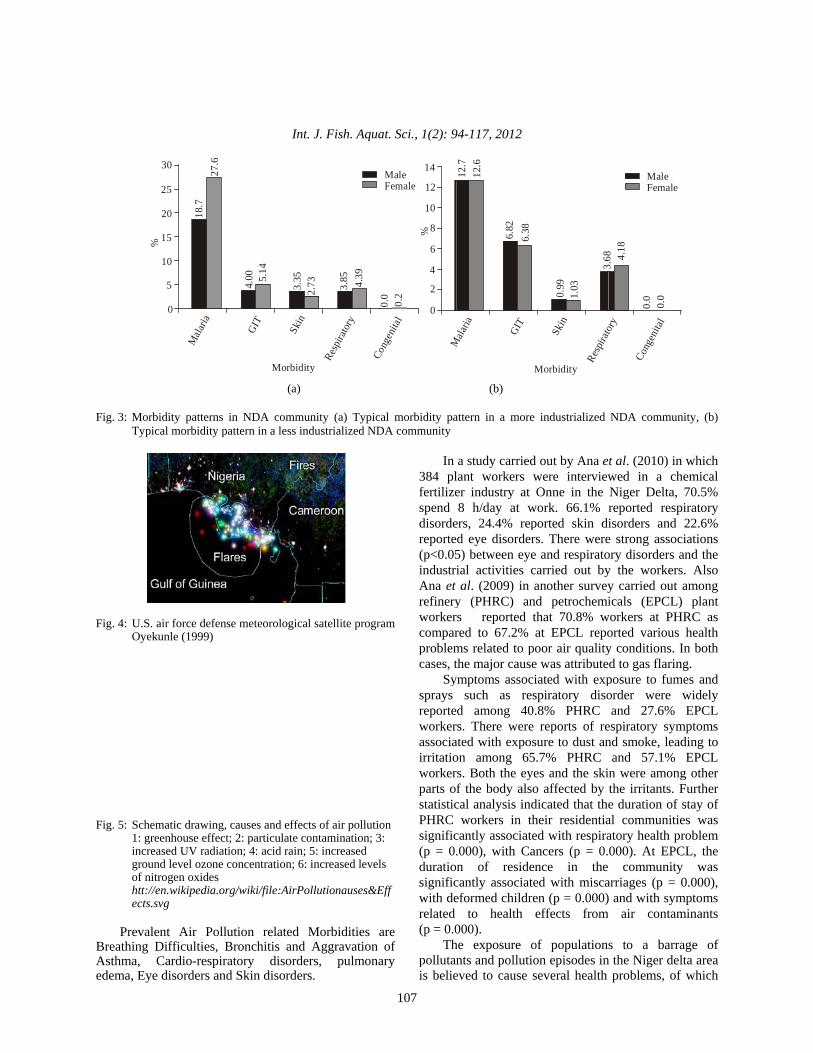
Fig. 3: Mor
Typi
Fig. 4: U.S.
Oyek
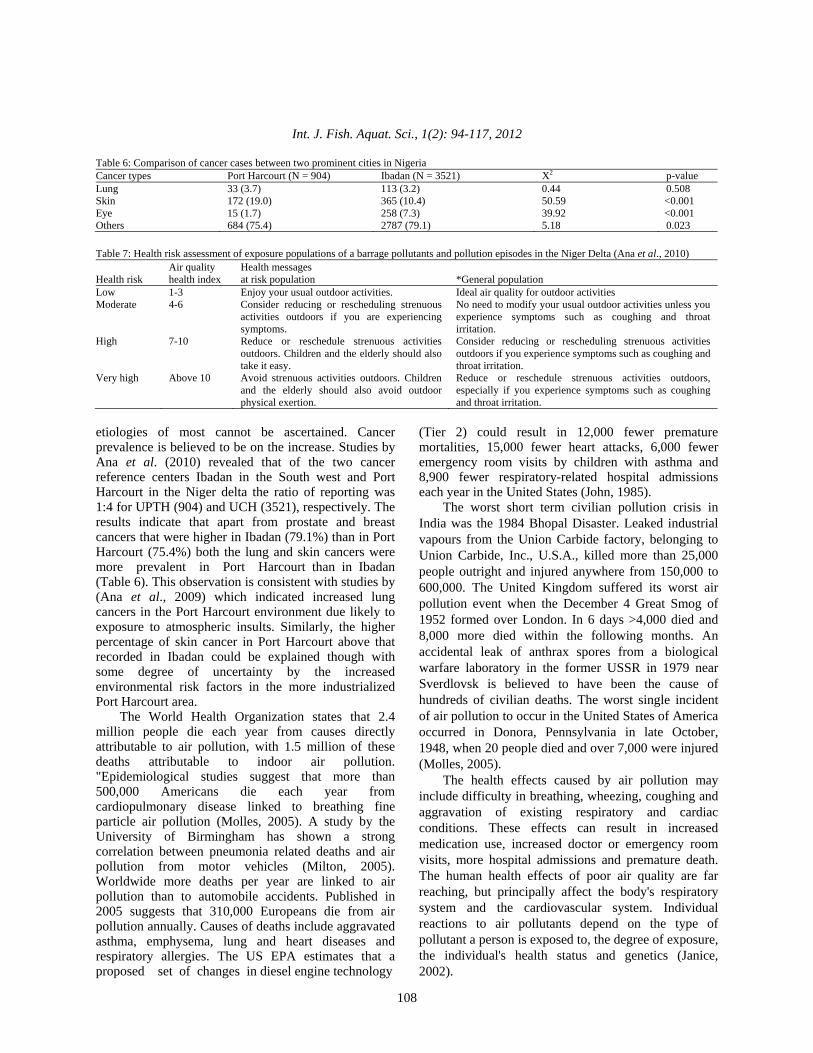
Fig. 5: Sche
1: grincregrouof nihtt://ects.
Preval
Breathing Asthma, edema, Ey
%
rbidity patterns ical morbidity pa
. air force defenskunle (1999)
ematic drawing, reenhouse effecteased UV radiatiund level ozone citrogen oxides //en.wikipedia.orsvg
lent Air PolluDifficulties, BCardio-respira
e disorders and
0
5
10
15
20
25
30
Mala
ria
%
18.7
27.6
Int
(a)
in NDA commuattern in a less in
se meteorologica
causes and effect; 2: particulate cion; 4: acid rain;concentration; 6
rg/wiki/file:AirP
ution related Bronchitis andatory disorded Skin disorder
GIT
Skin
Morbidi
4.00 5.
14
3.35
t. J. Fish. Aqua
unity (a) Typicndustrialized ND
al satellite progr
cts of air pollutiocontamination; 3; 5: increased : increased level
ollutionauses&E
Morbidities ad Aggravation ers, pulmonars.
n
ity
Resp
irato
ry
Co
2.73 4.
393.
85
at. Sci., 1(2): 9
107
al morbidity paDA community
ram
on 3:
ls
Eff
are of
ary
In 384 plfertilizespend disordereporte(p<0.05industrAna et refineryworkercomparproblemcases, t
Sysprays reporteworkerassociairritatioworkerparts ostatisticPHRC signific(p = 0.duratiosignificwith derelated(p = 0.0
Thpollutanis belie
Cong
enita
l
Male Female
0.0
0.2
M
%
0
2
4
6
8
10
12
14
94-117, 2012
(b)
attern in a more
a study carriedlant workers er industry at 8 h/day at w
ers, 24.4% reped eye disorder5) between eyeial activities cal. (2009) in
y (PHRC) anrs reportedred to 67.2% ms related to pthe major cause
ymptoms assocsuch as re
ed among 40rs. There wereated with exposon among 65rs. Both the eyf the body alscal analysis ind
workers in thcantly associate.000), with Can of reside
cantly associateformed childr to health
000). he exposure onts and pollutieved to cause
Mala
ria
GIT
12.7
12.6
6.82
6.38
e industrialized
d out by Ana ewere interviewOnne in the
work. 66.1% ported skin dirs. There weree and respiratocarried out byanother survey
nd petrochemithat 70.8% wat EPCL repo
poor air qualitye was attribute
ciated with expspiratory diso
0.8% PHRC e reports of resure to dust an5.7% PHRC yes and the skio affected by dicated that theheir residentiaed with respiraancers (p = 0.ence in the ted with miscaren (p = 0.000)
effects from
of populationion episodes inseveral health
Skin
Morbidity
Resp
irato
0.99
1.03
368
NDA communi
t al. (2010) in wed in a cheNiger Delta, 7reported respiisorders and 2e strong associory disorders ay the workers.y carried out aicals (EPCL)
workers at PHRorted various y conditions. Ind to gas flaringposure to fumeorder were wand 27.6%
espiratory symnd smoke, lead
and 57.1% in were amongthe irritants. Fe duration of sal communitieatory health pr000). At EPC
community arriages (p = 0) and with sym
m air contam
s to a barran the Niger delt
problems, of
atory
Cong
enita
l
Male Female
4.18
3.68
0.0
0.0
ity, (b)
which emical 70.5% iratory 22.6% iations
and the . Also among
plant RC as health n both g. es and widely EPCL
mptoms ding to EPCL
g other Further stay of es was roblem
CL, the was
0.000), mptoms minants
age of ta area which
Int. J. Fish. Aquat. Sci., 1(2): 94-117, 2012
108
Table 6: Comparison of cancer cases between two prominent cities in Nigeria Cancer types Port Harcourt (N = 904) Ibadan (N = 3521) X2 p-value Lung 33 (3.7) 113 (3.2) 0.44 0.508 Skin 172 (19.0) 365 (10.4) 50.59 <0.001 Eye 15 (1.7) 258 (7.3) 39.92 <0.001 Others 684 (75.4) 2787 (79.1) 5.18 0.023 Table 7: Health risk assessment of exposure populations of a barrage pollutants and pollution episodes in the Niger Delta (Ana et al., 2010)
Air quality health index
Health messages at risk population
Health risk *General population Low 1-3 Enjoy your usual outdoor activities. Ideal air quality for outdoor activities Moderate 4-6 Consider reducing or rescheduling strenuous
activities outdoors if you are experiencing symptoms.
No need to modify your usual outdoor activities unless you experience symptoms such as coughing and throat irritation.
High 7-10 Reduce or reschedule strenuous activities outdoors. Children and the elderly should also take it easy.
Consider reducing or rescheduling strenuous activities outdoors if you experience symptoms such as coughing and throat irritation.
Very high Above 10 Avoid strenuous activities outdoors. Children and the elderly should also avoid outdoor physical exertion.
Reduce or reschedule strenuous activities outdoors, especially if you experience symptoms such as coughing and throat irritation.
etiologies of most cannot be ascertained. Cancer prevalence is believed to be on the increase. Studies by Ana et al. (2010) revealed that of the two cancer reference centers Ibadan in the South west and Port Harcourt in the Niger delta the ratio of reporting was 1:4 for UPTH (904) and UCH (3521), respectively. The results indicate that apart from prostate and breast cancers that were higher in Ibadan (79.1%) than in Port Harcourt (75.4%) both the lung and skin cancers were more prevalent in Port Harcourt than in Ibadan (Table 6). This observation is consistent with studies by (Ana et al., 2009) which indicated increased lung cancers in the Port Harcourt environment due likely to exposure to atmospheric insults. Similarly, the higher percentage of skin cancer in Port Harcourt above that recorded in Ibadan could be explained though with some degree of uncertainty by the increased environmental risk factors in the more industrialized Port Harcourt area.
The World Health Organization states that 2.4 million people die each year from causes directly attributable to air pollution, with 1.5 million of these deaths attributable to indoor air pollution. "Epidemiological studies suggest that more than 500,000 Americans die each year from cardiopulmonary disease linked to breathing fine particle air pollution (Molles, 2005). A study by the University of Birmingham has shown a strong correlation between pneumonia related deaths and air pollution from motor vehicles (Milton, 2005). Worldwide more deaths per year are linked to air pollution than to automobile accidents. Published in 2005 suggests that 310,000 Europeans die from air pollution annually. Causes of deaths include aggravated asthma, emphysema, lung and heart diseases and respiratory allergies. The US EPA estimates that a proposed set of changes in diesel engine technology
(Tier 2) could result in 12,000 fewer premature mortalities, 15,000 fewer heart attacks, 6,000 fewer emergency room visits by children with asthma and 8,900 fewer respiratory-related hospital admissions each year in the United States (John, 1985).
The worst short term civilian pollution crisis in India was the 1984 Bhopal Disaster. Leaked industrial vapours from the Union Carbide factory, belonging to Union Carbide, Inc., U.S.A., killed more than 25,000 people outright and injured anywhere from 150,000 to 600,000. The United Kingdom suffered its worst air pollution event when the December 4 Great Smog of 1952 formed over London. In 6 days >4,000 died and 8,000 more died within the following months. An accidental leak of anthrax spores from a biological warfare laboratory in the former USSR in 1979 near Sverdlovsk is believed to have been the cause of hundreds of civilian deaths. The worst single incident of air pollution to occur in the United States of America occurred in Donora, Pennsylvania in late October, 1948, when 20 people died and over 7,000 were injured (Molles, 2005).
The health effects caused by air pollution may include difficulty in breathing, wheezing, coughing and aggravation of existing respiratory and cardiac conditions. These effects can result in increased medication use, increased doctor or emergency room visits, more hospital admissions and premature death. The human health effects of poor air quality are far reaching, but principally affect the body's respiratory system and the cardiovascular system. Individual reactions to air pollutants depend on the type of pollutant a person is exposed to, the degree of exposure, the individual's health status and genetics (Janice, 2002).

Int. J. Fish. Aquat. Sci., 1(2): 94-117, 2012
109
Plate 9: Smoke from giant gas flares hovers above ebocha-egbema. Residents say the flaring is harming their health and environment Oyekunle (1999)
A new economic study of the health impacts and
associated costs of air pollution in the Los Angeles Basin and San Joaquin Valley of Southern California shows that more than 3800 people die prematurely (approximately 14 years earlier than normal) each year because air pollution levels violate federal standards. The number of annual premature deaths is considerably higher than the fatalities related to auto collisions in the same area, which average fewer than 2,000/year (Milton, 2005). Diesel Exhaust (DE) is a major contributor to combustion derived particulate matter air
pollution. In several human experimental studies, using a well validated exposure chamber setup, DE has been linked to acute vascular dysfunction and increased thrombus formation (Marland et al., 2005). This serves as a plausible mechanistic link between the previously described association between particulate matter air pollution and increased cardiovascular morbidity and mortality. Gas Flaring Disrupts Life in Oil-Producing Niger Delta (Plate 9)
Gas flares in the Delta region can be viewed using Google Earth (Plate 10). Nurse Anthonia Chioma Ige is the senior nursing officer at Ebocha-Egbema's General Hospital. She is furious about gas flaring. Chief Eze Kingsley Okene shows the stump of what was once a coconut tree. He blames gas flaring for the tree's early death.
Color composite of the nighttime lights of the Nigeria region from data acquired by the U.S. Air Force Defense Meteorological Satellite Program (Fig. 4). Data from 1995 is blue, 2000 is green and 2006 is red. The vector polygon drawn around the gas flares associated with Nigeria are shown in white.
Color composite of the nighttime lights of the Nigeria region from data acquired by the U.S. Air Force Defense Meteorological Satellite Program. Data from 1995 is blue, 2000 is green and 2006 is red. The vector polygon drawn around the gas flares associated with Nigeria are shown in white.
Every year, millions of dollars are literally going up in smoke in Nigeria, Africa's top crude oil-exporting nation, as companies’ burn off unwanted natural gas released during oil production. This flaring and venting produces more greenhouse-gas emissions than any other single source in Africa south of the Sahara and many who live in Nigeria's oil-producing communities
Plate 10: Image from google earth Oyekunle (1999)

Int. J. Fish. Aquat. Sci., 1(2): 94-117, 2012
110
complain of chronic health and environmental problems associated with the gas flares. Black Clouds over Ebocha Much of the region where oil is pumped is a maze of winding mangrove creeks and waterways. Leafy, green and humid, Ebocha-Egbema is an unremarkable collection of small villages with tin-roof houses and shops, located in the heart of the Rivers State in Nigeria's turbulent oil-producing Niger Delta.
Huge flames billow in the air over Ebocha and above them, black clouds leap into the sky. The giant gas flares operated by Agip-Nigeria belch out noxious fumes that loom over homes, farms and shops. There's a strange smell and an audible hiss in the air. Residents of the Niger Delta region, where Ebocha is located, say gas flaring is ruining lives and livelihoods. Chief Eze Kingsley Okene, a local traditional leader and retired chemist, says Nigeria isn't doing enough to curb the practice.
"Yes, we are living with death, because of the oil company," Chief Okene says. While many villagers may not be familiar with the concept of climate change, they complain that the air around them is hotter and foul-smelling because of the gas flares. Chief Okene's wife, Roseline organizes protests against gas flaring, which she says produce poisons that kill crops and make villagers sick. "If you put water in a basin, you see that the water will change to charcoal-black and slippery," Roseline says. "You cannot wash it out without soap. ... So if human being drinks such water, it will affect a human being."
In the areas close to the gas flares, medical staff report treating patients with all sorts of illnesses that they believe are related to the flames: bronchial, chest, rheumatic and eye problems, among others. Some are referred to Ebocha-Egbema's General Hospital, which is being completely refurbished. The hospital's senior nursing officer, Anthonia Chioma Ike, is from another part of Nigeria, but after eight years of living and working in the vicinity of the gas flares, she's furious about what's going on.
"I don't feel fine. I feel afraid. I feel that something might happen one day that will cause a disaster in the community ... Like fire. Like people around that area always come here complaining that they are having internal heat. ... And they say they don't sleep because of the noise of that place," Chioma says. "From here, you'll be hearing the noise ... As if something is falling from up, from height. They say every time it seems the house and everything will explode." Effects on cystic fibrosis: A study from around the years of 1999 to 2000, by the University of Washington, showed that patients near and around particulate matter air pollution had an increased risk of
pulmonary exacerbations and decrease in lung function. Patients were examined before the study for amounts of specific pollutants like Pseudomonas aeruginosa or Burkholderia cenocepacia as well as their socioeconomic standing. Participants involved in the study were located in the United States in close proximity to an Environmental Protection Agency (Anderson, 2005). During the time of the study 117 deaths were associated with air pollution. Many patients in the study lived in or near large metropolitan areas in order to be close to medical help. These same patients had higher level of pollutants found in their system because of more emissions in larger cities. As cystic fibrosis patients already suffer from decreased lung function, everyday pollutants such as smoke, emissions from automobiles, tobacco smoke and improper use of indoor heating devices could further compromise lung function (Baird, 2010)
Effects on Chronic Obstructive Pulmonary Disease (COPD) Chronic Obstructive Pulmonary Disease (COPD) includes diseases such as chronic bronchitis, emphysema and some forms of asthma (Bronwen 1999). A study conducted in 1960-1961 in the wake of the Great Smog of 1952 compared 293 London residents with 477 residents of Gloucester, Peterborough and Norwich, three towns with low reported death rates from chronic bronchitis. All subjects were male postal truck drivers aged 40 to 59. Compared to the subjects from the outlying towns, the London subjects exhibited more severe respiratory symptoms (including cough, phlegm and dyspnea), reduced lung function (FEV1 and peak flow rate) and increased sputum production and purulence. The differences were more pronounced for subjects aged 50 to 59. The study controlled for age and smoking habits, so concluded that air pollution was the most likely cause of the observed differences (Anderson, 2005). It is believed that much like cystic fibrosis, by living in a more urban environment serious health hazards become more apparent. Studies have shown that in urban areas patients suffer mucus hypersecretion, lower levels of lung function and more self diagnosis of chronic bronchitis and emphysema (Baird, 2010). Effects on children: Cities around the world with high exposure to air pollutants have the possibility of children living within them to develop asthma, pneumonia and other lower respiratory infections as well as a low initial birth rate. Protective measures to ensure the youths' health are being taken in cities such as New Delhi, India where buses now use compressed natural gas to help eliminate the “pea-soup” smog (Fuggle, 2004). Research by the World Health Organization shows there is the greatest concentration
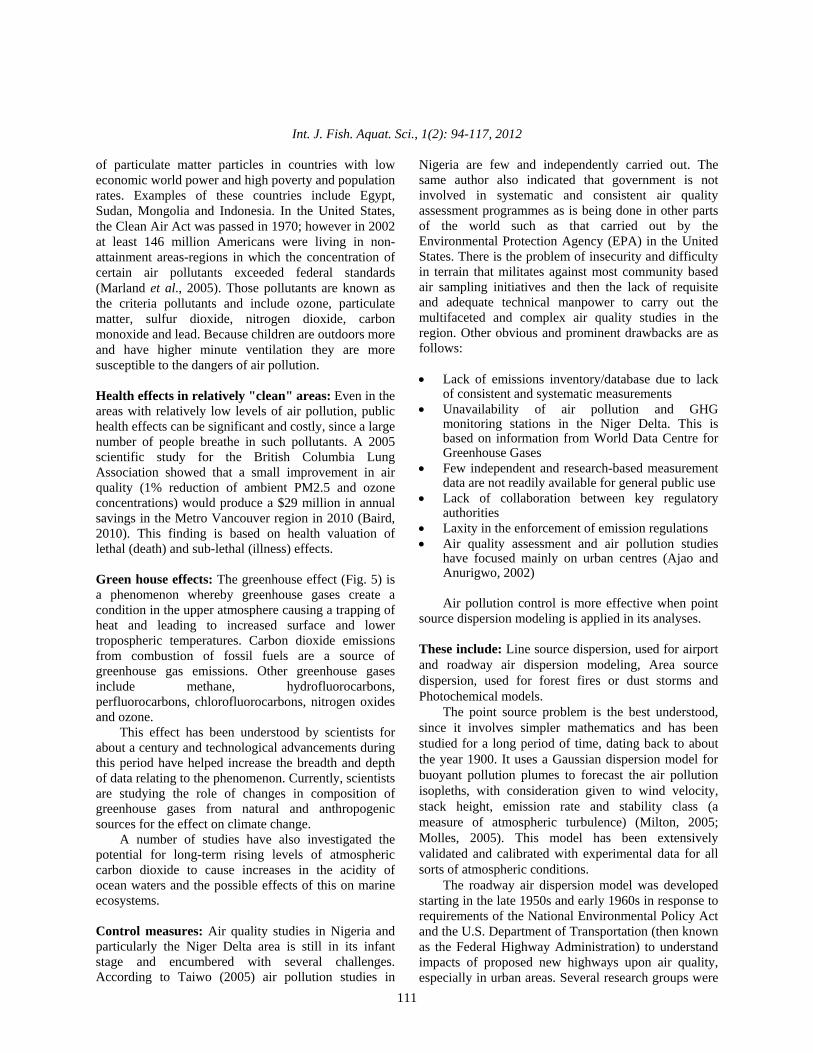
Int. J. Fish. Aquat. Sci., 1(2): 94-117, 2012
111
of particulate matter particles in countries with low economic world power and high poverty and population rates. Examples of these countries include Egypt, Sudan, Mongolia and Indonesia. In the United States, the Clean Air Act was passed in 1970; however in 2002 at least 146 million Americans were living in non-attainment areas-regions in which the concentration of certain air pollutants exceeded federal standards (Marland et al., 2005). Those pollutants are known as the criteria pollutants and include ozone, particulate matter, sulfur dioxide, nitrogen dioxide, carbon monoxide and lead. Because children are outdoors more and have higher minute ventilation they are more susceptible to the dangers of air pollution. Health effects in relatively "clean" areas: Even in the areas with relatively low levels of air pollution, public health effects can be significant and costly, since a large number of people breathe in such pollutants. A 2005 scientific study for the British Columbia Lung Association showed that a small improvement in air quality (1% reduction of ambient PM2.5 and ozone concentrations) would produce a $29 million in annual savings in the Metro Vancouver region in 2010 (Baird, 2010). This finding is based on health valuation of lethal (death) and sub-lethal (illness) effects. Green house effects: The greenhouse effect (Fig. 5) is a phenomenon whereby greenhouse gases create a condition in the upper atmosphere causing a trapping of heat and leading to increased surface and lower tropospheric temperatures. Carbon dioxide emissions from combustion of fossil fuels are a source of greenhouse gas emissions. Other greenhouse gases include methane, hydrofluorocarbons, perfluorocarbons, chlorofluorocarbons, nitrogen oxides and ozone.
This effect has been understood by scientists for about a century and technological advancements during this period have helped increase the breadth and depth of data relating to the phenomenon. Currently, scientists are studying the role of changes in composition of greenhouse gases from natural and anthropogenic sources for the effect on climate change.
A number of studies have also investigated the potential for long-term rising levels of atmospheric carbon dioxide to cause increases in the acidity of ocean waters and the possible effects of this on marine ecosystems. Control measures: Air quality studies in Nigeria and particularly the Niger Delta area is still in its infant stage and encumbered with several challenges. According to Taiwo (2005) air pollution studies in
Nigeria are few and independently carried out. The same author also indicated that government is not involved in systematic and consistent air quality assessment programmes as is being done in other parts of the world such as that carried out by the Environmental Protection Agency (EPA) in the United States. There is the problem of insecurity and difficulty in terrain that militates against most community based air sampling initiatives and then the lack of requisite and adequate technical manpower to carry out the multifaceted and complex air quality studies in the region. Other obvious and prominent drawbacks are as follows: • Lack of emissions inventory/database due to lack
of consistent and systematic measurements • Unavailability of air pollution and GHG
monitoring stations in the Niger Delta. This is based on information from World Data Centre for Greenhouse Gases
• Few independent and research-based measurement data are not readily available for general public use
• Lack of collaboration between key regulatory authorities
• Laxity in the enforcement of emission regulations • Air quality assessment and air pollution studies
have focused mainly on urban centres (Ajao and Anurigwo, 2002)
Air pollution control is more effective when point
source dispersion modeling is applied in its analyses.
These include: Line source dispersion, used for airport and roadway air dispersion modeling, Area source dispersion, used for forest fires or dust storms and Photochemical models.
The point source problem is the best understood, since it involves simpler mathematics and has been studied for a long period of time, dating back to about the year 1900. It uses a Gaussian dispersion model for buoyant pollution plumes to forecast the air pollution isopleths, with consideration given to wind velocity, stack height, emission rate and stability class (a measure of atmospheric turbulence) (Milton, 2005; Molles, 2005). This model has been extensively validated and calibrated with experimental data for all sorts of atmospheric conditions.
The roadway air dispersion model was developed starting in the late 1950s and early 1960s in response to requirements of the National Environmental Policy Act and the U.S. Department of Transportation (then known as the Federal Highway Administration) to understand impacts of proposed new highways upon air quality, especially in urban areas. Several research groups were
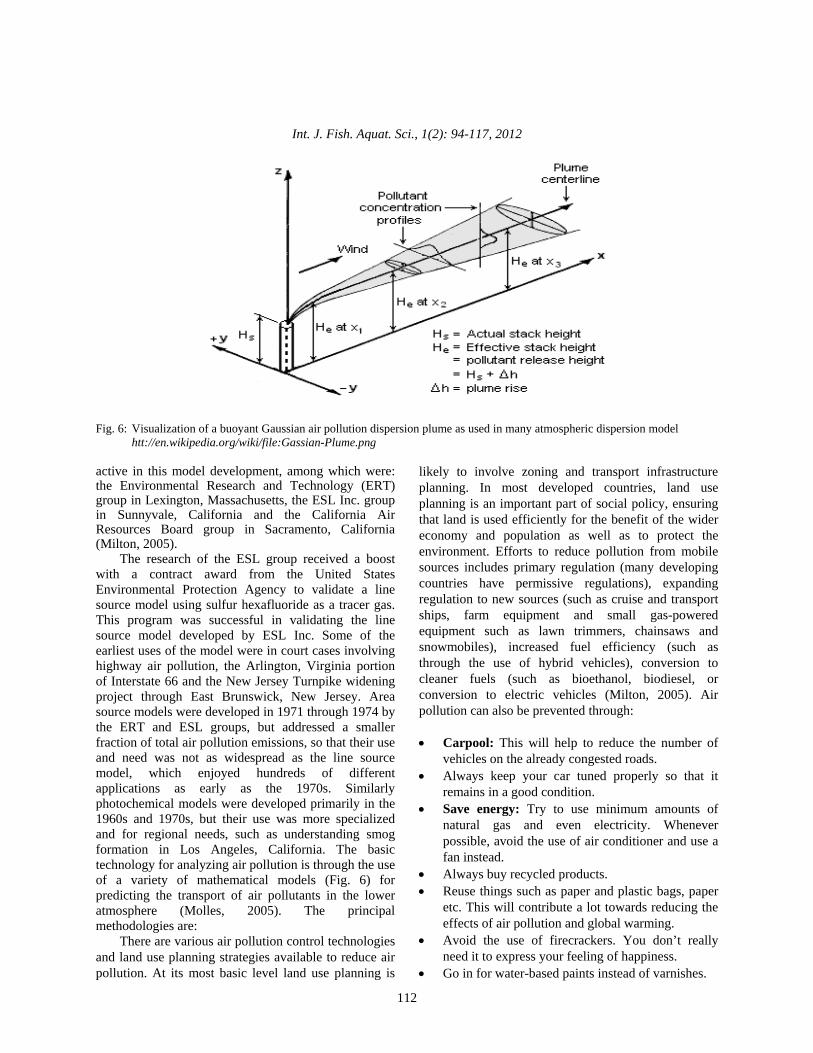
Int. J. Fish. Aquat. Sci., 1(2): 94-117, 2012
112
Fig. 6: Visualization of a buoyant Gaussian air pollution dispersion plume as used in many atmospheric dispersion model
htt://en.wikipedia.org/wiki/file:Gassian-Plume.png active in this model development, among which were: the Environmental Research and Technology (ERT) group in Lexington, Massachusetts, the ESL Inc. group in Sunnyvale, California and the California Air Resources Board group in Sacramento, California (Milton, 2005).
The research of the ESL group received a boost with a contract award from the United States Environmental Protection Agency to validate a line source model using sulfur hexafluoride as a tracer gas. This program was successful in validating the line source model developed by ESL Inc. Some of the earliest uses of the model were in court cases involving highway air pollution, the Arlington, Virginia portion of Interstate 66 and the New Jersey Turnpike widening project through East Brunswick, New Jersey. Area source models were developed in 1971 through 1974 by the ERT and ESL groups, but addressed a smaller fraction of total air pollution emissions, so that their use and need was not as widespread as the line source model, which enjoyed hundreds of different applications as early as the 1970s. Similarly photochemical models were developed primarily in the 1960s and 1970s, but their use was more specialized and for regional needs, such as understanding smog formation in Los Angeles, California. The basic technology for analyzing air pollution is through the use of a variety of mathematical models (Fig. 6) for predicting the transport of air pollutants in the lower atmosphere (Molles, 2005). The principal methodologies are:
There are various air pollution control technologies and land use planning strategies available to reduce air pollution. At its most basic level land use planning is
likely to involve zoning and transport infrastructure planning. In most developed countries, land use planning is an important part of social policy, ensuring that land is used efficiently for the benefit of the wider economy and population as well as to protect the environment. Efforts to reduce pollution from mobile sources includes primary regulation (many developing countries have permissive regulations), expanding regulation to new sources (such as cruise and transport ships, farm equipment and small gas-powered equipment such as lawn trimmers, chainsaws and snowmobiles), increased fuel efficiency (such as through the use of hybrid vehicles), conversion to cleaner fuels (such as bioethanol, biodiesel, or conversion to electric vehicles (Milton, 2005). Air pollution can also be prevented through: • Carpool: This will help to reduce the number of
vehicles on the already congested roads. • Always keep your car tuned properly so that it
remains in a good condition. • Save energy: Try to use minimum amounts of
natural gas and even electricity. Whenever possible, avoid the use of air conditioner and use a fan instead.
• Always buy recycled products. • Reuse things such as paper and plastic bags, paper
etc. This will contribute a lot towards reducing the effects of air pollution and global warming.
• Avoid the use of firecrackers. You don’t really need it to express your feeling of happiness.
• Go in for water-based paints instead of varnishes.
Int. J. Fish. Aquat. Sci., 1(2): 94-117, 2012
113
• If you really cannot avoid using your car, plan your work systematically to reduce air pollution. On the other side of the world, Chris Elvidge, a
research scientist with the National Oceanic and Atmospheric Administration, monitors a map of satellite images of gas flares so huge they can be spotted from space. Elvidge and his colleagues in Boulder, Colo., track gas flaring all over the globe. He says that after Russia, Nigeria has the most flares. "The gas flares in Nigeria are in the Niger Delta and offshore. Fifty to 100 of these gas flares produce very large halos of light, balls of light and it's because the flares have no shielding around them," Elvidge explains. Worldwide, oil companies have been burning the gas associated with crude oil production for years. In 2002, the World Bank launched a joint private/public global partnership to find ways to cut gas flaring while ensuring other benefits, such as energy savings and reduced air pollution
Gas flares emit about 390 million tons of carbon dioxide every year and experts say eliminating global flaring alone would curb more CO2 emissions than all the projects currently registered under the Kyoto Protocol's Clean Development Mechanism.
In response to international and local pressure, Nigeria pledged in 1984 to eliminate gas flares and set 2008 as the target date. While gas flaring is unlikely to end next year, the government says it's serious about the effort and Chris Elvidge confirms that the efforts to reduce gas flaring are producing results. "Nigeria has brought their gas flaring down by about 10 billion m3 a year from the mid-1990s, so Nigeria is actually one of the few countries of the world where gas flaring has been reduced. But there's still a lot of it." Oil is a mainstay of Nigeria's economy and the government acknowledges that the oil industry still flares 24 billion m3 of gas a year, enough to power a good portion of Africa for a whole year.
Despite its oil wealth, Nigeria itself suffers chronic energy shortages. The gas is often burned right next door to homes that don't have electricity and while there's a local market for the natural gas vented during oil production, it's less profitable than crude oil. Critics warn that not enough is being done to put out flares or save gas that could be harvested and used within the country. Chief Okene in Ebocha-Egbema says he just wants to see change. Tapping on the tin roof over his home, badly rusted and eroded by acid rain, he points to the stump of what was a precious coconut tree. "This died about four years ago. But the point I'm making is that this coconut is supposed to remain for at least 50 years before dying, but the burning gas has made it to die under 10 years."
Control devices: The following items are commonly used as pollution control devices by industry or transportation devices. They can either destroy contaminants or remove them from an exhaust stream before it is emitted into the atmosphere (Milton, 2005). Particulate control: • Mechanical collectors (dust cyclones,
multicyclones) • Electrostatic precipitators. An Electrostatic
Precipitator (ESP) or electrostatic air cleaner is a particulate collection device that removes particles from a flowing gas (such as air) using the force of an induced electrostatic charge. Electrostatic precipitators are highly efficient filtration devices that minimally impede the flow of gases through the device and can easily remove fine particulate matter such as dust and smoke from the air stream.
• Bag houses designed to handle heavy dust loads, a dust collector consists of a blower, dust filter, a filter-cleaning system and a dust receptacle or dust removal system (distinguished from air cleaners which utilize disposable filters to remove the dust).
• Particulate scrubbers. Wet scrubber is a form of pollution control technology. The term describes a variety of devices that use pollutants from a furnace flue gas or from other gas streams. In a wet scrubber, the polluted gas stream is brought into contact with the scrubbing liquid, by spraying it with the liquid, by forcing it through a pool of liquid, or by some other contact method, so as to remove the pollutants.
Scrubbers: Baffle spray scrubber, Cyclonic spray scrubber, Ejector venturi scrubber, Mechanically aided scrubber, Spray tower, Wet scrubber NOx control: Low NOx burners, Selective Catalytic Reduction (SCR), Selective Non-Catalytic, Reduction (SNCR) NOx scrubbers, Exhaust gas recirculation, Catalytic converter (also for VOC control). VOC abatement: Adsorption systems, such as activated carbon, Flares, Thermal oxidizers, Catalytic converters, Biofilters, Absorption (scrubbing), Cryogenic condensers, Vapor recovery systems Acid Gas/SO2 control: Wet scrubbers, Dry scrubbers, Flue gas desulfurization Mercury control: Sorbent Injection Technology, Electro-Catalytic Oxidation (ECO), K-Fuel Dioxin and furan control
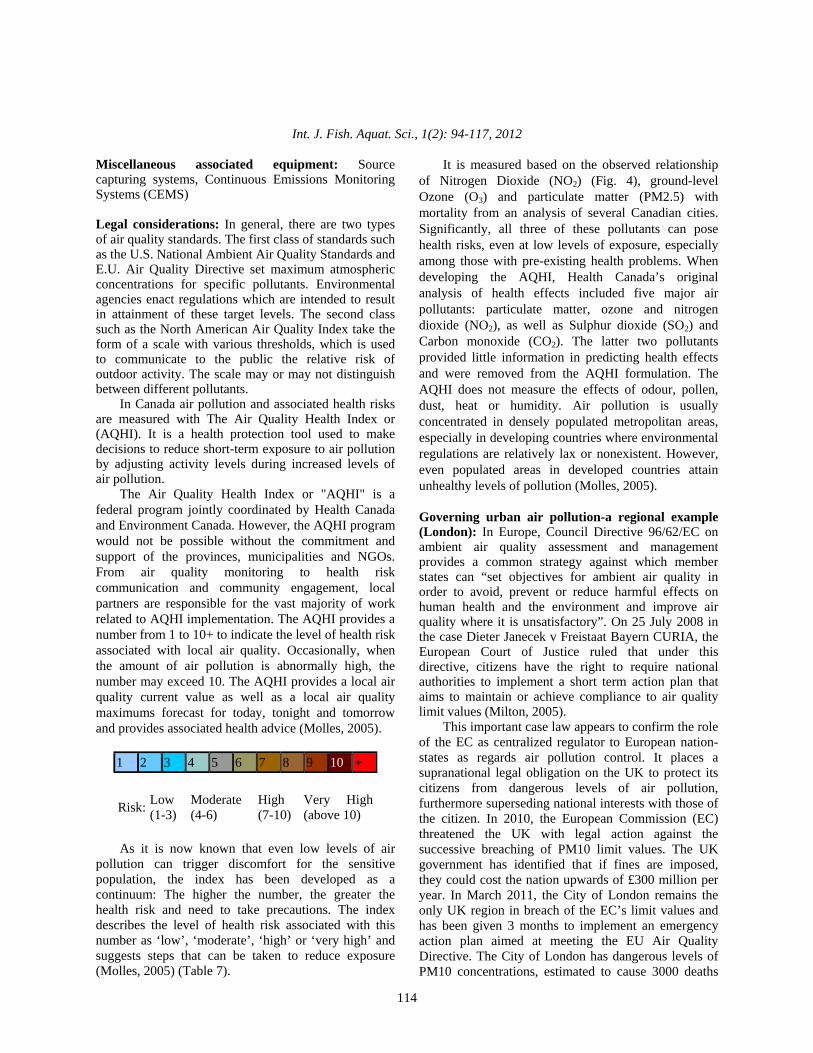
Int. J. Fish. Aquat. Sci., 1(2): 94-117, 2012
114
Miscellaneous associated equipment: Source capturing systems, Continuous Emissions Monitoring Systems (CEMS) Legal considerations: In general, there are two types of air quality standards. The first class of standards such as the U.S. National Ambient Air Quality Standards and E.U. Air Quality Directive set maximum atmospheric concentrations for specific pollutants. Environmental agencies enact regulations which are intended to result in attainment of these target levels. The second class such as the North American Air Quality Index take the form of a scale with various thresholds, which is used to communicate to the public the relative risk of outdoor activity. The scale may or may not distinguish between different pollutants.
In Canada air pollution and associated health risks are measured with The Air Quality Health Index or (AQHI). It is a health protection tool used to make decisions to reduce short-term exposure to air pollution by adjusting activity levels during increased levels of air pollution.
The Air Quality Health Index or "AQHI" is a federal program jointly coordinated by Health Canada and Environment Canada. However, the AQHI program would not be possible without the commitment and support of the provinces, municipalities and NGOs. From air quality monitoring to health risk communication and community engagement, local partners are responsible for the vast majority of work related to AQHI implementation. The AQHI provides a number from 1 to 10+ to indicate the level of health risk associated with local air quality. Occasionally, when the amount of air pollution is abnormally high, the number may exceed 10. The AQHI provides a local air quality current value as well as a local air quality maximums forecast for today, tonight and tomorrow and provides associated health advice (Molles, 2005).
1 2 3 4 5 6 7 8 9 10 +
Risk: Low (1-3)
Moderate (4-6)
High (7-10)
Very High (above 10)
As it is now known that even low levels of air
pollution can trigger discomfort for the sensitive population, the index has been developed as a continuum: The higher the number, the greater the health risk and need to take precautions. The index describes the level of health risk associated with this number as ‘low’, ‘moderate’, ‘high’ or ‘very high’ and suggests steps that can be taken to reduce exposure (Molles, 2005) (Table 7).
It is measured based on the observed relationship of Nitrogen Dioxide (NO2) (Fig. 4), ground-level Ozone (O3) and particulate matter (PM2.5) with mortality from an analysis of several Canadian cities. Significantly, all three of these pollutants can pose health risks, even at low levels of exposure, especially among those with pre-existing health problems. When developing the AQHI, Health Canada’s original analysis of health effects included five major air pollutants: particulate matter, ozone and nitrogen dioxide (NO2), as well as Sulphur dioxide (SO2) and Carbon monoxide (CO2). The latter two pollutants provided little information in predicting health effects and were removed from the AQHI formulation. The AQHI does not measure the effects of odour, pollen, dust, heat or humidity. Air pollution is usually concentrated in densely populated metropolitan areas, especially in developing countries where environmental regulations are relatively lax or nonexistent. However, even populated areas in developed countries attain unhealthy levels of pollution (Molles, 2005). Governing urban air pollution-a regional example (London): In Europe, Council Directive 96/62/EC on ambient air quality assessment and management provides a common strategy against which member states can “set objectives for ambient air quality in order to avoid, prevent or reduce harmful effects on human health and the environment and improve air quality where it is unsatisfactory”. On 25 July 2008 in the case Dieter Janecek v Freistaat Bayern CURIA, the European Court of Justice ruled that under this directive, citizens have the right to require national authorities to implement a short term action plan that aims to maintain or achieve compliance to air quality limit values (Milton, 2005).
This important case law appears to confirm the role of the EC as centralized regulator to European nation-states as regards air pollution control. It places a supranational legal obligation on the UK to protect its citizens from dangerous levels of air pollution, furthermore superseding national interests with those of the citizen. In 2010, the European Commission (EC) threatened the UK with legal action against the successive breaching of PM10 limit values. The UK government has identified that if fines are imposed, they could cost the nation upwards of £300 million per year. In March 2011, the City of London remains the only UK region in breach of the EC’s limit values and has been given 3 months to implement an emergency action plan aimed at meeting the EU Air Quality Directive. The City of London has dangerous levels of PM10 concentrations, estimated to cause 3000 deaths

Int. J. Fish. Aquat. Sci., 1(2): 94-117, 2012
115
per year within the city. As well as the threat of EU fines, in 2010 it was threatened with legal action for scrapping the western congestion charge zone, which is claimed to have led to an increase in air pollution levels (Milton, 2005).
In response to these charges, Boris Johnson, Mayor of London, has criticized the current need for European cities to communicate with Europe through their nation state’s central government, arguing that in future “A great city like London” should be permitted to bypass its government and deal directly with the European Commission regarding its air quality action plan. In part, this is an attempt to divert blame away from the Mayors office, but it can also be interpreted as recognition that cities can transcend the traditional national government organizational hierarchy and develop solutions to air pollution using global governance networks, for example through transnational relations. Transnational relations include but are not exclusive to national governments and intergovernmental organizations allowing sub-national actors including cities and regions to partake in air pollution control as independent actors (Molles, 2005).
Particularly promising at present are global city partnerships. These can be built into networks, for example the C40 network, of which London is a member. The C40 is a public ‘non-state’ network of the world’s leading cities that aims to curb their greenhouse emissions. The C40 has been identified as ‘governance from the middle’ and is an alternative to intergovernmental policy. It has the potential to improve urban air quality as participating cities “exchange information, learn from best practices and consequently mitigate carbon dioxide emissions independently from national government decisions”. A criticism of the C40 network is that its exclusive nature limits influence to participating cities and risks drawing resources away from less powerful city and regional actors (Milton, 2005).
Air pollution has been identified as one of the most critical environmental problems confronting the Niger delta Area. Traffic, industry and gas flaring are the major air pollution sources in the region. Impact on socioeconomic, ecosystems health, properties and climate have been linked with the pollution episodes in the area but which requires substantial scientific and empirical evidence. Multiple factors especially lack of equipment, inadequate skilled personnel and poor policy frame work has militated against effective and qualitative air quality studies in the area. To achieve long term goals for the region in this regard that would lead to the overall benefit of the people in the area, there is need therefore to employ a holistic and integrated approach to air pollution management that will involve all the stakeholders.
In order to improve on the current air quality monitoring and assessment programmes in the Niger Delta area there is need to embark on the following: • Develop monitoring mechanisms, regulations and
enforcement measures. • Institute planning policies to minimize pollution
that may be caused by future development. • Government agencies such as the Niger Delta
Development Commission (NDDC) should collaborate with other multinationals and stakeholders in air pollution management to come up with a comprehensive AQM scheme for the region.
• There should be a focus on the reduction of pollution levels from vehicles, industry, gas flaring and domestic burning of timber, to permissible levels as defined in national and international standards.
• The impact of air pollution from industrial and vehicular sources on the health of the communities in the region and its biodiversity needs to be researched in-depth.
• Existing air quality monitoring programmes should be re-examined and new ones introduced to determine the most effective means of mainstreaming national programmes with regional projects to improve air quality.
• Research on air quality should focus on source apportionment of the pollutants in the region
• In depth epidemiological and toxicological studies using risk and exposure assessment tools need to be carried out to establish causalities between the air pollution exposure factors and the associated health problems.
• Motor vehicles annual testing and other regulations must be created or re-introduced and strictly enforced.
• Focus should be on air pollution models, real-time monitoring of pollutants and speciation of pollutants from the particulate matter.
• There is a need to engage in renewable energy, clean energy and cleaner air initiatives.
• Usage of emissions abatement control mechanisms by polluters should be enforced.
REFERENCES
Aaron, K.K., 2006. Human Rights Violation and
Environmental Degradation in the Niger-Delta. In: Elizabeth P. and O. Baden (Eds.), Activating Human Rights. Barne, Oxford, New York.
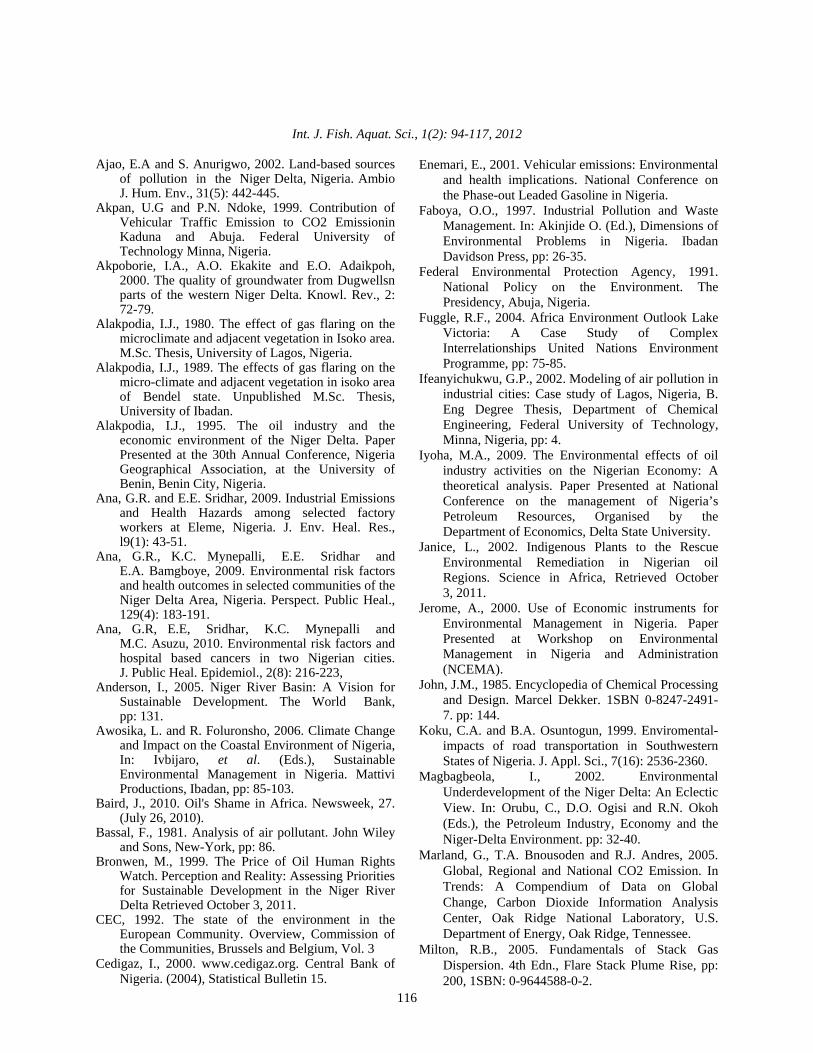
Int. J. Fish. Aquat. Sci., 1(2): 94-117, 2012
116
Ajao, E.A and S. Anurigwo, 2002. Land-based sources of pollution in the Niger Delta, Nigeria. Ambio J. Hum. Env., 31(5): 442-445.
Akpan, U.G and P.N. Ndoke, 1999. Contribution of Vehicular Traffic Emission to CO2 Emissionin Kaduna and Abuja. Federal University of Technology Minna, Nigeria.
Akpoborie, I.A., A.O. Ekakite and E.O. Adaikpoh, 2000. The quality of groundwater from Dugwellsn parts of the western Niger Delta. Knowl. Rev., 2: 72-79.
Alakpodia, I.J., 1980. The effect of gas flaring on the microclimate and adjacent vegetation in Isoko area. M.Sc. Thesis, University of Lagos, Nigeria.
Alakpodia, I.J., 1989. The effects of gas flaring on the micro-climate and adjacent vegetation in isoko area of Bendel state. Unpublished M.Sc. Thesis, University of Ibadan.
Alakpodia, I.J., 1995. The oil industry and the economic environment of the Niger Delta. Paper Presented at the 30th Annual Conference, Nigeria Geographical Association, at the University of Benin, Benin City, Nigeria.
Ana, G.R. and E.E. Sridhar, 2009. Industrial Emissions and Health Hazards among selected factory workers at Eleme, Nigeria. J. Env. Heal. Res., l9(1): 43-51.
Ana, G.R., K.C. Mynepalli, E.E. Sridhar and E.A. Bamgboye, 2009. Environmental risk factors and health outcomes in selected communities of the Niger Delta Area, Nigeria. Perspect. Public Heal., 129(4): 183-191.
Ana, G.R, E.E, Sridhar, K.C. Mynepalli and M.C. Asuzu, 2010. Environmental risk factors and hospital based cancers in two Nigerian cities. J. Public Heal. Epidemiol., 2(8): 216-223,
Anderson, I., 2005. Niger River Basin: A Vision for Sustainable Development. The World Bank, pp: 131.
Awosika, L. and R. Foluronsho, 2006. Climate Change and Impact on the Coastal Environment of Nigeria, In: Ivbijaro, et al. (Eds.), Sustainable Environmental Management in Nigeria. Mattivi Productions, Ibadan, pp: 85-103.
Baird, J., 2010. Oil's Shame in Africa. Newsweek, 27. (July 26, 2010).
Bassal, F., 1981. Analysis of air pollutant. John Wiley and Sons, New-York, pp: 86.
Bronwen, M., 1999. The Price of Oil Human Rights Watch. Perception and Reality: Assessing Priorities for Sustainable Development in the Niger River Delta Retrieved October 3, 2011.
CEC, 1992. The state of the environment in the European Community. Overview, Commission of the Communities, Brussels and Belgium, Vol. 3
Cedigaz, I., 2000. www.cedigaz.org. Central Bank of Nigeria. (2004), Statistical Bulletin 15.
Enemari, E., 2001. Vehicular emissions: Environmental and health implications. National Conference on the Phase-out Leaded Gasoline in Nigeria.
Faboya, O.O., 1997. Industrial Pollution and Waste Management. In: Akinjide O. (Ed.), Dimensions of Environmental Problems in Nigeria. Ibadan Davidson Press, pp: 26-35.
Federal Environmental Protection Agency, 1991. National Policy on the Environment. The Presidency, Abuja, Nigeria.
Fuggle, R.F., 2004. Africa Environment Outlook Lake Victoria: A Case Study of Complex Interrelationships United Nations Environment Programme, pp: 75-85.
Ifeanyichukwu, G.P., 2002. Modeling of air pollution in industrial cities: Case study of Lagos, Nigeria, B. Eng Degree Thesis, Department of Chemical Engineering, Federal University of Technology, Minna, Nigeria, pp: 4.
Iyoha, M.A., 2009. The Environmental effects of oil industry activities on the Nigerian Economy: A theoretical analysis. Paper Presented at National Conference on the management of Nigeria’s Petroleum Resources, Organised by the Department of Economics, Delta State University.
Janice, L., 2002. Indigenous Plants to the Rescue Environmental Remediation in Nigerian oil Regions. Science in Africa, Retrieved October 3, 2011.
Jerome, A., 2000. Use of Economic instruments for Environmental Management in Nigeria. Paper Presented at Workshop on Environmental Management in Nigeria and Administration (NCEMA).
John, J.M., 1985. Encyclopedia of Chemical Processing and Design. Marcel Dekker. 1SBN 0-8247-2491-7. pp: 144.
Koku, C.A. and B.A. Osuntogun, 1999. Enviromental-impacts of road transportation in Southwestern States of Nigeria. J. Appl. Sci., 7(16): 2536-2360.
Magbagbeola, I., 2002. Environmental Underdevelopment of the Niger Delta: An Eclectic View. In: Orubu, C., D.O. Ogisi and R.N. Okoh (Eds.), the Petroleum Industry, Economy and the Niger-Delta Environment. pp: 32-40.
Marland, G., T.A. Bnousoden and R.J. Andres, 2005. Global, Regional and National CO2 Emission. In Trends: A Compendium of Data on Global Change, Carbon Dioxide Information Analysis Center, Oak Ridge National Laboratory, U.S. Department of Energy, Oak Ridge, Tennessee.
Milton, R.B., 2005. Fundamentals of Stack Gas Dispersion. 4th Edn., Flare Stack Plume Rise, pp: 200, 1SBN: 0-9644588-0-2.

Int. J. Fish. Aquat. Sci., 1(2): 94-117, 2012
117
Moffat, D. and O. Linden., 1995. Perception and reality assessing priorities for sustainable development in the Niger Delta. J. Hum. Env., 24(7-8): 327-538.
Molles Jr, M.C., 2005. Ecology Concepts and Applications. 3rd Edn., McGraw-Hill Co. Inc, pp: 93-94.
Odigure, J.O., 1998. Safety Loss and Pollution Control in Chemical Process Industries. Jodigs and Associates, Minna, Nigeria, pp: 89-93.
Ogbuigwe, A., 1998. Judicial Activism in the Enforcement of Environmental Regulations in the Petroleum Industry: Past, Present and the Future. Proceedings of 1998 International Conference on the Petroleum and the Nigerian Environment, pp: 83-123.
Olobaniyi, S.B. and S.I. Efe, 2007. Comparative assessment of rainwater and groundwater quality in an oil producing area of Nigeria: Environmental and health implications. J. Env. Heal. Res., (6)2: 111-118.
Oluwole, A.F., H.B. Olaniyi, F.A. Akeredolu, O.J. Ogunsola and I.B. Obioh, 1996. Impact of the Petroleum Industry on Air Quality in Nigeria, Presented at the 8th Biennial International Seminar on the Petroleum Industry and the Nigerian Environment, Port Harcourt, pp: 17-21.
Orubu, C.O., 2002. Oil Industry activities, Environmental Quality and the Paradox of Poverty in Niger Delta. In: The Petroleum Industry, the Economy and the Niger- Delta Environment. (Eds.), C.O. Orubu, D.O. Ogisi and R.N. Okoh, pp: 17-31.
Oyekunle, L.O., 1999. Effect of gas flaring in Niger-Delta Area. NSChE Proceedings, Port-Harcourt, pp: 13.
Perry, R.H., 1984. Chemical Engineers Hand Book. 7th Edn., Mc-Graw Hill International USA.
Seneca, J.J. and M.K. Tausig, 1994. Environmental Economics, Engle Wood Cliffs, Prentice Hall.
Strauss, W., 1975. Industrial gas cleaning. Pergamon Press, New-York, 1978, pp: 80.
Taiwo, O., 2005. The Case of Lagos-Air Quality Improvement Project. LAMATA.
United Nation. Prospect of World Urbanization 1989 (Population Study No. 112) New York.
USEPA, 1993. Guide to Environmental Issues, Doc. No 520/B-94-01. United States Environmental Protection Agency, Washington, DC, USA.
Uyigue, E. and M. Agho., 2007. Coping with Climate Change and Environmental Degradation in the Niger-Delta of South Nigeria. Community Research and Development Centre (CREDC), Benin.
Wikipedia, 2007. Retrieved from: http://en.Wikipedia.org/Wiki/Environmental Issues in Nigeria/Niger Delta.