AIR FORCE INSTITUTE OF TECHNOLOGY - Defense ...dtic.mil/dtic/tr/fulltext/u2/a517907.pdfAppendix D:...
102
SUPPLY CHAIN RESILIENCE: ASSESSING USAF WEAPON SYSTEM LIFE CYCLE THESIS Brian P. Tobin, Senior Master Sergeant, USAF AFIT/LSCM/ENS/10-11 DEPARTMENT OF THE AIR FORCE AIR UNIVERSITY AIR FORCE INSTITUTE OF TECHNOLOGY Wright-Patterson Air Force Base, Ohio APPROVED FOR PUBLIC RELEASE; DISTRIBUTION UNLIMITED.
Transcript of AIR FORCE INSTITUTE OF TECHNOLOGY - Defense ...dtic.mil/dtic/tr/fulltext/u2/a517907.pdfAppendix D:...

SUPPLY CHAIN RESILIENCE: ASSESSING
USAF WEAPON SYSTEM LIFE CYCLE
THESIS
Brian P. Tobin, Senior Master Sergeant, USAF
AFIT/LSCM/ENS/10-11
DEPARTMENT OF THE AIR FORCE AIR UNIVERSITY
AIR FORCE INSTITUTE OF TECHNOLOGY
Wright-Patterson Air Force Base, Ohio
APPROVED FOR PUBLIC RELEASE; DISTRIBUTION UNLIMITED.
The views expressed in this thesis are those of the author and do not reflect the official policy or position of the United States Air Force, Department of Defense, or the United States Government.

AFIT/LSCM/ENS/10-11
SUPPLY CHAIN RESILIENCE: ASSESSING USAF WEAPON SYSTEM
LIFE CYCLE
THESIS
Presented to the Faculty
Department of Operational Sciences
Graduate School of Engineering and Management
Air Force Institute of Technology
Air University
Air Education and Training Command
In Partial Fulfillment of the Requirements for the
Degree of Master of Science in Logistics and Supply Chain Management
Brian P. Tobin, BS
Senior Master Sergeant, USAF
March 2010
APPROVED FOR PUBLIC RELEASE; DISTRIBUTION UNLIMITED.

AFIT/LSCM/ENS/10-11
SUPPLY CHAIN RESILIENCE: ASSESSING USAF WEAPON SYSTEM LIFE CYCLE
Brian P. Tobin, BS Senior Master Sergeant, USAF
Approved: _______________// Signed // ____________ 12 March 2010 Timothy J. Pettit, Lt Col, PhD (Chairman) Date ______________// Signed //______________ 12 March 2010 Daniel D. Mattioda, Maj, PhD (Member) Date

iv
AFIT/LSCM/ENS/10-11
Abstract
The Air Force Global Logistics Support Center (AFGLSC) is responsible for the
United States Air Force’s supply chain. One of the AFGLSC’s responsibilities is to
improve AF supply chain processes. This thesis investigates the subject of supply chain
resilience and its potential impact for improving supply chain management. Through
literature a supply chain resilience framework and measurement tool was identified for
potential benefit to Air Force supply chain management. Air Force weapon systems were
identified and segmented into two phases of the weapon system life cycle. This research
analyzes data collected on supply chain resilience factors, vulnerabilities and capabilities,
for each individual weapon system to determine if differences exist as weapon systems
progress through the weapon system life cycle. The results indicate that the supply chain
resilience framework and measurement tool provides Air Force leadership with beneficial
information to improve and assist in the strategic management of their supply chain.

v
AFIT/LSCM/ENS/10-11
To my wife and kids who gave me their love and support.
To my parents who instilled in me the importance of education.
Dedication

vi
Acknowledgments
I would like to express my sincere appreciation to my research advisor, Lt Col Tim Pettit,
and my committee member, Maj Dan Mattioda, for their guidance and support during this
research effort. I would, also, like to thank my sponsor, Ms Lorna Estep, from the Air
Force Global Logistics Support Center for the support and opportunity to improve supply
chain management within the United States Air Force.
Brian P. Tobin
vii
Table of Contents
Page
Abstract .............................................................................................................................. iv
Dedication ........................................................................................................................... v
Acknowledgments.............................................................................................................. vi
List of Tables ...................................................................................................................... x
I. Introduction .................................................................................................................... 1
Background ..................................................................................................................... 1
Problem Statement .......................................................................................................... 4
Research Objective ......................................................................................................... 5
Research Focus ............................................................................................................... 5
Methodology ................................................................................................................... 6
Scope and Limitations..................................................................................................... 7
Summary ......................................................................................................................... 8
II. Literature Review ........................................................................................................... 9
Introduction ..................................................................................................................... 9
Weapon System Life Cycle ............................................................................................ 9
Definition of Supply Chain ........................................................................................... 10
Risk Management ......................................................................................................... 11
Resilience ...................................................................................................................... 12
Why Resilience? ........................................................................................................... 13
Resilience Framework .................................................................................................. 15
How to Measure Resilience .......................................................................................... 21
Summary ....................................................................................................................... 25
III. Research Methodology ............................................................................................... 26
Introduction ................................................................................................................... 26
Research and Investigative Questions .......................................................................... 26

viii
Assumptions and Limitations ....................................................................................... 27
Research Sample ........................................................................................................... 27
Supply Chain Assessment and Management (SCRAM™) tool ................................... 31
Current Research ........................................................................................................... 37
Administration of SCRAM™ ....................................................................................... 38
Analysis Method ........................................................................................................... 39
Summary ....................................................................................................................... 40
IV. Analysis and Results ................................................................................................... 41
Introduction ................................................................................................................... 41
Research and Investigative Questions .......................................................................... 41
Weapon System Assessments ....................................................................................... 41
Investigative Questions 1 and 2 .................................................................................... 44
Investigative Question 3 ............................................................................................... 47
Table 15: Difference between Phases ........................................................................... 50
Summary ....................................................................................................................... 50
V. Conclusions and Recommendations ............................................................................ 51
Introduction ................................................................................................................... 51
Research Question ........................................................................................................ 51
Managerial Implications ............................................................................................... 52
Future Research ............................................................................................................ 52
Appendix A: Assessment Support Request Letter ............................................................ 54
Appendix B: Modified SCRAM™ 2.0 ............................................................................. 55
Appendix C: Confidence Interval for Weapon System #10; ............................................ 79
Appendix D: Blue Dart ..................................................................................................... 85
Appendix E: Supply Chain Resilience Storyboard ........................................................... 87
Bibliography ..................................................................................................................... 88

ix
List of Figures
Page Figure 1. Evolution of Logistics Thought and Practice..................................................2 Figure 2. AFGLSC Evolution ........................................................................................3 Figure 3. Weapon System Lifecycle Framework with Project Phases...........................7 Figure 4. Integrated Defense Acquisition, Technology, and Logistics Life Cycle Management System……………………………………………………….10 Figure 5. Operational Risk Management Process ........................................................12 Figure 6. Supply Chain Resilience Framework............................................................23 Figure 7. Zone of Balanced Resilience ........................................................................24 Figure 8. Weapon System Lifecycle Framework with Project Phases.........................38 Figure 9. Phase Comparison Resilience Assessment ...................................................42

x
List of Tables
Page Table 1. Definitions of Resilience.................................................................................. 13 Table 2. Vulnerability Factors ....................................................................................... 16 Table 3. Supply Chain Resilience Framework - Vulnerabilities ................................... 17 Table 4. Capability Factors ............................................................................................ 18 Table 5. Supply Chain Resilience Framework - Capabilities ........................................ 19 Table 6. Functional Roles by Weapon System .............................................................. 29 Table 7. Assessment Completion Times with Timeframe in Role and Organization.... 30 Table 8. SCRAM™ 2.0 Vulnerability Factors .............................................................. 32 Table 9. SCRAM™ 2.0 Capability Factors ................................................................... 33 Table 10. Internal Reliability of Factor Measures .......................................................... 36 Table 11. Phase I Resilience Gaps .................................................................................. 43 Table 12. Phase II Resilience Gaps................................................................................. 43 Table 13. Confidence Interval for Weapon System 10 – Vulnerability 1 ...................... 46 Table 14. Wilcoxon Rank Sum Test – JMP8 .................................................................. 48 Table 15. Wilcoxon Rank Sum Test – Rice (1995) ........................................................ 49 Table 16. Difference From Phase I to Phase II ............................................................... 50

1
SUPPLY CHAIN RESILIENCE: ASSESSING USAF WEAPON SYSTEM LIFE CYCLE
I. Introduction
The Air Force supply chain is one of the largest and most complex supply chains in the world, involving millions of parts, thousands of business and production processes, and hundreds of information systems. There are significant opportunities to improve the Air Force supply chain in terms of performance and cost that are both effective and efficient. This requires a revolution in thinking and action. (Air Force Global Logistics Support Center, 2008:1)
The purpose of this paper is to expand the research in the field of supply chain
resilience, specifically in a United States Air Force (USAF) setting. First, this chapter
will begin with a background of logistics and more recently supply chain management in
the United States military and specifically in the Air Force. This is followed by problem
statement definition, research objectives and concludes with the research focus.
Background
Beginning in the 1960’s the commercial sector was lagging behind the military in
the field of logistics. This was evident due to the commercial sector bench-marking
concepts and practices that the military had developed for their operations (Russell,
2007). Figure 1 illustrates the US military’s progression from the leader of logistics in
the 1950s and 1960s until 2003 and beyond where the military is now implementing the
commercial sector’s best practices by pursuing the concepts, practices, and technologies
of supply chain management (Russell, 2007).

2
Figure 1: Evolution of Logistics Thought and Practice
(Adapted from Russell, 2007)
The Department of Defense (DoD), in 2003, directed the implementation of
modern supply chain practices for all DoD components with the release of the DoD
Supply Chain Material Management Regulation (DoD 4140.1-R, 2003). This regulation
mandates the framework and guiding principles for many aspects of supply chain
management and requires all DoD components to measure total supply chain
performance (DoD 4140.1-R, 2003; Russell, 2007). Under this guidance, the USAF
created the Air Force Global Logistics Support Center (AFGLSC). Air Force Materiel
Command (AFMC) provisionally stood up the AFGLSC on 7 May 2007 and officially on
28 March 2008. The USAF also has a long history of supply chain management. Figure
2 details the progression of the USAF’s supply chain management. Prior to 1998 the
focus was limited to each air force base individually. Then in 2000, the focus shifted

3
from the individual base to each major command. In 2006, the focus shifted again from
the major commands to a weapon system focus and finally with the creation of the
AFGLSC the focus shifted to the USAF enterprise.
Figure 2: AFGLSC Evolution (AFGLSC, 2009)
Since the AFGLSC creation in 2007 it is the agency in charge of the USAF’s
supply chain. It was designed to be the single face to the warfighter for all supply chain
issues and improvements.
AFGLSC’s vision:
Recognized and respected as a premier Supply Chain Management organization through trusted support, continuous innovation and a professional, highly skilled workforce.

4
AFGLSC’s mission statement:
Execute the Air Force Supply Chain by integrating Enterprise-wide planning and strategy with Global command and control as the Single Focal Point to the Warfighter.
In a 15 May 2009 briefing presented by Major General Gary T. McCoy, AFGLSC
Commander, he identified the AFGLSC’s six top focus areas to improve the USAF’s
supply chain. The AFGLSC’s six focus areas include:
1) Optimize support to the warfighter
2) Exercise enterprise supply chain command and control
3) Establish single Air Force supply chain owner
4) Improve Air Force supply chain processes
5) Pursue and implement enabling technology
6) Develop professional, highly skilled workforce (AFGLSC, 2009)
Problem Statement
The list above identified AFGLSC’s fourth top focus area as improving Air Force
supply chain processes. Imbedded in this focus area is the requirement to define and
deploy a supply chain risk management program. Supply chain resilience has been
identified as a method of enhancing traditional risk management associated with
commercial supply chains both in recent literature and research. This leads to the
problem statement:
Does recent literature and research provide AFGLSC a method to enhance current supply chain risk management with supply chain resilience?
5
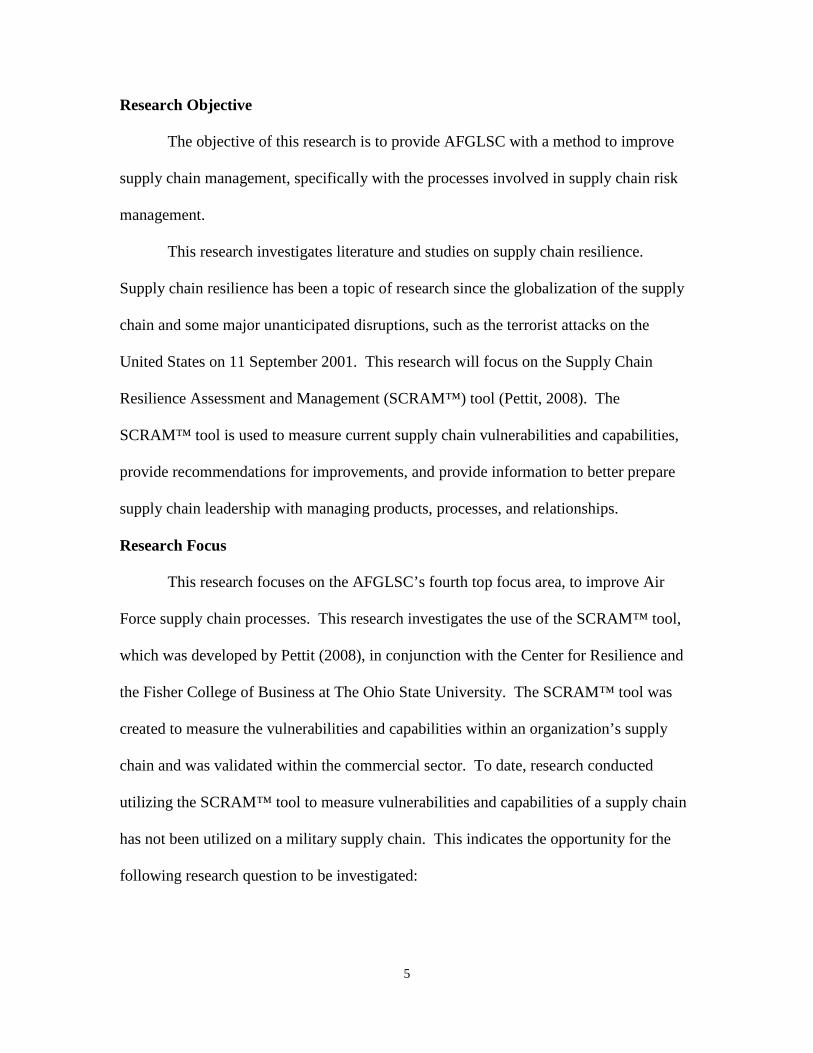
Research Objective
The objective of this research is to provide AFGLSC with a method to improve
supply chain management, specifically with the processes involved in supply chain risk
management.
This research investigates literature and studies on supply chain resilience.
Supply chain resilience has been a topic of research since the globalization of the supply
chain and some major unanticipated disruptions, such as the terrorist attacks on the
United States on 11 September 2001. This research will focus on the Supply Chain
Resilience Assessment and Management (SCRAM™) tool (Pettit, 2008). The
SCRAM™ tool is used to measure current supply chain vulnerabilities and capabilities,
provide recommendations for improvements, and provide information to better prepare
supply chain leadership with managing products, processes, and relationships.
Research Focus
This research focuses on the AFGLSC’s fourth top focus area, to improve Air
Force supply chain processes. This research investigates the use of the SCRAM™ tool,
which was developed by Pettit (2008), in conjunction with the Center for Resilience and
the Fisher College of Business at The Ohio State University. The SCRAM™ tool was
created to measure the vulnerabilities and capabilities within an organization’s supply
chain and was validated within the commercial sector. To date, research conducted
utilizing the SCRAM™ tool to measure vulnerabilities and capabilities of a supply chain
has not been utilized on a military supply chain. This indicates the opportunity for the
following research question to be investigated:

6
Research Question: Is the SCRAM™ tool able to measure supply chain vulnerabilities and capabilities within the USAF’s weapon system product life cycle and provide useful feedback?
To answer the research question the following investigative questions will be addressed:
Question 1: Will the SCRAM™ tool identify an overage of capabilities compared to vulnerabilities in selected weapon system at a current point in time in the weapon system life cycle?
Question 2: Will the SCRAM™ tool identify an underage of capabilities
compared to vulnerabilities in selected weapon system at a current point in time in the weapon system life cycle?
Question 3: Do supply chain vulnerabilities and capabilities vary across the
separate weapon system life cycle phases?
Methodology
This research will use a survey based methodology to address the research and
investigative questions. USAF weapon system program offices will be self-assessed
using the SCRAM™ tool to identify vulnerabilities and capabilities within the individual
weapon system’s supply chain. The weapon systems will be organized into two groups
based on their current position within the weapon system life cycle. Phase I is identified
as weapon systems from conception through production and Phase II is identified as
weapon systems from post production through disposal. Figure 3 depicts a basic view of
the weapon system life cycle and its division into phases used for this research.

7
Concept Refinement
Technology Development
System Development & Demonstration
Production & Deployment
Operations & Support Disposal
Phase I Phase II
Figure 3: Lifecycle Framework with Project Phases (Adapted from Defense Acquisition University, 2009)
To answer the investigative questions the individual weapon system assessments
will be analyzed by statistical methods to identify if the SCRAM™ tool will measure an
overage and an underage of capabilities verses vulnerabilities. Additionally, the
complete set of weapon system assessments divided into the two phases (Phase I and
Phase II) will be statistically compared to identify if differences exist between life cycle
phases. The intent of this research is to assist USAF leadership with supply chain
management for weapon systems as they mature and progress throughout the weapon
system life cycle. Specifically to enable leadership to proactively identify and mitigate
weapon systems risks for real-time business continuity and long-term sustainability.
Scope and Limitations
Given the vast amount of weapon systems currently within the USAF’s weapon
system life cycle, this research will be limited to addressing supply chain resilience of
eleven weapon systems identified in conjunction with the researcher, principal
investigator and sponsoring organization. Due to the complexity of the weapon systems
throughout the life cycle and the varying methods used to manage the individual weapon
system supply chains, this may impose limitations on the generalizability of the results.

8
Summary
This section began with an introduction and background of military and USAF
supply chain management progression. Introduction of the AFGLSC followed with a
discussion of its top focus areas to improve USAF supply chain management. This paper
is concentrated on improving AF supply chain processes, specifically supply chain risk
management through resilience. Additionally, the problem statement, the research
objective, research focus with investigative questions, and methodology were presented
to frame the research. The organization of the rest of this paper is as follows. Literature
review is presented in Chapter II, followed by methodology in Chapter III. Results and
analysis of the research are discussed in Chapter IV. The research concludes in Chapter
V with managerial implications, research limitations, and future research
recommendations.

9
II. Literature Review
Introduction
This chapter begins with a detailed explanation of the weapon system life cycle
and the definition of supply chain, as used for this research. The rest of the chapter
discusses traditional risk management, resilience, why resilience is important, resilience
framework and how to measure resilience.
Weapon System Life Cycle
In Chapter I, Figure 3 displayed a simplified pictorial view of the weapon system
life cycle. Figure 4, shows the complete Integrated Defense Acquisition, Technology, and
Logistics Life Cycle Management System (Defense Acquisition University, 2009). This
image is intended for a 2’x3’ poster and in this size is added to emphasize the complexity
of the system. This system is structured by DoDI 5000.02 into discrete phases separated
by major decision points, called milestones or decision reviews, with a number of key
activities to provide the basis for comprehensive management and informed decision
making. Life Cycle Logistics (LCL) is included in this system as the planning,
development, implementation, and management of a comprehensive, affordable, and
effective systems support strategy within the total life cycle systems management. LCL
encompasses the entire weapon system’s life cycle including acquisition (design,
develop, test, produce, and deploy), sustainment (operations and support), and disposal.
A key goal or objective of USAF logistics is to maintain and improve readiness, improve
affordability, and minimize the overall footprint of the weapon system and its required
support (DoDI 5000.02). As discussed in Chapter I, this research will separate the
weapon system life cycle into two phases, Phase I and Phase II. Phase I includes weapon

10
systems from conception through production and Phase II includes weapon systems from
post production through disposal
Figure 4: Integrated Defense Acquisition, Technology, and Logistics Life Cycle Management System
(Defense Acquisition University, 2009)
Definition of Supply Chain
There are many different definitions of a supply chain in literature. Stock and
Boyer noted 173 individual definitions of supply chain management in journals and
books (2009). For the purpose of this research, the supply chain is defined as the network
of organizations involved in the upstream and downstream flows of products, services,
finances and information from the initial supplier to the ultimate customer (Christopher,
1992; Mentzer et al., 2001; Lambert, Garcia-Dastugue, Croxton, 2005 and Pettit, 2008).

11
This definition is important to the research of resilience; it must have a wide view across
the supply chain to capture the dynamics of turbulence and complexity (Pettit, 2008).
Risk Management
Traditional risk management involves risk analysis which includes assessing each
risk in terms of its likelihood of occurrence (probability), and the estimated impact
(severity) should the risk occur (VanderBok, et. al, 2007). A typical step by step
explanation of the risk management process is shown Figure 5, illustrating a continuous
circle of risk identifying, assessing, analyzing, controlling, implementing and reviewing
(Manuele, 2005). Today’s supply chains are much more complex and more susceptible
to disruptions due to the globalized supply chains, specialized factories, centralized
distribution, increased outsourcing, reduced supplier base, increased volatility of demand,
and technological innovations (Cranfield University, 2002). Recent literature identifies
the greatest weakness of risk management is its inability to adequately characterize low-
probability, high-consequence events (Kunreuther, 2006). Pettit noted that “traditional
assessment approach cannot deal with unforeseeable events” (2008:16).

12
Figure 5: Operational Risk Management Process (Adapted from: Manuele, 2005)
Resilience
What is resilience? A respected dictionary defines resilience as “the tendency of
a material to return to its original shape after the removal of a stress that has produced
elastic strain” (Merriam-Webster, 2007:1340). Resilience has been identified as an
important concept in other fields of study, such as ecology, psychology, leadership, and
the supply chain (Folke et al., 2004; Gorman et al., 2005; Stoltz, 2004; Rice and Caniato,
2003; Sheffi, 2005; Christopher and Peck, 2004; Fiksel, 2006; and Ponomarov and
Holcomb, 2009). Definitions of resilience from the fields of study listed above are
summarized in Table 1.
Step 1:Identify Hazards
Step 2:Assess Risks
Step 3:Analyze Controls
Step 4:Determine Controls
Step 5:Implement Controls
Step 6:Superviseand Review
Step 1:Identify Hazards
Step 2:Assess Risks
Step 3:Analyze Controls
Step 4:Determine Controls
Step 5:Implement Controls
Step 6:Superviseand Review

13
Table 1: Definitions of Resilience (Adapted from Pettit, 2008)
Source Definition Field of study Merriam-Webster (2007)
Capability of a body to recover its size and shape after deformation Engineering
Folke et al. (2004)
Ability to rebound from a disturbance while maintaining diversity, integrity and ecological processes Ecology
Gorman et al. (2005) Ability to bounce back from adversity Psychology
Stoltz (2004) Ability to bounce back from adversity and move forward stronger than ever Leadership
Rice and Caniato (2003)
Ability to react to an unexpected disruption and restore normal operations Supply chain
Sheffi (2005) Containment of disruption and recovery from it Supply chain
Christopher and Peck (2004)
Ability of a system to return to its original state or move to a new, more desirable state after being disturbed Supply chain
Fiksel (2006) Capacity for complex industrial systems to survive, adapt and grow in the face of turbulent change Supply chain
Ponomarov and Holcomb (2009)
Capability to prepare for unexpected events, respond to disruptions, and recover by maintaining continuity of operations at the desired level of connectedness and control
Supply chain
Why Resilience?
“Supply chain resilience no longer implies merely the ability to manage risk. It
now assumes that the ability to manage risk means being better positioned than
competitors to deal with–and even gain advantage from–disruptions” (Sheffi, 2005:1).
Why the interest in supply chain resilience? According to Christopher and Peck, “in an
age of lengthening supply chains serving globe-spanning operations, there are frequent
reminders that we live in an unpredictable and changing world 2004:1). Fiksel added,
“the old methods of risk management are no longer effective in a global economy that is

14
tightly connected and unpredictable” (The Ohio State University, 2008:1). Fiksel also
stated “companies must cope with a continuous stream of surprises, ranging from
industrial accidents to economic shocks to natural catastrophes” and “resilience is about
configuring company assets, including both human and economic capital, in a way that
maximizes the capacity of the enterprise to survive, adapt and grow in the face of
turbulent change” (The Ohio State University, 2008:1).
The study of supply chain resilience was spurred by the disruptions in the United
Kingdom’s (UK) transportation network due to fuel protests in 2000 and to UK’s beef
market due to the outbreak of Foot and Mouth Disease in 2001 (Peck, 2005).
Additionally, there are many examples of disruptions that demonstrate the importance of
resilience. For example, a lightning bolt that, in March 2000, struck a Philips
semiconductor plant in Albuquerque, New Mexico, created a 10-minute blaze that
contaminated millions of chips and subsequently delayed deliveries to its two largest
customers: Finland’s Nokia and Sweden’s Ericsson. The fire contributed to Ericsson to
leaving the mobile phone business due to the losses it sustained, but Nokia prevailed
because the company recognized the magnitude of the disruption and took action because
it was resilient (Sheffi, 2005). Also, the 2002 longshoreman union lockout at the Los
Angeles/Long Beach port interrupted transshipments and deliveries to many US-based
firms. Port operations and schedules did not return to normal until six months after the
strike ended. This 10-day strike did not interrupt Dell Computer’s operations like it did
for many of the other country’s retailers and manufacturers. Dell was aware that its lean,
high-speed business model left it vulnerable. Dick Hunter, in charge of Dell’s United
States supply chain, stated “ when a labor problem or an earthquake or a SARS epidemic

15
breaks out, we’ve got to react quicker than anyone else” (Breen, 2004:86). Dell
recognized its vulnerabilities and took steps to make sure they, as a firm, are resilient.
The following is an excerpt taken from Pettit’s research that provides another view why
businesses and organizations should be interested in and pursuing resiliency.
In a world of turbulent change, resilience is a key competency, since even the most carefully designed supply chain is susceptible to unforeseen factors. Businesses must be prepared to cope with a continuous stream of challenges, ranging from human errors to technological failures to natural disasters (Pettit, 2008:191)
Pettit argues that the ability to manage the risk of uncertainty is a challenge and that
businesses are always changing and change introduces risk, and this requires resilience
(2008). Sheffi stated, “Some organizations cope far better than others with both the
prospect and the manifestation of unquantifiable risk. They don’t have in common a
secret formula or even many of the same processes for dealing with risk, but they share a
critical trait: resilience” (2005:1).
Resilience Framework
Since the UK’s fuel protests in 2000 and the many other major disruptions around
the globe and in the U.S. there has been many who have investigated supply chain
resilience to define its characteristics. A review of extant literature identified
vulnerabilities as one of the characteristics of supply chain resilience (Peck, 2005; Sheffi,
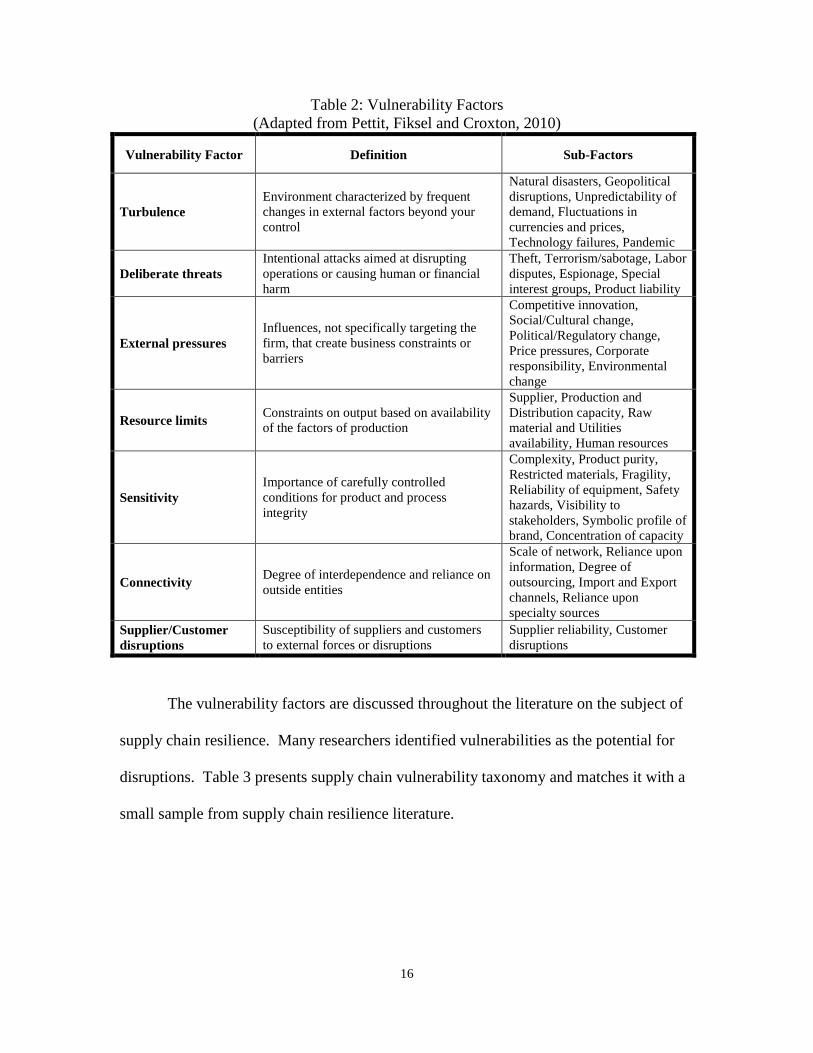
2005b; Pettit, 2008; Ponomarov and Holcomb, 2009). Pettit defined supply chain
vulnerabilities as “fundamental factors that make an enterprise susceptible to disruptions”
(2008:191). Table 2 lists and defines the vulnerability factors that Pettit identified during
his research and lists the sub-factors identified for each factor.
16
Table 2: Vulnerability Factors (Adapted from Pettit, Fiksel and Croxton, 2010)
Vulnerability Factor Definition Sub-Factors
Turbulence Environment characterized by frequent changes in external factors beyond your control
Natural disasters, Geopolitical disruptions, Unpredictability of demand, Fluctuations in currencies and prices, Technology failures, Pandemic
Deliberate threats Intentional attacks aimed at disrupting operations or causing human or financial harm
Theft, Terrorism/sabotage, Labor disputes, Espionage, Special interest groups, Product liability
External pressures Influences, not specifically targeting the firm, that create business constraints or barriers
Competitive innovation, Social/Cultural change, Political/Regulatory change, Price pressures, Corporate responsibility, Environmental change
Resource limits Constraints on output based on availability of the factors of production
Supplier, Production and Distribution capacity, Raw material and Utilities availability, Human resources
Sensitivity Importance of carefully controlled conditions for product and process integrity
Complexity, Product purity, Restricted materials, Fragility, Reliability of equipment, Safety hazards, Visibility to stakeholders, Symbolic profile of brand, Concentration of capacity
Connectivity Degree of interdependence and reliance on outside entities
Scale of network, Reliance upon information, Degree of outsourcing, Import and Export channels, Reliance upon specialty sources
Supplier/Customer disruptions
Susceptibility of suppliers and customers to external forces or disruptions
Supplier reliability, Customer disruptions
The vulnerability factors are discussed throughout the literature on the subject of
supply chain resilience. Many researchers identified vulnerabilities as the potential for
disruptions. Table 3 presents supply chain vulnerability taxonomy and matches it with a
small sample from supply chain resilience literature.

17
Table 3: Supply Chain Resilience Framework – Vulnerabilities (Adapted from Pettit, Fiksel and Croxton, 2010)
Main Factors of Vulnerability
DescriptorsChristopher, Rutherford
(2004)
Peck (2005)
Sheffi (2005)
Ponamarov, Holcomb
(2009)
Pettit, Fiksel,
Croxton (2010)
Turbulence Natural disasters X X X X XExposure to geopolitical disruptions X X X
Unpredictability of demand X X XFluctuations in currencies & prices X
Unforeseen technology failures XPandemic X
Deliberate threats Piracy & theft X X X X
Terrorism & sabotage X X X XLabor disputes X X X
Industrial espionage XSpecial interest groups X
Product liability X
External pressures Innovation (competition) X X
Social/Cultural changes X XPolitical/Regulatory changes X X
Price pressures (competition) XCorporate responsibility XEnvironmental changes X
Resource limits Supplier capacity XProduction capacity XDistribution capacity X
Raw material availability XUtilit ies availability X
Human resources XSensitivity Complexity X X X X X
Product purity XRestricted materials X
Fragility XReliability of equipment X XPotential safety hazards X
Visibility of disruption to stakeholders XSymbolic profile of brand X
Concentration of capacity XConnectivity Scale/Extent of supply network X X X X
Reliance upon information flow X X XDegree of outsourcing X X X X
Import/Export channels XReliance upon specialty sources X
Supplier/Customer disruptions
Supplier trust, loyalty, relations, reliability X X X X
Customer disruptions X
18
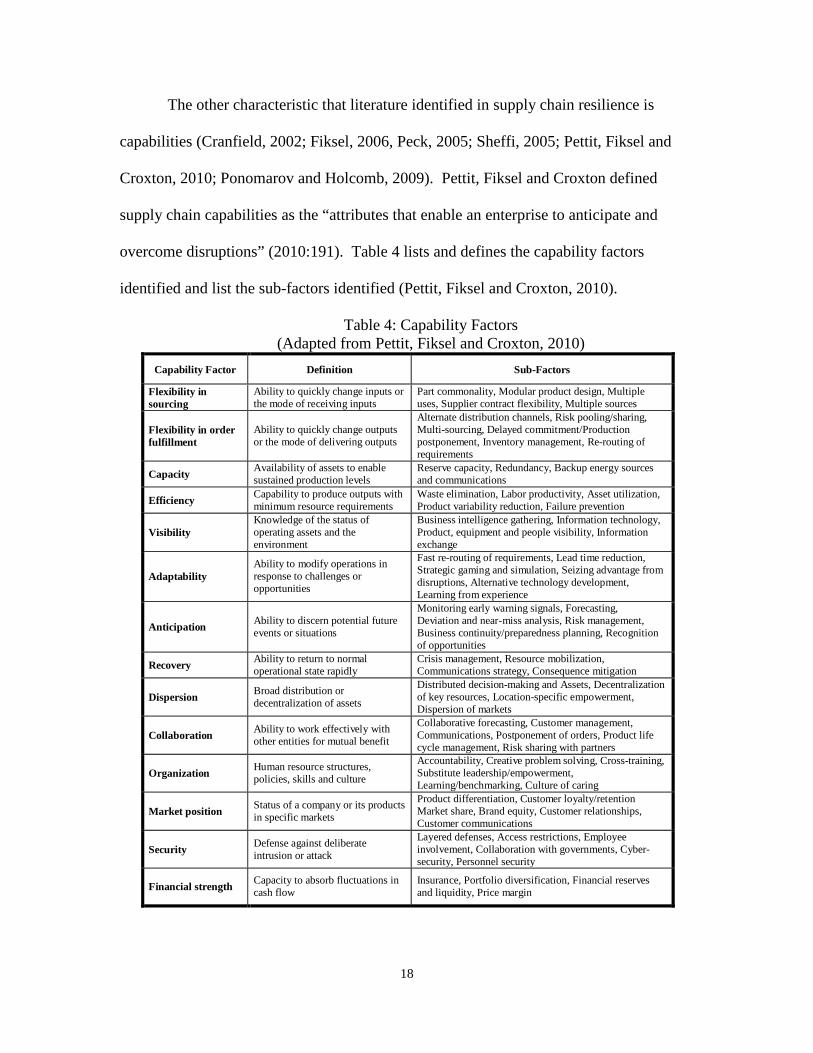
The other characteristic that literature identified in supply chain resilience is
capabilities (Cranfield, 2002; Fiksel, 2006, Peck, 2005; Sheffi, 2005; Pettit, Fiksel and
Croxton, 2010; Ponomarov and Holcomb, 2009). Pettit, Fiksel and Croxton defined
supply chain capabilities as the “attributes that enable an enterprise to anticipate and
overcome disruptions” (2010:191). Table 4 lists and defines the capability factors
identified and list the sub-factors identified (Pettit, Fiksel and Croxton, 2010).
Table 4: Capability Factors (Adapted from Pettit, Fiksel and Croxton, 2010)
Capability Factor Definition Sub-Factors
Flexibility in sourcing
Ability to quickly change inputs or the mode of receiving inputs
Part commonality, Modular product design, Multiple uses, Supplier contract flexibility, Multiple sources
Flexibility in order fulfillment
Ability to quickly change outputs or the mode of delivering outputs
Alternate distribution channels, Risk pooling/sharing, Multi-sourcing, Delayed commitment/Production postponement, Inventory management, Re-routing of requirements
Capacity Availability of assets to enable sustained production levels
Reserve capacity, Redundancy, Backup energy sources and communications
Efficiency Capability to produce outputs with minimum resource requirements
Waste elimination, Labor productivity, Asset utilization, Product variability reduction, Failure prevention
Visibility Knowledge of the status of operating assets and the environment
Business intelligence gathering, Information technology, Product, equipment and people visibility, Information exchange
Adaptability Ability to modify operations in response to challenges or opportunities
Fast re-routing of requirements, Lead time reduction, Strategic gaming and simulation, Seizing advantage from disruptions, Alternative technology development, Learning from experience
Anticipation Ability to discern potential future events or situations
Monitoring early warning signals, Forecasting, Deviation and near-miss analysis, Risk management, Business continuity/preparedness planning, Recognition of opportunities
Recovery Ability to return to normal operational state rapidly
Crisis management, Resource mobilization, Communications strategy, Consequence mitigation
Dispersion Broad distribution or decentralization of assets
Distributed decision-making and Assets, Decentralization of key resources, Location-specific empowerment, Dispersion of markets
Collaboration Ability to work effectively with other entities for mutual benefit
Collaborative forecasting, Customer management, Communications, Postponement of orders, Product life cycle management, Risk sharing with partners
Organization Human resource structures, policies, skills and culture
Accountability, Creative problem solving, Cross-training, Substitute leadership/empowerment, Learning/benchmarking, Culture of caring
Market position Status of a company or its products in specific markets
Product differentiation, Customer loyalty/retention Market share, Brand equity, Customer relationships, Customer communications
Security Defense against deliberate intrusion or attack
Layered defenses, Access restrictions, Employee involvement, Collaboration with governments, Cyber-security, Personnel security
Financial strength Capacity to absorb fluctuations in cash flow
Insurance, Portfolio diversification, Financial reserves and liquidity, Price margin

19
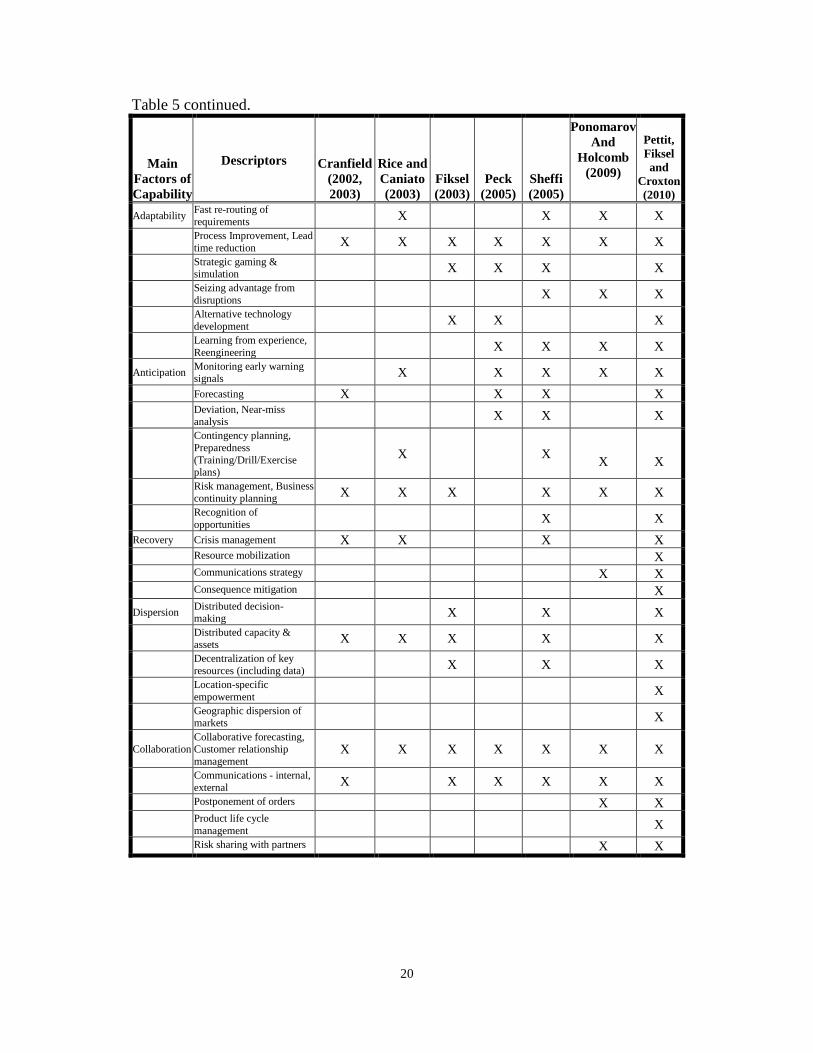
Just as the vulnerability factors are discussed throughout the literature,
capabilities have been investigated in literature within the subject of supply chain
resilience. Researchers have identified capabilities as management’s ability to anticipate
and overcome disruptions (Pettit, Fiksel and Croxton, 2010). Table 5 presents capability
taxonomy and matches it with a small sample from supply chain resilience literature.
Table 5: Supply Chain Resilience Framework — Capabilities (Adapted from Pettit, Fiksel and Croxton, 2010)
Main Factors of Capability Descriptors
Cranfield (2002, 2003)
Rice and Caniato (2003)
Fiksel (2003)
Peck (2005)
Sheffi (2005)
Ponomarov And
Holcomb (2009)
Pettit, Fiksel and
Croxton (2010)
Flexibility-sourcing
Commonality (facilities, processes) X X X
Product commonality
(modularity, interchangeability)
X X X
Multiple uses for supplies X X X Supplier contract flexibility X X X X X X Multiple sources X X X X X X
Flexibility-fulfillment
Alternate distribution channels X X X
Risk pooling/sharing X X X Multi-sourcing (peak vs.
base) X
Delayed commitment, Production postponement X X X
Inventory management X X Fast re-routing of
requirements X
Capacity Reserve capacity (materials, assets, labor, inventory) X X X X X X
Redundancy (assets, labor) X X X X X Backup energy
sources/communications X X X Efficiency Waste elimination X X X X
Labor productivity X X Asset utilization X X Product variability reduction X Failure prevention X
Visibility Business intelligence gathering X X X X
Information technology X X X X X Products, Assets, People
visibility X X X X
Collaborative information exchange X X
20
Table 5 continued.
Main Factors of Capability
Descriptors Cranfield (2002, 2003)
Rice and Caniato (2003)
Fiksel (2003)
Peck (2005)
Sheffi (2005)
Ponomarov And
Holcomb (2009)
Pettit, Fiksel and
Croxton (2010)
Adaptability Fast re-routing of requirements X X X X
Process Improvement, Lead time reduction X X X X X X X
Strategic gaming & simulation X X X X
Seizing advantage from disruptions X X X
Alternative technology development X X X
Learning from experience, Reengineering X X X X
Anticipation Monitoring early warning signals X X X X X
Forecasting X X X X Deviation, Near-miss
analysis X X X
Contingency planning, Preparedness (Training/Drill/Exercise plans)
X X X
X
Risk management, Business continuity planning X X X X X X
Recognition of opportunities X X
Recovery Crisis management X X X X Resource mobilization X Communications strategy X X Consequence mitigation X Dispersion Distributed decision-
making X X X
Distributed capacity & assets X X X X X
Decentralization of key resources (including data) X X X
Location-specific empowerment X
Geographic dispersion of markets X
Collaboration Collaborative forecasting, Customer relationship management
X X X X X X X
Communications - internal, external X X X X X X
Postponement of orders X X Product life cycle
management X Risk sharing with partners X X

21
Table 5 continued.
Main Factors of Capability Descriptors
Cranfield (2002, 2003)
Rice and Caniato (2003)
Fiksel (2003)
Peck (2005)
Sheffi (2005)
Ponomarov And
Holcomb (2009)
Pettit, Fiksel and
Croxton (2010)
Organization Learning, Benchmarking, Feedback X X
Responsibility, Accountability & Empowerment
X X
Teamwork, Creative problem solving X X X X
Training, Cross-train workers X X X
Substitute leadership capacity X
Culture of caring for employees X
Market position Product differentiation X Customer loyalty/retention X Market share X Brand equity X Customer relationships X X Customer communications X X Security Layered defenses X * X X X Access restriction X X X Employee involvement in
security X X
Collaboration with governments X X X X
Cyber-security X X Personnel security X Financial strength Insurance X X Portfolio diversification X X Financial reserves &
liquidity X X Price margin X * NOTE: Authors specifically describe security as separate from resilience.
How to Measure Resilience
Many scholars agree that supply chain resilience is essential in today’s global
environment (Christopher and Peck, 2004; Sheffi, 2005; Ponomarov and Holcomb, 2009;
Pettit, Fiksel, and Croxton 2010). However, the ability to measure supply chain
resilience without using traditional risk management techniques had been lacking in

22
literature. Based on the framework that Pettit, Fiksel and Croxton developed, Pettit with
the Center for Resilience and the Fisher College of Business at The Ohio State University
created the Supply Chain Resilience Assessment and Management (SCRAM™) tool
(Pettit, 2008).
The resilience framework that Pettit, Fiksel and Croxton developed was based on
two postulates and three propositions (2010).
Postulate 1: Forces of change create supply chain vulnerabilities.
Postulate 2: Management controls create supply chain capabilities.
Proposition 1: Supply chain resilience increases as capabilities increase and vulnerabilities decrease
Proposition 2: Linkages exist between each vulnerability and a specific set of
capabilities that can directly improve balanced resilience.
Proposition 3A: Excessive vulnerabilities relative to capabilities will result in excessive risk.
Proposition 3B: Excessive capabilities relative to vulnerabilities will erode
profitability.
Proposition 3C: Supply chain performance improves when capabilities and vulnerabilities are more balanced.
Pettit, Fiksel and Croxton built their resilience framework using tenets of
Grounded Theroy (2010). The first phase created the taxonomies of both capabilities and
vulnerabilities based on extant literature and then refined and validated this list with
supply chain managers from a large retailer with a complex global supply chain. The
second phase of the validation used focus groups from the large retailer using a detailed
interview protocol to discuss recent supply chain disruptions in order to identify the

23
vulnerabilities and capabilities (Pettit, Fiksel and Croxton, 2010). Figure 6 is a pictorial
view of the Pettit’s framework.
Figure 6: Supply Chain Resilience Framework (Pettit, Fiksel and Croxton, 2010)
Pettit, Fiksel and Croxton believed that through the measurement of
vulnerabilities and capabilities they could provide an evaluation of a supply chain’s
current level of resilience and from this developed the supply chain resilience assessment
and management (SCRAM™) tool to direct supply chain improvements (2010). The tool
is designed to subjectively measure the vulnerability and capability factors and their
respective sub-factors. The target population for SCRAM™ included all business
organizations, both for-profit and not-for-profit, global companies and privately owned
small businesses, as well as corporations and governmental agencies (Pettit, 2008). It is a
web-based survey instrument that measures responses in ordinal form in a Likert Scale

24
“Disagree/Agree,” ranging from 1 to 5. Due to the large number of factors and sub-
factors (21 and 111, respectively) Pettit controlled the number of questions in order to
maintain a reasonable survey length (Dillman, 2000; Pettit 2008).
Pettit, Fiksel and Croxton proposed that the assessment of the 21 factors, listed in
Tables 2 and 4, respectively, can be used to evaluate an organization’s current state of
resilience within its supply chain, and therefore, through a strategic review of the
organization’s resilience suggest recommendations for improvements that can be
prioritized to meet strategic goals. The recommendations are designed to lead an
organization to a state of “balanced resilience”. Figure 7 graphically presents this state of
“balanced resilience” and shows that an overage in capabilities relative to vulnerabilities
erodes profits and the overage of vulnerabilities relative to capabilities exposes an
organization to risk (Pettit, Fiksel and Croxton, 2010).
Figure 7: Zone of Balanced Resilience (Pettit, 2008)
Pettit’s research indicated that the SCRAM™ tool is a viable method of
evaluating the levels of vulnerabilities and capabilities of a firm’s supply chain.
Zone of B
alanced
Zone of B
alanced
Resilie
nce
Resilie
nce
ExposureExposureto Riskto Risk
ErosionErosionof Profits of Profits
Increasing Vulnerabilities
IncreasingCapabilities
25
Presentation of his results to corporate sponsors provided excellent feedback as to the
breadth of the supply chain resilience framework and the ability of the SCRAM™ tool to
accurately measure the sources of change facing the firm as well as the firm’s strengths
and weaknesses (Pettit, 2008).
Summary
The literature review provided an overview of the USAF weapon system life
cycle, the definition of resilience used in this research, risk management processes,
resilience, why resilience is important to organizations, resilience framework, and how to
measure resilience. Additionally, the results of Pettit’s research provide an opportunity
for further research utilizing the SCRAM™ tool. This research plans to validate the
SCRAM™ tool on USAF weapon systems throughout the weapon system life cycle. The
following chapter covers the research methods that are intended to be used to complete
this research paper.
26
III. Research Methodology
Introduction
This research employs a web-based survey instrument to collect the data
necessary to answer the research question and the three investigative questions. This
chapter begins by stating the research and investigative questions. The chapter continues
with the research assumptions and limitations, the selection of the weapon systems and
their respective respondents, and the SCRAM™ tool with modifications necessary for a
military application and the administration of the SCRAM™. The chapter concludes
with a discussion of the analysis plan followed by a summary.
Research and Investigative Questions
To date, the SCRAM™ tool has not been utilized on a military supply chain.
This indicates the opportunity for the following research question to be investigated:
Research Question: Is the SCRAM™ tool able to measure supply chain vulnerabilities and capabilities within the USAF’s weapon system life cycle and provide useful feedback?
To answer the research question the following investigative questions will be addressed:
Question 1: Will the SCRAM™ tool identify an overage of capabilities compared to vulnerabilities in selected weapon system at the current point in time in the weapon system life cycle?
Question 2: Will the SCRAM™ tool identify an underage of capabilities
compared to vulnerabilities in selected weapon system at the current point in time in the weapon system life cycle?
Question 3: Do supply chain vulnerabilities and capabilities vary across the
separate weapon system life cycle phases?

27
Assumptions and Limitations
The following assumptions are stated for this research:
1. The weapon system samples participating in this research represent the population of weapon systems in the Air Force.
2. The respondents are subject matter experts in their functional role.
3. The respondents hold top-level positions within the organization, providing a strategic perspective.
4. The respondents are knowledgeable with the supply chain their organization operates in regardless if organically or contactor managed.
5. The respondents took the appropriate amount of time to read, understand and
answer each question properly.
6. That the weapon system life cycle phases (Phase I and Phase II) for this research do not overlap.
The following are limitations of this research project: 1. The sample size of this research may provide less than robust results.
2. The weapon system’s leadership decision to select only one from each
functional role may introduce single-respondent bias.
3. Due to the complexity of the weapon systems throughout the life cycle and the varying methods used to manage the individual weapon system supply chains, this may impose limitations on the generalizability of the results.
Research Sample
The target sample population for this study is USAF weapon system program
offices that are actively managing weapon systems. The type of weapon systems targeted
included man and unmanned from the attack, bomber, cargo, fighter, multi-mission,
special electronic installation, and tanker type of systems. There were 21 weapon
systems identified in a collaboration effort between the researcher, principal investigator
and the research sponsoring organization. A request letter (Appendix A) was distributed

28
to the leadership of the 21 different weapon systems. Following the request letter, follow
up contact was made and 11 weapons systems agreed to participate in the project,
representing a 52% response rate.
Each weapon system’s leadership was asked to identify a cross-functional team of
top-level personnel from their organization. The cross-functional team should include,
but not limited to, such functional roles as engineering, acquisition, sustainment, program
management, research and development, logistics, financial management, and
contracting. Each team was to include a minimum of five members, with no maximum
stated. The minimum number of five participants was arbitrarily chosen to get a varied
sample of top-level cross-functional participants. The request for top-level cross-
functional participants was reiterated in all follow up contact, leaving the final selection
of participants to the weapon system’s leadership. Table 6, displays the number of each
functional role represented per weapon system with the total number of participants for
each weapon system and the overall total of all participants.

29
Table 6: Functional Roles by Weapon System
Additionally, each weapon system’s leadership was asked to provide a point of
contact or a list of individuals for which the researcher would electronically send the
survey link. If the organization only provided a point of contact for the researcher to
send the assessment link, the point of contact was asked to provide the number of
respondents and functional roles of the assigned to take the assessment to assist the
researcher in tracking the organization’s completion.
The SCRAM™ tool includes a total of 152 questions. Each participant was
informed, as a guide, the assessment will take on average approximately 30 minutes to
complete. Of the 54 participants, the longest time to complete the assessment was 87
minutes and the shortest time to complete the assessment was approximately 4.5 minutes.
Acq
uisi
tion
Engi
neer
ing
Budg
etin
g /
Fina
nce
Logi
sitic
s
Man
ufac
turin
g
Proc
urem
ent /
Co
ntra
ctin
g
Sust
ainm
ent
Prog
ram
M
anag
emen
t
Num
ber o
f Pa
rtic
ipan
ts
w/s 1 1 1 1 1 1 5w/s 2 1 1 1 2 5w/s 3 5 5w/s 4 1 1 1 2 5w/s 5 2 1 1 2 6w/s 6 3 3w/s 7 1 1 1 1 1 5w/s 8 1 1 1 2 5w/s 9 1 2 1 1 5w/s 10 1 1 1 1 1 5w/s 11 1 1 1 1 1 5
Total 54
Wea
pon
Syst
em D
esig
nato
r
Functional Role

30
Respondents with low completion times, less than 15 minutes, may bring concern of the
reliability of the data due to the number of questions. All samples were kept with the
assumption that the weapon systems leadership tasked their most qualified person(s) in
that functional role. Table 7 includes an average of assessment completion times of the
participants by weapon system and the number of respondents in each of the functional
role and the organization timeframe categories. With 29 of the 54 (53%) respondents
having more than 10 years of experience in their functional role lends credit to the
assumption that the respondents are subject matter experts. A note of interest is the
number of respondents that have less than five years in their current organization. Of the
54 respondents 44 (81%) have less than five years.
Table 7: Assessment Completion Times with Timeframe in Role and Organization
Weapon System #
Min/Max completion time (min/max)
Average Completion time (mm:ss) 0- <1 Year 1-< 5 Years 5-10 Years
More than 10 Years 0- <1 Year 1-< 5 Years 5-10 Years
More than 10 Years
1 4:19/30:59 16:00 1 1 1 2 1 3 12 20:58/44:30 36:47 3 2 1 43 6:54/53:23 17:30 1 2 2 1 2 24 12:57/54:19 24:33 1 1 3 3 25 24:53/59:18 46:30 1 5 1 4 16 18:37/55:39 39:10 1 1 1 2 17 7:04/35:37 18:50 1 2 2 3 1 18 13:19/87:00 38:03 1 2 2 3 29 7:18/29:25 18:38 1 2 2 510 6:14/50:40 27:12 5 3 211 6:14/50:40 17:33 2 3 2 3
27:2129 19 25 6 4
The number of Respondents Time in current Organization
The number of Respondents Time in current Functional Role
Total average timeTotal # of respondents per time frame 5 13 7

31
Supply Chain Assessment and Management (SCRAM™) tool
As discussed in Chapter II, the SCRAM™ tool was developed by Pettit, in
conjunction with the Center for Resilience and the Fisher College of Business at The
Ohio State University (Pettit, 2008). SCRAM™ is a web-based instrument that firms are
administered to self-assess the supply chain their organization is operating within. Web-
based or internet surveys are a low cost method compared to traditional research
methods, such as telephone, mail, and fax surveys (Griffis, Goldsby and Cooper, 2003;
Maronick, 2009). The web-based instrument was appropriate for this research since all
participants have access to the internet. The survey instrument was reviewed and
approved by Air Force Institute of Technology’s Institutional Review Board.
The SCRAM™ tool in Pettit’s research has been improved with further research
and this study will use the latest version of the tool, SCRAM™ 2.0. In SCRAM™ 2.0
the vulnerability factors have been reduced by one; therefore, there are only six. The
vulnerability factor removed was supply/customer disruptions. In a personal interview,
Pettit discussed the broadness of the supply/customer disruption factor and the reason for
removing the factor from the vulnerability list. His reasoning was that a firm’s strategic
suppliers and customers would complete the SCRAM™ from their perspective and
consolidated into a multi-aspect view of the supply chain’s resilience (Pettit, 2010b). The
SCRAM™ 2.0 vulnerability factors and the sub-factors are listed in Table 8.
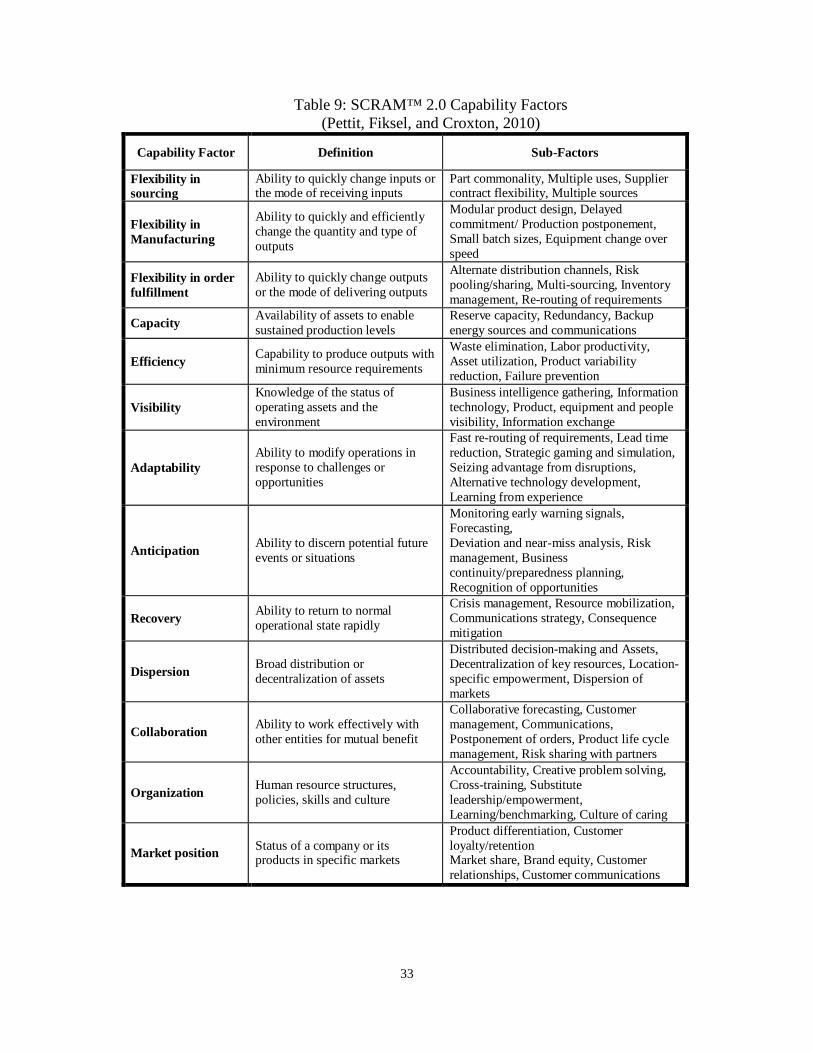
Furthermore, the capability factors have also been modified since Pettit’s initial
research. In Pettit’s (2008) study he identified 14 capabilities, but further research
expanded this list to 16 factors. The two capabilities factors that were added include;
flexibility in manufacturing and product stewardship. In a personal interview, Pettit

32
discussed the reasoning for expanding the list. Flexibility in manufacturing was added as
an individual factor from flexibility in order fulfillment due to scope of manufacturing
complexities. The second factor added was product stewardship due to the importance of
sustainable business practices required by government regulations and the public’s desire
for responsible firms protecting the environment (Pettit, 2010b). Table 9 lists the
SCRAM™ capability factors and sub-factors
Table 8 SCRAM™ 2.0 Vulnerability Factors (Pettit, Fiksel, and Croxton, 2010)
Vulnerability Factor Definition Sub-Factors
Turbulence Environment characterized by frequent changes in external factors beyond your control
Natural disasters, Geopolitical disruptions, Unpredictability of demand, Fluctuations in currencies and prices, Technology failures, Pandemic
Deliberate threats Intentional attacks aimed at disrupting operations or causing human or financial harm
Theft, Terrorism/sabotage, Labor disputes, Espionage, Special interest groups
External pressures Influences, not specifically targeting the firm, that create business constraints or barriers
Competitive innovation, Social/Cultural change, Political/Regulatory change, Budget constraints, Corporate responsibility, Environmental, Health and Safety Concern
Resource limits Constraints on output based on availability of the factors of production
Supplier, Production and Distribution capacity, Raw material and Utilities availability, Human resources
Sensitivity Importance of carefully controlled conditions for product and process integrity
Complexity, Product purity, Restricted materials, Fragility, Reliability of equipment, Safety hazards, Visibility to stakeholders, Symbolic profile of brand, Concentration of capacity
Connectivity Degree of interdependence and reliance on outside entities
Scale of network, Reliance upon information, Degree of outsourcing, Import and Export channels, Reliance upon specialty sources
33
Table 9: SCRAM™ 2.0 Capability Factors (Pettit, Fiksel, and Croxton, 2010)
Capability Factor Definition Sub-Factors
Flexibility in sourcing
Ability to quickly change inputs or the mode of receiving inputs
Part commonality, Multiple uses, Supplier contract flexibility, Multiple sources
Flexibility in Manufacturing
Ability to quickly and efficiently change the quantity and type of outputs
Modular product design, Delayed commitment/ Production postponement, Small batch sizes, Equipment change over speed
Flexibility in order fulfillment
Ability to quickly change outputs or the mode of delivering outputs
Alternate distribution channels, Risk pooling/sharing, Multi-sourcing, Inventory management, Re-routing of requirements
Capacity Availability of assets to enable sustained production levels
Reserve capacity, Redundancy, Backup energy sources and communications
Efficiency Capability to produce outputs with minimum resource requirements
Waste elimination, Labor productivity, Asset utilization, Product variability reduction, Failure prevention
Visibility Knowledge of the status of operating assets and the environment
Business intelligence gathering, Information technology, Product, equipment and people visibility, Information exchange
Adaptability Ability to modify operations in response to challenges or opportunities
Fast re-routing of requirements, Lead time reduction, Strategic gaming and simulation, Seizing advantage from disruptions, Alternative technology development, Learning from experience
Anticipation Ability to discern potential future events or situations
Monitoring early warning signals, Forecasting, Deviation and near-miss analysis, Risk management, Business continuity/preparedness planning, Recognition of opportunities
Recovery Ability to return to normal operational state rapidly
Crisis management, Resource mobilization, Communications strategy, Consequence mitigation
Dispersion Broad distribution or decentralization of assets
Distributed decision-making and Assets, Decentralization of key resources, Location-specific empowerment, Dispersion of markets
Collaboration Ability to work effectively with other entities for mutual benefit
Collaborative forecasting, Customer management, Communications, Postponement of orders, Product life cycle management, Risk sharing with partners
Organization Human resource structures, policies, skills and culture
Accountability, Creative problem solving, Cross-training, Substitute leadership/empowerment, Learning/benchmarking, Culture of caring
Market position Status of a company or its products in specific markets
Product differentiation, Customer loyalty/retention Market share, Brand equity, Customer relationships, Customer communications

34
Table 9: Continued
Pettit validated SCRAM™ by assessing seven commercial firms with global
supply chains. This validation occurred through a series of focus groups within each firm
using a multiple case study methodology (Pettit, 2008; Yin, 2003). Pettit administrated
the SCRAM™ to the seven firms to evaluate several recent disruptions within each firm
to validate the tool (Pettit, 2008). Additionally, Pettit’s (2008) research included the
methods he used to address construct validity, internal validity, external validity and
reliability.
Construct validity was controlled by using multiple respondents from each firms
varying functional areas, a secure database back-up, and followed up by a final
presentation to the firm’s leadership (Pettit, 2008). Therefore, to ensure construct
validity, Pettit used multiple data sources to combine expert perceptions with historical
performance (2008).
For internal validity, Pettit conducted a pre-test by academics and practitioners,
and a large pilot test of the SCRAM™ tool prior to administering the assessment to his
research sample (2008). Additionally, he used Cronbach’s alpha as an unbiased estimator
of internal consistency. Pettit noted that in literature well-developed scales will have a
Cronbach’s alpha of 0.7 or greater, but using a lower limit of 0.5 is acceptable in
Security Defense against deliberate intrusion or attack
Layered defenses, Access restrictions, Employee involvement, Collaboration with governments, Cyber-security, Personnel security
Financial strength Capacity to absorb fluctuations in cash flow
Insurance, Portfolio diversification, Financial reserves and liquidity, Price margin
Product Stewardship
Assurance of sustainable business practices throughout product life cycle
Monitor environmental, health and safety, Communicate sustainability with Suppliers, Communicate disposal requirements with Customers
35
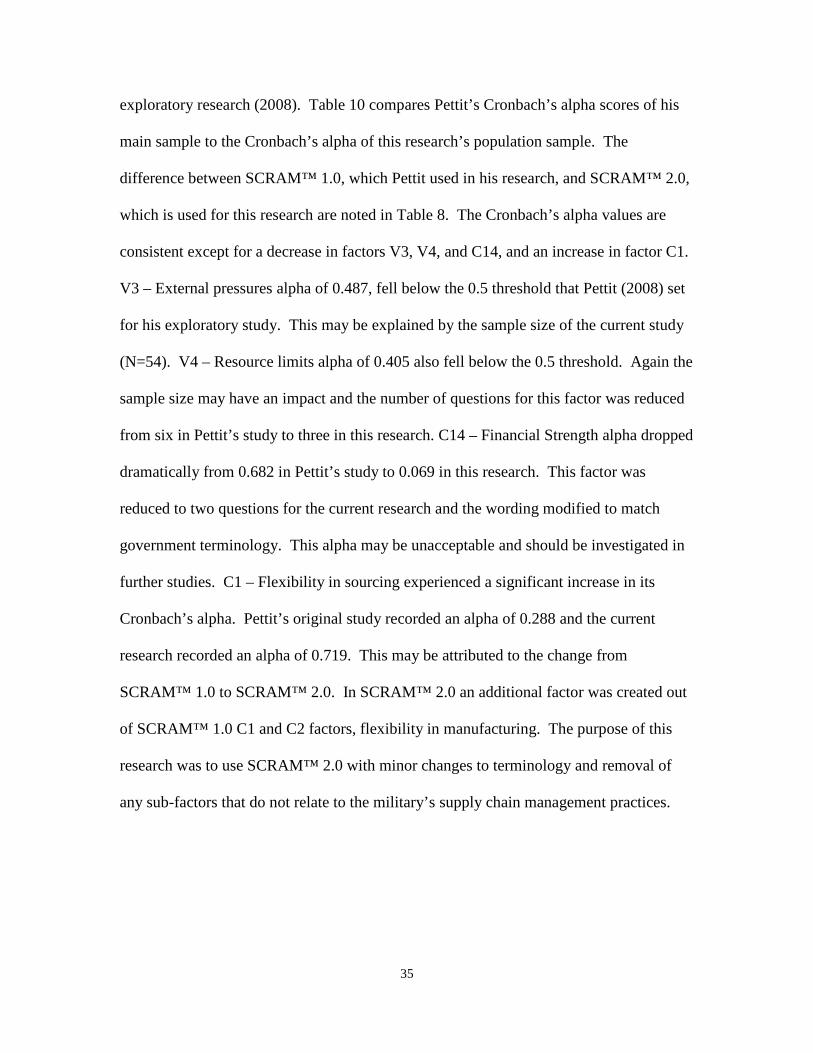
exploratory research (2008). Table 10 compares Pettit’s Cronbach’s alpha scores of his
main sample to the Cronbach’s alpha of this research’s population sample. The
difference between SCRAM™ 1.0, which Pettit used in his research, and SCRAM™ 2.0,
which is used for this research are noted in Table 8. The Cronbach’s alpha values are
consistent except for a decrease in factors V3, V4, and C14, and an increase in factor C1.
V3 – External pressures alpha of 0.487, fell below the 0.5 threshold that Pettit (2008) set
for his exploratory study. This may be explained by the sample size of the current study
(N=54). V4 – Resource limits alpha of 0.405 also fell below the 0.5 threshold. Again the
sample size may have an impact and the number of questions for this factor was reduced
from six in Pettit’s study to three in this research. C14 – Financial Strength alpha dropped
dramatically from 0.682 in Pettit’s study to 0.069 in this research. This factor was
reduced to two questions for the current research and the wording modified to match
government terminology. This alpha may be unacceptable and should be investigated in
further studies. C1 – Flexibility in sourcing experienced a significant increase in its
Cronbach’s alpha. Pettit’s original study recorded an alpha of 0.288 and the current
research recorded an alpha of 0.719. This may be attributed to the change from
SCRAM™ 1.0 to SCRAM™ 2.0. In SCRAM™ 2.0 an additional factor was created out
of SCRAM™ 1.0 C1 and C2 factors, flexibility in manufacturing. The purpose of this
research was to use SCRAM™ 2.0 with minor changes to terminology and removal of
any sub-factors that do not relate to the military’s supply chain management practices.

36
Table 10: Internal Reliability of Factor Measures (Adapted from Pettit, 2008)
Baseline SCRAM™ 1.0 V1 V2 V3 V4 V5 V6 V7
Number of Items 6 6 6 6 9 5 2
Cronbach’s Alpha (Pettit, 2008)
0.651 0.756 0.746 0.730 0.704 0.745 0.756
Sample size* 138 134 142 105 102 130 142Equivilent SCRAM™ 2.0 V1 V2 V3 V4 V5 V6 X
Number of Items 7 5 6 3 9 5 X
Cronbach’s Alpha (Current sample) 0.709 0.754 0.487 0.405 0.785 0.554 X
Sample size* 54 48 53 49 53 52 X
Baseline SCRAM™ 1.0 C1 X C2 C3 C4 C5 C6 C7
Number of Items 5 X 6 3 5 4 6 6
Cronbach’s Alpha (Pettit, 2008) 0.288 X 0.677 0.515 0.701 0.813 0.708 0.803
Sample size* 75 X 90 96 108 123 91 99Equivilent SCRAM™ 2.0 C1 C2 C3 C4 C5 C6 C7 C8
Number of Items 5 9 6 5 6 8 5 10
Cronbach’s Alpha (Current sample) 0.719 0.645 0.719 0.601 0.848 0.856 0.872 0.934
Sample size* 52 49 40 39 44 41 41 46
Baseline SCRAM™ 1.0 C8 C9 C10 C11 C12 C13 C14 X
Number of Items 4 5 5 6 6 6 4 X
Cronbach’s Alpha (Pettit, 2008)
0.682 0.461 0.615 0.779 0.763 0.896 0.682 X
Sample size* 136 115 89 158 141 87 136 XEquivilent SCRAM™ 2.0 C9 C10 C11 C12 X C13 C14 C15
Number of Items 5 6 11 7 X 6 2 5
Cronbach’s Alpha (Current sample) 0.859 0.413 0.907 0.930 X 0.933 0.069 0.864
Sample size* 44 46 47 40 X 35 46 39
X Indicates the factor was not part of either Pettit's (2008) or the current research
* Sample size due to listwise deletion of missing or “Don’t Know” responses: Pettit's (2008) Sample N=170, Current Sample N=54.

37
To ensure external validity, Pettit designed into his study a sample of firms that
are representative from the spectrum of markets (Pettit, 2008). Furthermore, Pettit noted
that the generalizability of the assessment tool was further improved because it was
created using a broad set of extant literature and presented to eight focus groups within a
firm that produces a wide variety of products (Pettit, 2008; Pettit, Fiksel and Croxton,
2010).
To ensure reliability, Pettit was the single researcher that facilitated each of the
focus groups. Pettit conducted a pre-test and pilot test for the assessment tool. The early
tests were used to correct interpretation issues related to the format and content of the
assessment tool (Pettit, 2008). Additionally, Pettit used hold-out samples for the case
studies. The hold-out sample was administered a subset of the questions in order to
evaluate the reliability of the focus group’s ability to uncover salient points and his
research concluded that the focus groups performed well in extracting the necessary
salient points (Pettit, 2008).
Current Research
This research uses SCRAM™ 2.0 and assessed military organizations,
specifically USAF weapon system acquisition and sustainment organizations that are
managing weapon systems in one of the two different phases of the weapon system life
cycle. The weapon system life cycle is divided into two different phases, Phase I
includes weapon systems from conception through production and Phase II includes
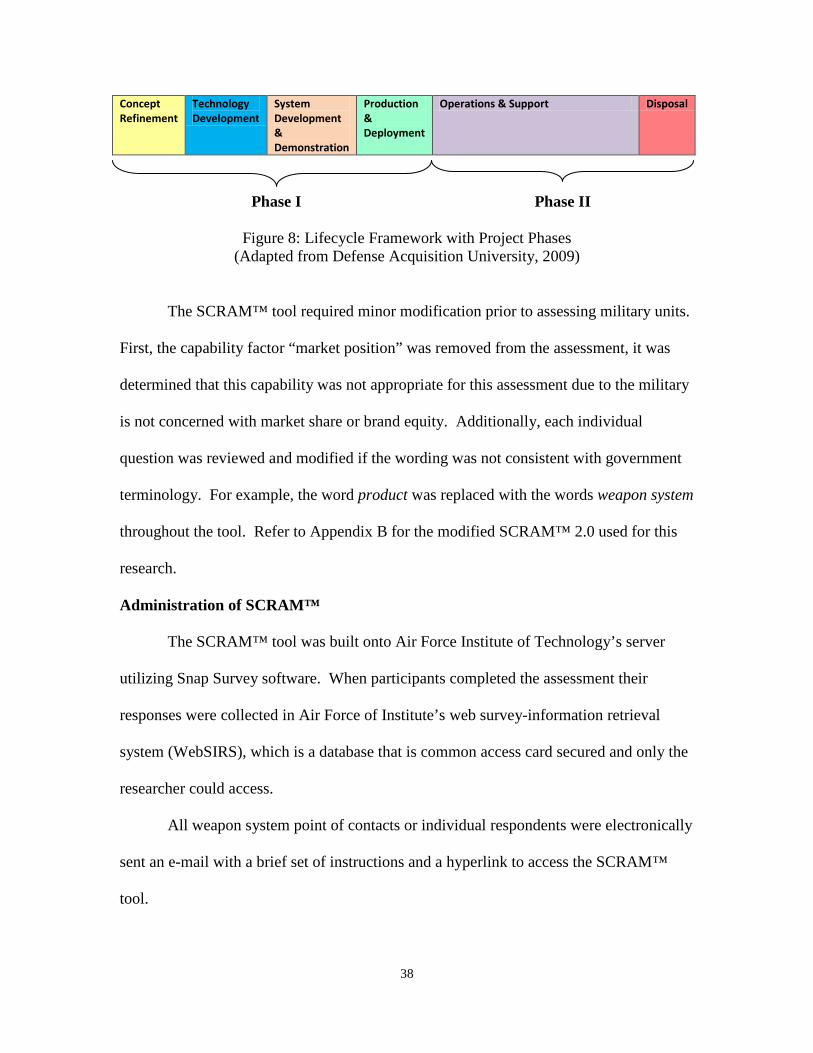
weapon systems from post production through disposal. Figure 8, depicts a description
of weapon system life cycle framework and how the life cycle is divided into two phases
for this research.
38
Concept Refinement
Technology Development
System Development & Demonstration
Production & Deployment
Operations & Support Disposal
Phase I Phase II
Figure 8: Lifecycle Framework with Project Phases (Adapted from Defense Acquisition University, 2009)
The SCRAM™ tool required minor modification prior to assessing military units.
First, the capability factor “market position” was removed from the assessment, it was
determined that this capability was not appropriate for this assessment due to the military
is not concerned with market share or brand equity. Additionally, each individual
question was reviewed and modified if the wording was not consistent with government
terminology. For example, the word product was replaced with the words weapon system
throughout the tool. Refer to Appendix B for the modified SCRAM™ 2.0 used for this
research.
Administration of SCRAM™
The SCRAM™ tool was built onto Air Force Institute of Technology’s server
utilizing Snap Survey software. When participants completed the assessment their
responses were collected in Air Force of Institute’s web survey-information retrieval
system (WebSIRS), which is a database that is common access card secured and only the
researcher could access.
All weapon system point of contacts or individual respondents were electronically
sent an e-mail with a brief set of instructions and a hyperlink to access the SCRAM™
tool.

39
The instructions included with the assessment link are as follows:
1. The assessment should take approximately 30 minutes to complete.
2. Do not close the assessment prior to completion due to the server will not save the assessment if not fully completed.
3. During the assessment you can use your browser’s back button to go back to questions/screens you have previously answered/viewed.
4. This assessment of your weapon system is not a collaboration effort. Only answer for your functional expertise. If there are questions you do not have expertise in, use the “Don’t Know” answer button.
5. Do not share the assessment link with others.
Once the individual respondents accessed the assessment tool on-line, additional
directions were provided. See Appendix B, Modified SCRAM™ Assessment Tool, for
the additional directions presented to the assessment respondents.
The initial e-mail with the assessment link was sent out on 12 December 2009.
Weapon systems were given updates on the number of completed assessments beginning
on 8 January 2010 and approximately every two weeks for a total of three e-mails with
updates. It was decided to only send three updates spread apart by two weeks to not bias
the respondents.
Analysis Method
The data collected from each weapon systems self-assessment from the
SCRAM™ tool is used for the analysis of this research. Two separate methods were
used to answer each investigative question and the overall research question.
To answer investigative questions 1 and 2, which are listed at the beginning of
this chapter, the data collected from each individual weapon system was used to calculate

40
a small-sample confidence interval for the sample population mean (McClave, Benson
and Sincich, 2008). Due to the small sample size, three to six respondents, both
parametric and nonparametric methods were explored. The researcher decided for this
set of investigative questions to use the parametric method, since 94% of all samples can
be assumed to come from a normal distribution at the 95% confidence level according to
the statistical program JMP8. The nonparametric method was not an option due to the
small sample size, the reference chart for the parametric method in Rice’s book should
not be used below n=5 (Rice, 1995).
To answer investigative question number 3, the weapon systems’ SCRAM™
results were grouped into the two phases, Phase I and Phase II. Again, due to the small
sample size, Phase I with a sample size of N=5 and Phase II with a sample size of N=6,
both parametric and nonparametric statistical methods were explored. The research opted
to use the nonparametric method, Wilcoxon rank sum test, due to the results being more
conservative than the parametric method.
Summary
This chapter discussed the laid the foundation for the research methodology. The
chapter began with the research question and investigative questions, then a review of the
research approach. The next chapter will present the analysis of the data collected from
the SCRAM™ assessment tool.
41
IV. Analysis and Results
Introduction
This chapter will present the data and the results of the analysis used to answer
the research question and investigative questions.
Research and Investigative Questions
Research Question: Is the SCRAM™ tool able to measure supply chain vulnerabilities and capabilities within the USAF’s weapon system life cycle and provide useful feedback?
To answer the research question the following investigative questions will be addressed:
Question 1: Will the SCRAM™ tool identify an overage of capabilities compared to vulnerabilities in selected weapon system at the current point in time in the weapon system life cycle?
Question 2: Will the SCRAM™ tool identify an underage of capabilities
compared to vulnerabilities in selected weapon system at the current point in time in the weapon system life cycle?
Question 3: Do supply chain vulnerabilities and capabilities vary across the
separate weapon system life cycle phases?
Weapon System Assessments
Each weapon system identified for this research the individual respondents were
administered a SCRAM™ web-based assessment. The results from the individual
assessments were used to answer the investigative questions and the research question for
this study.
The data from each respondent’s self-assessment using the SCRAM™ tool was
analyzed using a Microsoft Excel program that Pettit (2008) developed. The SCRAM™
analyzer calculates an aggregated resilience assessment score from the individual
respondent’s subjective assessment of the organization’s supply chain. Additionally,

42
resilience gaps, an imbalance of vulnerabilities verses capabilities, are calculated between
linked vulnerabilities and capabilities (Pettit, 2008). Figure 9 is the resilience assessment
score for Phase I and Phase II weapon systems. Table 11 and Table 12 are charts of
Phase I and Phase II resilience gaps, respectively.
Figure 9: Phase Comparison Resilience Assessment
1.0
1.5
2.0
2.5
3.0
3.5
4.0
4.5
5.0
1.0 1.5 2.0 2.5 3.0 3.5 4.0 4.5 5.0
Cap
abili
ty
Vulnerability
Phase 1
Composite Score - Phase 1
Balanced Mid-line
Phase 2
Composite Score - Phase 2
Erosion of Resources
Exposureto Risk

43
Table 11: Phase I Resilience Gaps
Table 12: Phase II Resilience Gaps
Phase ITurbulence
Deliberate Threats
External Pressures
Resource Limits Sensitivity Connectivity
V1 V2 V3 V4 V5 V6
Flexibility in Sourcing C1 -18.5% 0.7% -6.4% 12.4% 8.4%Flexibility in Manufacturing C2 -11.6% -16.0% -0.9%
exibility in Order Fulfillment C3 5.6% 4.5%Capacity C4 -10.0% -24.2% -0.2% 2.6% 3.5% -23.2%
Efficiency C5 -3.3% -8.6% 4.8% 12.5% -14.6%Visibility C6 -4.9% 3.0% 21.8% -16.1%
Adaptability C7 1.7% 9.1% 2.8% 10.8% 2.4%Anticipation C8 1.5% 4.0% 0.0% 6.9% 20.7% -2.9%
Recovery C9 10.6% 9.8% 1.2% 5.2% -0.3%Dispersion C10 8.4% 15.3% 46.2% 1.4%
Collaboration C11 -0.1% 3.6% 19.5% -6.9%Organization C12 6.3% 0.0% 27.8%
Security C13 -21.6% -30.0%Financial Strength C14 9.6% -6.6% -4.7%
Product Stewardship C15 5.3% 4.4% 10.6% 12.0% 1.5%
* Upper gap limit 5%* Lower gap limit -5%
Phase IITurbulence
Deliberate Threats
External Pressures
Resource Limits Sensitivity Connectivity
V1 V2 V3 V4 V5 V6
Flexibility in Sourcing C1 -25.8% -3.5% -20.2% 6.0% 2.4%Flexibility in Manufacturing C2 -15.5% -17.9% -2.0%
exibility in Order Fulfillment C3 1.0% -3.3%Capacity C4 -12.8% -26.7% -4.8% -6.2% -0.5% -27.8%
Efficiency C5 -14.5% -20.0% -11.0% 0.7% -26.8%Visibility C6 -7.1% 7.3% 16.3% -22.3%
Adaptability C7 -8.3% 3.3% 2.0% 1.0% -3.6%Anticipation C8 -10.6% -8.9% -19.5% -8.3% 8.8% -16.9%
Recovery C9 0.7% -1.1% -12.9% -5.7% -11.0%Dispersion C10 3.4% 11.0% 32.1% -3.3%
Collaboration C11 -10.5% -9.0% 10.0% -16.2%Organization C12 -3.2% -12.0% 17.2%
Security C13 -21.9% -27.3%Financial Strength C14 3.2% 0.6% -12.4%
Product Stewardship C15 -0.8% -4.9% 1.7% 3.2% -7.1%
* Upper gap limit 5%* Lower gap limit -5%

44
Each weapon system that participated in this study the organization’s leadership
was provided the results of their individual organization’s assessment with
recommendations.
Investigative Questions 1 and 2
The SCRAM™ tool was administered to 11 weapon systems with an average of
five respondents per weapon system; see Table 6, in Chapter III, for a breakdown of
respondents per weapon system. To test for an overage/underage of capabilities
compared to vulnerabilities each weapon system’s individual results were used to
calculate a resilience score. The resilience score (R) is calculated from each weapon
system’s individual respondent’s assessment answers, using a Likert scale of 1 to 5, by a
formula that uses an single vulnerability (V) score and calculates with each of the
individual capability (C) score, C1 through C15. For example, the result of the formula
((4-V1+C1)/8-0.5) would equal the value of R1.1. The R score for all respondents was
then averaged to get the mean R score and standard deviation. The critical t-statistic
values were obtained from TABLE V in Appendix B of McClave, Benson and Sincich’s
statistical book (2008). Using the values stated above the confidence intervals were
calculated using Microsoft Excel with average and standard deviation functions
embedded in Excel and the formula , where x-bar is the mean, t is the test
statistic, s is the standard deviation, and n is the sample size. Prior to calculating the
confidence interval all R scores (R1.1 through R1.15 for each Vulnerability (1 through
6)) the data was checked for a normal distribution in JMP 8. Of the 90 groups checked,
94% with a 95% confidence level appeared to be from a normal distribution. From this
information it was determined to use the parametric small-sample confidence interval for

45
a population mean from McClave, Benson and Sincich’s book (2008). Table 13 displays
the results from weapon system #10’s V6 with the results from V1 through V6 in
Appendix C.

46
Table 13: Confidence Interval for WS10; Vulnerability 6 V6
Respondents R6.1 R6.2 R6.3 R6.4 R6.5 R6.6 R6.7 R6.8 R6.9 R6.10 R6.11 R6.12 R6.13 R6.14 R6.15A 0.125 0.095833 0.16875 0.033333 0.075 0.1375 0.2 0.1375 -0.075 0.047222 -0.025 0.0125 -0.05 0.1375BC 0 -0.15833 -0.05417 -0.23125 -0.05417 -0.09286 -0.15833 -0.15 -0.0125 -0.075 -0.09063 -0.075 0.05 -0.075 -0.11667D -0.11667 -0.15104 -0.04167 -0.16667 -0.04167 -0.07738 -0.06667 -0.04167 -0.11667 -0.16667 -0.06439 -0.04167 -0.02083 -0.04167 -0.04167E 0.025 0 0.041667 0.025 0.041667 -0.09375 0.041667 -0.04167 0.125 -0.025 0.034091 0.089286 0.125 0 0.075
Mean 0.008333 -0.05339 0.028646 -0.0849 0.005208 -0.088 -0.01146 -0.00833 0.033333 -0.08542 -0.01843 -0.0131 0.041667 -0.04167 0.013542Std Dev 0.099303 0.123379 0.102633 0.134364 0.063042 0.009204 0.128622 0.14798 0.120905 0.059073 0.069266 0.071349 0.062639 0.03118 0.114229
tα/2 2.353 2.353 2.353 2.353 2.353 2.92 2.353 2.353 2.353 2.353 2.353 2.353 2.353 2.353 2.353
Count 4 4 4 4 4 3 4 4 4 4 4 4 4 4 4Confidence Level(90.0%)+ Conf. Interval 0.125163 0.09177 0.149393 0.073184 0.079377 -0.07248 0.139866 0.165765 0.175578 -0.01592 0.063065 0.070847 0.115361 -0.00498 0.147932- Conf. Interval -0.1085 -0.19854 -0.0921 -0.24298 -0.06896 -0.10351 -0.16278 -0.18243 -0.10891 -0.15492 -0.09992 -0.09704 -0.03203 -0.07835 -0.12085
Overage of Capabilities 0 0 0 0 0 0 0 0 0 0 0 0 0 0 0Underage of Capabilities 0 0 0 0 0 1** 0 0 0 1 0 0 0 1 0
Balanced Resilience 27Overage of Capability 0Underage of Capability 2
** 99% Confidence Level
Resilience Score

47
The results from the small-sample confidence interval of weapon system #10’s
SCRAM™ assessment results identified two positive resilience gaps, an overage of
capabilities verses vulnerabilities, at a confidence level of 90%, with V1 - R1.14 at a 95%
confidence level. Additionally, as shown above in Table 13, three negative resilience
gaps, an underage of capabilities verses vulnerabilities, are identified at a confidence
level of 90%, with R6.6 at a 99% confidence level. The low numbers of confidence
intervals that do not include the resilience mean score of zero, five out of 90, may be
attributed to many different variables. For example, the small sample size, the weapon
systems supply chain resilience may be balanced, or the subjective answers of the
selected respondents.
Investigative Question 3
The results of the SCRAM™ were next used to compare Phase I versus Phase II
of the weapon system life cycle to answer Investigative question 3. As stated in Chapter
III, the researcher used a nonparametric method to compare the distributions of Phase I
against Phase II to indicate differences in the phases as weapon systems mature from
Phase I to Phase II in the life cycle. The nonparametric method used was the Wilcoxon
rank sum test. This method does not specify the shape or type of probability distribution,
but does require two conditions for a valid test (McClave, Benson and Sincich, 2008)
1. The two samples are random and independent
2. The two probability distributions from which the samples are drawn are continuous.
The Wilcoxon rank sum test was calculated using two different methods, first the data
was entered into JMP 8, statistical software program, and the results are presented in

48
Table 14. The second method to calculate the Wilcoxon rank sum test used the formula
in Rice’s (1995) Mathematical Statistics and Data Analysis book. The results of this
method are presented in Table 15. The results of both methods are similar with the
Wilcoxon rank sum test calculated by the method in Rice’s (1995:402) book being more
conservative. The test identified one of the six vulnerability factors varied between Phase
I and Phase II at a confidence level of 90%, and six of the 15 capability factors varied
between Phase I and Phase II also at a confidence level of 90%. Table 16, identifies the
factors and the direction of the change.
Table 14: Wilcoxon rank sum test, JMP8
V1 V2 V3 V4 V5 V62-Sample Test, Normal Approx. 0.0828 1.0000 0.0277 0.1207 0.2353 0.46421-Way Test, ChiSquare 0.0679 1.0000 0.0219 0.1003 0.2012 0.4102Reject/Fail to Reject Reject Reject
C1 C2 C3 C4 C5 C6 C72-Sample Test, Normal Approx. 0.2353 0.0552 0.2353 0.4632 0.0225 0.2002 0.02251-Way Test, ChiSquare 0.2012 0.0446 0.2012 0.4092 0.0176 0.1699 0.0176Reject/Fail to Reject Reject Reject Reject
C8 C9 C10 C11 C12 C13 C14 C152-Sample Test, Normal Approx. 0.0222 0.0358 0.4113 0.0358 0.4113 0.7837 0.1207 0.1709 ChiSquare Approx. 0.0174 0.0285 0.3613 0.0285 0.3613 0.7144 0.1003 0.1441Reject/Fail to Reject Reject Reject RejectNull Hyp: Phase I = Phase IIAlt Hyp: Phase I ≠ Phase II

49
Table 15: Wilcoxon rank sum test (Rice, 1995)
V1 V2 V3 V4 V5 V6 C1 C2 C3 C4 C5 C6 C7 C8 C9 C10 C11 C12 C13 C14 C15W/S & Phase5 1 2.74 2.90 3.50 3.39 3.83 3.93 3.10 2.88 3.57 3.44 3.82 3.83 3.51 3.67 3.92 3.82 3.75 3.79 3.70 3.42 4.036 1 2.48 3.07 3.17 2.89 3.74 3.27 3.00 2.96 3.17 2.64 2.72 2.63 3.05 3.24 3.80 3.67 3.27 2.89 4.17 4.00 3.838 1 2.44 3.50 3.50 3.00 4.49 4.13 1.94 2.29 2.50 2.63 2.74 3.27 2.55 2.73 3.50 3.83 2.88 2.84 4.17 2.13 3.7210 1 3.11 3.28 3.29 2.79 3.38 3.58 3.30 2.98 3.50 2.91 3.25 3.16 3.47 3.51 3.43 3.10 3.52 3.64 3.63 3.25 3.5311 1 2.95 3.25 3.68 3.07 3.67 3.42 3.64 2.99 3.51 2.55 3.42 3.14 3.29 3.33 3.45 2.96 3.31 3.30 3.79 3.18 3.421 2 3.38 3.28 3.68 3.93 3.76 3.87 3.13 2.85 3.78 2.67 2.56 3.00 2.78 2.92 3.73 2.75 3.28 3.50 4.00 2.25 3.812 2 2.59 2.70 3.63 3.57 3.77 4.02 2.24 2.28 3.01 2.08 2.93 2.70 2.66 2.58 3.08 3.71 2.80 2.88 3.60 2.60 3.323 2 2.90 3.60 3.70 3.27 4.40 3.56 2.64 2.76 2.93 2.67 2.65 2.95 2.50 2.97 2.64 2.98 2.86 3.03 4.38 2.70 3.894 2 3.28 3.25 3.87 3.75 4.04 4.04 2.48 2.73 2.38 2.63 2.14 2.63 2.54 2.18 2.25 3.44 2.25 2.24 3.25 2.67 3.127 2 3.37 2.80 3.69 3.92 3.92 3.93 2.30 2.12 2.49 2.50 2.50 2.87 2.35 2.58 2.98 3.54 2.94 3.07 4.25 3.00 3.379 2 3.18 3.40 3.59 2.67 3.93 3.75 2.92 2.64 3.03 2.71 2.16 3.22 2.07 2.36 2.81 3.58 2.66 3.08 3.22 2.30 3.08
R 20.00 30.00 17.50 21.00 23.00 25.50 37.00 41.00 37.00 34.50 43.00 37.50 43.00 43.00 42.00 35.00 42.00 35.00 32.00 39.00 38.00
R' 40 30 42.5 39 37 34.5 23 19 23 25.5 17 22.5 17 17 18 25 18 25 28 21 22R* 20.00 30.00 17.50 21.00 23.00 25.50 23.00 19.00 23.00 25.50 17.00 22.50 17.00 17.00 18.00 25.00 18.00 25.00 28.00 21.00 22.00
α= 0.10 Reject Reject Reject Reject Reject Reject Reject
Critical Value of Smaller Rank Sum for the Wilcoxon Test is 20 (N1-5 and N2-6 for two-tailed test at .10)
Null Hyp: Phase I = Phase IIAlt Hyp: Phase I ≠ Phase II

50
Table 16: Difference between Phases
Summary
The data collected from the SCRAM™ 2.0 assessment of 11 weapon systems was
presented. The following chapter, Chapter V, will present the conclusions formulated for
answering the investigative questions and the overall research question. The researcher
will also present conclusions inferred from the results. Furthermore, managerial
implications and future research recommendations are also presented.
Factor Factor Factor
V1 C1 C8
V2 C2 C9
V3 C3 C10
V4 C4 C11
V5 C5 C12
V6 C6 C13
C7 C14C15
Indicates no significant difference
DecreasedDecreased
Decreased
Phase I to Phase II Phase I to Phase II Phase I to Phase II
Increased
Decreased
Decreased

51
V. Conclusions and Recommendations
Introduction
Previous research presented opportunities for improvement with the Air Force’s
supply chain management processes. This research investigated literature in the field of
supply chain resilience and identified the Supply Chain Resilience Assessment and
Management (SCRAM™) tool as an avenue for potential improvement with Air Force
supply chain risk management processes. Based on the results of this study’s SCRAM™
assessment of 11 weapon systems within the two defined phases of the weapon system
life cycle, the researcher provides an answer to the overall research question (Is the
SCRAM™ tool able to measure supply chain vulnerabilities and capabilities within the
USAF’s weapon system life cycle and provide useful feedback?). Following the answer
to the research question, the chapter continues with managerial implications, lessons
learned, and areas of future research.
Research Question
The information from Chapters II-IV provided the basis for answering the three
investigative questions and the overall research question. The researcher interpreted from
the analysis and results that the SCRAM™ demonstrated the ability to measure
vulnerabilities and capabilities within the defined weapon system life cycle phases and
the information obtained can provide beneficial information to guide those that manage
Air Force weapon systems as their weapon system matures and progress throughout the
life cycle. Though, these results are not without limitations, the results show promise for
the utility of supply chain resilience to enhance current Air Force risk management
processes.

52
Managerial Implications
The SCRAM™ tool assessment results have show in previous research that the
assessment tool can identify an organization’s current level of resilience by measuring the
organization’s supply chain vulnerabilities and capabilities (Pettit, 2008). The results
from this research obtained the same conclusions. Additionally, the analysis and results
in Chapter IV demonstrate that the SCRAM™ tool can target an imbalance of specific
vulnerabilities and capabilities. This information can provide weapon system leadership
the ability to further investigate and apply corrective measures if deemed appropriate.
The results from comparing the defined phases of the weapon system life cycle
produced promising results that there are changes in vulnerabilities and capabilities as
weapon systems progress throughout the weapon system life cycle. This information can
be very beneficial to weapon system managers in providing the necessary information for
strategic decisions as they plan for the next 5, 10, 15, 20 years and beyond. Furthermore,
since the AFGLSC is the organization responsible for the Air Force’s supply chain. This
information may be beneficial for instituting policy on supply chain management.
Future Research
The researcher tried to be as thorough as possible in this study, but realizes that
there are many opportunities for improvement and future research. A more targeted
study of one or two weapon systems with a larger sample size would be beneficial to the
research of supply chain resilience within the USAF’s weapon system life cycle.
Additionally, this researcher believes the research could be expanded by dividing the
weapon system life cycle into more distinct phases to identify more differences as
weapon systems mature through the life cycle. This research only focused on the weapon

53
system’s supply chain resilience from the perspective of personnel in that weapon
system. Future research could explore the supply chain from not only the weapon system
perspective, but also the suppliers and customers up and down the supply chain.
Furthermore, the opportunity to conduct cost analysis studies of supply chain resilience
would be beneficial to assist with future implementation within the USAF weapon system
life cycle.

54
Appendix A: Assessment Support Request Letter
Note: Distribution list not included in this document

55
Appendix B: Modified SCRAM™ 2.0

56
Weapon Systems Blocked for Anonymity

57

58

59

60

61

62
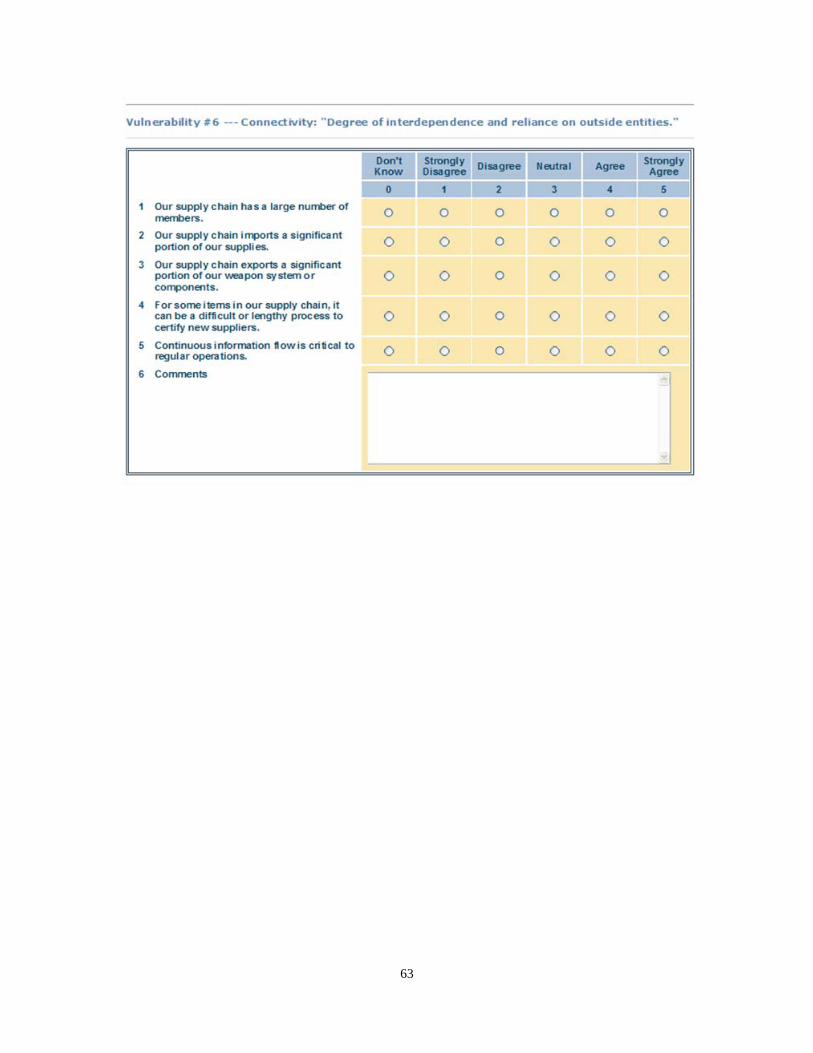
63

64

65

66
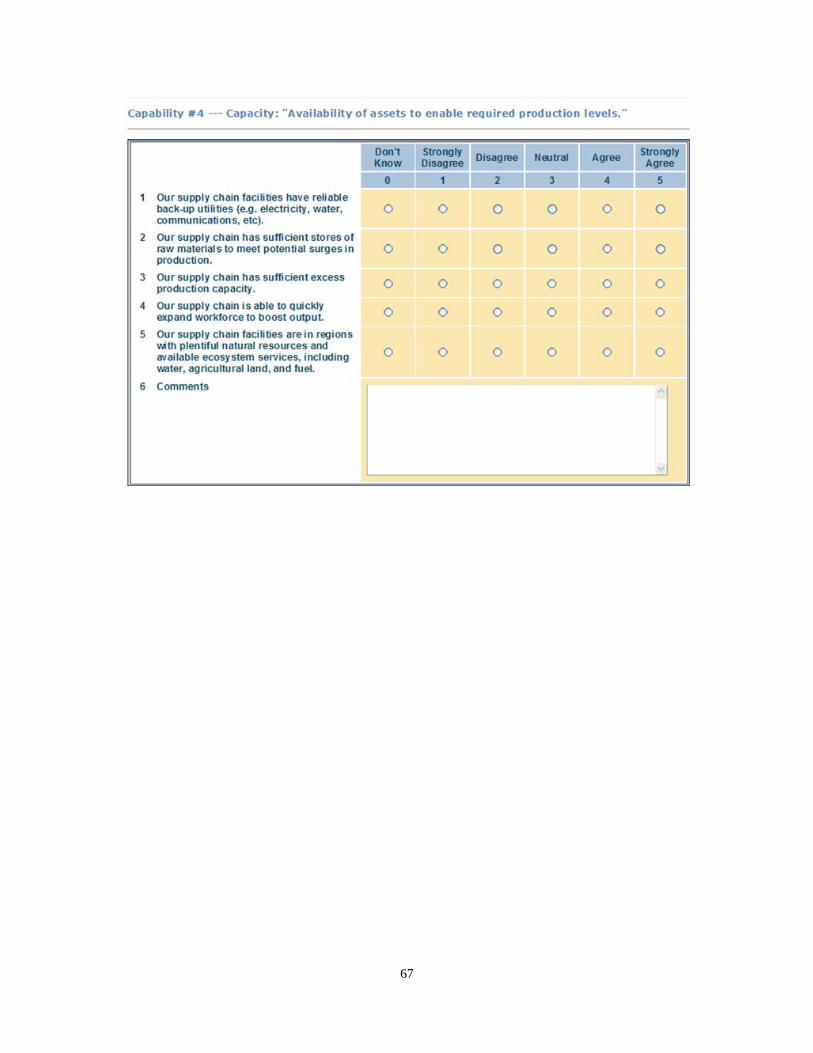
67

68
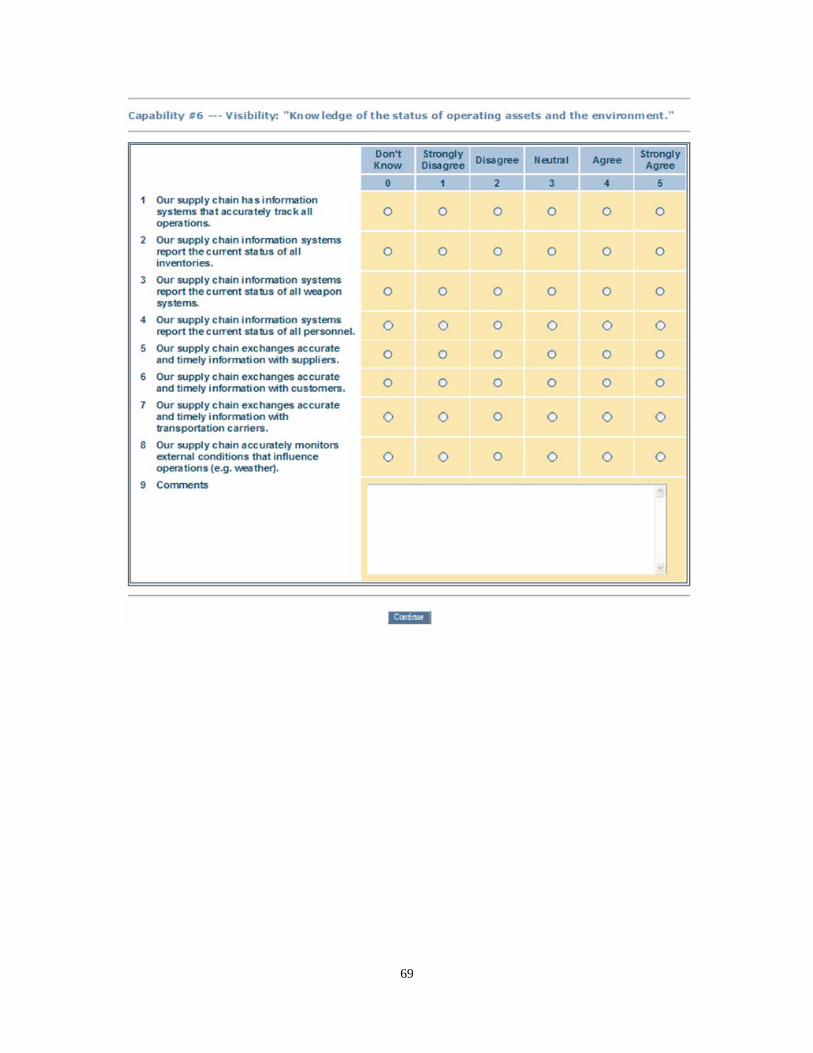
69

70

71
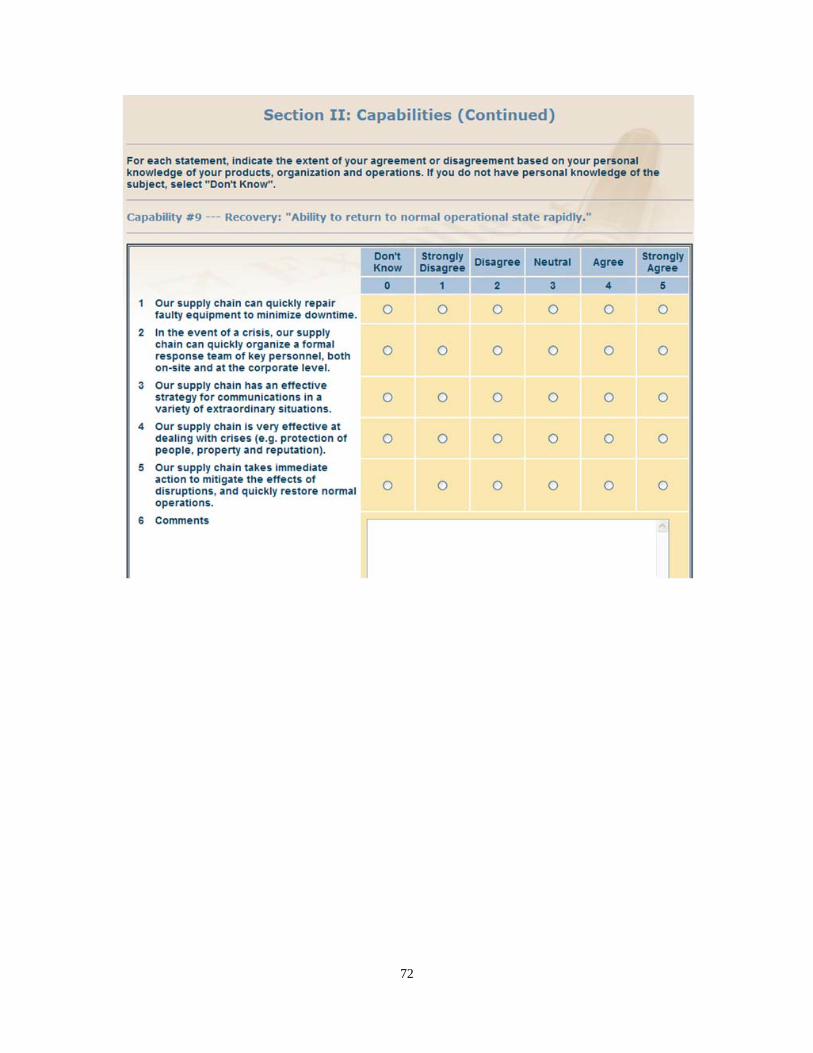
72

73
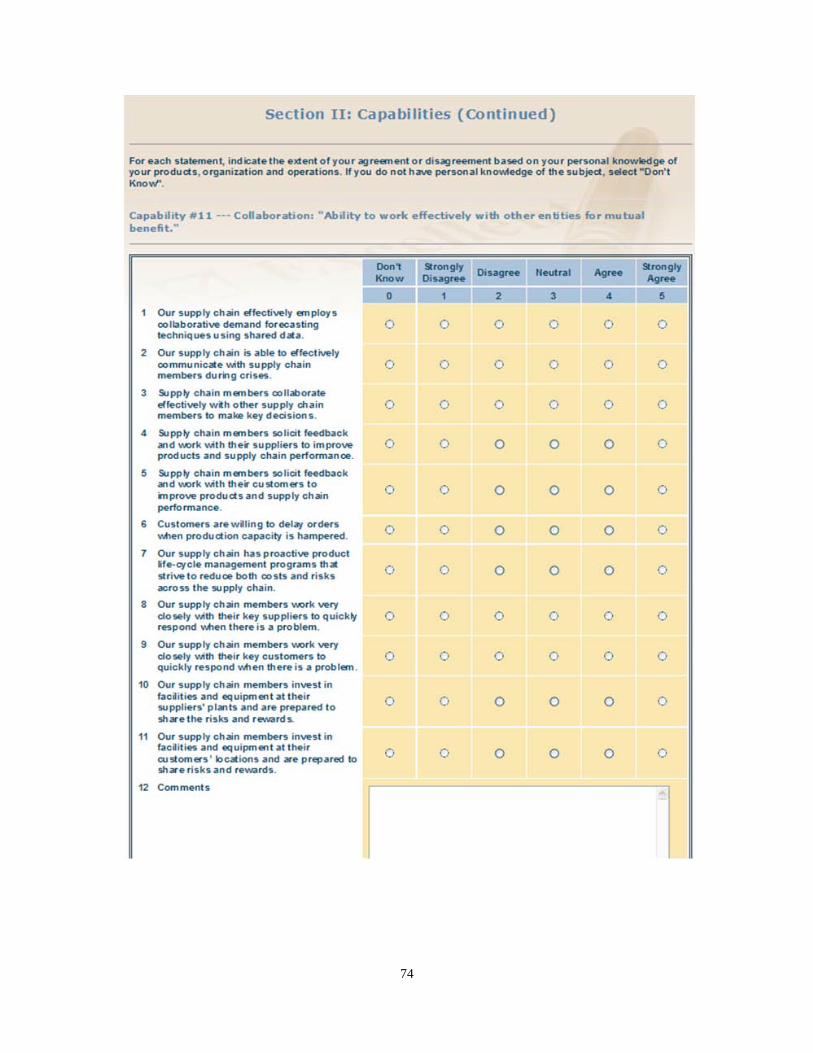
74

75
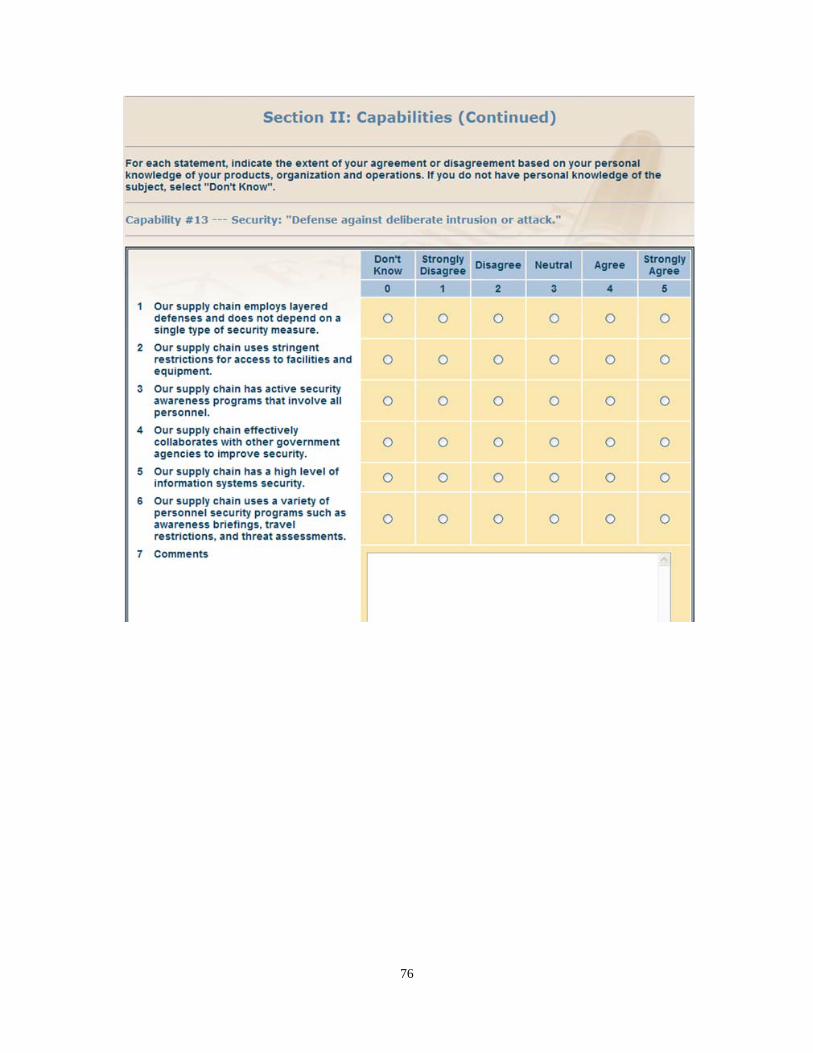
76

77

78

79
Appendix C: Confidence Interval for Weapon System #10; V1-V6
V1Resondents R1.1 R1.2 R1.3 R1.4 R1.5 R1.6 R1.7 R1.8 R1.9 R1.10 R1.11 R1.12 R1.13 R1.14 R1.15A 0.216667 0.1875 0.260417 0.125 0.166667 0.229167 0.291667 0.229167 0.016667 0.138889 0.066667 0.104167 0.041667 0.229167B 0.15 0.025 -0.01667 0.025 0.025 0.05625 0.0625 -0.125 0.025 0.025 -0.02857 0.05625 0.025 0.025C -0.05 -0.20833 -0.10417 -0.28125 -0.10417 -0.14286 -0.20833 -0.2 -0.0625 -0.125 -0.14063 -0.125 0 -0.125 -0.16667D 0.067857 0.033482 0.142857 0.017857 0.142857 0.107143 0.117857 0.142857 0.067857 0.017857 0.12013 0.142857 0.16369 0.142857 0.142857E 0.096429 0.071429 0.113095 0.096429 0.113095 -0.02232 0.113095 0.029762 0.196429 0.046429 0.105519 0.160714 0.196429 0.071429 0.146429
Mean 0.09619 0.021815 0.079107 -0.01049 0.06869 -0.00826 0.061607 0.065357 0.06119 -0.00381 0.049783 0.043333 0.104107 0.03119 0.075357Std Dev 0.099479 0.144073 0.142174 0.186104 0.110522 0.104464 0.163392 0.179521 0.155335 0.068793 0.114961 0.12014 0.079376 0.098275 0.153603tα/2 2.132 2.132 2.132 2.353 2.132 2.353 2.132 2.132 2.132 2.132 2.132 2.132 2.132 2.132 2.132Count 5 5 5 4 5 4 5 5 5 5 5 5 5 5 5Confidence Level(90.0%)+ Conf. Interval 0.19104 0.159183 0.214665 0.20846 0.174069 0.114643 0.217395 0.236524 0.209296 0.061781 0.159394 0.157882 0.179789 0.124892 0.221812- Conf. Interval 0.001341 -0.11555 -0.05645 -0.22944 -0.03669 -0.13116 -0.09418 -0.10581 -0.08692 -0.0694 -0.05983 -0.07121 0.028426 -0.06251 -0.0711
Overage of Capabilities 1* 0 0 0 0 0 0 0 0 0 0 0 1 0 0Underage of Capabilities 0 0 0 0 0 0 0 0 0 0 0 0 0 0 0
Balanced Resilience 28Overage of Capability 2Underage of Capability 0
Resilience Score
* 95% Confidence Level

80
V2Respondents R2.1 R2.2 R2.3 R2.4 R2.5 R2.6 R2.7 R2.8 R2.9 R2.10 R2.11 R2.12 R2.13 R2.14 R2.15A 0.125 0.095833 0.16875 0.033333 0.075 0.1375 0.2 0.1375 -0.075 0.047222 -0.025 0.0125 -0.05 0.1375B 0.275 0.15 0.108333 0.15 0.15 0.18125 0.1875 0 0.15 0.15 0.096429 0.18125 0.15 0.15C -0.1 -0.25833 -0.15417 -0.33125 -0.15417 -0.19286 -0.25833 -0.25 -0.1125 -0.175 -0.19063 -0.175 -0.05 -0.175 -0.21667D -0.0125 -0.04688 0.0625 -0.0625 0.0625 0.026786 0.0375 0.0625 -0.0125 -0.0625 0.039773 0.0625 0.083333 0.0625 0.0625E 0.15 0.125 0.166667 0.15 0.166667 0.03125 0.166667 0.083333 0.25 0.1 0.159091 0.214286 0.25 0.125 0.2
Mean 0.0875 0.013125 0.070417 -0.0526 0.06 0.003795 0.052917 0.056667 0.0525 -0.0125 0.041092 0.034643 0.095417 0.0225 0.066667Std Dev 0.146309 0.169839 0.133109 0.205081 0.128039 0.142981 0.182809 0.181969 0.141808 0.134048 0.140994 0.145235 0.121892 0.134745 0.165857tα/2 2.132 2.132 2.132 2.353 2.132 2.353 2.132 2.132 2.132 2.132 2.132 2.132 2.132 2.132 2.132Count 5 5 5 4 5 4 5 5 5 5 5 5 5 5 5Confidence Level(90.0%)+ Conf. Interval 0.226999 0.17506 0.19733 0.188674 0.18208 0.172011 0.227218 0.230167 0.187708 0.115309 0.175524 0.173118 0.211636 0.150974 0.224805- Conf. Interval -0.052 -0.14881 -0.0565 -0.29388 -0.06208 -0.16442 -0.12138 -0.11683 -0.08271 -0.14031 -0.09334 -0.10383 -0.0208 -0.10597 -0.09147
Overage of Capabilities 0 0 0 0 0 0 0 0 0 0 0 0 0 0 0Underage of Capabilities 0 0 0 0 0 0 0 0 0 0 0 0 0 0 0
Balanced Resilience 30Overage of Capability 0Underage of Capability 0
Resilience Score

81
V3Respondents R3.1 R3.2 R3.3 R3.4 R3.5 R3.6 R3.7 R3.8 R3.9 R3.10 R3.11 R3.12 R3.13 R3.14 R3.15A 0.008333 -0.02083 0.052083 -0.08333 -0.04167 0.020833 0.083333 0.020833 -0.19167 -0.06944 -0.14167 -0.10417 -0.16667 0.020833B 0.145833 0.020833 -0.02083 0.020833 0.020833 0.052083 0.058333 -0.12917 0.020833 0.020833 -0.03274 0.052083 0.020833 0.020833C -0.175 -0.33333 -0.22917 -0.40625 -0.22917 -0.26786 -0.33333 -0.325 -0.1875 -0.25 -0.26563 -0.25 -0.125 -0.25 -0.29167D 0.05 0.015625 0.125 0 0.125 0.089286 0.1 0.125 0.05 0 0.102273 0.125 0.145833 0.125 0.125E 0.108333 0.083333 0.125 0.108333 0.125 -0.01042 0.125 0.041667 0.208333 0.058333 0.117424 0.172619 0.208333 0.083333 0.158333
Mean 0.0275 -0.04688 0.010417 -0.09531 -2.2E-17 -0.04204 -0.00708 -0.00333 -0.0075 -0.0725 -0.01891 -0.02536 0.035417 -0.0375 0.006667Std Dev 0.124917 0.164455 0.146945 0.221647 0.146575 0.156197 0.186837 0.182536 0.156442 0.138557 0.156743 0.177376 0.147975 0.16298 0.177771tα/2 2.132 2.132 2.132 2.353 2.132 2.353 2.132 2.132 2.132 2.132 2.132 2.132 2.132 2.132 2.132Count 5 5 5 4 5 4 5 5 5 5 5 5 5 5 5Confidence Level(90.0%)+ Conf. Interval 0.146603 0.109926 0.150523 0.165455 0.139754 0.141728 0.171058 0.170707 0.141661 0.059608 0.130541 0.143763 0.176505 0.117895 0.176164- Conf. Interval -0.0916 -0.20368 -0.12969 -0.35608 -0.13975 -0.2258 -0.18522 -0.17737 -0.15666 -0.20461 -0.16836 -0.19448 -0.10567 -0.19289 -0.16283
Overage of Capabilities 0 0 0 0 0 0 0 0 0 0 0 0 0 0 0Underage of Capabilities 0 0 0 0 0 0 0 0 0 0 0 0 0 0 0
Balanced Resilience 30Overage of Capability 0Underage of Capability 0
Resilience Score

82
V4Respondents R4.1 R4.2 R4.3 R4.4 R4.5 R4.6 R4.7 R4.8 R4.9 R4.10 R4.11 R4.12 R4.13 R4.14 R4.15A -0.075 -0.10417 -0.03125 -0.16667 -0.125 -0.0625 0 -0.0625 -0.275 -0.15278 -0.225 -0.1875 -0.25 -0.0625B 0.166667 0.041667 0 0.041667 0.041667 0.072917 0.079167 -0.10833 0.041667 0.041667 -0.0119 0.072917 0.041667 0.041667C 0.075 -0.08333 0.020833 -0.15625 0.020833 -0.01786 -0.08333 -0.075 0.0625 0 -0.01563 0 0.125 0 -0.04167D 0.133333 0.098958 0.208333 0.083333 0.208333 0.172619 0.183333 0.208333 0.133333 0.083333 0.185606 0.208333 0.229167 0.208333 0.208333E 0.066667 0.041667 0.083333 0.066667 0.083333 -0.05208 0.083333 0 0.166667 0.016667 0.075758 0.130952 0.166667 0.041667 0.116667
Mean 0.073333 -0.00104 0.05625 -0.04323 0.045833 0.036086 0.03875 0.0425 0.038333 -0.02667 0.026926 0.020476 0.08125 0.008333 0.0525Std Dev 0.092684 0.088112 0.094786 0.136755 0.120041 0.098921 0.110923 0.107545 0.120163 0.142327 0.124384 0.165243 0.160768 0.165097 0.112485tα/2 2.132 2.132 2.132 2.353 2.132 2.353 2.132 2.132 2.132 2.132 2.132 2.132 2.132 2.132 2.132Count 5 5 5 4 5 4 5 5 5 5 5 5 5 5 5Confidence Level(90.0%)+ Conf. Interval 0.161704 0.082969 0.146625 0.117663 0.160287 0.152467 0.14451 0.14504 0.152904 0.109036 0.14552 0.178029 0.234536 0.165746 0.159749- Conf. Interval -0.01504 -0.08505 -0.03412 -0.20412 -0.06862 -0.08029 -0.06701 -0.06004 -0.07624 -0.16237 -0.09167 -0.13708 -0.07204 -0.14908 -0.05475
Overage of Capabilities 0 0 0 0 0 0 0 0 0 0 0 0 0 0 0Underage of Capabilities 0 0 0 0 0 0 0 0 0 0 0 0 0 0 0
Balanced Resilience 30Overage of Capability 0Underage of Capability 0
Resilience Score

83
V5Respondents R5.1 R5.2 R5.3 R5.4 R5.5 R5.6 R5.7 R5.8 R5.9 R5.10 R5.11 R5.12 R5.13 R5.14 R5.15A -0.03929 -0.06845 0.004464 -0.13095 -0.08929 -0.02679 0.035714 -0.02679 -0.23929 -0.11706 -0.18929 -0.15179 -0.21429 -0.02679B 0.25 0.125 0.083333 0.125 0.125 0.15625 0.1625 -0.025 0.125 0.125 0.071429 0.15625 0.125 0.125C -0.10556 -0.26389 -0.15972 -0.33681 -0.15972 -0.19841 -0.26389 -0.25556 -0.11806 -0.18056 -0.19618 -0.18056 -0.05556 -0.18056 -0.22222D -0.02813 -0.0625 0.046875 -0.07813 0.046875 0.011161 0.021875 0.046875 -0.02813 -0.07813 0.024148 0.046875 0.067708 0.046875 0.046875E 0.011111 -0.01389 0.027778 0.011111 0.027778 -0.10764 0.027778 -0.05556 0.111111 -0.03889 0.020202 0.075397 0.111111 -0.01389 0.061111
Mean 0.017629 -0.05675 0.000546 -0.13369 -0.00987 -0.04247 -0.01695 -0.0132 -0.01737 -0.08237 -0.02878 -0.03523 0.025546 -0.04737 -0.0032Std Dev 0.136515 0.139595 0.094131 0.147556 0.113567 0.140816 0.153771 0.156047 0.082018 0.140689 0.127147 0.137121 0.126695 0.146043 0.133796tα/2 2.132 2.132 2.132 2.353 2.132 2.353 2.132 2.132 2.132 2.132 2.132 2.132 2.132 2.132 2.132Count 5 5 5 4 5 4 5 5 5 5 5 5 5 5 5Confidence Level(90.0%)+ Conf. Interval 0.147791 0.076352 0.090296 0.039907 0.09841 0.123197 0.12966 0.13558 0.060829 0.05177 0.092451 0.095511 0.146344 0.091875 0.124365- Conf. Interval -0.11253 -0.18984 -0.0892 -0.30729 -0.11815 -0.20814 -0.16357 -0.16199 -0.09557 -0.21651 -0.15001 -0.16597 -0.09525 -0.18662 -0.13077
Overage of Capabilities 0 0 0 0 0 0 0 0 0 0 0 0 0 0 0Underage of Capabilities 0 0 0 0 0 0 0 0 0 0 0 0 0 0 0
Balanced Resilience 30Overage of Capability 0Underage of Capability 0
Resilience Score

84
V6Respondents R6.1 R6.2 R6.3 R6.4 R6.5 R6.6 R6.7 R6.8 R6.9 R6.10 R6.11 R6.12 R6.13 R6.14 R6.15A 0.125 0.095833 0.16875 0.033333 0.075 0.1375 0.2 0.1375 -0.075 0.047222 -0.025 0.0125 -0.05 0.1375BC 0 -0.15833 -0.05417 -0.23125 -0.05417 -0.09286 -0.15833 -0.15 -0.0125 -0.075 -0.09063 -0.075 0.05 -0.075 -0.11667D -0.11667 -0.15104 -0.04167 -0.16667 -0.04167 -0.07738 -0.06667 -0.04167 -0.11667 -0.16667 -0.06439 -0.04167 -0.02083 -0.04167 -0.04167E 0.025 0 0.041667 0.025 0.041667 -0.09375 0.041667 -0.04167 0.125 -0.025 0.034091 0.089286 0.125 0 0.075
Mean 0.008333 -0.05339 0.028646 -0.0849 0.005208 -0.088 -0.01146 -0.00833 0.033333 -0.08542 -0.01843 -0.0131 0.041667 -0.04167 0.013542Std Dev 0.099303 0.123379 0.102633 0.134364 0.063042 0.009204 0.128622 0.14798 0.120905 0.059073 0.069266 0.071349 0.062639 0.03118 0.114229tα/2 2.353 2.353 2.353 2.353 2.353 2.92 2.353 2.353 2.353 2.353 2.353 2.353 2.353 2.353 2.353Count 4 4 4 4 4 3 4 4 4 4 4 4 4 4 4Confidence Level(90.0%)+ Conf. Interval 0.125163 0.09177 0.149393 0.073184 0.079377 -0.07248 0.139866 0.165765 0.175578 -0.01592 0.063065 0.070847 0.115361 -0.00498 0.147932- Conf. Interval -0.1085 -0.19854 -0.0921 -0.24298 -0.06896 -0.10351 -0.16278 -0.18243 -0.10891 -0.15492 -0.09992 -0.09704 -0.03203 -0.07835 -0.12085
Overage of Capabilities 0 0 0 0 0 0 0 0 0 0 0 0 0 0 0Underage of Capabilities 0 0 0 0 0 1** 0 0 0 1 0 0 0 1 0
Balanced Resilience 27Overage of Capability 0Underage of Capability 2
** 99% Confidence Level
Resilience Score
85
Appendix D: Blue Dart
SMSgt Brian P. Tobin, Student, AFIT [email protected] Word Count: 506
Supply Chain Resilience
Supply chains throughout the world have become very complex and the USAF is
no exception. The USAF’s supply chain is one of the largest and most complex supply
chains in the world. Due to the complexity of supply chains, organizations cannot rely on
traditional risk management processes to protect them from unforeseen events. Supply
chains must become more resilient. Supply chain resilience is defined many different
ways. One definition from The Ohio State University’s Center for Resilience is the
capacity of a system to survive, adapt, and grow in the face of unforeseen changes, even
catastrophic incidents.
In 2003, the Department of Defense (DoD) directed the implementation of
modern supply chain practices for all DoD components with the release of DoD 4140.1-
R, Supply Chain Material Management Regulation. Under this guidance, the Air Force
created the Global Logistics Support Center (AFLGSC), which is responsible for
improving supply chain processes within the Air Force. A collaboration effort between
Air Force Institute of Technology and the AFGLSC enabled the research of supply chain
resilience as a potential enhancement to Air Force traditional risk management processes.
Through literature, a supply chain resilience framework and measurement tool
was identified to determine potential benefit to current Air Force supply chain
management processes. Individual Air Force weapon system acquisition and sustainment
programs were identified and segmented into two distinct phases of the weapon system
86
life cycle. The phases included; Phase I – concept through production, and Phase II –
post production through disposal. This research analyzed data from individual weapon
system program office self-assessments to compare the two phases, Phase I and Phase II.
The self-assessments measured supply chain resilience in two factors, vulnerabilities and
capabilities. In this research, vulnerabilities are defined as fundamental factors that make
an enterprise susceptible to disruptions and capabilities are defined as attributes that
enable an enterprise to anticipate and overcome disruptions.
The results of the study indicate that the supply chain resilience framework and
measurement tool provides leadership with beneficial information to improve and assist
in the management of their specific weapon system’s supply chain, as well as, providing
insight into changes required as weapon systems mature in the life cycle. First, the
individual weapon system assessments provide leadership with an overall resilience score
identifying vulnerabilities and capabilities in their supply chain. Once identified,
corrective action required to achieve a balanced resilience can be taken. For example, an
overage in vulnerabilities requires more attention to capabilities to reduce risk. However,
an overage in capabilities provides managers an opportunity for resource reduction or
moving resources to other high risk areas. Furthermore, the second benefit is the
identification of measurable differences in the results of the Phase I and Phase II
comparison. This information allows Air Force leadership to proactively manage risk by
providing insight to specific supply chain vulnerabilities and capabilities between the
different life cycle phases. This information assists Air Force leadership with strategic
planning of weapon systems as they mature and progress through the life cycle.

87
Appendix E: Supply Chain Resilience Storyboard

88
Bibliography
Air Force Global Logistics Support Center. Concept of Operations, Wright Patterson Air Force Base, OH, AFGLSC, 30 April 2008 Air Force Global Logistics Support Center. Maj. Gen. Gary McCoy, Commander, 15 May 2009 Briefing, Scott Air Force Base, IL AFGLSC, 15 May 2009. Breen, B., & Aneiro, M. (2004). Living in dell time. Fast Company, (88), 86-96. Christopher, Martin (1992), Logistics and supply chain management, London: Pitman Publishing. Christopher, Martin and Helen Peck (2004), “Building the resilient supply chain,” International Journal of Logistics Management, Vol. 15, No. 2, pp. 1-13. Cranfield University (2002), Supply chain vulnerability: Executive report, School of Business, Cranfield University. Cranfield University (2003), Creating resilient supply chain: A practical guide, Centre for Logistics and Supply Chain Management, School of Business, Cranfield University. Defense Acquisition Guidebook., https://akss.dau.mil/dag/welcome.asp, Accessed 2 June 2009. Department of Defense. Operation of the Defense Acquisition System, DoD Instruction 5000.02. Washington: GPO, 8 December 2008. Dillman, Don A. (2000), Mail and Internet surveys: The tailored design method, New York: Wiley. Fiksel, Joseph (2003), “Designing resilient, sustainable systems,” Environmental Science & Technology, Vol. 37, No. 23, pp. 5330-5339. Fiksel, Joseph (2006), “Sustainability and resilience: Toward a systems approach,” Sustainability: Science, Practice & Policy, Vol. 2, No. 2, pp. 1-8. Folke, Carl, Steve Carpenter, Brian Walker, Marten Scheffer, Thomas Elmqvist and Lance Gunderson, (2004), “Regime shifts, resilience and biodiversity in ecosystem management,” Annual Review of Ecology, Evolution, & Systematics, Vol. 35, No. 1, pp. 557-581. Gorman, Christine, Sarah S. Dale, Wendy Grossman, Kathie Klarreich, Jeanne McDowell and Leslie Whitaker (2005), “The importance of resilience,” Time Canada, Vol. 165, No. 3, pp. 76-79.

89
Griffis, Stanley E., Thomas J. Goldsby and Martha Cooper (2003), “Web based and mail surveys: A comparison of response, data and cost,” Journal of Business Logistics, Vol. 24, No. 2, pp. 237-258. Kunreuther, Howard (2006), “Risk and reaction,” Harvard International Review, Vol. 28, No. 3, pp. 37-42. Lambert, Douglas M., Sebastián J. García-Dastugue and Keely L. Croxton (2005), “An evaluation of process-oriented supply chain management frameworks,” Journal of Business Logistics, Vol. 26, No. 1, pp. 25-51. Manuele, Fred A. (2005), “Risk assessment & hierarchies of control,” Professional Safety, Vol. 50, No. 5, pp. 33-39. Maronick, T. (2009). The role of the internet in survey research: Guidelines for researchers and experts. [none] Journal of Global Business and Technology, 5(1), 18-15. McClave, James T. and others (2008), Statistics for Business and Economics (10th Edition). Upper Saddle River, NJ.: Pearson Education, Inc., 2008. Mentzer, John T., William DeWitt, James Keebler, Min Soonhoong, Nancy Nix, Carlo Smith and Zach Zacharia, (2001) “Defining supply chain management,” Journal of Business Logistics, Vol. 22, No. 2, pp. 1-25. Merriam-Webster (2007), Merriam-Webster Dictionary, Springfield, MA: Merriam- Webster, Inc. Office of the Deputy Under Secretary of Defense for Logistics and Material Readiness, DoD 4140.1-R Supply Chain Material Management Regulation, 23 May 2003, (Online) Available: www.ditc.mil/whs/directives/corres/pdf/4140r.pdf, accessed 21 Jan 2010. Peck, Helen (2005), “Drivers of supply chain vulnerability: An integrated framework,” International Journal of Physical Distribution & Logistics Management, Vol. 35, No. 4, pp. 210-232. Pettit, T. J. (2008). Supply chain resilience: Development of a conceptual framework, an assessment tool and an implementation process, PhD dissertation, The Ohio State University, Columbus, OH. Pettit, Timothy J., Joseph Fiksel and Keely L. Croxton (2010), “Ensuring supply chain resilience: Development of a conceptual framework,” Journal of Business Logistics, Spring edition (forthcoming). Pettit, Timothy J. (2010b) Assistant Professor, Air Force Institute of Technology, Wright Patterson Air Force Base, OH. Personal Interview. 23 February 2010.

90
Ponomarov, S. Y., & Holcomb, M. C. (2009). Understanding the concept of supply chain resilience. International Journal of Logistics Management, 20(1), 124-143. Rice Jr., James B. and Caniato, Federico (2003), “Building a secure and resilient supply network,” Supply Chain Management Review, Vol. 7, No. 5, pp. 22-30. Rice, John A. (1995), Mathematical Statistics and Data Analysis (2nd Edition). Belmont, CA: Wadsworth Publishing Company, 1995. Russell, S. H. (2007). Supply chain management: More than integrated logistics. (cover story). Air Force Journal of Logistics, 31(2), 56-63. Sheffi, Yossi, (2005). Building a Resilient Supply Chain. Harvard Business Review, Vol 1, No 8, pp. 1-4. Sheffi, Yossi, (2005b), The resilient enterprise: Overcoming vulnerability for competitive advantage, Cambridge, MA: MIT Press. Stock, J. R., & Boyer, S. L. (2009). Developing a consensus definition of supply chain management: A qualitative study. International Journal of Physical Distribution & Logistics Management, 39(8), 690-711. Stoltz, Paul G. (2004), “Building resilience for uncertain times,” Leader to Leader, Winter 2004, No. 31, pp. 16-20. The Ohio State University News Advisory, (2009), “Ohio State Secures Dow Chemical to Sponsor Global Supply Chain Resilience Research Program,” http://www.resilience.osu.edu/CFR-site/pdf/Dow_Resilience.pdf, accessed May 17, 2009. VanderBok, Ray, John A. Sauter, Chris Bryan and Jennifer Horan (2007), “Manage Your Supply Chain Risk”, Manufacturing Engineering, 138, 3, pp. 153-161. Yin, Robert K. (2003), Case study research: Design and methods (3rd ed.), Thousand Oaks, CA: Sage Publications, Inc.

REPORT DOCUMENTATION PAGE Form Approved OMB No. 074-0188
The public reporting burden for this collection of information is estimated to average 1 hour per response, including the time for reviewing instructions, searching existing data sources, gathering and maintaining the data needed, and completing and reviewing the collection of information. Send comments regarding this burden estimate or any other aspect of the collection of information, including suggestions for reducing this burden to Department of Defense, Washington Headquarters Services, Directorate for Information Operations and Reports (0704-0188), 1215 Jefferson Davis Highway, Suite 1204, Arlington, VA 22202-4302. Respondents should be aware that notwithstanding any other provision of law, no person shall be subject to an penalty for failing to comply with a collection of information if it does not display a currently valid OMB control number. PLEASE DO NOT RETURN YOUR FORM TO THE ABOVE ADDRESS. 1. REPORT DATE (DD-MM-YYYY)
12-03-2010 2. REPORT TYPE
Thesis 3. DATES COVERED (From – To)
Aug 2008 – Mar 2010 4. TITLE AND SUBTITLE SUPPLY CHAIN RESILIENCE: ASSESSING USAF WEAPON SYSTEM LIFE CYCLE
5a. CONTRACT NUMBER
5b. GRANT NUMBER
5c. PROGRAM ELEMENT NUMBER
6. AUTHOR(S) Tobin, Brian P., Senior Master Sergeant, USAF
5d. PROJECT NUMBER 5e. TASK NUMBER
5f. WORK UNIT NUMBER
7. PERFORMING ORGANIZATION NAMES(S) AND ADDRESS(S) Air Force Institute of Technology Graduate School of Engineering and Management (AFIT/EN) 2950 Hobson Street, Building 642 WPAFB OH 45433-7765
8. PERFORMING ORGANIZATION REPORT NUMBER AFIT/LSCM/ENS/10-11
9. SPONSORING/MONITORING AGENCY NAME(S) AND ADDRESS(ES) AFGLSC/CA Attn: Mrs. Lorna Estep 5215 Thurlow St. Suite 4 Bldg 70C DSN: 785-4539 WPAFB OH 45433-5547 e-mail: [email protected]
10. SPONSOR/MONITOR’S ACRONYM(S) 11. SPONSOR/MONITOR’S REPORT NUMBER(S)
12. DISTRIBUTION/AVAILABILITY STATEMENT APPROVED FOR PUBLIC RELEASE; DISTRIBUTION UNLIMITED.
13. SUPPLEMENTARY NOTES 14. ABSTRACT The Air Force Global Logistics Support Center (AFGLSC) is responsible for the United States Air Force’s supply chain. One of the AFGLSC’s responsibilities is to improve AF supply chain processes. This thesis investigates the subject of supply chain resilience and its potential impact for improving supply chain management. Through literature a supply chain resilience framework and measurement tool was identified for potential benefit to Air Force supply chain management. Air Force weapon systems were identified and segmented into two phases of the weapon system life cycle. This research analyzes data collected on supply chain resilience factors, vulnerabilities and capabilities, for each individual weapon system to determine if differences exist as weapon systems progress through the weapon system life cycle. The results indicate that the supply chain resilience framework and measurement tool provides Air Force leadership with beneficial information to improve and assist in the strategic management of their supply chain. 15. SUBJECT TERMS Supply chain management, Supply chain resilience, Resilience, Vulnerability, Capability
16. SECURITY CLASSIFICATION OF: 17. LIMITATION OF ABSTRACT
UU
18. NUMBER OF PAGES
102
19a. NAME OF RESPONSIBLE PERSON Timothy J. Pettit, Lt Col, USAF (ENS)
a. REPORT
U
b. ABSTRACT
U
c. THIS PAGE
U
19b. TELEPHONE NUMBER (Include area code) (937) 255-3636, ext 4525; e-mail: [email protected]
Standard Form 298 (Rev. 8-98) Prescribed by ANSI Std. Z39-18