
AIR DISPERSION MODELING REPORT WILSON … DISPERSION MODELING REPORT WILSON STATION SO2 DESIGNATION...
27
Environmental solutions delivered uncommonly well AIR DISPERSION MODELING REPORT WILSON STATION SO2 DESIGNATION ANALYSIS REVISION 1 Prepared for: Mark Bertram Manager, Environmental Big Rivers Electric Corporation 201 Third Street Henderson, KY 42420 Prepared By: TRINITY CONSULTANTS 1717 Dixie Highway Suite 900 Covington, Kentucky 41011 Project 151801.0045 August 25, 2015
Transcript of AIR DISPERSION MODELING REPORT WILSON … DISPERSION MODELING REPORT WILSON STATION SO2 DESIGNATION...

Environmental solutions delivered uncommonly well
AIR DISPERSION MODELING REPORT
WILSON STATION SO2 DESIGNATION ANALYSIS
REVISION 1
Preparedfor:MarkBertram
Manager,EnvironmentalBigRiversElectricCorporation
201ThirdStreetHenderson,KY42420
PreparedBy:
TRINITYCONSULTANTS1717DixieHighway
Suite900Covington,Kentucky41011
Project151801.0045
August25,2015

1-0 Big Rivers Electric Corporation – Wilson Station 1-Hour SO2 NAAQS Designation Modeling Report
TABLE OF CONTENTS
1.EXECUTIVESUMMARY 1-3
2.INTRODUCTION 2-0 2.1.FacilityInformation..............................................................................................................................................2‐0 2.2.BasisforAnalysis...................................................................................................................................................2‐1 2.3.RegulatoryBackground.......................................................................................................................................2‐2 2.4.EmissionRatesforWilsonStation...................................................................................................................2‐3
3.1‐HOURSO2DESIGNATIONMODELINGMETHODOLOGY 3-0 3.1.ModelSelection......................................................................................................................................................3‐0 3.2.RuralUrbanOptioninAERMOD.......................................................................................................................3‐1 3.3.MeteorologicalData..............................................................................................................................................3‐3
3.3.1.SurfaceData................................................................................................................................................................................3‐4 3.3.2.UpperAirData...........................................................................................................................................................................3‐5 3.3.3.LandUseAnalysis......................................................................................................................................................................3‐5
3.4.CoordinateSystem................................................................................................................................................3‐6 3.5.ReceptorLocations...............................................................................................................................................3‐6 3.6.TerrainElevations.................................................................................................................................................3‐9 3.7.WilsonStationEmissionSources..................................................................................................................3‐10 3.8.OtherSourceInventory....................................................................................................................................3‐11 3.9.BuildingInfluences............................................................................................................................................3‐13 3.10.SourceContributions......................................................................................................................................3‐13 3.11.BackgroundConcentrations.........................................................................................................................3‐13 3.12.ModelingFiles...................................................................................................................................................3‐15
4.1‐HOURSO2DESIGNATIONMODELINGRESULTS 4-1

1-1 Big Rivers Electric Corporation – Wilson Station 1-Hour SO2 NAAQS Designation Modeling Report
LIST OF FIGURES
Figure2‐1.AerialPhotographofWilsonStation 2‐0
Figure2‐2.AreaMapofWilsonStation 2‐1
Figure2‐3.Locationof1‐hourSO2ModelingSourcesinRelationtoWilsonStationandNearbyTowns 2‐3
Figure3‐1.DistributionofLandUseWithin3kmofWilsonStation 3‐2
Figure3‐2.MeteorologicalStationsandSO2MonitorsintheAreaNearWilsonStation 3‐4
Figure3‐3.ModelingTADReceptorGridShowingExampleExcludedLocationsOverWater 3‐7
Figure3‐4.InnermostPortionoftheModelingReceptorGridforWilson 3‐8
Figure3‐5.OverallModelingReceptorGridforWilson 3‐9
Figure3‐6.MapShowingRegionalSO2SourcesNearWilsonStation 3‐11
Figure3‐7.99thPercentileSO2AveragesbyHourofDayforBaskettMonitor(21‐101‐0014) 3‐15
Figure4‐1.SpatialDisplayof3‐yearAverage99thPercentileAnnualDistribution 4‐2

1-2 Big Rivers Electric Corporation – Wilson Station 1-Hour SO2 NAAQS Designation Modeling Report
LIST OF TABLES
Table3‐1.ModelingTADUrban/RuralCategories 3‐1
Table3‐2.WilsonStationUrban/RuralDetermination 3‐2
Table3‐3.ProximityAnalysisofMeteorologicalStationstoWilsonStation 3‐5
Table3‐4.MoistureCalculationforEvansvilleAirport(inchesofprecipitation) 3‐7
Table3‐5.WilsonStationSourceCharacterization 3‐10
Table3‐6.NearbySourceCharacterization 3‐12
Table4‐1.Highest4thHighModeled1‐hourSO2ResultsforComparisontotheNAAQS 4‐1

1-3 Big Rivers Electric Corporation – Wilson Station 1-Hour SO2 NAAQS Designation Modeling Report
1. EXECUTIVE SUMMARY
TheBigRiversElectricCorporation(BREC)inassociationwithourairqualitycontractor,TrinityConsultants(Trinity),submitsthisdispersionmodelingreportforairqualitymodelinganalysisthatwasperformedwithrespecttoBREC’sD.B.WilsonStation(Wilson)andthesurroundingarea.ThisworkwasundertakeninsupportoftheKentuckyDivisionforAirQuality(KDAQorDivision)responsetotheMarch20,2015letterfromtheU.S.EnvironmentalProtectionAgency(U.S.EPA)toCommissionerScottoftheKentuckyDepartmentforEnvironmentalProtection(KDEP)regardingdesignationsofareascurrentlyunclassifiedwithrespecttothe20101‐hourSO2NationalAmbientAirQualityStandard(NAAQS).Inthatletter,U.S.EPAidentifiedtheWilsonStationasoneoftheKentuckysourcesmeetingthecriteriaforevaluationofunclassifiedareasinthefirstroundofdesignationsthroughmodelingaspartofarequiredresponsebyU.S.EPAtotherecentSierraClubvs.ReginaMcCarthyConsentDecree1.WilsonwasalsoidentifiedontheU.S.EPAwebsitelistingallareaswheredesignationswouldberequiredundertheconsentdecreebytheJuly2,2016date2.ThecriteriatodetermineifasourcewassubjecttotheConsentDecreeare:1)anearbymonitorshowingaviolation,and2)thatanareacontainastationarysourcethataccordingtotheEPA’sAirMarketsDatabaseeitheremittedmorethan16,000tonsofSO2in2012oremittedmorethan2,600tonsofSO2andhadanemissionrateofatleast0.45lbsSO2/MMBtuin2012.AccordingtoEPA’sAirMarketsDatabase,theWilsonStationemitted7,387tonsSO2in2012andhadanaverageSO2emissionrateof0.45lbsSO2/MMBtuin2012.WilsonStationislocatedonStateHighway85justeastofIsland,KentuckyinOhioCounty.JustaftertheConsentDecreewassigned,U.S.EPAstatedthatitwouldbasethedesignationoftheOhioCountyandsurroundingareaontheemissioncriteriaalone(CriteriaNo.2)asnoSO2monitorsareinthearea.However,U.S.EPAinvitedstateagenciestosubmitupdatedrecommendationsandsupportinginformationthatcouldbeconsideredinthefinaldesignations.Tothatend,BRECcommissionedthismodelinganalysistoaidKDEP/KDAQinthedesignationdeterminationfortheOhioCountyarea.ThismodelingwasdesignedtomeettherequirementsofU.S.EPA’smodelingTechnicalAssistanceDocumentforSO2NAAQSdesignationmodelingguidance3(ModelingTAD).Tothatend,dispersionmodelingwasconductedfollowingtheTADguidance.Asallowedbytheguidance,anallowableemissionratewasusedfortheWilsonStationasasurrogateforactualemissions.Commensuratewiththeseallowablelimits,aGoodEngineeringPractice(GEP)stackheightwasused(theuseoftheactualstackheightispermissibleundertheTADifactualemissionswereused).NearbysourceswereconsideredwithintheTAD‐suggested20kmrangeofWilsonbutalsooutto50kmtoallowcomprehensiveconsiderationoflargenearbysources.OfthesetheGreenRiverStation,10kmtothesouthofWilsonhasannouncedshutdownoftheirunitsbyApril2016;theTVAParadiseStationabout22kmtothesoutheastofWilsonhasannouncedshutdownofUnits1and2byApril2016leavingUnit3tobeincludedinthemodeling;severalfacilitiesatabout40‐50kmtothenorthwestofWilsonweredistantenoughtofalloutsideoftheTADgeneralconsiderationguidanceandwerelikelycapturedaspartoftheregional,ruralbackgroundconcentration.GiventhisstrategyandcharacterizationofsourcesaffectingairqualityintheOhioCountyarea,modelingperformeddemonstratedthatambientconcentrationsintheareawouldbebelowthe3‐yearaverageofthe99thpercentileoftheannualdistributionofdailymaximum1‐hrconcentrationswhichistheformofthe1‐hourSO2NAAQS.Therefore,thismodelingdemonstratesthattheareawillbeconsideredfordesignationasattainment.
1OrderGrantingJointMotiontoApproveandEnterConsentDecreeandDenyingOtherMotionsasMoot,SierraClubet.al.v.ReginaMcCarthy,AdministratoroftheUnitedStatesEnvironmentalProtectionAgency,UnitedStatesDistrictCourt,NorthernDistrictofCalifornia,DocketNos.120,149,March2,2015.2http://www.epa.gov/airquality/sulfurdioxide/designations/pdfs/sourceareas.pdf3SO2NAAQSDesignationsModelingTechnicalAssistanceDocument,Draft,U.S.EPA,OfficeofAirQualityPlanningandStandards,AirQualityAssessmentDivision,December2013.

2-0 Big Rivers Electric Corporation – Wilson Station 1-Hour SO2 NAAQS Designation Modeling Report
2. INTRODUCTION
ThissectionofthemodelingreportprovidesanoverviewoftheWilsonStationalongwithbackgroundinformationforthebasisfortheSO2designationmodeling.
2.1. FACILITY INFORMATION
BigRiversElectricCorporation(BREC)ownsandoperatesa417MWcoalfiredpowerplantinCentertown,KYwhichconsistsofonegeneratingunit(EU01).Thispowergeneratingunitisapulverizedcoalfiredboilerwithamaximumcontinuousratingof4,585MMBtu/hr.TheunitisequippedwithmultiplecontroldevicestoreduceemissionsofpollutantsregulatedundervariousFederalandCommonwealthprograms.Thecontrolsinclude:anelectrostaticprecipitator,lowNOXburners,hydratedlimeinjection,wetfluegasdesulfurization(WFGD),andselectivecatalyticreduction(SCR).Thisunitandotheremissionunits(emergencygenerators,etc.,notconsideredundertheConsentDecree)atWilsonStationaresubjecttopermitunderthenowdraftTitleVoperatingpermitV‐12‐012currentlypendingapprovalbyKDAQ.EU01istheonlysignificantsourceofSO2emissionsatWilsonstationandassuchEU01istheonlysourcerepresentedinthemodelinganalysis.TheD.B.WilsonStationislocatedinOhioCounty,approximately3.5mileseastofthecityofIsland,Kentucky.AnaerialphotographandareamapofthefacilityandsurroundingareaareprovidedinFigures2‐1and2‐2,respectively.Thesemapsshowthefacilityrelativetopredominantgeographicalfeaturessuchasroads,rivers,andtownareasaswellassignificantfeaturesofthepropertyincludingthecontrolledarealinesandbuildings.Figure2‐1showsthecontrolledareaatWilson.Thesefiguresandthelocationsofallemissionsources,structures,andreceptorsinthemodelinganalysisarerepresentedintheUniversalTransverseMercator(UTM)coordinatesystem.ThedatumisbasedonNorthAmericanDatum1983(NAD83).UTMcoordinatesforthisanalysisarelocatedinUTMZone16.ThecentrallocationofWilsonStationisapproximately492,883metersEastand4,144,768metersNorthinZone16oftheUTMsystem.
Figure2‐1.AerialPhotographofWilsonStation

2-1 Big Rivers Electric Corporation – Wilson Station 1-Hour SO2 NAAQS Designation Modeling Report
Figure2‐2.AreaMapofWilsonStation
2.2. BASIS FOR ANALYSIS
BigRiversElectricCorporation(BREC)inassociationwithourairqualitycontractor,TrinityConsultants(Trinity)submitsthisdispersionmodelingprotocolfortheairqualityanalysisthatwillbeconductedaspartofarequiredresponsetotherecentenforceableSierraClubvs.ReginaMcCarthyConsentDecree4forthefirstroundofunclassifiedareassubjecttothe20101‐hourSO2NationalAmbientAirQualityStandard(NAAQS).TheBRECfacilitythatfallsunderthisrequirementistheD.B.WilsonStationonStateHighway85locatedinOhioCounty,KentuckyjusteastofIsland,Kentucky.TheareainthevicinityofWilsonStationpossiblyincludingsomeorallofOhioCountyandbecauseofitsproximitymayincludeportionsofMcLeanandMuhlenbergCounties,isrequiredtobedesignatedasattainmentornonattainmentaccordingtoanacceleratedscheduleascomparedtotheDataRequirementsRule(DRR)schedule(promulgatedAugust10,2015)5.UndertheSO2DataRequirementsRule(priortotheconsentdecreewhichisnotdependentontheDRRaspertheconsentdecree),KDAQhadtheoptionofinstallinganewmonitorintheareaaroundWilsonStationorperformingdispersionmodeling.Ineithercase,ascheduleforcompletionofthedesignationswasestablishedasDecember31,2017formodelingandDecember31,2020formonitoring.Undertheconsentdecree,however,thedesignationoftheareaaroundtheWilsonStationmustbecompletednolaterthanJuly2,2016,whichdoesnotallowsufficienttimeforcollectionofthree(3)yearsofvaliddata,letaloneundergoingthemonitorsitingprocess.Thus,KDAQisrequiredtoperformdispersionmodelingoftheWilsonStationtodeterminetheattainmentstatusofthearea.BREChasperformedthismodelinganalysesandisprovidingtheresultstoKDAQtoassistinthe 4OrderGrantingJointMotiontoApproveandEnterConsentDecreeandDenyingOtherMotionsasMoot,SierraClubet.al.v.ReginaMcCarthy,AdministratoroftheUnitedStatesEnvironmentalProtectionAgency,UnitedStatesDistrictCourt,NorthernDistrictofCalifornia,DocketNos.120,149,March2,2015.5DataRequirementsRuleforthe1‐HourSulfurDioxide(SO2)PrimaryNationalAmbientAirQualityStandards(NAAQS):ProposedRule,FederalRegisterVol.79No.92,pages27445‐27472,May13,2014.

2-2 Big Rivers Electric Corporation – Wilson Station 1-Hour SO2 NAAQS Designation Modeling Report
designationprocess.ThismodelingfollowsthemethodologyandmodelingguidancefromtheU.S.EPAintheformoftheSO2NAAQSdesignationmodelingguidanceTAD6andassistsinKDAQ’sdeterminationoftheambientlevelsofSO2atthe1‐houraveragingperiodintheareaaroundWilsonStation.ThisreportonlycoversthedispersionmodelingrequirementanddoesnotcovertheotheritemsrequiredtobeincludedinKDAQ’sconsiderationofthefive‐factoranalysiscomponentsfordeterminingtheboundaryoftheattainmentarea.
2.3. REGULATORY BACKGROUND
TheU.S.EnvironmentalProtectionAgency(U.S.EPA)iscurrentlygoingthroughamulti‐phasedesignationprocesswithvariabletimelineswithrespecttothe20101‐hourSO2NationalAmbientAirQualityStandard(NAAQS).TheprocessofdesignatingareashasbeenslowedconsiderablycomparedtoformercriteriapollutantNAAQSwherebymonitoringdatawastheprimarytoolforassessingattainment/nonattainmentstatusofareasaroundthecountry.Inadequatemonitoringatasparsenumberofsitesdoesnotallowthisprimarytooltobeusedasinthepast.Underthecurrentregulatoryguidanceandproposedrules,EPA:
OnJune2,2010issuedanew1‐hrSO2NAAQS, OnSeptember21,2011soughtpubliccommentondraftguidanceforimplementingthenewNAAQS, MayandJune2012heldstakeholdermeetingswithindustry,tradegroups,andenvironmentalgroupstoascertaintheinterestandconcernoverusingdispersionmodelingversusmonitoringdatawhichhadbeenthestandardmethodologypriortothisNAAQS;
February2013developedandreleasedwhitepapersonthestrategyforstatestocharacterizeairqualitynearlargesources,
August5,2013designated29areasin16statesasnonattainmentbasedonmonitoring, 2014,releasedadraftandfinaldraftsetoftwoTechnicalAssistanceDocuments(TADs)offeringguidancetostatesonamethodologytoperformmodeling(modelingTAD)ortoconductsource‐orientedmonitoring(monitoringTAD)tosupportadesignationapproach7,8,
May13,2014releasedtheproposedDataRequirementRule(DRR), AndMarch2,2015signedtheConsentDecreewithSierraClubtorequirecertainlargesourcesacrosstheU.S.toundergoearlyconsiderationfordesignation.
August10,2015releasedthefinalDataRequirementRule(DRR).FollowingtheU.SEPA’sMay2014publicationoftheproposedDataRequirementsRule,theU.S.EPAwassuedfor“failingtoundertakeacertainnondiscretionarydutyundertheCleanAirAct(“CAA”),42U.S.C.§§7401‐7671q,andthatsuchallegedfailureisactionableundersection304(a)(2)oftheCAA,42U.S.C.§7604(a)(2)”.ThelawsuitresultedintheConsentDecreethatwasenteredonMarch2,2015intheU.S.DistrictCourtfortheNorthernDistrictofCalifornia(sameasthatmentionedaboveandreferencedinFootnote1).AsaresultoftheConsentDecree,anadditionaldesignationphasewasaddedtothetwodesignationphasesthatwerealreadyincludedintheU.S.EPA’sMay2014proposedDataRequirementsRule.TheadditionalphaseaffectsareaswithstationarysourcesthatmeetspecificemissioncriterialaidoutintheConsentDecreeanddescribedabove.TheU.S.EPAreleasedamemorandumonMarch20,2015(referredtohereinasthe2015SO2AreaDesignationGuidance)totheRegionalDirectorsclarifyingthepathforwardforstateswithsourcesaffectedbythedecree9.BRECisveryawareoftheserequirementsandhashadinformaldiscussionswithKDAQtodetermineapathforwardtomeetthedeadlinesformodeling,strategicassessment,andeventualdesignationoftheareaaroundtheWilsonStation.
6Ibid.7Ibid.8SO2NAAQSDesignationsSource‐OrientedMonitoringTechnicalAssistanceDocument,draft,U.S.EnvironmentalProtectionAgency,ResearchTrianglePark,NC,December2013.9UpdatedGuidanceforAreaDesignationsforthe2010PrimarySulfurDioxideNationalAmbientAirQualityStandard,memorandumfromStephenPagetoRegionalAirdivisionDirectors,Regions1‐10,March20,2015.

2-3 Big Rivers Electric Corporation – Wilson Station 1-Hour SO2 NAAQS Designation Modeling Report
Figure2‐3.Locationof1‐hourSO2ModelingSourcesinRelationtoWilsonStationandNearbyTowns
2.4. EMISSION RATES FOR WILSON STATION
AsdiscussedunderSection5.3AllowableEmissionsoftheguidanceprovidedinthemodelingTAD,thedispersionmodelingcanbeconductedeitheratallowableemissionrateoratactualemissionspreferablyonanhourbyhourbasis.ThemodelingTADstatesthattheapproachofusingallowableemissionsisasimplerwaytoperformthemodelingandprovideairqualityimpactsforthedesignationprocess.TheTADgoesontosaythatanairagencymaychoosetofollowthistypeofapproachiftheconservativeanalysisofthistypestillindicatesattainmentfortheareaofinterest,inthiscasetheOhioCountyareaandsurroundingportionsofothercounties.Forthismodelinganalysis,anallowableemissionratelessthanthecurrentratewasused,namely0.85lbSO2/MMBturatherthanthecurrent1.2lbSO2/MMBtu.AsperSectionV.B.1.(b)oftheproposedDataRequirementsRule,aslongasthislimitisagreedtoandpermittedbythedesignationsprocessdecisiondateofJanuary15,2016(whenKDAQhastoselecteitheramodelingormonitoringpath),itsconsiderationinthemodelingisacceptable.ThismodelingoftheWilsonStationwillallowproactiveparticipationwithKDAQintermsofwhatactionscanbetakenandthedesignationofnonattainmentareaboundariesasdescribedintheMarch20,2015guidancememorandum.Thisdispersionmodeling,thus,istheappropriatetoolfordesignatingattainmentstatusofthearea.

3-0 Big Rivers Electric Corporation – Wilson Station 1-Hour SO2 NAAQS Designation Modeling Report
3. 1-HOUR SO2 DESIGNATION MODELING METHODOLOGY
AsprescribedbytheEPAintheDataRequirementsRuleandmodelingTAD,dispersionmodelingwasusedtoevaluatetheattainmentstatusoftheareainthevicinityoftheBRECWilsonStation.EPA’srationaleforallowingtheuseofdispersionmodelingratherthanrequiringnewSO2monitorstobeestablishedarethatSO2sourcesarelimitedindistancetowhereambientconcentrationimpactsoccurandthus,modelingisapplicableandrepresentative.Inpreparationforprovidingmodelingguidancefordesignationanalysis,EPAreviewedSO2ambientmonitoringandmodelingofconcentrationsaroundandnearSO2sourcesandfoundthatmostofthehighestimpactsfallwithinafew10’sofkilometersforlargesourcesandafewkilometersforsmallersources.Alsoofnotewasthatthegradientoftheseconcentrationsfallsoffsignificantlyafterthemaximumisreached.Thus,thismodelingfocusedontheuseofappropriatecomputationalmethodssuchthatEPA’sprimarypreferredindustrialsourcemodel,theAERMODModel,istheprimarymodelrecommendedforuse.InadditiontoAERMODandtoallowthebestrepresentationofsimulatedambientairconcentrations,themodelingTADrecommends:
Usingactualemissionsasaninputforassessingviolationstoprovideresultsthatreflectcurrentactualairquality(i.e.,modelingthatsimulatesamonitor)oruseallowableemissionswhichwillresultinamoreconservativeestimateofactualambientairimpactsofthesource;
Usingthreeyearsofmodelingresultstocalculateasimulateddesignvalueconsistentwiththe3‐yearmonitoringperiodrequiredtodevelopadesignvalueforcomparisontotheNAAQS;
Placingreceptorsforthemodelingonlyinlocationswhereamonitorcouldbeplaced;and UsingactualstackheightsratherthanfollowingtheGoodEngineeringPractice(GEP)stackheightpolicywhenusingactualemissionsandtheGEPstackheightwhenusingallowableemissions.
FollowingthesemodelingguidelinesforDRRmodeling,dispersionmodelingwasperformedfortheWilsonStationandtheareaaroundit.TheremainderofthissectionprovidesanoverviewofthemodelingthatwasfollowedfortheWilsonStationwhichwasapprovedbyKDAQ10inthemodelingprotocol11submittedforWilsonStationmodeling.
3.1. MODEL SELECTION
Modelingwasperformedfor1‐hourSO2analysisusingtheAERMODModelinitsmostcurrentversionatthetimeofthemodeling.ThecurrentapplicableversionisVersion15181whichreleasedbyU.S.EPAonJuly24,2015.U.S.EPAalsoreleasedanupdatedproposedversionofitsmodelingguidanceintheformoftheGuidelineonAirQualityModels12aboutthatsametime.ThisproposedguidanceandenhancedAERMODmodelhasnewbetaoptionsthatareexpectedtoaffecttheoutcomeofdesignationmodelingwithrespecttosomeofthelowwindoptions(LOWWIND)inthemodel.AsofthereleaseoftheproposedGuideline,theoptionsremainedbetaandweresubjecttoscrutinyattheU.S.EPARegionalandClearinghouselevelpriortouse.TheseoptionswerenotusedinthismodelingfortheWilsonStation.OftheoptionsintheAERMODModel,thefollowingwereselected.Thepollutantidentificationwassetto“SO2”inAERMOD,whichallowedadditionalinternalmodeloptionstobeavailablethusenablingtheoutputoptionsto
10LetterfromBenCordes,Supervisor,AirDispersionModelingSectiontoMarkBertram,BigRiverElectricCorporation,July15,2015.11AirDispersionModelingProtocolWilsonStationSo2DesignationAnalysis,preparedforBigRiversElectricCorporation,preparedbyTrinityConsultants,Covington,Kentucky,June12,2015.12Guideline on Air Quality Models. Appendix W to 40 CFR Parts 51 and 52. Federal Register, November 9, 2005. pp. 68217-68261.

3-1 Big Rivers Electric Corporation – Wilson Station 1-Hour SO2 NAAQS Designation Modeling Report
beconfiguredproperlyforSO2.Becauseoftheprobabilisticformofthe1‐hourNAAQS,selectingthesecorrectinputoptionsallowedAERMODtoproperlycalculateanSO2designvaluebasedonthe3‐yearaverageofthe99thpercentileoftheannualdistributionofthedailymaximum1‐hourconcentrationsforcomparisonwiththe1‐hourSO2NAAQSof75ppb(196g/m3).
3.2. RURAL URBAN OPTION IN AERMOD
AsstatedbySection6.3,Urban/RuralDeterminationofthemodelingTAD,foranydispersionmodelingexerciseforSO2,the“urban”or“rural”determinationofthelocationsurroundingthesubjectsourceisimportantindeterminingtheapplicableboundarylayercharacteristicsthataffectamodel’scalculationofambientconcentrationsaswellasthepossibleinvocationofAERMOD’s4‐hourhalf‐life.Thus,adeterminationwasmadeofwhethertheareaaroundtheWilsonStationwasurbanorrural.ThefirstmethoddiscussedinthemodelingTAD(alsoreferredthereintoSection7.2.3coftheGuidelineonAirQualityModels,AppendixW)wasusedtodeterminetheurbanorruralstatusoftheareaaroundWilson.Thisistheso‐called“landuse”techniquebecauseitexaminesthevariouslandusewithin3kmofWilsonandquantifiesthepercentageofareainvariouslandusecategories.Followingthisguidance,2011landusedata(mostrecentavailable)wereobtainedfromtheU.S.GeologicalSurvey13throughArcGISanda3kmradiuscircleinscribedelectronicallyaroundtheWilsonstackcoordinates.AlldataweregeoreferencedandtabulatedusingthecategoriesshowninTable3.1forurbanandruraldesignation.
Table3‐1.ModelingTADUrban/RuralCategories
Figure3‐1showsthelayoutofthelandusewheregreens,yellowsandbrownsarefarmland,forests,andgrassesandredandpinksareurbanareas.Table3‐2showstheresultsofthislandcategorizationprocess.Ascanbeseentheareaispredominantlyruralbyanoverwhelmingmarginat99.2percentandthereforewastreatedasruralintheAERMODModel.
13http://www.mrlc.gov/viewerjs/
Modeling TAD Rural or Urban
11 Open Water A5 Water Surfaces rural
12 Perennial Ice/Snow A5 Water Surfaces rural
21 Developed, Open Space A1 Metropolitan Natural rural
22 Developed, Low Intensity R1 Common Residential rural
23 Developed, Medium Intensity I1, I2, C1, R2, R3Industrial/Commercial/Compact
Residentialurban
24 Developed, High Intensity I1, I2, C1, R2, R3Industrial/Commercial/Compact
Residentialurban
31 Barren Land A3 Undeveloped (Grasses/Shrub) rural
41 Deciduous Forest A4 Undeveloped (Wooded) rural
42 Evergreen Forest A4 Undeveloped (Wooded) rural
43 Mixed Forest A4 Undeveloped (Wooded) rural
52 Shrub/Scrub A3 Undeveloped (Grasses/Shrub) rural
71 Grassland/Herbaceous A3 Undeveloped (Grasses/Shrub) rural
81 Pasture/Hay A2 Agricultural rural
82 Cultivated Crops A2 Agricultural rural
90 Woody Wetlands A4 Undeveloped (Wooded) rural
95 Emergent Herbaceous Wetlands A3 Undeveloped (Grasses/Shrub) rural
Auer Land-Use Classification2011 NLCD Land Cover Classification

3-2 Big Rivers Electric Corporation – Wilson Station 1-Hour SO2 NAAQS Designation Modeling Report
Figure3‐1.DistributionofLandUseWithin3kmofWilsonStation
Table3‐2.WilsonStationUrban/RuralDetermination
CategoryID
CategoryDescription Percent
11 OpenWater 3.8%
21 Developed,OpenSpace 4.3%
22 Developed,LowIntensity 0.4%
23Developed,MediumIntensity
0.3%
24Developed,HighIntensity
0.1%
31 BarrenLand 0.7%41 DeciduousForest 27.3%
42 EvergreenForest 0.1%
43 MixedForest 0.0%
52 Shrub/Scrub 0.0%
71 Grassland/Herbaceous 1.9%
81 Pasture/Hay 8.9%
82 CultivatedCrops 44.1%
90 WoodyWetlands 4.3%
95 EmergentHerbaceousWetlands 3.8%
Total 100%
Urban 0.8%
Rural 99.2%
PercentLandCategorizationArcGISAnalysisResultsforWilsonStation

3-3 Big Rivers Electric Corporation – Wilson Station 1-Hour SO2 NAAQS Designation Modeling Report
3.3. METEOROLOGICAL DATA
MeteorologicaldatawasrequiredasinputtotheAERMODmodeltoallowthecharacterizationofthetransportanddispersionoftheWilsonStationSO2emissionsintheatmosphere.AsperthemodelingTAD,threeyearsofrecentdatawereobtained.OnsitemeteorologicaldatawascollectedbyBREC.Apreliminaryevaluationoftheonsitemeteorologicaldataindicatedthatthe2014datawasavailableandthus,wasevaluatedforinclusioninthestudy.ThewindinstrumentsarelocatedonthenorthwestportionoftheBRECpropertyonacellandmicrowavetransmissiontower.Theplacementanddispositionoftheinstrumentswereevaluatedtodetermineiftheywerelocatedsuchthatthetowerwasnotinfluencingthereadingofwindspeedanddirectionandcausinganypotentialbiasinthedatapriortouse.Althoughonsitedataaregenerallypreferredformodeling,inthiscasetheproximityoftheinstrumentsensorstothecelltoweronwhichtheywereplaceddidnotmeetthesitingcriteriaforsuchinstrumentswhichcausedsignificantbiasinthemeasurements.Therefore,thisdatawasnotconsideredfurtherfortheanalysis.Data,therefore,wereobtainedfromtheNationalWeatherService(NWS).Thedatacollectedwasreportedinthreeformatsincludingsurfacedatainboththehourlyaveragedformataswellastheminutedataandupperair(radiosonde)meteorologicaldata.Themostrecentthreefullyeardataset(2012,2013,and2014)wasobtainedandprocessedfromarchiveddatafromthemostrepresentativeNWSmeteorologicalstationinthevicinityoftheWilsonStation.Thisrepresentativenesswasdeterminedonthebasisofproximity,similarityintermsoflanduse(anditseffectonsurfaceroughness,albedo,andBowenratio),andmeteorologicaljudgementastoapplicabilitytotheWilsonStationarea.Detailsonthedataselectionareprovidedinthefollowingsubsections.AERMOD‐readymeteorologicaldatawerepreparedusingthelatestversionoftheAERMETmeteorologicalprocessingutility(Version15181).StandardU.S.EPAmeteorologicaldataprocessingguidancewasusedasoutlinedinarecentU.S.EPAmemorandum14aswellasotherAERMETandassociatedprocessordocumentation.NWSsiteswerelocatednearbyandwereofsimilargeographicalsettingtotheWilsonStation.ApreliminaryevaluationoftheNWSmeteorologicaldatasiteswithinapproximately150kmindicatedthatseveralairportswerelocatedintheregion.SeveraloftheseweresmallerairportsintheregionincludingMadisonvilleMunicipalAirport(MADI,30kmtoWilsonStation),Owensboro‐DaviesCountyAirport(KOWB,34kmtoWilsonStation),andHendersonCity‐CountyAirport(66kmtoWilsonStation)andareincloseproximitytotheWilsonStation.However,eachofthesesmallerairportslacksufficienthour‐by‐hourfullyearmeteorologicaldatasetsthatcanbeusedinthedispersionmodeling.Thus,otherairportswereevaluatedintheregion.Figure3‐2showsthelocationsoftheairportshavingmeteorologicaldatasetsthatwereconsideredforthismodeling.Ofthesecandidatesites,themostrepresentativesite,theEvansvilleRegionalAirport,wasoneofonlythreesiteshavingthesufficienthour‐by‐hourandone‐minutemeteorologicaldatasetsthatcanbeusedinthedispersionmodeling.Table3‐3presentstheresultsofaNWSidentificationexercisebasedonproximitytoWilsonStationandavailabilityofdatawithallcandidatesites.AscanbeseenthethreesmallerairportsarecloserthanEvansvillebutfailtohaveadequatedata.Ascanbeseen,othercandidatesitesarelocatedfartherawayandinadifferentgeographicalsettingthantheWilsonStation.
14Fox,Tyler,U.S.EnvironmentalProtectionAgency.2013.“UseofASOSMeteorologicalDatainAERMODDispersionModeling.”AvailableOnline:http://www.epa.gov/ttn/scram/guidance/clarification/20130308_Met_Data_Clarification.pdf

3-4 Big Rivers Electric Corporation – Wilson Station 1-Hour SO2 NAAQS Designation Modeling Report
Figure3‐2.MeteorologicalStationsandSO2MonitorsintheAreaNearWilsonStation
Themostrepresentative2012‐2014surfacemeteorologydatawasdeterminedtobefromtheEvansvilleRegionalAirport(KEVV,WBANNo.93817)withupperairdatafromtheNashvilleInternationalAirport(KBNA,WBANNo.13897).TheEvansvilleRegionalAirportliesabout76.5kmtothenorthwestoftheWilsonStation.
3.3.1. Surface Data
UnprocessedhourlysurfacemeteorologicalfielddatawasobtainedfromtheU.S.NationalClimaticDataCenter(NCDC)fortheEvansvilleRegionalAirport(KEVV)for2012‐2014inthestandardISHD(integratedsurfacehourlydata)format15.Thisdatawassupplemented,asrecommendedbytheU.S.EPAwithTD‐6405format(so‐
15ftp://ftp.ncdc.noaa.gov/pub/data/noaa/

3-5 Big Rivers Electric Corporation – Wilson Station 1-Hour SO2 NAAQS Designation Modeling Report
Table3‐3.ProximityAnalysisofMeteorologicalStationstoWilsonStation
called“1‐minute”)winddataalsofromtheKEVVarchives16andprocessedusingthelatestversionoftheAERMINUTEpre‐processingtool(version14337).The“Ice‐FreeWindsGroup”AERMINUTEoptionwasselectedforprocessingduetothefactthatasonicanemometerhasbeeninstalledatKEVVin2006.
3.3.2. Upper Air Data
Inadditiontosurfacemeteorologicaldata,AERMETrequirestheuseofdatafromanupperairsoundingtoestimatemixingheightsandotherboundarylayerturbulenceparameters.UpperairdatafromthenearestU.S.NWSradiosondeequippedstationwasutilizedinthemodelinganalysis.Inthiscase,upperairdatafromtheNashvilleInternationalAirport(KBNA,WBANNo.13897)wasobtainedfromtheNationalOceanicandAtmosphericAdministration(NOAA)inFSL(ForecastSystemsLaboratory)format17.
3.3.3. Land Use Analysis
Parametersderivedfromanalysisoflandusedata(surfaceroughness,Bowenratio,andalbedo)arealsorequiredbyAERMET.InaccordancewithU.S.EPAguidance,thesevalueswillbedeterminedusingthelatestversionoftheAERSURFACEtool(version13016).18AERSURFACEreadsgriddedlanduse,landcoverdataasprovidedbytheUSGS19andassociatessuchdatawithrepresentativevaluesofthethreeparameterslistedabove.SpecificAERSURFACEsettingswillbeusedthatrepresentthelocationoftheEvansvillemeteorologicalstation.Theseincludesettingslikelocationcoordinates,monthlyversusseasonaldifferentiation,aridity,andsurfacemoisturedetermination.ThesurfacemoisturewillbedeterminedbasedonwhetherprecipitationattheEvansvilleAirportisclassifiedaswet,dry,oraverageincomparisontoarecent30‐yearclimatologicalrecordatthesite.ThisdeterminationisusedinAERSURFACEtoadjusttheBowenratioestimatedbyAERSURFACEwhich
16ftp://ftp.ncdc.noaa.gov/pub/data/asos‐onemin17http://www.esrl.noaa.gov/raobs/18U.S.EnvironmentalProtectionAgency.2013.“AERSURFACEUser’sGuide.”EPA‐454/B‐08‐001,Revised01/16/2013.AvailableOnline:http://www.epa.gov/scram001/7thconf/aermod/aersurface_userguide.pdf19http://www.mrlc.gov/viewerjs/
StationName
WBANStationID
StationCallSign Lat. Long.
UTMEast(m)
UTMNorth(m)
ASOSOneMinuteDataAvailable
DistancetoWilson(km)
MadisonvilleMunicipalAirpor 00421 MADI 37.350 ‐87.400 464,573 4,133,775 No 30.4Owensboro‐DaviessCountyAirp 53803 KOWB 37.750 ‐87.167 485,288 4,178,091 No 34.2HendersonCity‐CountyArpt 53886 KEHR 37.800 ‐87.683 439,872 4,183,845 No 65.9EvansvilleRegionalAirport 93817 KEVV 38.044 ‐87.521 454,285 4,210,825 Yes 76.5BowlingGreen21Nne 63849 NBWG 37.250 ‐86.233 568,021 4,122,882 No 78.3BowGrn‐WarrenCo.RgnlAp 93808 KBWG 36.965 ‐86.424 551,274 4,091,145 Yes 79.3HuntingburgAirport 53896 KHNB 38.249 ‐86.954 504,025 4,233,444 No 89.4CampbellAafAirport 13806 KHOP 36.667 ‐87.483 456,838 4,058,041 No 93.9Clarksville 03894 KCKV 36.624 ‐87.419 462,536 4,053,245 Yes 96.4GodmanAafAirport 13807 KFTK 37.900 ‐85.967 590,819 4,195,223 No 110.2GlasgowMunicipalAirport 00361 KGLW 37.033 ‐85.950 593,386 4,099,049 No 110.4CarmiMinicipalAirport 63840 KCUL 38.089 ‐88.123 401,521 4,216,285 No 116.0Harrisburg‐RaleighAirport 53897 KHSB 37.811 ‐88.549 363,649 4,185,976 No 135.6MountCarmelMunicipalAirpor 63853 KAJG 38.607 ‐87.727 436,701 4,273,417 No 140.4LouisvilleIntl‐StandifordF 93821 KSDF 38.181 ‐85.739 610,442 4,226,649 Yes 143.3KyleOakleyFieldAirport 00437 KCEY 36.665 ‐88.373 377,299 4,058,589 No 144.2BowmanFieldAirport 13810 KLOU 38.228 ‐85.664 616,936 4,231,956 Yes 151.6NashvilleInternationalAirpo 13897 KBNA 36.119 ‐86.689 527,988 3,997,192 Yes 151.7Lrncvll‐VincnesIntlArpt 13809 KLWV 38.764 ‐87.606 447,351 4,290,762 Yes 152.9FairfieldMunicipalArpt 53891 KFWC 38.379 ‐88.413 376,581 4,248,812 No 156.0Olney‐NobleAirport 53822 KOLY 38.722 ‐88.176 397,769 4,286,584 No 170.8FloraMunicipalAirport 53889 KFOA 38.665 ‐88.453 373,588 4,280,604 No 180.8CentralCoordinatesofWilson: 492,883 4,144,768

3-6 Big Rivers Electric Corporation – Wilson Station 1-Hour SO2 NAAQS Designation Modeling Report
inturnaffectsthecalculationofthedaytimemixingheightsusedinAERMOD.Tomakethemoistureconditionsdetermination,climatologicalrecordsoftheannualprecipitationineachmodeledyear(2012‐2014)willbecomparedtothe1985‐2014climatologicalrecordforeachsite20.Table3‐4showsthe30yearprecipitationbymonthforEvansvillealongwiththeseasonaltotals,averages,and30thpercentilehighandlowvalues.ThesewerecomparedtotheactualrainfallineachseasonforeachyearofJanuary1,2012throughDecember31,2014whichdeterminedtheaverage,wet,ordryoptioninAERSURFACEforeachyearandeachseason.
3.4. COORDINATE SYSTEM
Inallmodelinginputandoutputfiles,thelocationsofemissionsources,structures,andreceptorswillberepresentedintheappropriateZoneoftheUniversalTransverseMercator(UTM)coordinatesystemusingtheNorthAmericanDatum1983(NAD83).TheWilsonStationandthesurroundingarealieswithinZone16.
3.5. RECEPTOR LOCATIONS
ThedispersionmodelingfollowedtheguidanceofthemodelingTADintermsofonlyputtingreceptorsinareaswhereitisfeasibletoplaceanactualmonitor.AsshownintheexampleFigure3‐3fromthemodelingTAD,noreceptorswereplacedinlakes,riversorsimilarareas.AsthemodelingTADstates:
receptorplacementshouldbeofsufficientdensitytoprovideresolutionneededtodetectsignificantgradientsintheconcentrations,withreceptorsplacedclosertogethernearthesourcetodetectlocalgradientsandplacedfartherapartawayfromthesource.Inaddition,theusershouldplacereceptorsatkeylocationssuchasaroundfacilityfencelines(whichdefinetheambientairboundaryforaparticularsource)ormonitorlocations(forcomparisontomonitoredconcentrationsformodelevaluationpurposes).
ThereceptorgridforthemodelingoftheWilsonStationcombinedamulti‐nestedCartesiangridatvariousspacingcenteredonthemainWilsonStationstackalongwithreceptorpointsalongthefacility’scontrolledarea.Fortheairdispersionmodelinganalyses,ground‐levelconcentrationswerecalculatedfromthecontrolledareaoutto50km.Thereceptorsarecharacterizedbythefollowinggrids:
FenceLineGrid:“Fenceline”gridconsistingofevenly‐spacedreceptors50metersapartplacedalongthecontrolledareaoftheWilsonStationincludingthemaingenerationarea,coalpilesandconveyingareasandtheashlandfills,
FineCartesianGrid:A“fine”gridcontaining100‐meterspacedreceptorsextendingto3kmfromthecenterofthepropertyandbeyondthefenceline,includingreceptorsalongStateRoute85,
Medium‐FineCartesianGrid:A“medium‐fine”gridcontaining250‐meterspacedreceptorsextendingfrom3kmto5kmfromthecenterofthefacility,exclusiveofreceptorsonthefinegrid,
20NationalClimacticDataCenter.2014LocalClimatologicalData(LCD).

3-7 Big Rivers Electric Corporation – Wilson Station 1-Hour SO2 NAAQS Designation Modeling Report
Table3‐4.MoistureCalculationforEvansvilleAirport(inchesofprecipitation)
Figure3‐3.ModelingTADReceptorGridShowingExampleExcludedLocationsOverWater
YEAR JAN FEB MAR APR MAY JUN JUL AUG SEP OCT NOV DEC ANNUAL Winter Spring Summer Fall1985 1.76 4.24 6.10 3.80 2.97 4.68 1.18 3.76 3.59 4.46 7.61 1.74 45.89 7.74 12.87 9.62 15.661986 1.15 5.77 2.64 2.29 2.93 3.77 5.39 2.07 3.84 3.30 2.35 2.18 37.68 9.10 7.86 11.23 9.491987 0.77 3.51 2.11 2.31 3.90 5.97 3.19 0.47 1.98 1.23 3.36 5.71 34.51 9.99 8.32 9.63 6.571988 3.28 3.94 2.89 1.77 1.33 1.11 6.63 2.72 1.19 2.86 7.96 2.75 38.43 9.97 5.99 10.46 12.011989 3.35 7.00 6.40 4.19 3.72 4.00 7.83 3.46 2.21 2.16 1.64 1.38 47.34 11.73 14.31 15.29 6.011990 4.26 5.60 2.15 3.75 11.34 3.22 1.01 3.47 2.54 4.81 2.92 7.45 52.52 17.31 17.24 7.70 10.271991 3.02 2.99 4.27 2.56 3.11 0.65 2.58 0.46 2.60 3.05 3.67 3.72 32.68 9.73 9.94 3.69 9.321992 0.85 1.51 4.50 1.19 3.44 1.44 8.40 4.39 2.89 1.17 4.34 1.69 35.81 4.05 9.13 14.23 8.401993 3.57 2.61 3.23 4.38 4.20 4.65 2.37 2.17 5.59 3.76 6.62 2.68 45.83 8.86 11.81 9.19 15.971994 3.18 2.32 1.88 5.77 0.94 3.45 2.30 2.52 2.61 2.67 6.52 2.59 36.75 8.09 8.59 8.27 11.801995 2.82 2.98 2.53 5.59 13.51 4.56 2.88 3.60 0.47 2.01 2.32 3.19 46.46 8.99 21.63 11.04 4.801996 3.51 1.50 5.19 11.83 7.32 7.78 4.56 1.20 8.45 2.53 6.66 3.50 64.03 8.51 24.34 13.54 17.641997 4.20 3.35 6.90 4.16 7.57 6.12 1.71 4.02 1.31 1.73 4.17 2.34 47.58 9.89 18.63 11.85 7.211998 2.24 2.71 3.07 8.50 5.91 5.31 3.89 3.91 0.49 3.38 2.78 3.48 45.67 8.43 17.48 13.11 6.651999 6.00 1.94 4.30 6.15 3.21 6.27 2.00 0.64 0.39 2.80 0.51 5.13 39.34 13.07 13.66 8.91 3.702000 4.36 7.26 3.21 2.35 2.60 5.86 4.14 5.60 5.03 0.59 3.43 4.12 48.55 15.74 8.16 15.60 9.052001 1.29 3.26 2.23 1.60 3.82 3.82 5.54 6.09 2.40 7.27 5.40 7.16 49.88 11.71 7.65 15.45 15.072002 3.72 0.74 6.20 8.58 5.70 2.86 4.32 0.63 5.22 3.75 2.97 5.65 50.34 10.11 20.48 7.81 11.942003 0.90 4.92 2.60 3.91 6.48 4.50 4.38 1.88 3.17 1.61 4.36 1.20 39.91 7.02 12.99 10.76 9.142004 2.95 0.59 2.17 1.91 9.31 1.66 7.56 3.08 0.09 5.62 6.23 2.31 43.48 5.85 13.39 12.30 11.942005 4.59 2.77 2.85 2.13 2.33 4.88 2.69 8.51 2.00 0.73 5.93 1.76 41.17 9.12 7.31 16.08 8.662006 4.09 2.17 9.36 3.44 5.77 3.73 6.46 7.41 8.75 5.46 4.95 4.59 66.18 10.85 18.57 17.60 19.162007 5.47 3.41 2.66 2.88 2.73 2.71 1.97 0.99 2.22 4.64 1.77 6.34 37.79 15.22 8.27 5.67 8.632008 3.97 5.97 12.34 5.07 8.07 3.09 3.90 0.52 1.16 1.61 3.42 4.76 53.88 14.70 25.48 7.51 6.192009 2.85 2.76 3.32 6.01 6.47 2.20 6.46 1.91 5.17 8.21 1.22 3.62 50.20 9.23 15.80 10.57 14.602010 2.41 1.58 3.97 3.27 3.03 2.49 3.51 0.84 0.36 1.06 8.46 1.80 32.78 5.79 10.27 6.84 9.882011 1.65 4.52 5.34 11.77 7.90 6.52 6.66 0.62 8.20 2.49 8.32 6.04 70.03 12.21 25.01 13.80 19.012012 3.39 1.75 2.51 1.44 2.29 0.15 2.34 4.10 7.60 2.90 1.19 3.47 33.13 8.61 6.24 6.59 11.692013 6.76 2.77 4.08 3.86 5.08 7.55 3.59 1.64 2.81 6.07 2.04 7.33 53.58 16.86 13.02 12.78 10.922014 1.69 2.26 2.85 10.97 3.72 3.87 4.02 4.80 2.55 4.20 2.85 3.43 47.21 7.38 17.54 12.69 9.60
Precipitationlocationfromhttp://www.ncdc.noaa.gov/cdo‐web/datatools/findstation Upper30th 11.11 17.31 12.88 11.94KEVVprecipitationdata‐obtained2014cumulativereportfromhttp:/wwwi.ncdc.noaa.gov/pub/orders Lower30th 8.58 8.97 9.11 8.65
A=AveragePrecipitation 2012 A D D AW=WetPrecipitation 2013 W A A AD=DryPrecipitation 2014 D W A A
3-8 Big Rivers Electric Corporation – Wilson Station 1-Hour SO2 NAAQS Designation Modeling Report
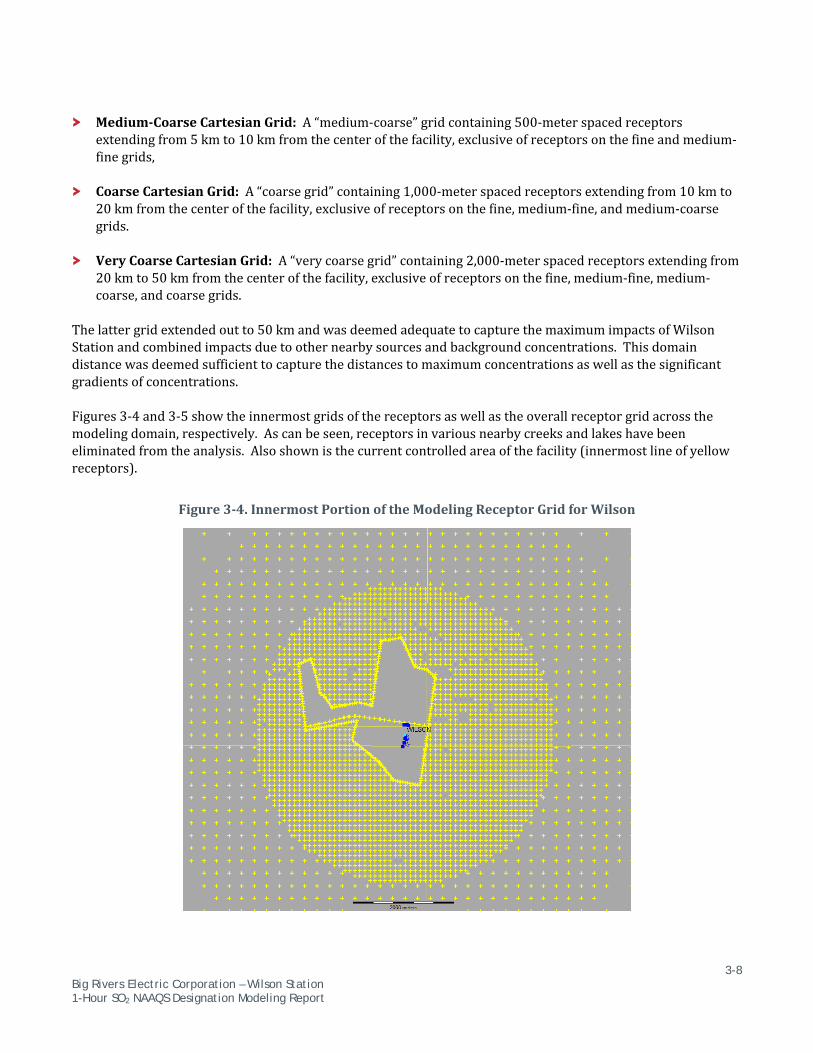
Medium‐CoarseCartesianGrid:A“medium‐coarse”gridcontaining500‐meterspacedreceptorsextendingfrom5kmto10kmfromthecenterofthefacility,exclusiveofreceptorsonthefineandmedium‐finegrids,
CoarseCartesianGrid:A“coarsegrid”containing1,000‐meterspacedreceptorsextendingfrom10kmto20kmfromthecenterofthefacility,exclusiveofreceptorsonthefine,medium‐fine,andmedium‐coarsegrids.
VeryCoarseCartesianGrid:A“verycoarsegrid”containing2,000‐meterspacedreceptorsextendingfrom20kmto50kmfromthecenterofthefacility,exclusiveofreceptorsonthefine,medium‐fine,medium‐coarse,andcoarsegrids.
Thelattergridextendedoutto50kmandwasdeemedadequatetocapturethemaximumimpactsofWilsonStationandcombinedimpactsduetoothernearbysourcesandbackgroundconcentrations.Thisdomaindistancewasdeemedsufficienttocapturethedistancestomaximumconcentrationsaswellasthesignificantgradientsofconcentrations.Figures3‐4and3‐5showtheinnermostgridsofthereceptorsaswellastheoverallreceptorgridacrossthemodelingdomain,respectively.Ascanbeseen,receptorsinvariousnearbycreeksandlakeshavebeeneliminatedfromtheanalysis.Alsoshownisthecurrentcontrolledareaofthefacility(innermostlineofyellowreceptors).
Figure3‐4.InnermostPortionoftheModelingReceptorGridforWilson

3-9 Big Rivers Electric Corporation – Wilson Station 1-Hour SO2 NAAQS Designation Modeling Report
Figure3‐5.OverallModelingReceptorGridforWilson
3.6. TERRAIN ELEVATIONS
Theterrainelevationforeachreceptor,building,andemissionsourceweredeterminedusingUSGS1arc‐secondNationalElevationData(NED).TheNED,obtainedfromtheUSGS21,hasterrainelevationsat30‐meterintervals.UsingtheAERMODterrainprocessor,AERMAP(version11103),theterrainheightforeachreceptor,building,andemissionsourceincludedinthemodelweredeterminedbyassigningtheinterpolatedheightfromthedigitalterrainelevationssurroundingeachpointofinterest.ThesewereuseddirectlyintheAERMODmodel.Inaddition,AERMAPwasusedtocomputethehillheightscalesassociatedwitheachelevatedreceptorlocatedatadifferentelevationthanthebaseoftheWilsonstack.ThiscomputationenabledtheAERMODModeltodeterminetheeffectthatterrainhasonplumesfromtheWilsonstackaswellasothersourcesconsidered.AERMAPsearchesallnearbyelevationpointsfortheterrainheightandlocationthathasthegreatestinfluenceoneachreceptortodeterminethehillheightscaleforthatreceptor.AERMODthenusesthehillheightscaleinordertoselectthepointwhereaplumemaydividebetweengoingaroundaterrainfeatureandloftingoverthefeature.InitialreviewoftheareadoesnotindicatethatanysignificantterrainfeaturesexistneartheWilsonStation,buttheterrainwillbeincorporatedasrequired.
21http://www.mrlc.gov/viewerjs/

3-10 Big Rivers Electric Corporation – Wilson Station 1-Hour SO2 NAAQS Designation Modeling Report
3.7. WILSON STATION EMISSION SOURCES
TheWilsonStationhasonlyonesourceofSO2emissions,whichistheflueinthemainstackassociatedwithcoal‐firedUnit1.Table3‐5belowsummarizesthestackparametersthatwereusedinthisinitialmodelingoftheWilsonStationmainstack.Modelingwasperformedatanemissionrateof0.853lbSO2/MMBtuand4,585MMBtu/hrcapacitywhichisalimitthatBRECiswillingtotakefortheWilsonStation.ThisuseofanewallowableemissionratelimitiscommensuratewiththeproposedDataRequirementsRuleguidanceforemissionstobeconsideredformodelinginSectionV.B.1.b(Emissions–AccountingforRecentEmissionReductionsinModelingAnalyses22).AsstatedinSectionV.B.1.b:
…theairagencymaywishtoconsultwiththesourceandconductadditional(modeling)analysiswiththesourcetoidentifyacontrolmeasureoranemissionlimitthatwouldensureattainmentwiththe1‐hourSO2standardfortheareaaroundthesource.
Thus,BREChaselectedtoperformthismodelingtoassistKDAQindemonstratingthattheareaaroundtheWilsonStationisinattainmentviathemodelingroute.ThisemissionlimitwouldbeenforceablebyJanuary2017andthus,qualifiesforthismodelingdemonstration.AsperthemodelingTADandguidanceonareadesignations,ifthisanalysisresultsinconcentrationslessthantheNAAQS,thentheareacanbedesignatedattainment.InthespiritofthemodelingTADandrelatedDRRguidance,themodelingwasperformedtosimulatewhatamonitormayhavemeasuredifonehadbeenavailable.Tothisend,themodelinghereindemonstrateswhattheambientairqualitywouldbeifamonitorweremeasuringtheairqualityintheareaafterthenewlimitisset.
Table3‐5.WilsonStationSourceCharacterization
StackIdentification
XCoordinate
(m)a
YCoordinate
(m)a
StackHeight(ft)
StackDiameter
(ft)
ExitVelocity(ft/s)
FlowRate(acfm)
ExitTemperature
(˚F)
EmissionRate(lb/hr)
Unit1b 492,876.8 4,144,766 600 22 67.4 1,536,428 130 3,911 aUTMZone16,NAD83.
bAtapermittedrateof0.853lbSO2/MMBtuand4,585MMBtu/hrcapacity.MostothersourcesattheWilsonStationarerelatedtocoalandashhandling,conveying,andtransportanddonotrelatetoSO2emissions.HowevertwoothersourcesofSO2emissionsattheWilsonStationfacilityincludea380hpFirePumpengine(EU06)whichrunsondieselfuelandan1,130hpemergencygeneratorwhichrunsondieselfuel.AccordingtothependingTitleVpermitfortheWilsonStation,eachunitislimitedto50hoursofnon‐emergencyoperation.Maintenancechecksandreadinesstestingoftheseunitsislimitedto100hoursperyear.AccordingtothemodelingTAD,Section5.4IntermittentEmissions,onlysourcesthatarecontinuousorfrequentenoughtocontributesignificantlytotheannualdistributionofmaximumdaily1‐hourconcentrationsshouldbeconsidered.AspertheTAD‐referencedU.S.EPAclarificationmemorandum23,forthereasonsstatedtherein,i.e.,thesesourcesdonotoperatecontinuousoroftenenoughtocontributetotheannualdistributionofdailymaximum1‐hourSO2concentrations,thesetwosourceswereexcludedfromthedispersionmodelingoftheWilsonStation.NoothersourcesofSO2emissionsexistattheWilsonStation.
22FRVolume79No.92,DataRequirementsRuleforthe1‐HourSulfurDioxide(SO2)PrimaryNationalAmbientAirQualityStandard(NAAQS);ProposedRule,May13,2014,pp27464‐27465.23AdditionalClarificationRegardingApplicationofAppendixWModelingGuidanceforthe1‐HourNO2NationalAmbientAirQualityStandard,fromTylerFox,LeadertoRegionalAirDivisionDirectors,U.S.EnvironmentalProtectionAgency.March11,2011.

3-11 Big Rivers Electric Corporation – Wilson Station 1-Hour SO2 NAAQS Designation Modeling Report
3.8. OTHER SOURCE INVENTORY
OthersourcesofSO2emissionsintheareasurroundingtheWilsonStationwereincludedasrequiredforthemodelingoftheWilsonStationtofullycharacterizetheairqualityinthearea.Sourceswithinabout20kmofWilsonwereincluded(orlargesourcesjustbeyondthe20kmrange)inthemodelingandwereobtainedfromavailableinventoriesfromKDAQ.Otherlargesourcesinthe20kmto50kmrangefromWilsonwerereviewedtodetermineiftheyshouldbeincludedinthemodelingandwerereviewedonthebasisofKDAQdataarchivesaswellasfromaperspectiveofpossiblefutureshutdowns(therebynotrequiringconsideration).Datasetswerereducedbyeliminatingverysmallsources(lessthan100tonsperyear).Figure3‐5showsmajorsourcesofSO2emissionswithinthe50kmrangeofWilson.
Figure3‐6.MapShowingRegionalSO2SourcesNearWilsonStation
Asummaryoftheconsiderationofeachsourceintheareaisasfollows:
WilsonStation,Unit1–modeledat0.853lbSO2/MMBtu.

3-12 Big Rivers Electric Corporation – Wilson Station 1-Hour SO2 NAAQS Designation Modeling Report
TVA–ParadiseStation–Units1and2willshutdownbyApril201624;Unit3modeledusinghourly2013‐2014CEMsdatafromtheU.S.EPAAirMarketsProgramDataforemissionsonly25;temperatureandgasexitvelocitywerenotavailableandwere,thereforesetequaltothatintheKDAQarchivedata.
GreenRiverStation–allunitswillshutdownbyApril201626.
CenturyAluminumlocatedover40kmtothenorthwestofWilsonStationwasdistantenoughthatitsimpactswouldbesignificantlyreducedintermsofitsimpactsoverlappingwiththoseofWilsonStation;SO2impactsweretreatedasregionalinnatureandassumedtobecapturedbytheambientmonitorattheHendersonCountymonitorlocatedattheBaskettFireHouse(AQS‐ID21‐101‐0014)whichisdownwindalargeportionofthetimewhenwindsarefromthesouthwestthroughsoutheastasshownbythemonitorlocationandwindrosefor2012‐2014inFigure3‐6.
TheReid/HendersonStationIIGeneratingStationandBRECLandfillarelocatedover40kmtothenorthwestofWilsonStation,whichisdistantenoughthattheirimpactswouldbesignificantlyreducedintermsofitsimpactsoverlappingwiththoseofWilsonStation;SO2impactsweretreatedasregionalinnatureandassumedtobecapturedbytheambientmonitorattheHendersonCountymonitorlocatedattheBaskettFireHouse(AQS‐ID21‐101‐0014)whichisdownwindalargeportionofthetimewhenwindsarefromthesouthwestthroughsoutheastasshownbythemonitorlocationandwindrosefor2012‐2014inFigure3‐6.
GreenStationlocatedover40kmtothenorthwestofWilsonStationwasdistantenoughthatitsimpactswouldbesignificantlyreducedintermsofitsimpactsoverlappingwiththoseofWilsonStation;SO2impactsweretreatedasregionalinnatureandassumedtobecapturedbytheambientmonitorattheHendersonCountymonitorlocatedattheBaskettFireHouse(AQS‐ID21‐101‐0014)whichisdownwindalargeportionofthetimewhenwindsarefromthesouthwestthroughsoutheastasshownbythemonitorlocationandwindrosefor2012‐2014inFigure3‐6.
TheElmerSmithStationislocatedabout35kmtothenorthofWilsonStationandisdistantenoughandinalocationthatisnotlikelytooverlapwiththemaximumconcentrationsduetoWilsonnorisWilsonlikelytocontributesignificantlytoconcentrationsinthevicinityofElmerSmithStation.
Thus,onlyTVAParadiseUnit3wasincludedasadirectsourceinthemodelinganalysis.Table2‐2providesthepertinentsourcesparametersandemissionsforthisunit.
Table3‐6.NearbySourceCharacterization
StackIdentification
XCoordinate
(m)a
YCoordinate
(m)a
StackHeight(ft)
StackDiameter
(ft)
ExitVelocity(ft/s)
FlowRate(acfm)
ExitTemperature
(˚F)
EmissionRate
(lb/hr)bTVA3‐EU03 502,305.5 4,123,697.4 600 37 50.44 3,254,000 130 CEMS aUTMZone16,NAD83.
bBasedonCEMSemissiondatafrom2012‐2014fromAirMarketsProgramData
24U.S.EnergyInformationAdministrationreporting,http://www.eia.gov/todayinenergy/detail.cfm?id=1549125AirMarketsProgramData,http://ampd.epa.gov/ampd/26CoalAge,http://www.coalage.com/news/latest/4152‐green‐river‐coal‐plant‐will‐remain‐in‐operation‐until‐april‐2016.html#.VckdfflVhBc

3-13 Big Rivers Electric Corporation – Wilson Station 1-Hour SO2 NAAQS Designation Modeling Report
3.9. BUILDING INFLUENCES
TheU.S.EPA’sBuildingProfileInputProgram(BPIP)withPlumeRiseModelEnhancements(PRIME)(version04274),willbeusedtoaccountforbuildingdownwashinfluencesontheUnit1mainstack.Thepurposeofabuildingdownwashanalysisistodetermineiftheplumedischargedfromastackwillbeinfluencedbytheturbulentwakeofanyonsitebuildingsorotherstructures,resultingindownwashoftheplume.Thedownwashoftheplumecanresultinelevatedground‐levelconcentrationsinthenearwakeofabuildingandisrequiredforconsiderationinthemodeling.For“other”sourcesthataremodeledinthearea,downwashwillnotbeconsidered.
3.10. SOURCE CONTRIBUTIONS
AnumberofoutputoptionsareavailableinAERMODtotabulateanddisplaytheconcentrationestimatesmade.TheoutputsthatwereofbestusewereMAXDCONTandthesummaryofmaximum4th‐highestmaximumdaily1‐hourconcentrationsaveragedoverthethreeperiod.Beyondjustthemaximumvalues,theuseofMAXDCONTallowsthemodeltogenerateoutputthatprovidesthemaximum4th‐highestmaximumdaily1‐hourconcentrationsaveragedoverthethreeperiodforeveryreceptor(orforthoseaboveauserestablishedthresholdvalue)andindicatesboththecumulativeconcentrationsaswellasindividualcontributionsfromeachuser‐specifiedgrouporindividualsource.TheoutputfromthiscomputationisintheformatandoverthetimeperiodthatiscommensuratewiththeformoftheNAAQS.Section4ofthisreportwillutilizetheseoutputoptions.
3.11. BACKGROUND CONCENTRATIONS
AsdescribedinSection8ofthemodelingTAD,theinclusionofbackgroundambientmonitoredconcentrationsaspartofthemodeledconcentrationsisimportantindetermininganddecipheringthecumulativeambientairimpacts.TheTADdiscussesafirsttierapproachbasedontheoverallhighesthourlymonitoredSO2concentrationandgoesontonotethatthisisaveryconservativemethodtoestablishthebackgroundconcentration.Asecond,lessconservativemethod,isrecommendedwherebythemonitoreddesignvaluesforthelatestthreeyearperiodisused.Forarelativelyisolatedsource,likeWilson,themodelingTADproposesusingaregionalmonitoringsitethatislocatedawayfromtheWilsonareabutisimpactedbysimilarnaturalanddistantanthropogenicsources.Thisregionalsourceshouldberepresentativeofallsourcesimpactinganareaandshouldnotdouble‐countsourceimpactsinthemodelingandmonitoring.Theotheralternativefordeterminingtheappropriatebackgroundconcentrationsistheuseofthe3‐yearaveragesofthe99thpercentilesbyseasonandhourofdayorthe3‐yearaveragesbyhourofday(acrossallseasons).AswithmanylocationsinKentucky,anearbymonitordoesnotexistandaregionalsitewasdeterminedtobethebestchoiceforcharacterizingbackgroundconcentrations.InthepreviouslypresentedFigure3‐2,fourSO2monitorsweredeterminedtobewithin100kmoftheWilsonStation,namely:
1. 18‐163‐0021,Evansville‐BuenaVista,75kmnorthwestofWilson2. 21‐101‐0014,BaskettFireHouse,55kmnorthwestofWilson3. 21‐059‐0005,OwensboroPrimary,35kmnorthofWilson4. 21‐061‐0501,MammothCaveNationalPark,95kmeastsoutheastofWilson
Considerationofeachmonitorasanappropriatebackgroundmonitorwillconsidera)thedistancefromWilsonStationtothemonitor,2)thelanduseinthesurroundingareaascomparedbetweenWilsonStationandthemonitor,3)thelikelihoodofinfluencingnearbylocalpopulation‐relatedsources(vehicles,residentialheating,etc.),4)abilityofthemonitortocapturetheimpactsofsourcesdistantfromtheWilsonStationthatmaynot

3-14 Big Rivers Electric Corporation – Wilson Station 1-Hour SO2 NAAQS Designation Modeling Report
explicitlybemodeledbecauseofthedistancebetweenthemandWilsonStationandtheapparentlackofoverlappingsignificantconcentrationgradients,and5)comparisonofpersistentwinddirectionswithlikelydownwindimpactareasforregionalsourceinfluencesonthecandidatemonitors.TheMammothCaveNPmonitor(21‐061‐0501)sitehadthelowestSO2concentrationsduetoitslocationandmonitoringobjective,i.e.,“General/Background”.ThismonitorwastheonelocatedfarthestfromWilsonStationatabout95kmtotheeastsoutheast.Duetoitsbackgroundstatus,thismonitorwasthoughttonotberepresentativeofthesmalltownsandruralcommunitythatinfluencetheairqualityaroundWilsonStation.Alsothismonitor,giventhewindpatternsinthearea(asshownbytheEvansvilleAirportwindroseinFigure3‐6)willnotreflectanycontributionsfromsourceslocatednorthandnorthwestofWilsonStation.Therefore,thissitewasnotchosentorepresentthebackgroundconcentrationsfortheWilsonStationmodelinganalysis.TheEvansville‐BuenaVistamonitor(SiteNo.18‐163‐0021)siteislocatedasa“Neighborhood”sitejusttothenorthofdowntownEvansville.Thismonitorisapproximately75kmtothenorthwestoftheWilsonStation.ThesurroundinglanduseandlocationbeinginsuchanurbansituationaswellasitsdistancefromtheWilsonStationdonotmakeitasuitablemonitorforbackgroundconcentrationsfortheDRRanalysis.Therefore,thissitewasnotchosentorepresentthebackgroundconcentrationsfortheWilsonStationmodelinganalysis.TheOwensboroPrimarymonitor(SiteNo.21‐059‐0005)siteislocatedasa“Neighborhood”sitejustnortheastofthecityofOwensboro.OfthecandidatemonitorsthisoneistheclosesttotheWilsonStationatabout35kmtothenorth.ThesurroundinglanduseandlocationareresidentialandjustoutsideanddownwindoftheurbancoreofOwensboroinalessdenselypopulatedareabutlikelyinfluencedbythemoredenseurbanpopulation‐relatedsources.Themonitorislocatedonly2kmfromtheOwensboroMunicipalElmerSmithStationlocatedupriver.ThepotentialinfluenceofthisstationwhenwindsarefromthenortheastwindfetchandbytheCityofOwensboroforallsouththroughwestwindfetcheslikelyoverwhelmanygeneralregionalSO2impactsandmakethisanunlikelycandidateforusingasthebackgroundfortheWilsonStationmodelinganalysis.Therefore,thissitewasnotchosentorepresentthebackgroundconcentrationsfortheWilsonStationmodelinganalysis.TheBaskettFireHousemonitor(SiteNo.21‐101‐0014)siteislocatedasageneral“PopulationExposure”siteabout8‐9kmsoutheastofEvansville,Indiana.Thiscandidatemonitorislocatedabout55kmtothenorthwestoftheWilsonStation.ThesurroundinglanduseandlocationareverylightdensityresidentialsurroundedbyruralagriculturalandwoodlandareassimilartoWilsonStation.AllsourcesnotedtothenorthwestofWilsonStationatthe40‐50kmrangeincludingCenturyAluminum,BRECLandfill,andGreenStationarelocatedwithrespecttothemonitorandwithrespecttotheprevailingwinds(seeFigure3‐6)thattheirregionalimpactsarelikelycapturedbytheBaskettmonitor.AlsoduetoitsproximitytotheBaskettmonitorandgiventhedownwinddirectionforcertainmeteorologicalevents,theElmerSmithStationwasassumedtoalsoaffecttheBaskettmonitorataregionalscale.Onthesebases,therefore,thissitewaschosentorepresentthebackgroundconcentrationsfortheWilsonStationmodelinganalysis.Ofthemethodsdescribedaboveforthedeterminationofthebackgroundconcentrations,themethodchosenwastheuseofthe3‐yearaveragesofthe99thpercentilesbyhourofday(acrossallseasons).Thisselectionwasbasedonthereviewofthe99thpercentilehourlyvaluesacross2012‐2014whichshowsadiurnalvariationoflowestSO2concentrationsatnightandhighestintheday.Figure3‐7showsthedailydistributionofhourly99thpercentileconcentrationsacrossallthreeyearsofdata.

3-15 Big Rivers Electric Corporation – Wilson Station 1-Hour SO2 NAAQS Designation Modeling Report
Figure3‐7.99thPercentileSO2AveragesbyHourofDayforBaskettMonitor(21‐101‐0014)
3.12. MODELING FILES
AllmodelingfileswillbeprovidedtoKDAQinelectronicformatonacompactdisk.Modelandprocessorinput,output,anddatafileswillbeprovided.Spreadsheetstabulatingsource,emission,andotherinputdatasetswillalsobeprovided.AppendixAprovidesalistingofthesourcesincludedforKDAQconsideration.

4-1 Big Rivers Electric Corporation – Wilson Station 1-Hour SO2 NAAQS Designation Modeling Report
4. 1-HOUR SO2 DESIGNATION MODELING RESULTS
DispersionmodelingoftheWilsonStationwasconductedusingtheAERMODModel(Version15181).IncludedinthismodelingwastheWilsonStationat0.85lbSO2/MMBtu,TVAUnit3usingtheAirMarketsCEMSSO2data,andbackgroundconcentrations(withtheassumptionthatitwascharacteristicoftheregionalimpactsfrommoredistantlargeSO2sourcesaswellasgeneralruralandnaturalbackgroundsources.Table4‐1presentstheoverallresultsofthemodelingforallsourcesandacontributiondistributionforeachsource(s)andbackgroundtothe3‐yearaverageofthe99thpercentileoftheannualdistributionofdailymaximum1‐hrconcentrations,whichistheformofthe1‐hourSO2NAAQS.AscanbeseenfromTable4‐1,theconcentrationsarealllessthantheNAAQSandthus,theareacanbesaidtobeachievingthestandardsandbedesignatedasattainment.Tofurthershowthis,Table4‐1notonlygivestheoverallmaximumconcentrationbutalsopresentsthehighestranked10highest4thhighconcentrations,allatdifferentreceptorswhichfurtherdemonstratescomplianceacrossabroaderareathanatthemaximumreceptor.
Figure4‐1showsthedistributionof1‐hourSO2concentrationsacrossthenearmodelingdomainasafurthergraphicalpresentationoftheairconcentrationsestimatesandtheirdistribution.
Table4‐1.Highest4thHighModeled1‐hourSO2ResultsforComparisontotheNAAQS
AllSources1
(µg/m3)
AllSourcePercentof1‐hourSO2
NAAQS2
(µg/m3)
WilsonStationContribution
(µg/m3)
TVAUnit3Contribution
(µg/m3)
Background
Contribution1
(µg/m3)
UTMEasting(m)
UTMNorthing(m)
Elevation(m)
186.5 95.2% 146.4 0.1 40.0 490,583 4,144,568 115.8186.2 95.0% 144.0 0.1 42.1 489,983 4,144,468 116.8185.9 94.8% 153.7 0.3 31.9 490,483 4,144,568 116.0185.8 94.8% 155.1 0.3 30.5 490,483 4,144,468 115.9185.4 94.6% 146.5 0.3 38.6 490,783 4,144,368 116.4184.9 94.3% 144.8 0.1 40.0 490,083 4,144,468 118.4184.8 94.3% 146.9 0.4 37.4 491,083 4,144,468 116.6184.4 94.1% 146.5 0.4 37.4 491,183 4,144,468 117.4184.3 94.1% 146.8 0.1 37.4 489,133 4,144,518 125.6184.3 94.0% 146.5 0.4 37.4 490,683 4,144,368 117.0
1Modeledconcentrationsincludeanhourlybackgroundconcentrationdeterminedbytakingthe3‐yearaverageofthe99thpercentileoftheannualdistributionofdailymaximum1‐hrconcentrationsattheBaskettFireDepartmentSO2MonitornorthwestofWilsonStation.2BasedonthePrimaryNationalAmbientAirQualityStandard(NAAQS)forSO2fortheaveragingperiodof1‐hr,75ppb(196µg/m
3).

4-2 Big Rivers Electric Corporation – Wilson Station 1-Hour SO2 NAAQS Designation Modeling Report
Figure4‐1.SpatialDisplayof3‐yearAverage99thPercentileAnnualDistributionofDailyMaximum1‐hrSO2Concentrations


