AIMA and ASSIRT Hedge Fund Booklet · 2 AIMAand ASSIRT Hedge Fund Booklet The AIMA/ASSIRT Hedge...
30
AIMA and ASSIRT Hedge Fund Booklet 1
Transcript of AIMA and ASSIRT Hedge Fund Booklet · 2 AIMAand ASSIRT Hedge Fund Booklet The AIMA/ASSIRT Hedge...
AIMA and ASSIRT
Hedge Fund Booklet
1

AIMA and ASSIRT Hedge Fund Booklet 1
Contents
1. Background
2. What are Hedge Funds?
3. Typical Strategies & Examples
4. Return/Risk Drivers
5. Investing In Hedge Funds
6. Glossary
Disclaimer
Material contained in this publication is a summary only and is based on information believed to be reliable and received from sources within the market.Therating and other opinions contained in this publication are and must be construed solely as statements of opinion and not statements of fact or recommendationsto purchase, sell or hold any securities. It is not the intention of ASSIRT Pty Ltd (ABN 80 009 182 263) ("ASSIRT") that this publication be used as the primarysource of readers’ information but as an adjunct to their own resources and training. No representation is given, warranty made or responsibility taken as to theaccuracy, timeliness or completeness of any information or recommendation contained in this publication and ASSIRT will not be liable to the reader in contractor tort (including for negligence) or otherwise for any loss or damage arising as a result of the reader relying on any such information or recommendation(except in so far as any statutory liability cannot be excluded).This publication has been prepared for general information and not having regard to any particularperson’s investment objectives, financial situation or needs.Accordingly, no recommendation (express or implied) or other information should be acted on withoutobtaining specific advice from an authorised representative. Estimates of income and capital growth projection rates are based on assessments of current and likelyfuture economic conditions, as well as investment manager past and likely future performances. Such figures are purely estimates and may vary with changingcircumstances. Please note past performance may not be indicative of future performance.
Disclosure
In the event of any person subscribing for the securities referred to herein, such subscriptions may result in an ASSIRT client or company associated with ASSIRTreceiving a commission, fee or other benefit or advantage. Precise details of any such benefits can be obtained from an authorised representative.ASSIRT itself doesnot receive any commission.ASSIRT from time to time provides fund managers investment data, research software, rating, consulting and other financial planningservices.ASSIRT is a wholly owned subsidiary of WealthPoint Limited (ABN 98 055 556 539), which is in turn a wholly owned subsidiary of St.George Bank Limited(ABN 92 055 513 070). St.George Bank also owns Advance Asset Management Ltd (ABN 98 002 538 329).ASSIRT is a licensed investment adviser. ©ASSIRT

2 AIMA and ASSIRT Hedge Fund Booklet
The AIMA/ASSIRT Hedge Fund Report is an
educational paper designed to assist the financial
community and investors in their understanding of
hedge funds, including the state of the hedge fund
market in Australia, characteristics of hedge funds,
different strategies employed and the risk/return
characteristics of hedge funds. It also aims to assist
financial planners and investors in approaching the
decision of allocating to hedge funds within an already
diversified portfolio.
With the steady rise in hedge funds offered to the
Australian marketplace over the past ten years, many
Australian superannuation funds have already identified
the benefits of investing in hedge funds. ASSIRT
believes the current growth trend in the hedge fund
market is set to continue.
Introduction
Who is AIMA?
The Alternative Investment Management Association
(AIMA) was established in 1990 in the UK as a
non-profit organisation for the alternative investment
industry. It specifically includes hedge funds, managed
futures and managed currency funds.
AIMA’s objectives are to increase investor education,
transparency and promote due diligence and related
best practices and to work closely with regulators and
interested parties in order to better promote and
control the use of alternative investments
Local industry participants formed the AIMA Australian
Chapter in 2001. Originally 12 members, it has quickly
expanded with the current membership standing at 43.
Very early on, committees were formed which included
Regulatory, Marketing and PR, Education and Member
Services. Damien Hatfield, of Colonial First State was
elected the inaugural Chairman whilst Kim Ivey of
Vertex Capital was elected Deputy Chairman. David
Zobel of DB Absolute Return Strategies chairs the
Education Committee, Paul Cheever of Access
Economics chairs the Regulatory Committee, Andy
Perry of the CBA chairs the Members Services
Committee and Josh Goben of Absolute Capital chairs
the Marketing and PR Committee. In addition, Mark
O’Sullivan of Ernst & Young is AIMA Treasurer and
Martin Jamieson of Phillips Fox Lawyers is AIMA’s
Legal Counsel.

AIMA and ASSIRT Hedge Fund Booklet 3
AIMA Australian Chapter Members
Single Hedge Fund Managers
American Express Asset Management
Barclays Global Investors
Basis Capital
Blue Sky Capital Management
Ebisu Portfolio Management
Eclectic Capital Management
FX Concepts (Asia Pacific), Ltd
GMO Australia Ltd
GoldLink Capital
Grinham Managed Funds Pty Ltd
Highland Capital Management Pty Limited
K2 Asset Management
Kaiser Trading Group
Monterrey Investment Management
Obno Pty Ltd
Optimal Fund Management
PM Capital
Sutton Managed Futures
Tactical Global Management
Vertex Capital Management
Fund of Hedge Fund Managers
Absolute Capital
Colonial First State Investments
DB Absolute Return Strategies
Everest Capital
Financial Risk Management
Gottex Australia Pty Ltd
Granite Capital Australia
Investor Select Advisors
Macquarie Bank
Momentum Australia Ltd
Sagitta Wealth Management
Service Providers
Access Economics
AFMA
Blake Dawson Waldron
CITCO Fund Services (Australia) Limited
Clayton Utz
CMC Group Pty Limited
Commonwealth Bank
Ernst & Young
Goldman Sachs Australia Pty Limited
Henry Davis York
Merrill Lynch (Australia)
Phillips Fox Lawyers
UBS Warburg Australia
Zurich Capital Markets Australia Ltd
4 AIMA and ASSIRT Hedge Fund Booklet
1.1 History of the Hedge Fund Industry
Over the past 50 years, the hedge fund industry has
grown and extended from US based managers and
investments to Europe, Asia, Australia and even some
emerging markets. The growth in the hedge fund
industry was accelerated through the 1980s and 1990s
during which time the increase in the number of new
financial vehicles and a change in technology facilitated
the development of sophisticated investment strategies
without the need for backing by large investment
houses1. In addition, the performance based incentive
fee and low barriers to entry for new funds has led to
highly-skilled entrepreneurial investment professionals
leaving large investment houses to start up their own
hedge funds, some with initial backing from their
former employer and many with their own funds.
Both the amount invested in hedge funds and the
number of funds on offer has increased substantially
over the past 10 years. From around 300 funds in
1990, current estimates are of 4000+ hedge funds
around the globe.
1 Editorial: Dealing with Myths of Hedge Fund Investment,Thomas Schneeweis; The Journal of Alternative Investments,Winter 1998
1. Background
1.2 The size of the Hedge Fund Industry(US focus)
Estimates on the size of the hedge fund industry vary,
as many private accounts are not included in the
various hedge fund indices and surveys. Global hedge
fund investment consulting firm Hennessee Group first
introduced their Hedge Fund Manager Survey in 1994.
The 2002 survey includes 766 hedge funds with over
US$141 billion assets, equating to 25% of assets in the
hedge fund industry by their estimates. The survey
results indicate that the hedge fund industry grew by
38% in 2001 to a total estimated size of US$563
billion, from US$408 billion in 2000. Charles Cradante,
President & CEO of Hennessee Group LLC notes that
"2001 was a pivotal year for the hedge fund industry as
it was the first time a bear market has been met by a
mature hedge fund industry." He also highlights that
the strong growth into hedge funds reflects investor
recognition of hedge funds as a "realistic alternative
investment for the purpose of diversifying portfolios,
capital appreciation, and managing downside risk."
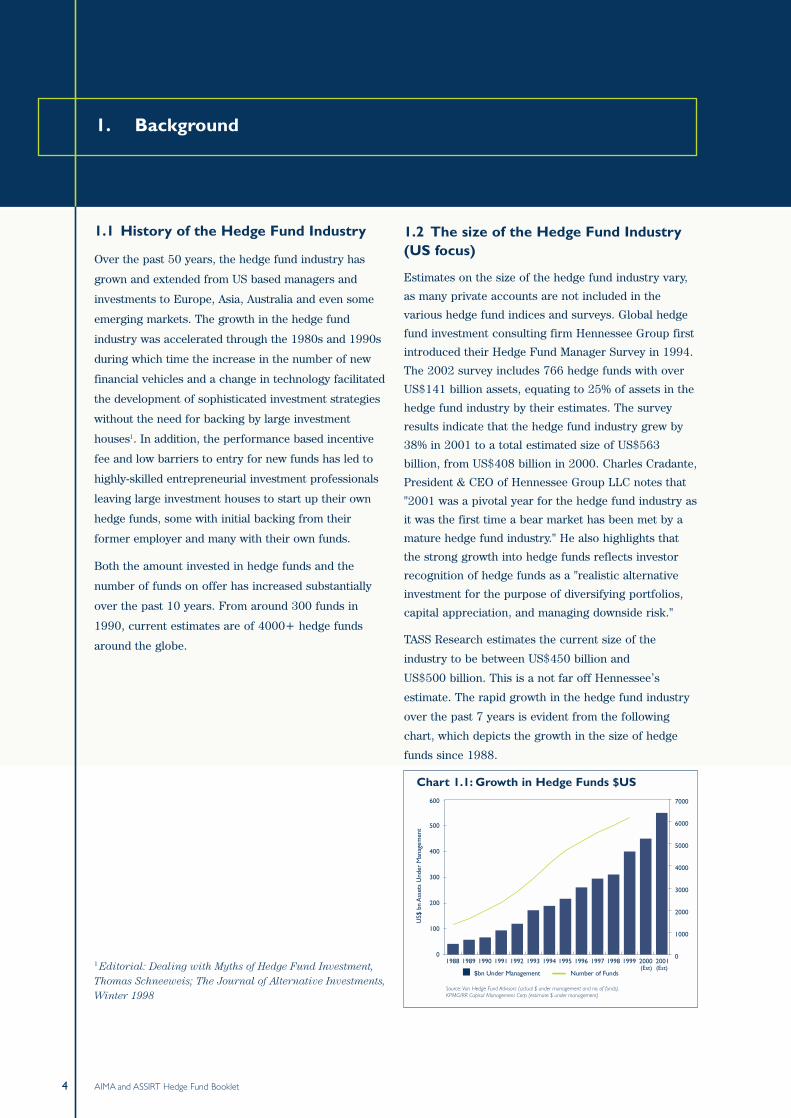
TASS Research estimates the current size of the
industry to be between US$450 billion and
US$500 billion. This is a not far off Hennessee’s
estimate. The rapid growth in the hedge fund industry
over the past 7 years is evident from the following
chart, which depicts the growth in the size of hedge
funds since 1988.
0
100
200
300
400
500
600
0
1000
2000
3000
4000
5000
6000
7000
US$
bn
Ass
ets
Und
er M
anag
emen
t
1988 1989 1990 1991 1992 1993 1994 1995 1996 1997 1998 1999 2000 2001(Est)(Est)
$bn Under Management Number of Funds
Source: Van Hedge Fund Advisors (actual $ under management and no. of funds). KPMG/RR Capital Management Corp (estimate $ under management)
Chart 1.1: Growth in Hedge Funds $US

AIMA and ASSIRT Hedge Fund Booklet 5
1.3 Who invests in Hedge Funds?
Historically, high net worth individual investors, who
wanted to protect their investments at a desired level of
risk, have been the main investors into hedge funds.
The landscape is now changing with institutional
investors and pension funds increasing their allocation
to hedge funds, as they seek out alternative investments
that offer low correlations to traditional portfolios of
cash, bonds and equities. Strong demand has also seen
the type of investor broadened to retail investors with
hedge funds making their funds more accessible with
low minimums (in one case as low as A$1000).
In their latest Hedge Fund Investor Survey, the
Hennessee Group reports that the largest investors in
hedge funds in the US continue to be individuals with
family offices, representing 56% of capital in the
industry. The largest increase in hedge fund investments
over the past year was from fund of hedge funds,
soaring from 3% of the hedge fund market to 15%.
The amount of total assets investors are willing to
allocate to hedge funds has risen steadily, reaching
41% in Hennessee’s 2002 Hedge Fund Investor Survey.
Despite this rise, just over half of investors indicated
they plan to increase the allocation of their assets in
hedge funds in the future, with 40% of respondents
looking to increase exposure in 2002.
1.4 The landscape of hedge funds andinvesting in Australia
During the late 1980s, several hedge fund managers
(mostly Commodity Trading Advisers) commenced
operations in Australia, with offshore fund of fund
managers allocating capital to them as early as 1990.
By the mid 1990s approximately 11 hedge funds or
managers were operating in the Australian market
place. Following a period of consolidation and the
collapse of LTCM in 1998 leading to a dampening of
interest in hedge funds on a global basis, a large
number of hedge fund managers have emerged in the
past 3 years. ASSIRT estimates 26 single managers and
14 fund of fund managers were launched during 1999-
2001, including the launch of the first fund of hedge
funds to the Australian market in 1999. The Australian
Chapter of the Alternative Investment Management
Association (AIMA) was formed in 2001, and currently
represents 43 members with Damien Hatfield as
Chairman and Kim Ivey as Deputy Chairman.
While several hedge funds have been operating in
Australia for well over 10 years, the local hedge fund
industry is considered to be still in its infancy as
many hedge funds are yet to establish track records
that are usually required by investors and institutions
prior to investing.
A number of superannuation funds have recently
announced allocations to hedge funds, including
Commonwealth Superannuation Scheme/Public Sector
Superannuation Scheme Australia’s second largest
superannuation fund, REST, Amcor, Westscheme and
the Reserve Bank Officers Fund. Several global funds
of hedge funds have taken this as a sign that the time
is right to enter the Australian market place. ASSIRT
believes the current growth trend is set to continue as
managers from the US and Europe increasingly visit
our shores and realise the opportunities for growth
prevalent in the Australian market place. Several large,
brand name managers have also shown interest in
launching hedge funds to the retail market in the
near future.
The Australian Hedge Fund Industry is currently worth
nearly A$5.4 billion, comprising A$3.47 billion in fund
of hedge fund assets, A$1.62 billion in single manager
strategies and approximately A$300 million allocated
to offshore hedge funds and offshore fund of hedge
funds. After adjustment for double counting, total
assets equate to approximately A$5 billion.
6 AIMA and ASSIRT Hedge Fund Booklet
A hedge fund may be described as a fund that offers an
absolute return investment objective, defined as a
targeted rate of return that is not index or benchmark
based. The approach utilised to achieve the absolute
return objective typically involves the manager investing
in similar asset sectors as traditional managers but
incorporating different skill based strategies. It is for
this reason the term ‘alternative investment strategies’
has become synonymous with hedging.
The term ‘hedge’ is generally associated with the
practice of covering an investment position (long)
with an investment that will act as an opposite position
(short), thereby nullifying any market risk imbedded
in the original investment decision. The hedge may be
in the form of a similar asset type to hedge market
risk (eg. equities) or a different security of the same
issuer (eg. equity/bond). The degree by which a fund
is ‘hedged’ in the traditional sense varies markedly
across managers.
2.1 How do hedge funds differ on a risk/return basis from traditional managed funds?
Hedge fund managers differ from
traditional active managers in a number
of ways. The two most significant are the
approaches to risk and return.
1. Risk: Most hedge fund managers define
risk in terms of potential loss of invested
capital whereas traditional active managers
define risk as the deviation (tracking error)
from a stated benchmark. The risk
associated with hedge funds is therefore
highly dependant on the skills of the
individual manager, both in implementing
the chosen strategy successfully and in
the running of their business.
2. What are Hedge Funds?
2. Return: Hedge fund managers aim to deliver a total
return unrelated to a benchmark or indice that is
therefore independent of the general direction of
markets. A traditional active manager largely aims
to deliver relative returns (returns above a related
benchmark). This relative return may be negative if
the benchmark return is negative. Therefore, the
generation of returns by hedge funds is reliant on
the skill of the manager, whereas traditional
strategies primarily reflect the return of the
underlying asset class.
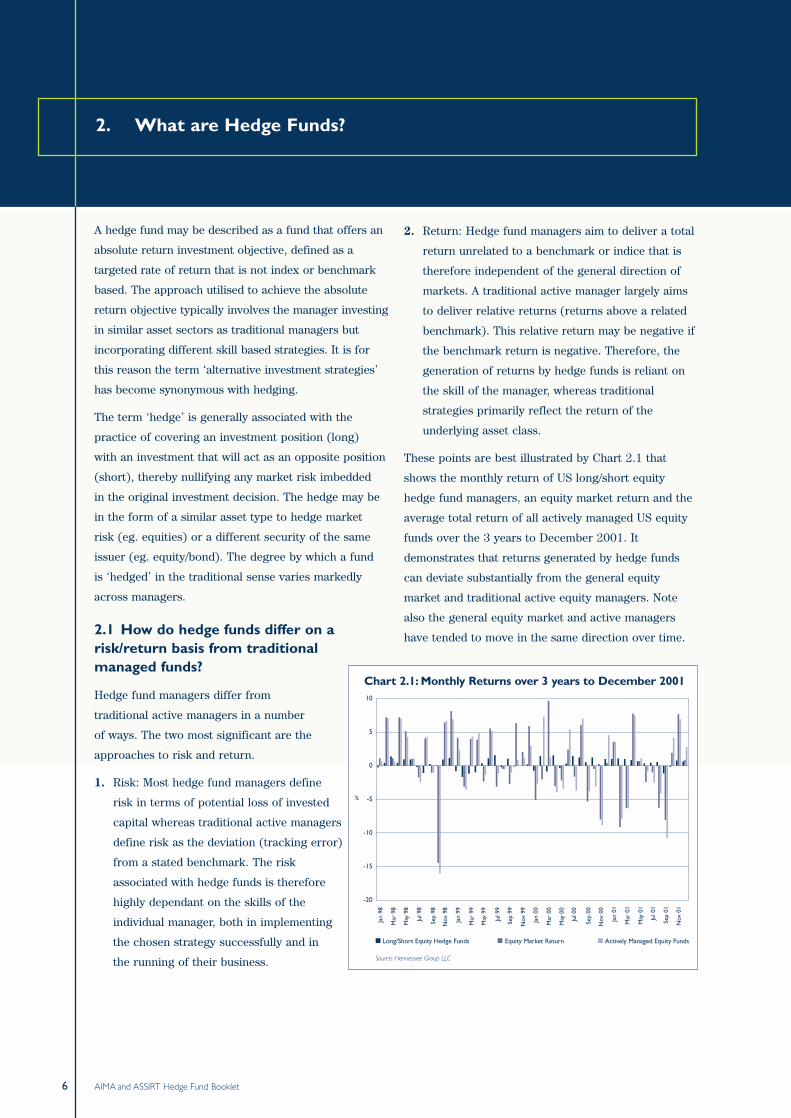
These points are best illustrated by Chart 2.1 that
shows the monthly return of US long/short equity
hedge fund managers, an equity market return and the
average total return of all actively managed US equity
funds over the 3 years to December 2001. It
demonstrates that returns generated by hedge funds
can deviate substantially from the general equity
market and traditional active equity managers. Note
also the general equity market and active managers
have tended to move in the same direction over time.
Long/Short Equity Hedge Funds Equity Market Return
Source: Hennessee Group LLC
Actively Managed Equity Funds
-20
-15
-10
-5
0
5
10
Jan
98
Mar
98
May
98
Jul 9
8
Sep
98
Nov
98
Jan
99
Mar
99
May
99
Jul 9
9
Sep
99
Nov
99
Jan
00
Mar
00
May
00
Jul 0
0
Sep
00
Nov
00
Jan
01
Mar
01
May
01
Jul 0
1
Sep
01
Nov
01
%
Chart 2.1: Monthly Returns over 3 years to December 2001

AIMA and ASSIRT Hedge Fund Booklet 7
2.2 Characteristics of single managerhedge funds
★ Hedge fund managers are typically organised as
limited partnerships, limited liability companies, unit
trusts or listed entities as investment pools with the
primary function of investment management.
★ Many are domiciled offshore to neutralise tax
effects and consequently for Australian investors
FIF legislation may apply.
★ Performance related compensation is prevalent,
typically with a high water mark and hurdle rate to
ensure a manager will only take incentive fees on
profit generated by positive investment
performance above a certain level.
★ Typically, a proportion of the partners or principals
wealth is invested in the funds, hence aligning their
interests with the performance of the fund.
2.4 Some Practicalities of Investing inHedge Funds
★ Many hedge funds will value assets monthly or
quarterly. Therefore unit prices will only be available
when assets are re-valued. This makes it difficult for
master funds and wrap accounts that require daily
unit pricing to include hedge funds on their menus.
★ A lock-up period may apply, restricting the liquidity
of investors’ assets. Monthly and quarterly unit
pricing also impacts fund liquidity. Some quarterly
redemption policies may also require a long notice
period (eg, 60 days notice).
★ The investor should be aware of the level of gearing
permitted within a fund.
★ Some hedge funds may distribute income
infrequently (annually) or in some cases not at all.
★ While many well run hedge funds stay open to new
investment for many years, some hedge funds may
close to new investors although remain available
through fund of hedge funds operators.
★ Limited in size to preserve investment returns.
★ High minimum investment levels, typically
$500,000 or higher. Funds with high minimums are
typically regulated as excluded offer funds by ASIC.
★ High expected risk-adjusted returns
★ Low correlation with traditional asset classes and
other skill based strategies.
2.3 Structure of Hedge Funds
The structural make-up of a typical hedge fund is
depicted in Chart 2.2. This diagram displays the
component service providers of hedge funds and their
roles and relationships.
Fund Administrator Hedge Fund
Investor
Custodian
Chart 2.2:Typical Structure of a Hedge Fund Offering
Processes subscriptions & Redemptions Calculates value
of investor’s holdings.(NAV or partnership share)
Holds the assets of the fundmonitors & controls flow ofcapital to meet margin calls
Executes the transactions ordered by the Hedge Fund Manager
Sets and undertakes investment strategy(ies) of the fund
Hedge Fund ManagerPrime Broker/Dealer
8 AIMA and ASSIRT Hedge Fund Booklet
There are many varied strategies that can be used by
hedge fund managers. They are limited only by
accessibility to markets and instruments by which to
trade, as well as technological developments where
quantitative based strategies are utilised.
Classification of hedge funds can be attempted from
various angles; via process/strategy, asset class,
geographical location or industry basis. Given the
variability by which hedge funds can be categorised,
the industry is yet to agree on a common classification.
Indeed, there are currently around 7 indices created by
consulting groups across the globe each with a
different classification methodology and outcome.
AIMA and ASSIRT both believe the most consistent
classification would occur via the process or strategy
that a fund employs and the asset class used. While
3. Strategies & Examples
this classification has limitations and difficulties when
comparing across regions or industries, we believe
that the returns generated in hedge funds are
primarily driven by the skills of the investment
managers in the particular strategies/processes
employed. Process describes the methodology that
managers follow when creating positions and
managing their portfolios and investment risk. The
methodology used by TASS Research in its
classification is largely in line with our view. The
classification is based on the investment style of each
fund in the TASS Research database.
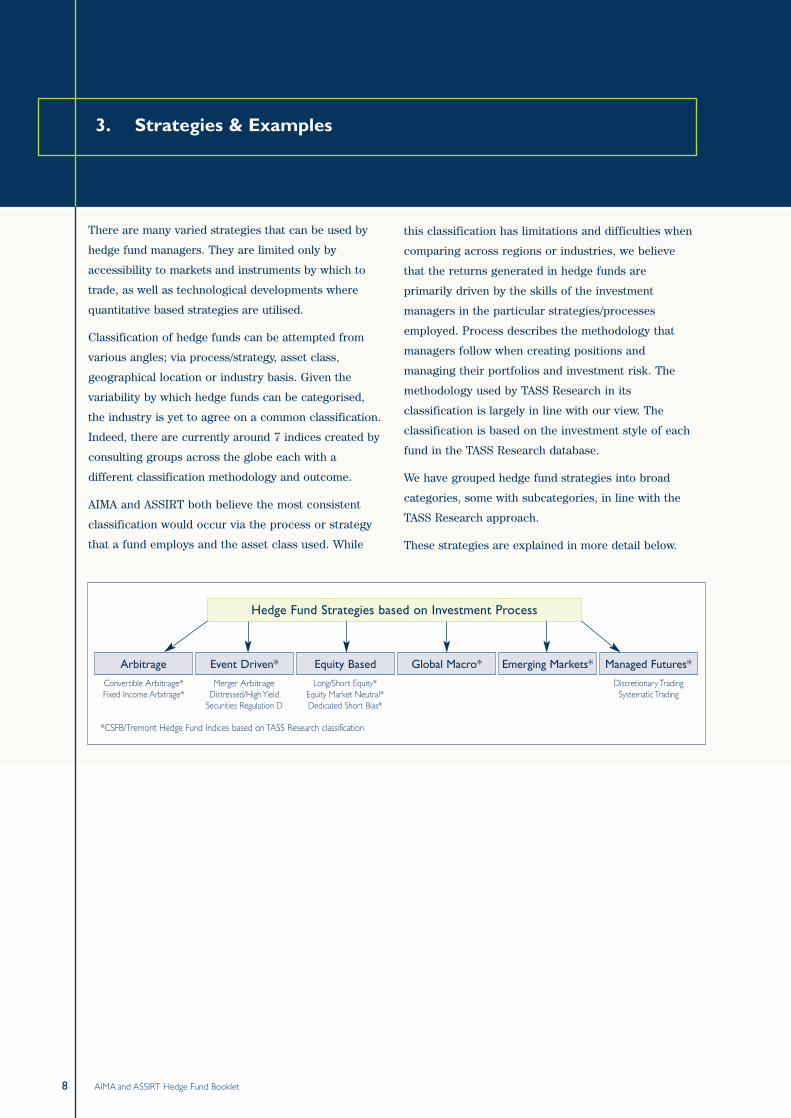
We have grouped hedge fund strategies into broad
categories, some with subcategories, in line with the
TASS Research approach.
These strategies are explained in more detail below.
Arbitrage Event Driven* Equity Based Global Macro* Emerging Markets* Managed Futures*
Convertible Arbitrage*Fixed Income Arbitrage*
Merger ArbitrageDistressed/High Yield
Securities Regulation D
Long/Short Equity*Equity Market Neutral*Dedicated Short Bias*
Discretionary TradingSystematic Trading
Hedge Fund Strategies based on Investment Process
*CSFB/Tremont Hedge Fund Indices based on TASS Research classification
AIMA and ASSIRT Hedge Fund Booklet 9
3.1 Arbitrage Strategies
In using arbitrage hedging strategies a manager
generally seeks to profit from perceived mispricing in a
specific asset of a market or security. With each position
held in the portfolio, the manager attempts to isolate
and capitalise on a feature of an asset or combination of
assets that is mispriced according to a theoretical fair
value or equilibrium relationship. The assets most
commonly traded based on arbitrage strategies include
convertible bonds, convertible preference shares and
fixed income. The degree of leverage used in arbitrage
strategies will vary with the composition of long
positions and portfolio objectives, usually between 2x
and 10x equity. Convertible Arbitrage and Fixed Income
Arbitrage strategies are detailed below.
3.1.1 Convertible Arbitrage
This strategy aims to profit from mispricing opportunities
within convertible bonds and other hybrid debt/equity
securities. These securities are a combination of various
instruments and the parcel as a whole may be a different
price to the sum of the component parts. If the price is
different there exists an opportunity to buy (sell) the
parcel and sell (buy) the various component parts to lock
in a profit. Therefore the generation of ‘alpha’ is
independent from the general direction of markets. A
typical investment is to be long (buy) the convertible
bond and short (sell) the common stock of the same
company to take advantage of the price volatility of the
stock. Positions are designed to generate profits from the
fixed income security as well as the short sale of stock,
while protecting principal from market moves.
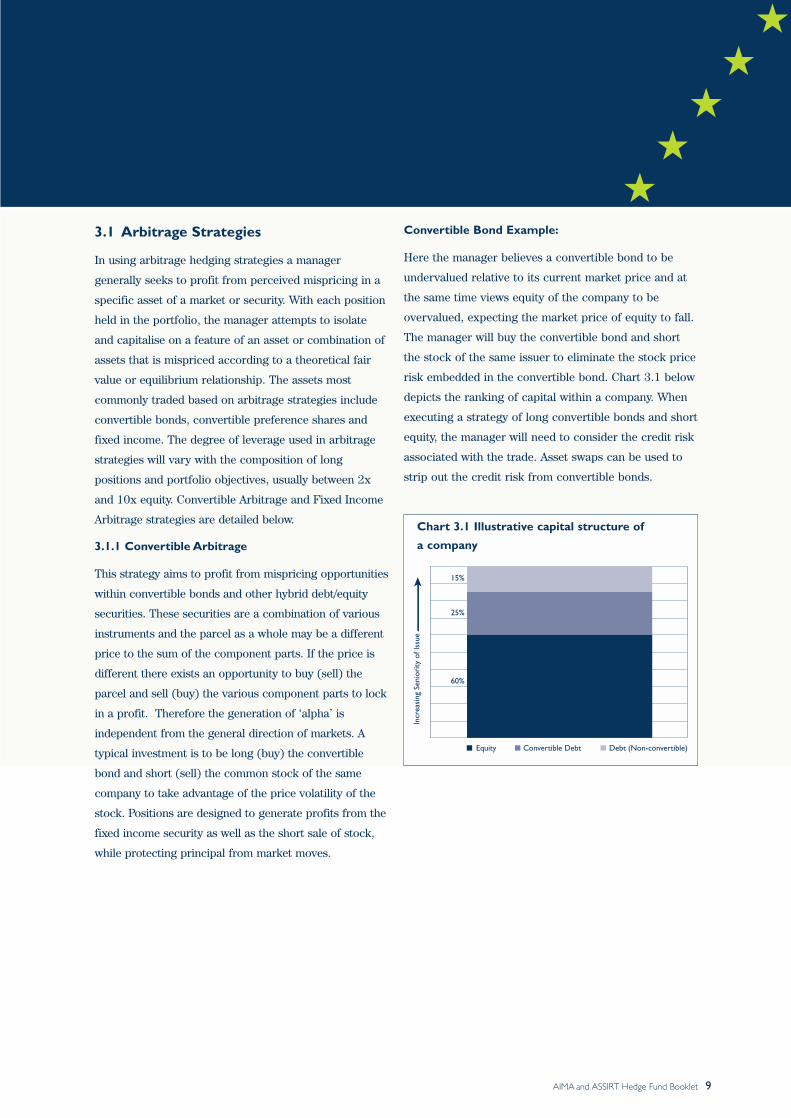
Convertible Bond Example:
Here the manager believes a convertible bond to be
undervalued relative to its current market price and at
the same time views equity of the company to be
overvalued, expecting the market price of equity to fall.
The manager will buy the convertible bond and short
the stock of the same issuer to eliminate the stock price
risk embedded in the convertible bond. Chart 3.1 below
depicts the ranking of capital within a company. When
executing a strategy of long convertible bonds and short
equity, the manager will need to consider the credit risk
associated with the trade. Asset swaps can be used to
strip out the credit risk from convertible bonds.
15%
25%
60%
Incr
easi
ng S
enio
rity
of I
ssue
Equity Convertible Debt Debt (Non-convertible)
Chart 3.1 Illustrative capital structure of
a company

10 AIMA and ASSIRT Hedge Fund Booklet
3.1.2 Fixed Income Arbitrage
The fixed income arbitrageur aims to profit from price
anomalies between related interest rate securities. Most
managers trade globally with a goal of generating steady
returns with low volatility. This category includes
interest rate swap arbitrage, US and non-US government
bond arbitrage, forward yield curve arbitrage, and
mortgage-backed securities arbitrage. The mortgage-
backed securities market is primarily US-based, over-the-
counter and particularly complex. Leverage will depend
on the types of positions taken in the portfolio. Positions
such as basis trades that are more simple and stable will
be leveraged higher than trades that have yield curve
exposure and are therefore considered to be higher risk.
Types of positions can include basis trading, intermarket
spreads, yield curve trading, relative value options
strategies and financing strategies.
Fixed Interest Arbitrage Example:
A simple example of a fixed income arbitrage strategy
is a basis trade. A basis trade involves the purchase or
sale of a futures contract and the concurrent offsetting
purchase or sale of an instrument that is deliverable
into the futures contract. This can be illustrated with
the following transaction:
Simultaneously
Purchase a government bond
Sell a futures contract on
that bond
Profit opportunities Uncertainty in the composition
of bonds required in the delivery
option of the bond futures
Shifts in the supply and demand
for the underlying bonds.
3.2 Event Driven
This strategy is designed to capture price movement
generated by a significant pending corporate event
such as a merger, corporate restructuring, liquidation,
bankruptcy or reorganisation. Three sub-categories in
event-driven strategies are: merger arbitrage,
distressed/high yield securities, and Regulation D.
3.2.1 Merger Arbitrage
Merger arbitrageurs exploit merger activity to capture
the spread between current market values of securities
and their values in the event of a merger, restructure or
other corporate transaction. Managers consider the
transaction once the announcement has been publicly
made. Before entering into a merger arbitrage strategy,
the manager will analyse the probability of the deal
closing, the likelihood of it closing at or above the bid
price, and the timeframe to the closing date. The
probability of success of the takeover directly influences
the size of positions the manager will take as the
profitability of the trade depends on the success of the
merger. If the deal involves a regulated industry (such
as banking), they factor in regulatory risk. Most merger
arbitrage managers look at both cash and stock deals.
Merger Arbitrage Example:
In mergers where shareholders in the target company
are offered stock in the acquiring company, the spread
is the difference between the current values of the
target company’s stock and the acquiring company’s
stock. The spread is captured where the arbitrageur
buys the stock of the target company and shorts the
stock of the acquiring company. This is depicted in the
following illustration;
Takeover Announcement
Offer
Market Reaction
Manager Expectation
Manager Response
Profit Where
Company BCompany A
20% premium of current market price
Stock price
Short (sell) Company A stock
No change
Buy Company B Stock
Stock priceRiseDecline
Takeover completed successfully and stock prices converge so that Company A stock price declines and Company B stock prices rise.
An alternative suitor, Company E makes a bid for Company B for a higher price than offered by Company A. The manager then switches the short position from Company A to Company E.
OR

AIMA and ASSIRT Hedge Fund Booklet 11
3.2.2 Distressed/High Yield Securities
Managers are active in fixed interest and equity
markets basing their strategies on the actual or
anticipated occurrence of a particular event such as a
bankruptcy announcement or corporate reorganisation
as a result of severe operating or financial difficulties
such as defaulting on debt. Distressed or high yield
securities are generally below investment grade and
require a high level of due diligence to take advantage
of the inexpensive prices at which they are trading.
Performance depends on how well the managers
analyse event-specific situations, rather than on the
direction of the stock or bond markets. Managers
investing in distressed or high yield securities will vary
in terms of the level of capital structure in which they
invest (debt or equity and ranking of the security), the
stage of the restructuring process and the degree to
which they become actively involved in negotiating the
terms and management of the restructuring.
Distressed Debt Example:
In a typical situation depicted below, a financial
institution (Finanz Company) makes a loan to a borrower
(WeAre Retail). WeAre Retail then finds itself in financial
difficulty, resulting in bankruptcy or being close to it.
WeAre Retail has defaulted on its debt resulting in a fall
in the value of the loan. A Distressed Debt specialist
analyses the situation for possible investment either in
the debt or equity of the company considering questions
such as: Does the business have value? Is the company in
trouble because of problems, such as over-leveraging,
that can be rectified? What class of debt will have the
most power in the restructuring?
Investors in distressed securities are seeking capital
appreciation of the debt rather than an income stream.
WeAre Retail(Clothing Retailer)
Passive Investment Active Investment
Hedge Fund Manager
Files for Bankruptcy
WeAre Retail uses financingfor restructuring/repaying debt
buys core position of debt orequity in WeAre Retail
buys equity/debt at a discountand waits for appreciation
buys equity/debt at a discountactively involved in restructuring andrefinancing to influence process to
their advantage
Finance Company
Loan of $1 million issued
Defaults on loan repayments
12 AIMA and ASSIRT Hedge Fund Booklet
3.2.3 Regulation D
Regulation D is a form of capital raising, essentially
representing investments in micro and small
capitalisation public companies that are raising money
in private capital markets. A manager will make a short
term or medium term investment in companies that are
in need of large capital injection within a relatively
short time frame. This allows small firms to raise
capital quickly and relatively cheaply and managers
aim to benefit from free equity options embedded in
the financial transaction. Investments usually take the
form of a convertible security with an exercise price
that floats or is subject to a look-back provision that
insulates the investor from a decline in the price of the
underlying stock.
Regulation D Example:
Buy A floating convertible instrument
in a small company listed on the
stock exchange
Option The option in the security is to convert
to the small company stock at say 15%
discount to the company’s stock price
after a minimum holding period of
18 months.
Profit To purchase the company stock
Opportunity at a discount and the ability to sell at a
higher price, that is the market price.
3.3 Equity Based Strategies
Managers will base the investment decision on their
view of the degree by which individual securities are
under or over valued relative to current market prices.
These strategies are heavily reliant on the skill of the
manager in discerning the value of a security. The
manager may use quantitative tools, however the final
investment decision is usually a subjective one.
Strategies combine long and short positions thereby
reducing or eliminating (in the case of market neutral
strategies), directional market risk and generating
returns based on the price movements in securities.
This may involve borrowing securities the manager
considers to be overvalued then selling them on the
market in the expectation that the price will be lower
when the fund has to buy the securities back to be able
to return them to the brokers.
These funds take positions along the whole risk-return
spectrum and try to distinguish their performance from
that of the asset class as a whole. Returns will therefore
deviate substantially from the underlying market return.
Portfolios will also tend to be more concentrated than
those of traditional long-only managers.
3.3.1 Long/Short Equity
Managers employing this strategy will hold both long
and short positions with a net long exposure. The
objective is not to be market neutral. This means that
at all times more than 50% of assets should be held as
long (buy) positions. This category excludes long only
portfolios. To be considered a hedge fund, the
manager’s strategy must include short positions while
maintaining an absolute return objective. Managers
have the ability to shift from value to growth and from
small to medium to large capitalisation stocks.
Managers may use futures and options to hedge. The
focus may be regional, such as long/short US or
European equity, or sector specific, such as long and
short technology or healthcare stocks.
AIMA and ASSIRT Hedge Fund Booklet 13
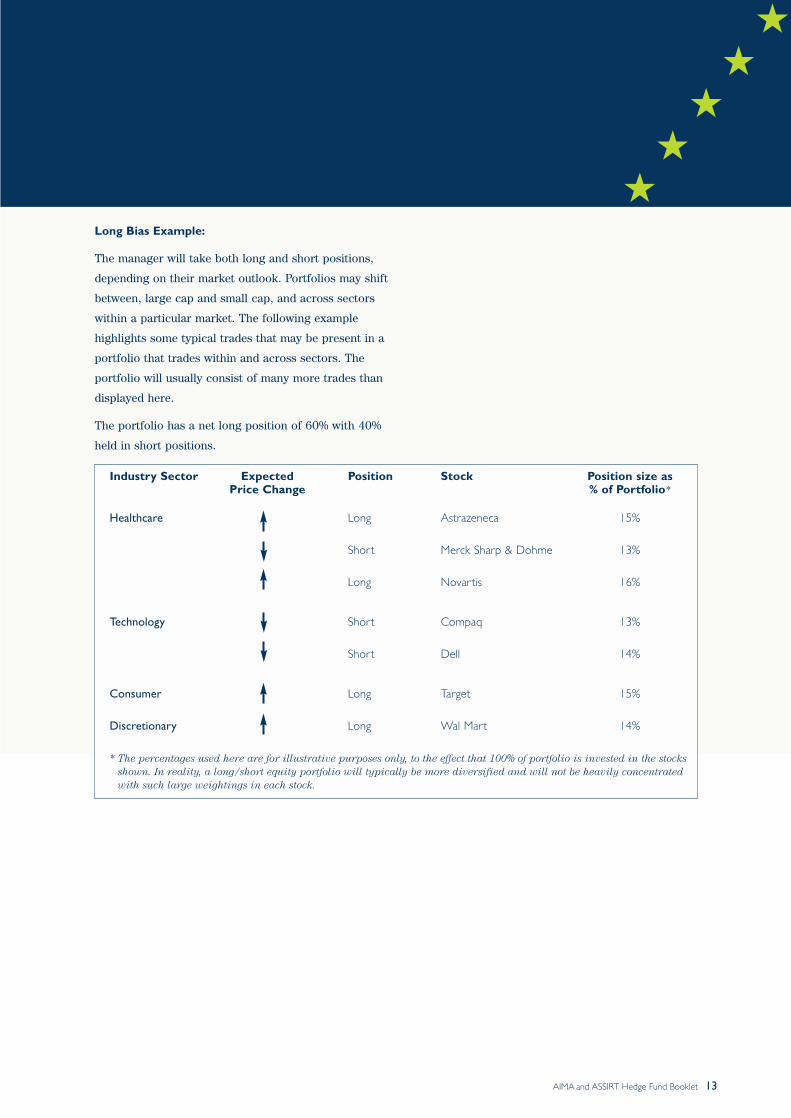
Long Bias Example:
The manager will take both long and short positions,
depending on their market outlook. Portfolios may shift
between, large cap and small cap, and across sectors
within a particular market. The following example
highlights some typical trades that may be present in a
portfolio that trades within and across sectors. The
portfolio will usually consist of many more trades than
displayed here.
The portfolio has a net long position of 60% with 40%
held in short positions.
Industry Sector Expected Position Stock Position size asPrice Change % of Portfolio*
Healthcare Long Astrazeneca 15%
Short Merck Sharp & Dohme 13%
Long Novartis 16%
Technology Short Compaq 13%
Short Dell 14%
Consumer Long Target 15%
Discretionary Long Wal Mart 14%
* The percentages used here are for illustrative purposes only, to the effect that 100% of portfolio is invested in the stocksshown. In reality, a long/short equity portfolio will typically be more diversified and will not be heavily concentratedwith such large weightings in each stock.

14 AIMA and ASSIRT Hedge Fund Booklet
3.3.2 Equity Market Neutral
This investment strategy is designed to exploit equity
market inefficiencies and usually involves simultaneously
long and short matched equity portfolios of the same
size. The manager will aim to position the portfolio to be
cash or beta neutral, or both. Typically the portfolio will
exhibit a small or nil net market exposure. Well-designed
portfolios typically control for industry, sector, market
capitalisation, and other market factors. This translates
to a near 50:50 balance to long and short positions.
Leverage is often applied to enhance returns.
Equity Market Neutral Example:
A pair trade in a dual listed company is a good example
of an equity market neutral strategy. This involves the
purchase of one share category and the sale of another
on the same stock. For example the manager -
Buys shares in one class Company A, Class C, listed
in the UK
Sells shares in another class Company A, Class D,
listed in France
Profit Opportunity The manager expects
Class C stocks to rise in
price and Class D stocks
to fall based on some
change to Company A's
capital structure.
There is no market or sector risk as the two stocks are
based on the same economic entity, but happen to
deviate in price.
3.3.3 Dedicated Short-Bias
In employing this strategy, a hedge fund manager will
maintain a net short bias against the market. Managers
look for securities that they perceive to be overvalued
and short those stocks or use derivatives to profit from a
declining share price. They may achieve better results in
bearish markets.
Dedicated Short Bias Example:
The following portfolio is an illustration of the
characteristics of a net short hedge fund. The manager
has taken a larger bet on the short positions, as
indicated by both the number of short versus long
positions and the total portfolio value of short
positions versus the value of long positions.
3.4 Global Macro
This strategy involves opportunistically allocating capital
among a wide variety of strategies and capital or
derivative markets. Strategies or themes may be
directional or non-directional, traditional or hedged. This
is the most flexible of investment strategies, with the
manager often taking a top-down thematic approach and
investing on an opportunistic basis, moving between
countries, markets and instruments based on the
manager’s forecasts of changes in factors such as
interest rates, exchange rates and liquidity. A number of
different trading strategies are often used depending on
the opportunities identified. Most funds invest globally in
both developed and emerging markets.
Global Macro Example:
A manager will attempt to exploit global trends and
market movements by entering into irregular, directional
positions that are highly leveraged. If for example a
manager expects interest rate spreads between Australia
and the USA to widen as a result of interest rates rising
in Australia. Hedge positions may be taken in interest
rates or currencies of the two countries;
Bet on $A/USD with the expectation that the $A will
rise against the USD following the increase in
Australian interest rates.
Number of Short 32 Total Value ofPositions Short Positions $400,000
Number of Long 4 Total Value of Positions Long Positions $20,000
Portfolio Bias: Net short

AIMA and ASSIRT Hedge Fund Booklet 15
3.5 Emerging Markets
Broadly defined, an emerging market is a country
making an effort to change and improve its economy
with the goal of raising its performance to that of the
world's more advanced nations. The World Bank
classifies economies with a Gross National Income per
capita of $9,266 and above as high-income countries.
Emerging markets however are not necessarily small or
poor. China, for example, is considered an emerging
market even though it has vast resources, has launched
satellites into space and a population of more than a
billion people.
The emerging markets strategy used by hedge funds
involves equity or fixed income investing in emerging
markets around the world. Because many emerging
markets do not allow short selling, nor offer viable
futures or other derivative products with which to
hedge, emerging market investing often employs a
long-only strategy. As the currency of many emerging
markets cannot be hedged through the use of
derivatives, an investment in an emerging market
results in exposure to the movements in currency of
the underlying country.
3.6 Managed Futures
This strategy is based on speculation of the direction in
market prices of currencies, commodities, equities and
fixed interest and on spot or futures markets across the
globe. The managers are usually referred to as
Commodity Trading Advisors, or CTAs. Trading
disciplines are generally systematic or discretionary.
Systematic traders tend to use price and market specific
information (often technical) to follow trends while
discretionary managers use a less quantitative approach,
relying on both fundamental and technical analysis.
3.6.1 Systematic Trading
Proprietary, quantitative models are typically used to
identify market opportunities and establish positions,
including the size of positions and the risk control. As a
group, these managers are trend followers. They seek to
identify a trend or pattern and position themselves to
stay invested as long as it persists. Systematic trading
differs from statistical arbitrage in that each position is
essentially an independent directional trade that is
intended to produce a profit, not a relative position.
3.6.2 Discretionary Trading
A manager will use fundamental analysis or computer
systems or a combination of the two to identify
profitable trades. In general, this tends to be the highest
risk and highest return strategy within the universe of
hedge funds, with concentrated positions held for very
short periods of time. The main difference between
these strategies and systematic trading is that the
investment decision is not automated. The manager will
make the final investment decision.
Typical Trades of Managed Futures strategies include:
★ Trend following using technical analysis with
stop-losses in place. Instruments used include
currency futures, forwards, exchange traded and
over-the-counter options and warrants.
★ Long term directional trading based on
market fundamentals
★ Short term spot trading based on flow information.

16 AIMA and ASSIRT Hedge Fund Booklet
3.7 Dominance of Strategies
3.7.1 Global Marketplace
The growth of strategies and composition within the
industry has changed dramatically over the past few
years. Charts 3.7.1 and 3.7.2 demonstrate the change
in composition of strategies within the global hedge
fund industry since 1994.
In 1994, as shown in Chart 3.7.1 global macro and
long/short equity strategies dominate the market place,
with a combined representation of 57.8%. The large
allocation to global macro is due to asset flows into
this strategy on the back of strong returns in 1992 and
1993. While event driven and emerging market
strategies also feature strongly, each with greater than
10% of assets, the remaining strategies are not
heavily represented.
The Strategies that currently dominate the hedge fund
industry are shown in Chart 3.7.2. Notably, Long/Short
equity funds have increased in market share from 26%
to 44%. The rapid growth in assets held in long/short
equity funds is attributable in part to the raging bull
market of the 1990s, which has attracted inflows and
new managers in this strategy. The demise of global
macro as a percentage of total assets within the industry
reflects funds outflow following poor performance of the
strategy (particularly 1994 and 1998) and the closure
and subsequent return of capital of two large and
dominant global macro managers in the industry.
3.7.2 Australian Marketplace
The breakdown of single fund managers and fund of
hedge funds by strategy type currently offered in the
Australian market place are depicted in Charts 3.7.3
and 3.7.4. These charts highlight the diversity across
the market and the opportunities for further diversity
as the industry grows. The current dominance of the
long/short equity strategy within single manager
offerings is in line with the global market environment.
The dedicated short bias strategy does not feature for
either single manager or fund of hedge funds in the
Australian market place. This is not surprising since
this strategy exhibits the highest volatility in returns
over time and it is hard to consistently add value in a
strategy that relies on falling share prices.
Source: TASS Research
Short Sellers 0.3%
Equity Market Neutal 1.8%
Fixed Interest Arbitrage 6.7%
Emerging Markets 12.6%
Managed Futures 6.3%
Other 0.3%
Convertible Arbitrage 1.4% Event Driven 12.7%
Long/Short Equity 26.2%
Global Macro 31.6%
Chart 3.7.1 Breakdown of Total Assets by
Strategy as at December 1994
Source: Tass Research
Fixed Interest Arbitrage 5.4%
Emerging Markets 3.1%
Managed Futures 2.9%
Equity Market Neutral 6.7%
Global Macro 9.2%
Convertible Arbitrage 7.9% Long/Short
Equity 44.3%
Short Sellers 0.3%
Other 0.5%
Event Driven 19.6%
Chart 3.7.2: Breakdown of Total Assets by
strategy as at December 2001
Source: ASSIRT
Multi Strategy 13%Managed Futures 23%
Long/Short Equity 45%
Fixed IncomeArbitrage 10%
Convertible Arbitrage 3%
Event Driven 6%
Chart 3.7.3 Breakdown of Single Manager
offerings by Strategy type

AIMA and ASSIRT Hedge Fund Booklet 17
The multi strategy dominates the fund of hedge funds
universe, a trend ASSIRT believes will continue as large
brand name fund managers continue to enter the
market place and investors look for diversity across
strategies and managers.
It is important to note that while funds of hedge funds
currently have nil allocation to some strategies, these
may be extensively used within the multi strategy
category by fund of hedge funds, in particular
Convertible Arbitrage and Global Macro strategies.
The popularity of each strategy is driven in part by the
risk/return possibilities of each strategy. In the next
section we outline the differences in strategies based
on risk/return drivers.
Source: ASSIRT * 30 Funds offered through 14 different managers
Managed Futures 3%
Long/Short Equity 20%
Event Driven 3%
Equity Market Neutral 3%
Fixed Income Arbitrage 7%
Multi Strategy 64%
Chart 3.7.4 Breakdown of Fund of Hedge Funds*
offerings by Strategy type

18 AIMA and ASSIRT Hedge Fund Booklet
An important measure for an investor to consider is the
degree of exposure to the broad movements of the
market and the impact on risk/return. Funds are
generally constructed with specific targets and
strategies, such that the investor knows to anticipate a
certain risk/return profile. In general, the higher the
degree of ‘directionality,’ or investing in market
direction, the higher will be the potential return and
volatility. An example of the risk/return delivered by a
range of strategy-based indices and the broader market
indices for the five years to December 2001 is shown
in Chart 4.1. This analysis is at one point in time and
as such the risk/return delivered by a strategy and
market will move around this point over time.
That hedge fund strategies differ substantially from each
other and more importantly from the broader bond,
property and equity markets is highlighted in Chart 4.1.
The MSCI World ex Australia Accumulation Index ($A)
has delivered the highest return at the highest level of
risk than the other broader market indices. A number of
hedge fund strategies have delivered returns largely in
line with the Australian equity market but at a lower risk.
These include event driven, convertible arbitrage and
equity market neutral strategies.
4. Return/Risk Drivers
Short selling as a security selection strategy has
delivered the lowest return at the highest level of risk
of all strategies and market returns analysed. This is in
line with the view that it is difficult to deliver
consistent outperformance from trading strategies that
solely rely on falling stock prices, as markets have
generally risen over time.
It is interesting to note that a large number of hedge fund
strategies deliver higher return opportunities than those
achieved from Australian bonds (as measured by the UBS
Warburg Composite Bond Index – All Maturities) or
Australian property securities (ASX Property Trust
Accumulation Index). The trade-off for this higher return
in some cases is a higher volatility in returns. This
volatility is in most instances however, much lower than
that of Australian or international equities.
The HFRI fund of hedge funds index sits in the middle
range of risk/return outcomes from both hedge fund
strategies and broader market indices. This highlights
the diversification benefits that can be achieved
through utilising a range of hedge fund strategies. It is
important to note that this index comprises a number
of fund of hedge funds, each with unique
characteristics. Each fund of hedge fund will have
distinct risk and return objectives and will diversify
across managers and strategies to varying degrees.
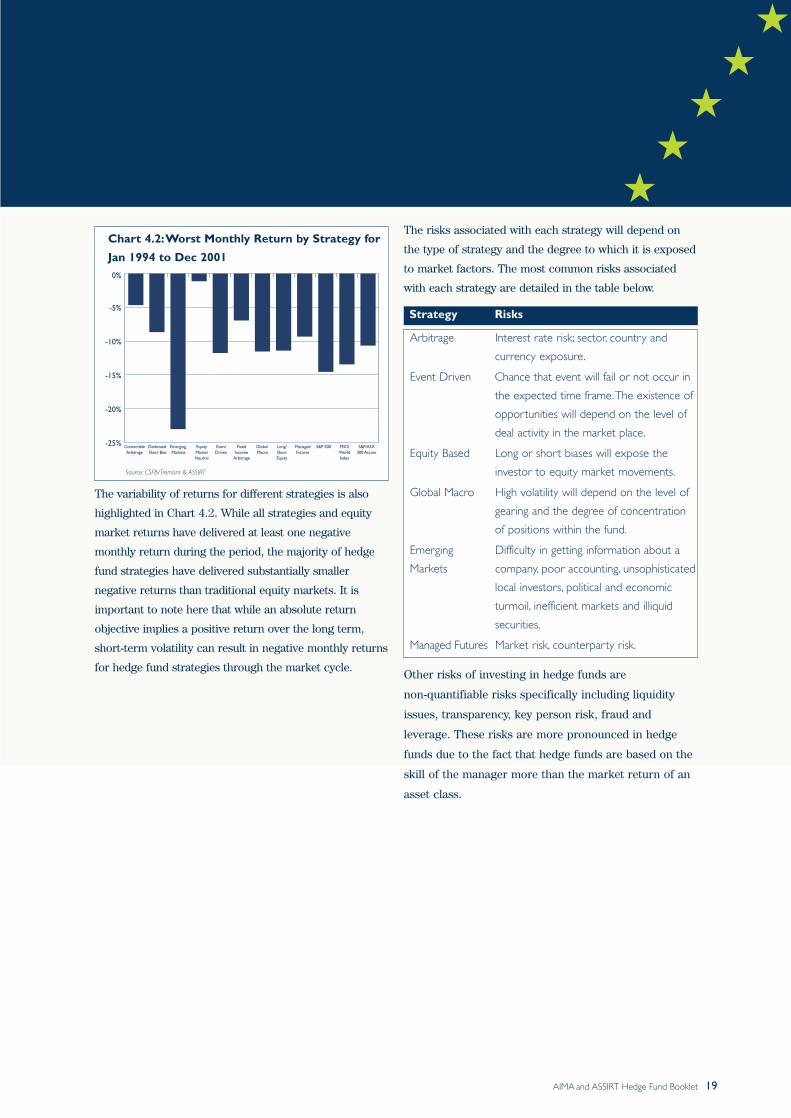
For hedge funds with absolute return objectives, it is
more meaningful to measure correlations and risk
which evaluate both the upside and downside deviations
relative to each fund’s specific objectives, than
performance relative to an index or peer group. The
worst monthly return for each strategy within the
CSFB/Tremont universe and some equity market returns
over the eight years to December 2001 is shown in
Chart 4.2. The emerging markets strategy exhibits the
greatest negative monthly return throughout the period.
Not surprisingly, the smallest negative return for a
month occurred within the equity market neutral
strategy that nullifies any market risk through holding a
portfolio of overall equal long and short positions.
Long/Short Equity
S&P/ASX All Ords Accum Index
Emerging Markets
Dedicated Short Bias
Managed Futures
ASX Property Trust Accum Index
Fund of Hedge Funds
Fixed Interest Arbitrage
UBS Warburg Comp Bond Index - All Mats
Event Driven
Convertible ArbitrageEquity Market Neutral
MSCI World ex Aust Accum Index $A
Global Macro
18.00
16.00
14.00
12.00
10.00
8.00
6.00
4.00
2.00
0.00
-2.00
-4.000 1 2 3 4
Monthly Standard Deviation, annualised %
5 6 7 8 9 10 11 12 13 14 15
Source: CSFB/Tremont, HFR & ASSIRT
Chart 4.1 – Return and Risk of Hedge Fund
Strategies and Market Indices
AIMA and ASSIRT Hedge Fund Booklet 19
The variability of returns for different strategies is also
highlighted in Chart 4.2. While all strategies and equity
market returns have delivered at least one negative
monthly return during the period, the majority of hedge
fund strategies have delivered substantially smaller
negative returns than traditional equity markets. It is
important to note here that while an absolute return
objective implies a positive return over the long term,
short-term volatility can result in negative monthly returns
for hedge fund strategies through the market cycle.
The risks associated with each strategy will depend on
the type of strategy and the degree to which it is exposed
to market factors. The most common risks associated
with each strategy are detailed in the table below.
Other risks of investing in hedge funds are
non-quantifiable risks specifically including liquidity
issues, transparency, key person risk, fraud and
leverage. These risks are more pronounced in hedge
funds due to the fact that hedge funds are based on the
skill of the manager more than the market return of an
asset class.
-25%
-20%
-15%
-10%
-5%
0%
Convertible Arbitrage
Dedictaed Short Bias
Emerging Markets
EquityMarket Neutral
Event Driven
Fixed Income
Arbitrage
Global Macro
Long/ Short Equity
Managed Futures
S&P 500 MSCI World Index
S&P/ASX 300 Accum
Source: CSFB/Tremont & ASSIRT
Chart 4.2:Worst Monthly Return by Strategy for
Jan 1994 to Dec 2001
Strategy Risks
Arbitrage Interest rate risk; sector, country and
currency exposure.
Event Driven Chance that event will fail or not occur in
the expected time frame.The existence of
opportunities will depend on the level of
deal activity in the market place.
Equity Based Long or short biases will expose the
investor to equity market movements.
Global Macro High volatility will depend on the level of
gearing and the degree of concentration
of positions within the fund.
Emerging Difficulty in getting information about a
Markets company, poor accounting, unsophisticated
local investors, political and economic
turmoil, inefficient markets and illiquid
securities.
Managed Futures Market risk, counterparty risk.
20 AIMA and ASSIRT Hedge Fund Booklet
5.1 Why invest in hedge funds?
As noted in Section 1, the types of investors who are
attracted to hedge funds varies from superannuation
funds to retail investors. Throughout a market cycle,
there will be periods during which equity and bond
markets will offer both attractive and unattractive
investment opportunities. The difficulty with investing
in any market is identifying when these opportunities
will rise and positioning an investor’s portfolio to take
advantage of favourable market conditions. An equity
market bull-run can be followed by a bear market with
lower returns from market based strategies,
price/earnings contraction and the delivery of lower
returns by traditional managers. However it is difficult to
predict the duration and extent of a bull or bear market.
Therefore hedge funds present an attractive opportunity
for inclusion in an investor’s diversified portfolio due to
the possibility of enhanced risk adjusted returns (as
demonstrated in section 4 above) and the low correlation
in returns that many hedge funds have to traditional asset
classes. A lower correlation between asset classes within
an investor’s portfolio, will result in a reduction in the
overall level of risk within the portfolio. The correlation
of returns that some hedge fund strategies exhibit with
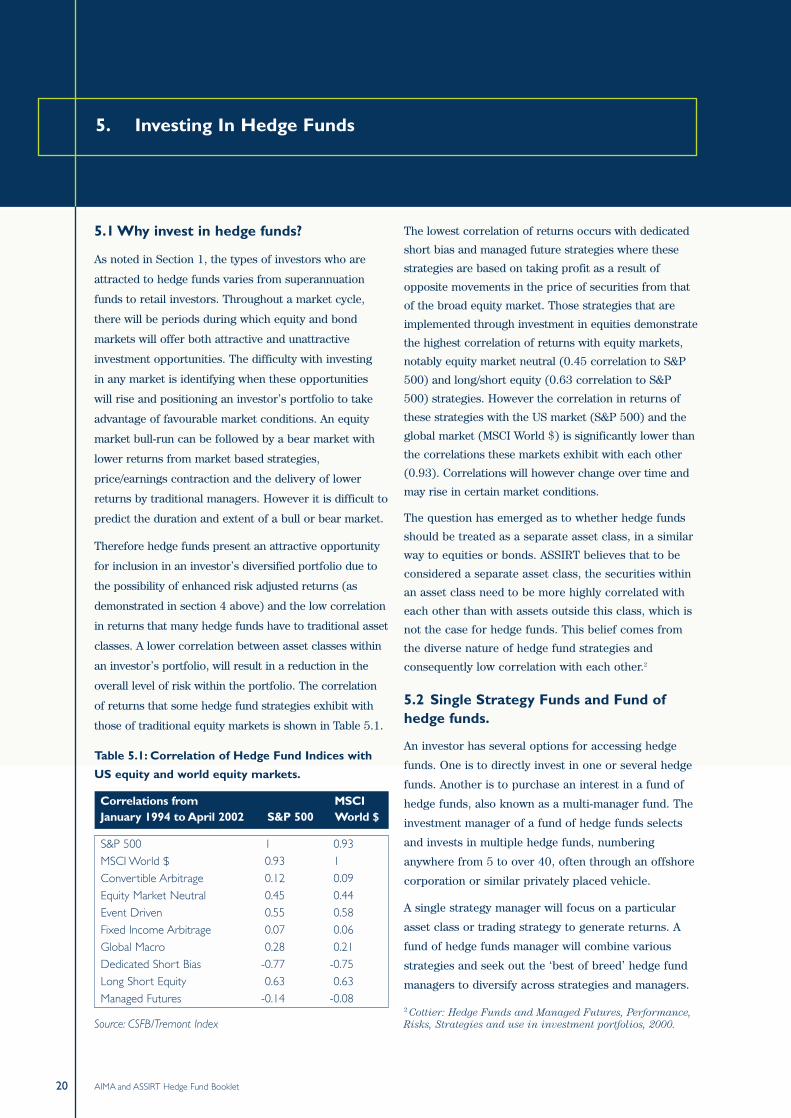
those of traditional equity markets is shown in Table 5.1.
Table 5.1: Correlation of Hedge Fund Indices with
US equity and world equity markets.
Source: CSFB/Tremont Index
The lowest correlation of returns occurs with dedicated
short bias and managed future strategies where these
strategies are based on taking profit as a result of
opposite movements in the price of securities from that
of the broad equity market. Those strategies that are
implemented through investment in equities demonstrate
the highest correlation of returns with equity markets,
notably equity market neutral (0.45 correlation to S&P
500) and long/short equity (0.63 correlation to S&P
500) strategies. However the correlation in returns of
these strategies with the US market (S&P 500) and the
global market (MSCI World $) is significantly lower than
the correlations these markets exhibit with each other
(0.93). Correlations will however change over time and
may rise in certain market conditions.
The question has emerged as to whether hedge funds
should be treated as a separate asset class, in a similar
way to equities or bonds. ASSIRT believes that to be
considered a separate asset class, the securities within
an asset class need to be more highly correlated with
each other than with assets outside this class, which is
not the case for hedge funds. This belief comes from
the diverse nature of hedge fund strategies and
consequently low correlation with each other.2
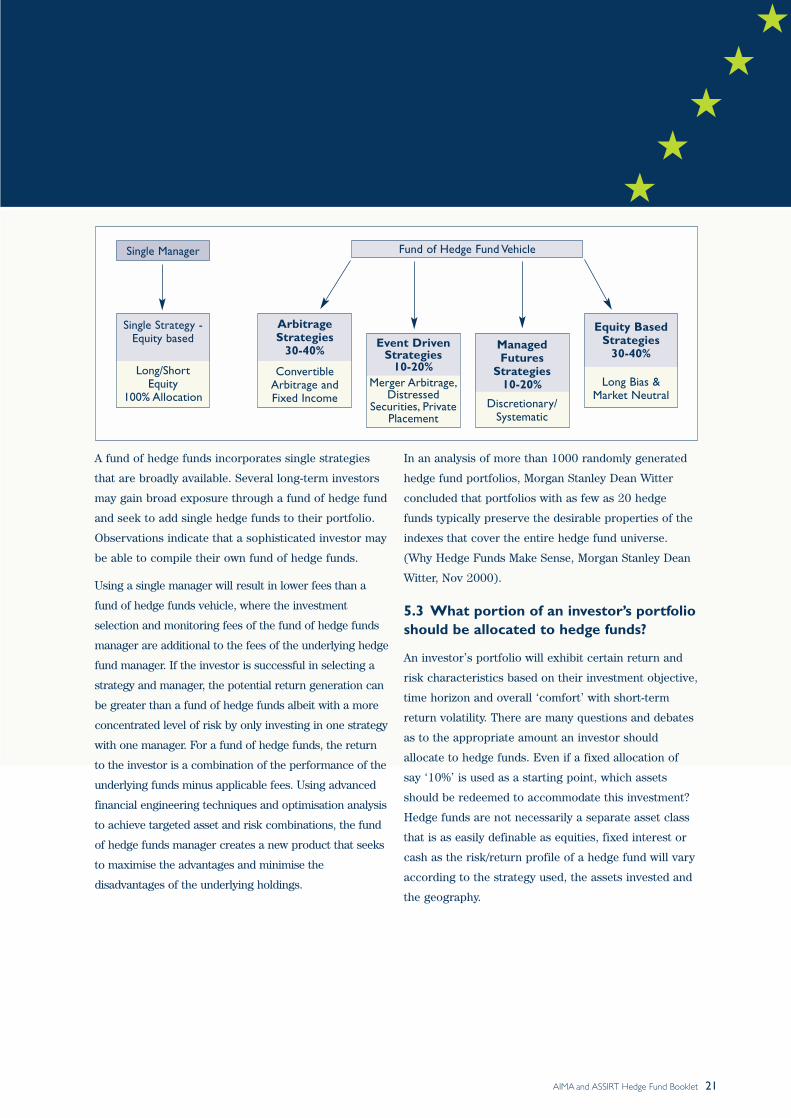
5.2 Single Strategy Funds and Fund ofhedge funds.
An investor has several options for accessing hedge
funds. One is to directly invest in one or several hedge
funds. Another is to purchase an interest in a fund of
hedge funds, also known as a multi-manager fund. The
investment manager of a fund of hedge funds selects
and invests in multiple hedge funds, numbering
anywhere from 5 to over 40, often through an offshore
corporation or similar privately placed vehicle.
A single strategy manager will focus on a particular
asset class or trading strategy to generate returns. A
fund of hedge funds manager will combine various
strategies and seek out the ‘best of breed’ hedge fund
managers to diversify across strategies and managers.
2 Cottier: Hedge Funds and Managed Futures, Performance,Risks, Strategies and use in investment portfolios, 2000.
Correlations from MSCIJanuary 1994 to April 2002 S&P 500 World $
S&P 500 1 0.93
MSCI World $ 0.93 1
Convertible Arbitrage 0.12 0.09
Equity Market Neutral 0.45 0.44
Event Driven 0.55 0.58
Fixed Income Arbitrage 0.07 0.06
Global Macro 0.28 0.21
Dedicated Short Bias -0.77 -0.75
Long Short Equity 0.63 0.63
Managed Futures -0.14 -0.08
5. Investing In Hedge Funds
AIMA and ASSIRT Hedge Fund Booklet 21
A fund of hedge funds incorporates single strategies
that are broadly available. Several long-term investors
may gain broad exposure through a fund of hedge fund
and seek to add single hedge funds to their portfolio.
Observations indicate that a sophisticated investor may
be able to compile their own fund of hedge funds.
Using a single manager will result in lower fees than a
fund of hedge funds vehicle, where the investment
selection and monitoring fees of the fund of hedge funds
manager are additional to the fees of the underlying hedge
fund manager. If the investor is successful in selecting a
strategy and manager, the potential return generation can
be greater than a fund of hedge funds albeit with a more
concentrated level of risk by only investing in one strategy
with one manager. For a fund of hedge funds, the return
to the investor is a combination of the performance of the
underlying funds minus applicable fees. Using advanced
financial engineering techniques and optimisation analysis
to achieve targeted asset and risk combinations, the fund
of hedge funds manager creates a new product that seeks
to maximise the advantages and minimise the
disadvantages of the underlying holdings.
In an analysis of more than 1000 randomly generated
hedge fund portfolios, Morgan Stanley Dean Witter
concluded that portfolios with as few as 20 hedge
funds typically preserve the desirable properties of the
indexes that cover the entire hedge fund universe.
(Why Hedge Funds Make Sense, Morgan Stanley Dean
Witter, Nov 2000).
5.3 What portion of an investor’s portfolioshould be allocated to hedge funds?
An investor’s portfolio will exhibit certain return and
risk characteristics based on their investment objective,
time horizon and overall ‘comfort’ with short-term
return volatility. There are many questions and debates
as to the appropriate amount an investor should
allocate to hedge funds. Even if a fixed allocation of
say ‘10%’ is used as a starting point, which assets
should be redeemed to accommodate this investment?
Hedge funds are not necessarily a separate asset class
that is as easily definable as equities, fixed interest or
cash as the risk/return profile of a hedge fund will vary
according to the strategy used, the assets invested and
the geography.
Fund of Hedge Fund VehicleSingle Manager
Single Strategy -Equity based
Long/Short Equity
100% Allocation
ArbitrageStrategies
30-40%
ConvertibleArbitrage and Fixed Income
Event DrivenStrategies
10-20%Merger Arbitrage,
DistressedSecurities, Private
Placement
ManagedFutures
Strategies 10-20%
Discretionary/Systematic
Equity BasedStrategies
30-40%
Long Bias &Market Neutral

22 AIMA and ASSIRT Hedge Fund Booklet
However a hedge fund investing in equity markets or
fixed income markets will not necessarily take on the
characteristics of that particular market. As an example,
within the equity based category of hedge fund
strategies a long/short equity portfolio or an equity
market neutral portfolio or a short bias portfolio may
deliver risk/return characteristics over time that are
quite different to those of broader equity markets and
therefore cannot always be considered an appropriate
replacement for equities. The return/risk profile of the
Australian share market and global share markets can
differ substantially from those of the equity based hedge
fund strategies, as demonstrated in Chart 5.1.
When using portfolio modelling (such as mean
variance optimisation) to make asset allocation
decisions, it is best to use the expected risk/return
characteristics of different asset classes that are based
on market factors and not a particular manager’s
ability to add value over the market. Given manager
capability is removed from all other asset class returns
(namely equity, property, fixed interest and cash) it is
not appropriate to use manager based hedge fund
benchmarks as proxies for the return of all hedge
funds. These benchmarks provide an indication of the
average manager skill available rather than passive
(market based) returns available from this form of
investing. However there is no data available to
forecast hedge fund returns given there is no passive
benchmark. Therefore, ASSIRT believes that there are
limitations to portfolio modelling of hedge funds, and
this form of analysis should be used only as a tool, not
a driver of the decision.
The question of allocating a portion of a client’s
portfolio to hedge funds therefore becomes one of a
market specialisation within the portfolio. Market
specialisation categories include active versus passive,
value versus growth, large cap versus small cap and
now market based versus skill based strategies. ASSIRT
would therefore argue that the choice of investing in
skill-based strategies (hedge funds) is part of the active
versus passive manager selection decision, rather than
part of the traditional asset allocation decision.
Two examples of allocating hedge funds within an
investor’s portfolio are illustrated below.
Consider the portfolios of two investors with differing
risk/return objectives that invest in traditional asset
classes. The first is a ‘defensive investor’ with 25%
invested in growth assets of equities and listed property
and 75% invested in fixed interest assets. The second is
a ‘growth investor’ with 25% invested in fixed interest
assets and 75% invested in growth assets. The 5-year
historical returns and risk generated by the portfolio of
each investor to May 2002 is set out in Table 5.2.
Table 5.2: Defensive and Growth Investors 5-year
Risk/Return to May 2002 from a portfolio of
investment in traditional asset classes
Long/Short Equity
Equity Market Neutral
S&P/ASX All Ords Accum Index
Dedicated Short Bias
MSCI World ex Aust Accum Index $A
20%0%
-3%
2%
7%
12%
17%
2% 4% 6% 8% 10% 12% 14% 16% 18%
Standard Deviation Annualised
5 Ye
ar R
etur
n to
Dec
200
1
Source: ASSIRT
Chart 5.1: Return/Risk of Equity Based
Strategies and equity markets
5 year Risk(Standard
5 year Returns Deviation)
Defensive Investor 7.61% 2.76%
Growth Investor 9.60% 7.12%

AIMA and ASSIRT Hedge Fund Booklet 23
Example 1: Fund of Hedge Funds
If each investor had allocated 10% their portfolio during
the 5-year period to a fund of hedge funds, the change
to the return and risk generated through the period
differs, depending on which asset classes the 10%
allocation was sourced from. A defensive investor
allocating 10% from equities or 10% from fixed interest
assets to a fund of hedge funds would have experienced
increased returns to the portfolio with a reduction in risk
for the allocation from equities (Chart 5.2 & Table 5.3).
In this case replacing equities had a greater impact in
risk reduction than improving the portfolio returns. This
is because the volatility in returns of the diversified fund
of hedge funds is lower than the volatility of equity
markets. In replacing fixed interest, the result would
have been a slightly increased risk but substantially
higher returns, due to the higher returns available
through the fund of hedge funds and by maintaining the
same exposure to equities within the portfolio.
Table 5.3: Return/Risk Outcomes of a Defensive
Investor’s portfolio
A growth investor allocating 10% from equities or fixed
interest assets to a fund of hedge funds would have
also experienced increased returns to the portfolio as
seen in Chart 5.3 & Table 5.4. Once again an allocation
from equities had a greater impact in risk reduction
than improving the portfolio returns. In replacing fixed
interest, the result would have resulted in a slightly
higher risk but substantially higher returns.
Table 5.4: Return/Risk outcome of a Growth
Investor’s Portfolio
Source: ASSIRT
Risk (Standard Deviation)
1.5%7.0%
7.5%
8.0%
8.5%
9.0%
9.5%
10.0%
2.0% 2.5% 3.0% 3.5%
5 Ye
ar R
etur
n to
May
02
Original Portfolio
Replace Fixed Income Replace Equity Replace All
Chart 5.2: Return/Risk outcome of 10% Allocation
to Hedge Funds for a Defensive Investor
Source: ASSIRT
Risk (Standard Deviation)
6.0%9.0%
9.5%
10.0%
10.5%
11.0%
11.5%
6.2% 6.4% 6.6% 6.8% 7.0% 7.2% 7.4%
5 Ye
ar R
etur
n to
May
02
Original Portfolio
Replace Fixed Income Replace Equity Replace All
Chart 5.3: Return/Risk outcome of 10% Allocation
to Fund of Hedge Funds for a Growth Investor
Defensive 5 year 5 year RiskInvestor Returns (Standard Deviation)
Traditional Asset Classes 7.61% 2.76%
Replace Equities 7.80% 2.05%
Replace Fixed Interest 8.10% 2.82%
Growth 5 year 5 year RiskInvestor Returns (Standard Deviation)
Traditional Asset Classes 9.60% 7.12%
Replace Equities 9.83% 6.22%
Replace Fixed Interest 10.06% 7.29%

24 AIMA and ASSIRT Hedge Fund Booklet
Example 2: Long/Short Global Equity Fund
If each investor had allocated 10% of their portfolio
during the 5-year period to a long/short global equity
fund, the change to the return and risk generated
through the period differs, depending on which asset
classes the 10% allocation was sourced from. A
defensive investor allocating a total of 10% equally
from Australian and international equities or 10% from
all asset classes to a hedge fund would have
experienced increased returns to the portfolio with a
reduction in risk for the equity allocation (Chart 5.4 &
Table 5.5). In this case replacing equities had a small
impact in risk reduction and a significant improvement
to the returns of the portfolio. In replacing all asset
classes, the result would have been slightly higher
returns than replacing equities but at a substantially
higher risk, therefore representing a less favourable
solution for an investor that wishes to maintain a
similar level of risk.
Table 5.5: Return/Risk outcome of a Defensive
Investor’s Portfolio
A growth investor allocating 10% from all asset classes
to a long/short global equity fund would have
experienced increased returns to the portfolio with a
reduction in risk (Chart 5.5 & Table 5.6). An allocation
from Australian and international equities had
significant impact in risk reduction, with a similar
improvement to portfolio returns as the allocation from
all asset classes over this long time period.
Table 5.6: Return/Risk outcome of a Growth
Investor’s Portfolio
It is important to note that each hedge fund and fund
of hedge funds will generate different returns and risk
over time depending on strategies and managers
utilised. Care should be taken in assessing the
appropriateness of particular hedge funds and funds of
hedge funds for particular client needs.
Source: ASSIRT
Risk (Standard Deviation)1.5%
9.0%
8.5%
8.0%
7.5%
7.0%
9.5%
10.0%
2.0% 2.5% 3.0% 3.5%
5 Ye
ar R
etur
n to
May
02
Original Portfolio
Replace Equity Replace All
Chart 5.4: Return/Risk outcome of 10% Allocation to
a Long/Short Equity Fund for a Defensive Investor
Growth 5 year 5 year RiskInvestor Returns (Standard Deviation)
Traditional Asset Classes 7.61% 2.76%
Replace Equities 9.21% 2.42%
Replace All Asset Classes 9.45% 2.84%
Source: ASSIRT
Risk (Standard Deviation)
6.0%9.0%
9.5%
10.0%
10.5%
11.0%
11.5%
6.2% 6.4% 6.6% 6.8% 7.0% 7.2% 7.4%
5 Ye
ar R
etur
n to
May
02
Original Portfolio
Replace Equity Replace All
Chart 5.5: Return/Risk outcome of 10% Allocation
to a Long/Short Equity Fund for a Growth Investor
Growth 5 year 5 year RiskInvestor Returns (Standard Deviation)
Traditional Asset Classes 9.60% 7.12%
Replace Equities 11.27% 6.19%
Replace All Asset Classes 11.28% 6.56%

AIMA and ASSIRT Hedge Fund Booklet 25
These examples suggest that most multi strategy fund
of hedge funds with low levels of volatility are better
suited to conservative investors rather than aggressive
investors in that they can improve the return potential
without significantly increasing risk when replacing
fixed interest assets in a defensive investor’s portfolio.
In using a single manager hedge fund, it is more
appropriate to allocate funds from the asset class that
exhibits similar risk/return characteristics to that fund.
In this example use of a long/short equity fund that has
a large market exposure (long bias) the allocation
should be sourced from the investor’s equity
component, not across all asset classes.
5.4 Factors to consider before investing
The decisions of whether to invest in hedge funds and
how much of the investor’s portfolio to allocate require
consideration of the following factors;
★ The investor’s investment objective, incorporating
their return objective and risk tolerance. This will
necessarily consider whether the investor’s aim is to
improve the return profile or reduce the risk profile
of their existing portfolio position. As demonstrated
above in general terms, where an investor aims to
substantially improve the return profile of their
portfolio, an allocation from fixed interest to a fund
of fund hedge fund may be appropriate. As an
improvement to the return expectation implies
taking on additional risk, the opposite case applies
for a reduction in the return expectation.
★ Which asset class to allocate funds from, for
investment in hedge funds will depend on
the return/risk objective of the hedge fund
being considered.
★ Whether the investor has the time and knowledge
to research individual hedge fund managers
offering single strategies to bring together their
own ‘fund of hedge funds’ hedge fund
★ The time frame to invest, considering any lock up
period the hedge fund manager may impose.
★ Fund of Hedge Funds offerings may be more suited
to conservative investors in improving the return
profile at a slightly lower risk.
★ An appropriate allocation to a single manager will
depend on whether the hedge fund has fixed
interest or equity like characteristics.
★ An investor’s income and taxation position should
be considered. Generally income distributions from
hedge funds will be treated as ordinary income with
very little or no capital gains or dividend
imputation. This is a result of frequent trading
employed by most hedge funds.
★ The need for professional guidance in manager/
fund selection and the appropriate allocation within
an investor’s portfolio.

26 AIMA and ASSIRT Hedge Fund Booklet
Alpha A numerical value indicating a
manager's risk-adjusted excess rate of
return relative to a benchmark.
Measures a manager's "value-added"
in selecting individual securities,
independent of the effect of overall
market movements.
Arbitrage To take advantage of disparate
pricing between two similar
instruments in the same or different
markets.
Benchmark A reference (security or index)
against which a comparison and
evaluation of performance of an
investment portfolio can be made.
Beta Measures the sensitivity of the
manager’s returns to the market
return. It is the extent to which the
manager’s returns have varied in line
with movements in benchmark
returns. A manager with a Beta
greater than 1.0 is more volatile than
the market, while a manager with
a Beta less than 1.0 is less volatile
than the market.
CTA Commodity Trading Advisor. CTA’s
generally trade commodity futures,
options and foreign exchange and
most are highly leveraged.
Correlation A measure of how variables tend to
move in relation to one another.
Variables that rise or fall in parallel
on average are positively correlated
and those that move in opposite
directions are negatively correlated.
Correlations range from –1 to +1.
6. Glossary
Credit Spread The spread between Treasury
securities and non-Treasury
securities that are identical in all
respects except for quality rating.
For example, the difference between
yields on Treasuries and those on
single A-rated industrial bonds.
Derivatives Financial instruments whose value is
derived from the value of an
underlying security, asset or variable.
Examples include options, warrants,
futures, forwards and swaps.
Diversification Minimising of non-systematic
portfolio risk by investing assets in
several securities and investment
categories with low correlation
between each other.
Duration The duration of a bond is a measure
of how interest rate changes affect a
bond’s price. It is also a measure of
how long, on present value money-
weighted basis, the holder of a bond
has to wait before receiving coupon
payments and final repayment.
FIF Foreign Investment Fund
Forward Agreement between two parties to
Contract buy or sell an underlying asset at a
specified future date for a specified
price. Not traded on an exchange,
but between specific parties.
Fund of funds An investment partnership that
invests in a series of other funds. A
portfolio will typically diversify
across a variety of investment
managers, investment strategies, and
subcategories.

AIMA and ASSIRT Hedge Fund Booklet 27
Futures Standardised, exchange traded
Contract contract for the future delivery or
receipt of a specified amount of an
asset at a specified price
Hedging Transactions entered into (usually
opposite transactions within the same
asset class or market) that protect
against adverse price movements and
limit the exposure to a specific risk.
High The assurance that a fund only takes
Watermark fees on profits once past losses are
recovered. If an investment is made
and subsequently falls in value, the
fund will only take incentive fees if
the investment grows above the
initial level of investment made.
Hurdle Rate The minimum investment return a
fund must exceed before a
performance allocation/incentive fee
can be taken.
Long Position Holding a positive amount of an asset.
Market Neutral Taking long and short positions
Strategy in related assets (such as spread
trades) in order to offset directional
market risk.
Multi Strategy Investment philosophy allocating
investment capital to a variety
of investment strategies, although
the fund is run by one
management company.
Pairs Trading Non-directional relative value
investment strategy that seeks to
identify two companies with similar
characteristics whose equity
securities are currently trading at a
price relationship that is out of their
historical trading range. Investment
strategy will entail buying the
undervalued security, while short-
selling the overvalued security.
Prime Broker The principal brokerage firm an
investment fund does business with.
Options A financial instrument that gives the
holder the right but not the
obligation to buy (call option) or sell
(put option) the underlying asset up
to (American option) or on
(European option) a defined
expiration date for a defined price.
OTC Over-the-counter trading. Trading of
products between two parties outside
of exchanges.
Risk Risk in a portfolio sense refers to the
variation or volatility of returns. It is
generally measured by the standard
deviation of the portfolio returns.
Sharpe Ratio Demonstrates the reward to risk
generated by an asset. It is the
difference between the return on the
portfolio and the risk free rate,
divided by the standard deviation of
the portfolio.
Short Position Holding a negative amount of an
asset, whereby assets are sold
without owning them.
Standard Standard deviation is a statistical
Deviation measure of the absolute variability of
returns. It is the most commonly
used measure of the volatility of
returns or investment risk.
Swap An agreement between two parties to
exchange cash flows over time
according to a predetermined formula.
Warrant An option in the form of a security.
Banks or companies issue warrants
and can either be traded on
exchanges or OTC.

28 AIMA and ASSIRT Hedge Fund Booklet
This page has been intentionally left blank.

ASSIRT Pty LtdABN 80 009 182 263Licensed Investment Adviser
Level 12400 George Street NSW 2000Telephone (02) 9947 1299Facsimile (02) 9947 1231
1