AIJOC REVIEW ARTICLE Imaging for Sensorineural Hearing Loss
12
Otorhinolaryngology Clinics: An International Journal, May-August 2010;2(2):113-124 113 Imaging for Sensorineural Hearing Loss Santosh Gupta Department of Radiology, PD Hinduja National Hospital and Medical Research Center, Mahim, Mumbai, Maharashtra, India Correspondence: Santosh Gupta, Department of Radiology, PD Hinduja National Hospital and Medical Research Center Veer Savarkar Marg, Mahim, Mumbai-400016, Maharashtra, India Abstract There are several causes of sensorineural hearing loss (SNHL), in some of which imaging plays an important role for diagnosis and further management. We present an elaborate imaging based pictorial depiction of the various findings in these cases mainly based on CT and MRI imaging. Keywords: Sensorineural hearing loss, imaging, CT, MRI. REVIEW ARTICLE AIJOC INTRODUCTION Diagnostic imaging plays an important role in the evaluation and management of hearing loss. High resolution computed tomography (CT) of the temporal bone and magnetic resonance imaging (MRI) are the imaging modalities of choice to evaluate the ear structures for causes of hearing loss and are now routinely being performed. Older imaging techniques of plain radiographs or X-ray tomograms are now obsolete. Also in general, to evaluate the bony structures, including the external auditory canal, middle ear space, mastoid, petrous apex, and bony labyrinth CT is a better modality, whereas for the membranous labyrinth and suspicion of retrocochlear pathology MRI should be the imaging modality of choice. 1 However, many a times both modalities are used together to compliment each other. MRI with its higher soft tissue resolution and tissue charac- terization capabilities would be more frequently used in cases of sensorineural hearing loss (SNHL), where the pathology is generally in the cochlea or retrocochlear region (in the eight nerve or brain). IMAGING TECHNIQUE It is vital to obtain a good quality high resolution CT and MRI, in patients with SNHL, with accurate technical paramaters. Most centers are now equipped with multislice/ spiral CT scanners, which is essential as reconstructions can be obtained in any plane with isotropic voxels in high end CT scanners without loss of resolution. MRI should be obtained on a high tesla strength magnet, 1T (tesla) or higher. The author’s experience in his institute, is on a 64 slice spiral CT and 1.5 T MRI machine, details of which have been elaborated below: HRCT HRCTs on a 64 slice volume scanner (LightSpeed VCT, GE, Milwaukee, USA) are obtained in a straight axial plane (kV: 140, mA: 350, matrix: 512 × 512, slice thickness: 0.625 mm/10.63, 0.531:1, scan field of view (FOV): 32 cm, display FOV: 9.6 cm). The original isometric volume data is used to obtain coronal reformatted images. The images are then reviewed with a high resolution bone algorithm, using a small FOV for separate right and left ear documentation. MRI MRI scans on 1.5 T MR machine (Excite Twin Speed, GE, Milwaukee, USA) are performed with an 8-channel head coil. A routine T2W axial sequence through the brain is obtained in all patients. For evaluating the seventh-eighth nerve complex thin 3 mm slices with 0 spacing are obtained through the posterior fossa in axial and coronal planes, both plain and following intravenous administration of gadolinium contrast. Diffusion weighted sequence is also obtained through the brain. In addition, especially for evaluation of nerves and in patients posted for cochlear implantation a 3D-FIESTA (fast imaging enabling steady-state acquisition) axial sequence (TR: 5.5, TE: 1.7/Fr, FOV: 16 × 16, slice thickness: 1.0/ – 0.5, matrix: 320 × 320, NEX: 6.0) is performed followed by coronal reformations along with 3D maximum intensity
Transcript of AIJOC REVIEW ARTICLE Imaging for Sensorineural Hearing Loss

Imaging for Sensorineural Hearing Loss
Otorhinolaryngology Clinics: An International Journal, May-August 2010;2(2):113-124 113
Imaging for Sensorineural Hearing LossSantosh Gupta
Department of Radiology, PD Hinduja National Hospital and Medical Research Center, Mahim, Mumbai, Maharashtra, India
Correspondence: Santosh Gupta, Department of Radiology, PD Hinduja National Hospital and Medical Research CenterVeer Savarkar Marg, Mahim, Mumbai-400016, Maharashtra, India
AbstractThere are several causes of sensorineural hearing loss (SNHL), in some of which imaging plays an important role for diagnosis andfurther management. We present an elaborate imaging based pictorial depiction of the various findings in these cases mainly basedon CT and MRI imaging.
Keywords: Sensorineural hearing loss, imaging, CT, MRI.
REVIEW ARTICLE
AIJOC
INTRODUCTION
Diagnostic imaging plays an important role in the evaluationand management of hearing loss. High resolution computedtomography (CT) of the temporal bone and magneticresonance imaging (MRI) are the imaging modalities ofchoice to evaluate the ear structures for causes of hearingloss and are now routinely being performed. Older imagingtechniques of plain radiographs or X-ray tomograms arenow obsolete. Also in general, to evaluate the bony structures,including the external auditory canal, middle ear space,mastoid, petrous apex, and bony labyrinth CT is a bettermodality, whereas for the membranous labyrinth andsuspicion of retrocochlear pathology MRI should be theimaging modality of choice.1 However, many a times bothmodalities are used together to compliment each other. MRIwith its higher soft tissue resolution and tissue charac-terization capabilities would be more frequently used in casesof sensorineural hearing loss (SNHL), where the pathologyis generally in the cochlea or retrocochlear region (in theeight nerve or brain).
IMAGING TECHNIQUE
It is vital to obtain a good quality high resolution CT andMRI, in patients with SNHL, with accurate technicalparamaters. Most centers are now equipped with multislice/spiral CT scanners, which is essential as reconstructionscan be obtained in any plane with isotropic voxels in highend CT scanners without loss of resolution. MRI should beobtained on a high tesla strength magnet, 1T (tesla) or higher.The author’s experience in his institute, is on a 64 slice
spiral CT and 1.5 T MRI machine, details of which havebeen elaborated below:
HRCT
HRCTs on a 64 slice volume scanner (LightSpeedVCT, GE, Milwaukee, USA) are obtained in a straight axialplane (kV: 140, mA: 350, matrix: 512 × 512, slice thickness:0.625 mm/10.63, 0.531:1, scan field of view (FOV):32 cm, display FOV: 9.6 cm). The original isometric volumedata is used to obtain coronal reformatted images. Theimages are then reviewed with a high resolution bonealgorithm, using a small FOV for separate right and left eardocumentation.
MRI
MRI scans on 1.5 T MR machine (Excite Twin Speed, GE,Milwaukee, USA) are performed with an 8-channel headcoil. A routine T2W axial sequence through the brain isobtained in all patients. For evaluating the seventh-eighthnerve complex thin 3 mm slices with 0 spacing are obtainedthrough the posterior fossa in axial and coronal planes, bothplain and following intravenous administration of gadoliniumcontrast. Diffusion weighted sequence is also obtainedthrough the brain.
In addition, especially for evaluation of nerves and inpatients posted for cochlear implantation a 3D-FIESTA (fastimaging enabling steady-state acquisition) axial sequence(TR: 5.5, TE: 1.7/Fr, FOV: 16 × 16, slice thickness: 1.0/– 0.5, matrix: 320 × 320, NEX: 6.0) is performed followedby coronal reformations along with 3D maximum intensity

Santosh Gupta
114JAYPEE
projection (MIP) reconstructions. A 3D-FIESTA sequenceis also acquired in a direct oblique sagittal plane (TR: 6.7,TE: 2.1/Fr, FOV: 12 × 12, slice thickness: 1.0/– 0.5, matrix:384 × 320, NEX: 6.0) perpendicular to the VII–VIII nervecomplexes. With this technique we are able to obtain betterresolution than with reformations from an axial sequence;which enables better delineation of the nerves.
IMAGING FINDINGS BASED ONETIOLOGIES OF SNHL
The etiologies of SNHL where imaging plays an importantrole can be broadly classified into congenital and acquired.Congential causes include various vestibulo-cochlearmalformations, congenital syndromes and intrauterineinfections. Acquired causes include inflammatory/infective,trauma, tumors, vascular ischemia, otodystrophies.2 Manyof the other causes of SNHL such as ototoxic drug-induced,noise-induced, autoimmune, idiopathic, etc are not likely toshow any significant findings on imaging and therefore inthese cases, imaging has a limited role to play, mainly toexclude other above imaging-discernible etiologies.
To discuss imaging of all the varied etiologies of SNHLis beyond the scope of this article. Therefore relevant cases,which are commonly encountered have been discussedbelow.
Congenital Malformations
Based on the site of abnormality, congenital inner earanomalies can be classified into:a. Cochlear malformationsb. Vestibular malformationsc. Malformations of the semicircular canalsd. Vestibular and cochlear aqueduct malformationse. Cochlear nerve deficiencyf. Isolated attenuated modiolus, andg. Isolated cochlea. A classification commonly used by
ENT surgeons is the one described by Sennaroglu andSaatci;3 we have used this system with some modifi-cations, since we encountered some additional anomalieson MRI (such as cochlear nerve deficiency).4 Congenitalmalformations of the inner ear are rare anomalies; theycan be identified on imaging with HRCT and/or MRI inabout 20% of patients with congenital sensorineuralhearing loss.5
With the resolution provided by the newer CT scan andMRI equipment it is now possible to see minute internal
structures of the cochlea such as the interscalar septum,6
which divides the major cochlear turns; this can be seen onboth HRCT and MRI 3D-FIESTA sequences (Fig. 1A).The osseous spiral lamina, a thin membrane within eachturn of the cochlea that separates the scala vestibuli fromthe scala tympani,6 can also be well seen on MRI as a thin,linear structure. The MRI 3D sequence data can be used toobtain a 3D MIP reconstruction (Fig. 1B), which gives agood outline of the inner ear structures, especially whencomplex anomalies need evaluation. The membranous
Fig. 1A: Axial 3D-FIESTA sequence, at the level of cochlea showsinterscalar septum (arrow) and osseous spiral lamina (block arrow)
Fig. 1B: 3D-MIP reconstruction of the data from 3D-FIESTAsequence shows the anatomy of the membranous labyrinth

Imaging for Sensorineural Hearing Loss
Otorhinolaryngology Clinics: An International Journal, May-August 2010;2(2):113-124 115
labyrinth contains endolymph and is surrounded by theperilymph which, in turn, separates it from the otic capsuleor bony labyrinth. The cochlea consists of two and onehalf turns, which extend into the vestibule. The threesemicircular canals arise from the vestibule in arches alongall three planes.
The vestibular aqueduct represents an osseous aperturein the bony labyrinth; it is about 5 mm in length and islocated along the medial aspect of the pyramid. Although,its lumen is lined by squamous and cuboidal epithelium, ithouses an extension of the membranous labyrinth—theendolymphatic duct. On axial CT scan, the vestibularaqueduct is seen as a small slit running medial and parallelto the plane of the posterior semicircular canal.
The seventh–eighth nerve complexes are well seen onMRI. On the 3D-FIESTA sequence it is possible to identifyfurther divisions of the eighth nerve (Fig. 2A). The cochlearnerve is well seen on axial 3D-FIESTA images (Fig. 2B),extending into the modiolus. The anatomy and delineationof the nerves is better appreciated in an oblique sagittal plane,perpendicular to the plane of the internal auditory canal.7
With this technique (Fig. 2C), the superior and inferiorvestibular nerves are seen in the posterior quadrants andthe cochlear nerve in the anteroinferior quadrant, while thefacial nerve is seen in the anterosuperior quadrant.
The important congenital anomalies that are encounteredwhen imaging patients prior to cochlear implant surgeries,are discussed in detail below.
Fig. 2A: Axial 3D-FIESTA sequence, at the level of vestibule andcochlea shows cochlear nerve (arrow) and vestibular nerve (blockarrow)
Fig. 2B: Axial 3D-FIESTA sequence, at the level of vestibule andcochlea, shows well-delineated and intact modiolus (arrow)
Fig. 2C: Oblique sagittal 3D-FIESTA sequence through the internalauditory canal shows facial nerve in the anterosuperior quadrant (blockwhite arrow), cochlear nerve in the anteroinferior quadrant (blockblack arrow) and the superior and inferior vestibular nerves, in theposterior quadrant (branching arrows)
Michel Deformity
In this deformity, there is absence of the entire cochlea andthe vestibular structures, i.e. complete labyrinthine aplasia.3
It may be bilateral or unilateral (Fig. 3). The internal auditorycanals (IACs) are small in size on both sides (Figs 3A and B).Cochlear nerve deficiency may be seen (Fig. 3C), on MR3D-FIESTA images.

Santosh Gupta
116JAYPEE
Fig. 3A: Axial 3D-FIESTA sequence shows absence of the entire vestibulo-cochlear structures, bilaterally (arrow), suggesting Micheldeformity. The internal auditory canals are small on both sides, with markedly thin eighth nerve (block arrow on left side)
Fig. 3B: HRCT shows small left internal auditory canal (black arrow) and absence of the entire vestibulo-cochlear structures(white arrow), consistent with Michel deformity
Fig. 3C: Oblique sagittal 3D-FIESTA sequence, through the small internal auditory canal shows thinned-out eighth nerve (block backarrow), with no divisions and normal facial nerve antero-superiorly (arrow)
Cochlear Aplasia
In this condition, the cochlea is completely absent3
(Fig. 4). The vestibule and semicircular canals may benormal, dilated (Figs 4A and B), or hypoplastic. Dense oticbone is present at the site of the cochlea (Fig. 4C).
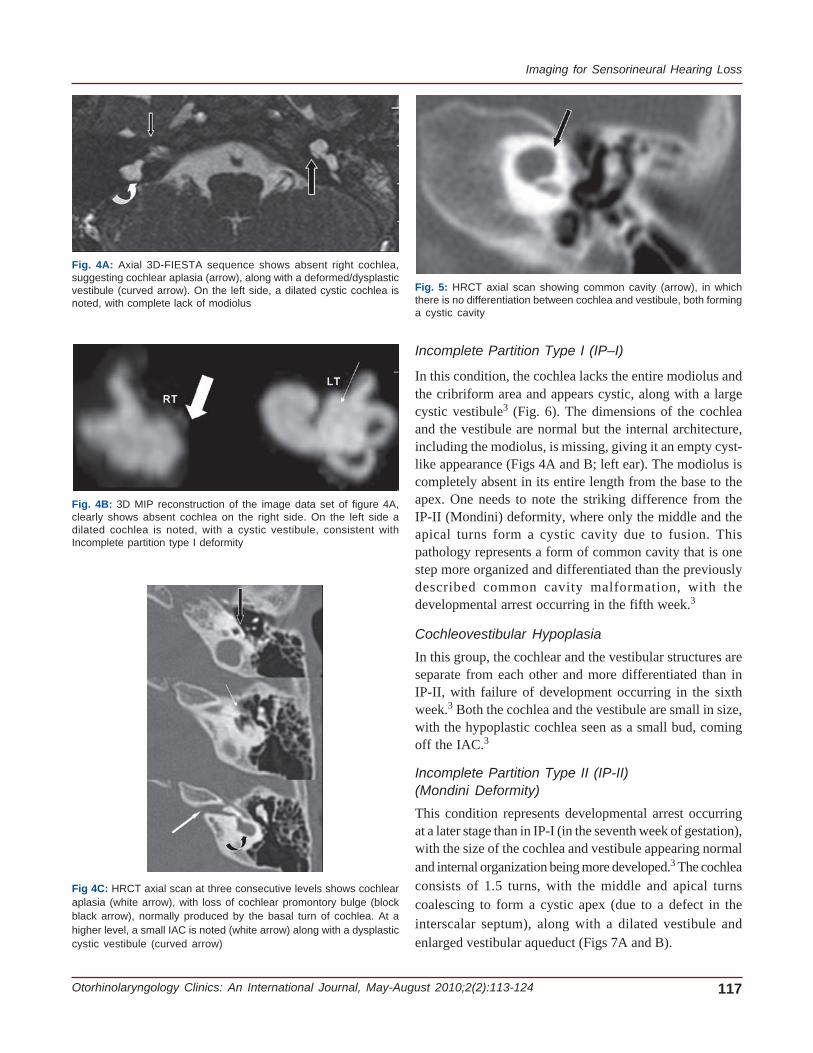
Common Cavity DeformityIn this condition there is no differentiation between thecochlea and the vestibule, both together forming a cysticcavity3 (Fig. 5). This occurs due to developmental arrest atthe fourth week of gestation, when the differentiation intocochlea and vestibule has not yet taken place.
Imaging for Sensorineural Hearing Loss
Otorhinolaryngology Clinics: An International Journal, May-August 2010;2(2):113-124 117
Fig. 4A: Axial 3D-FIESTA sequence shows absent right cochlea,suggesting cochlear aplasia (arrow), along with a deformed/dysplasticvestibule (curved arrow). On the left side, a dilated cystic cochlea isnoted, with complete lack of modiolus
Fig. 4B: 3D MIP reconstruction of the image data set of figure 4A,clearly shows absent cochlea on the right side. On the left side adilated cochlea is noted, with a cystic vestibule, consistent withIncomplete partition type I deformity
Fig 4C: HRCT axial scan at three consecutive levels shows cochlearaplasia (white arrow), with loss of cochlear promontory bulge (blockblack arrow), normally produced by the basal turn of cochlea. At ahigher level, a small IAC is noted (white arrow) along with a dysplasticcystic vestibule (curved arrow)
Fig. 5: HRCT axial scan showing common cavity (arrow), in whichthere is no differentiation between cochlea and vestibule, both forminga cystic cavity
Incomplete Partition Type I (IP–I)
In this condition, the cochlea lacks the entire modiolus andthe cribriform area and appears cystic, along with a largecystic vestibule3 (Fig. 6). The dimensions of the cochleaand the vestibule are normal but the internal architecture,including the modiolus, is missing, giving it an empty cyst-like appearance (Figs 4A and B; left ear). The modiolus iscompletely absent in its entire length from the base to theapex. One needs to note the striking difference from theIP-II (Mondini) deformity, where only the middle and theapical turns form a cystic cavity due to fusion. Thispathology represents a form of common cavity that is onestep more organized and differentiated than the previouslydescribed common cavity malformation, with thedevelopmental arrest occurring in the fifth week.3
Cochleovestibular Hypoplasia
In this group, the cochlear and the vestibular structures areseparate from each other and more differentiated than inIP-II, with failure of development occurring in the sixthweek.3 Both the cochlea and the vestibule are small in size,with the hypoplastic cochlea seen as a small bud, comingoff the IAC.3
Incomplete Partition Type II (IP-II)(Mondini Deformity)
This condition represents developmental arrest occurringat a later stage than in IP-I (in the seventh week of gestation),with the size of the cochlea and vestibule appearing normaland internal organization being more developed.3 The cochleaconsists of 1.5 turns, with the middle and apical turnscoalescing to form a cystic apex (due to a defect in theinterscalar septum), along with a dilated vestibule andenlarged vestibular aqueduct (Figs 7A and B).

Santosh Gupta
118JAYPEE
Fig. 6: HRCT axial scan shows findings of Incomplete partition type I deformity, with cystic appearance of cochlea, lacking the entiremodiolus (block black arrow) and a cystic vestibule (white arrow)
Fig. 7A: HRCT axial images show fusion of middle and apical turns of the cochlea (black arrow), prominent vestibule and dilated vestibularaqueduct (arrow), suggesting incomplete partition type II (Mondini) deformity
Fig. 7B: Axial 3D-FIESTA sequence shows dilated vestibular sac (block arrow) and markedly attenuated modiolus (arrow)

Imaging for Sensorineural Hearing Loss
Otorhinolaryngology Clinics: An International Journal, May-August 2010;2(2):113-124 119
Dilated Vestibular Aqueduct (Fig. 8)
This used to be thought as a finding which may occur inisolation. However, Lemmerling et al,12 in their series foundthat all ears with large vestibular aqueducts have an associatedmodiolar deficiency. Hence the term, isolated dilatedvestibular aqueduct seems obsolete. IP-II (classic Mondini)is always associated with a dilated vestibular aqueduct.Isolated dilated vestibular aqueduct has also been observedand reported by other authors.9 Large vestibular aqueduct,bilaterally may be a part of a syndrome, such as Pendredsyndrome and distal renal tubular acidosis,13 one needs tolook for this possibility in the appropriate setting. Bamiouet al, in their series of patients with sensorineural hearingloss evaluated with HRCT, found that 60% of their patientshad isolated dilated vestibular aqueduct.14 The criterion that
Fig. 8: 3D-MIP reconstruction of the images of another patient withIP II, well-demonstrates, a large vestibular sac (arrow)
Fig. 9A: Axial 3D-FIESTA sequence shows markedly thinned-out eighth nerve in the CP angel cistern (black arrow), which is barely seenin the distal portion of the canal and the left cochlear nerve is not visualized in its normal location (arrow)
they used for a dilated vestibular aqueduct was a middlethird diameter of the duct of more than 1.5 mm.14
Cochlear Nerve Deficiency
We have used the term cochlear nerve deficiency toencompass both absent (Figs 3 and 9A and B) as wellhypoplastic cochlear nerves, based on the study byGlastonbury et al.8 This study and another by Kim et al.7
showed that the cochlear nerve is larger than either thesuperior or inferior vestibular nerves in 90% of normal casesand it is of almost the same size (Fig. 2C) or larger than thefacial nerve in 64% of cases.
In almost all patients with congenital cochlear nervedeficiency the IACs are small in size. As per the criteriadescribed in literature, an abnormal IAC is diagnosed if it is< 4 mm in either the vertical or transverse diameter, isirregularly shaped, or is appreciably smaller than the IAC ofthe contralateral side.8 In the study by Valvassori et al, theIAC was found to be virtually symmetric in healthyindividuals, with a difference of <1 mm in 99% of patientsand 1 to 2 mm in 1% of patients.9
Isolated Cochlea
The term isolated cochlea (Fig. 10A) is used when thecochlear aperture (which is a small canal at the fundus ofthe IAC (Fig. 10B), through which the cochlear nerve passesto enter the cochlea, is absent and filled with bone.8 Thishas also been described as hypoplasia of the bony canal forthe cochlear nerve (Fig. 10C).10
Attenuated Modiolus
This may be an isolated finding or may be seen in associationwith other malformations. Modiolus (taken from the latinword ‘hub of a wheel’) is an irregular conical (ortrapezoidal)–shaped porous bone within the cochlea fromwhich the osseous spiral lamina of the cochlea projectsout, which supports the organ of Corti (Fig. 2B).

Santosh Gupta
120JAYPEE
Fig. 9B: Oblique sagittal 3D-FIETSA sequence shows the facial andvestibular nerves in their normal location, with the cochlear nervebarely or almost not seen in the anteroinferior quadrant (arrow)
We label a modiolus as attenuated on the basis of subjec-tive criteria (Fig. 11), although the more accurate methodis the measurement of its area at the point of its maximumsize. According to Naganawa et al, the size of the modioluson MRI in normal volunteers is about 4.0 mm2.11
In all patients, who are being evaluated for congenitalsensorineural hearing loss, it is important to study brainMRI, as sometimes there may be findings of congenitalTORCH infection on T2–wieghted MRI of brain showingmultiple ill-defined hyperintense lesions predominantly inthe cerebral subcortical white matter (Fig. 12).
OTOSPONGIOSIS (OTOSCLEROSIS)This is an otodystrophy of the bony labyrinth and stapes,where the normal endochondral bone of the otic capsuleis replaced by disorganized foci of Haversian bone.15 2types have been described : Fenestral and Cochlear (rare,and associated with fenestral), the latter causingsensorineural hearing loss. The early stage is seen as a
Fig. 10A: Axial HRCT shows a thick bony bar at the cochlear aperture (arrow), suggesting an isolated cochlea
Fig. 10B: Axial HRCT shows normal appearance of the cochlearaperture at the site of the entry of the cochlear nerve, near the modiolus
Fig. 10C: 3D-FIESTA axial sequence shows a bonybar (arrow) at the cochlear aperture (isolated cochlea).Also note left cochlear nerve deficiency

Imaging for Sensorineural Hearing Loss
Otorhinolaryngology Clinics: An International Journal, May-August 2010;2(2):113-124 121
Fig. 11: Axial 3D-FIESTA sequence shows attenuated modiolus onthe right side (arrow). Compare with normal modiolus in figure 2B
Fig. 12: MRI T2-weighted axial image shows multifocal ill-definedsubcortical lesions in both cerebral white matter, most likely sequelaeof TORCH infection
Fig. 13: Axial HRCT shows extensive lucency around all the visualizedcochlear turns, consistent with both fenestral and cochlearotospongiosis also called otospongiosis
lucency (otospongiosis stage) around the cochlea onHRCT (Fig. 13). In later stage there is recalcification intodense ossific plaque (otosclerosis stage). MRI may showenhancement on T1, in the otic capsule in the early stageand also pericochlear T2 hyperintense signal.15
INFLAMMATORY-INFECTIVE
With the advent of higher resolution and better imagingtechniques on MRI, subtle abnormalities of inner ear oreighth cranial nerve are more easier to identify, such as inacute labyrinthitis, where enhancement of the membranouslabyrinth can be seen on postgadolinium T1-weightedimages. In infectious or autoimmune labyrinthitis, there is abreak in the blood-labyrinthine-barrier, secondary toinflammation, resulting in enhancement of the cochlea and/or vestibule on MRI.2 In later stages disease may progressto ossification or labyrinthitis ossificans, where diffuse T2hypointense signal is seen on T2, better appreciated on T2gradient sequence such as FIESTA . This stage of ossicansis well seen on HRCT of temporal bones (Fig. 14), howeverthe fibrotic phase will not be readily appreciated on HRCT,which is seen well on 3D gradient MRI sequence (Fig. 15).
Hemorrhagic labyrinthitis is also well seen as hyper-intense signal in the membranous labyrinth on precontrastT1 weighted sequence on MRI (Fig. 16). Vestibular neuritismay be seen on MRI as enhancement of the eighth nerve,and should not be mistaken for a small vestibularSchwannoma, where enhancement is focal and nodular.
Other conditions that may cause SNHR due to infectionor inflammation are leptomeningitis (tuberculous, bacterialor fungal), and neurosarcoidosis, which may show linearor nodular enhancement along the eighth nerve.
Fig. 14: Axial HRCT shows ossificans along the margin of the basalturn of cochlea consistent with labyrinthitis ossificans

Santosh Gupta
122JAYPEE
Fig. 15: 3D-FIESTA axial MRI in early fibrotic phase of labyrinthis ossificans shows T2 hypointense signal along theposterior margin of the basal turns of both cochlea
Fig. 16: Precontrast T1-weighted axial MRI shows hyperintensity in the left cochlea due to hemorrhagic labyrinthitis
POSTERIOR FOSSA TUMORS
Acoustic Neuroma
Most common mass encountered in the IAC (internalauditory canal) and CPA (cerebello-pontine angle) cisternis acoustic neuroma which is a benign slow growing tumorarising from Schwann cells along the VIII cranial nerve,comprising approximately 85% of CPA masses.2 These mostcommonly arise from vestibular nerve at the area of theScarpa ganglion in the IAC. These are best visualized onMRI, where an ovoid shape mass is seen contained withinthe IAC (which may be enlarged) into the CPA cistern. Attimes one may see bilateral acoustic Schwannomas whichconfirms the diagnosis of neurofibromatosis type II (Fig.17). At times these may be isolated to IAC, without extensioninto the CPA cistern (Fig. 18). These are usually isointenseon T1-weighted sequence and hyperintense on T2, with
diffuse enhancement on postcontrast scans. Tumors whichare larger in size may show heterogeneous signal on T2 andheterogenous enhancement with cyst like areas. Hemorrhagemay also be seen but is rare, and is visible as hyperintensesignal on precontrast T1-weighted sequence. Calcificationmay also occur rarely. CT will show enlarged IAC in caseof large tumors. CT is useful to see calicification if any.However, small lesions at times can be missed even oncontrast-enhanced CT and MRI is the preferred modalityof choice to evaluate posterior fossa tumors in general.
Mengiomas
Approximately 3 to 8% of CPA masses and may look similarto acoustic neuromas.2 However, these generally have abroad-based dural attachment in the posterior fossa, withdural tail-like enhancement (Fig. 19) on the postgadoliniumscan, which distinguishes them from acoustic neuromas.

Imaging for Sensorineural Hearing Loss
Otorhinolaryngology Clinics: An International Journal, May-August 2010;2(2):113-124 123
Fig. 17: MRI axial contrast enhanced T1-weighted image showsbilateral large enhancing CP angle masses extending into both theIAC, consistent with acoustic Schwannomas, in a case ofneurofibromatosis type II
Fig. 18: Thin T2-weighted axial sequence shows a smallhypointense nodule/Schwannoma, in the left IAC
Fig. 19: Postcontrast T1-weighted axial MRI shows a diffuselyenhancing left CP angle mass lesion with a broad base and adjacentlinear dural enhancement typically seen in a meningioma
Meningiomas tend to be hypointense on T2 due to increasedcelluarity and diffuse calcification, the latter betterappreciated on CT scan. On CT they may show diffusemild hyperdensity or frank calcification on the plain scan.Sometimes meningiomas extend into the IAC, although theyare usually located eccentrically to the porus.
Other tumors: Other rare tumors in the posterior fossa,in the region of IAC or CPA cistern attributable to sensori-neural hearing loss are metastasis (especially from breastor lung), lymphoma, melanoma, endolymphatic sac tumors.
OTHERS
Vestibular neuritis may be seen as diffuse enhancement ofthe eighth nerve on postcontrast MRI, which will be smoothand diffuse and should not be mistaken for small vestibularSchwannoma, where the enhancement is focal and nodular.
Superficial siderosis due to repeated subarachnoidhemorrhage may cause hemosiderin deposition on thesurface of cerebellum, brainstem and the eighth nerveproducing typical marked T2 hypointense signal on MRI,also well seen with blooming on gradient sequence.
Vascular causes of sensorineural hearing loss includeanterior inferior cerebellar artery infarct, small arterio-venousmalformation, rarely a vascular loop significantlycompressing the eighth nerve.
Temporal bone trauma causing SNHL with fracturesacross the inner ear structures can also be seen well onHRCT (Fig. 20).
Fig. 20: Axial HRCT shows a transverse fracture across the leftcochlea, in a patient with post-traumatic profound sensorineural hearingloss

Santosh Gupta
124JAYPEE
CONCLUSION
Imaging plays an important role in diagnosis and work-upof patients with SNHR. There are a whole lot of etiologiesfor SNHR, many of which have typical findings on HRCTand MRI, which help in differentiation of these causes andtherefore guides the treating surgeon in further management.Both CT and MRI are complimentary to each other andshould be judiciously used by the radiologist in diagnosingthe various conditions, discussed above.
ACKNOWLEDGMENTS
I would like to acknowledge all my colleagues, especiallyDr Shailendra Maheshwari and also ENT department ofour institute without whom writing this article would nothave been possible.
REFERENCES
1. Parry DA, Booth T, Roland PS. Advantages of magneticresonance imaging over computed tomography in preoperativeevaluation of pediatric cochlear implant candidates. Otol Neurotol2005;26(5):976-82.
2. Michele BSM, Barry EH. Imaging of Hearing Loss:Otolaryngologic clinics of North America 2008(41);157-78.
3. Sennaroglu L, Saatci I. A new classification for cochleovestibularmalformations. The Laryngoscope Lippincott Williams andWikins, Inc., Philadelphia ©, Luxford 2002. The AmericanLaryngological, Rhinological and Otological Society, Inc.Laryngoscope 2002;112:2230-41.
4. Gupta SS, Maheshwari SM, Kirtane MV, Shrivastav N. Pictorialreview of MRI/CT Scan in congenital temporal bone anomalies,in patients for cochlear implant: Indian Journal of Radiology andImaging 2009;19(2):99-106.
5. Jackler RK, Luxford WM, House WF. Congenital malformationsof the inner ear: A classification based on embryogenesis.Laryngoscope 1987;97:2-14.
6. Curtin HD, Sanelli PC, Som PM. Temporal bone: Embryologyand Anatomy Chapter (19) In: Som PM, Curtin HD. Head andNeck Imaging (4th ed). Mosby; 2003;2:1057-75.
7. Kim HS, Kim DI, Chung IH, Lee WS, Kim KY. Topographicalrelationship of the facial and vestibulocochlear nerves in thesubarachnoid space and internal auditory canal. AJNR AmJ Neuroradiol 1998;19:1155-61.
8. Glastonbury CM, Davidson HC, Harnsberger HR, Butler J,Kertesz TR, Shelton C. Head and Neck. Imaging Findings ofCochlear Nerve Deficiency. American Journal of Neuroradiology2002 April;23:635-43.
9. Valvassori GE, Pierce RH. The normal internal auditory canal.AJR Am J Roentgenol 1964;92:773-81.
10. Fatterpekar GM, Mukherji SK, Alley J, Lin Y, Castillo M.Hypoplasia of the bony canal for the cochlear nerve in patientswith congenital sensorineural hearing loss: Initial observations.Radiology 2000;215:243-46.
11. Naganawa S, Ito T, Iwayama E, Fukatsu H, Ishigaki T,Nakashima T, and Ichinose N. Head and Neck Imaging. MRImaging of the Cochlear Modiolus: Area Measurement in HealthySubjects and in Patients with a Large Endolymphatic Duct andSac. Radiology 1999;213:819-23.
12. Lemmerling MM, Mancuso AA, Antonelli PJ, Kubilis PS.Normal modiolus: CT appearance in patients with a largevestibular aqueduct. Radiology 1997;204:213-19.
13. Berrittini S, Forli F, Bogazzi F, et al. Large vestibular aqueductsyndrome : Audiological, radiological, clinical and genetic featuresAmerican Journal of otolaryngology Head and neck Medicineand Surgery 2005:26 363-71.
14. Bamiou DE, Phleps P, Sirimanna T. Temporal bone computedtomography findings in bilateral sensorineural hearing loss. ArchDis Child 2000;82:257-60.
15. Goh JPN, Chan LL, Tan TY. MRI of cochlear otosclerosisBritish Journal of Radiology 2002(75);502-05.