AIDJEX BULLETIN No. 23 - Polar Science...
164
-
Upload
truongxuyen -
Category
Documents
-
view
214 -
download
0
Transcript of AIDJEX BULLETIN No. 23 - Polar Science...


AIDJEX BULLETIN No. 2 3
January 1974
TABLE OF CONTENTS
THE A IDJEX LEAD EXPERIMENT --C. A. P a u l s o n and J. Dungan S m i t h . . . . . . . . . . . . . . . 1
SUBSURFACE EDDIES I N THE ARCTIC OCEAN - - K e n n e t h L. H u n k i n s . . . . . . . . . . . . . . . . . . . . . . 9
THREE NOTES ON THE THEORY OF SEA-ICE MOVEMENT --J. F. N y e . . . . . . . . . . . . . . . . . . . . . . . . . . . 3 7
A RELATION BETWEEN THE POTENTIAL ENERGY PRODUCED BY RIDGING AND THE MECHANICAL WORK REQUIRED TO DEFORM PACK I C E
--D. A. R o t h r o c k . . . . . . . . . . . . . . . . . . . . . . . . 45
REDISTRIBUTION FUNCTIONS AND THEIR Y I E L D SURFACES I N A I N A PLASTIC THEORY OF PACK I C E DEFORMATION
--D. A. R o t h r o c k . . . . . . . . . . . . . . . . . . . . . . . . 53
DIMENSIONLESS STRENGTH PARAMETERS FOR FLOATING I C E SHEETS --R. R e i d P a r m e r t e r . . . . . . . . . . . . . . . . . . . . . . . 83
A MECHANICAL MODEL OF RAFTING --R. R e i d P a r m e r t e r . . . . . . . . . . . . . . . . . . . . . . . 9 7
ON THE CALCULATION OF THE ROUGHNESS PARAMETER OF SEA I C E - - C h i - H a i L ing and N o r b e r t U n t e r s t e i n e r . . . . . . . . . . . . 1 1 7
CLASSIF ICATION AND VARIATION OF SEA I C E RIDGING I N THE ARCTIC B A S I N
- - W . D. H i b l e r 111, S. J . Mock, and W. B. T u c k e r I11 . . . . . 1 2 7
S I M I L A R I T Y CONSTANTS I N THE STRATIF IED PLANETARY BOUNDARY LAYER --R. A. B r o w n . . . . . . . . . . . . . . . . . . . . . . . . . 1 4 7
ABSTRACTS OF INTEREST . . . . . . . . . . . . . . . . . . . . . . 157
Front cover: NASA CV-9.90 remote sensing f l i g h t over AIDJEX main camp during 1.972 p i l o t study.
Back cover: Evergreen he Zicopter removing the rotating dome which housed the CRREL laser.

AIDJEX BULLETIN No. 23
January 1974
* * * * *
Financial support for AIDJEX i s provided by the National Science Foundation,
the Office of Naval Research, and other U.S. and Canadian agencies.
* * * * *
Arctic Ice Dynamics Joint Experiment D i v i si on o f Marine Resources
University o f Washington Seat t le , Washington 98105

Division of Marine Resources
UNIVERSITY OF WASHINGTON
The AIDJEX Bul le t in aims t o provide both a forum for discussing AIDJEX problems and a source of information pertinent t o a l l AIDJEX participants. Issues--numbered, dated, and sometimes subtit Zed--contain technical materia2 cZoseZy re Zated t o AIDJEX, informal reports on theoreticaZ and f i e l d work, translations of reZevant s c i e n t i f i c reports, and discussions of interim AIDJEX resu Z t s .
Bul le t in No. 23 contains reports on the continuing work of the numerical modezing group, as we21 as an analysis, by Hunkins, of oceanographic data from the 1972 piZot s tudy and a scheme, reported by HibZer, Mock, and Tucker, f o r classifying the regionaZ and seasonal variations of ridges. O f immediate in t e res t i s the artieZe on the lead experiment, which w i l Z commence i n la te February, the f i r s t AIDJEX f i e l d study i n some time.
We want t o thank the many persons and agencies that returned the blue mailing l i s t card sent t o them i n mid-November.
Any correspondence concerning the AIDJEX Bulletin shouZd be addressed t o
Alma Johnson, Editor AIDJEX BuZ Zetin 4059 RooseveZt Way N.E. Seat t le , Washington 98205

THE A IDJEX LEAD EXPERIMENT
C. A. Paulson Department of Oceanography
Oregon State University, CorvalZis, Oregon
and
J. Dungan Smith Department of 0ceanograph:g
University of Washington, Seat t le , Washington
ABSTRACT
An open-lead experiment is planned wherein atmospheric and oceanic observa t ions w i l l b e made a t a newly c rea t ed lead o f f shore from Barrow, Alaska. The atmospheric observa t ions w i l l a t tempt t o measure t h e v e r t i c a l f l u x of hea t and determine i ts r e l a t i o n t o air-sea temperature d i f f e r e n c e , f e t c h , he igh t , and wind speed. The oceanic observa t ions seek t o determine t h e c h a r a c t e r i s t i c s of t h e densi ty-dr iven convection i n t h e v i c i n i t y of a lead by measuring t h e oceanic v e l o c i t y and dens i ty f i e l d s .
INTRODUCTION
Leads, def ined as areas of open water o r t h i n ice , cover only a s m a l l
f r a c t i o n oE t h e Arctic Basin. However, t h e phys ica l processes t h a t occur
i n and ad jacen t t o l eads are very i n t e n s e , p a r t i c u l a r l y i n win te r , and have
a s u b s t a n t i a l i n f luence on t h e genera l d i s t r i b u t i o n s of h e a t , momentum, and
m a s s i n t h e atmosphere, t h e ice , and t h e ocean. Badgley [1966] has esti-
mated t h a t t h e h e a t t r a n s f e r r e d t o t h e atmosphere i n win te r is about two
o rde r s of magnitude g r e a t e r from open l eads than from t h e pack ice.
r ap id h e a t t r a n s f e r causes new ice t o form i n t h e lead much f a s t e r than i t
does under t h e pack ice, t h e rate of product ion being approximately inve r se ly
p ropor t iona l t o t h e i c e thickness .
This
The s t r u c t u r a l weakness of t h e newly formed lead ice al lows f l o e s t o
move re la t ive t o one another . Depending on i t s d i r e c t i o n , t h i s re la t ive
1

motion creates e i t h e r a new l ead ( thus beginning another cyc le of r ap id h e a t
l o s s and ice product ion) o r a p res su re r i d g e composed p r imar i ly of new ice.
These r idges , which may extend several meters above and below t h e surrounding
pack ice, c o n t r i b u t e s i g n i f i c a n t l y t o t h e t r a n s f e r of momentum from t h e
atmosphere t o t h e i c e and from t h e ice t o t h e ocean.
The formation of i ce i n a l ead is accompanied by t h e product ion of a
dense b r i n e t h a t , i t is pos tu l a t ed , s i n k s as plumes t o t h e pycnocline forming
t h e base of a weakly s t r a t i f i e d oceanic mixed l a y e r [Smith, 19731. The
dynamics a s soc ia t ed wi th t h i s convect ion appears t o p lay an important r o l e
i n determining t h e genera l dens i ty and momentum s t r u c t u r e i n t h e oceanic
mixed l a y e r .
To e l u c i d a t e t h e phys ica l processes a s soc ia t ed wi th l eads , A I D J E X has
planned a program of atmospheric and oceanic observa t ions on t h e pack ice
near P t . Barrow, Alaska, i n e a r l y sp r ing 1974. This program, a j o i n t e f f o r t
by t h e Univers i ty of Washington, Oregon S t a t e Univers i ty , and t h e Univers i ty
of Alaska, is descr ibed i n t h e p re sen t paper.
ATMOSPHERIC OBSERVATIONS
H e a t is t r a n s f e r r e d from t h e s u r f a c e of a lead t o t h e atmosphere as
s e n s i b l e h e a t , t h e l a t e n t hea t of evaporated w a t e r , and long- and shortwave
r a d i a t i o n .
where a t y p i c a l temperature d i f f e r e n c e of 20"-30°C between t h e l ead s u r f a c e
and t h e ambient atmosphere causes a l a r g e s e n s i b l e hea t t r a s n f e r . S ince i n
t h a t circumstance latent heat: t r a n s f e r and back r a d i a t i o n are about an o rde r
of magnitude less than s e n s i b l e h e a t transfer--and shortwave r a d i a t i o n is
absent altogether--we s h a l l focus on t h e t r a n s f e r of s e n s i b l e h e a t from
open l e a d s t o t h e atmosphere.
The t o t a l t r a n s f e r is g r e a t e s t over an open l ead i n win te r ,
A s a n i d e a l i z a t i o n , t h e problem is one of determining t h e h e a t t r ans -
f e r and flow f i e l d over a uniformly rough su r face wi th an abrupt i n c r e a s e
i n temperature a long a l i n e perpendicular t o the mean flow. N o change i n
s u r f a c e roughness is assumed, s i n c e t h e pack ice and l ead ice have approxi-
mately equal roughness. Downwind from t h e temperature inc rease , a very
uns tab ly s t r a t i f i e d , thermally modified l a y e r develops which is c a l l e d a n
2

internal boundary layer. conduction in a very thin layer (1 mm thickness) adjacent to the boundary and by shear- and buoyancy-generated turbulence above that. This problem
has been investigated theoretically by Elliott [1958], Taylor [1970], and
others who modeled the turbulent heat and momentum exchanges by introducing
eddy viscosity approximations valid for flow over homogeneous surfaces.
These theories have often been directed toward determining the height of the
internal boundary layer rather than the heat flux at the surface. have not been adequately verified by observations.
Heat is transferred upward through this layer by
They
Despite its importance, the heat transfer from leads to the atmosphere
has been investigated experimentally only by Miyake [1965] and Badgley [19661,
who observed mean wind and temperature profiles over an artificial lead
20 m wide. No direct measurements have been reported of the turbulent flux
of sensible heat over a lead.
The atmospheric observations designed for the lead experiment are
aimed primarily at measuring the vertical flux of heat and its relation to
air-sea temperature difference, fetch, height, and wind speed. Two methods
of flux estimation will be used: an integral estimate, made by computing
the difference between the heat advected at the upwind edge and at the down- wind edge of the lead; and a direct or eddy-correlation estimate, made by computing the average product of simultaneous fluctuations of vertical
velocity and temperature.
Other parameters characterizing the internal boundary layer will be
determined: (1) the height of the internal boundary layer; (2) the momen-
tum flux as a function of height and fetch; (3) the distribution of mean wind
speed, temperature, and humidity; ( 4 ) the variance of temperature and
velocity fluctuations; and (5) spectra and co-spectra of turbulent fluctua- tions of temperature and velocity.
made by a group from the University of Alaska.
Radiation and C02 measurements will be
Most of the instrumentation required for the measurements will be divided between two similarly instrumented sites, one on each side of the
lead. on only one side of the lead.)
(An exception is the radiation and CO, instrumentation, which will be One site will measure the characteristics of
3

t h e undis turbed flow and t h e o the r t h e c h a r a c t e r i s t i c s of t h e i n t e r n a l boundary
l a y e r caused by t h e l ead , w i t h t h e wind d i r e c t i o n governing the r e s p e c t i v e
func t ions .
lent f l u c t u a t i o n s of wind v e l o c i t y and temperature and the o t h e r f o r tak ing
mean p r o f i l e s of wind speed and temperature.
Two masts w i l l be e rec ted a t each s i te , one f o r measuring turbu-
The turbulence m a s t (shown schematical ly i n Figure 1 ) suppor ts two
hot-wire anemometers and one thermocouple a t each of two he igh t s above t h e
lead. The proposed X conf igura t ion of t h e hot-wire anemometers a l lows one
t o ob ta in t h e ins tan taneous v e r t i c a l and downstream components of the wind
v e l o c i t y , so t h a t t h e hea t f l u x and momentum f l u x , as w e l l as o the r quant i -
t ies, can be computed a t t h e two he ights . The m a s t , which is d r iven v e r t i -
c a l l y by a remote-controlled motor, has a swivel a t i t s base f o r o r i e n t i n g
i t i n t h e d i r e c t i o n of t h e mean wind.
The m a s t used f o r making measurements of mean wind speed and tempera-
t u r e a t each s i t e i s s i m i l a r t o t h e turbulence mast. Its ins t rumenta t ion
inc ludes a s i n g l e hot-wire anemometer or ien ted v e r t i c a l l y and two thermo-
couples, one loca ted near t he hot-wire anemometer and the o the r 50 cm above.
t h e hot-wire anemometer y i e l d s t h e ho r i zon ta l wind speed from which means
and o the r s t a ' t i s t i c s can be ca l cu la t ed .
by a motor con t ro l l ed t o s t o p a t predetermined he igh t s f o r s p e c i f i e d l eng ths
of t i m e . A probe cyc l ing through these loca t ions ob ta ins t h e mean va lues
as a func t ion of he ight .
f o r t h e hot-wire anemometer. Wind speed w i l l a l s o be measured.
The sensors are dr iven v e r t i c a l l y
A cup anemometer w i l l provide i n s i t u c a l i b r a t i o n
Radia t ive f luxes w i l l be monitored by two sets of four Eppley pyranom-
eters (two shortwave and two longwave).
boom over t h e l ead , and t h e o the r set w i l l be i n s t a l l e d over t he i c e .
One set w i l l depend from a long
An o p t i c a l rangefinder w i l l measure t h e lead width, which, toge ther
Af te r ice forms, wi th wind d i r e c t i o n , w i l l g ive t h e f e t c h over t h e lead .
i ts th ickness w i l l be sampled p e r i o d i c a l l y t o g ive t h e rate of b r i n e produc-
t i o n , a measurement necessary f o r t he oceanic research .
Heated hu t s on each s i d e of t h e l ead w i l l house personnel , sensor
e l e c t r o n i c s , and recording instrumentat ion. Diesel genera tors w i l l provide
power.
4

Cup anemometer 3
rb 3 Drive motor, remotely controlled
x-wire thermocouple ~ a s e
Fig. 1. Schematic drawing of the turbulence mast on the downwind side of the lead. measures the mean profiles.
A similar mast carrying a hot-wire anemometer and thermocouples

Before the experiment is deployed on the ice, observations will be conducted near Barrow over an artificial lead created by pumping water from
a hole in the ice into a bounded lagoon 20 m across. The measurements made
there to test instrumentation and techniques will be similar to those planned
for the actual experiment, but will provide an opportunity to obtain data under more controlled conditions than would be possible over a natural lead.
OCEANIC OBSERVATIONS
Evaporation and the production of ice at the surface of a lead are
accompanied by the formation of a dense brine that sinks in plumes'and
mixes with the surrounding seawater. The depth to which the plumes sink
i s not known, but it is most likely the base of the oceanic mixed layer.
This possibility is suggested by observations, made during the 1971 and 1972 AlDJEX pilot studies [Smith, 19731, of horizontal jets just beneath the ice
in the direction of leads and just above the pycnocline away from leads.
Simultaneous observations of mean velocity and mean density structure show
that the mixed layer is stably stratified, with Richardson numbers between
10 and 100. According to these observations, the sinking brine is replaced
by the lightest water available in the vicinity, namely, that just beneath
the ice. When the brine reaches the deeper part of the mixed layer, where
i ts density is close to the ambient density, it runs out along a geopoten- tial surface. In this manner leads drive a large aspect-ratio convection
that tends to preserve rather than destroy the mean density structure of
the mixed layer.
I E the mechanism outlined above is correct, then lead convection is
extremely important not only for determining the depth of the pycnocline
and the mean density structure of the mixed layer but also for determining its annual variation. The convective plumes may also play an important role in transporting momentum from the ice across the mixed layer. The density flux in the plume appears to depend on the width of the lead and
the sensible and latent heat flux from the lead to the atmosphere. The rate and mechanism by which the dense fluid is mixed with the upper ocean
also must depend critically upon the shear across the mixed layer.
6

The oceanic observations ih this experiment are designed to determine
the characteristics of the density-driven convection in the vicinity of a lead by measuring the oceanic velocity and density fields.
atmospheric measurements referred to above are required to give the heat balance, and hence the brine production, at the surface of the lead.
The simultaneous
Two measurement sites will be established, one on each side of the
lead. The instrumentation at both sites will include a conductivity-
temperature-depth profiler and a set of fast-response component-measuring
current meters mounted of a frame whose orientation is monitored by tilt
meters and a compass.
ice beneath a hut housing the winch, recording instrumentation, and
personnel. tuating density and velocity on both sides of the lead.
Each instrument package will be lowered through the
The sensing instruments will obtain profiles of mean and fluc-
SCHEDULE OF ACTIVITIES
Logistics fur the lead experiment is the responsibility of the AIDJEX
Office and of the Naval Arctic Research Laboratory (NARL) at Barrow. Andreas
Heiberg, of AIDJEX, will coordinate the program elements.
Operations will commence on 25 February with the testing of atmospheric
instrumentation at the artificial lead near Barrow and will terminate approxo- mately six weeks later. At the conclusion of the test, a small plane will scout the ice within 30 miles of Barrow until a suitable lead is found.
Helicopter:; will then airlift the personnel and fully instrumented huts for
the atmospheric observations first, so that they can measure the upward
heat transfer when it is greatest, before the lead freezes. Oceanographic
huts, instrumentation, and personnel will follow; and oceanographic measure-
ments will continue after the lead freezes, since brine will still be
forming. ‘The radiation and CO, hut and personnel will arrive last.
Observations at the first lead will continue for approximately two days. The entire procedure will then be repeated at other leads so that data can be obtained for a variety of lead widths, wind speeds, and air- surface temperature differences.
7

REFERENCES
Badgley, F. I. 1966. Heat budget at the surface of the Arctic Ocean.
. (ea. J. Fletcher). The RAND Corp.,(RM-5233-NSF), pp. 267-277. Proc. of the Symp. on the Arctic Heat Budget and Atmospherk Circulation,
Elliott, W. P. 1958. The growth of the atmospheric internal boundary layer. Trans. Amer. Geophys. Union, 39: 1048-1054.
Miyake, M. 1965. Transformation of the atmospheric boundary layer over inhomogeneous surfaces. Scientific Report, University of Washington, 63 pp. I
Smith, J. D. 1973. Lead driven convection in the Arctic Ocean. Abstract, E W , Trans. Amer. Geophys. Union, 54: 1108-1109.
Taylor, P. A. 1970. A model of air flow above changes in surface heat flux, temperature and roughness for neutral and unstable conditions. Boundary-Layer MeteoroZogy, I : 18-39.
8

SUBSURFACE E D D I E S I N T H E A R C T I C OCEAN
Kenneth L. Hunkins Lumont-Doherty Geo Zoc$caZ Observatory
o f CoZwflbia University, PaZisades, New York 20983
ABSTRACT
On four occasions dur ing t h e AIDJEX f i e l d program i n March and A p r i l o f 1972 , t r a n s i e n t undercurrents a s soc ia t ed wi th eddies were observed a t depths between 50 and 300 m. The v e l o c i t y p r o f i l e w a s pa rabo l i c wi th a maximum of 40 cm/sec a t 150 m. A d i s t o r t i o n of t he s a l i n i t y and temperature f i e l d accompanied these cu r ren t s , and g rad ien t equi l ibr ium w a s c lose ly approached i n each case. The eddies , two of which were cyc lonic and two an t i cyc lon ic , p e r s i s t e d f o r a t least several days and probably endured much longer. were sepa ra t ed by 20-50 km, although the t i m e and space scales were n o t always c l e a r l y resolved i n these measurements. The subsurface c u r r e n t s i n t h e eddies were s w i f t e r than t h e wind- dr iven c u r r e n t s i n t h e upper mixed l a y e r , which usua l ly had speeds of less than 10 cm/sec, and t h e r e seemed t o be l i t t l e c o r r e l a t i o n between t h e two l e v e l s . Other i n v e s t i g a t o r s , both Sovie t and American, have noted similar eddies i n d i f f e r e n t p a r t s of t he Arctic Ocean and i n d i f f e r e n t seasons, b u t t h e p re sen t da t a are the most revea l ing , e s p e c i a l l y of h o r i z o n t a l scale.
The eddies are be l i eved t o have t h e i r o r i g i n i n t h e i n s t a b i l i t y of t h e b a s i c b a r o c l i n i c cur ren t . The la rge-sca le geostrophic cu r ren t was about 1 cm/sec i n the upper few hundred meters of t h e observa t ion area i n the permanent arct ic a n t i - cyc lonic gyre. The gyre has a lens-shaped s u r f a c e water mass of low s a l i n i t y produced i n the Arctic, over ly ing h i g h - s a l i n i t y water o r i g i n a t i n g i n lower l a t i t u d e s . There is thus a la rge- scale h o r i z o n t a l s a l i n i t y g rad ien t produced by g loba l condi t ions of oceanic prec ip i ta t ion-evapora t ion and modified by wind condi- t i ons . It can b e shown t h a t t h e c u r r e n t s accompanying such a dens i ty g rad ien t are no t s t a b l e b u t r a t h e r l e a d t o growing d is turbances . A s t he d is turbances amplify , t h e p o t e n t i a l energy of t h e ho r i zon ta l dens i ty g rad ien t is converted i n t o t h e k i n e t i c energy of eddies . Theory p r e d i c t s t h a t t h e f a s t e s t growing d is turbance w i l l have a h o r i z o n t a l wavelength on t h e o rde r of t he Rossby r ad ius of deformation, which i s 10 t o 20 km i n t h e Arctic Ocean. The observed h o r i z o n t a l scale agrees f a i r l y w e l l wi th t h i s .
They were 10 t o 20 km i n diameter and
9

Tota l k i n e t i c energy i n the mixed l a y e r above 50 m w a s less than 10 ergs/cm3. Below t h e mixed l a y e r k i n e t i c energy increased wi th depth, reaching 63 ergs/" a t 100 m, t h e deepes t level a t which i t w a s measured. The h o r i z o n t a l eddy f l u x of momentum was predominantly d i s s i p a t i v e , which could b e expected s i n c e t h e observa t ion s i t e w a s considerably no r th of t h e b a s i c cu r ren t maximum.
INTRODUCTION
I n s p r i n g 1972, t he Arc t -2 I c e Dynamics JoALit Experiment JIDJEX)
deployed an a r r a y of t h r e e manned camps r inged by d a t a buoys over t h e
Canadian Abyssal P l a i n i n the Arctic Ocean about 400 km nor th of Barrow,
Alaska (Fig. 1). During the six-week p i l o t s tudy , t h e s t a t i o n s d r i f t e d
genera l ly westward about 100 km, fol lowing t h e mean i c e c i r c u l a t i o n on t h e
southern s i d e of t he clockwise gyre i n t h a t p a r t of t h e A r c t i c Ocean (Fig. 2 ) .
S J SO' 70" so'
100.
110'
120'
130'
Fig. 1. I c e c i r c u l a t i o n i n t h e A r c t i c Ocean (adapted from U.S. Naval Oceanographic Off ice At l a s ) . Area of Fig. 2 is ou t l ined . D r i f t speeds i n knots (1 knot = 51.48 cm/sec).
10

This paper descr ibes oceanographic r e s u l t s from a program of c u r r e n t ,
s a l i n i t y , and temperature measurements conducted a t the main camp by i n v e s t i -
g a t o r s from t h e Lamont-Doherty Geological Observatory.
5 MA4CH 1972 TO 26 APRIL 1972
Fig. 2. D r i f t t r ack of i c e s t a t i o n s from 5 March t o 26 Apr i l 1972. Md.n camp is t o the southeas t . Dashed l i n e s i n d i c a t e l a c k of naviga t ion da ta .
From 15 March t o 1 9 A p r i l , p r o f i l e s of cu r ren t s a t 10 m i n t e r v a l s
w e r e taken twice each day wi th a Savonius r o t o r cu r ren t meter lowered by
hand t o 170 m, and t h e observa t ions were re ferenced t o magnetic no r th .
Currents w e r e a l s o sampled cont inuously, at one-minute intervals, a t 10 f i x e d
levels down t o 100 m wi th Savonius r o t o r meters a t t ached r i g i d l y t o inve r t ed
masts; t hese observa t ions were re ferenced t o t r u e no r th determined astronomi-
c a l l y , and t h e d a t a w e r e recorded d i g i t a l l y on magnetic tape. Since c u r r e n t
11
measurements are relative t o the d r i f t i n g ice platform, t h e i ce d r i f t w a s
removed t o o b t a i n c u r r e n t s relative t o t h e e a r t h . The d r i f t of t h e ice w a s
monitored c l o s e l y wi th sa te l l i t e naviga t ion systems, and ice v e l o c i t y d a t a
der ived from t h e p o s i t i o n s w e r e v e c t o r i a l l y added t o t h e observed c u r r e n t s
t o produce the t r u e c u r r e n t s used i n t h i s paper.
recorder (STD) ob ta ined 112 s t a t i o n s between 13 March and 25 Apri l .
A sal ini ty- temperature-depth
OCEANOGRAPHIC BACKGROUND
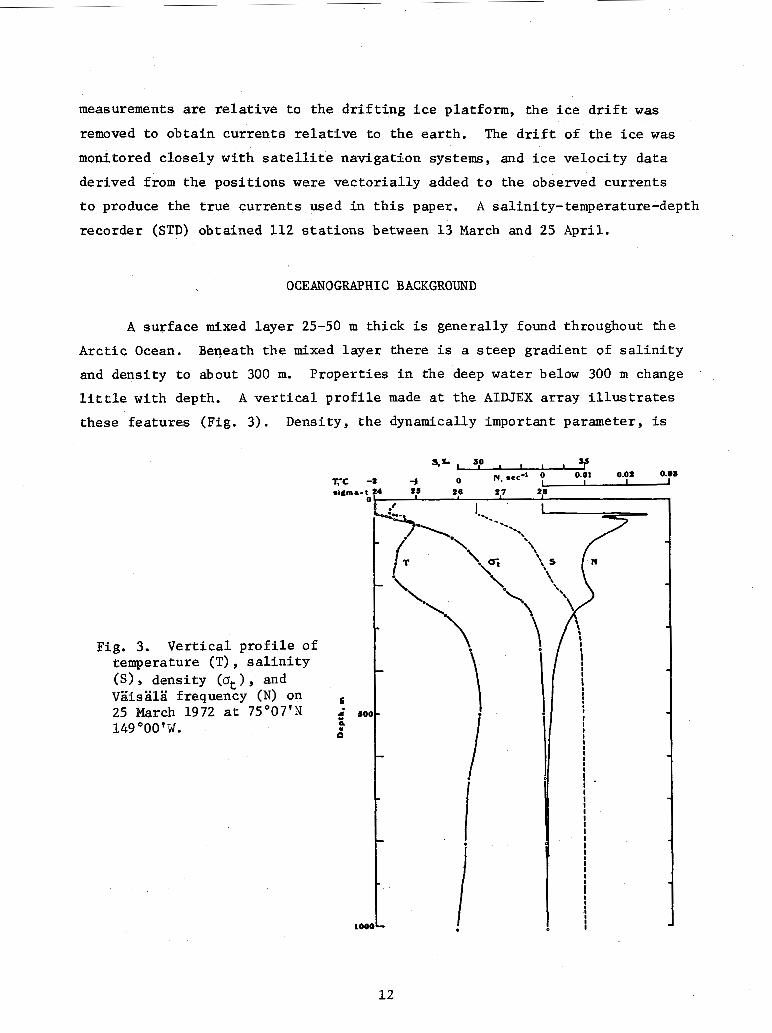
A s u r f a c e mixed l a y e r 25-50 m th i ck i s gene ra l ly found throughout t h e
Arctic Ocean.
and dens i ty t o about 300 m.
l i t t l e wi th depth.
t hese f e a t u r e s (Fig. 3 ) . Density, t h e dynamically important parameter, is
Beneath t h e mixed l a y e r t he re i s a s t e e p g rad ien t of s a l i n i t y
P rope r t i e s i n the deep water below 300 m change
A vertical p r o f i l e made a t t h e AIDJEX a r r a y i l l u s t r a t e s
Fig. 3. Vertical p r o f i l e of temperature (T) , s a l i n i t y (S), dens i ty (ot), and V B i s S l B frequency (N) on 25 March 1972 a t 75'07" 149 OOO' iJ .
5 L; a
loa
12

almost e n t i r e l y a func t ion of s a l i n i t y i n t h i s ocean.
t h e r e f o r e dens i ty , i nc reases cont inuously wi th depth, t h e ocean is s t a t i c a l l y
s t a b l e .
masses.
Since s a l i n i t y , and
Temperature o s c i l l a t e s w i th depth and serves as a tracer of water
The s a l i n i t y c o n t r a s t between t h e s u r f a c e and deep water masses i s due
t o t h e i r d i f f e r e n t o r i g i n s .
l a t i t u d e s i n t h e A t l a n t i c where evaporat ion exceeds p r e c i p i t a t i o n . It i s
then advected i n t o t h e A r c t i c Basin where i t is modified a t t h e s u r f a c e by
the excess of p r e c i p i t a t i o n over evapora t ion , producing an upper l a y e r of
low s a l i n i t y .
The h igh - sa l in i ty deep water is formed a t low
The s u r f a c e waters and pack ice circulate i n a clockwise gyre. The
dynamic topography of t h e sea s u r f a c e based on s c a t t e r e d hydrographic observa-
t i ons r e f l e c t s t h i s gyre, showing high p res su re a t t h e c e n t e r (Fig. 4 ) . dens i ty su r faces below t h e c e n t e r of t h e gyre are depressed, l i m i t i n g t h e
clockwise c i r c u l a t i o n to the upper few hundred meters, These are cu r ren t s
with a t i m e s c a l e of years and a space scale of thousands of k i lometers .
The
Fig. 4 . Dynamic topography of t h e sea su r face . Dots r ep resen t hydrographic s t a t i o n s . 600 m level [Kusunoki, 19621.
Dynamic meters relative t o t h e
13

The mean geos t rophic c u r r e n t s f o r one month over t h e AIDJEX a r r a y i n d i c a t e
a southwestward cu r ren t of about 2 cm/sec which decreases w i t h depth (Fig. 5). This c i r c u l a t i o n , w i th a time scale of months and a d i s t a n c e scale of hundreds
of k i lometers , agrees i n magnitude and vertical shea r wi th t h e l a r g e r - s c a l e
conception.
AIDJEX site, which may be a t t r i b u t a b l e t o a t i m e v a r i a t i o n o r , more l i k e l y ,
t o a l a c k of d a t a used f o r compiling the o v e r a l l dynamic topography i n
Figure 4.
t o t h e southwest , and the mean geos t rophic c u r r e n t s a t 30 m y 1 . 8 cm/sec i n
t h e same d i r e c t i o n .
The d i r e c t i o n , however, i n Figure 4 is northwestward a t the
There w a s c l o s e agreement between t h e average ice d r i f t , 2 .4 cm/sec
i= .5 - al 0)
CI
1.0
I I I I
- I
- - -
Fig. 5. Average geos t rophic c u r r e n t s a t t h e AIDJEX a r r a y r e l a t i v e t o t h e 1000 m level [Newton, 19731.
14

Direct c u r r e n t observat ions a t a s i n g l e s t a t i o n c o n t r a s t wi th t h e mean
c i r c u l a t i o n . Much s w i f t e r c u r r e n t s are superimposed on t h e slow mean c i rcu-
l a t i o n a t t i m e s .
i n t he upper 10 m, b u t t h e swiftest and most s t r i k i n g c u r r e n t s are found
considerably deeper. During t h e 1972 AIDJEX program, cur ren t speeds o f up
t o 40 cm/sec a t a depth of 150 m were observed on occasion a t t h e main camp.
These s w i f t e r t r a n s i e n t c u r r e n t s i n f l u e n c e t h e mean of t h e observed c u r r e n t s
shown i n Table 1. A t t h e main camp t h e observed mean c u r r e n t speeds increased
downward, u n l i k e t h e geostrophic c u r r e n t s c a l c u l a t e d over t h e 100 km ar ray .
Currents dr iven by t h e d r i f t i n g ice may reach 10 t o 1 5 cm/sec
TABLE 1
MEAN VELOCITIES AND CORRELATION COEFFICIENTS FOR CURRENTS AT 1972 AID,JEX M A I N CAME'
Xean v e l o c i t y No. of hourly Depth (m) d a t a p o i n t s East North Covar . Corr. Coeff.
n
2
4
8
12
20
30
40
50
70
100
662
662
66 2
662
662
650
650
6 50
6 31
6 31
-1.55
-1.44
-1.37
-1.09
-1.14
-2.01
-1.39
-1.95
-3.02
-4.36
1.19
0.93
1.09
0.56
0.55
-0.31
0.06
0.30
0.49
2.75
-4.67
-1.77
-3.48
-0.13
-0.39
0.74
-1.93
-0.95
5.58
-12.08
-0.55
-0.29
-0.44
-0.05
-0.14
0.12
-0.23
-0.13
0.23
-0.24
Transient undercurrents similar t o those observed at t h e AIDJEX s i t e
w e r e noted by Shirshov i n 1937 dur ing t h e d r i f t of the f i r s t Sovie t ice
research s t a t i o n , NP-1.
measurements from o t h e r Sovie t i ce s t a t i o n s (Fig. 6). Somewhat s i m i l a r
c u r r e n t s have a l s o been measured a t F l e t c h e r ' s Ice I s l a n d (T-3) [Gal t , 1967;
Belyakov [1972] has discussed t h e s e and l a te r
15

Berns te in , 19721.
Ocean, as w e l l as from d i f f e r e n t seasons and yea r s , suggest t h a t t h e phenome-
non of t r a n s i e n t undercurrents i s f a i r l y widespread through t h e Arctic Ocean.
These observa t ions from d i f f e r e n t reg ions of t h e Arctic
Velocity, c m l s e c
IOC
E .. c 0 0 0 200
c
300
I IO IS 20 2s I IO IS 20 2s
Fig. 6. Vertical p r o f i l e s of subsur face cu r ren t m a x i m a from Sovie t ice s t a t i o n s [Belyakov, 19721. I--North Pole-1; 2--North Pole-8, 9/10/59; 3--North Pole-8, 1/11/60.
The ALDJEX p i l o t program provided t h e b e s t opportuni ty y e t t o i n v e s t i -
g a t e t h e n a t u r e of t h e s e cu r ren t s .
s t a t i o n s allowed f o r t h e first t i m e an accu ra t e determinat ion of t h e t r u e
cu r ren t speeds i n these undercurrents and an estimate o f t h e i r h o r i z o n t a l
scale.
The accura t e p o s i t i o n i n g and the m u l t i p l e
STRUCTURE OF ARCTIC SUBSURFACE EDDIES
A prominent v e l o c i t y m a x i m u m i s t h e most c h a r a c t e r i s t i c f e a t u r e of
v e r t i c a l cu r ren t p r o f i l e s taken wi th in subsur face eddies (Fig. 7). The
v e r t i c a l p r o f i l e has a genera l ly smooth shape, wi th t h e s w i f t e s t cu r ren t a t
16

VELOCITY, cmlrcc
- North --9--- East
. L : 100 I I 1 1
Fig. 7. Vertical profiles of subsurface current maximum from AIDJEX main camp (1972.) Observation times are: 1900 Mar. 30; lower right--0610 Apr. 1.
upper left--0050 Mar. 16; upper right--0120 Mar. 17; lower left--

a t about 150 m.
i n F igure 3.
below 300 m. t h e s i x weeks of observa t ions , p e r s i s t i n g f o r one t o f o u r days on each
occasion.
they las t much longer than several days, b u t the ice s t a t i o n d r i f t s over
them. During the course of a day, cu r ren t d i r e c t i o n s w i t h i n t h e f e a t u r e s
may change as much as 180'.
The cu r ren t co inc ides wi th the s t e e p dens i ty g rad ien t shown
There is l i t t l e motion i n t h e mixed l a y e r o r i n t h e deep l a y e r s
Strong subsur face c u r r e n t s were noted on f o u r occasions during
This i s n o t n e c e s s a r i l y the l i f e t i m e of t h e f ea tu res : probably
The i n t e r p r e t a t i o n of t i m e - and space-dependent cu r ren t p a t t e r n s
The clearest observed from a d r i f t i n g p la t form p resen t s d i f f i c u l t i e s .
r e s o l u t i o n occurs when ice d r i f t i s r a p i d relative t o t h e s e cu r ren t systems,
which then appear t o be r e l a t i v e l y s t a t i o n a r y .
d i f f e r e n t types o f p l o t s , emphasizing d i f f e r e n t a spec t s of t h e observa t ions ,
a l s o g ives i n s i g h t i n t o t h e s t r u c t u r e and behavior of less i d e a l cases.
Since the observa t ions suggest t h a t t h e f e a t u r e s are closed c i r c u l a t i o n
systems, t he genera l term eddy w i l l be used.
But p re sen t ing t h e d a t a i n
Several s t r o n g eddies appear i n a p l o t of cu r ren t speed and depth of
dens i ty s u r f a c e s versus t i m e (Fig. 8). This p re sen ta t ion obscures t h e
h o r i z o n t a l dimensions of t h e eddies b u t c l e a r l y shows t h e presence of
c u r r e n t maxima and the r e l a t i o n between t h e v e l o c i t y and dens i ty f i e l d s .
The two most pronounced eddies appeared on 15-17 March and 29 March-2 A p r i l .
O f two weaker events noted on 26-28 March and 3-5 Apr i l , t h e l a t t e r appears
from the d r i f t t r a c k t o be a r ec ross ing of t h e 30 March-1 A p r i l f e a t u r e .
The dens i ty su r faces are d i s t o r t e d upward o r downward by as much as 18 m.
I n the two l a r g e r eddies t h e r e i s a gene ra l upwarping o f t h e dens i ty su r faces
above the cu r ren t maximum and a downwarping below t h e maximum. This corre-
sponds t o a h igh p res su re o r an t i cyc lon ic subsur face system.
s u r f a c e s i n t h e v i c i n i t y of t h e 26-28 March eddy are d i sp laced i n t h e
oppcs i t e s ense , i n d i c a t i n g a cyc lonic system.
The dens i ty
Geostrophic cu r ren t s ca l cu la t ed from p a i r s of hydrographic s t a t i o n s ,
one s t a t i o n nea r t h e c e n t e r and one n e a r t h e edge o f t h e eddy, show agreement
wi th d i r e c t l y measured cu r ren t s . S a t e l l i t e naviga t ion provided p o s i t i o n i n g
accuracy of kO.01 km, making poss ib l e s u f f i c i e n t l y accurate d i s t a n c e de te r -
mination between s t a t i o n s d e s p i t e t h e small spac ing between hydrographic
18

. . .
. . . : I
. . . . . . . .
. . . . . . . .
. . . P . . .
. . .
. . .
. . .
. . .
. . .
. . . .
. . . .
, . . .
. . . .
. . . .
. . .
. . . .
. . . . . . . .
. . . . . . .
0
0
60
I O 0
150
MARCH APRIL
Fig. 8. Current speed and sigma-t as a func t ion of t i m e a t t h e AIDJEX main camp. So l id l i n e s are contours of cu r ren t speed a t i n t e r v a l s of 5 cm/sec. of 0.5 sigma-t u n i t s based on hydrographic s t a t i o n s . Hatched areas i n d i c a t e cu r ren t speeds i n excess of 35 cm/sec.
Dashed l i n e s are dens i ty s u r f a c e s a t i n t e r v a l s Dots represent i n d i v i d u a l c u r r e n t measurements.

s t a t i o n s , 2.45 km i n one case and 3 .22 km i n t h e other .
l e v e l , and speed agree f a i r l y w e l l wi th t h e geos t rophic p r o f i l e a l though t h e
observed speeds are s l i g h t l y h ighe r i n each case (Figs . 9 and 1 0 ) .
cyc lonic flow, which cha rac t e r i zes both of these edd ie s , geos t roph ica l ly
ca l cu la t ed v e l o c i t y w i l l underestimate the cu r ren t v e l o c i t y i f c e n t r i f u g a l
fo rce e f f e c t s are s i g n i f i c a n t .
eddies , b e t t e r agreement i n speed i s achieved.
inc ludes c e n t r i f u g a l fo rce , w a s ca l cu la t ed from t h e r e l a t i o n
The p r o f i l e shape,
For a n t i -
I f a r ad ius of 10 km i s assumed f o r t hese
The g rad ien t f low, which
-V2/R + fv - f $ = 0
where V is t h e v e l o c i t y of t h e grad ien t cu r ren t and V i s t h e v e l o c i t y o f g
t he geos t rophic cu r ren t . The time v a r i a t i o n i s neglec ted s i n c e t h e eddies
24 25 26 27 28 I I 1 r
L\.2&5 3/15
-
-
-
h
0
100
Velocity, cm/sec
E 5 P 0,
a200! 300
S t a . 7 1800 3/16
Fig. 9 . Comparison of observed c u r r e n t s wi th ca l cu la t ed geostrophic and gradien t cu r ren t s ; and comparison of dens i ty p r o f i l e s a t cen te r o f and ou t s ide eddy.
20

seem t o vary only slowly over a per iod o f several days.
f o r t h e s t a t i o n p a i r s show g r e a t e r mixing o r vertical e longa t ion between
50 and 250 m a t t h e c e n t e r of t h e s e a n t i c y c l o n i c f e a t u r e s .
The dens i ty p r o f i l e s
Velocity, cm/sec 0 10 20 30
I I
Sigma - t *I
100
200
300 1 1800 3/30 -00600 3/31
Fig. 10. Comparison of observed c u r r e n t s wi th c a l c u l a t e d geo- s t r o p h i c and gradien t cu r ren t s ; and comparison of dens i ty p r o f i l e s at c e n t e r of and ouside at edge of eddy.
The h o r i z o n t a l p a t t e r n of t h e eddies i s revea led more c l e a r l y by a
p l o t of c u r r e n t vec to r s a t a f ixed depth along t h e d r i f t t r ack ,
of s w i f t e r cu r ren t s appear on t h e 100 m l e v e l (Fig. 1 1 ) . The f e a t u r e s are
about 10 k.m ac ross , w i th spac ing between them ranging from 10 t o 50 km.
eddy pattekrn shows most c l e a r l y when t h e s t a t i o n d r i f t is r ap id i n comparison
wi th t h e d r i f t of t h e eddies . I n most cases a clear p a t t e r n does no t emerge
from t h e c u r r e n t vec to r p a t t e r n p l o t t e d on the d r i f t t r ack .
e n t l y due t o t h e f a c t t h a t t h e p la t form i s d r i f t i n g i r r e g u l a r l y over a system
Five areas
The
This i s appar-
21

N 13
f 4- 16 Mar78
t
t
0 50 cm/rec __r_r_c
AIDJEX Currents at lOOm
Fig. 11. Current vec tors a t t h e 100 m level a long t h e d r i f t camp showing loca t ions o f subsur face eddies .
t r ack of t h e main

which i s a l s o d r i f t i n g b u t a t a d i f f e r e n t rate and d i r e c t i o n .
17-18 A p r i l , t he s t a t i o n d r i f t e d on a n e a r l y s t r a i g h t pa th ac ross a cyc lonic
However, on
counterclockwise eddy.
of t he eddy t o e f f e c t i v e l y f r e e z e t h e eddy motion i n t i m e . An enlargement
from t h e d r i f t t r a c k shows t h e c u r r e n t s at t h e 100 m level (Fig. 12) . The
same eddy w a s apparent ly recrossed on 22-25 A p r i l , so t h a t only fou r independ-
e n t eddies were p resen t .
The ice d r i f t w a s r a p i d enough relative t o advect ion
\ I
\ /
% f
1 \
cp \ \ \ % . \ / \
d 10 cm/sec /
\ \
0 0
---/ '\ '\ AIDJEX, Apr.'72
100m Depth
Fig. 12. Cyclonic eddy of 17-18 Apr i l . Current vec to r s at t h e 1013 m l e v e l p l o t t e d a t 2-hour intervals along t h e d r i f t t r a c k .
Although t h e eddy on 17-18 Apr i l was n o t w e l l sampled by t h e scanty
hand-lowered cu r ren t observa t ions shown i n F igure 8, continuous c u r r e n t
measurements and closely-spaced STD s t a t i o n s were taken during t h e Apr i l 17-18
per iod s o t h a t cons iderable s t r u c t u r a l d e t a i l w a s obtained.
s u r f a c e s are depressed above and e leva ted below t h e 150 m cu r ren t core ,
i n d i c a t i n g a cyc lonic f e a t u r e (Fig. 13) . The temperature f i e l d , which
decreases wi th depth between 75 and 170 m, shows behavior similar to t h a t
The s a l i n i t y
23

t 1
-i
3 1 4 0 5
+ =
Fig. 13. Surfaces of cons tan t s a l i n i t y as a func t ion of t i e m , 13-20 Apr i l , based on STD s t a t i o n s . Note c o n s t r i c t i o n of su r faces about t h e 150 m core level during appearance of 17-18 A p r i l cyc lonic eddy.

of t h e s a l i n i t y f i e l d (Fig. 14) . Of e s p e c i a l i n t e r e s t i n t h e temperature
p l o t is t h e presence of anomalously warm water o f 1 .O"C a t t h e 75 m level
n e a r t he eddy center .
s a l i n i t y diagrams show no s imple r e l a t i o n s h i p w i t h t h e presence o r absence
of subsurf ace eddies . The wind speeds p l o t t e d on t h e temperature and
A comparison of t h e dens i ty su r faces between s t a t i o n s provides f u r t h e r
evidence of t h e s m a l l h o r i z o n t a l scales o f t h e eddies . In the absence of
complete 'current d a t a a t a l l t h r e e s t a t i o n s , t h e dens i ty anomalies i n d i c a t e
t h e presence of edd ie s , s i n c e a d i r e c t r e l a t i o n s h i p exists between t h e
v e l o c i t y and mass f i e l d s . There i s l i t t l e c o r r e l a t i o n between pe r tu rba t ions
of t he sigma-t s u r f a c e s a t t h e t h r e e s t a t i o n s (F ig , 15). Since t h e s t a t i o n s
are spaced 100 km a p a r t , t h i s i s t o be expected f o r eddies which are only
about 10 kni i n diameter.
scale ice motion r a t h e r than subsur face eddies . The eddies a l ready d iscussed
i n the r e s u l t s from the main camp do not have counterpar t s a t t h e o t h e r
s t a t i o n s .
cyc lonic event on 23-25 March, wh i l e l i t t l e a c t i v i t y w a s recorded a t
s t a t i o n 1 t o t h e w e s t .
The a r r a y spac ing w a s chosen t o monitor synopt ic-
A t s t a t i o n 2 t o t h e no r th , for 'example, t h e r e was a s t r o n g a n t i -
KINETIC ENERGY DISTRIBUTION AND FLUX
The bulk of t h e k i n e t i c energy w i t h i n t h e w a t e r column apparent ly i s
contained wi th in these edd ie s , making t h e i r r o l e an important one f o r energy
balance. 'fie k i n e t i c energy of t h e h o r i z o n t a l c u r r e n t s w a s ca l cu la t ed us ing
hourly mean values from the 10 mast-mounted cu r ren t meters f o r t h e per iod
from 29 March-25 Apr i l .
dependent p a r t s ,
The c u r r e n t s were sepa ra t ed i n t o mean and t i m e -
and
- u = u + u '
- u = u + u '
where the mean v e l o c i t i e s s i g n i f i e d by a b a r are averages over a l l d a t a
p o i n t s and t h e f l u c t u a t i n g p a r t s i g n i f i e d by a prime is t h e depa r tu re from
t h e mean .
25

Fig. 14. Surfaces of constant temperature as a function of time, 13-20 April, based on STD stations.

I I I I 1 0 I I I I I I I I I I I I 1 I I I I 1 I I I
- - -
0
- - -
-
* . . ' * 4 -
- - \ ,-, e_-- ----26.50 -,
* 26.50
26.so . . 0 Le---------- -------___- 4'. . * a . .,I*;'*,,:--*
- I # ..
- -
I I I I I I I I I I I I I I I I I I I I I I I I I I I I
-l50

The k i n e t i c energy of t h e mean flow is given by
K.E. (mean) = % P [U2 + u21 The k i n e t i c energy of the time-dependent flow i s def ined as
- - K.E. ( f l u c t u a t i o n s ) = 15p[uf2 + v f 2 ]
where the var iances are given by
n
j=1 n
j = 1
F = l / n 1 ur2
- v12 = l / n 1 v r 2
and
wi th n be ing t h e number of d a t a po in t s .
these ca l cu la t ions . The t o t a l k i n e t i c energy i n t h e flow w i l l then be t h e
sum of the k i n e t i c energy i n the mean and f l u c t u a t i n g p a r t s .
energy of both t h e mean and the f l u c t u a t i n g flow reached i ts l a r g e s t va lue
a t the deepest measured level, 100 m (Fig. 16 ) . The f l u c t u a t i n g flow
conta ins the bulk of the k i n e t i c energy a t a l l levels, ranging from 3 t o 9
t i m e s t h a t i n t h e s teady flow.
cons tan t i n t h e mixed l a y e r between t h e su r face and 50 m. Between 50 and
100 m t h e energy inc reases wi th depth. Other s t u d i e s [Hunkins, 19661 have
5hOWIl t h a t f r i c t i o n a l e f f e c t s are confined t o an Ekman l a y e r only about
20 m t h i c k .
wi th t h a t a t 100 m.
nea r ly an o r d e r of magnitude less than i t s va lue of 6 3 ergs/cm3 a t 100 m.
Although these observat ions d id no t extend through t h e whole eddy depth, i t
Seem l i k e l y t h a t t he maximum k i n e t i c energy coincides wi th t h e v e l o c i t y
maximum a t 150 m and then decreases a t g r e a t e r depths.
The va lue of p i s taken as 1 i n
The k i n e t i c
The k i n e t i c energy is low and r e l a t i v e l y
The k i n e t i c energy i n t h e Ekman l a y e r i s small i n comparison
The average k i n e t i c energy i n t h e upper 20 m is 7 ergs/cm3,
1.n a normal d i s s i p a t i v e regime, momentum f lows from t h e mean flow t o
the f l u c t u a t i o n s , b u t i n c e r t a i n oceanic and atmospheric regions t h e flow of
momentum i s reversed. It is of i n t e r e s t t o know t h e d i r e c t i o n of momentum
f l u x i n the p re sen t case f o r la ter i n t e r p r e t a t i o n of t h e mechanisms genera t ing
and maintaining these cur ren ts .
v e l o c i t y components is given by
The covariance of t h e no r th and east
28

Kinetic Energy, ergs/ema 60 80 20 40
I 1 I I I I
t AIDJEX, 3/29 - 4/25/72
Fig. 16. Var i a t ion of h o r i z o n t a l k i n e t i c energy wi th depth f o r per iod 29 March-25 Apr i l af main camp.
Covariance = U ' V '
and
Eddy momentum flux = p u ' U ' For some purposes i t i s more convenient t o normalize t h i s t o form a
c o r r e l a t i o n c o e f f i c i e n t ,
29

U '5' Corre la t ion c o e f f i c i e n t = (ut2 0 t)'+
which has va lues from -1 t o +l.
p o s i t i v e va lues only at 30 and 70 m.
E ight of t h e t en va lues are nega t ive , with
The s ta t i s t ica l s i g n i f i c a n c e of t hese
r e s u l t s i s n o t c l e a r l y e s t ab l i shed , s i n c e the re is a ques t ion as t o t h e
independence of samples i n a t i m e series such as t h i s .
poss ib l e s i g n i f i c a n c e of these r e s u l t s can be noted. The term
Nevertheless , t h e
a i i pu'u' - aY descr ibes t h e f l u x of momentum between the mean flaw and f l u c t u a t i o n s i n t h e
case of an east-west mean cur ren t [Webster, 19611.
g rad ien t , aF/ay, w a s no t measured i n 1972, b u t t h e evidence from previous
years (Fig. 2) is t h a t t h e AIDJEX s i te w a s l oca t ed no r th of t h e axis of t h e
mean cu r ren t s .
The h o r i z o n t a l v e l o c i t y
In t h a t case aE/ay w a s p o s i t i v e and t h e term pu'u' aZ/ay w a s
nega t ive a t most of t he levels sampled. The negat ive s i g n r ep resen t s a
t r a n s f e r from the mean f l o w t o t h e eddies , a d i s s i p a t i v e regime.
l eng th of record and unce r t a in ty of t he statist ical s i g n i f i c a n c e make
r e s u l t only t e n t a t i v e , however.
The s h o r t
t h i s
THE ORIGIN OF SUBSURFACE EDDIES
The ex i s t ence o f these eddies raises quest ions about t h e i r o r i g i n s
and development. There are several sources of energy which might poss ib ly
l e a d t o eddy motions.
Winds d r ive the ice, yhich i n t u r n d r ives s u r f a c e cu r ren t s .
genera t ion of s u r f a c e cu r ren t s i n t h e mixed l a y e r is an obvious result.
Winds might a l s o provide energy f o r deeper cu r ren t s . Wind and pack ice
v o r t i c i t y would l e a d t o divergences in t h e mixed l a y e r and consequent
ver t ical v e l o c i t i e s a t i t s base. D i s t o r t i o n of t h e dens i ty s u r f a c e s and
a compensating flow a t depth would follow. Explanat ions by Browne and
Crary [1958] and by Shirshov [as d iscussed i n Belyakov, 19721 of e a r l y
observat ions of arctic undercurrents were based on wind-driven e f f e c t s .
These au thors r e f e r r e d t o t h e eddies as "counter-currents" and considered
them t o be a secondary flow induced by Ekman divergence i n t h e mixed l aye r .
The
30

Experience a t t h e AIDJEX 1972 s i te does n o t suppor t a wind-driven
hypothes is , however.
d r i f t and t h e presence of edd ie s , which were noted both dur ing s t r o n g winds
and during c.alms. The observed s m a l l s i z e of t h e eddies is a f u r t h e r argu-
ment against . a wind source.
order of 1000 km. Ice d r i f t c l o s e l y fol lows t h e wind and has t h e same hor i -
z o n t a l s c a l e as t h e winds, b u t t he observed eddies are, i n f a c t , two o rde r s
of magnitude smaller i n s ize .
There w a s l i t t l e apparent r e l a t i o n between wind o r ice
The synop t i c scale of wind systems i s on t h e
The f r e e z i n g process i s another p o s s i b l e energy source. During t h e
w i n t e r t h e pack ice f r equen t ly c racks , exposing areas of open water which
f r e e z e ove r quick ly under t h e p r e v a i l i n g low a i r temperatures.
releases salt . The heavy b r i n e s i n k s t o r e e s t a b l i s h equi l ibr ium. The
s i n k i n g b r i n e must d i s t u r b the base of t h e mixed l a y e r and l e a d t o some
d i s t o r t i o n of t he dens i ty f i e l d .
of open water which are gene ra l ly meters t o t ens of meters i n scale. In t h i s
case the source scale appears t o be smaller than t h e eddy scale. It i s no t
clear whether anomalies of t h e magnitude seen w i l l b e produced by t h i s
mechanism. The f r e e z i n g occurs only i n w i n t e r and could n o t ope ra t e i n
summer, y e t s t r o n g eddies have been observed i n t h e summer. I f they had
indeed been produced by f r e e z i n g they m u s t have p e r s i s t e d f o r many months.
The f r e e z i n g
The release would occur over l o c a l areas
The observed dimensions of 10 km are i n t h e neighborhood of t h e i n t e r n a l
Rossby r ad ius o f deformation f o r t h e A r c t i c Ocean. The deformation r ad ius
i s the r a t i o of the speed of long g rav i ty waves t o t h e i n e r t i a l frequency.
For n e a r l y geos t rophic flow under condi t ions of h y d r o s t a t i c equi l ibr ium and
conservat ion of p o t e n t i a l v o r t i c i t y , t h e rad ius of deformation is t h e n a t u r a l
h o r i z o n t a l scale.
i s a l a y e r of depth h and dens i ty p1 over a much t h i c k e r l a y e r of d e n s i t y p 2 .
I n t h i s case t h e i n t e r n a l deformation r ad ius i s
The s imples t model f o r t h e Arctic Ocean dens i ty s t r u c t u r e
Rd = ( g f h ) ' / f
where
31

Se lec t ing t y p i c a l values f o r t h e Arctic Ocean,
h = 100 m
p 1 = 1.024 g*cmw3
p2 = 1.028 g * ~ m - ~
g = i o 3 cm*sec-2
f = 1.4 X sec"
we have
Rd = 10.0 km
For a cont inuously s t r a t i f i e d model, t h e rad ius of deformation t akes t h e
f o m
Rd = ND/f
where the V&sgla frequency, N , is
and D i s depth of t h e s t r a t i f i e d l aye r .
l a y e r between 50 and 300 m depth, D = 250 m and f o r N = 0.01 s e c , w e have
Rd = 17.9 km. Both of these values are i n approximate agreement wi th t h e
observed s i z e s of t he eddies .
f r eez ing processes , R
NO smaller f e a t u r e s can e x i s t .
be determined by the dimensions of t h e source.
Applying t h i s t o t h e b a r o c l i n i c
For eddies induced by Ekman divergence o r by
w i l l be a lower bound t o t h e s i z e of t h e f e a t u r e s .
Above t h i s lower l i m i t t h e eddy s i z e w i l l d
The f i e l d r e s u l t s do n o t permit a conclusive determinat ion of t h e
o r i g i n o f these eddies , b u t i n s t a b i l i t y theo r i e s seem t o p re sen t t h e most
a t t r a c t i v e mechanism f o r t h e i r generat ion. I n s t a b i l i t y theo r i e s p r e d i c t
t h a t a b a s i c b a r o c l i n i c f l o w such as exists i n t h e Arctic Ocean i s n o t s t a b l e .
S m a l l d i s turbances tend t o grow spontaneously, e x t r a c t i n g p o t e n t i a l energy
from the h o r i z o n t a l dens i ty grad ien t and convert ing i t i n t o t h e k i n e t i c
energy of eddies . The theo r i e s show t h a t d i s turbances wi th wavelengths
s h o r t e r than R
rate of growth i s most r ap id f o r c e r t a i n in te rmedia te wavelengths a few times
l a r g e r than Rd. These f a s t e s t growing waves w i l l even tua l ly dominate t h e
flow t o t h e exc lus ion
are s t a b l e , b u t longer wavelengths tend t o amplify. The d
of s h o r t e r and longer wavelengths. Theories of s m a l l
32

per tu rba t ions cannot p r e d i c t subsequent development.
w i th a c t u a l atmospheric s i t u a t i o n s , wi th numerical computer m d e l s , and wi th
r o t a t i n g tank experiments shows t h a t t h e p r e f e r r e d wavelengths cont inue t o
dominate dur ing later development, even tua l ly be ing c u t o f f t o form c losed
systems which then are advected wi th t h e mean flow. The fact t h a t a r c t i c
subsurface eddies have dimensions on t h e o r d e r of R
wi th i n s t a b i l i t y t h e o r i e s .
However, experience
i s i n gene ra l agreement d
One of t he s imples t i n s t a b i l i t y models i s t h a t developed by Eady [1949]
f o r t he atmosphere.
cons tan t V B i s 1 1 3 frequency, and r i g i d boundaries a t t o p and bottom.
v a r i a t i o n of C o r i o l i s parameter wi th l a t i t u d e i s assumed. This model is
probably t h e s imples t one which inco rpora t e s t h e b a s i c f e a t u r e s of b a r o c l i n i c
i n s t a b i l i t y . Although the Eady theory only crudely approximates t h e a c t u a l
s i t u a t i o n i n t h i s case, i t is u s e f u l f o r c e r t a i n comparisons. The rate of
growth f o r t h e f a s t e s t growing waves i s p red ic t ed t o b e p ropor t iona l t o the
mean vertical shear . A t t h e AIDJEX s i te t h e mean shea r w a s low, only about
1 cm/sec/100 m.
The model assumes a l i n e a r b a s i c v e l o c i t y g r a d i e n t ,
No
Applicat ion of t h e theory i n d i c a t e s t h a t a t i m e per iod of
about one month w i l l be requi red f o r t h e d is turbances t o double i n amplitude.
This slow growth rate does n o t appear e s p e c i a l l y favorable f o r development
a t the experimental s i t e . I n t h e mean cu r ren t a x i s south of t h e AIDJEX
a r r a y , however, t h e r e i s a f r o n t a l zone wi th h ighe r s h e a r which would be more
favorable t o growth (Fig. 4 ) . The mean s h e a r i n t h a t region, about 10 cm/sec/
100 m, would produce a doubling t i m e of two o r t h r e e days.
the a rc t ic eddies are spawned p r i n c i p a l l y n e a r t h e cu r ren t a x i s n o r t h of
Barrow and are then advected t o o t h e r areas such as t h e AIDJEX s i te .
It may be t h a t
A t i l t i n g of t h e phase l i n e s wi th depth f u r t h e r suppor ts i n s t a b i l i t y
In the case of mean westward cu r ren t s which decrease wi th depth, t heo r i e s .
as a t t h e obse rva t iona l s i t e , t h e phase l i n e s would s lope t o the w e s t wi th
depth.
d i r e c t i o n , b u t t h e tilt is s m a l l . The a rc t ic eddies are apparent ly i n a
mature s t a g e of development, having been completely c u t o f f , so t h a t s t e e p
t i l t i n g might n o t be expected and t h e l a c k of i t does n o t s e r i o u s l y d e t r a c t
from a b a r o c l i n i c i n s t a b i l i t y hypothesis .
There i s some i n d i c a t i o n i n Figs . 1 3 and 1 4 of a s l o p e i n t h e proper
33

Near a f r o n t a l s u r f a c e such as t h e atmospheric p o l a r f r o n t o r t h e G u l f
S t ream, i t has genera l ly been found t h a t t h e momentum f lux i s a g a i n s t t h e
g rad ien t , from t h e eddies t o the mean cu r ren t . The f a c t t h a t t h e AIDJEX d a t a seem t o show t h e f l u x i n the more normal down-gradient d i r e c t i o n a l s o
does no t preclude i n s t a b i l i t y .
from t h e f r o n t , a d i s s i p a t i v e regime may reassert i tsel f , cascading energy
downward t o ever smaller f e a t u r e s .
For mature systems a t a cons iderable d i s t ance
The tempera ture-sa l in i ty diagram i s another t o o l which might be
expected t o h e l p d iscr imina te between i n s t a b i l i t y theo r i e s and o the r s . The
water a t the cen te r of an eddy formed by i n s t a b i l i t y would have p r o p e r t i e s
d i s t i n c t l y d i f f e r e n t from those of t h e surrounding water, whereas t h e water
wi th in a wind-generated eddy would be der ived l o c a l l y and would have t h e
same p r o p e r t i e s as t h e water without .
one o f the eddies (Fig. 17) shows i d e n t i c a l water masses a t t h e c e n t e r and
on t h e edge, which would favor wind formation. However, t h e eddy of 17-18
A p r i l shown i n Figure 14 c l e a r l y has d i f f e r e n t water a t i t s center . A t 75 m
t h e r e w a s water wi th a temperature of - l . O ° C which w a s no t found a t t h a t
depth a t any o t h e r t i m e during t h e observa t ion p r i o d shown i n t h e f i g u r e .
This water must have been introduced when the eddy w a s formed along a f r o n t
s epa ra t ing two d i s t i n c t water masses. Such r e l a t i v e l y w a r m water is found
i n the Chukchi Sea area south of t h e experimental s i t e , and the eddy may
have been formed i n the f r o n t a l area mentioned earlier.
The tempera ture-sa l in i ty diagram f o r
One of the unique a spec t s of t h e a r c t i c edd ie s , t h e i r subsur face
v e l o c i t y maximum, s t i l l remains t o b e i n t e r p r e t e d . This peak amplitude
wi th in t h e pycnocline i s not p red ic t ed by r e s u l t s of s imple i n s t a b i l i t y
t h e o r i e s which show exponent ia l behavior i n depth.
mean shea r and V B i s B l B frequency are more complex than assumed i n simple
t h e o r i e s , and i t may be t h a t t he changing r a t i o of t hese q u a n t i t i e s , t h e
Richardson number, is respons ib le f o r t h e maximum a t depth. F r i c t i o n is
another f a c t o r i n the real ocean no t included i n s imple theo r i e s . Energy
would b e ex t r ac t ed from t h e eddies by f r i c t i o n aga ins t t h e base of t h e ice ,
r e s u l t i n g i n k i n e t i c energy and v e l o c i t y maxima a t depth.
The a c t u a l p r o f i l e s of
The subsurface eddies conta in a major po r t ion of t h e k i n e t i c energy
i n t h i s area of t he Arctic Ocean. They must be a s i g n i f i c a n t f a c t o r i n t h e
34

7.T 0.0
-1.0
-2.0
r:c 0.0
-8.0
- 500
700
-
- fss0
-0- 1100 15 111 72
- --.- 1800 /'30 a 16 111 7 ) so
I I I I 1-
-
so S t 54 36 S,%
-*- 1800 so 111 7¶ --.-- 0600
150 31 111 7s
I I I I I I I SO 32 s4 56 -2.01
Fig. 1 7 . Temperature-sal ini ty diagrams from cen te r and per iphery of eddies . Depths are given i n meters along t h e curves.
exchange o f momentum, sal t , and h e a t between t h e Arctic Ocean and border ing
areas under t h e in f luence of t h e A t l a n t i c and P a c i f i c oceans. Because of
t h e i r p o t e n t i a l importance t o g loba l t r a n s f e r processes , they deserve
continued inves t i g a t ion.
ACKNOWLEDGMENTS
This i n v e s t i g a t i o n w a s made p o s s i b l e by t h e continued suppor t of t h e
Of f i ce of Naval Research under c o n t r a c t N00014-67-A-0108-0016. Log i s t i c s
support w a s provided by t h e Nat iona l Science Foundation through t h e AIDJEX
35

O f f i c e and by t h e Off ice of Naval Research through t h e Naval Arctic Research
Laboratory.
meter program on AIDJEX '72.
Amos w i t h t h e a s s i s t a n c e of Roy Wilkins. Myron F l i e g e l wrote t h e computer
programs f o r reducing the d i g i t a l cu r ren t r e s u l t s and c a r r i e d ou t t h e d a t a
reduct ion.
Barry Allen and Allan G i l l a s s i s t e d wi th t h e Lamont cu r ren t
The Lamont STD program w a s opera ted by Anthony
REFERENCES
Belyakov, L. N. 1972. Triggering mechanism of deep ep i sod ic c u r r e n t s i n t h e Arctic Basin. ProbZennj A r k t i k i i A n t a r k t i k i 39: 22-32. A A N I I , Leningrad, USSR. ( I n Russian.)
Berns te in , R. 1971. Observations of c u r r e n t s i n t h e Arctic Ocean. Unpub- l i s h e d doc to ra l d i s s e r t a t i o n , Columbia Univers i ty .
Browne, A. M. , and A . P. Crary. 1958. The movement of i c e i n t h e A r c t i c In Arctic Sea Ice , Publ. 598, Nat ional Academy of Sciences, Ocean.
Washington, D. C. : 191-207.
E. T. 1949. Long waves and cyclone waves. Tel lus , 2 : 33-52.
J. 1967. Current measurements i n t h e Canadian Basin of t h e A r c t i c Ocean, summer 1965. Tech. Rpt. No. 184, Univers i ty of Washington, Department of Oceanography.
Hunkins, K. 1966. Ekman d r i f t c u r r e n t s i n t h e Arctic Ocean. Deep-sea Research 23: 607-620.
Kusunoki, K. 1962. Hydrography of t h e Arctic Ocean wi th s p e c i a l re fe rence t o t h e Beaufort Sea. Contr ibut ions from t h e I n s t i t u t e of Low Tempera- t u r e Science, Ser. A. , No. 1 7 , Hokkaido Univers i ty , Sapporo, Japan.
Newton, J. L. 1973. The Canada Basin: mean c i r c u l a t i o n and in te rmedia te scale flow f e a t u r e s . Unpublished doc to ra l d i s s e r t a t i o n , Univers i ty of Washington.
Newton, J. L . , and L. K. Coachman, 1973. 1972 AIDJEX i n t e r i o r f low f i e l d study: prel iminary r e p o r t and comparison wi th previous results. A I D J E X BuZZstin No. 19: 19-42.
U. S . Navy Hydrographic Office. 1950. Oceanographic a t las of t h e p o l a r seas, P a r t I1 - Arctic. Hydrographic Of f i ce Publ. No. 705. Washington, D.C.
Webster, P. 1961. The effect of meanders on t h e k i n e t i c energy ba lance of t h e Gulf Stream. TeZZus, 13: 392-401.
36

THREE NOTES ON THE THEORY OF SEA- ICE MOVEMENT
by
J. F. Nye Department of Physics, Bristol University
Bris tol , England
I
I. SPATIAL SCALES I N SEA-ICE MOVEMENT
The ques t ion of s p a t i a l scales i n sea- ice movement is fundamental i n
devis ing a mathematical model. For example, i t is pos tu la ted by t h e AIDJEX
modeling group t h a t w i th in some range of s c a l e s i t is poss ib l e t o r ep resen t
t h e deformation p a t t e r n of t h e i c e pack by a continuum approximation.
may be h e l p f u l t o restate t h i s bas i c assumption i n purely geometr ical terms,
as fol lows.
It
L e t a c i r c l e C, be drawn on sea- ice , and then observed aga in a f t e r an
i n t e r v a l of time. It may have become roughly an e l l i p s e ; i n which case t h e
modeling grotip is happy. Suppose, however, t h a t i t becomes very discont inuous,
perhaps a number of disconnected a r c s .
approximation is not app l i cab le on t h i s s c a l e , and so w e should s ta r t again
wi th a l a r g e r circle, C,, hoping t h a t t h i s t i m e it w i l l become a recognizable ,
even i f s l i g h t l y discont inuous, e l l i p s e . If i t does, w e are s a t i s f i e d and
say t h a t w e have found t h e r i g h t s c a l e (o r a r i g h t scale) t o use.
i f i t does no t?
shaped.
The key ques t ion now is:
c i r c l e both remains reasonably continuous and becomes an e l l i p s e ? I n p r i n c i p l e ,
such a scale may o r may not e x i s t .
assemblage of r i g i d f l o e s each so large t h a t a q u i t e d i f f e r e n t wind ac ted
on each one.
proved) is t h a t such an in te rmedia te s c a l e does e x i s t ; i t is thought t o be
of t h e order of 100 km.
We should say t h a t a continuum
But what
Suppose C, remains nea r ly continuous but becomes kidney-
We say t h a t t h e s t r a i n is non-uniform on a s c a l e C,. What then?
Does a s c a l e e x i s t between C, and C, f o r which the
An example where i t would not is an
The AIDJEX modeling group's p o s t u l a t e (which remains t o be
The sp r ing 1973 ERTS photography now a v a i l a b l e [Barnes and Bowley,
19731 probably conta ins t h e proof o r disproof of t h e pos tu l a t e .
37

11. THE RELATION BETWEEN THE ROTATION RATE OF A STATION ON AN I C E FLOE AND THE VELOCITY FIELD I N WHICH I T I S IMBEDDED
Consider t h e fol lowing AIDJEX-type experiment. A c e n t r a l s t a t i o n is placed on an ice f l o e and is surrounded by an a r r a y of o the r s t a t i o n s .
p o s i t i o n s of a l l t h e s t a t i o n s are observed as func t ions of t i m e , and t h e
r e s u l t s are i n t e r p r e t e d as a measure of t h e s t r a i n - r a t e and v o r t i c i t y of
t h e ice pack averaged over t h e reg ion surveyed.
of t h e c e n t r a l ' s t a t i o n i t s e l f is a l s o measured. I n t h e observa t ions descr ibed
by Hib ler e t a l . [1973], w w a s i n most cases similar t o one-half of t h e
measured v o r t i c i t y ( v o r t i c i t y being def ined h e r e as t h e ver t ical component
of c u r l 2, where 2 i s t h e v e l o c i t y ) .
would t h i s be t h e expected r e s u l t ? For example, suppose t h e ice pack
contained a number of s t r a i g h t p a r a l l e l cracks along which shear ing w a s
occur r ing . Because each f l o e would not be r o t a t i n g , w = 0. But t h e v o r t i c i t y
would be non-zero, and so t h e r e l a t i o n would not be s a t i s f i e d . One could
inven t o the r examples where w w a s g r e a t e r than one-half of t h e v o r t i c i t y .
The
The rate of r o t a t i o n w
We wish t o ask: i n what circumstances
A model t h a t he lps t o answer t h e ques t ion is t h e following. A two-
dimensional medium t h a t is i n f i n i t e and i s o t r o p i c is deforming homogeneously.
A c i r c u l a r r i g i d inc lus ion is now introduced ( thus au tomat ica l ly d i s t u r b i n g
t h e prev ious ly homogeneous s t r a i n - r a t e f i e l d ) . We s h a l l prove t h a t
where w is t h e ra te of r o t a t i o n of t h e inc lus ion ( p o s i t i v e an t ic lockwise) ,
(x,y) are Car tes ian coord ina tes , and ( u , V ) are t h e v e l o c i t y components i n
t h e undis turbed medium. The reason f o r proving t h i s well-known r e s u l t is
t o po in t ou t which f e a t u r e s of t h e model are e s s e n t i a l i n a r r i v i n g a t i t
and which are not .
During a given s m a l l t i m e i n t e r v a l 6t t h e s m a l l deformation due t o t h e
undis turbed v e l o c i t y f i e l d may be reagrded as tak ing p l ace i n t w o success ive
s t ages :
followed by (2) a s m a l l r o t a t i o n without f u r t h e r d i s t o r t i o n through an angle
(1) a s m a l l deformation wi th t h e p r i n c i p a l axes not r o t a t i n g ,
38

When t h e i n c l u s i o n i s p resen t i t does not r o t a t e during s t a g e 1, by symmetry.
During s t a g e 2 , i t r o t a t e s through t h e same angle as t h e res t of t h e system,
namely, 68.
an ang le 69 i n t i m e Bt. So t h e f i n a l r e s u l t is t h a t t he inc lus ion has r o t a t e d through
I ts angular v e l o c i t y w is then
as w e wished t o prove.
I n o r d e r t h a t no r o t a t i o n should take place during s t a g e 1, i t appears
t o b e necessary t h a t t h e undis turbed medium should no t only be deforming
homogeneously, bu t t h a t i ts mechanical p r o p e r t i e s e i t h e r should b e i s o t r o p i c
o r should conform t o t h e ( instantaneous) symmetry of t h e p r i n c i p a l s t r a i n s ;
t h a t is , thley should have two perpendicular r e f l e x i o n l i n e s a l igned wi th t h e
p r i n c i p a l s t r a i n d i r e c t i o n s .
symmetry i n t h e form of t h e proof given above.
po in t of v i e w of modeling sea- ice , t o note t h a t nothing need b e assumed i n
t h e proof about t h e rheology of t h e medium (viscous, p l a s t i c , e t c . ) except
t h i s po in t about t h e symmetry of t h e mechanical p rope r t i e s .
I f t h i s w e r e not s o w e could not argue by
It is important , from t h e
The proof a l s o shows t h a t t h e shape of t h e inc lus ion does no t have t o
be c i r c u l a r f o r (1) t o hold. It i s s u f f i c i e n t t h a t t h e i n c l u s i o n should
have t h e symmetry of t h e ins tan taneous p r i n c i p a l s t r a i n - r a t e s . For example,
i n s imple shear i t could be an e l l i p s e wi th axes a t 45" t o t h e d i r e c t i o n of
shear ing. But f o r an e l l i p s e i n any o the r o r i e n t a t i o n (1) would not hold.
I f t he undisturbed s t r a i n r a t e f i e l d i s inhomogeneous, w e can now see
roughly what t h e condi t ion is t h a t 0) should equal ha l f t h e v o r t i c i t y of t he
undis turbed medium as measured a t t h e cen te r of t he inc lus ion . The inc lus ion
d i s t u r b s t h e v e l o c i t y f i e l d by producing a secondary flow system, ou t t o a
r ad ius of order P, say. I n order f o r (1) t o hold exac t ly , t he undis turbed
flow must be homogeneous ou t t o t h i s r ad ius . So when t h e undisturbed flow
is inhomogeneous, provided i t does not vary much over a d i s t a n c e 2 r , we m a y
expect (1) t o be a good approximation. In t h e same way, t h e r e must n n t b c
a boundary wi th in a d i s t a n c e of order r, o r , i f there is , i t must conform
t o the symmetry of the instantaneous p r i n c i p a l s t r a i n - r a t e s .
I n t h i s model w e are th inking of t h e i c e f l o e on which t h e c e n t r a l
s t a t i o n is placed as a r i g i d body and we are modeling all t he o the r f l c t s
39

as a continuous medium.
ous medium, t h e continuum s t r a i n - r a t e thus r e s u l t i n g must b e e s s e n t i a l l y
uniform over one f l o e diameter , and one would a l s o expect i t t o vary only
s l i g h t l y over t h e d i s t a n c e 2P (which is presumably a few f l o e d iameters ) .
I f t h e ice pack can be modeled a t a l l as a continu-
Therefore , w e do no t expect inhomogeneity of t h e s t r a i n - r a t e f i e l d s e r i o u s l y
t o upse t equat ion 1.
and t h e a n i s o t r o p i c mechanical p r o p e r t i e s of t h e surrounding pack may w e l l
do so.
However, t h e non-circular shape of t h e c e n t r a l f l o e
F i n a l l y , i f w e no longer model t h e surrounding f l o e s as a continuous
medium, b u t pay a t t e n t i o n t o t h e i r d i s c r e t e na tu re , w e must expect depa r tu re s
from (1) even i f t h e c e n t r a l f l o e w e r e c i r c u l a r , because of t h e random n a t u r e
of i t s con tac t s wi th its neighbors.
111. THE DEFINITION OF ROTATION OF A DRIFTING ICE FLOE
The previous no te r e f e r r e d t o t h e problem of t h e rate of r o t a t i o n of
a d r i f t i n g ice f l o e . I f t h e
i d e a of an angle of r o t a t i o n is used (e .g . , Hib ler e t a l . [1973], p. 108) ,
one is l e d t o a sk how i t should b e def ined. For example, i f t h e long i tude
of t h e ice f l o e changes, should t h i s be regarded as con t r ibu t ing t o its
r o t a t i o n o r not? The fol lowing a n a l y s i s shows t h a t t h e p r o p e r t i e s of a
s p h e r i c a l s u r f a c e i n f a c t make i t impossible t o d e f i n e t h e ang le of r o t a t i o n
of a d r i f t i n g ice f l o e i n a completely s a t i s f a c t o r y way.
The anEle of r o t a t i o n is a d i f f e r e n t matter.
The r o t a t i o n of t h e Ear th is no t r e l e v a n t t o t h e problem; so w e s h a l l
assume a non-rotat ing Earth. I f t h e ice f l o e is thought of as a r i g i d body
i n t h r e e dimensions i t s angular v e l o c i t y has , i n genera l , t h r e e components.
The r a d i a l ( v e r t i c a l ) component is t h e one of primary i n t e r e s t , bu t because
of d r i f t t h e r e are a l s o components of angular v e l o c i t y about t h e two hor i -
zon ta l axes. L e t u s c a l l t h e r a d i a l component t h e s p i n S. S is ha l f t h e
r a d i a l component of c u r l 2; t h a t i s ,
' S = +nr c u r l - v ;
where n t i o n and t i m e , is t h e v e l o c i t y of t h e i c e f l o e .
is a u n i t vec to r i n t h e r a d i a l d i r e c t i o n and 2, a func t ion of posi- -r
40

Take s p h e r i c a l po la r coord ina tes (T, 0 , A) based on t h e geographical
North Pole, w i th 8 the long i tude ( p o s i t i v e eastward) and A t h e l a t i t u d e .
components of v are (V
The
Ve, uA) . r' Then [Hildebrand, 19621
As a good approximation
We should l i k e t o
assume t h e Ear th t o b e s p h e r i c a l w i th r a d i u s R. Then
tanA 2R + - v e . 1 - --
2~ ax i n t e r p r e t t h i s equat ion i n terms of ( d e / & ) , , t h e
rate of change of l ong i tude of a po in t P on t h e ice f l o e , and dB/dt, t h e
rate of change of bea r ing t o t r u e North of a r e f e r e n c e l i n e drawn on t h e ice
f l o e through P .
t h e ice f l o e as made up of t h r e e p a r t s (in a small t i m e i n t e r v a l each p a r t
g ives small displacements which add v e c t o r i a l l y ) . I n motion 1 t h e long i tude
of P changes a t t h e rate (deidt),, bu t dB/dt = 0. I n motion 2 t h e l a t i t u d e
of P changes a t t h e rate (d l ld t ) , , bu t & / d t = 0. I n motion 3 t h e r e is no
change i n t h e l a t i t u d e or long i tude of P, bu t dB/d t has a non-zero va lue .
For t h i s purpose, cons ider a gene ra l r o t a t i o n and d r i f t of
For each of t h e s e r i g i d body motions t h e r e is a f i e l d of v e l o c i t y (ve, vx) around P . The f i e l d f o r motion 1 is s t r a igh t fo rward , namely,
de d t P V~ = R(-) COS^, vx 0 .
Thus, a t P ,
de - = - R (-) sinAp. ax d t P
Accordingly, from (1) , S a t P is
sP = - ( l & ) sinXp + - ( I g g ) sinXp = ( z ) ~ de sin$. 2 dt P 2 dt P
41

The f i e l d f o r motion 2 is much less obvious, bu t t o f i n d S from P equat ion 1 w e need only p ick ou t t h e zero-order t e r m i n ZY ( t h a t is, i ts
va lue a t P i t s e l f ) and t h e zero-order terms i n a V X / a e and aVe/3h .
a l l zero.
e These are
So Sp = 0. For motion 3 we have, a t P ,
SO, from (11,
- 1 d B 1 dB dB - -- = - - sP - - - - 2 d t 2 d t d t
For t h e complete motion, adding t h e s p i n s f o r motions 1, 2, and 3 , w e
have
de P' + ( z ) ~ sinX - dB sp - - - d t
The nega t ive s i g n before dB/d t arises because a clockwise r o t a t i o n outwards
i n t h e r a d i a l d i r e c t i o n is an an t ic lockwise r o t a t i o n seen looking downwards,
and thus g ives a decreas ing bear ing. The second t e r m on t h e right-hand s i d e
i s t h e longi tude c o r r e c t i o n t o b e appl ied t o -dB/dt t o o b t a i n t h e s p i n of t h e
f l o e .
It is i n t e r e s t i n g t o n o t i c e t h a t t h e longi tude c o r r e c t i o n is not simply
t h e l a s t t e r m i n equat ion 1: i t is twice as g r e a t . This is because motion 1
g ives not only a term i n t, b u t an equal ly l a r g e term i n a U e / a h . 0
The form of equat ion 2 shows t h a t S p d t is no t a p e r f e c t d i f f e r e n t i a l
and t h e r e f o r e t h a t j S p d t along a gene ra l pa th cannot n e c e s s a r i l y be i n t e r -
p re ted as an ang le of r o t a t i o n . For example, i f t h e f l o e followed a closed
pa th and re turned t o i t s s t a r t i n g po in t i n t h e same o r i e n t a t i o n t h a t i t had
t o begin wi th , t h e i n t e g r a l would neve r the l e s s be non-zero and one would be
forced t o say t h a t t h e f l o e had r o t a t e d . A l t e r n a t i v e l y , t h e f l o e could
fol low a
t h e t o t a l ang le of r o t a t i o n w a s zero, and y e t t h e f l o e would r e t u r n t o its
s t a r t i n g p o i n t w i th a d i f f e r e n t o r i e n t a t i o n .
a motion along a l i n e of longi tude from t h e North Po le t o t h e Equator, a long
t h e Equator f o r a c e r t a i n d i s t ance , and then back t o t h e North Pole , fol lowing
closed pa th wi th Sp always zero, so t h a t one would have t o s a y
An example of t h i s would be
42

another l i n e of longi tude , on each l e g the bear ing B being kept cons tan t
( say , zero) .
be a d i f f e r e n t o r i e n t a t i o n .
because on each l e g e i t h e r (de/&), is zero o r s inhp is zero.
On r e t u r n t o t h e North Po le it can be seen t h a t t h e f l o e w i l l
But equat ian 2 shows t h a t Sp is always zero,
However one tries t o do i t , i t is not p o s s i b l e t o de f ine an angle of
r o t a t i o n of a d r i f t i n g i c e f l o e which has t h e property t h a t i t has a s i n g l e
continuous non-singular va lue everywhere on t h e s u r f a c e of t h e Earth. This
would r e q u i r e one t o spec i fy a r e fe rence azimuth a t each po in t on t h e Ea r th ' s
su r f ace , wi th neighboring r e fe rence azimuths l o c a l l y p a r a l l e l . The problem
is equiva len t t o t r y i n g t o comb a h a i r y sphere. It cannot be done without
in t roducing a t least one s i n g u l a r po in t ( a t which azimuth becomes inde ter -
minate) ; f o r example, t h e crown of t h e head. ( I n t h e theory of l i q u i d
c r y s t a l s such po in t s [ l i n e s ] are c a l l e d d i s c l i n a t i o n s . Their s t r e n g t h need
not be 2n.) in t roduce two such p o i n t s ( t h e two poles ) .
I f such an azimuth system is set up, i t may be used q u i t e c o n s i s t e n t l y
Our coord ina te system of l a t i t u d e and longi tude happens t o
t o d e f i n e a single-valued angle of r o t a t i o n , provided t h e pa ths concerned
never e n c i r c l e t he s i n g u l a r i t y . Otherwise t h e angle is inde termina te t o
wi th in IT (or o the r va lue depending on t h e s t r e n g t h of t h e s i n g u l a r i t y ) .
. Thus, ang le to t r u e North is a cons i s t en t single-valued measure unless one
e n c i r c l e s t h e North (or South) Pole. It is a p i t y t h a t one of t h e s i n g u l a r i t i e s
i n our geographical coord ina te system happens t o l i e c l o s e t o o r i n t h e reg ion
of t h e AIDJEX experiment.
an a r b i t r a r y azimuth system covering t h e area of i n t e r e s t t h a t d id not have
i t s s i n g u l a r i t y (o r s i n g u l a r i t i e s ) w i th in t h e area. However, t h e rate of
change of angle of a f l o e measured r e l a t i v e t o t h i s azimuth system can never,
f o r a genera l motion, be t h e r a d i a l component of S c u r l - v .
It would avoid unnecessary complication t o set up
The o the r horn of t h e dilemma is t h e one j u s t mentioned--that, i f t h e
rate of change of angle is taken t o be given by t h e r a d i a l component of
% c u r l 2, t h e change of t h e ang le i n ques t ion is not a p e r f e c t d i f f e r e n t i a l ,
and so has t h e inconvenient property t h a t , i f t h e f l o e r e t u r n s t o its
s t a r t i n g po in t i n t h e same o r i e n t a t i o n , i ts angle has neve r the l e s s changed.
4 3

REFERENCES
Barnes, J. C., and C. J. Bowley. 1973. U s e of ERTS d a t a f o r mapping arct ic Type I1 Report f o r Per iod January-June 1973. sea i c e .
H ib le r , W. D. , W. F. Weeks, A. Kovacs, and S. F. Ackley. S p a t i a l and temporal v a r i a t i o n s i n mesoscale s t r a i n i n sea ice. NO. 21, 79-113.
AIDJEX Bulletin
Hildebrand, F. B. 1962. Advanced CaZcuZus for Applications. Englewood C l i f f s , N.J . : P r e n t i c e H a l l , 305.
44

A RELATION BETWEEN THE POTENTIAL ENERGY PRODUCED BY RIDGING AND THE MECH'ANICAL WORK REQUIRED TO DEFORM PACK I C E
D. A. Rothrock AIDJEX
ABSTRACT
The rate of production of p o t e n t i a l energy by mechanical processes t h a t change t h e th ickness d i s t r i b u t i o n of t h e i c e provides a u s e f u l lower bound f o r t h e rate of work by t h e two- dimensional stress i n pack i c e .
There have been many hypotheses f o r a mechanical c o n s t i t u t i v e equat ion
which relates stress t o s t r a i n o r s t r a i n rate i n pack i c e i n some average
sense over areas t h a t inc lude many i c e f l o e s and many cracks o r l eads .
However, no set of d a t a e x i s t s t h a t is s u f f i c i e n t l y thorough t o a l low a
s a t i s f a c t o r y test of t h e var ious hypotheses. An area of i n v e s t i g a t i o n t h a t
is he lp ing to provide s u f f i c i e n t knowledge on which t o judge these hypotheses
is t h e s tudy of t h e small-scale mechanisms s u c h a s r a f t i n g , r i dg ing , shear ing
along l eads , and t h e breaking up of f l o e s , which toge ther produce large-
s c a l e deformation.
O f p a r t i c u l a r i n t e r e s t h e r e i s t h e one-dimensional r i dg ing model of
Parmerter and Coon [1973].
formation arid concluded t h a t , t o a rough approximation, p o t e n t i a l energy i s
t h e dominant energy s ink .
a c t i n g i n t h e h o r i z o n t a l d i r e c t i o n t o t h e c r e a t i o n of p o t e n t i a l energy i n
t h e r idge , they deduced a s t ress-displacement r e l a t i o n . This r e l a t i o n w a s
a t once t a n t a l i z i n g and f r u s t r a t i n g . It suggested t h a t t h e ice could be
modeled as (a p l a s t i c material, as suggested by Coon [1972], wi th a y i e l d
stress equal t o what w e might c a l l t h e r idg ing stress of Parmerter and Coon's
model.
They examined t h e ene rge t i c s of p re s su re r i d g e
By equat ing t h e work performed by t h e stress
But t h e r idg ing model p r e d i c t s t h e stress assoc ia t ed wi th a r idg ing
45

process of a p a r t i c u l a r geometry--say, ice of 50 cm r idg ing a g a i n s t 2 m i ce
t o form a r i d g e 7 m th i ck . I n an a c t u a l l a rge - sca l e area of pack ice , many
d i f f e r e n t th icknesses of i c e may r i d g e s imultaneously. It has n o t been
clear how t o deduce t h e n e t stress as soc ia t ed wi th t h e simultaneous r idg ing
of t h e s e many th icknesses of ice. Nei ther has i t been clear how t h e one-
dimensional case should be genera l ized t o two dimensions.
More r e c e n t l y , Thorndike and Maykut [1973] introduced t h e th i ckness
d i s t r i b u t i o n , which records t h e r e l a t i v e amounts of i c e of a l l th icknesses
i n a l a r g e area (say , 100 km square) . The balance equat ion f o r t h i s d i s t r i b u -
t i o n inc ludes a term, c a l l e d t h e r e d i s t r i b u t i o n func t ion , t h a t accounts f o r
t h e changes i n ice th ickness caused by rd ig ing and o t h e r mechanical processes .
Thus, t h e r e d i s t r i b u t i o n func t ion parameter izes t h e same process from which
Parmerter and Coon c a l c u l a t e d p o t e n t i a l energy and then predic ted stress;
however, t h e r e d i s t r i b u t i o n func t ion parameter izes a22 processes , no t j u s t
a p a r t i c u l a r one.
I n t h i s no te , w e d e r i v e a formal r e l a t i o n between t h e p l a s t i c work and
t h e i n c r e a s e of p o t e n t i a l energy due t o a l l r idg ing processes represented
by t h e r e d i s t r i b u t i o n func t ion .
f o r f l o a t i n g ice. Then, i n t h e equat ion f o r changes i n p o t e n t i a l energy,
w e i d e n t i f y t h e t e r m r ep resen t ing changes caused by t h e r e d i s t r i b u t i o n
func t ion . We then assert t h a t t h e mechanical o rk by t h e ice stress must be
no less than t h i s mechanical rate of product ion of p o t e n t i a l energy.
To do t h i s , w e f i r s t d e f i n e p o t e n t i a l energy
Since t h e r e d i s t r i b u t i o n func t ion can depend i n genera l on two-
dimensional s t r a i n rates, t h e ex tens ion t o t h e two-dimensional case is
included without f u r t h e r de r iva t ion .
P o t e n t i a l Enerr&y
We d e f i n e p o t e n t i a l energy r e l a t i v e t o t h e sea su r face . Suppose a
2’ block of ice l ies i n t h e sea s u r f a c e wi th a d r a f t h, and a freeboard h giv ing a t o t a l th ickness h = h, + h2 . I f z is t h e v e r t i c a l coord ina te
measured as p o s i t i v e upward from t h e sea su r face , t h e p o t e n t i a l energy of
t h e ice per u n i t area is def ined as
46

'ice :3 J 'ice $ z dz = % pice ; (hu' - h t 2 )
where $ is t h e a c c e l e r a t i o n of g r a v i t y , and t h e dens i ty of ice pice is
assumed cons tan t .
area is equal t o t h e p o t e n t i a l energy of t h e water i n i ts d isp laced state
(zero) less the p o t e n t i a l energy of i ts undisplaced state; thus , w e have
The p o t e n t i a l energy Pw of t h e d isp laced water pe r u n i t
8
r O P = - I * pw g z d z = + $pw$ht 2
W
where t h e dens i ty of d i sp laced water Pw i s assumed cons tan t .
energy of t he ice-water system per u n i t area is equal t o t h e sum of t h e
energy of t h e i c e and t h e energy requi red t o d i s p l a c e t h e water
The p o t e n t i a l
P = Pice - P = %Piceghu ,. + $ A p G h Z 2 W
- ' ice' where Ap = pw
P can be w r i t t e n as t h e sum of an i s o s t a t i c term and a t e r m involving
the depar ture from i s o s t a s y
h
where p is p
w e r e l o c a l l y i s o s t a t i c .
wi th more information about t h e ice than is contained i n the th ickness
d i s t r i b u t i o n , , and w e w i l l neg lec t t h i s t e r m i n what follows.
r a t i o of t h e non- i sos t a t i c energy t o t h e i s o s t a t i c energy
Ap/p , and hpice/Pw is t h e va lue ht would have if t h e ice i c e The depar ture from i s o s t a s y can be r e t a ined only
However, t h e
is no t necessa r i ly s m a l l , because of t h e small f a c t o r Ap i n t h e denominator.
I f t h e ice w e r e 20% ou t of i s o s t a t i c balance, f o r example, t h i s r a t i o would
be about 0.4.
47

W e w i l l d i g r e s s b r i e f l y t o examine t h e p a r t i t i o n of p o t e n t i a l energy,
and t o see t h a t t h e bu i ld ing of a r i d g e r e q u i r e s energy no t so much t o p i l e
up ice, as t o d i s p l a c e water as i t " p i l e s down" ice.
hZ and hU are equal t o hPice/Pw and hAp/pw. Then, P
(-Pice ice w t h a t f o r every u n i t of p o t e n t i a l energy P of t h e f l o a t i n g ice system, t h e
i ce i t s e l f has a p o t e n t i a l energy P of -8 u n i t s , i t s cen te r of m a s s being
w e l l below t h e water su r face , and t h e d isp laced water has a p o t e n t i a l energy
Pw of +9 u n i t s .
equa t ion 1 is i d e n t i f i e d as t h e energy P s t o r e d i n t h e i ce above t h e water
su r face , and t h e second term as t h e energy PI requi red t o submerge t h e
remainder of t h e ice .
(0.9).
f a i r l y small:
underwater po r t ion of t h e ice. This energy of t h e underwater i ce is s t i l l
given by t h e d i f f e r e n c e of two l a r g e terms:
t h e w a t e r and t h e energy obtained by lowering t h e ice i n t o i t s submerged
p o s i t ion.
I n t h e i s o s t a t i c case,
/P is equal t o ice +Ap)/Ap, and Pw/P equals Pice/Ap. Taking p /P t o be 0.9, w e see
ice
I n another view, t h e f i r s t t e r m on t h e right-hand s i d e of
U
Pu/P and Pz/P are equal t o Ap/pw (0.1) and pice/pw
Thus, t h e p o t e n t i a l energy of t h e above-water po r t ion of t h e i ce i s
most of t h e p o t e n t i a l energy is produced by f o r c i n g down t h e
t h e energy r equ i r ed t o d i s p l a c e
A macroscale area of sea ice, wi th its many ice th icknesses , has a
p o t e n t i a l energy per u n i t area of
where g(h)dh is t h e f r a c t i o n of area covered by ice of th ickness between
h and h + dh.
'
Chanpes i n P o t e n t i a l Energy
The changes i n P t h a t are of i n t e r e s t involve changes i n g ( h , s , t ) , which are governed by t h e equat ion
where d i v and t h e ice v e l o c i t y 2 are two-dimensional, f is t h e rate of change
48

of h by thermodynamic processes , and $ is t h e mechanical r e d i s t r i b u t i o n
func t ion s a t i s f y i n g
t h a t considered by Thorndike and Maykut [1973].
are t h e p re sen t g and 9 .
03
h $ d h = 0 . This equat ion is t h e h-der ivat ive of 0
Thei r aG/ah and a?J/ah *dive
I f 8 and $ are no t func t ions of space
f o r P is m
- - a p -. - div(v P ) - 1 P & ( f g ) d h a t .., 0
Each t e r m on. t h e right-hand s i d e r ep resen t s a
o r t iye t, t h e ba lance equat ion
03
+ I P $ d h 0
p a r t i c u l a r e f f e c t . The f i r s t
t e r m is t h e divergence of t h e P-flux and r ep resen t s t h e n e t e f f e c t of
exchanges ac ross t h e boundary of a n elementary (macroscale) reg ion of
material wi th d i f f e r e n t p o t e n t i a l energy. The second t e r m desc r ibes t h e
rate of change of p o t e n t i a l energy caused by mel t ing o r f r eez ing of ice--
a pure ly thermodynamic source.
p o t e n t i a l energy by mechanical processes t h a t p i l e up t h i n ice i n t o th i ck
The last t e r m r e p r e s e n t s changes of t h e
ice. It i s t h i s term which w e w i l l relate t o work by t h e mechanical stress.
Work Done by t h e Ice
I f t h e stress Oij ( fo rce per u n i t l ength) and t h e s t r a i n ra te E are ij assumed t o he def ined i n a two-dimensional model of sea ice, 0 ij rate of work by t h e stress.
mechanisms t:hat w e b e l i e v e are re spons ib l e f o r absorbing it.
is t h e
We would l i k e t o relate t h i s work t o small-scale
Ridging is t h e most v i s i b l e mechanism, and t h e only one about which
w e have any q u a n t i t a t i v e i n s i g h t . Parmerter and Coon [19731 have s tud ied
a one-dimensional model of t h i s process i n d e t a i l . I n p a r t i c u l a r , they have
considered t:he absorp t ion of energy by f r a c t u r e and f r i c t i o n and t h e t rans-
formation of energy i n t o p o t e n t i a l energy.
(10 cm) p o t e n t i a l energy formation dominates o the r s inks .
(50 cm), f r i c t i o n a l d i s s i p a t i o n becomes s i g n i f i c a n t . They assert t h a t
e las t ic energy of deformation and t h e product ion of s u r f a c e energy by f rac-
t u r e are n e g l i g i b l e .
They show t h a t f o r t h i n ice
For t h i c k e r ice
49
Parmerter and Coon's study is of one-dimensional ridging.
two-dimensional deformation of pack ice involves additional processes:
frictional dissipation and cnmbling (creating surface energy) associated with
shearing along boundaries of adjacent ice floes, and fracture of floes. If elastic energy of deformation is neglected, the rate of performance of
A general
mechanical work OijEij can be equated to the sum of the known energy sinks:
mechanical production of potential energy, frictional dissipation, and
dissipation by%fracturing.
energy, but not provide it, the relation
Since friction and fracture can absorb mechanical
must hold. The amount of energy dissipated by fracture and friction in two-
dimensional deformations is not known. If, however, the production of poten-
tial energy is assumed to be dominant, then the equality can be assumed in
(2)
This relation is useful, but it does not help us obtain either (3 or
$. What it does is guide our choice of one of these quantities if we think we know the other.
Rothrock [1974, in this Bulletin] and by Coon et al. (work in progress, to
appear in Bulletin 24 or 25).
ij
The choice of Oij and J, is discussed in detail by
The stress 0 is equal to the total stress on the ice less the hydro- ij static load, and can be considered to be contact stress. The gradient of Oij should be used in a momentum equation in which the gradient of the hydro-
static load does not appear--one of two possible formulations considered by
Nye [1973]. The hydrostatic load is precisely accounted for, in this formu-
lation, by the inclusion of the potential energy of displaced water in the definition of P .
CONCLUSIONS
A theory of pack ice that predicts ice thickness distribution and the
mechanical work should satisfy the energetic inequality stated in (2).
50

If pressure ridging is the energetically dominant process in a general two-
dimensional deformation of pack ice, the assumption of the equality in (2)
will be approximately valid.
remains reasonable when shearing mechanisms of deformation are considered.
We must yet determine whether this assumption
A more formal derivation of a two-dimensional model from the three- s
dimensional problem is needed t o clarify the definition of stress, the
proper momentum equation, and the complete energy equation.
REFERENCES
Coon, M. D. 1972. Mechanical behavior of compacted arctic ice floes. Offshore Technology Conference, Houston, Texas, 1-3 May 1972. Paper No. OTC 1684. American Institute of Metallurgical, Mining, and Petroleum Engineers.
Nye, J. F. 1973. The physical meaning of two-dimensional stresses in a floating ice cover, AIDJEX Bulletin No. 19, 59-112.
Parmerter, R. R.,and M. D. Coon. 1973. Mechanical models of ridging in the arctic sea ice cover. AIDJEX Bul le t in No. 21, 31-48.
Rothrock, D. A. 1974. Redistribution functions and their yield surfaces in a plastic theory of pack ice deformation. (In this Bulletin.)
Thorndike, A. S., and G. A. Maykut. 1973. On the thickness distribution of sea ice. AIDJEX Bulletin No. 21, 31-48.
51

REDISTRIBUTION FUNCTIONS AND THEIR YIELD SURFACES IN A PLASTIC THEORY OF PACK ICE DEFORMATION
by D. A. Rothrock
AIDJEX
ABSTRACT
A l a rge-sca le area of pack i c e conta ins i ce of va r ious th icknesses from zero t o many meters. A s t he pack ice deforms, t h i n i ce i s r idged i n t o t h i c k e r ice , i n a way t h a t depends on t h e s t r a i n rate and t h e ins tan taneous th ickness d i s t r i b u t i o n . We assume t h a t t h e ra te of t h i s process i s p ropor t iona l t o t h e rate of deformation, and t h a t f i xed propor t ions by area of t h e t h i n n e r i ce are r idged i n t o ice of known th icknesses . The amount of t h i s r i dg ing , a,, i s assumed t o depend on 8 , t h e angle whose tangent i s t h e r a t i o of t h e shear ing rate t o the divergence rate. The p o t e n t i a l energy requi red t o perform t h i s r idg ing i s equated t o the p l a s t i c work performed by t h e h o r i z o n t a l ice stress. W e suppose t h a t t h e ice behaves p l a s t i c a l l y . For stresses i n s i d e a y i e l d su r face , t h e ice i s r i g i d . t h e r u l e t h a t t h e s t r a i n rate t enso r i s normal t o t h e y i e l d s u r f a c e i n stress space. The shape of t h e y i e l d su r face is uniquely r e l a t e d t o t h e func t ion a (e ) . s u r f a c e depends on t h e th ickness d i s t r i b u t i o n .
S t r e s s e s on t h e y i e l d su r face cause t h e ice t o flow by
The s i z e of t h e y i e l d r
1. INTRODUCTION
Pack ice considered as a two-dimensional h o r i z o n t a l continuum on
scales of 100 km has been modeled as a viscous material [Campbell, 19651,
an incompressible , i n v i s c i d f l u i d [Rothrock, 19731, and a c a v i t a t i n g f l u i d
[Nikiforov e t a l . , 1967; Doronin, 19701. The f i r s t theory of pack ice as
a p l a s t i c material w a s presented by Coon [1972], who l ikened t h e i c e i n
shea r t o a g ranu la r material.
Coon proposed two c o n t r o l l i n g mechanisms: breaking of p i eces i n bending by
r a f t i n g o r r idg ing , and t h e buckl ing of t hese p ieces under t h e h o r i z o n t a l
load. Calculated from these mechanisms, p* depended on t h e th ickness of
To c a l c u l a t e a maximum compressive load p * ,
53

ice involved. Thus, Coon presented a family of y i e l d su r faces f o r d i f f e r e n t
ice th icknesses .
I n a c l o s e r examination of p re s su re r idg ing , Parmerter and Coon [1973]
developed a kinematic model i n which they r e t a ined Coon's [1972] mechanism
of breaking i n bending. The buckl ing w a s no t modeled; i n f a c t , no stresses
i n t h e h o r i z o n t a l p lane were considered e x p l i c i t l y . They deduced t h e hor i -
zon ta l stress by equat ing t h e work of t h i s stress t o t h e i n c r e a s e i n p o t e n t i a l
energy i n t h e r idge . A s i n Coon's [1972] theory , thi's stress depended on
t h e p a r t i c u l a r t h i ckness of i ce being r idged , a l though i n a more complicated
way.
t o parameter ize real pack ice i n which ice of many th icknesses r i d g e s
s imultaneously.
It w a s obviously d e s i r a b l e t o gene ra l i ze Parmerter and Coon's stress
Thorndike and Maykut [1973] t h e n introduced t h e governing equat ion
f o r t h e th ickness d i s t r i b u t i o n . This equat ion inc ludes a t e r m , t h e r e d i s t r i -
bu t ion func t ion , t h a t r ep resen t s t h e e f f e c t on t h e th ickness d i s t r i b u t i o n of
t h e same mechanical processes of r a f t i n g and r idg ing whose mechanics w a s
modeled by Coon and by Parmerter and Coon.
func t ion can r ep resen t t h e s e processes occurr ing s imultaneously i n ice of
- a l l th icknesses .
However, t h e r e d i s t r i b u t i o n
Rothrock [1974] extended Parmerter and Coon's energy r e l a t i o n t o t h e
case i n which ice of many th icknesses r i d g e s s imultaneously, by r e l a t i n g
t h e p l a s t i c work t o t h e r e d i s t r i b u t i o n func t ion . We w i l l u se t h i s r e l a t i o n
he re , assuming t h a t t h e p l a s t i c work equals t h e product ion of p o t e n t i a l
energy i n r idges,and thus neg lec t ing o the r energy s inks . Parmerter and
Coon showed t h a t t h i s approximation is good when t h i n ice (20 cm) r i d g e s ,
bu t poor when t h i c k i c e (100 cm) r idges , because f r i c t i o n a l l o s s e s become
s i g n i f i c a n t . I n two-dimensional deformations, t h e energy l o s s e s a s soc ia t ed
wi th shear ing along cracks might no t be n e g l i g i b l e .
The y i e l d s u r f a c e s and r e d i s t r i b u t i o n func t ionspresented i n t h i s
paper s a t i s f y t h i s energy r e l a t i o n .
t h e y i e l d s u r f a c e and t h e r e d i s t r i b u t i o n func t ion are removed when t h e two
are r e l a t e d t o each o the r . I n s e c t i o n 2 , w e examine t h e form of t h e r e d i s t r i -
Many of our u n c e r t a i n t i e s about both
bu t ion func t ion i n some d e t a i l . W e hypothesize t h a t f o r any r e l a t i v e amount
54

of divergence and shear ing , Q can be cons t ruc ted from two modes:
occurs i n pure divergence, and t h e o the r t h a t occurs i n pure convergence.
It is shown t h a t t h i s cons t ruc t ion al lows a l l t h e freedom needed f o r Q t o
s a t i s f y our i n t u i t i v e requirements.
one t h a t
There are t h r e e unspec i f ied scalar func t ions of scalar v a r i a b l e s i n
t h e proposed form of Q. maximum compressive stress p * , t h a t is, t h e s i z e of t h e y i e l d su r face . The
o the r i s ’un ique ly r e l a t e d t o t h e shape of t h e y i e l d su r face . I n s e c t i o n 3 ,
w e show several examples of y i e l d s u r f a c e s ( t h e circle, t h e ice cream cone,
t h e diamond, and t h e box) and t h e i r a s soc ia t ed r e d i s t r i b u t i o n func t ions .
The impl i ca t ion of corners , s t r a i g h t l i n e segments, and o the r f e a t u r e s of
t h e y i e l d s u r f a c e f o r t h e form of Q are examined.
Two of them are r e l a t e d t o t h e magnitude of t h e
2. FORM OF THE REDISTRIBUTION FUNCTION
Suppose t h e f r a c t i o n of an area covered by ice s t r i c t l y t h i c k e r than
h b u t no t h i c k e r than h + dh is g(h)dh . g (h , s , t ) must s a t i s f y t h e ba lance equat ion
Then, t h e th ickness d i s t r i b u t i o n
where t i s t i m e , and d i v , 2, and are t h e divergence, v e l o c i t y , and p o s i t i o n
i n t h e two h o r i z o n t a l dimensions.
a c c r e t i o n ( d h l d t ) by thermodynamic processes and i s considered t o be a given
e x t e r n a l parameter. The r e d i s t r i b u t i o n func t ion , Q ( h , g , t ) , r e p r e s e n t s
changes i n open water and t ransformat ions from ice of one . th ickness t o ice
of another by mechanical processes such as r a f t i n g and r idg ing .
f i n i t e f r a c t i o n of area g ( h ) d h i s covered by ice of a s i n g l e th ickness
(dh is ze ro ) , g ( h ) is i n f i n i t e l y l a r g e , as suggested i n F igure 1.
and e s p e c i a l l y i n i d e a l i z e d examples, i t can be d e s i r a b l e t o work wi th G(h)
Z lOhg(h)dh. (Another example of g ( h ) and G(h) can be seen i n F igure 7 ,)
The quan t i ty f ( h , z , t ) is t h e rate of
When a
Therefore ,
I f we assume t o be independent of h , i n t e g r a t e equat ion 1 wi th
r e s p e c t t o h from 0 t o h , and denote I Q(h)dh by Y(h) , w e o b t a i n 0
- _ aG - - div(vG) a t ...
55

61 .
Fig. 1. g ( h ) and i ts i n t e g r a l G ( h )
h2
f o r an area one-third covered wi th wi th i ce about h , t h i c k , t h e remainder being about h2 t h i ck .
which d i f f e r s from t h e equat ion d iscussed by Thorndike and Maykut [1973]
i n two ways. F i r s t , t h e i r a G / a t is a Lagrangian d e r i v a t i v e and is equiva len t
h e r e t o a G / a t + g-YG. Second, whereas w e w i l l assume h e r e t h a t Y can depend
on divergence and t h e rate of shea r , they considered a s p e c i a l case i n which
Y! is w(h) d i v v . It seems easier t o th ink about g ( h ) , bu t t o s o l v e problems
f o r G(h) . 03
The t o t a l f r a c t i o n a l area I g(h )dh must be exac t ly un i ty , and s i n c e , 0
by d e f i n i t i o n , g(0 ) equals zero, and g ( h ) must tend t o zero as h tends t o
i n f i n i t y , equat ion 1 impl ies
This i s a s ta tement of area conservat ion. The n o t a t i o n w i l l b e convenient
later.
w e assume t h a t mechanical processes cannot create any volume (= jo hg(h)dh) . Thus, w e r e q u i r e
I Ignoring t h e inco rpora t ion of water i n t o voids c rea t ed by r idg ing ,
co
Our knowledge of $J is crude, being deduced from scan ty , q u a l i t a t i v e
observat ions. I n t h i s s e c t i o n , w e w i l l deduce a mathematical express ion
f o r I) t h a t is c o n s i s t e n t w i th t h e s e observa t ions . Suppose t h a t J, can be
I1 ' w r i t t e n as a func t ion of h , g ( h ' ) , 6 I which is a measure of t h e rate of shear and is def ined as 2-, where
( t h e rate of divergence) , and 6
56

E‘ is t h e s t r a i n rate dev ia to r .
and th ickness d i s t r i b u t i o n g ( h ’ ) , t h e r e is a unique va lue of $ corresponding
t o each va lue of h. We assume t h a t t h e m a t e r i a l is i s o t r o p i c , so t h a t $ is
independent of t h e o r i e n t a t i o n of t h e p r i n c i p a l axes of t h e s t r a i n r a t e
tensor .
That is, f o r any s t r a i n r a t e s t a t e
It w i l l be convenient t o consider t hese s t r a i n rate i n v a r i a n t s a s a
vec tor i n t h e ( 6 i )-plane shown i n Figure 2. The d i s t a n c e from t h e
o r i g i n 1i1 which equals ( k The angle 8 (= tan-’( i I I /kI)) between t h e vec tor and t h e i I -ax is is a
measure of t h e r e l a t i v e amounts of divergence and shear .
I’ I1 + iI12)%, is a measure of t h e rate of s t r a i n . I
&I I
I E
Fig. 2. The (kI, iII)-plane.
2.1 The r e d i s t r i b u t i o n func t ion II, i n pure divergence
I n pure divergence (0 = 0)’ i n t u i t i o n suggests t h a t no r idg ing occurs
but open water is crea ted . Hence, t h e r e d i s t r i b u t i o n func t ion is simply
= 6 ( h ) , f o r e = 0, (5)
where t h e opening mode 6(h ) is t h e Dirac d e l t a func t ion .
d e f i n i t i o n of g ( h ) , w e must t ake t h e d e l t a func t ion 6 ( h ) t o be i n f i n i t e not
a t h = 0 but a t h = O+.) This func t ion I/) t r i v i a l l y satisfies a rea and volume
conservation.
Maykut [1973].
(Because of t h e
This case is one of t h e examples given by Thorndike and
2.2 The r e d i s t r i b u t i o n func t ion II, i n pure convergence
I n pure convergence (e = IT), w e can w r i t e
q~ = 1 i 1 wr ( h ; g ) , f o r e = IT’
57

where t h e r idg ing mode wr i s a func t ion of h and a f u n c t i o n a l of g(h’ ) , ’ so t h a t Wr(h) depends no t only on g ( h ) bu t on g a t some o t h e r va lues h‘. The
s t r u c t u r e of wr i s less clear than w a s t h e s t r u c t u r e of t h e opening mode;
wr should be nega t ive f o r some th inne r ice and p o s i t i v e f o r some t h i c k e r
ice , as i n t h e two examples i n F igure 3.
Fig. 3. Two examples of t h e genera l form of t h e r idg ing mode wr ( h ) .
S u b s t i t u t i n g I) from (6 ) i n t o equat ions 3 and 4 success ive ly , w e f i n d t h a t
area and volume conserva t ion r e q u i r e
io wr(h)dh = -1
and
(7)
I n t h e example of
vr (h) would be
-2B(h - h,)
convergence w i t h r a f t i n g given by Thorndike and Maykut,
+ B(h - 2h,)
with h, = 10 cm, as represented by t h e dashed l i n e s i n F igure 3.
I n t h e remainder of s e c t i o n 2 .2 , w e w i l l cons ider i n d e t a i l t h e n a t u r e
of wr(h;g).
might p r o f i t a b l y presume wr t o b e given and t u r n t o s e c t i o n 2 . 3 .
The reader who p r e f e r s t o fo l low t h e primary l i n e of argument
58

To construct w ( h ) , one needs two pieces of information. First, if A r
ice of thickness h enters into a ridging process, it is converted into ice of thickness h. possibility that ice h is converted to a distribution of thicknesses h.) We suppose that a function h = h(h ) describing this conversion is available
from, say, the ridging model of Parmerter and Coon [1973]. Second, we must
know the thickness distribution a ( h ) for the area annihilated by ridging.
(To retain as much simplicity as possible, we ignore the A
A h
With a(h)., h (h ) and the principle of volume conservation, we can then
construct the thickness distribution n ( h ) for the area created by ridging.
Then, except for normalization by equation 7 , Wr(h) is the sum of -a(h) and n ( h ) , as shown in Figure 4 . The ridging mode can be viewed, then, as the sum of a number of events in which some area represented by the column on the left in Figure 4 is transformed by the rule h ( h ) -f h into an area represented by the other column in amounts proportional to the heights of the column.
A
t constant wr(h)
Fig. 4 . The ridging mode before normalization (solid curve). It is the difference between the area being created, n ( h ) , and the area being annihilated, a ( h ) .
We will first examine the distribution of ice being ridged, a ( h ) . Consider a uniaxial compressive strain.
strips, each of uniform thickness and aligned perpendicular to the direction
of straining, only the strip with the thinnest ice, say, h,, would need to ridge to allow the deformation. Then, a(h ) would be a delta function at this thickness, 6 ( h - h o ) . aligned parallel to the direction of straining, ice of all thicknesses
might have to ridge to allow the deformation. Then, a(h ) would equal g ( h ) .
In what follows we hypothesize that for real arrangements of ice, a(h ) lies
If all the ice were arranged in
If, on the other hand, the strips of ice were
59

between t h e s e two extremes. Thin ice r idges i n preference t o t h i c k ice;
however, t h e r e are p laces where t h i c k e r p i eces of i ce bea r on each o t h e r
d i r e c t l y and must r i d g e i f t h e deformation is t o occur.
To cons t ruc t a d i s t r i b u t i o n a ( h ) with t h i s proper ty , i t is h e l p f u l t o
t h i n k of t h e cumulative d i s t r i b u t i o n of t h e area (of t h i n ice) being
a n n i h i l a t e d
W e d e f i n e
a(h)dh = A ( a ) = 1 0
s o t h a t , i n analogy wi th g ( h ) , a ( h ) is p r e c i s e l y t h e ( h , h+dh)-fraction of
area a n n i h i l a t e d by r idg ing relative t o t h e t o t a l area ann ih i l a t ed .
t h a t t h e r e exists a u n i v e r s a l func t ion B ( G ) , as i n F igure 5, such t h a t
Suppose
A(h) f B ( G ( h ) ) . (11)
( B depends only on t h e va lue of G a t a s i n g l e va lue of h.)
c l e a r what t h e func t ion B ( G ) is, bu t w e would expect t h e r e t o be a va lue G*
such t h a t B ( G ) = 1 f o r G > G*, s o t h a t t h e t h i n n e s t G* of t h e i ce by area
provides ice f o r r idg ing . Furthermore, G* would be expected t o b e considerably
less than 1/2.
a t t h e o r i g i n , t h i s hypothesis reduces t o t h e s impler case i n which only t h e
t h i n n e s t ice can be r idged , and Ur(h) assumes t h e shape of t h e dashed curve
i n F igure 2. Regardless of t h e va lue of G*, B must equal 1 when G equals 1,
so t h a t (10) is s a t i s f i e d .
It is n o t a t a l l
I f G* is taken t o be zero so t h a t B ( G ) is j u s t a s t e p func t ion
Since a ( h ) i s aA(h)/ah, w e can d i f f e r e n t i a t e (11) t o o b t a i n
which shows t h a t t h e area of ice a n n i h i l a t e d is p ropor t iona l t o t h e area of
ice p resen t , g ( h ) , weighted by a f a c t o r dB/dG, which may i n c r e a s e o r decrease
wi th h. I f t h e curva ture of B ( G ) is negat ive , as i n F igure 4 , then dB/dG decreases wi th G and, t he re fo re , wi th h . It seems reasonable t o expect t h i s
60

1
B
0
I -
G?k
0 G" 1
G
_- 7 / 4 1 *
-- 0 - - ~ = h
Fig. 5. The universal function B(G). B(G(h)) is the cumulative thickness distribution of area being annihilated by ridging.
to be a property of B(G). from a maximum at G = 0 to zero at G = G* is
The simplest function B(G) for which dB/dG decreases
1 , G > G * c This function will be used in the examples that follow.
To illustrate distributions a ( h ) and A ( h ) that result for various
forms of G ( h ) , we will first consider the rather special case, illustrated in Figure 6 , in which the thinnest G* of the ice is all of the same thickness
h*. Then A ( h ) is a unit step function at h*, which we denote by H(h - h*) ,
and a ( h ) is a delta function of unit strength at h*.
that the $amount of open water is greater than G*, then no ice can be ridged, and convergence simply closes up open water.
If h* equals zero so
61

I n a more realist ic example, t h e r e might b e a uniform d i s t r i b u t i o n of
a l l i ce th icknesses less than h*, which is def ined by G(h*) = G*. The form
of G(h) f o r h > h* i n no way a f f e c t s A ( h ) . Using t h e B(G) i n (13), w e f i n d
and
c 0 , h > h *
Figure 7 i l l u s t r a t e s t hese d i s t r i b u t i o n s .
t h inne r than h* presen t , t h e amount of i c e a n n i h i l a t e d a ( h ) is a maximum
f o r h = 0 and decreases l i n e a r l y t o zero a t th ickness h*.
Thus, wi th equal amounts of i c e
1
GJc
0 0 h*
72
Gx" h"
0
-
0 h x"
h
Fig. 7 . A th ickness d i s t r i b u t i o n and t h e a s soc ia t ed a ( h ) and A ( h ) d i s t r i b u t i o n s .
Given a ( h ) , t h e th ickness d i s t r i b u t i o n of area a n n i h i l a t e d by r idg ing ,
w e wish now t o determine t h e th ickness d i s t r i b u t i o n n ( h ) of area c rea t ed by
r idg ing . volume of i ce c rea t ed , hn(h)dh, f o r each r idg ing process i n which t h i n
i c e of th ickness h is converted i n t o th i cke r i ce of th ickness h . w e have
h h h
The volume of ice i n t h e ann ih i l a t ed area, ha(h)dh, must equal t h e
A
Thus,
62

W e de f ine t h e d i s t r i b u t i o n of t h e n e t area change t o be
and, from w ( h ) , wr(h) i s def ined as
w ( h ) wrlh) =
so t h a t equat ion 7 is s a t i s f i e d .
occurs because a ( h ) and n(h) have been def ined , i n (10) and (161, r e l a t i v e
t o t h e area of t h i n i c e being a n n i h i l a t e d , whereas wr is def ined r e l a t i v e
t o t h e n e t change i n ice-covered area--that is, t h e d i f f e r e n c e between t h e
a n n i h i l a t e d area of t h i n i c e j 0 a(h)dh and t h e c rea t ed area of t h i c k i c e
Iomn(h)dh. h + h (by equat ion 1 6 ) , i t s a t i s f i e s t o t a l volume conserva t ion (8).
The d i v i s o r -I,"U(h)dh i n equat ion 18
co
Since wr(h) s a t i s f i e s volume conserva t ion f o r each conversion A
We can complete t h e formalism by de f in ing t h e cumulative d i s t r i b u t i o n s h N ( h ) , w ( h ) , and Wr(h) as t h e 1, dh- in t eg ra l s of n(h) , w ( h ) , and wr(h) exac t ly
as done i n equat ion 9. Then equat ion 16 can be i n t e g r a t e d by par ts t o show
N(h) = p ) k 4 m - A ( 0 3 &&+E (19) 0
A h
where h = T ( $ ) is t h e i n v e r s e of h = h ( h ) .
-A(h ) + N ( h ) , and, from equat ions .7 and 10, w e f i n d
The d i s t r i b u t i o n w(h) is j u s t
Expressing area and volume conserva t ion (equations 7 and 8) i n terms of Wr,
w e f i n d
and
-00
,I (1 + wr(h))dh = 0 , 0
both of which are s a t i s f i e d by equat ions 1 9 and 20.
63

I n o rde r t o cont inue t h e previous examples by eva lua t ing w,(h) and A
Wr(h), w e r e q u i r e h ( h ) . For s i m p l i c i t y , w e w i l l assume t h e l i n e a r r idg ing
l a w A
h = k h , where k is a cons tan t and might have a va lue of about 4 .
l a w i n t o equat ion 16, w e f i n d t h a t n(h ) is a ( h / k ) . Then N(h) is A ( h / k ) . From (17) and (18) , we f i n d
S u b s t i t u t i n g t h i s 1 1
and, from ( 2 0 ) ,
I n t h e example of F igure 6 , A(h) is t h e s t e p func t ion H(h - h*). Then, by equat ion 25, Wr(h) i s t h e sum of two s t e p func t ions
as i l l u s t r a t e d i n F igure 8.
-1
- k l ( k - 1)
Fig. 8. Wr(h) corresponding t o t h e G(h) and A ( h ) i n F igure 6.
64

The a ( h ) and A ( h ) d i s t r i b u t i o n s f o r t h e example i n F igure 7 are those
i n equat ions 1 4 and 15. For t h i s a ( h ) , n ( h ) i s
by (16).
i n F igure 9.
F igure 8.and 10 appear t o s a t i s f y equat ion 22, as they indeed do.
The form of w ( h ) , which i s t h e sum of -a(h) and n ( h ) , is i l l u s t r a t e d
The a s soc ia t ed Wr(h) is shown i n F igure 10. The Wr's i n both
I
2 k h* -
2 - - h*
Fig. 9 . w ( h ) ( s o l i d curve), n(h) and -a(h) (dashed curves) corresponding t o t h e th ickness d i s t r i b u t i o n of F igure 7.
0
Fig. 10. Wr(h) corresponding t o t h e th ickness d i s t r i b u t i o n i n F igure 7.
65

The chain of assumptions and definitions we have made in this subsection
is illustrated in Figure 11. have dimensions of (length)-'.
Wr are the h-integrals of the lower case variables; they represent fractions of areas and have no dimensions. affected by two functions, B(G) and h ( h ) , which we presume to be known.
The lower case variables g, a, n, w , and w
The upper case variables G, A , N, W, and r
The manner in which wr depends on g(h) is A
Thickness Relation Symbol distribution of:
i ( h ) , volume
conservation
- a + n
normalize by area conservation
Fig. 11.
g ( h ) entire area
a ( h ) area annihilated
\L n ( h ) area created
U ( h ) net area change
1 Ur(h) net area change
Relative to:
total area
total area annihilated
total area annihilated
total area annihilated
total net area change
Asummary of the assumptions and definitions used in section 2.2.
2.3 The redistribution function ~ for a general strain rate
To generalize the redistribution function $ of equations 5 and 6 ,
which apply for pure divergence (6 = 0 ) and for pure convergence (6 = T),
respectively, we hypothesize that for an arbitrary value of 8 , $ is some linear combination of the opening mode and the ridging mode
VJ = 161 {ao(e)b(h) + a,(e)w,(h;g))
For VJ to reduce to equations 5 and 6 , we must have
c
66

I n equat ion 27, t h e r e are no f u n c t i o n a l dependences except t hose e x p l i c i t l y
shown. The i n t e g r a l form of (27) is 4
Y = ca,(e)@) + a r ~ e ) v r ( h ; g ) ~
where H(h) is a u n i t s t e p func t ion a t h = 0'. a, and ar are dimensionless
ampli tudes, so Q has dimensions of (lengthatime)- ' and \Y has dimensions of
(time)-' .
S iqce both b ( h ) and zJr(h;g) are sepa ra t e ly volume conserving, $
conserves volume. Area conserva t ion (equat ion 3) r e q u i r e s
a , ( e ) - a r ( e ) = cos e . (29)
Thus, given wr , $ is determined t o wi th in one a r b i t r a r y func t ion , e i t h e r
a,(9) o r a r ( 0 ) . Both a, and clr are even func t ions of 8 and of IT - 8 and
need be def inedonly i n t h e range [0, IT]. Assuming t h a t r i dges f r e e z e as
soon as they are formed so t h a t t h e r e is no "unridging," w e r e q u i r e
We a l s o r e q u i r e t h a t t he c o e f f i c i e n t of t h e opening mode never be nega t ive
When convergence can occur simply by c los ing open water, t h e r idg ing mode
w i l l accomplish t h i s ( a s i n t h e example of Figures 6 and 8 when h* is zero) .
Combining (29) and (30) , w e have
, f o r O I 9 L y IT
IT ( 3 1 d (" -cos 9, f o r ij 5 9 5 IT arW
IT COS 0 , f o r 0 5 8 7
a,@) 2 (31b)
Then ar(€l) can be any of t h e func t ions i n F igure 12 .
cons iderable freedom i n t h e choice of a,(e), bu t , as w e w i l l now examine,
by equat ing p l a s t i c work t o p o t e n t i a l energy formation, each p o s s i b l e
ct,(0) corresponds t o a p a r t i c u l a r shape
There seems t o be
of a p l a s t i c y i e l d su r face .
67

0
Fig. 12. Poss ib l e func t ions a,(€)). The s o l i d curve r e p r e s e n t s t h e lower bound on ar s t a t e d i n (31a).
3. YIELD CRITERIA AND THEIR REDISTRIBUTION FUNCTIONS
3.1 The y i e l d c r i t e r i o n and t h e s t r e s s - s t r a i n rate r e l a t i o n
The s ta te of stress Oij i n a material can b e descr ibed uniquely by
( 3 4- d e t g’, where g’ is t h e stress d e v i a t o r ) , and t h e ang le t h e f i r s t
t h e mean stress O (E 0.. /2, t h e nega t ive p re s su re ) , t h e shear stress
CT
p r i n c i p a l a x i s makes wi th a known re fe rence l i n e .
plane. W e denote p o i n t s i n t h e p lane by 9 o r by (0 U ). Many materials
obey t h e same s t r e s s - s t r a i n (or s t r e s s - s t r a i n r a t e ) r e l a t i o n f o r any va lue
of 9. This is t r u e , f o r example, of a Hookean e l a s t i c and of a Newtonian
f l u i d . A p l a s t i c material, such as w e w i l l now cons ider , is a l t o g e t h e r
d i f f e r e n t .
as i n F igure 13 , such t h a t material wi th stress s ta te Q l y i n g i n s i d e t h e
curve is r i g i d (i = 0) whereas t h e same element wi th stress s ta te 0 l y i n g
on t h e curve may deform p l a s t i c a l l y (& # 0) . In p l a s t i c i t y theory, such
a curve is c a l l e d a y i e l d s u r f a c e o r a loading su r face , and t h e equat ion
F ( g ) = 0 i s c a l l e d a y i e l d c r i t e r i o n o r a loading func t ion . Drucker [1950]
pos tu l a t ed t h a t t h e n e t work performed during a cyc le of a p p l i c a t i o n and
removal of a d d i t i o n a l stresses by a n e x t e r n a l agency is non-negative. This
p o s t u l a t e , t h e b a s i s of much of p l a s t i c i t y theory, r equ i r e s t h a t (1) t h e s u r f a c e
be convex (outward) everywhere, (2) t h e p r i n c i p a l axes of stress and s t r a i n
ra te co inc ide , and (3) t h e s t r a i n rate s t a t e = (t tII) be normal t o t h e
y i e l d su r face , as Figure 13 i l l u s t r a t e s .
I 22
I1
%) - Consider t h e ((SI,
I’ I1
We suppose t h a t t h e r e e x i s t s a closed curve F(CTI, 011> = 0
I’
68

Fig. 13. plane. nom a1 t o t h e su r f ace.
The y i e l d s u r f a c e F(01, 011) = 0 i n t h e (01, 011)- The flow r u l e (equat ion 33) r e q u i r e s t h a t 6 - b e
This normali ty can b e expressed as
I n
o r , because of t h e second consequence, as
k = I, I1 (33 ) i: k = 1 q) = 0
Also because of t h e second consequence t h e r a t e of p l a s t i c work, Oij E:~,
can be w r i t t e n as t h e vec to r product
( 3 4 ) - - 9 = a1 E I + 011 Err 'i, j 'ij
In what fo l lows , w e assume (33) and (34) t o be t r u e . We w i l l see i n s e c t i o n
3 . 3 t h a t t h e s u p p o s i t i o n t h a t no r idg ing occurs during pure divergence
(a r (0) = 0 ) r e q u i r e s t h e y i e l d s u r f a c e t o pass through t h e o r i g i n .
3 . 2 &energy equat ion
W e now assert t h a t two previous ly un re l a t ed func t ions , t h e r e d i s t r i b u -
t i o n func t ion I/J and t h e loading func t ion F(g), are r e l a t e d t o each o t h e r
through an energy equat ion.
s a t i s f y i n g F ( g ) = 0.
I n a l l t h a t fo l lows , 9 is taken t o be a va lue
69
I f pack ice deforms wi th a s t r a i n rate Eij and wi th an i n t e r n a l stress
Oij, i t d i s s i p a t e s energy a t a rate Oi jE i j .
w e w i l l assume t h a t t h i s work is d i s s i p a t e d only by t h e i r r e v e r s i b l e produc-
t i o n of p o t e n t i a l energy caused by r idg ing and measured by $.
only t h e i s o s t a t i c p o t e n t i a l energy of t h e f l o a t i n g ice, def ined as
A s w e d iscussed i n s e c t i o n 1,
We cons ider
00
2 $ $ / h2g(h )dh , (35) 0
J
- Pice ('water Pice) ''water and 5 is t h e a c c e l e r a t i o n of g rav i ty . where 8 =
The t i m e rate of change of t h i s p o t e n t i a l energy due t o mechanical processes
is j u s t % 6 9 low h2$(h)dh. The energy equat ion is , then,
O. .E ZJ i j
0
a n d . s u b s t i t u t i n g f o r II, from equat ion 27, w e have
0 cos0 + aII s in0 = p* a r (h ) I
where t h e r e l a t i o n
(37)
is obtained by eva lua t ing (36) and (27) a t 0 = IT.
Equation 38 gives t h e inaximum compressive load p* i n terms of t h e
r idg ing mode W r (h ; g ) . of t h e s t r u c t u r e of Wr(h).
i n terms of W,, which i s r e l a t e d t o W r by aWr/ah = ur. (equat ion 21), i t is convenient t o w r i t e
The i n t e g r a l I CO h2Wr (h)dh is non-negative because
To s o l v e problems, w e w i l l need t o express p* Since Vr(m) i s -1
0
Upon i n t e g r a t i o n by p a r t s , (39) becomes
CO
p* = - o g J h [ l + Wr(h)]dh 0
70

S u b s t i t u t i n g Wr from (25), i n which t h e l i n e a r r idg ing l a w (23) has been
assumed, w e f i n d
m
p* = i 3 3 k h [ i - A(h)]dh
0
For t h e case shown i n F igure 7, with t h e A-d i s t r ibu t ion i n (14) , w e c a l c u l a t e
a p * of -L k O $ h*2. 1.2
S i r k e p* depends on W r , which i n t u r n depends on g ( h ) , t h e s t r e n g t h
of t h e material w i l l change as g ( h ) changes. Equation 1 states t h a t both
deformation and thermodynamics can cause g ( h ) t o change.
can change e i t h e r i n ways t h a t weaken t h e material o r i n ways t h a t s t r eng then
it.
Of course, g ( h )
Equation (37) relates t h e shape of t h e y i e l d s u r f a c e t o t h e func t ion
r a,@). t h e loading func t ion F(a), -" s i n c e 8 is , i n genera l , known only i n t e r m s
K t is an a l g e b r a i c equat ion i n a and a d i f f e r e n t i a l equat ion i n
of t h e normal t o t h e y i e l d su r face . To f i n d t h e examples i n F igures 1 4 through :L7, w e have proceeded i n t h e easier d i r e c t i o n by choosing a y i e l d
s u r f a c e , parameter iz ing CJ and CJ as func t ions of 8 , and so lv ing equat ion I I1 37 f o r ar(B).
I
0
1
I 0
- P* P* aI - - - + - case 2 2
0 = s i n e I1 2
8
- 1 + case - 2
EXg. 14. a (8) and a,(@) f o r a c i r c u l a r y i e l d su r face . r
71

I
€)=TI-
/ ( -p* , 0)
0 0 IT1 2 IT
0
Fig. 15. ar(e) and ao(e) for an ice-cream-conic y i e l d su r face . This example w a s considered by Coon [1972].
GI = 0
011 = 0
a1 = - p * / 2 IT
011
a, = (-cos0 + tanB s i n e ) / 2
a. = (+case + tan8 s i n e ) / 2 B < ~ < - + B 2
Fig. 16. a r ( e ) and for a diamond y i e l d su r face .
72

1
a0
0 0 IT
a, = y s i n e
a0 = cos0 + y s i n e
Tr O < 8 L T a* = 0
UII = YP"
a = -cos9 + y s i n 0
a. = y s in8
CJ = -p*
= yp* I
5 1
Fig. 17 . ar(8) and ao(8) f o r a rec tangular y i e l d su r face .
3 . 3 P r o p e r t i e s of a, (@), a ,@) , and t h e y i e l d s u r f a c e
The lower bound of zero f o r both clr and a0 i s j u s t i f i e d s o l e l y on t h e
b a s i s of t h e r e d i s t r i b u t i o n func t ion . However, t h e lower bound on ar can
be r e l a t e d t o the c l a s s of y i e l d su r faces permit ted. The quan t i ty ci has
t h e same s i g n as t h e p l a s t i c work g 6 , i n t h e n o n - t r i v i a l case f o r which
p* is p o s i t i v e . Suppose t h e r e s t r i c t i o n on a is re laxed . There are t h r e e
cases t o consider :
r
r
(i) a,(0) > 0 f o r a l l 8 .
( n i ) a r (8 ) 2 0 f o r a l l 8 and = 0 f o r some 8.
The p l a s t i c work would be s t r i c t l y p o s i t i v e
f o r any f i n i t e s t r a i n . The y i e l d s u r f a c e enc loses t h e o r i g i n .
The y i e l d s u r f a c e must
pass through t h e o r i g i n . The p l a s t i c work would be s t r i c t l y p o s i t i v e
everywhere on t h e y i e l d su r face , except a t t h e o r i g i n and on s t r a i g h t - l i n e
segments t h a t pass through t h e o r i g i n , where i t would be zero.
( i i i ) a r (8 ) < 0 f o r some 8. The p l a s t i c work is a l s o nega t ive f o r t h e
73

same 8 .
Although t h i s seems t o b e a p e c u l i a r case, i t occurs , f o r example, i f one
assumes t h a t r i dg ing is completely r e v e r s i b l e , and t h a t t h e material behaves
somewhat l i k e a shal low, i n v i s c i d , f l u i d l aye r .
zero f o r a l l 8 , and t h e y i e l d s u r f a c e reduces t o a po in t ( - p * , 0).
The y i e l d s u r f a c e does no t pass through o r enc lose t h e o r i g i n .
Then a is -cos 8, a. is r
I f w e assume t h a t t h e ice cannot support i s o t r o p i c t ens ion , (i) cannot
b e t r u e . However, w e expect t h a t when t h e ice f a i l s i n tens ion , i t does so
wi thout recovering any previous work; t h i s excludes ( i i i ) as a p o s s s i b i l i t y .
Thus, t h e bound i n (30a) on ar is compatible only wi th t h e y i e l d s u r f a c e s
t h a t touch t h e o r i g i n and do no t extend i n t o t h e r i g h t ha l f of t h e 9-plane.
The requirement t h a t a0 0 f o r a l l 8 , taken wi th ar 2 0, impl ies (31).
The func t ion a r (8 ) s a t i s f y i n g t h e e q u a l i t y i n (31 ) i s t h e lowest curve i n F igure 1 2 and is as soc ia t ed wi th t h e l i m i t i n g y i e l d s u r f a c e shown i n F igure
18. This y i e l d s u r f a c e r ep resen t s an incompressible , i n v i s c i d f l u i d t h a t
f a i l s i n t ens ion and a l s o i n s u f f i c i e n t compression.
Fig. 18. The l i m i t i n g y i e l d s u r f a c e corresponding t o t h e e q u a l i t y i n (31).
Upper bounds on a and a. do no t seem appropr i a t e , because they would r a r t i f i c i a l l y r e s t r i c t t h e class of y i e l d su r faces allowed.
The func t ion a r (6 ) is continuous and single-valued f o r any c losed ,
convex y i e l d su r face .
t i n u i t i e s i n a s i n c e both g.6 and 8 change smoothly.
segment of t h e y i e l d s u r f a c e (where 8 is cons tan t ) , one might expect 9 e t o vary and thus produce a d i s c o n t i n u i t y i n a r ( e ) .
can b e seen from Figure 19.
perpendicular d i s t a n c e d from t h e l i n e segment t o t h e o r i g i n , it is independ-
e n t of where g touches t h e l i n e segment.
Corners i n t h e y i e l d s u r f a c e do no t produce discon-
On a s t r a i g h t - l i n e r’
That t h i s does n o t occur
Since (T E is t h e product of I i I and t h e .....d
The d e r i v a t i v e of ar(O> need n o t be continuous. Its d i s c o n t i n u i t i e s
are a s soc ia t ed , somewhat s u r p r i s i n g l y , n o t wi th corners or w i t h discont inuous
7 4

Fig. 19. A s t r a i g h t - l i n e segment S of a y i e l d s u r f a c e i n the ?-plane.
I 0
\
changes of t h e cu rva tu re of t h e y i e l d s u r f a c e , b u t w i th s t r a i g h t - l i n e
segments. The y i e l d s u r f a c e s i n F igure 14 through 17 have, r e s p e c t i v e l y ,
zero, one, two, and t h r e e s t r a i g h t - l i n e segments i n t h e upper h a l f of t h e
9-plane.
[0, IT]. ( I n F igure 17, t h e d i s c o n t i n u i t i e s occur a t 0 = 0, T/2, and IT.)
The a s soc ia t ed a 's have as many d i s c o n t i n u i t i e s of s l o p e i n r
Maximums and minimums i n a (0) occur where 0 6 has i t s maximums and r minimums--that is , po in t s on t h e y i e l d s u r f a c e where g i s i n t h e same
d i r e c t i o n as t h e normal t o t h e y i e l d s u r f a c e ( p a r a l l e l t o i). S, is t h e c i rc le centered a t t h e o r i g i n pass ing through such a po in t .
t h e y i e l d s u r f a c e l i es i n s i d e S, i n t h e neighborhood of t h e po in t , a r (0 )
has a maximum a t 0
l i n e S,, a r (0 ) has a minimum a t 8,.
i l l u s t r a t e s a maximum i n a assoc ia t ed wi th t h e upper l e f t corner . Minimums
i n a a t 8 = 0 and IT are i l l u s t r a t e d i n t h e same example a s soc ia t ed wi th t h e
p o i n t s (0,O) and ( -p* ,O) on t h e y i e l d su r face . The y i e l d s u r f a c e cannot l i e
o u t s i d e S,, f o r i t would then b e concave--a condi t ion precluded by Drucker 's
p o s t u l a t e .
I n F igure 20
I f
I f t h e y i e l d s u r f a c e lies between S, and t h e s t r a i g h t - m' The example of t h e box i n F igure 1 7
r
r
I n genera l , a, would b e a multiple-valued func t ion of 0 f o r
s u r f a c e s wi th concavi t ies . -
V ' "I
Fig. 20. The g-plane. See t e x t f o r explanat ion.
75
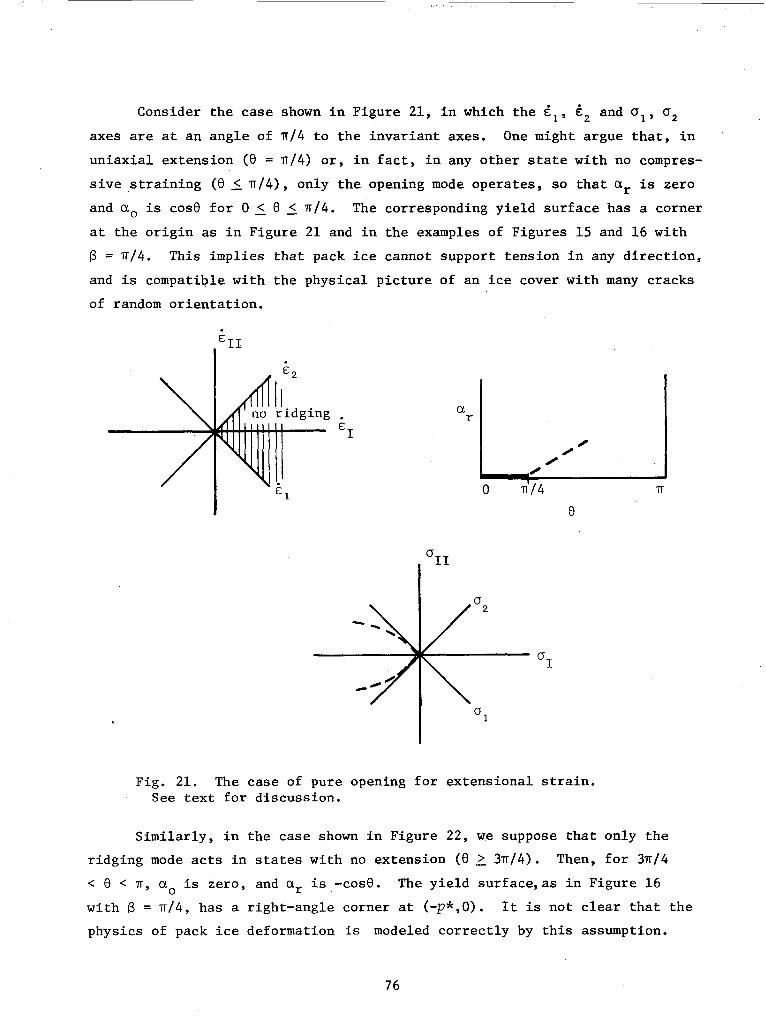
Consider t h e case shown i n F igure 21, i n which t h e g, , e , and ol, u2 axes are a t an ang le of T / 4 t o t h e i n v a r i a n t axes.
u n i a x i a l ex tens ion (8 = n / 4 ) o r , i n f a c t , i n any o t h e r s ta te wi th no compres-
s i v e s t r a i n i n g (8 5 IT/^), only t h e opening mode ope ra t e s , so t h a t ar i s zero
and a, is cos8 f o r 0 5 8 5 ~ / 4 .
a t t h e o r i g i n as i n F igure 21 and i n t h e examples of F igures 1 5 and 16 wi th
B = ~ / 4 . This impl ies t h a t pack ice cannot support t ens ion i n any d i r e c t i o n ,
and is compatible wi th t h e phys ica l p i c t u r e of an ice cover wi th many cracks
of random o r i e n t a t i o n .
One might argue t h a t , i n
The corresponding y i e l d s u r f a c e has a corner
0 n1/4 IT
I
Fig. 21. The case of pure opening f o r ex tens iona l s t r a i n . See t e x t f o r d i scuss ion .
S imi l a r ly , i n t h e case shown i n Figure 22, w e suppose t h a t only t h e
Then, f o r 3 T / 4
The y i e l d s u r f a c e , a s i n F igure 16
r idg ing mode acts i n states wi th no ex tens ion (8 2 37T/4).
< 8 < IT, a, is zero, and ar i s -cos8.
w i th 6 = ~ / 4 , has a r igh t -angle corner a t ( - p * , O ) . physics of pack ice deformation is modeled c o r r e c t l y by t h i s assumption.
It is no t clear t h a t t h e
76

1: 11llIl
no o p e n i
Fig. 22. The case of pure r idg ing f o r compressive s t r a i n . See t e x t f o r d i scuss ion .
3 . 4 An a l t e r n a t i v e form f o r $
The form,
* =: 6(h)E; + ?Jr(h;g) i f + ws(lZ;g)EII
which is l inear i n t h e s t r a i n rate, might be thought to be a u s e f u l alterna-
t ive t o ( i ! 7 ) . Here w e use the n o t a t i o n
and 0 , iI'0
kI < 0 . I ' E: . - €1
( 4 3 )
I n ( 4 2 ) , 6(h ) is t h e opening mode, 7 . ~ 7 ~ i s one r idg ing mode active dur ing
77

convergence, and W s denotes a second r idg ing mode a c t i v e i n shear .
S u b s t i t u t i n g ( 4 2 ) i n t o ( 3 6 ) , w e o b t a i n
( 4 4 ) GI cos0 + 0 s in0 = p* cos-e + p* s i n e I1 r S
where t h e minus s u p e r s c r i p t i s used as above, and p* and p; are def ined as
i n (38) f o r t h e two modes Wr and Us.
corresponds t o a y i e l d s u r f a c e of only one shape, which is a box of width
pP and h a l f he igh t p ; . of which nothing is known. The form of (27) seems t o be more use fu l , because
i t al lows a gene ra l shape of y i e l d s u r f a c e wi th only one n o n - t r i v i a l r i dg ing
mode w r .
r Thus w e see t h a t 7) as w r i t t e n i n ( 4 2 )
Furthermore, it in t roduces a second r idg ing mode w S
Suppose t h e dependence on shear is suppressed i n t h e above example by
s e t t i n g W and p* equal t o zero. Then t h e y i e l d s u r f a c e becomes t h a t shown
i n F igure 18, and J, i n ( 4 2 ) is i d e n t i c a l wi th $ i n (27) when a, and ar are
on t h e i r lower bounds (given by t h e e q u a l i t y i n (31) ) .
S S
4 . DISCUSSION AND CONCLUSIONS
The proposed form of $ has several u s e f u l p rope r t i e s .
1) The rate a t which a c e r t a i n incremental deformation occurs does no t
a f f e c t t h e n e t r e d i s t r i b u t i o n ( i f thermodynamic processes are i n a c t i v e ) .
2) The states of convergence and divergence have i n t u i t i v e l y s a t i s f a c t o r y
behavior .
3) These two s ta tes are genera l ized t o an expression a p p l i c a b l e f o r
any s t r a i n - r a t e s ta te . I n p a r t i c u l a r , i n pure shea r , t h e r e are gene ra l ly
both r idg ing and open-water product ion, aga in s a t i s f y i n g our q u a l i t a t i v e
no t ions . 4 ) A class of i n t u i t i v e l y s a t i s f a c t o r y y i e l d su r faces can b e shown t o
correspond t o Q through an energy equat ion.
The p l a s t i c c o n s t i t u t i v e l a w has been shown t o be c o n s i s t e n t w i t h a
phys ica l p i c t u r e based on the q u a n t i t a t i v e d e s c r i p t i o n of t h e ice s t a t e by
t h e th ickness d i s t r i b u t i o n g ( h ) and of t h e mechanical processes $ ( h ) t h a t
change t h i s state. The theory is completely genera l f o r two-dimensional
deformations of pack ice. There are parameter iza t ions of t h e small-scale
78
A
processes both i n t h e i r occurrence (B(G)) and i n t h e i r e f f e c t ( h ( h ) ) .
theory extends t h e compactness models, which d e a l t wi th t h e no t ions of
opening and open water, t o r ep resen t t h e r idg ing process and t h e transforma-
t i o n of t h i n ice i n t o th i ck .
This
A more p r e c i s e i n t e r p r e t a t i o n of t h e mechanical processes accompanying
deformation is p o s s i b l e h e r e than could be made i n Coon's [1972] theory.
Coon supposed t h a t ( f o r t h e ice-cream-cone y i e l d su r face ) "d i l a t ing" occurs
i f 8 is less than TF/2 (divergence) and "ridging" occurs i f 8 is g r e a t e r
than ~ r / 2 (c.onvergence). I n t h e present theory, such a dependence of processes
on 0 occurs only f o r t h e Ctr(e) given by t h e s o l i d curve i n F igure 1 2 and t h e
l i m i t i n g yi.eld s u r f a c e of Figure 18. For t h e y i e l d s u r f a c e Coon assumed
(Figure 1 5 ) , t h i s theory p r e d i c t s r i dg ing f o r e g r e a t e r than IT/^ -6 and some opening (ao > 0) f o r a l l va lues of 0 except 1 ~ .
The a b i l i t y of deformation (and thermodynamic processes) t o change t h e
y i e l d stress p* needs to be i l l u s t r a t e d .
t o appear i n AIDJEX B u l l e t i n No. 24 o r 25.)
convergence w i l l s t r eng then i ce and pure divergence w i l l weaken i t . Motions
inc luding a component of shear may e i t h e r s t r eng then o r weaken i t , depending
on t h e va lue of 8 and on g ( h ) .
(See Coon e t a l . , work i n progress ,
I n gene ra l , w e can say t h a t pure
The poores t approximation i n t h i s paper is probably t h e neg lec t of
s i n k s of energy o the r than p o t e n t i a l energy. We know from Parmerter and
Coon [1973] t h a t t h e f r i c t i o n a l d i s s i p a t i o n i n p re s su re r i d g e formation is
roughly as g r e a t as t h e p o t e n t i a l energy product ion when t h i c k ice (100 cm)
is r idged. P res su re r idg ing i s t h e only mechanical process of which an
e n e r g e t i c s tudy has been made. It is not known how much energy is d i s s i p a t e d
when t h e edges of f l o e s are crumbled dur ing shear a long cracks o r when l a r g e
f l o e s break up. Ce r t a in ly , c l o s e r s tudy of t h e s e small-scale processes is
e s s e n t i a l i f a complete la rge-sca le model is ever t o emerge.
We have assumed h e r e t h a t t h e s t r a i n ra te i s normal t o t h e y i e l d
s u r f a c e F ( 9 ) = 0. Considerat ion needs t o be given t o o t h e r flow r u l e s .
W e have assumed t h a t t h i n i ce h r idges i n t o t h i c k ice of only a s i n g l e
th ickness 32. t h a t r i dges of d i f f e r e n t he igh t s can be formed from ice of a given th ickness .
Such an ex tens ion of t h e p re sen t theory should be considered.
F i e ld observa t ions and Parmerter and Coon's r i d g e model show
79

New r i d g e s are known t o be composed of i r r e g u l a r l y shaped blocks of
ice t h a t l e a v e a s i z a b l e percentage (15% t o 30%) of t h e r i d g e f i l l e d w i t h
water. I n winter, much of t h i s water probably f r e e z e s and is thus incorpo-
r a t e d i n t o t h e ice.
t o inc lude t h i s f e a t u r e . Such an a l t e r a t i o n would change t h e y i e l d stress
p * ; i t would a l s o provide a s m a l l a d d i t i o n a l mass source , so t h a t t h e r ed i s -
t r i b u t i o n func t ion would no longer be volume conserving.
The p resen t theory can be a l t e r e d without d i f f i c u l t y
The d i r e c t measurement of t h e r e d i s t r i b u t i o n func t ion $ ( h ) is un l ike ly
f o r many years .
and wi th s u f f i c i e n t accuracy t o c a l c u l a t e temporal d i f f e r e n c e s i n g ( h ) and
thereby f i n d $ ( h ) . The bottom p r o f i l e g ives a b e t t e r measure of th ickness
than a p r o f i l e of t h e upper su r face , bu t submarines and submersibles are
imprac t i ca l f o r t h i s measurement because of t h e need t o sample l a r g e areas
repea ted ly .
and r ada r provide only t h e c rudes t approximation t o g ( h ) . of pas s ive microwave imagery t o d e t e c t ice th ickness has no t y e t been proven.
It is imprac t i ca l t o measure g ( h ) once--let a lone r epea ted ly
S a t e l l i t e s and a i r c r a f t wi th v i s u a l and i n f r a r e d photography
The c a p a b i l i t y
With t h e p re sen t theory, an i n d i r e c t measurement of t h e stress t enso r
could be made by measuring the s t r a i n rate tensor and t h e r e d i s t r i b u t i o n
func t ion .
t ies be fo re w e f i n d a method f o r d i r e c t l y measuring stress.
I t appears t h a t w e w i l l be a b l e t o measure these l a t te r quant i -
A numerical s tudy of t h e i n t e r a c t i o n of several f l o e s by idea l i zed
processes of r idg ing , opening, and shear ing along cracks i n real is t ic
geometries is now i n progress .
ments of t h e r e d i s t r i b u t i o n func t ion and t h e stress as soc ia t ed wi th s imple
th ickness d i s t r i b u t i o n s and s t r a i n s . Laboratory modeling of t h i s type could
a l so provide i n s i g h t i f a s u i t a b l e s c a l i n g of processes could be devised.
Such models w i l l provide a r t i f i c i a l measure-
ACKNOWLEDGMENT
I am g r a t e f u l t o Max Coon f o r our f requent d i scuss ions about t h e
vaga r i e s of p l a s t i c i t y theory and t o my o t h e r AIDJEX col leagues f o r t h e i r
a s s i s t a n c e .
80

REFERENCES
Campbell, W. J . 1965. The wind-driven c i r c u l a t i o n of ice and water i n a p o l a r ocean. J . Geophys. Res., 70: 3279-3301.
Coon, M. D. 1972. Mechanical behavior of compacted arctic ice f l o e s . Preprints, Offshore Te.ehnologg Conference, Houston, Texas, 1-3 Nay 1972. Paper No. OTC 1684. American I n s t i t u t e of Mining, Me ta l lu rg ica l Engineers.
Drucker, D. C. 1950. Some impl ica t ions of work hardening and i d e a l p l a s t i c i t y . Quart. A p p l . Math. 7: 411-418.
Doronin, Yu. P. 1970. On a method of c a l c u l a t i n g . t h e compactness and d r i f t of ice f l o e s . (K metodike r a sche ta sp lochennos t i i d r e i f a l 'dov.) Trudy A r k t . i Antarkt. In-tu., 2 9 1 , 5-17. Leningrad. [Engl ish t r a n s l . , AIDJEX Bulletin No. 3 (Nov. 1970) , pp. 22-39. ]
Nikiforov, Y e . B . , Z . M. Gudkovich, Yu. I. Yefimov, and M. A . Romanov. 1967'. t h e in f luence of wind during t h e naviga t ion per iod i n a r c t i c seas. (Osriovy metodiki r a sche ta pererasprede len iya l ' d a b a rk t i chesk ikh moryakh b navigatsionnyy per iod pod vozkeystviem v e t r a . ) i Antarkt. In-ta., 275, 5-25. Leningrad, [English t r a n s l . , AIDJEX BuZ'Cetin No. 3 (Nov. 1970), pp. 40-64.1
P r i n c i p l e s of a method f o r computing 2ce r e d i s t r i b u t i o n under
Trudy A r k t .
Parmerter , R. R. , and M. D. Coon. 1973. Mechanical models of r i dg ing i n t h e a r c t i c sea ice cover. AIDJEX Bulletin No. 1 9 , pp. 59-112.
Rothrock, D. A. 1973. The s teady d r i f t of an incompressible a r c t i c i ce cover. AIDJEX Bulletin No. 21, pp. 49-78.
Rothrock, D. A. 1974. A r e l a t i o n between t h e p o t e n t i a l energy produced by r idg ing and t h e mechanical work requi red t o deform pack i c e . I n t h i s Bu l l e t in .
Thorndike, A. S. , and G. A. Maykut. 1973. On the th ickness d i s t r i b u t i o n of sea ice. AIDJEX Bulletin No. 21, pp. 31-47.
81

DIMENSIONLESS STRENGTH PARAMETERS FOR FLOATING I C E S H E E T S
by
R. Reid Parmerter Department of Aeronautics and
University of Washington, Seat t le ,
I ABSTRACT
The equat ions governing a f l o a t i n g
Astronautics Washington 98295
i ce shee t subjec ted t o vertical loading a r e - s t u d i e d - i n dimensionless form. of t r a n s v e r s e shear T t o bending stress 0 is foun# t o be propor- t i o n a l t o t h e f o u r t h r o o t of th ickness ( T / 0 E t5), so t h a t bending stress dominates i n t h i n shee t s . Thus, s imple p l a t e theory, which ignores t h e deformation due t o shear , may be used f o r ice s h e e t s up t o several meters th i ck . The bending stress i n t h e s h e e t may be incorporated i n t o a dimensionless s t r e n g t h parameter t h a t depends on t h e func t iona l form of t h e loading and Poisson 's r a t i o V. Where t h e loading is one-dimensional, t h e s t r e n g t h parameter depends only on t h e form of t h e loading. The problem of i ce forced aga ins t a sea w a l l is s tud ied as an example. The dimensionless parameters s impl i fy t h e graphic p re sen ta t ion of t h e maximum height t h a t i c e can p i l e a g a i n s t a sea w a l l .
The more complex problem i n which in-plane fo rces i n t e r a c t through t h e ver t ica l deformations t o create a d d i t i o n a l loading is a:Lso s tud ied . This class of problems inc ludes problems of e las t ic buckl ing. The problem of t h e r a f t i n g of i c e , i n which one shee t ove r r ides another without breaking, serves as an example. The stress parameter is ca l cu la t ed as a func t ion of t h e geometry of t h e r a f t i n g shee t . I f t h e a c t u a l s t r e n g t h of t h e i ce is such t h a t t h e s t r e n g t h parameter f a l l s below t h e s o l u t i o n curve, t h e ice w i l l break be fo re i t r a f t s . th ickness of i ce t h a t can r a f t without breaking depends on t h e square of t h e ice th ickness ; t h e c a l c u l a t i o n of 1 7 cm f o r t y p i c a l young sea ice agrees w e l l w i th f i e l d observa t ions , a l though o lde r i c e , because of i t s g r e a t e r s t r e n g t h , can r a f t when i t is several meters th i ck .
The r a t i o
The maximum
83

BASIC EQUATIONS AND DIMENSIONAL ANALYSIS
The a rc t ic ice is o f t e n subjec ted t o ver t ical loading. This may occur
when man ventures upon t h e ice, br inging heavy equipment t h a t t h e ice
support ; o r i t may occur i n na tu re , when d i f f e r e n t i a l accumulation o r
e ros ion of ice creates l o c a l areas t h a t are o u t of i s o s t a t i c equi l ibr ium.
I n both cases , t h e s e vertical fo rces bend t h e ice s h e e t and induce bending
stress components O x X , 0
and T
perpendicular t o it.
concentrated loads , where t h e assumptions of p l a t e theory break down.
must
and (J and transverse shea r components T~. xy’ YY where t h e x , y coord ina tes are i n t h e p lane of t h e s h e e t and z is YZ’
The v e r t i c a l component (Jzz is n e g l i g i b l e except under
S t r u c t u r a l l y , t h e ice may be approximated by an elastic p l a t e of
th ickness t on a Winkler foundat ion wi th modulus k = pwg, [Hetenyi, 1946,
pp. 1-21, where Pw is t h e dens i ty of water and g t h e a c c e l e r a t i o n of g rav i ty .
This approximation is v a l i d provided t h e p l a t e is n e i t h e r l i f t e d from t h e
water nor t o t a l l y submerged.
equat ion [from Timoshenko, 1940, p. 881
The ver t ical d e f l e c t i o n W is governed by t h e
D O 4 W + kW = q(x,y)
where t h e bending s t i f f n e s s D = E t 3 / 1 2 ( l - V2) incorpora tes two mechanical
p r o p e r t i e s of t h e ice, Young’s modulus E and Poisson’s r a t i o V.
load per u n i t area is q(x,y).
The ver t ica l
Introducing t h e dimensionless parameters
x = 4m
w = W i t
t h i s equat ion can be put i n t h e form
A4w + 4w = 2 f(<,q).* ~
*In p l a t e theory, a more n a t u r a l d e f i n i t i o n is A = 4m. The f a c t o r of 4 Both d e f i n i - proves t o b e a convenience i n t h e s o l u t i o n of beam problems.
t i o n s may b e found i n t h e l i t e r a t u r e .
84

The parameter q , is a measure of load i n t e n s i t y and k k is t h e uniform load
r equ i r ed t o d i s p l a c e t h e p l a t e one-quarter th ickness i n t h e i d e a l i z e d s i tua- t i o n where t h e elastic foundat ion is l i n e a r f o r displacements of t h i s
magnitude.
act when t h e p l a t e is f u l l y submerged o r l i f t e d f r e e of t h e su r face .
However, t h e r a t i o q o / k t s t i l l has a clear phys ica l i n t e r p r e t a t i o n .
func t ion f ( 5 , ~ ) is a geometr ica l ly sca l ed load d i s t r i b u t i o n func t ion . L e t
w o ( < , q ) b e t h e s o l u t i o n of equat ion 1 f o r a load i n t e n s i t y q , = k k .
t h e func t ion uO(5,Q) depends only on t h e func t ion f ( < , n ) . l i n e a r ; t hus , t h e response w t o any o the r load i n t e n s i t y q w i t h t h e same
I n t h e case of a f l o a t i n g ice s h e e t , t h e foundat ion ceases t o
The
Then
Equation 1 is
d i s t r i b u t i o m f is j u s t W
The moments i n t h e
= D { (1 - V) Mij
and t h e bending stresses
‘ = +6M. .It2 ij $3
From t h e s e r e l a t i o n s , i t
= q w l k t . 0 0
i c e are r e l a t e d t o t h e deformation by
a t t h e s u r f a c e are
is clear t h a t t h e t h r e e t enso r s M. a2W/axi3x zj ’ j ’ and aij are symmetric and have t h e same p r i n c i p a l d i r e c t i o n s .
denote t h e d i r e c t i o n s of maximum and minimum p r i n c i p a l stress.
L e t n and m Then t h e
maximum normal stress is
- - = ? { $ + v + a2w ‘max ‘nn t am
In t roducing dimensionless parameters
A similar express ion a p p l i e s f o r t h e maximum in-plane shear ((5
L e t Oc denote a f a i l u r e level f o r in-plane stress ( e i t h e r normal stress o r
shea r stress). Then, i n view of equat ion 3 , a dimensionless f a i l u r e parameter
can be defined :
- om)/2.** nn
*If ann and am have t h e same s i g n , t h e maximum shear is (ann - az,)/2 = Onn/2. ‘Chis is no t an in -p laneshea r , bu t occurs on t h e p lane making a 45’ ang le wi th t h e d i r e c t i o n s n and z .
85

The t r ansve r se shear T i n t h e p l a t e is r e l a t e d t o t h i r d d e r i v a t i v e s
of W. f o m
I n a similar manner, t h e maximum t r ansve r se shear can be put i n t h e
If T~ is a f a i l u r e l e v e l i n t r ansve r se shea r , then
Equations 4 and 6 are use fu l f o r designing experiments on s c a l e models.
Ful l - sca le d a t a can be obtained by designing a small-scale experiment t o
g ive the des i r ed va lues of dimensionless groupings. The groupings a l s o
provide a minimum number of v a r i a b l e s f o r t h e problem, s impl i fy ing t h e
g raph ica l p re sen ta t ion of a n a l y t i c a l o r experimental da ta .
i n which t h e d i s t r i b u t i o n func t ion depends only on one dimension, f = f (< ) ,
and t h e boundary condi t ions are independent of 0 , t h e s o l u t i o n W is a l s o
independent of q.
except through t h e parameter A . f unc t iona l s F,, F,, F , , F , depend only on t h e d i s t r i b u t i o n func t ion f .
I n simple beam theory, t h e r a t i o of bending stress t o t r ansve r se
For problems
I n t h i s case Omax does not depend on V ( see equat ion 2 ) ,
S imi la r conclusions apply t o ‘1. Thus t h e
shear depends on t h e r a t i o of beam l eng th L t o th ickness t , wi th t r a n s v e r s e
shear becoming n e g l i g i b l e f o r l a r g e L / t . from equat ions 3 and 5, wi th t h e d i s t a n c e 1 / X p laying t h e r o l e of L .
f ixed f , V, t h e func t iona l s F, and F , are cons tan t , and
A similar r e s u l t can be deduced
For
Thus, bending stress dominates as t h e shee t becomes th in .*
* P l a t e theory assumes t h a t t h e deformations due t o t r ansve r se shear are neg l ig ib l e . If t h e t r ansve r se shear becomes important , p l a t e theory must be modified.
86

A s an example, consider t h e case of a concentrated l i n e load a c t i n g
on an i n f i n i t e shee t . This one-dimensional problem is equiva len t t o a beam
on an e l a s t i c foundat ion, and t h e beam s o l u t i o n , from Hetenyi [1946, chap. 21,
y i e l d s
t
ICE SHEET RUBBLE t IN
ISOSTATI C EQUlLl B R l U M
L 1 0 2 -- max = - A t
mal:
\ \ \ \
$WALL \ \ \ \ \
so t h a t bending dominates i f t < 2/A.
f o r t = 20 cm, and A t = 0.1 f o r t = 4 m.
problems, except i n reg ions where loads are concentrated over d i s t a n c e s of
t h e order of a th ickness o r less. I n t h e s e reg ions , t h e b a s i c assumptions
of p l a t e theory break down, and more complex, three-dimensional a n a l y s i s
may be requi red l o c a l l y .
For t y p i c a l ice p r o p e r t i e s , A t = 0.05
Thus bending dominates i n most
THE SEA WALL PROBLEM
To : i l l u s t r a t e t h e s i m p l i f i e d graphic p re sen ta t ion made p o s s i b l e by
equat ion 4 , consider a semi - in f in i t e ice shee t which is forced a g a i n s t a
w a l l (Fig. 1). Pieces are broken from t h e s h e e t i n bending, c r e a t i n g a
Pig. 1. A s s u m e d m o d e l for ice i n t e r a c t i o n w i t h a sea w a l l .
rubble p i l e .
t i o n s on t h e top and bottom of t h e s h e e t , a t angles of repose 8 and a. rubble is composed of ice blocks and voids wi th average d e n s i t y pr.
Rubble tumbles from t h e p i l e , forming t r i a n g u l a r load d i s t r i b u -
The
I f vo ids
87

i n t h e rubble are f i l l e d wi th a i r above and water below t h e s u r f a c e , t h e
main rubble p i l e f l o a t s , so t h a t
Thus, t h e load is completely descr ibed by H s , Ls, Lk, p r y pi, and p W’
Once a p i l e has formed, breaking of t h e s h e e t can occur near t h e
po in t t h a t t h e s h e e t e n t e r s t h e p i l e , due t o t h e unequal t r i a n g u l a r loads .
It is n a t u r a l t o a sk what he igh t Hs is requi red t o load t h e s h e e t t o breaking
level.
i n t e r p r e t t h e he igh t H
s o l u t i o n may a l s o b e appl ied t o t h e p re sen t problem, of i ce forced a g a i n s t
a v e r t i c a l w a l l . I n t h i s case, Hs is t h e maximum he igh t of rubble t h a t can
be p i l e d a g a i n s t t h e w a l l . Once t h i s maximum height is reached, t h e rubb le
p i l e w i l l grow l a t e r a l l y r a t h e r than v e r t i c a l l y . The fo rces requi red t o
push t h e ice s h e e t i n t o t h e rubble p i l e are a l s o ca l cu la t ed i n t h e r e fe rences ,
and provide an estimate of t h e maximum loads t h a t i ce can impose on sea
w a l l s .
This problem has been discussed by Parmerter and Coon [1973a], who
The as a l i m i t i n g he igh t f o r p re s su re r idges . S
I n dimensionless form, t h e t r i a n g u l a r load d i s t r i b u t i o n is completely
s p e c i f i e d by
’i tane - S tan0 S Pw - pi t ana - - G
S Lk AH
and = )J = -
whi le t h e load i n t e n s i t y may be s p e c i f i e d by 4 , = P , s H s .
i s one dimensional, so t h a t V does no t e n t e r FP. Assume t h e loading
Equation 4 becomes
HS (5 A 2 t 2
C = s, I=’ GI
P,aHS
S , o r equ iva len t ly , s i n c e w e are i n t e r e s t e d i n determining H
hHS o c A 3 t 2
f 2 ( p r g tane’ - = tan0
Thus H,, which depends on a l l t h e independent v a r i a b l e s of t h e problem
Hs = f3(oc, E , V , P r y P i > Pw, k , 8, a ) ,
88

may be p l o t t e d convenient ly i n dimensionless form as a dimensionless he ight
lHs/tane TTS. a dimensionless s t r e n g t h och3t2/Prg t a d , wi th geometry G as
a parameter. The r e s u l t s are shown i n Figure 2 .
3.0
I .o
0.3
0.1
0.03
. 0.001
Fig. 2 . Dimensionless sea w a l l problem.
rubble he ight vs . i c e s t r e n g t h f o r t h e
IN-PLANE FORCES
The problem of a p l a t e on an e l a s t i c foundat ion may be general ized
The myriad cracks i n arctic by inc luding t h e e f f e c t of in-plane fo rces .
i c e prevent s i g n i f i c a n t tens ion fo rces from developing. However, compres-
s i v e fo rces of cons iderable magnitude a r e p re sen t , as evidenced by compres-
s i v e processes such as r idg ing and r a f t i n g .
In--plane compressive fo rces i n t e r a c t i n g through t h e v e r t i c a l d e f l e c t i o n
of t h e p l a t e c r e a t e moments t h a t tend t o inc rease t h e displacement. A t some
c r i t i c a l va lue of in-plane fo rce , buckling can occur; i .e., v e r t i c a l def lec-
t i o n s appear even when v e r t i c a l loads are not present .
f o r t h e :in-plane f o r c e per u n i t l eng th , F,, Fy, Fq, Fyz, are shown i n
Figure 3 . From moment equi l ibr ium,
Sign conventions
= Fyx. The d i f f e r e n t i a l equat ion E;Cy
89

yf
Fx
X J F Y
Fig. 3 . Sign conventions for in-plane forces in the ice sheet.
of the plate becomes [see Timoshenko, 1940, p. 3011
Introducing dimensionless parameters, the equation takes the form
where
are dimensionless in-plane force parameters. For fixed in-plane forces,
equation 7 is linear in W, so that the principle of superposition may be
used. this case wo depends on the load distribution function f and on the in-plane components. Thus,
Introducing a function w o , as in the first section, we see that in
The dimensionless strength parameter for bending takes the form
C r J 2 t 2
90

For problems i n which f = f(<), w i t h boundary condi t ions independent
of q, and wi th t h e in-plane f o r c e i n t h e d i r e c t i o n of 5 , t h i s r e l a t i o n takes
t h e s imple form
RAFTING
The r a f t i n g of sea ice i l l u s t r a t e s t h e use of equat ion 9. When two
ice s h e e t s are forced toge the r , one s h e e t sometimes ove r r ides t h e o t h e r
without breaking.
The stresses developed i n t h e ice and t h e in-plane f o r c e requi red t o cause
r a f t i n g have been s tud ied i n a s impl i f i ed model by Matsuoka [1973] and i n a
more d e t a i l e d model by Parmerter [1974, t h i s B u l l e t i n ] .
This phenomenon is usua l ly observed i n t h i n young ice.
The r a f t i n g model assumed by Parmerter [1974] i s shown i n F igure 4 .
The two s h e e t s meet along a s t r a i g h t l i n e of s u f f i c i e n t l eng th t h a t t h e
problem may be considered as one-dimensional.
l e f t i s assumed t o make an angle 0 with t h e ver t ical t o t h e s u r f a c e of t h e
ice. A f r i c t i o n l e s s i n t e r a c t i o n occurs between t h e two s h e e t s (wet i c e on
i c e ) . The f o r c e F and t h e maximum
stress i n t h e i ce s h e e t can be ca l cu la t ed i n t h i s conf igura t ion . The i n t e r -
a c t i o n between t h e two s h e e t s may be resolved i n t o an a x i a l f o r c e , a v e r t i c a l
f o r c e , and a moment.
The edge of t h e s h e e t on t h e
F igure 4 shows r a f t i n g about t o occur.
;;+ WATER L E V E L 7 q t v
SUBMERGES
Fig. 4 . Assumed model f o r ice r a f t i n g .
91

The s h e e t on t h e r i g h t is p a r t i a l l y submerged. The unsubmerged po r t ion ,
l abe led 3, is a beam on an elastic foundat ion wi th end loads.
po r t ion , l abe led 1, is a beam column without foundat ion, subjec ted t o a
cons tan t d i s t r i b u t e d buoyance f o r c e and end loads. S ince t h e beam l abe led 2
is no t l i f t e d from t h e water, i t is t r e a t e d e n t i r e l y as a beam on an elastic
foundat ion wi th a x i a l load and end loads. The ang le t h a t t h e edge of beam 2
makes wi th t h e ver t ical t o t h e water s u r f a c e determines t h e r e l a t i o n s h i p
between F and t h e appl ied ver t ical fo rce .
is t h e r o t a t i o n of t h e end of beam 2 due t o t h e deformation. The r o t a t i o n
8, and t h e l eng th of beam 1 are important unknowns t h a t must be e l imina ted
during t h e s o l u t i o n of t h e problem.
The submerged
This angle is Cp - e,, where 8,
The maximum bending stress is found t o occur i n t h e submerged beam.
I f t h i s stress exceeds t h e s t r e n g t h of t h e ice , p i eces w i l l be broken from
t h e s h e e t and r a f t i n g w i l l no t occur. The broken p i eces form rubble , which ,
then starts a ridge-forming process [Parmerter and Coon, 1973a1. The
a n a l y t i c a l r e s u l t s show t h a t t h i n i ce r a f t s and t h i c k e r ice forms r idges .
The same conclusion has been reached by Weeks and Kovacs [1970] from f i e l d
observa t ions .
u sua l ly occurs a t a th ickness of between 15 and 30 cm, al though on occasion
th i cke r ice w i l l r a f t wi thout breaking.
They s ta te that t h e t r a n s i t i o n from r a f t i n g t o r i d g i n g
The s t r e n g t h r e s u l t s can be presented i n t h e form of equat ion 9. I n
t h i s problem, ver t ica l loads are generated i n two ways:
because of t h e i n t e r a c t i o n of t h e two s h e e t s , and as d i s t r i b u t e d moment
r e s u l t i n g from t h e in-plane f o r c e F a c t i n g through t h e ver t ical displacement.
Raf t ing occurs when t h e t o t a l end displacement of t h e two s h e e t s equals t.
Thus, t h e ver t ical r e a c t i o n s of t h e foundat ion w i l l be p ropor t iona l t o kt, and t h e shape func t ion f w i l l depend on F and t h e i n t e r a c t i o n s .
t h a t w e p i ck q , = kt as a measure of load i n t e n s i t y .
a t t h e i n t e r f a c e
This sugges ts
The i n t e r a c t i o n s i n t h i s problem c o n s i s t of equal bu t oppos i t e moments
and concentrated f o r c e s a t t h e i n t e r f a c e . The magnitude of t h e ver t ical
concentrated load is
P = F t an($ - 02)
92

and t h e moment is
F t M = - 2
The f u n c t i o n a l form of t h e loading can be s p e c i f i e d by t h e r a t i o of t h e s e
loads.
i s t i c l eng th 1 / A t o c r e a t e a moment of order P l h . of t h e load is given by t h e r a t i o
To make a dimensionless r a t i o , n o t e t h a t P a c t s over t h e charac te r -
Thus t h e f u n c t i o n a l form
P ' t an($ - 02) - - 2 2 AM A t
W e t h e r e f o r e in t roduce t h e dimensionless parameter
tan($ - e2) 1 c I = A t
The v e r t i c a l r e a c t i o n s a l s o depend on N, t h e in-plane f o r c e parameter,
and on t h e i s o s t a t i c r a t i o 5 = (pw - pi)/pw, which determines t h e freeboard
of t h e ice and thus t h e po in t where t h e overr idden s h e e t submerges.
t h i s case (9) takes t h e form
For
I n t h i s problem, however, N is no t an independent v a r i a b l e , s i n c e i t is t h e
f o r c e requi red t o main ta in equi l ibr ium i n t h e s p e c i f i e d conf igu ra t ion of
F igure 4 . Thus, N i n f a c t is a func t ion of $ and E , and t h e d a t a may be
presented i n t h e form
The s o l u t i o n has been found, and t h e form of t h e func t ion f, is shown i n
Figure 5.
The maximum th i ckness of ice t h a t w i l l r a f t without f a i l i n g can be
ca l cu la t ed from Figure 5 . For 5 = 0.1,
c 0.46 f o r $ > 3.0 --
pw9
93

0.6
tT 3
0.5 “A bo
a4
Fig. 5. Raf t ing stress parameter vs . geometry parameter.
I 1 I I I 1 I I 1
- -
- - I
t= 0.1
I I I I I 1 I I .
Thus
Note t h a t t h e maximum th ickness depends on t h e square of t h e s t r e n g t h 0,.
The s t r e n g t h and modulus of young i c e are widely v a r i a b l e .
Anderson [1958] have measured va lues of (Jc i n t h e range lo6 < Oc < 3.5 X l o 6 dyn/cm2.
s u r f a c e l a y e r which is e s s e n t i a l l y without s t r e n g t h , s o t h a t t h e th ickness
of t h e load-bearing i c e is poorly def ined.
l a r g e amount of s c a t t e r i n Young’s modulus, i n t h e range l o 9 < E < 8 X lo9
dyn/cm2.
v = 0 . 3 , and P g = 1009 dyn/cm3, equat ion 10 y i e l d s
Weeks and
The measurement problem is compounded by t h e presence of a s k e l e t a l
They a l s o r e p o r t a s u r p r i s i n g l y
Assuming as nominal va lues CrC = 2X l o 6 dyn/cm2, E = 3 X l o9 dyn/cm2,
t = 17.1 c m
Thinner ice wi th t h e s e p r o p e r t i e s w i l l tend t o r a f t without breaking.
Thicker i ce w i l l break during r a f t i n g , form rubble , and develop i n t o r idges .
This r e s u l t is i n good agreement wi th t h e observa t ions of Weeks and Kovacs
[1970]. The s c a t t e r i n mechanical p r o p e r t i e s and t h e s t rong dependence on
(Jc e a s i l y account f o r t h e occas iona l r a f t i n g of abnormally t h i c k ice.
94

CONCLUSIONS
Through dimensional a n a l y s i s , t h e v a r i a b l e s t h a t e n t e r i n t o problems
of bending ice can be grouped convenient ly i n t o a few dimensionless
parameters.
f o r a given problem.
des ign of scale experiments, and reduce t h e numerical work requi red f o r
ana ly t ica l . s o l u t i o n s .
These dimensionless parameters are a minimum set of v a r i a b l e s
They s impl i fy t h e p re sen ta t ion of d a t a , c l a r i f y t h e
ACKNOWLEDGMENT
This r e sea rch was supported by Nat iona l Science Foundation Grant
GV-28807 t o t h e Univers i ty of Washington f o r support of t h e Arctic Sea Ice
Study .
REFERENCES
Hetenyi, M. 1946. Beams on Elast ic Foundation. Ann Arbor, Michigan: Univers i ty of Michigan Press .
Matsuoka, K. 1972. The mechanics of f r a c t u r e of sea ice i n l eads . Master's Thes is , Univers i ty of Washington, S e a t t l e , Washington. (56 pages.)
Parmerter , R. R., and M. D. Coon. 1973a. Mechanical models of r idg ing i n t h e a r c t i c sea ice cover. AIDJEX Bul le t in No. 19, pp. 59-112.
Parmerter , R. R. , and M. D. Coon. 1973b. On t h e mechanics of p re s su re r i d g e formation i n sea ice. Con*ference, Houston, Texas, A p r i l 30-May 2, 1973, vo l . 1, pp. 733-742.
Preprints of the F i f t h Offshore TechnoZogy
Parmerter , R. R. 1974. A mechanical model of r a f t i n g . I n t h i s Bu l l e t in .
Timoshenko, S. 1940. Theory of Plates and Shel ls . New York, N.Y.: M c G r a w - H i l l .
Weeks, W. F., and D. L. Anderson. 1958. An experimental s tudy of s t r e n g t h of :young sea i c e . E@S, Trans. of the Amer . Geophys. Union, 39(4): 641-647.
Weeks, W. F., and A. Kovacs. 1970. On p res su re r idges . Report f o r Cold Regions Research and Engineering Laboratory, Hanover, New Hampshire. (59 pages.).
95

A MECHANICAL MODEL OF RAFTING
R. Reid Parmerter Department of Aeronautics and Astronautics
University o f Washington, Seat t le , Washington 981 95
ABSTRACT
The s imple r a f t i n g of two ice s h e e t s of equal th ickness is inves t iga t ed . The f o r c e requi red t o i n i t i a t e r a f t i n g i s s m a l l compared t o t h e f o r c e requi red t o buckle t h e ice s h e e t . Maximum stresses occur i n t h e submerged po r t ion of t h e overr idden shee t . A s t h e th ickness of t h e s h e e t s is increased , t h e maximum stress developed dur ing r a f t i n g inc reases . Thus, t h e r e e x i s t s a c r i t i c a l ice th ickness a t which r a f t i n g causes t h e overr idden s h e e t t o f a i l . I c e t h i c k e r than t h i s c r i t i c a l va lue w i l l f a i l and t h e r e f o r e cannot r a f t . T h e . i c e blocks t h a t are broken from t h e s h e e t during t h e aborted r a f t i n g provide rubble , which then produces a r i d g e s t r u c t u r e . Thus, t h i c k ice tends t o deform through r idg ing and t h i n i ce tends t o r a f t .
INTRODUCTION
Compact sea ice under p re s su re deforms by t h e mechanisms of r idg ing
and r a f t i n g .
t i o n r e l a t i o n s h i p s of t hese processes . The compressive fo rces requi red t o
s u s t a i n r idg ing have r e c e n t l y been s tud ied [Parmerter and Coon, 19731. This
r e p o r t develops a model f o r s tudying t h e fo rces requi red t o i n i t i a t e r a f t i n g .
The t e r m " r a f t i ng" desc r ibes t h e phenomenon of an ice s h e e t ove r r id ing
another s h e e t , r e s u l t i n g i n a l o c a l doubling of ice th ickness . I f one s h e e t
ove r r ides and t h e o t h e r s h e e t is overr idden, t h e process is c a l l e d "simple
r a f t i n g " [Weeks and Kovacs, 19701. A v a r i a t i o n , c a l l e d " f inger r a f t i n g , "
is o f t e n observed, i n which t h e i n t e r a c t i n g s h e e t s f r a c t u r e along l i n e s
perpendicu:Lar t o t h e i r i n t e r a c t i n g edge, forming f i n g e r s . A l t e rna te f i n g e r s
of each s h e e t are then over- o r unde r th rus t , l eav ing an in t e r locked s t r u c t u r e .
Photographs and d e s c r i p t i o n s of both types of r a f t i n g may be found i n Weeks
and Kovacs [1970] and Kovacs [1972], a long wi th a more ex tens ive l i s t of
r e fe rences .
A c o n s t i t u t i v e l a w f o r pack i c e must inc lude t h e f o r c e deforma-
97

I n t h e s imple r a f t i n g model descr ibed i n t h i s r e p o r t , two ice s h e e t s
interact a long s t r a i g h t edges, w i th one s h e e t being overr idden along i t s
e n t i r e l eng th . The assumption of a s t r a i g h t edge is no t considered t o be
a s e r i o u s r e s t r i c t i o n : as shown i n t h e Appendix, bending e f f e c t s i n a
f l o a t i n g ice s h e e t propagate f o r a d i s t a n c e of only 10-20 th icknesses , so
t h a t i r r e g u l a r i t i e s i n t h e i n t e r a c t i n g f aces on a scale l a r g e r than t h i s
c h a r a c t e r i s t i c d i s t a n c e w i l l have l i t t l e e f f e c t on t h e a n a l y s i s .
FORMULATION OF THE PROBLEM
Consider two f l o a t i n g ice s h e e t s of th ickness t forced i n t o con tac t
along t h e i r l i n e a r edges by an e x t e r n a l f o r c e per u n i t l eng th F .
edge of each s h e e t is smooth and s t r a i g h t , bu t no t n e c e s s a r i l y v e r t i c a l .
L e t Cp and C p ' be t h e angles between t h e two edges and t h e v e r t i c a l (Fig. 1A).
I f a l ead opens and r e c l o s e s without shear ing , then C p ' = -4. The a n a l y s i s
is v a l i d f o r t h e more genera l assumption - CpL 4 ' L Cp , wi th Cp > 0, s o t h e
p o s s i b i l i t y of shear ing be fo re r ec los ing is included. With t h e s e assumptions,
t h e s h e e t on t h e r i g h t w i l l tend t o s l i d e down and under t h e s h e e t on t h e
l e f t (Fig. 1 B ) . Assuming t h a t t h e s l i d i n g f r i c t i o n of w e t i ce on w e t i ce is
n e g l i g i b l e , t h e i n t e r a c t i o n f o r c e must be or thogonal t o t h e edge on t h e l e f t ,
and, from geometry, i t i s d i r e c t e d through t h e upper corner of t h e s h e e t on
t h e r i g h t .
an a x i a l fo rce , a v e r t i c a l fo rce , and a moment.
The l i n e a r
Consequently, t h e two s h e e t s are loaded a t t h e i r i n t e r f a c e by
The ove r r id ing cont inues u n t i l t h e conf igura t ion shown i n F igure 1 C
i s reached, a t which po in t t h e s h e e t s r a f t . The deformation causes a
r o t a t i o n e2 of t h e edge of t h e s h e e t on t h e l e f t , which modifies t h e ang le
between t h e edge and t h e v e r t i c a l . I n t h i s f i n a l conf igura t ion (Fig. IC) ,
t h e i n t e r a c t i o n fo rces per u n i t l ength are
Axial fo rce : F
V e r t i c a l fo rce : P, = P2 = F t a n ($ - 0,)
Moment : MI = M, = Ft/2
Sign conventions are def ined i n Figure 1C.
98

B
A . Two ice sheets before rafting begins.
,-water surface
V
B. Intermediate stage of rafting.
C
downward
C. Incipient rafting.
Fig. 1. Simple rafting.
99

Since t h e s h e e t s are assumed t o meet uniformly over a s t r a i g h t edge,
t h e loading does not vary along t h e edge, and t h e p l a t e problem reduces t o
a beam problem. The equiva len t beam is of u n i t width, wi th beam s t i f f n e s s
E I = D, where D is t h e p la te s t i f f n e s s D = E t 3 / 1 2 ( 1 - v2>, E is Young's
modulus, and V i s Poisson ' s r a t i o . Ice f l o a t s w i th most of i t s volume under
w a t e r . The he igh t of t h e ice above water is <t, where
and p,, p i are t h e mass d e n s i t i e s of water and ice.
l e f t w i l l no t be l i f t e d ou t of t h e water, whi le t h e beam on t h e r i g h t w i l l
be p a r t i a l l y submerged. L e t Z be t h e d i s t a n c e from t h e edge t o t h e po in t
where t h e beam submerges. This po r t ion of t h e beam, labe led 1 i n F igure l C ,
is loaded by a uniformly d i s t r i b u t e d buoyancy f o r c e per u n i t area of magni-
tude
Thus t h e beam on t h e
where g is t h e a c c e l e r a t i o n of g rav i ty .
l abe led 2 and 3 , act as beams on an e l a s t i c foundat ion, wi th a foundat ion
modulus K = p&.
The remaining beam por t ions ,
The form of t h e s o l u t i o n depends on 5 , which is important i n t h e de t e r -
minat ion of Z , and on t h e re la t ive magnitude of t he e f f e c t s of M and P. When 5 is va r i ed over t h e range 0.09 L 5 L 0.11, which i s t y p i c a l of ice ,
t h e r e i s l i t t l e change i n t h e s o l u t i o n s . Therefore , a l l s o l u t i o n s are given
f o r t h e nominal va lue 5 = 0.1. P l a t e on e l a s t i c foundat ion s o l u t i o n s depend
on a parameter A = JK/4D. The c h a r a c t e r i s t i c length over which a v e r t i c a l
load has an apprec i ab le e f f e c t on deformation i s l/X ( see Appendix). Thus
P acts through a l e v e r a r m of o rde r 1 / A , and t h e dimensionless r a t i o
4
measures t h e r e l a t i v e importance of P and M.
It i s convenient t o in t roduce t h e dimensionless parameters
N = FA2/&&
Tl = AZ
T = A t
A = 6 / t
100

where 6 i s t h e ver t ical beam d e f l e c t i o n . The s o l u t i o n t o t h i s problem may
b e synthes ized from t h e s o l u t i o n s given i n t h e Appendix.
The displacement s o l u t i o n f o r beam 2 is \
- 2NT {m - $ 1 1 - 2N 8, - -
where 6, i s t h e d e f l e c t i o n and 8, t h e r o t a t i o n of t h e end of beam 2 .
Because $ (equat ion 1 ) depends on e,, t h e s e equat ions are n o t immediately
use fu l . However, assuming 8, is a s m a l l angle , s o t h a t t h e approximation
tan8, = 8, is v a l i d , and us ing t r i g i d e n t i t i e s , equat ion 3 can b e solved
f o r 8, i n terms of t h e independent v a r i a b l e s @ and T and t h e v a r i a b l e N :
tan4 - TJFT A =
(3)
( 4 ) ( 1 - 2N) /2N + T= tan$ + 1
- 2
Beam 3 is t h e unsubmerged po r t ion of t h e beam on t h e r i g h t . Thus t h e
d i s t a n c e 2 is determined by t h e condi t ion A 3 = 5, where 6 , is t h e d e f l e c t i o n
of t h e end of beam 3. The moment and ver t ical f o r c e a t t h e end of beam 3
may b e ca l cu la t ed from equi l ibr ium:
However, i n v i e w of A 3 = 5 and t h e deformation equat ion
{m P, - AM,) = St 4x 6, = (3a2 - B2)Pw9
i t fol lows t h a t
m 9PW5'c(l - 2N)
M 3 = x p3 - 2x3
(7)
S u b s t i t u t i a g ( 5 ) and ( 6 ) i n t o (81, and us ing t h e r a f t i n g condi t ion A , + A 2 = 1,
i t is found t h a t t h e dimensionless l eng th of t h e submerged beam must s a t i s f y
t h e equat ion
101

Thus q is determined as a func t ion of t h e independent v a r i a b l e s 5 , 4 , T ,
and t h e dependent v a r i a b l e N. The r o t a t i o n a t t h e end of beam 3 is
e, = - 2 ~ [I+ - SQ - ~K7-171 (10) \
The submerged beam is subjec ted t o an end load P , and a moment M,. Viewed i n a coord ina te system r o t a t e d by an angle 0 , with r e spec t t o t h e
h o r i z o n t a l , t h e submerged beam i s a can t i l eve red beam column subjec ted t o
end loads and a uniform buoyancy q = 6pd-b. I n t h e r o t a t e d frame t h e end
loads become
P = P, + F 0 ,
M = M,
F = F
where t h e angle 0 , is assumed t o be s m a l l , and t h e approximations s-in0, = e,, cos0, = 1 have been used.
The end d e f l e c t i o n is found t o be
where U ( see Appendix) is
u = m z = 2rlf i
These equat ions, toge ther wi th t h e r a f t i n g condi t ion
A , + A 2 = 1
completely d e f i n e t h e idea l i zed r a f t i n g problem.
SOLUTION
These equat ions are t o be solved f o r t h e va lue of N which g ives
deformations s a t i s f y i n g t h e r a f t i n g condi t ion (12). I n p r i n c i p l e , (2) and
(11) could be s u b s t i t u t e d i n t o (12) and solved f o r t h e equi l ibr ium va lue of
N . This is no t p r a c t i c a l , however, because of t h e complicated dependence
on 8. Therefore , an i t e ra t ive technique w a s used t o o b t a i n s o l u t i o n s .
102

For each <choice of t h e independent v a r i a b l e s T, (p, and 5, t h e equi l ibr ium
va lue of 127 w a s found i n t h e fol lowing manner.
N--for example, N = 0.01. Then 8, may be found from ( 4 ) , and I) may be cal-
cu la t ed from (1). The submergence point'r) is obtained from (9) and 8, from
(10). Now A , + A, i s ca l cu la t ed from (2) and (11) and compared wi th 1. I f
A , + A2 < 1, N is increased and t h e procedure i s repeated.
found t h a t y i e l d s A , + A 2 > 1, t h e va lue is r e f ined u n t i l s a t i s f a c t o r y
convergence (0.999 LA, + A 2 5 1 . 0 0 1 ) i s obtained.
t o r a f t i ce is obtained as a func t ion of (p, 5, and T:
A small va lue i s picked f o r
When an N is
Thus t h e f o r c e N requi red
N = f,@, 5, -r> (13)
This func t iona l form can be s impl i f i ed . I n (9) w e see t h a t
and from (10)
8 3 - T = f , ( 4 $3 5)
I n equat ion 2 ,
A 2 = f J N , $)
A , = f p , u , $ Y 7, rl, 5)
and i n equat ion 11, 03
A , + A2 = f," $, 5) = 1 ( r a f t i n g condi t ion)
and i t fol lows t h a t
so t h a t N depends on only two v a r i a b l e s , 11, and 5, r a t h e r than t h r e e , as i n
(13)
The .problem wi th t h i s form is t h a t $ is not known a p r i o r i , due t o
t h e dependence on 8, ( s e e equat ion 1). From (3) w e see t h a t
10 3
e,
The func t ion $ depends on @, e,, and T (equat ion 1 3 ) , so t h a t i n terms of
independent v a r i a b l e s \
8, = f J S , 0, The dependence on t h r e e parameters makes g raph ica l p re sen ta t ion d i f f i c u l t .
For tuna te ly , t h i s can be s impl i f i ed i n a l l cases of i n t e r e s t .
i d e n t i t i e s t o expand $, and having a l ready assumed t h a t 8, is a s m a l l angle ,
Using t r i g
Thus i f
le, t a n @ ] << 1,
then
0 2 - - tan$ $ = T
and i t fol lows from func t iona l form f,, i n (15) t h a t
For t y p i c a l p r o p e r t i e s of sea i c e , T 0.1, and condi t ion 1 7 may be
w r i t t e n
Graphing (18), i t is found t h a t 1:l < 1 s o t h a t condi t ion 17 holds f o r
angles @ up t o several degrees . For l a r g e $, t h e a l t e r n a t e approximation
tan4 * =
is v a l i d , s i n c e 8, is a s m a l l angle . Thus, i n a l l cases , $ may be found from
inpu t da t a . The graph of f,, (equat ion 18) is shown i n F igure 2. Deviat ions
from the two v a r i a b l e dependence of (18) appear around tan@/T = 10.
104

T
/ tan CP For > IO
use the approximation qh-. tan+
T
-Asymptotic to %i ~ =-.38
1 I I I l l I 1 I I I I I 1 1 1 1
.I .2 .3 A .5 .6 .8 ID 2 3 4 8 6 8 1 0
Tan # / T
Fig. 2. Rotat ion parameter 8 , / ~ vs. i n i t i a l geometry parameter t:an$/T f o r C; = 0.1.
Having obtained $J from 4 , T , and 5 , may be found as a func t ion of
$ and C;, %from equat ion 1 4 . f o r c e decreases r ap id ly as $ i nc reases . I n t h e l i m i t $ -t 0, one might
expect fl t o approach t h e buckl ing va lue fl = 0.5 f o r a semi - in f in i t e s h e e t
on an elastic foundation. However, o t h e r f a c t o r s lower t h e l i m i t on t h e
maximum value of N. of @. This would be expected, s i n c e $ -t 0 impl ies t h a t t h e predominant
loading is a moment ( s e e equat ion l), which tends t o bend t h e edge of
beam 2 downward. Thus, f o r a s m a l l bu t f i n i t e angle @, t h e e f f e c t i v e ramp
angle Cp - 6, i nc reases as N i nc reases .
ramp angle is non-zero. and equat ions 4 and 1 y i e l d
This func t ion is shown i n F igure 3. The r a f t i n g
Note i n Figure 2 t h a t 8, is negat ive f o r s m a l l va lues
I n t h e l i m i t @ -t 0, t h e e f f e c t i v e
105

2 -
. I
.06
A4
(r
\ cm- LL
"A .02
II
z
.01
.006
.ow
/ /
*Limit value 9 = 2N f i
Limit, submerged beam buckles, & = 0.1
- - - - - - -
-
- - - - - - - 1 1 1 I I I I I I I I I I I 1 1 1 1 I
20 3 .4 .5 6 .7 .B .9 LO 2 3 4 5 6 7 8 9 1 0
tan (+-e2) A t
Fig. 3 . Dimensionless in-plane f o r c e N vs. deformed geometry parameter f o r 5 = 0.1.
This l i m i t curve is shown i n Figure 3 .
approaches t h e l i m i t i n a smooth manner, a maximum value of N implied.
appendix, i t is shown t h a t
Assuming t h a t t h e 5 = 0.1 load curve
0 . 2 1 is
I n t h e However, another l i m i t is reached be fo re t h i s po in t .
u = n / 2
i s t h e c r i t i c a l condi t ion f o r buckl ing of a beam column. I n t h e p re sen t contex t ,
106

The r a t i o 2U/T is shown i n F igure 4 .
approaches 1. A t approximately J, = 0.41, t h e submerged beam buckles . For
t h e va lues of 5 t y p i c a l f o r ice, buckl ing of t h e submerged beam always occurs
be fo re t h e l i m i t i n (20) i s reached. Thus t h e l i m i t va lue of N is con t ro l l ed
by t h e buckl ing of t h e submerged beam, r a t h e r than buckling of a beam on an
e las t ic foundation.
Note t h a t f o r small 9 , t h i s r a t i o
I I I I I I I I
.6 .E ID 20 3.0 5.0 8.0 lox) 0
A
Fig. 4 . Buckling r a t i o U / ( I T / ~ ) f o r submerged beam vs. deformed geometry parameter $J f o r 5 = 0.1.
The l o c a t i o n 05 t h e buckl ing curve i n t h e N , $ plane can be found by
The l i m i t curve f o r 5 = 0.1 is shown i n s u b s t i t u t i n g r) = T / 4 f i i n t o ( 9 ) .
F igure 3. Thus, even i n rrhe l i m i t 41 -f 0 t h e f o r c e requi red t o r a f t ice is
only about 40% of t h e f o r c e requi red t o buckle a semi - in f in i t e p l a t e on an
e l a s t i c foundat ion.
10 7

STRESSES DURING RAFTING
The bending of t h e two ice s h e e t s during r a f t i n g creates stress i n t h e
ice. The predominant stress is t h e tens i le and compressive bending stress,
which varies l i n e a r l y through t h e th ickness , reaching maximum values a t t h e
top and bottom su r faces . The d i r e c t compressive stress due t o F and t h e
shear stresses are n e g l i g i b l e by comparison.
Simple r a f t i n g can occur i n i c e s h e e t s only i f t h e maximum stresses
requi red by t h e deformation do not exceed f r a c t u r e l e v e l s . I f f r a c t u r e
occurs , an i c e block w i l l break o f f and t h e s h e e t s w i l l f a i l . t o r a f t . These
ice blocks may then provide t h e rubble which is necessary i n t h e r idg ing
model proposed by Parmerter and Coon [1973]. Thus, by consider ing t h e
stresses induced i n t h e i c e as a func t ion of th ickness , i t should be p o s s i b l e
t o p r e d i c t a crossover po in t between r idg ing and r a f t i n g . F i e ld observa t ions
suggest t h a t such a crossover e x i s t s . To quote Weeks and Kovacs [1970]:
It is our impression t h a t i f both i n t e r a c t i n g ice s h e e t s are of approximately t h e same th ickness t h e r e is a gradual t r a n s i - t i o n between f i n g e r and simple r a f t i n g , and p res su re r idg ing . This change starts when t h e ice involved i n t h e t h r u s t i n g is s u f f i c i e n t l y t h i c k s o t h a t t h e stress developed when t h e over lap forms causes t h e ice s h e e t t o f a i l . This occurs i n i c e of a th ickness of 15 cm although w e have seen t h r u s t s wi th very l i t t l e f r a c t u r i n g i n ice 30 cm th i ck .
Matsuoka [1972] considered t h i s problem wi th a s i m p l e r model. I n h i s
c a l c u l a t i o n s , t h e i n t e r a c t i o n of t h e two s h e e t s w a s taken t o be a v e r t i c a l
f o r c e and t h e moment w a s ignored. This corresponds t o t h e l i m i t $ -t 03 i n
t h e p re sen t a n a l y s i s . H e a l s o ignored t h e coupl ing between ver t ical def lec-
t i o n s and t h e in-plane f o r c e F. This coupling is n e g l i g i b l e , provided F
does no t approach t h e buckl ing va lue ; t h a t is, provided N << 0.5 and U << 'rr/2.
From f i g u r e s 3 and 4 w e see t h a t i n t h e present a n a l y s i s t h e s e condi t ions
are s a t i s f i e d as 9 -t a. Thus Matsuoka's a n a l y s i s providesa c o r r e c t l i m i t
po in t f o r t h e present work.
The maximum stress i n each s h e e t is r e l a t e d t o t h e maximum moment by
- - (j'max - $2
0 max
108

The moment can be ca l cu la t ed from t h e d e f l e c t i o n 6 ( x )
It can be shown [Parmerter , 19731 t h a t f o r t h i s problem a dimensionless stress parameter C can be def ined which is a func t ion of only and 5 :
where 0, i.s t h e t e n s i l e s t r e n g t h of ice.
I n t.he sunken po r t ion of t h e beam, t h e expression f o r C is
C = A , s i n y x + B l c o s y x + C,
where Y = 2 h f i
A I = 1.5 { 2 ( $ +?) 83 f i s e c U - 2 N t a n U - #U 5 secU - t a n U )
B, = 1 . 5 1 5 - 2 N 1
C, = - 1.5 5.
The naximum occurs a t t h e po in t t h a t - dC = 0 => x = - 1 tan” (A1/B,) o r a t t h e Cfx Y
po in t t h a t x = 2 , o r x = 0.
The corresponding r e s u l t s i n beam 2 a r e
e-a’ { A ~ cos ~y + B2sin 69) 3N C = 7 /l + N (1 - 2N)
where a = Am
A 2 = v’l + N (1 - 28)
B = Jl - N ( 1 + 2N) - 2$ 2
The maximum occurs a t t h e po in t t h a t
o r a t t h e pioint t h a t y = 0.
109

The stresses i n beam 3 are
CA3cos P + B3s in k E ) 4- C = e
where f = z - Z = 3 { c ( 1 - 2N) - 2- (a$ - <r l>)
A 3
The maximum occurs a t
- d1 + N B , - 41 - N A 3 - 1 z = - tan-'
B B, + A ,
o r a t X = 0.
Once t h e equi l ibr ium va lue of N has been determined, each of t h e s e
expressions f o r maximum stress can be evaluated and t h e l a r g e s t maximum can
be found. Over t h e range of parameters considered, t h e l a r g e s t stress w a s
always found i n t h e submerged shee t (beam 1 ) .
of t h e maximum is shown i n F igure 5, a long wi th t h e dimensionless po in t rl
a t which t h e beam submerges. Note t h a t h z < n, so t h a t t h e overr idden shee t
always breaks i n t h e underwater po r t ion .
The dimensionless l o c a t i o n h z
The c r i t i c a l stress parameter C is shown i n F igure 6. P o i n t s on t h e
curve are combinations of material p r o p e r t i e s and th ickness which cause t h e
s h e e t t o break i n t h e conf igura t ion shown i n F igure 1C. I f t h e s h e e t i s
t h i c k e r than t h i s c r i t i c a l va lue , i t w i l l break be fo re t h e r a f t i n g configura-
t i o n i s reached, i n t h e conf igura t ion of Fig. 1 B .
Assuming, f o r example, t h a t @ is l a r g e enough t h a t $ > 6, t h e asymptotic
Then t h e maximum th ickness s a t i s f i e s t h e equat ion va lue = 0.46 may b e used.
Solving. f o r tmax
2 (1 - v2> :c-
Pwg E = 14.2 max t
110

17
1.6
1.5
I .4
I 3
1.2
Fig. 5. Locat ion of submergence po in t ~l and l o c a t i o n of maximum stress Ax, vs. deformed geometry parameter $, f o r 5 = 0.1.
= 0,I
\
7) (SUBMERGENCE POINT)
ASYMPTOTIC VALUES
A X (LOCATION OF MAXIMUM STRESS)
I I I I 1 1 I .4 .6 .a LO 4x, 6.0
For t y p i c a l young ice p r o p e r t i e s
oc = 2 X l o 6 dyn/cm2
E = 3 x lo9 dyn/cm2
v = 0.3
= 1009 dyn/cm3 p w9
equat ion 2 1 y i e l d s a maximum r a f t i n g th ickness of t = 1 7 cm. max
Note t h a t t h e maximum th ickness (21) depends on t h e square of t h e
s t r e n g t h (sc.
Weeks and Anderson [1958] r e p o r t va lues of cTc i n t h e range l o 6 < oC < 3.5
X l o 6 dyn/cm2.
is a l s o a s u r p r i s i n g l y l a r g e scatter i n t h e modulus of young ice, l o 9 < E
< 8 X l o 9 dyn/cm2, whi le E = 10” is t y p i c a l of o lde r i c e .
The s t r e n g t h and modulus of young ice are widely v a r i a b l e .
Older ice may be as s t r o n g as oc = 2 x l o 7 dyn/cm2. There
111

1 1 I I l l , I I I I I I I I I I
.3 -4 .6 .6 .7 .8 11) 21) 3.0 4D 6.0 60 80 IOD 20.0
9- Fig. 6 . S t r e s s parameter C vs . deformed geometry parameter $,
f o r 5 = 0.1.
The va lue t = 1 7 cm f o r t h e crossover between r a f t i n g and r idg ing is
i n good agreement wi th t h e observa t ions of Weeks and Kovacs. The v a r i a b i l i t y
of i c e p r o p e r t i e s and t h e s t rong dependence on 0, exp la in t h e later r e p o r t
by Kovacs [1972] t h a t on occasion ice t h i c k e r than 1 meter can r a f t .
CONCLUSIONS
A mechanical model of s imple r a f t i n g has been proposed. Calcu la t ions
based on t h i s model show t h a t r a f t i n g can be i n i t i a t e d by in-plane f o r c e s
i n t h e i ce s h e e t t h a t are only a s m a l l percentage of t h e f o r c e requi red t o
buckle t h e shee t . Maximum r a f t i n g fo rces are found t o be about 40% of t h e
buckl ing load.
1 1 2

It i s found t h a t maximum stress i n t h e ice shee t always occurs i n t h e
submerged po r t ion of t h e overr idden shee t . The maximum stress inc reases
as t h e th ickness of t h e s h e e t i nc reases . Thus a l i m i t i n g th ickness f o r
r a f t i n g can be found, where t h e r a f t i n g stresses are s u f f i c i e n t t o f r a c t u r e
t h e ice.
ice s t r e n g t h . For t y p i c a l young ice p r o p e r t i e s , a maximum r a f t i n g th ickness
of 1 7 c m is ca l cu la t ed , i n good agreement wi th f i e l d observa t ions . The
v a r i a b i l i t y of i c e p r o p e r t i e s accounts f o r occas iona l observa t ions of
r a f t i n g i n much t h i c k e r i c e .
This maximum th ickness is found t o depend on t h e square of t h e
ACKNOWLEDGMENT
This research w a s supported by t h e Nat ional Science Foundation under
Grant GV-28807, wi th t h e Univers i ty of Washington, f o r support of t h e Arctic
Sea Ice Study.
REFERENCES
Hetenyi, M. 1946. Beams on Elastic Foundation. Ann Arbor, Mich.: Univers i ty of Michigan P res s , 127-138.
Kovacs, A . 1972. On pressured sea ice . I n Sea Ice: Proceedings of an International Conference, Reykjavik, Iceland, May 10-13, 1971, ed. Thorbj'drn Karlsson. Nat iona l Research Council, R.eykjavik, Ice land , 276-295.
Matsuoka, K. 1972. The mechanics of f r a c t u r e of sea ice i n l eads . Master's t h e s i s , Univers i ty of Washington.
Parmerter , R. R. 1973. Dimensionless s t r e n g t h parameters f o r f l o a t i n g i c e s h e e t s . Proceedings of the Second International Conference on Port and Ocean Engineering under Arctic Conditions, Eeykjavik, IceZand, 27-30 August 1973. I n press . Reprinted i n AIDJEX Bulletin No. 23.
Parmerter , R. R. , and M. D. Coon. 1973. Mechanical models of r i dg ing i n t h e a r c t i c sea i c e cover. AIDJEX Bul.Zetin No. 19, 59-112.
Popov, E. P. 1968. Introduction to Mechanics of S o l i d s . Englewood C l i f f s , N . J . : P r e n t i c e H a l l , 522.
Weeks, W. F., and D. L. Anderson. 1958. An experimental s tudy of s t r e n g t h of young sea i c e . E@S, Trans. Am. Geophys. Union 39(4): 641-647.
113

Weeks, W . F. , and A. Kovacs. 1970. On p res su re r idges . Report f o r t h e U.S. Army Cold Regions Research and Engineering Laboratory, Hanover, New Hampshire.
APPENDIX
B e a m on Elas t ic Foundation
Consider a semi - in f in i t e beam on an e l a s t i c foundat ion. The f r e e end
is subjec ted t o an a x i a l f o r c e F, a t r ansve r se f o r c e P, and a moment M,.
Sign conventions are shown i n F igure 1.
conventions, can be found i n chapter 6 of Hetenyi [ 1 9 4 6 ] .
The s o l u t i o n , wi th d i f f e r e n t s i g n
L e t K = modulus of foundat ion
N = FA2/K
Then t h e d e f l e c t i o n 6 , r o t a t i o n 0 , and mometit M are
M - j$ [ B cos BX - a s i n B x I 3
I f a semi - in f in i t e p l a t e i s subjec ted t o a uniform l i n e load and moment a t
t h e edge, t h e same s o l u t i o n s apply, wi th t h e p l a t e s t i f f n e s s D = E t 3 / 1 2 ( l - v2) r ep lac ing EI i n a l l equat ions.
l ength i n t h e equiva len t p l a t e problem.
The loads F, P, and M, become loads per u n i t
1 1 4

It is clear from these equat ions t h a t a buckl ing condi t ion is reached
when
3a2 - B2 = 0 => N = 0.5
I n o t h e r words, an a x i a l f o r c e F = 0.5K/X2 w i l l cause uns t ab le l a te ra l
deformations, even i f M, = P = 0.
exponent ia l ly damped over a c h a r a c t e r i s t i c l eng th l/a. t h i s d i s t a n c e is of t h e same order as 1/X. For t y p i c a l i c e p r o p e r t i e s ,
1/X falls i n t h e range 10t < 1/X < 2 0 t .
Also, no te t h a t t h e s o l u t i o n s are
Since N < 0.5,
Cant i lever B e a m Column
Consider a c a n t i l e v e r beam of length L , subjec ted t o an a x i a l f o r c e F, a uniform t r a s v e r s e loading of i n t e n s i t y q , and end loading P and M,.
(Sign conventions are shown i n F igure 1.) The b a s i c d i f f e r e n t i a l equat ions
(see f o r example Popov [1968]) can be i n t e g r a t e d t o o b t a i n the fol lowing
s o l u t i o n .
L e t y = and U = y L . Then
1 P F y
- T [ u t an u + cosyx - s e c u + ' i(y2x2 -J*)
6 = - { - [ t a n U - U + yx - sec U s inyx] + M, [ t a n U sinyx + cosyx - s e c U]
( A 4 ) cl Y + ( t a n u - u sec ~ ) s i n y x ~ >
1 e = , {P[sec U cosyx - 1 1 - yMo[tan U cosyx - s inyz ]
4 Y + - [ ( t a n u - u s e c ~ ) c o s y z - s i n y z + yx] 1
P Y M = - - sec U s inyx + M,[tan U s inyz + cosyx]
(A6) 9 Y + 7 [(U s e c U - t a n U)sinyx - cosyz -t 1 1
Again, t h e problem of one-dimensional loading on a c a n t i l e v e r p l a t e
can be obtained by r ep lac ing EI by D.
per u n i t l ength , wh i l e q becomes a load per u n i t area.
The loads P , M,, and F become loads
I n these equat ions, buckling occurs when U = ~ / 2 , s i n c e t h e terms
t an U and s e c U become unbounded a t t h a t po in t .
115

ON THE CALCULATION OF THE ROUGHNESS PARAMETER OF SEA I C E
Chi-Hai Ling and Norbert Un te r s t e ine r Arctic Ice D y n d c s Joint Experiment
University of Washington, Seattle, Washington
ABSTRACT
A method i s descr ibed f o r c a l c u l a t i n g t h e roughness parameter Ins t ead of t h e convent ional z o of sea i c e from v e l o c i t y p r o f i l e s .
procedure of determining an i n d i v i d u a l z o f o r each observed v e l o c i t y p r o f i l e , t h i s method uses a number of p r o f i l e s t o f i n d a s i n g l e va lue f o r z o . Arctic, i t is shown t h a t t he method g r e a t l y reduces t h e s c a t t e r i n z o and produces cons i s t en t values f o r t h e f r i c t i o n v e l o c i t y uJt.
By means of a set of d a t a obtained i n t h e
A i r stress i s the p r i n c i p a l fo rce i n t h e dynamics of sea ice. The
magnitude of t h i s fo rce i s determined by the ho r i zon ta l wind v e l o c i t y , t h e
v e r t i c a l f l u x dens i ty of momentum, and t h e roughness of t h e su r face . The
l a t te r i s genera l ly def ined by a s i n g l e parameter of dimension (cm). Its
numerical va lue must be determined by f i e l d observa t ions .
I n tu rbu len t flow, the fol lowing r e l a t i o n s h i p i s genera l ly considered
t o be a good approximation near a rough su r face :
where u i s t h e v e l o c i t y p a r a l l e l t o t h e su r face , uJt t h e f r i c t i o n v e l o c i t y ,
k the von Karman cons tan t , z t h e d i s t ance from t h e su r face , d t h e displacement
he igh t [Le t t au , 19571 , and z0 t h e roughness parameter.
A t some d i s t ance from the su r face , p a r t i c u l a r l y i f i t is smooth, t h e
e f f e c t of the displacement he igh t becomes n e g l i g i b l e . Hence,
u* 2
k 0 u = - 1 n z
holds wi th s u f f i c i e n t accuracy.
117

Equation 2 can be der ived from P r a n d t l ' s mixing length theory [Schlich- t i n g , 1962, p. 477-4891.
1. The v e l o c i t y u i s a func t ion of z on ly , and thus the re i s no
vertical component, o r u = u ( z ) , v = w = 0.
The stress i s cons tan t near t h e s u r f a c e , o r T = T ~ .
The mixing length i s p ropor t iona l t o t h e d i s t a n c e from the w a l l ,
o r 2 = k z .
2.
3 .
A common procedure t o determine z o is t o select observat ions t h a t f i t
equat ion 2 , and e x t r a p o l a t e a p l o t of u versus In z downward t o t h e po in t
where 2, = 0.
z = z o , and the s l o p e of t h e p l o t i s p ropor t iona l t o u*. The he igh t of t h a t p o i n t over a f i c t i t i o u s su r face is then
This procedure, shown i n Figure 1, w a s used by Un te r s t e ine r and
Badgley [1965] t o c a l c u l a t e the roughness parameters of sea ice , f o r both
upper and lower s u r f a c e s .
roughness parameter v a r i e s g rea t ly .
d i r e c t i o n and dens i ty s t r a t i f i c a t i o n , as mentioned i n t h e i r paper.
p re sen t r e p o r t , a method of c a l c u l a t i o n is suggested as an at tempt t o evalu-
a te the roughness parameter of sea i c e i n a way t h a t y i e l d s more c o n s i s t e n t
r e s u l t s .
They found t h a t , even a t t h e same loca t ion , t h e
This i s perhaps due t o change of wind
In t h e
U
Fig.
I" 20 I n z 1. F i t t i n g d a t a wi th a semi-log curve
118

I n the classical measurements of flow i n rough pipes by Nikuradse [1933]
an empir ical formula w a s obtained:
U Y - = 2.5 I n - + B u* kS
(3)
where k , i s t h e he igh t of t h e roughness element of t h e sand t h a t was glued
on t o t he p ipe w a l l ; y i s the d i s t ance from t h e w a l l ; and B is a constant
t h a t v a r i e s from 6.5 t o about 9.0 f o r smooth pipes and from 8.5 t o 9.5 f o r
t r a n s i t i o n , and s t a y s a t 8.5 for completely rough p ipes [Sch l i ch t ing , 1962,
p. 522-5233. Figure 2 shows the v a r i a t i o n o f E.
I I I
Fig. 2. Var ia t ion of B.
-B/2.5 Defining y o = e k,, (3) can be r ewr i t t en as
U Y - = 2.5 In - u* Y O
B v a r i e s between 8.5 and 9.5 €or non-smooth p ipes , a roughness
non-smooth p i p e s i s always between about 1/30 and 1/40 t h a t of
Actua l ly , a0 rock [ 19731 pointed out t h a t t he flow the roughness he ight k , . er u,k,/v f o r t he sea ice corresponds t o t h a t of a rough p ipe ,
f o r which B = 8.5. In o the r words, t h e roughness parameter y o f o r non-smooth
pipes is n e a r l y independent of t h e flow v e l o c i t y f o r a s p e c i f i e d p ipe su r face
and should the re fo re be considered t o desc r ibe a phys ica l c h a r a c t e r i s t i c
of t h e su r face .
119

Applying t h i s e s t a b l i s h e d reasoning t o a n a t u r a l su r f ace , one should
expect t h a t observa t ions obta ined a t one l o c a t i o n wi th e s s e n t i a l l y cons tan t
s u r f a c e roughness should n o t show t h e l a r g e scatter of z o repor ted by some
authors .
This s c a t t e r i n g is due t o f i t t i n g i n d i v i d u a l p r o f i l e s of d a t a wi th (2) . In the atmospheric boundary l a y e r , one i s much less c e r t a i n about t h e v a l i d i t y
of t he P rand t l assumptions (pr imar i ly due t o s t r a t i f i c a t i o n ) , e s p e c i a l l y t h e
assumption regarding t h e mixing length .
condi t ions i n which the mixing length varies non l inea r ly wi th he igh t .
are a l s o cases i n which k # 0.4 [Businger e t a l . , 19711. Under these con-
d i t i o n s , (2) is no longer app l i cab le wi thout proper modi f ica t ions f o r t h e
c a l c u l a t i o n of z o as w e l l as u*.
There are p o s s i b l e atmospheric
There
We sugges t t h e following:
1.
2 .
Use only those p r o f i l e s t h a t are logar i thmic o r n e a r l y logar i thmic ,
because wi th non-logarithmic v e l o c i t y p r o f i l e s , f r i c t i o n l a w s
equiva len t t o (2) have y e t t o be found; and work such as t h a t of
Nikuradse has t o be done f o r a v a r i e t y of mixing l eng th func t ions
so t h a t z o w i l l be meaningful i n those " f r i c t i o n laws."
Ins t ead of f i t t i n g ind iv idua l p r o f i l e s t o ( 2 ) , f i t t oge the r a l l
loga r i thmic p r o f i l e s f o r t h e same l o c a t i o n on a p l o t of UIU, versus I n z [Schubauer and Tchen, 1961; Richards, 19731.
The procedure can be b e s t represented by Figure 3 , i n which a number
of p r o f i l e s are p l o t t e d . The o b j e c t i v e is t o move along t h e h o r i z o n t a l axis
u n t i l one f i n d s a z o such t h a t s t r a i g h t l i n e s drawn through i t approximate
t h e da ta sets wi th t h e least t o t a l "e r ror" ( t o be more exac t , t h e dimension-
less e r r o r ) .
t h ree zols.
For i l l u s t r a t i v e purposes, ( z ~ ) ~ i s t h e b e s t va lue among t h e
Thorndike [1973] suggested t h e fo l lowing a lgeb ra t o show t h e b e s t
f i t t i n g procedure :
ij 1 - 1 n - - e k zo ij z ij U
U - =
*j ( 4 )
where i r e f e r s t o t h e i t h p o i n t of a p r o f i l e , j r e f e r s to t h e j t h p r o f i l e , and
and e i s the e r r o r , o r t he d i f f e r e n c e between t h e f i t t e d curve and t h e
measured u.
120

700..
600 -
600 -
400-
U
#x)-
200-
I
/
0
Fig. 3 . Finding of a z o t h a t b e s t f i t s a l l v e l o c i t y p r o f i l e s . The un i t f o r t h e ver t ical axis is i n r evo lu t ions pe r 10 minutes of a 3-cup anemometer.
. . . u which minimizes *M We wish to f i n d z o
2 + e + ... ~ = e . = e 2 + e 2, J- 1 Y 1 2 Y 1 + * * * + enlYl 1 Y 2
Rewriting ( 4 ) w e o b t a i n
1 1 1 - I n z . = - In z o + u..(-) + e . k 2,J- k 23 u*j 2, i
I n matrix form one could w r i t e
Y = X B + E
12s

where
Y = z 1
B =
u* 1
1
*2
- U
1 - u* M
1 I n z,, - -
X =
E =
1,1 e
e nl,l
o . . . . . . . . o
0
u 1 y 2
U n2 ,2 0
0
0 U nMYM
Note t h a t n i s the number of d a t a po in t s i n each p r o f i l e . j
T The s o l u t i o n [Mood and Graybi l l , 19631 f o r 6 which minimizes E E i s
A
p = (xTx)-' XTY (5) A
I n t h i s way, 2 provides a d i f f e r e n t s l o p e u i n t e r c e p t In z o which, taken a l l t oge the r , "best" f i t t h e d a t a po in t s .
f o r each p r o f i l e and a common A *j
- 1 1 1
1 1 1
-
Values of the roughness parameter of sea ice previous ly obta ined can
be found i n Un te r s t e ine r and Badgley [1965] , S e i f e r t and Langleben [1972] ,
122
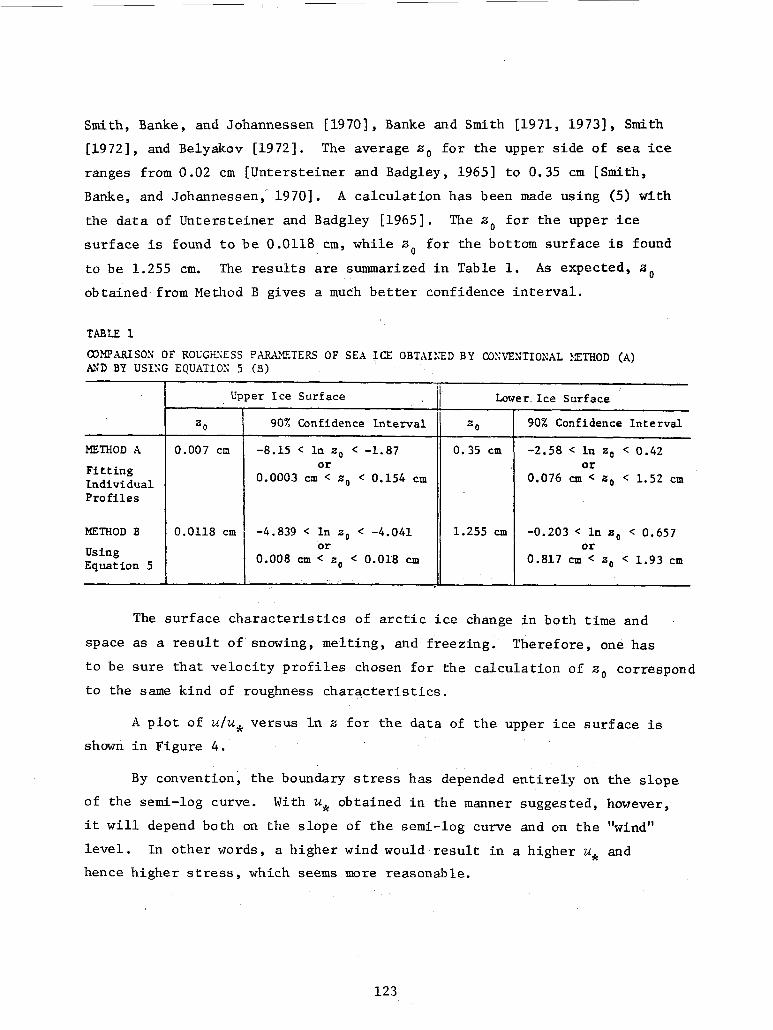
Smith, Banke, and Johannessen [1970], Banke and Smith [1971, 19731, Smith
[1972], and Belyakov [1972]. The average z o f o r t h e upper s i d e of sea ice
ranges from 0.02 cm [Unters te iner and Badgley, 19651 t o 0.35 cm [Smith,
Banke, and Johannessen, 19701. A c a l c u l a t i o n has been made using (5) with
the d a t a of Unters te iner and Badgley [1965].
s u r f a c e i s found t o b e 0.0118 cm, whi le z 0 f o r t h e bottom su r face i s found
t o be 1 .255 cm.
obtained from Method B gives a much b e t t e r confidence i n t e r v a l .
The z o f o r t h e upper ice
The r e s u l t s are summarized i n Table 1. As expected, ,'do
METHOD A
F i t t ing Individual P r o f i l e s
METHOD B
U s i n g Equation 5
Lower. Ice Surface Upper Ice Surface
90% Confidence Interval
-2.58 < In z,, < 0.42
0.076 an < z 0 < 1.52 cm
2 0
0.35 cm
909, Confidence Interval 2 0
0.007 cm -8.15 < In z 0 < -1.87
0.0003 cm < z,, < 0.154 c m or or
0.0118 cm -4.839 < In z,, < -4.041
0.008 cm < z g < 0.018 cm
1.255 up -0.203 < In z0 < 0 . 6 5 7
0.817 cm < z,, < 1 . 9 3 cm or or
A p l o t of u/u, versus I n z f o r t h e d a t a of t h e upper i c e s u r f a c e i s
shown i n Figure 4 .
By convention, t h e boundary stress has depended e n t i r e l y on t h e s lope
of the semi-log curve.
i t w i l l depend both on t h e s l o p e of t h e semi-log curve and on t h e "wind"
level.
hence h ighe r stress , which seems more reasonable.
With UJc obtained i n the manner suggested, however,
In o the r words, a h ighe r wind would r e s u l t i n a h ighe r uJc and
123
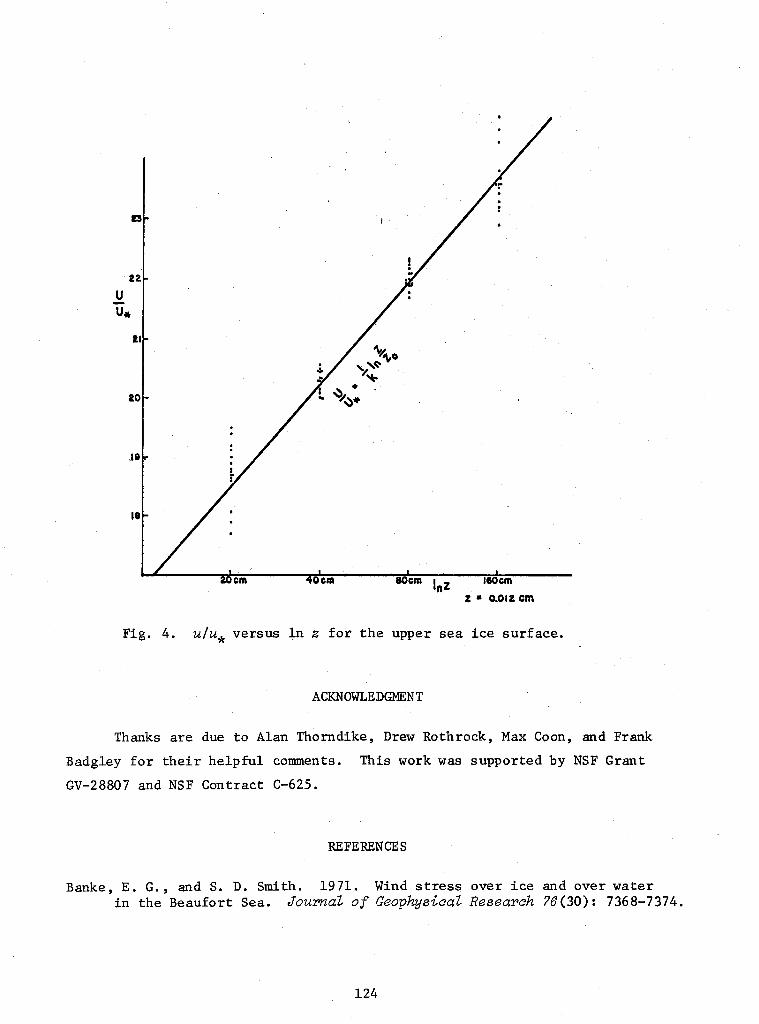
z = 0.012cm
Fig. 4. u/u, versus I n z f o r t h e upper sea ice sur face .
ACKNOWLEDGMENT
Thanks are due t o Alan Thorndike, Drew Rothrock, Max Coon, and Frank
Badgley f o r t h e i r h e l p f u l comments.
GV-28807 and NSF Contract C-625.
This work w a s supported by NSF G r a n t
REFERENCES
Banke, E . G . , and S. D. Smith. 1971. Wind stress over ice and over water i n t h e Beaufort Sea. JoumaZ of GeophysicaZ Research 76(30): 7368-7374.
124

Banke, E. G . , and S. D. Smith. 1973. Wind stress on a r c t i c sea ice . Submt t t e d t o Journal of Geophysical Research.
Belyakov, L. N. 1972. Proceedings of t h e Symposiwn on Sea-Air Interaction i n th.e Polar Regions, Leningrad, 1972. ( In press .)
Businger, J. , J . C. Syngaard, Y . Izumi, and E . Bradley. 1971. Flux p r o f i l e r e l a t i o n s h i p s i n t h e atmospheric su r face l aye r . Science 28: 1021-1025.
Journal o f Atmospheric
Langleben, M. P. 1972. A s tudy of t h e roughness parameters of sea i ce from wind p r o f i l e s . Journal of Geophysical Research 77(30): 5935-5944.
Le t tau , H. H. 1957. Computation of Richardson numbers, c l a s s i f i c a t i o n of wind p r o f i l e s , and determinat ion of roughness parameters. Exploring the Atmosphere's First Mile, vo l . I . New York: Pergamon P r e s s , 328-336.
Mood, A. M., and F. A. Grayb i l l . 1963. Introduction t o the Theory of S t a t i s t i c s . New York: McGraw-Hill, 343-349.
Nikuradse, J. 1933. StrEmungsgesetze i n rauben Rohren. Forschungsheft 361.
Sch l i ch t ing , H. 1962. Boundary Layer Theory. New York: McGraw-Hill, 477, 489, 522-52 3.
Schubauer, G. B . , and C . M. Tchen. 1959. Turbulent Flow. Pr ince ton , N . J . : P r ince ton Univers i ty Press .
Se i fe r t , W. J. , and M. P. Langleben. 1972. A i r drag c o e f f i c i e n t and roughness length of a cover of sea ice. 2708-2713.
Journal o f Geophysical Research 77(15):
Smith, S. D. , E. G. Banke, and 0. M. Johannessen. 1970. Wind stress and turbulence over i ce i n t h e Gulf of S t . Lawrence. Research 75(15): 2803-2812.
Journal o f Geophysical
Smith, S. D. 1972. Wind stress and turbulence over a f l a t ice f l o e . Journal o f Geophysical Research 77(21) : 3886-3901.
Un te r s t e ine r , N . , and F. I. Badgley. 1965. The roughness parameters of sea i c e . Journal of Geophysical Research 70(18) : 4573-4577.
125

CLASSIFICATION AND VARIATION OF SEA ICE RIDGING IN THE ARCTIC BASIN
W. D. Hib ler 111, S. J, Mock U.S. A r r y CoZd Regions Research and Engineering Laboratory
Hanover, Nm Hampshire
and
W. B. Tucker I11 Naval Oceanographic Office, PoZar Oceanography Division
Washington, D . C.
ABSTRACT
A one-parameter model f o r pressure r idges is developed and compared wi th good agreement t o more than 3000 km of laser p r o f i l e d a t a taken from November 1970 t o February 1973 i n t h e Arctic bas in . Using a parameter c a l l e d r idg ing i n t e n s i t y (denoted by yh) , which may be determined f o r a reg ion from t h e mean number of r i dges per u n i t l eng th and t h e mean r i d g e he igh t , t h e number of r idges per ki lometer a t any he ight l e v e l may be predic ted . Resul t s from a s tudy of r eg iona l and temporal var ia - t i o n i n r idg ing i n d i c a t e t h a t although magnitudes of r idg ing i n t e n s i t y vary i n t i m e , t h e r e l a t i v e r eg iona l v a r i a t i o n s are s imilar . Consequently, t h r e e d i s t i n c t reg ions of r idg ing in ten- s i t y having r e l a t i v e l y s t a b l e boundaries can be def ined . Annual v a r i a t i o n i n new i c e product ion due t o r idg ing is s u f f i c i e n t l y l a r g e t o suggest t h a t r i dg ing plays an important r o l e i n t h e o v e r a l l mass balance of t h e Arctic bas in .
INTRODUCTION
I n r ecen t yea r s t h e s tudy of pressure r idges has been an a c t i v e area
of research t h a t has l e d t o t h e development of formation models [Parmerter
and Coon, 19721, a genera l understanding of r i d g e morphological cha rac t e r i s -
t i c s [Weeks e t a l . , 1971; Kovacs, 19721, and development of models capable
of p red ic t ing t h e he ight and s p a t i a l d i s t r i b u t i o n s of p re s su re r idges [Hibler
e t a l . , 19721. The l a r g e q u a n t i t i e s of laser p r o f i l e d a t a r e c e n t l y acquired
1 2 7

over t h e Arctic i c e pack provide a unique source of d a t a wi th which t o examine
f u r t h e r t h e s ta t i s t ica l p r o p e r t i e s of p re s su re r idges . I n p a r t i c u l a r , t h e
laser d a t a base is l a r g e enough tq al low a q u a n t i t a t i v e r eg iona l and seasonal
c l a s s i f i c a t i o n of t h e r idg ing p r o p e r t i e s of t h e western Arctic bas in .
To c a r r y out such a q u a n t i t a t i v e c l a s s i f i c a t i o n , w e w i l l d i s cuss he re
a one-parameter model f o r t h e pressure r i d g e he igh t d i s t r i b u t i o n t h a t
provides a coherent and usable c l a s s i f i c a t i o n scheme f o r p re s su re r idg ing .
The b a s i c parameter i n t h e r i d g e model is t h e r idg ing i n t e n s i t y y which
may be uniquely determined f o r a reg ion by t h e mean number of r i d g e s pe r
u n i t l ength 1-1 (above an a r b i t r a r y cu tof f he ight h ) , and t h e mean r i d g e h he ight < Hh > . Once y is known, t h e model a l lows t h e p r e d i c t i o n of t h e
number of r idges per u n i t l ength above any he ight .
h y
h
I n t h i s r e p o r t , t h e r i d g e model, an extension of an earlier two-
parameter model [Hibler e t al . , 19721 , is f i t t e d w i t h good agreement t o
r i d g e he ight d i s t r i b u t i o n s obtained from more than 3000 km of laser p r o f i l e
d a t a taken from November 1970 t o February 1973. W e a l s o examine t h e sampling
s t a b i l i t y of va r ious r i d g e parameters.
temporal v a r i a t i o n i n r idg ing from November 1970 t o February 1973 is c a r r i e d
ou t , producing maps t h a t show approximate contours of r idg ing i n t e n s i t y as
a func t ion of t i m e f o r d i f f e r e n t regions.
F i n a l l y a s tudy of r eg iona l and
RIDGE CLASSIFICATION MODEL
There are s e v e r a l ways t o c l a s s i f y r idg ing c h a r a c t e r i s t i c s . The
scheme d iscussed h e r e w a s designed o r i g i n a l l y t o p r e d i c t t h e frequency of
r idges above any given he ight s o t h a t t h e mobi l i ty of veh ic l e s w i th va r ious
he igh t c learances could be determined. However, as w i l l b e shown later, t h e
model is a l s o r e l a t e d t o ice deformation and thus has important imp l i ca t ions
f o r ice dynamics and m a s s balance.
One-parameter r i d g e model
The s t a r t i n g po in t f o r t h e one-parameter model is t h e r i d g e he igh t
p r o b a b i l i t y dens i ty func t ion der ived by Hib ler e t a l . [1972]. Using t h i s
model t h e r idg ing c h a r a c t e r i s t i c s of a reg ion are determined by t h e two
128

parameters
t i o n from t h e equat ion
and < Hh >, which al low c a l c u l a t i o n of t h e r i d g e he igh t d i s t r i b u -
where P(H)dH is t h e number of r i d g e s per ki lometer w i th he igh t s between H
and H+&; uh i s t h e number of r idges per ki lometer
a r b i t r a r y cu tof f h e i g h t ; < H h > i s t h e mean r i d g e he igh t of a l l r i d g e s above
h; and X is t h e d i s t r i b u t i o n shape parameter which can be determined from
< H h > . Equation 1 w a s shown by Hib ler e t a l . [1972] t o genera te t h e most
probable arrangement of a given number of r idges i n ca t egor i e s of equal
he igh t f o r a given amount of deformed ice, wi th no r e s t r i c t i o n placed on
t h e maximum r i d g e he ight .
above he igh t h , a n
To form a one-parameter model using equat ion 1 w e f i r s t d e f i n e a
Second, w e - quan t i ty y
assume t h a t equat ion 1 may be w r i t t e n i n t h e form
= 1-1 / A , which w e s h a l l ca l l r idg ing i n t e n s i t y . h h
where F(yh) is est imated by p l o t t i n g
1
erf c ( h a )
versus y and f i t t i n g t h e d a t a wi th a l i n e a r r eg res s ion l i n e of t h e form
~ ( y ~ ) = m$ -i- b. I n t e g r a t i n g equat ion 2 g ives h’
Using t h i s express ion and t h e r eg res s ion l i n e of F upon F, sets of va lues
for X and F ( y ) corresponding t o a given va lue of may be found. These
va lues a l low c a l c u l a t i o n of t h e number of r idges i n d i f f e r e n t he igh t cate-
g o r i e s us ing equat ion 2.
h
h h
C lea r ly t h e b a s i c assumption needed t o form t h e one-parameter model
is t h a t t h e r i d g e he igh t p r o b a b i l i t y func t ion , P(H)dH, depends on only one
r idg ing parameter f o r a given region. Although t h i s assumption is b a s i c a l l y
129

an empir ica l one t h a t must be j u s t i f i e d by t h e d a t a , i t does have some i n t u i -
t ive j u s t i f i c a t i o n on grounds of p robab i l i t y . For example, w e might consider
t h e deformation i n a reg ion as d iv ided i n t o s m a l l , equa l deformation incre-
ments, each increment c r e a t i n g new r idges wi th a c e r t a i n p r o b a b i l i t y and
adding ice t o o l d r idges wi th a d i f f e r e n t p r o b a b i l i t y dependent on t h e r i d g e
he igh t . The number of deformation increments, and hence t h e t o t a l deformation,
f o r such a model should determine t h e unique s t a t i s t i c a l na tu re of t h e r idg ing .
Any of several parameters could be used as a b a s i c r idg ing parameter--
e.g. , A , ph, < H h > , yh E ph/A, because yh conta ins information on both t h e he ight d i s t r i b u t i o n
and t h e spacing d i s t r i b u t i o n and thus supp l i e s a more complete measure of
t h e r idg ing . Also, as w e show later, t h e sampling s t a b i l i t y of y is q u i t e
good.
one of t h e s imples t empir ica l curves a v a i l a b l e and provides adequately
accu ra t e pred ic t ion .
o r any combination the reo f . We have chosen t o use
h For determining F(Yh), w e use a l i n e a r r eg res s ion l i n e s i n c e i t is
A s a f i n a l po in t w e no te t h a t F(Yh) and A , once they are determined f o r
a reg ion , should be independent of t h e cu tof f he igh t h.
because t h e p r o b a b i l i t y dens i ty func t ion P(H)dH must be t h e same a t a given
he igh t r ega rd le s s of what t h e cu tof f he igh t is.
the re fo re , equat ion 2 may b e used t o c a l c u l a t e r idges a t any he igh t level.
This i s simply
Once F(y ) and A are known, h
Comparison wi th laser d a t a
The laser p r o f i l e d a t a comprise 81 sets, each conta in ing 40 km of
t r a c k taken a t d i f f e r e n t geographical l o c a t i o n s i n t h e Arctic bas in . Tech-
n i c a l a spec t s of t h e laser prof i lometer systems and accuracy of t h e d a t a
have been d iscussed , r e spec t ive ly , by Ketchum [1972] and Tooma and Tucker
[1973]. B r i e f l y , t h e d a t a reduct ion c o n s i s t s of two p a r t s . F i r s t , laser
d a t a recorded i n analog form on magnetic t ape are converted t o a form
acceptab le f o r d i g i t a l computing by d i g i t i z i n g t h e analog record and then
removing t h e phase s h i f t s . Second, t h e d i g i t i z e d p r o f i l e is then processed
t o remove t h e a i r c r a f t a l t i t u d e v a r i a t i o n by using t h e three-s tep d i g i t a l
f i l t e r i n g process developed by Hib ler [1972]. The three-s tep f i l t e r i n g
process provides a l eve led p r o f i l e wi th a zero f i d u c i a l level from which t o
130

measure r i d g e he igh t s . Ridges are i d e n t i f i e d d i g i t a l l y by dec la r ing a
p r o f i l e peak t o be a r i d g e when t h e peak is a t least two f e e t (0.61 m)
above minimum p o i n t s located. both l e f t and r i g h t of t h e peak.
To use t h e s e d a t a sets f o r t e s t i n g t h e one-parameter model, w e first
test equat ion I, s e t t i n g a cu tof f he ight h of 4 f e e t (1.22 m) and using t h e
observed<H > t o determine A . For each d a t a set , a goodness-of-fit test
is made between t h e t o t a l observed and p red ic t ed number of r i d g e s f o r t h e
40 km segment i n one-foot c a t e g o r i e s above t h e cu tof f he igh t h.
f i t a r eg res s ion l i n e through a p l o t of F(yh) ve r sus
and 2 t o c a l c u l a t e numbers of r idges a t d i f f e r e n t he igh t levels ve r sus
f o r comparison wi th observa t ion .
h
Then w e
and u s e equat ions 4 h
h
While t h e t e s t i n g of equat ion 1 is no t s t r i c t l y necessary f o r t h e one-
parameter model, i t is important f o r e s t a b l i s h i n g t h e v a l i d i t y of t h e b a s i c
d i s t r i b u t i o n model (equat ion 1) t h a t t h e one-parameter model (equat ion 2)
is b u i l t on. The goodness-of-fit tests of equat ion 1 are summarized by
month i n Table 1. The o v e r a l l agreement of t h e t h e o r e t i c a l and observed
d i s t r i b u t i o n s shown i n t h i s t a b l e i n d i c a t e s t h a t equat ion 1 is a good working
d i s t r i b u t i o n model.
TABLE 1
SUMMARY OF GOODNESS-OF-FIT RESULTS FOR BASIC DISTRIBUTION MODEL (EQUATION 1 )
No. of No. passes a t T o t a l T o t a l S ign i f i cance level Date samples 0.05 level d.f.* X2 of t o t a l x2
Nov 70 16 14 57 67.1 < 0.05
Jan 71 11 10 35 46.4 < 0.05
Mar 7 1 12 12 36 37.7 < 0.05
Oct 71 13 12 27 34.5 0.05
Mar 72 10 10 26 19.9 < 0.05
Feb 73 - 19 - 17 - 76 100.5 < 0.025
TOTAL 81 75 257 306.1 < 0.01
(*I degrees of freedom
131

Using t h e q u a n t i t i e s ca l cu la t ed f o r f i t t i n g equat ion 1, w e cons t ruc ted
which y i e l d s a r eg res s ion l i n e i n metric u n i t s of . a p l o t of F(y ) ver sus h h
F(yh) = 1.97 % + 7.27
The c o r r e l a t i o n c o e f f i c i e n t is 0.53 ( s i g n i f i c a n t a t t h e 0.05 l e v e l ) , and
t h e s tandard dev ia t ions of F(y ) and are 5 .27 and 1 . 4 3 , r e s p e c t i v e l y .
Using t h i s r eg res s ion l i n e and equat ions 4 and 2 , w e c a l c u l a t e r i d g e frequen-
cies above h e i g h t s of 4 f t (1.22 m), 6 f t (1 .83 m), 8 f t ( 2 . 4 4 m), and 10 f t
(3 .05 m ) .
curves of r i d g e frequency as s o l i d curves and observed f requencies as open
c i rc les .
h h
The r e s u l t s are i l l u s t r a t e d i n Figure 1, where w e show c a l c u l a t e
We s h a l l r e f e r t o Figure 1, s p e c i f i c a l l y t h e curves, as t h e universal r i d g e picker. p icke r is shown by t h e s tandard dev ia t ions i n Table 2 . With t h e p o s s i b l e
except ion of the 10 f t (3.05 m) category, t h e s tandard dev ia t ions between
p red ic t ed and observed r i d g e f requencies are s m a l l compared t o t h e t o t a l
v a r i a t i o n i n t h e frequencies . Perhaps even more important , w e no te t h a t
t h e r e is a c e r t a i n sampling e r r o r a s soc ia t ed wi th each experimental r i d g e
frequency; consequently t h e observa t ion would be expected t o d e v i a t e somewhat
randomly from p red ic t ion . I n f a c t , estimates of t h e sampling e r r o r d i scussed
later are l a r g e r than t h e s tandard dev ia t ions i n Table 2. We t h e r e f o r e
conclude t h a t t h e one-parameter model i s a good working r i d g e model w i th
p r e d i c t i o n c a p a b i l i t y commensurate wi th sampling e r r o r .
A q u a n t i t a t i v e measure of t h e e f f e c t i v e n e s s of t h e r i d g e
TABLE 2
STANDARD DEVIATIONS FOR UNIVERSAL RIDGE PICKER
= no. of r i dges per km above he igh t h' (h' i n meters) ."-- 'h I
- uh, (observed) 3 * N 5 =
- ._ - - - _-__ . ----------- ~ .
- - 0 ~ __.__ Ridge Frequency ~
'1. 22
' 1 . 8 3
' 2 . 4 4
' 3 . 0 5
0.549 km-I
0.177 km-l
0.089 km-'
0.077 km-l
132

13-
12 -
10-
6 -
k h I k m '
6 c
i
4c
2 i
I I
0 96 -
t i
-I---- I I I 7 _ _
-
I I I I I 0 2 3 4 5 6 I
I
4 (m km-'')
0.881
6 f m km-%)
Fig. 1. Universal ridge picker. Predicted (solid lines) and observed values for yh', the number of ridges per kilometer above height h ' ; versus ridging intensity fib; h = 4 ft (1.22 m).
133

Ridging intensity and sampling stability
It can be seen from the ridge picker that other parameters--for example,
uh or A--could be used instead of yh as the single parameter in the one-
parameter model. However, we expect intuitively that yh would be the best
for describing ridging characteristics because it reflects both the number
of ridges per kilometer and the average ridge height.
should also be better than that of <Hh>,+,, or A , because fluctuations in
any one of these three parameters could occur independently of the other two.
Its sampling stability
We would like to demonstrate the superior sampling stability of yh, and at the same time show that each of the other ridging parameters (vh,
<Hh>y than sampling variations within a region.
regional segments of laser track (about 40 km) was divided into two parts and the ridge parameters were evaluated for each segment. An analysis of
variance was then made to determine the significance of the regional varia- tion and how much of each parameter's total variance is due to sampling
errors in individual regions.
and A ) does in fact have a regional variation significantly greater
To do this, each of the 81
The results, summarized in Table 3, are arranged in order of decreasing
variance ratio. The larger the value of the variance ratio, the greater the between-region variance as compared to the within-region variance. Conse-
quently, larger variance ratios are indicative of more satisfactory parameters
for estimating regional characteristics. amount of total variance not explained by between-region variability, and
thus Or/fi is a good measure of the sampling "error."
the stability of yh as a ridging characteristics parameter.
The residual variance Or2 is the
Table 3 confirms
For completeness the table also gives results for ridge frequencies
at different height levels corresponding to the ridge picker curves. Note tha t the residual sampling errors, O s , are in all cases less than or equal to the standard errors for the ridge picker (see Table 2).
Estimate of volume of deformed ice
One advantage of the analytical one-parameter ridge model (as expressed in equation 2) is that it may be used to calculate various quantities besides
134

TABLE 3
ANALYSIS OF VARIANCE RESULTS
P = var i ance r a t i o %
‘5, = ( r e s i d u a l var iance /2)
h = 4 f t (1.22 m) t Sign i f i cance level Parameter F OS of F r a t i o
yh 13.13 2.596 m2/km < 0.01
12.20 0.770 km’l < 0.01 %. 22
l / h 8.24 0.260 m2 < 0.01
< Hh > 5.77 0.180 m < 0.01
8.66 0.419 km-I < 0.01
9.62 0.161 km-’ < 0.01
6.34 0.077 km-’ < 0.01
’1.83
’2.44
’3.05
r i d g e f requencies . One quan t i ty of p a r t i c u l a r i n t e r e s t , which w e w i l l r e f e r
t o l a te r , is t h e amount of deformed i c e i n t h e Arctic. E s t i m a t e s of t he
mass ba lance [Koerner, 19731 and t h e mean i c e th ickness [Swithinbank, 19721
suggest t h a t r i dges account f o r a s i g n i f i c a n t amount of t h e ice th ickness
i n t h e Arctic.
To estimate t h e amount of deformed i c e , w e no te t h a t a b a s i c assumption
i n t h e r i d g e he ight p r o b a b i l i t y dens i ty func t ion (equat ion 1) is t h a t a l l
r idges are geometr ical ly s i m i l a r [Hibler e t a l . , 19721. Furthermore, f o r
randomly o r i en ted r idges , t h e t o t a l l eng th of r idges per u n i t area is given
by s imilar s l o p e angles of 8 and are randomly o r i en ted , t h e t o t a l amount of
deformed ice above t h e water level
(T/2)’h [Mock e t a l . , 19721. Thus, assuming t h a t r i dges a l l have
(7r/2) ph < H i > c o t 9
I f w e f u r t h e r assume t h a t t h e r e is about n ine t i m e s as much ice volume below
t h e water l e v e l ( i n r i d g e kee l s ) as above t h e water l e v e l and t h a t c o t 8 = 2,
w e may estimate a mean ice th ickness ph (volume of deformed ice pe r u n i t area),
135

due t o deformed ice i n r idges having he igh t s above h of
where w e have used equat ion 2. h w i l l be independent of t h e va lue of h chosen, as t h e p r o b a b i l i t y func t ion
must remain i n v a r i a n t a t a given level.)
(P lease no te t h a t f o r a given r eg ion F(y )
I n Figure 2 w e p l o t t h e mean ice th ickness f o r d i f f e r e n t cu tof f
h e i g h t s a g a i n s t r i dg ing i n t e n s i t y .
i c e i n r idges h igher than 2 f e e t is c l o s e t o t h a t i n r idges h igher than
4 f e e t , r e f l e c t i n g t h e f a c t t h a t t h e h igher r idges con ta in most of t h e
deformed i c e i n a given area.
Note t h a t t h e mean th ickness of deformed
I I I I
50
Fig. 2. Mean ice th ickness due to deformed ice i n r idges above 4 f t (1.22 m) and 2 f t (0.61 m) versus r idg ing i n t e n s i t y y h = 4 f t (1.22 m). h;
136

REGIONAL VARIATIONS OF RIDGING INTENSITY: 1970-73
To s tudy t h e r eg iona l and temporal v a r i a t i o n s i n r idg ing i n t e n s i t y ,
t h e l o c a t i o n of each of t h e 81 laser d a t a samples w a s catalogued. The
l o c a t i o n s were found t o f a l l i n one of 26 geographical s i tes, shown i n
Figure 3 . These are t h e same sites used by Tucker and Westhall [1973] t o
estimate mean seasonal contours of t h e r i d g e frequency. I n Table 4 , w e
relate r idg ing i n t e n s i t i e s of t h e samples t o geographical reg ion and da te .
Other r idg ing parameters of i n t e r e s t can be determined by r e fe rence t o
Table 4 and use of t h e r i d g e p icker (Fig. 1). (See a l s o t h e Appendix.)
Fig. 3. Geographical sampling reg ions f o r laser da ta .
S p a t i a l v a r i a t i o n s i n r i d g i n g
The d a t a given i n Table 4 have been p l o t t e d on t h e series of maps
shown i n F igure 4 , each map corresponding t o a sampling month.
i n d i c a t e t h a t whi le t he r idg ing i n t e n s i t y va lues a t t h e same l o c a t i o n may
The maps
137

TABLE 4
R I D G I N G I N T E N S I T Y yh FOR SAMPLING REGIONS
h = 4 ft (1 .22 m); y h Sampling N o v Jan Mar Oct Mar Feb
is in units of m2/km
Region 7 0 7 1 71 7 1 72 7 3
1
2
3
4
5
6
7
8
9
10 11
1 2
1 3
1 4
1 5
16
17
1 8
1 9
20
2 1
22
23
24
25
26
15 .4
13 .4
15.5
6 .9
8 .0
6.3
6.5
2.7
2.4
6.4
2.2
2.7
6 .6
9 . 1
19 .3
6.9
19.5
6.7
5 .3
2 .6
2.5
1 . 5
0.1
8.3
2.3
0 .9
20.7
9 .2 9.7
15.6 8.2
14.3 4.6
4.4 5.6
4 .8 2 .9
3.6 4 .1
6.7 3 . 1
2.9 0.6
2.6 0 .2
1 . 4 0.3
9.9
2.5 0 .9
0 .2
0 . 1
2 . 2
2.3
2.4
1.8
2.8
2.9
0 .6
20.1
18.6
8.9
24.9
27.6
7 . 4
10.1
8.5
14.4
5.9
1 .8
2.6
2.5
6.7
8 . 4
23.4
33.9
42.8
32.7
12.4
26.8
38.6
1 3 8

\
vary from month t o month, re la t ive reg iona l v a r i a t i o n s are q u i t e s imilar .
To provide approximate contour maps of t h e r idg ing i n t e n s i t y we have used
two contour l i n e s wi th s imilar l o c a t i o n s but d i f f e r e n t magnitudes from
month t o month. Note t h a t t h e two contour l i n e s a r e
t i n u i t i e s i n r idg ing i n t e n s i t y genera l ly occcr .
Nov. 1970 Jan. 1971
Oct. 1971 Mar. 1972
loca ted where discon-
Mar. 1 9 7 1
Feb. 1973
Fig. 4 . Regional v a r i a t i o n s i n r idg ing i n t e n s i t y , yh, i n f a l l and win ter from 1970 t o 1973. i n u n i t s of m2/km.
h = 4 f t (1 .22 m) and yh 5s
139

Although t h e s e are except ions, t h e contours i n d i c a t e t h a t t h e western
po r t ion of t h e A r c t i c bas in may be divided i n t o t h r e e zones wi th boundaries
def ined by t h e contours: the Beaufort-Chukchi zone o f f t h e Alaskan coas t ;
t h e Cen t ra l A r c t i c zone centered around t h e North Pole; and t h e Archipelago
zone, cons i s t ing of t h e reg ion o f f t h e coas t s of nor thern Greenland and t h e
Canadian Archipelago down t o Banks I s land . Notable except ions t o t h i s
r eg iona l breakdown are t h e shear zone reg ion o f f Barrow (geographical s i t e
15) and t h e reg ion around Banks I s l and , which appears t o be a t r i p l e boundary
between regions. This r eg iona l v a r i a t i o n is i n genera l agreement wi th
Wittmann and Schule [1966], a l though numbers cannot be d i r e c t l y compared,
t h e Wittmann-Schule index being e s s e n t i a l l y a r i d g e frequency based on
v i s u a l counts.
The r eg iona l v a r i a t i o n is a l s o i n genera l agreement wi th d r i f t ca lcu la-
t i o n s made by Rothrock f19731. Rothrock p r e d i c t s a decreas ing i c e stress
(which would presumably c o r r e l a t e wi th deformation) as one proceeds from
Spi t sbergen t o Alaska, and a zone of maximum shear corresponding t o t h e
Archipelago region. I n add i t ion , i n t e r m s of o v e r a l l motion of t h e i c e
pack, h igh r idg ing would c e r t a i n l y be expected i n the Archipelago zone, as
t h i s i s where t h e i c e moving i n t h e P a c i f i c Gyre meets and gr inds along t h e
unyielding land .
Seasonal and annual v a r i a t i o n i n r i d g i n g
To examine temporal v a r i a t i o n s i n r idg ing , mean r idg ing i n t e n s i t i e s
f o r each of t h e t h r e e reg ions were ca l cu la t ed and p l o t t e d as a func t ion of
t i m e . The r e s u l t s are shown i n F igure 5. The e r r o r b a r s r ep resen t s tandard
dev ia t ions ca l cu la t ed from t h e d a t a po in t s i n t h e reg ion f o r t h e month under
cons idera t ion .
While Figure 5 spans t h e per iod from f a l l 1970 t o winter 1973, only
one yea r , f a l l 1970 t o f a l l 1971, is reasonably complete. For t h i s per iod
t h e curves sugges t , as would be expected, t h a t t h e maximum change i n r idg ing
i n t e n s i t y occurs i n e a r l y f a l l . Changes i n r idg ing i n t e n s i t y from f a l l t o
l a t e win te r , on t h e o the r hand, were q u i t e s m a l l .
des igna t ion of t h r e e major reg ions of d i f f e r i n g r idg ing i n t e n s i t i e s i n t h a t
t h e r e is gene ra l ly no over lap between t h e curves.
Figure 5 suppor ts our
140

\
However, perhaps t h e most i n t e r e s t i n g a spec t of F igure 5 is t h e l a r g e
inc rease i n r idg ing i n t e n s i t y from 1970 t o 1973, e s p e c i a l l y i n t h e Archipelago
province.
of t h e a r c t i c ice pack. Using Figure 2 i t is poss ib l e t o estimate the i c e
volumes represented by r i d g e s higher than 2 f t (0 .61 m) ( i n t e r m s of equiva-
l e n t th ickness) and t h e changes t h a t occur from 1970 t o 1973. W e have
t abu la t ed t h i s information i n Table 5. The averages shown i n Table 5 were
ca l cu la t ed by weighting t h e t h r e e reg ions according t o t h e i r re la t ive s i z e .
This has important impl ica t ions for t h e dynamics and m a s s balance
Fig. 5. Average r idg ing i n t e n s i t i e s and s tandard dev ia t ions as a func t ion of t i m e f o r ( a ) t h e Archipelago zone, (b) t h e Cent ra l A r c t i c zone, and (e ) t h e Beaufort-Chukchi zone.
141

TABLE 5
VARIATION OF RIDGING AND EQUIVALENT THICKNESS, 1971-73
(Equivalent th ickness es t imated from a l l r idges higher than 0.61 E)
Winter 1971 Winter 1973
Equiv Equiv Weight Region yh Thickness yh Thickness Dif fe rence
3 Beauf ort-Chukchi 3.8 0.30 m 3.9 0.32 m + 0.02 m
2 Cent ra l A r c t i c 5.0 0.37 m 10.2 0 .61 m + 0.24 m
1 Archipelago 13.2 0.73 m 31.3 1.42 m + 0.69 m
WEIGHTED AVERAGE 0.39 m 0.60 m + 0.21 m
I n a r ecen t s tudy of t h e mass balance of t h e A r c t i c bas in , Koerner
[1973] s t a t e d t h a t t h e equiva len t of a continuous l a y e r of i ce 1.1 m t h i c k
may form i n t h e A r c t i c i n a s i n g l e win ter . H e es t imated t h a t 20%, o r 22 c m ,
of t h i s i ce w a s i n d i r e c t l y produced by r idg ing and hummocking. The reg ion
covered by h i s s tudy is roughly t h e same as t h e combined Beaufort-Chukchi
and Cen t ra l Arctic zones of our i nves t iga t ion . According t o t h e weighted
average of t h e s e two zones ( s e e Table 51, 35 cm of ice i n 1971 and 4 4 cm of
ice i n 1973 were produced i n d i r e c t l y by r idg ing . Since our c a l c u l a t i o n s
n e i t h e r d i s t i n g u i s h between new and o ld r idges nor consider t h e void spaces
w i t h i n r i d g e s , t h e agreement between our 1971 f i g u r e s and Koerner 's is
encouraging.
Two s i g n i f i c a n t po in t s are i l l u s t r a t e d by our da t a . I f w e accept
Koerner 's [1973] estimate of t h e percentage of new i c e due i n d i r e c t l y t o
r idg ing , o r a l t e r n a t i v e l y accept Maykut and Un te r s t e ine r ' s [1969] estimate
f o r t h e s t eady- s t a t e mean yea r ly sea i c e acc re t ion rate i n t h e Arctic of
= 0.6 m p e r yea r , w e can draw t h e fol lowing conclusions from our d a t a .
F i r s t , any assessment of mass balance i n t h e Arc t i c must consider t h e Archi-
pelago province, w h i c h d e s p i t e i t s r e l a t i v e l y s m a l l s i z e , i s a major contr ibu-
t o r (20% t o 40%) t o new i c e production i n t h e western po r t ion of t h e Arctic
bas in .
r i dg ing (50% inc rease from 1971 t o 1973) i s much g r e a t e r than t h e v a r i a t i o n
t h a t would be expected from thermodynamics alone. This second conclusion
Second, t h e v a r i a t i o n i n new ice product ion due i n d i r e c t l y t o
142

\
accentuates the importance of air-sea dynamic interaction in climate
modeling [see, for example, Thorndike and Maykut, 19731 when calculating
the mass balance for the Arctic.
CONCLUSIONS
The results of this study may be conveniently separated into those
relevant to classification models and those relevant to variations in ridging as a function of geographical location and time.
With respect to classification models, it appears that the one-
parameter ridge model using ridging intensity (y ) is very useful for classifying sea ice ridging for the following reasons.
h
1. The number of ridges per kilometer at any height may be accurately estimated from 6. upon ridging, such as form drag [see, for example, Arya, 19731 and total ice deformation per unit area, may be estimated as a function of %.
Hence, other parameters dependent
2. The sampling stability of y for a given region is good; h that is,the variability of y between regions is considerably
greater than the sampling variation in y for a given region. h
h 3. Ridging intensity, y may be easily derived from digital h'
processing of laser profile data.
4 . Using the one-parameter ridge model, data obtained by
' different investigators using different cutoff heights may be compared.
As regards geographical and temporal variations in ridging, the laser results support conclusions that have implications for mass balance and thermodynamic-dynamic interactions in the Arctic:
1. Three distinct regions defined by ridging intensity can be identified.
2. Year-to-year variation is significant, but relative ridging intensities and boundaries between regions remain reasonably constant .
143

\
3 . New i c e produced i n d i r e c t l y by r idg ing ( 0 . 3 t o 0.6 m/yr) i s a
s i g n i f i c a n t po r t ion of t h e o v e r a l l new ice product ion of approximately
1.1 m/yr [Koerner, 19731.
4. I c e product ion due t o r idg ing i n t h e Archipelago province
may be a key f a c t o r i n t h e o v e r a l l mass ba lance of t h e A r c t i c bas in .
ACKNOWLEDGMENTS
We would l i k e t o thank Floyd Kugzruk f o r performing much of t h e
numerical computer work f o r t h i s s tudy. The work w a s supported by ARPA
Order 1615 and DA P r o j e c t 4A161102B52E.
APPEND I X
To make t h e d a t a i n t h i s paper more a c c e s s i b l e t o o the r i n v e s t i g a t o r s
w e inc lude a t a b l e of var ious r idg ing parameters as a func t ion of r idg ing
i n t e n s i t y . Using the r idg ing i n t e n s i t i e s i n Table 4 and Figure 4 t h i s t a b l e
may be used t o determine r idg ing c h a r a c t e r i s t i c s f o r d i f f e r e n t seasons and
loca t ions . For example, given y F(y ) and X may be determined. This h’ h a l lows c a l c u l a t i o n of t he he ight d i s t r i b u t i o n from t h e equat ion
(A-1)
where P(H)dH is the number of r idges per ki lometer wi th he igh t s between
H and H+dH. Values of r i d g e f requencies a t d i f f e r e n t he igh t l e v e l s may be
taken d i r e c t l y from t h e t a b l e ; v2.5, f o r example, r ep resen t s t h e number of
r i d g e s per ki lometer higher than 2.5 m and 1-1 t h e number higher than 1 m. 1.0
144

RIDGE PICKER TABLE
Relevant r idg ing parameters as a func t ion of $; h = 4 f t (1 .22 m)
A ' 1 . 0 ' 1 . 5 ' 2 . 0 ' 2 . 5 ' 3 . 0 ' 3 . 5
0.5
1 .0
1 . 5
2.0
2.5
3.0
3.5
4.0
4.5
s.0
5.5
6.0
6.5
8 .3
9.2
10 .2
1 1 : 2
12 .2
1 3 . 1
1 4 . 1
15 .1
1 6 . 1
1 7 . 1
18.0
19.0
20.0
1 .291
0.893
0.706
0.593
0.517
0 .461
0.418
0.385
0.357
0.334
0.314
0.298
0.283
0.696
1.568
2.526
3.553
4.640
5.782
6.975
8.215
9.500
10.829
12 .198
13.607
15.054
0 .103 0.009 <0.001 < 0.001 <0.001 1.454 m
0.389 0.065 0.007 0.001 <0.001 1.533
0.804 0.188 0.032 0.004 <0.001 1.595
1.317 0.378 0.083 0.014 0.002 1.647
1.909 0.631 0.166 0.035 0.006 1.692
2.570 0 .941 0.281 0.068 0.013 1.733
3 .291 1.304 0.430 0.118 0.027 1.769
4.067 1 .715 0.613 0.184 0.047 1 .803
4.891 2.173 0.827 0.269 0.044 1 .834
5.763 2.673 1 .075 0.373 0.111 1.863
6.678 3.214 1.352 0.495 0.158 1 .890
7.635 3.794 1 .661 0.638 0.214 1.915
8 .631 4.410 1.998 0.800 0.282 1.940
REFERENCES
Arya, S. P. S. 1973. Contr ibut ion of form drag on p res su re r idges t o the a i r stress on a r c t i c sea ice. J . Geophys. Res. 7 8 : 7092-7099.
Hib le r , W. D. 111. 1972. Removal of a i r c r a f t a l t i t u d e v a r i a t i o n from laser p r o f i l e s of t h e arct ic ice pack. J . Geophys. Res. 7 7 : 7190-7195.
Hib le r , W. D. 111, W. F. Weeks, and S. J. Mock. 1972. S t a t i s t i c a l a spec t s of sea-ice r i d g e d i s t r i b u t i o n s . J . Geophys. Res. 7 7 : 5954-5970.
Ketchum, R.D. Jr. 1971. Airborne laser p r o f i l i n g of t h e arct ic pack i c e . Remote Sensing Environ., 2 : 41-52.
Koerner, R. M. 1973. The m a s s balance of t h e sea ice of t h e Arctic Ocean. J . Glaciol. 1 2 ( 6 5 ) : 173-185.
Kovacs, A. 1972. On pressured sea ice. I n Sea Ice: Proceedings o f an InternationaZ Conference, Reykjavik, Iceland, May 10-1 3, 1.971 (ed. T. Karlsson) , pp. 276-295. Nat iona l Research Council , Reykjavik, Iceland.
145
\
Maykut, G. A., and N. Untersteiner. 1969. Numerical prediction of the thermodynamic response of arctic sea ice to environmental changes. RAND Memorandum RM-6093-PRY 173 pp. The RAND Corporation, Santa Monica, California.
Mock, S . J . , A. D. Hartwell, and W. D. Hibler 111. 1972. Spatial aspects of pressure ridge statistics. J . Geophys. Res. 7 7 : 5945-5953.
Parmerter, R. R., and M. D. Coon. 1972. Model of pressure ridge formation in sea ice. J . Geophys. Res. 7 7 : 6565-6575.
Rothrock, D. A . 1973. The steady drift of an incompressible arctic ice cover. AIJDEX Bul le t in No. 2 1 : 49-77.
Swithinbank, C. 1972. Arctic pack ice from below. In Sea Ice: Proceedings of an IntemationaZ Conference, Reyb'avik, IeeZand, May 10-13, 1971 (ed. T. Karlsson), pp. 246-254. National Research Council, Reykjavik, Iceland.
Thorndike, A. S.,and G . A. Maykut. 1973. On the thickness distribution of sea ice. AIDJEX Bul le t in No. 2 1 : 31-47.
Tooma, S . G . , and W. B. Tucker 111. 1974. Statistical comparison of airborne laser and stereophotogrammetric sea ice profiles. Environ. (in press).
Remote Sensing
Tucker, W. B. 111, and V. H. Westhall. 1973. Arctic sea ice ridge frequency distributions derived from laser profiles. AIDJEX BuZZetin No. 2 1 : 171-180.
Weeks, W. F., A. Kovacs, and W. D. Hibler 111. 1971. Pressure ridge charac- teristics in the arctic coastal environment. International Conference on Port and Ocean Engineering under Arctic Conditions, vol. 1, pp. 152-183. Department of Port and Ocean Engineering, Technical University of Norway, Trondheim, Norway.
In Proceedings of the Firs t
Wittmann,W. I, and J. J. Schule, Jr. 1966. Comments on the mass budget of arctic pack ice. Budget and Atmospheric C<rcuZat<on. pp. 215-246. RAND Corporation, Santa Monica, California.
In Proceedings of the Symposiwn on Arctic Heat RAND Memorandum RM-5233-NSFY
146

S I M I L A R I T Y CONSTAEJTS 114 THE STRATIF IED PLANETARY BOUNDARY LAYER
R. A. Brown Arctic Ice Dynamics Joint Experiment
ABSTRACT
The c l a s s i c a l s o l u t i o n s f o r t h e r e l a t i o n s h i p between geostrophic , Ekman l a y e r , and su r face l a y e r flow have been developed i n t o a continuous s o l u t i o n f o r t he semi - in f in i t e
composite boundary l a y e r s o l u t i o n wi th matching cr i ter ia . The matching process i n d i c a t e s a correspondence between the stress and the geos t rophic flow dev ia t ion involv ing two a r b i t r a r y parameters. Some va lues of these s i m i l a r i t y constants determined from da ta f o r n e u t r a l and s t r a t i f i e d boundary l aye r s are discussed.
. flow over a sur face . This s o l u t i o n l eads t o a two-layer
INTRODUCTION
Ekman, i n h i s s i n g u l a r paper analyzing t h e p l ane ta ry boundary l a y e r
[1905], sought t o expla in the observed d r i f t of pack i ce a t l a r g e angles
(20"-40") t o the wind d i r e c t i o n . H e employed Boussinesq's [1897] eddy
v i s c o s i t y concept and obtained an exac t s o l u t i o n t o t h e Navier-Stokes
equat ions f o r t h e balance between p res su re grad ien t , C o r i o l i s , and viscous
fo rces . H e considered a v a r i a b l e eddy v i s c o s i t y , p ropor t iona l t o ver t ical
v e l o c i t y g rad ien t , i n t h i s i n i t i a l paper. Indeed, the l i m i t of Ekman's
s o l u t i o n f o r s m a l l he igh t s provides one de r iva t ion of t he logar i thmic
v e l o c i t y p r o f i l e .
Taylor (1915) added t h e f i n i t e v e l o c i t y boundary condi t ion a t the
lower boundary t o r e l i e v e t h e 45" t u rn ing angle p red ic t ed by Ekman's so lu t ion .
Micrometeorological i n v e s t i g a t i o n s have s i n c e e s t a b l i s h e d t h e p e r s i s t e n c e of
t he l o g wind p r o f i l e i n the lowest po r t ion of t h e boundary l a y e r , whi le
i n c u r r i n g t h e l i a b i l i t y of using two ephemeral "cons tan ts ," von Karman's k
147

and t h e s u r f a c e roughness z o .
r a t o r y i s d i f f e r e n t from t h e k = 0.35 found i n t h e f i e l d by Businger e t 61. ,J
[1971] and may be cons tan t f o r s p e c i f i c condi t ions only [Tennekes, 19731.
The value of k = 0 .4 e s t a b l i s h e d i n t h e labo-
The va lue of z o as determined from t h e observed logari thmic p r o f i l e varies
from about 0.02 cm over smooth ocean t o 0 [ 1 m] f o r a f o r e s t , whi le va lues
f o r mountains and c i t i e s must be obtained by a f f l a t u s . I n a d d i t i o n ,
and seasonal v a r i a t i o n s i n Z o are expected f o r a given l o c a t i o n .
l i g h t , one must view w i t h some r e s e r v a t i o n any theory which incorpora tes
z o G/fzo), inc luding t h i s one.
u t i l i z a t i o n l ies i n a re la t ive i n d i f f e r e n c e o f t h e results t o v a r i a t i o n s i n /
diurna2 I n t h i s
\ '\t ( a s i n t h e r a t i o Ro The hope f o r p r a c t i c a l
Ro , o r i n t h e s u b s t i t u t i o n of some la rger -sca le c h a r a c t e r i s t i c length f o r
t h e s u r f a c e l a y e r . The la t ter is n o t g e n e r a l l y a v a i l a b l e , al though t h e
Monin-Obukhov scale length may b e used under mi ld ly s t r a t i f i e d condi t ions.
The i d e a of a two-layer model has a f a i r l y long h i s t o r y assoc ia ted
wi th K d i s t r i b u t i o n modeling.
Patching w a s i n v a r i a b l y done using t h e classical Ekman-Taylor s o l u t i o n as
t h e o u t e r l a y e r , a l i a b i l i t y which limits a p p l i c a b i l i t y . The same possible',,
l i m i t a t i o n ex is t s i n t h e r e l a t i o n developed he re . However, knowledge o f t h e ;
perturbed s teady-s ta te Ekman s o l u t i o n [Brown, 19701 l e a d s one t o assume with i
some confidence t h a t t h e d i f f e r e n c e i n t h i s s o l u t i o n w i l l be absorbed i n t o '
t h e e m p i r i c a l constants .
A summary can b e found i n Brown [1973].
!
/
Solu t ions f o r t h e Ekman l a y e r have cons is ted of myriad concepts f o r
eddy v i s c o s i t y d i s t r i b u t i o n s ( o r some equiva len t ) . These were summarized by
Z i l i t i n k e v i c h [ 19 711 . It i s evident t h a t no genera l c h a r a c t e r i s t i c K d i s t r i bu -
t i o n has been found. Nevertheless , some dependence on eddy v i s c o s i t y i s
necessary t o express t h e eddy viscous e f f e c t a n a l y t i c a l l y on t h e mesoscale.
An a l t e r n a t i v e i s a d e t a i l e d numerical c a l c u l a t i o n of t h e n o n l i n e a r terms t o
achieve c losure on a h i g h e r order . Such c a l c u l a t i o n s are be ing made by
Deardorff [1970] i n t h r e e dimensions and by Wyngaard e t a l . [1973] i n one
dimens ion.
The s p e c i f i c problem f o r t h e AIDJEX p lane tary boundary l a y e r model is
t o achieve some measure of t h e s u r f a c e stress based on synopt ic scale param-
eters.
vec to r .
The main inpu t parameter is expected t o be t h e geostrophic flow
The atmosphere g e n e r a l l y has good ver t ical coherence i n t h e p r e s s u r e
148

grad ien t , s o t h a t s u r f a c e pressure masurements should provide a good measure
of t h i s boundary condi t ion (although a p r a c t i c a l determinat ion of t h e geo-
s t r o p h i c flow vec to r may prove d i f f i c u l t due t o non-steady s ta te and b a r o c l i n i c
e f f e c t s , as found by Clarke [1970]). However, even wi th a good determinat ion
of t he geos t rophic flow, a s e r i o u s problem ex is t s , i n t h a t boundary l a y e r
s t r a t i f i c a t i o n i s expected t o p l ay an important ro l e .
dynamic i n t e r a c t i o n has y e t t o y i e l d an a n a l y t i c model, al though much has
been w r i t t e n on s p e c i a l cases of mixed shea r flow wi th s t r a t i f i c a t i o n , usua l ly
from t h e s tandpoin t of l i n e a r i z e d pe r tu rba t ion theory. Here, t h e n e u t r a l
case only is considered, us ing t h e s i m i l a r i t y cons tan ts e s t a b l i s h e d by Brown
[1973] t o f i t d a t a empir ica l ly across a spectrum of s t r a t i f i c a t i o n . An
at tempt must then b e made t o j u s t i f y t h e theory f o r t hese s t r a t i f i e d cases.
The problem of buoyant-
THE SIMILARITY CONSTANTS
By matching the l i m i t of an Ekman-Taylor o u t e r s o l u t i o n t o a logar i thmic
p r o f i l e s u r f a c e l a y e r , a r e l a t i o n between geos t rophic drag c o e f f i c i e n t and
angle of t u rn ing between the geos t rophic flow and t h e s u r f a c e flow w a s found:
[ s i n a Jr C, (cosa - s ina ) 3 = C, G - u*
where
u* = (-ro/p)%, the f r i c t i o n v e l o c i t y
6 2h
c, = - E 2
= - 6
kC, = - 2 zi
6 = (2K/f)% h = he igh t o f smooth match of s u r f a c e l a y e r and Ekman-Taylor l a y e r
z = c h a r a c t e r i s t i c scale of s u r f a c e l a y e r
K = mean eddy v i s c o s i t y f o r o u t e r l a y e r
f = 2fisin8, t h e C o r i o l i s parameter
vel0 c i t y
i
I n p r a c t i c e , t h e r a t i o s involved i n (1) cannot be measured. Rather ,
t h e cons t an t s must b e r e l a t e d empir ica l ly t o u,/G and a. Since t h e cons tan ts
149

con t ro l t h e s lope and i n t e r c e p t of an i n f i n i t e set of s l i g h t l y curved l i n e s
on the u,/G versus a p lane , a f i t can be found t o any d a t a wi th a d i s c e r n i b l e
t rend. Unfortunately, the small amount of d a t a a v a i l a b l e from t h e atmosphere
is widely s c a t t e r e d . Nevertheless , a prel iminary f i t t o t h e d a t a from Clarke
e t a l . [1971] and unpublished d a t a taken over t he arct ic i c e pack can provide
some t e n t a t i v e values f o r C, and C,.
f i c a t i o n and roughness ( represented i n t h e parameter, E E 6/s. ) .
The stress is found t o vary wi th strati-
2
EVALUATION OF SIMILARITY CONSTANTS FROM DATA
The theory holds s t r i c t l y f o r n e u t r a l s t r a t i f i c a t i o n and a n e a r 45" .
However, d a t a are found t o vary over a wide range of s t r a t i f i c a t i o n and a. To be of p r a c t i c a l va lue , t h e stress must b e r e l a t e d t o v a r i a b l e a and
s t r a t i f i c a t i o n . While no appropr ia te a n a l y t i c s o l u t i o n s are a v a i l a b l e t o
match toge ther , t he re are numerical s o l u t i o n s f o r t h e modified Ekman l a y e r
allowing h ighly v a r i a b l e a with s t r a t i f i c a t i o n [ see Brown, 19721 and empir ica l
f i t s t o a modified su r face l a y e r [ see Businger, 19551. The e f f e c t of t h e s e
pe r tu rba t ions on the b a s i c s o l u t i o n s might be absorbed i n t h e s i m i l a r i t y
constants . These cons tan ts may then be expected t o vary wi th s t r a t i f i c a t i o n .
In the o r i g i n a l s i m i l a r i t y r e l a t i o n [e .g . , see Kazanskii and Monin, 19611,
C, = 0 and C, = 0-5 f o r t h e n e u t r a l case.
which depends on the e f f e c t i v e roughness c h a r a c t e r i s t i c f o r t h e sur face .
Then u,/G i s r e l a t e d t o a via C, ,
The s i m i l a r i t y parameters have appeared i n t h e l i t e r a t u r e genera l ly
i n the form
G / U , cosu = [In(u,/fz,> - A l / k
Glu, s i n a = B / k
Eq. 2 i s cont ingent upon t h e logar i thmic p r o f i l e f o r t h e v e l o c i t y i n
The r e l a t i o n r e s u l t s from applying s i m i l a r i t y arguments t he matched region.
t o an Ekman l a y e r and the logar i thmic l a y e r s epa ra t e ly and then patching.
Both s o l u t i o n forms have long been known f o r t h e atmosphere, and (2) has been
150

a r r i v e d at by several i n v e s t i g a t o r s . Z i l i t i n k e v i c h e t al. [1967] a sc r ibed
t h e de r iva t ion t o Kazanskii and Monin [1961].
and B der ived from va r ious t h e o r i e s . Blackadar and Tennekes [1968] d iscussed
t h e i n n e r / o u t e r matching of s i m i l a r i t y s o l u t i o n s i n terms of general func t iona l
s o l u t i o n s , showing t h e pe r s i s t ence of t h e b a s i c r e l a t i o n s .
by G i l l (unpublished) and Csanady [1967] which a l s o a r r i v e d at (3) by simi-
l a r i t y cons idera t ion . Clarke [1970] allowed A and B t o vary wi th
s t r a t i f i c a t i o n and found a dramatic v a r i a t i o n as s t r a t i f i c a t i o n went from
n e u t r a l t o s t a b l e . Csanady [1972] has extended t h e a n a l y s i s t o t h e d i a b a t i c
l a y e r wi th a commensurate inc rease i n cons tan ts t o be determined empir ica l ly .
It i s d i f f i c u l t t o eva lua te t h e m e r i t s of these more complex theo r i e s relative
t o (1) i n the l i g h t of p re sen t data .
They presented va lues of A
They c i te work
When the Wangara [Clarke e t a l . , 19711 d a t a are p l o t t e d on a u,/G
versus a graph, some t rends appear. A s shown i n Figure 1, t h e n e u t r a l case
i s widely s c a t t e r e d , wi th only t h e b a r e s t i n d i c a t i o n of a t r end corresponding
t o d a t a summarized i n Blackadar [1962]. On t h i s graph, a v a r i a t i o n i n
roughness tends t o move t h e d a t a upwards and s l i g h t l y t o the r i g h t correspond-
i n g t o a lower C; = 6 /z . ( i . e. , a g r e a t e r z .).
t h e e n t i r e range of s t r a t i f i e d d a t a can be made with a cons tan t C; = 6 / h . This impl ies t h a t both l a y e r s tend t o grow o r s h r i n k toge the r wi th changes
i n s t r a t i f i c a t i o n .
similar r e s u l t s .
A s u r p r i s i n g l y good f i t t o 2 7,
Data from AIDJEX 1972 were p l o t t e d on t h i s graph wi th
The d a t a are the processed 4-meter p r o f i l e wind and temperature d a t a
taken by W. Goddard dur ing t h e AIDJEX 1972 p i l o t experiment.
method w a s used t o ob ta in u*. pres su re f i e l d as the s u r f a c e geostrophic wind.
obtained from Weather Bureau maps and co r rec t ed by manned s t a t i o n , Arctic
Basin per iphery s t a t i o n , and AIDJEX buoy p res su re da ta . The d i r e c t i o n of
t h e s u r f a c e wind w a s read t o t h e n e a r e s t 10" (AIDJEX B u l l e t i n No. 14) . The
angle a is no b e t t e r than +lo" accuracy.
of G w i l l y i e l d an e r r o r b a r on each p o i n t approximately equal t o t h e minor
axis of the e l l i p s e s enc los ing 90% of t h e po in t s . S t r a t i f i c a t i o n w a s de te r -
mined us ing t h e 4-meter da t a , supplemented by t h e kytoon d a t a taken by
R. McBeth o f t h e Nat ional Center f o r Atmospheric Research, t o above t h e
invers ion when a v a i l a b l e .
The p r o f i l e +
The va lue of G was obta ined from t h e synop t i c
The p res su re f i e l d w a s
The e r r o r s i n uz and magnitude
151

- unstable u unstable o neutral n neutral + stable s stable
Effective Roughness increased
decreased from Blackodar 1962
t I I I - c- I
a (degrees)
Fig. 1. P l o t of t he geos t rophic drag r a t i o u,/G versus t h e devia t ion between geostrophic and su r face flow, a". Values of u*, G , and a , were taken o r ca l cu la t ed from data i n Clarke e t a l . [1971] and from unpublished AIDJEX 1972 data . In each case , accumulative e r r o r b a r ranges are approximately equal t o t h e minor axis of t h e e l l i p s e s drawn t o encompass 90% of t h e p o i n t s i n t h e s t ab ly /uns t ab ly s t r a t i f i e d cases. Errors i n a are approximately 5"-10". S t r a t i f i c a t i o n ranged from weak t o s t rong . Curve va lues of C,, C, correspond t o (1).
It would appear t h a t the s t a b i l i t y e f f e c t s dominate t o e s t a b l i s h a
constant 6 /h f o r a small degree of s t r a t i f i c a t i o n .
s t r a t i f i c a t i o n very small changes i n roughness change C, s i g n i f i c a n t l y .
Both sets o f d a t a r e f l e c t roughness v a r i a t i o n s during t h e d a t a c o l l e c t i o n
per iod.
However, a t n e a r n e u t r a l
152

While the l a r g e scatter i n t h i s p l o t must g ive pause wi th r e spec t t o
q u a n t i t a t i v e va lue , t h e p red ic t ed t r end i s ev ident and l ies w e l l w i t h i n t h e
e r r o r range of the data . One might expect C, and C, t o vary with s t r a t i f i -
ca t ion ; however, t h i s d i s t i n c t i o n is beyond t h e r e a l i z a t i o n of t h e data .
Any f i rm r e l a t i o n s h i p between 01 and s t r a t i f i c a t i o n r equ i r e s b e t t e r d a t a ,
p a r t i c u l a r l y wi th regard t o a r e l i a b l e s t r a t i f i c a t i o n parameter.
SUMMARY
The c r i t i c a l parameter governing t h e f i t of two limit s o l u t i o n s t o the
Navier-Stokes equat ions w a s found t o be t h e r a t i o of t h e c h a r a c t e r i s t i c
length scales of t h e o u t e r and i n n e r boundary l a y e r s o l u t i o n s designated E .
A s E v a r i e s from ze ro t o i n f i n i t y , t h e s o l u t i o n varies from t h e geos t rophic
t o t h e l o g l aye r . These s o l u t i o n s are s i n g u l a r pe r tu rba t ions of t h e b a s i c
Ekman-Taylor so lu t ion . The i n n e r solut ion-- the log p r o f i l e - - s a t i s f i e s t h e
no-sl ip boundary condi t ion and i s smoothly matched t o t h e in te rmedia te
Ekman l a y e r so lu t ion . The su r face l a y e r s o l u t i o n has replaced t h e Ekman
l a y e r s o l u t i o n i n t h e near s u r f a c e region where t h e cons tan t eddy v i s c o s i t y
assumption breaks down.
The three-dimensional o u t e r s o l u t i o n p resen t s a continuous s e l e c t i o n
of p r o f i l e s t o match the two-dimensional i n n e r l a y e r so lu t ion . These p r o f i l e s
vary wi th E , t he he igh t of t he matching l a y e r , o r t h e angle of t u rn ing i n
t h e o u t e r so lu t ion . One d i f f i c u l t y i n app l i ca t ion arises from t h e i n d e f i n i t e
na tu re of the pe r tu rba t ion parameter.
t i o n of scale he igh t s .
been accura te ly e s t a b l i s h e d f o r t h e atmosphere o r ocean. The empir ica l curve
f i t t o d a t a s i d e s t e p s t h i s problem of t h e d e t a i l s of t h e flow. However,
t h e r e is a t present only a l i m i t e d amount of d a t a wi th which t o e s t a b l i s h
a curve f i t .
There is ambiguity i n t h e determina-
Both may b e r e l a t e d t o eddy v i s c o s i t y . Nei ther has
The tenuous na tu re of t he preceding ex t r apo la t ions t o t h e s t r a t i f i e d ,
quasi-steady states i s c e r t a i n l y recognized. The ques t ion of whether t h e
Ekman s o l u t i o n i s a v a l i d ou te r s o l u t i o n i s s i g n i f i c a n t . The Ekman s p i r a l
is genera l ly no t observed and i s n o t even an a n a l y t i c a l l y s t a b l e s o l u t i o n
f o r most geophysical condi t ions. However, an Ekman s o l u t i o n modified by
153

secondary flow is appropr ia te .
o u t e r flow, t h e asymptot ic l i m i t upon which (1) is based i s b a s i c a l l y t h e
same.
which must b e determined i n p r a c t i c a l a p p l i c a t i o n .
While t h e pe r tu rba t ion flow alters t h e genera l
The d i f f e rences are expected t o be absorbed i n t h e empir ica l cons tan ts ,
Although t h e de r iva t ions given p e r t a i n s t r i c t l y t o t h e n e u t r a l case,
they are l i k e l y t o p r e v a i l s i g n i f i c a n t l y f a r i n t o t h e s t r a t i f i e d regime.
The b a s i c cha rac t e r of t h e Ekman l a y e r s o l u t i o n and the log l a y e r w i l l
p e r s i s t i n s t r o n g flow regimes.
ness (such as t h e ocean) and s p e c i f i e d range of G (10-20 m sec-’), t h e main
v a r i a t i o n i n u,/G can be expected t o b e due t o s t r a t i f i c a t i o n e f f e c t s . The
rough d a t a a v a i l a b l e sugges t t h a t t h i s v a r i a t i o n may b e r e l a t e d t o a. v a r i a t i o n of a with changing s t r a t i f i c a t i o n corresponds t o t h e p red ic t ed
behavior of t he Ekman s o l u t i o n wi th secondary flow as discussed by Brown
[1972].
expected; however, the nea r ly l i n e a r l i n e segments represented by cons t an t
For a given s i t e wi th c h a r a c t e r i s t i c rough-
The
The v a r i a t i o n of i n t r i n s i c parameters w i t h s t r a t i f i c a t i o n i s
C, This unexpected f i t t o the da t a i n d i c a t e s t h a t t h e c h a r a c t e r i s t i c scales
inc rease and decrease wi th changing s t r a t i f i c a t i o n whi le t h e i r r a t i o remains
nea r ly cons tan t . If subsequent d a t a can s u b s t a n t i a t e t h i s behavior , then
a may serve not only as a s t r a t i f i c a t i o n parameter, b u t as an i n d i c a t o r of
su r f ace stress.
and C, i n the s t a b l e and t h e uns tab le regimes f i t t h e d a t a adequately.
REFERENCES
Blackadar, A. K. 1962. The ver t ical d i s t r i b u t i o n of wind and tu rbu len t exchange i n a n e u t r a l atmosphere. J . Geophys. Res. 67(8) : 3095-3102.
Blackadar, A. K., and H. Tennekes. 1968. Asymptotic s i m i l a r i t y i n n e u t r a l b a r o t r o p i c p l ane ta ry boundary l aye r . J . Atmos. Se i . 25: 1015-1022.
Boussinesq, J . 1903. Theorie AnaZytique de ChaZeur, vol . 2. P a r i s : Gauthier-Vil lars .
Brown, R. A. 1970. A secondary flow model f o r t h e p l ane ta ry boundary l aye r . J . A - ~ ~ o s . SCi. 27(5): 742-757.
. 1972. The i n f l e c t i o n p o i n t i n s t a b i l i t y problem f o r s t r a t i f i e d r o t a t i n g boundary l aye r s . J . Atmos. Sei . 29: 850-859.
. 1973. On t h e atmospheric boundary l aye r : theory and methods. AIDJEX BuZZetin No. 20, pp. 1-141.
154

Businger, J . 1955. On t h e s t r u c t u r e of the atmospheric su r face l aye r . J . MeteoroZogy 22: 553-561.
Businger, J . , J. C. Wyngaard, Y. Izumi, and E. Bradley. 1971. Flux p r o f i l e r e l a t i o n s h i p s i n t h e atmospheric s u r f a c e l aye r . J. Atmos. S e i . 28: 1021-1025.
Clarke, R. H. 1970. Observat ional s t u d i e s of t he atmospheric boundary l aye r . Q J R E 96: 91-114.
Clarke, R. H. , A. J. Dyer, R. R. Brook, D. G . Reid, and A. J. Troup. 1971. The Wangara experiment: boundary l a y e r data . CSIRO D i v . of M e t . Phys., Tech. Paper No. 19.
Csanady, G. T. 1967. On t h e r e s i s t a n c e l a w of a tu rbu len t Ekman layer . J . Atmos . Se i . 24: 467-471.
. 1972. Geostrophic drag, h e a t and mass t r a n s f e r c o e f f i c i e n t f o r t h e d i a b a t i c Ekman l aye r . J . Atmos. Sei. 29: 488-496.
Deardorff , J. W. 1970. Prel iminary r e su l t s from numerical i n t e g r a t i o n of t h e uns tab le p l ane ta ry boundary l aye r . J . Atmos. Sei. 27: 1209-1211.
Ekman, V. W. 1905. On t h e in f luence of t h e e a r t h ' s r o t a t i o n on ocean cu r ren t s . Arkiv Mat., Astr. 0. F y s i k 2(11) , 53 pp. ( i n Engl i sh) .
Kazanskii , A. B., and A. S O Monin. 1961. The dynamic i n t e r a c t i o n between the atmosphere and t h e l and sur face . B u l l e t i n ( I zves t iya ) of t h e Academy of Sciences, USSR, Geophys. S e r . 1\10. 5.
Taylor , G. I. 1915. The eddy motion i n t h e atmosphere. Phil. Trans. Roy. Soc. A, 215, I. (Sc i en t i f i c Popers 2 , I . )
Tennekes, H. 1973. The logar i thmic wind p r o f i l e . J . Atmos. Sei. 30: 2 34-2 38.
Wyngaard, J. C . , 0. R. Cote, and K. S. Rao. 1973. Modelling t h e atmos- p h e r i c boundary l a y e r , TurbuZent Di ffusion, IUGG Meeting, CharZottesuiZZe, Virginia. To appear i n Advmzces i n Gkophysies, Academic P res s , New York.
Proceedings, Second IUTAM, Symposium on
Z i l i t i n k e v i c h , S . , D. Laikhtman, and A. Monin. 1967. Dynamics of t h e atmospheric boundary l aye r . Izvest iya Akad. Nauk. SSSR, Atmos. and Qceanic Phys. Ser., 3: 297-333.
155

ABSTRACTS OF INTEREST
John L. Newton. 1973. The Canada Basin; mean c i r c u l a t i o n and in te rmedia te scale flow f e a t u r e s . Doctoral d i s s e r t a t i o n , Univers i ty of Washington.
Recent d i r e c t cu r ren t measurements and hydrographic d a t a from t h e Canada Basin of t h e Arctic Ocean are examined. From these d a t a , t h e mean c i r c u l a t i o n p a t t e r n is def ined and some of t h e t i m e dependent components of t h e flow f i e l d are i s o l a t e d and discussed.
is an an t i cyc lon ic gyre, t h e Beaufort gyre. This c i r c u l a t i o n is maintained by t h e wind stress p a t t e r n as modified by t h e i c e cover and, i n t h e shal lower areas near t h e coas t s and around t h e Chukchi Province, is s t rong ly a f f e c t e d by t h e bottom topography. The mean flow of t h e A t l a n t i c l a y e r (centered a t 5 0 0 m) is a l s o an t i cyc lon ic w i t h i n t h e deep bas in ; however, t h e r e is evidence f o r a subsur face counter cu r ren t along t h e Chukchi R i s e . This sou theas t counter flow apparent ly r e s u l t s from A t l a n t i c w a t e r en t e r ing t h e Canada Basin d i r e c t l y ac ross t h e deeper southern po r t ions of t h e Chukchi Province.
from t h e simulcaneous hydrographic and cu r ren t d a t a c o l l e c t e d from t h e Arct ic . Ice Dynamics J o i n t Experiment (AIDJEX) s t u d i e s . The baro- c l i n i c v a r i a t i o n s i n t h e c u r r e n t s are due t o slowly propagat ing, i n t e r - mediate scale f e a t u r e s which r ep resen t l a r g e h o r i z o n t a l g rad ien t s of cu r ren t s and mass f i e l d p rope r t i e s . Thus, during per iods of s u b s t a n t i a l ice d r i f t (5-10 km da- l ) , observed changes i n these v a r i a b l e s due t o t h e h o r i z o n t a l displacement of t h e measurement platform ac ross t h e f e a t u r e s w i l l gene ra l ly be g r e a t e r than l o c a l t i m e changes. Three t i m e dependent f e a t u r e s of t h e flow f i e l d are i d e n t i f i e d :
(1) Barotropic component. A depth independent, l a r g e scale v a r i a b l e cu r ren t component is i d e n t i f i e d i n t h e AIDJEX 1972 da ta . It has an amplitude of about 3 cm sec-l and r ep resen t s t h e major source of v a r i a b i l i t y a t per iods of one day o r g r e a t e r i n t h e deep cu r ren t records (deeper than 500 m). magnitude of t h e ba ro t rop ic component,is co r re l a t ed wi th t h e atmospheric fo rc ing (winds and atmospheric p re s su re g rad ien t ) .
f e a t u r e wi th c r e s t s o r i en ted north-south (perpendicular t o t h e mean flow) and a 100 t o 200 km wavelength i n t h e east-west d i r e c t i o n is i d e n t i f i e d i n the 1972 A I D J E X da t a . This f e a t u r e , which appears t o be a Rossby wave, has a per iod of 16-32 weeks. Isopycnal d i sp lace- ments a s soc ia t ed wi th t h i s wave are of t h e second mode, r e s u l t i n g i n geos t roph ica l ly balanced cu r ren t maxima (2-8 c m sec-’) i n t h e pycnocline.
(3) Baroc l in ic eddies . Very high speed c u r r e n t s ( g r e a t e r than 30 cm sec-’) contained wi th in t h e pycnocline w e r e observed i n both t h e A I D J E X s t u d i e s and previous i n v e s t i g a t i o n s i n t h e A r c t i c Ocean. These
The major f e a t u r e of t h e mean s u r f a c e flow i n t h e Canada Basin
The t i m e dependent components of t h e flow f i e l d are i d e n t i f i e d
The d i rec t ion ,and t o some ex ten t t he
(2) In te rmedia te scale b a r o c l i n i c f e a t u r e . A wave-like b a r o c l i n i c
157

f e a t u r e s are i d e n t i f i e d as geos t rophica l ly balanced, b a r o c l i n i c eddies wi th r a d i i of about 15 km and predominantly an t i cyc lon ic r o t a t i o n . The r a d i a l d i s t r i b u t i o n of v e l o c i t y and r e l a t i v e v o r t i c i t y is determined f o r one eddy. From 0 t o 6 km t h e t a n g e n t i a l v e l o c i t y inc reases l i n e a r l y , i n d i c a t i n g s o l i d body r o t a t i o n and a cons tan t v o r t i c i t y , wh i l e from 6 t o 15 km t h e v e l o c i t y d i s t r i b u t i o n i s i r r o t a t i o n a l . The important f o r c e s w i t h i n t h e eddy are C o r i o l i s , c e n t r i f u g a l and t h e i n t e r n a l p re s su re g rad ien t which are gene ra l ly i n balance. The water proper- t ies w i t h i n t h e eddies d i f f e r s i g n i f i c a n t l y from t h e ambient water p rope r t i e s ; t hus , t h e eddies w e r e probably formed a t a l o c a t i o n removed from t h e po in t of observa t ion , poss ib ly i n t h e Bering S t r a i t o r Chukchi Sea.
E. G. Banke and S. D. Smith. 1973. Wind stress on a r c t i c sea ice. Journa2 o f Geophysical Research 7 8 ( 3 3 ) : 7871-7883.
Wind v e l o c i t y f l u c t u a t i o n s have been recorded wi th a s o n i c anemometer over sea i c e a t a number of l o c a t i o n s i n t h e Arctic Ocean and i n Robeson Channel and used t o compute s u r f a c e stresses and drag c o e f f i - c i e n t s . The wind drag c o e f f i c i e n t is found t o c o r r e l a t e w e l l wi th t h e r m s e l e v a t i o n of t h e i ce and snow s u r f a c e a t wavelengths s h o r t e r than 13 meters. A formula f o r t h e es t imat ion of drag c o e f f i c i e n t s from s u r f a c e p r o f i l e s is given. The form drag of r idges can be of similar magnitude t o t h e measured s u r f a c e drag and should be allowed f o r . Gust f a c t o r s are examined. Spec t ra and o the r tu rbulence param- eters are found t o be i n agreement wi th o the r boundary l a y e r tu rbulence measurements over i c e , w a t e r , and land.
W. J. Campbell, P. Gloersen, W . Nordberg, and T. T. Wi lhe i t . 1973. Dynamics and morphology and Beaufort Sea ice determined from satel l i tes , a i r c r a f t , and d r i f t i n g s t a t i o n s . P r e p r i n t X-650-73-194. NASA-Goddard Space F l i g h t Center , Greenbel t , Maryland. Presented as Paper No. A.5.6 a t t h e Symposium on Approaches t o Earth Sciences through the Use of Space TechnoZogy, COSPAR Working Group 6 , 25 May 1973, Konstanz, Germany.
A series of measurements from d r i f t i n g s t a t i o n s , a i r c r a f t , t h e ERTS-1, Nimbus 4, and Nimbus 5 satel l i tes have j o i n t l y provided a new descr ip- t i o n of t h e dynamics and morphology of t h e ice cover of t h e Beaufort Sea. The combined a n a l y s i s of t hese d a t a s h o w s t h a t t h e e a s t e r n Beaufort Sea ice cover is made up of l a r g e mul t iyear f l o e s wh i l e t h e western p a r t is made up of s m a l l , predominantly f i r s t - y e a r f l o e s . The a n a l y s i s sugges ts t h a t t h i s d i s t r i b u t i o n might be quasi-s teady-state and t h a t t h e dynamics and thermodynamics of t h e reg ion are more complex than h i t h e r t o known. The measurements c o n s i s t o f : (1) h igh r e s o l u t i o n ERTS-1 imagery which is used t o desc r ibe f l o e s i z e and shape d i s t r i b u - t i o n , s h o r t t e r m f l o e dynamics, and l ead and polynya dynamics; (2) t r ack ing by Nimbus 4 of IRLS d r i f t i n g buoys t o provide i c e d r i f t information which enhances t h e i n t e r p r e t a t i o n of t h e ERTS-1 imagery: (3) Nimbus 5 microwave (1.55 cm wavelength) imagery which provides
15 8

synoptic, sequential maps on the distribution of multiyear and first- year ice types; ( 4 ) airborne microwave surveys and surface based observations made during 1971 and 1972 in conjunction with the AIDJEX (Arctic Ice Dynamics Joint Experiment) program.
The following abstracts are taken from papers which were presented at the InterdiscipZinary Symposium on Advanced Concepts and Techniques i n the Study of Snow and Ice Resources, 2-6 December, 1973 , Monterey, California.
R. J. Schertler, C. A. Raquet, and R. A. Svehla, NASA-Lewis Research Center, Cleveland, Ohio 44135. Application of thermal imagery to the develop- ment of a Great Lakes ice information system.
Recent measurements and analysis have shown that thermal infrared imagery (wavelength, 8-14 ym) can be employed to delineate the relative thicknesses of various regions of freshwater ice, as well as differen- tiate new ice from both open water areas and thicker (young) ice. Thermal imagery was observed to be generally superior to visual (0.4-0.7 pm) and our SLAR ( 3 . 3 cm) imagery for estimating relative ice thicknesses and delineating open water from new ice growth. In a real-time Great Lakes Ice Information System, thermal imagery can not only provide supplementary imagery but also aid in developing interpretative methods for all-weather SLAR imagery, as well as establishing the areal extent of spot thickness measurements.
Donald R. Wiesnet, NOAA, National Environmental Satellite Service. The role of satellites in snow and ice measurements.
Earth-orbiting polar satellites are desirable platforms for remote sensing of snow and ice. Geostationary satellites at very high altitude (35 ,000 km) are also desirable platforms for many remote sensors, particularly for communications relay, flood warning systems, and telemetry of unattended instrumentation in remote, inaccessible places such as the Arctic, Antarctic, or mountain tops. Optimum use of satellite platforms is achieved only after careful consideration of the temporal, spatial and spectral requirements of the environmental mission. The National Environmental Satellite Service will maintain both types of environmental satellites as part of its mission. The NOAA-2 satellite currently in use provides twice-a-day earth coverage in a near-polar orbit at an altitude of 1500 km. Resolution Radiometer (VHRR) is a new, significantly improved dual channel scanner (visible, .6-.7 Pm; infrared 10.5-12.5 pm) that has been used experimentally for detailed snow mapping. percent of snow cover is believed to be accurate to 5% in either moun- tainous terrain or flatland basins greater than 5,000 km2 when the visible channel is used on cloudfree days. Cloud contamination and thick coniferous forests are problems that can and do affect such measurements .
The NOM-2 Very High
Basin mapping of
159

Although snow th ickness and water equiva len t cannot as y e t be determined from satel l i te d a t a , under c e r t a i n s p e c i a l condi t ions v i s i b l e band r e f l e c t a n c e seems t o b e r e l a t e d t o snow depth. Research d i r e c t e d toward determining snow cover i n reg ions of heavy f o r e s t canopy, such as t h e Adirondacks, would be h ighly b e n e f i c i a l t o a l l i n v e s t i g a t o r s .
v i s i b l e and near-IR has been achieved using ERTS-1 d a t a as w e l l as Nimbus-3 da ta . Mul t i spec t r a l techniques have permit ted i d e n t i f i c a t i o n of mel t ing snow, b u t t h e r e l a t i o n of s p e c t r a l r e f l e c t a n c e of snow t o type, age, water equiva len t and metamorphosis of snow is poorly known and r a r e l y s tud ied .
NASA's Nimbus-5 s a t e l l i t e , l a u n c h e d i n December 1972, carries an E l e c t r i c a l l y Scanning Microwave Radiometer (ESMR) capable of measuring t h e e a r t h ' s b r igh tness temperature--hence its snow cover--through almost any cloud cover. Ground r e s o l u t i o n of t h e instrument ranges from 25 x 25 km t o 45 x 160 km, thereby l i m i t i n g t h e usefu lness of t h i s instrument--at l eas t f o r snow mapping--to large-area s t u d i e s .
snow th ickness , water equiva len t and snow dens i ty are foremost among them. On t h e o t h e r hand, determining t h e percent of snow cover i n bas ins is e a s i l y p o s s i b l e today i f t h e need is demonstrated. The percent of t h e snowpack mel t ing a t t h e s u r f a c e cannot be accomplished wi th p re sen t NOAA senso r s , b u t may be p o s s i b l e i n a f u t u r e genera t ion of sensors .
S a t e l l i t e d e t e c t i o n of mel t ing snow and melt ing l ake ice us ing
Many p r o p e r t i e s of snow cannot be measured today by s a t e l l i t e s :
Thomas H. Vonder Haar, Department of Atmospheric Science, Colorado S t a t e Univers i ty . Nimbus-3 sa te l l i t e da ta .
Measurement of a lbedo over po la r snow and ice f i e l d s us ing
E f f e c t s of v a r i a t i o n s of snow and ice f i e l d s on hemispheric weather and climate p a t t e r n s are l a r g e l y accomplished through t h e albedo of t h e s e su r faces . For t h e f i r s t t i m e r e c e n t measurements from meteoro- l o g i c a l satell i tes have allowed t h e de te rmina t ion of t o t a l s p e c t r a l albedo (0.3-3 um) over both po la r reg ions a t moderately high ground r e so lu t ion . This paper desc r ibes t h e albedo d a t a reduct ion technique, t h e usefu lness of s u r f a c e measurements t o augment t h e sa te l l i t e observa- t i o n s , and t h e p a t t e r n s and extremes of po la r albedo v a r i a t i o n measured during 1969-1970.
W. E. Markham, Department of t h e Environment, Canada. Modern demands on t h e Canadian Ice Advisory Service.
Canada has developed a comprehensive sea i c e reconnaissance and f o r e c a s t i n g program over t h e p a s t f i f t e e n yea r s which extends from t h e Great Lakes and Grand Banks i n win te r t o t h e f r i n g e s of t h e A r c t i c Ocean i n summer. I n i t i a l v i s u a l mapping and message r e l a y from s h o r t range a i r c r a f t has given way almost exc lus ive ly t o teams of observers a ided by an a r r a y of remote senso r s passing d a t a d i r e c t l y t o ice- breakers and from a i r p o r t t o f o r e c a s t o f f i c e us ing f a c s i m i l e equipment.
160

A t t h e same t i m e , ice f o r e c a s t i n g requirements have become more and more involved, t h e i r per iod has lengthened and qeasonal out looks are now requi red i n most areas.
This evolu t ion has a l s o extended t o t h e d a t a s t o r e f o r no r the rn and o f f shore petroleum developments; planning and design of l a r g e r icebreakers and s t rengthened cargo v e s s e l s are con t inua l ly r a i s i n g new ques t ions concerning t h e na tu re of t h e i c e pack, of i t s r i d g e s , t h e s i z e , numbers and pa ths of icebergs t h a t t a x t h e c a p a b i l i t y of an al l -purpose survey system.
Considerable improvements i n observing c a p a b i l i t y and i n d a t a handl ing are requi red and s t e p s are being taken t o explore and e x p l o i t t hese as n a t i o n a l economics permit.
E. Paul McClain, NOAA, Nat iona l Environmental S a t e l l i t e Service. Some new sa te l l i t e measurements and t h e i r a p p l i c a t i o n t o sea ice a n a l y s i s i n t h e A r c t i c and An ta rc t i c .
The NOM-2 ope ra t iona l environmental s a t e l l i t e carries a new Very High Resolut ion Radiometer (VHRR) capable of one ki lometer ground r e s o l u t i o n i n t h e v i s i b l e and thermal i n f r a r e d po r t ions of t h e spectrum. This r e s o l u t i o n is s i g n i f i c a n t l y h igher than t h a t prev ious ly a v a i l a b l e from N O M ope ra t iona l sa te l l i t es o r from NASA Nimbus satel l i tes , and t h e areal coverage and frequency of coverage is much g r e a t e r than t h a t afforded by NASA's Ear th Resources Technology S a t e l l i t e (ERTS-1).
The VHRR d a t a have g r e a t l y improved t h e ease and r e l i a b i l i t y of s a t e l l i t e image i n t e r p r e t a t i o n f o r t h e d e t e c t i o n and monitoring of i c e pack f e a t u r e s and condi t ion , even dur ing t h e months of po la r n igh t darkness. being made, and r e sea rch explor ing t h e e x t r a c t i o n of q u a n t i t a t i v e information from t h e s e d a t a is underway a l s o .
o f t e n seve re ly l i m i t e d by cloud cover. The microwave imager on t h e Nimbus 5 sa te l l i t e does no t s u f f e r t h i s c o n s t r a i n t .
Operat ional a p p l i c a t i o n s of VHRR images are a l r eady
Visua l and i n f r a r e d observa t ions of sea ice from satel l i tes are
James C. Barnes, Cl in ton J. Bowley, and David A. Simmes, Environmental Research and Technology, Inc . , Lexington, Massachusetts 02173. Snow s t u d i e s us ing v i s i b l e and i n f r a r e d measurements from e a r t h satell i tes.
This paper desc r ibes r ecen t s t u d i e s of t h e app l i ca t ions of ITOS and Nimbus thermal I R measurements and of ERTS-1 m u l t i s p e c t r a l imagery f o r d e t e c t i n g and mapping snow ex ten t . The r e s u l t s of t hese i n v e s t i g a t i o n s demonstrate t h a t thermal I R measurements can b e a u s e f u l t o o l f o r mapping gross snow-cover p a t t e r n s , a t least i n r e l a t i v e l y f l a t t e r r a i n ; i n I R imagery, snow-covered areas are usua l ly depic ted by s i g n i f i c a n t l y b r i g h t e r tones (lower temperatures) than t h e surrounding snow-free t e r r a i n . The a n a l y s i s of ERTS imagery f o r two test sites, t h e Sa l t - Verde Watershed i n c e n t r a l Arizona and t h e southern S i e r r a Nevada i n C a l i f o r n i a , i n d i c a t e s t h a t snow ex ten t can be mapped from ERTS i n more d e t a i l than is depic ted on aerial survey snow c h a r t s . Moreover, i t appears t h a t a l though s m a l l d e t a i l s i n t h e snowline can b e mapped
161

b e t t e r from higher - reso lu t ion a i r c r a f t photographs, boundaries of t h e areas areas of s i g n i f i c a n t snow cover can be mapped as accura t e ly from t h e ERTS imageryeas from t h e a i r c r a f t photography.
r
James C. Barnes, Cl in ton J. Bowley, David T. Chang, and James H. Willand. Environmental Research and Technology, Inc . , Lexington, Massachusetts 02173. Appl ica t ion of s a t e l l i t e v i s i b l e and i n f r a r e d d a t a t o mapping sea ice.
This paper desc r ibes t h e use of t h e h igh- reso lu t ion , m u l t i s p e c t r a l d a t a from ERTS-1 (Earth Resources Technology S a t e l l i t e ) f o r mapping a rc t i c sea i c e . t h e Bering Sea during t h e 1973 s p r i n g season are discussed. r e s u l t s demonstrate t h a t ERTS imagery has a high p o t e n t i a l f o r monitoring i c e condi t ions during t h e t i m e of maximum ice e x t e n t and t h e beginning of t h e i c e break-up season. of sa te l l i t e thermal I R d a t a f o r d e t e c t i n g ice are a l s o d iscussed . Evidence is found t h a t t h e combined use of I R and v i s i b l e d a t a may provide more information on i c e condi t ions than can b e deduced from e i t h e r type of d a t a a lone , and t h a t during per iods of a l t e r n a t i n g day l igh t and darkness a r e l a t i o n s h i p e x i s t s between t h e d i u r n a l v a r i a t i o n i n I R temperature and ice th ickness and/or amount.
I c e f e a t u r e s mapped i n t h e e a s t e r n Beaufort Sea and The
Examples of t h e a p p l i c a t i o n
Henry G. Hengeveld, Atmospheric Environment Serv ice , Department of t h e Environment, Canada. Remote sens ing a p p l i c a t i o n s i n Canadian ice reconnaissance.
Remote sens ing techniques are being inves t iga t ed and i n t e g r a t e d i n t o t h e Canadian a i rbo rne i c e reconnaissance program i n o rde r t o improve t h e program t o an a l l weather, day and n igh t c a p a b i l i t y . Two Electra a i r c r a f t being used f o r a r o u t i n e v i s u a l and r ada r i c e observing program have been equipped wi th an i n f r a r e d l i n e scan system, a laser prof i lometer system and a t r i metrigon Vinten camera system. Applica- t i o n s and i n t e r p r e t a t i o n problems of S ide Looking Airborne Radar imagery over ice of a l l ages and types are a l s o being inves t iga t ed i n p repa ra t ion f o r f u t u r e i n s t a l l a t i o n s of SLAR systems. Real t i m e d a t a a v a i l a b i l i t y f o r immediate i n f l i g h t i n t e r p r e t a t i o n and a n a l y s i s is being emphasized. The formats of t h e real t i m e as w e l l as permanent d a t a records , t h e i n t e r p r e t a t i o n methods, and t h e a n a l y s i s of t h e a v a i l a b l e information are discussed. Proposed methods of d a t a reduc- t i o n and coord ina t ion wi th v i s u a l and r ada r d a t a f o r u se i n d i r e c t marine tact ical support are presented.
T. Schmugge, T. T. Wi lhe i t , and P. Gloersen, NASA/Goddard Space F l i g h t Center , Greenbel t , Maryland 20771; M. F. Meier and D. Frank, Water Resources Divis ion, U.S. Geological Survey, Tacoma, Washington; I. Dirmhirn, Utah S t a t e Univers i ty , Logan, Utah. Microwave s i g n a t u r e s of snow and f r e s h water ice. NASA P r e p r i n t X-652-73-335.
During March of 1971, t h e NASA Convair 990 Airborne Observatory ca r ry ing microwave radiometers i n t h e wavelength range 0.8 t o 2 1 cm
162

8
w a s flown over dry snow wi th d i f f e r e n t s u b s t r a t a : Lake i n Utah; w e t s o i l i n t h e Yampa River Valley near Steamboat Springs, Colorado; and g l a c i e r ice, f i r n and w e t snow on t h e South Cascade Glacier i n Washington. The d a t a presented i n d i c a t e t h a t t h e t ranspar - ency of t h e snow cover is a func t ion of wavelength. False-color images of microwave b r igh tness temperatures obtained from a scanning radiometer opera t ing a t a wavelength of 1.55 cm demonstrate t h e c a p a b i l i t y of scanning radiometers f o r mapping snowfields .
l a k e ice a t Bear
Ambrose 0. Poul in , U.S. Army Engineer Topographic Labora tor ies . Hydrologic c h a r a c t e r i s t i c s of snow-covered t e r r a i n from thermal i n f r a r e d imagery.
Snow cover, i n a d d i t i o n t o its own con t r ibu t ion t o t h e hydro logica l s t a t e of t h e t e r r a i n , o f t e n conceals o the r hydrologic f e a t u r e s o r changes i n t h e i r condi t ions . The d i f f e r e i n g subsur face thermal regimes of f e a t u r e s such as streams, f rozen l akes , and areas of deeper snow o f t e n produce s u r f a c e temperature d i f f e r e n c e s t h a t are s u f f i c i e n t f o r t h e product ion of thermal images of those f e a t u r e s . Measurements a t a f rozen arct ic s h o r e l i n e i n d i c a t e t h a t t h e p a r t of t hese temperature d i f f e r e n c e s r e s u l t i n g from sys temat ic v a r i a t i o n s of t h e energy balance components is s u f f i c i e n t l y l a r g e t h a t i t can be d i s t ingu i shed from t h e p a r t due t o random v a r i a t i o n s . This sugges ts t h a t t h e r e is a degree of p r e d i c t a b i l i t y t o t h e information a v a i l a b l e i n thermal i n f r a r e d imagery of snow-covered t e r r a i n . However, i t is o f t e n necessary t o consider topographic r e l a t i o n s h i p s and s h o r t t e r m environmental phenomena i n order t o understand some of t h e t r a n s i e n t , b u t u s e f u l , image f e a t u r e s . A phenomenon, which w a s given t h e name "cold f r i n g e e f f e c t , " w a s discovered t h a t should al low t h e i d e n t i f i c a t i o n of areas i n which t h e ice formed on bodies of water is f rozen t o t h e bottom. A q u a l i t a t i v e model w a s developed f o r t h e d i u r n a l v a r i a t i o n of a s h o r e l i n e temperature d i f f e r e n t i a l throughout t h e win ter season, and s t u d i e s are i n progress t o eva lu t e i t us ing measurements from both a i r c r a f t and spacec ra f t .
W. D. Hib ler 111, S. J. Mock, U.S. Army Cold Regions Research and Engineering Laboratory, Hanover, New Hampshire. C l a s s i f i c a t i o n of sea ice r idg ing and s u r f a c e roughness i n t h e A r c t i c basin.
One- and two-parameter c l a s s i f i c a t i o n schemes f o r sea ice p res su re r idg ing are reviewed. Using t h e s e c l a s s i f i c a t i o n schemes t h e number of r idges above any he igh t may be predic ted . More than 500 km of processed laser p r o f i l e d a t a flown over t h e arctic ice pack i n November 1970 is used t o i l l u s t r a t e t h e agreement between models and observa t ion . The key parameter is yh, def ined by yh/X, where y h is t h e number of r idges pe r ki lometer above he igh t h encountered along a s t r a i g h t l i n e path, and X is t h e r i d g e he igh t d i s t r i b u t i o n shape parameter, uniquely determined b y < H h > , t h e mean r i d g e he ight . Sur face roughness s p e c t r a l c h a r a c t e r i s t i c s are examined and i t is found t h a t r i dg ing i n t e n s i t y c o r r e l a t e s w e l l w i th s u r f a c e roughness throughout t h e frequency range. A s p e c i f i c r e l a t i o n s h i p between high frequency roughness (< 1 3 m) and r idg ing i n t e n s i t y is shown. Wind form drag va lues due t o pressure
163

r idges are ca l cu la t ed and compared t o empir ica l wind drag va lues obtained by o t h e r r e sea rche r s f o r r e l a t i v e l y unridged ice.
W. K. Crowder, H. L. McKim, S. F. Ackley, W. D. Hib ler 111, and D. M. Anderson, U.S. Army Cold Regions Research and Engineering Laboratory, Hanover, New Hampshire. Mesoscale deformation of sea ice from s a t e l l i t e imagery.
Sequent ia l mesoscale movement and deformation i n t h e pack ice approximately 90 km nor theas t of Poin t Barrow, Alaska, have been observed i n t h e ERTS-1 m u l t i s p e c t r a l imagery of 19 t o 22 March 1973. A t t h i s l a t i t u d e , s i d e l a p of ad jacent ground t r a c k s of d a i l y overpasses is about 75%. This s i d e l a p , toge ther w i th t h e coincidence of f i v e cloud-free days and a major westward movement of t h e pack i n t h e Beaufort Sea Gyre, permit ted observa t ion of d r i f t and deformation i n an area of about 1.4 X l o 4 km2.
and divergence rates as l a r g e as 1 .3 X lom6 sec-l (0.5% per hour) . Continuous deformation measurements through t h e f a s t i ce /pack i c e boundary ind ica t ed a sharp change i n t h e s i g n of t h e v o r t i c i t y as t h e shear zone w a s crossed. Measured d r i f t v e l o c i t i e s va r i ed from 0.24 m/sec t o 0.4 m/sec (0.9 t o 1.4 m/hr).
d a t a can be obtained from s e q u e n t i a l ERTS-1 images. u s e f u l f o r determining s c a l i n g e f f e c t s i n t h e i c e v e l o c i t y f i e l d and f o r t e s t i n g e x i s t i n g mathematical models of t h e response of sea i c e t o meteorological and hydrodynamic stresses.
S t r a i n c a l c u l a t i o n s us ing several 10-point a r r a y s y ie lded shear
These r e s u l t s i n d i c a t e t h a t d e t a i l e d deformation and movement Such d a t a are
W. F. Weeks, W. D. Hib ler 111, and S. F. Ackley, U.S. Army Cold Regions Research and Engineering Laboratory, Hanover, New Hampshire. Sea ice: s c a l e s , problems and requirements.
Sea ice can be examined on a v a r i e t y of s p a t i a l scales t h a t range over 10 o rde r s .o f magnitude. c h a r a c t e r i s t i c types of problems and these problems have a s soc ia t ed requirements f o r new observa t iona l systems and techniques t h a t are necessary f o r t h e i r r e so lu t ion . view of some of t h e more important problems and requirements on each s c a l e .
The smallest scale, t h e microscale , is d i s t ingu i shed from o t h e r scales by t h e g r e a t importance of changes i n t h e growth condi t ions on the s t r u c t u r e of t h e r e s u l t i n g ice and t h e c o n t r o l l i n g e f f e c t of t h e s e s t r u c t u r a l v a r i a t i o n s on its s m a l l scale (< 10 m) p roper ty v a r i a t i o n . The g r e a t e s t need is f o r compact ins t rumenta t ion t h a t i s capable of r ap id ly spec i fy ing , by non-destruct ive methods, t h e i n t e r n a l s t a t e of t h e sea i c e .
t h e micro-s t ruc tura l p r o p e r t i e s of t h e ice r a p i d l y become of less importance as t h e s c a l e l eng th inc reases , being replaced by e f f e c t s produced by ensembles of ice f e a t u r e s such as f l o e s , l eads and p res su re
Each scale of observa t ion has i t s
The present paper provides a personal
When observa t ions on t h e mesoscale (100 m - 50 km) are considered,
164

r idges . It is w i t h i n t h i s s c a l e range t h a t t h e understanding requi red t o b r idge t h e gap between t h e s m a l l scale s p a t i a l and temporal behavior of i nd iv idua l ice f e a t u r e s and t h e l a r g e scale behavior of t h e pack as a whole must be sought. For tuna te ly ins t rumenta t ion t o accomplish most a s p e c t s of mesoscale experimentation e x i s t s . Its drawbacks are t h a t t h e equipment i s both expensive and r e l a t i v e l y untes ted under a rc t ic condi t ions . The mesoscale i s a l s o t h e n a t u r a l scale f o r t h e u t i l i z a t i o n of remote sens ing systems operated from a i r c r a f t . However, f o r t h e r e s u l t s of such remote sens ing f l i g h t s t o be u s e f u l f o r more than a post-mortem requ i r e s techniques f o r r ap id ly analyzing t h e d a t a and present ing i t i n terms of phys i ca l ly j u s t i f i a b l e d i s t r i b u t i o n func t ions . The most important equipment development problem as r e l a t e d t o mesoscale s t u d i e s is t h e p re sen t l a c k of an instrument t h a t remotely measures ice th ickness .
a i r c r a f t can only be used t o o b t a i n random samples of t h e ice of i n t e r e s t . Most information would t h e r e f o r e have t o be provided by s a t e l l i t e - b a s e d remote sens ing systems coupled wi th a r r a y s of d a t a buoys s i t e d i n t h e i c e . Progress i n a r c t i c d a t a buoy development is q u i t e encouraging wi th t h e main missing element being t h e i n a b i l i t y t o o b t a i n adequate oceanographic da t a . The problems wi th t h e satell i te- based remote sens ing d a t a are, as i n t h e mesoscale, p r imar i ly r e l a t e d t o d i f f i c u l t i e s i n r ap id a n a l y s i s of t h e images i n a format t h a t can be used i n cu r ren t numerical e f f o r t s . of c e r t a i n systems t o func t ion through a cloud cover and t h e long hol idays i n t h e d a t a acquired by systems such as ERTS.
On t h e macroscale (> 100 km), convent ional remote sens ing from
Other problems are t h e i n a b i l i t y
P. Gloersen, T. C. Chang, T. T. Wi lhe i t , NASA-Goddard Space F l i g h t Center. Greenbel t , Maryland; and W. J. Campbell, U.S. Geological Survey, Tacoma, Washington. Po la r sea ice observa t ions by means of microwave radiometry.
P r i n c i p l e s p e r t i n e n t t o t h e u t i l i z a t i o n of 1.55 cm wavelength r a d i a t i o n emanating from t h e s u r f a c e of t h e Earth f o r s tudying t h e changing c h a r a c t e r i s t i c s of po la r sea ice are b r i e f l y reviewed. Recent d a t a obtained a t t h a t wavelength wi th an imaging radiometer on-board t h e Nimbus 5 s a t e l l i t e are used t o i l l u s t r a t e how the seasonal changes i n ex ten t of sea ice i n both po la r reg ions may be monitored f r e e of atmos- phe r i c i n t e r f e rence . Within a season, changes i n t h e compactness of t he sea ice are a l s o observed from t h e sa te l l i t e . Some s u b s t a n t i a l areas of t h e Arctic sea ice canopy i d e n t i f i e d as f i r s t - y e a r i c e i n t h e p a s t win ter w e r e observed no t t o m e l t t h i s summer, a graphic i l l u s t r a t i o n of t h e eventua l formation of mul t iyear ice i n t h e Arctic. wave emiss iv i ty of some of t h e mul t iyear ice areas near t h e North Pole w a s found t o inc rease s i g n i f i c a n t l y i n t h e s u m m e r , probably due t o l i q u i d water conten t i n t h e f i r n l aye r .
F i n a l l y , t h e micro-
165