
AIAA-2002-4253 The Effects of Nude Faraday Probe …peplweb/pdf/AIAA-2002-4253_Faraday.pdfthe...
14
AIAA-2002-4253 The Effects of Nude Faraday Probe Design and Vacuum Facility Backpressure on the Measured Ion Current Density Profile of Hall Thruster Plumes Mitchell L. R. Walker, Richard R. Hofer, and Alec D. Gallimore Plasmadynamics and Electric Propulsion Laboratory The University of Michigan Ann Arbor, MI 48105 USA 38th AIAA/ASME/SAE/ASEE Joint Propulsion Conference & Exhibit 7-10 July 2002 Indianapolis, Indiana For permission to copy or republish, contact the copyright owner named on the first page. For AIAA-held copy write, write to AIAA Permissions Department, 1801 Alexander Bell Drive, Suite 500, Reston, VA 20191-4344.
Transcript of AIAA-2002-4253 The Effects of Nude Faraday Probe …peplweb/pdf/AIAA-2002-4253_Faraday.pdfthe...
AIAA-2002-4253 The Effects of Nude Faraday Probe Design and Vacuum Facility Backpressure on the Measured Ion Current Density Profile of Hall Thruster Plumes
Mitchell L. R. Walker, Richard R. Hofer, and Alec D. Gallimore Plasmadynamics and Electric Propulsion Laboratory The University of Michigan Ann Arbor, MI 48105 USA
38th AIAA/ASME/SAE/ASEE Joint Propulsion Conference & Exhibit
7-10 July 2002 Indianapolis, Indiana
For permission to copy or republish, contact the copyright owner named on the first page.
For AIAA-held copy write, write to AIAA Permissions Department, 1801 Alexander Bell Drive, Suite 500, Reston, VA 20191-4344.
THE EFFECTS OF NUDE FARADAY PROBE DESIGN AND VACUUM FACILITY BACKPRESSURE ON THE MEASURED ION CURRENT DENSITY PROFILE OF HALL THRUSTER PLUMES
Mitchell L. R. Walker* Richard R. Hofer* Alec D. Gallimore†
[email protected] [email protected] [email protected]
Plasmadynamics and Electric Propulsion Laboratory Department of Aerospace Engineering
University of Michigan Ann Arbor, MI 48109 USA
* Graduate Student, Student Member AIAA † Associate Professor, Associate Fellow AIAA Copyright © 2002 by Mitchell L. R. Walker Published by the American Institute of Aeronautics and Astronautics, Inc. with permission.
ABSTRACT
The effects of dissimilar probe design and facility backpressure on the measured ion current densities of Hall thrusters are investigated. JPL and GRC designed nude Faraday probes are used to simultaneously measure the ion current density of a 5 kW Hall thruster in the Large Vacuum Test Facility (LVTF) at the University of Michigan. The probes are located one meter from the exit plane of the Hall thruster, which is operated over the range of 300-500 V and 5-10 mg/s. In addition, the effect of facility background pressure is evaluated by varying the nominal pumping speed from 70,000 l/s to 240,000 l/s on xenon, corresponding to backpressures of 4.3x10⁻⁶ Torr to 2.3x10⁻⁵ Torr, corrected for xenon. Detailed examination of the results has shown that the GRC probe measured a greater ion current density than the JPL probe over the range of angular positions investigated for each operating condition. Yet, both probes measure similar thruster plume profiles for all operating conditions. Because all other parameters are identical, the differences between ion current density profiles measured by the probes are contributed to material selection and probe design. Moreover, both probes measured the highest ion current density near thruster centerline at the lowest facility pumping speed. A combination of charge exchange collisions and vacuum chamber gas ingestion into the thruster is believed to be the cause of this phenomenon.
Introduction
The Hall Effect Thruster’s (HET) combination of high specific impulse, efficiency, and thrust density, has increased its popularity for use in spacecraft propulsion systems. As the availability of in-space power increases, the trend in HET development is growing proportionally towards high-power engines. In the last ten years, the HET community has seen the completion of flight qualification to western standards of the SPT-100 (1.35 kW),1-2 on-going activities for qualifying the SPT-140 (4.5 kW),3-4BPT-4000,5 and a 1000 hour test of the T-220 (10 kW).6-7 The latest trends at government laboratories sponsoring HET research are towards power levels of 30-100 kW.8 The NASA Glenn Research Center (GRC) has recently begun testing a nominally 50 kW engine, and the Air Force Research Laboratory (AFRL) has recently started testing a cluster of four 200 W HETs 9 with the
eventual goal of testing high-power clusters. The University of Michigan will be supporting this effort with the acquisition of a 4 x 600 W Busek cluster and a 2 x 5 kW P5 cluster. The ability of high-power HETs to perform orbit-raising as well as stationkeeping maneuvers may eliminate the need for chemical rockets on satellites and deep space probes. The trend to high-power HETs leads to elevated facility back pressures in existing facilities. Facility effects become more important as back pressure rises due to the increased number of charge exchange (CEX) collisions. Given the cost of adding pumping speed to a facility – between $1-$4 per l/s – and the fact that most facilities are already filled to capacity with cryosurfaces, it is unlikely that significant pumping speed improvements will take place in the near future on current propellants, such as xenon or krypton. This
American Institute of Aeronautics and Astronautics
2
raises considerable questions about the reliability of the performance and plume measurements that will be taken for high-power HETs. As a result, there is a growing need in the United States to develop the necessary methodologies and diagnostics to test high-power thrusters at elevated pressures, so that ground test results may be correlated to in-space operation. Currently, the widespread use of HETs is hindered by the lack of understanding of plume interaction with the spacecraft. The plume contains high-speed ions that can erode sensitive spacecraft surfaces, and the deposition of contamination products created by thruster discharge channel erosion can reduce solar cell performance. The parasitic facility effects present in ground tests create additional plume components such as slow propellant ions and slow and fast neutral atoms.10 Ions and neutrals present in the HET plume interact through the process of resonant CEX collisions. Accounting for CEX ions is not the only obstacle to using ground tests for in-space performance prediction. The wide range of facilities used in Hall thruster testing makes it difficult for researchers to compare data sets, given dissimilar probe designs and elevated facility backpressures in facilities with modest pumping speeds and varying geometries.11 Further, numerical studies have not shown very good agreement with experimental data, which further hinders the integration of HETs with spacecraft.12 To this end, the University of Michigan has launched an investigation seeking to more fundamentally understand facility effects introduced by elevated backpressures. This investigation has thus far included the characterization of the performance of the P5 HET at different pumping speeds13, an evaluation of a collimated Faraday probe’s ability to filter out CEX ions while measuring the ion current density at elevated backpressures11, and a pressure map of the Large Vacuum Test Facility (LVTF) in conjunction with a DSMC simulation to characterize chamber backpressure.14 This paper investigates the effect of Faraday probe design and facility backpressure on the measured ion current densities in HET plumes. The goal of this work and future experiments is to develop a standardized method for measuring the ion current density, such that valid comparisons can be made between data taken in different facilities, with different background pressures.
Faraday Probes
Several numerical sputtering model codes have been developed to provide adequate predictions of the HET plume’s impact on spacecraft. Inputs to such models are typically the ion energy and ion current density
distributions. These are experimentally determined at a known radial position as a function of angle with respect to the thruster centerline. Normally, the ion current density distribution is measured with a nude Faraday probe. A shortcoming of nude Faraday probes is that the measured ion current density depends partly on the facility size and operating pressure. This makes comparisons between ion current density data collected in different facilities questionable, since almost all facilities differ considerably in geometry and pumping speed. Facility effects due to elevated operating pressures are driven by CEX collisions of directed plume ions with the random background population of neutrals. In resonant CEX collisions, a “fast” moving ion exchanges an electron with a “slow” moving neutral. Because the process does not involve momentum transfer, the resulting products are a fast neutral moving with the original ion’s velocity and a slow ion moving in a random direction. The nude Faraday probe is unable to differentiate between ions created in the discharge chamber and slow CEX ions. A more in-depth discussion of CEX collisions is given in Ref. 11. In an effort to obtain the true ion current density in the presence of CEX collisions and their products, the University of Michigan’s Plasmadynamics and Electric Propulsion Laboratory (PEPL) has evaluated a collimated Faraday Probe’s ability to filter out CEX ions while measuring the ion current density at elevated back pressures.15,16 The results of that effort show that optical filtering with a collimated Faraday probe does not filter out low-energy ions introduced in the plume by CEX collisions caused by the finite vacuum chamber backpressure. The purpose of this study is to evaluate the performance of the JPL and NASA GRC nude Faraday probes at background pressures above and below the Randolph criterion17 for plume characterization. Randolph’s criterion suggests that below background pressures of 1x10⁻⁵ Torr, facility effects on plume measurements are negligible. Our study allows for the evaluation of dissimilar nude Faraday probe designs as well as a verification of Randolph’s criterion. In the following, a design comparison of the JPL and NASA GRC probes is presented. Experimental results and discussion of current density measurements obtained at PEPL then follow. Finally, some conclusions on the differences in performance of the JPL and GRC nude Faraday probes are offered.

American Institute of Aeronautics and Astronautics
3
Experimental Apparatus
Vacuum Facility All experiments were conducted in the University of Michigan’s LVTF. The LVTF is a stainless steel-clad vacuum chamber that has a diameter of 6 m and a length of 9 m. The thruster was mounted at thruster station 1, as indicated in Figure 1. At this position, the thruster is medially located along the radial axis of the tank, and the plume is allowed to expand freely approximately 7 meters along the centerline axis. The facility is equipped with seven CVI TM-1200 re-entrant cryopumps, each of which is surrounded by a LN2 baffle. With seven pumps operating, the pumping speed of the facility is 500,000 l/s on air, and 240,000 l/s on xenon with a base pressure of 2.5x10⁻⁷ Torr. The cryopump system can be operated with any number of pumps in use.
Two hot-cathode ionization gauges monitored chamber pressure, as indicated in Figure 1. The first gauge was a Varian model 571 gauge with a HPS model 919 Hot Cathode Controller. The second was a Varian model UHV-24 nude gauge with a Varian UHV senTorr Vacuum Gauge Controller. Pressure measurements from both gauges were corrected for xenon using the known base pressure on air and a correction factor of 2.87 for xenon according to the following equation,18
bbi
c PPP
P +−
=87.2
, (1)
where Pc is the corrected pressure on xenon, Pb is the base pressure, and Pi is the indicated pressure when xenon is flowing into the vacuum chamber. For the experiments reported here, the LVTF was operated with two, four, and seven cryopumps, corresponding to nominal pumping speeds of 70,000, 140,000, and 240,000 l/s, respectively. Table 1 shows the operating pressures of the LVTF for the various flow rates and pumping speeds investigated. Operating pressures are arrived at by averaging pressures measured by the nude and external ion gauges.
Hall Thruster All experiments were performed on the NASA-173M (formerly called the P5-2) Hall thruster. This engine may be operated as either a singe- or two-stage device, usually by replacing electrodes with rings of boron nitride. For these experiments, the engine was run exclusively in single-stage mode with a discharge chamber that was machined only for single-stage operation (no ring segments). A more detailed
discussion of this thruster can be found in References 19 and 20. The 173M has a mean diameter of 148 mm, a channel width of 25 mm, and has a nominal power rating of 5 kW. The thruster was allowed to operate for two hours after initial exposure to vacuum to allow the discharge chamber walls to outgas. Upon subsequent thruster shutdowns and restarts, the 173M was operated for approximately 30 minutes before data were taken to allow the discharge chamber walls to reach thermal steady-state.
Table 1 – LVTF background pressure for the investigated flow rates and pumping speeds.
Nominal Anode Cathode PressurePumping Flow Flow
Speed (l/s) (mg/s) (mg/s) (Torr-Xe)
70,000 4.81 0.55 1.3E-0570,000 9.61 0.55 2.3E-05140,000 5.01 0.55 7.6E-06140,000 9.73 0.55 1.3E-05240,000 5.06 0.55 4.3E-06240,000 9.75 0.55 7.7E-06
Figure 1 – Schematic of the LVTF (not to scale). A NASA GRC laboratory model hollow cathode was located at the 12 o’clock position on the thruster. The cathode orifice was located approximately 25 mm downstream and 25 mm radially away from the outer front pole piece at an inclination of 30° from thruster centerline. Probe Designs Both JPL and GRC nude Faraday probes were simultaneously investigated. Design details of each probe are discussed below.
American Institute of Aeronautics and Astronautics
4
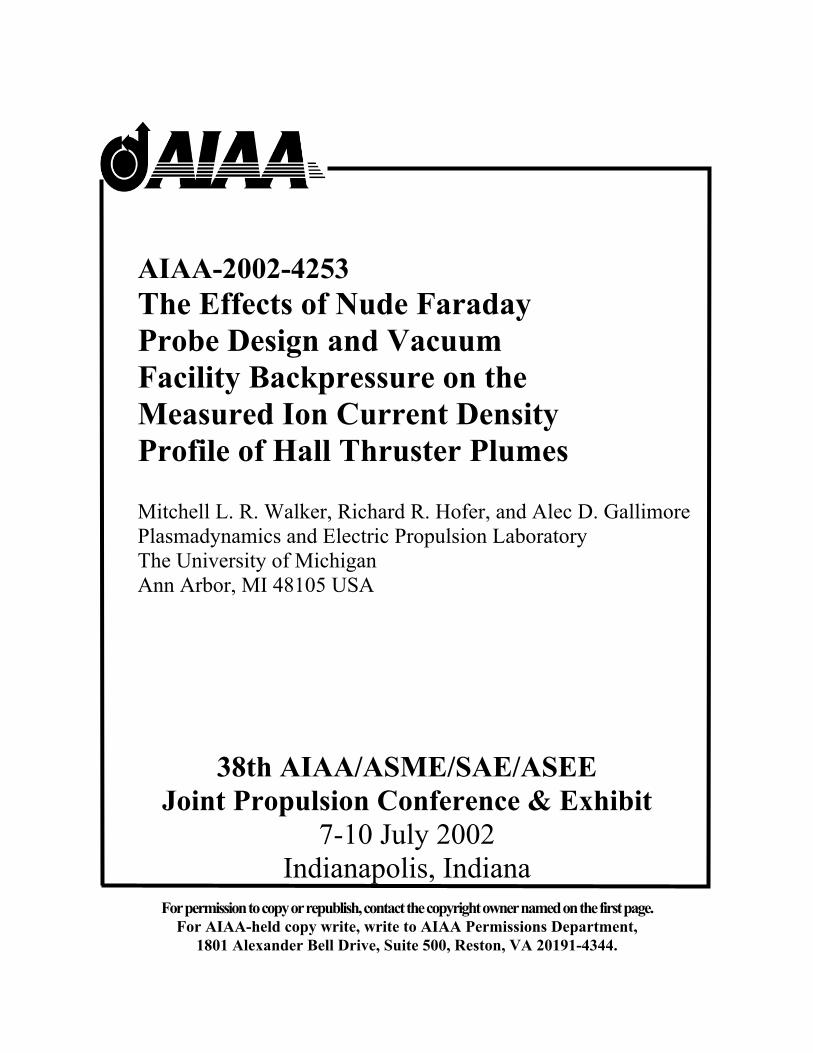
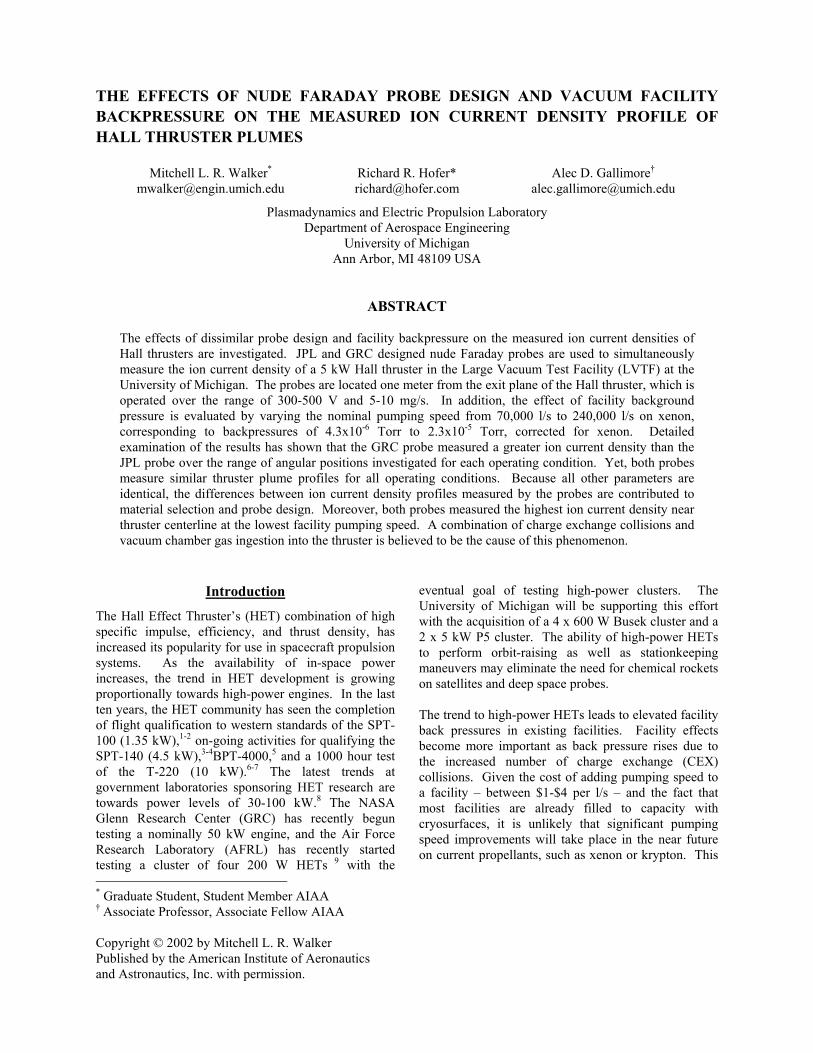
Figure 2 shows a schematic of the JPL probe and the photograph in Figure 3 shows the collector and guard ring. Table 2 summarizes the relevant dimensions. The JPL probe consists of a 2.31 cm (0.91 in) diameter collection electrode enclosed within a guard ring. The collection electrode is aluminum, spray-coated with tungsten to minimize secondary electron emission. Both the collector and guard ring are designed to be biased to the same negative potential below facility ground. Biasing the guard ring and collector to the same potential is intended to minimize edge effects around the collector by creating a flat, uniform sheath over the collection area.
Guard Ring Ceramic Insulator
Collector
Figure 2 – Schematic of the JPL nude Faraday probe. The collector is isolated from the guard ring with ceramic standoffs.
Figure 3 – Photograph of the JPL nude Faraday probe. Table 2 – Dimensions of the nude JPL nude Faraday probe.
Dimension Part Name
[cm (in.)] JPL Collector Outer Diameter 2.31 (0.910) Gap Thickness 0.23 (0.09) JPL Guard Ring Outer Diameter 2.540 (1.000) Thickness 0.074 (0.029)
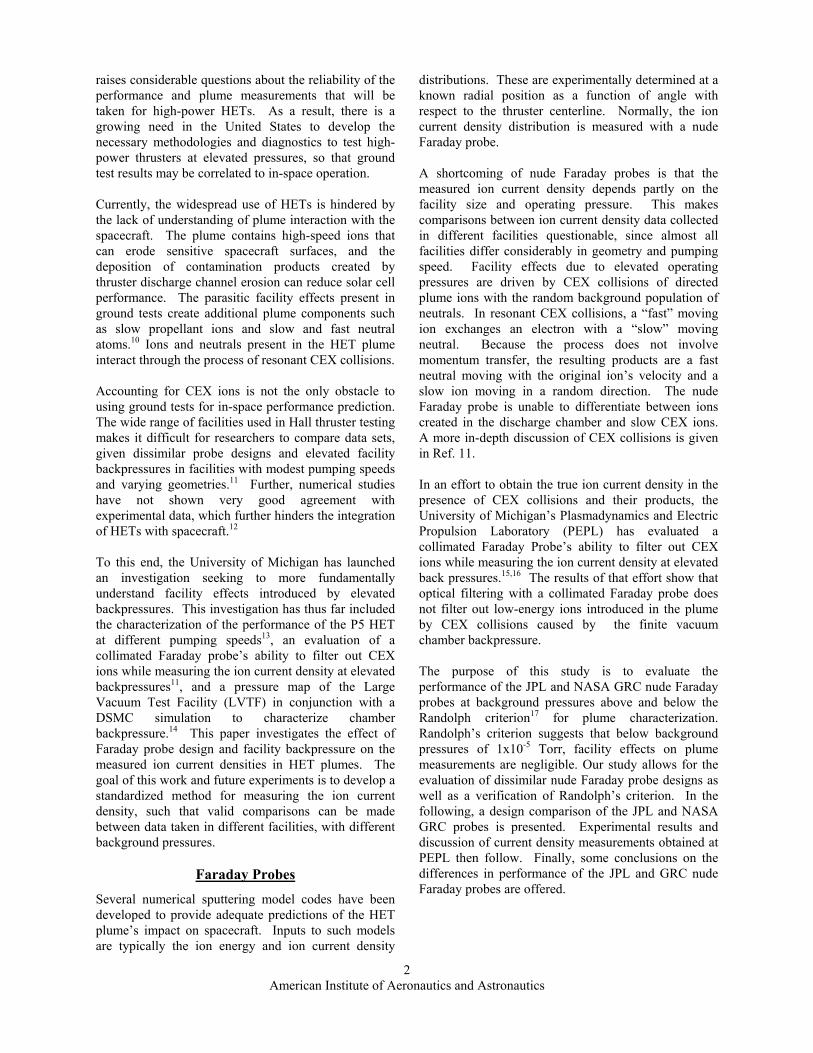
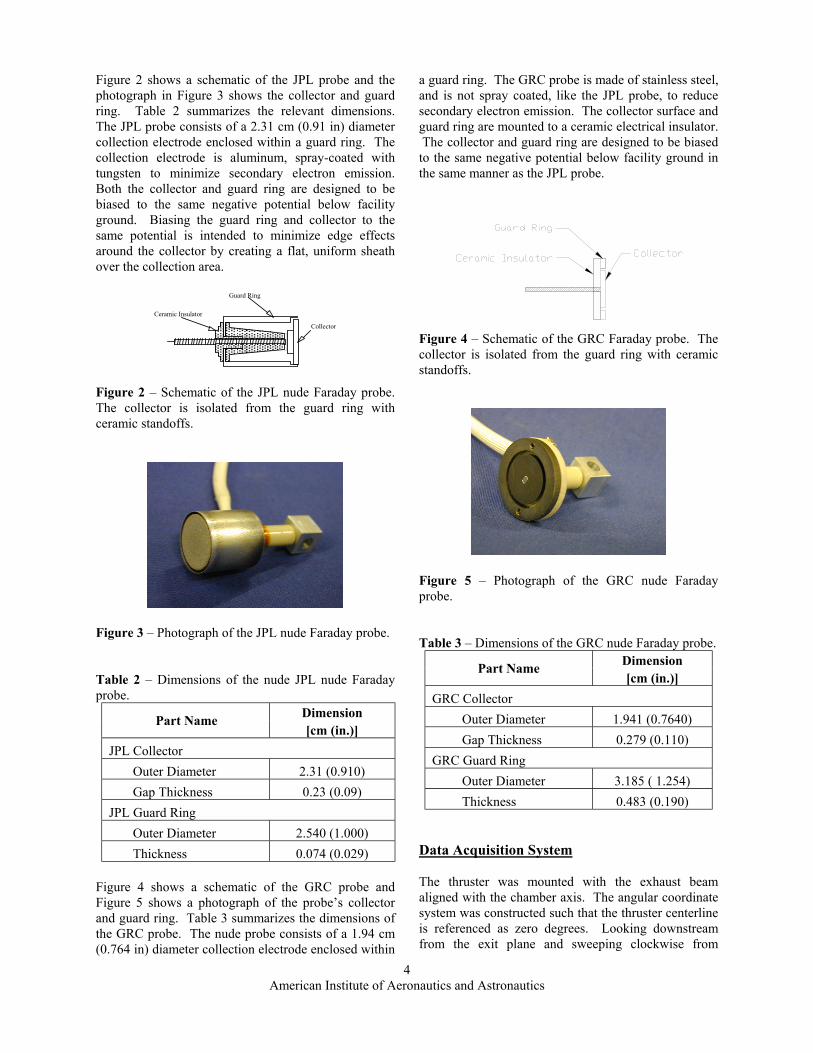
Figure 4 shows a schematic of the GRC probe and Figure 5 shows a photograph of the probe’s collector and guard ring. Table 3 summarizes the dimensions of the GRC probe. The nude probe consists of a 1.94 cm (0.764 in) diameter collection electrode enclosed within
a guard ring. The GRC probe is made of stainless steel, and is not spray coated, like the JPL probe, to reduce secondary electron emission. The collector surface and guard ring are mounted to a ceramic electrical insulator. The collector and guard ring are designed to be biased to the same negative potential below facility ground in the same manner as the JPL probe.
Figure 4 – Schematic of the GRC Faraday probe. The collector is isolated from the guard ring with ceramic standoffs.
Figure 5 – Photograph of the GRC nude Faraday probe. Table 3 – Dimensions of the GRC nude Faraday probe.
Dimension Part Name
[cm (in.)] GRC Collector Outer Diameter 1.941 (0.7640) Gap Thickness 0.279 (0.110) GRC Guard Ring Outer Diameter 3.185 ( 1.254) Thickness 0.483 (0.190)
Data Acquisition System The thruster was mounted with the exhaust beam aligned with the chamber axis. The angular coordinate system was constructed such that the thruster centerline is referenced as zero degrees. Looking downstream from the exit plane and sweeping clockwise from

American Institute of Aeronautics and Astronautics
5
centerline, angles become increasingly positive. The probes were positioned 19.50 ± 0.25º apart on an overhead, rotating arm that is attached to a Parker Daedal 20600RT rotary table, driven by an Empire Magnetics VSU23 stepper motor. As reported by the manufacturer, the table has an accuracy of 12 arc-sec. Both the table and motor were specifically prepped for vacuum service by the manufacturers. A National Instruments NuDrive 4SX-411 powers the stepper motor, and control of the table is provided by a National Instruments PCI-7344 stepper controller through a LabView 6 interface. The probes were aligned to the center of the 173M exit plane and placed 100.9 ± 0.1 cm downstream of the thruster. This allowed the probes to be swept +/-100º from the thruster centerline through the plume. Probe data were acquired using a 22-bit Agilent Data Logger head unit (HP34970A) with a 20-channel multiplexer (HP34901A) through the same LabView interface used to control the rotary table. The Data Logger was used to measure the voltage drop across two 99.6 Ω current shunts (see Figure 6). Measurements from both probes were taken in 1º increments. The ion current density is then computed by dividing by the known probe area and the shunt resistance. A scan of the thruster plume from -100 to 100 degrees took approximately 6 minutes.
Figure 6 – Electrical schematic of the JPL and NASA GRC nude Faraday probes.
Experimental Results
Prior use of nude probes at PEPL has indicated that a bias voltage of –20 V below ground is sufficient for the collector to enter ion saturation without substantial sheath growth. Since the GRC probe was a new diagnostic at PEPL, a study of the effects of the bias
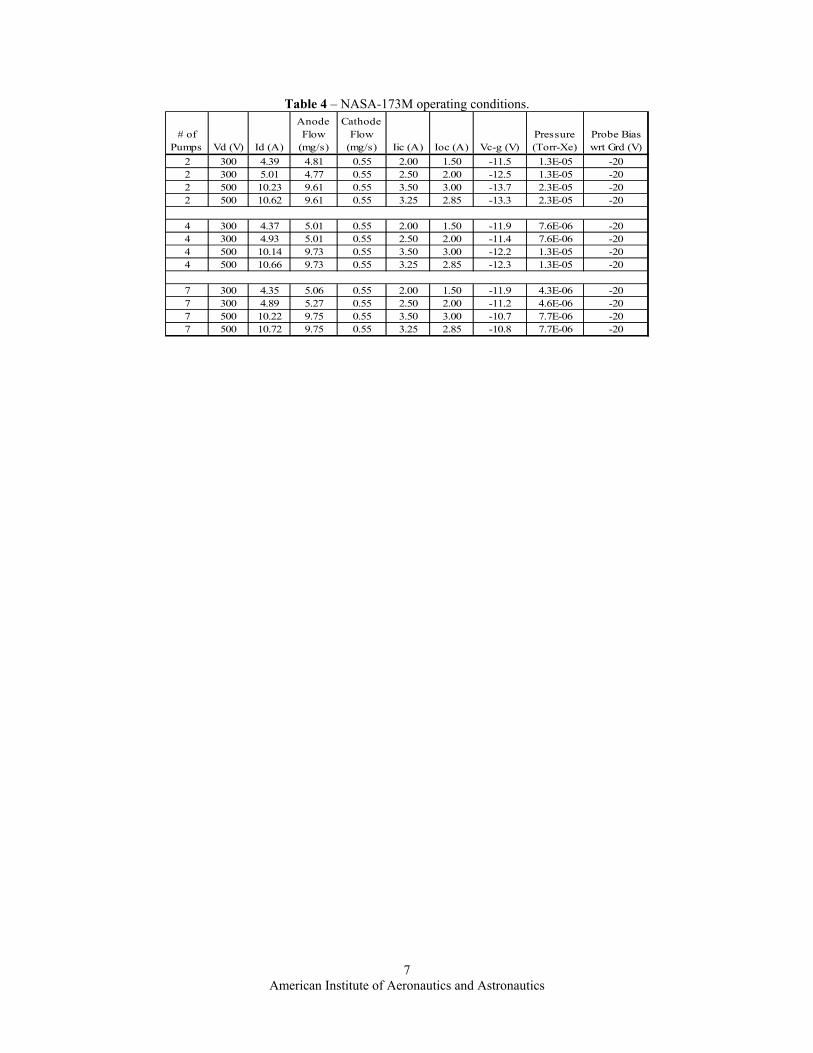
potential on the collected current was conducted. This study had been previously performed on the JPL probe16, but was performed here at the same angles as the GRC probe to validate the experimental setup. The probes were each placed at 0º, 45º, and 90º, to compare probe operation. The study was conducted with 4 cyropumps operating (140,000 l/s). Figure 7 presents the results, which varied the bias potential up to 50 V below ground. For each position, measurements were made with the guard ring biased to the same potential as the collector. As expected, a bias potential of 20 V below ground ensures both probes reach ion saturation. The curves in Figure 7 slowly increase at potentials below 20 V below ground, signaling sheath growth after ion saturation. The plasma electron number density decreases as the angle from thruster centerline increases. As result, the sheath of each probe must increase to adequately shield the probe potential, as the probe moves farther from centerline.21 Figure 7 shows the increased rate of sheath growth as a function of angle from centerline Several variations to the data acquisition system and positioning system were investigated to insure they were operating properly. For the data acquisition system, the Data Logger calibration was checked by measuring the shunt potentials using Fluke multimeters. Also, isolation of the probes was verified by measuring the impedance to ground after applying a 500 V potential (no plasma). In addition, the motion parameters of the positioning system were varied. The effect of wait time, or the time the probe spends at each position before the Data Logger records data, was studied. The rotary table is motionless while the Data Logger acquires data. It was found that vibrations were negligible for a zero second wait time. Data taken with the probes rotating in the counterclockwise and clockwise direction were essentially identical. The repeatability of the positioning system, regardless of direction, showed that negligible hysterisis existed in the angular positioning table. The above measures insured that the data taken were independent of the data acquisition and positioning system. Table 4 presents the thruster operating conditions that were investigated. The thruster was operated at 300 and 500 V at approximately 4.4 and 10 A, at nominal pumping speeds of 70,000, 140,000, and 240,000 l/s. In the following discussion, all data reported are with the collector and guard ring of both the JPL and GRC probe biased to 20 V below ground. Data from the JPL and GRC probes were actually collected at several intermediate conditions, but not all of the results are presented. The excluded data showed results consistent with the observations in Figures 8-13 at all thruster operating conditions.

American Institute of Aeronautics and Astronautics
6
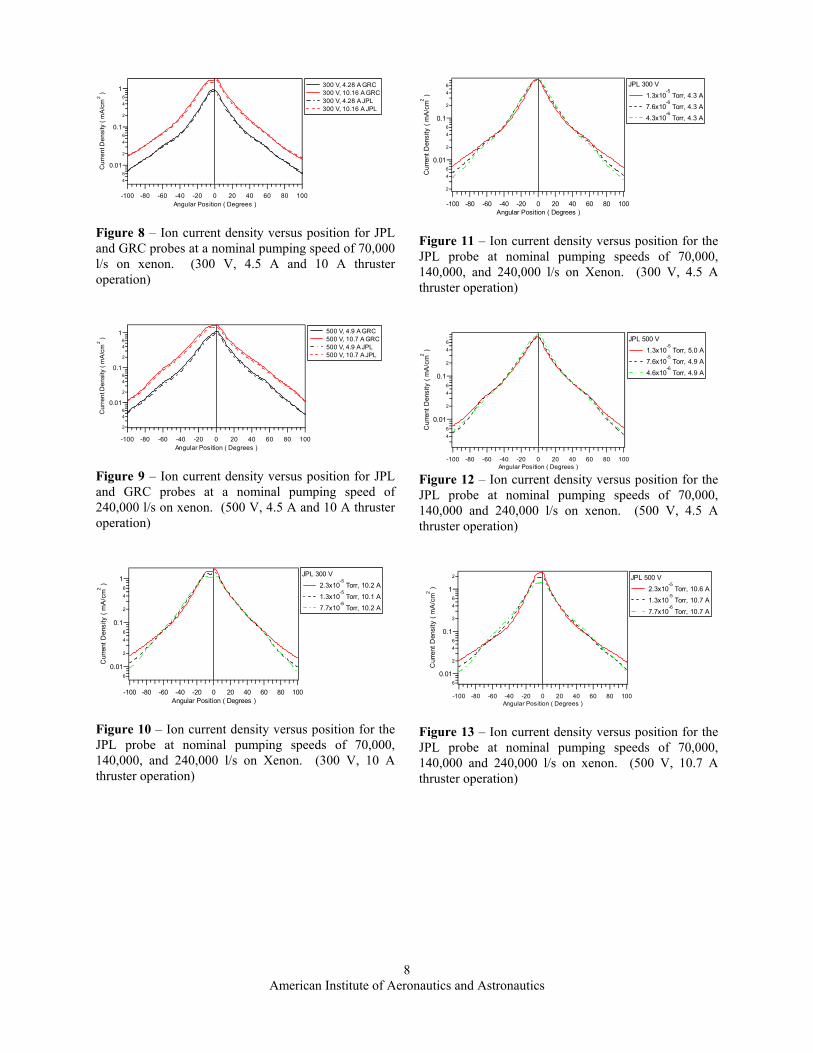
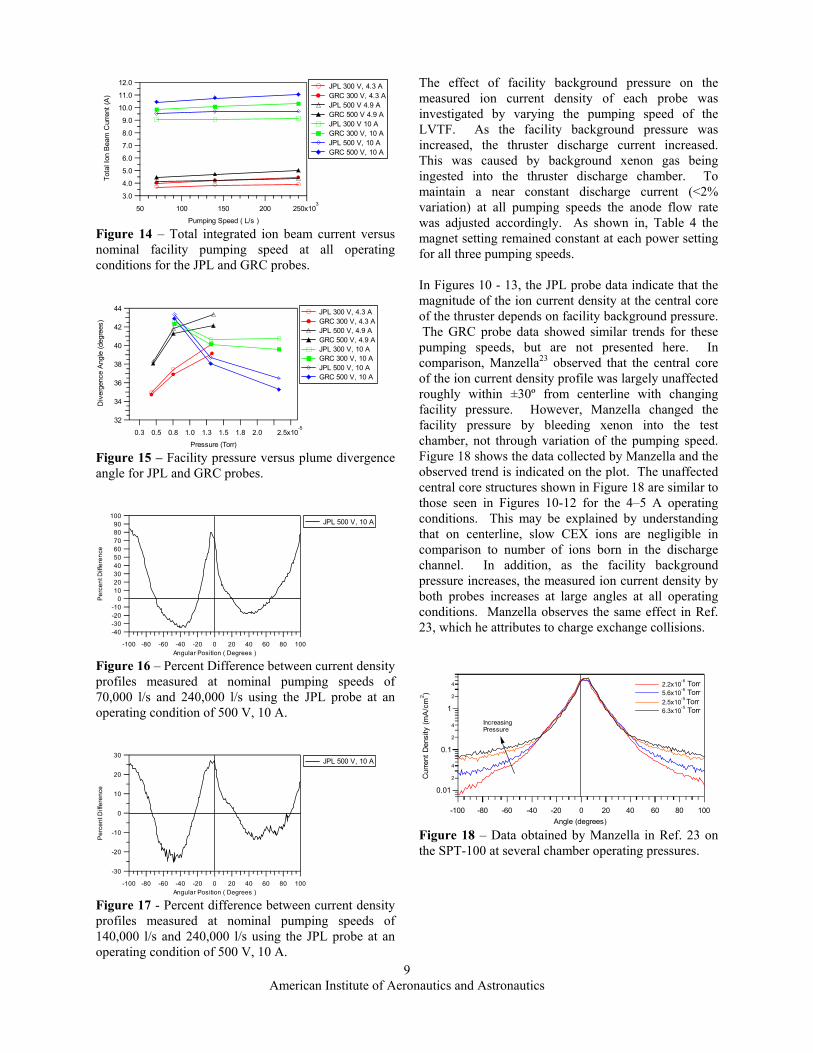
Figures 8 and 9 compare operation of the JPL nude Faraday probe to the GRC nude Faraday probe for several operating conditions. These figures show data taken at the minimum and maximum facility pumping speeds. As shown, the GRC probe consistently measured a higher current density over the investigated angles. The agreement between the probes was best along the wings and worst on centerline. At 300 V, the GRC probe measured centerline current densities 12.3% and 8.7% higher than the corresponding values from the JPL probe at 4.3 and 10.2 A, respectively. The corresponding centerline offset between the probe data at 500 V was 13.4% and 15.9% at 4.9 and 10.7 A, respectively. Figures 10 - 13 compare current density distributions measured by the GRC probe from 300 V to 500 V at 5 to 10 mg/s, for nominal facility pumping speeds of 70,000, 140,000, and 240,000 l/s on xenon. Facility background pressure influenced the measured current density both on centerline and in the perimeter. Figure 14 shows that decreasing facility backpressure increases the total integrated ion beam current, due to the collection of a greater number of slow ions born from CEX collisions. Figure 15 shows how plume divergence angle changes with pressure at all of the operating conditions investigated. In addition, Figures 16 and 17 show the percent difference in current density between the pumping speeds of 70,000 and 240,000 l/s, and 140,000 and 240,000 l/s, respectively. The points of interest in each of these figures will be discussed in subsequent sections of this paper.
Discussion
Figures 8 and 9 show the performance of the JPL and GRC probes at vacuum chamber background pressures of 4.4x10⁻⁶ and 2.3x10⁻⁵ Torr, the minimum and maximum operation pressures for this experiment. In addition, Figures 8 and 9 show that the GRC probe measures a greater ion current density than the JPL probe over the range of angular positions investigated. This trend appears in the ion current density data for all thruster operating conditions in this experiment. However, both probes measure similar thruster plume profiles for all operating conditions. Because all other parameters are identical, the difference between the measured ion current density profiles must be a result of probe design. The main two design differences are collector material and guard ring spacing. As mentioned above, the JPL probe collector is spray-coated with tungsten to reduce the secondary electron emission coefficient, whereas the GRC probe collector is made of stainless steel and with no spray-coating. The maximum secondary electron emission yield of iron is 1.3 at an electron energy of 350 V.22 In
comparison, the maximum secondary electron yield of tungsten is 1.4, but this value corresponds to an electron energy of 600 V.22 The shape of a typical yield curve suggests that the secondary electron yield for iron may be higher than tungsten over the range of electron energies in this study. Thus, a greater secondary electron emission coefficient of the GRC probe may account for some of the perceived difference between the GRC and JPL ion current density profiles. The probe guard ring spacing will be discussed later in this section.
1.00x10
-3
0.95
0.90
0.85
0.80
0.75
0.70
0.65
0.60 Io
n C
urre
nt D
ensi
ty (m
A/c
m2 )
-35 -30 -25 -20 -15 -10 -5 0Vbias (Volts)
JPL, Biased, 0 Deg GRC, Biased, 0 Deg
60x10-3
55
50
45
40
35
30
25
20
Ion
Cur
rent
Den
sity
(mA
/cm
2 )
-55 -50 -45 -40 -35 -30 -25 -20 -15 -10 -5 0Vbias (Volts)
JPL, Biased, 45 Deg GRC, Biased, 45 Deg
8x10⁻³
7
6
5
4
3
2
1
0
Ion
Cur
rent
Den
sity
(mA
/cm
2 )
-55 -50 -45 -40 -35 -30 -25 -20 -15 -10 -5 0Vbias (Volts)
JPL, Biased, 90 Deg GRC, Biased, 90 Deg
Figure 7 – Effect of varying the probe bias at several angular positions. (300 V, 4.41 A thruster operation, 140,000 l/s pumping speed)
American Institute of Aeronautics and Astronautics
7
Table 4 – NASA-173M operating conditions.
# of Pumps Vd (V) Id (A)
Anode Flow
(mg/s)
Cathode Flow
(mg/s) Iic (A) Ioc (A) Vc-g (V)Pressure (Torr-Xe)
Probe Bias wrt Grd (V)
2 300 4.39 4.81 0.55 2.00 1.50 -11.5 1.3E-05 -202 300 5.01 4.77 0.55 2.50 2.00 -12.5 1.3E-05 -202 500 10.23 9.61 0.55 3.50 3.00 -13.7 2.3E-05 -202 500 10.62 9.61 0.55 3.25 2.85 -13.3 2.3E-05 -20
4 300 4.37 5.01 0.55 2.00 1.50 -11.9 7.6E-06 -204 300 4.93 5.01 0.55 2.50 2.00 -11.4 7.6E-06 -204 500 10.14 9.73 0.55 3.50 3.00 -12.2 1.3E-05 -204 500 10.66 9.73 0.55 3.25 2.85 -12.3 1.3E-05 -20
7 300 4.35 5.06 0.55 2.00 1.50 -11.9 4.3E-06 -207 300 4.89 5.27 0.55 2.50 2.00 -11.2 4.6E-06 -207 500 10.22 9.75 0.55 3.50 3.00 -10.7 7.7E-06 -207 500 10.72 9.75 0.55 3.25 2.85 -10.8 7.7E-06 -20
American Institute of Aeronautics and Astronautics
8
46
0.01
2
46
0.1
2
46
1
Cur
rent
Den
sity
( m
A/cm
2 )
-100 -80 -60 -40 -20 0 20 40 60 80 100Angular Position ( Degrees )
300 V, 4.28 A GRC 300 V, 10.16 A GRC 300 V, 4.28 A JPL 300 V, 10.16 A JPL
Figure 8 – Ion current density versus position for JPL and GRC probes at a nominal pumping speed of 70,000 l/s on xenon. (300 V, 4.5 A and 10 A thruster operation)
2
46
0.01
2
46
0.1
2
46
1
Cur
rent
Den
sity
( m
A/cm
2 )
-100 -80 -60 -40 -20 0 20 40 60 80 100Angular Position ( Degrees )
500 V, 4.9 A GRC 500 V, 10.7 A GRC 500 V, 4.9 A JPL 500 V, 10.7 A JPL
Figure 9 – Ion current density versus position for JPL and GRC probes at a nominal pumping speed of 240,000 l/s on xenon. (500 V, 4.5 A and 10 A thruster operation)
6
0.01
2
46
0.1
2
46
1
Cur
rent
Den
sity
( m
A/c
m2 )
-100 -80 -60 -40 -20 0 20 40 60 80 100Angular Position ( Degrees )
JPL 300 V 2.3x10
-5 Torr, 10.2 A
1.3x10⁻⁵
Torr, 10.1 A 7.7x10
-6 Torr, 10.2 A
Figure 10 – Ion current density versus position for the JPL probe at nominal pumping speeds of 70,000, 140,000, and 240,000 l/s on Xenon. (300 V, 10 A thruster operation)
2
46
0.01
2
46
0.1
2
46
Cur
rent
Den
sity
( m
A/cm
2 )
-100 -80 -60 -40 -20 0 20 40 60 80 100Angular Position ( Degrees )
JPL 300 V 1.3x10
-5 Torr, 4.3 A
7.6x10⁻⁶
Torr, 4.3 A 4.3x10
-6 Torr, 4.3 A
Figure 11 – Ion current density versus position for the JPL probe at nominal pumping speeds of 70,000, 140,000, and 240,000 l/s on Xenon. (300 V, 4.5 A thruster operation)
46
0.01
2
46
0.1
2
46
Cur
rent
Den
sity
( m
A/c
m2 )
-100 -80 -60 -40 -20 0 20 40 60 80 100Angular Position ( Degrees )
JPL 500 V 1.3x10
-5 Torr, 5.0 A
7.6x10⁻⁵
Torr, 4.9 A 4.6x10
-6 Torr, 4.9 A
Figure 12 – Ion current density versus position for the JPL probe at nominal pumping speeds of 70,000, 140,000 and 240,000 l/s on xenon. (500 V, 4.5 A thruster operation)
6
0.01
2
46
0.1
2
46
1
2
Cur
rent
Den
sity
( m
A/c
m2 )
-100 -80 -60 -40 -20 0 20 40 60 80 100Angular Position ( Degrees )
JPL 500 V 2.3x10
-5 Torr, 10.6 A
1.3x10⁻⁵
Torr, 10.7 A 7.7x10
-6 Torr, 10.7 A
Figure 13 – Ion current density versus position for the JPL probe at nominal pumping speeds of 70,000, 140,000 and 240,000 l/s on xenon. (500 V, 10.7 A thruster operation)
American Institute of Aeronautics and Astronautics
9
12.0
11.0
10.0
9.0
8.0
7.0
6.0
5.0
4.0
3.0
Tota
l Ion
Bea
m C
urre
nt (A
)
250x103 20015010050
Pumping Speed ( L/s )
JPL 300 V, 4.3 A GRC 300 V, 4.3 A JPL 500 V 4.9 A GRC 500 V 4.9 A JPL 300 V 10 A GRC 300 V, 10 A JPL 500 V, 10 A GRC 500 V, 10 A
Figure 14 – Total integrated ion beam current versus nominal facility pumping speed at all operating conditions for the JPL and GRC probes.
44
42
40
38
36
34
32
Div
erge
nce
Angl
e (d
egre
es)
2.5x10⁻⁵
2.01.81.51.31.00.80.50.3Pressure (Torr)
JPL 300 V, 4.3 A GRC 300 V, 4.3 A JPL 500 V, 4.9 A GRC 500 V, 4.9 A JPL 300 V, 10 A GRC 300 V, 10 A JPL 500 V, 10 A GRC 500 V, 10 A
Figure 15 – Facility pressure versus plume divergence angle for JPL and GRC probes.
100908070605040302010
0-10-20-30-40
Perc
ent D
iffer
ence
-100 -80 -60 -40 -20 0 20 40 60 80 100Angular Position ( Degrees )
JPL 500 V, 10 A
Figure 16 – Percent Difference between current density profiles measured at nominal pumping speeds of 70,000 l/s and 240,000 l/s using the JPL probe at an operating condition of 500 V, 10 A.
-30
-20
-10
0
10
20
30
Perc
ent D
iffer
ence
-100 -80 -60 -40 -20 0 20 40 60 80 100Angular Position ( Degrees )
JPL 500 V, 10 A
Figure 17 - Percent difference between current density profiles measured at nominal pumping speeds of 140,000 l/s and 240,000 l/s using the JPL probe at an operating condition of 500 V, 10 A.
The effect of facility background pressure on the measured ion current density of each probe was investigated by varying the pumping speed of the LVTF. As the facility background pressure was increased, the thruster discharge current increased. This was caused by background xenon gas being ingested into the thruster discharge chamber. To maintain a near constant discharge current (<2% variation) at all pumping speeds the anode flow rate was adjusted accordingly. As shown in, Table 4 the magnet setting remained constant at each power setting for all three pumping speeds. In Figures 10 - 13, the JPL probe data indicate that the magnitude of the ion current density at the central core of the thruster depends on facility background pressure. The GRC probe data showed similar trends for these pumping speeds, but are not presented here. In comparison, Manzella23 observed that the central core of the ion current density profile was largely unaffected roughly within ±30º from centerline with changing facility pressure. However, Manzella changed the facility pressure by bleeding xenon into the test chamber, not through variation of the pumping speed. Figure 18 shows the data collected by Manzella and the observed trend is indicated on the plot. The unaffected central core structures shown in Figure 18 are similar to those seen in Figures 10-12 for the 4–5 A operating conditions. This may be explained by understanding that on centerline, slow CEX ions are negligible in comparison to number of ions born in the discharge channel. In addition, as the facility background pressure increases, the measured ion current density by both probes increases at large angles at all operating conditions. Manzella observes the same effect in Ref. 23, which he attributes to charge exchange collisions.
0.01
2
4
0.1
2
4
1
2
4
Cur
rent
Den
sity
(mA
/cm
2 )
-100 -80 -60 -40 -20 0 20 40 60 80 100Angle (degrees)
2.2x10⁻⁶ Torr 5.6x10⁻⁶ Torr 2.5x10⁻⁵ Torr 6.3x10⁻⁵ Torr
Increasing Pressure
Figure 18 – Data obtained by Manzella in Ref. 23 on the SPT-100 at several chamber operating pressures.
American Institute of Aeronautics and Astronautics
10
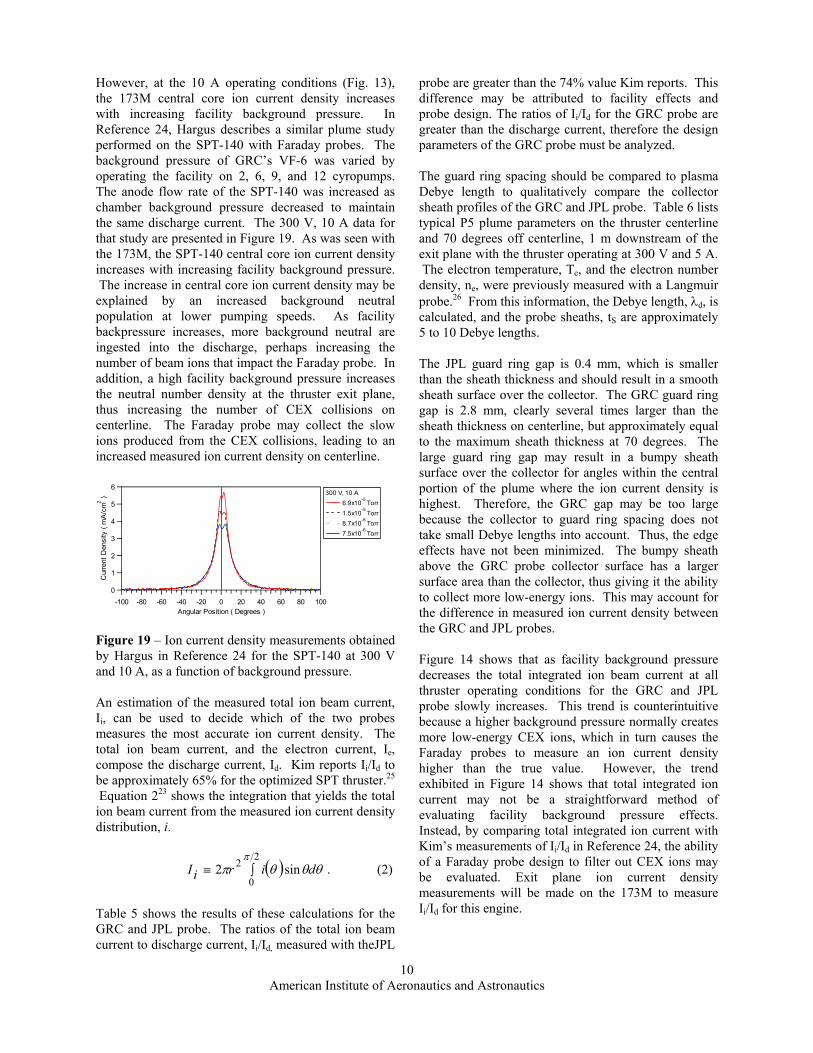
However, at the 10 A operating conditions (Fig. 13), the 173M central core ion current density increases with increasing facility background pressure. In Reference 24, Hargus describes a similar plume study performed on the SPT-140 with Faraday probes. The background pressure of GRC’s VF-6 was varied by operating the facility on 2, 6, 9, and 12 cyropumps. The anode flow rate of the SPT-140 was increased as chamber background pressure decreased to maintain the same discharge current. The 300 V, 10 A data for that study are presented in Figure 19. As was seen with the 173M, the SPT-140 central core ion current density increases with increasing facility background pressure. The increase in central core ion current density may be explained by an increased background neutral population at lower pumping speeds. As facility backpressure increases, more background neutral are ingested into the discharge, perhaps increasing the number of beam ions that impact the Faraday probe. In addition, a high facility background pressure increases the neutral number density at the thruster exit plane, thus increasing the number of CEX collisions on centerline. The Faraday probe may collect the slow ions produced from the CEX collisions, leading to an increased measured ion current density on centerline.
6
5
4
3
2
1
0
Cur
rent
Den
sity
( m
A/cm
2 )
-100 -80 -60 -40 -20 0 20 40 60 80 100Angular Position ( Degrees )
300 V, 10 A 6.9x10⁻⁵ Torr 1.5x10⁻⁵ Torr 8.7x10⁻⁶ Torr 7.5x10⁻⁶ Torr
Figure 19 – Ion current density measurements obtained by Hargus in Reference 24 for the SPT-140 at 300 V and 10 A, as a function of background pressure. An estimation of the measured total ion beam current, Ii, can be used to decide which of the two probes measures the most accurate ion current density. The total ion beam current, and the electron current, Ie, compose the discharge current, Id. Kim reports Ii/Id to be approximately 65% for the optimized SPT thruster.25 Equation 223 shows the integration that yields the total ion beam current from the measured ion current density distribution, i.
( ) θθθππ
diriI sin22
0
2∫≡ . (2)
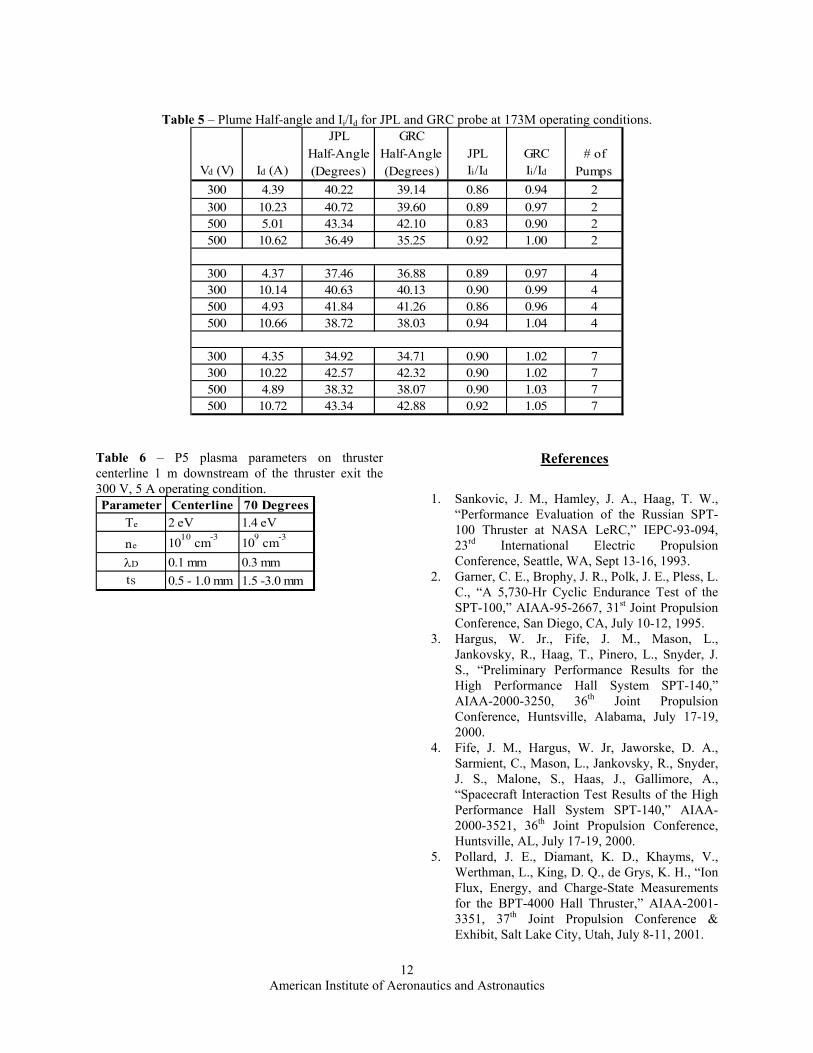
Table 5 shows the results of these calculations for the GRC and JPL probe. The ratios of the total ion beam current to discharge current, Ii/Id, measured with theJPL
probe are greater than the 74% value Kim reports. This difference may be attributed to facility effects and probe design. The ratios of Ii/Id for the GRC probe are greater than the discharge current, therefore the design parameters of the GRC probe must be analyzed. The guard ring spacing should be compared to plasma Debye length to qualitatively compare the collector sheath profiles of the GRC and JPL probe. Table 6 lists typical P5 plume parameters on the thruster centerline and 70 degrees off centerline, 1 m downstream of the exit plane with the thruster operating at 300 V and 5 A. The electron temperature, Te, and the electron number density, ne, were previously measured with a Langmuir probe.26 From this information, the Debye length, λd, is calculated, and the probe sheaths, tS are approximately 5 to 10 Debye lengths. The JPL guard ring gap is 0.4 mm, which is smaller than the sheath thickness and should result in a smooth sheath surface over the collector. The GRC guard ring gap is 2.8 mm, clearly several times larger than the sheath thickness on centerline, but approximately equal to the maximum sheath thickness at 70 degrees. The large guard ring gap may result in a bumpy sheath surface over the collector for angles within the central portion of the plume where the ion current density is highest. Therefore, the GRC gap may be too large because the collector to guard ring spacing does not take small Debye lengths into account. Thus, the edge effects have not been minimized. The bumpy sheath above the GRC probe collector surface has a larger surface area than the collector, thus giving it the ability to collect more low-energy ions. This may account for the difference in measured ion current density between the GRC and JPL probes. Figure 14 shows that as facility background pressure decreases the total integrated ion beam current at all thruster operating conditions for the GRC and JPL probe slowly increases. This trend is counterintuitive because a higher background pressure normally creates more low-energy CEX ions, which in turn causes the Faraday probes to measure an ion current density higher than the true value. However, the trend exhibited in Figure 14 shows that total integrated ion current may not be a straightforward method of evaluating facility background pressure effects. Instead, by comparing total integrated ion current with Kim’s measurements of Ii/Id in Reference 24, the ability of a Faraday probe design to filter out CEX ions may be evaluated. Exit plane ion current density measurements will be made on the 173M to measure Ii/Id for this engine.

American Institute of Aeronautics and Astronautics
11
The 90o half-angle divergence was calculated for both probes using the measured ion current density profiles. The calculated GRC 90° half-angle divergence is always smaller than that of the JPL probe. The ion current density profiles in Figures 8 and 9 show that the difference in measured current density between the GRC and JPL probe increases toward the thruster centerline. This small difference leads to a slightly more collimated current density profile and thus explains why the divergence half-angle of GRC probe is always less than that of the JPL probe. As shown in Figure 15, plume divergence angle depends on facility backpressure. For a particular thruster discharge voltage, the divergence angle has a maximum over the investigated range. From 4 A – 5 A, the measured ion current densities in the central core of the SPT-100, SPT-140, and 173M were unaffected by facility background pressure, but at large angles from centerline, the ion current density measurements decreased with decreasing backpressure. Thus, the trend shown in Figure 15 for decreasing divergence half-angle with decreasing backpressure at the 4 A – 5 A operating conditions makes sense. In addition, the measured ion current density within the central core for the 10 A operating conditions increases with increasing back pressure, which creates a more collimated plume profile. This is consistent with the calculated divergence half-angle for the 10 A operating conditions shown in Figure 15. That is, the divergence angle decreases as the facility backpressure increases. The ion current density percent difference between two pumping speeds displays the effect of facility background pressure on ion current density measurements. Figure 16 shows the percent difference in current density between the pumping speeds of 70,000 and 240,000 l/s at a thruster operating condition of 500 V at 10 A. Figure 17 shows the percent difference in measured ion current density between 140,000 and 240,000 l/s at a thruster operating condition of 500 V at 10 A. As seen in Figure 16, the difference between measurements taken at 70,000 and 240,000 l/s is nearly 80% on centerline. By doubling the pumping speed to 140,000 l/s, the centerline difference from the 240,000 l/s is reduced to approximately 25%. The same trends appear for the GRC probe, but were not included in the figures for clarity. The large percent difference in ion current density within the 40O half-angle of the plume for the 10 A operating conditions is consistent with the increase in measured ion current density in the central core of the plume discussed earlier. In addition, the increasing percent difference at large angles from centerline corresponds to the presence of CEX ions in the plume perimeter.
Conclusions and Future Work The ion current density distribution of the 173M Hall thruster at typical operating conditions was measured with the JPL and NASA GRC nude Faraday probes. For both probes, the magnitude of the ion current density at the central core of the plume increases with increasing facility background pressure. A similar trend in ion current density measurements was seen at large angles from the thruster centerline. The GRC probe measured a greater ion current density than the JPL nude Faraday over the range of angular positions investigated for each operating condition. Yet, both probes measure similar thruster plume profiles for all operating conditions. Because all other parameters are identical, the differences between ion current density profiles measured by the probes are attributed to material selection and probe design. Analysis of Ii/ID and local plasma parameters shows that Debye length must be considered when calculating guard ring spacing. Total integrated ion beam current was found to be greater than values reported in previous studies with SPTs. The calculated GRC 90° half-angle divergence was always smaller than that of the JPL probe due to a difference in probe performance within the central core of the plume. The plume divergence angle depends on facility backpressure and anode flow rate. We are currently preparing an experiment that will interrogate the fields surrounding the Faraday probe collectors and guard rings with a Langmuir probe. Our goal is to measure the electron number density, electron temperature, and plasma potential in the immediate vicinity of the probe to study probe collection phenomena. We are also undertaking a numerical modeling effort of the probe, as well as studying various probe designs (e.g., those used in the material processing industry) and material choices.
Acknowledgements We would like to thank: Dr. Colleen Marrese at JPL for loaning PEPL the nude Faraday probes, Robert Jankvosky at NASA Glenn Research Center for loaning PEPL the NASA GRC probes, Mr. Terry Larrow for fabricating the hardware used in this study, and the departmental technical staff and other graduate students at PEPL for help in maintaining the facilities. This research was supported by the Air Force Office of Scientific Research grant F49620-02-1-0051 (Dr. Mitat Birkan is the contract monitor). In addition, Mr. Walker is supported by the Michigan Space Grant Consortium and the National Science Foundation. The authors are greatly appreciative of this support.
American Institute of Aeronautics and Astronautics
12
Table 5 – Plume Half-angle and Ii/Id for JPL and GRC probe at 173M operating conditions.
JPL GRCHalf-Angle Half-Angle JPL GRC # of
Vd (V) Id (A) (Degrees) (Degrees) Ii/Id Ii/Id Pumps300 4.39 40.22 39.14 0.86 0.94 2300 10.23 40.72 39.60 0.89 0.97 2500 5.01 43.34 42.10 0.83 0.90 2500 10.62 36.49 35.25 0.92 1.00 2
300 4.37 37.46 36.88 0.89 0.97 4300 10.14 40.63 40.13 0.90 0.99 4500 4.93 41.84 41.26 0.86 0.96 4500 10.66 38.72 38.03 0.94 1.04 4
300 4.35 34.92 34.71 0.90 1.02 7300 10.22 42.57 42.32 0.90 1.02 7500 4.89 38.32 38.07 0.90 1.03 7500 10.72 43.34 42.88 0.92 1.05 7
Table 6 – P5 plasma parameters on thruster centerline 1 m downstream of the thruster exit the 300 V, 5 A operating condition. Parameter Centerline 70 Degrees
Te 2 eV 1.4 eV
ne 1010 cm-3 109 cm-3
λD 0.1 mm 0.3 mmtS 0.5 - 1.0 mm 1.5 -3.0 mm
References
1. Sankovic, J. M., Hamley, J. A., Haag, T. W.,
“Performance Evaluation of the Russian SPT-100 Thruster at NASA LeRC,” IEPC-93-094, 23rd International Electric Propulsion Conference, Seattle, WA, Sept 13-16, 1993.
2. Garner, C. E., Brophy, J. R., Polk, J. E., Pless, L. C., “A 5,730-Hr Cyclic Endurance Test of the SPT-100,” AIAA-95-2667, 31st Joint Propulsion Conference, San Diego, CA, July 10-12, 1995.
3. Hargus, W. Jr., Fife, J. M., Mason, L., Jankovsky, R., Haag, T., Pinero, L., Snyder, J. S., “Preliminary Performance Results for the High Performance Hall System SPT-140,” AIAA-2000-3250, 36th Joint Propulsion Conference, Huntsville, Alabama, July 17-19, 2000.
4. Fife, J. M., Hargus, W. Jr, Jaworske, D. A., Sarmient, C., Mason, L., Jankovsky, R., Snyder, J. S., Malone, S., Haas, J., Gallimore, A., “Spacecraft Interaction Test Results of the High Performance Hall System SPT-140,” AIAA-2000-3521, 36th Joint Propulsion Conference, Huntsville, AL, July 17-19, 2000.
5. Pollard, J. E., Diamant, K. D., Khayms, V., Werthman, L., King, D. Q., de Grys, K. H., “Ion Flux, Energy, and Charge-State Measurements for the BPT-4000 Hall Thruster,” AIAA-2001-3351, 37th Joint Propulsion Conference & Exhibit, Salt Lake City, Utah, July 8-11, 2001.
American Institute of Aeronautics and Astronautics
13
6. Mason, L. S., Jankovsky, R. S., Manzella, D.H., “1000 Hours of Testing on a 10 Kilowatt Hall Effect Thruster,” AIAA-2001-3773, 37th Joint Propulsion Conference, Salt Lake City, UT, July 8-11, 2001.
7. Britt, N., “Overview of EP in U.S. Industry,” AIAA-2002-3559, 38th Joint Propulsion conference & Exhibit, Indianapolis, IN, July 7-10, 2002.
8. Jankovsky, R. S., Jacobson, D. T., Mason, L. S., Rawlin, V. K., Mantenieks, M. A., Manzella, D. H., Hofer, R. R., Peterson, P. Y., “NASA’s Hall Thruster Program,” AIAA-2001-3888, 37th Joint Propulsion Conference, Salt Lake City, UT, July 8-11, 2001.
9. Beal, B. E., Gallimore, A. D., Hargus, W. Jr, “Preliminary Plume Characterization of a Low-Power Hall Thruster Cluster,” AIAA-2002-4251, 38th Joint Propulsion Conference, Indianapolis, IN, July 7-10, 2002.
10. King, L. B, Gallimore, A. D., Marrese, C. M., “Transport-Property Measurements in the Plume of an SPT-100 Hall Thruster,” Journal of Propulsion and Power, Vol. 14, No. 3, May-June 1998, pp. 327-335
11. Semenkin, A., Kim, V., Gorshkov, O., Jankovsky, R., “Development of Electric Propulsion Standards – Current Status and Further Activity,” IEPC-01-070, 27th International Electric Propulsion Conference Pasadena, CA October 15-19, 2001.
12. Pullins, S., Dressler, R. A., Chiu, Y. –H., Levandier, D. J., “Ion Dynamics in Hall Effect and Ion Thrusters: Xe+ + Xe Symmetric Charge Transfer,” AIAA-2000-0603, 38th Aerospace Sciences Meeting & Exhibit, Reno, NV, Jan 10-13, 2000.
13. Hofer, R. R., Peterson, P. Y., Gallimore, A. D., “Characterizing Vacuum Facility Backpressure Effects on the Performance of a Hall Thruster,” IEPC-01-045, 27th International Electric Propulsion Conference, Pasadena, CA, Oct 14-19, 2001.
14. Walker, M. L. R., Gallimore, A. D., Cai, C., Boyd, I. D., “Pressure map of a Facility as a Function of Flow Rates to Study Facility Effects,” AIAA-2002-3815, 38th Joint Propulsion conference & Exhibit, Indianapolis, IN, July 7-10, 2002.
15. Hofer, R. R., Walker, M. L. R., Gallimore, A. D., “A Comparison of nude and collimated Faraday Probes for Use with Hall Thrusters,” IEPC-01-20, 27th International Electric Propulsion Conference, Pasadena, CA, Oct 14-19, 2001
16. de Grys, K. H., Tilley, D. L., Aadland, R. S., “BPT Hall Thruster Plume Characteristics,” AIAA-99-2283, 35th Joint Propulsion Conference, Los Angeles, CA, June 20-24, 1999.
17. Randolph, T. Kim, V., Kaufman, H., Kozubsky, K., Zhurin, V., Day, M. “Facility Effects on Stationary Plasma Thruster Testing,” IEPC-93-93, 23rd International Electric Propulsion Conference, Seattle, WA, Sept 13-16, 1993.
18. Dushman, S., Scientific Foundations of Vacuum Technique, Vol. 4, Wiley, New York, 1958.
19. Hofer, R. R., Peterson, P. Y., Gallimore, A. D., “A High Specific Impulse Two-Stage Hall Thruster with Plasma Lens Focusing,” IEPC-01-036, 27th International Electric Propulsion Conference, Pasadena, CA, Oct 14-19, 2001.
20. Hofer, R. R., Gallimore, A. D., “The Role of Magnetic Field Topography inn Improving the Performance of a High Voltage Hall Thruster,” AIAA-2002-4111, 38th Joint Propulsion Conference, Indianapolis, IN, July 7-10, 2002.
21. Haas, J. M., “Low-Perturbation Interrogation of the Internal and Near-field Plasma Structure of a Hall Thruster using a High-Speed Probe Positioning System,” Ph.D. thesis, Dept. of Aerospace Engineering, University of Michigan, pp. 176-186, Feb., 2001.
22. Brown, A., Basic Data of Plasma Physics, McGraw-Hill Book Company, New York, 1959.
23. Manzella, D. H., Sankovic, J. M., “Hall Thruster Ion Beam Characterization,” AIAA-95-2927, 31st Joint Propulsion Conference, San Diego, CA, July 10-12, 1995.
24. Hargus, W. Jr., Fife, J. M., Mason, L., Jankovsky, R., Haag, T., Pinero, L., Snyder, J. S., “Preliminary Performance Results for the High Performance Hall System SPT-140,” AIAA-2000-3250, 36th Joint Propulsion conference, Huntsville, Alabama, July 17-19, 2000.
25. Kim, V., “Main Physical Features and Processes Determining the Performance of Stationary Plasma Thrusters,” Journal of Propulsion and Power, Vol.14, No. 5, Sept.-Oct. 1998, pp 736-743
26. Haas, J. M., Gulczinksi, F. S., Gallimore, A. D., “Performance Characteristics of a 5 kW Laboratory Hall Thruster,” AIAA-98-3503, 34th Joint Propulsion Conference, Cleveland, OH, July 12-15, 1998.