AIA Group Limited 友邦保險控股有限公司 - aia.com€¦ · ii About AIA AIA Group Limited...
195
This announcement is for information purposes only and does not constitute an invitation or offer by any person to acquire, purchase or subscribe for securities. This announcement is not, and is not intended to be, an offer of securities of the Company for sale in the United States. The securities of the Company have not been, and will not be, registered under the U.S. Securities Act of 1933, as amended (the “U.S. Securities Act”) and may not be offered or sold in the United States absent registration or an applicable exemption from registration requirements under the U.S. Securities Act. There is not, and is not intended to be, any public offering of the securities of the Company in the United States. Hong Kong Exchanges and Clearing Limited and The Stock Exchange of Hong Kong Limited take no responsibility for the contents of this announcement, make no representation as to its accuracy or completeness and expressly disclaim any liability whatsoever for any loss howsoever arising from or in reliance upon the whole or any part of the contents of this announcement. AIA Group Limited 友邦保險控股有限公司 (Incorporated in Hong Kong with limited liability) Stock Code: 1299 ANNUAL RESULTS FOR THE YEAR ENDED 30 NOVEMBER 2017
Transcript of AIA Group Limited 友邦保險控股有限公司 - aia.com€¦ · ii About AIA AIA Group Limited...

This announcement is for information purposes only and does not constitute an invitation or offer by any person to acquire, purchase or subscribe for securities. This announcement is not, and is not intended to be, an offer of securities of the Company for sale in the United States. The securities of the Company have not been, and will not be, registered under the U.S. Securities Act of 1933, as amended (the “U.S. Securities Act”) and may not be offered or sold in the United States absent registration or an applicable exemption from registration requirements under the U.S. Securities Act. There is not, and is not intended to be, any public offering of the securities of the Company in the United States.
Hong Kong Exchanges and Clearing Limited and The Stock Exchange of Hong Kong Limited take no responsibility for the contents of this announcement, make no representation as to its accuracy or completeness and expressly disclaim any liability whatsoever for any loss howsoever arising from or in reliance upon the whole or any part of the contents of this announcement.
AIA Group Limited友 邦 保 險 控 股 有 限 公 司
(Incorporated in Hong Kong with limited liability)Stock Code: 1299
ANNUAL RESULTS FOR THE YEAR ENDED 30 NOVEMBER 2017

i
AIA DELIVERS ANOTHER YEAR OF EXCELLENT GROWTH
VALUE OF NEW BUSINESS UP 28 PER CENT OPERATING PROFIT UP 16 PER CENT AND FINAL DIVIDEND UP 17 PER CENT
EV EXCEEDS US$50 BILLION FOR THE FIRST TIME
The Board of Directors of AIA Group Limited (stock code: 1299) is pleased to announce that AIA has delivered strong results for the year ended 30 November 2017 with double-digit growth across our main financial metrics. Highlights are shown on a constant exchange rate basis:
Excellent growth in value of new business (VONB)
• 28 per cent growth in VONB to US$3,512 million• Annualised new premiums (ANP) increased by 19 per cent to US$6,092 million• VONB margin up 4.1 pps to 56.8 per cent• PVNBP margin increased to 10 per cent from 9 per cent in 2016
Strong operating profit generation
• IFRS operating profit after tax (OPAT) up 16 per cent to US$4,647 million• Embedded value (EV) operating profit increased by 19 per cent to US$6,997 million• Operating return on EV (operating ROEV) up 110 bps to 16.6 per cent
Robust cash flow and resilient capital position
• EV Equity of US$51.8 billion; EV of US$50.1 billion, up US$8.0 billion• Underlying free surplus generation of US$4,527 million, up 13 per cent• Free surplus of US$12.3 billion• Net remittances of US$2.1 billion• Solvency ratio for AIA Co., our principal operating company, of 443 per cent on the HKIO basis
Significant increase in recommended final dividend
• 17 per cent growth in final dividend to 74.38 Hong Kong cents per share• Total dividend of 100.00 Hong Kong cents per share, an increase of 17 per cent
Ng Keng Hooi, AIA’s Group Chief Executive and President, said:
“AIA has delivered another strong performance with double-digit growth across our main financial metrics. Value of new business increased by 28 per cent to reach a new high of US$3,512 million and we also achieved strong growth in IFRS operating profit and free surplus. Today’s results are the direct outcome of the scale, quality and breadth of AIA’s exceptional businesses across the region and the significant progress we are making in delivering our strategic objectives.
“The Board has recommended an increase of 17 per cent in the 2017 final dividend, reflecting the strength of AIA’s financial results as well as our confidence in the outlook for the Group.
“AIA has been in Asia for almost a century and we operate in some of the most dynamic and attractive life insurance markets in the world. With our deep roots and long history in Asia, we have aligned our growth strategy with the opportunities created by the unprecedented structural economic, demographic and social changes taking place across our markets. AIA’s extensive distribution reach, product innovation, trusted brand and outstanding people capabilities place us in a unique position to help safeguard the financial security of consumers across the Asia-Pacific region.
“Our focus continues to be on the execution of our strategic priorities that will build on our competitive advantages and make a material difference to AIA’s future. I am confident that our teams will continue to deliver profitable growth and long-term value for our shareholders as we help our customers live healthier, longer, better lives and plan for a brighter future.”

ii
About AIA
AIA Group Limited and its subsidiaries (collectively “AIA” or the “Group”) comprise the largest independent
publicly listed pan-Asian life insurance group. It has a presence in 18 markets in Asia-Pacific – wholly-owned
branches and subsidiaries in Hong Kong, Thailand, Singapore, Malaysia, China, Korea, the Philippines,
Australia, Indonesia, Taiwan, Vietnam, New Zealand, Macau, Brunei, Cambodia, a 97 per cent subsidiary in
Sri Lanka, a 49 per cent joint venture in India and a representative office in Myanmar.
The business that is now AIA was first established in Shanghai almost a century ago. It is a market leader in
the Asia-Pacific region (ex-Japan) based on life insurance premiums and holds leading positions across the
majority of its markets. It had total assets of US$216 billion as of 30 November 2017.
AIA meets the long-term savings and protection needs of individuals by offering a range of products and
services including life insurance, accident and health insurance and savings plans. The Group also provides
employee benefits, credit life and pension services to corporate clients. Through an extensive network of
agents, partners and employees across Asia-Pacific, AIA serves the holders of more than 30 million individual
policies and over 16 million participating members of group insurance schemes.
AIA Group Limited is listed on the Main Board of The Stock Exchange of Hong Kong Limited under the stock
code “1299” with American Depositary Receipts (Level 1) traded on the over-the-counter market (ticker
symbol: “AAGIY”).
Contacts
Investment Community News Media
Lance Burbidge +852 2832 1398 Stephen Thomas +852 2832 6178
Feon Lee +852 2832 4704 Allister Fowler +852 2832 1978
Rachel Poon +852 2832 4792 Emerald Ng +852 2832 4720

iii
FINANCIAL SUMMARY
PERFORMANCE HIGHLIGHTS
US$ millions, unless otherwise stated 2017 2016YoY
CERYoY
AER
New Business Value
Value of new business (VONB) 3,512 2,750 28% 28% VONB margin 56.8% 52.8% 4.1 pps 4.0 pps Annualised new premiums (ANP) 6,092 5,123 19% 19%EV Operating Profit
Embedded value (EV) operating profit 6,997 5,887 19% 19% Operating ROEV 16.6% 15.4% 1.1 pps 1.2 pps EV operating earnings per share (US cents) 58.31 49.17 19% 19%IFRS Earnings
Operating profit after tax (OPAT) 4,647 3,981 16% 17% Operating ROE 14.2% 14.1% 0.2 pps 0.1 pps Total weighted premium income (TWPI) 26,147 22,133 18% 18% Operating earnings per share (US cents) – Basic 38.73 33.25 16% 16% – Diluted 38.61 33.16 16% 16%Dividends
Dividend per share (HK cents) – Final 74.38 63.75 n/a 17% – Total 100.00 85.65 n/a 17%
US$ millions, unless otherwise statedAs at
30 Nov 2017As at
30 Nov 2016YoY
CERYoY
AER
Embedded Value
EV Equity 51,775 43,650 15% 19% Embedded value 50,131 42,114 16% 19% Free surplus 12,303 9,782 29% 26% EV Equity per share (US cents) 428.78 362.06 15% 18%Equity and Capital
Shareholders’ allocated equity 35,658 29,632 17% 20% AIA Co. HKIO solvency ratio 443% 404% n/a 39 pps Shareholders’ allocated equity per share (US cents) 295.30 245.79 16% 20%
NEW BUSINESS PERFORMANCE BY SEGMENT
US$ millions, unless otherwise stated 2017 2016 VONB Change
VONBVONB
Margin ANP VONBVONB
Margin ANPYoY
CERYoY
AER
Hong Kong 1,559 53.2% 2,849 1,161 48.8% 2,294 34% 34%Thailand 381 73.6% 518 384 81.5% 471 (4)% (1)%Singapore 311 71.8% 433 316 74.1% 427 (1)% (2)%Malaysia 220 62.5% 348 198 57.1% 341 16% 11%China 828 85.5% 968 536 86.4% 621 60% 54%Other Markets 408 41.2% 976 321 32.9% 969 27% 27%Subtotal 3,707 60.0% 6,092 2,916 56.0% 5,123 28% 27%Adjustment to reflect consolidated reserving and capital requirements (65) n/m n/m (37) n/m n/m n/m n/mAfter-tax value of unallocated Group Office expenses (130) n/m n/m (129) n/m n/m n/m n/mTotal 3,512 56.8% 6,092 2,750 52.8% 5,123 28% 28%

iv
Notes:
(1) A presentation for analysts and investors, hosted by Ng Keng Hooi, Group Chief Executive and President, is scheduled at 9:30 a.m. Hong Kong time today with attendance by pre-registration only.
An audio cast of the presentation and presentation slides will be available on AIA’s website:
http://www.aia.com/en/investor-relations/results-presentations.html
(2) All figures are presented in actual reporting currency (US dollar) and based on actual exchange rates (AER) unless otherwise stated. Change on constant exchange rates (CER) is calculated using constant average exchange rates for 2017 and for 2016 other than for balance sheet items that use CER as at 30 November 2017 and as at 30 November 2016.
(3) Change is shown on a year-on-year basis unless otherwise stated.
(4) VONB is calculated based on assumptions applicable at the point of sale and before deducting the amount attributable to non-controlling interests. The amounts of VONB attributable to non-controlling interests in 2017 and in 2016 were US$22 million and US$19 million respectively.
(5) VONB includes pension business. ANP and VONB margin exclude pension business.
(6) IFRS operating profit after tax and operating earnings per share are shown after non-controlling interests unless otherwise stated.
(7) Hong Kong refers to operations in Hong Kong and Macau; Singapore refers to operations in Singapore and Brunei; and Other Markets refers to operations in Australia (including New Zealand), Cambodia, Indonesia, Korea, the Philippines, Sri Lanka, Taiwan, Vietnam and India. The results of our joint venture in India are accounted for using the equity method. For clarity, TWPI, ANP and VONB exclude any contribution from India.
(8) AIA’s financial information in this document is based on the audited consolidated financial statements and supplementary embedded value information for 2017.

001
TABLE OF CONTENTS
Page
Group Chief Executive and President’s Report . . . . . . . . . . . . . . . . . . . . . . . . . . . . . . . . . . . . . . . . . . . . . . . . . . . . . . . . . 2
Financial and Operating Review. . . . . . . . . . . . . . . . . . . . . . . . . . . . . . . . . . . . . . . . . . . . . . . . . . . . . . . . . . . . . . . . . . . . . . . 7
Financial Review . . . . . . . . . . . . . . . . . . . . . . . . . . . . . . . . . . . . . . . . . . . . . . . . . . . . . . . . . . . . . . . . . . . . . . . . . . . . . . . . . . 7
Business Review . . . . . . . . . . . . . . . . . . . . . . . . . . . . . . . . . . . . . . . . . . . . . . . . . . . . . . . . . . . . . . . . . . . . . . . . . . . . . . . . . . 23
Regulatory and International Developments. . . . . . . . . . . . . . . . . . . . . . . . . . . . . . . . . . . . . . . . . . . . . . . . . . . . . . . . . 35
Change of Financial Year-end Date . . . . . . . . . . . . . . . . . . . . . . . . . . . . . . . . . . . . . . . . . . . . . . . . . . . . . . . . . . . . . . . . . . . . 36
Financial Statements . . . . . . . . . . . . . . . . . . . . . . . . . . . . . . . . . . . . . . . . . . . . . . . . . . . . . . . . . . . . . . . . . . . . . . . . . . . . . . . . . 37
Independent Auditor’s Report . . . . . . . . . . . . . . . . . . . . . . . . . . . . . . . . . . . . . . . . . . . . . . . . . . . . . . . . . . . . . . . . . . . . . . 37
Consolidated Income Statement . . . . . . . . . . . . . . . . . . . . . . . . . . . . . . . . . . . . . . . . . . . . . . . . . . . . . . . . . . . . . . . . . . . . 44
Consolidated Statement of Comprehensive Income. . . . . . . . . . . . . . . . . . . . . . . . . . . . . . . . . . . . . . . . . . . . . . . . . . 45
Consolidated Statement of Financial Position . . . . . . . . . . . . . . . . . . . . . . . . . . . . . . . . . . . . . . . . . . . . . . . . . . . . . . . 46
Consolidated Statement of Changes in Equity . . . . . . . . . . . . . . . . . . . . . . . . . . . . . . . . . . . . . . . . . . . . . . . . . . . . . . . 48
Consolidated Statement of Cash Flows . . . . . . . . . . . . . . . . . . . . . . . . . . . . . . . . . . . . . . . . . . . . . . . . . . . . . . . . . . . . . 50
Notes to the Consolidated Financial Statements and
Significant Accounting Policies. . . . . . . . . . . . . . . . . . . . . . . . . . . . . . . . . . . . . . . . . . . . . . . . . . . . . . . . . . . . . . . . . 52
Independent Auditor’s Report on the Supplementary Embedded Value Information . . . . . . . . . . . . . . . . . . . 155
Supplementary Embedded Value Information . . . . . . . . . . . . . . . . . . . . . . . . . . . . . . . . . . . . . . . . . . . . . . . . . . . . . . . 159
Supplementary Financial Information on Calendar Year Basis . . . . . . . . . . . . . . . . . . . . . . . . . . . . . . . . . . . . . . . . . . 179
Information for Shareholders . . . . . . . . . . . . . . . . . . . . . . . . . . . . . . . . . . . . . . . . . . . . . . . . . . . . . . . . . . . . . . . . . . . . . . . . . 180
Review of Financial Statements . . . . . . . . . . . . . . . . . . . . . . . . . . . . . . . . . . . . . . . . . . . . . . . . . . . . . . . . . . . . . . . . . . . . 180
Compliance with Corporate Governance Code. . . . . . . . . . . . . . . . . . . . . . . . . . . . . . . . . . . . . . . . . . . . . . . . . . . . . . . 180
Purchase, Sale or Redemption of the Company’s Listed Securities. . . . . . . . . . . . . . . . . . . . . . . . . . . . . . . . . . . . 180
Events after the Reporting Period . . . . . . . . . . . . . . . . . . . . . . . . . . . . . . . . . . . . . . . . . . . . . . . . . . . . . . . . . . . . . . . . . . 180
Publication of Certain Financial and Other Data Pursuant to
Local Regulatory Requirements . . . . . . . . . . . . . . . . . . . . . . . . . . . . . . . . . . . . . . . . . . . . . . . . . . . . . . . . . . . . . . . . 180
Final Dividend. . . . . . . . . . . . . . . . . . . . . . . . . . . . . . . . . . . . . . . . . . . . . . . . . . . . . . . . . . . . . . . . . . . . . . . . . . . . . . . . . . . . . 180
Closure of Register of Members and Record Date. . . . . . . . . . . . . . . . . . . . . . . . . . . . . . . . . . . . . . . . . . . . . . . . . . . . 180
Annual General Meeting . . . . . . . . . . . . . . . . . . . . . . . . . . . . . . . . . . . . . . . . . . . . . . . . . . . . . . . . . . . . . . . . . . . . . . . . . . . 181
Forward-looking Statements . . . . . . . . . . . . . . . . . . . . . . . . . . . . . . . . . . . . . . . . . . . . . . . . . . . . . . . . . . . . . . . . . . . . . . . 181
Glossary . . . . . . . . . . . . . . . . . . . . . . . . . . . . . . . . . . . . . . . . . . . . . . . . . . . . . . . . . . . . . . . . . . . . . . . . . . . . . . . . . . . . . . . . . . . . . 183

002
GROUP CHIEF EXECUTIVE AND PRESIDENT’S REPORT
I am pleased to report that AIA has delivered another strong set of results in 2017 and we have continued to
make significant progress in delivering our strategic objectives. Our consistent track record of value creation
has been built collectively by the dedication of our exceptional teams throughout the region and their focus on
meeting the diverse needs of our customers and our partners.
Value of new business (VONB) grew by 28 per cent, IFRS operating profit after tax (OPAT) increased by 16 per
cent and underlying free surplus generation grew by 13 per cent. Embedded Value Equity exceeded US$50
billion for the first time, up by 15 per cent to US$51,775 million, all on constant exchange rates.
The Board has recommended an increase of 17 per cent in the 2017 final dividend from the higher base
established in 2016, reflecting AIA’s strong financial performance and the Board’s confidence in the Group’s
prospects.
AIA operates in some of the most dynamic and attractive life insurance markets in the world. The primary drivers
of growth for those markets and AIA’s business in the region remain as powerful and resilient as ever. Asia’s
economic expansion over the last decade, driven by the rapid urbanisation of large and growing populations,
has led to increased levels of participation in the labour force and rising affluence. As larger numbers of
households begin to cross higher-income thresholds, this leads to a significant step change in the need for
protection and long-term savings products from these newly-affluent consumers. AIA is ideally placed to meet
this fast-growing need.
These demographic trends are also giving rise to significant social and economic challenges. Ageing
populations require greater access to healthcare and present a rapidly growing burden on state pensions. Given
the increasing prevalence of lifestyle-related diseases, ageing populations and medical cost inflation, social
welfare and healthcare provision in the markets where we operate remain at relatively limited levels.
Private insurance will therefore play an increasingly critical role in addressing the shortfall in protection cover
needed to safeguard the population against early mortality, disability and growing out-of-pocket medical costs –
the “protection gap”. Weakening family support networks, inefficient savings in the form of short-term deposits
and insufficient provision for retirement, combined with increasing longevity, are also creating a substantial and
growing “retirement savings gap”.
As a result, the needs and expectations of Asian consumers are changing rapidly. Personal health, wellness and
the need for financial support into old age are increasingly front of mind. The key to meeting these needs is
developing products and professional financial advice that are relevant, personalised and reflect an individual’s
needs and lifestyle.
Our leadership position in health and protection integrated with wellness and long-term savings is at the
forefront of these developments and will continue to be our primary focus. AIA’s unparalleled distribution
capabilities, financial strength and product innovation place us in a unique and privileged position to help
safeguard the financial security of consumers across the Asia-Pacific region.

003
2017 PERFORMANCE HIGHLIGHTS (ON A CONSTANT EXCHANGE RATE BASIS)
Our strategy of meeting the long-term protection and savings needs of our customers in Hong Kong continued
to deliver excellent results with 34 per cent growth in VONB and a 23 per cent increase in OPAT in 2017. VONB
growth was broad-based across our main distribution channels and customer segments, led by an exceptionally
strong performance in the first half of the year from the retail IFA channel, as previously highlighted. Our agency
channel in Hong Kong continued to deliver excellent results throughout the year driven by the success of our
Premier Agency strategy.
China delivered 60 per cent growth in VONB and a 39 per cent increase in OPAT in 2017. AIA’s differentiated
approach to training, recruitment and career development, aided by digital tools, continues to be a distinct
competitive advantage and has transformed our agency force. Our agents are better able to serve the needs
of the rapidly growing middle class in China through offering professional financial advice. This allows us to
access the opportunities for growth in the Chinese life insurance market and sets AIA apart in the industry –
both with our customers and our new recruits.
Singapore delivered a stronger second-half performance with positive VONB growth from our strategic focus on
growing Premier Agency, developing profitable partnership distribution and sustaining our leadership position
in group insurance.
AIA’s operation in Thailand continued to transform our market-leading agency by recruiting the next generation
of full-time agents. While VONB reduced in line with the first half performance, we saw strong progress in our
Financial Adviser programme. This combines selective recruitment of young, highly educated candidates with
best-in-class training, and is running in parallel with the reductions we are making in the numbers of less
productive agents.
Malaysia delivered 16 per cent growth in VONB driven by our multi-channel distribution and our focus on
improving the protection coverage of our customers. Our Takaful business in Malaysia also continued to make
good progress and, since our launch three years ago, AIA is now a leading provider in this market.
Other Markets VONB grew by 27 per cent including strong performances from Australia and New Zealand,
Korea, the Philippines, Sri Lanka, Taiwan and Vietnam. All markets in the segment delivered positive VONB
growth in the year.
Our performance in 2017 is another clear demonstration of the benefits of AIA’s diversified growth portfolio
across geographical markets, products and distribution channels and the tremendous potential for profitable
growth in the Asia-Pacific region.
GROUP-WIDE OVERVIEW
DISTRIBUTION
AIA was one of the first life insurers to introduce agency distribution in Asia and this remains our core distribution
channel. Our agents provide us with an unparalleled ability to deliver professional face-to-face financial advice
to our millions of customers across the region. Agency distribution accounted for approximately 70 per cent of
the Group’s total VONB with growth of 28 per cent to US$2,541 million in 2017.

004
We remain committed to the disciplined execution of our Premier Agency strategy. Through our ongoing work
of attracting quality recruits and enhancing their productivity, we aim to develop the next generation of Premier
Agents. Million Dollar Round Table (MDRT) is an internationally recognised standard for financial planners,
and in 2017, AIA became the only company to be ranked number one in the world for MDRT members for three
consecutive years.
Partnership distribution, which includes bancassurance, broker and direct partnerships, remains a strategic
priority for AIA and continued to deliver strong profitable growth. In 2017, the Group’s VONB from partnership
distribution exceeded US$1 billion for the first time, growing by 27 per cent to US$1,113 million. Over the
course of the year, we also signed a number of new strategic partnership agreements with leading financial
institutions in the region while continuing to deliver strong results from our existing partnerships.
We provide our agents and distribution partners with state-of-the-art digital tools that are designed to
significantly enhance their professionalism and productivity. We believe that AIA is one of the few life
insurers to have demonstrated success in leveraging technology to enable and improve distribution through
our proprietary iPoS and iMO platforms. We have the capabilities and opportunities to keep innovating and
adopting new digital technology that will allow AIA to further enhance customer experience and engagement.
In the second half of the year, we launched the next major phase of iMO, our interactive Mobile Office platform.
By significantly expanding our functionality beyond the sales modules in iPoS, iMO represents a major step
change in support for our agents and distribution partners, spanning all of their daily activities including online
recruitment, training and digital leads generation.
STRATEGIC PARTNERSHIPS
Our focus continues to be on capturing the significant opportunities we have for organic growth by investing
capital in new business that offers attractive rates of return. In addition, our scale and presence across the
Asia-Pacific region places us in a strong position to take advantage of value-enhancing inorganic opportunities
as they arise. We rigorously evaluate these opportunities against strict financial and strategic criteria, and we
announced a number of transactions in 2017 that will materially extend our distribution reach across the region.
In September 2017, we announced the acquisition of the life insurance business in Australia and life and
health insurance businesses in New Zealand of Commonwealth Bank of Australia (CBA), along with new
20-year strategic bancassurance distribution agreements in both markets. The transaction, subject to securing
all necessary regulatory and governmental approvals, is expected to be accretive to earnings in the first year
following completion and the partnership agreements are expected to deliver a range of important benefits to
AIA and our stakeholders. Upon completion of this transaction, AIA will become the leading life insurer in the
profitable individual life protection markets of both Australia and New Zealand. It will add to AIA’s strength in
individual and group insurance in these markets by materially expanding and strengthening AIA’s distribution
capabilities and customer reach to CBA’s combined base of 13 million customers.
We also announced a new 15-year strategic bancassurance partnership in October 2017 with Bangkok Bank,
the largest bank in Thailand. This partnership is a significant opportunity for AIA to broaden our regional
bancassurance presence and reinforce our market leadership position in Thailand.
Earlier in the year, we extended our partnership with Bank Central Asia (BCA) in Indonesia by a further 10 years
and, in December 2017, we announced a 15-year extension to our exclusive regional bancassurance agreement
with Public Bank that extends the existing partnership to 2037.
We also entered into a new strategic partnership with SK Group, one of the largest business conglomerates in
Korea, through a long-term marketing and technology development agreement with SK Holdings, the holding
company for the leading telecommunications service provider in Korea, SK Telecom. Our partnership creates
strategic cooperation across a number of initiatives, including the offer of AIA Vitality and related propositions
to SK Telecom’s over 30 million customers.

005
Our new and extended agreements reflect AIA’s market-leading reputation for partnership distribution
capabilities and expand our distribution reach to create additional new business growth opportunities while
delivering attractive returns on capital.
BRAND AND MARKETING
AIA has one of the most recognised and trusted brands in Asia, built over our long history in the region. Our
brand promise of helping our customers live healthier, longer, better lives is one that resonates with the rapidly
evolving needs, lifestyles and expectations of Asian consumers. This clear theme influences every aspect of our
proposition for customers, refining the way we align benefits to customers’ needs and influencing the quality
of our service.
AIA continues to transform from product provider to partner. This provides a strong basis for developing deep,
long-term relationships with our customers. There are enormous opportunities in evolving life and health
insurance, moving from a transaction-based model to one where we work with our customers, helping prevent
the onset of illness by encouraging changes in lifestyle. AIA Vitality, the first science-based comprehensive
wellness programme in the Asia-Pacific region, is at the heart of this transformation and continues to gain
traction. This innovative programme is now available in 10 of our markets, and the number of full Vitality
members has trebled in 2017 as we offered a wide range of healthy lifestyle initiatives aimed at engaging local
communities and promoted healthy living throughout the year.
We extended our partnership with the English Premier League Football Club, Tottenham Hotspur, for a
further five years as the lead shirt sponsor of the club and we also appointed David Beckham as AIA’s Global
Ambassador in 2017. David is one of the most recognised individuals in the world and his sporting reputation
is well-aligned with AIA’s established brand promise and promotion of healthy lifestyles through active
participation in sport.
TECHNOLOGY AND OPERATIONS
New technology is a critical enabler underpinning our transformation to be a partner to our customers. We
have made substantial investments in digital technology during the year that will make a material difference
to how we do business with our customers, agents and distribution partners. Our approach to investing in
and deploying new digital technologies is focused on enhancing our back-office processes and increasing
operational efficiency, transforming the customer experience and improving the productivity of our distribution.
We also promote innovation and aim to leverage emerging technologies to support long-term sustainable
growth.
AIA completed the migration of our back office in four of our major markets into a dedicated “private cloud”
environment. This was one of the largest cloud migration programmes in the insurance industry in Asia enabling
availability of on-demand computing power across our back office. We developed and launched the first
blockchain-enabled bancassurance network with one of our bank partners in Hong Kong and deployed new
Artificial Intelligence (AI) solutions to help drive customer and agent service efficiency, as well as to support
effective decision-making. We also launched the next phase of iMO, our interactive Mobile Office platform, to
expand the functionality of our suite of digital tools that support our distribution platforms. These are just a few
examples of the many activities that are taking place across the Group in this area.
We are constantly looking for opportunities to use innovative technologies in ways where we can leverage our
scale and capabilities to industrialise them across the Group. In this way, our investments in digital technology
will add material value to our customers and make meaningful improvements to our operational efficiency.

006
ENGAGEMENT WITH PEOPLE
AIA’s successes over the years have been the direct result of the leadership talent, professionalism, commitment
and care demonstrated by our employees and agents throughout our organisation. The Group remains dedicated
to creating opportunities for our staff and improving engagement with our corporate purpose and operating
principles. The AIA Leadership Centre in Bangkok is fully operational and is continuing to introduce new
executive and staff development programmes. In 2017, AIA once again received the “Regional Best Employer,
Asia Pacific” award from Aon Hewitt in recognition of our efforts in employee engagement, talent development
and performance management.
2017 was a year of change and new opportunities for the Group’s senior leadership team. AIA has robust
succession plans with carefully considered candidates for all senior leadership positions across the Group. The
success of this framework was clearly demonstrated this year with the smooth transition of responsibilities to
our new Group Executive Committee members and the consistent delivery of a strong operating performance
throughout the transition period. I am pleased to report that five of the six new Group Executive Committee
members appointed this year were internal promotions, underscoring AIA’s deep pool of leadership talent and
experience.
Management teams from across the organisation, in both Group Office and the local business units, also
undertook a major project to review our strategy and our operating models. The objective was to identify priorities
and develop initiatives that will build on our unique competitive advantages and sustain our strong track record
of value creation. This review resulted in an updated strategic framework with a set of strategic priorities and
challenging internal targets for the Group, which will require us to continue to evolve our capabilities and
develop our people.
OUTLOOK
Economic growth accelerated across much of the Asia-Pacific region as domestic consumption and services
continued to replace exports as the major drivers of growth and monetary policy remained supportive during the
year. Economic reform and targeted risk reduction continued in China as policymakers execute a rebalancing of
the economy further away from manufacturing over the long term.
Current monetary policy conditions continue to be constructive with Asian policymakers retaining the
willingness and ability on both the monetary and fiscal fronts to supplement domestic growth drivers. The
outlook for overall growth in the region remains strong and broad-based as real disposable incomes continue to
rise, financial conditions are supportive and consumer demand for financial services is accelerating, providing
strong support for the life insurance industry and for AIA.
AIA is an exceptional company with a unique culture. The combination of major competitive advantages together
with our strong operational execution and AIA’s unique franchise gives me the confidence that we will continue
to capture the significant opportunities that the region presents. We still have a lot to do to achieve this and I
am tremendously excited about the future.
I remain committed to realising AIA’s full potential in Asia-Pacific and I look forward with great enthusiasm as
we continue to execute our growth strategy to create long-term sustainable value for our shareholders.

007
FINANCIAL AND OPERATING REVIEW
AIA is the largest publicly listed pan-Asian life insurance group, with a presence across 18 markets in the
Asia-Pacific region. We receive the vast majority of our premiums in local currencies and we closely match our
local assets and liabilities to minimise the economic effects of foreign exchange movements. When reporting
the Group’s consolidated figures, there is a currency translation effect as we report in US dollars. We have
provided growth rates and commentaries on our operating performance on CER unless otherwise stated, since
this provides a clearer picture of the year-on-year performance of the underlying businesses despite foreign
exchange volatility.
FINANCIAL REVIEW
SUMMARY AND KEY FINANCIAL HIGHLIGHTS
Our financial performance in 2017 has once again demonstrated AIA’s ability to deliver strong and consistent
results with double-digit growth across our main financial metrics of VONB, IFRS operating profit after tax and
embedded value. We have also increased capital and free surplus generation from the active management of
our in-force book, financed our growth, maintained our resilient solvency position and increased shareholder
dividends during the year. We have a clear strategy that is working well and with a strong track record of
execution. Our focus will continue to be on delivering profitable growth using our competitive advantages
to invest capital where we see attractive opportunities. This is underpinned by our disciplined financial
management with the aim of maintaining our prudent balance sheet taking into consideration the financial
flexibility needed to fund our growth. We remain confident in AIA’s long-term prospects and ability to continue
to deliver value for shareholders.
EMBEDDED VALUE
VONB grew by 28 per cent to US$3,512 million benefiting from AIA’s diverse growth platform across geographical
markets, products and distribution channels. Our agency and partnership businesses delivered 28 per cent and
27 per cent VONB growth respectively, while Hong Kong, Malaysia, China and our Other Markets each delivered
double-digit VONB growth in 2017.
ANP increased by 19 per cent to US$6,092 million and VONB margin was higher by 4.1 pps to 56.8 per cent.
Margin reported on a present value of new business premium (PVNBP) basis also increased to 10 per cent from
9 per cent in 2016.
EV operating profit increased by 19 per cent to US$6,997 million reflecting strong new business growth, a
higher expected return on EV of US$3,317 million and overall positive operating variances of US$304 million
from the proactive management of our in-force portfolio. This has driven a strong increase of 110 bps in our
operating ROEV to 16.6 per cent compared with 2016.
Equity attributable to shareholders of the Company on the embedded value basis (EV Equity) grew by US$8,125
million to US$51,775 million. The increase was mainly driven by EV operating profit growth of 19 per cent and
investment return variances of US$1,517 million reflecting the positive effect of short-term capital market
movements. We also benefited from foreign exchange translation movements of US$1,265 million. The strong
growth in EV Equity is reported after the payment of shareholder dividends totalling US$1,376 million.

008
IFRS EARNINGS
OPAT increased by 16 per cent to US$4,647 million mainly driven by double-digit growth in Hong Kong,
Singapore, China and our Other Markets. Each of our operating market segments delivered positive OPAT
growth compared with 2016. This strong performance was the result of the growth in new business over time
and the proactive management of our in-force portfolio.
The expense ratio reduced to 7.5 per cent from 7.9 per cent in 2016, from disciplined expense management and
as we continued to benefit from increasing scale.
Operating margin after tax was 17.9 per cent compared with 18.1 per cent in 2016. Each of our market segments
reported an improvement in operating margin apart from Hong Kong reflecting significant TWPI growth in 2017
and a shift in product mix towards participating business.
Operating return on shareholders’ allocated equity (operating ROE) increased by 20 bps to 14.2 per cent
reflecting strong OPAT growth partly offset by the significant positive effect on shareholders’ allocated equity of
short-term capital market movements. Shareholders’ allocated equity grew by US$6,026 million to US$35,658
million at 30 November 2017.
CAPITAL POSITION AND DIVIDENDS
Underlying free surplus generation grew by 13 per cent to US$4,527 million. The amount invested in writing
new business was stable at US$1,376 million with the increase from growth in new business offset by a higher
proportion of participating business that has a lower reported new business strain.
Free surplus increased by US$2,521 million to US$12,303 million at 30 November 2017 mainly reflecting
strong underlying free surplus generation, net of new business investment, of US$3,151 million and positive
investment return variances and other items of US$940 million, less the payment of shareholder dividends
totalling US$1,376 million.
The solvency ratio of AIA Company Limited (AIA Co.), our principal operating company, was 443 per cent at
30 November 2017, up by 39 pps compared with 404 per cent at 30 November 2016. The higher solvency
ratio was driven by the strong growth in retained earnings and the positive effect of short-term capital market
movements on our investment portfolio and statutory reserves, partly offset by dividends to AIA Group Limited.
Net funds remitted to the Group Corporate Centre were US$2,106 million in 2017 with each of our operating
market segments remitting positive cashflows.
The Board has recommended a final dividend of 74.38 Hong Kong cents per share, subject to shareholders’
approval at the Company’s forthcoming AGM. This brings the total dividend for 2017 to 100.00 Hong Kong cents
per share, an increase of 17 per cent on the higher base established in 2016. This reflects the strength of our
financial results and our confidence in the outlook for the Group. The Board intends to follow AIA’s established
prudent, sustainable and progressive dividend policy allowing for future growth opportunities and the financial
flexibility of the Group.

009
NEW BUSINESS PERFORMANCE
VONB, ANP and Margin by Segment
2017 2016 VONB Change
US$ millions, unless otherwise stated VONBVONB
Margin ANP VONBVONB
Margin ANPYoY
CERYoY
AER
Hong Kong 1,559 53.2% 2,849 1,161 48.8% 2,294 34% 34%
Thailand 381 73.6% 518 384 81.5% 471 (4)% (1)%
Singapore 311 71.8% 433 316 74.1% 427 (1)% (2)%
Malaysia 220 62.5% 348 198 57.1% 341 16% 11%
China 828 85.5% 968 536 86.4% 621 60% 54%
Other Markets 408 41.2% 976 321 32.9% 969 27% 27%
Subtotal 3,707 60.0% 6,092 2,916 56.0% 5,123 28% 27%
Adjustment to reflect consolidated reserving and capital requirements (65) n/m n/m (37) n/m n/m n/m n/m
After-tax value of unallocated Group Office expenses (130) n/m n/m (129) n/m n/m n/m n/m
Total 3,512 56.8% 6,092 2,750 52.8% 5,123 28% 28%
VONB grew by 28 per cent to US$3,512 million mainly driven by double-digit growth in Hong Kong, Malaysia,
China and our Other Markets. Our agency business delivered 28 per cent VONB growth to US$2,541 million and
partnership distribution VONB grew by 27 per cent to US$1,113 million compared with 2016.
ANP increased by 19 per cent to US$6,092 million and VONB margin was higher by 4.1 pps to 56.8 per cent.
Margin reported on a present value of new business premium (PVNBP) basis also increased to 10 per cent from
9 per cent in 2016.
Hong Kong delivered another excellent performance with VONB growth of 34 per cent to US$1,559 million.
We continued to benefit from broad-based growth across distribution channels and customer segments led
by an exceptionally strong performance in the first half of the year from the retail IFA channel, as previously
highlighted. Our agency channel in Hong Kong delivered another excellent performance driven by a strong
increase in the number of active agents.
AIA’s wholly-owned operation in China was our fastest-growing business with VONB growth of 60 per cent
to US$828 million. The consistent execution of our Premier Agency strategy continued to deliver a significant
increase in the number of active agents and our extensive use of digital technology helped to drive higher agent
productivity levels compared with 2016.
VONB in Thailand reduced by 4 per cent to US$381 million consistent with the performance in the first half. We
continue to transform our market-leading agency force by selective recruitment through our Financial Adviser
programme and increasing the productivity of our existing agents. We also announced in October 2017 that we
had reached an agreement on a new 15-year bancassurance partnership with Bangkok Bank Public Company
Limited (“Bangkok Bank”).
AIA Singapore reported VONB of US$311 million in 2017 with a positive second-half performance supported by
double-digit VONB growth from our agency channel. Malaysia delivered VONB growth of 16 per cent to US$220
million with solid performances from both our agency and partnership distribution channels benefiting from
strong growth in our Takaful business combined with increased sales of regular premium products.

010
Other Markets delivered excellent VONB growth of 27 per cent to US$408 million. Highlights included strong
performances from Australia (including New Zealand), Korea, the Philippines, Sri Lanka, Taiwan and Vietnam.
The VONB results for the Group are reported after a US$195 million total deduction for consolidated reserving
and capital requirements over and above local statutory requirements and for the present value of unallocated
Group Office expenses. This approach was taken to reflect the additional reserving and capital requirements
for AIA Co. and AIA International after allowing for the HKIO and the Bermuda Monetary Authority (BMA)
regulations above local requirements as applied by the Group.
EV EQUITY
EV OPERATING PROFIT
EV operating profit increased by 19 per cent to US$6,997 million compared with 2016. Operating ROEV
increased by 110 bps to 16.6 per cent compared with 2016.
This strong performance was the result of 28 per cent growth in VONB to US$3,512 million, a higher expected
return on EV of US$3,317 million and overall positive operating variances of US$304 million.
Overall operating variances have totalled more than US$1.4 billion since our initial public offering (IPO) in 2010.
EV Operating Profit Per Share – Basic
2017 2016YoY
CER
YoYAER
EV operating profit (US$ millions) 6,997 5,887 19% 19%
Weighted average number of ordinary shares (millions) 12,000 11,972 n/a n/a
Basic EV earnings per share (US cents) 58.31 49.17 19% 19%
EV Operating Profit Per Share – Diluted
2017 2016YoY
CER
YoYAER
EV operating profit (US$ millions) 6,997 5,887 19% 19%
Weighted average number of ordinary shares(1) (millions) 12,037 12,006 n/a n/a
Diluted EV earnings per share(1) (US cents) 58.13 49.03 19% 19%
Note:(1) Diluted EV earnings per share including the dilutive effects, if any, of the awards of share options, restricted share units, restricted stock purchase units
(RSPUs) and restricted stock subscription units (RSSUs) granted to eligible directors, officers, employees and agents under the share-based compensation plans as described in note 38 to the financial statements.
EV MOVEMENT
EV grew by US$8,017 million to US$50,131 million at 30 November 2017.
The increase was mainly driven by strong EV operating profit growth of 19 per cent to US$6,997 million and
positive non-operating movements of US$997 million. The overall growth in EV is shown after the payment of
shareholder dividends totalling US$1,376 million.

011
Non-operating movements included investment return variances of US$1,517 million reflecting the positive
effect of short-term capital market movements, reductions of US$190 million for economic assumption changes
and US$330 million for other non-operating variances. Other non-operating variances were mainly from changes
in regulatory requirements, including the strengthening of risk-based capital requirements in Singapore and
the newly published mortality tables in Thailand, and others including modelling-related enhancements. The
effect of positive foreign exchange translation movements was an additional US$1,265 million.
An analysis of the movement in EV is shown as follows:
2017
US$ millions, unless otherwise stated ANW VIF EV
Opening EV 16,544 25,570 42,114
Value of new business (546) 4,058 3,512
Expected return on EV 4,023 (706) 3,317
Operating experience variances 313 72 385
Operating assumption changes (229) 148 (81)
Finance costs (136) – (136)
EV operating profit 3,425 3,572 6,997
Investment return variances 1,242 275 1,517
Effect of changes in economic assumptions (7) (183) (190)
Other non-operating variances 420 (750) (330)
Total EV profit 5,080 2,914 7,994
Dividends (1,376) – (1,376)
Other capital movements 134 – 134
Effect of changes in exchange rates 114 1,151 1,265
Closing EV 20,496 29,635 50,131
2016
US$ millions, unless otherwise stated ANW VIF EV
Opening EV 15,189 23,009 38,198
Value of new business (695) 3,445 2,750
Expected return on EV 3,440 (586) 2,854
Operating experience variances 303 62 365
Operating assumption changes 26 3 29
Finance costs (111) – (111)
EV operating profit 2,963 2,924 5,887
Investment return variances (67) 30 (37)
Effect of changes in economic assumptions 6 (242) (236)
Other non-operating variances (142) 120 (22)
Total EV profit 2,760 2,832 5,592
Dividends (1,124) – (1,124)
Other capital movements (5) – (5)
Effect of changes in exchange rates (276) (271) (547)
Closing EV 16,544 25,570 42,114

012
EV Equity
US$ millions, unless otherwise stated
As at
30 November
2017
As at 30 November
2016
EV 50,131 42,114
Goodwill and other intangible assets(1) 1,644 1,536
EV Equity 51,775 43,650
Note:(1) Consistent with the IFRS financial statements, net of tax, amounts attributable to participating funds and non-controlling interests.
EV AND VONB SENSITIVITIES
Sensitivities to EV and VONB arising from changes to central assumptions from equity price and interest rate
movements are shown below and are consistent with the prior period.
US$ millions, unless otherwise stated
EV as at
30 November
2017
VONB
2017
EV as at30 November
2016VONB 2016
Central value 50,131 3,512 42,114 2,750
Equity price changes
10 per cent increase in equity prices 50,850 n/a 42,839 n/a
10 per cent decrease in equity prices 49,406 n/a 41,380 n/a
Interest rate changes
50 basis points increase in interest rates 50,160 3,693 42,262 2,927
50 basis points decrease in interest rates 49,689 3,262 41,736 2,524
Please refer to Section 3 of the Supplementary Embedded Value Information for additional information.
IFRS PROFIT
OPAT(1) by Segment
US$ millions, unless otherwise stated 2017 2016YoY
CER
YoYAER
Hong Kong 1,636 1,334 23% 23%
Thailand 865 768 9% 13%
Singapore 504 453 12% 11%
Malaysia 272 265 6% 3%
China 639 469 39% 36%
Other Markets 758 662 13% 15%
Group Corporate Centre (27) 30 n/m n/m
Total 4,647 3,981 16% 17%
Note:(1) Attributable to shareholders of the Company only excluding non-controlling interests.
OPAT grew by 16 per cent to US$4,647 million mainly driven by double-digit growth in Hong Kong, Singapore,
China and our Other Markets. Each of our operating market segments delivered positive OPAT growth compared
with 2016. This strong performance was the result of the growth in new business over time and the proactive
management of our in-force portfolio.

013
Hong Kong delivered an excellent performance with an OPAT increase of 23 per cent as we continued to benefit
from strong underlying business growth and improved claims experience.
Thailand delivered a solid performance with 9 per cent OPAT growth and Singapore continued its positive
momentum from the half-year with an increase in OPAT of 12 per cent. China OPAT grew by 39 per cent
supported by the quality of our earnings and increasing scale from sustained growth in profitable new business.
Malaysia delivered an improved performance in the second half with OPAT up by 12 per cent to report 6 per cent
growth for the full year. Other Markets also delivered a strong result in the second half with OPAT growth of 21
per cent giving 13 per cent for the full year and with positive OPAT growth across each of our individual markets.
Operating return on shareholders’ allocated equity (operating ROE) increased by 20 bps to 14.2 per cent
reflecting strong OPAT growth partly offset by the significant positive effect on shareholders’ allocated equity of
short-term capital market movements. Shareholders’ allocated equity grew by US$6,026 million to US$35,658
million at 30 November 2017.
TWPI by Segment
US$ millions, unless otherwise stated 2017 2016YoY
CER
YoYAER
Hong Kong 9,434 6,873 37% 37%
Thailand 3,517 3,327 2% 6%
Singapore 2,421 2,276 7% 6%
Malaysia 1,823 1,795 6% 2%
China 3,092 2,384 33% 30%
Other Markets 5,860 5,478 6% 7%
Total 26,147 22,133 18% 18%
TWPI increased by 18 per cent to US$26,147 million compared with 2016. The Group’s persistency remained
strong and stable at 95.6 per cent in 2017.
IFRS Operating Profit Investment Return
US$ millions, unless otherwise stated 2017 2016YoY
CER
YoYAER
Interest income 5,440 5,081 7% 7%
Expected long-term investment return for equities and real estate 1,656 1,343 24% 23%
Total 7,096 6,424 11% 10%
IFRS operating profit investment return increased by 11 per cent to US$7,096 million as our average invested
assets grew over the year as a result of the growth in our portfolio of business, supported by the higher market
values of our equity portfolio.

014
Operating Expenses
US$ millions, unless otherwise stated 2017 2016
YoY
CER
YoYAER
Operating expenses 1,969 1,752 13% 12%
The expense ratio reduced to 7.5 per cent from 7.9 per cent in 2016 from disciplined expense management and as we continued to benefit from increasing scale. Operating expenses grew by 13 per cent to US$1,969 million.
Net Profit(1)
US$ millions, unless otherwise stated 2017 2016YoY
CER
YoYAER
OPAT 4,647 3,981 16% 17%
Short-term fluctuations in investment return related to equities and real estate, net of tax 1,741 97 n/m n/m
Other non-operating investment return and other items, net of tax (268) 86 n/m n/m
Total 6,120 4,164 48% 47%
Note:(1) Attributable to shareholders of the Company only excluding non-controlling interests.
IFRS NON-OPERATING MOVEMENT
IFRS net profit increased by 48 per cent to US$6,120 million compared with 2016. The increase was due to strong growth in OPAT of 16 per cent to US$4,647 million and positive short-term fluctuations in investment return of US$1,741 million compared with US$97 million in 2016. Other non-operating items in 2016 included US$181 million from the change in corporate income tax rate in Thailand.
Movement in Shareholders’ Allocated Equity
US$ millions, unless otherwise stated 2017 2016
Opening shareholders’ allocated equity 29,632 26,705
Opening adjustments on revaluation gains on property held for own use – 259
Net profit 6,120 4,164
Purchase of shares held by employee share-based trusts (10) (86)
Dividends (1,376) (1,124)
Revaluation gains on property held for own use 78 50
Foreign currency translation adjustments 1,061 (423)
Other capital movements 153 87
Total movement in shareholders’ allocated equity 6,026 2,927
Closing shareholders’ allocated equity 35,658 29,632
The movement in shareholders’ allocated equity is shown before fair value reserve movements. We believe this provides a clearer reflection of the underlying movement in shareholders’ equity over the period, before the IFRS accounting treatment of movements in available for sale bonds.
Shareholders’ allocated equity grew to US$35,658 million at 30 November 2017. The increase of US$6,026 million was mainly due to net profit of US$6,120 million and foreign exchange translation movements of US$1,061 million, less the payment of shareholder dividends totalling US$1,376 million.
Sensitivities arising from foreign exchange rate, interest rate and equity price movements are included in note 36 to the financial statements.

015
IFRS EARNINGS PER SHARE (EPS)
Basic EPS based on IFRS OPAT attributable to shareholders increased by 16 per cent to 38.73 US cents in 2017.
Basic EPS based on IFRS net profit attributable to shareholders, including mark-to-market movements from our
equity and investment property portfolios, increased by 47 per cent to 51.00 US cents in 2017.
IFRS EPS – Basic
Net Profit(1) OPAT(1)
2017 2016 2017 2016
Profit (US$ millions) 6,120 4,164 4,647 3,981
Weighted average number of ordinary shares (millions) 12,000 11,972 12,000 11,972
Basic earnings per share (US cents) 51.00 34.78 38.73 33.25
IFRS EPS – Diluted
Net Profit(1) OPAT(1)
2017 2016 2017 2016
Profit (US$ millions) 6,120 4,164 4,647 3,981
Weighted average number of ordinary shares(2) (millions) 12,037 12,006 12,037 12,006
Diluted earnings per share(2) (US cents) 50.84 34.68 38.61 33.16
Notes:(1) Attributable to shareholders of the Company only excluding non-controlling interests.
(2) Diluted earnings per share including the dilutive effects, if any, of the awards of share options, restricted share units, RSPUs and RSSUs granted to eligible directors, officers, employees and agents under the share-based compensation plans as described in note 38 to the financial statements.
CAPITAL
FREE SURPLUS GENERATION
Our aim is to maintain a prudent balance sheet and capital position taking into consideration the financial
flexibility needed to fund our significant new business growth opportunities and support our prudent,
sustainable and progressive dividend policy and we look to do this through capital market stress conditions.
The Group’s free surplus at 30 November 2017 represents the excess of adjusted net worth over required
capital including consolidated reserving and capital requirements over and above local statutory requirements.
Underlying free surplus generation, which excludes investment return variances and other items, increased by
13 per cent to US$4,527 million. The amount invested in writing new business was stable at US$1,376 million
with the increase from growth in new business offset by a higher proportion of participating business that has
a lower reported new business strain.
Free surplus increased by US$2,521 million to US$12,303 million at 30 November 2017 mainly reflecting
strong underlying free surplus generation, net of new business investment, of US$3,151 million and positive
investment return variances and other items of US$940 million, less the payment of shareholder dividends
totalling US$1,376 million.

016
The following table summarises the change in free surplus:
US$ millions, unless otherwise stated 2017 2016
Opening free surplus 9,782 7,528
Underlying free surplus generated 4,527 4,024
Free surplus used to fund new business (1,376) (1,374)
Investment return variances and other items 940 1,005
Unallocated Group Office expenses (192) (161)
Dividends (1,376) (1,124)
Finance costs and other capital movements (2) (116)
Closing free surplus 12,303 9,782
NET FUNDS TO GROUP CORPORATE CENTRE
Working capital comprises debt and equity securities, deposits and cash and cash equivalents held at the Group
Corporate Centre. Working capital increased to US$9,749 million at 30 November 2017.
The increase was mainly due to net remittances from business units of US$2,106 million and an increase in
borrowings of US$514 million including the issuance of medium-term notes with net proceeds of US$497
million. The increase is reported after the payment of shareholder dividends totalling US$1,376 million.
The movements in working capital are summarised as follows:
US$ millions, unless otherwise stated 2017 2016
Opening working capital 8,416 7,843
Group Corporate Centre operating results (27) 30
Capital flows from business units
Hong Kong 952 1,034
Thailand 467 411
Singapore 238 209
Malaysia 192 186
China 207 46
Other Markets 50 135
Net funds remitted to Group Corporate Centre 2,106 2,021
Payment for increase in interest of an associate (Tata AIA) – (310)
Increase in borrowings 514 260
Purchase of shares held by the employee share-based trusts (10) (86)
Payment of dividends (1,376) (1,124)
Change in fair value reserve and others 126 (218)
Closing working capital 9,749 8,416

017
IFRS BALANCE SHEET
Consolidated Statement of Financial Position
US$ millions, unless otherwise stated
As at
30 November
2017
As at30 November
2016Change
AER
Assets
Financial investments 176,220 150,998 17%
Investment property 4,365 3,910 12%
Cash and cash equivalents 2,289 1,642 39%
Deferred acquisition and origination costs 21,847 18,898 16%
Other assets 10,970 9,626 14%
Total assets 215,691 185,074 17%
Liabilities
Insurance and investment contract liabilities 156,979 135,214 16%
Borrowings 3,958 3,460 14%
Other liabilities 12,382 11,090 12%
Less total liabilities 173,319 149,764 16%
Equity
Total equity 42,372 35,310 20%
Less non-controlling interests 378 326 16%
Total equity attributable to shareholders of AIA Group Limited 41,994 34,984 20%
Shareholders’ allocated equity 35,658 29,632 20%
Movement in Shareholders’ Equity
US$ millions, unless otherwise stated 2017 2016
Opening shareholders’ equity 34,984 31,119
Opening adjustments on revaluation gains on property held for own use – 259
Net profit 6,120 4,164
Fair value gains on assets 984 938
Purchase of shares held by employee share-based trusts (10) (86)
Dividends (1,376) (1,124)
Revaluation gains on property held for own use 78 50
Foreign currency translation adjustments 1,061 (423)
Other capital movements 153 87
Total movement in shareholders’ equity 7,010 3,865
Closing shareholders’ equity 41,994 34,984

018
Total Investments
US$ millions, unless otherwise stated
As at
30 November
2017
Percentage
of total
As at30 November
2016Percentage
of total
Total policyholder and shareholder 160,327 87% 137,479 87%
Total unit-linked contracts and consolidated investment funds 24,231 13% 20,657 13%
Total investments 184,558 100% 158,136 100%
The investment mix remained stable during the year as set out below:
Unit-Linked Contracts and Consolidated Investment Funds
US$ millions, unless otherwise stated
As at
30 November
2017
Percentage
of total
As at30 November
2016Percentage
of total
Unit-linked contracts and consolidated investment
funds
Debt securities 4,704 19% 4,456 22%
Loans and deposits 107 1% 196 1%
Equities 18,953 78% 15,498 75%
Cash and cash equivalents 456 2% 504 2%
Derivatives 11 – 3 –
Total unit-linked contracts and consolidated
investment funds 24,231 100% 20,657 100%

019
Policyholder and Shareholder Investments
US$ millions, unless otherwise stated
As at
30 November
2017
Percentage
of total
As at30 November
2016Percentage
of total
Participating funds
Government and government agency bonds 9,585 6% 7,830 6%
Corporate bonds and structured securities 11,089 7% 10,877 8%
Loans and deposits 2,037 1% 1,830 1%
Subtotal – Fixed income investments 22,711 14% 20,537 15%
Equities 6,822 4% 5,451 4%
Investment property and property held for own use 468 1% 434 –
Cash and cash equivalents 249 – 179 –
Derivatives 73 – 17 –
Subtotal participating funds 30,323 19% 26,618 19%
Other policyholder and shareholder
Government and government agency bonds 46,447 29% 40,013 29%
Corporate bonds and structured securities 59,343 37% 50,442 36%
Loans and deposits 5,829 4% 5,036 4%
Subtotal – Fixed income investments 111,619 70% 95,491 69%
Equities 10,941 7% 9,262 7%
Investment property and property held for own use 5,581 3% 5,062 4%
Cash and cash equivalents 1,584 1% 959 1%
Derivatives 279 – 87 –
Subtotal other policyholder and shareholder 130,004 81% 110,861 81%
Total policyholder and shareholder 160,327 100% 137,479 100%
ASSETS
Our asset allocation strategy is driven by our liability matching approach. We also aim to match our assets and
liabilities in local currencies.
Total assets increased by US$30,617 million to US$215,691 million at 30 November 2017, compared with
US$185,074 million at 30 November 2016, due to positive net revenues, mark-to-market gains from our debt
and equity securities and positive foreign exchange movements.
Total investments including financial investments, investment property, property held for own use, and cash
and cash equivalents increased by US$26,422 million to US$184,558 million at 30 November 2017, compared
with US$158,136 million at 30 November 2016.
Of the total US$184,558 million investments at 30 November 2017, US$160,327 million were held in respect of
policyholders and shareholders and the remaining US$24,231 million were backing unit-linked contracts and
consolidated investment funds.
Fixed income investments, including debt securities, loans and term deposits held in respect of policyholders
and shareholders, totalled US$134,330 million at 30 November 2017 compared with US$116,028 million at
30 November 2016. The average credit rating of the fixed income portfolio of A remained consistent with the
position at 30 November 2016.
020
Government and government agency bonds represented 42 per cent of fixed income investments at 30
November 2017, compared with 41 per cent at 30 November 2016. Corporate bonds and structured securities
accounted for 52 per cent of fixed income investments at 30 November 2017, compared with 53 per cent at 30
November 2016.
Equity securities held in respect of policyholders and shareholders totalled US$17,763 million at 30 November
2017, compared with US$14,713 million at 30 November 2016. The US$3,050 million increase in carrying
value was mainly attributable to new purchases and positive mark-to-market movements. Within this figure,
equity securities of US$6,822 million were held in participating funds.
Cash and cash equivalents increased by US$647 million to US$2,289 million at 30 November 2017 compared
with US$1,642 million at 30 November 2016. The increase largely reflected positive net cash inflows from our
operating business and proceeds of US$497 million from an issuance of medium-term notes in May 2017 less
the payment of shareholder dividends of US$1,376 million.
Investment property and property held for own use in respect of policyholders and shareholders totalled
US$6,049 million at 30 November 2017 compared with US$5,496 million at 30 November 2016.
Deferred acquisition and origination costs increased to US$21,847 million at 30 November 2017 compared
with US$18,898 million at 30 November 2016, largely reflecting new business growth.
Other assets increased to US$10,970 million at 30 November 2017 compared with US$9,626 million at 30
November 2016, reflecting the increase in reinsurance assets, accrued interest and prepayments.
LIABILITIES
Total liabilities increased to US$173,319 million at 30 November 2017 from US$149,764 million at 30 November
2016.
Insurance and investment contract liabilities grew to US$156,979 million at 30 November 2017 compared with
US$135,214 million at 30 November 2016, reflecting the underlying growth of the in-force portfolio from new
business, positive mark-to-market movements on equities and positive foreign exchange translation.
Borrowings increased to US$3,958 million at 30 November 2017, due to the net proceeds of US$497 million
from an issuance of medium-term notes in May 2017. Medium-term notes with a notional amount of US$500
million issued in 2013 will mature in 2018 as disclosed in note 28 to the financial statements.
Other liabilities were US$12,382 million at 30 November 2017, compared with US$11,090 million at 30
November 2016.
Details of commitments and contingencies are included in note 41 to the financial statements.

021
REGULATORY CAPITAL
The Group’s lead insurance regulator is the Hong Kong Insurance Authority (HKIA). The Group’s principal
operating company is AIA Co., a Hong Kong-domiciled insurer.
At 30 November 2017, the total available capital for AIA Co., our main regulated entity, was US$8,248 million
as measured under the HKIO basis, resulting in a solvency ratio of 443 per cent of regulatory minimum capital
compared with 404 per cent at 30 November 2016. The higher solvency ratio was driven by the strong growth
in retained earnings and the positive effect of short-term capital market movements on our investment portfolio
and statutory reserves, partly offset by dividends to the Company.
A summary of the total available capital and solvency ratios of AIA Co. is as follows:
US$ millions, unless otherwise stated
As at
30 November
2017
As at30 November
2016
Total available capital 8,248 6,699
Regulatory minimum capital (100%) 1,862 1,659
Solvency ratio (%) 443% 404%
The Group’s individual branches and subsidiaries are also subject to supervision, including relevant capital
requirements, in the jurisdictions in which they and their parent entity operate. The local operating units
were in compliance with the capital requirements of their respective entity and local regulators in each of our
geographical markets at 30 November 2017.
GLOBAL MEDIUM-TERM NOTE (GMTN) AND SECURITIES PROGRAMME
In March 2017, we expanded our US$5 billion GMTN programme to a US$6 billion GMTN and Securities
programme. Under our US$6 billion GMTN and Securities programme, the Company issued senior unsecured
fixed rate notes with a nominal amount of US$500 million in May 2017. The notes will mature in 2047 and bear
annual interest of 4.47 per cent. The Company has the right to redeem these notes at par on 23 May of each year
beginning on 23 May 2022. At 30 November 2017, the aggregate carrying amount of the debt issued under the
GMTN and Securities programme was US$3,958 million.
CREDIT RATINGS
Moody’s upgraded its financial strength rating on AIA Co. from Aa3 (Very Low Credit Risk) to Aa2 (Very Low
Credit Risk) on 27 March 2017.
At 30 November 2017, AIA Co. has financial strength ratings of Aa2 (Very Low Credit Risk) with a stable outlook
from Moody’s; AA (Very Strong) with a stable outlook from Fitch; and AA- (Very Strong) with a stable outlook
from Standard & Poor’s.
Moody’s upgraded its issuer credit rating on the Company from A3 (Low Credit Risk) to A2 (Low Credit Risk)
on 27 March 2017. Fitch upgraded its issuer credit rating of the Company from A+ (High Credit Quality) to AA-
(Very High Credit Quality) on 23 November 2017.
The Company has issuer credit ratings of A2 (Low Credit Risk) with a stable outlook from Moody’s; AA- (Very
High Credit Quality) with a stable outlook from Fitch; and A (Strong) with a stable outlook from Standard &
Poor’s.

022
DIVIDENDS
The Board has recommended a final dividend of 74.38 Hong Kong cents per share, subject to shareholders’
approval at the Company’s forthcoming AGM. This brings the total dividend for 2017 to 100.00 Hong Kong
cents per share, an increase of 17 per cent on the higher base established in 2016. This reflects the strength
of our financial results as well as our confidence in the outlook for the Group. The Board intends to follow AIA’s
established prudent, sustainable and progressive dividend policy allowing for future growth opportunities and
the financial flexibility of the Group.

023
BUSINESS REVIEWBUSINESS REVIEW
DISTRIBUTION
AGENCY
AIA’s proprietary tied agency network is our core distribution platform and enables us to deliver high-quality
professional services to a broad range of customers across the region. Our extensive agency network provides us
with a unique opportunity to offer personalised advice on a comprehensive range of products and services that
reflect an individual’s financial needs. The regular personal interaction our agents have with our customers is a
fundamental competitive advantage for the Group and enables AIA to build long-term relationships, providing
opportunities to bring further value-added products and services to those relationships over time.
The disciplined execution of AIA’s Premier Agency strategy has continued to deliver excellent results. Agency
VONB grew by 28 per cent to US$2,541 million in 2017, representing 70 per cent of the Group’s total VONB in
2017. ANP increased by 26 per cent to US$3,894 million with a higher VONB margin of 65.3 per cent.
Quality recruitment is an essential component of our Premier Agency strategy. We are also committed to the
ongoing professional development of our agents and leaders to ensure that we deliver customer service and
engagement levels of the highest standards. Our agents have access to our comprehensive suite of training
programmes and AIA was the first insurer in Asia to introduce mandatory pre-contract induction programmes.
These are designed to attract high-calibre new recruits and support our agents as they build successful
long-term careers with AIA. Our successful initiatives in 2017 have contributed to double-digit growth in the
total number of active agents and a 14 per cent increase in active agent productivity compared with 2016.
In 2017, AIA became the only company to be ranked number one in the world for Million Dollar Round Table
(MDRT) members for three consecutive years. MDRT status is an important, globally-recognised industry
benchmark, setting the standard of excellence for our agents. Each of our agency markets achieved at
least double-digit growth in registered MDRT members, reflecting the breadth of quality and high levels of
professionalism of our agents across Asia.
In addition to agency recruitment, training and development, we made substantial investments in digital tools
to help us serve our customers better and enhance the professionalism and productivity of our agents. Our iMO
platform is driving a step change in the support for our agents and customers – from delivering recruitment
and training programmes, to digital lead generation using data analytics and improving the effectiveness of the
face-to-face sales experience. By November 2017, more than 85 per cent of our active agents across the Group
have adopted our digital technology in their day-to-day sales activities.
Our aim is to continue the successful evolution of our Premier Agency strategy to differentiate AIA from
capacity-driven industry models that focus on mass recruitment of part-time agents, to a professional full-time
model that achieves best-in-class productivity levels, activity rates and quality of advice. We believe this
distinguishes AIA to both our agents and our customers and places us at a significant advantage to capture the
future growth opportunities in Asia.
024
PARTNERSHIPS
Our partnerships extend our market reach and broaden our access to new customers across the Asia-Pacific
region. Many of our long-term strategic partnerships are in high-growth emerging markets and are often with
the most prominent financial institutions in their respective countries. We continue to drive additional growth,
and strengthen these important long-term relationships by integrating our processes with those of our partners,
using in-branch insurance specialists, employing digital lead generation and further building our capabilities in
customer analytics. VONB from partnerships in 2017 exceeded US$1 billion for the first time, with 27 per cent
growth to US$1,113 million. VONB margin increased to 50.6 per cent from 43.5 per cent and ANP grew by 9 per
cent to US$2,198 million. Partnerships accounted for 30 per cent of the Group’s total VONB in 2017.
Intermediary Channels
Our intermediated channels, including independent financial advisers (IFAs), brokers, private banks and
specialist advisers, delivered excellent VONB growth in 2017 led by an exceptionally strong performance in
the first half of the year from Hong Kong, as previously highlighted. Our overall performance reflects the deep
relationships we have developed with our intermediary partners through the provision of dedicated sales
and service support and our ability to offer targeted propositions that meet the needs of a broader range of
customers.
Bancassurance Partnerships
AIA has developed a leading network of strategic bank partnerships across the region and our close cooperation
with these partners delivered double-digit growth in VONB in 2017. Our seven largest partner banks provide
access to more than 60 million existing bank customers, where the penetration from AIA products is currently
less than 2 per cent, and a significant population of potential new customers, demonstrating the considerable
opportunities for future profitable growth.
AIA has built long-term strategic partnerships with major local banks including the Bank Central Asia (BCA) in
Indonesia, Public Bank in Malaysia, Bank of the Philippine Islands (BPI) and IndusInd Bank in India. We have
built a strong regional partnership with Citibank, N.A. (Citibank) across 12 markets with the aim of providing a
full range of life and health insurance products and services to the bank’s 15 million retail clients. Our joint new
product launches, integration of iPoS with Citibank’s sales platforms and in-depth training delivered very strong
double-digit VONB growth in 2017.
We extended our relationships with BCA and Public Bank and announced new long-term distribution agreements
with a number of highly-regarded banks across the region, including Bangkok Bank Public Company Limited
(Bangkok Bank) in Thailand and Vietnam Prosperity Joint-Stock Commercial Bank (VPBank) in Vietnam. We
also announced a transaction that includes 20-year strategic bancassurance partnerships with Commonwealth
Bank of Australia (CBA) and ASB Bank Limited (ASB) in New Zealand subject to completion of the transactions,
including securing all necessary regulatory and governmental approvals.
Direct Channel
Our direct channel delivered strong VONB growth in 2017. Our businesses in Malaysia and Taiwan each delivered
good results and AIA Korea continued to build on its excellent performance in the first half, with very strong
double-digit VONB growth in 2017. We have also entered into a new strategic partnership with SK Group, one
of the largest business conglomerates in Korea. AIA Korea will offer protection products, including AIA Vitality,
to SK Telecom, the leading telecommunications service provider in Korea with more than 30 million customers.

025
GROUP INSURANCE
AIA is a major provider of group insurance across the region with leading positions in Hong Kong, Thailand,
Singapore, Malaysia and Australia. The provision of group insurance is an important part of AIA’s protection
strategy. The increasing emphasis on the provision of life, health and wellness schemes by employers is an
area we believe will offer significant growth given the more than 1.8 billion people in the working population in
Asia-Pacific (ex-Japan).
We delivered strong double-digit VONB growth in 2017 helped by the retention of several large group schemes
in Australia and a solid performance from our agency channel providing individual voluntary solutions to AIA’s
existing customer base of more than 16 million group scheme members. We also launched AIA Vitality to
selected group insurance clients in Australia, Hong Kong, Malaysia, Singapore, Thailand and the Philippines to
increase engagement with their employees.
Our regional presence and longstanding relationships with international and regional employee benefits
consultants place AIA in an advantaged position to capture the huge potential from the growth in
Asian-headquartered multinational companies and the expansion of global corporations across the region. This
is supported by our multi-territory risk-pooling capability via the AIA Asia Benefits Network.
Our agency channel provides us with access to small-and-medium sized enterprise (SME) clients throughout
the region. SMEs employ more than half of the labour force in Asia-Pacific and we expect this market to become
increasingly important as a source of new business as these companies evolve from small family-run operations
into scalable businesses. We identify and train specialists who are able to use their strong relationships with
business owners to capture the demand for group insurance as these businesses grow in size and sophistication.
MARKETING
AIA is one of the most trusted and recognised brands across our markets. We are committed to delivering
our brand promise of helping our customers across the region meet their financial protection and long-term
savings needs while enabling them to live healthier, longer, better lives. This ensures that the AIA brand remains
relevant and continues to resonate with our customers as their lifestyles and financial needs evolve.
CUSTOMER ENGAGEMENT
AIA’s large existing customer base is a significant source of scale and potential future growth for the Group with
more than 30 million individual policies and over 16 million participating members of group insurance schemes.
We recognise the importance of increasing customer engagement to help ensure the successful delivery of
our brand promise to our customers and our ability to capture material upside from additional new business.
Deeper analysis of customer preferences, behaviours and life stages enables us to help our distribution meet
the individually-tailored needs of our customers at the right time and with the right propositions.
Our brand promise provides a framework to help us engage with our stakeholders throughout the Asia-Pacific
region. We held a wide range of healthy living initiatives with our local communities to promote active lifestyles
including The FitnessFest by AIA in Singapore, The #LiveBetter Expo in the Philippines, The Music Run in
Thailand and The Men’s Health/Women’s Health Night Run in Malaysia.
In March 2017, we also announced the appointment of David Beckham as AIA’s Global Ambassador to support
our promotion of healthy living activities. We launched our #WhatsYourWhy campaign, including a video
prominently featuring David, which encourages people to understand their motivations for wanting to live
healthier, longer, better lives. Our regional campaign spanned several months and included a four-market tour,
generating over 10 million online views of the video.

026
Our shirt sponsorship agreement with Tottenham Hotspur Football Club (Spurs) continued to play an important
role in linking AIA with healthy lifestyles by encouraging active participation in sport. In May 2017, we extended
our partnership with Spurs for another five years. We believe football is an ideal platform that enables us to
engage with our customers and distribution across all of our markets.
PRODUCT INNOVATION
AIA Vitality, our science-backed wellness programme, epitomises AIA’s brand promise. We extended the launch
of AIA Vitality to Vietnam, Sri Lanka and Korea in 2017, bringing the programme to 10 markets including
Australia, Singapore, the Philippines, Hong Kong, Macau, Malaysia and Thailand. We also developed a wellness
programme to meet the specific needs of our customers in China.
We continued to focus on expanding our comprehensive suite of protection products in 2017 including the
launch of a number of first-to-market benefits such as the “Metro Trio” and the “Smart Elite Ultra” plans in Hong
Kong, as well as the “Diabetes Care” plan in Singapore. These products help raise awareness of chronic diseases
and also enable AIA to access a new category of customers, who were previously unable to obtain insurance,
while ensuring that we do not materially increase our risk profile. AIA Vitality is also fully integrated with these
new products providing a tremendous opportunity for AIA to benefit customers, distributors, shareholders and
the many communities in which we operate.
TECHNOLOGY AND OPERATIONS
AIA has continued to make significant progress in transforming our technology systems and business processes.
Innovation and operational excellence are strategic priorities for the Group and we have made substantial
investments in digital technology during the year. Our activities span all aspects of the business – from
transforming our back-office processes and systems, driving a step change in the support for our distribution,
to delivering product innovation and simplifying the customer experience.
INCREASING EFFICIENCY THROUGH DIGITALISATION
The digitalisation of our back office is critical in enabling AIA to deliver market-leading customer service.
The scale of more than 30 million customer interactions during the year across our businesses means that
digitalisation offers many opportunities to simplify and accelerate processes whilst both enhancing the
customer experience and improving costs.
For example, we continued our development of artificial intelligence (AI) capabilities using the IBM Watson
platform. We achieved a 40 per cent reduction in turnaround times and over 99 per cent accuracy on claims
eligibility processing in Australia. We extended this to Natural Language Processing (NLP) to launch chatbots
to service customers in Korea and agents in Hong Kong. In Malaysia, we launched the first insurance chatbot
integrated into social media. In Singapore, the auto-underwriting rate has more than doubled across the last
two years to reach over 70 per cent by the end of 2017. We have also partnered with SK C&C in Korea to
integrate IBM Watson into our service centre.
In 2017, AIA completed the transformation of our back office in four of our major markets into a dedicated
“private cloud” environment. This was one of the largest cloud migration programmes in the insurance industry
in Asia enabling availability of on-demand computing power across our back office. The consolidation of our
multiple data centres into the “private cloud” also provided us significant reduction in carbon footprint.

027
DRIVING PRODUCTIVITY AND SERVICE EXCELLENCE
AIA pioneered digital point-of-sale technology that has been improving the efficiency, productivity and
professionalism of our agents since its launch in 2012. In November 2017, more than 85 per cent of the
Group’s new agency business was submitted completely paperless using an electronic signature. In China, the
latest version of iPoS has reduced the time taken for the sales application and fulfilment process, including
underwriting and policy issuance, to under 30 minutes from the previous average of five days.
We significantly expanded the functionality of iPoS to incorporate productivity tools and analytics capabilities
as part of our iMO platform. iMO allows our agents to manage their entire range of activities from a single mobile
device and marks a step change in the digital support for customers and agents. iPoS is now only one powerful
component of a much broader suite of market-leading digital tools.
In 2017, we commenced the roll-out of our next generation customer platform, MyPage. This will be live in most
markets by the end of 2018 offering an integrated (online and mobile), single digital touchpoint, linking all our
customers with all our products and services, including AIA Vitality, in a consistent way.
We are also continuing to expand our presence on third-party online platforms, such as WeChat in China where
we already provide service information, e-claims and appointment-booking services. Health claims can be
submitted in real time through WeChat and the average turnaround time has reduced from four days to same
day settlement.
PROMOTING INNOVATION AND ENHANCED CUSTOMER EXPERIENCE
The focus of our innovation activities is on digital health and wellness, AI, cloud technology and blockchain.
By leveraging innovation and emerging technologies, we are deepening engagement with our customers and
supporting the sustainable and profitable growth of our businesses.
For example, our Hong Kong business co-developed Hong Kong’s first blockchain-enabled bancassurance
network with our bank partners, reducing the time needed to process insurance applications. AIA Vitality, our
science-backed wellness programme, is designed to use digital technology to encourage and reward sustained
changes in lifestyle that promote healthy living. AIA Vitality customers used our mobile apps more than 30
million times during the year. Membership has increased to more than three times the level of the prior year and
we now have more than 700,000 customers with full membership of our wellness programmes.
AIA has piloted Automation Anywhere, Nice and UiPath and our aim is to deliver improved efficiency in selected
major markets using Robotic Process Automation (RPA).

028
GEOGRAPHICAL MARKETS
HONG KONG
US$ millions, unless otherwise stated 2017 2016YoY
CER
YoYAER
VONB(1) 1,559 1,161 34% 34%
VONB margin(2) 53.2% 48.8% 4.4 pps 4.4 pps
ANP 2,849 2,294 24% 24%
TWPI 9,434 6,873 37% 37%
Operating profit after tax 1,636 1,334 23% 23%
Financial Highlights
AIA Hong Kong delivered another excellent performance in 2017 with VONB growing by 34 per cent to US$1,559
million. ANP grew by 24 per cent and VONB margin increased by 4.4 pps to 53.2 per cent, reflecting sales of
higher-margin protection and savings products, particularly in the second half of the year. VONB growth was
broad-based across our main distribution channels and customer segments, led by an exceptionally strong
performance in the first half from the retail IFA channel, as previously highlighted. Our agency channel delivered
another excellent performance driven by a strong increase in the number of active agents. IFRS operating profit
after tax grew by 23 per cent to US$1,636 million reflecting strong growth in the underlying business and
improved claims experience.
Business Highlights
AIA Hong Kong continued to set the benchmark for agent quality through the consistent execution of our Premier
Agency strategy. Building on the success of the AIA Premier Academy, which celebrated its sixth anniversary
in 2017, we extended the programme to develop the next generation of high-calibre agency leaders. This has
helped drive quality recruitment with a 26 per cent increase in the number of active new agents compared with
2016. Active agent productivity increased over the year, supported by our principal digital platforms which help
our agents deliver a seamless customer experience.
Our partnership distribution also delivered another strong performance in 2017. Our long-term relationship
with Citibank delivered excellent double-digit growth in VONB. This was driven by higher levels of productivity
as we continued to support Citibank’s relationship managers and insurance specialists. Our IFA channel also
delivered an exceptional performance, particularly in the first half of the year, and we continued to strengthen
our IFA proposition through our ongoing commitment to high levels of service and support.
AIA offers a broad range of protection and long-term savings products to meet the evolving needs of consumers
in Hong Kong and we are the market leader in protection provision. We also engage our customers through
cross-sell and loyalty campaigns which contributed meaningfully to our new sales during the year. AIA Vitality,
our comprehensive science-backed wellness programme, further differentiates our protection proposition and
membership numbers increased by more than 90 per cent compared with 2016.

029
THAILAND
US$ millions, unless otherwise stated 2017 2016YoY
CER
YoYAER
VONB(1) 381 384 (4)% (1)%
VONB margin(2) 73.6% 81.5% (7.9) pps (7.9) pps
ANP 518 471 6% 10%
TWPI 3,517 3,327 2% 6%
Operating profit after tax 865 768 9% 13%
Financial Highlights
AIA Thailand reported VONB of US$381 million for 2017, a reduction of 4 per cent. We continued to transform
our market-leading agency distribution by selective recruitment of our next generation of full-time agents and
increasing the productivity of our existing agents. We remained focused on providing long-term protection and
savings products with regular premium business accounting for more than 95 per cent of ANP in 2017. IFRS
operating profit after tax increased by 9 per cent to US$865 million reflecting underlying business growth
and better claims experience partly offset by the introduction of a new mortality table as required by local
regulation.
Business Highlights
An important part of our Premier Agency strategy is the acceleration of our Financial Adviser programme to
drive our agency transformation and attract young and high-calibre individuals to full-time professional careers
with AIA. In 2017 new recruits through this programme grew by 32 per cent compared with 2016 and the
total number of Financial Advisers now exceeds 7,000. The activity ratio of newly-recruited Financial Advisers
was more than double that of other new agents and productivity per active agent was 35 per cent higher than
average.
Among our existing agents, we continue to actively develop those with strong potential, who receive training to
become professional, full-time Premier Agents and our next generation of agency leaders. We have also made
significant investments in the infrastructure supporting our Premier Agency strategy. This includes opening
nine new Financial Adviser training centres nationwide, modernising our agency offices and digitally equipping
our agents to support future growth. At the same time, we are continuing to enforce our minimum standards to
reduce the number of less productive agents.
In October 2017, we reached agreement on a 15-year strategic bancassurance partnership with Bangkok Bank,
the largest bank in Thailand by total assets with more than 16 million customer accounts. Through this new
strategic partnership, Bangkok Bank will distribute AIA Thailand’s broad range of protection and long-term
savings products on an exclusive basis via its nationwide network of around 1,200 branches. We believe our
new partnership provides tremendous opportunities by bringing together two of Thailand’s largest, most
well-established and recognised financial institutions.
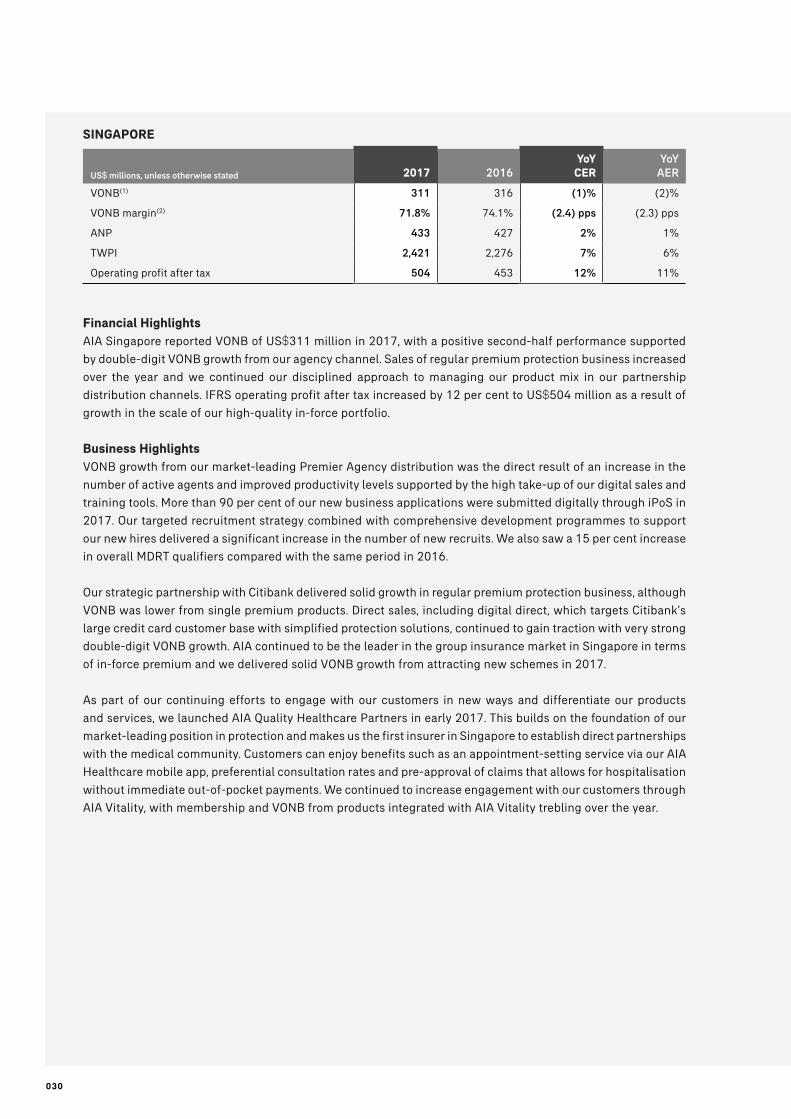
030
SINGAPORE
US$ millions, unless otherwise stated 2017 2016YoY
CER
YoYAER
VONB(1) 311 316 (1)% (2)%
VONB margin(2) 71.8% 74.1% (2.4) pps (2.3) pps
ANP 433 427 2% 1%
TWPI 2,421 2,276 7% 6%
Operating profit after tax 504 453 12% 11%
Financial Highlights
AIA Singapore reported VONB of US$311 million in 2017, with a positive second-half performance supported
by double-digit VONB growth from our agency channel. Sales of regular premium protection business increased
over the year and we continued our disciplined approach to managing our product mix in our partnership
distribution channels. IFRS operating profit after tax increased by 12 per cent to US$504 million as a result of
growth in the scale of our high-quality in-force portfolio.
Business Highlights
VONB growth from our market-leading Premier Agency distribution was the direct result of an increase in the
number of active agents and improved productivity levels supported by the high take-up of our digital sales and
training tools. More than 90 per cent of our new business applications were submitted digitally through iPoS in
2017. Our targeted recruitment strategy combined with comprehensive development programmes to support
our new hires delivered a significant increase in the number of new recruits. We also saw a 15 per cent increase
in overall MDRT qualifiers compared with the same period in 2016.
Our strategic partnership with Citibank delivered solid growth in regular premium protection business, although
VONB was lower from single premium products. Direct sales, including digital direct, which targets Citibank’s
large credit card customer base with simplified protection solutions, continued to gain traction with very strong
double-digit VONB growth. AIA continued to be the leader in the group insurance market in Singapore in terms
of in-force premium and we delivered solid VONB growth from attracting new schemes in 2017.
As part of our continuing efforts to engage with our customers in new ways and differentiate our products
and services, we launched AIA Quality Healthcare Partners in early 2017. This builds on the foundation of our
market-leading position in protection and makes us the first insurer in Singapore to establish direct partnerships
with the medical community. Customers can enjoy benefits such as an appointment-setting service via our AIA
Healthcare mobile app, preferential consultation rates and pre-approval of claims that allows for hospitalisation
without immediate out-of-pocket payments. We continued to increase engagement with our customers through
AIA Vitality, with membership and VONB from products integrated with AIA Vitality trebling over the year.

031
MALAYSIA
US$ millions, unless otherwise stated 2017 2016YoY
CER
YoYAER
VONB(1) 220 198 16% 11%
VONB margin(2) 62.5% 57.1% 5.3 pps 5.4 pps
ANP 348 341 7% 2%
TWPI 1,823 1,795 6% 2%
Operating profit after tax 272 265 6% 3%
Financial Highlights
AIA Malaysia delivered VONB growth of 16 per cent to US$220 million as a result of solid performances from
both our agency and partnership distribution channels. VONB margin increased by 5.3 pps to 62.5 per cent as
we continued to focus on providing long-term unit-linked protection products. ANP increased by 7 per cent to
US$348 million with new regular premium business accounting for 95 per cent of sales. IFRS operating profit
after tax grew by 6 per cent to US$272 million, including an improved performance over the second half with
OPAT up by 12 per cent compared with the prior year.
Business Highlights
Our agency strategy in Malaysia is designed to drive quality recruitment and improve agency productivity
supporting our aim of promoting and rewarding highly-skilled and well-trained full-time agents. AIA’s Takaful
business continued to be an important growth driver as our agency leaders focus on recruitment to meet the
needs of this significantly under-penetrated market. Takaful agents accounted for around two-thirds of our
new recruits during the year and the total number of active Takaful-producing agents increased by 38 per cent
compared with 2016.
Partnership distribution delivered another strong performance with our bancassurance business achieving 25
per cent VONB growth. Our high sum assured regular premium product targeting Public Bank’s mass affluent
customers continued to be well received and helped to increase the productivity of our in-branch insurance
specialists. Our direct channel delivered a strong performance as we focused on offering critical illness
protection products to the existing customers of Public Bank and Citibank. Building on the success of our
longstanding relationship with Public Bank, we announced in December 2017 that we had agreed to extend our
existing exclusive regional bancassurance partnership by a further 15 years to 2037.
AIA is the clear market leader in group insurance in Malaysia and we delivered double-digit VONB growth in
the year. To further enhance customer experience, we released a new mobile app for our corporate healthcare
members which enables them to locate the nearest healthcare provider, pre-register appointments, obtain
referral letters and monitor their benefit usage.
AIA is committed to providing sustainable and affordable long-term protection cover to a wide cross section
of Malaysian consumers. AIA was the first company globally to integrate health and wellness benefits with
unit-linked life insurance and Takaful products through AIA Vitality. We more than doubled the number of
AIA Vitality members and we expanded our AIA Vitality programme to Public Bank customers in June 2017.
Continuing our efforts to innovate and invest in technology, we recently launched the first insurance chatbot
“Ask Sara” in Malaysia to provide a differentiated and seamless experience to our sales force. This AI-powered
enquiry tool provides real-time answers to agents on 700 commonly asked questions, and, in doing so, helps
them to serve and advise our customers even more efficiently.

032
CHINA
US$ millions, unless otherwise stated 2017 2016YoY
CER
YoYAER
VONB(1) 828 536 60% 54%
VONB margin(2) 85.5% 86.4% (0.8) pps (0.9) pps
ANP 968 621 61% 56%
TWPI 3,092 2,384 33% 30%
Operating profit after tax 639 469 39% 36%
Financial Highlights
AIA China delivered another excellent set of results with VONB growth of 60 per cent to US$828 million. ANP
grew by 61 per cent to US$968 million and VONB margin was 85.5 per cent. Our strong performance was driven
by a significant increase in the number of active agents, higher agent productivity and our sustained focus on
writing regular premium long-term savings and protection products to meet the substantial and growing needs
of customers. IFRS operating profit after tax rose by 39 per cent to US$639 million reflecting the growing scale
of our business and our high-quality sources of earnings.
Business Highlights
Our agency strategy is built around a culture of disciplined activity management and ongoing professional
development to help our agents and leaders build long-term careers with AIA and provide our customers with
high-quality advice tailored to their needs. Our emphasis on quality recruitment through stringent selection,
best-in-class training and advanced agency leader development programmes led to a 32 per cent increase in
our number of active agents compared with 2016 and a 30 per cent increase in MDRT qualifiers.
Our agents are supported by leading digital platforms that have helped them become the most productive
agency distribution in the market. Our technology provides agents and leaders with a comprehensive suite of
tools that covers all aspects of their roles from recruitment and training to the provision of face-to-face advice
and servicing of customers – online and offline. Almost 100 per cent of new policies were submitted digitally
in 2017, using our next generation of iPoS. Alongside our leading training programmes, this technological
enhancement has helped active agents increase productivity levels by more than 25 per cent compared with
2016.
While agency is our main source of new business, our bancassurance distribution also made good progress
in 2017 achieving strong double-digit VONB growth. We continued to work closely with Citibank and other
selected local bank partners to provide long-term protection and savings products to the affluent customer
segment.
AIA is a leader in the protection market in China with traditional protection business accounting for 84 per
cent of VONB in 2017. We launched our first wellness programme earlier in the year in conjunction with the
announcement of David Beckham as AIA’s Global Ambassador. This programme combines mobile technology
with an innovative customer programme to encourage healthy lifestyles through engagement activities as well
as benefits and rewards. We also delivered a strong performance from our high net worth offering to meet the
protection cover, estate planning and long-term retirement savings needs of this substantial and fast-growing
customer segment.

033
OTHER MARKETS
US$ millions, unless otherwise stated 2017 2016YoY
CER
YoYAER
VONB(1) 408 321 27% 27%
VONB margin(2) 41.2% 32.9% 8.2 pps 8.3 pps
ANP 976 969 1% 1%
TWPI 5,860 5,478 6% 7%
Operating profit after tax 758 662 13% 15%
AIA’s Other Markets include Australia (including New Zealand), Cambodia, Indonesia, Korea, the Philippines,
Sri Lanka, Taiwan, Vietnam and India.
The financial results from our 49 per cent shareholding in Tata AIA, our joint venture with the Tata Group in
India, are accounted for using the equity method. For clarity, TWPI, ANP and VONB exclude any contribution
from India.
Financial Highlights
Other Markets delivered very strong growth with VONB up by 27 per cent to US$408 million. VONB margin
was higher by 8.2 pps to 41.2 per cent and ANP was flat compared with 2016. Highlights included strong
performances from Australia (including New Zealand), Korea, the Philippines, Sri Lanka, Taiwan and Vietnam.
IFRS operating profit after tax increased by 13 per cent to US$758 million.
Business Highlights
Australia: Our Australian group business delivered excellent performance as we continued to focus on the
retention of major industry funds and corporate clients while proactively reviewing benefit designs. AIA also
maintained its leadership position in the retail IFA channel, although the overall market growth remained
subdued during the year. We also launched ‘myOwn’, a new health insurance brand in July 2017. myOwn is the
result of an innovative alliance amongst AIA Australia; GMHBA, an Australian health insurance provider; and
Discovery Limited, our AIA Vitality partner. myOwn offers a digitally-led integrated life, health and wellness
proposition, which is a first for the Australian market.
In September 2017, we announced that we had reached an agreement with CBA, subject to securing all
necessary regulatory and governmental approvals, to acquire CommInsure Life in Australia and Sovereign
Assurance Company Limited (Sovereign) in New Zealand. The Group will also enter into 20-year strategic
bancassurance partnerships with CBA in Australia and ASB in New Zealand, together providing access to the
banks’ 13 million existing bank customers and significantly expanding our distribution capabilities in these
markets.
Cambodia: Our Cambodian operations were officially launched in May 2017, which is AIA’s first start-up business
in a new market since our IPO. Our strategy is to focus on providing protection, health and wellness products
through multichannel distribution including the creation of a full-time, professional agency distribution and our
exclusive bancassurance partnership with Cambodian Public Bank. We also provide a fully digital end-to-end
service platform for both our agency and bancassurance channels.

034
Indonesia: We continued to execute our Premier Agency strategy in Indonesia and our agency business delivered
strong double-digit VONB growth driven by increased active agent productivity levels and higher average case
sizes. We extended our longstanding relationship with BCA in February 2017, allowing us to broaden our access
to BCA’s customers. In 2017 we delivered double-digit VONB growth with BCA from expanding our product
range and focusing on recruitment of in-branch insurance specialists. We also launched direct sales operations
to customers of BCA during the year.
Korea: Our Korean business delivered excellent VONB growth in 2017. VONB margin was higher, mainly from a
positive shift in product mix. Our direct business delivered an excellent performance, as we continued to engage
with both new and existing partners to improve sales efficiency. Agency reported solid VONB growth, following
the launch of new protection products and our focus on quality recruitment to grow an efficient and productive
agency distribution. We have also entered into a new strategic partnership with SK Group. AIA Korea will offer
protection products, including AIA Vitality, to SK Telecom, the leading telecommunications service provider
with more than 30 million customers.
Philippines: AIA’s business in the Philippines delivered strong double-digit VONB growth across both our
agency and bancassurance channels. Our focus on quality recruitment led to a 24 per cent increase in the
number of active new agents compared with 2016. Our joint venture with BPI continued to be the market leader
in bancassurance with VONB growth from an increase in the number of in-branch insurance specialists and
more efficient new lead generation. AIA Vitality membership has grown significantly following its integration
into our bestselling products in both the agency and bancassurance channels.
Sri Lanka: Our Sri Lankan business delivered a strong performance in 2017 as we continued to execute our
Premier Agency strategy. We launched new products during the year, further strengthening our position within
the protection and retirement savings market. The launch of our new long-term strategic partnership with DFCC
Bank has been completed with a full roll-out across all of its branches in the country.
Taiwan: AIA Taiwan delivered excellent VONB growth in 2017 from our multichannel partnership distribution.
Our direct channel benefited from double-digit growth in our number of telesales representatives and VONB
from our bancassurance and broker businesses grew significantly, as a result of successful new product
launches with our strategic partners in Taiwan.
Vietnam: Vietnam extended its strong track record and once again delivered excellent VONB growth in 2017.
Strong recruitment continued to drive active new agent growth with an increase of 28 per cent compared with
2016 while VONB margin increased as a result of a higher proportion of protection riders within the product
mix. We also broadened our product range with the launch of our new unit-linked products and first-to-market
early critical illness waiver of premium rider, and expanded our partnership distribution capabilities through
the addition of four new bancassurance agreements including an exclusive partnership with VPBank in the
second half.
Notes:Throughout the Distribution section:
VONB and VONB margin by distribution channel are based on local statutory reserving and capital requirements and exclude pension business.
Throughout the Geographical Markets section:
(1) VONB figures shown in the tables are based on local statutory reserving and capital requirements and include pension business.
(2) VONB margin excludes pension business to be consistent with the definition of ANP used within the calculation.

035
REGULATORY AND INTERNATIONAL DEVELOPMENTS
Internationally, the regulatory environment facing life insurers has continued to evolve. In particular, the
International Association of Insurance Supervisors (IAIS) continues a multi-year review of certain Insurance
Core Principles with the longer-term aim of developing and implementing an updated common framework for
the international regulation of insurance companies.
Regulators across AIA’s span of operations continue a variety of initiatives intended to align their respective
regulatory frameworks with the broad principles recommended by the IAIS. AIA continues to be involved in
these initiatives across the region, and is an active participant in the international industry dialogue on a host of
relevant issues, including formulation by the IAIS of an insurance capital standard (ICS). Field testing for the ICS
is expected to be completed in 2019 with implementation of the ICS to be conducted in two phases. Under the
first phase, ICS will be used for confidential reporting to group-wide supervisors in a monitoring period lasting
five years. The second phase will be implementation of the ICS as a group-wide prescribed capital requirement.
In particular in 2016, Bermuda’s prudential framework for insurance was deemed to be equivalent to the
regulatory standards applied to European insurers in accordance with the requirements of the Solvency II
Directive. Under the enhanced commercial prudential return regime, the Bermuda Monetary Authority has
instituted a number of changes to its statutory and prudential reporting requirements, including the need for
commercial insurers to prepare an economic balance sheet. These new regulatory requirements are first applied
to AIA’s financial year ended 30 November 2017 and AIA is participating in the development and refinement of
these initiatives.
In Hong Kong, the HKIA, being a statutory body established under the Insurance Companies (Amendment)
Ordinance 2015, replaced the Office of the Commissioner of Insurance as the regulator of insurance companies
with effect from 26 June 2017. It is anticipated that the HKIA will directly regulate intermediaries within two
years. A multi-year consultation process is also underway towards the development of a risk-based capital
regime for Hong Kong insurers. As previously disclosed, AIA is closely and constructively engaged in these
developments.
On 16 May 2017, the HKIA and the China Insurance Regulatory Commission (CIRC) signed the Equivalence
Assessment Framework Agreement on Solvency Regulatory Regime under which the HKIA and the CIRC
agreed to conduct an assessment that the insurance solvency regime of the Mainland and Hong Kong would
be equivalent. As no implementing procedures for equivalency were in place for Hong Kong as of 30 November
2017, there was no change to the solvency requirements under the HKIO.
On 18 May 2017, the International Accounting Standards Board (IASB) published International Financial
Reporting Standard (IFRS) 17, Insurance Contracts (previously IFRS 4 Phase II) which will replace the current
IFRS 4, Insurance Contracts. IFRS 17 includes some fundamental differences to current accounting in both
insurance contract measurement and profit recognition. On 12 December 2017, the Hong Kong Institute of
Certified Public Accountants (HKICPA) approved the issuance of Hong Kong Financial Reporting Standard
(HKFRS) 17, Insurance Contracts. The Group is in the midst of conducting a detailed assessment of the new
standards. The standards are mandatorily effective for financial periods beginning on or after 1 January 2021.

036
CHANGE OF FINANCIAL YEAR-END DATE
The Board has resolved to change the Company’s financial year-end date from 30 November to 31 December. Accordingly, the next financial year-end date of the Company will be 31 December 2018 and the next audited financial statements of the Group will cover a 13-month period from 1 December 2017 to 31 December 2018.
REASONS FOR THE CHANGE
The Company has operated with a November year-end since its IPO in 2010 based in large measure on its pre-IPO history. The Group operates in 18 markets in Asia-Pacific and the majority of its entities require a December year-end for local regulatory purposes. Accordingly, the Board believes that the year-end change will increase efficiencies and reduce the complexities and risks associated with different financial reporting year-ends applicable to different Group entities.
In addition to the benefits to be derived from operational efficiencies, the change in year-end should facilitate comparison between the Company and its large international insurance peers which likewise operate with a December year-end. The calendar year-end is also aligned with the basis upon which insurance market information is produced for the public by regulators, including the HKIA. Further, the Board believes that the year-end change will promote better operational alignment in terms of planning and reporting with business partners which operate on a December year-end cycle.
WAIVER FROM STRICT COMPLIANCE WITH RULES 13.48(1) AND 13.49(6) OF THE LISTING RULES
In accordance with Rule 13.48(1) and Rule 13.49(6) of the Listing Rules, the Company would be required to send its interim report to its shareholders not later than three months and publish its preliminary interim results announcement not later than two months, respectively, after the end of the first six months of the financial year. As a result of the change of the Company’s financial year-end date from 30 November to 31 December, the Company’s 2018 interim results will cover a period of seven months from 1 December 2017 to 30 June 2018 (“Extended 2018 Interim Results”). The Hong Kong Stock Exchange has granted the Company a waiver from strict compliance with Rule 13.48(1) and Rule 13.49(6) of the Listing Rules in respect of the timing to release the Company’s preliminary interim results announcement and the interim report for the Extended 2018 Interim Results. Pursuant to the waiver, the Company will publish its preliminary announcement for the Extended 2018 Interim Results on or before 31 August 2018 and send its interim report covering the Extended 2018 Interim Results to its shareholders on or before 30 September 2018. The 2018 interim dividend is expected to be determined by the Board in late August 2018 and further details will be set out in the preliminary announcement for the Extended 2018 Interim Results.
The Board, to the best of its knowledge and belief, does not foresee any material adverse impact on the financial position of the Group as a result of the year-end change and there are no other significant matters that need to be brought to the attention of holders of securities of the Company in relation thereto.
SUBSEQUENT FINANCIAL REPORTING
Following the year-end change, the deadlines for publication and despatch of the consolidated financial statements of the Group with respect to the following financial periods will be as follows:
Deadline for publication of
results announcement
Deadline for despatch of
financial report
Unaudited interim results for the seven months ending 30 June 2018
31 August 2018 30 September 2018
Audited annual results for the thirteen months ending 31 December 2018
31 March 2019 30 April 2019

037
INDEPENDENT AUDITOR’S REPORT
TO THE SHAREHOLDERS OF AIA GROUP LIMITED
(incorporated in Hong Kong with limited liability)
Opinion
What we have audited
The consolidated financial statements of AIA Group Limited (the “Company”) and its subsidiaries
(the “Group”) set out on pages 44 to 154, which comprise:
• the consolidated statement of financial position as at 30 November 2017;
• the consolidated income statement for the year then ended;
• the consolidated statement of comprehensive income for the year then ended;
• the consolidated statement of changes in equity for the year then ended;
• the consolidated statement of cash flows for the year then ended; and
• the notes to the consolidated financial statements, which include a summary of significant
accounting policies.
Our opinion
In our opinion, the consolidated financial statements give a true and fair view of the consolidated
financial position of the Group as at 30 November 2017, and of its consolidated financial
performance and its consolidated cash flows for the year then ended in accordance with Hong
Kong Financial Reporting Standards (“HKFRSs”) issued by the Hong Kong Institute of Certified
Public Accountants (“HKICPA”) and with International Financial Reporting Standards (“IFRSs”)
issued by the International Accounting Standards Board (“IASB”) and have been properly prepared
in compliance with the Hong Kong Companies Ordinance.
Basis for Opinion
We conducted our audit in accordance with Hong Kong Standards on Auditing (“HKSAs”) issued
by the HKICPA. Our responsibilities under those standards are further described in the Auditor’s
Responsibilities for the Audit of the Consolidated Financial Statements section of our report.
We believe that the audit evidence we have obtained is sufficient and appropriate to provide a
basis for our opinion.
IndependenceWe are independent of the Group in accordance with the HKICPA’s Code of Ethics for Professional
Accountants (“the Code”), and we have fulfilled our other ethical responsibilities in accordance
with the Code.
FINANCIAL STATEMENTS

038
Key Audit Matters
Key audit matters are those matters that, in our professional judgement, were of most significance
in our audit of the consolidated financial statements of the current period. These matters were
addressed in the context of our audit of the consolidated financial statements as a whole, and in
forming our opinion thereon, and we do not provide a separate opinion on these matters. The key
audit matters identified relate to the valuation of insurance contract liabilities and the amortisation
of deferred acquisition costs (“DAC”).
Key audit matter How our audit addressed the key audit matter
a) Valuation of insurance contract liabilities
Refer to the following notes in the consolidated financial statements: Note 2.4 for related accounting policies, Note 3 for critical accounting estimates and judgements, Note 25 and Note 27.
As at 30 November 2017 the Group has insurance contract liabilities of US$148,897 million.
The Director’s valuation of these insurance contract liabilities involves significant judgement about uncertain future outcomes, including mortality, morbidity, persistency, expense, investment return, valuation interest rates and provision for adverse deviation, as well as complex valuation methodologies.
The liabilities for traditional participating life assurance policies with discretionary participation features and non-participating life assurance policies, annuities and policies related to other protection products are determined by a net level premium valuation method using best estimate assumptions at policy inception adjusted for adverse deviation. These assumptions remain locked in thereafter, subject to meeting a liability adequacy test which compares the liabilities with a valuation on current best estimate assumptions.
We performed the following audit procedures to address this matter:
• We assessed the valuation methodologies used, identified changes in methodologies from previous valuation and assessed the reasonableness and impact for material changes identified, by applying our industry knowledge and experience to compare whether the methodologies and changes to those are consistent with recognised actuarial practices and expectation derived from market experience.
• We assessed the reasonableness of the key assumptions including those for mortality, morbidity, persistency, expense, investment return and valuation interest rates as well as provision for adverse deviation. Our assessment of the assumptions included:
• Obtaining an understanding of, and testing, the controls in place to determine the assumptions;
• Examining the approach used by management to derive the assumptions by applying our industry knowledge and experience;
039
Key audit matter How our audit addressed the key audit matter
a) Valuation of insurance contract liabilities (continued)
Insurance contract liabilities for universal life and unit-linked policies are based on the value of the account balance together with liabilities for unearned revenue and additional insurance benefits which are dependent upon operating assumptions and future investment return assumptions that are reassessed at each reporting period.
As part of our consideration of assumptions, we have focused on those insurance contracts where the assumptions are reassessed at each reporting date as well as how assumptions are set at policy inception dates.
We have, in relation to valuation methodologies used, focused on changes in methodologies from the previous valuation as well as methodologies applied to material new product types (as applicable).
• Challenging the key assumptions used by management against past experience, market observable data (as applicable) and our experience of market practice.
• We checked the calculation of the liability adequacy test and assessed the related results in order to ascertain whether the insurance contract liabilities used for the in-force business are adequate in the context of a valuation on current best estimate assumptions.
Based upon the work performed, we found the methodologies and assumptions used by management to be appropriate, including those used in the liability adequacy test.
b) Amortisation of DAC
Refer to the following notes in the consolidated financial statements: Note 2.4.1 for related accounting policies, Note 3.3 for critical accounting estimates and judgements and Note 18.
As at 30 November 2017, the Group has reported DAC of US$21,847 million.
The amortisation of DAC for traditional life insurance policies and annuities are amortised over the expected life of the policies as a constant percentage of premiums and involve less judgement by the Directors compared to universal life and unit-linked policies. Expected premiums are estimated at the date of policy issue.
We performed the following audit procedures to address this matter:
• Reviewed and challenged the basis of amortisation of DAC in the context of the Group’s accounting policy and the appropriateness of the assumptions used in determining the estimated gross profits used for amortisation for universal life and unit-linked policies. This included those for mortality, morbidity, persistency, expense and investment returns by comparing against past experience, market observable data (as applicable) and our experience of market practice.
Key Audit Matters (continued)
040
Key audit matter How our audit addressed the key audit matter
b) Amortisation of DAC (continued)
The amortisation of DAC for universal life and unit-linked policies involves greater judgement by the Directors. For these contracts, DAC is amortised over the expected life of the contracts based on a constant percentage of the present value of estimated gross profits expected to be realised over the life of the contract or on a straight-line basis. Estimated gross profits are revised regularly and significant judgement is exercised in making appropriate estimates of gross profits.
As part of our audit we have focused on DAC related to universal life and unit-linked policies where the assumptions are reassessed at each reporting date.
Based upon the work performed, we found the assumptions used in relation to the amortisation of DAC for universal life and unit-linked policies to be appropriate.
Other Information
The Directors of the Company are responsible for the other information. The other information
comprises the Group Chief Executive and President’s Report, Financial Review, Business Review,
Regulatory and International Developments, Supplementary Embedded Value Information and our
auditor’s report thereon and Glossary (but does not include the consolidated financial statements and
our auditor’s report thereon), which we obtained prior to the date of this auditor’s report, and the
Financial Highlights, Chairman’s Statement, Risk Management, Our People, Corporate Social
Responsibility, Statement of Directors’ Responsibilities, Board of Directors, Executive Committee,
Report of the Directors, Corporate Governance Report, Remuneration Report, Information for
Shareholders and Corporate Information, which are expected to be made available to us after that date.
Our opinion on the consolidated financial statements does not cover the other information and we
do not and will not express any form of assurance conclusion thereon.
In connection with our audit of the consolidated financial statements, our responsibility is to read
the other information identified above and, in doing so, consider whether the other information is
materially inconsistent with the consolidated financial statements or our knowledge obtained in
the audit or otherwise appears to be materially misstated.
If, based on the work we have performed on the other information that we obtained prior to the
date of this auditor’s report, we conclude that there is a material misstatement of this other
information, we are required to report that fact. We have nothing to report in this regard.
Key Audit Matters (continued)

041
Other Information (continued)
When we read the Financial Highlights, Chairman’s Statement, Risk Management, Our People,
Corporate Social Responsibility, Statement of Directors’ Responsibilities, Board of Directors,
Executive Committee, Report of the Directors, Corporate Governance Report, Remuneration
Report, Information for Shareholders and Corporate Information, if we conclude that there is a
material misstatement therein, we are required to communicate the matter to those charged with
governance and take appropriate action considering our legal rights and obligations.
Other Matter
The Group has prepared Supplementary Embedded Value Information as at and for the year
ended 30 November 2017 in accordance with the embedded value basis of preparation set out in
Sections 4 and 5 of the Supplementary Embedded Value Information, on which we issued a
separate auditor’s report to the Board of Directors of the Company dated 27 February 2018.
Responsibilities of Directors and Those Charged with Governance for the Consolidated
Financial Statements
The Directors of the Company are responsible for the preparation of the consolidated financial
statements that give a true and fair view in accordance with HKFRSs issued by the HKICPA, and
with IFRSs issued by the IASB and the Hong Kong Companies Ordinance, and for such internal
control as the Directors determine is necessary to enable the preparation of consolidated financial
statements that are free from material misstatement, whether due to fraud or error.
In preparing the consolidated financial statements, the Directors are responsible for assessing
the Group’s ability to continue as a going concern, disclosing, as applicable, matters related to
going concern and using the going concern basis of accounting unless the Directors either intend
to liquidate the Group or to cease operations, or have no realistic alternative but to do so.
Those charged with governance are responsible for overseeing the Group’s financial reporting
process.
Auditor’s Responsibilities for the Audit of the Consolidated Financial Statements
Our objectives are to obtain reasonable assurance about whether the consolidated financial
statements as a whole are free from material misstatement, whether due to fraud or error, and to
issue an auditor’s report that includes our opinion. We report our opinion solely to you, as a body,
in accordance with Section 405 of the Hong Kong Companies Ordinance and for no other purpose.
We do not assume responsibility towards or accept liability to any other person for the contents
of this report. Reasonable assurance is a high level of assurance, but is not a guarantee that an
audit conducted in accordance with HKSAs will always detect a material misstatement when it
exists. Misstatements can arise from fraud or error and are considered material if, individually or
in the aggregate, they could reasonably be expected to influence the economic decisions of users
taken on the basis of these consolidated financial statements.

042
Auditor’s Responsibilities for the Audit of the Consolidated Financial Statements
(continued)
As part of an audit in accordance with HKSAs, we exercise professional judgement and maintain
professional scepticism throughout the audit. We also:
• Identify and assess the risks of material misstatement of the consolidated financial statements,
whether due to fraud or error, design and perform audit procedures responsive to those risks,
and obtain audit evidence that is sufficient and appropriate to provide a basis for our opinion.
The risk of not detecting a material misstatement resulting from fraud is higher than for one
resulting from error, as fraud may involve collusion, forgery, intentional omissions,
misrepresentations, or the override of internal control.
• Obtain an understanding of internal control relevant to the audit in order to design audit
procedures that are appropriate in the circumstances, but not for the purpose of expressing an
opinion on the effectiveness of the Group’s internal control.
• Evaluate the appropriateness of accounting policies used and the reasonableness of
accounting estimates and related disclosures made by the Directors.
• Conclude on the appropriateness of the Directors’ use of the going concern basis of accounting
and, based on the audit evidence obtained, whether a material uncertainty exists related to
events or conditions that may cast significant doubt on the Group’s ability to continue as a
going concern. If we conclude that a material uncertainty exists, we are required to draw
attention in our auditor’s report to the related disclosures in the consolidated financial
statements or, if such disclosures are inadequate, to modify our opinion. Our conclusions are
based on the audit evidence obtained up to the date of our auditor’s report. However, future
events or conditions may cause the Group to cease to continue as a going concern.
• Evaluate the overall presentation, structure and content of the consolidated financial
statements, including the disclosures, and whether the consolidated financial statements
represent the underlying transactions and events in a manner that achieves fair presentation.
• Obtain sufficient appropriate audit evidence regarding the financial information of the entities
or business activities within the Group to express an opinion on the consolidated financial
statements. We are responsible for the direction, supervision and performance of the group
audit. We remain solely responsible for our audit opinion.

043
Auditor’s Responsibilities for the Audit of the Consolidated Financial Statements
(continued)
We communicate with those charged with governance regarding, among other matters, the
planned scope and timing of the audit and significant audit findings, including any significant
deficiencies in internal control that we identify during our audit.
We also provide those charged with governance with a statement that we have complied with
relevant ethical requirements regarding independence, and to communicate with them all
relationships and other matters that may reasonably be thought to bear on our independence, and
where applicable, related safeguards.
From the matters communicated with those charged with governance, we determine those
matters that were of most significance in the audit of the consolidated financial statements of the
current period and are therefore the key audit matters. We describe these matters in our auditor’s
report unless law or regulation precludes public disclosure about the matter or when, in extremely
rare circumstances, we determine that a matter should not be communicated in our report
because the adverse consequences of doing so would reasonably be expected to outweigh the
public interest benefits of such communication.
The engagement partner on the audit resulting in this independent auditor’s report is Lars
Christian Jordy Nielsen.
PricewaterhouseCoopers
Certified Public Accountants
Hong Kong
27 February 2018
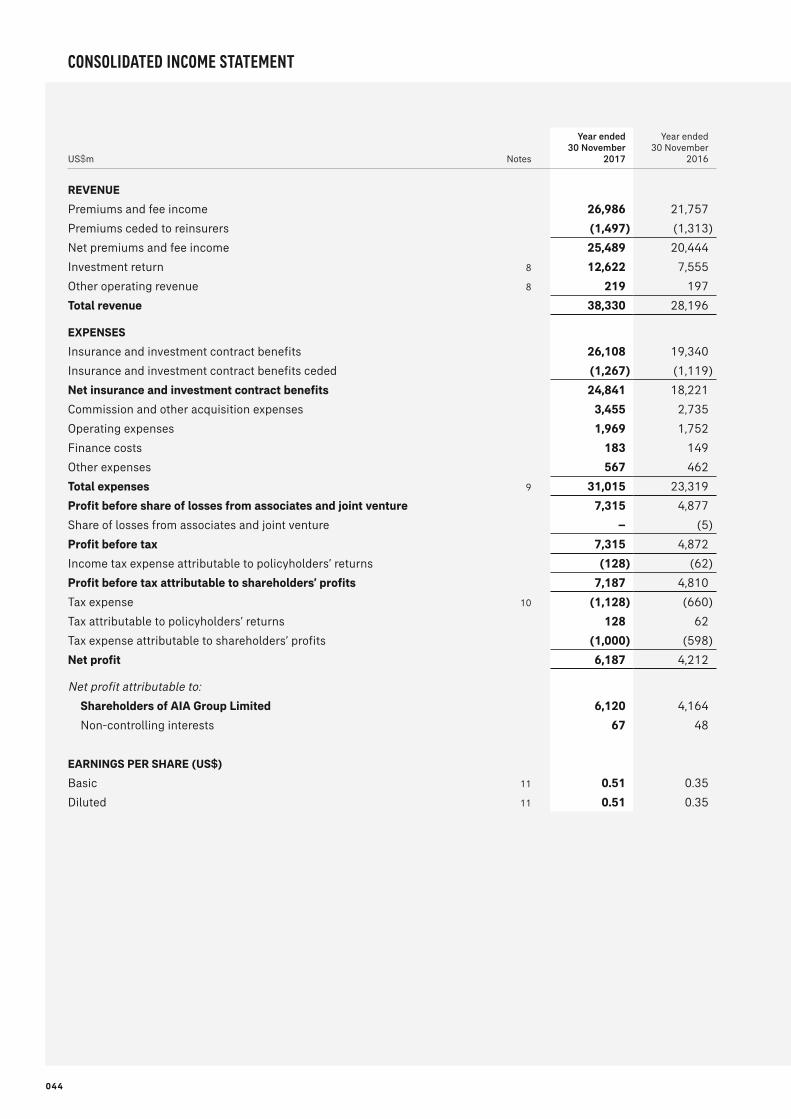
044
CONSOLIDATED INCOME STATEMENT
US$m Notes
Year ended30 November
2017
Year ended30 November
2016
REVENUE
Premiums and fee income 26,986 21,757
Premiums ceded to reinsurers (1,497) (1,313)
Net premiums and fee income 25,489 20,444
Investment return 8 12,622 7,555
Other operating revenue 8 219 197
Total revenue 38,330 28,196
EXPENSES
Insurance and investment contract benefits 26,108 19,340
Insurance and investment contract benefits ceded (1,267) (1,119)
Net insurance and investment contract benefits 24,841 18,221
Commission and other acquisition expenses 3,455 2,735
Operating expenses 1,969 1,752
Finance costs 183 149
Other expenses 567 462
Total expenses 9 31,015 23,319
Profit before share of losses from associates and joint venture 7,315 4,877
Share of losses from associates and joint venture – (5)
Profit before tax 7,315 4,872
Income tax expense attributable to policyholders’ returns (128) (62)
Profit before tax attributable to shareholders’ profits 7,187 4,810
Tax expense 10 (1,128) (660)
Tax attributable to policyholders’ returns 128 62
Tax expense attributable to shareholders’ profits (1,000) (598)
Net profit 6,187 4,212
Net profit attributable to:
Shareholders of AIA Group Limited 6,120 4,164
Non-controlling interests 67 48
EARNINGS PER SHARE (US$)
Basic 11 0.51 0.35
Diluted 11 0.51 0.35

045
CONSOLIDATED STATEMENT OF COMPREHENSIVE INCOME
US$m
Year ended30 November
2017
Year ended30 November
2016
Net profit 6,187 4,212
OTHER COMPREHENSIVE INCOME
Items that may be reclassified subsequently to profit or loss:
Fair value gains on available for sale financial assets (net of tax of: 2017: US$297m; 2016: US$8m) 1,197 869
Fair value (gains)/losses on available for sale financial assets transferred to income on disposal and impairment (net of tax of: 2017: US$19m; 2016: US$6m) (161) 2
Foreign currency translation adjustments 1,028 (412)
Cash flow hedges (11) 1
Share of other comprehensive (expense)/income from associates and joint venture (24) 43
Subtotal 2,029 503
Items that will not be reclassified subsequently to profit or loss:
Revaluation gains on property held for own use (net of tax of: 2017: US$(14)m; 2016: US$(66)m) 78 309
Effect of remeasurement of net liability of defined benefit schemes (net of tax of: 2017: nil; 2016: US$1m) 18 (21)
Subtotal 96 288
Total other comprehensive income 2,125 791
Total comprehensive income 8,312 5,003
Total comprehensive income attributable to:
Shareholders of AIA Group Limited 8,250 4,968
Non-controlling interests 62 35

046
CONSOLIDATED STATEMENT OF FINANCIAL POSITION
US$m Notes
As at 30 November
2017
As at 30 November
2016
ASSETS
Intangible assets 13 1,864 1,743
Investments in associates and joint venture 14 642 650
Property, plant and equipment 15 1,213 1,132
Investment property 16 4,365 3,910
Reinsurance assets 17 2,481 2,046
Deferred acquisition and origination costs 18 21,847 18,898
Financial investments: 19, 21
Loans and deposits 7,973 7,062
Available for sale
Debt securities 105,466 90,092
At fair value through profit or loss
Debt securities 25,702 23,526
Equity securities 36,716 30,211
Derivative financial instruments 20 363 107
176,220 150,998
Deferred tax assets 10 9 7
Current tax recoverable 131 59
Other assets 22 4,630 3,989
Cash and cash equivalents 24 2,289 1,642
Total assets 215,691 185,074
LIABILITIES
Insurance contract liabilities 25 148,897 128,186
Investment contract liabilities 26 8,082 7,028
Borrowings 28 3,958 3,460
Obligations under repurchase agreements 29 1,883 1,984
Derivative financial instruments 20 361 644
Provisions 31 234 253
Deferred tax liabilities 10 3,595 3,276
Current tax liabilities 421 210
Other liabilities 32 5,888 4,723
Total liabilities 173,319 149,764

047
CONSOLIDATED STATEMENT OF FINANCIAL POSITION
US$m Notes
As at 30 November
2017
As at 30 November
2016
EQUITY
Share capital 33 14,065 13,998
Employee share-based trusts 33 (297) (351)
Other reserves 33 (11,948) (11,954)
Retained earnings 34,087 29,334
Fair value reserve 33 6,336 5,352
Foreign currency translation reserve 33 (751) (1,812)
Property revaluation reserve 33 527 449
Others (25) (32)
Amounts reflected in other comprehensive income 6,087 3,957
Total equity attributable to:
Shareholders of AIA Group Limited 41,994 34,984
Non-controlling interests 34 378 326
Total equity 42,372 35,310
Total liabilities and equity 215,691 185,074

048
CONSOLIDATED STATEMENT OF CHANGES IN EQUITY
Other comprehensive income
US$m NoteShare
capital
Employee share-based trusts
Other reserves
Retained earnings
Fair value
reserve
Foreign currency
translation reserve
Property revaluation
reserve Others
Non-controlling
interestsTotal
equity
Balance at
1 December 2016 13,998 (351) (11,954) 29,334 5,352 (1,812) 449 (32) 326 35,310
Net profit – – – 6,120 – – – – 67 6,187
Fair value gains/(losses) on available for sale financial assets – – – – 1,202 – – – (5) 1,197
Fair value gains on available for sale financial assets transferred to income on disposal – – – – (161) – – – – (161)
Foreign currency translation adjustments – – – – – 1,028 – – – 1,028
Cash flow hedges – – – – – – – (11) – (11)
Share of other comprehensive (expense)/income from associates and joint venture – – – – (57) 33 – – – (24)
Revaluation gains on property held for own use – – – – – – 78 – – 78
Effect of remeasurement of net liability of defined benefit schemes – – – – – – – 18 – 18
Total comprehensive
income for the year – – – 6,120 984 1,061 78 7 62 8,312
Dividends 12 – – – (1,376) – – – – (14) (1,390)
Shares issued under share option scheme and agency share purchase plan 67 – – – – – – – – 67
Capital contributions from non-controlling interests – – – – – – – – 4 4
Share-based compensation – – 79 – – – – – – 79
Purchase of shares held by employee share-based trusts – (10) – – – – – – – (10)
Transfer of vested shares from employee share-based trusts – 64 (64) – – – – – – –
Others – – (9) 9 – – – – – –
Balance at
30 November 2017 14,065 (297) (11,948) 34,087 6,336 (751) 527 (25) 378 42,372
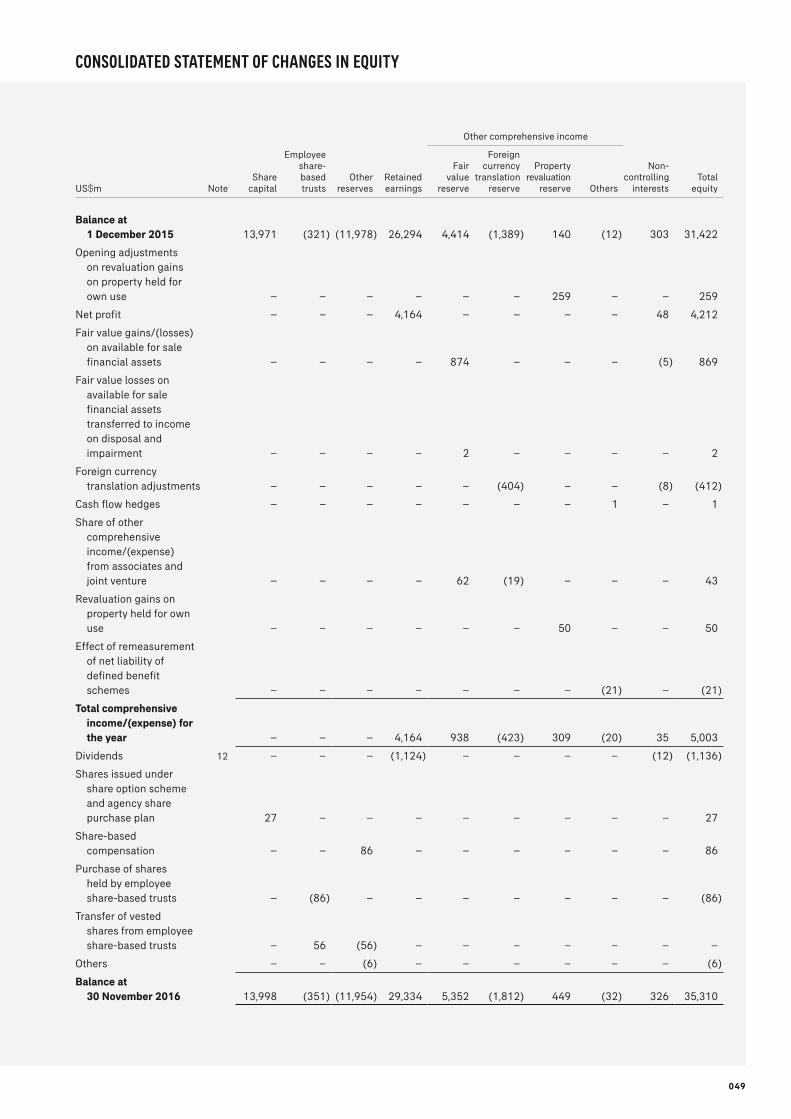
049
CONSOLIDATED STATEMENT OF CHANGES IN EQUITY
Other comprehensive income
US$m NoteShare
capital
Employee share-based trusts
Other reserves
Retained earnings
Fair value
reserve
Foreign currency
translation reserve
Property revaluation
reserve Others
Non-controlling
interestsTotal
equity
Balance at
1 December 2015 13,971 (321) (11,978) 26,294 4,414 (1,389) 140 (12) 303 31,422
Opening adjustments on revaluation gains on property held for own use – – – – – – 259 – – 259
Net profit – – – 4,164 – – – – 48 4,212
Fair value gains/(losses) on available for sale financial assets – – – – 874 – – – (5) 869
Fair value losses on available for sale financial assets transferred to income on disposal and impairment – – – – 2 – – – – 2
Foreign currency translation adjustments – – – – – (404) – – (8) (412)
Cash flow hedges – – – – – – – 1 – 1
Share of other comprehensive income/(expense) from associates and joint venture – – – – 62 (19) – – – 43
Revaluation gains on property held for own use – – – – – – 50 – – 50
Effect of remeasurement of net liability of defined benefit schemes – – – – – – – (21) – (21)
Total comprehensive
income/(expense) for
the year – – – 4,164 938 (423) 309 (20) 35 5,003
Dividends 12 – – – (1,124) – – – – (12) (1,136)
Shares issued under share option scheme and agency share purchase plan 27 – – – – – – – – 27
Share-based compensation – – 86 – – – – – – 86
Purchase of shares held by employee share-based trusts – (86) – – – – – – – (86)
Transfer of vested shares from employee share-based trusts – 56 (56) – – – – – – –
Others – – (6) – – – – – – (6)
Balance at
30 November 2016 13,998 (351) (11,954) 29,334 5,352 (1,812) 449 (32) 326 35,310

050
CONSOLIDATED STATEMENT OF CASH FLOWS
US$m Notes
Year ended30 November
2017
Year ended30 November
2016
CASH FLOWS FROM OPERATING ACTIVITIES
Profit before tax 7,315 4,872
Adjustments for:
Financial investments (18,413) (13,438)
Insurance and investment contract liabilities 14,312 11,794
Obligations under repurchase agreements 29 (219) (1,019)
Other non-cash operating items, including investment income and the effect of exchange rate changes on certain operating items (7,242) (6,164)
Operating cash items:
Interest received 5,627 5,261
Dividends received 703 645
Interest paid (50) (39)
Tax paid (582) (548)
Net cash provided by operating activities 1,451 1,364
CASH FLOWS FROM INVESTING ACTIVITIES
Payments for intangible assets 13 (151) (64)
(Contribution to)/distribution or dividend from associates and joint venture 14 (6) 2
Proceeds for sale of property, plant and equipment 15 20 –
Payments for investment property and property, plant and equipment 15, 16 (104) (181)
Payments for increase in interest of an associate – (310)
Net cash used in investing activities (241) (553)
CASH FLOWS FROM FINANCING ACTIVITIES
Issuance of medium-term notes 28 497 733
Interest paid on medium-term notes (136) (108)
Repayment of medium-term notes 28 – (150)
Net repayment of other borrowings 28 (1) (323)
Capital contributions from non-controlling interests 4 –
Dividends paid during the year (1,390) (1,136)
Purchase of shares held by employee share-based trusts (10) (86)
Shares issued under share option scheme and agency share purchase plan 67 27
Net cash used in financing activities (969) (1,043)
Net increase/(decrease) in cash and cash equivalents 241 (232)
Cash and cash equivalents at beginning of the financial year 1,482 1,750
Effect of exchange rate changes on cash and cash equivalents 64 (36)
Cash and cash equivalents at end of the financial year 1,787 1,482

051
CONSOLIDATED STATEMENT OF CASH FLOWS
Cash and cash equivalents in the above consolidated statement of cash flows can be further analysed as follows:
US$m Note
Year ended30 November
2017
Year ended30 November
2016
Cash and cash equivalents in the consolidated statement of financial position 24 2,289 1,642
Bank overdrafts (502) (160)
CASH AND CASH EQUIVALENTS IN THE CONSOLIDATED STATEMENT
OF CASH FLOWS 1,787 1,482

052
NOTES TO THE CONSOLIDATED FINANCIAL STATEMENTS AND SIGNIFICANT ACCOUNTING POLICIES
1. CORPORATE INFORMATION
AIA Group Limited (the “Company”) was established as a company with limited liability incorporated in Hong Kong on 24
August 2009. The address of its registered office is 35/F, AIA Central, No. 1 Connaught Road Central, Hong Kong.
AIA Group Limited is listed on the Main Board of The Stock Exchange of Hong Kong Limited under the stock code “1299”
with American Depositary Receipts (Level 1) being traded on the over-the-counter market (ticker symbol: “AAGIY”).
AIA Group Limited and its subsidiaries (collectively “AIA” or the “Group”) is a life insurance based financial services provider
operating in 18 markets throughout the Asia-Pacific region. The Group’s principal activity is the writing of life insurance
business, providing life insurance, accident and health insurance and savings plans throughout Asia, and distributing
related investment and other financial services products to its customers.
2. SIGNIFICANT ACCOUNTING POLICIES
2.1 Basis of preparation and statement of compliance
The consolidated financial statements have been prepared in accordance with all applicable Hong Kong Financial
Reporting Standards (HKFRS), International Financial Reporting Standards (IFRS) and the Hong Kong Companies
Ordinance. IFRS is substantially consistent with HKFRS and the accounting policy selections that the Group has made in
preparing these consolidated financial statements are such that the Group is able to comply with both HKFRS and IFRS.
References to IFRS, International Accounting Standards (IAS) and Interpretations developed by the IFRS Interpretations
Committee (IFRS IC) in these consolidated financial statements should be read as referring to the equivalent HKFRS, Hong
Kong Accounting Standards (HKAS) and Hong Kong (IFRIC) Interpretations (HK(IFRIC) – Int) as the case may be.
Accordingly, there are not any differences of accounting practice between HKFRS and IFRS affecting these consolidated
financial statements.
The consolidated financial statements have been approved for issue by the Board of Directors on 27 February 2018.
The consolidated financial statements have been prepared using the historical cost convention, as modified by the
revaluation of available for sale financial assets, certain financial assets and liabilities designated at fair value through
profit or loss, derivative financial instruments, property held for own use and investment properties, all of which are carried
at fair value.
Items included in the consolidated financial statements of each of the Group’s entities are measured in the currency of the
primary economic environment in which that entity operates (the functional currency). The Company’s functional currency
and the presentation currency of the Company and the Group is the US dollar. The consolidated financial statements are
presented in millions of US dollars (US$m) unless otherwise stated.
The accounting policies adopted are consistent with those of the previous financial year, except as described as follows.
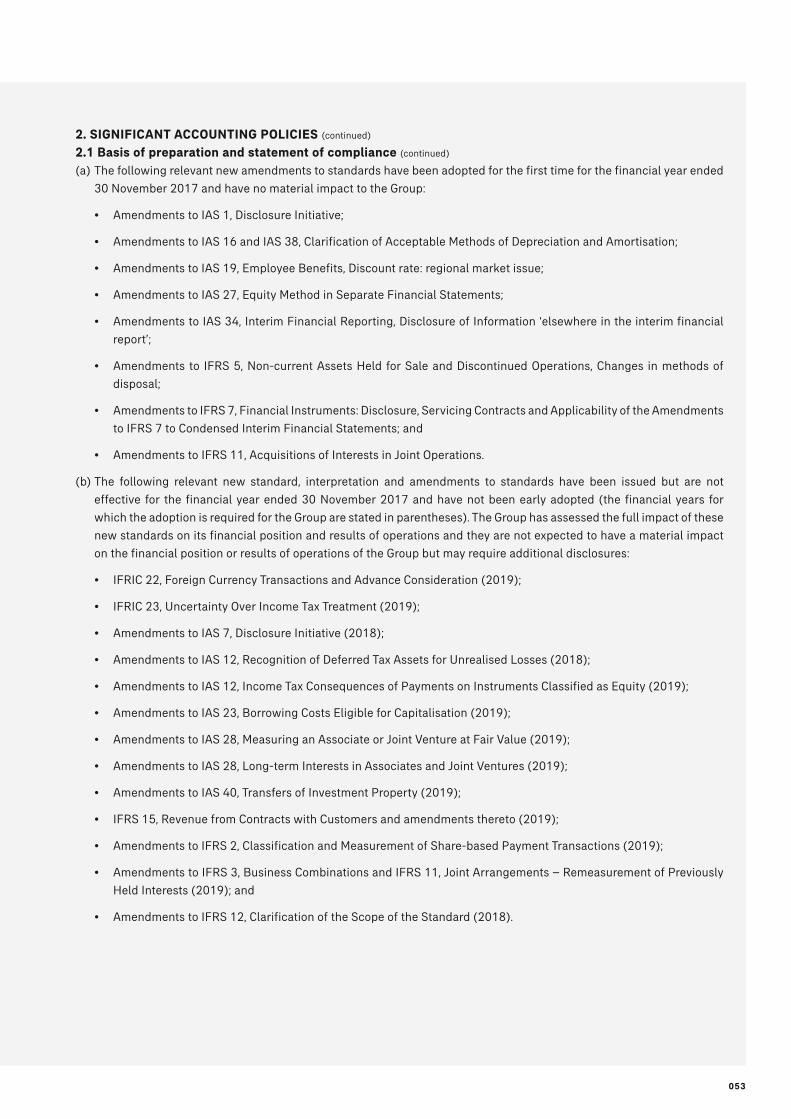
053
2. SIGNIFICANT ACCOUNTING POLICIES (continued)
2.1 Basis of preparation and statement of compliance (continued)
(a) The following relevant new amendments to standards have been adopted for the first time for the financial year ended
30 November 2017 and have no material impact to the Group:
• Amendments to IAS 1, Disclosure Initiative;
• Amendments to IAS 16 and IAS 38, Clarification of Acceptable Methods of Depreciation and Amortisation;
• Amendments to IAS 19, Employee Benefits, Discount rate: regional market issue;
• Amendments to IAS 27, Equity Method in Separate Financial Statements;
• Amendments to IAS 34, Interim Financial Reporting, Disclosure of Information ‘elsewhere in the interim financial
report’;
• Amendments to IFRS 5, Non-current Assets Held for Sale and Discontinued Operations, Changes in methods of
disposal;
• Amendments to IFRS 7, Financial Instruments: Disclosure, Servicing Contracts and Applicability of the Amendments
to IFRS 7 to Condensed Interim Financial Statements; and
• Amendments to IFRS 11, Acquisitions of Interests in Joint Operations.
(b) The following relevant new standard, interpretation and amendments to standards have been issued but are not
effective for the financial year ended 30 November 2017 and have not been early adopted (the financial years for
which the adoption is required for the Group are stated in parentheses). The Group has assessed the full impact of these
new standards on its financial position and results of operations and they are not expected to have a material impact
on the financial position or results of operations of the Group but may require additional disclosures:
• IFRIC 22, Foreign Currency Transactions and Advance Consideration (2019);
• IFRIC 23, Uncertainty Over Income Tax Treatment (2019);
• Amendments to IAS 7, Disclosure Initiative (2018);
• Amendments to IAS 12, Recognition of Deferred Tax Assets for Unrealised Losses (2018);
• Amendments to IAS 12, Income Tax Consequences of Payments on Instruments Classified as Equity (2019);
• Amendments to IAS 23, Borrowing Costs Eligible for Capitalisation (2019);
• Amendments to IAS 28, Measuring an Associate or Joint Venture at Fair Value (2019);
• Amendments to IAS 28, Long-term Interests in Associates and Joint Ventures (2019);
• Amendments to IAS 40, Transfers of Investment Property (2019);
• IFRS 15, Revenue from Contracts with Customers and amendments thereto (2019);
• Amendments to IFRS 2, Classification and Measurement of Share-based Payment Transactions (2019);
• Amendments to IFRS 3, Business Combinations and IFRS 11, Joint Arrangements – Remeasurement of Previously
Held Interests (2019); and
• Amendments to IFRS 12, Clarification of the Scope of the Standard (2018).

054
2. SIGNIFICANT ACCOUNTING POLICIES (continued)
2.1 Basis of preparation and statement of compliance (continued)
(c) The following relevant new standards and requirements have been issued but are not effective for the financial year
ended 30 November 2017 and have not been early adopted:
• IFRS 9, Financial Instruments, addresses the classification, measurement and recognition of financial assets and
financial liabilities. IFRS 9 requires financial assets to be classified into separate measurement categories: those
measured as at fair value with changes either recognised in profit or loss or in other comprehensive income and
those measured at amortised cost. The determination is made at initial recognition depending on the entity’s
business model for managing its financial instruments and the contractual cash flow characteristics of the
instrument. In addition, a revised expected credit losses model will replace the incurred loss impairment model in
IAS 39. The Group is yet to fully assess the impact of the standard on its financial position and results of operations.
For financial liabilities, the standard retains most of the IAS 39 requirements. The main change is that, in cases
where the fair value option is taken for financial liabilities, part of the fair value change due to an entity’s own credit
risk is recorded in other comprehensive income rather than profit or loss, unless this creates an accounting
mismatch. In addition, the new standard revises the hedge accounting model to more closely align with the entity’s
risk management strategies. The IASB made further changes to two areas of IFRS 9. Financial assets containing
prepayment features with negative compensation can be measured at amortised cost or at fair value through other
comprehensive income if the cash flow represents solely payments of principal and interest. Non-substantial
modifications or exchange of financial liabilities that do not result in derecognition will be required to be recognised
in profit or loss. The Group is yet to fully assess the impact of the above new requirements and changes, but the
impact is not expected to be material.
The standard is mandatorily effective for financial periods beginning on or after 1 January 2018 (except for
prepayment features with negative compensation and modifications or exchange of financial liabilities that do not
result in derecognition which will become effective for financial periods beginning on or after 1 January 2019), but
the Group qualifies for a temporary exemption as explained below.
• On 12 September 2016, the IASB issued amendments to IFRS 4, Insurance Contracts, Applying IFRS 9 Financial
Instruments with IFRS 4, which provides two alternative measures to address the different effective dates of IFRS
9 and IFRS 17, Insurance Contracts. These measures include a temporary option for companies whose activities are
predominantly connected with insurance to defer the effective date of IFRS 9 until the earlier of the effective date
of IFRS 17 and the financial reporting periods beginning on or after 1 January 2021, as well as an approach that
allows an entity to remove from profit or loss the effects of certain accounting mismatches that may occur before
IFRS 17 is applied. Based on the amendments to IFRS 4, the Group is eligible for and will elect to apply the temporary
option to defer the effective date of IFRS 9 in order to implement the changes in parallel with IFRS 17, Insurance
Contracts.
• IFRS 17, Insurance Contracts (previously IFRS 4 Phase II) will replace the current IFRS 4, Insurance Contracts. IFRS
17 includes some fundamental differences to current accounting in both insurance contract measurement and
profit recognition. The general model is based on a discounted cash flow model with a risk adjustment and deferral
of unearned profits. A separate approach applies to insurance contracts that are linked to returns on underlying
items and meet certain requirements. Additionally, IFRS 17 requires more granular information and a new
presentation format for the statement of comprehensive income as well as extensive disclosures. On 12 December
2017, the Hong Kong Institute of Certified Public Accountants (“HKICPA”) approved the issuance of HKFRS 17,
Insurance Contracts. The Group is in the midst of conducting a detailed assessment of the new standards. The
standards are mandatorily effective for financial periods beginning on or after 1 January 2021.

055
2. SIGNIFICANT ACCOUNTING POLICIES (continued)
2.1 Basis of preparation and statement of compliance (continued)
(c) The following relevant new standards and requirements have been issued but are not effective for the financial year
ended 30 November 2017 and have not been early adopted: (continued)
• IFRS 16, Leases, sets out the principles for the recognition, measurement, presentation and disclosure of leases.
The standard introduces a single lessee accounting model and requires a lessee to recognise assets and liabilities
for all leases with a term of more than 12 months, unless the underlying asset is of low value. A lessee is required
to recognise a right-of-use asset representing its right to use the underlying leased asset and a lease liability
representing its obligation to make lease payments. IFRS 16 substantially carries forward the lessor accounting
requirements in IAS 17. Accordingly, a lessor continues to classify its leases as operating leases or finance leases,
and to account for those two types of leases differently. The Group is yet to assess the full impact of the standard on
its financial position and results of operations. The standard is mandatorily effective for financial periods beginning
on or after 1 January 2019.
The significant accounting policies adopted in the preparation of the Group’s consolidated financial statements are set out
below. These policies have been applied consistently in all periods presented.
2.2 Operating profit
The long-term nature of much of the Group’s operations means that, for management’s decision-making and internal
performance management purposes, the Group evaluates its results and its operating segments using a financial
performance measure referred to as “operating profit”. Operating profit includes among others the expected long-term
investment returns for investments in equities and real estate based on the assumptions applied by the Group in the
Supplementary Embedded Value Information. The Group defines operating profit after tax as net profit excluding the
following non-operating items:
• short-term fluctuations between expected and actual investment returns related to equities and real estate;
• other investment return (including short-term fluctuations due to market factors); and
• other significant items that management considers to be non-operating income and expenses.
The Group considers that the presentation of operating profit enhances the understanding and comparability of its
performance and that of its operating segments. The Group considers that trends can be more clearly identified without
the fluctuating effects of these non-operating items, many of which are largely dependent on market factors.
Operating profit is provided as additional information to assist in the comparison of business trends in different reporting
periods on a consistent basis and enhance overall understanding of financial performance.

056
2. SIGNIFICANT ACCOUNTING POLICIES (continued)
2.3 Basis of consolidation
Subsidiaries
Subsidiaries are all entities (including structured entities) over which the Group has control. A structured entity is an entity
that has been designed so that voting or similar rights are not the dominant factor in deciding who controls the entity, such
as when any voting rights relate to administrative tasks only, and the relevant activities are directed by means of contractual
arrangements. The Group has determined that the investment funds and structured securities, such as collateralised debt
obligations, mortgage-backed securities and other asset-backed securities that the Group has interest are structured
entities.
The Group controls an entity when the Group is exposed to, or has rights to, variable returns from its involvement with the
entity and has the ability to affect those returns through its power over the entity. Subsidiaries are consolidated from the
date on which control is transferred to the Group and are excluded from consolidation from the date at which the Group no
longer has control. Intercompany transactions are eliminated.
The Group utilises the acquisition method of accounting to account for the acquisition of subsidiaries, unless the acquisition
forms part of the Group reorganisation of entities under common control. Under this method, the cost of an acquisition is
measured as the fair value of consideration payable, shares issued or liabilities assumed at the date of acquisition. The
excess of the cost of acquisition over the fair value of the net assets of the subsidiary acquired is recorded as goodwill (see
2.10 below). The Group recognises, separately from goodwill, the identifiable assets acquired, the liabilities assumed and
any non-controlling interest in the subsidiary. Any surplus of the acquirer’s interest in the subsidiary’s net assets over the
cost of acquisition is credited to the consolidated income statement.
The consolidated financial statements of the Group include the assets, liabilities and results of the Company and subsidiaries
in which AIA Group Limited has a controlling interest, using accounts drawn up to the reporting date.
Investment funds
Investment funds in which the Group has interests and power to direct their relevant activities that affect the return of the
funds are consolidated in the financial statements. In conducting the assessment, the Group considers substantive
contractual rights as well as de facto control. De facto control of an entity may arise from circumstances where the Group
does not have more than 50% of the voting power but it has the practical ability to direct the relevant activities of the entity.
If the Group has power to remove or control over the party having the ability to direct the relevant activities of the fund
based on the facts and circumstances and that the Group has exposure to variable returns of the investment funds, they
are consolidated. Variable returns include both rights to the profits or distributions as well as the obligation to absorb
losses of the investees.
Employee share-based trusts
Trusts are set up to acquire shares of the Company for distribution to participants in future periods through the share-
based compensation schemes. The consolidation of these trusts is evaluated in accordance with IFRS 10; where the Group
is deemed to control the trusts, they are consolidated. Shares acquired by the trusts to the extent not provided to the
participants upon vesting are carried at cost and reported as “employee share-based trusts” in the consolidated statement
of financial position, and as a deduction from the equity in the consolidated statement of changes in equity.

057
2. SIGNIFICANT ACCOUNTING POLICIES (continued)
2.3 Basis of consolidation (continued)
Non-controlling interests
Non-controlling interests are presented within equity except when they arise through the minority’s interest in puttable
liabilities such as the unit holders’ interest in consolidated investment funds, when they are recognised as a liability,
reflecting the net assets of the consolidated entity.
Acquisitions and disposals of non-controlling interests, except when they arise through the minority’s interest in puttable
liabilities, are treated as transactions between equity holders. As a result, any difference between the acquisition cost or
sale price of the non-controlling interest and the carrying value of the non-controlling interest is recognised as an increase
or decrease in equity.
Associates and joint ventures
Associates are entities over which the Group has significant influence, but which it does not control. Generally, it is
presumed that the Group has significant influence if it has between 20 per cent and 50 per cent of voting rights. Joint
ventures are entities whereby the Group and other parties undertake an economic activity which is subject to joint control
arising from a contractual agreement.
Gains on transactions between the Group and its associates and joint ventures are eliminated to the extent of the Group’s
interest in the associates and joint ventures. Losses are also eliminated, unless the transaction provides evidence of an
impairment of an asset transferred between entities.
Investments in associates and joint ventures are accounted for using the equity method of accounting. Under this method,
the cost of the investment in an associate or joint venture, together with the Group’s share of that entity’s post-acquisition
changes to equity, is included as an asset in the consolidated statement of financial position. Cost includes goodwill arising
on acquisition. The Group’s share of post-acquisition profits or losses is recognised in the consolidated income statement
and its share of post-acquisition movement in equity is recognised in other comprehensive income. Equity accounting is
discontinued when the Group no longer has significant influence over the investment. If the Group’s share of losses in an
associate or joint venture equals or exceeds its interest in the undertaking, additional losses are provided for, and a liability
recognised, only to the extent that the Group has incurred legal or constructive obligations or made payments on behalf of
the associate or joint venture. The Group also accounts for investments in joint ventures that are subject to joint control
using the equity method of accounting.
The Company’s investments
In the Company’s statement of financial position, subsidiaries, associates and joint ventures are stated at cost, unless
impaired. The Company’s interests in investment funds such as mutual funds and unit trusts are designated at fair value
through profit or loss.
058
2. SIGNIFICANT ACCOUNTING POLICIES (continued)
2.4 Insurance and investment contracts
Consistent accounting policies for the measurement and recognition of insurance and investment contracts have been
adopted throughout the Group to substantially all of its business.
In a limited number of cases, the Group measures insurance contract liabilities with reference to statutory requirements in
the applicable jurisdiction, without deferral of acquisition costs.
Product classification
The Group classified its contracts written as either insurance contracts or investment contracts, depending on the level of
insurance risk. Insurance contracts are those contracts that transfer significant insurance risk, while investment contracts
are those contracts without significant insurance risk. Some insurance and investment contracts, referred to as participating
business, have discretionary participation features, “DPF”, which may entitle the customer to receive, as a supplement to
guaranteed benefits, additional non-guaranteed benefits, such as policyholder dividends or bonuses. The Group applies
the same accounting policies for the recognition and measurement of obligations arising from investment contracts with
DPF as it does for insurance contracts.
In the event that a scenario (other than those lacking commercial substance) exists in which an insured event would
require the Group to pay significant additional benefits to its customers, the contract is accounted for as an insurance
contract. For investment contracts that do not contain DPF, IAS 39, Financial Instruments: Measurement and Recognition,
and, if the contract includes an investment management element, IAS 18, Revenue Recognition, are applied. IFRS 4 permits
the continued use of previously applied accounting policies for insurance contracts and investment contracts with DPF,
and this basis has been adopted by the Group in accounting for such contracts. Once a contract has been classified as an
insurance or investment contract, reclassification is not subsequently performed unless the terms of the agreement are
later amended.
Certain contracts with DPF supplement the amount of guaranteed benefits due to policyholders. These contracts are
distinct from other insurance and investment contracts as the Group has discretion in the amount and/or timing of the
benefits declared, and how such benefits are allocated between groups of policyholders. Customers may be entitled to
receive, as a supplement to guaranteed benefits, additional benefits or bonuses:
• that are likely to be a significant portion of the total contractual benefits;
• whose amount or timing is contractually at the discretion of the Group; and
• that are contractually based on:
– the performance of a specified pool of contracts or a specified type of contract;
– realised and/or unrealised investment returns on a specified pool of assets held by the issuer; or
– the profit or loss of the Company, fund or other entity that issues the contract.

059
2. SIGNIFICANT ACCOUNTING POLICIES (continued)
2.4 Insurance and investment contracts (continued)
Product classification (continued)
The Group applies the same accounting policies for the recognition and measurement of obligations and the deferral of
acquisition costs arising from investment contracts with DPF as it does to insurance contracts. The Group refers to such
contracts as participating business. In some jurisdictions participating business is written in a participating fund which is
distinct from the other assets of the Company or branch. The allocation of benefits from the assets held in such participating
funds is subject to minimum policyholder participation mechanisms which are established by regulation. The extent of
such policyholder participation may change over time. The current policyholder participation in declared dividends for
locations with participating funds is set out below:
Country Current policyholder participation
Singapore 90%
Malaysia 90%
China 70%
Australia 80%
Brunei 80%
In some jurisdictions participating business is not written in a distinct fund and the Group refers to this as other participating
business.

060
2. SIGNIFICANT ACCOUNTING POLICIES (continued)
2.4 Insurance and investment contracts (continued)
Product classification (continued)
The Group’s products may be divided into the following main categories:
Basis of accounting for:
Policy type Description of benefits payable Insurance contract liabilitiesInvestment contract liabilities
Traditional participating life assurance with DPF
Participating funds Participating products include protection and savings elements. The basic sum assured, payable on death or maturity, may be enhanced by dividends or bonuses, the aggregate amount of which is determined by the performance of a distinct fund of assets and liabilities
The timing of dividend and bonus declarations is at the discretion of the insurer. Local regulations generally prescribe a minimum proportion of policyholder participation in declared dividends
Insurance contract liabilities make provision for the present value of guaranteed benefits less estimated future net premiums to be collected from policyholders. In addition, an insurance liability is recorded for the proportion of the net assets of the participating funds that would be allocated to policyholders, assuming all performance would be declared as a dividend based upon local regulations
Not applicable, as IFRS 4 permits contracts with DPF to be accounted for as insurance contracts
Other participating business
Participating products include protection and savings elements. The basic sum assured, payable on death or maturity, may be enhanced by dividends or bonuses, the timing or amount of which are at the discretion of the insurer taking into account factors such as investment experience
Insurance contract liabilities make provision for the present value of guaranteed benefits and non-guaranteed participation less estimated future net premiums to be collected from policyholders
Not applicable, as IFRS 4 permits contracts with DPF to be accounted for as insurance contracts
Non-participating life assurance, annuities and other protection products
Benefits payable are not at the discretion of the insurer
Insurance contract liabilities reflect the present value of future policy benefits to be paid less the present value of estimated future net premiums to be collected from policyholders. In addition, deferred profit liabilities for limited payment contracts are recognised
Investment contract liabilities are measured at amortised cost
Universal life Benefits are based on an account balance, credited with interest at a rate set by the insurer, and a death benefit, which may be varied by the customer
Insurance contract liabilities reflect the accumulation value, representing premiums received and investment return credited, less deductions for front-end loads, mortality and morbidity costs and expense charges. In addition, liabilities for unearned revenue and additional insurance benefits are recorded
Not applicable as such contracts generally contain significant insurance risk
Unit-linked These may be primarily savings products or may combine savings with an element of protection
Insurance contract liabilities reflect the accumulation value, representing premiums received and investment return credited, less deductions for front-end loads, mortality and morbidity costs and expense charges. In addition, liabilities for unearned revenue and additional insurance benefits are recorded
Investment contract liabilities are measured at fair value (determined with reference to the accumulation value)
In the notes to the financial statements, unit-linked contracts are presented together with pension contracts for disclosure
purposes.
061
2. SIGNIFICANT ACCOUNTING POLICIES (continued)
2.4 Insurance and investment contracts (continued)
Product classification (continued)
The basis of accounting for insurance and investment contracts is discussed in notes 2.4.1 and 2.4.2 below.
2.4.1 Insurance contracts and investment contracts with DPF
PremiumsPremiums from life insurance contracts, including participating policies and annuity policies with life contingencies, are
recognised as revenue when due from the policyholder. Benefits and expenses are provided in respect of such revenue so
as to recognise profits over the estimated life of the policies. For limited pay contracts, premiums are recognised in profit
or loss when due, with any excess profit deferred and recognised in income in a constant relationship to the insurance in-
force or, for annuities, the amount of expected benefit payments.
Amounts collected as premiums from insurance contracts with investment features but with sufficient insurance risk to be
considered insurance contracts, such as universal life, and certain unit-linked contracts, are accumulated as deposits.
Revenue from these contracts consists of policy fees for the cost of insurance, administration, and surrenders during the
period.
Upfront fees are recognised over the estimated life of the contracts to which they relate. Policy benefits and claims that are
charged to expenses include benefit claims incurred in the period in excess of related policyholder contract deposits and
interest credited to policyholder deposits.
Unearned revenue liabilityUnearned revenue liability represents upfront fees and other non-level charges that have been collected and released to
the consolidated income statement over the estimated life of the business. A separate liability for accumulation value is
established.
Deferred profit liabilityDeferred profit liability arising from traditional insurance contracts represents excess profits that have been collected and
released to the consolidated income statement over the estimated life of the business. A separate liability for future policy
benefits is established.
Deferred acquisition costsThe costs of acquiring new insurance contracts, including commissions and distribution costs, underwriting and other
policy issue expenses which vary with and are primarily related to the production of new business or renewal of existing
business, are deferred as an asset. Deferred acquisition costs are assessed for recoverability in the year of policy issue to
ensure that these costs are recoverable out of the estimated future margins to be earned on the policy. Deferred acquisition
costs are assessed for recoverability at least annually thereafter. Future investment income is also taken into account in
assessing recoverability. To the extent that acquisition costs are not considered to be recoverable at inception or thereafter,
these costs are expensed in the consolidated income statement.
Deferred acquisition costs for life insurance and annuity policies are amortised over the expected life of the contracts as a
constant percentage of expected premiums. Expected premiums are estimated at the date of policy issue and are
consistently applied throughout the life of the contract unless a deficiency occurs when performing liability adequacy
testing (see below).
Deferred acquisition costs for universal life and unit-linked contracts are amortised over the expected life of the contracts
based on a constant percentage of the present value of estimated gross profits expected to be realised over the life of the
contract or on a straight-line basis. Estimated gross profits include expected amounts to be assessed for mortality,
administration, investment and surrenders, less benefit claims in excess of policyholder balances, administrative expenses
and interest credited. Estimated gross profits are revised regularly. The interest rate used to compute the present value of
revised estimates of expected gross profits is the latest revised rate applied to the remaining benefit period. Deviations of
actual results from estimated experience are reflected in earnings.

062
2. SIGNIFICANT ACCOUNTING POLICIES (continued)
2.4 Insurance and investment contracts (continued)
Product classification (continued)
2.4.1 Insurance contracts and investment contracts with DPF (continued)
Deferred sales inducementsDeferred sales inducements, consisting of day one bonuses, persistency bonuses and enhanced crediting rates are deferred
and amortised using the same methodology and assumptions used to amortise acquisition costs when:
• the sales inducements are recognised as part of insurance contract liabilities;
• they are explicitly identified in the contract on inception;
• they are incremental to amounts credited on similar contracts without sales inducements; and
• they are higher than the expected ongoing crediting rates for periods after the inducement.
UnbundlingThe deposit component of an insurance contract is unbundled when both of the following conditions are met:
• the deposit component (including any embedded surrender option) can be measured separately (i.e. without taking
into account the insurance component); and
• the Group’s accounting policies do not otherwise require the recognition of all obligations and rights arising from the
deposit component.
BifurcationTo the extent that certain of the Group’s insurance contracts include embedded derivatives that are not clearly and closely
related to the host contract, these are bifurcated from the insurance contracts and accounted for as derivatives.
Benefits and claimsInsurance contract benefits reflect the cost of all maturities, surrenders, withdrawals and claims arising during the year, as
well as policyholder dividends accrued in anticipation of dividend declarations.
Accident and health claims incurred include all losses occurring during the year, whether reported or not, related handling
costs, a reduction for recoveries, and any adjustments to claims outstanding from previous years.
Claims handling costs include internal and external costs incurred in connection with the negotiation and settlement of
claims, and are included in operating expenses.
Insurance contract liabilities (including liabilities in respect of investment contracts with DPF)Insurance contract liabilities represent the estimated future policyholder benefit liability for life insurance policies.
Future policy benefits for life insurance policies are calculated using a net level premium valuation method which
represents the present value of estimated future policy benefits to be paid, less the present value of estimated future net
premiums to be collected from policyholders.
For contracts with an explicit account balance, such as universal life and unit-linked contracts, insurance contract liabilities
are equal to the accumulation value, which represents premiums received and investment returns credited to the policy
less deductions for mortality and morbidity costs and expense charges.
Settlement options are accounted for as an integral component of the underlying insurance or investment contract unless
they provide annuitisation benefits, in which case an additional liability is established to the extent that the present value
of expected annuitisation payments at the expected annuitisation date exceeds the expected account balance at that date.
Where settlement options have been issued with guaranteed rates less than market interest rates, the insurance or
investment contract liability does not reflect any provision for subsequent declines in market interest rates unless a
deficiency is identified through liability adequacy testing.

063
2. SIGNIFICANT ACCOUNTING POLICIES (continued)
2.4 Insurance and investment contracts (continued)
Product classification (continued)
2.4.1 Insurance contracts and investment contracts with DPF (continued)
Insurance contract liabilities (including liabilities in respect of investment contracts with DPF) (continued)
The Group accounts for insurance contract liabilities for participating business written in participating funds by establishing
a liability for the present value of guaranteed benefits less estimated future net premiums to be collected from policyholders.
In addition, an insurance liability is recorded for the proportion of the net assets of the participating funds that would be
allocated to policyholders assuming all relevant surplus at the date of the consolidated statement of financial position
were to be declared as a policyholder dividend based upon applicable regulations. The Group accounts for other
participating business by establishing a liability for the present value of guaranteed benefits and non-guaranteed
participation, less estimated future net premiums to be collected from policyholders.
Liability adequacy testingThe adequacy of liabilities is assessed by portfolio of contracts, in accordance with the Group’s manner of acquiring,
servicing and measuring the profitability of its insurance contracts. Liability adequacy testing is performed for each
reportable segment.
For traditional life insurance contracts, insurance contract liabilities reduced by deferred acquisition costs and value of
business acquired on acquired insurance contracts, are compared to the gross premium valuation calculated on a best
estimate basis, as of the valuation date. If there is a deficiency, the unamortised balance of deferred acquisition cost and
value of business acquired on acquired insurance contracts are written down to the extent of the deficiency. If, after writing
down the unamortised balance for the specific portfolio of contracts to nil, a deficiency still exists, the net liability is
increased by the amount of the remaining deficiency.
For universal life and investment contracts, deferred acquisition costs, net of unearned revenue liabilities, are compared to
estimated gross profits. If a deficiency exists, deferred acquisition costs are written down.
Financial guaranteesFinancial guarantees are regarded as insurance contracts. Liabilities in respect of such contracts are recognised as loss is
incurred by a holder.
2.4.2 Investment contracts
Investment contracts do not contain sufficient insurance risk to be considered insurance contracts and are accounted for
as a financial liability, other than investment contracts with DPF which are excluded from the scope of IAS 39 and are
accounted for as insurance contracts.
Revenue from these contracts consists of various charges (policy fees, handling fees, management fees and surrender
charges) made against the contract for the cost of insurance, expenses and early surrender. First year charges are amortised
over the life of the contract as the services are provided.
Investment contract fee revenueCustomers are charged fees for policy administration, investment management, surrenders or other contract services. The
fees may be fixed amounts or vary with the amounts being managed, and will generally be charged as an adjustment to the
policyholder’s account balance. The fees are recognised as revenue in the period in which they are received unless they
relate to services to be provided in future periods, in which case they are deferred and recognised as the service is provided.
Origination and other “upfront” fees (fees that are assessed against the account balance as consideration for origination of
the contract) are charged on some non-participating investment and pension contracts. Where the investment contract is
recorded at amortised cost, these fees are amortised and recognised over the expected term of the policy as an adjustment
to the effective yield. Where the investment contract is measured at fair value, the front-end fees that relate to the provision
of investment management services are amortised and recognised as the services are provided.

064
2. SIGNIFICANT ACCOUNTING POLICIES (continued)
2.4 Insurance and investment contracts (continued)
Product classification (continued)
2.4.2 Investment contracts (continued)
Deferred origination costsThe costs of acquiring investment contracts with investment management services, including commissions and other
incremental expenses directly related to the issue of each new contract, are deferred and amortised over the period that
services are provided. Deferred origination costs are tested for recoverability at each reporting date.
The costs of acquiring new investment contracts without investment management services are included as part of the
effective interest rate used to calculate the amortised cost of the related investment contract liabilities.
Investment contract liabilitiesDeposits received in respect of investment contracts are not accounted for through the consolidated income statement,
except for the investment income and fees attributable to those contracts, but are accounted for directly through the
consolidated statement of financial position as an adjustment to the investment contract liability, which reflects the
account balance.
The majority of the Group’s contracts classified as investment contracts are unit-linked contracts, with measurement
directly linked to the underlying investment assets. These represent investment portfolios maintained to meet specific
investment objectives of policyholders who generally bear the credit and market risks on those investments. The liabilities
are carried at fair value determined with reference to the accumulation value (current unit value) with changes recognised
in profit or loss. The costs of policy administration, investment management, surrender charges and certain policyholder
taxes assessed against customers’ account balances are included in revenue, and accounted for as described under
“Investment contract fee revenue” above.
Non unit-linked investment contract liabilities are carried at amortised cost, being the fair value of consideration received
at the date of initial recognition, less the net effect of principal payments such as transaction costs and front-end fees, plus
or minus the cumulative amortisation using the effective interest method of any difference between that initial amount and
the maturity value, and less any write-down for surrender payments. The effective interest rate equates the discounted
cash payments to the initial amount. At each reporting date, the unearned revenue liability is determined as the value of
the future best estimate cash flows discounted at the effective interest rate. Any adjustment is immediately recognised as
income or expense in the consolidated income statement.
The amortised cost of the financial liability is never recorded at less than the amount payable on surrender, discounted for
the time value of money where applicable, if the investment contract is subject to a surrender option.
Deferred fee income liabilityDeferred fee income liability represents upfront fees and other non-level charges that have been collected and released to
the consolidated income statement over the estimated life of the business. A separate liability for accumulation value is
established.

065
2. SIGNIFICANT ACCOUNTING POLICIES (continued)
2.4 Insurance and investment contracts (continued)
Product classification (continued)
2.4.3 Insurance and investment contracts
ReinsuranceThe Group cedes reinsurance in the normal course of business, with retentions varying by line of business. The cost of
reinsurance is accounted for over the life of the underlying reinsured policies, using assumptions consistent with those
used to account for such policies.
Premiums ceded and claims reimbursed are presented on a gross basis in the consolidated income statement and
statement of financial position.
Reinsurance assets consist of amounts receivable in respect of ceded insurance liabilities. Amounts recoverable from
reinsurers are estimated in a manner consistent with the reinsured insurance or investment contract liabilities or benefits
paid and in accordance with the relevant reinsurance contract.
To the extent that reinsurance contracts principally transfer financial risk (as opposed to insurance risk) they are accounted
for directly through the consolidated statement of financial position and are not included in reinsurance assets or liabilities.
A deposit asset or liability is recognised, based on the consideration paid or received less any explicitly identified premiums
or fees to be retained by the reinsured.
If a reinsurance asset is impaired, the Group reduces the carrying amount accordingly and recognises that impairment loss
in the consolidated income statement. A reinsurance asset is impaired if there is objective evidence, as a result of an event
that occurred after initial recognition of the reinsurance asset, that the Group may not receive all amounts due to it under
the terms of the contract, and the impact on the amounts that the Group will receive from the reinsurer can be reliably
measured.
Value of business acquired (VOBA)The VOBA in respect of a portfolio of long-term insurance and investment contracts, either directly or through the purchase
of a subsidiary, is recognised as an asset. If this results from the acquisition of an investment in a joint venture or an
associate, the VOBA is held within the carrying amount of that investment. In all cases, the VOBA is amortised over the
estimated life of the contracts in the acquired portfolio on a systematic basis. The rate of amortisation reflects the profile
of the value of in-force business acquired. The carrying value of VOBA is reviewed annually for impairment and any
reduction is charged to the consolidated income statement.
Shadow accountingShadow accounting is applied to insurance and certain investment contracts with discretionary participation feature
where financial assets backing insurance and investment contract liabilities are classified as available for sale. Shadow
accounting is applied to deferred acquisition costs, VOBA, deferred origination costs and the contract liabilities for
investment contracts with DPF to take into account the effect of unrealised gains or losses on insurance liabilities or assets
that are recognised in other comprehensive income in the same way as for a realised gain or loss recognised in the
consolidated income statement. Such assets or liabilities are adjusted with corresponding charges or credits recognised
directly in shareholders’ equity as a component of the related unrealised gains and losses.
Other assessments and leviesThe Group is potentially subject to various periodic insurance-related assessments or guarantee fund levies. Related
provisions are established where there is a present obligation (legal or constructive) as a result of a past event. Such
amounts are not included in insurance or investment contract liabilities but are included under “Provisions” in the
consolidated statement of financial position.

066
2. SIGNIFICANT ACCOUNTING POLICIES (continued)
2.5 Financial instruments
2.5.1 Classification of and designation of financial instruments
Financial assets and liabilities at fair value through profit or lossFinancial assets and liabilities at fair value through profit or loss comprise two categories:
• financial assets or liabilities designated at fair value through profit or loss upon initial recognition; and
• financial assets or liabilities classified as held for trading.
Management designates financial assets and liabilities at fair value through profit or loss if this eliminates a measurement
inconsistency or if the related assets and liabilities are actively managed on a fair value basis, including:
• financial assets held to back unit-linked contracts and participating funds;
• other financial assets managed on a fair value basis; consisting of the Group’s equity portfolio and investments held by
the Group’s fully consolidated investment funds; and
• compound instruments containing an embedded derivative, where the embedded derivative would otherwise require
bifurcation.
Financial assets and liabilities classified as held for trading include financial assets acquired principally for the purpose of
selling them in the near future and those that form part of a portfolio of financial assets in which there is evidence of short-
term profit taking, as well as derivative assets and liabilities.
Dividend income from equity instruments designated at fair value through profit or loss is recognised in investment income
in the consolidated income statement, generally when the security becomes ex-dividend. Interest income is recognised on
an accrued basis. For all financial assets designated at fair value through profit or loss, changes in fair value are recognised
in investment experience.
Transaction costs in respect of financial assets and liabilities at fair value through profit or loss are expensed as they are
incurred.
Available for sale financial assetsFinancial assets, other than those at fair value through profit or loss, and loans and receivables, are classified as available
for sale.
The available for sale category is used where the relevant investments backing insurance and investment contract liabilities
and shareholders’ equity are not managed on a fair value basis. These principally consist of the Group’s debt securities
(other than those backing participating funds and unit-linked contracts). Available for sale financial assets are initially
recognised at fair value plus attributable transaction costs. For available for sale debt securities, the difference between
their cost and par value is amortised. Available for sale financial assets are subsequently measured at fair value. Interest
income from debt securities classified as available for sale is recognised in investment income in the consolidated income
statement using the effective interest method.
Unrealised gains and losses on securities classified as available for sale are analysed between differences resulting from
foreign currency translation, and other fair value changes. Foreign currency translation differences on monetary available
for sale investments, such as debt securities are calculated as if they were carried at amortised cost and so are recognised
in the consolidated income statement as investment experience. For impairments of available for sale financial assets,
reference is made to the section “Impairment of financial assets”.
Changes in the fair value of securities classified as available for sale, except for impairment losses and relevant foreign
exchange gains and losses, are recognised in other comprehensive income and accumulated in a separate fair value
reserve within equity. Impairment losses and relevant foreign exchange gains and losses are recognised in the income
statement.
Realised gains and losses on financial assetsRealised gains and losses on available for sale financial assets are determined as the difference between the sale proceeds
and amortised cost. Amortised cost is determined by specific identification.
067
2. SIGNIFICANT ACCOUNTING POLICIES (continued)
2.5 Financial instruments (continued)
2.5.1 Classification of and designation of financial instruments (continued)
Recognition of financial instrumentsPurchases and sales of financial instruments are recognised on the trade date, which is the date at which the Group
commits to purchase or sell the assets.
Derecognition and offset of financial assetsFinancial assets are derecognised when the rights to receive cash flows from the financial assets have expired or where
the Group has transferred substantially all risks and rewards of ownership. If the Group neither transfers nor retains
substantially all the risks and rewards of ownership of a financial asset, it derecognises the financial asset if it no longer
has control over the asset. In transfers where control over the asset is retained, the Group continues to recognise the asset
to the extent of its continuing involvement. The extent of continuing involvement is determined by the extent to which the
Group is exposed to changes in the fair value of the asset.
Financial assets and liabilities are offset and the net amount reported in the consolidated statement of financial position
only when there is a legally enforceable right to offset the recognised amounts and there is an intention to settle on a net
basis, or realise the asset and settle the liability simultaneously.
Loans and receivablesLoans and receivables are non-derivative financial assets with fixed or determinable payments that are not quoted in an
active market. They are initially recognised at fair value plus transaction costs. Subsequently, they are carried at amortised
cost using the effective interest method less any impairment losses. Interest income from loans and receivables is
recognised in investment income in the consolidated income statement using the effective interest method.
Term depositsDeposits include time deposits with financial institutions which do not meet the definition of cash and cash equivalents as
their maturity at acquisition exceeds three months. Certain of these balances are subject to regulatory or other restriction
as disclosed in note 19 Loans and deposits. Deposits are stated at amortised cost using the effective interest method.
Cash and cash equivalentsCash and cash equivalents include cash in hand, deposits held at call with banks and other short-term highly liquid
investments with maturities at acquisition of three months or less, which are held for cash management purposes. Cash
and cash equivalents also include cash received as collateral for derivative transactions, and repo and reverse repo
transactions, as well as cash and cash equivalents held for the benefit of policyholders in connection with unit-linked
products. Cash and cash equivalents are measured at amortised cost using the effective interest method.
2.5.2 Fair values of non-derivative financial instruments
The fair value of a financial instrument is the amount that would be received to sell an asset or paid to transfer a liability in
an orderly transaction between market participants at the measurement date, having regard to the specific characteristics
of the asset or liability concerned, assuming that the transfer takes place in the most advantageous market to which the
Group has access. The fair values of financial instruments traded in active markets (such as financial instruments at fair
value through profit or loss and available for sale securities) are based on quoted market prices at the date of the
consolidated statement of financial position. The quoted market price used for financial assets held by the Group is the
current bid price, which is considered to be the price within the bid-ask spread that is most representative of the fair value
in the circumstances. The fair values of financial instruments that are not traded in active markets are determined using
valuation techniques. The Group uses a variety of methods and makes assumptions that are based on market conditions at
the date of each consolidated statement of financial position. The objective of using a valuation technique is to estimate
the price at which an orderly transaction would take place between market participants at the date of the consolidated
statement of financial position.
Financial instruments carried at fair value are measured using a fair value hierarchy described in note 21.

068
2. SIGNIFICANT ACCOUNTING POLICIES (continued)
2.5 Financial instruments (continued)
2.5.3 Impairment of financial assets
GeneralFinancial assets are assessed for impairment on a regular basis. The Group assesses at each reporting date whether there
is objective evidence that a financial asset or group of financial assets is impaired. A financial asset, or group of financial
assets, is impaired and impairment losses are incurred only if there is objective evidence of impairment as a result of one
or more events that have occurred after the initial recognition of the asset (a loss event) and that loss event (or events) has
an impact on the estimated future cash flows of the financial asset or group of financial assets that can be reliably
estimated.
For loans and receivables, the Group first assesses whether objective evidence of impairment exists for financial assets
that are individually significant. If the Group determines that objective evidence of impairment does not exist for an
individually assessed financial asset, whether significant or not, it includes the asset in a group of financial assets with
similar credit risk characteristics and collectively assesses them for impairment. Assets that are individually assessed for
impairment and for which an impairment loss is or continues to be recognised are not included in a collective assessment
of impairment.
Available for sale financial instrumentsWhen a decline in the fair value of an available for sale asset has been recognised in other comprehensive income and
there is objective evidence that the asset is impaired, the cumulative loss already recognised directly in other comprehensive
income is recognised in current period profit or loss.
If the fair value of a debt instrument classified as available for sale increases in a subsequent period, and the increase can
be objectively related to an event occurring after the impairment loss was recognised in profit or loss, the impairment loss
is reversed through profit or loss. Where, following the recognition of an impairment loss in respect of an available for sale
debt security, the asset suffers further falls in value, such further falls are recognised as an impairment only in the case
when objective evidence exists of a further impairment event to which the losses can be attributed.
Loans and receivablesFor loans and receivables, impairment is considered to have taken place if it is probable that the Group will not be able to
collect principal and/or interest due according to the contractual terms of the instrument. When impairment is determined
to have occurred, the carrying amount is decreased through a charge to profit or loss. The carrying amount of mortgage
loans or receivables is reduced through the use of an allowance account, and the amount of any allowance is recognised
as an impairment loss in profit or loss.
2.5.4 Derivative financial instruments
Derivative financial instruments primarily include foreign exchange contracts and interest rate swaps that derive their
value mainly from underlying foreign exchange rates and interest rates. All derivatives are initially recognised in the
consolidated statement of financial position at their fair value, which represents their cost excluding transaction costs,
which are expensed, giving rise to a day one loss. They are subsequently remeasured at their fair value, with movements in
this value recognised in profit or loss. Fair values are obtained from quoted market prices or, if these are not available, by
using valuation techniques such as discounted cash flow models or option pricing models. All derivatives are carried as
assets when the fair values are positive and as liabilities when the fair values are negative.
Derivative instruments for economic hedgingWhilst the Group enters into derivative transactions to provide economic hedges under the Group’s risk management
framework, it adopts hedge accounting to these transactions only in limited circumstances. This is either because the
transactions would not meet the specific IFRS rules to be eligible for hedge accounting or the documentation requirements
to meet hedge accounting criteria would be unduly onerous. Where hedge accounting does not apply, these transactions
are treated as held for trading and fair value movements are recognised immediately in investment experience.

069
2. SIGNIFICANT ACCOUNTING POLICIES (continued)
2.5 Financial instruments (continued)
2.5.4 Derivative financial instruments (continued)
Embedded derivativesEmbedded derivatives are derivatives embedded within other non-derivative host financial instruments to create hybrid
instruments. Where the economic characteristics and risks of the embedded derivatives are not closely related to the
economic characteristics and risks of the host instrument, and where the hybrid instrument is not measured at fair value
with changes in fair value recognised in profit or loss, the embedded derivative is bifurcated and carried at fair value as a
derivative in accordance with IAS 39.
2.6 Segment reporting
An operating segment is a component of the Group that engages in business activity from which it earns revenues and
incurs expenses and, for which, discrete financial information is available, and whose operating results are regularly
reviewed by the Group’s chief operating decision-maker, considered to be the Executive Committee of the Group (ExCo).
2.7 Foreign currency translation
Income statements and cash flows of foreign entities are translated into the Group’s presentation currency at average
exchange rates for the year as this approximates to the exchange rates prevailing at the transaction date. Their statements
of financial position are translated at year or period end exchange rates. Exchange differences arising from the translation
of the net investment in foreign operations, are taken to the currency translation reserve within equity. On disposal of a
foreign operation, such exchange differences are transferred out of this reserve and are recognised in the consolidated
income statement as part of the gain or loss on sale.
Foreign currency transactions are accounted for at the exchange rates prevailing at the date of the transactions. Gains and
losses resulting from the settlement of such transactions, and from the translation of monetary assets and liabilities
denominated in foreign currencies into functional currency, are recognised in the consolidated income statement.
Translation differences on financial assets designated at fair value through profit or loss are included in investment
experience. For monetary financial assets classified as available for sale, translation differences are calculated as if they
were carried at amortised cost and so are recognised in the consolidated income statement. Foreign exchange movements
on non-monetary equities that are accounted for as available for sale are included in the fair value reserve.
2.8 Property, plant and equipment
Property held for own use is carried at fair value at last valuation date less accumulated depreciation. When an asset is
adjusted for the latest fair value, any accumulated depreciation at the date of valuation is eliminated against the gross
carrying amount of the asset. The movement of fair values is generally recognised in other comprehensive income. When
such properties are sold, the amounts accumulated in other comprehensive income are transferred to retained earnings.
The Group records its interest in leasehold land and land use rights associated with property held for own use separately
as operating leases or finance leases depending on whether substantially all the risks and rewards incidental to ownership
of the land are transferred to the Group. Those interests classified as finance leases are reported as a component of the
property held for own use and carried at fair value at last valuation date. The prepayments to acquire leasehold land
classified as operating leases are recorded at original cost within “Other assets” and amortised over the term of the lease
(see note 2.19).
Plant and equipment are stated at historical cost less accumulated depreciation and any accumulated impairment losses.
Historical cost includes expenditure that is directly attributable to the acquisition of the items.
070
2. SIGNIFICANT ACCOUNTING POLICIES (continued)
2.8 Property, plant and equipment (continued)
Depreciation is calculated using the straight-line method to allocate cost less any residual value over the estimated useful
life, generally:
Fixtures, fittings and office equipment 5 years
Buildings 20-40 years
Computer hardware and other assets 3-5 years
Freehold land No depreciation
Subsequent costs are included in the carrying amount or recognised as a separate asset, as appropriate, when it is probable
that future economic benefits will flow to the Group. Repairs and maintenance are charged to the consolidated income
statement during the financial period in which they are incurred.
Residual values and useful lives are reviewed and adjusted, if applicable, at each reporting date. An asset is written down
to its recoverable amount if the carrying value is greater than the estimated recoverable amount.
Any gain and loss arising on disposal of property, plant and equipment is measured as the difference between the net sale
proceeds and the carrying amount of the relevant asset, and is recognised in the consolidated income statement.
2.9 Investment property
Property held for long-term rental or capital appreciation or both that is not occupied by the Group is classified as
investment property. Investment property, including land and buildings, is initially recognised at cost with changes in fair
values in subsequent periods recognised in the consolidated income statement.
If an investment property becomes held for own use, it is reclassified as property, plant and equipment. Where a property
is partly used as an investment property and partly for the use by the Group, these elements are recorded separately within
investment property and property, plant and equipment respectively, where the component used as investment property
would be capable of separate sale or finance lease.
2.10 Goodwill and other intangible assets
GoodwillGoodwill represents the excess of the cost of an acquisition over the fair value of the Group’s share of the net identifiable
assets of the acquired subsidiary, associate or joint venture at the date of acquisition. Goodwill on acquisitions prior to 1
December 2006 (the date of transition to IFRS) is carried at book value (original cost less cumulative amortisation) on that
date, less any impairment subsequently incurred. Goodwill arising on the Group’s investment in subsidiaries since that date
is shown as a separate asset and is carried at cost less any accumulated impairment losses, whilst that on associates and
joint ventures is included within the carrying value of those investments. All acquisition-related costs are expensed as
incurred.
Other intangible assetsOther intangible assets consist primarily of acquired computer software and contractual relationships, such as access to
distribution networks, and are amortised over their estimated useful lives. The amortisation charge for rights to access
distribution networks is included in the consolidated income statement under “Commission and other acquisition
expenses”.
Acquired computer software licences are capitalised on the basis of the costs incurred to acquire and bring to use the
specific software. Costs directly associated with the internal production of identifiable and unique software by the Group
that will generate economic benefits exceeding those costs over a period greater than a year, are recognised as intangible
assets. All other costs associated with developing or maintaining computer software programmes are recognised as an
expense as incurred. Costs of acquiring computer software licences and incurred in the internal production of computer
software are amortised using the straight-line method over the estimated useful life of the software, which does not
generally exceed a period of 3 to 15 years. The amortisation charge for the year is included in the consolidated income
statement under “Operating expenses”.

071
2. SIGNIFICANT ACCOUNTING POLICIES (continued)
2.11 Impairment of non-financial assets
Property, plant and equipment, goodwill and other non-financial assets are reviewed for impairment whenever events or
changes in circumstances indicate that the carrying amount may not be recoverable. An impairment loss is recognised to
the extent that the carrying amount of the asset exceeds its recoverable amount, which is the higher of the fair value of the
asset less cost to sell and value in use. For the purposes of assessing impairment, assets are grouped into cash-generating
units at the level of the Group’s operating segments, the lowest level for which separately identifiable cash flows are
reported. The carrying values of goodwill and intangible assets with indefinite useful lives are reviewed at least annually
or when circumstances or events indicate that there may be uncertainty over this value.
The Group assesses at the end of each reporting period whether there is any objective evidence that its investments in
associates and joint ventures are impaired. Such objective evidence includes whether there has been any significant
adverse changes in the technological, market, economic or legal environment in which the associates and joint ventures
operate or whether there has been a significant or prolonged decline in value below their cost. If there is an indication that
an interest in an associate or a joint venture is impaired, the Group assesses whether the entire carrying amount of the
investment (including goodwill) is recoverable. An impairment loss is recognised in profit or loss for the amount by which
the carrying amount is lower than the higher of the investment’s fair value less costs to sell or value in use. Any reversal of
such impairment loss in subsequent periods is reversed through profit or loss.
In the statement of financial position of the Company, impairment testing of the investments in subsidiaries, associates and
joint ventures is required upon receiving dividends from these investments if the dividend exceeds the total comprehensive
income of the subsidiaries, associates or joint ventures in the period the dividend is declared or if the carrying amount of
the relevant investment in the Company’s statement of financial position exceeds its carrying amount in the consolidated
financial statements of the investees’ net assets including goodwill.
2.12 Securities lending including repurchase agreements
The Group has been a party to various securities lending agreements under which securities are loaned to third parties on
a short-term basis. The loaned securities are not derecognised and so they continue to be recognised within the appropriate
investment classification.
Assets sold under repurchase agreements (repos)Assets sold under repurchase agreements continue to be recognised and a liability is established for the consideration
received. The Group may be required to provide additional collateral based on the fair value of the underlying assets, and
such collateral assets remain on the consolidated statement of financial position.
Assets purchased under agreements to resell (reverse repos)The Group enters into purchases of assets under agreements to resell (reverse repos). Reverse repos are initially recorded
at the cost of the loan or collateral advanced within the caption “Loans and deposits” in the consolidated statement of
financial position. In the event of failure by the counterparty to repay the loan, the Group has the right to the underlying
assets.

072
2. SIGNIFICANT ACCOUNTING POLICIES (continued)
2.13 Collateral
The Group receives and pledges collateral in the form of cash or non-cash assets in respect of derivative transactions and
repo and reverse repo transactions, in order to reduce the credit risk of these transactions. The amount and type of collateral
depends on an assessment of the credit risk of the counterparty. Collateral received in the form of cash, which is not legally
segregated from the Group, is recognised as an asset in the consolidated statement of financial position with a corresponding
liability for the repayment. Non-cash collateral received is not recognised on the consolidated statement of financial
position unless the Group either sells or repledges these assets in the absence of default, at which point the obligation to
return this collateral is recognised as a liability. To further minimise credit risk, the financial condition of counterparties is
monitored on a regular basis.
Collateral pledged in the form of cash which is legally segregated from the Group is derecognised from the consolidated
statement of financial position and a corresponding receivable established for its return. Non-cash collateral pledged is not
derecognised (except in the event of default) and therefore continues to be recognised in the consolidated statement of
financial position within the appropriate financial instrument classification.
2.14 Borrowings
Borrowings are recognised initially at their issue proceeds less transaction costs incurred. Subsequently, borrowings are
stated at amortised cost, and any difference between net proceeds and redemption value is recognised in the consolidated
income statement over the period of the borrowings using the effective interest method. All borrowing costs are expensed
as they are incurred, except for borrowing costs directly attributable to the development of investment properties and other
qualifying assets, which are capitalised as part of the cost of the asset.
2.15 Income taxes
The current tax expense is based on the taxable profits for the year, including any adjustments in respect of prior years. Tax
is allocated to profit or loss before taxation and amounts charged or credited to equity as appropriate.
Deferred tax is recognised in respect of temporary differences between the tax bases of assets and liabilities and their
carrying amounts in the consolidated financial statements, except as described below.
The principal temporary differences arise from the basis of recognition of insurance and investment contract liabilities,
revaluation of certain financial assets and liabilities including derivative contracts, deferred acquisition costs and the
future taxes arising on the surplus in life funds where the relevant local tax regime is distributions-based. The rates enacted
or substantively enacted at the date of the consolidated statement of financial position are used to determine deferred tax.
Deferred tax assets are recognised to the extent that it is probable that future taxable profit will be available against which
the temporary differences can be utilised. In countries where there is a history of tax losses, deferred tax assets are only
recognised in excess of deferred tax liabilities if there is evidence that future profits will be available.
Deferred taxes are not provided in respect of temporary differences arising from the initial recognition of goodwill or from
goodwill for which amortisation is not deductible for tax purposes, or from the initial recognition of an asset or liability in a
transaction which is not a business combination and which affects neither accounting nor taxable profit or loss at the time
of the transaction.
Deferred tax related to fair value remeasurement of available for sale investments and other amounts taken directly to
equity, is recognised initially within the applicable component of equity. It is subsequently recognised in the consolidated
income statement, together with the gain or loss arising on the underlying item.
In addition to paying tax on shareholders’ profits, certain of the Group’s life insurance businesses pay tax on policyholders’
investment returns (policyholder tax) at policyholder tax rates. Policyholder tax is accounted for as an income tax and is
included in the total tax expense and disclosed separately.

073
2. SIGNIFICANT ACCOUNTING POLICIES (continued)
2.16 Revenue
Investment returnInvestment income consists of dividends, interest and rents receivable for the reporting period. Investment experience
comprises realised gains and losses, impairments and unrealised gains and losses on investments held at fair value
through profit or loss. Interest income is recognised as it accrues, taking into account the effective yield on the investment.
Rental income on investment property is recognised on an accrual basis. Investment return consists of investment income
and investment experience.
The realised gain or loss on disposal of an investment is the difference between the proceeds received, net of transaction
costs, and its original cost or amortised cost as appropriate. Unrealised gains and losses represent the difference between
the carrying value at the year end and the carrying value at the previous year end or purchase price if purchased during the
year, less the reversal of previously recognised unrealised gains and losses in respect of disposals made during the year.
Other fee and commission incomeOther fee and commission income consists primarily of fund management fees, income from any incidental non-insurance
activities, distribution fees from mutual funds, commissions on reinsurance ceded and commission revenue from the sale
of mutual fund shares. Reinsurance commissions receivable are deferred in the same way as acquisition costs. All other
fee and commission income is recognised as the services are provided.
2.17 Employee benefits
Annual leave and long service leaveEmployee entitlements to annual leave and long service leave are recognised when they accrue to employees. A provision
is made for the estimated liability for annual leave and long service leave as a result of services rendered by employees up
to the reporting date.
Post-retirement benefit obligationsThe Group operates a number of funded and unfunded post-retirement employee benefit schemes, whose members
receive benefits on either a defined benefit basis (generally related to salary and length of service) or a defined contribution
basis (generally related to the amount invested, investment return and annuity rates), the assets of which are generally
held in separate trustee-administered funds. The defined benefit plans provide life and medical benefits for employees
after retirement and a lump sum benefit on cessation of employment, and the defined contribution plans provide post-
retirement pension benefits.
For defined benefit plans, the costs are assessed using the projected unit credit method. Under this method, the cost of
providing benefits is charged to the consolidated income statement so as to spread the regular cost over the service lives
of employees, in accordance with the advice of qualified actuaries. The obligation is measured as the present value of the
estimated future cash outflows, using a discount rate based on market yields for high-quality corporate bonds that are
denominated in the currency in which the benefits will be paid and that have terms to maturity approximating to the terms
of the related liability. The resulting scheme surplus or deficit appears as an asset or liability in the consolidated statement
of financial position.
Remeasurements arising from defined benefit plans comprise actuarial gains and losses, the return on plan assets
(excluding interest) and the effect of the asset ceiling (if any, excluding interest). The Group recognises them immediately
in other comprehensive income and all other expenses related to defined benefit plans in staff costs in the consolidated
income statement.
When the benefits of a plan are changed, or when a plan is curtailed, the portion of the changed benefit related to past
service by employees, or the gain or loss on curtailment, is recognised immediately in consolidated income statement
when the plan amendment or curtailment occurs.
For defined contribution plans, the Group pays contributions to publicly or privately administered pension plans. Once the
contributions have been paid, the Group, as employer, does not have any further payment obligations. The Group’s
contributions are charged to the consolidated income statement in the reporting period to which they relate and are
included in staff costs.
074
2. SIGNIFICANT ACCOUNTING POLICIES (continued)
2.17 Employee benefits (continued)
Share-based compensation and cash incentive plansThe Group launched a number of share-based compensation plans, under which the Group receives services from the
employees, directors, officers and agents as consideration for the shares and/or share options of the Company. These
share-based compensation plans comprise the Share Option Scheme (SO Scheme), the Restricted Share Unit Scheme
(RSU Scheme), the Employee Share Purchase Plan (ESPP) and the Agency Share Purchase Plan (ASPP).
The Group’s share-based compensation plans are predominantly equity-settled plans. Under equity-settled share-based
compensation plan, the fair value of the employee services received in exchange for the award of shares and/or share
options is recognised as an expense in profit or loss over the vesting period with a corresponding amount recorded in
equity.
The total amount to be expensed over the vesting period is determined by reference to the fair value of the share and/or
share options awarded. Non-market vesting conditions are included in assumptions about the number of shares and/or
share options that are expected to be vested. At each period end, the Group revises its estimates of the number of shares
and/or share options that are expected to be vested. Any impact of the revision to original estimates is recognised in profit
or loss with a corresponding adjustment to equity. Where awards of share-based payment arrangements have graded
vesting terms, each tranche is recognised as a separate award, and therefore the fair value of each tranche is recognised
over the applicable vesting period.
The Group estimates the fair value of share options using a binomial lattice model. This model requires inputs such as
share price, implied volatility, risk-free interest rate, expected dividend rate and the expected life of the share option.
Where modification or cancellation of an equity-settled share-based compensation plan occurs, the grant date fair value
continues to be recognised, together with any incremental value arising on the date of modification if non-market conditions
are met.
For cash-settled share-based compensation plans, the fair value of the employee services in exchange for the award of
cash-settled award is recognised as an expense in profit or loss, with a corresponding amount recognised in liability. At the
end of each reporting period, any unsettled award is remeasured based on the change in fair value of the underlying asset
and the liability and expense are adjusted accordingly.
2.18 Provisions and contingencies
Provisions are recognised when the Group has a present legal or constructive obligation as a result of past events, it is
probable that an outflow of economic resources will be required to settle the obligation, and a reliable estimate of the
amount of the obligation can be made. Where the Group expects a provision to be reimbursed, for example under an
insurance contract held, the reimbursement is recognised as a separate asset only when the reimbursement is virtually
certain.
The Group recognises a provision for onerous contracts when the expected benefits to be derived from a contract are less
than the unavoidable costs of meeting the obligations under the contract.
Contingencies are disclosed if material and if there is a possible future obligation as a result of a past event, or if there is a
present obligation as a result of a past event, but either a payment is not probable or the amount cannot be reliably
estimated.

075
2. SIGNIFICANT ACCOUNTING POLICIES (continued)
2.19 Leases
Leases, where a significant portion of the risks and rewards of ownership is retained by the Group as a lessor, are classified
as operating leases. Assets subject to such leases are included in property, plant and equipment or investment property,
and are depreciated to their residual values over their estimated useful lives. Rentals from such leases are credited to the
consolidated income statement on a straight-line basis over the period of the relevant lease.
Payments made by the Group as lessee under operating leases are classified either as an operating lease prepayment or
as a component of investment property depending on whether the property interest is used as investment property.
Operating leases held for long-term rental or capital appreciation or both that are not occupied by the Group are classified
as investment property. They are initially recognised at cost with changes in fair values in subsequent periods recognised
in the consolidated income statement. The Group classifies amounts paid to acquire leasehold land which are held for the
Group’s own occupancy as an operating lease prepayment or as a component of property, plant and equipment depending
on whether substantially all the risks and rewards incidental to the ownership of the land are transferred to the Group.
Prepayments for land use rights under operating leases that are held for the Group’s own occupancy (net of any incentives
received from the lessor) are included within “Other assets” and charged to the consolidated income statement on a
straight-line basis over the period of the relevant lease. There are not any freehold land interests in Hong Kong.
2.20 Share capital
Ordinary shares are classified in equity when there is not any obligation to transfer cash or other assets to the holders.
Share issue costsIncremental external costs directly attributable to the issue of new shares are shown in equity as a deduction, net of tax,
from the proceeds of the issue.
DividendsInterim dividends on ordinary shares are recognised when they have been paid. Final dividends on ordinary shares are
recognised when they have been approved by shareholders.
2.21 Presentation of the consolidated statement of financial position
The Group’s insurance and investment contract liabilities and related assets are realised and settled over periods of several
years, reflecting the long-term nature of the Group’s products. Accordingly, the Group presents the assets and liabilities in
its consolidated statement of financial position in approximate order of liquidity, rather than distinguishing current and
non-current assets and liabilities. The Group regards its intangible assets, investments in associates and joint ventures,
property, plant and equipment, investment property and deferred acquisition and origination costs as non-current assets
as these are held for the longer-term use of the Group.
2.22 Earnings per share
Basic earnings per share is calculated by dividing net profit available to ordinary shareholders by the weighted average
number of ordinary shares in issue during the year.
Earnings per share has also been calculated on the operating profit before adjusting items, attributable to ordinary
shareholders, as the Directors believe this figure provides a better indication of operating performance.
For diluted earnings per share, the weighted average number of ordinary shares in issue is adjusted to assume conversion
of all dilutive potential ordinary shares, such as share options awarded to employees.
Potential or contingent share issuances are treated as dilutive when their conversion to shares would decrease net earnings
per share.
2.23 Fiduciary activities
Assets and income arising from fiduciary activities, together with related undertakings to return such assets to customers,
are excluded from these consolidated financial statements where the Group does not have contractual rights to the assets
and acts in a fiduciary capacity such as nominee, trustee or agent.

076
2. SIGNIFICANT ACCOUNTING POLICIES (continued)
2.24 Consolidated statement of cash flow
The consolidated statement of cash flow presents movements in cash and cash equivalents and bank overdrafts as shown
in the consolidated statement of financial position.
Purchases and sales of financial investments are included in operating cash flows as the purchases are funded from cash
flows associated with the origination of insurance and investment contracts, net of payments of related benefits and
claims. Purchases and sales of investment property are included within cash flows from investing activities.
2.25 Related party transactions
Transactions with related parties are recorded at amounts mutually agreed and transacted between the parties to the
arrangement.
3. CRITICAL ACCOUNTING ESTIMATES AND JUDGEMENTS
The Group makes estimates and assumptions that affect the reported amounts of assets, liabilities, and revenue and
expenses. All estimates are based on management’s knowledge of current facts and circumstances, assumptions based on
that knowledge and predictions of future events and actions. Actual results can always differ from those estimates, possibly
significantly.
Items that are considered particularly sensitive to changes in estimates and assumptions, and the relevant accounting
policies are those which relate to product classification, insurance contract liabilities (including liabilities in respect of
investment contracts with DPF), deferred acquisition and origination costs, liability adequacy testing, fair value
measurement, impairment of financial assets and impairment of goodwill and other intangible assets.
3.1 Product classification
The Group issues contracts that transfer insurance risk or financial risk or both. Insurance contracts are those contracts
that transfer significant insurance risk, while investment contracts are those contracts without significant insurance risk.
The Group exercises significant judgement to determine whether there is a scenario (other than those lacking commercial
substance) in which an insured event would require the Group to pay significant additional benefits to its customers. In the
event the Group has to pay significant additional benefits to its customers, the contract is accounted for as an insurance
contract. The judgements exercised in determining the level of insurance risk in product classification affect the amounts
recognised in the consolidated financial statements as insurance and investment contract liabilities and deferred
acquisition and origination costs. The accounting policy on product classification is described in note 2.4.
3.2 Insurance contract liabilities (including liabilities in respect of investment contracts with DPF)
The Group calculates the insurance contract liabilities for traditional life insurance using a net level premium valuation
method, whereby the liability represents the present value of estimated future policy benefits to be paid, less the present
value of estimated future net premiums to be collected from policyholders. This method uses best estimate assumptions
at inception adjusted for a provision for the risk of adverse deviation for mortality, morbidity, expected investment yields,
policyholder dividends (for other participating business), surrenders and expenses set at the policy inception date. These
assumptions remain locked in thereafter, unless a deficiency arises on liability adequacy testing. Interest rate assumptions
can vary by geographical market, year of issuance and product. Mortality, surrender and expense assumptions are based
on actual experience by each geographical market, modified to allow for variations in policy form. The Group exercises
significant judgement in making appropriate assumptions.
For contracts with an explicit account balance, such as universal life and unit-linked contracts, insurance contract liabilities
represent the accumulation value, which represents premiums received and investment returns credited to the policy less
deductions for mortality and morbidity costs and expense charges. Significant judgement is exercised in making appropriate
estimates of gross profits which are based on historical and anticipated future experiences, these estimates are regularly
reviewed by the Group.

077
3. CRITICAL ACCOUNTING ESTIMATES AND JUDGEMENTS (continued)
3.2 Insurance contract liabilities (including liabilities in respect of investment contracts with DPF) (continued)
The Group accounts for insurance contract liabilities for participating business written in participating funds by establishing
a liability for the present value of guaranteed benefits less estimated future net premiums to be collected from policyholders.
In addition, an insurance liability is recorded for the proportion of the net assets of the participating funds that would be
allocated to policyholders assuming all relevant surplus at the date of the consolidated statement of financial position
were to be declared as a policyholder dividend based upon applicable regulations. Establishing these liabilities requires
the exercise of significant judgement. In addition, the assumption that all relevant performance is declared as a policyholder
dividend may not be borne out in practice. The Group accounts for other participating business by establishing a liability
for the present value of guaranteed benefits and non-guaranteed participation, less estimated future net premiums to be
collected from policyholders.
The judgements exercised in the valuation of insurance contract liabilities (including investment contracts with DPF)
affect the amounts recognised in the consolidated financial statements as insurance contract benefits and insurance
contract liabilities. Further details of the related accounting policy, key risk and variables, and the sensitivities of
assumptions to the key variables in respect of insurance contract liabilities are provided in notes 2.4, 25 and 27.
3.3 Deferred acquisition and origination costs
The judgements exercised in the deferral and amortisation of acquisition and origination costs affect amounts recognised
in the consolidated financial statements as deferred acquisition and origination costs and insurance and investment
contract benefits.
As noted in note 2.4.1, deferred acquisition costs for traditional life insurance and annuity policies are amortised over the
expected life of the contracts as a constant percentage of expected premiums. Expected premiums are estimated at the
date of policy issue and are applied consistently throughout the life of the contract unless a deficiency occurs when
performing liability adequacy testing.
As noted in note 2.4.1, deferred acquisition costs for universal life and unit-linked contracts are amortised over the expected
life of the contracts based on a constant percentage of the present value of estimated gross profits expected to be realised
over the life of the contract or on a straight-line basis. As noted in note 3.2, significant judgement is exercised in making
appropriate estimates of gross profits. The expensing of acquisition costs is accelerated following adverse investment
performance. Likewise, in periods of favourable investment performance, previously expensed acquisition costs are
reversed, not exceeding the amount initially deferred.
Additional details of deferred acquisition and origination costs are provided in notes 2.4 and 18.
3.4 Liability adequacy testing
The Group evaluates the adequacy of its insurance and investment contract liabilities with DPF at least annually. Significant
judgement is exercised in determining the level of aggregation at which liability adequacy testing is performed and in
selecting best estimate assumptions. Liability adequacy is assessed by portfolio of contracts in accordance with the
Group’s manner of acquiring, servicing and measuring the profitability of its insurance contracts. The Group performs
liability adequacy testing separately for each reportable segment.
The judgements exercised in liability adequacy testing affect amounts recognised in the consolidated financial statements
as commission and other acquisition expenses, deferred acquisition costs, insurance contract benefits and insurance and
investment contract liabilities.

078
3. CRITICAL ACCOUNTING ESTIMATES AND JUDGEMENTS (continued)
3.5 Fair value measurement
3.5.1 Fair value of financial assets
The Group determines the fair values of financial assets traded in active markets using quoted bid prices as of each
reporting date. The fair values of financial assets that are not traded in active markets are typically determined using a
variety of other valuation techniques, such as prices observed in recent transactions and values obtained from current bid
prices of comparable investments. More judgement is used in measuring the fair value of financial assets for which market
observable prices are not available or are available only infrequently.
The degree of judgement used in measuring the fair value of financial assets generally correlates with the level of pricing
observability. Pricing observability is affected by a number of factors, including the type of financial instrument, whether
the financial instrument is new to the market and not yet established, the characteristics specific to the transaction and
general market conditions.
Changes in the fair value of financial assets held by the Group’s participating funds affect not only the value of financial
assets, but are also reflected in corresponding movements in insurance and investment contract liabilities. This is due to
an insurance liability being recorded for the proportion of the net assets of the participating funds that would be allocated
to policyholders if all relevant surplus at the date of the consolidated statement of financial position were to be declared
as a policyholder dividend based on current local regulations. Both of the foregoing changes are reflected in the consolidated
income statement.
Changes in the fair value of financial assets held to back the Group’s unit-linked contracts result in a corresponding change
in insurance and investment contract liabilities. Both of the foregoing changes are also reflected in the consolidated
income statement.
Further details of the fair value of financial assets and the sensitivity analysis to interest rates and equity prices are
provided in notes 21 and 36.
3.5.2 Fair value of property held for own use and investment property
The Group uses independent professional valuers to determine the fair value of properties on the basis of the highest and
best use of the properties that is physically possible, legally permissible and financially feasible. In most cases, current use
of the properties is considered to be the highest and best use for determining the fair value. Different valuation techniques
may be adopted to reach the fair value of the properties. Under the Market Data Approach, records of recent sales and
offerings of similar property are analysed and comparisons are made for factors such as size, location, quality and
prospective use. For investment properties, the discounted cash flow approach may be used by reference to net rental
income allowing for reversionary income potential to estimate the fair value of the properties. On some occasions, the cost
approach is used as well to calculate the fair value which reflects the cost that would be required to replace the service
capacity of the property.
Further details of the fair value of property held for own use and investment property are provided in note 21.

079
3. CRITICAL ACCOUNTING ESTIMATES AND JUDGEMENTS (continued)
3.6 Impairment of financial assets
Financial assets, other than those at fair value through profit or loss, are assessed for impairment regularly. This requires
the exercise of significant judgement. The Group assesses at each reporting date whether there is objective evidence that
a financial asset or a group of financial assets is impaired. Objective evidence that a financial asset, or group of assets, is
impaired includes observable data that comes to the attention of the Group about the following events:
• significant financial difficulty of the issuer or debtor;
• a breach of contract, such as a default or delinquency in payments;
• it becomes probable that the issuer or debtor will enter bankruptcy or other financial reorganisation;
• the disappearance of an active market for that financial asset because of financial difficulties; or
• observable data, including market prices, indicating that there is a potential decrease in the estimated future cash
flows since the initial recognition of those assets, including:
– adverse changes in the payment status of issuers; or
– national or local economic conditions that correlate with increased default risk.
For loans and receivables, impairment loss is determined using an analytical method based on knowledge of each loan
group or receivable. The method is usually based on historical statistics, adjusted for trends in the group of financial assets
or individual accounts.
Further details of the impairment of financial assets during the year are provided in note 23.
3.7 Impairment of goodwill and other intangible assets
For the purposes of impairment testing, goodwill and other intangible assets are grouped into cash-generating units. These
assets are tested for impairment by comparing the carrying amount of the cash-generating unit, including goodwill, to the
recoverable amount of that cash-generating unit. The determination of the recoverable amount requires significant
judgement regarding the selection of appropriate valuation techniques and assumptions. Further details of the impairment
of goodwill during the year are provided in note 13.

080
4. EXCHANGE RATES
The Group’s principal overseas operations during the reporting period were located within the Asia-Pacific region. The
results and cash flows of these operations have been translated into US dollars at the following average rates:
US dollar exchange rates
Year ended 30 November
2017
Year ended 30 November
2016
Hong Kong 7.79 7.76
Thailand 34.15 35.30
Singapore 1.39 1.38
Malaysia 4.33 4.13
China 6.78 6.60
Assets and liabilities have been translated at the following year-end rates:
US dollar exchange rates
As at 30 November
2017
As at 30 November
2016
Hong Kong 7.81 7.76
Thailand 32.62 35.61
Singapore 1.35 1.43
Malaysia 4.09 4.47
China 6.61 6.89
Exchange rates are expressed in units of local currency per US$1.

081
5. OPERATING PROFIT AFTER TAX
Operating profit after tax may be reconciled to net profit as follows:
US$m Note
Year ended 30 November
2017
Year ended 30 November
2016
Operating profit after tax 7 4,682 4,013
Non-operating items, net of related changes in insurance and investment contract liabilities:
Short-term fluctuations in investment return related to equities and real estate (net of tax of 2017: US$(117)m; 2016: US$(4)m) 1,764 97
Other non-operating investment return and other items (net of tax of 2017: US$40m; 2016: US$169m) (259) 102
Net profit 6,187 4,212
Operating profit after tax attributable to:
Shareholders of AIA Group Limited 4,647 3,981
Non-controlling interests 35 32
Net profit attributable to:
Shareholders of AIA Group Limited 6,120 4,164
Non-controlling interests 67 48
Operating profit is determined using, among others, expected long-term investment return for equities and real estate.
Short-term fluctuations between expected long-term investment return and actual investment return for these asset
classes are excluded from operating profit. The investment return assumptions used to determine expected long-term
investment return are based on the same assumptions used by the Group in determining its embedded value and are
disclosed in the Supplementary Embedded Value Information.
6. TOTAL WEIGHTED PREMIUM INCOME AND ANNUALISED NEW PREMIUMS
For management decision-making and internal performance management purposes, the Group measures business
volumes during the year using a performance measure referred to as total weighted premium income (TWPI). The Group
measures new business activity using a performance measure referred to as annualised new premiums (ANP). The
presentation of this note is consistent with our reportable segment presentation in note 7.
TWPI consists of 100 per cent of renewal premiums, 100 per cent of first year premiums and 10 per cent of single premiums,
before reinsurance ceded, and includes deposits and contributions for contracts that are accounted for as deposits in
accordance with the Group’s accounting policies.
Management considers that TWPI provides an indicative volume measure of transactions undertaken in the reporting
period that have the potential to generate profits for shareholders. The amounts shown are not intended to be indicative of
premiums and fee income recorded in the consolidated income statement.

082
6. TOTAL WEIGHTED PREMIUM INCOME AND ANNUALISED NEW PREMIUMS (continued)
ANP is a key internal measure of new business activities, which consists of 100 per cent of annualised first year premiums
and 10 per cent of single premiums, before reinsurance ceded. ANP excludes new business of pension business, personal
lines and motor insurance.
TWPIUS$m
Year ended 30 November
2017
Year ended 30 November
2016
TWPI by geography
Hong Kong 9,434 6,873
Thailand 3,517 3,327
Singapore 2,421 2,276
Malaysia 1,823 1,795
China 3,092 2,384
Other Markets 5,860 5,478
Total 26,147 22,133
First year premiums by geography
Hong Kong 2,586 2,065
Thailand 477 439
Singapore 277 261
Malaysia 286 276
China 928 585
Other Markets 925 872
Total 5,479 4,498
Single premiums by geography
Hong Kong 2,417 1,761
Thailand 194 163
Singapore 1,433 1,443
Malaysia 187 167
China 150 194
Other Markets 622 619
Total 5,003 4,347
Renewal premiums by geography
Hong Kong 6,606 4,632
Thailand 3,021 2,872
Singapore 2,001 1,871
Malaysia 1,518 1,502
China 2,149 1,779
Other Markets 4,873 4,544
Total 20,168 17,200

083
6. TOTAL WEIGHTED PREMIUM INCOME AND ANNUALISED NEW PREMIUMS (continued)
ANPUS$m
Year ended 30 November
2017
Year ended 30 November
2016
ANP by geography
Hong Kong 2,849 2,294
Thailand 518 471
Singapore 433 427
Malaysia 348 341
China 968 621
Other Markets 976 969
Total 6,092 5,123
7. SEGMENT INFORMATION
The Group’s operating segments, based on the reports received by the ExCo, are each of the geographical markets in which
the Group operates. Each of the reportable segments, other than the “Group Corporate Centre” segment, writes life
insurance business, providing life insurance, accident and health insurance and savings plans to customers in its local
market, and distributes related investment and other financial services products. The reportable segments are Hong Kong
(including Macau), Thailand, Singapore (including Brunei), Malaysia, China, Other Markets and Group Corporate Centre.
Other Markets includes the Group’s operations in Australia (including New Zealand), Cambodia, Indonesia, Korea, the
Philippines, Sri Lanka, Taiwan, Vietnam and India. The activities of the Group Corporate Centre segment consist of the
Group’s corporate functions, shared services and eliminations of intragroup transactions.
As each reportable segment other than the Group Corporate Centre segment focuses on serving the life insurance needs
of its local market, there are limited transactions between reportable segments. The key performance indicators reported
in respect of each segment are:
• ANP;
• TWPI;
• investment return;
• operating expenses;
• operating profit after tax attributable to shareholders of AIA Group Limited;
• expense ratio, measured as operating expenses divided by TWPI;
• operating margin, measured as operating profit after tax expressed as a percentage of TWPI; and
• operating return on shareholders’ allocated equity measured as operating profit after tax attributable to shareholders
of AIA Group Limited expressed as a percentage of the simple average of opening and closing shareholders’ allocated
segment equity (being the segment assets less segment liabilities in respect of each reportable segment less non-
controlling interests and fair value reserve).
In presenting net capital in/(out) flows to reportable segments, capital outflows consist of dividends and profit distributions
to the Group Corporate Centre segment and capital inflows consist of capital injections into reportable segments by the
Group Corporate Centre segment. For the Group, net capital in/(out) flows reflect the net amount received from shareholders
by way of capital contributions less amounts distributed by way of dividends.
Business volumes in respect of the Group’s five largest customers are less than 30 per cent of premiums and fee income.

084
7. SEGMENT INFORMATION (continued)
US$m Hong Kong Thailand Singapore Malaysia ChinaOther
Markets
Group Corporate
Centre Total
Year ended 30 November 2017
ANP 2,849 518 433 348 968 976 – 6,092
TWPI 9,434 3,517 2,421 1,823 3,092 5,860 – 26,147
Net premiums, fee income and other operating revenue (net of reinsurance ceded) 10,828 3,532 2,837 1,610 3,006 3,888 7 25,708
Investment return 2,148 1,189 1,083 547 734 1,057 338 7,096
Total revenue 12,976 4,721 3,920 2,157 3,740 4,945 345 32,804
Net insurance and investment contract benefits 9,454 2,659 2,822 1,439 2,406 2,603 4 21,387
Commission and other acquisition expenses 1,213 739 347 210 181 752 1 3,443
Operating expenses 407 199 181 164 278 552 188 1,969
Finance costs and other expenses 117 49 27 11 28 42 126 400
Total expenses 11,191 3,646 3,377 1,824 2,893 3,949 319 27,199
Share of profit from associates and joint venture – – – – – – – –
Operating profit before tax 1,785 1,075 543 333 847 996 26 5,605
Tax on operating profit before tax (137) (210) (39) (59) (208) (217) (53) (923)
Operating profit after tax 1,648 865 504 274 639 779 (27) 4,682
Operating profit after tax attributable to:
Shareholders of AIA Group
Limited 1,636 865 504 272 639 758 (27) 4,647
Non-controlling interests 12 – – 2 – 21 – 35
Key operating ratios:
Expense ratio 4.3% 5.7% 7.5% 9.0% 9.0% 9.4% – 7.5%
Operating margin 17.5% 24.6% 20.8% 15.0% 20.7% 13.3% – 17.9%
Operating return on shareholders’ allocated equity 23.6% 17.5% 18.5% 19.1% 20.4% 12.8% – 14.2%
Operating profit before tax includes:
Finance costs 29 6 – – 16 2 104 157
Depreciation and amortisation 37 10 16 17 17 40 12 149

085
7. SEGMENT INFORMATION (continued)
US$m Hong Kong Thailand Singapore Malaysia ChinaOther
Markets
Group Corporate
Centre Total
30 November 2017
Total assets 65,485 31,319 35,922 14,347 19,915 37,145 11,558 215,691
Total liabilities 54,023 24,358 32,501 12,806 16,789 29,172 3,670 173,319
Total equity 11,462 6,961 3,421 1,541 3,126 7,973 7,888 42,372
Shareholders’ allocated equity 7,909 5,510 2,961 1,524 3,391 6,430 7,933 35,658
Net capital (out)/in flows (952) (467) (238) (192) (207) (50) 866 (1,240)
Total assets include:
Investments in associates and joint venture – – 1 6 – 635 – 642
Segment information may be reconciled to the consolidated income statement as shown below:
US$mSegment
information
Short-term fluctuations in
investment return related
to equities and real estate
Other non-operating
items(1)
Consolidated income
statement
Year ended 30 November 2017
Net premiums, fee income and other operating revenue 25,708 – – 25,708
Net premiums, fee income and other operating revenue
Investment return 7,096 2,314 3,212 12,622 Investment return
Total revenue 32,804 2,314 3,212 38,330 Total revenue
Net insurance and investment contract benefits 21,387 433 3,021 24,841
Net insurance and investment contract benefits
Other expenses 5,812 – 362 6,174 Other expenses
Total expenses 27,199 433 3,383 31,015 Total expenses
Share of profit from associates and joint venture – – – –
Share of profit from associates and joint venture
Operating profit before tax 5,605 1,881 (171) 7,315 Profit before tax
Note:
(1) Include unit-linked contracts.

086
7. SEGMENT INFORMATION (continued)
US$m Hong Kong Thailand Singapore Malaysia ChinaOther
Markets
Group Corporate
Centre Total
Year ended 30 November 2016
ANP 2,294 471 427 341 621 969 – 5,123
TWPI 6,873 3,327 2,276 1,795 2,384 5,478 – 22,133
Net premiums, fee income and other operating revenue (net of reinsurance ceded) 7,172 3,271 2,659 1,621 2,267 3,655 (4) 20,641
Investment return 1,788 1,056 1,024 541 663 1,025 327 6,424
Total revenue 8,960 4,327 3,683 2,162 2,930 4,680 323 27,065
Net insurance and investment contract benefits 6,311 2,541 2,672 1,474 1,937 2,588 (11) 17,512
Commission and other acquisition expenses 790 609 303 183 146 655 – 2,686
Operating expenses 310 184 161 163 235 515 184 1,752
Finance costs and other expenses 104 38 16 11 12 43 110 334
Total expenses 7,515 3,372 3,152 1,831 2,330 3,801 283 22,284
Share of losses from associates and joint venture – – – – – (5) – (5)
Operating profit before tax 1,445 955 531 331 600 874 40 4,776
Tax on operating profit before tax (101) (187) (78) (64) (131) (192) (10) (763)
Operating profit after tax 1,344 768 453 267 469 682 30 4,013
Operating profit after tax attributable to:
Shareholders of AIA Group
Limited 1,334 768 453 265 469 662 30 3,981
Non-controlling interests 10 – – 2 – 20 – 32
Key operating ratios:
Expense ratio 4.5% 5.5% 7.1% 9.1% 9.9% 9.4% – 7.9%
Operating margin 19.6% 23.1% 19.9% 14.9% 19.7% 12.4% – 18.1%
Operating return on shareholders’ allocated equity 22.9% 19.0% 19.1% 19.7% 17.0% 13.5% – 14.1%
Operating profit before tax includes:
Finance costs 28 5 7 2 19 2 86 149
Depreciation and amortisation 23 9 13 17 13 37 15 127

087
7. SEGMENT INFORMATION (continued)
US$m Hong Kong Thailand Singapore Malaysia ChinaOther
Markets
Group Corporate
Centre Total
30 November 2016
Total assets 52,916 26,800 31,087 12,409 18,672 33,011 10,179 185,074
Total liabilities 45,166 21,163 28,345 11,079 15,064 25,881 3,066 149,764
Total equity 7,750 5,637 2,742 1,330 3,608 7,130 7,113 35,310
Shareholders’ allocated equity 5,935 4,400 2,502 1,331 2,864 5,369 7,231 29,632
Net capital (out)/in flows (1,034) (411) (209) (186) (46) 175 608 (1,103)
Total assets include:
Investments in associates and joint venture – – 1 6 – 643 – 650
Segment information may be reconciled to the consolidated income statement as shown below:
US$mSegment
information
Short-term fluctuations in
investment return related to
equities and real estate
Other non-operating
items(1)
Consolidated income
statement
Year ended 30 November 2016
Net premiums, fee income and other operating revenue 20,641 – – 20,641
Net premiums, fee income and other operating revenue
Investment return 6,424 42 1,089 7,555 Investment return
Total revenue 27,065 42 1,089 28,196 Total revenue
Net insurance and investment contract benefits 17,512 (59) 768 18,221
Net insurance and investment contract benefits
Other expenses 4,772 – 326 5,098 Other expenses
Total expenses 22,284 (59) 1,094 23,319 Total expenses
Share of losses from associates and joint venture (5) – – (5)
Share of losses from associates and joint venture
Operating profit before tax 4,776 101 (5) 4,872 Profit before tax
Note:
(1) Include unit-linked contracts.

088
8. REVENUE
Investment return
US$m
Year ended 30 November
2017
Year ended 30 November
2016
Interest income 5,599 5,290
Dividend income 695 654
Rental income 151 140
Investment income 6,445 6,084
Available for sale
Net realised gains from debt securities 180 25
Impairment of debt securities – (22)
Net gains of available for sale financial assets reflected in the consolidated
income statement 180 3
At fair value through profit or loss
Net gains of financial assets designated at fair value through profit or loss
Net (losses)/gains of debt securities (89) 125
Net gains of equity securities 5,789 934
Net gains of financial instruments held for trading
Net losses of debt investments – (1)
Net fair value movement on derivatives 513 39
Net gains in respect of financial instruments at fair value through profit or loss 6,213 1,097
Net fair value movement of investment property 367 288
Net foreign exchange (losses)/gains (560) 75
Other net realised (losses)/gains (23) 8
Investment experience 6,177 1,471
Investment return 12,622 7,555
Foreign currency movements resulted in the following (losses)/gains recognised in the consolidated income statement
(other than gains and losses arising on items measured at fair value through profit or loss):
US$m
Year ended 30 November
2017
Year ended 30 November
2016
Foreign exchange (losses)/gains (238) 36
Other operating revenue
The balance of other operating revenue largely consists of asset management fees.

089
9. EXPENSES
US$m
Year ended 30 November
2017
Year ended 30 November
2016
Insurance contract benefits 11,530 10,501
Change in insurance contract liabilities 13,366 8,594
Investment contract benefits 1,212 245
Insurance and investment contract benefits 26,108 19,340
Insurance and investment contract benefits ceded (1,267) (1,119)
Insurance and investment contract benefits, net of reinsurance ceded 24,841 18,221
Commission and other acquisition expenses incurred 5,696 4,786
Deferral and amortisation of acquisition costs (2,241) (2,051)
Commission and other acquisition expenses 3,455 2,735
Employee benefit expenses 1,243 1,168
Depreciation 65 64
Amortisation 53 37
Operating lease rentals 147 122
Other operating expenses 461 361
Operating expenses 1,969 1,752
Investment management expenses and others 397 340
Depreciation on property held for own use 22 21
Restructuring and other non-operating costs(1) 142 82
Change in third-party interests in consolidated investment funds 6 19
Other expenses 567 462
Finance costs 183 149
Total 31,015 23,319
Other operating expenses include auditors’ remuneration of US$20m (2016: US$15m), an analysis of which is set out
below:
US$m
Year ended 30 November
2017
Year ended 30 November
2016
Audit services 14 12
Non-audit services, including:
Audit-related services(2) 4 1
Tax services 1 1
Other services 1 1
Total 20 15
Notes:
(1) Restructuring costs represent costs related to restructuring programmes and are primarily comprised of redundancy and contract termination costs. Other non-operating costs primarily consist of acquisition-related and integration expenses.
(2) Audit-related services for 2017 include the audit of the Supplementary Embedded Value Information as at and for the year ended 30 November 2017 (2016: nil).
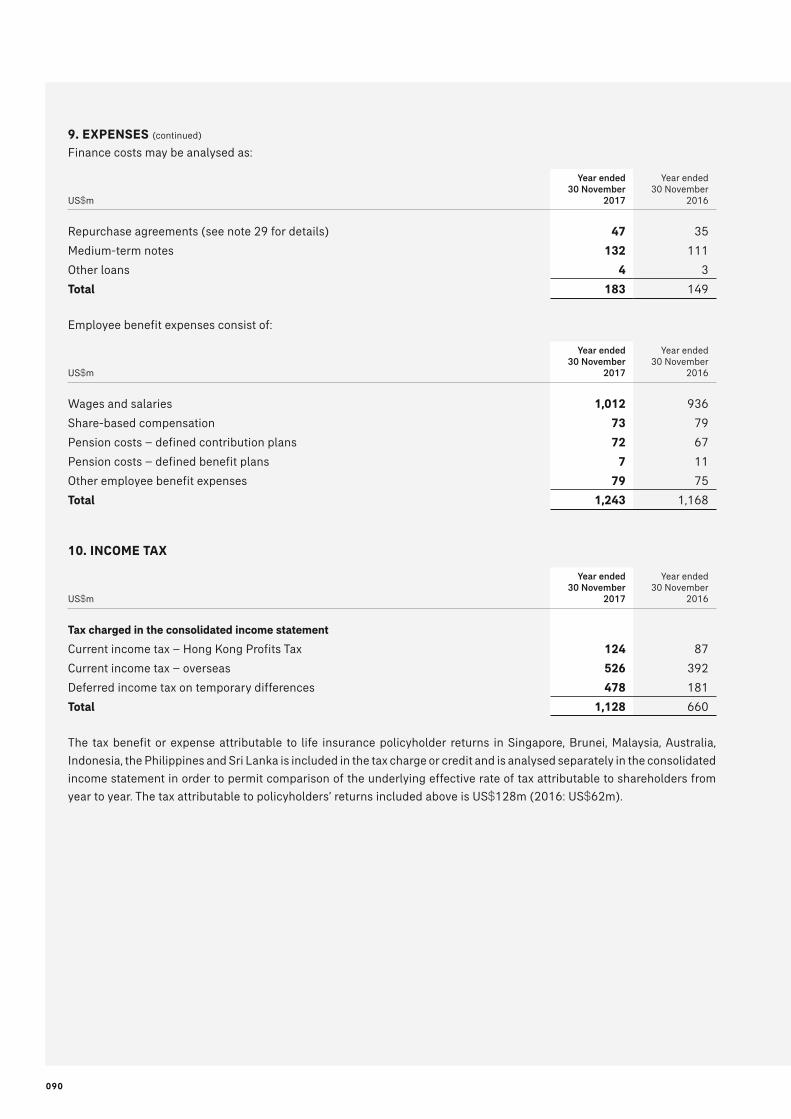
090
9. EXPENSES (continued)
Finance costs may be analysed as:
US$m
Year ended 30 November
2017
Year ended 30 November
2016
Repurchase agreements (see note 29 for details) 47 35
Medium-term notes 132 111
Other loans 4 3
Total 183 149
Employee benefit expenses consist of:
US$m
Year ended 30 November
2017
Year ended 30 November
2016
Wages and salaries 1,012 936
Share-based compensation 73 79
Pension costs – defined contribution plans 72 67
Pension costs – defined benefit plans 7 11
Other employee benefit expenses 79 75
Total 1,243 1,168
10. INCOME TAX
US$m
Year ended 30 November
2017
Year ended 30 November
2016
Tax charged in the consolidated income statement
Current income tax – Hong Kong Profits Tax 124 87
Current income tax – overseas 526 392
Deferred income tax on temporary differences 478 181
Total 1,128 660
The tax benefit or expense attributable to life insurance policyholder returns in Singapore, Brunei, Malaysia, Australia,
Indonesia, the Philippines and Sri Lanka is included in the tax charge or credit and is analysed separately in the consolidated
income statement in order to permit comparison of the underlying effective rate of tax attributable to shareholders from
year to year. The tax attributable to policyholders’ returns included above is US$128m (2016: US$62m).

091
10. INCOME TAX (continued)
The provision for Hong Kong Profits Tax is calculated at 16.5 per cent. Taxation for overseas subsidiaries and branches is
charged at the appropriate current rates of taxation ruling in the relevant jurisdictions of which the most significant
jurisdictions are outlined below.
Year ended 30 November
2017
Year ended 30 November
2016
Hong Kong 16.5% 16.5%
Thailand 20% 20%
Singapore 17% 17%
Malaysia 24% 24%
China 25% 25%
Others 12% – 30% 12% – 30%
The table above reflects the principal rate of corporate income tax as at the end of each year. The rates reflect enacted or
substantively enacted corporate tax rates throughout the year in each jurisdiction.
The table above does not include prospective changes in corporate income tax rates for Korea and Taiwan, which were
enacted after 30 November 2017. For Korea, the corporate income tax rate for the portion of taxable income that exceeds
300 billion Korean Won will increase from 24.2% to 27.5% for fiscal year 2018 and onwards. For Taiwan, the corporate
income tax rate will increase from 17% to 20% for fiscal year 2018 and onwards. Accordingly, the financial impact of these
changes in corporate income tax rate have not been reflected in the consolidated financial statements.
During the year of 2016, Thailand enacted a permanent change in the corporate income tax rate from 30 per cent to 20 per
cent from assessment year 2016 onwards. The decrease in tax rate resulted in a reduction in deferred tax liabilities of
US$314m, of which US$181m was recognised in profit or loss and US$133m was recognised in other comprehensive
income for the year ended 30 November 2016.

092
10. INCOME TAX (continued)
US$m
Year ended 30 November
2017
Year ended 30 November
2016
Income tax reconciliation
Profit before income tax 7,315 4,872
Tax calculated at domestic tax rates applicable to profits in the respective jurisdictions 1,361 935
Reduction in tax payable from:
Life insurance tax(1) (108) –
Exempt investment income (266) (166)
Amount over-provided in prior years (10) (23)
Changes in tax rate and law – (181)
Others (83) (65)
(467) (435)
Increase in tax payable from:
Life insurance tax (1) – 18
Withholding taxes 17 1
Disallowed expenses 132 81
Unrecognised deferred tax assets 19 30
Provisions for uncertain tax positions 66 30
234 160
Total income tax expense 1,128 660
Note:
(1) Life insurance tax refers to the permanent differences which arise where the tax regime specific to the life insurance business does not adopt net income as the basis for calculating taxable profit, for example Hong Kong, where life business taxable profit is derived from life premiums.

093
10. INCOME TAX (continued)
The movement in net deferred tax liabilities in the period may be analysed as set out below:
US$m
Net deferred tax asset/
(liability) at 1 December
Credited/(charged) to
the income statement
Credited/(charged) to other comprehensive income Net deferred
tax asset/(liability)
at year endFair value
reserve(2)Foreign
exchange Others
30 November 2017
Revaluation of financial instruments (1,387) (52) 316 (33) – (1,156)
Deferred acquisition costs (2,196) (214) – (136) – (2,546)
Insurance and investment contract liabilities 1,094 (78) – 70 – 1,086
Withholding taxes (132) (16) – 1 – (147)
Provision for expenses 110 29 – 7 – 146
Losses available for offset against future taxable income 69 (39) – 1 – 31
Life surplus (1) (534) (100) – (40) – (674)
Others (293) (8) – (11) (14) (326)
Total (3,269) (478) 316 (141) (14) (3,586)
30 November 2016
Revaluation of financial instruments (1,429) 26 14 2 – (1,387)
Deferred acquisition costs (2,409) 196 – 17 – (2,196)
Insurance and investment contract liabilities 1,477 (392) – 9 – 1,094
Withholding taxes (148) (1) – 17 – (132)
Provision for expenses 139 (29) – (1) 1 110
Losses available for offset against future taxable income 23 47 – (1) – 69
Life surplus (1) (525) (24) – 15 – (534)
Others (228) (4) – 5 (66) (293)
Total (3,100) (181) 14 63 (65) (3,269)
Notes:
(1) Life surplus relates to the temporary difference which arises where the taxable profits are based on actual distributions from the long-term fund. This primarily relates to Singapore and Malaysia.
(2) Of the fair value reserve deferred tax credit of US$316m for 2017 (2016: US$14m), US$297m (2016: US$8m) relates to fair value gains and losses on available for sale financial assets and US$19m (2016: US$6m) relates to fair value gains and losses on available for sale financial assets transferred to income on disposal and impairment.
Deferred tax assets are recognised to the extent that sufficient future taxable profits will be available for realisation. The
Group has not recognised deferred tax assets of US$52m (2016: US$59m) on tax losses and the temporary difference on
insurance and investment contract liabilities arising from different accounting and statutory/tax reserving methodology
for certain branches and subsidiaries on the basis that they have histories of tax losses and there is insufficient evidence
that future profits will be available.
The Group has not provided deferred tax liabilities of US$62m (2016: US$156m) in respect of unremitted earnings of
operations in two jurisdictions (2016: three jurisdictions) from which a withholding tax charge would be incurred upon
distribution as the Group does not consider it probable that this portion of accumulated earnings will be remitted in the
foreseeable future.
The Group has unused income tax losses carried forward in Hong Kong, Macau, Thailand, Malaysia, China, Korea, New
Zealand, the Philippines, Sri Lanka and Taiwan. The tax losses of Hong Kong, Malaysia, New Zealand and Sri Lanka can be
carried forward indefinitely. The tax losses of remaining branches and subsidiaries are due to expire within the periods
ending 2020 (Macau and the Philippines), 2022 (Thailand and China), 2025 (Taiwan) and 2027 (Korea).

094
11. EARNINGS PER SHARE
Basic
Basic earnings per share is calculated by dividing the net profit attributable to shareholders of AIA Group Limited by the
weighted average number of ordinary shares in issue during the year. The shares held by employee share-based trusts are
not considered to be outstanding from the date of the purchase for purposes of computing basic and diluted earnings per
share.
Year ended30 November
2017
Year ended30 November
2016
Net profit attributable to shareholders of AIA Group Limited (US$m) 6,120 4,164
Weighted average number of ordinary shares in issue (million) 12,000 11,972
Basic earnings per share (US cents per share) 51.00 34.78
Diluted
Diluted earnings per share is calculated by adjusting the weighted average number of ordinary shares outstanding to
assume conversion of all dilutive potential ordinary shares. As of 30 November 2017 and 2016, the Group has potentially
dilutive instruments which are the share options, restricted share units, restricted stock purchase units and restricted
stock subscription units awarded to eligible directors, officers, employees and agents under various share-based
compensation plans as described in note 38.
Year ended 30 November
2017
Year ended 30 November
2016
Net profit attributable to shareholders of AIA Group Limited (US$m) 6,120 4,164
Weighted average number of ordinary shares in issue (million) 12,000 11,972
Adjustment for share options, restricted share units, restricted stock purchase units and restricted stock subscription units awarded under share-based compensation plans (million) 37 34
Weighted average number of ordinary shares for diluted earnings per share (million) 12,037 12,006
Diluted earnings per share (US cents per share) 50.84 34.68
At 30 November 2017, 5,340,052 share options (2016: 14,937,248) were excluded from the diluted weighted average
number of ordinary shares calculation as their effect would have been anti-dilutive.
Operating profit after tax per share
Operating profit after tax (see note 5) per share is calculated by dividing the operating profit after tax attributable to
shareholders of AIA Group Limited by the weighted average number of ordinary shares in issue during the year. As of 30
November 2017 and 2016, the Group has potentially dilutive instruments which are the share options, restricted share
units, restricted stock purchase units and restricted stock subscription units awarded to eligible directors, officers,
employees and agents under various share-based compensation plans as described in note 38.
Year ended 30 November
2017
Year ended 30 November
2016
Basic (US cents per share) 38.73 33.25
Diluted (US cents per share) 38.61 33.16
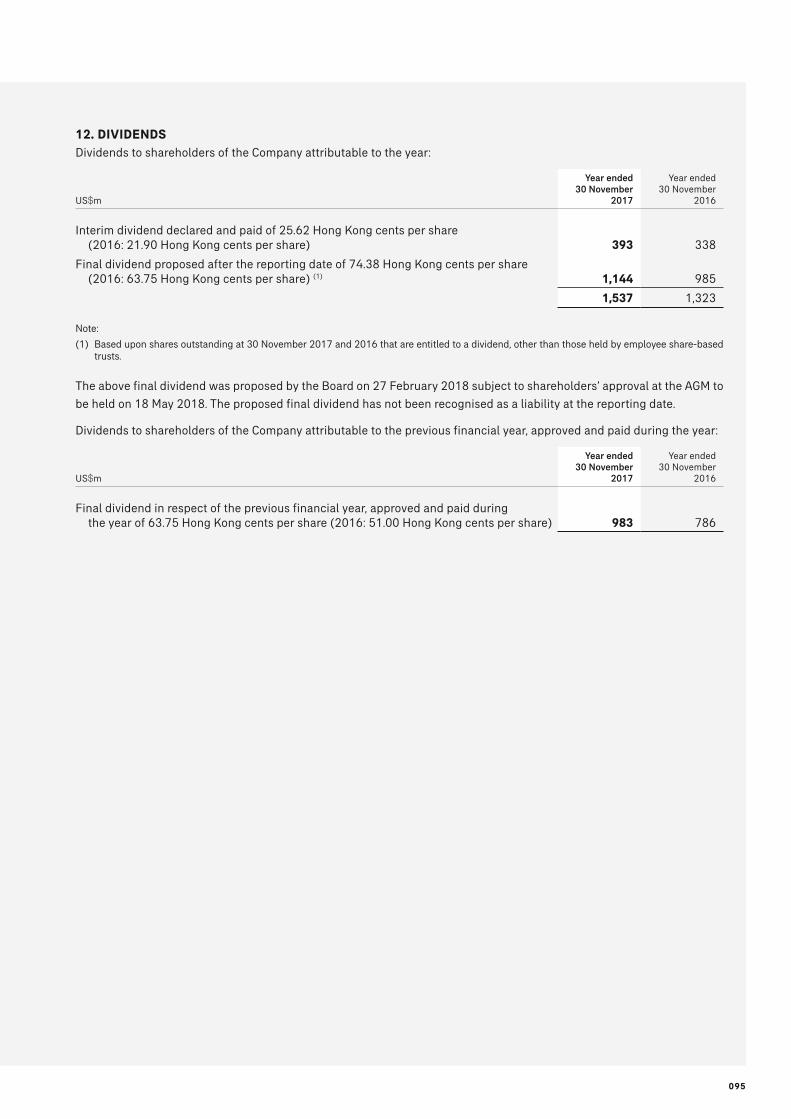
095
12. DIVIDENDS
Dividends to shareholders of the Company attributable to the year:
US$m
Year ended 30 November
2017
Year ended 30 November
2016
Interim dividend declared and paid of 25.62 Hong Kong cents per share (2016: 21.90 Hong Kong cents per share) 393 338
Final dividend proposed after the reporting date of 74.38 Hong Kong cents per share (2016: 63.75 Hong Kong cents per share) (1) 1,144 985
1,537 1,323
Note:
(1) Based upon shares outstanding at 30 November 2017 and 2016 that are entitled to a dividend, other than those held by employee share-based trusts.
The above final dividend was proposed by the Board on 27 February 2018 subject to shareholders’ approval at the AGM to
be held on 18 May 2018. The proposed final dividend has not been recognised as a liability at the reporting date.
Dividends to shareholders of the Company attributable to the previous financial year, approved and paid during the year:
US$m
Year ended 30 November
2017
Year ended 30 November
2016
Final dividend in respect of the previous financial year, approved and paid during the year of 63.75 Hong Kong cents per share (2016: 51.00 Hong Kong cents per share) 983 786

096
13. INTANGIBLE ASSETS
US$m GoodwillComputer
software
Distribution and other
rights Total
Cost
At 1 December 2015 808 405 870 2,083
Additions – 61 3 64
Disposals – (4) (1) (5)
Foreign exchange movements and others (33) (4) (57) (94)
At 30 November 2016 775 458 815 2,048
Additions – 53 77 130
Disposals – (2) – (2)
Foreign exchange movements 60 17 15 92
At 30 November 2017 835 526 907 2,268
Accumulated amortisation
At 1 December 2015 (4) (199) (46) (249)
Amortisation charge for the year – (36) (27) (63)
Disposals – 2 1 3
Foreign exchange movements – 1 3 4
At 30 November 2016 (4) (232) (69) (305)
Amortisation charge for the year – (51) (33) (84)
Foreign exchange movements – (14) (1) (15)
At 30 November 2017 (4) (297) (103) (404)
Net book value
At 30 November 2016 771 226 746 1,743
At 30 November 2017 831 229 804 1,864
The Group holds intangible assets for its long-term use and the annual amortisation charge of US$84m (2016: US$63m)
approximates the amount that is expected to be recovered through consumption within 12 months after the end of the
reporting period.
Impairment tests for goodwill
Goodwill arises primarily in respect of the Group’s insurance business in Malaysia. Goodwill is tested for impairment by
comparing the carrying amount of the cash-generating unit, including goodwill, to the recoverable amount of that cash-
generating unit. If the recoverable amount of the unit exceeds the carrying amount of the unit, the goodwill allocated to
that unit shall be regarded as not impaired. The recoverable amount is the value in use of the cash-generating unit unless
otherwise stated. The value in use is determined by calculating the present value of expected future cash flows plus a
multiple of the present value of the new business generated.
Value in use is calculated as an actuarially determined appraisal value, based on the embedded value of the business and
the value from future new business.
The key assumptions used in the embedded value calculations include investment returns, mortality, morbidity, persistency,
expenses and inflation. The value from future new business is calculated based on a combination of indicators which
include, among others, a multiple of the projected one-year value of new business (VONB), taking into account recent
production mix, business strategy and market trends. The Group may apply alternative method to estimate the value of
future new business if the described method is not appropriate under the circumstances.

097
14. INVESTMENTS IN ASSOCIATES AND JOINT VENTURE
US$m
Year ended 30 November
2017
Year ended 30 November
2016
Group
Investments in associates 636 650
Investment in joint venture 6 –
Total 642 650
Investments in associates and joint venture are held for their long-term contribution to the Group’s performance and so all
amounts are expected to be realised more than 12 months after the end of the reporting period.
The Group’s interests in its principal associates and joint venture are as follows:
Group’s interest %
Place of incorporation
Principal activity
Type of shares held
As at 30 November
2017
As at 30 November
2016
Tata AIA Life Insurance Company Limited India Insurance Ordinary 49% 49%
On 25 April 2016, the Group increased its shareholding of Tata AIA Life Insurance Company Limited from 26 per cent to 49
per cent.
All associates and joint venture are unlisted.
Aggregated financial information of associates and joint venture
The investments in the associates and joint venture are measured using the equity method. The following table analyses,
in aggregate, the carrying amount and share of profit and other comprehensive income of these associates and joint
venture.
US$m
Year ended30 November
2017
Year ended30 November
2016
Carrying amount in the statement of financial position 642 650
Losses from continuing operations – (5)
Other comprehensive (expenses)/income (24) 43
Total comprehensive (expenses)/income (24) 38

098
15. PROPERTY, PLANT AND EQUIPMENT
US$m
Property held for
own useComputer hardware
Fixtures and fittings and
others Total
Cost or revaluation
At 1 December 2015 615 207 357 1,179
Additions 3 19 131 153
Disposals (34) (36) (13) (83)
Net transfers from investment property 19 – – 19
Increase from valuation 312 – – 312
Foreign exchange movements (10) (2) (11) (23)
At 30 November 2016 905 188 464 1,557
Additions 1 23 66 90
Disposals (7) (21) (58) (86)
Net transfers to investment property (24) – – (24)
Increase from valuation 62 – – 62
Foreign exchange movements 42 11 18 71
At 30 November 2017 979 201 490 1,670
Accumulated depreciation
At 1 December 2015 (200) (172) (228) (600)
Depreciation charge for the year (15) (19) (45) (79)
Disposals 11 28 – 39
Revaluation adjustment 209 – – 209
Foreign exchange movements (5) 3 8 6
At 30 November 2016 – (160) (265) (425)
Depreciation charge for the year (16) (18) (47) (81)
Disposals 5 19 37 61
Revaluation adjustment 10 – – 10
Foreign exchange movements 1 (9) (14) (22)
At 30 November 2017 – (168) (289) (457)
Net book value
At 30 November 2016 905 28 199 1,132
At 30 November 2017 979 33 201 1,213
Properties held for own use are carried at fair value at the reporting date less accumulated depreciation. The fair value at
the reporting date is determined by independent professional valuers. Details of valuation techniques and process are
disclosed in notes 3 and 21.
During the reporting period, no expenditure (2016: nil) recognised in the carrying amount of property held for own use was
in the course of its construction. Increases from revaluation on property held for own use of US$72m (2016: US$521m)
were taken to other comprehensive income.
If property held for own use were stated on a historical cost basis, the carrying value would be US$373m (2016: US$393m).
The Group holds property, plant and equipment for its long-term use and, accordingly, the annual depreciation charge
approximates to the amount expected to be recovered through consumption within 12 months after the end of the reporting
period.

099
16. INVESTMENT PROPERTY
US$m
Fair value
At 1 December 2015 3,659
Additions and capitalised subsequent expenditures 60
Disposals (3)
Net transfers to property, plant and equipment (19)
Net transfers to other assets (40)
Fair value gain 288
Foreign exchange movements (35)
At 30 November 2016 3,910
Additions and capitalised subsequent expenditures 10
Disposals (12)
Net transfers from property, plant and equipment 24
Fair value gain 367
Foreign exchange movements 66
At 30 November 2017 4,365
Investment properties are carried at fair value at the reporting date as determined by independent professional valuers.
Details of valuation techniques and process are disclosed in notes 3 and 21.
The Group leases out its investment property under operating leases. The leases typically run for an initial period of one to
twelve years, with an option to renew the lease based on future negotiations. Lease payments are usually negotiated every
one to three years to reflect market rentals. There were not any material contingent rentals earned as income for the year.
Rental income generated from investment property amounted to US$151m (2016: US$140m). Direct operating expenses
(including repair and maintenance) on investment property that generates rental income amounted to US$31m (2016:
US$32m).
The Group owns investment property in the form of freehold land outside Hong Kong and leasehold land under finance
lease. Leasehold land under operating leases which is held for long-term rental or capital appreciation or both that is not
occupied by the Group is classified as investment property. They are initially recognised at cost with changes in fair values
in subsequent periods recognised in the consolidated income statement. The Group does not hold freehold land in Hong
Kong.
The future minimum operating lease rental income under non-cancellable operating leases that the Group expects to
receive in future periods may be analysed as follows:
US$m
As at30 November
2017
As at30 November
2016
Leases of investment property
Expiring no later than one year 135 121
Expiring later than one year and no later than five years 241 143
Expiring after five years or more 31 8
Total 407 272

100
17. REINSURANCE ASSETS
US$m
As at30 November
2017
As at30 November
2016
Amounts recoverable from reinsurers 506 335
Ceded insurance and investment contract liabilities 1,975 1,711
Total 2,481 2,046
18. DEFERRED ACQUISITION AND ORIGINATION COSTS
US$m
As at30 November
2017
As at30 November
2016
Carrying amount
Deferred acquisition costs on insurance contracts 21,345 18,351
Deferred origination costs on investment contracts 373 418
Value of business acquired 129 129
Total 21,847 18,898
Year ended30 November
2017
Year ended30 November
2016
Movements in the year
At beginning of financial year 18,898 17,092
Deferral and amortisation of acquisition and origination costs 2,318 2,057
Foreign exchange movements 833 (172)
Impact of assumption changes (77) (6)
Other movements (125) (73)
At end of financial year 21,847 18,898
Deferred acquisition and origination costs are expected to be recoverable over the mean term of the Group’s insurance and
investment contracts, and liability adequacy testing is performed at least annually to confirm their recoverability.
Accordingly, the annual amortisation charge, which varies with investment performance for certain universal life and unit-
linked products, approximates to the amount which is expected to be realised within 12 months of the end of the reporting
period.

101
19. FINANCIAL INVESTMENTS
The following tables analyse the Group’s financial investments by type and nature. The Group manages its financial
investments in two distinct categories: Unit-linked Investments and Policyholder and Shareholder Investments. The
investment risk in respect of Unit-linked Investments is generally wholly borne by our customers, and does not directly
affect the profit for the year before tax. Furthermore, unit-linked contract holders are responsible for allocation of their
policy values amongst investment options offered by the Group. Although profit for the year before tax is not affected by
Unit-linked Investments, the investment return from such financial investments is included in the Group’s profit for the
year before tax, as the Group has elected the fair value option for all Unit-linked Investments with corresponding changes
in insurance and investment contract liabilities for unit-linked contracts. Policyholder and Shareholder Investments
include all financial investments other than Unit-linked Investments. The investment risk in respect of Policyholder and
Shareholder Investments is partially or wholly borne by the Group.
Policyholder and Shareholder Investments are further categorised as Participating Funds and Other Policyholder and
Shareholder. The Group has elected to separately analyse financial investments held by Participating Funds within
Policyholder and Shareholder Investments as they are subject to local regulations that generally prescribe a minimum
proportion of policyholder participation in declared dividends. The Group has elected the fair value option for debt and
equity securities of Participating Funds. The Group’s accounting policy is to record an insurance liability for the proportion
of net assets of the Participating Funds that would be allocated to policyholders assuming all performance would be
declared as a dividend based upon local regulations as at the date of the statement of financial position. As a result the
Group’s net profit for the year before tax is impacted by the proportion of investment return that would be allocated to
shareholders as described above.
Other Policyholder and Shareholder Investments are distinct from Unit-linked Investments and Participating Funds as
there is not any direct contractual or regulatory requirement governing the amount, if any, for allocation to policyholders.
The Group has elected to apply the fair value option for equity securities in this category and the available for sale
classification in respect of the majority of debt securities in this category. The investment risk from investments in this
category directly impacts the Group’s financial statements. Although a proportion of investment return may be allocated to
policyholders through policyholder dividends, the Group’s accounting policy for insurance and certain investment contract
liabilities utilises a net level premium methodology that includes best estimates as at the date of issue for non-guaranteed
participation. To the extent investment return from these investments either is not allocated to participating contracts or
varies from the best estimates, it will impact the Group’s profit before tax.
In the following tables, “FVTPL” indicates financial investments classified at fair value through profit or loss and “AFS”
indicates financial investments classified as available for sale.
Debt securities
In compiling the tables, external ratings have been used where available. Where external ratings are not readily available
an internal rating methodology has been adopted, if applicable. External ratings for government bonds are based on issuers
as well as currencies of issuances. The following conventions have been adopted to conform the various ratings.
External ratings Internal ratings Reported as
Standard and Poor’s Moody’s
AAA Aaa 1 AAA
AA+ to AA- Aa1 to Aa3 2+ to 2- AA
A+ to A- A1 to A3 3+ to 3- A
BBB+ to BBB- Baa1 to Baa3 4+ to 4- BBB
BB+ and below Ba1 and below 5+ and below Below investment grade(1)
Note:
(1) Unless otherwise identified individually.

102
19. FINANCIAL INVESTMENTS (continued)
Debt securities (continued)
Debt securities by type comprise the following:
Policyholder and shareholderConsolidated
investment funds(3)
Participating funds
Other policyholder and shareholder Unit-linked
US$m Rating FVTPL FVTPL AFS Subtotal FVTPL FVTPL Total
30 November 2017
Government bonds
– issued in local currency
Thailand A – – 13,141 13,141 – – 13,141
China A 1,520 – 6,821 8,341 27 – 8,368
Korea AA – – 5,439 5,439 272 – 5,711
Singapore AAA 2,440 – 1,230 3,670 476 – 4,146
Philippines BBB – – 2,346 2,346 55 – 2,401
Malaysia A 1,249 – 562 1,811 25 – 1,836
United States AA 168 – 3,100 3,268 1 – 3,269
Indonesia BBB 77 25 379 481 55 – 536
Other(1) 6 – 744 750 2 – 752
Subtotal 5,460 25 33,762 39,247 913 – 40,160
Government bonds
– foreign currency
AAA – – – – 8 – 8
AA 36 – 799 835 25 – 860
A 90 – 831 921 16 – 937
BBB 95 45 1,677 1,817 185 – 2,002
Below investment grade – 12 53 65 – – 65
Subtotal 221 57 3,360 3,638 234 – 3,872
Government agency
bonds(2)
AAA 1,184 – 908 2,092 90 – 2,182
AA 367 – 3,517 3,884 63 263 4,210
A 2,084 3 3,051 5,138 38 56 5,232
BBB 198 10 1,493 1,701 5 – 1,706
Below investment grade 71 1 260 332 14 – 346
Subtotal 3,904 14 9,229 13,147 210 319 13,676
Notes:
(1) Of the total government bonds issued in local currency listed as “Other” at 30 November 2017, 44 per cent are rated as investment grade and a further 38 per cent are rated BB- and above. The remaining are rated below BB-.
(2) Government agency bonds comprise bonds issued by government-sponsored institutions such as national, provincial and municipal authorities; government-related entities; multilateral development banks and supranational organisations.
(3) Consolidated investment funds reflect 100 per cent of assets and liabilities held by such funds.

103
19. FINANCIAL INVESTMENTS (continued)
Debt securities (continued)
Policyholder and shareholderConsolidated
investment funds(3)
Participating funds
Other policyholder and shareholder Unit-linked
US$m FVTPL FVTPL AFS Subtotal FVTPL FVTPL Total
30 November 2017
Corporate bonds
AAA 46 – 431 477 5 – 482
AA 475 17 4,021 4,513 11 349 4,873
A 5,185 43 26,150 31,378 377 1,139 32,894
BBB 4,510 106 25,461 30,077 598 181 30,856
Below investment grade 679 19 2,421 3,119 191 – 3,310
Not rated – 2 – 2 177 – 179
Subtotal 10,895 187 58,484 69,566 1,359 1,669 72,594
Structured securities(4)
AAA – – 9 9 – – 9
AA – – 64 64 – – 64
A 18 – 301 319 – – 319
BBB 165 – 250 415 – – 415
Below investment grade – – 6 6 – – 6
Not rated 11 41 1 53 – – 53
Subtotal 194 41 631 866 – – 866
Total(5) 20,674 324 105,466 126,464 2,716 1,988 131,168
Notes:
(3) Consolidated investment funds reflect 100 per cent of assets and liabilities held by such funds.
(4) Structured securities include collateralised debt obligations, mortgage-backed securities and other asset-backed securities.
(5) Debt securities of US$4,900m are restricted due to local regulatory requirements.

104
19. FINANCIAL INVESTMENTS (continued)
Debt securities (continued)
Policyholder and shareholderConsolidated
investment funds(3)
Participating funds
Other policyholder and shareholder Unit-linked
US$m Rating FVTPL FVTPL AFS Subtotal FVTPL FVTPL Total
30 November 2016
Government bonds
– issued in local currency
Thailand A – – 11,313 11,313 – – 11,313
China AA 1,635 – 6,510 8,145 19 – 8,164
Korea AA – – 4,171 4,171 280 – 4,451
Singapore AAA 1,552 – 950 2,502 387 – 2,889
Philippines BBB – – 2,527 2,527 68 – 2,595
Malaysia A 1,185 – 414 1,599 22 – 1,621
United States AA 16 – 1,587 1,603 2 – 1,605
Indonesia BB 57 10 387 454 37 – 491
Other(1) – – 639 639 2 – 641
Subtotal 4,445 10 28,498 32,953 817 – 33,770
Government bonds
– foreign currency
AAA – – – – 3 – 3
AA 25 – 713 738 26 – 764
A 73 – 576 649 17 – 666
BBB 10 28 710 748 126 – 874
Below investment grade 77 29 717 823 50 – 873
Subtotal 185 57 2,716 2,958 222 – 3,180
Government agency
bonds(2)
AAA 1,107 – 782 1,889 105 34 2,028
AA 945 – 5,327 6,272 75 182 6,529
A 898 3 1,245 2,146 26 15 2,187
BBB 220 9 1,245 1,474 6 – 1,480
Below investment grade 30 – 121 151 3 – 154
Not rated – – – – 8 – 8
Subtotal 3,200 12 8,720 11,932 223 231 12,386
Notes:
(1) Of the total government bonds issued in local currency listed as “Other” at 30 November 2016, 49 per cent are rated as investment grade and a further 35 per cent are rated BB- and above. The remaining are rated below BB-.
(2) Government agency bonds comprise bonds issued by government-sponsored institutions such as national, provincial and municipal authorities; government-related entities; multilateral development banks and supranational organisations.
(3) Consolidated investment funds reflect 100 per cent of assets and liabilities held by such funds.

105
19. FINANCIAL INVESTMENTS (continued)
Debt securities (continued)
Policyholder and shareholderConsolidated
investment funds(3)
Participating funds
Other policyholder and shareholder Unit-linked
US$m FVTPL FVTPL AFS Subtotal FVTPL FVTPL Total
30 November 2016
Corporate bonds
AAA 48 – 237 285 4 46 335
AA 573 22 4,087 4,682 21 351 5,054
A 4,863 13 21,654 26,530 426 983 27,939
BBB 4,251 125 20,382 24,758 566 270 25,594
Below investment grade 876 8 3,044 3,928 140 3 4,071
Not rated – – 1 1 138 14 153
Subtotal 10,611 168 49,405 60,184 1,295 1,667 63,146
Structured securities(4)
AAA – – 20 20 – – 20
AA 13 – 79 92 – – 92
A 20 20 381 421 – – 421
BBB 223 – 270 493 1 – 494
Below investment grade – 50 – 50 – – 50
Not rated 10 46 3 59 – – 59
Subtotal 266 116 753 1,135 1 – 1,136
Total(5) 18,707 363 90,092 109,162 2,558 1,898 113,618
Notes:
(3) Consolidated investment funds reflect 100 per cent of assets and liabilities held by such funds.
(4) Structured securities include collateralised debt obligations, mortgage-backed securities and other asset-backed securities.
(5) Debt securities of US$3,964m are restricted due to local regulatory requirements.
The Group’s debt securities classified at fair value through profit or loss can be analysed as follows:
US$m
As at30 November
2017
As at30 November
2016
Debt securities – FVTPL
Designated at fair value through profit or loss 25,702 23,509
Held for trading – 17
Total 25,702 23,526

106
19. FINANCIAL INVESTMENTS (continued)
Equity securities
Equity securities by type comprise the following:
Policyholder and shareholder
Participating funds
Other policyholder
and shareholder Unit-linked
Consolidated investment
funds(1)
US$m FVTPL FVTPL Subtotal FVTPL FVTPL Total
30 November 2017
Equity shares 4,631 9,267 13,898 4,610 – 18,508
Interests in investment funds 2,191 1,674 3,865 14,343 – 18,208
Total 6,822 10,941 17,763 18,953 – 36,716
Policyholder and shareholder
Participating funds
Other policyholder
and shareholder Unit-linked
Consolidated investment
funds(1)
US$m FVTPL FVTPL Subtotal FVTPL FVTPL Total
30 November 2016
Equity shares 3,705 6,967 10,672 3,608 1 14,281
Interests in investment funds 1,746 2,295 4,041 11,886 3 15,930
Total 5,451 9,262 14,713 15,494 4 30,211
Note:
(1) Consolidated investment funds reflect 100 per cent of assets and liabilities held by such funds.
Debt and equity securities
US$m
As at30 November
2017
As at30 November
2016
Debt securities
Listed 100,647 86,105
Unlisted 30,521 27,513
Total 131,168 113,618
Equity securities
Listed 20,205 16,394
Unlisted(1) 16,511 13,817
Total 36,716 30,211
Note:
(1) Including US$15,375m (2016: US$13,067m) of investment funds which can be redeemed daily.

107
19. FINANCIAL INVESTMENTS (continued)
Interests in structured entities
The Group has determined that the investment funds and structured securities, such as collateralised debt obligations,
mortgage-backed securities and other asset-backed securities that the Group has interest are structured entities.
The Group has consolidated certain investment funds for which the Group provides guarantee on capital or rate of return
to the investors and deemed to have control based on an analysis of the guidance in IFRS 10. For these investment funds,
the Group has the ability to reduce the guaranteed rates of return, subject to obtaining approvals of applicable regulators.
The Group has an obligation to absorb losses in the event that the returns of the funds are insufficient to cover the capital
or rate of return guarantee provided to the investors.
The following table summarises the Group’s interest in unconsolidated structured entities:
As at 30 November 2017 As at 30 November 2016
US$mInvestment
fundsStructured securities(1)
Investment funds
Structured securities(1)
Available for sale debt securities 1,250(2) 631 939(2) 753
Debt securities at fair value through profit or loss 520(2) 235 489(2) 383
Equity securities at fair value through profit or loss 18,208 – 15,930 –
Total 19,978 866 17,358 1,136
Notes:
(1) Structured securities include collateralised debt obligation, mortgage-backed securities and other asset-backed securities.
(2) Balance represents the Group’s interests in debt securities issued by real estate investment trusts.
The Group’s maximum exposure to loss arising from its interests in these unconsolidated structured entities is limited to
the carrying amount of the assets. Dividend income and interest income are received during the reporting period from
these interests in unconsolidated structured entities.
In addition, the Group receives management fees and trustee fees in respect of providing trustee, management and
administrative services to certain retirement scheme funds and investment funds. These funds are not held and the
associated investment risks are not borne by the Group, the Group does not have exposure to loss in these funds.

108
19. FINANCIAL INVESTMENTS (continued)
Loans and deposits
US$m
As at 30 November
2017
As at 30 November
2016
Policy loans 2,726 2,448
Mortgage loans on residential real estate 600 546
Mortgage loans on commercial real estate 53 51
Other loans 889 737
Allowance for loan losses (12) (13)
Loans 4,256 3,769
Term deposits 2,138 1,847
Promissory notes(1) 1,579 1,446
Total 7,973 7,062
Note:
(1) The promissory notes are issued by a government.
Certain term deposits with financial institutions and promissory notes are restricted due to local regulatory requirements
or other pledge restrictions. The restricted balance held within term deposits and promissory notes is US$1,749m (2016:
US$1,638m).
Other loans include receivables from reverse repurchase agreements under which the Group does not take physical
possession of securities purchased under the agreements. Sales or transfers of securities are not permitted by the
respective clearing house on which they are registered while the loan is outstanding. In the event of default by the
counterparty to repay the loan, the Group has the right to the underlying securities held by the clearing house. At 30
November 2017, the carrying value of such receivables is US$326m (2016: US$224m).

109
20. DERIVATIVE FINANCIAL INSTRUMENTS
The Group’s non-hedge derivative exposure was as follows:
Fair value
US$m Notional amount Assets Liabilities
30 November 2017
Foreign exchange contracts
Cross-currency swaps 7,569 249 (164)
Forwards 5,921 47 (142)
Foreign exchange futures 139 – –
Currency options 7 – –
Total foreign exchange contracts 13,636 296 (306)
Interest rate contracts
Interest rate swaps 3,157 51 (55)
Other
Warrants and options 161 16 –
Netting (139) – –
Total 16,815 363 (361)
30 November 2016
Foreign exchange contracts
Cross-currency swaps 7,660 28 (567)
Forwards 1,710 36 (6)
Foreign exchange futures 192 – –
Currency options 13 – –
Total foreign exchange contracts 9,575 64 (573)
Interest rate contracts
Interest rate swaps 1,851 30 (35)
Other
Warrants and options 1,520 13 (36)
Netting (192) – –
Total 12,754 107 (644)
The column “notional amount” in the above table represents the pay leg of derivative transactions other than equity index
option. For certain equity-index call and put options with same notional amount that are purchased to hedge the downside
risk of the underlying equities by means of a collar strategy, the notional amount represents the exposure of the hedged
equities.
Of the total derivatives, US$8m (2016: US$12m) are listed in exchange or dealer markets and the rest are over-the-counter
(OTC) derivatives. OTC derivative contracts are individually negotiated between contracting parties and not cleared through
an exchange. OTC derivatives include forwards, swaps and options. Derivatives are subject to various risks including
market, liquidity and credit risks, similar to those related to the underlying financial instruments.
Derivative assets and derivative liabilities are recognised in the consolidated statement of financial position as financial
assets at fair value through profit or loss and derivative financial liabilities respectively. The Group’s derivative contracts
are established to economic hedge financial exposures. The Group adopts hedge accounting in limited circumstances. The
notional or contractual amounts associated with derivative financial instruments are not recorded as assets or liabilities in
the consolidated statement of financial position as they do not represent the fair value of these transactions. The notional
amounts in the previous table reflect the aggregate of individual derivative positions on a gross basis and so give an
indication of the overall scale of derivative transactions.

110
20. DERIVATIVE FINANCIAL INSTRUMENTS (continued)
Foreign exchange contracts
Foreign exchange forward and futures contracts represent agreements to exchange the currency of one country for the
currency of another country at an agreed price and settlement date. Currency options are agreements that give the buyer
the right to exchange the currency of one country for the currency of another country at agreed prices and settlement
dates. Currency swaps are contractual agreements that involve the exchange of both periodic and final amounts in two
different currencies. Exposure to gains and losses on the foreign exchange contracts will increase or decrease over their
respective lives as a function of maturity dates, interest and foreign exchange rates, implied volatilities of the underlying
indices and the timing of payments.
Interest rate swaps
Interest rate swaps are contractual agreements between two parties to exchange periodic payments in the same currency,
each of which is computed on a different interest rate basis, on a specified notional amount. Most interest rate swaps
involve the net exchange of payments calculated as the difference between the fixed and floating rate interest payments.
Other derivatives
Warrants and options are option agreements that give the owner the right to buy or sell securities at an agreed price and
settlement date.
Netting adjustment
The netting adjustment is related to futures contracts executed through clearing house where the settlement arrangement
satisfied the netting criteria under IFRS.
Collateral under derivative transactions
At 30 November 2017, the Group had posted cash collateral of US$10m (2016: US$188m) and pledged debt securities
with carrying value of US$227m (2016: US$440m) for liabilities and held cash collateral of US$141m (2016: US$6m),
debt securities collateral with carrying value of US$15m (2016: US$5m) for assets in respect of derivative transactions.
The Group did not sell or repledge the collateral received. These transactions are conducted under terms that are usual and
customary to collateralised transactions including, where relevant, standard repurchase agreements.

111
21. FAIR VALUE MEASUREMENT
Fair value of financial instruments
The Group classifies all financial assets as either at fair value through profit or loss, or as available for sale, which are
carried at fair value, or as loans and receivables, which are carried at amortised cost. Financial liabilities are classified as
either at fair value through profit or loss or at amortised cost, except for investment contracts with DPF which are accounted
for under IFRS 4.
The following tables present the fair values of the Group’s financial assets and financial liabilities:
Fair value
US$m Notes
Fair value through
profit or lossAvailable
for sale
Cost/amortised
cost
Total carrying
valueTotal fair
value
30 November 2017
Financial investments 19
Loans and deposits – – 7,973 7,973 7,977
Debt securities 25,702 105,466 – 131,168 131,168
Equity securities 36,716 – – 36,716 36,716
Derivative financial instruments 20 363 – – 363 363
Reinsurance receivables 17 – – 506 506 506
Other receivables 22 – – 2,150 2,150 2,150
Accrued investment income 22 – – 1,541 1,541 1,541
Cash and cash equivalents 24 – – 2,289 2,289 2,289
Financial assets 62,781 105,466 14,459 182,706 182,710
Notes
Fair value through
profit or loss
Cost/amortised
cost
Total carrying
valueTotal fair
value
Financial liabilities
Investment contract liabilities 26 7,502 580 8,082 8,082
Borrowings 28 – 3,958 3,958 4,144
Obligations under repurchase agreements 29 – 1,883 1,883 1,883
Derivative financial instruments 20 361 – 361 361
Other liabilities 32 1,225 4,663 5,888 5,888
Financial liabilities 9,088 11,084 20,172 20,358

112
21. FAIR VALUE MEASUREMENT (continued)
Fair value of financial instruments (continued)
Fair value
US$m Notes
Fair value through
profit or lossAvailable
for sale
Cost/amortised
cost
Total carrying
valueTotal fair
value
30 November 2016
Financial investments 19
Loans and deposits – – 7,062 7,062 7,066
Debt securities 23,526 90,092 – 113,618 113,618
Equity securities 30,211 – – 30,211 30,211
Derivative financial instruments 20 107 – – 107 107
Reinsurance receivables 17 – – 335 335 335
Other receivables 22 – – 1,934 1,934 1,934
Accrued investment income 22 – – 1,383 1,383 1,383
Cash and cash equivalents 24 – – 1,642 1,642 1,642
Financial assets 53,844 90,092 12,356 156,292 156,296
Notes
Fair value through
profit or loss
Cost/amortised
cost
Total carrying
valueTotal fair
value
Financial liabilities
Investment contract liabilities 26 6,499 529 7,028 7,028
Borrowings 28 – 3,460 3,460 3,479
Obligations under repurchase agreements 29 – 1,984 1,984 1,984
Derivative financial instruments 20 644 – 644 644
Other liabilities 32 1,239 3,484 4,723 4,723
Financial liabilities 8,382 9,457 17,839 17,858
The carrying amount of assets included in the above tables represents the maximum credit exposure.
Foreign currency exposure, including the net notional amount of foreign currency derivative positions, is shown in note 36
for the Group’s key foreign exchange exposures.
The fair value of investment contract liabilities measured at amortised cost is not considered to be materially different from
the amortised cost carrying value.
The carrying value of financial instruments expected to be settled within 12 months (after taking into account valuation
allowances, where applicable) is not considered to be materially different from the fair value.

113
21. FAIR VALUE MEASUREMENT (continued)
Fair value measurements on a recurring basis
The Group measures at fair value property held for own use, investment property, financial instruments classified at fair
value through profit or loss, available for sale securities portfolios, derivative assets and liabilities, investments held by
investment funds which are consolidated, investments in non-consolidated investment funds and certain investment
contract liabilities on a recurring basis.
The fair value of a financial instrument is the amount that would be received on sale of an asset or paid to transfer a liability
in an orderly transaction between market participants at the measurement date.
The degree of judgement used in measuring the fair value of financial instruments generally correlates with the level of
pricing observability. Financial instruments with quoted prices in active markets generally have more pricing observability
and less judgement is used in measuring fair value. Conversely, financial instruments traded in other than active markets
or that do not have quoted prices have less observability and are measured at fair value using valuation models or other
pricing techniques that require more judgement. An active market is one in which transactions for the asset or liability
being valued occur with sufficient frequency and volume to provide pricing information on an ongoing basis.
An other than active market is one in which there are few transactions, the prices are not current, price quotations vary
substantially either over time or among market makers, or in which little information is released publicly for the asset or
liability being valued. Pricing observability is affected by a number of factors, including the type of financial instrument,
whether the financial instrument is new to the market and not yet established, the characteristics specific to the transaction
and general market conditions.
Fair value of properties is based on valuation by independent professional valuers.
The Group does not have assets or liabilities measured at fair value on a non-recurring basis during the year ended 30
November 2017.
The following methods and assumptions were used by the Group to estimate the fair value of financial instruments and
properties.
Determination of fair value
Loans and receivables
For loans and advances that are repriced frequently and have not had any significant changes in credit risk, carrying
amounts represent a reasonable estimate of fair values. The fair values of other loans are estimated by discounting expected
future cash flows using interest rates offered for similar loans to borrowers with similar credit ratings.
The fair values of mortgage loans are estimated by discounting future cash flows using interest rates currently being
offered in respect of similar loans to borrowers with similar credit ratings. The fair values of fixed rate policy loans are
estimated by discounting cash flows at the interest rates charged on policy loans of similar policies currently being issued.
Loans with similar characteristics are aggregated for purposes of the calculations. The carrying values of policy loans with
variable rates approximate to their fair values.
Debt securities and equity securities
The fair values of equity securities are based on quoted market prices or, if unquoted, on estimated market values generally
based on quoted prices for similar securities. Fair values for fixed interest securities are based on quoted market prices,
where available. For those securities not actively traded, fair values are estimated using values obtained from brokers,
private pricing services or by discounting expected future cash flows using a current market rate applicable to the yield,
credit quality and maturity of the investment. Priority is given to values from independent sources when available, but
overall the source of pricing and/or valuation technique is chosen with the objective of arriving at the price at which an
orderly transaction would take place between market participants on the measurement date. The inputs to determining
fair value that are relevant to fixed interest securities include, but not limited to risk-free interest rates, the obligor’s credit
spreads, foreign exchange rates and credit default rates. For holdings in hedge funds and limited partnerships, fair values
are determined based on the net asset values provided by the general partner or manager of each investment, the accounts
of which are generally audited on an annual basis. The transaction price is used as the best estimate of fair value at
inception.

114
21. FAIR VALUE MEASUREMENT (continued)
Determination of fair value (continued)
Derivative financial instruments
The Group values its derivative financial assets and liabilities using market transactions and other market evidence
whenever possible, including market-based inputs to models, model calibration to market clearing transactions, broker or
dealer quotations or alternative pricing sources with reasonable levels of price transparency. When models are used, the
selection of a particular model to value a derivative depends on the contract terms of, and specific risks inherent in, the
instrument as well as the availability of pricing information in the market. The Group generally uses similar models to value
similar instruments. Valuation models require a variety of inputs, including contractual terms, market prices and rates,
yield curves, credit curves, measures of volatility, prepayment rates and correlations of such inputs. For derivatives that
trade in liquid markets, such as generic forwards, swaps and options, model inputs can generally be verified and model
selection does not involve significant management judgement. Examples of inputs that are generally observable include
foreign exchange spot and forward rates, benchmark interest rate curves and volatilities for commonly traded option
products. Examples of inputs that may be unobservable include volatilities for less commonly traded option products and
correlations between market factors.
When the Group holds a group of derivative assets and derivative liabilities entered into with a particular counterparty, the
Group takes into account the arrangements that mitigate credit risk exposure in the event of default (e.g. International
Swap and Derivatives Association (ISDA) Master Agreements and Credit Support Annex (CSA) that require the exchange of
collateral on the basis of each party’s net credit risk exposure). The Group measures the fair value of the group of financial
assets and financial liabilities on the basis of its net exposure to the credit risk of that counterparty or the counterparty’s
net exposure to our credit risk that reflects market participants’ expectations about the likelihood that such an arrangement
would be legally enforceable in the event of default.
Property held for own use and investment property
The Group engaged external, independent and qualified valuers to determine the fair value of the Group’s properties at
least on an annual basis. The valuation on open market value basis by independent professional valuer for certain
investment properties was calculated by reference to net rental income allowing for reversionary income potential. The fair
values of other properties were derived using the Market Data Approach. In this approach, the values are based on sales
and listing of comparable property registered in the vicinity.
The properties held for own use and investment properties, in most cases, are valued on the basis of the highest and best
use of the properties that is physically possible, legally permissible and financially feasible. The current use of the properties
are considered to be its highest and best use; records of recent sales and offerings of similar property are analysed and
comparison made for such factors as size, location, quality and prospective use. On limited occasions, potential
redevelopment of the properties in use would be taken into account when they would maximise the fair value of the
properties; the Group is occupying these properties for operational purposes.
Cash and cash equivalents
The carrying amount of cash approximates its fair value.
Reinsurance receivables
The carrying amount of amounts receivable from reinsurers is not considered materially different to their fair value.
Fair value of securities sold under repurchase agreements and the associated payables
The contract values of payables under repurchase agreements approximate their fair value as these obligations are short-
term in nature.
Other assets
The carrying amount of other financial assets is not materially different to their fair value. The fair values of deposits with
banks are generally based on quoted market prices or, if unquoted, on estimates based on discounting future cash flows
using available market interest rates offered for receivables with similar characteristics.

115
21. FAIR VALUE MEASUREMENT (continued)
Determination of fair value (continued)
Investment contract liabilities
For investment contract liabilities, the fair values have been estimated using a discounted cash flow approach based on
interest rates currently being offered for similar contracts with maturities consistent with those remaining for the contracts
being valued. For investment contracts where the investment risk is borne by the policyholder, the fair value generally
approximates to the fair value of the underlying assets.
Investment contracts with DPF enable the contract holder to receive additional benefits as a supplement to guaranteed
benefits. These are referred to as participating business and are measured and classified according to the Group practice
for insurance contract liabilities and hence are disclosed within note 25. These are not measured at fair value as there is
currently not an agreed definition of fair value for investment and insurance contracts with DPF under IFRS. In the absence
of any agreed methodology, it is not possible to provide a range of estimates within which fair value is likely to fall. The
IASB is expecting to address this issue in Phase II of its insurance contracts project.
Borrowings
The fair values of borrowings with stated maturities have been estimated based on discounting future cash flows using the
interest rates currently applicable to deposits of similar maturities or prices obtained from brokers.
Other liabilities
The fair values of other unquoted financial liabilities is estimated by discounting expected future cash flows using current
market rates applicable to their yield, credit quality and maturity, except for those without stated maturity, where the
carrying value approximates to fair value.
Fair value hierarchy for fair value measurement on a recurring basis
Assets and liabilities recorded at fair value in the consolidated statement of financial position are measured and classified
in a hierarchy for disclosure purposes consisting of three “levels” based on the observability of inputs available in the
marketplace used to measure their fair values as discussed below:
• Level 1: Fair value measurements that are quoted prices (unadjusted) in active markets for identical assets or liabilities
that the Group has the ability to access as of the measurement date. Market price data is generally obtained from
exchange or dealer markets. The Group does not adjust the quoted price for such instruments. Assets measured at fair
value on a recurring basis and classified as Level 1 are actively traded equities. The Group considers that government
debt securities issued by G7 countries (the United States, Canada, France, Germany, Italy, Japan, the United Kingdom)
and traded in a dealer market to be Level 1, until they no longer trade with sufficient frequency and volume to be
considered actively traded.
• Level 2: Fair value measurements based on inputs other than quoted prices included in Level 1 that are observable for
the asset or liability, either directly (as prices) or indirectly (derived from prices). Level 2 inputs include quoted prices
for similar assets and liabilities in active markets, quoted prices for identical or similar assets or liabilities in markets
that are not active and inputs other than quoted prices that are observable for the asset and liability, such as interest
rates and yield curves that are observable at commonly quoted intervals. Assets and liabilities measured at fair value
on a recurring basis and classified as Level 2 generally include government securities issued by non-G7 countries, most
investment grade corporate bonds, hedge fund investments and derivative contracts.
• Level 3: Fair value measurements based on valuation techniques that use significant inputs that are unobservable.
Unobservable inputs are only used to measure fair value to the extent that relevant observable inputs are not available,
allowing for circumstances in which there is little, if any, market activity for the asset or liability. Assets and liabilities
measured at fair value on a recurring basis and classified as Level 3 include properties held for own use, investment
properties, certain classes of structured securities, certain derivative contracts, private equity and real estate fund
investments, and direct private equity investments.

116
21. FAIR VALUE MEASUREMENT (continued)
Fair value hierarchy for fair value measurement on a recurring basis (continued)
In certain cases, the inputs used to measure fair value may fall into different levels of the fair value hierarchy. In such cases,
the level in the fair value hierarchy within which the fair value measurement in its entirety falls is determined based on the
lowest level input that is significant to the fair value measurement in its entirety. The Group’s assessment of the significance
of a particular input to the fair value measurement in its entirety requires judgement. In making the assessment, the Group
considers factors specific to the asset or liability.
A summary of assets and liabilities carried at fair value on a recurring basis according to fair value hierarchy is given below:
Fair value hierarchy
US$m Level 1 Level 2 Level 3 Total
30 November 2017
Recurring fair value measurements
Non-financial assets
Property held for own use – – 979 979
Investment property – – 4,365 4,365
Financial assets
Available for sale
Debt securities – 104,318 1,148 105,466
At fair value through profit or loss
Debt securities
Participating funds – 20,255 419 20,674
Unit-linked and consolidated investment funds – 4,604 100 4,704
Other policyholder and shareholder – 259 65 324
Equity securities
Participating funds 6,034 355 433 6,822
Unit-linked and consolidated investment funds 18,803 149 1 18,953
Other policyholder and shareholder 9,625 690 626 10,941
Derivative financial instruments
Foreign exchange contracts – 296 – 296
Interest rate contracts – 51 – 51
Other contracts 8 8 – 16
Total assets on a recurring fair value
measurement basis 34,470 130,985 8,136 173,591
% of Total 19.9 75.4 4.7 100.0
Financial liabilities
Investment contract liabilities – – 7,502 7,502
Derivative financial instruments
Foreign exchange contracts – 306 – 306
Interest rate contracts – 55 – 55
Other liabilities – 1,225 – 1,225
Total liabilities on a recurring fair value
measurement basis – 1,586 7,502 9,088
% of Total – 17.5 82.5 100.0

117
21. FAIR VALUE MEASUREMENT (continued)
Fair value hierarchy for fair value measurement on a recurring basis (continued)
Fair value hierarchy
US$m Level 1 Level 2 Level 3 Total
30 November 2016
Recurring fair value measurements
Non-financial assets
Property held for own use – – 905 905
Investment property – – 3,910 3,910
Financial assets
Available for sale
Debt securities 24 88,819 1,249 90,092
At fair value through profit or loss
Debt securities
Participating funds – 18,366 341 18,707
Unit-linked and consolidated investment funds – 4,239 217 4,456
Other policyholder and shareholder – 223 140 363
Equity securities
Participating funds 4,856 324 271 5,451
Unit-linked and consolidated investment funds 15,434 64 – 15,498
Other policyholder and shareholder 8,117 728 417 9,262
Derivative financial instruments
Foreign exchange contracts – 64 – 64
Interest rate contracts – 30 – 30
Other contracts 12 1 – 13
Total assets on a recurring fair value
measurement basis 28,443 112,858 7,450 148,751
% of Total 19.1 75.9 5.0 100.0
Financial liabilities
Investment contract liabilities – – 6,499 6,499
Derivative financial instruments
Foreign exchange contracts – 573 – 573
Interest rate contracts – 35 – 35
Other contracts – 36 – 36
Other liabilities – 1,239 – 1,239
Total liabilities on a recurring fair value
measurement basis – 1,883 6,499 8,382
% of Total – 22.5 77.5 100.0
The Group’s policy is to recognise transfers of assets and liabilities between Level 1 and Level 2 at their fair values as at the end of each reporting period, consistent with the date of the determination of fair value. Assets are transferred out of Level 1 when they are no longer transacted with sufficient frequency and volume in an active market. During the year ended 30 November 2017, the Group transferred US$50m (2016: US$241m) of assets measured at fair value from Level 1 to Level 2. Conversely, assets are transferred from Level 2 to Level 1 when transaction volume and frequency are indicative of an active market. The Group transferred US$148m (2016: US$463m) of assets from Level 2 to Level 1 during the year ended 30 November 2017.
The Group’s Level 2 financial instruments include debt securities, equity securities and derivative instruments. The fair values of Level 2 financial instruments are estimated using values obtained from private pricing services and brokers corroborated with internal review as necessary. When the quotes from third-party pricing services and brokers are not
available, internal valuation techniques and inputs will be used to derive the fair value for the financial instruments.

118
21. FAIR VALUE MEASUREMENT (continued)
Fair value hierarchy for fair value measurement on a recurring basis (continued)
The tables below set out a summary of changes in the Group’s Level 3 assets and liabilities measured at fair value on a
recurring basis for the year ended 30 November 2017 and 2016. The tables reflect gains and losses, including gains and
losses on assets and liabilities categorised as Level 3 as at 30 November 2017 and 2016.
Level 3 assets and liabilities
US$m
Property held for
own useInvestment
propertyDebt
securitiesEquity
securities
Derivative financial
assets/(liabilities)
Investment contracts
At 1 December 2016 905 3,910 1,947 688 – (6,499)
Net movement on investment contract liabilities – – – – – (1,003)
Total gains/(losses)
Reported under investment return and other expenses in the consolidated income statement (16) 367 (56) 31 – –
Reported under fair value reserve, foreign currency translation reserve and property revaluation reserve in the consolidated statement of comprehensive income 115 66 55 18 – –
Transfer to investment property (24) 24 – – – –
Purchases 1 10 216 369 – –
Sales (2) (12) (20) (35) – –
Settlements – – (410) – – –
Transfer into Level 3 – – – 2 – –
Transfer out of Level 3 – – – (13) – –
At 30 November 2017 979 4,365 1,732 1,060 – (7,502)
Change in unrealised gains or losses
included in the consolidated income
statement for assets and liabilities
held at the end of the reporting period,
under investment return (16) 367 (61) 31 – –
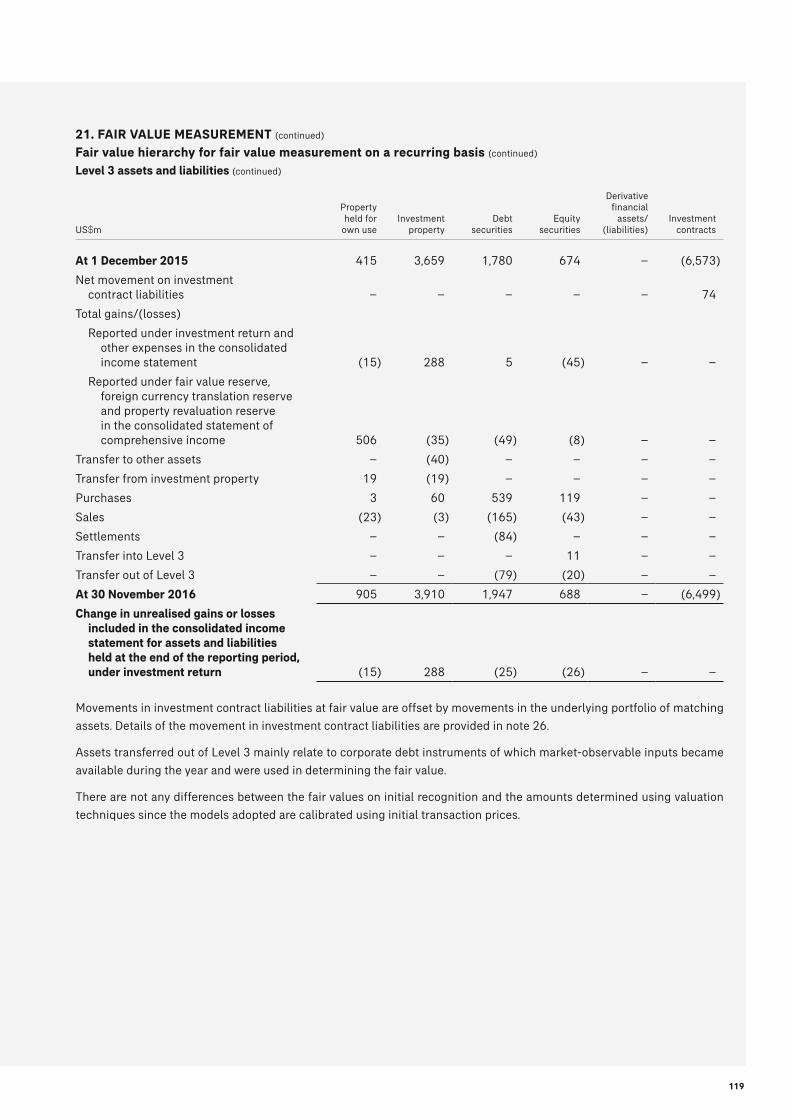
119
21. FAIR VALUE MEASUREMENT (continued)
Fair value hierarchy for fair value measurement on a recurring basis (continued)
Level 3 assets and liabilities (continued)
US$m
Property held for
own useInvestment
propertyDebt
securitiesEquity
securities
Derivative financial
assets/(liabilities)
Investment contracts
At 1 December 2015 415 3,659 1,780 674 – (6,573)
Net movement on investment contract liabilities – – – – – 74
Total gains/(losses)
Reported under investment return and other expenses in the consolidated income statement (15) 288 5 (45) – –
Reported under fair value reserve, foreign currency translation reserve and property revaluation reserve in the consolidated statement of comprehensive income 506 (35) (49) (8) – –
Transfer to other assets – (40) – – – –
Transfer from investment property 19 (19) – – – –
Purchases 3 60 539 119 – –
Sales (23) (3) (165) (43) – –
Settlements – – (84) – – –
Transfer into Level 3 – – – 11 – –
Transfer out of Level 3 – – (79) (20) – –
At 30 November 2016 905 3,910 1,947 688 – (6,499)
Change in unrealised gains or losses
included in the consolidated income
statement for assets and liabilities
held at the end of the reporting period,
under investment return (15) 288 (25) (26) – –
Movements in investment contract liabilities at fair value are offset by movements in the underlying portfolio of matching
assets. Details of the movement in investment contract liabilities are provided in note 26.
Assets transferred out of Level 3 mainly relate to corporate debt instruments of which market-observable inputs became
available during the year and were used in determining the fair value.
There are not any differences between the fair values on initial recognition and the amounts determined using valuation
techniques since the models adopted are calibrated using initial transaction prices.

120
21. FAIR VALUE MEASUREMENT (continued)
Significant unobservable inputs for level 3 fair value measurements
As at 30 November 2017 and 2016, the valuation techniques and applicable unobservable inputs used to measure the
Group’s Level 3 financial instruments are summarised as follows:
DescriptionFair value at 30 November 2017 (US$m) Valuation techniques Unobservable inputs Range
Debt securities 943 Discounted cash flows Discount rate for liquidity 5.29% – 11.89%
DescriptionFair value at 30 November 2016 (US$m) Valuation techniques Unobservable inputs Range
Debt securities 861 Discounted cash flows Discount rate for liquidity 4.07% – 17.58%
Fair value of the Group’s properties are determined based on appropriate valuation techniques which may consider among
others income projection, value of comparable property and adjustments for factors such as size, location, quality and
prospective use. These valuation inputs are deemed unobservable.
Valuation processes
The Group has the valuation policies, procedures and analyses in place to govern the valuation of financial assets required
for financial reporting purposes, including Level 3 fair values. In determining the fair values of financial assets, the Group
in general uses third-party pricing providers and, only in rare cases when third-party prices do not exist, will use prices
derived from internal models. The Chief Investment Officers of each of the business units are required to review the
reasonableness of the prices used and report price exceptions, if any. The Group Investment team analyses reported price
exceptions and reviews price challenge responses from third-party pricing providers and provides the final recommendation
on the appropriate price to be used. Any changes in valuation policies are reviewed and approved by the Group Valuations
Advisory Committee which is part of the Group’s wider financial risk governance processes. Changes in Level 2 and 3 fair
values are analysed at each reporting date.
The main Level 3 input used by the Group pertains to the discount rate for the fixed income securities and investment
contracts. The unobservable inputs for determining the fair value of these instruments include the obligor’s credit spread
and/or the liquidity spread. A significant increase/(decrease) in any of the unobservable input may result in a significantly
lower/(higher) fair value measurement. The Group has subscriptions to private pricing services for gathering such
information. If the information from private pricing services is not available, the Group uses the proxy pricing method based
on internally-developed valuation inputs.

121
21. FAIR VALUE MEASUREMENT (continued)
Fair value of financial and insurance assets and liabilities for which the fair value is disclosed at reporting
date
A summary of fair value hierarchy of assets and liabilities not carried at fair value but for which the fair value is disclosed
as at 30 November 2017 and 2016 is given below.
Fair value hierarchy
US$m Level 1 Level 2 Level 3 Total
30 November 2017
Assets for which the fair value is disclosed
Financial assets
Loans and deposits 1,112 2,680 4,185 7,977
Reinsurance receivables – 506 – 506
Other receivables – 2,109 41 2,150
Accrued investment income 21 1,520 – 1,541
Cash and cash equivalents 2,289 – – 2,289
Total assets for which the fair value is disclosed 3,422 6,815 4,226 14,463
Liabilities for which the fair value is disclosed
Financial liabilities
Investment contract liabilities – – 580 580
Borrowings 3,630 514 – 4,144
Obligations under repurchase agreements – 1,883 – 1,883
Other liabilities 692 3,938 33 4,663
Total liabilities for which the fair value is disclosed 4,322 6,335 613 11,270
Fair value hierarchy
US$m Level 1 Level 2 Level 3 Total
30 November 2016
Assets for which the fair value is disclosed
Financial assets
Loans and deposits 744 2,817 3,505 7,066
Reinsurance receivables – 335 – 335
Other receivables – 1,885 49 1,934
Accrued investment income 73 1,310 – 1,383
Cash and cash equivalents 1,642 – – 1,642
Total assets for which the fair value is disclosed 2,459 6,347 3,554 12,360
Liabilities for which the fair value is disclosed
Financial liabilities
Investment contract liabilities – – 529 529
Borrowings 3,478 – 1 3,479
Obligations under repurchase agreements – 1,984 – 1,984
Other liabilities 312 3,126 46 3,484
Total liabilities for which the fair value is disclosed 3,790 5,110 576 9,476

122
22. OTHER ASSETS
US$m
As at 30 November
2017
As at 30 November
2016
Accrued investment income 1,541 1,383
Pension scheme assets
Defined benefit pension scheme surpluses 44 24
Insurance receivables due from insurance and investment contract holders 1,223 1,004
Prepayments – operating lease of leasehold land 357 345
Others 1,465 1,233
Total 4,630 3,989
All amounts other than certain prepayments are generally expected to be recovered within 12 months after the end of the
reporting period.
23. IMPAIRMENT OF FINANCIAL ASSETS
In accordance with the Group’s accounting policies, impairment reviews were performed for available for sale securities
and loans and receivables.
Available for sale debt securities
During the year ended 30 November 2017, no impairment loss (2016: US$22m) was recognised in respect of available for
sale debt securities.
The carrying amounts of available for sale debt securities that are individually determined to be impaired at 30 November
2017 was nil (2016: US$18m).
Loans and receivables
The Group’s primary potential credit risk exposure in respect of loans and receivables arises in respect of policy loans and
a portfolio of mortgage loans on residential and commercial real estate (see note 19 Financial investments for further
details). The Group’s credit exposure on policy loans is mitigated because, if and when the total indebtedness on any policy,
including interest due and accrued, exceeds the cash surrender value, the policy terminates and becomes void. The Group
has a first lien on all policies which are subject to policy loans.
The carrying amounts of loans and receivables that are individually determined to be impaired at 30 November 2017 was
US$12m (2016: US$18m).
The Group has a portfolio of residential and commercial mortgage loans which it originates. To the extent that any such
loans are past their due dates specific allowance is made, together with a collective allowance, based on historical
delinquency. Insurance receivables are short-term in nature and cover is not provided if consideration is not received. An
ageing of accounts receivable is not provided as all amounts are due within one year and cover is cancelled if consideration
is not received.

123
24. CASH AND CASH EQUIVALENTS
US$m
As at 30 November
2017
As at 30 November
2016
Cash 1,735 1,120
Cash equivalents 554 522
Total(1) 2,289 1,642
Note:
(1) Of cash and cash equivalents, US$385m (2016: US$412m) are held to back unit-linked contracts and US$71m (2016: US$92m) are held by consolidated investment funds.
Cash comprises cash at bank and cash in hand. Cash equivalents comprise bank deposits and highly liquid short-term
investments with maturities at acquisition of three months or less and money market funds. Accordingly, all such amounts
are expected to be realised within 12 months after the end of the reporting period.
25. INSURANCE CONTRACT LIABILITIES
The movement of insurance contract liabilities (including liabilities in respect of investment contracts with DPF) is shown
as follows:
US$m
Year ended 30 November
2017
Year ended 30 November
2016
At beginning of financial year 128,186 115,969
Valuation premiums and deposits 25,586 23,962
Liabilities released for policy termination or other policy benefits paid and related expenses (14,929) (13,647)
Fees from account balances (1,817) (1,491)
Accretion of interest 4,417 3,810
Foreign exchange movements 5,232 (1,733)
Change in net asset values attributable to policyholders 2,762 1,434
Other movements (540) (118)
At end of financial year 148,897 128,186
Insurance contract liabilities (including liabilities in respect of investment contracts with DPF) can also be analysed as
follows:
US$m
Year ended 30 November
2017
Year ended 30 November
2016
Deferred profit 7,046 5,761
Unearned revenue 2,674 2,906
Policyholders’ share of participating surplus 7,935 6,731
Liabilities for future policyholder benefits 131,242 112,788
Total 148,897 128,186

124
25. INSURANCE CONTRACT LIABILITIES (continued)
Business description
The table below summarises the key variables on which insurance and investment contract cash flows depend.
Type of contract Material terms and conditions
Nature of benefits and
compensation for claims
Factors affecting
contract cash
flows
Key reportable
segments
Traditional participating life assurance with DPF
Participating funds
Participating products include protection and savings elements. The basic sum assured, payable on death or maturity, may be enhanced by dividends or bonuses, the aggregate amount of which is determined by the performance of a distinct fund of assets and liabilities. The timing of dividend and bonus declarations is at the discretion of the insurer. Local regulations generally prescribe a minimum proportion of policyholder participation in declared dividends
Minimum guaranteed benefits may be enhanced based on investment experience and other considerations
• Investment performance
• Expenses• Mortality• Surrenders
Singapore, China, Malaysia
Other participating business
Participating products include protection and savings elements. The basic sum assured, payable on death or maturity, may be enhanced by dividends or bonuses, the timing or amount of which are at the discretion of the insurer taking into account factors such as investment experience
Minimum guaranteed benefits may be enhanced based on investment experience and other considerations
• Investment performance
• Expenses• Mortality• Surrenders• Morbidity
Hong Kong, Thailand, Other Markets
Traditional non-participating life assurance
Benefits paid on death, maturity, sickness or disability that are fixed and guaranteed and not at the discretion of the insurer
Benefits, defined in the insurance contract, are determined by the contract and are not affected by investment performance or the performance of the contract as a whole
• Mortality• Morbidity• Lapses• Expenses
All(1)
Accident and health These products provide morbidity or sickness benefits and include health, disability, critical illness and accident cover
Benefits, defined in the insurance contract, are determined by the contract and are not affected by investment performance or the performance of the contract as a whole
• Mortality• Morbidity• Lapses• Expenses
All(1)
Unit-linked Unit-linked contracts combine savings with protection, the cash value of the policy depending on the value of unitised funds
Benefits are based on the value of the unitised funds and death benefits
• Investment performance
• Lapses• Expenses• Mortality
All(1)
Universal life The customer pays flexible premiums subject to specified limits accumulated in an account balance which are credited with interest at a rate set by the insurer, and a death benefit which may be varied by the customer
Benefits are based on the account balance and death benefit
• Investment performance
• Crediting rates • Lapses• Expenses• Mortality
All(1)
Note:
(1) Other than the Group Corporate Centre segment.

125
25. INSURANCE CONTRACT LIABILITIES (continued)
Methodology and assumptions
The most significant items to which profit for the year and shareholders’ equity are sensitive are market, insurance and
lapse risks which are shown in the table below. Indirect exposure indicates that there is a second order impact. For example,
whilst the profit for the year attributable to shareholders is not directly affected by investment income earned where the
investment risk is borne by policyholders (for example, in respect of unit-linked contracts), there is a second-order effect
through the investment management fees which the Group earns by managing such investments. The distinction between
direct and indirect exposure is not intended to indicate the relative sensitivity to each of these items. Where the direct
exposure is shown as being “net neutral”, this is because the exposure to market and credit risk is offset by a corresponding
movement in insurance contract liabilities.
Market and credit risk
Direct exposure
Type of contractInsurance and investment contract liabilities
Risks associated with related investment portfolio Indirect exposure
Significant insurance and lapse risks
Traditional participating life assurance with DPF
Participating funds
• Net neutral except for the insurer’s share of participating investment performance
• Guarantees
• Net neutral except for the insurer’s share of participating investment performance
• Guarantees
• Investment performance subject to smoothing through dividend declarations
• Impact of persistency on future dividends
• Mortality
Other participating business
• Net neutral except for the insurer’s share of participating investment performance
• Guarantees
• Net neutral except for the insurer’s share of participating investment performance
• Guarantees
• Investment performance subject to smoothing through dividend declarations
• Impact of persistency on future dividends
• Mortality• Morbidity
Traditional non-participating life assurance
• Guarantees• Asset-liability
mismatch risk
• Investment performance
• Asset-liability mismatch risk
• Credit risk
• Not applicable • Mortality• Persistency• Morbidity
Accident and health • Asset-liability mismatch risk
• Investment performance
• Credit risk• Asset-liability
mismatch risk
• Not applicable • Morbidity• Persistency
Pension • Net neutral• Asset-liability
mismatch risk
• Net neutral• Asset-liability
mismatch risk
• Performance-related investment management fees
• Persistency
Unit-linked • Net neutral • Net neutral • Performance-related investment management fees
• Persistency• Mortality
Universal life • Guarantees• Asset-liability
mismatch risk
• Investment performance
• Credit risk• Asset-liability
mismatch risk
• Spread between earned rate and crediting rate to policyholders
• Mortality• Persistency• Withdrawals
The Group is also exposed to foreign exchange rate risk in respect of its operations, and to interest rate risk, credit risk and
equity price risk on assets representing net shareholders’ equity, and to expense risk to the extent that actual expenses
exceed those that can be charged to insurance and investment contract holders on non-participating business. Expense
assumptions applied in the Group’s actuarial valuation models assume a continuing level of business volumes.
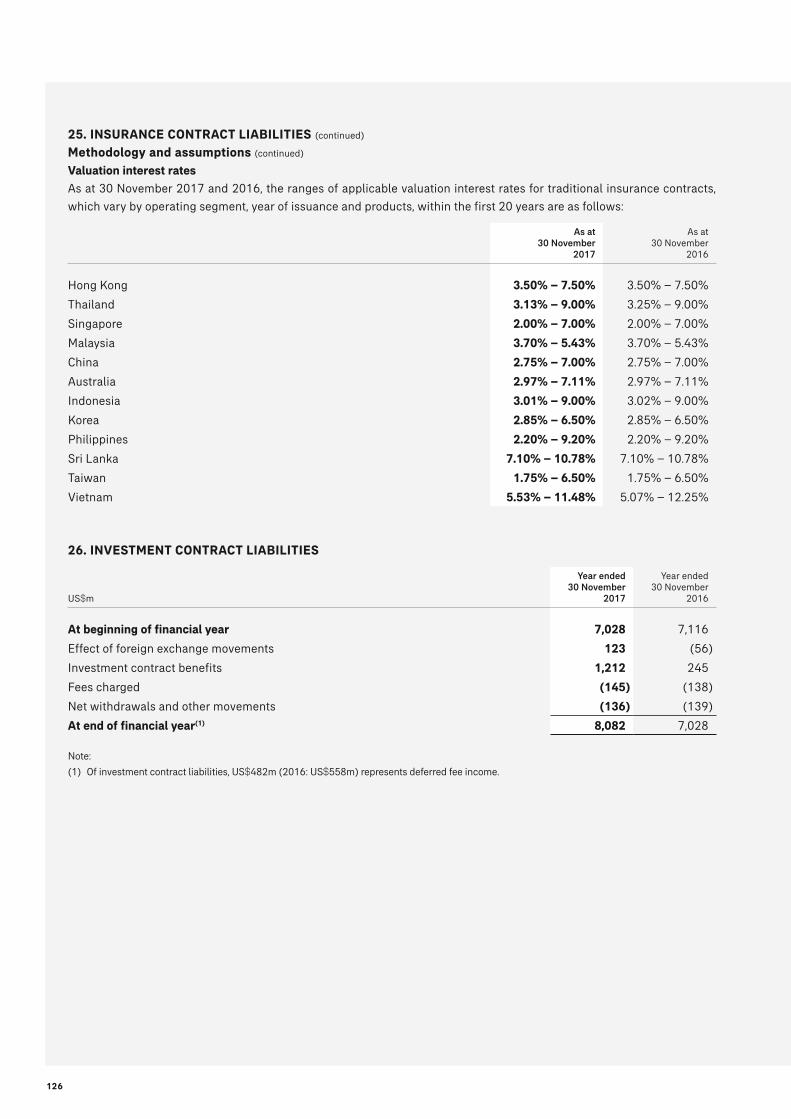
126
25. INSURANCE CONTRACT LIABILITIES (continued)
Methodology and assumptions (continued)
Valuation interest rates
As at 30 November 2017 and 2016, the ranges of applicable valuation interest rates for traditional insurance contracts,
which vary by operating segment, year of issuance and products, within the first 20 years are as follows:
As at 30 November
2017
As at 30 November
2016
Hong Kong 3.50% – 7.50% 3.50% – 7.50%
Thailand 3.13% – 9.00% 3.25% – 9.00%
Singapore 2.00% – 7.00% 2.00% – 7.00%
Malaysia 3.70% – 5.43% 3.70% – 5.43%
China 2.75% – 7.00% 2.75% – 7.00%
Australia 2.97% – 7.11% 2.97% – 7.11%
Indonesia 3.01% – 9.00% 3.02% – 9.00%
Korea 2.85% – 6.50% 2.85% – 6.50%
Philippines 2.20% – 9.20% 2.20% – 9.20%
Sri Lanka 7.10% – 10.78% 7.10% – 10.78%
Taiwan 1.75% – 6.50% 1.75% – 6.50%
Vietnam 5.53% – 11.48% 5.07% – 12.25%
26. INVESTMENT CONTRACT LIABILITIES
US$m
Year ended 30 November
2017
Year ended 30 November
2016
At beginning of financial year 7,028 7,116
Effect of foreign exchange movements 123 (56)
Investment contract benefits 1,212 245
Fees charged (145) (138)
Net withdrawals and other movements (136) (139)
At end of financial year(1) 8,082 7,028
Note:
(1) Of investment contract liabilities, US$482m (2016: US$558m) represents deferred fee income.

127
27. EFFECT OF CHANGES IN ASSUMPTIONS AND ESTIMATES
The table below sets out the sensitivities of the assumptions in respect of insurance and investment contracts with DPF to
key variables. This disclosure only allows for the impact on liabilities and related assets, such as reinsurance, and deferred
acquisition costs and does not allow for offsetting movements in the fair value of financial assets backing those liabilities.
US$m
As at 30 November
2017
As at 30 November
2016
(Increase)/decrease in insurance contract liabilities, increase/(decrease) in equity
and profit before tax
0.5 pps increase in investment return 20 20
0.5 pps decrease in investment return (39) (27)
10% increase in expenses (7) (7)
10% increase in mortality rates (42) (36)
10% increase in lapse/discontinuance rates (32) (22)
Future policy benefits for traditional life insurance policies (including investment contracts with DPF) are calculated using
a net level premium valuation method with reference to best estimate assumptions set at policy inception date unless a
deficiency arises on liability adequacy testing. There is not any impact of the above assumption sensitivities on the carrying
amount of traditional life insurance liabilities as the sensitivities presented would not have triggered a liability adequacy
adjustment. During the years presented there were not any effect of changes in assumptions and estimates on the Group’s
traditional life products.
For interest sensitive insurance contracts, such as universal life products and unit-linked contracts, assumptions are made
at each reporting date including mortality, persistency, expenses, future investment earnings and future crediting rates.
The impact of changes in assumptions on the valuation of insurance and investment contracts with DPF was US$16m
(2016: US$20m) increase in profit.

128
28. BORROWINGS
US$m
As at 30 November
2017
As at 30 November
2016
Other loans – 1
Medium-term notes 3,958 3,459
Total 3,958 3,460
Interest expense on borrowings is shown in note 9. Further information relating to interest rates and the maturity profile of
borrowings is presented in note 36.
The following table summarises the Company’s outstanding medium-term notes at 30 November 2017:
Issue date Nominal amount Interest rate Tenor
13 March 2013(1) US$500m 1.750% 5 years
13 March 2013(1) US$500m 3.125% 10 years
11 March 2014(1) US$500m 2.250% 5 years
11 March 2014(1) US$500m 4.875% 30 years
11 March 2015(1) US$750m 3.200% 10 years
16 March 2016(1) US$750m 4.500% 30 years
23 May 2017(2) US$500m 4.470% 30 years
Notes:
(1) These medium-term notes are listed on The Stock Exchange of Hong Kong Limited.
(2) These medium-term notes are listed on The Taipei Exchange, Taiwan. The Company has the right to redeem these notes at par on 23 May of each year beginning on 23 May 2022.
The net proceeds from issuance during the year ended 30 November 2017 and 2016 are used for general corporate
purposes.
The Group has access to an aggregate of US$2,226m unsecured committed credit facilities, which includes a US$300m
revolving three-year credit facility expiring in 2020 and a US$1,926m five-year credit facility expiring in 2022. The credit
facilities will be used for general corporate purposes. There were nil outstanding borrowings under these credit facilities
as of 30 November 2017 (2016: nil).
29. OBLIGATIONS UNDER REPURCHASE AGREEMENTS
The Group has entered into repurchase agreements whereby securities are sold to third parties with a concurrent agreement
to repurchase the securities at a specified date.
The securities related to these agreements are not de-recognised from the Group’s consolidated statement of financial
position, but are retained within the appropriate financial asset classification. During the term of the repurchase agreements,
the Group is restricted from selling or pledging the transferred debt securities. The following table specifies the amounts
included within financial investments subject to repurchase agreements which do not qualify for de-recognition at each
year end:
US$m
As at 30 November
2017
As at 30 November
2016
Debt securities – AFS 1,854 2,045
Debt securities – FVTPL 12 98
Total 1,866 2,143

129
29. OBLIGATIONS UNDER REPURCHASE AGREEMENTS (continued)
Collateral
At 30 November 2017, the Group had pledged debt securities with carrying value of US$1m (2016: US$6m). Cash collateral
of US$1m (2016: US$1m) were held based on the market value of the securities transferred. In the absence of default, the
Group does not sell or repledge the debt securities collateral received and they are not recognised in the consolidated
statement of financial position.
At 30 November 2017, the obligations under repurchase agreements were US$1,883m (2016: US$1,984m).
30. OFFSETTING OF FINANCIAL ASSETS AND FINANCIAL LIABILITIES
Offsetting, enforceable master netting agreements and similar agreements
The following table shows the assets that are subject to offsetting, enforceable master netting agreements and similar
arrangements at each year end:
US$m
Gross amount of
recognised financial
assets
Gross amount of
recognised financial liabilities
set off in the consolidated
statement of financial
position
Net amount of financial
assets presented
in the consolidated statement of
financial position
Related amounts not set off in the
consolidated statement of financial position
Net amount
Financial instruments
Cash collateral received
30 November 2017
Financial assets:
Derivative assets 363 – 363 (15) (141) 207
Reverse repurchase agreements 326 – 326 (326) – –
Total 689 – 689 (341) (141) 207
US$m
Gross amount of
recognised financial
assets
Gross amount of
recognised financial liabilities
set off in the consolidated
statement of financial
position
Net amount of financial
assets presented
in the consolidated statement of
financial position
Related amounts not set off in the
consolidated statement of financial position
Net amount
Financial instruments
Cash collateral received
30 November 2016
Financial assets:
Derivative assets 107 – 107 (5) (6) 96
Reverse repurchase agreements 224 – 224 (224) – –
Total 331 – 331 (229) (6) 96
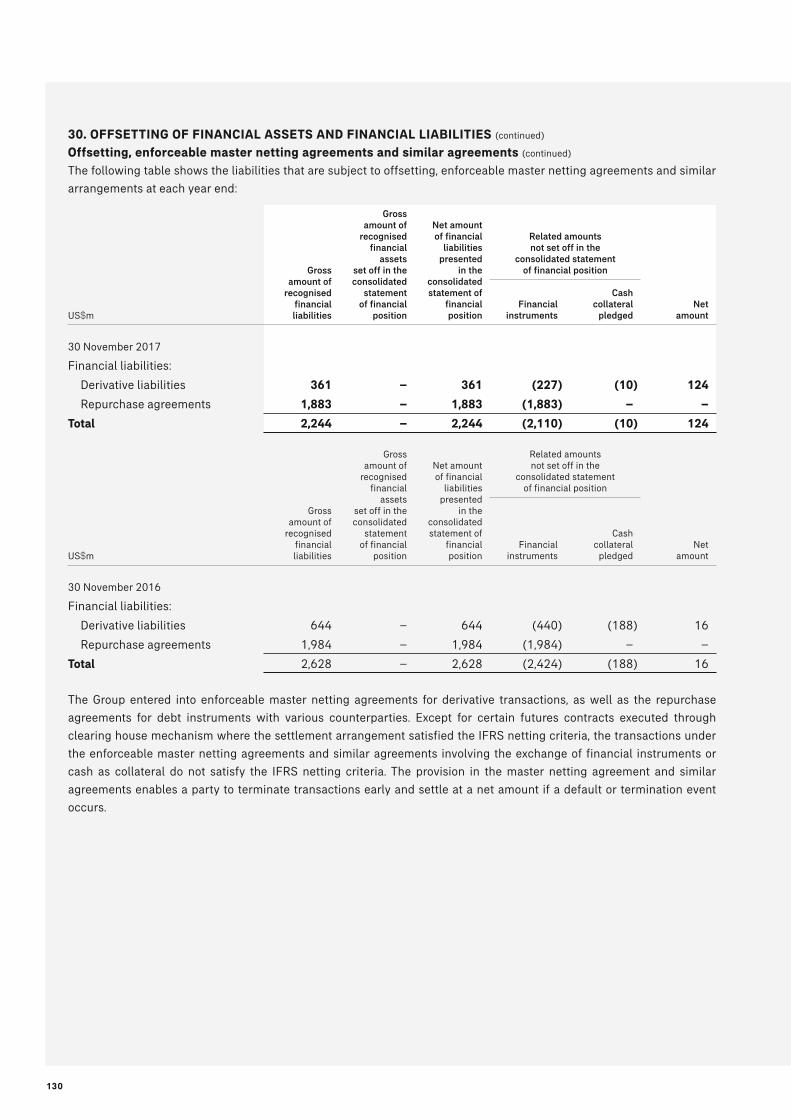
130
30. OFFSETTING OF FINANCIAL ASSETS AND FINANCIAL LIABILITIES (continued)
Offsetting, enforceable master netting agreements and similar agreements (continued)
The following table shows the liabilities that are subject to offsetting, enforceable master netting agreements and similar
arrangements at each year end:
US$m
Gross amount of
recognised financial liabilities
Gross amount of
recognised financial
assets set off in the consolidated
statement of financial
position
Net amount of financial
liabilities presented
in the consolidated statement of
financial position
Related amounts not set off in the
consolidated statement of financial position
Net amount
Financial instruments
Cash collateral
pledged
30 November 2017
Financial liabilities:
Derivative liabilities 361 – 361 (227) (10) 124
Repurchase agreements 1,883 – 1,883 (1,883) – –
Total 2,244 – 2,244 (2,110) (10) 124
US$m
Gross amount of
recognised financial liabilities
Gross amount of
recognised financial
assets set off in the consolidated
statement of financial
position
Net amount of financial
liabilities presented
in the consolidated statement of
financial position
Related amounts not set off in the
consolidated statement of financial position
Net amount
Financial instruments
Cash collateral
pledged
30 November 2016
Financial liabilities:
Derivative liabilities 644 – 644 (440) (188) 16
Repurchase agreements 1,984 – 1,984 (1,984) – –
Total 2,628 – 2,628 (2,424) (188) 16
The Group entered into enforceable master netting agreements for derivative transactions, as well as the repurchase
agreements for debt instruments with various counterparties. Except for certain futures contracts executed through
clearing house mechanism where the settlement arrangement satisfied the IFRS netting criteria, the transactions under
the enforceable master netting agreements and similar agreements involving the exchange of financial instruments or
cash as collateral do not satisfy the IFRS netting criteria. The provision in the master netting agreement and similar
agreements enables a party to terminate transactions early and settle at a net amount if a default or termination event
occurs.

131
31. PROVISIONS
US$m Employee benefits Other Total
At 1 December 2015 117 128 245
Charged to the consolidated income statement 11 52 63
Charged to other comprehensive income 22 – 22
Released during the year – (18) (18)
Utilised during the year (3) (54) (57)
Other movements (2) – (2)
At 30 November 2016 145 108 253
Charged to the consolidated income statement 7 94 101
Charged to other comprehensive income (23) – (23)
Exchange differences 9 – 9
Released during the year – (29) (29)
Utilised during the year (12) (83) (95)
Other movements 17 1 18
At 30 November 2017 143 91 234
Other provisions
Other provisions comprise provisions in respect of regulatory matters, litigation, reorganisation and restructuring. In view
of the diverse nature of the matters provided for and the contingent nature of the matters to which they relate, the Group
is unable to provide an accurate assessment of the term over which provisions are expected to be utilised.
32. OTHER LIABILITIES
US$m
As at 30 November
2017
As at 30 November
2016
Trade and other payables 3,958 2,980
Third-party interests in consolidated investment funds 1,225 1,239
Reinsurance payables 705 504
Total 5,888 4,723
Third-party interests in consolidated investment funds consist of third-party unit holders’ interests in consolidated
investment funds which are reflected as a liability since they can be put back to the Group for cash.
Trade and other payables are generally expected to be settled within 12 months after the end of the reporting period. The
realisation of third-party interests in investment funds cannot be predicted with accuracy since these represent the
interests of third-party unit holders in consolidated investment funds held to back insurance and investment contract
liabilities and are subject to market risk and the actions of third-party investors.

132
33. SHARE CAPITAL AND RESERVES
Share capital
As at 30 November 2017 As at 30 November 2016
Million shares US$m Million shares US$m
At beginning of the financial year 12,056 13,998 12,048 13,971
Shares issued under share option scheme and agency share purchase plan 18 67 8 27
At end of the financial year 12,074 14,065 12,056 13,998
The Company issued 17,053,136 shares under share option scheme (2016: 7,174,665 shares) and 1,037,294 shares under
agency share purchase plan (2016: 927,042 shares) during the year ended 30 November 2017.
The Company and its subsidiaries have not purchased, sold or redeemed any of the Company’s shares during the year
ended 30 November 2017 with the exception of 1,395,132 shares (2016: 16,849,376 shares) of the Company purchased
by and nil shares (2016: 276,401 shares) of the Company sold by the employee share-based trusts. These purchases were
made by the relevant scheme trustees on the Hong Kong Stock Exchange. These shares are held on trust for participants
of the relevant schemes and therefore were not cancelled.
During the year ended 30 November 2017, 15,730,944 shares (2016: 13,664,506 shares) were transferred to eligible
directors, officers and employees of the Group from the employee share-based trusts under share-based compensation
plans as a result of vesting. As at 30 November 2017, 63,720,201 shares (2016: 78,056,013 shares) of the Company were
held by the employee share-based trusts.
Reserves
Fair value reserve
The fair value reserve comprises the cumulative net change in the fair value of available for sale securities held at the end
of the reporting period.
Foreign currency translation reserve
The foreign currency translation reserve comprises all foreign currency exchange differences arising from the translation
of the financial statements of foreign operations.
Employee share-based trusts
Trusts have been established to acquire shares of the Company for distribution to participants in future periods through the
share-based compensation plans. Those shares acquired by the trusts, to the extent not transferred to the participants
upon vesting, are reported as “Employee share-based trusts”.
Property revaluation reserve
Property revaluation reserve comprises the cumulative net change in the revalued amount of property held for own use at
the end of the reporting period. Property revaluation surplus is not considered to be a realised profit available for distribution
to shareholders.
Other reserves
Other reserves mainly include the impact of merger accounting for business combinations under common control and
share-based compensation.

133
34. NON-CONTROLLING INTERESTS
US$m
As at 30 November
2017
As at 30 November
2016
Equity shares in subsidiaries 64 59
Share of earnings 310 257
Share of other reserves 4 10
Total 378 326
35. GROUP CAPITAL STRUCTURE
Capital Management Approach
The Group’s capital management objectives focus on maintaining a strong capital base to support the development of its
business, maintaining the ability to move capital freely and satisfying regulatory capital requirements at all times.
The Group’s capital management function oversees all capital-related activities of the Group and assists senior management
in making capital decisions. The capital management function participates in decisions concerning asset-liability
management, strategic asset allocation and ongoing solvency management. This includes ensuring capital considerations
are paramount in the strategy and business planning processes and when determining the AIA’s capacity to pay dividends
to shareholders.
Regulatory Solvency
The Group is in compliance with the solvency and capital adequacy requirements applied by its regulators. The Group’s
primary insurance regulator at the AIA Company Limited (AIA Co.) and AIA International Limited (AIA International) levels
is the Hong Kong Insurance Authority (HKIA), which requires that AIA Co. and AIA International meet the solvency margin
requirements of the Hong Kong Insurance Ordinance (HKIO). The HKIO (among other matters) sets minimum solvency
margin requirements that an insurer must meet in order to be authorised to carry on insurance business in or from Hong
Kong. AIA has given an undertaking to the HKIA to maintain an excess of assets over liabilities for branches other than
Hong Kong at no less than 100% of the Hong Kong statutory minimum solvency margin requirement in each of AIA Co. and
AIA International.
The capital positions of the Group’s two principal operating companies as of 30 November 2017 and 2016 are as follows:
30 November 2017 30 November 2016
US$m
Total available
capital
Regulatory minimum
capitalSolvency
ratio
Total available
capital
Regulatory minimum
capitalSolvency
ratio
AIA Co. 8,248 1,862 443% 6,699 1,659 404%
AIA International 7,826 2,431 322% 6,237 2,072 301%
For these purposes, the Group defines total available capital as the amount of assets in excess of liabilities measured in
accordance with the HKIO and “regulatory minimum capital” as the required minimum margin of solvency calculated in
accordance with the HKIO. The solvency ratio is the ratio of total available capital to regulatory minimum capital.
The Group’s individual branches and subsidiaries are also subject to the supervision of government regulators in the
jurisdictions in which those branches and subsidiaries and their parent entity operate and, in relation to subsidiaries, in
which they are incorporated. The various regulators overseeing the Group actively monitor our local solvency positions. AIA
Co. and AIA International submit annual filings to the HKIA of their solvency margin position based on their annual audited
financial statements.

134
35. GROUP CAPITAL STRUCTURE (continued)
Regulatory Solvency (continued)
The ability of the Company to pay dividends to shareholders and to meet other obligations depends ultimately on dividends
and other payments being received from its operating subsidiaries and branches, which are subject to contractual,
regulatory and other limitations. The various regulators overseeing the individual branches and subsidiaries of the Group
have the discretion to impose additional restrictions on the ability of those regulated subsidiaries and branches to make
payment of dividends or other distributions and payments to AIA Co., including increasing the required margin of solvency
that an operating unit must maintain. For example, capital may not be remitted without the consent from regulators for
certain individual branches or subsidiaries of the Group. The payment of dividends, distributions and other payments to
shareholders is subject to the oversight of the HKIA.
Capital and Regulatory Orders Specific to the Group
As of 30 November 2017, the requirements and restrictions summarised below may be considered material to the Group
and remain in effect unless otherwise stated.
Hong Kong Insurance Authority
AIA Group Limited has given to the Insurance Authority an undertaking that AIA Group Limited will:
(i) ensure that (a) each of AIA Co. and AIA International will at all times maintain an excess of assets over liabilities of not
less than the aggregate of 150% of the Hong Kong statutory minimum solvency margin requirement in respect of the
Hong Kong branch and no less than 100% of the Hong Kong statutory minimum solvency margin requirement for
branches other than Hong Kong (“minimum amount”); (b) it will not withdraw capital or transfer any funds or assets
out of AIA Co. or AIA International that will cause the solvency ratio to fall below the minimum amounts specified in (a),
except with, in either case, the prior written consent of the Insurance Authority; and (c) should the solvency ratio of
either AIA Co. or AIA International fall below the respective minimum amounts, AIA Group Limited will take steps as
soon as possible to restore it to at least the respective minimum amounts in a manner acceptable to the Insurance
Authority;
(ii) notify the Insurance Authority in writing as soon as the Company becomes aware of any person (a) becoming a
controller (within the meaning of Section 9(1)(a)(iii)(B) of the HKIO) of AIA Co. and AIA International through the
acquisition of our shares traded on the HKSE; or (b) ceasing to be a controller (within the meaning of Section 9(1)(a)
(iii)(B) of the HKIO) of AIA Co. and AIA International through the disposal of our shares traded on the HKSE;
(iii) be subject to the supervision of the Insurance Authority and AIA Group Limited will be required to continually comply
with the Insurance Authority’s guidance on the “fit and proper” standards of a controller pursuant to Section 8(2) of the
HKIO. The Insurance Authority is empowered by the HKIO to raise objection if it appears to it that any person is not fit
and proper to be a controller or director of an authorised insurer. These standards include the sufficiency of a holding
company’s financial resources; the viability of a holding company’s business plan for its insurance subsidiaries which
are regulated by the Insurance Authority; the clarity of the Group’s legal, managerial and operational structures; the
identities of any other holding companies or major regulated subsidiaries; whether the holding company, its directors
or controllers is subject to receivership, administration, liquidation or other similar proceedings or failed to satisfy any
judgement debt under a court order or the subject of any criminal convictions or in breach of any statutory or regulatory
requirements; the soundness of the Group’s corporate governance; the soundness of the Group’s risk management
framework; the receipt of information from its insurance subsidiaries which are regulated by the Insurance Authority to
ensure that they are managed in compliance with applicable laws, rules and regulation; and its role in overseeing and
managing the operations of its insurance subsidiaries which are regulated by the Insurance Authority; and
(iv) fulfil all enhancements or improvements to the guidance referred to in subparagraph (iii) above, as well as administrative
measures issued from time to time by the Insurance Authority or requirements that may be prescribed by the Insurance
Authority in accordance with the HKIO, regulations under the HKIO or guidelines issued by the Insurance Authority
from time to time.

135
36. RISK MANAGEMENT
Risk management framework
AIA recognises the importance of sound risk management in every aspect of our business and for all our stakeholders. The
Risk Management Framework (RMF) provides the structure for identifying, quantifying and mitigating risk across the
Group. An effective RMF is the key to avoiding the financial and reputational damage that arises from inadequate or
ineffective control of the risks in the business.
Insurance risk
Insurance risk is the risk arising from changes in claims experience as well as more general exposure relating to the
acquisition and persistency of insurance business. This also includes changes to assumptions regarding future experience
for these risks.
Lapse
Lapse risk is the risk that the rate of policy termination deviates from the Group’s expectation.
Ensuring customers buy products that meet their needs is central to the Group’s Operating Philosophy. Through effective
implementation of the Business Quality Framework, comprehensive sales training programmes and active monitoring of
sales activities and persistency, the Group seeks to ensure that appropriate products are sold by qualified sales
representatives and that standards of service consistently meet our customers’ needs.
Expense
Expense risk is the risk that the cost of selling new business and of administering the in-force book exceeds the assumptions
made in pricing and/or reserving.
Daily operations follow a disciplined budgeting and control process that allows for the management of expenses based on
the Group’s very substantial experience within the markets in which we operate.
Morbidity and Mortality
Morbidity and mortality risk is the risk that the occurrence and/or amounts of medical/death claims are higher than the
assumptions made in pricing and/or reserving.
The Group adheres to well-defined market-oriented underwriting and claims guidelines and practices that have been
developed based on extensive historical experience and with the assistance of professional reinsurers.
The Group’s actuarial teams conduct regular experience studies of all the insurance risk factors in its in-force book. These
internal studies together with external data are used to identify emerging trends which can then be used to inform product
design, pricing, underwriting, claims management and reinsurance needs.
Through monitoring the development of both local and global trends in medical technology, health and wellness, the
impact of legislation and general social, political and economic conditions the Group seeks to anticipate and respond
promptly to potential adverse experience impacts on its products.
Reinsurance is used to reduce concentration and volatility risk, especially with large policies or new risks, and as protection
against catastrophic events such as pandemics or natural disasters.

136
36. RISK MANAGEMENT (continued)
Investment and financial risks
Credit risk
Credit risk is the risk that third parties fail to meet their obligations to the Group when they fall due. Although the primary
source of credit risk is the Group’s investment portfolio, such risk can also arise through reinsurance, procurement, and
treasury activities.
The Group’s credit risk management oversight process is governed centrally, but provides for decentralised management
and accountability by our lines of business. A key to AIA’s credit risk management is adherence to a well-controlled
underwriting process. The Group’s credit risk management starts with the assignment of an internal rating to all
counterparties. A detailed analysis of each counterparty is performed and a rating recommended by the first lines of
business. The Group’s Risk Management function manages the Group’s internal ratings framework and reviews these
recommendations and make final decision on the assigned ratings. Measuring and monitoring of credit risk is an ongoing
process and is designed to enable early identification of emerging risk.
Interest rate risk
The Group’s exposure to interest rate risk predominantly arises from any differences between the duration of the Group’s
liabilities and assets. Since most markets do not have assets of sufficient tenor to match life insurance liabilities, an
uncertainty arises around the reinvestment of maturing assets to match the Group’s insurance liabilities.
AIA manages interest rate risk primarily on an economic basis to determine the durations of both assets and liabilities.
Interest rate risk on local solvency basis is also taken into consideration for business units where local solvency regimes
deviate from economic basis. Furthermore, for products with discretionary benefits, additional modelling of interest rate
risk is performed to guide determination of appropriate management actions. Management also takes into consideration
the asymmetrical impact of interest rate movements when evaluating products with options and guarantees.
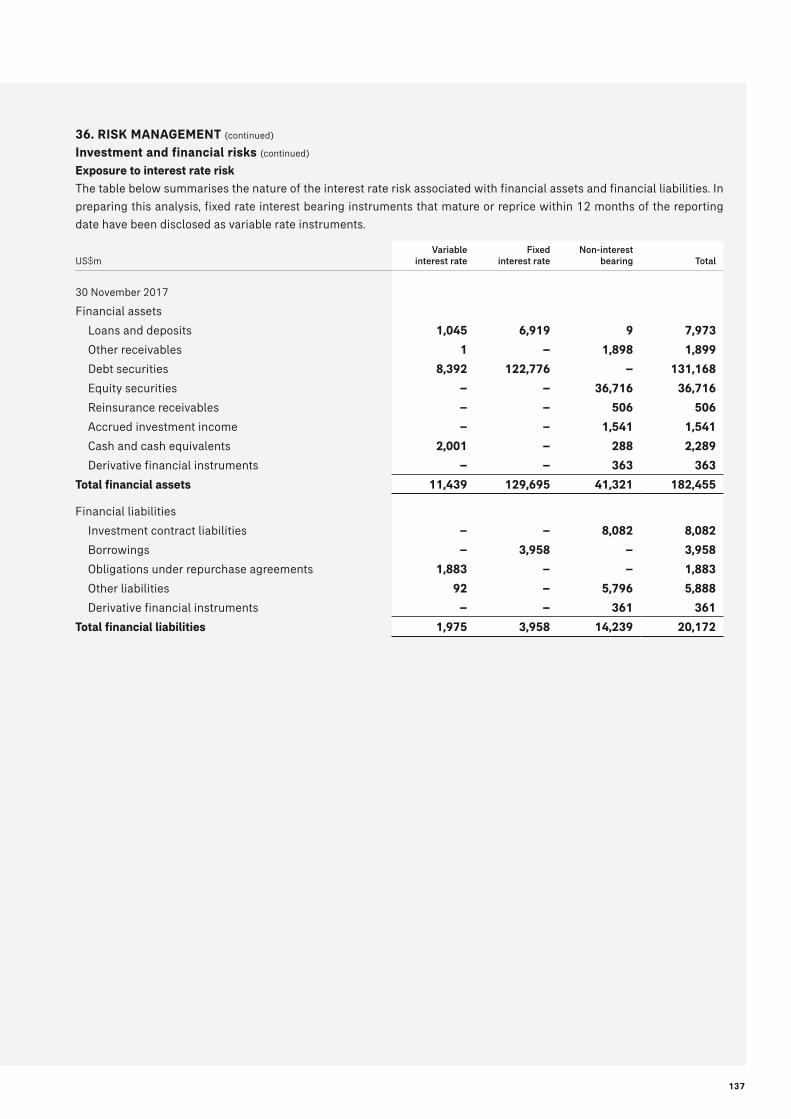
137
36. RISK MANAGEMENT (continued)
Investment and financial risks (continued)
Exposure to interest rate risk
The table below summarises the nature of the interest rate risk associated with financial assets and financial liabilities. In
preparing this analysis, fixed rate interest bearing instruments that mature or reprice within 12 months of the reporting
date have been disclosed as variable rate instruments.
US$mVariable
interest rateFixed
interest rateNon-interest
bearing Total
30 November 2017
Financial assets
Loans and deposits 1,045 6,919 9 7,973
Other receivables 1 – 1,898 1,899
Debt securities 8,392 122,776 – 131,168
Equity securities – – 36,716 36,716
Reinsurance receivables – – 506 506
Accrued investment income – – 1,541 1,541
Cash and cash equivalents 2,001 – 288 2,289
Derivative financial instruments – – 363 363
Total financial assets 11,439 129,695 41,321 182,455
Financial liabilities
Investment contract liabilities – – 8,082 8,082
Borrowings – 3,958 – 3,958
Obligations under repurchase agreements 1,883 – – 1,883
Other liabilities 92 – 5,796 5,888
Derivative financial instruments – – 361 361
Total financial liabilities 1,975 3,958 14,239 20,172

138
36. RISK MANAGEMENT (continued)
Investment and financial risks (continued)
Exposure to interest rate risk (continued)
US$mVariable
interest rateFixed
interest rateNon-interest
bearing Total
30 November 2016
Financial assets
Loans and deposits 1,108 5,929 25 7,062
Other receivables 164 – 1,569 1,733
Debt securities 7,342 106,276 – 113,618
Equity securities – – 30,211 30,211
Reinsurance receivables – – 335 335
Accrued investment income – – 1,383 1,383
Cash and cash equivalents 1,456 – 186 1,642
Derivative financial instruments – – 107 107
Total financial assets 10,070 112,205 33,816 156,091
Financial liabilities
Investment contract liabilities – – 7,028 7,028
Borrowings – 3,459 1 3,460
Obligations under repurchase agreements 1,984 – – 1,984
Other liabilities – – 4,723 4,723
Derivative financial instruments – – 644 644
Total financial liabilities 1,984 3,459 12,396 17,839
Equity price risk
Equity price risk arises from changes in the market value of equity securities. Investments in equity securities on a long-
term basis are expected to provide diversification benefits and enhance returns. The extent of exposure to equities at any
time is subject to the terms of the Group’s strategic asset allocations.
Equity price risk is managed in the first instance through the individual investment mandates which define benchmarks
and any tracking error targets. Equity limits are also applied to contain individual exposures. Equity exposures are included
in the aggregate exposure reports on each individual counterparty to ensure concentrations are avoided.

139
36. RISK MANAGEMENT (continued)
Investment and financial risks (continued)
Equity price risk (continued)
Sensitivity analysis
Sensitivity analysis to the key variables affecting financial assets and liabilities is set out in the table below. Information
relating to sensitivity of insurance and investment contracts with DPF is provided in note 27. The carrying values of other
financial assets are not subject to changes in response to movements in interest rates or equity prices. In calculating the
sensitivity of debt and equity instruments to changes in interest rates and equity prices, the Group has made assumptions
about the corresponding impact of asset valuations on liabilities to policyholders. Assets held to support unit-linked
contracts have been excluded on the basis that changes in fair value are wholly borne by policyholders. Sensitivity analysis
for assets held in participating funds has been calculated after allocation of returns to policyholders using the applicable
minimum policyholders’ participation ratios described in note 2.
Information is presented to illustrate the estimated impact on profits and total equity arising from a change in a single
variable before taking into account the effects of taxation.
The impact of any impairments of financial assets has been ignored for the purpose of illustrating the sensitivity of profit
before tax and total equity before the effects of taxation to changes in interest rates and equity prices on the grounds that
default events reflect the characteristics of individual issuers. As the Group’s accounting policies lock in interest rate
assumptions on policy inception and the Group’s assumptions incorporate a provision for adverse deviations, the level of
movement illustrated in this sensitivity analysis does not result in loss recognition and so there is not any corresponding
effect on liabilities.
30 November 2017 30 November 2016
US$m
Impact on profit
before tax
Impact on total
equity (before
the effects of taxation)
Impact on allocated
equity (before the
effects of taxation)
Impact on profit
before tax
Impact on total
equity (before
the effects of taxation)
Impact on allocated
equity (before the
effects of taxation)
Equity price risk
10 per cent increase in equity prices 1,182 1,182 1,182 995 995 995
10 per cent decrease in equity prices (1,182) (1,182) (1,182) (995) (995) (995)
Interest rate risk
+ 50 basis points shift in yield curves (157) (5,676) (157) (204) (4,699) (204)
- 50 basis points shift in yield curves 169 6,272 169 219 5,179 219
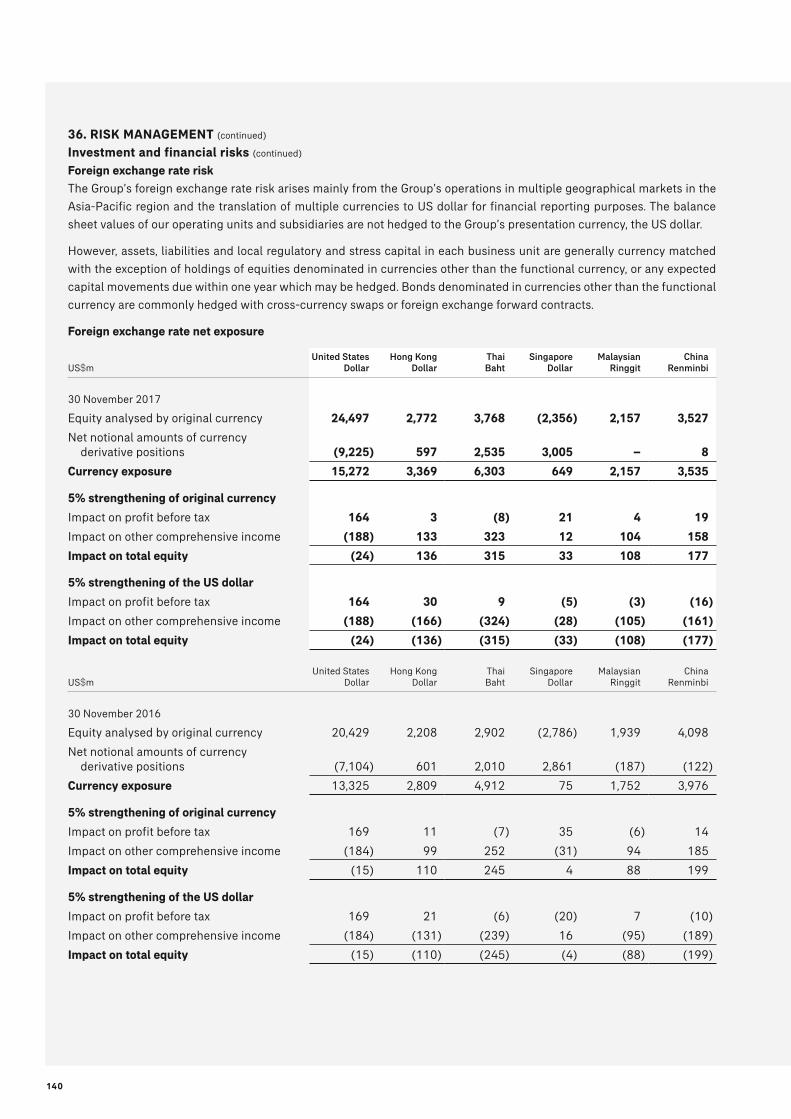
140
36. RISK MANAGEMENT (continued)
Investment and financial risks (continued)
Foreign exchange rate risk
The Group’s foreign exchange rate risk arises mainly from the Group’s operations in multiple geographical markets in the
Asia-Pacific region and the translation of multiple currencies to US dollar for financial reporting purposes. The balance
sheet values of our operating units and subsidiaries are not hedged to the Group’s presentation currency, the US dollar.
However, assets, liabilities and local regulatory and stress capital in each business unit are generally currency matched
with the exception of holdings of equities denominated in currencies other than the functional currency, or any expected
capital movements due within one year which may be hedged. Bonds denominated in currencies other than the functional
currency are commonly hedged with cross-currency swaps or foreign exchange forward contracts.
Foreign exchange rate net exposure
US$mUnited States
DollarHong Kong
DollarThai Baht
Singapore Dollar
Malaysian Ringgit
China Renminbi
30 November 2017
Equity analysed by original currency 24,497 2,772 3,768 (2,356) 2,157 3,527
Net notional amounts of currency derivative positions (9,225) 597 2,535 3,005 – 8
Currency exposure 15,272 3,369 6,303 649 2,157 3,535
5% strengthening of original currency
Impact on profit before tax 164 3 (8) 21 4 19
Impact on other comprehensive income (188) 133 323 12 104 158
Impact on total equity (24) 136 315 33 108 177
5% strengthening of the US dollar
Impact on profit before tax 164 30 9 (5) (3) (16)
Impact on other comprehensive income (188) (166) (324) (28) (105) (161)
Impact on total equity (24) (136) (315) (33) (108) (177)
US$mUnited States
DollarHong Kong
DollarThai Baht
Singapore Dollar
Malaysian Ringgit
China Renminbi
30 November 2016
Equity analysed by original currency 20,429 2,208 2,902 (2,786) 1,939 4,098
Net notional amounts of currency derivative positions (7,104) 601 2,010 2,861 (187) (122)
Currency exposure 13,325 2,809 4,912 75 1,752 3,976
5% strengthening of original currency
Impact on profit before tax 169 11 (7) 35 (6) 14
Impact on other comprehensive income (184) 99 252 (31) 94 185
Impact on total equity (15) 110 245 4 88 199
5% strengthening of the US dollar
Impact on profit before tax 169 21 (6) (20) 7 (10)
Impact on other comprehensive income (184) (131) (239) 16 (95) (189)
Impact on total equity (15) (110) (245) (4) (88) (199)

141
36. RISK MANAGEMENT (continued)
Investment and financial risks (continued)
Liquidity risk
AIA identifies liquidity risk as occurring in two ways, financial liquidity risk and investment liquidity risk. Financial liquidity risk is the risk that insufficient cash is available to meet payment obligations to counterparties as they fall due. One area of particular focus in the management of financial liquidity is collateral. AIA manages this exposure by determining limits for its activities in the derivatives and repurchase agreement markets based on the collateral available within the relevant fund or subsidiary to withstand extreme market events. More broadly AIA supports its liquidity through committed bank facilities, use of the bond repurchase markets and maintaining access to debt markets via the Company’s Global Medium-term Note and Securities programme.
Investment liquidity risk occurs in relation to the Group’s ability to buy and sell investments. This is a function of the size of the Group’s holdings relative to the availability of counterparties willing to buy or sell these holdings at any given time. In times of stress, market losses will generally be compounded by forced sellers seeking unwilling buyers.
While life insurance companies are characterised by a relatively low need for liquidity to cover those of their liabilities which are directly linked to mortality and morbidity, this risk is nevertheless carefully managed by continuously assessing the relative liquidity of the Group’s assets and managing the size of individual holdings through limits.
US$m Total
Due in one year
or less
Due after one year through
five years
Due after five years
through ten years
Due after ten years
No fixed maturity
30 November 2017
Financial assets (Policyholder and shareholder investments)
Loans and deposits 7,866 1,427 919 399 2,392 2,729
Other receivables 1,727 1,617 59 6 – 45
Debt securities 126,464 3,834 17,553 31,334 73,743 –
Equity securities 17,763 – – – – 17,763
Reinsurance receivables 506 506 – – – –
Accrued investment income 1,494 1,486 1 – – 7
Cash and cash equivalents 1,833 1,833 – – – –
Derivative financial instruments 352 76 142 122 12 –
Subtotal 158,005 10,779 18,674 31,861 76,147 20,544
Financial assets (Unit-linked contracts and consolidated investment funds) 24,450 – – – – 24,450
Total 182,455 10,779 18,674 31,861 76,147 44,994
Financial and insurance contract liabilities (Policyholder and shareholder investments)
Insurance and investment contract liabilities (net of deferred acquisition and origination costs, and reinsurance) 109,900 2,609 10,420 11,404 85,467 –
Borrowings 3,958 500 499(1) 1,242 1,717 –
Obligations under repurchase agreements 1,883 1,883 – – – –
Other liabilities 4,445 3,314 47 2 – 1,082
Derivative financial instruments 361 170 57 86 48 –
Subtotal 120,547 8,476 11,023 12,734 87,232 1,082
Financial and insurance contract liabilities (Unit-linked contracts and consolidated investment funds) 24,450 – – – – 24,450
Total 144,997 8,476 11,023 12,734 87,232 25,532
Note:(1) No borrowings are due after 2 years through 5 years.

142
36. RISK MANAGEMENT (continued)
Investment and financial risks (continued)
Liquidity risk (continued)
US$m Total
Due in one year
or less
Due after one year through
five years
Due after five years
through ten years
Due after ten years
No fixed maturity
30 November 2016
Financial assets (Policyholders and shareholder investments)
Loans and deposits 6,866 818 1,095 298 2,204 2,451
Other receivables 1,676 1,558 78 6 – 34
Debt securities 109,162 3,098 16,341 28,291 61,432 –
Equity securities 14,713 – – – – 14,713
Reinsurance receivables 335 335 – – – –
Accrued investment income 1,341 1,333 1 – – 7
Cash and cash equivalents 1,137 1,137 – – – –
Derivative financial instruments 104 53 12 26 13 –
Subtotal 135,334 8,332 17,527 28,621 63,649 17,205
Financial assets (Unit-linked contracts and consolidated investment funds) 20,757 – – – – 20,757
Total 156,091 8,332 17,527 28,621 63,649 37,962
Financial and insurance contract liabilities (Policyholders and shareholder investments)
Insurance and investment contract liabilities (net of deferred acquisition and origination costs, and reinsurance) 95,007 2,725 9,799 10,529 71,954 –
Borrowings 3,460 – 998(1) 1,241 1,221 –
Obligations under repurchase agreements 1,984 1,984 – – – –
Other liabilities 3,379 2,354 47 2 13 963
Derivative financial instruments 642 93 208 313 28 –
Subtotal 104,472 7,156 11,052 12,085 73,216 963
Financial and insurance contract liabilities (Unit-linked contracts and consolidated investment funds) 20,743 – – – – 20,743
Total 125,215 7,156 11,052 12,085 73,216 21,706
Note:
(1) Includes amounts of US$498m falling due after 2 years through 5 years.

143
37. EMPLOYEE BENEFITS
Defined benefit plans
The Group operates funded and unfunded defined benefit plans that provide life and medical benefits for participating
employees after retirement and a lump sum benefit on cessation of employment. The locations covered by these plans
include Hong Kong, Singapore, Malaysia, Thailand, Indonesia, Korea, the Philippines, Sri Lanka, Taiwan and Vietnam. The
latest independent actuarial valuations of the plans were at 30 November 2017 and were prepared by credentialed
actuaries. All the actuaries are qualified members of professional actuarial organisations to render the actuarial opinions.
The actuarial valuations indicate that the Group’s obligations under these defined benefit retirement plans are 44 per cent
(2016: 33 per cent) covered by the plan assets held by the trustees. The fair value of plan assets as at year end at the date
of valuation was US$79m (2016: US$62m). The total expenses relating to these plans recognised in the consolidated
income statement was US$7m (2016: US$11m).
Defined contribution plans
The Group operates a number of defined contribution pension plans. The total expense relating to these plans in the
current year was US$72m (2016: US$67m). Employees and the employer are required to make monthly contributions
equal to 1 per cent to 22 per cent of the employees’ monthly basic salaries, depending on years of service and subject to
any applicable caps of monthly relevant income in different jurisdictions. For defined contribution pension plans with
vesting conditions, any forfeited contributions by employers on behalf of employees who leave the scheme prior to vesting
fully in such contributions are used by the employer to reduce any future contributions. The amount of forfeited contributions
used to reduce the existing level of contributions is not material.
38. SHARE-BASED COMPENSATION
Share-based compensation plans
During the year ended 30 November 2017, the Group made further awards of share options, restricted share units (RSUs)
and restricted stock purchase units (RSPUs) to certain directors, officers and employees of the Group under the Share
Option Scheme (SO Scheme), the Restricted Share Unit Scheme (RSU Scheme) and the Employee Share Purchase Plan
(ESPP). In addition, the Group made further awards of restricted stock subscription units (RSSUs) to eligible agents under
the Agency Share Purchase Plan (ASPP).
RSU Scheme
Under the RSU Scheme, the vesting of the awarded RSUs is conditional upon the eligible participants remaining in
employment with the Group during the respective vesting periods. RSU awards are vested either entirely after a specific
period of time or in tranches over the vesting period. For RSU awards that are vested in tranches, each vesting tranche is
accounted for as a separate award for the purposes of recognising the expense over the vesting period. For certain RSUs,
performance conditions are also attached which include both market and non-market conditions. RSUs subject to
performance conditions are released to the participants at the end of the vesting period depending on the actual
achievement of the performance conditions. During the vesting period, the participants are not entitled to dividends of the
underlying shares. Except in jurisdictions where restrictions apply, the awarded RSUs are expected to be settled in equity;
awards that the Group has the legal or constructive obligation to settle in cash are insignificant to the Group. The maximum
number of shares that can be awarded under this scheme is 301,100,000 (2016: 301,100,000), representing approximately
2.5 per cent (2016: 2.5 per cent) of the number of shares in issue at 30 November 2017.
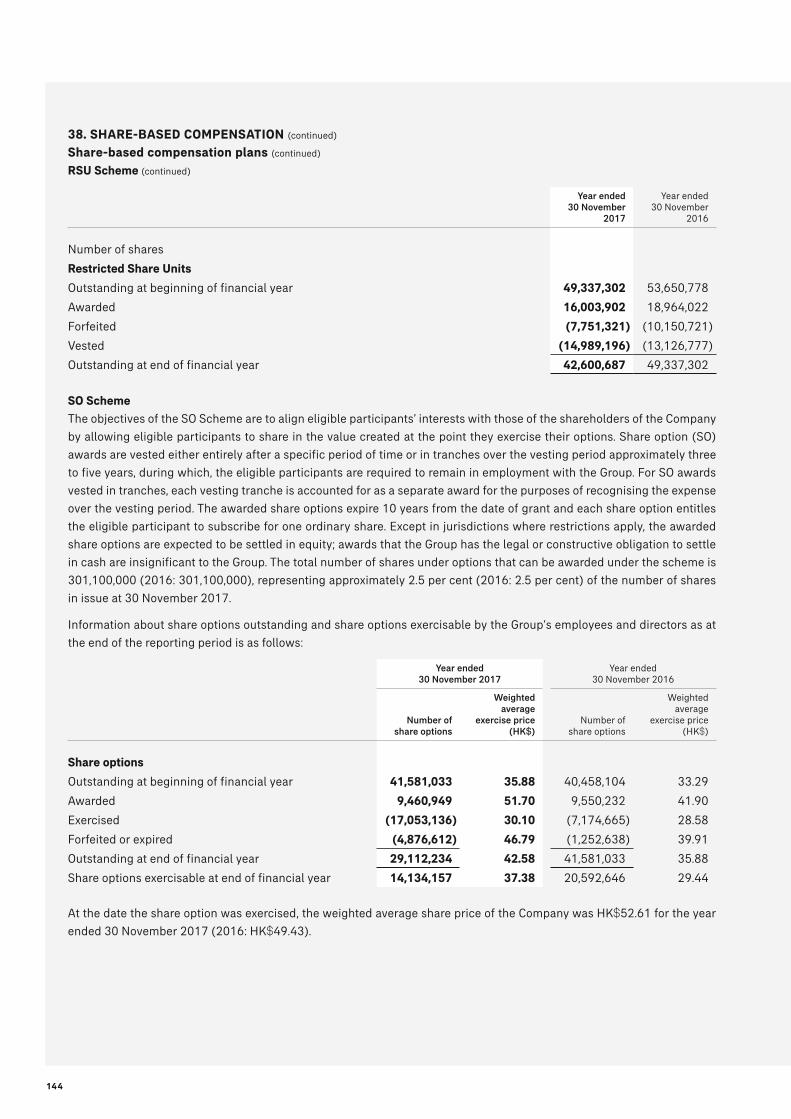
144
38. SHARE-BASED COMPENSATION (continued)
Share-based compensation plans (continued)
RSU Scheme (continued)
Year ended 30 November
2017
Year ended 30 November
2016
Number of shares
Restricted Share Units
Outstanding at beginning of financial year 49,337,302 53,650,778
Awarded 16,003,902 18,964,022
Forfeited (7,751,321) (10,150,721)
Vested (14,989,196) (13,126,777)
Outstanding at end of financial year 42,600,687 49,337,302
SO Scheme
The objectives of the SO Scheme are to align eligible participants’ interests with those of the shareholders of the Company
by allowing eligible participants to share in the value created at the point they exercise their options. Share option (SO)
awards are vested either entirely after a specific period of time or in tranches over the vesting period approximately three
to five years, during which, the eligible participants are required to remain in employment with the Group. For SO awards
vested in tranches, each vesting tranche is accounted for as a separate award for the purposes of recognising the expense
over the vesting period. The awarded share options expire 10 years from the date of grant and each share option entitles
the eligible participant to subscribe for one ordinary share. Except in jurisdictions where restrictions apply, the awarded
share options are expected to be settled in equity; awards that the Group has the legal or constructive obligation to settle
in cash are insignificant to the Group. The total number of shares under options that can be awarded under the scheme is
301,100,000 (2016: 301,100,000), representing approximately 2.5 per cent (2016: 2.5 per cent) of the number of shares
in issue at 30 November 2017.
Information about share options outstanding and share options exercisable by the Group’s employees and directors as at
the end of the reporting period is as follows:
Year ended 30 November 2017
Year ended 30 November 2016
Number of share options
Weighted average
exercise price(HK$)
Number of share options
Weighted average
exercise price(HK$)
Share options
Outstanding at beginning of financial year 41,581,033 35.88 40,458,104 33.29
Awarded 9,460,949 51.70 9,550,232 41.90
Exercised (17,053,136) 30.10 (7,174,665) 28.58
Forfeited or expired (4,876,612) 46.79 (1,252,638) 39.91
Outstanding at end of financial year 29,112,234 42.58 41,581,033 35.88
Share options exercisable at end of financial year 14,134,157 37.38 20,592,646 29.44
At the date the share option was exercised, the weighted average share price of the Company was HK$52.61 for the year
ended 30 November 2017 (2016: HK$49.43).

145
38. SHARE-BASED COMPENSATION (continued)
Share-based compensation plans (continued)
SO Scheme (continued)
The range of exercise prices for the share options outstanding as of 30 November 2017 and 2016 is summarised in the
table below.
Year ended 30 November 2017
Year ended 30 November 2016
Number of share options
outstanding
Weighted average
remaining contractual
life (years)
Number of share options
outstanding
Weighted average
remaining contractual
life (years)
Range of exercise price
HK$26 – HK$35 5,059,663 4.21 20,575,507 5.14
HK$36 – HK$45 12,090,822 7.58 15,489,143 8.48
HK$46 – HK$55 10,787,231 8.34 5,516,383 8.28
HK$56 – HK$65 1,174,518 9.67 – –
Outstanding at end of financial year 29,112,234 7.36 41,581,033 6.80
ESPP
Under the plan, eligible employees of the Group can purchase ordinary shares of the Company with qualified employee
contributions and the Company will award one matching restricted stock purchase unit to them at the end of the vesting
period for each two shares purchased through the qualified employee contributions (contribution shares). Contribution
shares are purchased from the open market. During the vesting period, the eligible employees must hold the contribution
shares purchased during the plan cycle and remain employed by the Group. The level of qualified employee contribution is
limited to not more than 8 per cent of the annual basic salary subject to a maximum of HK$117,000 per annum. The
awarded matching restricted stock purchase units are expected to be settled in equity. For the year ended 30 November
2017, eligible employees paid US$20m (2016: US$14m) to purchase 2,739,064 ordinary shares (2016: 2,436,497 ordinary
shares) of the Company.
ASPP
The structure of the ASPP generally follows that of the ESPP, the key difference being that the eligible agents are required
to pay a subscription price of US$1 to subscribe for each new share in the Company at the end of the vesting period. Under
the plan, eligible agents of the Group can purchase ordinary shares of the Company with qualified agent contributions and
the Company will award one matching restricted stock subscription unit to them at the end of the vesting period for each
two shares purchased through the qualified agent contributions (agent contribution shares). Each restricted stock
subscription unit entitles eligible agents to subscribe for one new share of the Company. Agent contribution shares are
purchased from the open market. During the vesting period, the eligible agents must hold the contribution shares purchased
during the plan cycle and maintain their agent contracts with the Group. The awarded matching restricted stock subscription
units are expected to be settled in equity. The level of qualified agent contribution is subject to a maximum of US$15,000
per annum. For the year ended 30 November 2017, eligible agents paid US$20m (2016: US$17m) to purchase 2,708,018
ordinary shares (2016: 2,792,549 ordinary shares) of the Company.
Valuation methodology
The Group utilises a binomial lattice model to calculate the fair value of the share option awards, a Monte-Carlo simulation
model and/or discounted cash flow technique to calculate the fair value of the RSU, ESPP and ASPP awards, taking into
account the terms and conditions upon which the awards were made. The price volatility is estimated on the basis of
implied volatility of the Company’s shares which is based on an analysis of historical data since they are traded in the Hong
Kong Stock Exchange. The expected life of the share options is derived from the output of the valuation model and is
calculated based on an analysis of expected exercise behaviour of the Company’s employees. The estimate of market
condition for performance-based RSUs is based on one-year historical data preceding the grant date. An allowance for
forfeiture prior to vesting is not included in the valuation of the awards.

146
38. SHARE-BASED COMPENSATION (continued)
Valuation methodology (continued)
The fair value calculated for share options is inherently subjective due to the assumptions made and the limitations of the
model utilised.
Year ended 30 November 2017
Share options
Restricted share units
ESPP Restricted
stock purchase
units
ASPP Restricted
stock subscription
units
Assumptions
Risk-free interest rate 1.45% – 1.90% 0.83% – 1.29%* 0.68% – 1.29% 1.25%
Volatility 20% 20% 20% 20%
Dividend yield 1.8% 1.8% 1.8% 1.8%
Exercise price (HK$) 50.30 – 61.55 n/a n/a n/a
Share option life (in years) 10 n/a n/a n/a
Expected life (in years) 7.95 – 8.00 n/a n/a n/a
Weighted average fair value per option/unit at measurement date (HK$) 10.47 39.95 58.25 45.81
Year ended 30 November 2016
Share options
Restricted share units
ESPP Restricted
stock purchase
units
ASPP Restricted
stock subscription
units
Assumptions
Risk-free interest rate 1.25% 0.50% – 0.74%* 0.47% – 0.88% 0.91%
Volatility 20% 20% 20% 20%
Dividend yield 1.8% 1.8% 1.2% – 1.8% 1.8%
Exercise price (HK$) 41.90 n/a n/a n/a
Share option life (in years) 10 n/a n/a n/a
Expected life (in years) 8.03 n/a n/a n/a
Weighted average fair value per option/unit at measurement date (HK$) 7.74 34.35 44.20 34.92
* Applicable to RSU with market conditions.
The weighted average share price for share option valuation for awards made during the year ended 30 November 2017 is
HK$51.70 (2016: HK$41.60). The total fair value of share options awarded during the year ended 30 November 2017 is
US$13m (2016: US$10m).
Recognised compensation cost
The total recognised compensation cost (net of expected forfeitures) related to various share-based compensation awards
made under the RSU Scheme, SO Scheme, ESPP and ASPP by the Group for the year ended 30 November 2017 is US$79m
(2016: US$84m).

147
39. REMUNERATION OF DIRECTORS AND KEY MANAGEMENT PERSONNEL
Directors’ remuneration
The Executive Directors receive compensation in the form of salaries, bonuses, contributions to pension schemes, long-
term incentives, housing and other allowances, and benefits in kind subject to applicable laws, rules and regulations.
Bonuses and long-term incentives represent the variable components in the Executive Director’s compensation and are
linked to the performance of the Group and the Executive Director. Details of share-based payment schemes are described
in note 38.
US$Director’s
fees
Salaries, allowances
and benefits in kind(1) Bonuses
Share-based payments(2)
Pension scheme
contributionOther
benefits(3)
Inducement fees Total
Year ended 30 November 2017
Executive Directors
Mr. Mark Edward Tucker(4) – 1,135,952 4,824,000 8,336,772 70,949 1,154,706 – 15,522,379
Mr. Ng Keng Hooi(5) – 749,333 1,504,110 1,375,587 44,788 – – 3,673,818
Total – 1,885,285 6,328,110 9,712,359 115,737 1,154,706 – 19,196,197
US$Director’s
fees
Salaries, allowances
and benefits in kind(1) Bonuses
Share-based payments(2)
Pension scheme
contributionOther
benefitsInducement
fees Total
Year ended 30 November 2016
Executive Director
Mr. Mark Edward Tucker(4) – 2,212,482 4,636,000 8,107,671 137,417 – – 15,093,570
Total – 2,212,482 4,636,000 8,107,671 137,417 – – 15,093,570
Notes:
(1) Includes non-cash benefits for housing, medical and life insurance, children’s education, club and professional membership, company car and perquisites.
(2) Includes SOs and RSUs awarded based upon the fair value at grant date.
(3) Includes post-employment benefits received during garden leave and termination benefits.
(4) Mr. Mark Edward Tucker receives his remuneration exclusively for his role as Group Chief Executive and President and receives no separate fees for his role as Director of the Company or for acting as a director of any subsidiary of the Company. Mr. Mark Edward Tucker retired as Group Chief Executive and President with effect from 1 June 2017.
(5) Mr. Ng Keng Hooi was appointed as Group Chief Executive and President of the Company on 1 June 2017. He receives his remuneration exclusively for his role as Group Chief Executive and President and receives no separate fees for his role as Director of the Company or for acting as a director of any subsidiary of the Company.

148
39. REMUNERATION OF DIRECTORS AND KEY MANAGEMENT PERSONNEL (continued)
Directors’ remuneration (continued)
The remuneration of Non-executive Director and Independent Non-executive Directors of the Company at 30 November
2017 and 2016 are included in the tables below:
US$Director’s
fees(1)
Salaries, allowances
and benefits in kind(2) Bonuses
Share-based payments
Pension scheme
contributionOther
benefitsInducement
fees Total
Year ended 30 November 2017
Non-executive Director
Mr. Mark Edward Tucker(3) – – – – – – – –
Independent Non-executive Directors
Mr. Edmund Sze-Wing Tse(4) 570,000 109,383 – – – – – 679,383
Mr. Jack Chak-Kwong So 260,000 – – – – – – 260,000
Mr. Chung-Kong Chow 220,000 – – – – – – 220,000
Mr. John Barrie Harrison 260,000 – – – – – – 260,000
Mr. George Yong-Boon Yeo 245,000 – – – – – – 245,000
Mr. Mohamed Azman Yahya 205,000 – – – – – – 205,000
Professor Lawrence Juen-Yee Lau 205,000 – – – – – – 205,000
Ms. Swee-Lian Teo 205,000 – – – – – – 205,000
Dr. Narongchai Akrasanee(5) 265,000 – – – – – – 265,000
Mr. Cesar Velasquez Purisima(6) 43,630 – – – – – – 43,630
Total 2,478,630 109,383 – – – – – 2,588,013

149
39. REMUNERATION OF DIRECTORS AND KEY MANAGEMENT PERSONNEL (continued)
Directors’ remuneration (continued)
US$Director’s
fees(1)
Salaries, allowances
and benefits in kind(2) Bonuses
Share-based payments
Pension scheme
contributionOther
benefitsInducement
fees Total
Year ended 30 November 2016
Non-executive Director
Mr. Edmund Sze-Wing Tse 571,230 97,289 – – – – – 668,519
Independent Non-executive Directors
Mr. Jack Chak-Kwong So 260,000 – – – – – – 260,000
Mr. Chung-Kong Chow 220,000 – – – – – – 220,000
Mr. John Barrie Harrison 260,000 – – – – – – 260,000
Mr. George Yong-Boon Yeo 245,000 – – – – – – 245,000
Mr. Mohamed Azman Yahya 205,000 – – – – – – 205,000
Professor Lawrence Juen-Yee Lau 205,000 – – – – – – 205,000
Ms. Swee-Lian Teo 205,000 – – – – – – 205,000
Dr. Narongchai Akrasanee(5) 188,566 – – – – – – 188,566
Total 2,359,796 97,289 – – – – – 2,457,085
Notes:
(1) Saved as disclosed below, all Directors receive the fees for their role as a Director of the Company and not for acting as a director of any subsidiary of the Company.
(2) Includes non-cash benefits for housing, club membership and medical insurance and company car.
(3) Mr. Mark Edward Tucker was re-designated as Non-executive Director of the Company on 1 June 2017 and retired from the position on 1 September 2017. He did not receive a director’s fee during his tenure of office as a Non-executive Director of the Company.
(4) Mr. Edmund Sze-Wing Tse was re-designated as Independent Non-executive Director of the Company on 23 March 2017.
(5) Dr. Narongchai Akrasanee was appointed as Independent Non-executive Director of the Company on 15 January 2016. US$50,000 which represents remuneration to Dr. Narongchai Akrasanee in respect of his services as Chairman of Advisory Board of AIA Thailand for the year ended 30 November 2017 is included in his fees.
(6) Mr. Cesar Velasquez Purisima was appointed as Independent Non-executive Director of the Company on 1 September 2017.
Remuneration of five highest-paid individuals
The aggregate remuneration of the five highest-paid individuals employed by the Group in each of the years ended 30
November 2017 and 2016 is presented in the table below.
US$Director’s
fees
Salaries, allowances
and benefits in kind(1) Bonuses
Share-based payments(2)
Pension scheme
contributionOther
benefits(3)
Inducement fees Total
Year ended
30 November 2017 – 5,098,393 10,523,042 15,462,857 247,032 2,458,727 – 33,790,051
30 November 2016 – 6,148,230 10,114,000 15,870,944 299,748 – – 32,432,922
Notes:
(1) 2017 and 2016 non-cash benefits include housing, medical and life insurance, medical check-up, children’s education, club and professional membership, company car and perquisites.
(2) Includes SOs and RSUs awarded to the five highest-paid individuals based upon the fair value at grant date.
(3) Includes post-employment benefits received during garden leave and termination benefits.

150
39. REMUNERATION OF DIRECTORS AND KEY MANAGEMENT PERSONNEL (continued)
Remuneration of five highest-paid individuals (continued)
The emoluments of the five individuals with the highest emoluments are within the following bands:
HK$
Year ended 30 November
2017
Year ended 30 November
2016
28,500,001 to 29,000,000 1 –
30,000,001 to 30,500,000 – 1
32,000,001 to 32,500,000 1 –
33,000,001 to 33,500,000 – 1
34,500,001 to 35,000,000 – 1
35,000,001 to 35,500,000 1 –
36,000,001 to 36,500,000 – 1
45,500,001 to 46,000,000 1 –
117,000,001 to 117,500,000 – 1
120,500,001 to 121,000,000 1 –
Key management personnel remuneration
Key management personnel have been identified as the members of the Group’s Executive Committee.
US$
Year ended 30 November
2017
Year ended 30 November
2016
Key management compensation and other expenses
Salaries and other short-term employee benefits 27,287,043 26,994,421
Post-employment benefits 3,731,580 568,687
Share-based payments(1) 18,646,971 21,144,940
Termination benefits 3,078,510 –
Total 52,744,104 48,708,048
Note:
(1) Include SOs and RSUs awarded to the key management personnel based upon the fair value at grant date.
The emoluments of the key management personnel are within the following bands:
US$
Year ended 30 November
2017
Year ended 30 November
2016
Below 1,000,000 4 2
1,000,001 to 2,000,000 5 1
2,000,001 to 3,000,000 1 3
3,000,001 to 4,000,000 3 3
4,000,001 to 5,000,000 2 3
5,000,001 to 6,000,000 1 –
Over 7,000,000 1 1

151
40. RELATED PARTY TRANSACTIONS
Remuneration of Directors and key management personnel is disclosed in note 39.
41. COMMITMENTS AND CONTINGENCIES
Commitments under operating leases
Total future aggregate minimum lease payments under non-cancellable operating leases are as follows:
US$m
As at 30 November
2017
As at 30 November
2016
Properties and others expiring
Not later than one year 128 120
Later than one and not later than five years 219 178
Later than five years 48 94
Total 395 392
The Group is the lessee in respect of a number of properties and items of office equipment held under operating leases.
The leases typically run for an initial period of one to ten years, with an option to renew the lease when all terms are
renegotiated. Lease payments are usually reviewed at the end of the lease term to reflect market rates. None of the leases
include contingent rentals.
Investment and capital commitments
US$m
As at 30 November
2017
As at 30 November
2016
Not later than one year 1,231 682
Later than one and not later than five years 6 10
Total 1,237 692
Investment and capital commitments consist of commitments to invest in private equity partnerships and other assets.
Contingencies
The Group is subject to regulation in each of the geographical markets in which it operates from insurance, securities,
capital markets, pension, data privacy and other regulators and is exposed to the risk of regulatory actions in response to
perceived or actual non-compliance with regulations relating to suitability, sales or underwriting practices, claims
payments and procedures, product design, disclosure, administration, denial or delay of benefits and breaches of fiduciary
or other duties. The Group believes that these matters have been adequately provided for in these financial statements.
The Group is exposed to legal proceedings, complaints and other actions from its activities including those arising from
commercial activities, sales practices, suitability of products, policies and claims. The Group believes that these matters
are adequately provided for in these financial statements.
The Group is the reinsurer in a residential mortgage credit reinsurance agreement covering residential mortgages in
Australia. The Group is exposed to the risk of losses in the event of the failure of the retrocessionaire, a subsidiary of
American International Group, Inc., to honour its outstanding obligations which is mitigated by a trust agreement. The
principal balance outstanding of mortgage loans to which the reinsurance agreement relates were approximately US$561m
at 30 November 2017 (2016: US$616m). The liabilities and related reinsurance assets, which totalled US$2m (2016:
US$3m), respectively, arising from these agreements are reflected and presented on a gross basis in these financial
statements in accordance with the Group’s accounting policies. The Group expects to fully recover amounts outstanding at
the reporting date under the terms of this agreement from the retrocessionaire.

152
42. SUBSIDIARIES
The principal subsidiary companies which materially contribute to the net income of the Group or hold a material element
of its assets and liabilities are:
Name of entity
Place of
incorporation
and operation Principal activity Issued share capital
As at
30 November 2017
As at
30 November 2016
Group’s
interest %
NCI’s
interest %
Group’s
interest %
NCI’s
interest %
AIA Company Limited(1) Hong Kong Insurance 1,151,049,861 ordinary shares
for US$5,962,084,000 issued
share capital
100% – 100% –
AIA International Limited Bermuda Insurance 3,000,000 ordinary shares
of US$1.20 each
100% – 100% –
AIA Australia Limited Australia Insurance 112,068,300 ordinary shares
of A$193,872,800 issued
share capital
100% – 100% –
AIA Pension and Trustee Co. Ltd. British Virgin
Islands
Trusteeship 19,500,000 ordinary shares
of US$1 each
100% – 100% –
AIA Bhd. Malaysia Insurance 767,438,174 ordinary shares
of RM1 each
100% – 100% –
AIA Singapore Private Limited Singapore Insurance 1,374,000,001 ordinary shares
of S$1 each
100% – 100% –
PT. AIA Financial Indonesia Insurance 1,910,844,140 ordinary shares
of Rp1,000 each
100% – 100% –
The Philippine American Life
and General Insurance
(PHILAM LIFE) Company
Philippines Insurance 199,560,671 ordinary shares of
PHP10 each and 439,329
treasury shares
100% – 100% –
AIA (Vietnam) Life Insurance
Company Limited
Vietnam Insurance Contributed capital of
VND1,264,300,000,000
100% – 100% –
AIA Insurance Lanka PLC Sri Lanka Insurance Stated capital of
LKR511,921,836
97.16% 2.84% 97.16% 2.84%
Bayshore Development Group Limited British Virgin
Islands
Investment
holding
company
100 ordinary shares of
US$1 each
90% 10% 90% 10%
BPI-Philam Life Assurance
(BPLAC) Corporation
Philippines Insurance 749,993,979 ordinary shares
of PHP1 each and 6,000
treasury shares
51% 49% 51% 49%
AIA Reinsurance Limited Bermuda Reinsurance 250,000 common shares of
US$1 each
100% – 100% –
Notes:
(1) The Company’s subsidiary.
(2) All of the above subsidiaries are audited by PricewaterhouseCoopers.
All subsidiaries are unlisted except AIA Insurance Lanka PLC which is listed on the Main Board of the Colombo Stock
Exchange.

153
43. EVENTS AFTER THE REPORTING PERIOD
On 1 January 2018, AIA International completed the transfer of its insurance business in Korea from a branch to a wholly-owned subsidiary, AIA Life Insurance Co. Ltd. This transfer was not expected to have any material financial impact on the Group consolidated financial statements.
In September 2017, the Group reached an agreement, subject to securing all necessary regulatory and governmental approvals, to acquire Commonwealth Bank of Australia’s (CBA) life insurance business in Australia and life and health insurance businesses in New Zealand. The transaction includes 20-year strategic bancassurance partnerships with CBA in Australia and ASB Bank Limited in New Zealand. The transaction will expand the Group’s distribution capabilities and customer reach in Australia and New Zealand markets. As announced on 21 September 2017, the gross consideration to be paid with respect to the proposed transaction is expected to be approximately US$3.0 billion payable in cash on completion of the proposed transaction and subject to certain adjustments at completion. After taking into account the expected proceeds from reinsurance agreements and the expected free surplus of the acquired businesses, the final net cash outlay by AIA is expected to be approximately US$1.5 billion.
In December 2017, the Group entered into a 15-year extension of the existing exclusive regional bancassurance agreement with Public Bank Berhad, a leading Malaysian banking group, extending the partnership from 2023 to 2037.
The Board has resolved to change the Company’s financial year-end date from 30 November to 31 December. Accordingly, the next financial year-end date of the Company will be 31 December 2018 and the next audited financial statements of the Group will cover a 13-month period from 1 December 2017 to 31 December 2018.
On 27 February 2018, a Committee appointed by the Board of Directors proposed a final dividend of 74.38 Hong Kong
cents per share (2016: 63.75 Hong Kong cents per share).
44. STATEMENT OF FINANCIAL POSITION OF THE COMPANY
US$m
As at 30 November
2017
As at 30 November
2016
Assets
Investment in subsidiaries 15,750 15,745
Available for sale – debt securities 2,442 1,544
At fair value through profit or loss – derivative financial instruments 37 –
Loans to/amounts due from subsidiaries 3,554 2,903
Other assets 17 44
Cash and cash equivalents 5 4
Total assets 21,805 20,240
Liabilities
Borrowings 4,420 3,777
Derivative financial instruments 125 –
Other liabilities 43 70
Total liabilities 4,588 3,847
Equity
Share capital 14,065 13,998
Employee share-based trusts (297) (351)
Other reserves 199 185
Retained earnings 3,315 2,620
Amounts reflected in other comprehensive income (65) (59)
Total equity 17,217 16,393
Total liabilities and equity 21,805 20,240
Note:
(1) The financial information of the Company should be read in conjunction with the consolidated financial statements of the Group.

154
45. STATEMENT OF CHANGES IN EQUITY OF THE COMPANY
US$mShare
capital
Employee share-based
trustsOther
reservesRetained earnings
Amounts reflected
in other comprehensive
incomeTotal
equity
Balance at 1 December 2016 13,998 (351) 185 2,620 (59) 16,393
Net profit – – – 2,071 – 2,071
Cash flow hedges – – – – (11) (11)
Fair value losses on available for sale financial assets – – – – (4) (4)
Fair value losses on available for sale financial assets transferred to income on disposal – – – – 8 8
Dividends – – – (1,376) – (1,376)
Shares issued under share option scheme and agency share purchase plan 67 – – – – 67
Share-based compensation – – 79 – – 79
Purchase of shares held by employee share-based trusts – (10) – – – (10)
Transfer of vested shares from employee share-based trusts – 64 (64) – – –
Balance at 30 November 2017 14,065 (297) 200 3,315 (66) 17,217
US$mShare
capital
Employee share-based
trustsOther
reservesRetained earnings
Amounts reflected
in other comprehensive
incomeTotal
equity
Balance at 1 December 2015 13,971 (321) 155 2,785 (22) 16,568
Net profit – – – 959 – 959
Cash flow hedges – – – – (1) (1)
Fair value losses on available for sale financial assets – – – – (10) (10)
Fair value gains on available for sale financial assets transferred to income on disposal – – – – (26) (26)
Dividends – – – (1,124) – (1,124)
Shares issued under share option scheme and agency share purchase plan 27 – – – – 27
Share-based compensation – – 86 – – 86
Purchase of shares held by employee share-based trusts – (86) – – – (86)
Transfer of vested shares from employee share-based trusts – 56 (56) – – –
Balance at 30 November 2016 13,998 (351) 185 2,620 (59) 16,393

155
INDEPENDENT AUDITOR’S REPORT ON THE SUPPLEMENTARY EMBEDDED VALUE INFORMATION
INDEPENDENT AUDITOR’S REPORT ON THE SUPPLEMENTARY EMBEDDED VALUE
INFORMATION AS AT AND FOR THE YEAR ENDED 30 NOVEMBER 2017
TO THE BOARD OF DIRECTORS OF AIA GROUP LIMITED
(incorporated in Hong Kong with limited liability)
Opinion
What we have audited
We have audited the Supplementary Embedded Value Information (the “EV Information”) of AIA
Group Limited (the “Company”) and its subsidiaries (the “Group”) set out on pages 159 to 178,
which comprises:
• the consolidated EV results as at and for the year ended 30 November 2017;
• the sensitivity analysis as at and for the year then ended; and
• a summary of significant methodology and assumptions and other explanatory notes.
Our opinion
In our opinion, the EV Information of the Group as at and for the year ended 30 November 2017 is
prepared, in all material respects, in accordance with the EV basis of preparation set out in
Sections 4 and 5 of the EV Information.
Basis for Opinion
We conducted our audit in accordance with Hong Kong Standards on Auditing (“HKSAs”) issued
by the Hong Kong Institute of Certified Public Accountants (“HKICPA”). Our responsibilities under
those standards are further described in the Auditor’s Responsibilities for the Audit of the EV
Information section of our report.
We believe that the audit evidence we have obtained is sufficient and appropriate to provide a
basis for our opinion.
Independence
We are independent of the Group in accordance with the HKICPA’s Code of Ethics for Professional
Accountants (“the Code”), and we have fulfilled our other ethical responsibilities in accordance
with the Code.
Emphasis of Matter – Basis of Preparation
We draw attention to Sections 4 and 5 of the EV Information, which describes the EV basis of
preparation. As a result, the EV Information may not be suitable for another purpose. Our opinion
is not modified in respect of this matter.

156
Other Matter
The EV Information includes comparative information. The comparative information for the
three-month periods ended 29 February 2016, 31 May 2016, 31 August 2016 and 30 November
2016 has not been audited.
The Group has prepared a separate set of consolidated financial statements for the year ended 30
November 2017 in accordance with Hong Kong Financial Reporting Standards (“HKFRSs”) issued
by the HKICPA and with International Financial Reporting Standards (“IFRSs”) issued by the
International Accounting Standards Board (“IASB”), on which we issued a separate auditor’s
report to the shareholders of the Company dated 27 February 2018.
Other Information
The Directors of the Company are responsible for the other information. The other information
comprises the Group Chief Executive and President’s Report, Financial Review, Business Review,
Regulatory and International Developments, Consolidated Financial Statements and our auditor’s
report thereon, and Glossary (but does not include the EV Information of AIA Group Limited and
our auditor’s report thereon), which we obtained prior to the date of this auditor’s report, and the
Financial Highlights, Chairman’s Statement, Risk Management, Our People, Corporate Social
Responsibility, Statement of Directors’ Responsibilities, Board of Directors, Executive Committee,
Report of the Directors, Corporate Governance Report, Remuneration Report, Information for
Shareholders and Corporate Information, which are expected to be made available to us after that
date.
Our opinion on the EV Information does not cover the other information and we do not and will not
express any form of assurance conclusion thereon.
In connection with our audit of the EV Information, our responsibility is to read the other
information identified above and, in doing so, consider whether the other information is materially
inconsistent with the EV Information or our knowledge obtained in the audit, or otherwise appears
to be materially misstated.
If, based on the work we have performed on the other information that we obtained prior to the
date of this auditor’s report, we conclude that there is a material misstatement of this other
information, we are required to report that fact. We have nothing to report in this regard.
When we read the Financial Highlights, Chairman’s Statement, Risk Management, Our People,
Corporate Social Responsibility, Statement of Directors’ Responsibilities, Board of Directors,
Executive Committee, Report of the Directors, Corporate Governance Report, Remuneration
Report, Information for Shareholders and Corporate Information, if we conclude that there is a
material misstatement therein, we are required to communicate the matter to those charged with
governance and take appropriate action considering our legal rights and obligations.

157
Responsibilities of Directors and Those Charged With Governance for the EV Information
The Directors of the Company are responsible for the preparation of the EV Information in
accordance with the EV basis of preparation set out in Sections 4 and 5 of the EV Information and
for such internal control as the Directors determine is necessary to enable the preparation of the
EV Information that is free from material misstatement, whether due to fraud or error.
In preparing the EV Information, the Directors are responsible for assessing the Group’s ability to
continue as a going concern, disclosing, as applicable, matters relating to going concern and
using the going concern basis of accounting unless the Directors either intend to liquidate the
Group or to cease operations, or has no realistic alternative but to do so.
Those charged with governance are responsible for overseeing the Group’s EV Information
reporting process.
Auditor’s Responsibilities for the Audit of the EV Information
Our objectives are to obtain reasonable assurance about whether the EV Information as a whole
is free from material misstatement, whether due to fraud or error, and to issue an auditor’s report
that includes our opinion. We report our opinion solely to you, as a body, and for no other purpose.
We do not assume responsibility towards or accept liability to any other person for the contents
of this report. Reasonable assurance is a high level of assurance, but is not a guarantee that an
audit conducted in accordance with HKSAs will always detect a material misstatement when it
exists. Misstatements can arise from fraud or error and are considered material if, individually or
in the aggregate, they could reasonably be expected to influence the economic decisions of users
taken on the basis of this EV Information.
As part of an audit in accordance with HKSAs, we exercise professional judgement and maintain
professional scepticism throughout the audit. We also:
• Identify and assess the risks of material misstatement of the EV Information, whether due to
fraud or error, design and perform audit procedures responsive to those risks, and obtain audit
evidence that is sufficient and appropriate to provide a basis for our opinion. The risk of not
detecting a material misstatement resulting from fraud is higher than for one resulting from
error, as fraud may involve collusion, forgery, intentional omissions, misrepresentations, or the
override of internal control.
• Obtain an understanding of internal control relevant to the audit in order to design audit
procedures that are appropriate in the circumstances, but not for the purpose of expressing an
opinion on the effectiveness of the Group’s internal control.

158
Auditor’s Responsibilities for the Audit of the EV Information (continued)
• Evaluate the appropriateness of the EV basis of preparation used and the reasonableness of
accounting estimates and related disclosures made by the Directors.
• Conclude on the appropriateness of the Directors’ use of the going concern basis of accounting
and, based on the audit evidence obtained, whether a material uncertainty exists related to
events or conditions that may cast significant doubt on the Group’s ability to continue as a
going concern. If we conclude that a material uncertainty exists, we are required to draw
attention in our auditor’s report to the related disclosures in the EV Information or, if such
disclosures are inadequate, to modify our opinion. Our conclusions are based on the audit
evidence obtained up to the date of our auditor’s report. However, future events or conditions
may cause the Group to cease to continue as a going concern.
• Obtain sufficient appropriate audit evidence regarding the EV Information of the entities or
business activities within the Group to express an opinion on the EV Information. We are
responsible for the direction, supervision and performance of the group audit. We remain
solely responsible for our audit opinion.
We communicate with those charged with governance regarding, among other matters, the
planned scope and timing of the audit and significant audit findings, including any significant
deficiencies in internal control that we identify during our audit.
We also provide those charged with governance with a statement that we have complied with
relevant ethical requirements regarding independence, and to communicate with them all
relationships and other matters that may reasonably be thought to bear on our independence, and
where applicable, related safeguards.
The engagement partner on the audit resulting in this independent auditor’s report is Lars
Christian Jordy Nielsen.
PricewaterhouseCoopers
Certified Public Accountants
Hong Kong
27 February 2018

159
SUPPLEMENTARY EMBEDDED VALUE INFORMATION
CAUTIONARY STATEMENTS CONCERNING SUPPLEMENTARY EMBEDDED VALUE INFORMATION
This report includes non-IFRS financial measures and should not be viewed as a substitute for IFRS financial measures.
The results shown in this report are not intended to represent an opinion of market value and should not be interpreted in
that manner. This report does not purport to encompass all of the many factors that may bear upon a market value.
The results shown in this report are based on a series of assumptions as to the future. It should be recognised that actual
future results may differ from those shown, on account of changes in the operating and economic environments and
natural variations in experience. The results shown are presented at the valuation dates stated in this report and no
warranty is given by the Group that future experience after these valuation dates will be in line with the assumptions made.

160
1. HIGHLIGHTS
The embedded value (EV) is a measure of the value of shareholders’ interests in the earnings distributable from assets
allocated to the in-force business after allowance for the aggregate risks in that business. The Group uses a traditional
deterministic discounted cash flow methodology for determining its EV and value of new business (VONB). This
methodology makes an implicit overall level of allowance for risk including the cost of investment return guarantees and
policyholder options, asset-liability mismatch risk, credit risk, the risk that actual experience in future years differs from
that assumed, and the economic cost of capital, through the use of a risk discount rate. The equity attributable to
shareholders of the Company on the embedded value basis (EV Equity) is the total of EV, goodwill and other intangible
assets attributable to shareholders of the Company. More details of the EV results, methodology and assumptions are
covered in later sections of this report.
Summary of key metrics(1) (US$ millions)
As at 30 November
2017
As at 30 November
2016Growth
CERGrowth
AER
Equity attributable to shareholders of the Company on
the embedded value basis (EV Equity)
51,775 43,650 15% 19%
Embedded value (EV) 50,131 42,114 16% 19%
Adjusted net worth (ANW) 20,496 16,544 24% 24%
Value of in-force business (VIF) 29,635 25,570 11% 16%
Year ended 30 November
2017
Year ended 30 November
2016YoY
CERYoY
AER
Value of new business (VONB) 3,512 2,750 28% 28%
Annualised new premiums (ANP) 6,092 5,123 19% 19%
VONB margin 56.8% 52.8% 4.1 pps 4.0 pps
EV operating profit 6,997 5,887 19% 19%
Operating return on EV (Operating ROEV) 16.6% 15.4% 1.1 pps 1.2 pps
Note:
(1) The results are after adjustment to reflect the consolidated reserving and capital requirements and the present value of future after-tax unallocated Group Office expenses.

161
2. EV RESULTS
2.1 Embedded Value by Business Unit
The EV as at 30 November 2017 is presented consistently with the segment information in the IFRS financial statements.
Summary of EV by Business Unit (US$ millions)
As at 30 November 2017
Business Unit ANW(1)VIF before
CoC CoCVIF after
CoC EV
AIA Hong Kong 6,509 11,033 897 10,136 16,645
AIA Thailand 4,356 4,700 787 3,913 8,269
AIA Singapore 2,446 3,632 706 2,926 5,372
AIA Malaysia 1,165 1,495 216 1,279 2,444
AIA China 2,098 4,689 – 4,689 6,787
Other Markets 4,805 3,204 983 2,221 7,026
Group Corporate Centre 8,312 (117) – (117) 8,195
Subtotal 29,691 28,636 3,589 25,047 54,738
Adjustment to reflect consolidated reserving and capital requirements(2) (9,195) 5,640 84 5,556 (3,639)
After-tax value of unallocated Group Office expenses – (968) – (968) (968)
Total 20,496 33,308 3,673 29,635 50,131
As at 30 November 2016
Business Unit ANW(1)VIF before
CoC CoCVIF after
CoC EV
AIA Hong Kong 4,685 9,731 622 9,109 13,794
AIA Thailand 3,880 3,488 656 2,832 6,712
AIA Singapore 2,084 3,286 424 2,862 4,946
AIA Malaysia 1,071 1,229 184 1,045 2,116
AIA China 2,732 2,753 – 2,753 5,485
Other Markets 4,252 2,827 1,020 1,807 6,059
Group Corporate Centre 7,273 (177) (1) (176) 7,097
Subtotal 25,977 23,137 2,905 20,232 46,209
Adjustment to reflect consolidated reserving and capital requirements(2) (9,433) 6,294 (8) 6,302 (3,131)
After-tax value of unallocated Group Office expenses – (964) – (964) (964)
Total 16,544 28,467 2,897 25,570 42,114
Notes:
(1) ANW by Business Unit is after net capital flows between Business Units and Group Corporate Centre as reported in the IFRS financial statements.
(2) Adjustment to reflect consolidated reserving and capital requirements as described in Section 4.4 of this report.

162
2. EV RESULTS (continued)
2.2 Reconciliation of ANW to IFRS Equity
Derivation of the consolidated ANW from IFRS equity (US$ millions)
As at 30 November
2017
As at 30 November
2016
IFRS equity attributable to shareholders of the Company 41,994 34,984
Elimination of IFRS deferred acquisition and origination costs assets (21,847) (18,898)
Difference between IFRS policy liabilities and local statutory policy liabilities 9,116 9,646
Difference between net IFRS policy liabilities and local statutory policy liabilities (12,731) (9,252)
Mark-to-market adjustment for property and mortgage loan investments, net of amounts attributable to participating funds 348 336
Elimination of intangible assets (1,864) (1,743)
Recognition of deferred tax impacts of the above adjustments 1,891 1,602
Recognition of non-controlling interests impacts of the above adjustments 53 50
ANW (Business Unit) 29,691 25,977
Adjustment to reflect consolidated reserving requirements, net of tax (9,195) (9,433)
ANW (Consolidated) 20,496 16,544
2.3 Breakdown of ANW
The breakdown of the ANW for the Group between the required capital, as defined in Section 4.6 of this report, and the free
surplus, which is the ANW in excess of the required capital, is set out below:
Free surplus and required capital for the Group (US$ millions)
As at 30 November 2017 As at 30 November 2016
Business Unit Consolidated Business Unit Consolidated
Free surplus 21,311 12,303 19,089 9,782
Required capital 8,380 8,193 6,888 6,762
ANW 29,691 20,496 25,977 16,544
The Company’s subsidiaries, AIA Company Limited (AIA Co.) and AIA International Limited (AIA International), are both
subject to the Hong Kong reserving and capital requirements. In addition, AIA International, which is incorporated in
Bermuda, is subject to the Bermuda Monetary Authority (BMA) reserving and capital requirements with effect from 1
December 2016. These regulatory and other consolidated reserving and capital requirements apply in addition to the
relevant local requirements applicable to our Business Units.
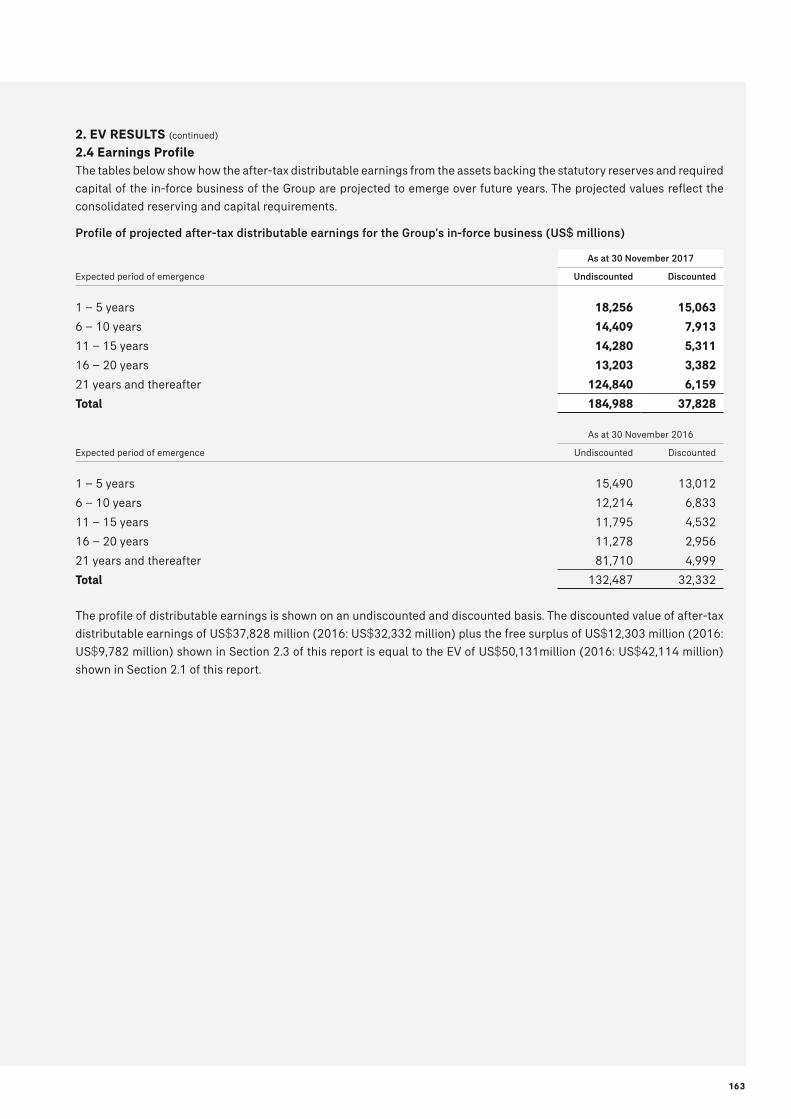
163
2. EV RESULTS (continued)
2.4 Earnings Profile
The tables below show how the after-tax distributable earnings from the assets backing the statutory reserves and required
capital of the in-force business of the Group are projected to emerge over future years. The projected values reflect the
consolidated reserving and capital requirements.
Profile of projected after-tax distributable earnings for the Group’s in-force business (US$ millions)
As at 30 November 2017
Expected period of emergence Undiscounted Discounted
1 – 5 years 18,256 15,063
6 – 10 years 14,409 7,913
11 – 15 years 14,280 5,311
16 – 20 years 13,203 3,382
21 years and thereafter 124,840 6,159
Total 184,988 37,828
As at 30 November 2016
Expected period of emergence Undiscounted Discounted
1 – 5 years 15,490 13,012
6 – 10 years 12,214 6,833
11 – 15 years 11,795 4,532
16 – 20 years 11,278 2,956
21 years and thereafter 81,710 4,999
Total 132,487 32,332
The profile of distributable earnings is shown on an undiscounted and discounted basis. The discounted value of after-tax
distributable earnings of US$37,828 million (2016: US$32,332 million) plus the free surplus of US$12,303 million (2016:
US$9,782 million) shown in Section 2.3 of this report is equal to the EV of US$50,131million (2016: US$42,114 million)
shown in Section 2.1 of this report.

164
2. EV RESULTS (continued)
2.5 Value of New Business
The VONB for the Group for the year ended 30 November 2017 is summarised in the table below. The VONB is defined as
the present value, at the point of sale, of the projected after-tax statutory profits less the cost of required capital. Results
are presented consistently with the segment information in the IFRS financial statements. Section 4.1 of this report
contains a list of the entities included in this report and the mapping of these entities to Business Units for the purpose of
this report.
The Group VONB for the year ended 30 November 2017 was US$3,512 million, an increase of US$762 million, or 28 per
cent on actual exchange rates, from US$2,750 million for the year ended 30 November 2016.
Summary of VONB by Business Unit (US$ millions)
Year ended 30 November 2017
Year ended 30 November 2016
Business UnitVONB
before CoC CoCVONB after
CoC(1)VONB
before CoC CoCVONB after
CoC(1)
AIA Hong Kong 1,708 149 1,559 1,464 303 1,161
AIA Thailand 434 53 381 427 43 384
AIA Singapore 358 47 311 355 39 316
AIA Malaysia 239 19 220 217 19 198
AIA China 899 71 828 592 56 536
Other Markets 480 72 408 385 64 321
Total before unallocated Group Office
expenses (Business Unit)
4,118 411 3,707 3,440 524 2,916
Adjustment to reflect consolidated reserving and capital requirements
(87) (22) (65) (60) (23) (37)
Total before unallocated Group Office
expenses (Consolidated)
4,031 389 3,642 3,380 501 2,879
After-tax value of unallocated Group Office expenses
(130) – (130) (129) – (129)
Total 3,901 389 3,512 3,251 501 2,750
Note:
(1) VONB for the Group is calculated before deducting the amount attributable to non-controlling interests. The amounts of VONB attributable to non-controlling interests for the year ended 30 November 2017 and 30 November 2016 were US$22 million and US$19 million respectively.
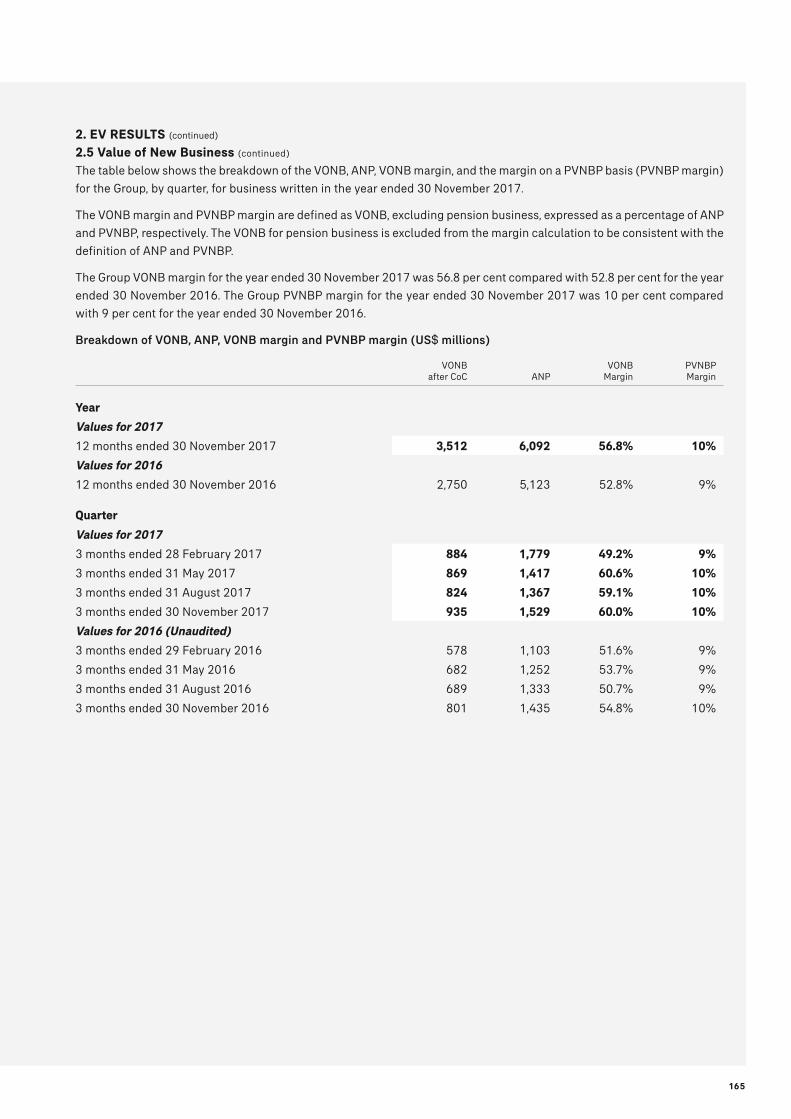
165
2. EV RESULTS (continued)
2.5 Value of New Business (continued)
The table below shows the breakdown of the VONB, ANP, VONB margin, and the margin on a PVNBP basis (PVNBP margin)
for the Group, by quarter, for business written in the year ended 30 November 2017.
The VONB margin and PVNBP margin are defined as VONB, excluding pension business, expressed as a percentage of ANP
and PVNBP, respectively. The VONB for pension business is excluded from the margin calculation to be consistent with the
definition of ANP and PVNBP.
The Group VONB margin for the year ended 30 November 2017 was 56.8 per cent compared with 52.8 per cent for the year
ended 30 November 2016. The Group PVNBP margin for the year ended 30 November 2017 was 10 per cent compared
with 9 per cent for the year ended 30 November 2016.
Breakdown of VONB, ANP, VONB margin and PVNBP margin (US$ millions)
VONB after CoC ANP
VONB Margin
PVNBP Margin
Year
Values for 2017
12 months ended 30 November 2017 3,512 6,092 56.8% 10%
Values for 2016
12 months ended 30 November 2016 2,750 5,123 52.8% 9%
Quarter
Values for 2017
3 months ended 28 February 2017 884 1,779 49.2% 9%
3 months ended 31 May 2017 869 1,417 60.6% 10%
3 months ended 31 August 2017 824 1,367 59.1% 10%
3 months ended 30 November 2017 935 1,529 60.0% 10%
Values for 2016 (Unaudited)
3 months ended 29 February 2016 578 1,103 51.6% 9%
3 months ended 31 May 2016 682 1,252 53.7% 9%
3 months ended 31 August 2016 689 1,333 50.7% 9%
3 months ended 30 November 2016 801 1,435 54.8% 10%

166
2. EV RESULTS (continued)
2.5 Value of New Business (continued)
The table below shows the VONB (excluding pension business), ANP, and VONB margin by Business Unit.
Summary of VONB excluding pension, ANP and VONB margin by Business Unit (US$ millions)
Year ended 30 November 2017
Year ended 30 November 2016
Business Unit
VONB Excluding
Pension ANPVONB
Margin
VONB Excluding
Pension ANPVONB
Margin
AIA Hong Kong 1,515 2,849 53.2% 1,120 2,294 48.8%
AIA Thailand 381 518 73.6% 384 471 81.5%
AIA Singapore 311 433 71.8% 316 427 74.1%
AIA Malaysia 218 348 62.5% 195 341 57.1%
AIA China 828 968 85.5% 536 621 86.4%
Other Markets 401 976 41.2% 319 969 32.9%
Total before unallocated Group Office
expenses (Business Unit) 3,654 6,092 60.0% 2,870 5,123 56.0%
Adjustment to reflect consolidated reserving and capital requirements (65) – (37) –
Total before unallocated Group Office
expenses (Consolidated) 3,589 6,092 58.9% 2,833 5,123 55.3%
After-tax value of unallocated Group Office expenses (130) – (129) –
Total 3,459 6,092 56.8% 2,704 5,123 52.8%
2.6 Analysis of EV Movement
Analysis of movement in EV (US$ millions)
Year ended 30 November 2017
Year ended 30 November 2016
YoYAER
ANW VIF EV ANW VIF EV EV
Opening EV 16,544 25,570 42,114 15,189 23,009 38,198 10%
Value of new business (546) 4,058 3,512 (695) 3,445 2,750 28%
Expected return on EV 4,023 (706) 3,317 3,440 (586) 2,854 16%
Operating experience variances 313 72 385 303 62 365 5%
Operating assumption changes (229) 148 (81) 26 3 29 n/m
Finance costs (136) – (136) (111) – (111) 23%
EV operating profit 3,425 3,572 6,997 2,963 2,924 5,887 19%
Investment return variances 1,242 275 1,517 (67) 30 (37) n/m
Effect of changes in economic assumptions (7) (183) (190) 6 (242) (236) (19)%
Other non-operating variances 420 (750) (330) (142) 120 (22) n/m
Total EV profit 5,080 2,914 7,994 2,760 2,832 5,592 43%
Dividends (1,376) – (1,376) (1,124) – (1,124) 22%
Other capital movements 134 – 134 (5) – (5) n/m
Effect of changes in exchange rates 114 1,151 1,265 (276) (271) (547) n/m
Closing EV 20,496 29,635 50,131 16,544 25,570 42,114 19%

167
2. EV RESULTS (continued)
2.6 Analysis of EV Movement (continued)
EV operating profit grew by 19 per cent on actual exchange rates to US$6,997 million (2016: US$5,887 million) compared
with 2016. The growth reflected a combination of a higher VONB of US$3,512 million (2016: US$2,750 million) and a
higher expected return on EV of US$3,317 million (2016: US$2,854 million). Overall operating experience variances and
operating assumption changes were again positive at US$304 million (2016: US$394 million). Finance costs were US$136
million (2016: US$111 million).
The VONB is calculated at the point of sale for business written during the year before deducting the amount attributable
to non-controlling interests. The expected return on EV is the expected change in the EV over the year plus the expected
return on the VONB from the point of sale to 30 November 2017 less the VONB attributable to non-controlling interests.
Operating experience variances reflect the impact on the ANW and VIF from differences between the actual experience
over the year and that expected based on the operating assumptions.
The main operating experience variances, net of tax, were US$385 million (2016: US$365 million), reflecting:
• Expense variances of US$54 million (2016: US$12 million);
• Mortality and morbidity claims variances of US$197 million (2016: US$200 million); and
• Persistency and other variances of US$134 million (2016: US$153 million).
The effect of changes in operating assumptions during the year was US$(81) million (2016: US$29 million).
The EV profit of US$7,994 million (2016: US$5,592 million) is the total of EV operating profit, investment return variances,
the effect of changes in economic assumptions and other non-operating variances.
The investment return variances arise from the impact of differences between the actual investment returns in the year
and the expected investment returns. This amounted to US$1,517 million (2016: US$(37) million) from the net effect of
short-term capital market movements on the Group’s investment portfolio and statutory reserves compared with the
expected returns.
The effect of changes in economic assumptions amounted to US$(190) million (2016: US$(236) million).
Other non-operating variances amounted to US$(330) million (2016: US$(22) million) which comprised a decrease in EV
of US$183 million due to changes in regulatory requirements, including the strengthening of risk-based capital
requirements in Singapore and the newly published mortality tables in Thailand, and others including modelling-related
enhancements.
The Group paid total shareholder dividends of US$1,376 million (2016: US$1,124 million). Other capital movements
increased EV by US$134 million (2016: reduced EV by US$5 million).
Foreign exchange movements were US$1,265 million (2016: US$(547) million).
Operating ROEV (US$ millions)
Operating return on EV (Operating ROEV) is calculated as EV operating profit expressed as a percentage of the opening EV
and was 16.6% (2016: 15.4%) for the year ended 30 November 2017.
Year ended 30 November
2017
Year ended 30 November
2016 YoY CER YoY AER
EV operating profit 6,997 5,887 19% 19%
Opening EV 42,114 38,198 12% 10%
Operating ROEV 16.6% 15.4% 1.1 pps 1.2 pps
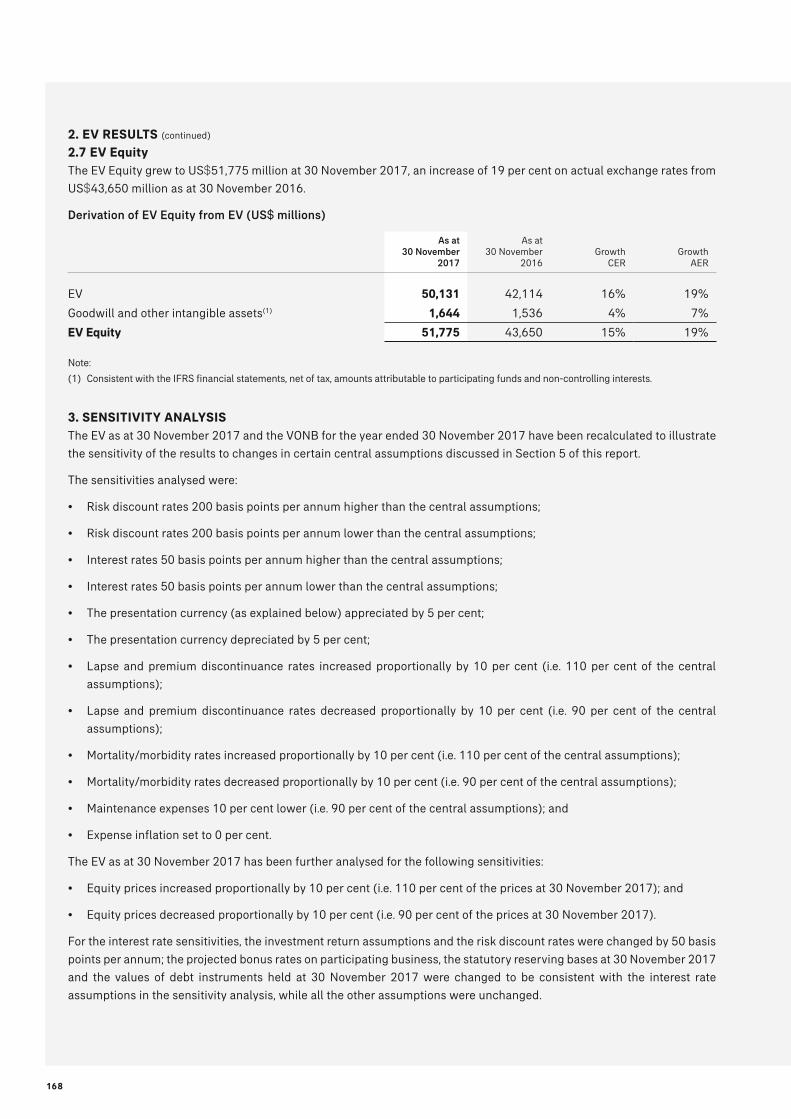
168
2. EV RESULTS (continued)
2.7 EV Equity
The EV Equity grew to US$51,775 million at 30 November 2017, an increase of 19 per cent on actual exchange rates from
US$43,650 million as at 30 November 2016.
Derivation of EV Equity from EV (US$ millions)
As at 30 November
2017
As at 30 November
2016Growth
CERGrowth
AER
EV 50,131 42,114 16% 19%
Goodwill and other intangible assets(1) 1,644 1,536 4% 7%
EV Equity 51,775 43,650 15% 19%
Note:
(1) Consistent with the IFRS financial statements, net of tax, amounts attributable to participating funds and non-controlling interests.
3. SENSITIVITY ANALYSIS
The EV as at 30 November 2017 and the VONB for the year ended 30 November 2017 have been recalculated to illustrate
the sensitivity of the results to changes in certain central assumptions discussed in Section 5 of this report.
The sensitivities analysed were:
• Risk discount rates 200 basis points per annum higher than the central assumptions;
• Risk discount rates 200 basis points per annum lower than the central assumptions;
• Interest rates 50 basis points per annum higher than the central assumptions;
• Interest rates 50 basis points per annum lower than the central assumptions;
• The presentation currency (as explained below) appreciated by 5 per cent;
• The presentation currency depreciated by 5 per cent;
• Lapse and premium discontinuance rates increased proportionally by 10 per cent (i.e. 110 per cent of the central
assumptions);
• Lapse and premium discontinuance rates decreased proportionally by 10 per cent (i.e. 90 per cent of the central
assumptions);
• Mortality/morbidity rates increased proportionally by 10 per cent (i.e. 110 per cent of the central assumptions);
• Mortality/morbidity rates decreased proportionally by 10 per cent (i.e. 90 per cent of the central assumptions);
• Maintenance expenses 10 per cent lower (i.e. 90 per cent of the central assumptions); and
• Expense inflation set to 0 per cent.
The EV as at 30 November 2017 has been further analysed for the following sensitivities:
• Equity prices increased proportionally by 10 per cent (i.e. 110 per cent of the prices at 30 November 2017); and
• Equity prices decreased proportionally by 10 per cent (i.e. 90 per cent of the prices at 30 November 2017).
For the interest rate sensitivities, the investment return assumptions and the risk discount rates were changed by 50 basis
points per annum; the projected bonus rates on participating business, the statutory reserving bases at 30 November 2017
and the values of debt instruments held at 30 November 2017 were changed to be consistent with the interest rate
assumptions in the sensitivity analysis, while all the other assumptions were unchanged.

169
3. SENSITIVITY ANALYSIS (continued)
As the Group operates in multiple geographical markets in the Asia-Pacific region, the EV results for the Group are
translated from multiple currencies to US dollar which is the Group’s presentation currency. In order to provide sensitivity
results for EV and VONB of the impact of foreign currency movements, a change of 5 per cent to the US dollar is included.
For the equity price sensitivities, the projected bonus rates on participating business and the values of equity securities
and equity funds held at 30 November 2017 were changed to be consistent with the equity price assumptions in the
sensitivity analysis, while all the other assumptions were unchanged.
For each of the remaining sensitivity analyses, the statutory reserving bases as at 30 November 2017 and the projected
bonus rates on participating business were changed to be consistent with the sensitivity analysis assumptions, while all
the other assumptions remain unchanged.
The sensitivities chosen do not represent the boundaries of possible outcomes, but instead illustrate how certain alternative
assumptions would affect the results.
Sensitivity of EV (US$ millions)
As at 30 November 2017 As at 30 November 2016
Scenario EV Ratio EV Ratio
Central value 50,131 42,114
Impact of:
200 bps increase in risk discount rates (6,146) (12.3)% (5,193) (12.3)%
200 bps decrease in risk discount rates 9,884 19.7% 8,089 19.2%
10% increase in equity prices 719 1.4% 725 1.7%
10% decrease in equity prices (725) (1.4)% (734) (1.7)%
50 bps increase in interest rates 29 0.1% 148 0.4%
50 bps decrease in interest rates (442) (0.9)% (378) (0.9)%
5% appreciation in the presentation currency (1,558) (3.1)% (1,081) (2.6)%
5% depreciation in the presentation currency 1,558 3.1% 1,081 2.6%
10% increase in lapse/discontinuance rates (779) (1.6)% (678) (1.6)%
10% decrease in lapse/discontinuance rates 889 1.8% 792 1.9%
10% increase in mortality/morbidity rates (3,678) (7.3)% (3,445) (8.2)%
10% decrease in mortality/morbidity rates 3,607 7.2% 3,462 8.2%
10% decrease in maintenance expenses 555 1.1% 523 1.2%
Expense inflation set to 0% 581 1.2% 550 1.3%

170
3. SENSITIVITY ANALYSIS (continued)
Sensitivity of VONB (US$ millions)
Year ended 30 November 2017 Year ended 30 November 2016
Scenario VONB Ratio VONB Ratio
Central value 3,512 2,750
Impact of:
200 bps increase in risk discount rates (988) (28.1)% (796) (28.9)%
200 bps decrease in risk discount rates 1,871 53.3% 1,424 51.8%
50 bps increase in interest rates 181 5.2% 177 6.4%
50 bps decrease in interest rates (250) (7.1)% (226) (8.2)%
5% appreciation in the presentation currency (106) (3.0)% (82) (3.0)%
5% depreciation in the presentation currency 106 3.0% 82 3.0%
10% increase in lapse rates (186) (5.3)% (134) (4.9)%
10% decrease in lapse rates 195 5.6% 150 5.5%
10% increase in mortality/morbidity rates (343) (9.8)% (336) (12.2)%
10% decrease in mortality/morbidity rates 330 9.4% 328 11.9%
10% decrease in maintenance expenses 82 2.3% 84 3.1%
Expense inflation set to 0% 56 1.6% 56 2.0%
4. METHODOLOGY
4.1 Entities Included in This Report
The Group operates through a number of subsidiaries and branches. Its two main operating subsidiaries are AIA Co., a
company incorporated in Hong Kong and a subsidiary of the Company, and AIA International, a company incorporated in
Bermuda and an indirect subsidiary of the Company. Furthermore, AIA Co. has branches located in Brunei, China and
Thailand and AIA International has branches located in Hong Kong, Korea, Macau, New Zealand and Taiwan.
The following is a list of the entities and their mapping to Business Units included in this report.
• AIA Australia refers to AIA Australia Limited, a subsidiary of AIA Co., and the New Zealand branch of AIA International;
• AIA Cambodia refers to AIA (Cambodia) Life Insurance Plc., a subsidiary of AIA International;
• AIA China refers to the China branches of AIA Co.;
• AIA Hong Kong refers to the total of the following three entities:
– the Hong Kong and Macau branches of AIA International;
– the Hong Kong and Macau business written by AIA Co.; and
– AIA Pension and Trustee Co. Ltd., a subsidiary of AIA Co.
• AIA Indonesia refers to PT. AIA Financial, a subsidiary of AIA International;
• AIA Korea refers to the Korea branch of AIA International;
• AIA Malaysia refers to AIA Bhd., a subsidiary of AIA Co. and AIA PUBLIC Takaful Bhd., a 70 per cent owned subsidiary
of AIA Co.;

171
4. METHODOLOGY (continued)
4.1 Entities Included in This Report (continued)
• AIA Philippines refers to The Philippine American Life and General Insurance (PHILAM LIFE) Company, a subsidiary of
AIA Co. and its 51 per cent owned subsidiary BPI-Philam Life Assurance Corporation;
• AIA Singapore refers to AIA Singapore Private Limited, a subsidiary of AIA Co., and the Brunei branch of AIA Co.;
• AIA Sri Lanka refers to AIA Insurance Lanka PLC, a 97.16 per cent owned subsidiary of AIA Co.;
• AIA Taiwan refers to the Taiwan branch of AIA International;
• AIA Thailand refers to the Thailand branches of AIA Co.; and
• AIA Vietnam refers to AIA (Vietnam) Life Insurance Company Limited, a subsidiary of AIA International.
In addition, the financial results from the entity Tata AIA Life Insurance Company Limited (Tata AIA), which is 49 per cent
owned by AIA International, are accounted for using the equity method and have been included in the Group ANW presented
in this report. For clarity, the Group’s ANP and VONB exclude any contribution from Tata AIA.
Results are presented consistently with the segment information in the IFRS financial statements. The summary of the EV
of the Group by Business Unit in this report also includes a segment for “Group Corporate Centre” results. The results
shown for this segment consist of the ANW for the Group’s corporate functions and the present value of remittance taxes
payable on distributable profits to Hong Kong. The ANW has been derived as the IFRS equity for this segment plus mark-
to-market adjustments less the value of excluded intangible assets. For the VONB, “Other Markets” includes the present
value of allowance for remittance taxes payable on distributable profits to Hong Kong.
4.2 Embedded Value and Value of New Business
The Group uses a traditional deterministic discounted cash flow methodology for determining its EV and VONB. This
methodology makes an implicit overall level of allowance for risk including the cost of investment return guarantees and
policyholder options, asset-liability mismatch risk, credit risk, the risk that actual experience in future years differs from
that assumed, and the economic cost of capital, through the use of a risk discount rate. Typically, the higher the risk
discount rate, the greater the allowance for these factors. This is a common methodology used by life insurance companies
in Asia currently. Alternative valuation methodologies and approaches continue to emerge and may be considered by AIA.
The business included in the VIF and VONB calculations includes all life business written by the Business Units of the
Group, plus other lines of business which may not be classified as life business but have similar characteristics. These
include accident and health, group and pension businesses. The projected in-force business included in the VIF also
incorporates expected renewals on short-term business with a term of one year or less.
The EV is the sum of the ANW and VIF. The ANW is the market value of assets in excess of the assets backing the policy
reserves and other liabilities of the life (and similar) business of the Group, plus the IFRS equity value of other activities,
such as general insurance business, less the value of intangible assets. It excludes any amounts not attributable to
shareholders of the Company. The market value of investment property and property held for own use that is used to
determine the ANW is based on the fair value disclosed in the Group’s IFRS financial statements as at the valuation date.
It is the Group’s policy to obtain external property valuations annually except in the case of a discrete event occurring in
the interim that has a significant impact on the fair value of the properties.

172
4. METHODOLOGY (continued)
4.2 Embedded Value and Value of New Business (continued)
The VIF is the present value of projected after-tax statutory profits emerging in the future from the current in-force business
less the cost arising from holding the required capital (CoC) to support the in-force business. CoC is calculated as the face
value of the required capital as at the valuation date less the present value of the net-of-tax investment return on the
shareholder assets backing required capital and the present value of projected releases from the assets backing the
required capital. Where the required capital may be covered by policyholder assets such as surplus assets in a participating
fund, there is no associated cost of capital included in the VIF or VONB.
EV Equity is the total of EV, goodwill and other intangible assets attributable to shareholders of the Company.
The VONB is the present value, measured at the point of sale, of projected after-tax statutory profits emerging in the future
from new business sold in the period less the cost of holding required capital in excess of regulatory reserves to support
this business. The VONB for the Group is calculated based on assumptions applicable at the point of measurement and
before deducting the amount attributable to non-controlling interests. The VONB attributable to non-controlling interests
was US$22 million for the year ended 30 November 2017 (2016: US$19 million).
A deduction has been made from the EV and VONB for the present value of future after-tax unallocated Group Office expenses, representing the expenses incurred by the Group Office which are not allocated to the Business Units. These unallocated Group Office expenses have been allocated to acquisition and maintenance activities, and a deduction made from the VONB and VIF respectively.
4.3 Definition of New Business
New business includes the sale of new contracts during the period, additional single premium payments on recurrent single premium contracts and increments to existing contracts where these are not variations allowed for in the calculation of the VIF. The VONB also includes the present value of cash flows associated with new policies written during the reporting period but subsequently terminated before the valuation date.
For group renewable business including group yearly renewable term business, new business is composed of new schemes set up during the period plus any premium payable on existing schemes that exceeds the prior year’s premiums. For individually significant group cases, the VONB is calculated over each premium rate guarantee period entered upon contract inception or renewal.
For short-term accident and health business with a term of one year or less, renewals of existing contracts are not considered new business, and the value of expected renewals on this business is included in the VIF.
For pension business, sales of new contracts during the period and any new contributions, including assets transferred in, are considered as new business for the calculation of the VONB.
New business volumes shown in this report are measured using annualised new premiums (ANP), which is an internal measure of new business sales.
4.4 Consolidation of Branches and Subsidiaries of AIA Co. and AIA International
The Group’s subsidiaries, AIA Co. and AIA International, are both Hong Kong-regulated entities. AIA operates in a number of territories as branches and subsidiaries of these entities. In addition, AIA International, which is incorporated in Bermuda, is subject to the BMA reserving and capital requirements with effect from 1 December 2016. These regulatory and other consolidated reserving and capital requirements apply in addition to the relevant local requirements applicable to our Business Units.
The EV and VONB results for the Group shown in Section 2 of this report have been adjusted to reflect the consolidated reserving and capital requirements. This approach was taken so as to reflect the distribution of profits from AIA Co. and AIA International after allowing for the Hong Kong, BMA, local regulatory and other reserving and capital requirements as applied by the Group. The EV and VONB for each Business Unit reflect the local reserving and capital requirements, as discussed in Section 4.6 of this report, before a Group-level adjustment to reflect the consolidated reserving and capital requirements.
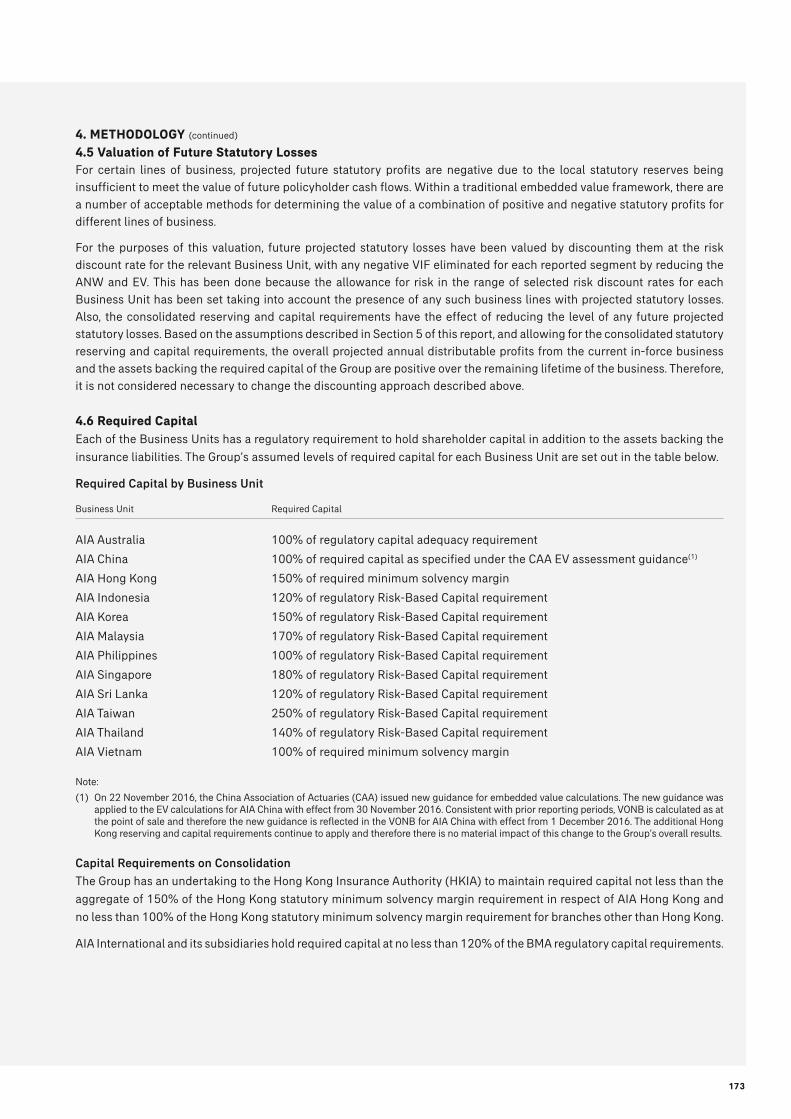
173
4. METHODOLOGY (continued)
4.5 Valuation of Future Statutory Losses
For certain lines of business, projected future statutory profits are negative due to the local statutory reserves being insufficient to meet the value of future policyholder cash flows. Within a traditional embedded value framework, there are a number of acceptable methods for determining the value of a combination of positive and negative statutory profits for different lines of business.
For the purposes of this valuation, future projected statutory losses have been valued by discounting them at the risk discount rate for the relevant Business Unit, with any negative VIF eliminated for each reported segment by reducing the ANW and EV. This has been done because the allowance for risk in the range of selected risk discount rates for each Business Unit has been set taking into account the presence of any such business lines with projected statutory losses. Also, the consolidated reserving and capital requirements have the effect of reducing the level of any future projected statutory losses. Based on the assumptions described in Section 5 of this report, and allowing for the consolidated statutory reserving and capital requirements, the overall projected annual distributable profits from the current in-force business and the assets backing the required capital of the Group are positive over the remaining lifetime of the business. Therefore, it is not considered necessary to change the discounting approach described above.
4.6 Required Capital
Each of the Business Units has a regulatory requirement to hold shareholder capital in addition to the assets backing the
insurance liabilities. The Group’s assumed levels of required capital for each Business Unit are set out in the table below.
Required Capital by Business Unit
Business Unit Required Capital
AIA Australia 100% of regulatory capital adequacy requirement
AIA China 100% of required capital as specified under the CAA EV assessment guidance(1)
AIA Hong Kong 150% of required minimum solvency margin
AIA Indonesia 120% of regulatory Risk-Based Capital requirement
AIA Korea 150% of regulatory Risk-Based Capital requirement
AIA Malaysia 170% of regulatory Risk-Based Capital requirement
AIA Philippines 100% of regulatory Risk-Based Capital requirement
AIA Singapore 180% of regulatory Risk-Based Capital requirement
AIA Sri Lanka 120% of regulatory Risk-Based Capital requirement
AIA Taiwan 250% of regulatory Risk-Based Capital requirement
AIA Thailand 140% of regulatory Risk-Based Capital requirement
AIA Vietnam 100% of required minimum solvency margin
Note:
(1) On 22 November 2016, the China Association of Actuaries (CAA) issued new guidance for embedded value calculations. The new guidance was applied to the EV calculations for AIA China with effect from 30 November 2016. Consistent with prior reporting periods, VONB is calculated as at the point of sale and therefore the new guidance is reflected in the VONB for AIA China with effect from 1 December 2016. The additional Hong Kong reserving and capital requirements continue to apply and therefore there is no material impact of this change to the Group’s overall results.
Capital Requirements on Consolidation
The Group has an undertaking to the Hong Kong Insurance Authority (HKIA) to maintain required capital not less than the
aggregate of 150% of the Hong Kong statutory minimum solvency margin requirement in respect of AIA Hong Kong and
no less than 100% of the Hong Kong statutory minimum solvency margin requirement for branches other than Hong Kong.
AIA International and its subsidiaries hold required capital at no less than 120% of the BMA regulatory capital requirements.

174
5. ASSUMPTIONS
5.1 Introduction
This section summarises the assumptions used by the Group to determine the EV as at 30 November 2017 and the VONB for the year ended 30 November 2017 and highlights certain differences in assumptions between the EV as at 30 November 2016 and the EV as at 30 November 2017.
5.2 Economic Assumptions
Investment returns
The Group has set the assumed long-term future returns for fixed income assets to reflect its view of expected returns having regard to estimates of long-term forward rates from yields available on government bonds and current bond yields. In determining returns on fixed income assets the Group allows for the risk of default, and this allowance varies by the credit rating of the underlying asset.
Where long-term views of investment return assumptions differ from current market yields on existing fixed income assets such that there would be a significant impact on value, an adjustment was made to make allowance for the current market yields. In these cases, in calculating the VIF, adjustments have been made to the investment return assumptions such that the investment returns on existing fixed income assets were set consistently with the current market yield on these assets for their full remaining term, to be consistent with the valuation of the assets backing the policy liabilities.
The Group has set the equity return and property return assumptions by reference to the return on 10-year government bonds, allowing for an internal assessment of risk premia that vary by asset class and by territory.
For each Business Unit, the non-linked portfolio is divided into a number of distinct product groups, and the returns for each of these product groups have been derived by considering current and future targeted asset allocations and associated investment returns for major asset classes.
For unit-linked business, fund growth assumptions have been determined based on actual asset mix within the funds at the valuation date and expected long-term returns for major asset classes.
Risk discount rates
The risk discount rates can be considered as the sum of the appropriate risk-free interest rate, to reflect the time value of money, and a risk margin to make an implicit overall level of allowance for risk.
The table below summarises the current market 10-year government bond yields referenced in EV calculations.
Current market 10-year government bond yields referenced in EV
calculations (%)
Business UnitAs at
30 Nov 2017As at
30 Nov 2016
AIA Australia 2.50 2.72
AIA China 3.90 2.95
AIA Hong Kong(1) 2.44 2.38
AIA Indonesia 6.52 8.14
AIA Korea 2.48 2.15
AIA Malaysia 3.91 4.41
AIA Philippines 5.56 4.52
AIA Singapore 2.13 2.30
AIA Sri Lanka 10.31 14.11
AIA Taiwan 1.00 1.12
AIA Thailand 2.55 2.69
AIA Vietnam 5.45 6.30
Note:(1) The majority of AIA Hong Kong’s assets and liabilities are denominated in US dollars. The 10-year government bond yields shown above are those
of US dollar-denominated bonds.

175
5. ASSUMPTIONS (continued)
5.2 Economic Assumptions (continued)
Risk discount rates (continued)
The table below summarises the risk discount rates and long-term investment returns assumed in EV calculations. The
same risk discount rates were used for all the EV results shown in Section 1 and Section 2 of this report. The present value
of unallocated Group Office expenses was calculated using the AIA Hong Kong risk discount rate. The investment returns
on existing fixed income assets were set consistently with the market yields on these assets. Note that VONB results were
calculated based on start-of-quarter economic assumptions consistent with the measurement at the point of sale. The
investment returns shown are gross of tax and investment expenses.
Risk discount rates assumed in EV
calculations (%)
Long-term investment returns assumed in EV calculations (%)
10-year government bonds Local equities
Business Unit
As at 30 Nov
2017
As at 30 Nov
2016
As at 30 Nov
2017
As at 30 Nov
2016
As at 30 Nov
2017
As at 30 Nov
2016
AIA Australia 7.35 7.35 3.00 3.00 7.50 7.50
AIA China 9.75 9.55 3.70 3.50 9.30 9.30
AIA Hong Kong(1) 7.30 7.00 2.80 2.50 7.60 7.60
AIA Indonesia 13.00 13.50 7.50 8.00 12.00 12.50
AIA Korea 8.60 8.60 2.70 2.70 7.20 7.20
AIA Malaysia 8.75 8.75 4.20 4.20 8.80 8.80
AIA Philippines 11.30 11.00 4.80 4.50 10.00 9.70
AIA Singapore 6.90 6.90 2.50 2.50 7.00 7.00
AIA Sri Lanka 15.70 15.70 10.00 10.00 12.00 12.00
AIA Taiwan 7.85 7.85 1.60 1.60 6.60 6.60
AIA Thailand 8.60 8.60 3.20 3.20 9.00 9.00
AIA Vietnam 12.30 12.80 6.50 7.00 11.80 12.30
Note:
(1) The majority of AIA Hong Kong’s assets and liabilities are denominated in US dollars. The 10-year government bond assumptions shown above are those of US dollar-denominated bonds.
5.3 Persistency
Persistency covers the assumptions required, where relevant, for policy lapse (including surrender), premium persistency,
premium holidays, partial withdrawals and retirement rates for pension products.
Assumptions have been developed by each of the Business Units based on their recent historical experience, and their best
estimate expectations of current and expected future experience. Persistency assumptions vary by policy year and product
type with different rates for regular and single premium products.
Where experience for a particular product was not credible enough to allow any meaningful analysis to be performed,
experience for similar products was used as a basis for future persistency experience assumptions.
In the case of surrenders, the valuation assumes that current surrender value bases will continue to apply in the future.

176
5. ASSUMPTIONS (continued)
5.4 Expenses
The expense assumptions have been set based on the most recent expense analysis. The purpose of the expense analysis
is to allocate total expenses between acquisition and maintenance activities, and then to allocate these acquisition and
maintenance expenses to various product categories to derive unit cost assumptions.
Where the expenses associated with certain activities have been identified as being one-off, these expenses have been
excluded from the expense analysis.
Expense assumptions have been determined for acquisition and maintenance activities, split by product type, and unit
costs expressed as a percentage of premiums, sum assured and an amount per policy. Where relevant, expense assumptions
have been calculated per distribution channel.
Expense assumptions do not make allowance for any anticipated future expense savings as a result of any strategic
initiatives aimed at improving policy administration and claims handling efficiency.
Assumptions for commission rates and other sales-related payments have been set in line with actual experience.
Group Office expenses
Group Office expense assumptions have been set, after excluding non-operating expenses, based on actual acquisition
and maintenance expenses in the year ended 30 November 2017. The Group Office acquisition expenses have been
deducted from the VONB. The present value of the projected future Group Office maintenance expenses has been deducted
from the Group EV. The maintenance expense assumptions in the VONB also allow for the allocation of Group Office
expenses.
5.5 Expense Inflation
The assumed expense inflation rates are based on expectations of long-term consumer price and salary inflation.
Expense inflation assumptions by Business Unit (%)
Business Unit
As at 30 November
2017
As at 30 November
2016
AIA Australia 3.0 3.0
AIA China 2.0 2.0
AIA Hong Kong 2.0 2.0
AIA Indonesia 6.0 6.0
AIA Korea 3.5 3.5
AIA Malaysia 3.0 3.0
AIA Philippines 3.5 3.5
AIA Singapore 2.0 2.0
AIA Sri Lanka 6.5 6.5
AIA Taiwan 1.2 1.2
AIA Thailand 2.0 2.0
AIA Vietnam 5.0 5.0
Unallocated Group Office expenses are assumed to inflate by the weighted average of the Business Unit expense inflation
rates.

177
5. ASSUMPTIONS (continued)
5.6 Mortality
Assumptions have been developed by each Business Unit based on their recent historical experience, and their expectations
of current and expected future experience. Where historical experience is not credible, reference has been made to pricing
assumptions supplemented by market data, where available.
Mortality assumptions have been expressed as a percentage of either standard industry experience tables or, where
experience is sufficiently credible, as a percentage of tables that have been developed internally by the Group.
For products that are exposed to longevity risk, an allowance has been made for expected improvements in mortality;
otherwise no allowance has been made for mortality improvements.
5.7 Morbidity
Assumptions have been developed by each Business Unit based on their recent historical experience, and their expectations
of current and expected future experience. Morbidity rate assumptions have been expressed as a percentage of standard
industry experience tables or as expected claims ratios.
5.8 Reinsurance
Reinsurance assumptions have been developed by each Business Unit based on the reinsurance arrangements in force as
at the valuation date and the recent historical and expected future experience.
5.9 Policyholder Dividends, Profit Sharing and Interest Crediting
The projected policyholder dividends, profit sharing and interest crediting assumptions set by each Business Unit that
have been used in calculating the EV results presented in this report, reflect contractual and regulatory requirements,
policyholders’ reasonable expectations (where clearly defined) and each Business Unit’s best estimate of future policies,
strategies and operations consistent with the investment return assumptions used in the EV results.
Participating fund surpluses have been assumed to be distributed between policyholders and shareholders via future final
bonuses or at the end of the projection period so that there are no residual assets at the end of the projection period.
5.10 Taxation
The projections of distributable earnings underlying the values presented in this report are net of corporate income tax,
based on current taxation legislation and corporate income tax rates. The projected amount of tax payable in any year
allows, where relevant, for the benefits arising from any tax loss carried forward.
The local corporate income tax rates used by each Business Unit are set out below:
Local corporate income tax rates by Business Unit (%)
Business Unit
As at 30 November
2017
As at 30 November
2016
AIA Australia 30.0 30.0
AIA China 25.0 25.0
AIA Hong Kong 16.5 16.5
AIA Indonesia 25.0 25.0
AIA Korea 24.2 24.2
AIA Malaysia 24.0 24.0
AIA Philippines 30.0 30.0
AIA Singapore 17.0 17.0
AIA Sri Lanka 28.0 28.0
AIA Taiwan 17.0 17.0
AIA Thailand 20.0 20.0
AIA Vietnam 20.0 20.0

178
5. ASSUMPTIONS (continued)
5.10 Taxation (continued)
The tax assumptions used in the valuation reflect the local corporate income tax rates set out above. Where applicable, tax
payable on investment income has been reflected in projected investment returns.
The EV of the Group as at 30 November 2017 is calculated after deducting any remittance taxes payable on the anticipated
distribution of both the ANW and VIF.
5.11 Statutory Valuation Bases
The projection of regulatory liabilities at future points in time assumes the continuation of the reserving methodologies
used to value policyholder liabilities as at the valuation date.
On 22 November 2016, the CAA issued new guidance for embedded value calculations. The new guidance has been
applied to the EV calculations for AIA China with effect from 30 November 2016. Consistent with prior reporting periods,
VONB is calculated as at the point of sale and the new guidance is reflected in the VONB for AIA China with effect from 1
December 2016.
5.12 Product Charges
Management fees and product charges reflected in the VIF and VONB have been assumed to follow existing scales.
5.13 Foreign Exchange
The EV as at 30 November 2017 and 30 November 2016 have been translated into US dollars using exchange rates as at
each valuation date. The VONB results shown in this report have been translated into US dollars using the corresponding
average exchange rates for each quarter. The other components of the EV profit shown in the analysis of movement in EV
have been translated using average exchange rates for the period.
6. EVENTS AFTER THE REPORTING PERIOD
On 1 January 2018, AIA International completed the transfer of its insurance business in Korea from a branch to a wholly-
owned subsidiary, AIA Life Insurance Co. Ltd.
In September 2017, the Group reached an agreement, subject to securing all necessary regulatory and governmental
approvals, to acquire Commonwealth Bank of Australia’s (CBA) life insurance business in Australia and life and health
insurance businesses in New Zealand. The transaction includes 20-year strategic bancassurance partnerships with CBA
in Australia and ASB Bank Limited in New Zealand. The transaction will expand the Group’s distribution capabilities and
customer reach in Australia and New Zealand markets. As announced on 21 September 2017, the gross consideration to
be paid with respect to the proposed transaction is expected to be approximately US$3.0 billion payable in cash on
completion of the proposed transaction and subject to certain adjustments at completion. After taking into account the
expected proceeds from reinsurance agreements and the expected free surplus of the acquired businesses, the final net
cash outlay by AIA is expected to be approximately US$1.5 billion.
In December 2017, the Group entered into a 15-year extension of the existing exclusive regional bancassurance agreement
with Public Bank Berhad, a leading Malaysian banking group, extending the partnership from 2023 to 2037.
The Board has resolved to change the Company’s financial year-end date from 30 November to 31 December. Accordingly,
the next financial year-end date of the Company will be 31 December 2018. The next audited Supplementary Embedded
Value Information will cover a 12-month period from 1 January 2018 to 31 December 2018.
On 27 February 2018, a Committee appointed by the Board of Directors proposed a final dividend of 74.38 Hong Kong
cents per share (2016: 63.75 Hong Kong cents per share).

179
SUPPLEMENTARY FINANCIAL INFORMATION ON CALENDAR YEAR BASIS
As set out in the section headed “Change of Financial Year-end Date” of this announcement, the Board has resolved to
change the Company’s financial year-end date from 30 November to 31 December, with the next financial year-end date
of the Company being 31 December 2018. In conjunction with this change, the following supplementary financial
information is voluntarily disclosed by the Company to provide a historical basis for comparison with our upcoming
financial results on calendar year basis.
The table below shows the breakdown of the VONB, ANP, VONB margin, and PVNBP margin for the Group, by quarter, for
business written in the nine months ended 30 September 2017. The supplementary financial information set out in the
table below has neither been audited nor reviewed by the Company’s external auditor, PricewaterhouseCoopers.
Breakdown of VONB, ANP, VONB margin and PVNBP margin (US$ millions)
VONB after CoC ANP
VONB Margin
PVNBP Margin
Quarter
Values for 2017
3 months ended 31 March 2017 811 1,630 49.2% 9%
3 months ended 30 June 2017 794 1,276 61.3% 10%
3 months ended 30 September 2017 846 1,422 58.4% 10%

180
INFORMATION FOR SHAREHOLDERS
REVIEW OF FINANCIAL STATEMENTS
The Audit Committee has reviewed the Group’s consolidated financial statements for the year ended 30 November 2017,
including the accounting principles and practices adopted by the Group.
COMPLIANCE WITH CORPORATE GOVERNANCE CODE
The Company complied with all applicable code provisions set out in the Corporate Governance Code throughout the year
ended 30 November 2017.
PURCHASE, SALE OR REDEMPTION OF THE COMPANY’S LISTED SECURITIES
Save for the purchase of 1,395,130 shares of the Company under the Restricted Share Unit Scheme and the Employee
Share Purchase Plan at a total consideration of approximately US$7 million, neither the Company nor any of its subsidiaries
purchased, sold or redeemed any of the Company’s listed securities during the year ended 30 November 2017. These
purchases were made by the relevant scheme trustees on the Hong Kong Stock Exchange. These shares are held on trust
for participants of the relevant schemes and therefore were not cancelled. Please refer to note 38 to the financial statements
for details.
EVENTS AFTER THE REPORTING PERIOD
Details of significant events after the year ended 30 November 2017 are set out in note 43 to the financial statements.
PUBLICATION OF CERTAIN FINANCIAL AND OTHER DATA PURSUANT TO LOCAL REGULATORY REQUIREMENTS
The Company and its subsidiaries or their respective branches are subject to local regulatory oversight in each of the
countries or jurisdictions in which they operate. In a number of these jurisdictions, local insurance and other regulations
require the publication of certain financial and other data primarily for policyholders’ information and prudential supervisory
purposes. Such local statutory data is often produced pursuant to regulations that are not designed with the protection or
requirements of public shareholders as a primary objective.
The Company uses HKFRS and IFRS to prepare its consolidated financial information. The local statutory data may be
prepared on bases different from HKFRS and IFRS and may be substantially different from the Company’s HKFRS and IFRS
financial information.
Accordingly, our shareholders and potential investors are advised that the local statutory data should not be relied on
for an assessment of the Company’s financial performance.
FINAL DIVIDEND
The Board has recommended a final dividend of 74.38 Hong Kong cents per share (2016: 63.75 Hong Kong cents per
share) for the year ended 30 November 2017. If approved, the proposed final dividend together with the interim dividend
will represent a total dividend of 100.00 Hong Kong cents per share (2016: 85.65 Hong Kong cents per share) for the year
ended 30 November 2017.
Subject to shareholders’ approval at the AGM, the final dividend will be payable on Friday, 8 June 2018 to shareholders
whose names appear on the register of members of the Company at the close of business on Thursday, 24 May 2018.
CLOSURE OF REGISTER OF MEMBERS AND RECORD DATE
The register of members of the Company will be closed from Tuesday, 15 May 2018 to Friday, 18 May 2018, both days
inclusive, during which period no transfer of shares will be registered. In order to be eligible to attend and vote at the AGM,
all properly completed transfer forms accompanied by the relevant share certificates must be lodged for registration with
the Company’s share registrar, Computershare Hong Kong Investor Services Limited at Shops 1712-1716, 17th Floor,
Hopewell Centre, 183 Queen’s Road East, Wanchai, Hong Kong, no later than 4:30 p.m. on Monday, 14 May 2018.
In order to qualify for the entitlement of the final dividend, all properly completed transfer forms accompanied by the
relevant share certificates must be lodged for registration with the Company’s share registrar, Computershare Hong Kong
Investor Services Limited at Shops 1712-1716, 17th Floor, Hopewell Centre, 183 Queen’s Road East, Wanchai, Hong Kong,
no later than 4:30 p.m. on Thursday, 24 May 2018.

181
ANNUAL GENERAL MEETING
The AGM will be held at 11:00 a.m. (Hong Kong time) on Friday, 18 May 2018 at the Grand Ballroom, 2/F, New World
Millennium Hong Kong Hotel, 72 Mody Road, Tsim Sha Tsui East, Kowloon, Hong Kong. Notice of the AGM will be published
on the websites of both the Hong Kong Stock Exchange and the Company.
Details of voting results at the AGM can be found on the websites of both the Hong Kong Stock Exchange at www.hkex.com.hk
and the Company at www.aia.com on Friday, 18 May 2018 after the AGM.
FORWARD-LOOKING STATEMENTS
This document may contain certain forward-looking statements relating to the Group that are based on the beliefs of the
Group’s management as well as assumptions made by and information currently available to the Group’s management.
These forward-looking statements are, by their nature, subject to significant risks and uncertainties. These forward-looking
statements include, without limitation, statements relating to the Group’s business prospects, future developments, trends
and conditions in the industry and geographical markets in which the Group operates, its strategies, plans, objectives and
goals, its ability to control costs, statements relating to prices, volumes, operations, margins, overall market trends, risk
management and exchange rates.
When used in this document, the words “anticipate”, “believe”, “could”, “estimate”, “expect”, “going forward”, “intend”,
“may”, “ought to”, “plan”, “project”, “seek”, “should”, “will”, “would” and similar expressions, as they relate to the Group or
the Group’s management, are intended to identify forward-looking statements. These forward-looking statements reflect
the Group’s views as of the date hereof with respect to future events and are not a guarantee of future performance or
developments. You are strongly cautioned that reliance on any forward-looking statements involves known and unknown
risks and uncertainties. Actual results and events may differ materially from information contained in the forward-looking
statements as a result of a number of factors, including any changes in the laws, rules and regulations relating to any
aspects of the Group’s business operations, general economic, market and business conditions, including capital market
developments, changes or volatility in interest rates, foreign exchange rates, equity prices or other rates or prices, the
actions and developments of the Group’s competitors and the effects of competition in the insurance industry on the
demand for, and price of, the Group’s products and services, various business opportunities that the Group may or may not
pursue, changes in population growth and other demographic trends, including mortality, morbidity and longevity rates,
persistency levels, the Group’s ability to identify, measure, monitor and control risks in the Group’s business, including its
ability to manage and adapt its overall risk profile and risk management practices, its ability to properly price its products
and services and establish reserves for future policy benefits and claims, seasonal fluctuations and factors beyond the
Group’s control. Subject to the requirements of the Listing Rules, the Group does not intend to update or otherwise revise
the forward-looking statements in this document, whether as a result of new information, future events or otherwise. As a
result of these and other risks, uncertainties and assumptions, forward-looking events and circumstances discussed in this
document might not occur in the way the Group expects, or at all. Accordingly, you should not place reliance on any
forward-looking information or statements. All forward-looking statements in this document are qualified by reference to
the cautionary statements set forth in this section.
By Order of the Board
Ng Keng Hooi
Executive Director,
Group Chief Executive and President
Hong Kong, 27 February 2018

182
As at the date of this announcement, the Board comprises:
Independent Non-executive Chairman and Independent Non-executive Director:
Mr. Edmund Sze-Wing Tse
Executive Director, Group Chief Executive and President:
Mr. Ng Keng Hooi
Independent Non-executive Directors:
Mr. Jack Chak-Kwong So, Mr. Chung-Kong Chow, Mr. John Barrie Harrison, Mr. George Yong-Boon Yeo, Mr. Mohamed Azman Yahya,
Professor Lawrence Juen-Yee Lau, Ms. Swee-Lian Teo, Dr. Narongchai Akrasanee and Mr. Cesar Velasquez Purisima
183
GLOSSARY
active agent An agent who sells at least one policy per month.
active market A market in which all the following conditions exist:• the items traded within the market are homogeneous;• willing buyers and sellers can normally be found at any time; and• prices are available to the public.
A financial instrument is regarded as quoted in an active market if quoted prices are readily and regularly available from an exchange, dealer, broker, industry group, pricing service or regulatory agency, and those prices represent actual and regularly occurring market transactions on an arm’s length basis.
adjusted net worth or ANW ANW is the market value of assets in excess of the assets backing the policy reserves and other liabilities of the life (and similar) business of AIA, plus the IFRS equity value of other activities, such as general insurance business, less the value of intangible assets. It excludes any amounts not attributable to shareholders of AIA Group Limited. ANW for AIA is stated after adjustment to reflect consolidated reserving requirements. ANW by market is stated before adjustment to reflect consolidated reserving requirements, and presented on a local statutory basis.
AER Actual exchange rates.
AGM 2018 Annual General Meeting of the Company to be held at 11:00 a.m. (Hong Kong time) on Friday, 18 May 2018.
AIA or the Group AIA Group Limited and its subsidiaries.
AIA Co. AIA Company Limited, a company incorporated in Hong Kong and a subsidiary of the Company.
AIA International AIA International Limited, a company incorporated in Bermuda and an indirect subsidiary of the Company.
AIA Vitality A science-backed wellness programme that provides participants with the knowledge, tools and motivation to help them achieve their personal health goals. The programme is a partnership between AIA and Discovery Limited, a specialist insurer headquartered in South Africa.
amortised cost The amount at which the financial asset or financial liability is measured at initial recognition minus principal repayments, plus or minus the cumulative amortisation using the effective interest method of any difference between the initial amount and the maturity amount, and minus any reduction for impairment or uncollectibility.
annualised new premiums or ANP ANP represents 100 per cent of annualised first year premiums and 10 per cent of single premiums, before reinsurance ceded. It is an internally used measure of new business sales or activity for all entities within AIA. ANP excludes new business of pension business, personal lines and motor insurance.
ASPP Agency Share Purchase Plan, adopted by the Company on 23 February 2012, a share purchase plan with matching offer to facilitate and encourage AIA share ownership by agents.
184
available for sale (AFS) financial assets
Financial assets that may be sold before maturity and that are used to back insurance and investment contract liabilities and shareholders’ equity, and which are not managed on a fair value basis. Non-derivative financial assets that are designated as available for sale or are not classified as loans and receivables or as at fair value through profit or loss. Available for sale financial instruments are measured at fair value, with movements in fair value recorded in other comprehensive income.
bancassurance The distribution of insurance products through banks or other financial institutions.
Board The board of Directors.
CER Constant exchange rates. Change on constant exchange rates is calculated using constant average exchange rates for the current year and for the prior year other than for balance sheet items that use constant exchange rates as at the end of the current year and as at the end of the prior year.
CIRC China Insurance Regulatory Commission.
Company AIA Group Limited, a company incorporated in Hong Kong with limited liability, whose shares are listed on the Main Board of the Hong Kong Stock Exchange (stock code: 1299).
consolidated investment funds Investment funds in which the Group has interests and power to direct their relevant activities that affect the return of the funds.
Corporate Governance Code Corporate Governance Code set out in Appendix 14 to the Listing Rules.
cost of capital or CoC CoC is calculated as the face value of the required capital as at the valuation date less the present value of the net-of-tax investment return on the shareholder assets backing the required capital and the present value of projected releases from the assets backing the required capital. Where the required capital may be covered by policyholder assets such as surplus assets in participating funds, there is no associated cost of capital included in the VIF or VONB. CoC for AIA is stated after adjustment to reflect consolidated capital requirements. CoC by market is stated before adjustment to reflect consolidated capital requirements, and presented on a local statutory basis.
deferred acquisition costs or DAC DAC are expenses of an insurer which are incurred in connection with the acquisition of new insurance contracts or the renewal of existing insurance contracts. They include commissions and other variable sales inducements and the direct costs of issuing the policy, such as underwriting and other policy issue expenses. These costs are deferred and expensed to the consolidated income statement on a systematic basis over the life of the policy. DAC assets are tested for recoverability at least annually.
deferred origination costs or DOC Origination costs are expenses which are incurred in connection with the origination of new investment contracts or the renewal of existing investment contracts. For contracts that involve the provision of investment management services, these include commissions and other incremental expenses directly related to the issue of each new contract. Origination costs on contracts with investment management services are deferred and recognised as an asset in the consolidated statement of financial position and expensed to the consolidated income statement on a systematic basis in line with the revenue generated by the investment management services provided. Such assets are tested for recoverability.

185
Director(s) The director(s) of the Company.
embedded value or EV An actuarially determined estimate of the economic value of a life insurance business based on a particular set of assumptions as to future experience, excluding any economic value attributable to future new business. EV for AIA is stated after adjustments to reflect consolidated reserving and capital requirements and the after-tax value of unallocated Group Office expenses. EV by market is stated before adjustments to reflect consolidated reserving and capital requirements and unallocated Group Office expenses, and presented on a local statutory basis.
EPS Earnings per share.
equity attributable to shareholders of the Company on the embedded value basis or EV Equity
EV Equity is the total of embedded value, goodwill and other intangible assets attributable to shareholders of the Company.
ESPP Employee Share Purchase Plan, adopted by the Company on 25 July 2011 (as amended), a share purchase plan with matching offer to facilitate and encourage AIA share ownership by employees.
ExCo The Executive Committee of the Group.
fair value through profit or loss or FVTPL
Financial assets that are held to back unit-linked contracts and participating funds or financial assets and liabilities that are held for trading. A financial asset or financial liability that is measured at fair value in the statement of financial position with gains and losses arising from movements in fair value being presented in the consolidated income statement as a component of the profit or loss for the year.
first half The six months from 1 December to 31 May.
first year premiums First year premiums are the premiums received in the first year of a recurring premium policy. As such, they provide an indication of the volume of new policies sold.
free surplus ANW in excess of the required capital. Free surplus for AIA is stated after adjustment to reflect consolidated reserving and capital requirements.
group insurance An insurance scheme whereby individual participants are covered by a master contract held by a single group or entity on their behalf.
Group Office Group Office includes the activities of the Group Corporate Centre segment consisting of the Group’s corporate functions, shared services and eliminations of intragroup transactions.
HKFRS Hong Kong Financial Reporting Standards.
HKIA Insurance Authority established under the Insurance Companies (Amendment) Ordinance 2015 or prior to 26 June 2017, the Office of the Commissioner of Insurance.

186
HKICPA Hong Kong Institute of Certified Public Accountants.
Hong Kong The Hong Kong Special Administrative Region of the PRC; in the context of our reportable segments, Hong Kong includes Macau.
Hong Kong Companies Ordinance
Companies Ordinance (Chapter 622 of the Laws of Hong Kong), as amended from time to time.
Hong Kong Insurance Ordinance or HKIO
Insurance Ordinance (Chapter 41 of the Laws of Hong Kong), as amended from time to time. It provides a legislative framework for the prudential supervision of the insurance industry in Hong Kong.
Hong Kong Stock Exchange or HKSE
The Stock Exchange of Hong Kong Limited.
IAIS International Association of Insurance Supervisors.
IAS International Accounting Standards.
IASB International Accounting Standards Board.
IFA Independent financial adviser.
IFRS Standards and interpretations adopted by the IASB comprising:• International Financial Reporting Standards;• IAS; and• Interpretations developed by the IFRS Interpretations Committee (IFRS
IC) or the former Standing Interpretations Committee (SIC).
interactive Mobile Office or iMO iMO is a mobile office platform with a comprehensive suite of applications that allow agents and agency leaders to manage their daily activities from lead generation, sales productivity and recruitment activity through to development training and customer analytics.
interactive Point of Sale or iPoS iPoS is a secure, mobile point-of-sale technology that features a paperless sales process from the completion of the customer’s financial-needs analysis to proposal generation with electronic biometric signature of life insurance applications on tablet devices. It is part of iMO.
investment experience Realised and unrealised investment gains and losses recognised in the consolidated income statement.
investment income Investment income comprises interest income, dividend income and rental income.
investment return Investment return consists of investment income plus investment experience.
IPO Initial Public Offering.
187
liability adequacy testing An assessment of whether the carrying amount of an insurance liability needs to be increased or the carrying amount of related deferred acquisition and origination costs or related intangible assets decreased based on a review of future cash flows.
Listing Rules The Rules Governing the Listing of Securities on The Stock Exchange of Hong Kong Limited.
Million Dollar Round Table or MDRT
MDRT is a global professional trade association of life insurance and financial services professionals that recognises significant sales achievements and high service standards.
net funds to Group Corporate Centre
In presenting net capital in/(out) flows to reportable segments, capital outflows consist of dividends and profit distributions to the Group Corporate Centre segment and capital inflows consist of capital injections into reportable segments by the Group Corporate Centre segment. For the Group, net capital in/(out) flows reflect the net amount received from shareholders by way of capital contributions less amounts distributed by way of dividends.
n/a Not available.
n/m Not meaningful.
operating profit after tax or OPAT Operating profit is determined using, among others, expected long-term investment return for equities and real estate. Short-term fluctuations between expected long-term investment return and actual investment return for these asset classes are excluded from operating profit. The investment return assumptions used to determine expected long-term investment return are based on the same assumptions used by the Group in determining its embedded value and are disclosed in the Supplementary Embedded Value Information.
operating return on EV or operating ROEV
Operating return on EV is calculated as EV operating profit, expressed as a percentage of the opening embedded value.
operating return on shareholders’ allocated equity or operating ROE
Operating return on shareholders’ allocated equity is calculated as operating profit after tax attributable to shareholders of the Company, expressed as a percentage of the simple average of opening and closing shareholders’ allocated equity.
OTC Over-the-counter.
participating funds Participating funds are distinct portfolios where the policyholders have a contractual right to receive at the discretion of the insurer additional benefits based on factors such as the performance of a pool of assets held within the fund, as a supplement to any guaranteed benefits. The Group may either have discretion as to the timing of the allocation of those benefits to participating policyholders or may have discretion as to the timing and the amount of the additional benefits.

188
participating policies Participating policies are contracts with DPF. Participating policies may either be written within participating funds or may be written within the Company’s general account, whereby the investment performance is determined for a group of assets or contracts, or by reference to the Company’s overall investment performance and other factors. The latter is referred to by the Group as “other participating business”. Whether participating policies are written within a separate participating fund or not largely depends on matters of local practice and regulation.
persistency The percentage of insurance policies remaining in force from month to month in the past 12 months, as measured by premiums.
Philam Life The Philippine American Life and General Insurance (PHILAM LIFE) Company, a subsidiary of AIA Co.; in the context of the Supplementary Embedded Value Information, Philam Life includes BPI-Philam Life Assurance Corporation.
policyholder and shareholder investments
Investments other than those held to back unit-linked contracts as well as assets from consolidated investment funds.
pps Percentage points.
PRC The People’s Republic of China.
protection gap The difference between the resources needed and resources available to maintain dependants’ living standards after the death of the primary wage-earner.
puttable liabilities A puttable financial instrument is one in which the holder of the instrument has the right to put the instrument back to the issuer for cash (or another financial asset). Units in investment funds such as mutual funds and open-ended investment companies are typically puttable instruments. As these can be put back to the issuer for cash, the non-controlling interests in any such funds which have to be consolidated by AlA are treated as financial liabilities.
PVNBP margin VONB excluding pension business, expressed as a percentage of present value of new business premiums (PVNBP). PVNBP margin for AIA is stated after adjustments to reflect consolidated reserving and capital requirements and the after-tax value of unallocated Group Office expenses.
regulatory minimum capital Net assets held to meet the minimum solvency margin requirement set by the HKIO that an insurer must meet in order to be authorised to carry on insurance business in or from Hong Kong.
renewal premiums Premiums receivable in subsequent years of a recurring premium policy.
rider A supplemental plan that can be attached to a basic insurance policy, typically with payment of additional premiums.
Risk-Based Capital or RBC RBC represents an amount of capital based on an assessment of risks that a company should hold to protect customers against adverse developments.

189
RMF Risk Management Framework.
RSPUs Restricted stock purchase units.
RSSUs Restricted stock subscription units.
RSU Scheme Restricted Share Unit Scheme, adopted by the Company on 28 September 2010 (as amended), under which the Company may award restricted share units to employees, directors (excluding independent non-executive directors) or officers of the Company or any of its subsidiaries.
second half The six months from 1 June to 30 November.
share(s) For the Company, shall mean ordinary share(s) in the capital of the Company.
shareholders’ allocated equity Shareholders’ allocated equity is total equity attributable to shareholders of the Company less fair value reserve.
Singapore The Republic of Singapore; in the context of our reportable segments, Singapore includes Brunei.
single premium A single payment that covers the entire cost of an insurance policy.
SME Small-and-medium sized enterprise.
SO Scheme Share Option Scheme, adopted by the Company on 28 September 2010 (as amended), under which the Company may award share options to employees, directors (excluding independent non-executive directors) or officers of the Company or any of its subsidiaries.
solvency The ability of an insurance company to satisfy its policyholder benefits and claims obligations.
solvency ratio The ratio of the total available capital to the regulatory minimum capital applicable to the insurer pursuant to relevant regulations.
takaful Islamic insurance which is based on the principles of mutual assistance and risk sharing.
Tata AIA Tata AIA Life Insurance Company Limited.
total weighted premium income or TWPI
TWPI consists of 100 per cent of renewal premiums, 100 per cent of first year premiums and 10 per cent of single premiums, before reinsurance ceded. As such it provides an indication of AIA’s longer-term business volumes as it smoothes the peaks and troughs in single premiums.
unit-linked investments Financial investments held to back unit-linked contracts.

190
unit-linked products Unit-linked products are insurance products where the policy value is linked to the value of underlying investments (such as collective investment schemes, internal investment pools or other property) or fluctuations in the value of underlying investment or indices. Investment risk associated with the product is usually borne by the policyholder. Insurance coverage, investment and administration services are provided for which the charges are deducted from the investment fund assets. Benefits payable will depend on the price of the units prevailing at the time of death of the insured or surrender or maturity of the policy, subject to surrender charges.
universal life A type of insurance product where the customer pays flexible premiums, subject to specified limits, which are accumulated in an account balance which are credited with interest at a rate either set by the insurer or reflecting returns on a pool of matching assets. The customer may vary the death benefit and the contract may permit the policyholder to withdraw the account balance, typically subject to a surrender charge.
value of business acquired or VOBA
VOBA in respect of a portfolio of long-term insurance and investment contracts acquired is recognised as an asset, calculated using discounted cash flow techniques, reflecting all future cash flows expected to be realised from the portfolio. VOBA is amortised over the estimated life of the contracts in the acquired portfolio on a systematic basis. The rate of amortisation reflects the profile of the additional value of the business acquired. The carrying value of VOBA is reviewed annually for impairment and any impairment is charged to the consolidated income statement.
value of in-force business or VIF VIF is the present value of projected after-tax statutory profits emerging in the future from the current in-force business less the cost arising from holding the required capital (CoC) to support the in-force business. VIF for AIA is stated after adjustments to reflect consolidated reserving and capital requirements and the after-tax value of unallocated Group Office expenses. VIF by market is stated before adjustments to reflect consolidated reserving and capital requirements and unallocated Group Office expenses, and presented on a local statutory basis.
value of new business or VONB VONB is the present value, measured at the point of sale, of projected after-tax statutory profits emerging in the future from new business sold in the period less the cost of holding the required capital in excess of regulatory reserves to support this business. VONB for AIA is stated after adjustments to reflect consolidated reserving and capital requirements and the after-tax value of unallocated Group Office expenses. VONB by market is stated before adjustments to reflect consolidated reserving and capital requirements and unallocated Group Office expenses, and presented on a local statutory basis.
VONB margin VONB excluding pension business, expressed as a percentage of ANP. VONB margin for AIA is stated after adjustments to reflect consolidated reserving and capital requirements and the after-tax value of unallocated Group Office expenses. VONB margin by market is stated before adjustments to reflect consolidated reserving and capital requirements and unallocated Group Office expenses, and presented on a local statutory basis.
working capital Working capital comprises debt and equity securities, deposits and cash and cash equivalents held at the Group Corporate Centre. These liquid assets are available to invest in building the Group’s business operations.