AHRQ Quality Indicators - Agency for Healthcare Research ... · PDF filehealth care quality...
50
Transcript of AHRQ Quality Indicators - Agency for Healthcare Research ... · PDF filehealth care quality...


AHRQ Quality Indicators
Patient Safety Indicators: Software Documentation, Version 2.1, Revision 2 SAS Department of Health and Human Services Agency for Healthcare Research and Quality http://www.qualityindicators.ahrq.gov March 2003 AHRQ Pub. No. 03-R204 Revision 2 (October 22, 2004)

Citation AHRQ Quality Indicators -- Patient Safety Indicators: Software Documentation, Version 2.1 - SAS. Rockville, MD: Agency for Healthcare Research and Quality, 2003. Revision 2 (October 22, 2004) AHRQ Pub.03-R204
Abstract The value of information on health care quality has never been so widely recognized; yet many organizations lack the resources and/or expertise to build a quality information program from the ground up. Recognizing this, the AHRQ Quality Indicators were developed specifically to meet the short-term needs for information on health care quality using standardized, user-friendly methods and existing sources of data. This module of the AHRQ Quality Indicators was designed to capitalize on the availability of administrative data on inpatient stays to produce information for Patient Safety Indicators (PSIs). These indicators capture potentially preventable complications and iatrogenic events for patients treated in hospitals. They can be used as a screening tool for problems that patients experience as a result of exposure to the healthcare system and that are likely amenable to prevention by changes at the system or provider level. This document is the software documentation for the Patient Safety Indicators software Version 2.1, Revision 2, which is provided on the AHRQ Web site. The software was developed in SAS, for use on a personal computer. By making this tool available, we hope to assist others in producing information on health care quality more cost effectively. Details on the development of the Patient Safety Indicators can be found in "Guide to Patient Safety Indicators."
Version 2.1 i Revision 2 (PSI, SAS, October 22, 2004)
Acknowledgments This product is based on the work of many individuals who contributed to its development and testing. The following staff from the Evidence-based Practice Center (EPC) at UCSF-Stanford performed the evidence review, facilitated clinician reviews, completed the empirical evaluation, and created the programming code and technical documentation for the new Patient Safety Indicators: Core Project Team Other Contributors Kathryn M. McDonald, M.M. (Stanford) Kaveh G. Shojania, M.D. (UCSF) Jeffrey Geppert, J.D. (Stanford) Bradford Duncan M.D. (Stanford) Sheryl M. Davies, M.A. (Stanford) Angela Hansen, B.A. (Stanford) Patrick Romano, M.D., M.P.H. (UC-Davis) The following staff from Social & Scientific Systems, Inc., developed this software product, documentation, and guide: Programmers Technical Writer Leif Karell Patricia Burgess Kathy McMillan Fred Rohde Graphics Designer Laura Spofford Contributors from the Agency for Healthcare Research and Quality: Anne Elixhauser, Ph.D. H. Joanna Jiang, Ph.D. Marlene Miller, M.D., M.Sc. Margaret Coopey, R.N., M.G.A, M.P.S. Denise Remus, Ph.D., R.N.
Support efforts, including refinement and enhancement of the AHRQ Quality Indicators and related products, are provided by the Support for Quality Indicators contract team. The following individuals from Stanford University, University of California (UC) and Battelle Memorial Institute constitute the Support for Quality Indicators core team: Sheryl M. Davies, M.A. Mark Gritz, Ph.D. Rajin Mangru, B.S. Bruce Ellis, M.S. Greg Hubert, B.S. Kathryn M. McDonald, M.M. Jeffrey Geppert, J.D. Elaine Keller, M.Ed. Patrick Romano, M.D., M.P.H The Agency for Healthcare Research and Quality Support for Quality Indicators team includes: Denise Remus, Ph.D., R.N., Project Officer Mary B. Haines, Contract Officer We also wish to acknowledge the invaluable contribution of the clinical panelists and the peer reviewers of the evidence report; and the beta-testers of the software products.
Version 2.1 ii Revision 2 (PSI, SAS, October 22, 2004)

Table of Contents
Abstract............................................................................................................................................................. i
Acknowledgments .......................................................................................................................................... ii
Introduction ..................................................................................................................................................... 1
Components of the Patient Safety Indicators Module................................................................................. 1
Quick Reference.............................................................................................................................................. 2 Processing Steps ...................................................................................................................................... 2 Patient Safety Indicator Module Details .................................................................................................... 5
Background ..................................................................................................................................................... 7
Data Elements and Coding Conventions...................................................................................................... 8 Input for the AHRQ Quality Indicators....................................................................................................... 8 Coding of Diagnoses, Procedures, DRGs and MDCs ............................................................................ 10 Use of External Cause of Injury Codes ................................................................................................... 10 Missing Values ........................................................................................................................................ 13 Treatment of Missing Data ...................................................................................................................... 14
User Options.................................................................................................................................................. 15
Producing Patient Safety Indicator Rates: Processing Steps................................................................. 16 1. Identify outcomes in inpatient records ............................................................................................... 16 2. Identify populations at risk.................................................................................................................. 16 3. Calculate observed (raw) Patient Safety Indicator rates.................................................................... 16 4. Risk adjust the Patient Safety Indicator rates: Provider PSIs only ................................................... 17 5. Create MSX smoothed rates: Provider PSIs only ............................................................................. 17
Program Descriptions................................................................................................................................... 18 Program 1: Modify Statements in the CONTROL_PSI.SAS code ......................................................... 18 Program 2: Run PSFMTS ...................................................................................................................... 19 Program 3: Run PSSAS1....................................................................................................................... 19 Program 4: Run PSSASP2..................................................................................................................... 20 Program 5: Run PSSASP3..................................................................................................................... 23 Program 6: Run PSSASA2..................................................................................................................... 25
Reviewing the Printed Output...................................................................................................................... 28 PSSAS1................................................................................................................................................... 28 PSSASP2 ................................................................................................................................................ 28 PSSASP3 ................................................................................................................................................ 29 PSSASA2 ................................................................................................................................................ 31
Interpreting the Results................................................................................................................................ 33 Using Indicators in Combination.............................................................................................................. 33 Observed Means ..................................................................................................................................... 33 Risk-adjusted Rates. Provider PSIs Only............................................................................................... 34 MSX Smoothed rates (Optional). Provider PSIs Only............................................................................ 35 Comparing Observed, Risk-adjusted and Smoothed Rates. Provider PSIs Only.................................. 36 Comparing Observed Rates with Risk-adjusted Rates........................................................................... 37 Comparing Risk-adjusted Rates with Smoothed Rates (Optional) ......................................................... 37 Confidence Intervals................................................................................................................................ 38 Computing Expected Rates (Optional).................................................................................................... 38
Version 2.1 iii Revision 2 (PSI, SAS, October 22, 2004)
Benchmark Timings...................................................................................................................................... 39
User Support and Information ..................................................................................................................... 39
Appendix A: Log of Revisions to PSI Documentation and Software Version 2.1, Revision 2 ........... A-1
Appendix B: ICD-9-CM and DRG Coding Updates in PSI Release Version 2.1, Revision 2 .............. B-1
List of Figures Figure 1. Processing Steps for the Patient Safety Indicators - Provider.................................................. 3
Figure 2. Processing Steps for the Patient Safety Indicators - Area ........................................................ 4
List of Tables Table 1. Patient Safety Indicator (PSI) Variables ........................................................................................ 5
Table 2. Prefixes for the Patient Safety Indicator (PSI) Variables ............................................................. 6
Table 3. Patient Safety Module Contents..................................................................................................... 6
Table 4. Data Elements and Coding Conventions .................................................................................... 11
Table 5. Treatment of Missing Data Elements........................................................................................... 14
Table 6. PSSASP2 Aggregation Possibilities............................................................................................ 22
Table 7. PSSASA2 Aggregation Possibilities............................................................................................ 26
Version 2.1 iv Revision 2 (PSI, SAS, October 22, 2004)

AHRQ Quality Indicators, SAS Software Documentation, Version 2.1, Revision 2: Patient Safety Indicators
Introduction This documentation describes the software for implementing the Patient Safety Indicator (PSI) module of the AHRQ Quality Indicators Version 2.1, Revision 2 and highlights features of the analytic approach of particular interest to new users. Detailed information about the PSIs is contained in the companion document “Guide to Patient Safety Indicators”1, which includes information about the development of the indicators and their definitions. The software consists of a series of computer programs that perform the following functions: • Assign and calculate PSIs from hospital discharge abstracts or UB (uniform billing) claims data. • Print PSI results in SAS format or as an ASCII text file (comma delimited) that can be imported into
word processing documents, spreadsheets, or graphics software, at the user's option. • Create risk-adjusted rates that adjust for case mix differences. • Create smoothed (i.e., reliability-adjusted) rates that reduce fluctuations over time due to random
variation. This documentation includes: • A discussion of the data elements necessary to produce the AHRQ PSIs and the uniform coding
conventions recommended for those elements. • Descriptions of the PSI processing steps in non-technical language. • Detailed descriptions of the functions of each PSI SAS program. Critical user information is highlighted with this symbol:
Components of the Patient Safety Indicators Module As shown in Table 3 on page 6, the Patient Safety Indicators module consists of six SAS programs and seven ASCII text files that contain auxiliary data. These programs and text files are described in the subsequent sections of this document. The programs were developed for use in Statistical Analysis System (SAS)2, version 6.12 or higher, on a Windows personal computer. A note on the naming conventions for the PSI module programs. Most programs have names of the form PSSASi, PSSASAi, or PSSASPi. The first two characters “PS” of the program name indicate a Patient Safety Indicators program, to distinguish it from other modules that have been or will be released from AHRQ. The next three characters of the program name are “SAS” and are present to distinguish the
1 Available at http://www.qualityindicators.ahrq.gov/psi_download.htm. 2 SAS is a statistical program distributed by the SAS Institute, Inc. (http://www.sas.com). The company may be contacted directly regarding the licensing of their products. The SAS Institute, Inc. does not have any affiliation with AHRQ nor involvement in the development of the AHRQ QIs.
Version 2.1 1 Revision 2 (PSI, SAS, October 22, 2004)
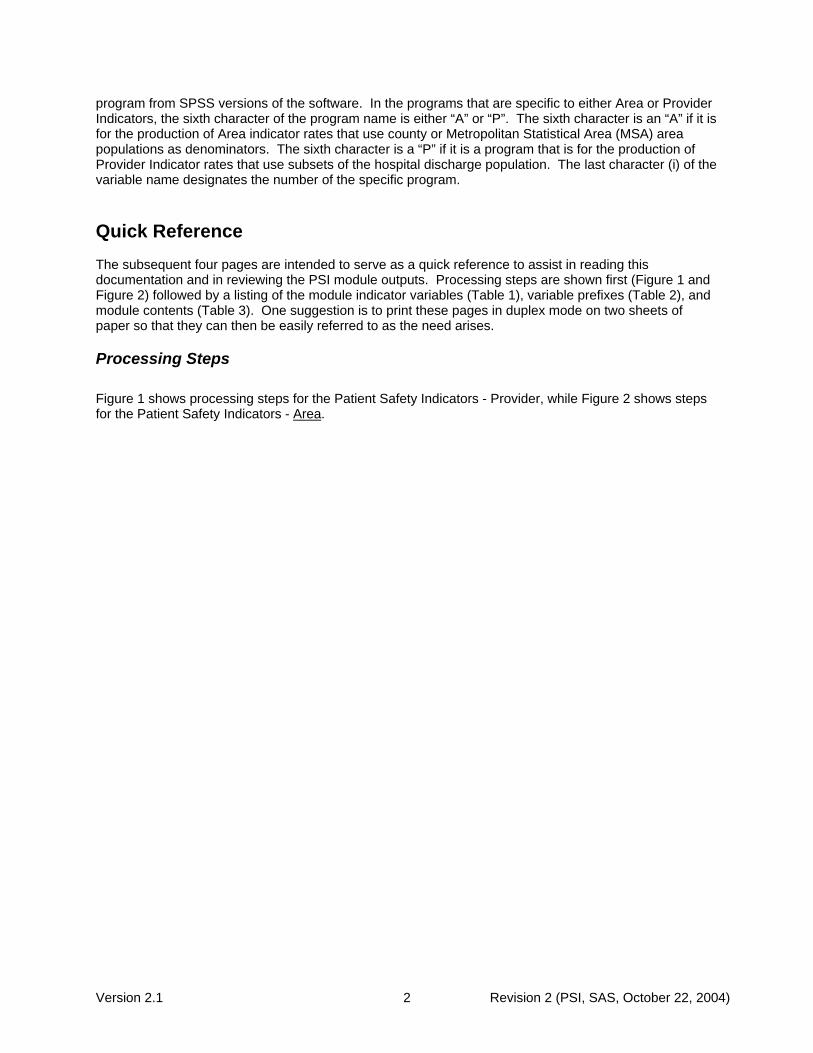
program from SPSS versions of the software. In the programs that are specific to either Area or Provider Indicators, the sixth character of the program name is either “A” or “P”. The sixth character is an “A” if it is for the production of Area indicator rates that use county or Metropolitan Statistical Area (MSA) area populations as denominators. The sixth character is a “P” if it is a program that is for the production of Provider Indicator rates that use subsets of the hospital discharge population. The last character (i) of the variable name designates the number of the specific program.
Quick Reference The subsequent four pages are intended to serve as a quick reference to assist in reading this documentation and in reviewing the PSI module outputs. Processing steps are shown first (Figure 1 and Figure 2) followed by a listing of the module indicator variables (Table 1), variable prefixes (Table 2), and module contents (Table 3). One suggestion is to print these pages in duplex mode on two sheets of paper so that they can then be easily referred to as the need arises.
Processing Steps Figure 1 shows processing steps for the Patient Safety Indicators - Provider, while Figure 2 shows steps for the Patient Safety Indicators - Area.
Version 2.1 2 Revision 2 (PSI, SAS, October 22, 2004)

Figure 1. Processing Steps for the Patient Safety Indicators - Provider
NOTE: Each of the SAS Programs in Figure 1 incorporates the CONTROL_PSI.SAS program, which contains code the user must modify in order to run the PSI software. The modifications include such items as specifying the name and location of the input data set, the population data set, and the output data set.
Version 2.1 3 Revision 2 (PSI, SAS, October 22, 2004)

Figure 2. Processing Steps for the Patient Safety Indicators - Area
Version 2.1 4 Revision 2 (PSI, SAS, October 22, 2004)

Patient Safety Indicator Module Details The following tables list the module indicator variables (Table 1), variable prefixes (Table 2), and module contents (Table 3).
Table 1. Patient Safety Indicator (PSI) Variables PSI Number Indicator
Patient Safety Provider Indicators 1 Complications of anesthesia* 2 Death in low mortality DRGsa
3 Decubitus ulcer* 4 Failure to rescue 5 Foreign body left during procedure* 6 Iatrogenic pneumothorax* 7 Selected infections due to medical care* 8 Postoperative hip fracture* 9 Postoperative hemorrhage or hematoma* 10 Postoperative physiologic and metabolic derangements* 11 Postoperative respiratory failure* 12 Postoperative pulmonary embolism or deep vein thrombosis* 13 Postoperative sepsis* 14 Postoperative wound dehiscence* 15 Accidental puncture or laceration* 16 Transfusion reaction* 17 Birth trauma – injury to neonate 18 Obstetric trauma – vaginal with instrument 19 Obstetric trauma – vaginal without instrument 20 Obstetric trauma – cesarean section 27 Obstetric trauma with 3rd degree – vaginal with instrument* 28 Obstetric trauma with 3rd degree – vaginal without instrument* 29 Obstetric trauma with 3rd degree – cesarean section*
Patient Safety Area Indicators 21 Foreign body left during procedure 22 Iatrogenic pneumothorax 23 Selected infections due to medical care 24 Postoperative wound dehiscence* 25 Accidental puncture or laceration 26 Transfusion reaction
a PSI 2 is reported as a single measure, but is also stratified into medical (adult and pediatric), surgical
(adult and pediatric), obstetric and psychiatric DRGs. * These PSI were modified (PSIs 1, 3, 5, 6, 7, 8, 9, 10, 11, 12, 13, 14, 15, 16, 17, 18, 29, 24) or added
(PSIs 27, 28, 29) in version 2.1, revision 2.
Version 2.1 5 Revision 2 (PSI, SAS, October 22, 2004)

Table 2. Prefixes for the Patient Safety Indicator (PSI) Variables
Examples
Prefix Contents Provider Indicator
# 8, Postoperative Hip
Fracture
Area Indicator # 23,
Infection Due to Medical Care
T Inpatient numerator (top) TPPS08 TAPS23
P Population denominator (pop) PPPS08 PAPS23
O Observed Rate OPPS08 OAPS23
R Risk-adjusted Rate RPPS08 RAPS23
S Smoothed Rate SPPS08 SAPS23
E Expected Rate EPPS08 EAPS23
Table 3. Patient Safety Module Contents SAS programs ASCII text files † CONTROL_PSI.SAS QICTY97.TXT PSFMTS.SAS QICTY98.TXT PSSAS1.SAS QICTY99.TXT PSSASP2.SAS QICTY00.TXT PSSASP3.SAS QICTY01.TXT PSSASA2.SAS QICTY02.TXT COVPSP00.TXT MSXPSP00.TXT † The ASCII text files are data files provided with the Patient Safety module and are necessary for the
programs to run. There is no need to convert these files to SAS format for use with the software. The parameter reference file of MSXPS00.TXT is not interchangeable between SAS and SPSS software. Users should verify they are running the software with the ASCII text files as listed in Table 3 of the applicable, e.g., SAS or SPSS, software manuals.
Version 2.1 6 Revision 2 (PSI, SAS, October 22, 2004)

Background The PSI module contains 29 indicators that reflect the quality of care inside hospitals. These indicators serve as flags for potential quality problems rather than definitive measures of quality of care. The indicators include two groups of measures based on hospital stays. 1. There are 23 Provider-based Patient Safety Indicators for medical conditions and surgical
procedures that have been shown to have complication/adverse event rates that vary substantially across institutions and for which evidence suggests that high complication/adverse event rates may be associated with deficiencies in the quality of care. These indicators are measured as rates—number of complications / adverse events divided by the number of admissions for the procedure or condition. The Provider-based Indicators include only those cases where a secondary diagnosis code flags a potentially preventable complication.
Eight of these indicators are for surgical discharges, eight are for either medical or surgical discharges, and seven are for obstetric discharges. Six of the Provider-based Patient Safety Indicators (PSIs 8, 9, 10, 11, 12, 14), incorporate information about when procedures were performed (relative to the admission date) if this information is available. Note, however, that if the day of procedure information is missing, the computed rates for these indicators will be slightly lower than if the information was available. Admission type is used by four of the PSIs: postoperative physiologic and metabolic derangements, postoperative respiratory failure, postoperative sepsis, and birth trauma (PSIs 10, 11, 13, and 17), to identify elective surgeries and newborn admissions. Note that PSI 2 (Death in Low Mortality DRGs) is reported as a single provider level measure (observed and risk-adjusted). A single measure is necessary to insure adequate reliability of the provider level rates by pooling an infrequent event over a large group of patients. However, the denominator for the indicator is very heterogeneous, and the mortality rate among the low mortality DRGs varies by DRG type. For instance, adult medical DRGs account for about 60% of the deaths, although they account for only 25% of the discharges in the denominator. Conversely, obstetric DRGs account for about 5% of the deaths and 45% of discharges in the denominator. Users should compare the observed rate to the risk-adjusted rate, which accounts for differences among hospitals in patient case-mix (i.e., age, gender, DRG and co morbidities). For example, a hospital may have a high Death in Low Mortality DRG observed rate only because the hospital has a higher-than-average share of adult medical DRGs. However, in order to further assist users in understanding the basis of the Low Mortality DRG rate, and in identifying the subpopulation of patients that may require further analysis, the software also calculates eight discharge level Low Mortality DRG measures by DRG type: medical (adult and pediatric), surgical (adult and pediatric – with and without an OR procedure), obstetric and psychiatric DRGs. Although all the deaths identified by this measure are potentially preventable, hospitals could decide to focus their attention on those subpopulations either with the highest share of deaths (e.g. adult medical DRGs) or with the least likely deaths (e.g. obstetric DRGs).
2. There are six Area-based Patient Safety Indicators, where geographic areas can be defined at the
MSA (Metropolitan Statistical Area) level for urban areas and at the county level for rural areas or by county for all areas. MSAs are defined in terms of entire counties, which include the county (or counties) that contain the largest city and any adjacent counties that have at least 50 percent of their population in the urbanized area surrounding the largest city. In New England, the MSAs are defined in terms of cities and towns rather than counties. The MSA definitions in this software are based on the standards effective June 30, 1999. These indicators are identical to Provider-based Indicators, except that the numerator uses principal diagnosis in addition to secondary diagnoses in order to capture all cases of the complication, and not only those that develop during a given hospital admission.
Version 2.1 7 Revision 2 (PSI, SAS, October 22, 2004)

The 29 indicators in the PSI module are listed in Table 1 on page 5. See also Appendix A of the “Guide to Patient Safety Indicators” (http://www.qualityindicators.ahrq.gov/psi_download.htm) for the definition of each indicator. Note that PSI 2 (death in low mortality DRGs) is reported as a single measure, but also stratified by type of DRG: adult medical, pediatric medical, adult surgical (with OR procedure), adult surgical (without OR procedure), pediatric surgical (with OR procedure), pediatric surgical (without OR procedure), obstetric and psychiatric. See Appendix A of the PSI Guide for a list of low mortality DRGs by type. The data required for measuring these indicators come from hospital discharge abstracts or billing claims (administrative data) which are readily available within hospitals or from many state data organizations. The residential population data for the six Area-based Indicators are from the U.S. Census Bureau. The software generates observed rates for the area-based patient safety indicators and observed, risk-adjusted, smoothed (i.e., reliability-adjusted) and expected rates for all Provider-based Indicators. Observed rates are the raw rates. Risk-adjusted and expected rates are derived from applying the average case mix and rates of a baseline file that reflects a large proportion of the U.S. hospitalized population. Smoothed rates are estimates with removal of fluctuations over time due to random variation. The observed rates for the area PSI are extremely low, and as a result age-sex adjustments are not necessary. For information about how these indicators were identified, see the “Guide to the Patient Safety Indicators.” (http://www.qualityindicators.ahrq.gov/psi_download.htm)
Data Elements and Coding Conventions
Input for the AHRQ Quality Indicators The PSI software was written to process data from discharge data abstracts that contain information about hospital stays. The specific data elements that are needed for the PSI software are listed in Table 4. The PSI module was tested on data from the AHRQ Healthcare Cost and Utilization Project (HCUP). HCUP is an ongoing Federal-State-private collaboration to build uniform databases from administrative hospital-based data collected by State data organizations and hospital associations. Additional information on HCUP is available at the website http://www.ahrq.gov/data/hcup.
The input data files for the Patient Safety Indicators software must be in SAS.
It is strongly recommend that users recode data elements in their input files to be consistent with the coding expected by the software. We do not recommend changing the Patient Safety Indicators software. For example, recoding the SEX data element in the input file to be consistent with the coding described in Table 4 (i.e., 1 for male and 2 for female) should be done rather than attempting to modifying all uses of the Sex data element in the PSI programs.
Not every value for every data element is referenced by the PSI software. For example, only two
of the discharge disposition (DISP) data elements values are used in the software (DISP value “2” for short-term hospital and value “20” for died in the hospital). However, the complete set of standardized values is included, based on HCUP specifications, to assist users of the uniform HCUP data files.
Four of the indicators (PSIs 10, 11, 13, and 17) use admission type (ATYPE) to identify elective
surgeries and newborn admissions. If admission type (ATYPE) is not available in the user’s data, the user may want to evaluate other data in the file to create a proxy to identify elective and newborn admission types.
Version 2.1 8 Revision 2 (PSI, SAS, October 22, 2004)

To minimize internal changes to the software, all required elements should be present in the input data file. If a required element is not available, a dummy element should be provided. Failure to provide a dummy element will result in errors during the execution of the PSI programs.
The data elements listed in Table 4 are those required for the input files of both SAS and SPSS. When a variable is not required for the program the notation “Not used by the QI program” will be present in the Comments column. The SAS program will still run if these variables are not present, however, the SPSS program will not run correctly. Standardizing the variables and data values in the input data file will be helpful for users who have access to both statistical software packages as well as users working to standardize their input file specifications for use with any of the AHRQ QI software modules. The data element HOSPSTCO provides flexibility for users to calculate the area PSIs by hospital location or by patient residence. If the user wants to calculate the PSIs using the population associated with the hospital location as the denominator, the values for this variable should be the individual hospital FIPS3 state/county codes. If the user wants to calculate the area PSIs based on the population of the MSA region or county associated with the patient residence, the values for this variable should be the FIPS state/county code associated with each individual patient’s place of residence.
If the hospital FIPS code is used in HOSPSTCO, users should be aware that rates may be biased for hospitals which serve as regional referral centers. These hospitals are likely to treat patients from outside the MSA, county or even the state in which the facility is located.
Certain independent cities (Baltimore City, Carson City and St. Louis City), and areas within
Hawaii and Virginia, are assigned to different area groupings in the Modified FIPS categories as compared to the U.S. Census Bureau groupings. The AHRQ QI software uses the Modified FIPS code assignment of these areas. Failure to use the Modified FIPS codes assignment will result in the use of incorrect denominator estimates for area indicators.
Using the patient FIPS state/county code for analysis may more accurately reflect the true
population at risk.
It is possible that some records in the input data file may be missing the patient FIPS code. Users should be aware that any records with missing values (in the HOSPSTCO data field) are excluded from the calculations of observed, risk-adjusted and smoothed PSI area rates. They will be included in the output from the first program (PSSAS1.SAS).
The software will generate area PSI rates for each county included in the HOSPSTCO data field.
Users are encouraged to limit cases in their input file to those patients discharged from the geographic area of interest. For example, if you are using data from the state of Wisconsin and are interested in generating a rate for Wisconsin, you should remove the cases where the patient’s county of residence (FIPS code) is from another state. Otherwise the total or overall rate will include the population of the counties outside Wisconsin.
The software provides the user with the option of producing output by MSA or by county. When MSA is selected, urban areas are always defined by MSAs. When county is selected urban areas will be defined by county. Rural areas are always defined by county.
In the software programs, the MSALEVL parameter indicates whether MSA codes should be created from the FIPS state/county codes in the input dataset. If the user wishes to analyze data
3 Federal Information Processing Standard, as defined by the U.S. Department of Commerce, National Institute of Standards and Technology (formerly National Bureau of Standards).
Version 2.1 9 Revision 2 (PSI, SAS, October 22, 2004)

at the MSA level, this parameter should be set to 1. If the user wishes to analyze data at the county level, this parameter should be set to 0.
Coding of Diagnoses, Procedures, DRGs and MDCs
Diagnoses and procedures must be coded using the International Classification of Diseases, 9th Revision, Clinical Modification (ICD-9-CM)
Significant modifications to ICD-9-CM codes occurred in the early 1990s. PSI definitions only
reflect codes valid after October 1, 1997, and therefore may not accurately analyze data collected before 1997.
• Diagnoses and procedure codes should be in character strings. • Diagnosis and procedure codes should not contain any decimal points. • Diagnosis and procedure codes should be left justified. Diagnosis codes with fewer than five digits
should be padded with spaces (not zeros) on the right. Procedure codes with fewer than four digits should be padded with spaces (not zeros) on the right.
The PSI software programs assume accurate and specific coding of ICD codes. If an ICD code is
specified using 5 digits, the software recognizes only 5-digit versions of that code and not truncated versions at 3 or 4 digits. Similarly, if an ICD code is specified using 4 digits, the software recognizes only 4-digit versions of that code and not truncated versions at 3 digits. For example, 4281 is the ICD-9-CM diagnosis code for left heart failure. If your data are coded less specifically (i.e., 428 is used to designate "heart failure"), these less specific codes are not recognized by the software and will result in undercounting cases.
• Diagnosis-Related Groups (DRGs) and Major Diagnostic Categories (MDCs) are those derived from
the Centers for Medicare & Medicaid Services (previously Health Care Financing Administration) Medicare grouper. The software expects that you will be using the DRG and MDC effective on the discharge date. The software now refers to data elements DRG and MDC. Your data should be coded accordingly. .
Version 2.1, Revision 2 of the software accounts for ICD-9-CM, DRG and MDC coding effective
through FY 2004 (or through September 30, 2004).
Use of External Cause of Injury Codes External cause of injury codes - E-codes – are used to classify environmental events, circumstances, and conditions as the cause of injury, poisoning, or other adverse events. The use of E-codes is not always required by a state uniform billing committee or a state data organization. Users should be knowledgeable of the E-code requirements and practices of hospitals represented in the input data file. Several of the indicators use E-codes in their numerator or denominator definitions. See the “Guide to the Patient Safety Indicators” (http://www.qualityindicators.ahrq.gov/psi_download.htm) for additional information.
Version 2.1 10 Revision 2 (PSI, SAS, October 22, 2004)
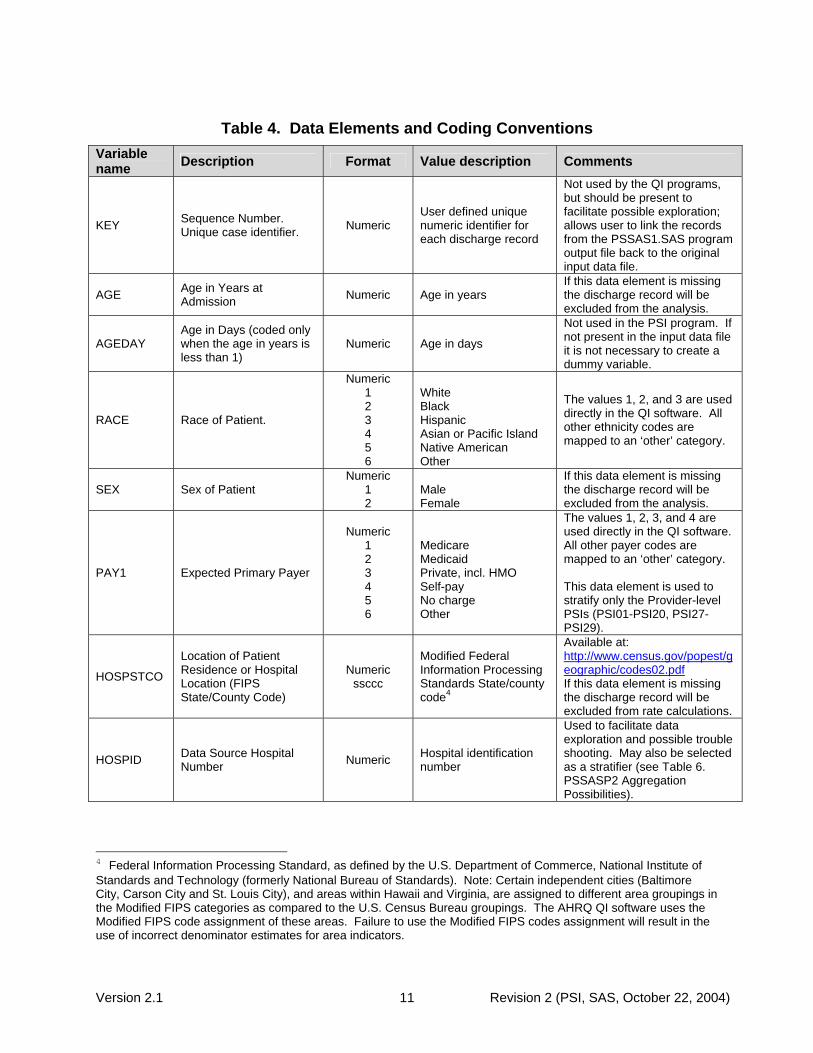
Table 4. Data Elements and Coding Conventions Variable name Description Format Value description Comments
KEY Sequence Number. Unique case identifier. Numeric
User defined unique numeric identifier for each discharge record
Not used by the QI programs, but should be present to facilitate possible exploration; allows user to link the records from the PSSAS1.SAS program output file back to the original input data file.
AGE Age in Years at Admission Numeric Age in years
If this data element is missing the discharge record will be excluded from the analysis.
AGEDAY Age in Days (coded only when the age in years is less than 1)
Numeric Age in days
Not used in the PSI program. If not present in the input data file it is not necessary to create a dummy variable.
RACE Race of Patient.
Numeric 1 2 3 4 5 6
White Black Hispanic Asian or Pacific Island Native American Other
The values 1, 2, and 3 are used directly in the QI software. All other ethnicity codes are mapped to an ‘other’ category.
SEX Sex of Patient Numeric
1 2
Male Female
If this data element is missing the discharge record will be excluded from the analysis.
PAY1 Expected Primary Payer
Numeric 1 2 3 4 5 6
Medicare Medicaid Private, incl. HMO Self-pay No charge Other
The values 1, 2, 3, and 4 are used directly in the QI software. All other payer codes are mapped to an ‘other’ category. This data element is used to stratify only the Provider-level PSIs (PSI01-PSI20, PSI27-PSI29).
HOSPSTCO
Location of Patient Residence or Hospital Location (FIPS State/County Code)
Numeric ssccc
Modified Federal Information Processing Standards State/county code4
Available at: http://www.census.gov/popest/geographic/codes02.pdf If this data element is missing the discharge record will be excluded from rate calculations.
HOSPID Data Source Hospital Number Numeric Hospital identification
number
Used to facilitate data exploration and possible trouble shooting. May also be selected as a stratifier (see Table 6. PSSASP2 Aggregation Possibilities).
4 Federal Information Processing Standard, as defined by the U.S. Department of Commerce, National Institute of Standards and Technology (formerly National Bureau of Standards). Note: Certain independent cities (Baltimore City, Carson City and St. Louis City), and areas within Hawaii and Virginia, are assigned to different area groupings in the Modified FIPS categories as compared to the U.S. Census Bureau groupings. The AHRQ QI software uses the Modified FIPS code assignment of these areas. Failure to use the Modified FIPS codes assignment will result in the use of incorrect denominator estimates for area indicators.
Version 2.1 11 Revision 2 (PSI, SAS, October 22, 2004)

Variable name Description Format Value description Comments
DISP Disposition of Patient
Numeric 1 2 3 4 5 6 7
20
Routine Short-term hospital Skilled nursing facility Intermediate care Another type of facility Home health care Against medical advice Died in the hospital
The values 2 and 20 are referenced by the QI code (to identify transfers to another short-term hospital and patients who died in the hospital).
ATYPE Admission Type
Numeric 1 2 3 4 5 6
Emergency Urgent Elective Newborn Delivery Other
The values 3 and 4 are referenced by the PSI code (to identify elective surgeries and newborn admissions). PSIs 10, 11, 13, and 17 will be affected if ATYPE values are missing.
ASOURCE Admission Source
Numeric 1 2 3 4 5
ER Another hospital Another facility incl LTC Court/law enforcement Routine/birth/other
The values 2 and 3 are referenced by the PSI code (to identify transfers from another hospital or facility)
LOS Length of Stay Numeric Number of days from admission to discharge
APR_DRG APR_DRG Category Numeric APR-DRG from 3M software
Not used by the PSI program. If not present in the input data file it is not necessary to create a dummy variable.
SEVERTY APR_DRG Severity Score Numeric APR-DRG Severity
Score from 3M software
Not used by the PSI program. If not present in the input data file it is not necessary to create a dummy variable.
RISKMORT APR_DRG Mortality Score Numeric
APR-DRG Risk of Mortality Score from 3M software
Not used by the PSI program. If not present in the input data file it is not necessary to create a dummy variable.
DRG Diagnosis Related Group Numeric DRG from federal (CMS) Grouper
MDC Major Diagnostic Category Numeric MDC from federal
(CMS) grouper
DX1 – DX30
ICD-9-CM Diagnosis Codes. DX1 is the principal diagnosis. DX2-DX30 are secondary diagnoses. Note: If e-codes are separated from secondary diagnoses in the input data file, the variable should be renamed and included as a secondary diagnosis variable (e.g., e-codes would be labeled as DX10 in a data file where the last secondary DX field is DX9).
String, 5 character
Diagnosis codes
Users must specify the number of diagnoses in the parameter &NDX in the CONTROL_PSI.SAS program to reflect the number of diagnoses.
Version 2.1 12 Revision 2 (PSI, SAS, October 22, 2004)
Variable name Description Format Value description Comments
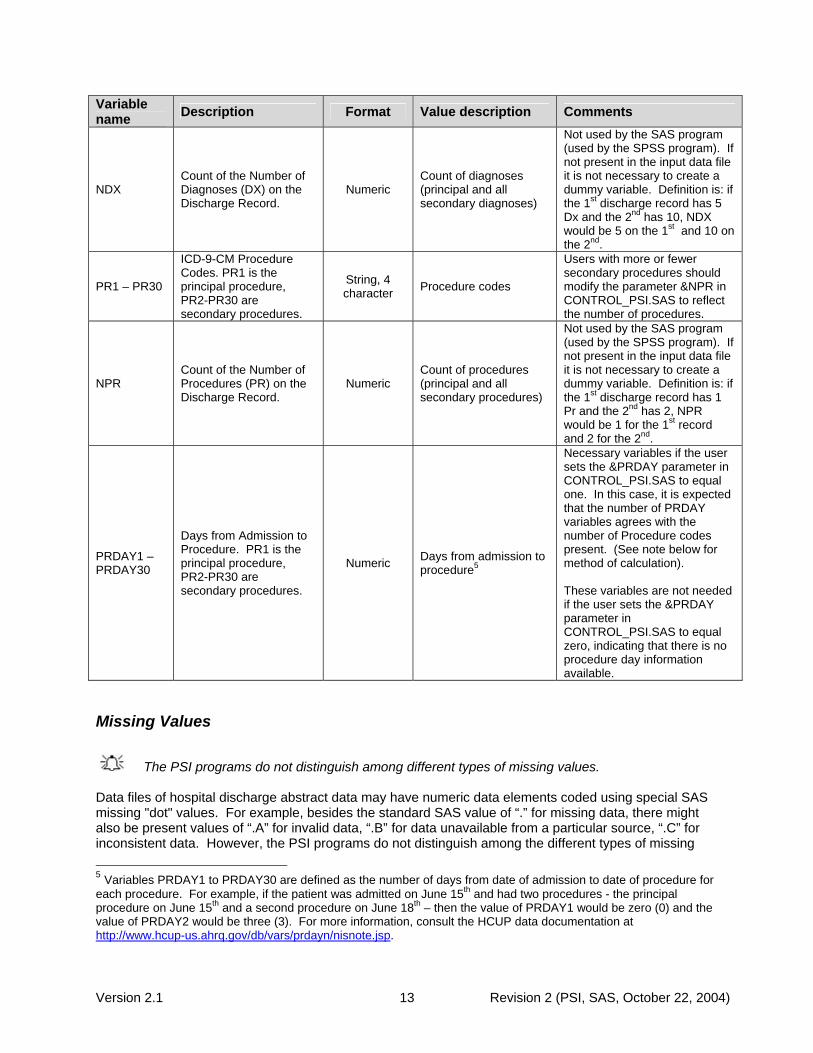
NDX Count of the Number of Diagnoses (DX) on the Discharge Record.
Numeric Count of diagnoses (principal and all secondary diagnoses)
Not used by the SAS program (used by the SPSS program). If not present in the input data file it is not necessary to create a dummy variable. Definition is: if the 1st discharge record has 5 Dx and the 2nd has 10, NDX would be 5 on the 1st and 10 on the 2nd.
PR1 – PR30
ICD-9-CM Procedure Codes. PR1 is the principal procedure, PR2-PR30 are secondary procedures.
String, 4 character Procedure codes
Users with more or fewer secondary procedures should modify the parameter &NPR in CONTROL_PSI.SAS to reflect the number of procedures.
NPR Count of the Number of Procedures (PR) on the Discharge Record.
Numeric Count of procedures (principal and all secondary procedures)
Not used by the SAS program (used by the SPSS program). If not present in the input data file it is not necessary to create a dummy variable. Definition is: if the 1st discharge record has 1 Pr and the 2nd has 2, NPR would be 1 for the 1st record and 2 for the 2nd.
PRDAY1 – PRDAY30
Days from Admission to Procedure. PR1 is the principal procedure, PR2-PR30 are secondary procedures.
Numeric Days from admission to procedure5
Necessary variables if the user sets the &PRDAY parameter in CONTROL_PSI.SAS to equal one. In this case, it is expected that the number of PRDAY variables agrees with the number of Procedure codes present. (See note below for method of calculation). These variables are not needed if the user sets the &PRDAY parameter in CONTROL_PSI.SAS to equal zero, indicating that there is no procedure day information available.
Missing Values The PSI programs do not distinguish among different types of missing values. Data files of hospital discharge abstract data may have numeric data elements coded using special SAS missing "dot" values. For example, besides the standard SAS value of “.” for missing data, there might also be present values of “.A” for invalid data, “.B” for data unavailable from a particular source, “.C” for inconsistent data. However, the PSI programs do not distinguish among the different types of missing 5 Variables PRDAY1 to PRDAY30 are defined as the number of days from date of admission to date of procedure for each procedure. For example, if the patient was admitted on June 15th and had two procedures - the principal procedure on June 15th and a second procedure on June 18th – then the value of PRDAY1 would be zero (0) and the value of PRDAY2 would be three (3). For more information, consult the HCUP data documentation at http://www.hcup-us.ahrq.gov/db/vars/prdayn/nisnote.jsp.
Version 2.1 13 Revision 2 (PSI, SAS, October 22, 2004)

codes. Therefore, all types of missing values in the input data to the PSI module can be represented by a single value - missing data (.) for numeric variables and blank (' ') for alphanumeric (or character) variables.
Treatment of Missing Data The software is designed to handle missing data in a particular manner; specifically the software requires confirmation for the assignment of a poor outcome or negative event. For instance, in order to be assigned as a death, each case must actually be coded as a death. Missing data is considered neutral. Missing data for some elements results in the exclusion of that case from the denominator. For a few other elements, the case is retained. Table 5 lists the impact of missing data for each data element.
Table 5. Treatment of Missing Data Elements Variable Label D N E S Treatment of Missing Data AGE Age In Years At Admission X X X X Case excluded from all analysis (e.g., dropped
from the denominator of the discharge based indicators and from numerator of all population based measures).
ASOURCE Admission Source X Case excluded from denominator where used in specification (e.g., PSI 3).
ATYPE Admission Type X Case excluded from denominator where used in specification (e.g., PSI 10).
DISP Disposition Status X X Case excluded from denominator where used in specification (e.g., PSI 4).
DRG Diagnosis Related Group (CMS DRG) in Effect on Discharge Date
X X X Case excluded from denominator (e.g., PSI 1) and from numerator (e.g., PSI 21) where used in specification.
LOS Length of Stay X X Case excluded from denominator where used in specification (e.g., PSI 3).
SEX Patient Gender X X X Case excluded from all analysis (e.g., dropped from the denominator of the discharge based indicators and from numerator of all population based measures).
HOSPSTCO Location of Patient Residence or Hospital Location Modified FIPS State/County Code
X Dropped from denominator in rate calculations (stratified by county or MSA), case will appear in calculation of the overall rate.
MDC Major Diagnostic Category (CMS MDC) In Effect On Discharge Date
X X Case excluded from denominator (e.g., PSI 3) and from numerator (e.g., PSI 22) where used in specification.
RACE Race X Classified As “Other.” D – Denominator; N – Numerator; E – Exclusion; S – Stratification
Version 2.1 14 Revision 2 (PSI, SAS, October 22, 2004)

User Options The PSI software reflects the development and implementation of the software with discharge data available to AHRQ through the HCUP program. Our goal was to develop the tools, illustrate their use, and then encourage others to adopt and use the tools for their own applications. As a result, users are encouraged to consider how AHRQ may modify the PSI software to better serve their measurement needs and interests.
Modifications to the definitions of outcomes of interest (numerators) or populations at risk (denominators) are possible but not desirable. Maintaining consistent definitions is important. Once definitions are altered, the ability to make comparisons of PSIs based on original definitions is lost. Users are encouraged to identify ways to improve the PSI methodology and to share their suggestions with AHRQ for future updates.
AHRQ provides public access to HCUPnet - an interactive tool for identifying, tracking, analyzing, and comparing statistics on hospital care. HCUPnet queries generate statistics in a table format using data from the Nationwide Inpatient Sample (NIS) and State Inpatient Databases (SID) for those States that have agreed to participate. HCUPnet includes statistics based on the AHRQ Quality Indicators (QIs) which have been applied to the HCUP NIS. If users change definitions of the PSIs, it will not be possible to compare users’ results to the national estimates in HCUPnet. HCUPnet may be accessed through the HCUP web site at http://hcup.ahrq.gov/HCUPnet.asp.
Version 2.1 15 Revision 2 (PSI, SAS, October 22, 2004)
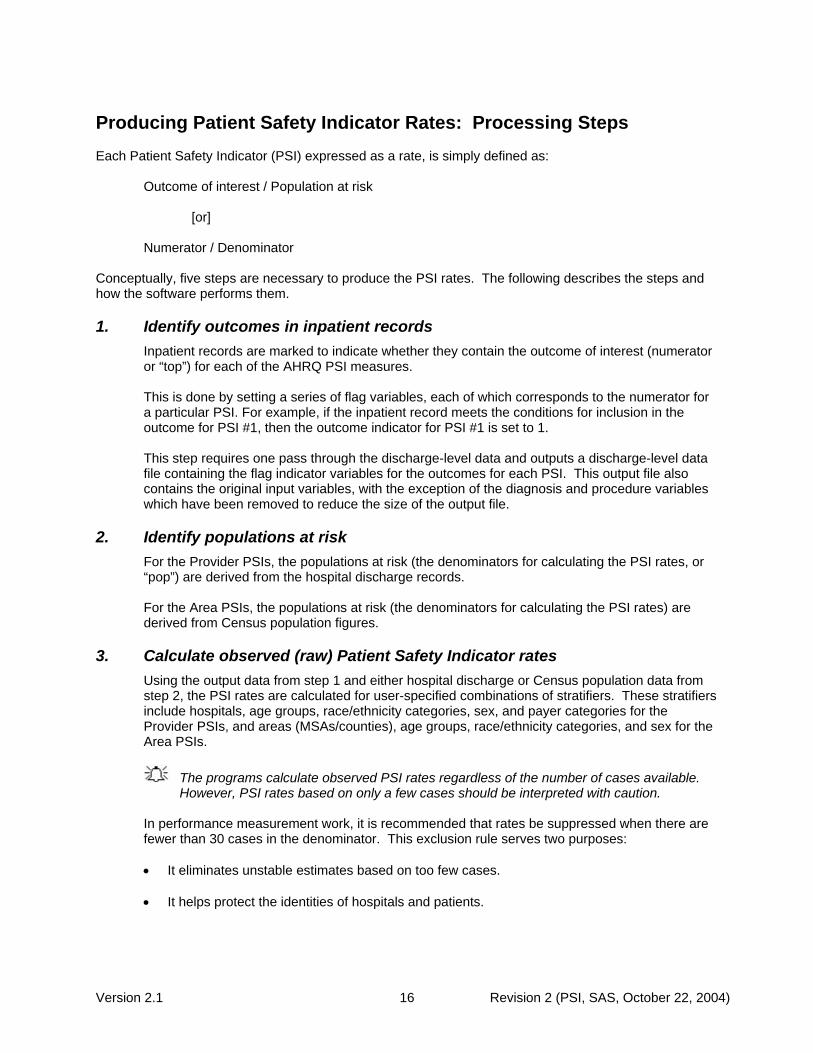
Producing Patient Safety Indicator Rates: Processing Steps Each Patient Safety Indicator (PSI) expressed as a rate, is simply defined as:
Outcome of interest / Population at risk
[or] Numerator / Denominator
Conceptually, five steps are necessary to produce the PSI rates. The following describes the steps and how the software performs them.
1. Identify outcomes in inpatient records Inpatient records are marked to indicate whether they contain the outcome of interest (numerator or “top”) for each of the AHRQ PSI measures.
This is done by setting a series of flag variables, each of which corresponds to the numerator for a particular PSI. For example, if the inpatient record meets the conditions for inclusion in the outcome for PSI #1, then the outcome indicator for PSI #1 is set to 1.
This step requires one pass through the discharge-level data and outputs a discharge-level data file containing the flag indicator variables for the outcomes for each PSI. This output file also contains the original input variables, with the exception of the diagnosis and procedure variables which have been removed to reduce the size of the output file.
2. Identify populations at risk For the Provider PSIs, the populations at risk (the denominators for calculating the PSI rates, or “pop”) are derived from the hospital discharge records.
For the Area PSIs, the populations at risk (the denominators for calculating the PSI rates) are derived from Census population figures.
3. Calculate observed (raw) Patient Safety Indicator rates Using the output data from step 1 and either hospital discharge or Census population data from step 2, the PSI rates are calculated for user-specified combinations of stratifiers. These stratifiers include hospitals, age groups, race/ethnicity categories, sex, and payer categories for the Provider PSIs, and areas (MSAs/counties), age groups, race/ethnicity categories, and sex for the Area PSIs.
The programs calculate observed PSI rates regardless of the number of cases available.
However, PSI rates based on only a few cases should be interpreted with caution.
In performance measurement work, it is recommended that rates be suppressed when there are fewer than 30 cases in the denominator. This exclusion rule serves two purposes: • It eliminates unstable estimates based on too few cases. • It helps protect the identities of hospitals and patients.
Version 2.1 16 Revision 2 (PSI, SAS, October 22, 2004)
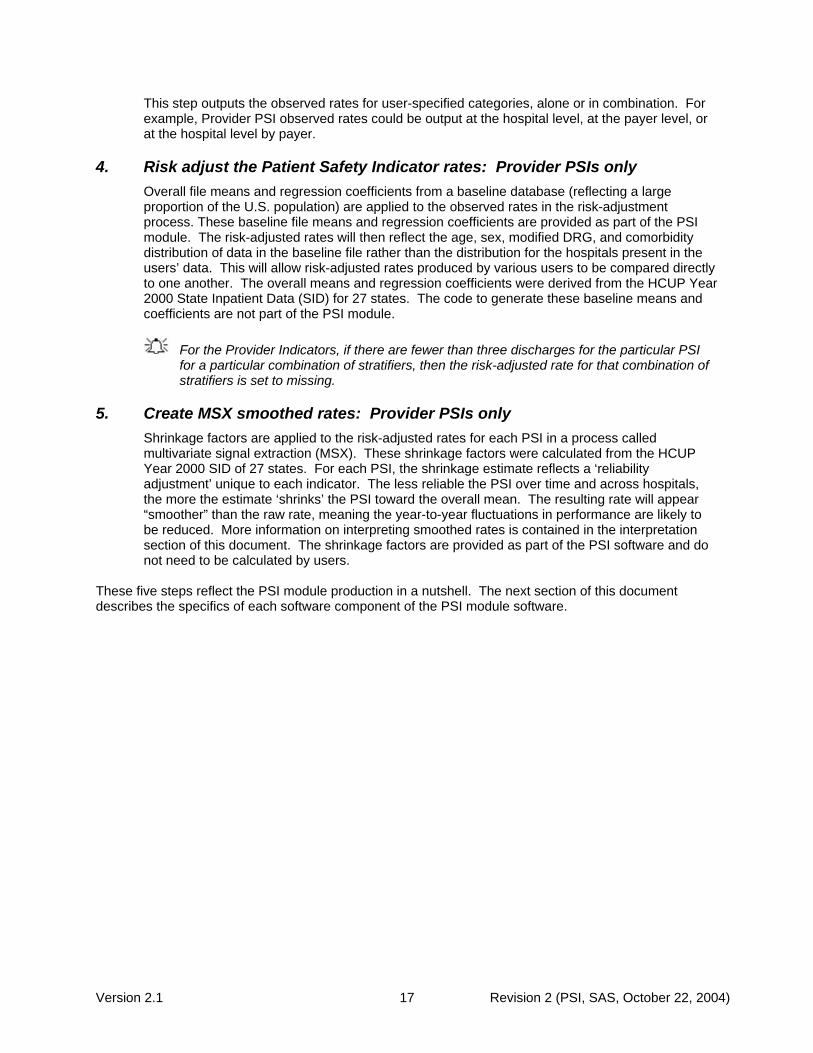
This step outputs the observed rates for user-specified categories, alone or in combination. For example, Provider PSI observed rates could be output at the hospital level, at the payer level, or at the hospital level by payer.
4. Risk adjust the Patient Safety Indicator rates: Provider PSIs only Overall file means and regression coefficients from a baseline database (reflecting a large proportion of the U.S. population) are applied to the observed rates in the risk-adjustment process. These baseline file means and regression coefficients are provided as part of the PSI module. The risk-adjusted rates will then reflect the age, sex, modified DRG, and comorbidity distribution of data in the baseline file rather than the distribution for the hospitals present in the users’ data. This will allow risk-adjusted rates produced by various users to be compared directly to one another. The overall means and regression coefficients were derived from the HCUP Year 2000 State Inpatient Data (SID) for 27 states. The code to generate these baseline means and coefficients are not part of the PSI module.
For the Provider Indicators, if there are fewer than three discharges for the particular PSI
for a particular combination of stratifiers, then the risk-adjusted rate for that combination of stratifiers is set to missing.
5. Create MSX smoothed rates: Provider PSIs only Shrinkage factors are applied to the risk-adjusted rates for each PSI in a process called multivariate signal extraction (MSX). These shrinkage factors were calculated from the HCUP Year 2000 SID of 27 states. For each PSI, the shrinkage estimate reflects a ‘reliability adjustment’ unique to each indicator. The less reliable the PSI over time and across hospitals, the more the estimate ‘shrinks’ the PSI toward the overall mean. The resulting rate will appear “smoother” than the raw rate, meaning the year-to-year fluctuations in performance are likely to be reduced. More information on interpreting smoothed rates is contained in the interpretation section of this document. The shrinkage factors are provided as part of the PSI software and do not need to be calculated by users.
These five steps reflect the PSI module production in a nutshell. The next section of this document describes the specifics of each software component of the PSI module software.
Version 2.1 17 Revision 2 (PSI, SAS, October 22, 2004)

Program Descriptions This section describes the six SAS programs that assign, calculate, and print the Patient Safety Indicators. For each program there is a description, a list of input and output files, and an explanation of changes to the program that may be required. The flow of data through the PSI module programs is shown in the flowcharts in Figure 1 and Figure 2 that begin on page 3. If you desire to create and examine observed PSI rates, then the PSFMTS, CONTROL, and the PSSAS1 programs will need to be used, followed by PSSASP2 (for Provider observed rates) and/or PSSASA2 (for Area observed rates). If you also wish to create Hospital risk-adjusted and smoothed PSI rates, then you will also need to run the PSSASP3 program. Risk-adjusted and smoothed rates are not calculated for the Area PSIs.
Program 1: Modify Statements in the CONTROL_PSI.SAS code The CONTROL_PSI.SAS code contains all of the SAS statements that you need to modify in order to run the remaining PSI module programs (with one exception noted below). This is where you specify, for example, the path names or locations of all your input and output data sets. There is also a TITLE line that the user can fill in. The items that need to be changed in order to run the PSSAS1, PSSASP2, PSSASP3, and PSSASA2 programs are described below under each program.
The CONTROL_PSI.SAS code is automatically inserted into the remaining programs when they are executed. You do not need to run CONTROL_PSI.SAS as a separate program.
All of the changes needed for the CONTROL_PSI.SAS code are listed in the following
descriptions for programs 2 – 6. Each program description contains a section labeled “Changes:” that enumerates the modifications for CONTROL_PSI.SAS that are associated with that particular program.
Lines of code to be modified are identified by the phrase “<===USER MUST modify” which
means the user must make the change or by “<===USER MAY modify” which means the modification is optional.
In all of the remaining programs included with the PSI module, there is one line of code near the beginning of each program that needs to be modified. This line of code starts with the phrase "FILENAME CONTROL". You must modify this line to point to the path name where you stored your modified copy of the CONTROL_PSI.SAS file. CONTROL_PSI.SAS has a collection of parameters that allow you to read in data from and write out data to different locations or pathnames. For example, “LIBNAME1 IN1” points to the location of your input data set for program PSSAS1 and “LIBNAME OUT1” points to the location of the output data set created by the PSSAS1 program. The parameters allow these locations to be different from one another. However, if you wish to read in and write out all of the data to the same location, it is easiest to just make a global change in CONTROL_PSI.SAS changing “C:\pathname” to the single directory location that you wish to use. There is a global PRINT parameter in CONTROL_PSI.SAS that as a default prints all of the output summary records at the end of the PSSASP2, PSSASP3, and PSSASA2 programs. These printouts may be quite large if you have a large database with a large number of hospitals and if you choose the results to be finely stratified. If you wish to turn these prints off, set PRINT to have a value of zero in CONTROL_PSI.SAS.
Version 2.1 18 Revision 2 (PSI, SAS, October 22, 2004)

The global MSALEVL parameter in CONTROL.PSI.SAS by default instructs all programs to
define geographic areas by county for all areas in the input datasets. To define urban areas by Metropolitan Statistical Area (MSA) rather than by county, change the MSALEVL parameter from 0 to 1.
Program 2: Run PSFMTS The PSFMTS program defines a format library, which contains the diagnosis and procedure screens necessary for assigning the outcomes of interest. This format library is used by most of the succeeding programs. The first few formats in this program are for the stratifiers (age, sex, race/ethnicity, payer). These are followed by formats that are used for the identification of outcomes of interest in the PSSAS1.SAS program, and by formats that map FIPS county codes to metropolitan statistical areas (MSAs) in the PSSAS1 and PSSASA2 programs. At the end of the program are formats used to assign age, modified DRG and comorbidity categories for the risk adjustment process implemented in PSSASP3. The MSA definitions are from June 30, 1999 according to the federal Office of Management and Budget (OMB) circular 99-04 (Last Revised May 6, 2002). The mapping is from county to MSA, except in New England where counties are assigned to NECMAs (New England County Metropolitan Area). OMB defines NECMAs as a county-based alternative to the city- and town-based New England MSAs and CMSAs (Consolidated MSAs). For example, Hampden and Hampshire counties in Western Massachusetts are assigned to the Springfield MA NECMA, even though Holland town in Hampden County is part of the Boston MSA. The PSI module Version 2.1, Revision 2 contains formats that incorporate ICD-9-CM and DRG coding through September 30, 2004. Input: None. Output: Permanent SAS format library (FMTLIB). Changes:
1. You must modify the “FILENAME CONTROL” statement at the beginning of the program to change the path so that it points to your location of the CONTROL_PSI.SAS code.
2. In CONTROL_PSI.SAS, specify the location (path) of the format library in the “LIBNAME
LIBRARY” statement.
Program 3: Run PSSAS1 The PSSAS1 program processes hospital discharge abstract data, sets comorbidity indicators, and flags inpatient records if they contain outcomes of interest. Outcome indicator names have prefix of “T” (Top). Stratifier variables are constructed at the beginning of the program. This program assumes that the input data file (consisting of inpatient discharge abstract data) conforms to specific variable names, attributes, and coding conventions. See Table 4 on page 11 for variable names and attributes for the input data file. Partial definitions of the Patient Safety Indicators are given in Table 1 on page 5. This table is presented to assist those individuals who desire to examine the software source code statements. Complete definitions of the indicators are given in Appendix A of the “Guide to Patient Safety Indicators” (http://www.qualityindicators.ahrq.gov/psi_download.htm).
Version 2.1 19 Revision 2 (PSI, SAS, October 22, 2004)

The AHRQ Comorbidity Analysis Program (comoanaly.sas), available at http://www.hcup-us.ahrq.gov/toolssoftware/comorbidity/comorbidity.jsp has been included as part of program PSSASS1. This code adds the comorbidity indicators to each discharge record. The user does not need to access the AHRQ Comorbidity Analysis Program. The AHRQ Comorbidity Format Program is part of the PSI module. Instead, the appropriate formats (modified for used with the PSI) are included in the PSFMTS program. Input:
1. User supplied SAS inpatient data set consisting of administrative hospital discharge abstract data. This data set is a discharge level file with an array of diagnosis and procedure codes, among other data elements.
2. SAS format library (FMTLIB) created from the PSFMT program.
Output:
1. SAS dataset containing inpatient records with input variables, stratifiers, comorbidity variables, and flag indicators (TPPSxx and TAPSxx) for the outcomes of interest that will later form the numerators for the PSI rates.
2. PROC MEANS (with N, NMISS, MIN, MAX, MEAN, and SUM) of all of the numeric variables
in the output data file and a PROC CONTENTS of the output data file are output to hardcopy.
3. A PROC PRINT of the first 24 observations in the output data file is output to hardcopy. Changes:
1. The “FILENAME CONTROL” statement at the beginning of the program must be changed to reflect the location of the CONTROL_PSI.SAS code.
2. In CONTROL_PSI.SAS, specify the locations (paths) of the input and output files in the
“LIBNAME IN1” and “LIBNAME OUT1” statements.
3. In CONTROL_PSI.SAS, specify the names of the input and output files in the “INFILE1” and “OUTFILE1” statements.
The PSI module assumes that your starting SAS data set contains 30 diagnoses and 30
procedures. If these numbers are different in your input inpatient data, then modify the NDX and NPR parameters in CONTROL_PSI.SAS.
If your variables are named differently from those used in the PSI software (see Table 4 on page
11), you MUST either rename those variables prior to running this program or modify PSSAS1 to include the renaming of your variables to match those expected by the software. Similarly, if your variables are not the same type, i.e., character or numeric, as those expected by the software (see Table 4), you MUST modify your variables prior to running this program.
Program 4: Run PSSASP2 The PSSASP2 program calculates the observed or raw rates for the Provider-level Patient Safety Indicators, using the data derived in a previous step (PSSAS1). These observed rates are stratified by combinations of hospitals, sex, age, race, and payer categories. The program first totals the indicator flags created by the PSSAS1 program and then for each of the desired stratifiers divides these totals by the hospital discharges in the universe for the indicator. The population denominators are stored in variables with names that have a prefix of “P” (Pop). The Observed rates are stored in variables that have a prefix of “O”.
Version 2.1 20 Revision 2 (PSI, SAS, October 22, 2004)

Input:
1. The SAS dataset that was created in the PSSAS1. This is a discharge-level file that contains inpatient records with input variables, stratifiers, and the 23 new flag indicators for the PSI Hospital outcomes of interest.
2. SAS format library (FMTLIB) created from the PSFMT program.
Output:
1. SAS dataset with summary records that contain observed rates (OPPSxx variables where xx refers to the indicator number), the counts of outcomes that formed the numerators of the rates (TPPSxx variables), and the hospital discharge totals that formed the denominators of the observed rates (PPPSxx variables). The output file has records summarized to the various combinations of stratifiers specified in the TYPELVLP parameter that is described in item 4 in “Changes” below.
2. An optional ASCII (comma delimited) text file that the user can then import into a
spreadsheet. This text file contains the same information as the SAS output dataset. The text file will contain the OPPSxx observed rates, the TPPSxx counts of outcomes that formed the numerators of the rates, and the PPPSxx counts of outcomes that formed the denominators of the rates. The different records/rows in the text file will correspond to the different TYPELVLP stratification combinations
3. A PROC MEANS (with N, NMISS, MIN, MAX, MEAN, and SUM) of the hospital-level
summary records that shows statistics for the OPPSxx observed rates, the TPPSxx counts of outcomes that formed the numerators of the rates, and the PPPSxx counts of outcomes that formed the denominators of the rates. These means will only be generated if the user included a value of 16 for the TYPELVLP parameter discussed in item 4 in the “Changes” section below.
4. A PROC CONTENTS of the output SAS summary dataset is output to hardcopy.
5. A PROC PRINT of the output summary dataset is provided at the end of the hardcopy
printout. This printout may be quite large depending on the number and the types of stratifications that the user requests with the TYPELVLP parameter discussed in item Error! Reference source not found. in the “Changes” section below. If the user does not wish to generate this printout, then the global “PRINT” parameter in CONTROL_PSI.SAS code should be set to zero.
Changes:
1. The “FILENAME CONTROL” statement at the beginning of the program must be changed to reflect the location of the CONTROL_PSI.SAS code.
2. In CONTROL_PSI.SAS, specify the locations (paths) of the input and output SAS files in the
“LIBNAME INP2” and “LIBNAME OUTP2” statements.
3. In CONTROL_PSI.SAS, specify the names of the input and output files in the “INFILEP2” and “OUTFILP2” statements. The name that you specify with INFILEP2 should be for the file that you created using the PSSAS1 program.
4. In CONTROL_PSI.SAS, specify the levels of aggregation for the observed rates. This is
done by specifying numbers between 0 and 31 in the “%LET TYPELVLP =” statement. Each number from 0 to 31 corresponds to a different level or combination of levels as show in Table 6. The default values of 0 and 16 will provide an overall total and provider-level totals.
Version 2.1 21 Revision 2 (PSI, SAS, October 22, 2004)

If TYPELVLP includes the value 0, then the first observation in the output summary datafile will contain the overall totals and observed rates for the entire database created with the PSSAS1 program.
Table 6. PSSASP2 Aggregation Possibilities TYPELVLP Stratification
0 Overall 1 Race 2 Payer 3 Payer ∗ Race 4 Sex 5 Sex ∗ Race 6 Sex ∗ Payer 7 Sex ∗ Payer ∗ Race 8 Age 9 Age Race
10 Age ∗ Payer 11 Age ∗ Payer ∗ Race 12 Age ∗ Sex 13 Age ∗ Sex ∗ Race 14 Age ∗ Sex ∗ Payer 15 Age ∗ Sex ∗ Payer ∗ Race 16 Provider 17 Provider ∗ Race 18 Provider ∗ Payer 19 Provider ∗ Payer ∗ Race 20 Provider ∗ Sex 21 Provider ∗ Sex ∗ Race 22 Provider ∗ Sex ∗ Payer 23 Provider ∗ Sex ∗ Payer ∗ Race 24 Provider ∗ Age 25 Provider ∗ Age ∗ Race 26 Provider ∗ Age ∗ Payer 27 Provider ∗ Age ∗ Payer ∗ Race 28 Provider ∗ Age ∗ Sex 29 Provider ∗ Age ∗ Sex ∗ Race 30 Provider ∗ Age ∗ Sex ∗ Payer 31 Provider ∗ Age ∗ Sex ∗ Payer ∗ Race
0 and 16 TYPELVLP (overall and provider) are default values for the level of computation in the software.
For example, if you are using a state inpatient hospital database, you might specify the following TYPELVLP values: 0 – provides overall rates for your entire state 8 – provides overall rates for your state, broken down by age groups 16 – provides rates for providers within your state 24 – provides rates for age groups within these providers
Version 2.1 22 Revision 2 (PSI, SAS, October 22, 2004)

5. In CONTROL_PSI.SAS, if you wish to create an ASCII (comma delimited) text file that you can import into a spreadsheet, then set the TEXTP2 parameter to 1. Otherwise, the default value of zero for TEXTP2 will skip around the code that would generate this file.
6. In CONTROL_PSI.SAS, if you wish to create an ASCII (comma delimited) text file that you can import
into a spreadsheet, then specify the path (including the file name) for this ASCII text file in the "FILENAME PSTEXTP2” statement.
Program 5: Run PSSASP3 The PSSASP3 program calculates age, sex, modified DRG and comorbidity risk-adjusted rates for each PSI and then calculates smoothed rates.
If you are interested in calculating confidence intervals for each PSI, you may request a supplementary module (PSSASP3CI.SAS) to calculate a 95% CI for each PSI and hospital (see the Interpreting the Results, Confidence Intervals section for additional information). You would run this program in place of PSSASP3. The user needs to run only PSSASP3 or PSSASP3CI, it is not necessary to run both these programs.
When there are fewer than three discharges within a stratification cell, the risk-adjusted rates are
set to missing. The smoothed rates that are based on these risk-adjusted rates are also set to missing.
The output file has records summarized to the various combinations of stratifiers that were specified in the TYPELVLP parameter of the preceding QISASP2 program. See Table 6 on page 22. Input:
1. SAS format library (FMTLIB) created from the PSFMT program. 2. The discharge-level file that was created with the PSSAS1 program.
3. The SAS dataset with summary records that was created with the PSSASP2 program. 4. A text file (COVPSP00.TXT) containing regression coefficients from a regression that was run
on a reference SID dataset. These coefficients will be used in the risk adjustment process. This file is provided to you as part of the PSI module. The text file does not need to be converted to a SAS file for use with the software.
5. A text file (MSXPSP00.TXT) containing three arrays for use in the smoothing process. The
arrays contain noise estimates, signal estimates, and mean rates for each PSI. This file is provided to you as part of the PSI module. The text file does not need to be converted to a SAS file for use with the software.
Output:
1. A SAS dataset with an overall summary record and with hospital-level summary records that contain the three types of indicator rates, along with the components of the initial raw rates. Specifically, the file contains the observed rates (OPPSxx variables), the risk-adjusted rates (RPPSxx variables), the smoothed rates (SPPSxx variables), the counts of outcomes that formed the numerators of the observed rates (TPPSxx variables), and the hospital discharge totals that formed the denominators of the observed rates (PPPSxx variables).
2. An optional ASCII (comma delimited) text file that the user can then import into a
spreadsheet. This text file contains the same information as the SAS output dataset. The text file will contain the OPPSxx observed rates and their TPPSxx and PPPSxx numerator
Version 2.1 23 Revision 2 (PSI, SAS, October 22, 2004)

and denominator components, the RPPSxx risk-adjusted rates, and the SPPSxx smoothed rates. Each record or row in the text file will correspond to a specification group.
3. A PROC MEANS (with N, NMISS, MIN, MAX, MEAN, and SUM) of the hospital-level
summary records that shows statistics for the observed, risk-adjusted and smoothed rates, and statistics for the counts of outcomes that formed the numerators and denominators of the observed rates. These means will only be generated if the user included a value of 16 for the TYPELVLP parameter of the preceding QISASP2 program. See Table 6 on page 22.
4. A PROC CONTENTS of the output SAS summary dataset is output to hardcopy.
5. A PROC PRINT of the output summary dataset is provided at the end of the hardcopy
printout. This printout may be quite large depending on the number and the types of stratifications that the user requested with the TYPELVLP parameter of the preceding PSSASP2 program. See Table 6 on page 22. If the user does not wish to generate this printout, then the global “PRINT” parameter in CONTROL_PSI.SAS code should be set to zero.
Changes:
1. The “FILENAME CONTROL” statement at the beginning of the program must be changed to reflect the location of the CONTROL_PSI.SAS code.
2. In CONTROL_PSI.SAS, specify the locations (paths) of the input and output SAS files in the
“LIBNAME INP3” and “LIBNAME OUTP3” statements.
3. In CONTROL_PSI.SAS, specify in the “INFILP3X” statement the name of the discharge-level file that you created with the PSSAS1 program.
4. In CONTROL_PSI.SAS, specify in the "FILENAME COVARP" statement the path (including
the file name) for the ASCII text file that contains regression coefficients from a regression that was run on the reference SID dataset. This file is provided as part of the PSI module. The name of the file is COVARP00.TXT.
5. In CONTROL_PSI.SAS, specify in the "FILENAME MSXP" statement the path (including the
file name) for the ASCII text file that contains the estimates to smooth the indicator rates. This file is provided as part of the PSI module. The name of the file is MSX00.TXT.
6. In CONTROL_PSI.SAS, specify in the “INFILP3Y” statement the name of the summary file
that you created with the PSSASA2 program.
7. In CONTROL_PSI.SAS, specify in the “OUTFILP3” statement the name that you wish the output file to have.
8. In CONTROL_PSI.SAS, if you wish to create an ASCII (comma delimited) text file that you
can import into a spreadsheet, then set the TEXTP3 parameter to 1. Otherwise, the default value of zero for TEXTP3 will skip around the code that would generate this file.
9. In CONTROL_PSI.SAS, if you wish to create an ASCII (comma delimited) text file that you
can import into a spreadsheet, then specify the path (including the file name) for this ASCII text file in the "FILENAME PSTEXTP3” statement.
Version 2.1 24 Revision 2 (PSI, SAS, October 22, 2004)

Program 6: Run PSSASA2 The PSSASA2 program calculates the observed or raw rates for the area-level Patient Safety Indicators, using the data derived in a previous step (PSSAS1). These observed rates are stratified by combinations of area, sex, age, and race categories. The program first totals the six area indicator flags created by the PSSAS1 program, and then for each of the desired stratifiers divides these totals by the pertinent residential population. The population denominators are stored in variables with names that have a prefix of “P” (Pop). The Observed rates are stored in variables that have a prefix of “O”. Input:
1. The SAS dataset that was created in the PSSAS1. This is a discharge-level file that contains inpatient records with input variables, stratifiers, and the six new flag indicators for the PSI Area outcomes of interest.
2. A text file with Census area residential populations stratified by area, age, sex, and ethnicity
categories. Five such files are currently provided along with the PSI module software. The files are QICTY97, QICTY98, QICTY99, QICTY00, QICTY01 and QICTY02. The user should select the file for the year that best matches the user’s discharge datafile.
Users do not need to convert the ASCII text file to a SAS dataset for use with the
software.
3. SAS format library (FMTLIB) created from the PSFMT program. Output:
1. SAS dataset with summary records that contain observed rates (OAPSxx variables where xx refers to the indicator number), the counts of outcomes that formed the numerators of the rates (TAPSxx variables), and the residential population totals that formed the denominators of the observed rates (PAPSxx variables). The output file has records summarized to the various combinations of stratifiers specified in the TYPELVLA parameter that is described in item 5 in “Changes” below.
2. An optional ASCII (comma delimited) text file that the user can then import into a
spreadsheet. This text file contains the same information as the SAS output dataset. The text file will contain the OAPSxx observed rates, the TAPSxx counts of outcomes that formed the numerators of the rates, and the PAPSxx residential population totals. The different records/rows in the text file will correspond to the different TYPELVLA stratification combinations.
3. A PROC MEANS (with N, NMISS, MIN, MAX, MEAN, and SUM) of the area-level summary
records that shows statistics for the OAPSxx observed rates, the TAPSxx counts of outcomes that formed the numerators of the rates, and the PAPSxx residential populations totals. These means will only be generated if the user included a value of 8 for the TYPELVLA parameter discussed in item 5 in the “Changes” section below.
4. A PROC CONTENTS of the output SAS summary dataset is output to hardcopy.
5. A PROC PRINT of the output summary dataset is provided at the end of the hardcopy
printout. This printout may be quite large depending on the number and the types of stratifications that the user requests with the TYPELVLA parameter discussed in item 5 in the “Changes” section below. If the user does not wish to generate this printout, then the global “PRINT” parameter in CONTROL_PSI.SAS code should be set to zero.
Version 2.1 25 Revision 2 (PSI, SAS, October 22, 2004)

Changes: 1. The “FILENAME CONTROL” statement at the beginning of the program must be changed to
reflect the location of the CONTROL_PSI.SAS code. 2. In CONTROL_PSI.SAS, specify the locations (paths) of the input and output SAS files in the
“LIBNAME INA2” and “LIBNAME OUTA2” statements.
3. In CONTROL_PSI.SAS, specify the names of the input and output files in the “INFILEA2” and “OUTFILA2” statements. The name that you specify with INFILEA2 should be for the file that you created using the PSSAS1 program.
4. In CONTROL_PSI.SAS, specify the path (including the file name) for the ASCII population
text file in the "FILENAME POPFILA2" statement. The file name will be QICTY97.TXT, QICTY98.TXT, QICTY99.TXT, QICTY00.TXT, QICTY01.TXT, or QICTY02.TXT. These files are provided as part of the PSI module. The file used should be the one that is closest to the year associated with your particular data.
5. In CONTROL_PSI.SAS, specify the levels of aggregation for the observed rates. This is
done by specifying numbers between 0 and 15 in the “%LET TYPELVLA =” statement. Each number from 0 to 15 corresponds to a different level or combination of levels as show in Table 7. The default values of 0 and 8 will provide an overall total and area-level totals.
If TYPELVLA includes the value 0, then the first observation in the output summary
datafile will contain the overall totals and observed rates for the entire database created with the PSSAS1 program.
Table 7. PSSASA2 Aggregation Possibilities TYPELVLA Stratification
0 Overall 1 Race 2 Sex 3 Sex ∗ Race 4 Age 5 Age ∗ Race 6 Age ∗ Sex 7 Age ∗ Sex ∗ Race 8 Area 9 Area ∗ Race 10 Area ∗ Sex 11 Area ∗ Sex ∗ Race 12 Area ∗ Age 13 Area ∗ Age ∗ Race 14 Area ∗ Age ∗ Sex 15 Area ∗ Age ∗ Sex ∗ Race
0 and 8 TYPELVLA (overall and area) are default values for the level of computation in the software. For example, if you are using a state inpatient hospital database, you might specify the following TYPELVLA values:
0 – provides overall rates for your entire state 4 – provides overall rates for your state, broken down by age groups 8 – provides rates for areas within your state 12 – provides rates for age groups within these areas
Version 2.1 26 Revision 2 (PSI, SAS, October 22, 2004)
6. In CONTROL_PSI.SAS, if you wish to create an ASCII (comma delimited) text file that you
can import into a spreadsheet, then set the TEXTA2 parameter to 1. Otherwise, the default value of zero for TEXTA2 will skip around the code that would generate this file.
7. In CONTROL_PSI.SAS, if you wish to create an ASCII (comma delimited) text file that you
can import into a spreadsheet, then specify the path (including the file name) for this ASCII text file in the "FILENAME PSTEXTA2” statement.
Version 2.1 27 Revision 2 (PSI, SAS, October 22, 2004)

Reviewing the Printed Output. This section contains tips for reviewing some of the printed output from the PSI module. These tips are oriented toward explaining the interrelationships between printout items from different programs and hopefully will help to reveal the nature and structure of the module outputs. For guidance in interpreting the results, see the next section which begins on page 33.
The final output of the PSI module is a PROC PRINT from PSSASP3 (for Provider-level Indicators) and PSSASA2 (for Area-level Indicators). All interim printouts are for checking and trouble-shooting. However, if you have elected to refrain from risk adjusting and smoothing the Provider Indicators, then the final Provider Indicator output will be the PROC PRINT at the end of the PSSASP2 program. Risk-adjusted and smoothed rates are not calculated for the Area-level PSIs.
PSSAS1 The initial printout from the PSSAS1 program contains PROC MEANS output for all of the numeric variables (including the comorbidity indicators) in the output discharge-level dataset. It will contain information for the newly constructed TAPSxx and TPPSxx flag variables that will later form the numerators for the indicator rates. For each TAPSxx and TPPSxx flag variable: • The SUM will contain the total number of observations in the dataset that were found to have the
particular outcome of interest. • For the six Area Indicators (TAPS21-TAPS26), the MEAN, MINIMUM and MAXIMUM will usually be
one since the flag variables have either been set to missing (‘.’) or to a value of one. The Provider Indicators (TPPS01-TPPS20, TPPS27-TPPS29) will have a value of one, zero, or missing (‘.’). For these indicators, a value of zero was assigned to the TPPSxx flag if a particular observation was part of the population at risk for a particular indicator but did not have the particular outcome of interest. For example, TPPS20 = 1 indicates a patient who had an obstetric trauma from a Cesarean section, while TPPS20 = 0 identifies a patient who had a C-section but no trauma complication.
• For the Provider Indicators, the MEANs will contain a close approximation of the eventual overall
observed indicator rates. The values will change slightly after PSSASP2 has applied additional parts of the indicator definitions.
• N lists the number of observations in the dataset with non-missing values. For the six Area
Indicators, N for TAPSxx will be the same as the SUM. For the Provider Indicators, N will contain the denominator for the observed indicator rate.
The PSSAS1 printout also contains a PROC CONTENTS that lists all of the variables in the output dataset, including the character variables that are present, and a PROC PRINT of the first 24 observations in the output dataset.
PSSASP2 The purpose of this printout is to provide the observed rates for all Provider-level Indicators. The default printout shows results by provider, but other levels of output (as shown in Table 6) can be specified as well. Note that risk-adjusted and smoothed rates are shown in the output from the next program.
Version 2.1 28 Revision 2 (PSI, SAS, October 22, 2004)

The printout from the PSSASP2 program contains PROC MEANS on the provider-level summary records for all of the numeric variables in the output summary dataset. It will contain information for the newly constructed OPPSxx rates, the PPPSxx denominators, and the TPPSxx numerators. • The _TYPE_ variable described in the MEANS table identifies the stratification level for the records in
the output data set. The _TYPE_ variable corresponds to the TYPELVLP parameter values that were specified (see item 4 in “Changes” under the PSSASP2 program on page 20). In this case, _TYPE_ always assumes the value of 16, since only the provider-level records are selected.
• The N statistic for _TYPE_ contains the number of records in the output summary data set. A
TPPSxx numerator variable with a value for N that is lower than the N value for _TYPE_ indicates that there were no outcomes of interest for some of the providers. Similarly, a PPPSxx denominator variable with a lower value for N than _TYPE_ indicates that for some providers, there were no hospital discharges with the outcome of interest.
• The MINIMUM value for the TPPS01-TPPS20, TPPS26-TPPS29 numerators will be zero since
values of zero were assigned for observations that were part of the population for the rate denominator but did not have the particular outcome of interest to be included in the rate numerator.
For the observed rates, the User should NOT report the MEANS displayed here, but instead
should refer to the overall means in the output dataset that are also present in the subsequent PROC PRINT. The MEANS given here are means of hospital means; i.e., all hospitals are given equal weight, regardless of the number of discharges in the different hospitals.
• The SUMs for the counter variables TPPSxx and PPPSxx will contain overall file totals for these data
elements. The SUMs for the observed rates have no intuitive meaning. If the “PRINT” parameter in the CONTROL_PSI.SAS program is set to 1, the subsequent PROC PRINT output contains a complete dump of the output summary file. Listed for each record are the stratification values, the PPPSxx population denominators for the 23 indicators, the TPPSxx outcome numerators for the 23 indicators, and the 23 OPPSxx observed rates.
PSSASP3
The PROC PRINT at the end of this program provides your final output. (This printout appears if the "PRINT" parameter in the CONTROL_PSI.SAS program is set to 1 – the default setting.) It lists the numerator and the denominator, along with the observed, risk-adjusted, and smoothed rates for all indicators, as shown in the following example.
Version 2.1 29 Revision 2 (PSI, SAS, October 22, 2004)

SAMPLE DATA PROGRAM P3 PART III
AHRQ PATIENT SAFETY INDICATORS: HOSPITAL-LEVEL MERGED FILES FINAL OUTPUT
Indicator # 04: FAILURE TO RESCUE
TPPS04 PPPS04 OPPS04 RPPS04 SPPS04 OBS HOSPID AGECAT SEXCAT PAYCAT RACECAT (Numerator)(Denominator) (Observed) (Risk Adj) (Smoothed) 1 . 3051 18021 0.169302 0.171598 0.171589 2 12004 38 182 0.208791 0.218282 0.197431 3 12006 1 11 0.090909 0.087498 0.164362 4 13015 4 32 0.125000 0.174602 0.171170 5 13022 151 1148 0.131533 0.162518 0.163375 6 13031 42 188 0.223404 0.180822 0.176362 7 13042 25 249 0.100402 0.113107 0.133753 8 13060 7 38 0.184211 0.190012 0.174569 9 13076 34 182 0.186813 0.178394 0.174908 10 13084 16 168 0.095238 0.097523 0.130686 11 13088 72 423 0.170213 0.133663 0.142811 12 13093 47 305 0.154098 0.173130 0.172266 13 13096 33 328 0.100610 0.128792 0.141256 14 13097 123 1009 0.121903 0.118205 0.124576 15 13100 2 21 0.095238 0.034538 0.152704 16 14002 130 843 0.154211 0.195720 0.192105 17 14003 14 109 0.128440 0.131110 0.153216 18 14008 9 88 0.102273 0.103876 0.144754 19 14031 72 413 0.174334 0.196287 0.189719 20 14034 61 406 0.150246 0.169017 0.169369 21 14044 102 469 0.217484 0.217232 0.206444 22 15049 95 608 0.156250 0.152693 0.156011 23 15050 131 603 0.217247 0.202397 0.196354 24 15054 10 67 0.149254 0.131847 0.157933 25 15071 18 128 0.140625 0.144376 0.157979 26 15074 54 370 0.145946 0.165906 0.167139 27 15080 12 128 0.093750 0.100078 0.136848 28 15097 34 157 0.216561 0.244424 0.209481 29 15098 61 309 0.197411 0.184295 0.179952 30 15123 126 644 0.195652 0.187238 0.184223 31 15136 104 553 0.188065 0.164413 0.165623 32 15143 47 262 0.179389 0.168238 0.168988 33 15145 5 47 0.106383 0.133684 0.161179 34 15149 58 399 0.145363 0.143799 0.150717 35 15150 3 31 0.096774 0.093100 0.156403 36 15163 30 171 0.175439 0.184905 0.178361 37 15173 23 107 0.214953 0.207813 0.186578 38 15182 78 416 0.187500 0.157560 0.160796 39 15188 29 123 0.235772 0.153952 0.162710 40 15193 124 818 0.151589 0.165210 0.165968 41 15195 8 43 0.186047 0.233235 0.185128 42 15197 . 0 . . . 43 15223 167 879 0.189989 0.192694 0.189623 44 15230 10 107 0.093458 0.112351 0.145279 45 15239 103 510 0.201961 0.199198 0.192981 46 15241 40 154 0.259740 0.238155 0.205845 47 15249 10 47 0.212766 0.216202 0.181882 48 15253 43 296 0.145270 0.134759 0.146218 49 15255 90 394 0.228426 0.216462 0.204361 50 15256 62 328 0.189024 0.157658 0.161473 51 15276 161 1002 0.160679 0.161331 0.162444 52 15284 140 863 0.162225 0.168232 0.168533 53 15288 41 226 0.181416 0.185729 0.179852 54 15295 94 375 0.250667 0.266884 0.240607 55 15296 57 244 0.233607 0.232630 0.209903
Version 2.1 30 Revision 2 (PSI, SAS, October 22, 2004)

In this example printout, observation 1 (with HOSPID = ".") is the overall average for the entire dataset (TYPELVL = 0). The remaining observations are individual providers, or hospitals (TYPELVL = 16). Data will appear under the column headers, AGECAT, SEXCAT, PAYCAT, and RACECAT, if you specify these levels of aggregation (shown in Table 6). You may wish to express the results in more understandable terms: • Multiply the rates by 100 to express them as a percentage (e.g., 0.0338 * 10 = 3.4%) • To create standardized rates, or rates per 1,000 discharges, multiple the output by 1,000. The MEANS table is generated from the permanent provider-based output file and is provided for trouble-shooting and understanding your data, but not for reporting. The means are provided just for the provider level summary records. • The N for all but the TPPSxx counter variables should contain the number of providers in the users
database. • The MEANS, MINIMUMs, and MAXIMUMs have their normal meaning and provide comparisons
among the different hospitals or providers in your database.
For the (observed, risk-adjusted, or smoothed) rates, the user should NOT report the MEANS displayed here, but instead refer to the overall means in the output dataset in the PROC PRINT labeled "FINAL OUTPUT." The MEANS given here are means of hospital means; i.e., all hospitals are given equal weight, regardless of the number of discharges in the different hospitals.
• If the “PRINT” parameter in the CONTROL_PSI.SAS program is set to 1, at the end of the printout is
a PROC PRINT on the final provider-based output file. Listed for each level of stratification are the stratifiers, the numerator and denominator totals for the observed rates, and the observed, risk-adjusted, and smoothed rates.
PSSASA2 The purpose of this printout is to provide the observed rates for all Area-level Indicators. The default printout shows overall results and results by area, but other levels of output (as shown in Table 7) can be specified as well. • The printout from the PSSASA2 program contains PROC MEANS for all of the numeric variables in
the output summary dataset. It will contain information for the newly constructed OAPSxx rates, the PAPSxx denominators, and the TAPSxx numerators.
• The _TYPE_ variable described in the first row of the MEANS table identifies the stratification level for
the records in the output data set. The _TYPE_ variable corresponds to the TYPELVLA parameter values that were specified (see item 6 in “Changes” under the PSSASA2 program on page Error! Bookmark not defined.). In this case, _TYPE_ always assumes the value of 8 since only the area-level records are selected.
• The N statistic for _TYPE_ contains the number of areas in the output summary data set. A TAPSxx
numerator variable with a lower value for N than _TYPE_ indicates that there were no outcomes of interest for some of the areas
• The MINIMUM value for the TAPSxx numerators will be one or higher.
Version 2.1 31 Revision 2 (PSI, SAS, October 22, 2004)
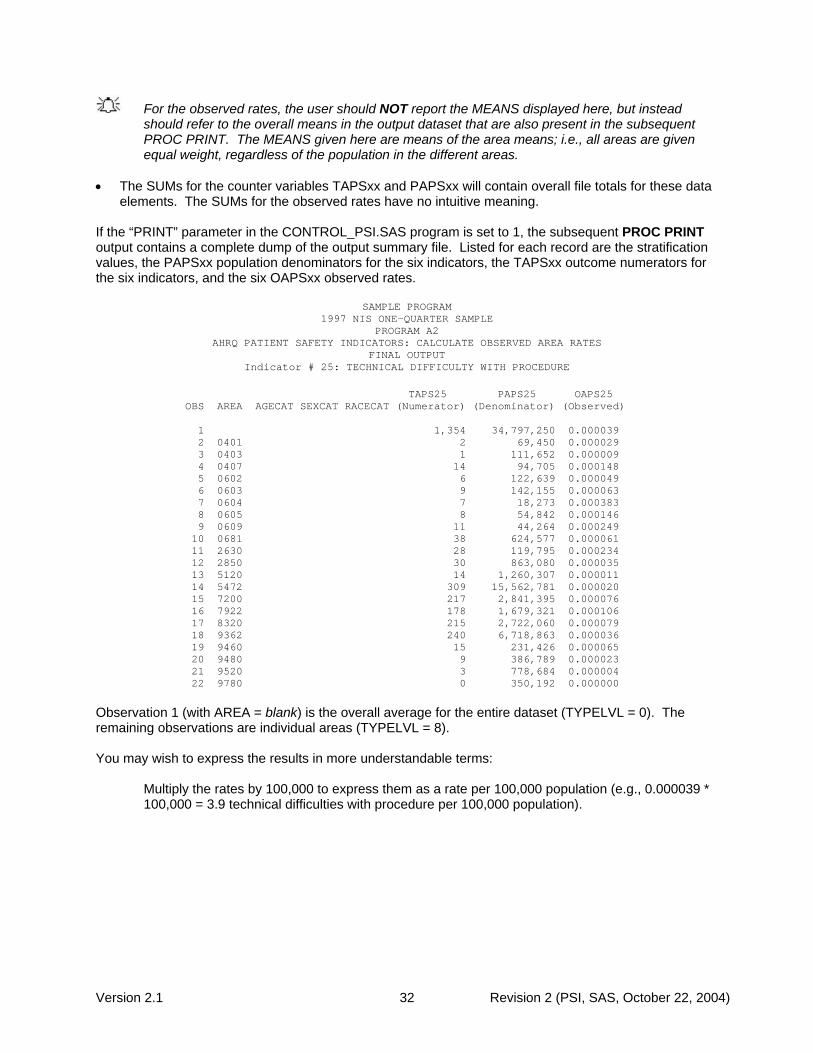
For the observed rates, the user should NOT report the MEANS displayed here, but instead should refer to the overall means in the output dataset that are also present in the subsequent PROC PRINT. The MEANS given here are means of the area means; i.e., all areas are given equal weight, regardless of the population in the different areas.
• The SUMs for the counter variables TAPSxx and PAPSxx will contain overall file totals for these data
elements. The SUMs for the observed rates have no intuitive meaning. If the “PRINT” parameter in the CONTROL_PSI.SAS program is set to 1, the subsequent PROC PRINT output contains a complete dump of the output summary file. Listed for each record are the stratification values, the PAPSxx population denominators for the six indicators, the TAPSxx outcome numerators for the six indicators, and the six OAPSxx observed rates.
SAMPLE PROGRAM
1997 NIS ONE-QUARTER SAMPLE PROGRAM A2
AHRQ PATIENT SAFETY INDICATORS: CALCULATE OBSERVED AREA RATES FINAL OUTPUT
Indicator # 25: TECHNICAL DIFFICULTY WITH PROCEDURE TAPS25 PAPS25 OAPS25 OBS AREA AGECAT SEXCAT RACECAT (Numerator) (Denominator) (Observed) 1 1,354 34,797,250 0.000039 2 0401 2 69,450 0.000029 3 0403 1 111,652 0.000009 4 0407 14 94,705 0.000148 5 0602 6 122,639 0.000049 6 0603 9 142,155 0.000063 7 0604 7 18,273 0.000383 8 0605 8 54,842 0.000146 9 0609 11 44,264 0.000249 10 0681 38 624,577 0.000061 11 2630 28 119,795 0.000234 12 2850 30 863,080 0.000035 13 5120 14 1,260,307 0.000011 14 5472 309 15,562,781 0.000020 15 7200 217 2,841,395 0.000076 16 7922 178 1,679,321 0.000106 17 8320 215 2,722,060 0.000079 18 9362 240 6,718,863 0.000036 19 9460 15 231,426 0.000065 20 9480 9 386,789 0.000023 21 9520 3 778,684 0.000004 22 9780 0 350,192 0.000000 Observation 1 (with AREA = blank) is the overall average for the entire dataset (TYPELVL = 0). The remaining observations are individual areas (TYPELVL = 8). You may wish to express the results in more understandable terms:
Multiply the rates by 100,000 to express them as a rate per 100,000 population (e.g., 0.000039 * 100,000 = 3.9 technical difficulties with procedure per 100,000 population).
Version 2.1 32 Revision 2 (PSI, SAS, October 22, 2004)

Interpreting the Results The Patient Safety Indicators are not intended to be definitive quality measures. Many factors can and do influence performance on quality indicators and some of these factors are independent of quality of care. The empirical analyses conducted by the research team during the development of the PSI produced an estimation that generally less than 20% of total patient level variation for each QI is attributable to actual provider-level differences. Though this number appears low, the research team also estimated that most of this remaining provider-level variation reflects true signal; that is, the observed performance is not likely the result of random variation. The researchers also noted that these true differences in provider performance are potentially clinically important, in that they involve large numbers of patients, severe and potentially preventable complications and adverse events, and/or significant cost to the health care system.
Although these indicators are not intended and should not be used as definitive measures of quality, they are useful low-cost screens that can potentially illuminate differences between providers and areas that may be addressable using quality and patient safety improvement techniques.
Since very high rates may indicate quality problems, and since there are no “right rates” established for most indicators, it is often best to compare provider or area-level rates with other similar providers or areas. These “peer groups” would ideally be as similar as possible in potentially important factors, such as case-mix, socioeconomic status and other demographics. Similar hospitals should perform similarly on QIs. Potential characteristics that have been used to define peer groups have been teaching status, bed capacity, socioeconomic status of the population, and urban or rural location.
Using Indicators in Combination Performance on a single PSI often cannot reliably indicate actual quality differences. Examining all the indicators together is likely to produce a more complete picture of overall quality of care. Providers that perform better (or worse) than average on one measure tend to perform better (or worse) on others. In other words, performance on indicators is often related, and performance on multiple similar indicators could also be examined as summary indicators for an overall picture of quality. Similarly, indicators may be related across indicator types. Groups of indicators have not been validated as sets, but using them as such may be useful for exploration purposes.
After performing all of the steps as previously outlined, users will have three estimates of performance for each Provider-based PSI – observed, risk-adjusted, and MSX smoothed (i.e., reliability-adjusted) estimates. This section will outline how the different types of estimates can be used.
Observed Means
Examine observed rates as baseline measure of performance on the indicators and to see the impact of risk-adjustment.
The interpretation of the observed (raw) PSI rates may be complicated by concerns over noise and bias. However, the observed rates do not require complex statistical methods as do the risk-adjusted and MSX smoothed rates. For this reason, they are the most intuitive estimates of PSI performance. Observed rates can be used as a baseline measure when comparing to risk-adjusted and MSX smoothed rates, to determine the impact of risk adjustment/smoothing.
Version 2.1 33 Revision 2 (PSI, SAS, October 22, 2004)

Observed rates may fluctuate for some providers from year to year. While some of these fluctuations may indicate true differences in performance, others are due only to random chance (i.e., non-systematic differences among providers in patient characteristics that are not observed, and therefore cannot be adjusted for). For this reason, it is often beneficial to examine observed rates for a given provider over several consecutive time periods. This will help to diminish the chance of inaccurately judging poorer than average or better than average performance during one year as true performance.
Risk-adjusted Rates. Provider PSIs Only
For most purposes, you will use the risk-adjusted rates. Simply put, risk-adjusted rates are the estimated performance of providers on the PSIs if those providers had an ‘average’ case mix. This average case mix is estimated and included in the software using estimates from 27 States in the HCUP Year 2000 SID databases. Estimates of the average case mix do not reflect only the providers in the dataset being analyzed, but rather the distribution in age, sex, modified DRG and co-morbidity categories among the providers in the SID data. Most Provider Indicators are risk adjusted using age, sex, modified DRGs and co-morbidities. A few cannot be adjusted using DRGs since the population at risk is characterized by a few DRGs. These are the OB related indicators. For Transfusion reaction (PSI #16) the outcome of interest is a relatively rare event and the observed rates will be extremely low. No risk-adjustment or smoothing is performed for this indicator.
The output will not include any risk-adjusted or smoothed rates for PSI #16, Transfusion reaction. The software will generate observed rates only.
Users should compare risk-adjusted rates with the observed rates. This will indicate the impact of risk adjustment and presumably case mix on indicator performance. Providers with large changes in performance between observed and risk-adjusted rates presumably have a more or less complex case mix. The construction of risk-adjusted rate uses the standard method with logistic models of first estimating the predicted value for each discharge, then subtracting the actual outcome from the predicted, and averaging the difference for each provider (and adding in the overall rate) to get the provider fixed effect estimate. The logistic model was appropriate given the rare occurrence of many of the PSIs and the dichotomous outcomes. The risk-adjustment model for each PSI accounts for patient demographics (age, sex) and DRG/co-morbidity category. The risk-adjusted rates reflect the estimated performance on the PSI for each provider if that provider had the ‘average’ case mix among all providers in the estimation sample. Because the fixed effects are calculated indirectly with a logistic model, the estimated risk-adjusted rates may be negative (that is, the model does not require the rates to be between zero and one). This might happen, for example, if the observed rate is close to zero, and the provider has a more severe than average case mix. The model would predict that the provider’s performance with an ‘average’ case mix would be less and subtract some adjusted amount from the observed rate. If that observed rate is already nearly zero, the adjusted rate may be negative. A negative rate means that the observed rate is close to zero, and that the provider has a less-severe-than-average case mix. In order to facilitate the interpretation of the estimates, the PSI module imposes a lower bound of zero; i.e., negative values are set to zero.
Version 2.1 34 Revision 2 (PSI, SAS, October 22, 2004)
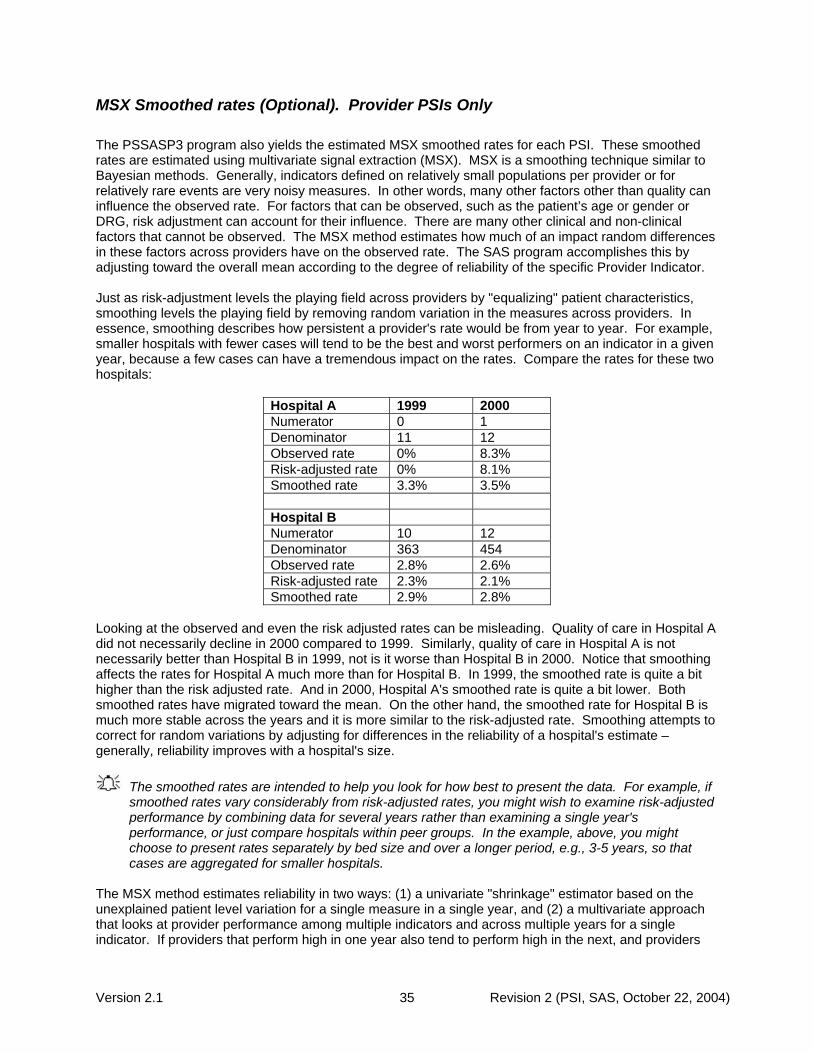
MSX Smoothed rates (Optional). Provider PSIs Only The PSSASP3 program also yields the estimated MSX smoothed rates for each PSI. These smoothed rates are estimated using multivariate signal extraction (MSX). MSX is a smoothing technique similar to Bayesian methods. Generally, indicators defined on relatively small populations per provider or for relatively rare events are very noisy measures. In other words, many other factors other than quality can influence the observed rate. For factors that can be observed, such as the patient’s age or gender or DRG, risk adjustment can account for their influence. There are many other clinical and non-clinical factors that cannot be observed. The MSX method estimates how much of an impact random differences in these factors across providers have on the observed rate. The SAS program accomplishes this by adjusting toward the overall mean according to the degree of reliability of the specific Provider Indicator. Just as risk-adjustment levels the playing field across providers by "equalizing" patient characteristics, smoothing levels the playing field by removing random variation in the measures across providers. In essence, smoothing describes how persistent a provider's rate would be from year to year. For example, smaller hospitals with fewer cases will tend to be the best and worst performers on an indicator in a given year, because a few cases can have a tremendous impact on the rates. Compare the rates for these two hospitals:
Hospital A 1999 2000 Numerator 0 1 Denominator 11 12 Observed rate 0% 8.3% Risk-adjusted rate 0% 8.1% Smoothed rate 3.3% 3.5% Hospital B Numerator 10 12 Denominator 363 454 Observed rate 2.8% 2.6% Risk-adjusted rate 2.3% 2.1% Smoothed rate 2.9% 2.8%
Looking at the observed and even the risk adjusted rates can be misleading. Quality of care in Hospital A did not necessarily decline in 2000 compared to 1999. Similarly, quality of care in Hospital A is not necessarily better than Hospital B in 1999, not is it worse than Hospital B in 2000. Notice that smoothing affects the rates for Hospital A much more than for Hospital B. In 1999, the smoothed rate is quite a bit higher than the risk adjusted rate. And in 2000, Hospital A's smoothed rate is quite a bit lower. Both smoothed rates have migrated toward the mean. On the other hand, the smoothed rate for Hospital B is much more stable across the years and it is more similar to the risk-adjusted rate. Smoothing attempts to correct for random variations by adjusting for differences in the reliability of a hospital's estimate – generally, reliability improves with a hospital's size.
The smoothed rates are intended to help you look for how best to present the data. For example, if smoothed rates vary considerably from risk-adjusted rates, you might wish to examine risk-adjusted performance by combining data for several years rather than examining a single year's performance, or just compare hospitals within peer groups. In the example, above, you might choose to present rates separately by bed size and over a longer period, e.g., 3-5 years, so that cases are aggregated for smaller hospitals.
The MSX method estimates reliability in two ways: (1) a univariate "shrinkage" estimator based on the unexplained patient level variation for a single measure in a single year, and (2) a multivariate approach that looks at provider performance among multiple indicators and across multiple years for a single indicator. If providers that perform high in one year also tend to perform high in the next, and providers
Version 2.1 35 Revision 2 (PSI, SAS, October 22, 2004)

that are low in one indicator tend to perform low in other related indicators, then the methods incorporate this information to improve the estimate of how much of a provider’s performance on a single indicator in a single year is “signal” and how much is “noise”. PSSASP3 reports the univariate “signal” estimate, after removing the “noise”. These estimates are referred to as “smoothed” estimates because when the raw data is reported annually on a graph, for example, the line connecting the points may show massive fluctuations, seemingly with no apparent pattern. Some of these fluctuations are due to random differences in factors that influence performance, so once the impact of these factors is removed, fluctuations are reduced, or smoothed out. Improvements in performance will still be observed, however, they will only be observed when it is likely that these improvements are actually true differences, and not simply random variation. The estimates of how related the Patient Safety Indicators are among measures and over time for a typical provider are based on estimates using the 27 states in the HCUP Year 2000 SID databases. Therefore, PSSASP3 does not require multiple providers, measures, and years of data to operate. Instead shrinkage estimates were calculated from the combination of 27 statewide HCUP Year 2000 SID datasets to which the MSX had been applied. These shrinkage estimates are the best estimates of the impact that MSX smoothing would have on a particular PSI if MSX could be applied to the dataset being analyzed. These shrinkage estimates are then applied to the adjusted rates for each PSI, giving ‘smoothed’ estimates of the rates. The smoothed estimates represent the best guess of what the provider performance would be for any given PSI if the data contained only a minimal amount of noise. This has several implications. First, users can be more certain that changes observed over time represent true differences in performance, rather than random variation. Second, in any given year, users can be more certain that the rate does not reflect only random noise. This can best be seen by comparing the smoothed estimates with the observed raw rates, which will indicate the impact of MSX on that indicator. A large impact means that the observed rate of the indicator is less precise, meaning it contains more noise relative to other indicators sustaining less impact. Low precision can result from small numbers of observations, or for relatively rare events. Therefore, the impact of the MSX estimate will in general be greater for small providers and for infrequent events. For providers with small numbers of cases, the MSX estimates may be the same over time as the estimates are being “shrunk” to an overall mean. Plotting the MSX estimates over time will reflect more persistent performance from year-to-year, and the correlations among indicators will generally be stronger.
Comparing Observed, Risk-adjusted and Smoothed Rates. Provider PSIs Only The purpose of the analysis determines which rates the user should look at in evaluating the performance of a provider. If the user’s primary interest is to focus on a particular provider without any comparisons to other providers, simply examine the overall observed rate for the entire provider, as well as further breakdowns by age, sex, payer, and race/ethnicity which are the output created by the PSSASP2 programs. Trend data are recommended for identifying changes over years. If the purpose of the analysis is to compare the performance of a particular provider with national, state, or regional averages or performance of other selected providers, then both observed and risk-adjusted rates should be examined. Variation in observed rates across providers is attributable to a variety of factors including differences in patient case mix or population demographics, disparity in access to and quality of care, and other provider characteristics (‘systematic factors’), and random factors (non-systematic factors or ‘noise’). Comparing observed and risk-adjusted rates can reveal if there is any difference between the provider’s population and the population of other providers. If the difference is minimal, one can compare the observed rate with the overall average across all providers. However, to account for differences in patient case mix or population demographics among different providers, risk-adjusted rates should be used for provider comparisons.
Version 2.1 36 Revision 2 (PSI, SAS, October 22, 2004)

After removing the impact of patient case mix or population demographics, if users want to examine potential existence of random factors, comparisons can be made between the risk-adjusted rates and the smoothed rates to determine if the differences in risk-adjusted rates across providers are due to systematic, as opposed to random, factors. The following two tables provide guidance on how to interpret differences in observed, risk-adjusted, and smoothed rates.
Comparing Observed Rates with Risk-adjusted Rates Purpose: To identify if there is any difference in the patient case mix of the provider relative to that
of all providers combined Observed rate > Risk-adjusted rate The provider’s patient population for the condition or procedure
has a higher risk of complication/adverse event due to its case mix (for example, older or a greater proportion of a higher-risk DRG/ comorbidity).
Observed rate < Risk-adjusted rate The provider’s patient population for the condition or procedure has a lower risk of complication/adverse event due to its case mix (for example, younger or a greater proportion of a lower-risk DRG/comorbidity).
Observed rate = Risk-adjusted rate Mortality indicators: The provider’s patient case mix for the condition or procedure is similar to other providers’, suggesting that patient composition is not a contributing factor to the provider’s performance for the complication/adverse event indicator.
Comparing Risk-adjusted Rates with Smoothed Rates (Optional) Purpose: To determine if differences in risk-adjusted rates across providers are due to systematic or
random factors after patient case mix or demographic composition is taken into account. Risk-adjusted rate similar to Smoothed rate
The provider’s risk-adjusted rate is more precise, an accurate reflection of the provider’s systematic (‘true’) rate. If there is any difference between the risk-adjusted rate and the overall average1, such difference is likely to be due to systematic factors.
Risk-adjusted rate different from Smoothed rate
The provider’s risk-adjusted rate is less precise2; that is, some of the difference between the risk-adjusted rate and the overall average is due to random (‘noise’) factors. The smoothed rate is thus a more accurate estimate of the systematic rate than the risk-adjusted rate. Comparing the smoothed rate to the overall provider average reveals more accurately the ‘true’ performance of the provider.
Notes: 1. The overall provider average refers to the weighted average risk-adjusted rates across all providers.
2. The risk-adjusted rates for providers with small population are generally less precise. Generally, subtracting the observed, risk-adjusted and smoothed rates can help to reveal differences among these rates. To get a sense of the magnitude, the most straightforward approach is to estimate the difference in terms of the number of cases in the numerator. For example, for a hospital with 1000 cases, a difference of -0.005 between the observed rate and risk-adjusted rate would mean five adverse events. Whether the difference between rates is statistically meaningful will depend on the number of discharges in the population at risk, and the sampling variability for each indicator. Users can apply a rough rule of thumb to estimate the required difference: 1.4* SQRT(p*(1-p)/N), where p is the rate and N is the denominator of the indicator.
Version 2.1 37 Revision 2 (PSI, SAS, October 22, 2004)
For example, if the observed rate for an indicator is p=0.045 and the population at risk is N=200, applying the formula to these numbers will produce: 1.4* SQRT(0.045*(1-.045)/200) = 0.0205. That is, for the risk-adjusted rate to be significantly different from the observed rate, the absolute difference between the two rates has to be equal to or greater than 0.0205.
Confidence Intervals The software does not include a procedure for calculating confidence intervals for the PSIs. Any such procedure should be evaluated for robustness depending on the provider’s denominator and rate. Users may request a supplementary module to calculate a 95% CI (PSSASP3CI.SAS) for each PSI and provider using a procedure based on a normal approximation that is generally appropriate. The module can be requested by sending an e-mail to [email protected] and specify “PSI Confidence Interval Syntax Request” in the subject line and indicate in the body of the e-mail you would like the SAS syntax.
Computing Expected Rates (Optional) While the risk-adjusted rate assumes an “average” case-mix (but the provider’s actual performance for each patient group), an expected rate assumes an “average” performance for each patient group (but the provider’s actual case-mix). The relationship between the two rates is given by the formula: Risk-adjusted rate = (Observed Rate – Expected Rate) + Population Rate. PSI Version 2.1, Revision 2 calculates an expected rate by subtracting the risk-adjusted rate from the observed rate and adding the population rate. For example, if the risk-adjusted rate is 5.1%, the observed rate is 4.5% and the population rate is 6.0%, then the expected rate is (4.5 – 5.1) + 6.0 = 5.4%. The provider performed better than expected given the provider’s actual case-mix (5.4% vs. 4.5%, or -0.9%). The risk-adjustment model assumes that the provider would also perform better than expected (and to the same extent) if the provider had an “average” case-mix (6.0% vs. 5.1%, or -0.9%).
Version 2.1 38 Revision 2 (PSI, SAS, October 22, 2004)
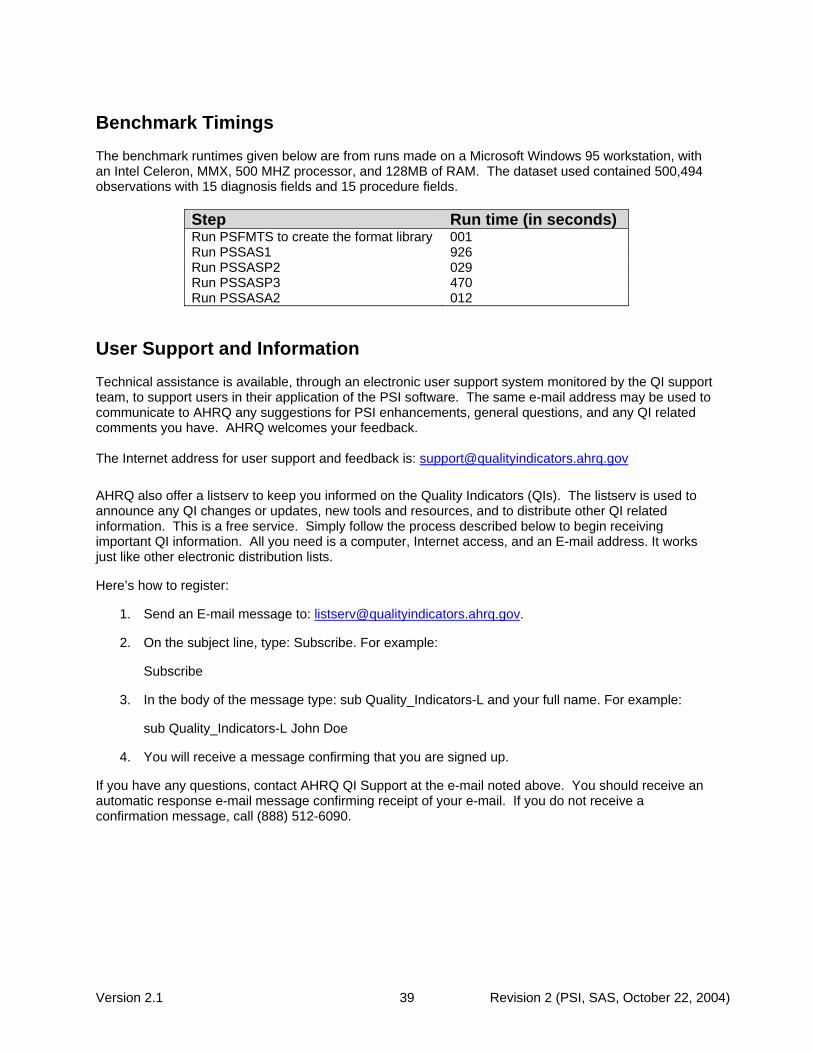
Benchmark Timings The benchmark runtimes given below are from runs made on a Microsoft Windows 95 workstation, with an Intel Celeron, MMX, 500 MHZ processor, and 128MB of RAM. The dataset used contained 500,494 observations with 15 diagnosis fields and 15 procedure fields.
Step Run time (in seconds) Run PSFMTS to create the format library 001 Run PSSAS1 926 Run PSSASP2 029 Run PSSASP3 470 Run PSSASA2 012
User Support and Information Technical assistance is available, through an electronic user support system monitored by the QI support team, to support users in their application of the PSI software. The same e-mail address may be used to communicate to AHRQ any suggestions for PSI enhancements, general questions, and any QI related comments you have. AHRQ welcomes your feedback. The Internet address for user support and feedback is: [email protected] AHRQ also offer a listserv to keep you informed on the Quality Indicators (QIs). The listserv is used to announce any QI changes or updates, new tools and resources, and to distribute other QI related information. This is a free service. Simply follow the process described below to begin receiving important QI information. All you need is a computer, Internet access, and an E-mail address. It works just like other electronic distribution lists.
Here’s how to register:
1. Send an E-mail message to: [email protected].
2. On the subject line, type: Subscribe. For example:
Subscribe
3. In the body of the message type: sub Quality_Indicators-L and your full name. For example:
sub Quality_Indicators-L John Doe
4. You will receive a message confirming that you are signed up.
If you have any questions, contact AHRQ QI Support at the e-mail noted above. You should receive an automatic response e-mail message confirming receipt of your e-mail. If you do not receive a confirmation message, call (888) 512-6090.
Version 2.1 39 Revision 2 (PSI, SAS, October 22, 2004)

A.
Appendix A: Log of Revisions to PSI Documentation and Software Version 2.1, Revision 2 The following table summarizes the revisions made to the PSI software, software documentation and the Guide to Patient Safety Indicators (Guide) document in release version 2.1, revision 2. The table lists the component(s) affected by the change and a short summary of the changes that were made. Component Changes
Guide
1. Modified documentation to reflect changes in indicators associated with ICD-9-CM coding updates for FY 2004 (effective 10-1-2003). See separate documentation for specific details.6
2. Changed syntax of "hospital-level" to "provider-level" throughout the documentation. 3. Added PSI number to each Indicator name. 4. Updated empirical results for Table 1, and limited contents to Provider-level PSIs. 5. Added Table 2, listing Area-level PSIs. 6. Added caption for Table 3, Indicators and Use of External Cause-of-Injury Codes. 7. Modified PSI #2 (death in low mortality DRGs). The indicator is reported as a single
measure, but also stratified by type of DRG: adult medical, pediatric medical, adult surgical (with OR procedure), adult surgical (without OR procedure), pediatric surgical (with OR procedure), pediatric surgical (without OR procedure), obstetric and psychiatric. A list of low mortality DRGs by type is included PSI Guide.
Impact: Among the low mortality DRGs, about 25% of the discharges and 60% of the deaths are “adult medical” DRGs. Psychiatric DRGs also have a higher share of deaths (10%) than discharges (6%). Death among the other DRG types is very rare (0.1% or less). Few low mortality surgical DRGs do not have an operating room procedure, so the adult or pediatric surgical DRG (without OR procedure) will generally be missing or zero for most hospitals. Modified PSI #2, Death in Low-mortality DRG, to split the adult and pediatric surgical strata into separate strata for cases with operating room procedures and cases without operating room procedures.
8. Modified PSI #14, Postoperative Wound Dehiscence, to include only OR
procedures in the definition of abdominopelvic surgery.
Impact: Small (less than 1%) decrease in the denominator and resulting small increase in the rate due to exclusion of a low-risk procedure.
9. Modified PSI #17, Birth Trauma, to exclude preterm infants with subdural or
cerebral hemorrhage or osteogenesis imperfecta infants with injury to skeleton from the numerator only. NOTE: The infants remain in the population at risk for other types of birth trauma.
6 Updates to Version 2.1, Revision 2 – ICD-9-CM Coding Updates," http://www.qualityindicators.ahrq.gov/psi_download.htm
Version 2.1 A-1 Revision 2 (PSI, SAS, October 22, 2004)

Component Changes Impact: Small (less than 1%) increase in the denominator and resulting small decrease or no impact in the rate (i.e. the risk of other types of birth trauma for these two populations is less than or no different than for other births).
10. Added three new Indicators #27-29, to include third-degree lacerations for each of
three types of delivery: Vaginal with and without instruments, and Cesarean.
Impact: The rate for OB Trauma is generally 5-10% higher when including 3rd degree lacerations
11. Limited the surgical DRG inclusion criteria to major OR procedures for PSI #1, 8-13,
all of which deal with postoperative illness or injury.
Impact: Medium (1-4%) decrease in the denominator. The impact on the rate varies by indicator. PSIs 1, 8 and 9 have a medium (1-3%) increase in the rate. PSIs 10 and 12 have a small (less than 1%) decrease in the rate. PSIs 11 and 13 have a medium (3-4%) decrease in the rate.
12. Modified PSIs #1, 3, 5, 6, 7, 8, 9, 10, 11, 12, 13, 15. 16 to exclude discharges with a
PSI-defining secondary diagnosis and a different PSI-defining principal diagnosis (but within the same PSI definition).
Impact: Small (less than 1%) decrease in the denominator. The impact on the rate varies by indicator. PSIs 1, 3, 6, 7, 8, 10, 11, 13 and 16 have a small (less than 1%) increase in the rate. PSI 9 has a small (less than 1%) decrease in the rate. PSI 15 has a medium (2-3%) decrease in the rate. PSIs 5 and 12 have a large (5-9%) decrease in the rate.
13. Modified PSIs #8, 9, 11, 12 to exclude discharges where the only OR procedure is a
PSI-related procedure.
Impact: Small (less than 1%) decrease in the denominator. The impact on the rate varies by indicator. PSI 11 has a small (less than 1%) decrease in the rate. PSI 9 has a medium (1-2%) decrease in the rate. PSIs 8 and 12 have a large (15-65%) decrease in the rate.
14. Modified PSIs #8, 9, 11, 12, 14 to exclude discharges where a PSI-related
procedure precedes the denominator-defining OR procedure.
Impact: Small (less than 1%) decrease in the denominator. The impact on the rate varies by indicator. PSI 9 has a large (65-70%) increase in the rate. PSIs 11 and 12 have a small (less than 1%) decrease in the rate. PSI 8 has a medium (3-4%) decrease in the rate. PSI 14 has a large (8-9%) decrease in the rate.
15. Modified Area level PSI #24, Postoperative Wound Dehiscence, to drop the
requirement that the wound reclosure occurs in a discharge with a procedure code of abdominopelvic surgery.
Impact: Numerator increases by about 40%.
16. Added code 72.79 to the definition of instrument-assisted delivery in PSI #18, 19.
Impact: Transfers about 33% of the denominator from PSI 19 to PSI 18. Because the OB Trauma rate for these cases is higher than average for PSI 19 and lower than average for PSI 18, and because the OB Trauma rate for PSI 19 is lower than PSI 18, the rate for both indicators decreases by 3-10%.
Version 2.1 A-2 Revision 2 (PSI, SAS, October 22, 2004)

Component Changes
Software (SAS and SPSS)
1. Implemented syntax changes associated with ICD-9-CM coding updates from FY 2004 (effective 10-1-2003). See separate documentation on ICD-9 coding updates for specific details.
2. Implemented all syntax changes required to implement the indicator modifications
(noted above under Guide) and incorporated the related documentation in the Software manuals.
3. Modified the age, DRG and co morbidity aggregations used in the risk-adjustment
to reflect the new rates and to group the DRGs by MDC (including an MDC-specific other category).
4. Added the calculation and reporting of the expected rate at the stratification level
selected by the user. The SAS (PSSASP3.SAS) and SPSS (PSSPSP3.SPS) software now calculates the risk-adjusted rate, the expected rate and the smoothed rate. The rates are saved in the output file. The user also has the option to print the rates or save the rates in a comma-delimited ASCII file.
Software (SAS) 1. Inserted “PS” in format names for age, sex, DRG and co morbidity aggregations in
SAS programs to distinguish these formats from similarly named formats used by other indicator software.
Version 2.1 A-3 Revision 2 (PSI, SAS, October 22, 2004)

B.
Appendix B: ICD-9-CM and DRG Coding Updates in PSI Release Version 2.1, Revision 2 The following changes were implemented in version 2.1, revision 2 of the Patient Safety Indicator PSI software code (both SAS and SPSS) and reflect changes to indicator definitions based on updates to ICD-9-CM and DRG codes for Fiscal Year 2004 (effective 10-1-2003). All changes noted below have been incorporated into the software syntax, software documentation and the Guide to Patient Safety Indicators. With this software update, the PSI software definitions now incorporate ICD-9-CM codes valid from October 1, 1994 through September 30, 2004. Indicator Name (#) Component Change
Failure to Rescue (PSI #4)
Denominator (exclusion, viral pneumonia)
Added new (FY 2004) code 480.3 "Pneumonia due to SARS-associated coronavirus" to the viral pneumonia exclusion criteria (for FTR - pneumonia) Expected impact on rate: negligible
Failure to Rescue (PSI #4)
Denominator (inclusion, shock or cardiac arrest)
Added new (FY 2004) code 785.52, "Septic shock" to the denominator inclusion criteria (for FTR - shock or cardiac arrest) Expected impact on rate: negligible
Iatrogenic Pneumothorax (PSI #6)
Denominator (exclusion, cardiac surgery)
Added new (FY 2003) DRG code 525 "Heart assist system implant" to the cardiac surgery exclusion criteria. Expected impact on rate: negligible
Postoperative Wound Dehiscence (PSI #14)
Denominator (inclusion, abdominopelvic surgery)
Added new (FY 2004) code 68.39 "Other subtotal abdominal hysterectomy, NOS" to denominator inclusion criteria for abdominopelvic surgery. Expected impact on rate: negligible
Birth Trauma (PSI #17)
Numerator (inclusion, birth trauma)
Added new (FY 2004) code 767.11 "Epicranial subaponeurotic hemorrhage (massive)" to numerator inclusion criteria for birth trauma. Expected impact on rate: may increase slightly
Birth Trauma (PSI #17)
Denominator (inclusion, liveborn)
Added new (FY 2004) codes 767.11 “Epicranial subaponeurotic hemorrhage (massive)” and 767.19 “Other injuries to scalp” and new categories 766.2x, Disorders relating to long gestation and high birth weight; 770.8x, Other respiratory conditions of fetus and newborn (FY 2003); 771.8x, Infections specific to the perinatal period (FY 2003); 772.1x, Fetal and neonatal hemorrhage (FY 2002); and 779.8x, Other and ill-defined conditions originating in the perinatal period (FY 2003). Expected impact on rate: negligible
Multiple Indicators Shock exclusion
Added new (FY 2004) code 785.52, “Septic shock” to the Shock exclusion criteria for the applicable PSIs Expected impact on rate: negligible
Version 2.1 B-1 Revision 2 (PSI, SAS, October 22, 2004)

Indicator Name (#) Component Change
Multiple Indicators Trauma exclusion
Added new (FY 2004) codes 850.11 “Concussion-brief coma < 31 minutes” and 850.12 “Concussion - brief coma 31-59 minutes” to the Trauma exclusion criteria for the applicable PSIs Expected impact on rate: negligible
Multiple Indicators Immunocompromised state exclusion
Added new (FY 2004) code 37.51, "Heart transplantation" to the immunocompromised state exclusion criteria for the applicable PSIs Expected impact on rate: negligible
Multiple Indicators Surgical discharges denominator inclusion
Added new (FY2004) DRG codes 528-540 to the surgical discharges inclusion criteria for the applicable PSIs. Expected impact on rate: negligible; may decrease rates on FY04 data from Revision 1
Multiple Indicators Cancer discharges denominator exclusion
Added new (FY2004) DRG codes 539-540, Lymphoma & leukemia with major operating room procedure with and without complications, respectively, to the cancer exclusion criteria for the applicable PSIs. Expected impact on rate: negligible
Version 2.1 B-2 Revision 2 (PSI, SAS, October 22, 2004)