AHMEDABAD, GUJARAT - Pradhan Mantri Krishi … List of Graphs/Figures Contents 1 Figure 1.1Mean...
125
Pradhan Mantri Krishi Sinchayee Yojana (PMKSY) District Irrigation Plan (2016-2020) AHMEDABAD, GUJARAT AHMEDABAD
-
Upload
duongkhuong -
Category
Documents
-
view
214 -
download
0
Transcript of AHMEDABAD, GUJARAT - Pradhan Mantri Krishi … List of Graphs/Figures Contents 1 Figure 1.1Mean...

Pradhan Mantri Krishi Sinchayee Yojana (PMKSY)
District Irrigation Plan (2016-2020)AHMEDABAD, GUJARAT
AHMEDABAD

Pradhan Mantri Krishi Sinchayee Yojana (PMKSY)
District Irrigation Plan (2016-2020)AHMEDABAD, GUJARAT
AHMEDABAD

1
Contents I. Introduction ............................................................................................................................... 9
i. Background ................................................................................................................................... 9
ii. Vision ........................................................................................................................................ 14 iii. Objective ................................................................................................................................. 14 iv. Strategy/approach ................................................................................................................. 14
v. Programme Components ....................................................................................................... 15 vi. Rationale/ Justification Statement ..................................................................................... 16 vii. Methodology .......................................................................................................................... 16
1. General Information of the District ......................................................................................... 18
1.1 District Profile ........................................................................................................................ 18
1.2 Demography ........................................................................................................................... 20
1.3 Biomass and Livestock ......................................................................................................... 23 1.4 Agro-Ecology, Climate, Hydrology and Topography ....................................................... 26
1.4.1 Agro ecological zone: ......................................................................................................... 26 1.4.2 Climate and Rainfall ............................................................................................................. 26
1.5 Soil Profile .............................................................................................................................. 28
1.6 Land Use Pattern ................................................................................................................... 29 2. District Water Profile .............................................................................................................. 31
2.1 Area Wise, Crop Wise irrigation Status ............................................................................. 31
2.2 Production and Productivity of Major Crops .................................................................... 34 2.3 Area Wise Irrigation in Ahmedabad District: ................................................................... 37
Chapter 3: Water Availability in Ahmedabad ................................................................................... 38
3.1 Status of Water Availability ................................................................................................. 38
3.2 Status of Ground Water Availability .................................................................................. 41 3.3 Status of Command Area ..................................................................................................... 44
3.4 Existing type of Irrigation: .................................................................................................. 45 4.Water Requirement ......................................................................................................................... 46
4.1 Domestic Water Demand ......................................................................................................... 46
4.2 Crop Water Demand ................................................................................................................ 47 4.3 Livestock Water Demand ........................................................................................................ 49 4.4 Industrial Water Demand ......................................................................................................... 51
4.5 Water Demand for Power Generation ............................................................................... 52
4.6 Total Water Demand of the District for Various sectors ................................................. 52 4.7 Water Budget ........................................................................................................................... 54
Chapter 5: Strategic Action Plan for Irrigation in District under PMKSY ........................................ 56
5.1 Taluk Wise Area Covered: ....................................................................................................... 56 5.2Component wise Coverage of Area .......................................................................................... 56 5.3 Department wise Coverage of Area ......................................................................................... 58
5.4Taluka Wise wise plan Outlay: ................................................................................................. 59 5.5 Component wise plan outlay .................................................................................................... 60
5.6 Department wise plan outlay ................................................................................................... 61 5.8 Year Wise Department Wie Area Covered and Plan Outlay: .................................................. 61
5.9: Monitoring and Evaluation ................................................................................................ 62
5.10 Expected Output and Outcome: ....................................................................................... 62

2
List of Tables Table 1.1 District Profile .................................................................................................................... 18 Table 1.2 Demographic profile of Ahmedabad district ..................................................................... 20 Table 1.3 Decadal change in population of Taluks by residence, 2001-2011 ................................... 21 Table-1.4: Block Wise Population in Ahmedabad District, 2011 ..................................................... 22
Table-1.5: Social Category Wise Households and Population in Ahmedabad District, 2011 ........... 22 Table-1.6: Block Wise Category of Workers (Main Workers + Marginal workers) in Ahmedabad
District (%) ......................................................................................................................................... 23 Table 1.6 Taluk Wise No of Livestock in AhmedabadDistrict of Gujarat ........................................ 24 Table 1.6 Taluk Wise No of Livestock in Ahmedabad District of Gujarat (Contd…) ...................... 25
Table 1.7 Changes in Livestock Population, 2003-2012 Census (No.) ............................................. 25 Table-1.8 Agro Ecological Situation in Ahmadabad District ............................................................ 26
Table 1.9 Major Soil types in Ahmadabad District ........................................................................... 28 Table 1.10 Slope classification in the district .................................................................................... 29 Table 1.11 Land Use Pattern in Ahmedabad District (Area in Ha) ................................................... 29 Table 2.1Area wise Irrigation Status of the district under Agricultural crops ................................... 31 Table 2.2 Area under Horticulture Crops in Ahmedabad District (in ha.) ........................................ 33 Table 2.3 Major Crop-Wise Irrigation Status of Ahmedabad District (Block Wise) ........................ 34
Table 2.4Area, Production and Productivity of Major Crops in Ahmedabad District ...................... 34 Table 2.5Area, Production and Productivity of Horticulture Crops in Ahmedabad District, 2014-15
............................................................................................................................................................ 35
Table 2.8: Irrigation Based Classification in Ahmedabad District, 2014-15 ..................................... 37 Table 3.1: Status of Water Availability in Ahmadabad District (MCM) .......................................... 38 Table 3.2a: Block wise Water availability from Canal (MCM) ........................................................ 40
Table3. 2b: Block wise availability from Ground Water Sources(MCM) ......................................... 41
Table 3.3: Water availability from Various Sources in Ahmedabad (MCM) .................................... 41 Table 3.4: Ground Water Status of Ahmedabad ................................................................................ 43 Table 3.5: Block wise Canal and other services Command in Ahmadaad District ........................... 44
Table3.6: Block wise Canal and other services Command in Ahmadaad District ............................ 45 Table 4.1Domestic Water Demand in AhmedabadDistrict (No) ....................................................... 46
Table 4.2 Crop Water Requirement in Ahmedabad District (in Million Cubic Meters) ................... 47 Figure 4.3:Livestock Water Demand (in Million Cubic Meters) ...................................................... 49 Table 4.4 Industry Water Demand (in Million Cubic Meters) .......................................................... 51 Table 4.5Water Demand for Power Generation in Ahmedabad district (in Million cubic Meters) .. 52
4.6 Total Water Demand of the district for various sectors in Ahmadabad in 2015 (in MCM) ........ 52
Table 4.7Total water demand of the district for various sectors in 2020 (Million Cubic Meters) .... 53
4.8 Water Budget of Ahmadabad District (in Million Cubic Meters) ............................................... 54 Table 5.1Taluk Wise Area Covered under PMKSY through Different Components in Ahmedabad
District (Ha) ....................................................................................................................................... 57 Table 5.2Taluk Wise Area Covered under PMKSY through Different Departments in Ahmedabad
District (Ha) ....................................................................................................................................... 59
Table 5.3Talukwise and component wise plan outlay proposed under PMKSY in Ahmedabad
District (in Rs Lakhs) ......................................................................................................................... 60 Table 5.4 Taluk-Wise and Department Wise Estimated Plan Outlay under PMKSY in Ahmedbad
District (in Rs Lakhs) ......................................................................................................................... 61 Table 5.5 Department Wise and Year wise Area planned to be irrigated and Estimated Plan Outlay
under PMKSY in Ahmedbad District (in Rs Lakhs) ......................................................................... 62
Table5.6: Department wise proposed additional area to brought under irrigation ............................ 63

3
List of Graphs/Figures Contents ............................................................................................................................................... 1
Figure 1.1Mean rainfall and no. of rainy days in Ahmedabad district ..................................... 27 Figure 1.2 Maximum and minimum temperatures (
0c) ...................................................................... 27
Figure 1.3 Relative humidity in Ahmedabad District (%) ................................................................. 28
Figure 2.1 Area under various crops in Ahmadabad District ............................................................ 32 Figure 2.2 Area under various horticulture crops in Ahmedabad District ......................................... 33 Figure-3.1: Major Source of Water in Ahmedabad District .............................................................. 39 Figure 4.1Existing Water Potential and Water Potential to be created (in mcm) .............................. 48 Figure 4.2Taluka Wise Existing Crop Water Potential and Water Potential to be created (mcm) .... 49
Figure 4.3 Livestock Water Demand in AhmedabadDistrict ............................................................. 50 Figure 4.4Livestock Water Demand in AhmedabadDistrict (in Million Cubic Meters) ................... 51
Figure 4.5Sector Wise Water Demand in Ahmedabad District (Million Cubic Meters) ................... 53 Figure 4.6Water Budget of Ahmedabad District (in MCM) .............................................................. 54 Figure 5.1Talukwise Coverage of Area UnderPMKSY in Ahmedabad District ............................... 56 Figure 5.2 Component Wise Area Covered through PMKSY in Ahmedabad District (%) .............. 57 Figure 5.3 Department Wise Coverage of Area through PMKSY in Gandhinagar District (%) ....... 58
Figure 5.4Taluk Wise Planned Outlay for PMKSY in Ahmedabad District (%) .............................. 59 Figure 5.5 Component Wise Plan Outlay for PMKSY in Ahmedabad District ................................ 60 Figure 5.6 Department Wise Plan Outlay for PMKSY in Ahmedabad District ................................ 61

4
Executive summary Water is of vital importance for human & animal life, for maintaining ecological balance and for developmental efforts. With the ever increasing demand for water due to population growth, urbanization and industrialization, making water available to multiple uses, planning and management of water resources and utilization of water economically, optimally and equitably assumes greater significance. Government of India formulated PMKSY with the vision of extending the coverage of irrigation (Har Khet Ko Pani) and improving water use efficiency (More Crop Per Drop) in a focused manner with end to end solution on water resource creation, distribution, management, field application and extension activities. Under PMKSY an integrated planning and management of water resources, through estimation of water budget for each of the district and sub districts and preparation of strategic action plan to address the water gap through District Irrigation Plan (DIP) was envisaged. Pradhan Mantri Krishi Sinchayee Yojana (PMKSY) incentivizes states to enhance expenditures on irrigation and water resources management by making the access to PMKSY funds to states conditional i.e., state will have access only if the expenditure in water resource development for agriculture sector in the year under consideration is not less than the baseline expenditure, which is defined as the average of the expenditure in irrigation sector irrespective of the department in the state plan in three years prior to the year under consideration. PMKSY will be implemented in area development mode only by adopting a „decentralized State level planning and projectised execution‟ structure that will allow States to draw up their own irrigation development plans based on DIPs and SIPs with a horizon of 5-7 years. A three tier structure at national, state and district level will oversee implementation and coordination of the program. The District Level Implementation Committee will form the third tier of the PMKSY. The DLIC will be chaired by the District Collector and is comprised of the Departments of Agriculture, Horticulture, District Rural Development Agency (DRDA), Narmada Water Resources, Water Supply & Kalpasar department (NWRWS&K), Sardar Sarovar Narmada Nigam Ltd (SSNNL), Forest Department, Lead bank of the Districtand any other line Departments in the District. The DLIC will oversee the implementation and inter-departmental coordination at district level. District Water Profile: Ahmedabad district is predominantly urban, dominated by Ahmedabad city where households in non-urban area were equally dependent on agriculture and allied activities for their livelihood. Irrigation infrastructure created in the district addressed the drinking water requirement as well as irrigation requirements in rural areas of the district. Among the major crops cultivated in the district, Paddy is cultivated in 1,17,443 hectares and most of it is cultivated in irrigated conditions; Wheat is
cultivated in 1,72,554 hectares out of which 75 percent is cultivated in irrigated conditions; Cotton is cultivated in 95,314 hectares out of which 14 percent is cultivated in irrigated conditions; Castor is cultivated in 38,569 hectares out of which 93 percent is cultivated in irrigated conditions. Further, 62000 hactares of the area is under horticulture crops out of which 99 percentis under irrigated conditions. Out of total cropped area of 1,31,418 ha in Khariff, nearly 36 per cent cropped area is irrigated and out of 2,29,807 hectares of cropped area in Rabi 60 percent cropped area is irrigated and out of 11,636 hectares of cropped area in summer 100 per cent of cropped area is irrigated. Further, out of 62,329 hectares of area under horticulture crops (vegetables, spices, fruits and flowers) 99 per cent of cropped area is under irrigation. Out

5
of the 6,11,635 hectares of cropped area in the district nearly 280,044 (or 45.8%) area is irrigated. Further, the district has scope for per-urban agriculture utilizing the treated water resources from sewage emanating from Ahmedabad city.
Crop Diversification: Ahmedabad district has a highly diversified cropping pattern consisting of high value crops like paddy, wheat, cotton, castor, fruits, vegetables, flowers, etc. Further potential exists in different parts of the district for intensification and diversification of cropping system and may be promoted through actively expanding irrigation facilities in the district. This process will ensure that farmers receive higher income than received at present while the existing food grain production takes care of the food security needs of the households. Yield per Hectare of Major Crops: Further, the absolute levels of yields reported in the district are lower than the state average yields or potential yields as per the package of practices recommended by the state agricultural university. By enhancing the water resources availability for irrigation purpose through improving irrigation canal network, improving water use efficiency, rainwater harvesting, soil & water conservation measures, the productivity of crops can be enhanced further. Availability of water sources: The district has a semi-arid climate and receives rainfall through South-west monsoon that normally starts from mid June.Most of the rainfall (about 766 mm) is received from south-west monsoon between June and September.The average annual rainfall in the district is 750 mm.The principal rivers of Ahmadabad district include Sabarmati, Vatrak, Khari, Meshwo, Bhogavo, Bhadar, Rodh, Shelwa and Andhli. Out of all these rivers, Sabarmati is the principal river in the district flowing from NE to SW direction in Ahmedabad district. Apart from rivers, the district also has extensive ground water. The district has acquifers in fissured formation and porous formation.Under porous formations, the confined aquifers are B, C & D with in the post Miocene alluvial sediments and G and F aquifers in Miocene sediments with in the drilled depth of 565 m in the district. The aquifers that are developed include B and C and to some extent the upper part of the D aquifers of the post Miocene alluvial aquifer. Including all the water resources, Ahmadabad district has an estimated water resource availability of 2849.2656 mcm out of which 1935.7806 mcm (or 68%) is canal based surface water and 392.3750 mcm (or 14%) is untreated affluent and the remaining 521.1100 mcm (or 18%) is the ground water availability in the district. Crop season wise, water resource availability during Khariff season was 1307.0602 mcm (or 46%), during Rabi season was 1411.4137 (or 50%) and the summer season was 130.7917 (or 4%). The total availability of surface water in the district is 2328.16 MCM. Among the Taluks, Dholka Taluk has the largest surface water availability with 692.28 MCM, followed by Ahmedabad city taluk with 392.4 MCM, Dhandhuka taluk with 387.06 MCM and Mandal Taluk with 196.963 MCM. The gross annual ground water recharge in the district is 419.17 mcm and existing gross ground water draft for all uses is 557.12 mcm leaving a negative gap of 137.95 mcm.Majority of the taluks in the district were categorised as either over exploited or semi-critical. The status ground water in Daskroi taluk is Over Exploitation, status in Dholka taluka is Critical and Detroj-Rampura and Viramgam Taluks the status is semi-critical. As reported by the central ground water board Bavla, Mandal and Sanand Taluks are in safe category.In Dhandhuka taluka ground water is Saline. Ground water is available in all the nine Taluks of the district. Daskroi Taluk has the highest ground water availability of 202.72 MCM, followed by Sanand with 116.6800 and Detroj-Rampur with

6
58.5200 MCM. Ground water in the Dhandhuka Taluk is salinity effected. Existing Type of Irrigation: In Ahmedabad district 20,624 irrigation works were supplying water to households for domestic and irrigation purpose. Government canals, ponds / dams / reservoirs account for more than 13 percent and the rest are water extraction devices/lift irrigation structures, accounting for 86% of the total irrigation works and traditional water harvesting structures accounts for 0.7% of the total irrigation works.However, in terms of command area, out of 383,701 hectares of command area under different type of irrigation works, more than 55 percent of command area is under canal command followed by Wells & Tube Wells, accounting for 44 percent of the total command area and the rest is through other sources. Status of Command Area: Out of the total command area of 3, 90,001 hectares in Ahmedabad district, 2, 27,872 hectares (or 58.4%) is developed and the rest is undeveloped. While most of the other service command are developed, only 56.7% of the canal command area is developed. While the Taluks of Daskroi (89.4%), Detroj-Rampura (81.3%), Mandal (71%), Viramgam (68%) and Sanand (63%) had higher developed command area, rest of the taluks, the developed command area is less than the district average. Demand for water sources: The present water demand of the district has been assessed to be 2279.82 MCM annually. Out of the total water demand, 1834.6 mcm (80 percent) is requirement from crop production. This was followed by 386.58 mcm (16.9%) for domestic water requirement, 0 mcm (or 0%) for power generation, 43.41 mcm (or 1.9%) for industry and 15.09 mcm (or 0.6%) for livestock. By 2020 the water demand is likely to reach 2284.1653 mcm out of which crop water requirement is 1834.6494 mcm (80%), domestic water demand is 428.0045 mcm (or 18.7%), industrial water demand is 5.6575 mcm (0.2%), water demand for power generation is 0 mcm (or 0%) and livestock water demand is 15.8538 (or 0.69%). Water budget in the district: The water budget shows wide gaps between water availability and water demand in the district. While the availability at present is 2885.256 mcm, the present water demand is 2279.819 mcm giving rise to a surplus of close to 605.437 mcm. If the existing water availability is continued, the water surplus is likely to be reduced further in future reaching 601.091 mcm. The water budget analysis suggest that urgent efforts are required to meet the water requirements of the district as the surplus is likely to reduced further in future and water gap may set in. Utilizing the surface & ground water potential in the district, activities that promote water use efficiency, ground water re-charge and water harvesting & conservation measures etc. are proposed in the Strategic Action plan, 2015-20 that will prevent the onset of water gap in the near future. Command Area/Irrigation Potential Covered through PMKSY: The total area covered under Pradhan Mantri Krishi Sinachyee Yojna will be 3,24,193 ha out of which 128,807 ha (or 40%) of command area will be covered in Dhandhuka Taluka followed by 52,224 ha (16%) of command area in Viramgam Taluka and 47,909 ha (or 15%) of command area in Mandal taluka. Department Wise Coverage of Area: Out of 3,24,193 ha of area that will be covered in Ahmadabad district, Sardar Sarovar Narmada Nigam Ltd will cover about 2,84,479 (or 88%) of area while Narmada Water Resource Water Supply and Kalpasar Department will cover about 16,435 hactares (or 5%) of area. Activities covered under SSNNL include lining of field channels and activities

7
covered under NWRWS&K are renovation of canals, pipeline project, RRR of water bodies, water harvesting structures etc. Gujarat Green Revolution Company will cover 13,816 hectares (or 4.2%) of area and the Rural Development Department will cover about 2,419 hectares (or 1%) under Integrated watershed Development Program (IWMP) and coverage of 6,264 hactares (or 2%) through Gujarat Land Development Corporation. A total of 1215 individual and community ponds will be created along with 315 water harvesting structures during upcoming 4 years by GLDC in the district. Component Wise Coverage of Area:
Among the four PMKSY components (indicate components), nearly 2,06,925 hectares (or
64%) of area will be covered through Har Khet ko Pani component followed by nearly
96,588 hectares (or 30%) of area will be covered through/by Accelerated Irrigation Benefit
Program. Most of the area covered under HKKP component aims at development of
ground water by state irrigation department NWRWS & Kalpasar, lining of field channels
by Sardar Sarovar Narmada Nigam Ltd (SSNNL) and water recharge structures by Ground
Water Resource Development Corporation (GWRDC). HKKP activities area spread
throuhout the district. These activities will enhance the ground water recharge as well as
water use efficiency of canal based surface water through improving the water distribution
network-field channels. Under Per Drop More Crop (PDMC) component nearly 18,261
hactares (or 6%) of area will be covered. The activities were mostly aimed at water
conservation through drip and sprinkler irrigation implemented by Gujarat Green
Revoluation Company. Under PMKSY Watershed component nearly 2,419 hectares (or 1%)
of area will be covered through soil and water conservation works.
Taluka Wise Plan Outlay:
To successfully implement the activities proposed under PMKSY, Ahmedabad district would require a total estimated outlay of Rs. 2,35,604 Lakhs for the period 2016-17 to 2019-20 out of which Rs.70,524 Lakhs (30%) will be spent in Ahmedabad City Taluk followed by Dhandhuka Taluka with Rs.66,741 Lakhs (28%). The remaining amount will be required in the rest of the Taluks. Lowest amounts is earmarked for Bavla (2%), Daskroi (1.3%) and Detroj(4%).
Component Wise Plan Outlay:
Out of the Rs. 2,36,604 Lakhs of estimated plan outlay, major share of the total amount
will be required for activities to be taken up under Har khet Ko Pani with Rs.1,54,909
Lakhs (or 65%), followed by activities under Accelerated Irrigation Benefit Program
(AIBP) component having Rs.65,514 Lakhs (or 28%). In terms of total funds designated,
the HKP and AIBP are followed by activities under Per Drop More Crop component with
Rs.9,077 Lakhs (or 4%) and PMKSY watershed component with an outlay of Rs.7,090
Lakhs (or 3%) and PMKSY-Convergence with MGNREGA will have ana outlay of Rs.13.3
Lakhs.
Department Wise Plan Outlay: Among all the departments, SSNNL has the largest outlay of Rs.1,32,542 Lakh (or 56%), followed by NWRWS&K deparment with an outlay of Rs.86257 Lakhs (or 37%). The GGRC will have an outlay of Rs.6189 Lakhs (or 3%). Rural Development department will have an outlay of Rs.7103 Lakhs (or 3%). GLDC wil have an outlay of Rs.2564.7 Lakhs (or 1%) of the total amount. Department of Agriculture (ATMA) has an outlay of Rs.189 Lakhs.

8
Year Wise Plan Outlay: While the amount planned to be spent decreased from Rs 93,607 Lakhs in 2016-17 to Rs 84,947 lakhs in 2017-18., this would further decline to Rs.34,520 Lakhs in 2018-19 and Rs.23,530 Lakhs in 2019-20. Along with plan outlay, the area to be covered through PMKSY would also reduce progressively over the years. Outcomes of the Interventions With the completion of irrigation works proposed in the district an additional area of 217,539 hectares of area (out of 6,11,635 hectares of cropped area) will be brought under irrigation taking the total area under irrigation from 280,044 (or 45.8%) in 2015 to 412,595 ha (or 81.35%) in 2020. Completion of the proposed irrigation projects and the water saving technologies especially under per drop more crop would save water by increasing efficiency of water usage up to 30 percent leading to an availability of water for creation of additional irrigation potential. Further, the creation of additional irrigation will increase the productivity of crops- Paddy productity will increase to 4000 Kg per hectare; Wheat productivity will increase to 3085 Kg per hectare and castor productivity will increase to 1834 Kg per hectare and cotton productivity will increase to 800 Kg per hectare. The increase in irrigation potential and supply of assured water supply will result in generation of additional annual income of Rs. 32,630 Lakhs to the farmers of the district. This is based on the assumption that at least 60% of potential is utilised and Rs.24,950 per ha gross returns will be received by the farmers through shift from area under rainfed to irrigated farming. Further, the assured water supply is also likely to create 106.10247 Lakh mandays of employment and 48,228 jobs annually on recurring basis.

9
I. Introduction
i. Background Preparation of decentralized, area specific district planning process visualized in various
plans took concrete shape through the years and initiatives like specific guidelines on
methodologies and processes for preparation of district plans; framework for preparation
of perspective plan, medium term and annual plans by the then planning commission in
1969 and the 73rd and 74th constitutional amendments conferring constitutional status to
Panchayats at district and sub district level, local self-government in urban areas;
constitution of district planning committee to consolidate the plans prepared at
Panchayats and municipalities and preparation of a draft development plan for the whole
district.
The decentralized planning process was strengthened further through emphasis by
planning commission on preparation of district level plans and making it an integral part
of the process of preparation of the states 11th five year plan. Planning commission issued
guidelines in August 2006 on the preparation of the district plans. The guideline defines
the district planning as „…the process of preparing an integrated plan for the local
government sector in a district taking into account the resources (natural, human and
financial) available and covering the sectoral activities and schemes assigned to the district
level and below and those implemented through local governments in a state. The
document that embodies this statement of resources and their allocation for various
purposes is known as the District Plan”.
Government of India, through a resolution in National Development Council on 29th May
2007 conceived a special Additional Central Assistance Scheme to address the slow growth
of agriculture and allied sectors by incentivizing states to draw up plans for their
agriculture sectors more comprehensively. The NDC resolution states "GoI will introduce a
new Additional Central Assistance scheme to incentivize states to draw up plans for their
agriculture sector more comprehensively, taking agro-climatic conditions, natural resource
issues and technology into account, and integrating livestock, poultry and fisheries, etc.
This will involve a new scheme for Additional Central Assistance (ACA) to State Plans,
administered by the Union Ministry of Agriculture over and above its existing Centrally
Sponsored Schemes, to supplement the state-specific strategies including special schemes
for beneficiaries of land reforms. The newly created National Rainfed Area Authority will,
on request, assist states in planning for Rainfed areas".
The NDC in its resolution advised the states to prepare a comprehensive district
agriculture plans (C-DAP) that will fully utilize available resources and will include allied
agriculture sectors. Further, GOI issued a manual on preparation of comprehensive district
agriculture plans to help the states prepare C-DAP. As per these guidelines, the objective of
district planning is „to design an integrated and participatory action plan for the
development of local area in general and agriculture and allied sectors in particular‟. The
objectives of Comprehensive District Agriculture Plan (C-DAP) are:

10
To prepare a Comprehensive District Agriculture Plan (C-DAP) through participatory
process involving various organisations and stakeholders.
To enable optimum utilization of scarce natural, physical & financial resources.
To assess and plan for the infrastructure required to support the agriculture
development.
To establish linkages with the required institutional support services, like credit,
technology transfer, ICT, research etc.
To evolve an action plan for achieving sustainable agricultural growth with food
security and cropping system that will improve farmers‟ income.
The guidelines wanted the state/district authorities to (i) ensure that the agricultural plans
are prepared for the district and then integrated into the agricultural plans of the state
based on the agro-climatic conditions, availability of technology, trained manpower and
natural resources;(ii) the local needs / crops / feed and fodder / animal husbandry /
dairying / fisheries / priorities are reflected in the plan; (iii)the productivity gaps for
important crops and livestock and fisheries are reduced; and (iv) the returns to the farmers
from these are maximized.
The latest move in the process of strengthening of decentralized planning process was the
Government of India guidelines issued in 2015 in the form of a template for the
preparation of District Irrigation Plan (DIP) and State Irrigation Plan (SIP) as part of the
Pradhan Mantri Krishi Sinchayee Yojana (PMKSY) program and made the preparation of
DIP and SIP mandatory for the state to receive funds from the program. The present
District Irrigation Plan (DIP) report is a product of these long drawn efforts of
Government of India to strengthen the decentralized planning process in the country
focusing on the vital resource i.e., water.
Water is of vital importance for human & animal life, maintenance of ecological balance
and promotion of developmental activities. Considering its vital importance and ever
increasing demand for water, making water available to multiple uses, planning and
management of water resources and utilization of water economically, optimally and
equitably assumes greater importance.
According to the 12th Five Year Plan, the water budget estimates of India by Ministry of
Water Resources suggests an availability of 1123 Billion Cubic Meters (BCM) against a
current estimated demand of 710 BCM. The Standing Committee of the Ministry of Water
Resources estimates that this water demand will rise to 1093 BCM by 2025. Though the
existing water availability in the immediate future seems to be adequate, the near constant
supply of water resources in the face of increasing demand will strain the water supply-
demand balance.
The per capita water availability which stood at 5177 cubic meters in 1951 was reduced to
1820 cubic meters in 2001, while the international prescribed limit is 1800 cubic meters.
The projected per capita availability of water is 1341 cubic meters in 2025 and 1140

11
cubicmeters in 2050 suggesting a shortage of water in the medium term1. Further, the all
India water balance estimates does not reflect the variations in water balance across time
and space- certain areas having a positive water balance and the others facing acute
shortage. The problem is further accentuated by water quality related issues.
With an abundant surface and ground water supply in the first five decades since
independence, more than 80 percent of the total available water resources were earmarked
for irrigation purposes and the rest for meeting domestic and industrial demands. A recent
study2 on the demand for water from agriculture, domestic and industrial uses in 2000,
2025 and 2050 seems to suggest that domestic demand (34 BCM in 2000, 66 BCM in
2025 and 101 BCM in 2050) and industrial demand (42 BCM in 2000, 92 BCM in 2025
and 161 BCM in 2050) for water will utilize the total balance water available while
agriculture demand for water will be 605 BCM in 2000, 675 BCM in 2025 and 637 BCM in
2050. This change is partly because of the changing sectoral contributions of India‟s GDP
but also because of dynamics of irrigation development in the country where the initial
expansion in area under irrigation is propelled by the availability of abundant water
resources and availability of good quality land. This is no longer the case in many states
where the availability of land and water are serious constraints for further expansion of
irrigation. Further, as per the estimates of the then planning commission, out of a total of
141 million hectares of net sown area in the country, 114 million hectares (81%) is
Irrigation Potential Created (IPC) and 88 million hectares (62%) is Irrigation Potential
Utilized (IPU), leaving almost 20% of irrigated potential unutilized as on March 2012. This
leaves 40 percent of the net sown area in the country dependent on rainfall which makes
farming a high risk activity.
The competing demands for water resources and the emerging issues and concerns were to
be addressed through certain basic principles and commonality in approaches in dealing
with planning, development and management of water resources3 under an Integrated
Water Resource Management framework. The main objectives of water resource
management as delineated in National Water Policy 2012 are:
Planning, development and management of water resources need to be governed by
common integrated perspective considering local, regional, State and national context,
having an environmentally sound basis, keeping in view the human, social and
economic needs.
Principle of equity and social justice must inform use and allocation of water.
Good governance through transparent informed decision making is crucial to the
objectives of equity, social justice and sustainability. Meaningful intensive
1 Ministry of Water Resources (2011), Strategic Plan for Ministry of Water Resources, Government of India, New
Delhi. 2Amarasinghe, U.A., Shah T., Turral, H. and Anand, B.K. 2007. India’s water future to 2025-2050:
Business-as-usual scenario and deviations. Research Report 123, International Water Management Institute,
Colombo. 3Ministry of Water Resources, National Water Policy, 2012, Government of India, New Delhi.

12
participation, transparency and accountability should guide decision making and
regulation of water resources.
Water needs to be managed as a common pool community resource held, by the state,
under public trust doctrine to achieve food security, support livelihood, and ensure
equitable and sustainable development for all.
Water is essential for sustenance of eco-system, and therefore, minimum ecological
needs should be given due consideration.
Safe Water for drinking and sanitation should be considered as pre-emptive needs,
followed by high priority allocation for other basic domestic needs (including needs of
animals), achieving food security, supporting sustenance agriculture and minimum
eco-system needs. Available water, after meeting the above needs, should be allocated
in a manner to promote its conservation and efficient use.
All the elements of the water cycle, i.e., evapo-transpiration, precipitation, runoff, river,
lakes, soil moisture, and ground water, sea, etc., are interdependent and the basic
hydrological unit is the river basin, which should be considered as the basic
hydrological unit for planning.
Given the limits on enhancing the availability of utilizable water resources and
increased variability in supplies due to climate change, meeting the future needs will
depend more on demand management, and hence, this needs to be given priority,
especially through (a) evolving an agricultural system which economizes on water use
and maximizes value from water, and (b) bringing in maximum efficiency in use of
water and avoiding wastages.
Water quality and quantity are interlinked and need to be managed in an integrated
manner, consistent with broader environmental management approaches inter-alia
including the use of economic incentives and penalties to reduce pollution and wastage.
The impact of climate change on water resources availability must be factored into
water management related decisions. Water using activities need to be regulated
keeping in mind the local geo climatic and hydrological situation.
The National Water Policy 2012 drives the water resource management program planning
and management in the country. Government of India launched Pradhan Mantri Krishi
Sinchayee Yojana (PMKSY) to address the constraints to providing assured irrigation as
well as increasing efficiency and productivity of current water use to bring more prosperity
to the rural areas. Priorities of Government of India were reflected in the Hon‟ble
President‟s address to the joint Session of the Parliament of 16thLok Sabha where he
indicated that “Each drop of water is precious. Government is committed to
giving high priority to water security. It will complete the long pending
irrigation projects on priority and launch the ‘Pradhan Mantri Krishi

13
Sinchayee Yojana’ with the motto of ‘Har KhetKOPani’. There is a need for
seriously considering all options including linking of rivers, where feasible;
for ensuring optimal use of our water resources to prevent the recurrence of
floods and drought. By harnessing rain water through ‘Jal Sanchay’ and ‘Jal
Sinchan’, we will nurture water conservation and ground water recharge.
Micro irrigation will be popularized to ensure ‘Per drop-More crop”.
PMKSY has been approved with an indicative outlay of Rs.50,000 crore over a period of
five years from 2015-16 to 2019-20. The programme is an amalgamation of on-going
schemes of Ministry of Water Resources, River Development and Ganga Rejuvenation,
Ministry of Agriculture & Cooperation and Ministry of Rural Development. The existing
schemes AIBP, CADWM, MI, SWMA, and Watershed& Convergence with MGNREGA were
brought together under the umbrella program of PMKSY. Further the scheme seeks
convergence with scheme likeMahatma Gandhi National Rural Employment Guarantee
Scheme (MGNRES), Rashtriya Krishi Vikas Yojana (RKVY), Jawaharlal Nehru National
Solar Mission and Rural Electrification programmes (JLNNSM&REP), Rural
Infrastructure development Fund (RIDF), Member of Parliament Local Area Development
Scheme (MPLAD), Member of Legislative Assembly Local Area Development Scheme
(MPLALAD), Local body funds (LBF), Working Plan of State Forest Department (WPSFD)
etc.
The PMKSY will be implemented in an area development mode by adopting a
decentralized state level planning and project based execution structure that will allow the
state to draw up their own irrigation development plans based on DIPs and SIPs with a
horizon of 5-7 years. The program will be supervised and coordinated utilizing the existing
mechanism and structure available under Rashtriya Krishi Vikas Yojana (RKVY) program
with state agriculture department acting as the State Nodal Agency for implementation of
PMKSY. However, the implementing departments for the four components like AIBP,
PMKSY (HarKhetKoPani), PMKSY (Per drop more crop) and PMKSY (watershed
development) will be decided by the respective program ministry/department.
The funds under this program would be provided to the states as per the pattern of
assistance of Centrally Sponsored Schemes (CSS) decided by the Ministry of Finance and
NITI Aayog. During 2015-16 the existing pattern of assistance of ongoing scheme will be
continued. An outlay of Rs. 50,000 crore has been approved for 2015-20. The financial
assistance provided to the state governments from this centrally sponsored scheme is
subject to fulfillment of certain conditions. Firstly, a state will become eligible to access
PMKSY fund only if it has prepared the District Irrigation Plans (DIP) and State Irrigation
Plan (SIP), excepting for the initial year, and the expenditure in water resource
development for agriculture sector in the year under consideration is not less than the
baseline expenditure, which is defined as the average of the expenditure in irrigation sector
irrespective of the department in the state plan in three years prior to the year under
consideration. Secondly, State will be given additional weightage for levying charges on
water and electricity for irrigation purposes, so as to ensure sustainability of the
programme. Thirdly, inter state allocation of PMKSY fund will be decided based on (i)
share of percentage of unirrigated area in the state vis-à-vis national average including

14
prominence of areas classified under Dessert Development Programme (DDP) and
Drought Prone Area Development Programme (DPAP) and (ii) increase in percentage
share of expenditure on water resource development for agriculture sector in State Plan
expenditure in the previous year over three years prior to it (iv) improvement in irrigation
efficiency in the state.
ii. Vision
The overreaching vision of Pradhan Mantri Krishi Sinchayee Yojana (PMKSY) will be to
ensure access to some means of protective irrigation to all agricultural farms in the
country, to produce „per drop more crop‟, thus bringing much desired rural prosperity.
iii. Objective
The objective of the PMKSY program are to:
a) Achieve convergence of investments in irrigation at the field level (preparation of
district level and, if required, sub district level water use plans).
b) Enhance the physical access of water on the farm and expand cultivable area under
assured irrigation (Har Khet ko Pani),
c) Integration of water source, distribution and its efficient use, to make best use of water
through appropriate technologies and practices.
d) Improve on-farm water use efficiency to reduce wastage and increase availability both in
duration and extent,
e) Enhance the adoption of precision-irrigation and other water saving technologies (More
crop per drop).
f) Enhance recharge of aquifers and introduce sustainable water conservation practices
g) Ensure the integrated development of Rainfed areas using the watershed approach
towards soil and water conservation, regeneration of ground water, arresting runoff,
providing livelihood options and other NRM activities.
h) Promote extension activities relating to water harvesting, water management and crop
alignment for farmers and grass root level field functionaries.
i) Explore the feasibility of reusing treated municipal waste water for peri-urban
agriculture, and
j) Attract greater private investments in irrigation.
iv. Strategy/approach
To achieve these objectives PMKSY adopted strategies that include
a) Creation of new water sources; repair, restoration and renovation of defunct water
sources; construction of water harvesting structures, secondary & micro storage,
groundwater development, enhancing potentials of traditional water bodies at village level
like Jal Mandir (Gujarat); Khatri, Kuhl (H.P.); Zabo (Nagaland); Eri, Ooranis (T.N.);
Dongs (Assam); Katas, Bandhas (Odisha and M.P.) etc.
b) Developing/augmenting distribution network where irrigation sources (both assured
and protective) are available or created;
c) Promotion of scientific moisture conservation and run off control measures to improve
ground water recharge so as to create opportunities for farmer to access recharged water
through shallow tube/dug wells;

15
d) Promoting efficient water conveyance and field application devices within the farm viz,
underground piping system, Drip & Sprinklers, pivots, rain-guns and other application
devices etc.;
e) Encouraging community irrigation through registered user groups/farmer producers‟
organisations/NGOs; and
f) Farmer oriented activities like capacity building, training and exposure visits,
demonstrations, farm schools, skill development in efficient water and crop management
practices (crop alignment) including large scale awareness on more crop per drop of water
through mass media campaign, exhibitions, field days, and extension activities through
short animation films etc.
v. Programme Components
PMKSY has the following four programme components
1 Accelerated Irrigation Benefit Programme (AIBP) To focus on faster completion
of ongoing Major and Medium Irrigation including National Projects.
2 PMKSY (Har Khet ko Pani) a) Creation of new water sources through Minor
Irrigation (both surface and ground water); b) Repair, restoration and renovation of water
bodies; strengthening carrying capacity of traditional water sources, construction rain
water harvesting structures (Jal Sanchay); c) Command area development, strengthening
and creation of distribution network from source to the farm; d) Ground water
development in the areas where it is abundant, so that sink is created to store runoff/ flood
water during peak rainy season. e) Improvement in water management and distribution
system for water bodies to take advantage of the available source which is not tapped to its
fullest capacity (deriving benefits from low hanging fruits). At least 10% of the command
area to be covered under micro/precision irrigation. f) Diversion of water from source of
different location where it is plenty to nearby water scarce areas, lift irrigation from water
bodies/rivers at lower elevation to supplement requirements beyond IWMP and
MGNREGS irrespective of irrigation command. g) Creating and rejuvenating traditional
water storage systems like Khatri, Kuhl etc. at feasible locations.
3 PMKSY (Per Drop More Crop) a) Programme management, preparation of
State/District Irrigation Plan, approval of annual action plan, Monitoring etc. b)
Promoting efficient water conveyance and precision water application devices like drips,
sprinklers, pivots, rain-guns in the farm (Jal Sinchan); c) Topping up of input cost
particularly under civil construction beyond permissible limit (40%), under MGNREGS for
activities like lining inlet, outlet, silt traps, distribution system etc. d) Construction of
micro irrigation structures to supplement source creation activities including tube wells
and dug wells (in areas where ground water is available and not under semi critical
/critical /over exploited category of development) which are not supported under AIBP,
PMKSY (HarKhet ko Pani), PMKSY (Watershed) and MGNREGS as per block/district
irrigation plan. e) Secondary storage structures at tail end of canal system to store water
when available in abundance (rainy season) or from perennial sources like streams for use
during dry periods through effective on-farm water management; f) Water lifting devices
like diesel/ electric/ solar pump sets including water carriage pipes, underground piping
system. g) Extension activities for promotion of scientific moisture conservation and

16
agronomic measures including cropping alignment to maximize use of available water
including rainfall and minimize irrigation requirement (Jal sarankchan); h) Capacity
building, training and awareness campaign including low cost publications, use of pico
projectors and low cost films for encouraging potential use water source through
technological, agronomic and management practices including community irrigation. i)
The extension workers will be empowered to disseminate relevant technologies under
PMKSY only after requisite training is provided to them especially in the area of promotion
of scientific moisture conservation and agronomic measures, improved/ innovative
distribution system like pipe and box outlet system, etc. Appropriate Domain Experts will
act as Master Trainers. j) Information Communication Technology (ICT) interventions
through NeGP-A to be made use in the field of water use efficiency, precision irrigation
technologies, on farm water management, crop alignment etc. and also to do intensive
monitoring of the Scheme.
4 PMKSY (Watershed Development)
a) Effective management of runoff water and improved soil & moisture conservation
activities such as ridge area treatment, drainage line treatment, rain water harvesting, in-
situ moisture conservation and other allied activities on watershed basis. b) Converging
with MGNREGS for creation of water source to full potential in identified backward
Rainfed blocks including renovation of traditional water bodies
vi. Rationale/ Justification Statement
In reference to the status and need of irrigation, the water resource management including
irrigation related priorities was identified for Ahmedabad district by the peoples‟
representatives of district with support from administration and technical experts. For
instance the reports of Strategic Research and Extension Plan (SREP) prepared under
ATMA program, Comprehensive District Agriculture Plan (C-DAP) prepared as part of
Rashtriya Krishi Vikas Yojana (RKVY), Potential Linked Credit Plans (PLP) of NABARD
and the Integrated District Development Plan etc. identified number of irrigation related
issues for Ahmedabad district that are considered in the Ahmadabad district irrigation
plan.
vii. Methodology
During the course of preparation of District Irrigation Plan (DIP) the team visited
Ahmedabad district to collect data and have interaction with all the stakeholders. The
Methodology adopted to prepare DIP is outlined in brief as under:
Collection of primary and secondary data from multiple sources including Season
and Crop Reports, District Statistical Handbook, District Primary Census Abstract,
District Census Handbook and other published documents and websites of different
departments.
Meetings with state government departments and related institutions were held.
GIS maps of the area‟s/clusters were studied to understand the land morphology,
topography of the district.
Discussions and interviews were held with officers of agriculture department,
horticulture department, Gujarat Land Development Corporation (GLDC) office,

17
Agriculture Technology Management Agency (ATMA), Gujarat Green Revolution
Company (GGRC) officers, Forestry Department, District Watershed Development
Agency (DWDA) of District Rural Development Authority (DRDA), Animal
Husbandry department, Narmada Water Resource Water Supply and Kalpasar
(NWRWS&K) department, Sardar Sarovar Narmada Nigam Ltd (SSNNL), Gujarat
Water Resource Development Corporation (GWRDC), Gujarat Industrial
Development Corporation (GIDC), District Industrial Centers (DIC), Industrial
Estate and Notified Areas; Nagara Palikas, Gujarat Urban Development Company
(GuDC); Gujarat Water Supply & Sewage Board (GWSSB) etc.to identify the key
issues and key focus areas of the region.
Discussion with NABARD officer of Ahmedabaddistrict was also held during the visit.
Team member also participated in the State Level workshop and held active
discussions with GoJ officers, State Level officers and scientists of various
institutions
On the basis of detailed discussion and analysis of data, the team arrived at the projections
of various components of PMKSY and department wise plan for four years from 2016-17 to
2019-20 was prepared which is given in Annexure I

18
Chapter-I
1. General Information of the District
1.1 District Profile The Ahmedabad district takes its name from the town of Ahmedabad which is the headquarters of the district. A separate State of Gujarat came into existence on 1st May 1960 with Ahhmedabad as its state capital and it remained so till May 1970, when the state capital was shifted to Gandhinagar.It is surrounded by Mehsana district and Gandhinagar on the North, Sabarkantha district is north East, Kheda district and gulf of Cambay towards the south, Bhavnagar and surendranagar on the Western side. Historical or other importance:
Ahmedabad city was built in 1411 A.D. by Ahmad Shah who laid the foundation of Ahmadabad in an open and spacious area in the immediate vicinity of the old towns of Asawal and Karnavati and to the east of the Sabarmati River. Ahmedabad is historically textile city and also an industrial hub of the country with flourishing business of diamond, textile, and other major industries. The city not only employs locals or people from Gujarat but migrants from all over India. This resulted in heavy urbanization. Due to industries and urbanization, water requirement is very high on one side, on the other hand the release of affluents (industrial and domestic waste) into the natural water bodies is also very high.
Latitude and longitude:
The total geographical area of the district is 7932.41 Sq km.The district consists of 11 talukas and 517 gram panchayats with 541 villages. Agriculture is still the main source of livelihood for the rural people of the district.
Table 1.1 District Profile Name of the
District District
Code Latitude Longitude
Ahmedabad 2407 20°00' to 23°30' 70°00' to 72°30'
Administrative setup
With a view to run the administration of the State smoothly, the state has been divided into Districts, which in turn have been further sub-divided into Talukas (Tahsils). In the State of Gujarat, the community development blocks are coterminous with the Talukas. The Talukas contain large number of villages and possibly several towns. The villages have Village Panchayats to run the local administration. A Village Panchayat may constitute of one revenue village, several revenue villages or a part of a large village. Similarly, the towns have Municipality or Municipal Corporation as the seat of local self-government.
The District Collector looks after the general administration, maintenance of collection of land revenue and settlement of law related disputes civil supplies, district planning, mid-day meal scheme, etc at the district level. The functions of administration of law and order and control and investigation of crime are done by the Superintendent of Police of the district with the help of Police Stations working under him.At the Taluka level, Mamlatdar looks after the land development and revenue collection and law and order.
19
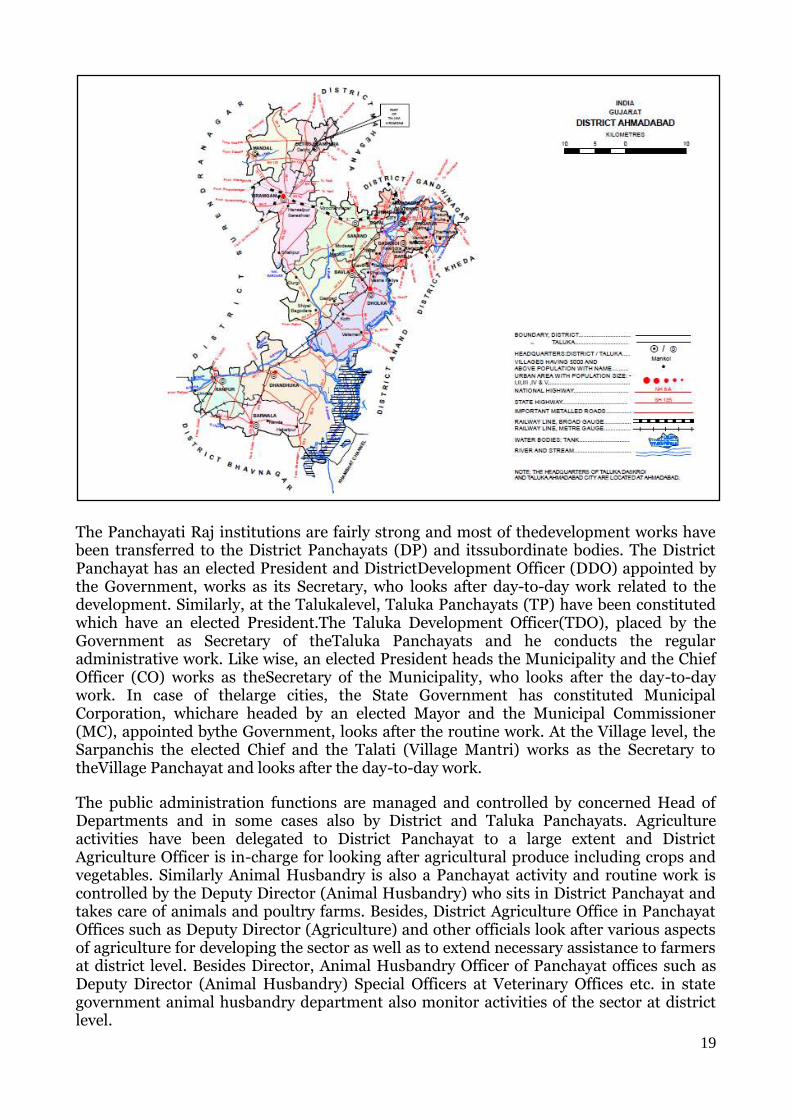
The Panchayati Raj institutions are fairly strong and most of thedevelopment works have been transferred to the District Panchayats (DP) and itssubordinate bodies. The District Panchayat has an elected President and DistrictDevelopment Officer (DDO) appointed by the Government, works as its Secretary, who looks after day-to-day work related to the development. Similarly, at the Talukalevel, Taluka Panchayats (TP) have been constituted which have an elected President.The Taluka Development Officer(TDO), placed by the Government as Secretary of theTaluka Panchayats and he conducts the regular administrative work. Like wise, an elected President heads the Municipality and the Chief Officer (CO) works as theSecretary of the Municipality, who looks after the day-to-day work. In case of thelarge cities, the State Government has constituted Municipal Corporation, whichare headed by an elected Mayor and the Municipal Commissioner (MC), appointed bythe Government, looks after the routine work. At the Village level, the Sarpanchis the elected Chief and the Talati (Village Mantri) works as the Secretary to theVillage Panchayat and looks after the day-to-day work. The public administration functions are managed and controlled by concerned Head of Departments and in some cases also by District and Taluka Panchayats. Agriculture activities have been delegated to District Panchayat to a large extent and District Agriculture Officer is in-charge for looking after agricultural produce including crops and vegetables. Similarly Animal Husbandry is also a Panchayat activity and routine work is controlled by the Deputy Director (Animal Husbandry) who sits in District Panchayat and takes care of animals and poultry farms. Besides, District Agriculture Office in Panchayat Offices such as Deputy Director (Agriculture) and other officials look after various aspects of agriculture for developing the sector as well as to extend necessary assistance to farmers at district level. Besides Director, Animal Husbandry Officer of Panchayat offices such as Deputy Director (Animal Husbandry) Special Officers at Veterinary Offices etc. in state government animal husbandry department also monitor activities of the sector at district level.

20
The large multi purpose irrigation projects are controlled by State Government directly through its Executive Engineers. Minor irrigation works are transferred to the District Panchayat and Executive Engineer (Panchayat) of the Panchayat‟s irrigation office looks after water harvesting and check dams. The micro irrigation works were carried out by Gujarat Green Revolution Company (GGRC) and watershed works under IWMP were executed through PD, DRDA. District Industries Centre looks after the development of small village industries, handloom industries and the scope of industrial growth in the district. Besides, other departments are working for the rights of the industrial workers and rural labourers engaged in agriculture and others sectors. In each District Panchayat, District Statistical Officer of Directorate of Economics and Statistics looks after co-ordination of different development programmes. He is also Member-Secretary of District Planning Board. Similarly in every Collector Office, District Planning Officer looks after development work of various Government (State and Centre) sponsored programmes.
1.2 Demography According to the 2011 census, Ahmedabad district has a population of 70,45,313 recording
a decadal population growth rate of 23.5% between 2001 and 2011.While in terms of area
the district covers 4.13% of the total geographical area of Gujarat, in terms of population,
the district has 11.7% of the population of state.
Table 1.2 Demographic profile of Ahmedabad district S# State District
1 Number of Villages Total 18,225 434
Inhabited 17,843 428
Uninhabited 382 6
2 Number of Towns Statutory 195 8
Census 153 3
Total 348 11
3 Number of Households Normal 1 2,193,328 1503692
Institutional 18,175 2540
Houseless 36,925 3902
4 Population
Number Percentage Change over
Previous Census
Number Percentage Change over
Previous Census 4.1 Total Persons 60,439,692 19.28 7,045,313 23.45
Males 31,491,260 19.35 3,700,894 22.63
Females 28,948,432 19.20 3,344,419 24.38
% of Total Population
% of Total Population
4.2 Rural Persons 34,694,609 57.4 1,017,161 14.44
Males 17,799,159 56.5 526,480 7.47
Females 16,895,450 58.4 490,681 6.96

21
4.3 Urban Persons 25,745,083 74.2 6,028,152 85.56
Males 13,692,101 76.9 3,174,414 45.06
Females 12,052,982 71.3 2,853,738 40.51
Note: The figures for Ahmadabad exclude the population of Ranpur and Barwala Talukas.
Source: Census of India (2011), District Census Handbook, Ahmedabad District, Series 25, Part
XII-B, Directorate of Census Operations, Gujarat, Ahmedabad.
While Gujarat state has a population of 6,04,39,692 living in 18,225 villages resulting in a
population density of 310/km2 (800/sq mile), Ahmadabad district with a population of
70.5 Lakhs living in 434 villages has a density of 890 per Sq KM. Ahmadabad city has the
highest population density followed by Daskroi & Sanad Taluka. The taluka of Dhandhuka
and Mandal has the lowest population density.
Changes in population growth rate (2001-2011)
As per the population census 2011, Gujarat is a highly urbanized. It is thesixth largest
urbanized state in India with nearly 42.6% of its population residing in towns. Ahmadabad
district is also a highly urbanized district with more than 43% of the populating residing in
towns and cities. While Ahmadabad city taluka is 100 percent urbanized, the other
urbanized taluks are Daskroi (42%), Sanand (40%) and Dholka (32%). The taluks of
Mandal and Datroj-Rampura had no urban population in their respective taluks.
Table 1.2 Decadal change in population of Taluks by residence, 2001-2011
Sl.
No
.
Name of
Taluka
Population Percentage decadal
variation 2001-2011 2001 2011
Rural Urban Total Rural Urban Total Rural Urban Total
1 2 3 4 5 6 7 8 9 10 11
1 Mandal 65751 0 65751 70346 0 70346 7.0 - 7.0 2 Detroj-Rampura 77778 0 77778 83199 0 83199 7.0 - 7.0 3 Viramgam 119306 53094 172400 137462 55821 193283 15.2 5.1 12.1 4 Sanand 160918 32417 193335 141955 95890 237845 -11.8 195.8 23.0 5 Ahmadabad
City 4551 4215497 4220048 0 5585528 5585528 -100.0 32.5 32.4
6 Daskroi 218670 240513 459183 186782 135035 321817 -14.6 -43.9 -29.9 7 Dholka 153267 61569 214836 168907 80945 249852 10.2 31.5 16.3 8 Barwala 67301 0 67301 58035 17951 75986 -13.8 - 12.9 9 Dhandhuka 105090 29572 134662 112777 32475 145252 7.3 9.8 7.9 10 Ahmadabad
District 1009557 4663533 5673090 1017161 6028152 7045313 0.8 29.3 24.2
Note: Figures for Ahmadabad district exclude population of Ranpur and Barwala Talukas.
Source: Census of India (2011), District Census Handbook,Ahmedabad District,Series 25, Part
XII-B, Directorate of Census Operations, Gujarat, Ahmedabad.
The 60.63 Lakh urban population of Ahmadabad district reside in 11 towns, the chief among them being Ahmadabad municipal corporation with 55.77 Lakh population followed by Dholka Municipality with 0.79 Lakh population, Viramgam Municipality with 0.55 Lakh population, Sanand Municipality with 0.41 Lakh population and the rest of the urban population living in the remaining town and outgrowths.

22
Changes in population growth rate (2001-2011):
While the population of Gujarat increased from 5,06,71,077 in 2001 to 6,04,39,692 in 2011 resulting in a decadal growth rate of 19.3% during the last decade while the population of Ahmadabad district increased from 56,73,090 in 2001 to 70,45,313 in 2011 resulting in a decadal growth rate of 24.2%. Within Ahmadabad district, population in the Taluks of Ahmadabad city (32%), Sanand (23%) and Dholka (16.3%) taluks grew faster than rest of the Taluks.
Table-1.4: Block Wise Population in Ahmedabad District, 2011 S# Name of Taluk Male Female CH* (0-6 Yrs) Total
1 Mandal 36063 34283 8954 70346
2 Detroj-Rampura 42958 40241 10490 83199
3 Viramgam 100153 93130 25997 193283
4 Sanand 123742 114103 33490 237845
5 Ahmadabad City 2942922 3E+06 621829 5585528
6 Daskroi 166727 155090 42904 321817
7 Dholka 130113 119739 32034 249852
8 Bavla 82432 75759 23210 158191
9 Dhandhuka 75784 69468 18969 145252
10 District Total 3700894 3344419 817877 7045313 Note: The figures for Ahmadabad district exclude the population of Ranpur and Barwala
Talukas.
Source: Census of India (2011), Village and Town Wise Primary Census Abstract, District Census
Handbook, Ahmedabad District, Series 25, Part XII-B, Directorate of Census Operations,
Gujarat, Ahmedabad.
Out of the 70.45 Lakh population in Ahmadabad district, 33.44 Lakhs (or 47.5%) were females and the rest 37.01 Lakhs (or 52.4%) were males. Ahmadabad has the sex ratio of 904 female per 1000 males and is the second lowest (among districts) in the state. Mandal Taluk with a sex ratio of 950 records the highest sex ratio in the district while Ahmadabad Taluk has the lowest sex ratio of 898. Table-1.5: Social Category Wise Households and Population in Ahmedabad District, 2011
Schedule Caste Schedule Tribes Other Backward Caste
/GeneralCaste Total
S#
Name of Taluk No. of
household
No. of Member
No. of household
No. of Member
No. of household
No. of Member
No. of household
No. of Member
1 Mandal 1,711 8068 15 58 13,395 62220 15121 70346
2
Detroj-Rampura
1,375 5869 19 73 16,186 77257 17580 83199
3 Viramgam 3,851 23994 465 2971 36,517 166318 40833 193283
4 Sanand 4,849 29654 226 1404 42,747 206787 47822 237845
5
Ahmadabad City
118396 596468 14,376 67659 1,166,893 4921401 1181269 5585528
6 Daskroi 4,644 22308 836 4643 61,651 294866 67131 321817
7 Dholka 5,416 33672 285 1802 45,020 214378 50721 249852
8 Bavla 2,604 15606 1,739 9946 27,500 132639 31843 158191
11 Dhandhuka 1,998 12167 51 355 24,873 132730 26922 145252

23
12 District Total 144844 747806 18012 88911 1316386 6208596 1479242 7045313 Note: The figures for Ahmadabad district exclude the population of Ranpur and Barwala Talukas. Source: Census of India (2011), Village and Town Wise Primary Census Abstract, District Census Handbook, Ahmedabad District, Series 25, Part XII-B, Directorate of Census Operations, Gujarat, Ahmedabad. Out of 70.45 Lakh population in the district, nearly 9.79 percent belong to schedule caste, 1.22 percent belong to schedule tribes and the rest belongs to Other Backward Caste/General Category. While the proportion of population belonging to schedule caste was more in the Taluks of Mandal (11%), Dholka 911%), Sanand (10%) and Ahmadabad City (10%), the proportion of population belonging to Schedule Tribe is more in the Taluks of Bavla (5.5%), Viramgam (1.1%), Daskroi (1.2%) and Ahmadaba city (1.2%). Table-1.6: Block Wise Category of Workers (Main Workers + Marginal workers) in Ahmedabad District (%)
Name Taluk Cultivators % Agri
Labour %
Workers in HH
Industry %
Other Workers
% Total
Workers
Mandal 6324 20.2 11667 37.3 134 0.4 5314 17.0 31252
Detroj-Rampura 7449 21.5 12099 35.0 273 0.8 6818 19.7 34601
Viramgam 13507 18.1 23003 30.8 384 0.5 25056 33.6 74657
Sanand 21782 24.2 21530 23.9 574 0.6 33040 36.7 90121
Ahmadabad City 9057 0.5 9767 0.5 35288 1.8 1753338 89.7 1954050
Daskroi 19355 16.4 21817 18.4 1138 1.0 59297 50.1 118355
Dholka 14582 14.7 29837 30.1 2798 2.8 32378 32.6 99290
Bavla 12917 19.4 20994 31.6 409 0.6 21084 31.7 66470
Dhandhuka 9340 15.9 19567 33.4 495 0.8 16103 27.5 58585
Ahmadabad 114313 4.5 170281 6.7 41493 1.6 1952428 77.3 248866
Note: The figures for Ahmadabad district exclude the population of Ranpur and Barwala Talukas. Source: Census of India (2011), Village and Town Wise Primary Census Abstract, District Census Handbook, Ahmedabad District, Series 25, Part XII-B, Directorate of Census Operations, Gujarat, Ahmedabad.
In Ahmadabad district out of 70.45 Lakh population 25.27 Lakh persons were reported as workers (including main workers or marginal workers) with a work force parcipation rates of 36%. The workforce participation rates were high in the Taluks Mandal (44%), Bavla (42%) and Detroj-Rampura (42%) and lowest Workforce participation rates were found in Ahmadabad city (35%) In Ahmadabad district out of 24.88 Lakh total workers, nearly 19.52 Lakhs (or 77%) were in other workers category depending on industry and service sector employment for their livelihood. The growth of industries and service sector in Ahmadabad and Daskroi may have led to the high proportion of workers in other workers category. Nearly 1.14 Lakh (or 5%) persons were dependent on cultivation for their livelihood followed by 1.70 Lakh (7%) on agriculture labour, 0.42 Lakahs (or 1.6%) on household industry.
1.3 Biomass and Livestock Green cover: Green cover consists of area under forest along with area under
miscellaneous trees. Ahmadabaddistrict has nearly 8,664 ha of forest area constituting less
than 1.3 per cent of the total geographical area. The area under miscellaneous tree crops is

24
nil. Thus the total green cover in the district is very limited.
Not only the area under forests is declining but also the per cent of forest cover in the district is less than in the state. Most of the forest area activities in the district is confined to social forestry and the trees raised on the village common lands and forest programs success dependent on the interest shown by the villagers to raise the trees.
Biomass yield: In mixed crop livestock farming systems, biomass from crop residues
especially cereals, select oilseeds and pulses crops are used as feed for the cattle
population. With increasing cattle population and reduced area under cereals, oilseeds and
pulses crops there is an increasing pressure on biomass in mixed farming systems.
Further, increased use of cereal crop residues as mulch and conservation agriculture
makes it more scarce and unavailable for livestock feed. The biomass yield pressures can
be addressed through increasing the overall biomass yield, improving fodder quality and
increasing the efficiency of raising livestock production.
Fodder Yield: The area under fodder especially under grass land in the Ahmadabad
district was low with area under cultivable wastes (3.4%) and permanent pastures (3.6%)
constituting nearly 7 percent of the total geographical area and the area under fodder crops
like Sorghum, Pearlmillet, pulse crops etc was low (less than 2 percent) in the district.
Further, along with the area under grass lands, the area under cereal crop is also
decreasing. By developing the area under permanent pastures, promoting the fodder
varieties and raising biomass yield of cereal crops, the issue of fodder availability to dairy
farmers can be addressed.
Small and Large Livestock:
According to the 19th Livestock Census, there were 8.58 Lakh Livestock in Ahmadabad district. The district has seen a yearly increase of approximately 3.95% in the total livestock population - increased from 7.75 Lakhs in 2007 to 8.58 Lakhs in 2012.
Table 1.3 Taluk Wise No of Livestock in AhmedabadDistrict of Gujarat
Small Animals Large Animal
S# Name of Taluka Poultry
(No.) Ducks (No.)
Pigs (Nos.)
Goats (Nos.)
Sheep (Nos.)
Indigenous Cow
(Nos.)
Hybrid Cow
(Nos.)
In Descript
ive Buffalo(
Nos.)
Hybrid Buffalo (Nos.)
1 Mandal 4109 292 17151 93 15147
2 Detroj-Rampura 6519 238 9212 441 21515
3 Viramgam 12079 358 22271 208 31446
4 Sanand 194000 11351 1290 12061 361 52573
5 Ahmadabad City 46967 283 470 49349 3878 44252 4901 22309 4901
6 Daskroi 72036 0 10413 3938 14650 733 74006
7 Dholka 30000 17101 931 20940 1238 56964
8 Bavla 5000 7553 1139 19537 284 44050
9 Dhandhuka 3183 190 10470 1644 35604 4958 21634
10 District Total 351186 283 1092 144017 16315 237618 18381 360161
Note: The figures for Ahmadabad district exclude the population of Ranpur and Barwala
Talukas.

25
Source: Government of Gujarat, (2012) Report on 19th Livestock Census 2012, Government of
Gujarat, India
Buffaloes accounted for the largest segment (47%) of livestock population followed by
Cattle accounting for 34% of the total livestock in the district, while goats with 17%
accounts for the third largest second largest livestock segment in the district followed by
sheep with 2% of the total livestock population.
Table 1.4 Taluk Wise No of Livestock in Ahmedabad District of Gujarat (Contd…)
Draft Animal (Buffalo/ yak/ bulls/ any other (Nos.)
S# Name of Taluka Bulls Male
Buffaloes Yak Camels Donkeys Horses
Grand Total
1 Mandal 1590 3543 126 64 170 42285
2 Detroj-Rampura 1901 2816 540 87 43269
3 Viramgam 3604 4158 46 89 30 74289
4 Sanand 4824 2583 113 176 26 279358
5 Ahmadabad City 2009 4909 0 405 943 185576
6 Daskroi 5046 2927 81 90 246 184166
7 Dholka 6441 3962 32 143 190 137942
8 Bavla 3554 3014 84131
9 Dhandhuka 7025 740 124 24 85596
10 District Total 40646 31695 0 938 1397 1629 1210259 Note: The figures for Ahmadabad district exclude the population of Ranpur and Barwala
Talukas.
Source: Government of Gujarat, (2012) Report on 19th Livestock Census 2012, Government of
Gujarat, India.
The number of bovines per ha of geographical area had increased from 0.91 bovines in
2007 to 1.10 bovines in 2012 showing a slight increase in bovine density. The increasing
bovine density means more demand for water & fodder putting higher pressure on existing
waste lands, pasture lands &crop residue.
Table 1.5 Changes in Livestock Population, 2003-2012 Census (No.)
Particular Cattle Buffalo Sheep Goat Total
Livestock Poultry
Bovine Density per Ha
Bovine Density per Household
2007 216941 343699 23150 125800 716914 452470 0.92 0.48
2012 287694 405708 16315 144017 858790 351469 1.10 0.58 Note: The figures for Ahmadabad district exclude the population of Ranpur and Barwala Talukas.Bovine Density is calculated as (i) no of livestock per ha of geographical area and (ii) no of livestock per household. Source: Livestock Census of India, Gujarat, Various Years. Animal husbandry, along with cultivation is an important source of livelihood for households in Ahmadabad district. The district is known for a very efficient dual purpose breed of „Kankrej cow‟ and „Mehsana buffaloes‟. As in the state of Gujarat on the whole, Ahmadabad district is prospering well and farmers earn reasonable income from dairying.

26
1.4 Agro-Ecology, Climate, Hydrology and Topography
1.4.1 Agro ecological zone: Ahmadabad district falls under Agro Ecological Situation Ia, Ib, V, VI, IX and XII covering
68 percent of area and Agro Ecological Situation II covering 32% of the area.
Table-1.8 Agro Ecological Situation in Ahmadabad District Zone
Agro Ecological Situation
Particulars Soil Types
Rain Fall
(mm) Crops Grown
% of Area Taluka
BCZ Ia
Medium Black Moderately Saline
with low to medium rainfall-waterlogged
Clayey 600-750
Cotton, Sorghum,
Pearlmillet, Wheat and Gram
25% Dholka,
Dhandhuka
Ib
Medium Black, Moderately Saline
with low to Medium rainfall
Clayey 550-750
Cotton, Sorghum,
Pearlmillet, Wheat, Gram and Sesamum
32% Dholka,
Dhandhuka
NWZ V Black soil with high
rainfall 588.3
Cotton and Sorghum
21% Viramgam
NZ VI Alluvial clay loam
soils with high rainfall
Clay Loam
Over 850
pearlmillet 12% Dascroi and
Ahmedabad City
IX Alluvial clay loam soils with medium
rainfall
Clay loam
700-850
Rice and Cotton 6%
Parts (60%) of Sanand
XII Medium Black ill drained soils with medium rainfall
Sandy, clay loam
and clay
700-850
Rice, Cotton
4% Parts (40%) of Sanand
Note: The figures for Ahmadabad district exclude the population of Ranpur and Barwala Talukas.
Source: Status Report prepared by GAU (1987, 1988-89) cited in Strategic Reseaech and Extension Plan (SREP), Ahmedabad District, Ahmedabad.
1.4.2 Climate and Rainfall
The district has a semi arid climate with three distinguished seasons i.e., kharif (June to
September), winter (October to January) and summer (February to May). The district
receives rainfall through South-west monsoon that normally starts from mid June. Rainfall
records for a period of 30 years are available from a station in the district based at
Ahmedabad. The average annual rainfall in the district is 750 mm. The details of the
normal rainfall at these stations during a year are given in Figure below.

27
Figure 1.1Mean rainfall and no. of rainy days in Ahmedabad district
It can be seen that the monsoon rainfall occurs mainly during June to September. July and
August are the rainiest months. The rainfall during the monsoon season constitutes about
96 percent of the annual rainfall. The heaviest rainfall recorded in a month in the district
was 1538 mm in 1927.
Figure 1.2 Maximum and minimum temperatures (0c)
1 0.8 0.6 2.4 7
80
291.2266.2
86.8
11.7 2.3 1
0.1 0.1
0
0.4 0.6
3.9
11.5
10.7
5
0.8
0.40.2 0
2
4
6
8
10
12
14
0
50
100
150
200
250
300
350
Rai
nfa
ll (m
m)
Average Monthly Rainfall (mm) No of Rainy Days
32.335.4
40.243.1 44.4 42.9
37.734.8
37.1 38.135.7
32.8
7.9 9.2
14.1
19.6
24 24 23.3 23.2 22.6
16.9
12.38.8
0
5
10
15
20
25
30
35
40
45
50
Tem
pe
ratu
re(0
c)
Graph: Maximum and Minimum Temperatures (0c)
Max Temp Min Temp

28
The temperature in the district varies from 15o C to 44o C. The period from March to about
the end of June is one of continuous rise in temperature. May is the hottest month when
the mean daily maximum temperature is 44.4oC and the mean daily minimum is 24oC.
Figure 1.3 Relative humidity in Ahmedabad District (%)
Relative humidity is maximum during the monsoon months while it is minimum in
March-May. Humidity is normally higher in the mornings than during the afternoons. The
skies are generally heavily clouded during monsoon season. Skies are mostly clear or
lightly cloudy during the rest of the year. The average wind velocity varies from 0.2 km/hr
to 3.1 km/hr.
1.5 Soil Profile Ahmadabad district is covered with very deep alluvial sandy loam (more than 90 cm).
These soils are high in productivity with moderate fertility.
Table 1.6 Major Soil types in Ahmadabad District
Sr. No
Name of Taluka
Soil Type Grand Total Black
Soil %
Medium Black Soil
% Sandy
Loam Soil %
Sandy Soil
% Coastal
Alluvium Soil
1 Daskoi 0 0.0 29500 52.0 27236 48.0 0 0.0 0 56736
2 Dholka 24000 36.8 20000 30.7 20000 30.7 1240 1.9 0 65240
3 Bavla 12500 32.2 11000 28.4 15000 38.7 300 0.8 0 38800
4 Dhandhuka 0 - 0 - 0 - 0 - 0 0
5 Dholera 0 - 0 - 0 - 0 - 0 0
6 Viramgam 9423 14.1 43110 64.3 10181 15.2 4290 6.4 0 67004
7 Mandal 9500 27.1 22000 62.9 500 1.4 3000 8.6 0 35000
6356
5056
65
74
85 8782
65
5761
25 2621 20
25
44
69 72
60
4136 37
0
10
20
30
40
50
60
70
80
90
100
Re
lati
ve H
um
idit
y
Relative Humidity (Morn) Relative Humidity (Even)

29
8 Detroj 0 0.0 16800 56.0 12000 40.0 1200 4.0 0 30000
9 Sanand 28800 36.0 19254 24.1 31942 39.9 0 0.0 0 79996
10 Ahmadabad City 325 11.7 2441 88.3 0 0.0 0 0.0 0 2766
11 District Total 84548 22.5 164105 43.7 116859 31.1 10030 2.7 0 375542
Note: The figures for Ahmadabad district exclude the population of Ranpur and Barwala Talukas. Land slope classification The slope or inclination of a land is the percentage change in its elevation over a certain
distance. It is measured by dividing the vertical distance from the foot to the top of the
land by the horizontal distance between those points, multiplied by 100.
Table 1.7 Slope classification in the district S# Name of Taluka Area (Ha)
Land Slope
0-3% (Ha) 3-8% (ha) 8-25% (ha) >25% (ha)
1 Daskroi 69887 100% - - -
2 Dholka 95577 100% - - -
3 Bavala 76418 100% - - -
4 Dhandhuka 170275 100% - - -
5 Viramgam 84295 100% - - -
6 Mandal 49496 100% - - -
7 Detroj 35074 100% - - -
8 Sanand 75977 100% - - -
9 Ahmedabad City 24420 100% - - -
10 District Total 679414 100% - - -
Note: The figures for Ahmadabad district exclude the population of Ranpur and Barwala
Talukas.
A 45-degree angle of elevation is equivalent to 100% slope. The steepness of slope effects
plant growth through differential incidence of solar radiation, wind velocity and soil type.
A steep slope is susceptible to rapid surface runoff and soil erosion causing soil
degradation.All the Taluka in Ahmadabad has a slope less than 5 percent.
1.6 Land Use Pattern The total geographical area of Ahmadabad district is 6.79 Lakh hectares out of which neary
8.664 Lakh hactares (or 1.3%) constitutes of forest area, 50,609 hectares (or 7.4%) is the
area under wastelands. Nearly 4.23 Lakh hectares (or 62%) is the Net Sown Area (NSA)
and cropping intensity is 115.9 percent.
Table 1.8 Land Use Pattern in Ahmedabad District (Area in Ha)
Sl Name of Taluka
Total
Geographical
Area
Area under Agriculture Area
under
forest
Area
under
wasteland
Area
under
other
uses
Gross
Cropped
Area (1)
Net
Sown
Area (2)
Area sown
more than
once (1-2)
Cropping
intensity
(%)
1 Daskroi 69887 73654 52700 20954 139.8 0 6588 705

30
2 Dholka 95577 77189 67500 9689 114.4 0 8060 6354
3 Bavala 76418 63286 44003 19283 143.8 0 13131 10046
4 Dhandhuka 170275 79711 79711 0 100 8664 8675 33163
5 Viramgam 84295 66130 62201 3929 106.3 0 4695 3220
6 Mandal 49496 38648 37050 1598 104.3 0 2460 2010
7 Detroj 35074 30328 29005 1323 104.6 0 1948 888
8 Sanand 75977 73022 52270 20752 139.7 0 4082 2100
9 Ahmedabad City 24420 1284 1084 200 118.5 0 970 260
10 District Total 679414 499910 423777 76133 115.9 8664 50609 58746 Note: The figures for Ahmadabad district exclude the population of Ranpur and Barwala Talukas. Source: Government of Gujarat, Season and Crop Reports, Department of Land Records, Ahmedabad
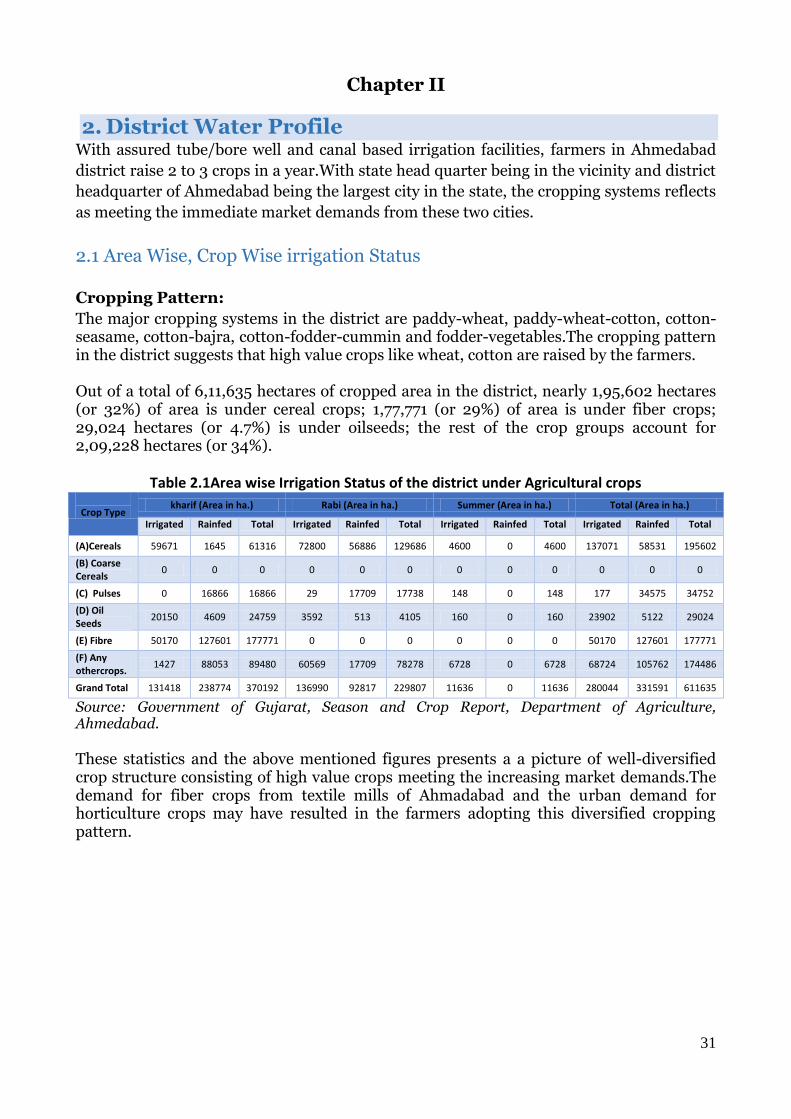
31
Chapter II
2. District Water Profile With assured tube/bore well and canal based irrigation facilities, farmers in Ahmedabad
district raise 2 to 3 crops in a year.With state head quarter being in the vicinity and district
headquarter of Ahmedabad being the largest city in the state, the cropping systems reflects
as meeting the immediate market demands from these two cities.
2.1 Area Wise, Crop Wise irrigation Status
Cropping Pattern:
The major cropping systems in the district are paddy-wheat, paddy-wheat-cotton, cotton-seasame, cotton-bajra, cotton-fodder-cummin and fodder-vegetables.The cropping pattern in the district suggests that high value crops like wheat, cotton are raised by the farmers. Out of a total of 6,11,635 hectares of cropped area in the district, nearly 1,95,602 hectares (or 32%) of area is under cereal crops; 1,77,771 (or 29%) of area is under fiber crops; 29,024 hectares (or 4.7%) is under oilseeds; the rest of the crop groups account for 2,09,228 hectares (or 34%).
Table 2.1Area wise Irrigation Status of the district under Agricultural crops
Crop Type kharif (Area in ha.) Rabi (Area in ha.) Summer (Area in ha.) Total (Area in ha.)
Irrigated Rainfed Total Irrigated Rainfed Total Irrigated Rainfed Total Irrigated Rainfed Total
(A)Cereals 59671 1645 61316 72800 56886 129686 4600 0 4600 137071 58531 195602
(B) Coarse Cereals
0 0 0 0 0 0 0 0 0 0 0 0
(C) Pulses 0 16866 16866 29 17709 17738 148 0 148 177 34575 34752
(D) Oil Seeds
20150 4609 24759 3592 513 4105 160 0 160 23902 5122 29024
(E) Fibre 50170 127601 177771 0 0 0 0 0 0 50170 127601 177771
(F) Any othercrops.
1427 88053 89480 60569 17709 78278 6728 0 6728 68724 105762 174486
Grand Total 131418 238774 370192 136990 92817 229807 11636 0 11636 280044 331591 611635
Source: Government of Gujarat, Season and Crop Report, Department of Agriculture, Ahmedabad. These statistics and the above mentioned figures presents a a picture of well-diversified crop structure consisting of high value crops meeting the increasing market demands.The demand for fiber crops from textile mills of Ahmadabad and the urban demand for horticulture crops may have resulted in the farmers adopting this diversified cropping pattern.

32
Figure 2.1 Area under various crops in Ahmadabad District
Both during Kharif and Rabi season, an almost equal amount of area is under cultivation in the district. Moreover, while the diversification of cropping is much more in khraiff season than in the rabi season where wheat, bajra and few other crops were grown during the Rabi season. Further diversification and intensification of the cropping system may lead to better returns to the farmers and the irrigation infrastructure may facilitate such a diversification and intensification process in the district. Area under Fruits and Vegetables: Nearly 66,047 hectares or close to 10 percent of cultivated area in the district is under horticulture crops. Vegetables account for 30874 hectares (or 50%) of the area under horticulture crops followed by spices with 25,720 hactares (or 41%) of the area. Fruits and flowers account for the rest 9 percent of the area under horiculure crops in the district.
Paddy26%
WHEAT38%
BAJRI0%
GRAM5%
MATH1%
UDID0%
TUR0%CASTOR
9% MUSTARD0%
SESAMUM0%
COTTON21%
Fig: Area Under Multiple Crops in Ahmadabad District (%)

33
Figure 2.2 Area under various horticulture crops in Ahmedabad District
Though horticulture crops were grown in almost all the taluks in Ahmedabad district, the
taluks of Daskroi, Dholka, Dhandhuka and Viramgam account for 10 to 11 thousand
hectares of area each.
Table 2.2 Area under Horticulture Crops in Ahmedabad District (in ha.) S# Name of Taluka Fruits Vegetables Spices Flowers Grand Total
1 Daskroi 706 9688 280 663 11337
2 Dholka 1407 7445 1818 1061 11731
3 Bavla 261 1700 1415 16 3392
4 Dhandhuka 143 270 10129 16 10558
5 Sanand 335 5751 967 4 7057
6 Viramgam 532 2453 6805 5 9795
7 Mandal 204 3026 3880 0 7110
8 Detroj 382 541 426 0 1349
9 Ahmedabad City 0 0 0 0 0
10 Total Area (Ha) 3970 30874 25720 1765 62329
Source: Government of Gujarat, Season and Crop Report, Department of Agriculture,
Ahmedabad.
While spices were grown in large area in Dhandhuka, Viramgam taluks, vegetables were
grown in relatively larger tracts in Daskroi, Dholka, Sanad taluks. Efforts by the
horticulture department and proximity of these taluks to Ahmedbad and Gandhinagar
cities ensuring ready market for the horticulture produce explains such cropping pattern.
Irrigation for each type of crop
Paddy is cultivated in 1,17,443 hectares in Ahemdabad district and most of it is cultivated in irrigated conditions. Wheat is cultivated in 1,72,554 hectares out of which 75 percent is cultivated in irrigated conditions and the rest is cultivated in rainfed conditions.
Fruits6%
Vegetables50%
Spices41%
Flowers3%

34
Table 2.3 Major Crop-Wise Irrigation Status of Ahmedabad District (Block Wise) Name of Crops
Khariff Rabi Season Summer Grand Total
Rainfed Irrigated
Total Rainfed Irrigated
Total Rainfed Irrigated
Total Rainfed Irrigated
Total
Paddy 0 117443 117443 0 0 0 0 117443 117443
WHEAT 42856 129698 172554 42856 129698 172554
BAJRI 1652 0 1652 0 250 250 1652 250 1902
GRAM 20521 169 20690 20521 169 20690
MATH 3415 0 3415 3415 0 3415
UDID 2112 0 2112 0 2 2 2112 2 2114
TUR 1080 0 1080 1080 0 1080
CASTOR 2694 35875 38569 2694 35875 38569
MUSTARD 188 1070 1258 188 1070 1258
SESAMUM 1033 0 1033 0 105 105 1033 105 1138
COTTON 81664 13650 95314 81664 13650 95314
TOTAL 94608 167156 261764 63565 131035 194600 0 504 504 158173 298695 456868
Source: Government of Gujarat, Season and Crop Report, Department of Agriculture,
Ahmedabad.
In terms of area under cultivation, rice and wheat is followed by cotton which is cultivated
in 95,314 hectares out of which 14 percent is cultivated in irrigated conditions and the rest
in rainfed conditions. Castor is cultivated in 38,569 hectares out of which 93 percent is
cultivated in irrigated conditions and the rest of the area is under rainfed conditions.
Further, 62000 hactares (or 99%) of the area under horticulture crops is cultivated under
irrigated conditions.
2.2 Production and Productivity of Major Crops The details of the area, production and yield of various crops of Ahmedabad district can be observed in table. 2.4. The productivity of crops is lower than the best practice/recommended practices. For instance, as per the package of practices, the expected yield of Paddy should be between 30-35 quintal per hectare4, while actual productivity is 25-30 Quintal per Hectare. While the yield per hectare as per recommended package of practice for wheat is between 29-30 quintals per hectare5, the actual yield is 32 quintal per hectare. The expected yield of cotton is 8.0quintal per hectare while the actual productivity is 6.5 quintal per hectare.
Table 2.4Area, Production and Productivity of Major Crops in Ahmedabad District Rainfed Irrigated Total
Crops Area
(ha)
Production
(Qtn/Yr)
Productivity or Yield
(kg/ha)
Cost of Cultivati
on (Rs/ha)
Area (ha)
Production
(Qtn/Yr)
Productivity or Yield
(kg/ha)
Cost of Cultivati
on (Rs/ha)
Area(ha)
Production
(Qtn/Yr)
Productivity or Yield
(kg/ha)
Cost of Cultivati
on (Rs/ha)
Khariff Season Paddy 0 0 0 NA 1174
43 248171
7 2113 NA 11744
3 248171
7 2113 NA
BAJRI 165 6172.29 374 NA 0 0 0 NA 1652 6172.29 374 NA
4 Govt of Gujarat (2007), Strategic Research Extension Plan of Ahmadabad district, pp.xxx.
5 Govt of Gujarat (2007), Strategic Research Extension Plan of Ahmadabad district, pp.xxx.

35
2
MUNG 651 3081.67 473 NA 0 0 0 NA 651 3081.67 473 NA
MATH 3415
15546.8 455 NA 0 0 0 NA 3415 15546.8 455 NA
UDID 2112
9240 438 NA 0 0 0 NA 2112 9240 438 NA
TUR 1080
9450 875 NA 0 0 0 NA 1080 9450 875 NA
GROUNDNUT
40 312.5 781 NA 13 0 0 NA 53 414.063 781 NA
CASTOR 2694
24704 917 NA 35875
657947.5
1834 NA 38569 1061033
2751 NA
SESAMUM
1033
4410.91 427 NA 0 0 0 NA 1033 4410.91 427 NA
COTTON 81664
144545 177 NA 13650
82446 604 NA 95314 744402 781 NA
TOBACCO 0 0 0 NA 50 250 500 NA 50 250 500 NA
GUAR SEED
267 1016.27 381 NA 125 190.3125
152 NA 392 2088.87 533 NA
Rabi Season WHEAT 428
56 126318 295 NA 1296
98 400118
3 3085 NA 17255
4 583189
4 3380 NA
GRAM 20521
54714.1 267 NA 169 395.46 234 NA 20690 103579 501 NA
RAPESEED & MUSTARD
188 376 200 NA 1070 10700 1000 NA 1258 15096 1200 NA
ISABGUL 0 0 0 NA 20 30.25 151 NA 20 30.25 151 NA
FENNEL 0 0 0 NA 48 0 0 NA 48 0 0 NA
TOBACCO 0 0 0 NA 30 75 250 NA 30 75 250 NA
Summer Season BAJRA 0 0 0 NA 250 1643.12
5 657 NA 250 1643.13 657 NA
MUNG 0 0 0 NA 147 397.635 271 NA 147 397.635 271 NA
SESAMUM
0 0 0 NA 105 56.04375
53 NA 105 56.0438 53 NA
*Yield R - Yield under Rainfed Conditions (kg/ha), CC- Cost of Cultivation
Source: Department of Agriculture, Season and Crop Reports, Government of Gujarat, Gandhinagar.
Productivity of Horticulture Crops: Horticulture crops were grown in about 10 percent of the total cropped area in the district
and vegetables and spices alone account for close to 90 percent of the total area under
horticulture crops followed by fruits and flowers accounting for the remaining 10% of the
area under horticulture crops. Though the productivity levels of horticulture crops was
high in the district, with better water management practice using drip and sprinkler
irrigation, there is scope for even better productivity and simultaneous reduction of
wastage of water.
Table 2.5Area, Production and Productivity of Horticulture Crops in Ahmedabad District, 2014-15
Sr.No Crop Name Total Area
(Ha)
Production
(MT)
Productivity
(Prod/Area)
I Fruit Crops
1 Mango 250 1163 4.65
2 Sapota 113 1102 9.75

36
૩ Citrus 1480 16443 11.11
4 ber 728 7259 9.97
5 Banana 159 7672 48.25
6 Guava 285 4218 14.80
7 Pomegranate 130 1586 12.20
8 Date Palm 2 17 8.50
9 Papaya 200 10300 51.50
10 Custard Apple 510 6018 11.80
11 Aonla 218 2780 12.75
12 CashewNut 4 0 0.00
13 Coconut 4 28 7.00
14 Others 210 1670 7.95
II Vegetable Crops
1 Potato 0 0 0.00
2 Onion 0 0 0.00
3 Brinjal 3780 72009 19.05
4 Cabbage 1207 21726 18.00
5 Okra 2440 19593 8.03
6 Tomato 5200 145860 28.05
7 Cauliflower 1800 27900 15.50
8 Cluster Bean 3300 33924 10.28
9 Cow Pea 2565 25034 9.76
10 Cucurbits 8205 127998 15.60
11 Other 3722 58100 15.61
III Spice Crops
1 Cumin 23600 14160 0.60
2 Fennel 100 98 0.98
૩ Chilli Green 162
206 1.27
4 Chilli Dry 100 0.62
5 Garlic 0 0 0.00
6 Coriander 100 145 1.45
7 Ginger 0 0 0.00
8 Termaric 0 0 0.00
9 Fenugreek 652 1369 2.10
10 Isabgul 200 200 1.00
11 Ajwa 5 4 0.80
12 Suva 3300 4125 1.25
IV Flower Crops
1 Rose 410 4005 9.77
2 Marigold 840 7852 9.35
3 Mogra 166 1585 9.55
4 Lily 169 1580 9.35
5 Other 191 1725 9.03
Source: Department of Agriculture, Season and Crop Reports, Government of Gujarat, Gandhinagar.

37
2.3 Area Wise Irrigation in Ahmedabad District: Out of the total geographical area of 6,81,419 hactares of Ahmedabad district, nearly 3,80,468 hectares (or 56%) is the irrigated area and the remaining 2,80,505 hectares (or 44%) is rainfed area. While the Talukas of Dholaka (88%), Sanand (102%), Bavala (84%) and Daskroi (84%) have a relatively higher irrigated area and in the rest of the taluks, the irrigated area is less than 50 percent. Lowest Irrigated area is noticed in Mandal (26%) and Dhandhuka (14%) taluks.
Table 2.8: Irrigation Based Classification in Ahmedabad District, 2014-15
SNo Name of Taluka Total
Geographical Area
Irrigated (Area in Ha)
Rainfed (Area in Ha)
Gross
Cultivated Area
% Gross Irrigated
Area %
Partially Irrigated
/ Protectiv
e Irrigation
%
Un-lrrigated
or Totally Rainfed
%
1 2 3 4 5=(4/3*100)
6 7=(6/3*100)
8 9=(8/3*100)
10 11=(10/3
*100)
1 Daskroi 69887 58882 84.3 0 0 10854 15.5 69736 99.8
2 Dholaka 95577 83726 87.6 0 0 37910 39.7 121636 127.3
3 Bavala 76418 64264 84.1 0 0 25807 33.8 90071 117.9
5 Dhandhuka 170275 24436 14.4 0 0 99159 58.2 123595 72.6
6 Viramgam 84295 40177 47.7 0 0 45205 53.6 85382 101.3
7 Detroj-Rampura 35074 18696 53.3 0 0 17220 49.1 35916 102.4
8 Sanand 75977 77220 101.6 0 0 19380 25.5 96600 127.1
9 Mandal 49496 13067 26.4 0 0 33970 68.6 47037 95.0
9 Ahmedabad City 24420 0 0.0 0 0 0 0.0 0 0.0
10 Grand Total 681419 380468 55.8 0 0 289505 42.5 669973 98.3

38
Chapter 3: Water Availability in Ahmedabad The climate of the district is characterised by hot summer and general dryness except during the southwest monsoon seasons. Long term average annual rainfall recorded by IMD station at Ahmedabad is 799.6 mm. Most of the rainfall (about 766 mm) is received from south-west monsoon between June and September.
3.a: Drainage The principal rivers of Ahmadabad district include Sabarmati, Vatrak, Khari, Meshwo, Bhogavo, Bhadar, Rodh, Shelwa and Andhli. Out of all these rivers, Sabarmati is the principal river in the district flowing from NE to SW direction in Ahmedabad district. The river Vatrak flows in the district joining Sabarmati and drains in Dholka Taluka. The rivers Khari and Meshwo drain the Dascroi taluka. The river Bhogavo drains Dholka and Dhandhuka talukas. The Bhadar River drains Dhandhuka taluka of the district. River Rodh drains Sanand and Dholka talukas. Rivers Shelwa and Andhli drain Dholka taluka. In terms of Basin/ Sub-basin, Major portion of the district falls under Sabarmati basin. Rupen, Saraswati, Banas form the sub basins. 3.b: Acquifers The other major source of water in the district are acquifers. The district has acquifers in fissured formation and porous formation. The Deccan trap and the limestone formations occupying the western part of the Dandhuka taluka forms the only hard rock aquifers in the district. However, major part of the district has porous formations. It includes the post-Miocene alluvial deposits at the top, underlained by older Miocene formations. The sedimentary formations mainly consist of fine to coarse-grained sand, gravel, silt, clay, clay stone, siltstone and kankar. Under fissured formations, the thickness of aquifer varies between 20 and 45 m in general and with in the depth range of 3 and 75 mbgl and can be considered as aquifer A. Under porous formations, the confined aquifers are grouped and designated as B, C & D with in the post Miocene alluvial sediments and G and F aquifers in Miocene sediments with in the drilled depth of 565 m in the district. The distribution of the confined aquifers varies considerably in the district. The aquifers that are developed include B and C and to some extent the upper part of the D aquifers of the post Miocene alluvial aquifer and can be termed as user confined aquifers.
3.1 Status of Water Availability
Inclusive of all water resources, Ahmadabad district has an estimated water availability of 2849.2656 mcm out of which 1935.7806 mcm (or 68%) is canal based surface water and 392.3750 mcm (or 14%) is untreated affluent and the remaining 521.1100 mcm (or 18%) is the ground water availability in the district.
Table 3.9: Status of Water Availability in Ahmadabad District (MCM) S.No. Sources Kharif Rabi Summer Total
1 Surface Irrigation
(i) Canal(Major & Medium
Irrigation) 733.4585 1202.3220 0.0000 1935.7806
(ii) Minor Irrigation tanks 0.0000 0.0000 0.0000 0.0000 (iii) Lift Irrigation/Diversion 0.0000 0.0000 0.0000 0.0000
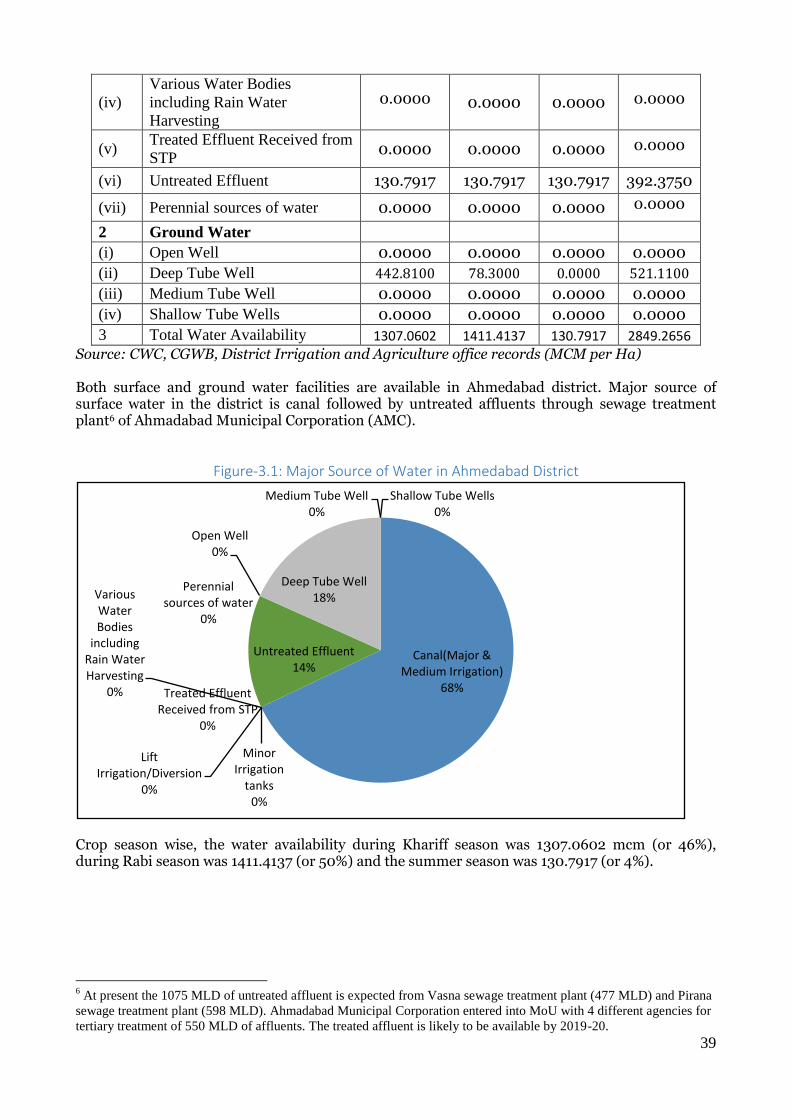
39
(iv)
Various Water Bodies
including Rain Water
Harvesting
0.0000 0.0000 0.0000 0.0000
(v) Treated Effluent Received from
STP 0.0000 0.0000 0.0000 0.0000
(vi) Untreated Effluent 130.7917 130.7917 130.7917 392.3750
(vii) Perennial sources of water 0.0000 0.0000 0.0000 0.0000 2 Ground Water
(i) Open Well 0.0000 0.0000 0.0000 0.0000
(ii) Deep Tube Well 442.8100 78.3000 0.0000 521.1100
(iii) Medium Tube Well 0.0000 0.0000 0.0000 0.0000
(iv) Shallow Tube Wells 0.0000 0.0000 0.0000 0.0000
3 Total Water Availability 1307.0602 1411.4137 130.7917 2849.2656
Source: CWC, CGWB, District Irrigation and Agriculture office records (MCM per Ha)
Both surface and ground water facilities are available in Ahmedabad district. Major source of surface water in the district is canal followed by untreated affluents through sewage treatment plant6 of Ahmadabad Municipal Corporation (AMC).
Figure-3.1: Major Source of Water in Ahmedabad District
Crop season wise, the water availability during Khariff season was 1307.0602 mcm (or 46%), during Rabi season was 1411.4137 (or 50%) and the summer season was 130.7917 (or 4%).
6 At present the 1075 MLD of untreated affluent is expected from Vasna sewage treatment plant (477 MLD) and Pirana
sewage treatment plant (598 MLD). Ahmadabad Municipal Corporation entered into MoU with 4 different agencies for
tertiary treatment of 550 MLD of affluents. The treated affluent is likely to be available by 2019-20.
Canal(Major & Medium Irrigation)
68%
Minor Irrigation
tanks0%
Lift Irrigation/Diversion
0%
Various Water Bodies
including Rain Water Harvesting
0% Treated Effluent Received from STP
0%
Untreated Effluent14%
Perennial sources of water
0%
Open Well0%
Deep Tube Well18%
Medium Tube Well0%
Shallow Tube Wells0%

40
180MLD Sewage Treatment Plant (Pirana) 60MLD Sewage Treatment Plant (old Pirana)
35MLD Sewage Treatment Plant (Vasna) 35MLD Sewage Treatment Plant (Vasna)
All the blocks except Ahmedabad city Taluk in Ahmedabad district have availability of canal water across both the seasons. The total availability of surface water in the district is 2328.16 MCM. Among the Taluks, Dholka Taluk has the largest surface water availability with 692.28 MCM, followed by Ahmedabad city taluk with 392.4 MCM, Dhandhuka talukwith 387.06 MCM and Mandal Taluk with 196.963 MCM.
Table 3.2a: Block wise Water availability from Canal (MCM) S# Blocks/ Taluka Kharif Rabi Summer Total
1 Mandal 55.15 141.81 0.00 196.96
2 Detroj-Rampura 32.83 84.43 0.00 117.26
3 Viramgam 68.54 161.87 0.00 230.41
4 Sanand 32.91 61.13 0.00 94.04
5 Ahmedabad City 130.79 130.79 130.79 392.38
6 Daskroi 83.72 84.83 0.00 168.55
7 Dholka 326.96 365.31 0.00 692.28
8 Bavla 17.23 32.00 0.00 49.22 9 Dhandhuka 116.12 270.94 0.00 387.06
10 Total 864.25 1333.11 130.79 2328.16
GWRDC (2011):District and Taluk Wise Ground Water Resources, Availability, Utilization, Storage of Ground Water Development, Government of Gujarat, Gandhinagar. As per the data provided by Gujarat Water Resource Development Corporation, Ground water is
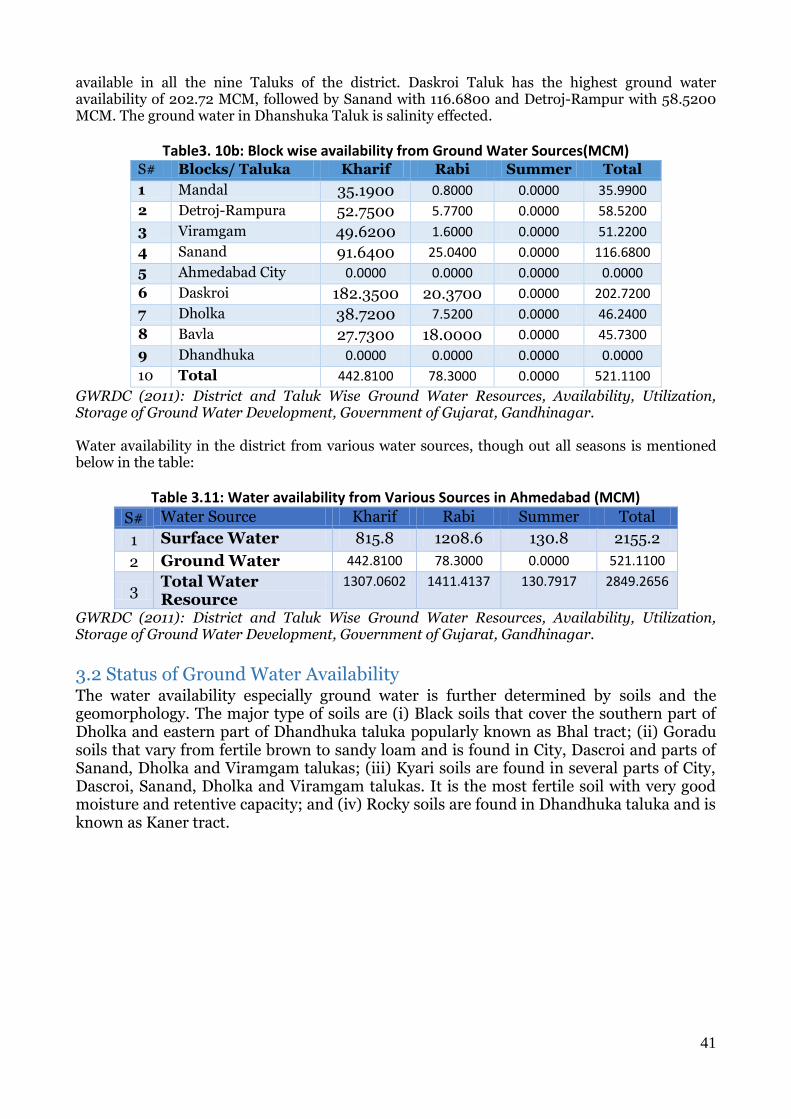
41
available in all the nine Taluks of the district. Daskroi Taluk has the highest ground water availability of 202.72 MCM, followed by Sanand with 116.6800 and Detroj-Rampur with 58.5200 MCM. The ground water in Dhanshuka Taluk is salinity effected.
Table3. 10b: Block wise availability from Ground Water Sources(MCM) S# Blocks/ Taluka Kharif Rabi Summer Total
1 Mandal 35.1900 0.8000 0.0000 35.9900
2 Detroj-Rampura 52.7500 5.7700 0.0000 58.5200
3 Viramgam 49.6200 1.6000 0.0000 51.2200
4 Sanand 91.6400 25.0400 0.0000 116.6800
5 Ahmedabad City 0.0000 0.0000 0.0000 0.0000
6 Daskroi 182.3500 20.3700 0.0000 202.7200
7 Dholka 38.7200 7.5200 0.0000 46.2400
8 Bavla 27.7300 18.0000 0.0000 45.7300
9 Dhandhuka 0.0000 0.0000 0.0000 0.0000
10 Total 442.8100 78.3000 0.0000 521.1100
GWRDC (2011): District and Taluk Wise Ground Water Resources, Availability, Utilization, Storage of Ground Water Development, Government of Gujarat, Gandhinagar. Water availability in the district from various water sources, though out all seasons is mentioned below in the table:
Table 3.11: Water availability from Various Sources in Ahmedabad (MCM) S# Water Source Kharif Rabi Summer Total
1 Surface Water 815.8 1208.6 130.8 2155.2
2 Ground Water 442.8100 78.3000 0.0000 521.1100
3 Total Water Resource
1307.0602 1411.4137 130.7917 2849.2656
GWRDC (2011): District and Taluk Wise Ground Water Resources, Availability, Utilization, Storage of Ground Water Development, Government of Gujarat, Gandhinagar.
3.2 Status of Ground Water Availability The water availability especially ground water is further determined by soils and the geomorphology. The major type of soils are (i) Black soils that cover the southern part of Dholka and eastern part of Dhandhuka taluka popularly known as Bhal tract; (ii) Goradu soils that vary from fertile brown to sandy loam and is found in City, Dascroi and parts of Sanand, Dholka and Viramgam talukas; (iii) Kyari soils are found in several parts of City, Dascroi, Sanand, Dholka and Viramgam talukas. It is the most fertile soil with very good moisture and retentive capacity; and (iv) Rocky soils are found in Dhandhuka taluka and is known as Kaner tract.

42
Geomorphology of the area plays an important role in deciphering the sub-surface and surface hydrogeological conditions. The district forms a part of the CAMBAY BASIN. The major portion of it forms a flat planar topography except for a few rocky features in the extreme southern portion. Ground Water in Fissured Formations (Hard rocks): In the western part of the Dhandhuka taluka har rock aquifers under the Deccan trap and the limestone formations occur in the district. The thickness of the weathered zone of the basalt ranges from less than one meter to more than 6 m and the joints and fracture system is prevalent down to a maximum depth of 80 to 90 mbgl in the basaltic terrain. Ground water occurs in the weathered and fissured zones mainly under water table conditions. These fissured formations do not form good repository of groundwater, compared to porous unconsolidated sedimentary formations.Depth of dugwells in the limestone formations varies between 12 and 38 mbgl. Deeper wells are constructed in the western part in these formations. The average yield of the wells in the trap formations varies between 50 and 1000 cu.m/day and of the wells in the limestone varies between 50 and 200 cu.m/day. Ground Water in Porous Formations (Sedimentaries): This occupies 94 percent of the district. The sedimentary formations mainly consist of fine to coarse-grained sand, gravel, silt, clay, clay stone, siltstone and kankar. Ground water occurs under phreatic as well as confined conditions in the granular horizons with in the sedimentaries. The unconfined aquifer occurs in the upper horizons down to a maximum depth of 60-75 mbg consisting of medium to fine grained sand, silt with local lenses of sandy clay and clay. The thickness of aquifer varies between 20 and 45 m in general, met with in the depth range of 3 and 75 mbgl and can be considered as aquifer A.Ground water occurs under phreatic conditions in the north eastern part of the district. It bears potable and good quality water in the north eastern part of the district and eastern part of Dascroi taluka (east of Khari river). It is being developed by dug, dug-cum-bored wells and tube wells. The depth of the dug wells and dug-cum-bored wells usually
varies between 10 and 60 mbgl. The tube wells range between 42 and 167 mbgl. In the rest part of

43
the area it bears brackish to saline ground water. Hence ground water development is meagre and dug wells are constructed in or vicinity of ponds to meet the local demands. The upper unconfined aquifer is underlained by persistent clay formations of considerable thickness in the entire area of porous sedimentary formations. This separates the lower unit consisting of a few hundred meters of alternating sandy and argillaceous beds forming the confined aquifer system. The arenaceous horizons of the confined aquifer, consists of medium to coarse-grained sand with gravel interstratified locally with silty or clayey sand and clay lenses. The confined aquifers are grouped and designated as B, C & D with in the post Miocene alluvial sediments and G and F aquifers in Miocene sediments with in the drilled depth of 565 m in the district. Confined aquifers with potable water occurs down to 300 to 350 m in the area towards north and north east of the low lying ‟Bhal‟ land in the district. The aquifers that are developed include B and C and to some extent the upper part of the D aquifer. As per Central Ground Water Board notification, the status ground water in Daskroi taluk is Over Exploitated, status in Dholka taluka is Critical and Detroj-Rampura and Viramgam Taluks the status is semi-critical. As reported by the central ground water board Bavla, Mandal and Sanand Taluks are in safe category.In Dhandhuka taluka grand water is Saline. Further details are given in following table.
Table 3.12: Ground Water Status of Ahmedabad Name of Taluka
Status of block as per central ground water board notification
Ground water (MCM)
OE Critical Semi Critical Safe Saline Draft Recharge Gap
Bavla Safe 15.96 45.73 -29.77
Daskroi OE 199.78 202.72 -2.94
Detroj-Rampura
Semi critical 39.99 58.53 -18.54
Dhandhuka Saline NA NA NA
Dholka Critical 40.48 46.25 -5.77
Mandal Safe 16.54 35.99 -19.45
Sanand Safe 66.82 116.68 -49.86
Viramgam Semi critical 39.6 51.22 -11.62
Ahmadabad 419.17 557.12 -137.95
The stage of categorization of ground water status is shown in following map. As the map was made in 2011 it includes blocks of Ranpur and Barvala in it. These blocks were later made the part of Bothad district in 2013.

44
3.3 Status of Command Area
Out of the total command area of 3,90,001 hectares in Ahmadabad district, 2,27,872 hectares (or 58.4%) is developed area and the rest of the area is undeveloped. While most of the other service command is developed, only 56.7% of the canal command area is developed and the rest is undeveloped. While the Taluks of Daskroi (89.4%), Detroj-Rampura (81.3%), Mandal (71%), Viramgam (68%) and Sanand (63%) had higher developed command area, rest of the taluks, the developed command area is less than the district average.The information on the other Services Command has been in the blocks of Dasroki, Dholka and Viramgam and all the area is reported to be developed. Projects works were planned in the strategic action plan such that the undeveloped command area is developed by taking up engineering works in the command area.
Table 3.5: Block wise Canal and other services Command in Ahmadaad District Name of the Taluka
Information of Canal Command Information on the other Services Command
Total Area (in Hectares)
Total Area
Developed Area
Undeveloped Area
Total Area
Developed Area
Undeveloped Area
Developed Area
Undeveloped Area
Bavla 35523 17334 18189 0 0 0 17334 18189 Daskroi 31745 28391 3354 7290 7290 0 35681 3354
Detroj-Rampura
22166 18015 4151 0 0 0 18015 4151
Dhandhuka 73168 17986.00 55182 0 0 0 17986 55182 Dholka 62767 31101.00 31666 8208 8208 0 39309 31666
Mandal 37233 26447 10786 0 0 0 26447 10786 Sanand 58008 36378 21630 0 0 0 36378 21630 Viramgam 52031 35251 16780 402 402 0 35653 16780 Ahmedabad 1460 1069 391 1069 391 Total 374101 211972 162129 15900 15900 0 227872 162129
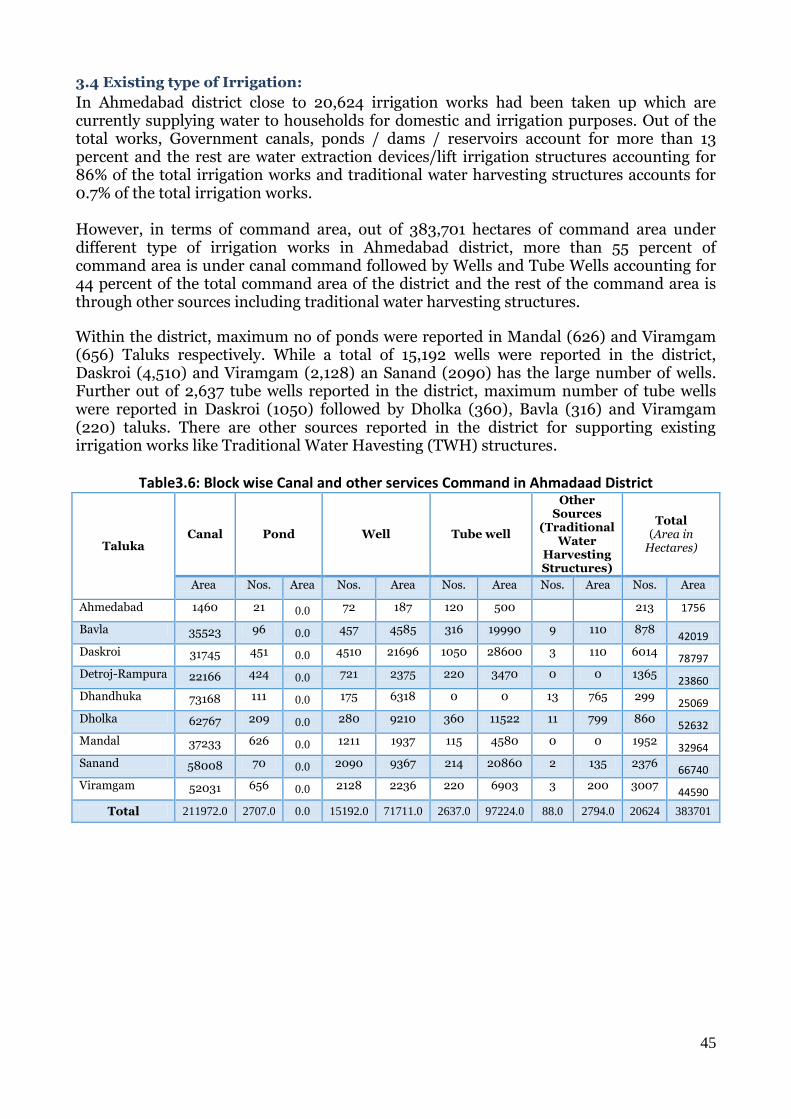
45
3.4 Existing type of Irrigation:
In Ahmedabad district close to 20,624 irrigation works had been taken up which are currently supplying water to households for domestic and irrigation purposes. Out of the total works, Government canals, ponds / dams / reservoirs account for more than 13 percent and the rest are water extraction devices/lift irrigation structures accounting for 86% of the total irrigation works and traditional water harvesting structures accounts for 0.7% of the total irrigation works. However, in terms of command area, out of 383,701 hectares of command area under different type of irrigation works in Ahmedabad district, more than 55 percent of command area is under canal command followed by Wells and Tube Wells accounting for 44 percent of the total command area of the district and the rest of the command area is through other sources including traditional water harvesting structures.
Within the district, maximum no of ponds were reported in Mandal (626) and Viramgam (656) Taluks respectively. While a total of 15,192 wells were reported in the district, Daskroi (4,510) and Viramgam (2,128) an Sanand (2090) has the large number of wells. Further out of 2,637 tube wells reported in the district, maximum number of tube wells were reported in Daskroi (1050) followed by Dholka (360), Bavla (316) and Viramgam (220) taluks. There are other sources reported in the district for supporting existing irrigation works like Traditional Water Havesting (TWH) structures.
Table3.6: Block wise Canal and other services Command in Ahmadaad District
Taluka Canal Pond Well Tube well
Other Sources
(Traditional Water
Harvesting Structures)
Total (Area in
Hectares)
Area Nos. Area Nos. Area Nos. Area Nos. Area Nos. Area
Ahmedabad 1460 21 0.0 72 187 120 500 213 1756
Bavla 35523 96 0.0 457 4585 316 19990 9 110 878 42019
Daskroi 31745 451 0.0 4510 21696 1050 28600 3 110 6014 78797
Detroj-Rampura 22166 424 0.0 721 2375 220 3470 0 0 1365 23860
Dhandhuka 73168 111 0.0 175 6318 0 0 13 765 299 25069
Dholka 62767 209 0.0 280 9210 360 11522 11 799 860 52632
Mandal 37233 626 0.0 1211 1937 115 4580 0 0 1952 32964
Sanand 58008 70 0.0 2090 9367 214 20860 2 135 2376 66740
Viramgam 52031 656 0.0 2128 2236 220 6903 3 200 3007 44590
Total 211972.0 2707.0 0.0 15192.0 71711.0 2637.0 97224.0 88.0 2794.0 20624 383701

46
Chapter- IV
4.Water Requirement
Ahmedabad district is highly urbanised district and state capital of Gandhinagar is also in
close proximity. The urban ethos and amenities/facilities were also available in the
neighbouring villages of these two cities. Being a highly industrialized district, the
population of Ahmedabad had grown and its neighbouring villages have expanded at a
relatively faster pace effecting the water demand. The programs and schemes of the
government promoting piped water supply to villages, measures promoting micro and
drip/sprinkler irrigation programs and insistence on usage of water efficiency promoting
measures for having electricity connections and the efforts to promote a diversified crop
structure etc. effected the demand for water in the villages. Further, the industrialization
and growth of service sector that took place in the district also effected the water demand
apart from the crop cultivation and domestic water demand.
4.1 Domestic Water Demand As per the latest 2011 census nearly 62 percent of the households in Ahmedabad district
were having tapped water from treated source for drinking water7 thus having a high
existing potential. Considering the priority given to domestic water demand for drinking
purpose over all other uses of water, the domestic water demand requirement is estimated
as per the provision of 100 liters per capita per day in rural areas and 140 liters per capita
per day in urban area while estimating the domestic water demand.
The population growth rate of Ahmedabad district at 24 percent between 2001 and 2011 is
higher than the population growth rate of Gujarat (19.2%). Further, the urban population
of Ahmedabad district (85%) is twice than the Gujarat state (42%) and even though the
urban population of Gujarat is growing at a relatively faster pace, Ahmedabad being in the
vicinity of Gandhinagar and being the industrial hub, attracts large migrant from all over
Gujarat and India.
Table 0.1Domestic Water Demand in AhmedabadDistrict (No)
7 The other sources along with percentage are tapped water from untreated source (17.63%), covered well (0.77%), Un
covered well (1.16%), Hand pump (1.52%), tube well/borehole (10.58%), spring (0.03%), river/canal (0.16%),
tank/pond/lake (0.23%) and other sources (0.88%)
S# Name of Block Population in 2015 Projected Population in 2020
Existing Water
Demand (MCM)
Gross Water
Demand (MCM)
Rural Urban Rural Urban
1 Mandal 78788 0 87229 0 2.8757 3.1839
2 Detroj-Rampura 93183 0 103167 0 3.4012 3.7656
3 Viramgam 153957 62520 170453 69218 8.8142 9.7586
4 Sanand 158990 107397 176024 118904 11.2911 12.5009
5 Ahmadabad City 0 6255791 0 6926055 319.6709 353.9214
6 Daskroi 209196 151239 231610 167443 15.3640 17.0101
7 Dholka 189176 90658 209445 100372 11.5376 12.7737
8 Bavla 129621 47553 143509 52648 7.1611 7.9284

47
The population of Ahmedabad district is likely to reach 87.36 Lakh by 2020. This would
result in a demand of 428 Million Cubic Meters which is higher than the existing water
demand of 386.5847 million cubic meters showing an additional domestic water demand
requirement of 41.4 million cubic meters.
4.2 Crop Water Demand
Ahmedabad district has nearly 4.56 lakh hectares as the total cropped area out of which more than 65% of the area is considered as irrigated in the district. Under irrigated conditions a well-diversified cropping system was promoted with a focus on high value crops like cotton, castor, along with food grains like paddy, wheat. While further intensification and diversification of existing cropping system may be attempted in the district with adequate and effective irrigation.
With the provision of irrigation facilities, farmers may be successful in bringing the fallow
lands and culturable waste lands under cultivation and may also bring additional area both
in Rabi and Summer season under cultivation thereby raising crop intensity. While
conversion of the present rainfed area into irrigated area is being taken into account for
estimating the demand for water for raising crops, other factors such as changes in
cropping pattern and additional area being brought into cultivation have not been
considered. If the latter is included, the water demand as estimated in the following table
may increase further.
4.2.1 Crop Water Demand:
Table 0.2 Crop Water Requirement in Ahmedabad District (in Million Cubic Meters)
Name of Taluks Name of
Crops
Area
sown
(Ha)
Irrigat
ed area
(ha)
Crop
Water
Demand
(MCM)
Existing
Water
Potential
(MCM)
Additional Water
Potential
Required to
bridge the
demand gap
(MCM)
Water
Potential to
be created
in the next
4 years
(MCM)
(1) (2) (3) (4) (5) (6) 7=(5-6) 8
Mandal All Crops 26645 6475 113 32.2 80.4 80.4
Detroj-Rampura All Crops 20514 14587 84.6 72.3 12.3 12.3
Viramgam All Crops 26182 25535 120.0 117.3 2.7 2.7
Sanand All Crops 65802 63622 274.1 266.3 7.8 7.8
Ahmadabad City All Crops 0 0 0.0 0.0 0.0 0.0
Daskroi All Crops 58638 56609 236.4 226.3 10.1 10.1
Dholka All Crops 92107 64932 376.3 264.4 111.9 111.9
Bavla All Crops 67756 56609 262.9 226.3 36.6 36.6
Dhandhuka All Crops 99224 10326 367.6 45.0 322.6 322.6
Grand Total 456868 298695 1835 1250 584 584
9 Dhandhuka 126310 36372 139843 40269 6.4689 7.1620
10 Grand Total 1,139,220 6,751,530 1,261,280 7,474,908 386.5847 428.0045

48
It is estimated that nearly 1,835 million cubic meters of water is required for watering
cropped area in Ahmedabad district. The taluka wise crop water requirement shows that
out of the total crop water requirement Dhokla (376 mcm), Dhandhuka (367 mcm),
Sanand (274 mcm), Bavla (263 mcm) has largest crop water demand followed by
Viramgam, Detroj-Rampura and Mandal talukas.
Existing water potential and water potential to be created:
The crop wise water demand depends on per hectare crop water requirement8 and
cropping pattern. The existing water potential is the extent of area already under irrigation
irrespective of the source and type of irrigation. As can be seen, the existing water potential
is 45 percent of the total demand leaving a huge 55% of crop water demand unmet and
hence additional water potential needs to be created in the district.
However, since close to 80 per cent of the water demand is coming from crop sector alone
and management of demand for crop cultivation were proposed in the strategic plan to
reduce usage of water through schemes and programs aimed at water saving measures &
promotion of technologies increasing efficient water use.
Figure 0.1Existing Water Potential and Water Potential to be created (in mcm)
The block wise crop water demand, existing potential and water potential to be created varies in each of the four taluks. While the talukas of Sanad, Daskrol and Viramgam has a
8The water requirement of cops per hectare of area are 0.003 mcm for paddy; 0.0048 to 0.002 mcm in the case of Wheat; 0.004 mcm in case of pearl millet, 0.0035 to 0.004 mcm in case of sorghum; 0.004 to 0.003 mcm in the case of green gram; 0.0052 to 0.0072 mcm in the case of cotton, 0.004 to 0.0052 mcm in the case of groundnut; 0.004 mcm in the case of potato0.042 to 0.005 in the case of sugarcane. A loss of 40 percent is considered for distribution and application losses as well as excessive use of water by farmers.
1835
1250
584.4188 584.4188
0
200
400
600
800
1000
1200
1400
1600
1800
2000
Crop Water Demand (MCM) Existing Water Potential (MCM)
Water Potential Required (MCM)
Water Potential to be created (MCM)
Graph-: Existing Water Potential and Water Potential to be Created in Ahmedabad District (in mcm)

49
very high existing water potential close to the water demand, the talukas of Dhandhukla and Mandal has a relatively lower existing water potential compared to the demand.
Figure 0.2Taluka Wise Existing Crop Water Potential and Water Potential to be created (mcm)
4.3 Livestock Water Demand There were 11.16 Lakh livestock in Ahmedabad district according to the 2012 livestock census. The district has seen an increase by approximately 20% in the total livestock population which was recorded as 8.58 lakhs during Livestock census 2007. Animal husbandry is an important source of livelihood for households in Ahmedabad district along with farming. All the taluks have animal husbandry which requires water.
Figure 0.3:Livestock Water Demand (in Million Cubic Meters) S# Block Total
number of
livestock in 2015
Total number
of livestock in 2020
Present water
demand (MCM)
Water Demand in 2020 (MCM)
Existing water
potential (MCM)
Water potential
to be created (MCM)
1 Mandal 42285 44399 0.9084 0.9539 0.9084 0.04542
2 Detroj-Rampura 43269 45432 0.8810 0.9251 0.8810 0.04405
3 Viramgam 74289 78003 1.4947 1.5694 1.4947 0.07473
4 Sanand 279358 293326 1.7706 1.8591 1.7706 0.08853
5 Ahmadabad City 185576 194855 2.1297 2.2362 2.1297 0.10649
6 Daskroi 184166 193374 2.3578 2.4757 2.3578 0.11789
7 Dholka 137942 144839 2.1753 2.2841 2.1753 0.10877
8 Bavla 84131 88338 1.6907 1.7752 1.6907 0.08453
9 Dhandhuka 85596 89876 1.6906 1.7751 1.6906 0.08453
10 District Total 1116612 1172442 15.0989 15.8538 15.0989 0.75494
113
84.6
120.0
274.1
0.0
236.4
376.3
262.9
367.6
80.4
12.3 2.7 7.8 0.0 10.1
111.9
36.6
322.6
32.2
72.3
117.3
266.3
0.0
226.3
264.4
226.3
45.0
80.4
12.3 2.7 7.8 0.0 10.1
111.9
36.6
322.6
0
50
100
150
200
250
300
350
400
Crop Water Demand (MCM) Water Potential Required (MCM)
Existing Water Potential (MCM) Water Potential to be created (MCM)

50
The number of bovines per Sq. Km of geographical area had increased from 0.8 per hectare of area in 2007 to to 1.2 bovines per hectare in 2012 showing a slight increase in bovine density. The increasing bovine density means more demand for water & fodder. Livestock consumes water depending on the size of the animal, growth stage of the animal
and the number & composition of livestock. The per day water requirement of livestock are
6 literes per day for small animals (2.19 cu m of water per year); 65 Litres per day for large
animals (23.7 cu m of water per year) and 0.25 Litres per day for birds (0.09 cu m of water
per year).
The livestock are equally distributed in all the taluks and the water potential created is
spread evenly in all the taluks. Most of the livestock are owned by the individual
households and the water requirement is met through household level sources.
Livestock water demand by 2020 and water potential to be created:
The total livestock water demand in 2015 is 15.09 million cubic meters and the same is
being catered at present by the households. However, by 2020, the livestock water demand
may reach 15.85 million cubic meters resulting in an additional water potential
requirement of 0.75 million cubic meters.
Figure 0.3 Livestock Water Demand in AhmedabadDistrict
15.098915.8538
15.0989
0.75494
0.0000
2.0000
4.0000
6.0000
8.0000
10.0000
12.0000
14.0000
16.0000
18.0000
20.0000
Present water demand (MCM)
Water Demand in 2020 (MCM)
Existing water potential (MCM)
Water potential to be created (MCM)
Graph-: Livestock Water Demand in Ahmadabad District (in Million Cubic Meters)

51
Figure 0.4Livestock Water Demand in AhmedabadDistrict (in Million Cubic Meters)
4.4 Industrial Water Demand Being the capital city of state till 1970 and district headquarter thereafter, and historically known for textiles mills, Ahmedabad district attracted investment in a range of industries. Many of these industrial activity require water and is provided with nearly 44.398 mcm of water allocation by Gujarat Water Infrastructure Ltd through Sardar Sarovar Narmada Nigam Ltd. While 43.48 mcm out of the water allocation is currently being utilized, these industries may require the remaining water allocation as well.
Table 0.3 Industry Water Demand (in Million Cubic Meters) S# Name of Taluka Type of industry Water
Demand MCM in 2015
Water Demanded in 2020 (MCM)
Exiting Water Potential (MCM)
Water Potential To Be Created
(MCM) 1 Mandal 0.0000 0.0000 0.0000 0.0000
2 Detroj-Rampura 0.0000 0.0000 0.0000 0.0000
3
Viramgam
Hindustan Gum & Chem
0.1095 0.0000 0.1095 0.0000
4 Viramgam IOC Ltd 0.0511 0.0000 0.0511 0.0000
5 Viramgam
Viramgam Industrial Estate
7.3000 3.2850 7.3000 0.0000
6 Sanand Myron Realtor 0.0730 0.0000 0.0730 0.0000
7 Sanand GIDC 32.8500 0.0000 32.8500 0.0000
8
Sanand
Zydus Cadila Healthcare
1.6425 0.0000 1.6425 0.0000
9
Sanand
GTIL Properties Pvt Ltd
1.4600 1.4600 1.4600 0.0000
10 Ahmadabad City Dholera SIR 0.0000 0.9125 0.9125 0.0000
0.9 0.9
1.5
1.8
2.1
2.42.2
1.7 1.7
1.0 0.9
1.6
1.9
2.22.5
2.3
1.8 1.8
0.9 0.9
1.5
1.8
2.12.4
2.2
1.7 1.7
0.05 0.04 0.07 0.09 0.11 0.12 0.11 0.08 0.08
0.00
0.50
1.00
1.50
2.00
2.50
3.00
Graph-: Livestock Water Demand in Ahmadabad District (in Million Cubic Meters)

52
Development Authority
11 Daskroi 0.0000 0.0000 0.0000 0.0000
12 Dholka 0.0000 0.0000 0.0000 0.0000
13 Bavla 0.0000 0.0000 0.0000 0.0000
14 Dhandhuka 0.0000 0.0000 0.0000 0.0000
15 Grand Total 43.4861 5.6575 44.3986 0.0000 Source: Internal Documents of Department of Industries, Ahmedabad district, Ahmedabad.
4.5 Water Demand for Power Generation Ahmedabad district has two private power plants producing around 500 MW of power
owned by Torent Power Ltd. While the gas based power plant at Vatva, Ahmedabad had a
capacity of producing 100 MC, the coal based power plant at Sabarmati, and Ahmedabad
district had a capacity of producing 400 MW of power. Another 1600 MW coal based
power plant at Dholera, Ahmedabad district was proposed by Gujarat State Electricity
Corporation Ltd though it was yet to be finalized.
Table 0.4Water Demand for Power Generation in Ahmedabad district (in Million cubic Meters)
Name of Taluka Power Requirement (MW)
Water Demand (MCM)
Water Demanded
in 2020 (MCM)
Exiting Water
Potential (MCM)
Water Potential to be Created
(MCM)
Mandal 0 0 0 0
Detroj-Rampura 0 0 0 0
Viramgam 0 0 0 0
Sanand 0 0 0 0
Ahmadabad City 0 0 0 0
Daskroi 0 0 0 0
Dholka 0 0 0 0
Bavla 0 0 0 0
Dhandhuka 0 0 0 0
District Total 0 0 0 0
4.6 Total Water Demand of the District for Various sectors The present water demand of the district has been assessed to be 2279.82 MCM annually. Out of the total water demand, 1834.6 mcm (80 percent) is the requirement for crop production. This was followed by 386.58 mcm (16.9%) of domestic water requirement, 0 mcm (or 0%) for power generation, 43.41 mcm (or 1.9%) for industry and 15.09 mcm (or 0.6%) water requirement for livestock.
4.6 Total Water Demand of the district for various sectors in Ahmadabad in 2015 (in MCM) S. No.
Name of Taluk Components Total, MCM Domestic Crop Livestock Industrial Power
Generation
1 Mandal 2.8757 112.6680 0.9084 0.0000 0.0000 116.4521
2 Detroj-Rampura 3.4012 84.6123 0.8810 0.0000 0.0000 88.8945
3 Viramgam 8.8142 120.0495 1.4947 7.4606 0.0000 137.8189
4 Sanand 11.2911 274.1102 1.7706 36.0255 0.0000 323.1974

53
5 Ahmadabad City 319.6709 0.0000 2.1297 0.0000 0.0000 321.8007
6 Daskroi 15.3640 236.4445 2.3578 0.0000 0.0000 254.1662
7 Dholka 11.5376 376.2876 2.1753 0.0000 0.0000 390.0005
8 Bavla 7.1611 262.8706 1.6907 0.0000 0.0000 271.7224
11 Dhandhuka 6.4689 367.6069 1.6906 0.0000 0.0000 375.7664
12 Grand Total 386.5847 1834.6494 15.0989 43.4861 0.0000 2279.8191
Figure 0.5Sector Wise Water Demand in Ahmedabad District (Million Cubic Meters) Sectoral Water Demand at Present Sectoral Water Demand by 2020
Between 2015 and 2020, the sectoral changes are very marginal in the case of domestic
use, use by animal husbandry and crop production, the water demand for industry and
power is likely to increase further . Hence, efforts may be placed to reduce water use for
agriculture and water thus saved may be utilized for irrigating more area which is currently
unirrigated. The water saved by judicious irrigation may also be diverted for domestic and
industrial purpose, the two areas where water demand is likely to increase.
Table 0.7Total water demand of the district for various sectors in 2020 (Million Cubic Meters) S. No.
Name of Taluka
Components Total, MCM Domestic Crop Livestock Industrial Power
Generation
1 Mandal 3.1839 112.6680 0.9539 0.0000 0.0000 116.8057 2 Detroj-Rampura 3.7656 84.6123 0.9251 0.0000 0.0000 89.3030 3 Viramgam 9.7586 120.0495 1.5694 3.2850 0.0000 134.6625 4 Sanand 12.5009 274.1102 1.8591 1.4600 0.0000 289.9302 5 Ahmadabad City 353.9214 0.0000 2.2362 0.9125 0.0000 357.0701 6 Daskroi 17.0101 236.4445 2.4757 0.0000 0.0000 255.9303
Domestic17%
Crop80%
Livestock1%
Industrial
2%
Power Generati
on0%
Domestic19%
Crop80%
Livestock1%
Industrial0%
Power Generati
on0%

54
7 Dholka 12.7737 376.2876 2.2841 0.0000 0.0000 391.3454 8 Bavla 7.9284 262.8706 1.7752 0.0000 0.0000 272.5742 9 Dhandhuka 7.1620 367.6069 1.7751 0.0000 0.0000 376.5440
10 Grand Total 428.0045 1834.6494 15.8538 5.6575 0.0000 2284.1653
4.7 Water Budget The water budget shows wide gaps between water availability and water demand in the
district. While the availability at present is 2712.3 mcm, the present water demand is
2279.81 mcm giving rise to a surplus water availability of close to 432.478 mcm which is 15
percent of the current availability. The surplus is possibly on account of consideration of
untreated affluent which, after tertiary treatment, is likely to be available for use in 2020.
Considering the untreated affluents, the district has water surplus and whcih is likely to
decrease in the future.
Figure 0.6Water Budget of Ahmedabad District (in MCM)
At present while the talukas of Viramgam, Sanand, Bavla has negative water budget and is likely to continue to be negative in the future. In rest of the Taluks, the water budget is positive.
4.8 Water Budget of Ahmadabad District (in Million Cubic Meters) S#
Name of Taluks
Existing Water Availability (MCM) Water Demand (MCM) Water Gap (MCM)
Surface Water
Ground Water
Total Present (2015)
Projected (2020)
Present (2015)
Projected 2020
1 Mandal 196.9630 35.9900 232.9530 116.4521 116.8057 116.5009 116.1473
2 Detroj-Rampura 117.2580 58.5200 175.7780 88.8945 89.3030 86.8835 86.4750
3 Viramgam 57.4490 51.2200 108.6690 137.8189 134.6625 -29.1499 -25.9935
4 Sanand 94.0400 116.6800 210.7200 323.1974 289.9302 -112.4774 -79.2102
5 Ahmadabad City 392.3750 0.0000 392.3750 321.8007 357.0701 70.5743 35.3049
6 Daskroi 168.5490 202.7200 371.2690 254.1662 255.9303 117.1028 115.3387
7 Dholka 692.2800 46.2400 738.5200 390.0005 391.3454 348.5195 347.1746
2712.297
2279.819 2284.165
432.478 428.132
0.000
500.000
1000.000
1500.000
2000.000
2500.000
3000.000
Total Water Resource
Availability
Present Water Demand (2015)
Projected Water Demand (2020)
Present Water Gap (2015)
Projected Water Gap (2020)

55
8 Bavla 49.2230 45.7300 94.9530 271.7224 272.5742 -176.7694 -177.6212
9 Dhandhuka 387.0600 0.0000 387.0600 375.7664 376.5440 11.2936 10.5160
10 Grand Total 2155.1970 557.1000 2712.2970 2279.8191 2284.1653 432.4779 428.1317
Note: Water gap is calculated as water demand minus existing water availability. A negative water gap means that excess water availability exists and a positive water gap means that existing water availability is short of demand. The water budget analysis suggest that efforts are required to meet the water requirements of the district as the gap between water demand and availability may likely to deteriorate in future. Utilizing the surface & ground water potential in the district and activities that promote water use efficiency, ground water re-charge, water harvesting and conservation etc. proposed in the Strategic Action plan, 2015-20 to address the challenges.

56
Chapter 5: Strategic Action Plan for Irrigation in District
under PMKSY
The strategic action plan presents the estimated area planned to be brought under irrigation and the financial outlays required for completion of the proposed projects for the period 2016-17 to 2019-20.
5.1 Taluk Wise Area Covered: Through the PMKSY project, nearly 3,24,193 ha of command area will be covered during the period 2016-17 to 2019-20 out of which 128,807 ha (or 40%) of command area will be covered in Dhandhuka Taluka followed by 52,224 ha (16%) of command area in Viramgam Taluka and 47,909 ha (or 15%) of command area in Mandal taluka.
Figure 0.1Talukwise Coverage of Area UnderPMKSY in Ahmedabad District
Lowest coverage of area is reported from Ahmedabad (0%), Bavla (0.8%), Daskroi (1.2%) and
Sanand(7%) and DetrojRampura (8%).
5.2Component wise Coverage of Area Among the four PMKSY components, nearly 2,06,925 hectares (or 64%) of area will be
covered through Har Khet Ko Pani (HKKP) component followed by nearly 96,588 hactares
(or 30%) of area will be covered through Accelerated Irrigation Benefit Program(AIBP).
Most of the area covered under this component aims at development of ground water by
state irrigation department NWRWS&K, lining of field channels by Sardar Sarovar
Narmada Nigam Ltd (SSNNL) and water recharge structures by Ground Water Resource
Development Corporation (GWRDC). This is the component is spread across the district.
These activities will enhance the ground water recharge as well as water use efficiency of
canal based surface water through improving the water distribution network-field
channels.
Ahmedabad City0%
Bavla1%
Daskroi1%
Detroj6%
Dhandhuka40%
Dholka14%
Mandal15%
Sanand7%
Viramgam16%

57
Figure 0.2 Component Wise Area Covered through PMKSY in Ahmedabad District (%)
Under Per Drop More Crop (PDMC) component nearly nearly 18,261 hactares (or 6%) of
area will be covered. The activities will aim at water conservation through drip and
sprinkler irrigation implemented by Gujarat Green Revoluation Company.
Table 0.1Taluk Wise Area Covered under PMKSY through Different Components in Ahmedabad District (Ha)
S# Name of Taluka AIBP Har Khet Ko Pani
PDMC (Micro
Irrigation)
PDMC (SWMA)
PMKSY-
Convergence with
MGNREGA
PMKSY-Watershed
Grand Total
1 Ahmedabad City 0.0 0.0 51.3 0.0 - 0.0 51.3
2 Bavla 550.0 1517.0 193.1 0.0 - 421.5 2681.6
3 Daskroi 0.0 2632.0 1373.5 0.0 - 0.0 4005.5
4 DetrojRampura 4151.0 15223.0 878.1 0.0 - 970.0 21222.1
5 Dhandhuka 50516.0 74600.0 3529.2 0.0 - 162.5 128807.7
6 Dholka 18113.0 24465.0 1480.1 0.0 - 0.0 44058.1
7 Mandal 10786.0 33380.0 3502.7 0.0 - 240.7 47909.3
8 Sanand 2000.0 16153.0 1901.6 2875.0 - 304.2 23233.8
9 Viramgam 10472.0 38955.0 1306.2 1170.0 - 320.4 52223.7
10 Grand Total 96588.0 206925.0 14215.7 4045.0 - 2419.2 324192.9
PMKSY-Watershed: PMKSY-Watershed Component (erstwhile named as Integrated Watershed Management Programme) is one of the flagship program of Govt. of India. The main objectives of this is to
Accelerated Irrigation Benefit
Program30%
Har Khet Ko Pani64%
Per Drop More Crop5%
PMKSY-Watershed
1% PMKSY-Convergence with
MGNREGA0%

58
restore the ecological balance by harnessing, conserving and developing degraded natural resources such as soil, vegetative cover and water. Gujarat is one of the largest States in context of land area treatment under PMKSY-Watershed project. The important activities carried out under this projects are soil moisture conservation, water harvesting, vegetative cover and plantation, agricultural production and productivity improvement, dairy development, agro processing, livelihood and income generating activities etc. In Gujarat, PMKSY-watershed component is implemented through a State Level Nodal Agency (SLNA) constituted as Gujarat State Watershed Management Agency (GSWMA), an autonomous society supported under the Rural Development Department (RDD) of Government of Gujarat. GSWMA has vision of “Enhancing the quality of rural population through sustainable, equitable and participatory natural resources management” and also has mission of “creating sustainable rural livelihoods through scientific and Integrated Watershed Development Approach(IWDA)”. GSWMA works in all the 33 districts of Gujarat. GSWMA planned to cover all the micro-watersheds (at village level) of the state in the next 18 years. Thus, it will cover all the talukas of the state. Total 610 no. of PMKSY-watershed component projects under six batches covering 31.04 lakh hectares of land are currently under implementation in Gujarat state. In Ahmedabad district under PMKSY-Watershed component, nearly 2,419 hactares (or 1%) of area will be covered aimiming at soil and water conservation works.
5.3 Department wise Coverage of Area The total area covered through PMKSY by different departments is given in the graph given below. Among all the departments Sardar Sarovar Narmada Nigam Ltd will cover about 2,84,479 (or 88%) of area while Narmada Water Resource Water Supply and Kalpasar department will cover about 16,435 hactares (or 5%) of area. Activities covered under NWRWS&K are renovation of canals, pipeline project, RRR of water bodies, water harvesting structures etc.
Figure 0.3 Department Wise Coverage of Area through PMKSY in Gandhinagar District (%)
These are followed by Gujarat Green Revolution Company with 13,816 hactares (or 4.3%) of area and the GSWMA will cover about 2,419 hactares (or 1%) under Integrated watershed Development Program (IWMP) and coverage of 6,264 heactres (or 2%) through Gujarat Land Development Corporation Ltd. A total of 1215 individual and community ponds will be created along with 315 water harvesting structures during upcoming 4 years by GLDC in the district. The detailed taluk wise and department wise break up of the area
NWRWS&K5%
SSNNL88%
GWRDC0%
ATMA0% GGRC
4%
GLDC2%
Rural Development1%

59
to be covered is givn in the table below. Table 0.1Taluk Wise Area Covered under PMKSY through Different Departments in Ahmedabad District (Ha)
S# Row Labels ATMA GGRC GLDC GWRDC NWRWS&K SSNNL Rural Development
Grand Total
1 Ahmedabad City 0 51 0 0 0 0 0 51
2 Bavla 0 145 696 88 550 781 422 2682
3 Daskroi 0 1373 696 80 0 1856 0 4005
4 DetrojRampura 0 798 696 140 0 18618 970 21222
5 Dhandhuka 0 3529 1392 40 0 123684 163 128808
6 Dholka 0 1432 696 88 200 41642 0 44058
7 Mandal 0 3423 696 80 0 43470 241 47909
8 Sanand 0 1854 696 88 12205 8087 304 23234
9 Viramgam 0 1210 696 176 3480 46341 320 52224
10 Grand Total 0 13816 6264 780 16435 284479 2419 324193
There is little forest area under the Forest Department and core forest area is limited. Most of the interventions of the forest department in the district relate to social forestry in the village panchayat lands. Agriculture Technology Management Agency (ATMA) focused on awareness generation and capacity building of the beneficiary farmers on water distribution, efficient use of water and water saving technologies etc. However, these interventions had little or no direct impact on coverage of area under PMKSY project.
5.4Taluka Wise wise plan Outlay: To successfully implement the activities proposed under PMKSY, Ahmedabad district will require a total estimated outlay of Rs. 2,36,604 Lakhs for the period 2016-17 to 2019-20 out of which Rs.70,524 Lakhs (30%) will be spent in Ahmedabad City Taluk followed by Dhandhuka Taluka with Rs.66,742 Lakhs (28%).
Figure 0.4Taluk Wise Planned Outlay for PMKSY in Ahmedabad District (%)
The remaining amount will be required in the rest of the Taluks. Lowest amount will be spent in
Ahmedabad City30%
Bavla2%
Daskroi1%
Detroj4%
Dhandhuka28%
Dholka8%
Mandal9%
Sanand6% Viramgam
12%

60
Bavla (2%), Daskroi (1.3%) and Detroj (4%).
5.5 Component wise plan outlay Out of the Rs. 2,36,604 Lakhs of estimated plan outlay, major share of the total plan outlay will be
required for activities to be taken up under Har khet Ko Pani with Rs.1,54,909 Lakhs (or 65%)
followed by activities under Accelerated Irrigation Benefit Program(AIBP)component requiring
Rs.65,514 Lakhs (or 28%).
Figure 0.5 Component Wise Plan Outlay for PMKSY in Ahmedabad District
The activities under Per Drop More Crop (PDMC) component will require Rs.9,077 Lakhs (or 4%) and PMKSY-Watershed component will require an outlay of Rs.7,090 Lakhs (or 3%) and the PMKSY-Convergence with MGNREGA will require an outlay of Rs 13.3 Lakhs (0.01%). Detailed Taluk wise and component wise break-up of plan outlay is shown in the table below. Table 0.2Talukwise and component wise plan outlay proposed under PMKSY in Ahmedabad District (in Rs Lakhs)
S# Name of Taluk AIBP Har Khet ko pani
PDMC (Micro
Irrigation)
PDMC (SWMA)
PMKSY-
Convergence With
MGNREGA
PMKSY-Watershed
Grand Total
1 Ahmedabad City 5060.0 65420.0 44.0 0.0 - 0.0 70524.0
2 Bavla 2012.2 693.0 206.0 0.0 - 607.1 3518.2
3 Daskroi 1317.6 1224.5 636.3 0.0 - 0.0 3178.4
4 DetrojRampura 872.0 7204.5 578.5 0.0 - 495.2 9150.1
5 Dhandhuka 33492.1 29917.1 1601.3 0.0 13.3 1717.6 66741.5
6 Dholka 7294.3 10268.1 782.5 0.0 - 0.0 18344.9
7 Mandal 2265.0 15646.5 1754.3 0.0 - 1466.1 21131.9
8 Sanand 5994.3 6656.8 971.4 700.0 - 675.0 14997.4
9 Viramgam 7207.0 17878.9 803.1 1000.0 - 2128.5 29017.5
10 Grand Total 65514.4 154909.2 7377.4 1700.0 13.3 7089.5 236603.9
Accelerated Irrigation Benefit
Program28%
Har Khet Ko Pani65%
Per Drop More Crop4%
PMKSY-Watershed
3%
PMKSY-Convergence with
MGNREGA0%

61
5.6 Department wise plan outlay Among all the departments, SSNNL will require an outlay of Rs.1,32,542Lakh (or 56%) followed by NWRWS&K deparment with an outlay of Rs.86257 Lakhs (or 37%). GGRC will require an outlay of Rs.6189 Lakhs (or 3%). Rural Development Department will require an estimated outlay of Rs.7103 Lakhs (or 3%) of total outlay of PMKSY. GLDC will require an outlay of Rs.2564.7 Lakhs (or 1%) of the total amount. Department of Agriculture (ATMA) will require an outlay of Rs.189 Lakhs.
Figure 0.6 Department Wise Plan Outlay for PMKSY in Ahmedabad District
Detailed break up of Taluka wise and department wise plan outlay is presented in Table below.
Table 0.4 Taluk-Wise and Department Wise Estimated Plan Outlay under PMKSY in Ahmedbad District (in Rs Lakhs)
S# Name of Taluka ATMA GGRC GLDC GWRDC NWRWS&K SSNNL Rural Develop
ment
Grand Total
1 Ahmedabad City 21.0 23.0 0.0 0.0 70480.0 0.0 0.0 70524.0
2 Bavla 21.0 65.0 285.0 200.0 2012.2 328.0 607.1 3518.2
3 Daskroi 21.0 615.3 285.0 160.0 0.0 2097.1 0.0 3178.4
4 DetrojRampura 21.0 357.5 285.0 320.0 0.0 7671.5 495.2 9150.1
5 Dhandhuka 21.0 1580.4 569.9 80.0 0.0 62759.3 1730.9 66741.5
6 Dholka 21.0 641.6 285.0 200.0 2012.2 15185.2 0.0 18344.9
7 Mandal 21.0 1533.4 285.0 200.0 0.0 17626.5 1466.1 21131.9
8 Sanand 21.0 830.4 285.0 200.0 8690.7 4295.4 675.0 14997.4
9 Viramgam 21.0 542.2 285.0 400.0 3062.2 22578.7 2128.5 29017.5
10 Grand Total 188.6 6188.7 2564.6 1760.0 86257.3 132541.7 7102.8 236603.9
5.8 Year Wise Department Wie Area Covered and Plan Outlay: While the amount planned to be spent decreased from Rs 93607 Lakhs in 2016-17 to
NWRWS&K36%
SSNNL56%
GWRDC1%
ATMA0%
GLDC1%
GGRC3% Rural Development
3%

62
Rs.84947 lakhs in 2017-18. This has further declined to Rs.34,520 Lakhs in 2018-19 and Rs.23,530 Lakhs in 2019-20. Along with plan outlay, the command area covered through PMKSY also declined progressively. A department wise and year wise break up of area covered and planned outlay is given in the table below.
Table 0.5 Department Wise and Year wise Area planned to be irrigated and Estimated Plan Outlay under PMKSY in Ahmedbad District (in Rs Lakhs)
(Area in Hactares& Funds in Rs Lakhs) Departments
2016-17 2017-18 2018-19 2019-20 Total
Area Funds Area Funds Area Funds Area Funds Area Funds
NWRWS&K 3810 23424 4120 21746 4175 20723 4330 20365 16435 86257
SSNNL 126927 63962 132111 58404 25440 10176 0 0 284479 1325
GWRDC 195 440 195 440 195 440 195 440 780 1760
GLDC 1566 641 1566 641 1566 641 1566 641 6264 2565
GSWMA 1397 3190 462 2246 307 1061 253 593 2419 7090
GSWMA- Convergence
- 13.3 - - - - - - - 13.3
GGRC 4251 1904 3188 1428 3188 1428 3188 1428 13815 6189
ATMA 32 42 51 63 189
Total 138147 93607 141643 84947 34871 34520 9532 23530 324192 236604
5.9: Monitoring and Evaluation The Strategic Action Plan of PMKSY will be monitored by the respective departments through the regular reporting system and component wise progress will be monitored by the District Level Irrigation Committee. Further, the activities, outputs and outcomes will be reported in web based MIS of PMKSY for review at state and national level. Some of the key indicators that will be used to monitor and evaluate the progress of PMKSY include:
Annual irrigation water supply per unit irrigated area measured as the ratio of total volume of irrigation water supplied at intake divided by total area irrigated in all seasons
Potential created and utilized measured as the ratio of total potential utilized (measured crop area) to irrigation potential created
Output (agricultural production) per unit irrigated area measured as the ratio of total value of agriculture production divided by the total irrigated area.
Output (agricultural production) per unit irrigation water supply measured as the ratio of total value of agriculture production divided by the total volume of irrigated water supplied.
Total Operations & Maintenance (O&M) cost per unit irrigated area measured as the total Management, Operation and Maintenance (MOM) costs for the system divided by total area irrigated (potential utilized).
Total Operations & Maintenance (O&M) cost per unit volume of water supplied measured as total Management, Operation and Maintenance (MOM) costs for the system divided Total volume of water supplied (all uses)
Equity performance measured as actual area irrigated in head, middle and tail divided by Command area in head, middle and tail.
5.10 Expected Output and Outcome: 1. Out of total cropped area of 1,31,418 ha in Khariff, nearly 36 per cent cropped area is irrigated and out of 2,29,807 hectares of cropped area in Rabi 60 percent cropped area is

63
irrigated and out of 11,636 hectares of cropped area in summer 100 per cent of cropped area is irrigated. Further, out of 62,329 hectares of area under horticulture crops (vegetables, spices, fruits and flowers) 99 per cent of cropped area is under irrigation. With the completion of irrigation works proposed in the district an additional area of 217,539 hectares of area (out of 6,11,635 hectares of cropped area) will be brought under irrigation taking the total area under irrigation from 280,044 (or 45.8%) in 2015 to 412,595 ha (or 81.35%) in 2020. 2. On completion of the proposed irrigation projects and the water saving technologies especially under per drop more crop would save water by increasing efficiency of water usage. It is expected that 30 percent of water would be saved by using technologies under per drop more crop leading to an additional irrigation potential created through saving of water. 3.On completion of all the projects proposed under PMKSY 2,17,539 ha of additional irrigation potential is likely to be created in the district.
Table5.6: Department wise proposed additional area to brought under irrigation Departments Major Infrastrctures 2016-17 2017-18 2018-19 2019-20 Total
NWRWS&K 3810 4120 4175 4330 16435
SSNNL 81830 84371 25440 0 191641
CE Mehsana Major Irrigation - - - - 0
lined Channels (UGPL) 37853 37853 - - 75705
CE Rajkot Major Irrigation - - - - 0
lined Channels (UGPL) 25440 25440 25440 - 76321
CE ABAD Major Irrigation - - - - 0
lined Channels (UGPL) 18537 21078 - - 39615
GWRDC New tubewell with Drip, recharge structure
195 195 195 195 780
GLDC Farm Pond, Sim Pond, Village Pond, and WHS
1566 1566 1566 1566 6264
GSWMA 1397 462 307 253 2419
Various Compenents 1397 462 307 253 2419
MGNREGA - - - - 0
Ahmedabad District Total 88798 90714 31683 6344 217539
The creation of additional irrigation will increase the productivity of crops. The Productivity of Paddy will increase to 4000 Kg per Hectare; The Productivity of Wheat will increase to 3085 Kg per Hectare and the productivity of castor will increase to 1834 Kg per Hectare and the productivity of cotton will increase to 800 Kg per hectare. 4.The increase in irrigation potential and supply of assured water supply will result in generation of additional annual income of Rs. 32,630 Lakhs to the farmers of the district9. This is based on the assumption of at least 60% of potential is utilised and Rs.24,950 per
9It is found that gross returns have a correlation of 0.64 with area under irrigation (CACP). Fertilizer consumption also has a high correlation of (0.90 with gross returns, but fertilizers are consumed generally where there is assured irrigation). In that sense, irrigation and fertilizers‟ roles are overlapping in raising returns to farmers, where both represent adoption of modern technology.

64
ha gross returns10will be received by the farmers through shift from area under rainfed to irrigated farming. 5. The assured water supply is also likely to create 106.10247 Lakh mandays11 of employment and 48,228 jobs annually on recurring basis.
10
Agro climatic, soil conditions, natural endowments, adoption of modern technologies along with marketing opportunities play important roles in determining returns on cultivation of agricultural commodities. As per the study of Ashok V and Luka B (2013), „Pricing, costs, returns and productivity in Indian crop sector during 2000‟, Discussion Paper No-7, Commission for Agriculture Costs and Prices, Department of Agriculture& Cooperation, Govt of Inda (pp.39), the per hectare Gross Returns to Cultivation which is defined as Gross Value of Output (GVO) minus Cost of Cultivation (A2 plus Family Labour). As per the study the Gross Returns to Cultivation in Gujarat is Rs.24,949 and similar figures for the neighbouring states are Maharashtra (Rs.13,148/-) Rajasthan (Rs.13,809/-), Madhya Pradesh (Rs.15,441/-) that are bordering Gujarat. 11
The total cost of production is Rs.23,407/- for paddy and Rs 23,822- for wheat, Rs.41,468/- for cotton, the three most important crops in the district. The amount spent on labour including family labour roughly works out to Rs.13,628/- (Paddy), Rs.7,585/- (Wheat), Rs.11438/- (Cotton). The number of man days is 70 days per hectare (Paddy), 54 days per hectare (wheat), 93 days per hectare (cotton).

65
Strategic Action plan for Irrigation in District under PMKSY
Sr. No
Name of the Taluks / Districts
Concerned Ministry
Department Component Activity Total Numb
er
Capacity
(cum )
Command Area
/ lrrigatio
n Potential (Ha)
Period of Implementa
tion (5/7 yrs)
Estimated cost (in
Rs.) Lacs
1.1 Ahmadabad District
MoWR NWRWS&K AIBP Major Irrigation 0 0 0 0 0
1.2 Ahmadabad District
MoWR SSNNL AIBP Major Irrigation 263 92838 16
49793.6319
2.1 Ahmadabad District
MoWR NWRWS&K AIBP Medium Irrigation 0 0 0 0 0
2.2 Ahmadabad District
MoWR SSNNL AIBP Medium Irrigation 0 0 0 0 0
3.1 Ahmadabad District
MoWR NWRWS&K Har khet ko pani Surface Minor Irrigation 0 0 0 0 0
3.2 Ahmadabad District
MoWR SSNNL Har khet ko pani Surface Minor Irrigation 0 0 0 0 0
4.1 Ahmadabad District
MoWR NWRWS&K Har khet ko pani Lift Irrigation 0 0 0 0 0
4.2 Ahmadabad District
MoWR SSNNL Har khet ko pani Lift Irrigation 0 0 0 0 0
5.1 Ahmadabad District
MoWR NWRWS&K Har khet ko pani Ground water development 0 0 0 0 0
5.2 Ahmadabad District
MoWR SSNNL Har khet ko pani Ground water development 0 0 0 0 0
6.1 Ahmadabad District
MoWR NWRWS&K Har khet ko pani RRR of Water Bodies 0 0 2700 0 1100
6.2 Ahmadabad District
MoWR SSNNL Har khet ko pani RRR of Water Bodies 0 0 0 0 0
7 Ahmadabad District
MoWR NWRWS&K Har khet ko pani Construction of Field Channels
7.1.1
Ahmadabad District
MoWR NWRWS&K Har khet ko pani Lined Field Channels 0 0 495 0 165
7.1.2 Ahmadabad District
MoWR SSNNL Har khet ko pani Lined Field Channels 3619 426.47 191641 2 82748.1

66
7.2.1 Ahmadabad District
MoWR NWRWS&K Har khet ko pani Unlined Channels 0 0 1990 0 180
7.2.2 Ahmadabad District
MoWR SSNNL Har khet ko pani Unlined Channels 0 0 0 0 0
8.1 Ahmadabad District
MoWR NWRWSK &
SSNL Har khet ko pani
Micro Irrigation 0 0 0 0 0
8.2 Ahmadabad District
MoWR NWRWSK &
SSNL Har khet ko pani
Micro Irrigation 0 0 0 0 0
9 Ahmadabad District
MOA & FW-DAC & FW
GGRC Per drop more crop (Micro Irrigation)
DPAP and DDP Area - Drip irrigation System
0 0 0 0 0
10 Ahmadabad District
MOA & FW-DAC & FW
GGRC Per drop more crop (Micro Irrigation)
DPAP and DDP Areas - Sprinkler Irrigation System
0 0 0 0 0
11.1 Ahmadabad District
MoWR GWRDC Per Drop more crop (Micro Irrigation) New Tubewell with Drip 19 400 4 1000
11.2 Ahmadabad District
MOA & FW-DAC & FW
GGRC Per drop more crop (Micro Irrigation)
Non DPAP Area-Drip Irrigation System
5181.8
8289.2 5570.0
12 Ahmadabad District
MOA & FW-DAC & FW
GGRC Per drop more crop (Micro Irrigation)
Non DPAP Area - Sprinkler Irrigation system (SIS)
3454.2
5526.5 618.8
13.1 Ahmadabad District
MOA & FW-DAC & FW
GLDC Per drop more crop (Supplementary water management activities)
Topping up of MGNREGA
0 0 0 0 0
13.2 Ahmadabad District
MoWR GWRDC Per Drop more crop (Micro Irrigation) Recharge Structures 76 380 4 760
14 Ahmadabad District
MOA & FW-DAC & FW
GLDC Per drop more crop (Supplementary water management activities)
Drought Proofing through Checkdams / Water harvesting structures
252 1512 4 282.24
15 Ahmadabad District
MOA & FW-DAC & FW
GLDC Per drop more crop (Supplementary water management activities)
Secondary Storage Structures-Farm Pond
720 1036.8 4 806.4
15 Ahmadabad District
MOA & FW-DAC & FW
GLDC Per drop more crop (Supplementary water management activities)
Secondary Storage Structures-Sim Pond
144 604.8 4 720
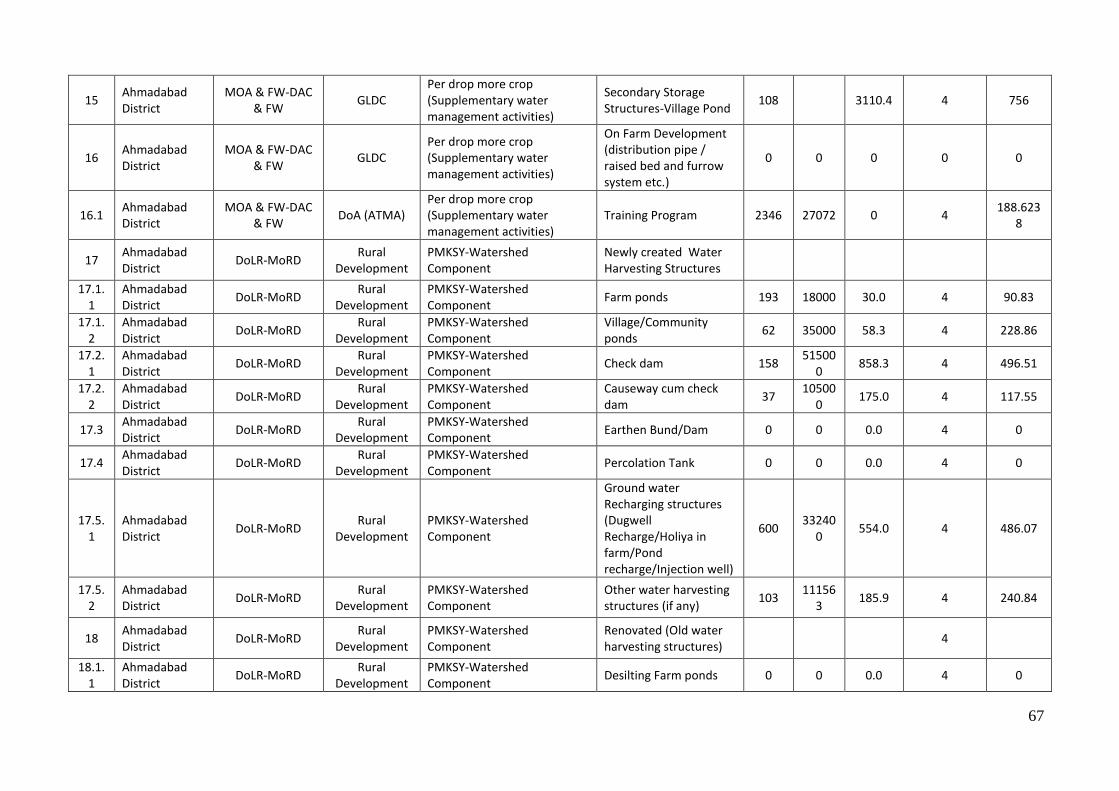
67
15 Ahmadabad District
MOA & FW-DAC & FW
GLDC Per drop more crop (Supplementary water management activities)
Secondary Storage Structures-Village Pond
108 3110.4 4 756
16 Ahmadabad District
MOA & FW-DAC & FW
GLDC Per drop more crop (Supplementary water management activities)
On Farm Development (distribution pipe / raised bed and furrow system etc.)
0 0 0 0 0
16.1 Ahmadabad District
MOA & FW-DAC & FW
DoA (ATMA) Per drop more crop (Supplementary water management activities)
Training Program 2346 27072 0 4 188.623
8
17 Ahmadabad District
DoLR-MoRD Rural
Development PMKSY-Watershed Component
Newly created Water Harvesting Structures
17.1.1
Ahmadabad District
DoLR-MoRD Rural
Development PMKSY-Watershed Component
Farm ponds 193 18000 30.0 4 90.83
17.1.2
Ahmadabad District
DoLR-MoRD Rural
Development PMKSY-Watershed Component
Village/Community ponds
62 35000 58.3 4 228.86
17.2.1
Ahmadabad District
DoLR-MoRD Rural
Development PMKSY-Watershed Component
Check dam 158 51500
0 858.3 4 496.51
17.2.2
Ahmadabad District
DoLR-MoRD Rural
Development PMKSY-Watershed Component
Causeway cum check dam
37 10500
0 175.0 4 117.55
17.3 Ahmadabad District
DoLR-MoRD Rural
Development PMKSY-Watershed Component
Earthen Bund/Dam 0 0 0.0 4 0
17.4 Ahmadabad District
DoLR-MoRD Rural
Development PMKSY-Watershed Component
Percolation Tank 0 0 0.0 4 0
17.5.1
Ahmadabad District
DoLR-MoRD Rural
Development PMKSY-Watershed Component
Ground water Recharging structures (Dugwell Recharge/Holiya in farm/Pond recharge/Injection well)
600 33240
0 554.0 4 486.07
17.5.2
Ahmadabad District
DoLR-MoRD Rural
Development PMKSY-Watershed Component
Other water harvesting structures (if any)
103 11156
3 185.9 4 240.84
18 Ahmadabad District
DoLR-MoRD Rural
Development PMKSY-Watershed Component
Renovated (Old water harvesting structures)
4
18.1.1
Ahmadabad District
DoLR-MoRD Rural
Development PMKSY-Watershed Component
Desilting Farm ponds 0 0 0.0 4 0

68
18.1.2
Ahmadabad District
DoLR-MoRD Rural
Development PMKSY-Watershed Component
Deepening/Desilting of ponds
162 33458
3 557.6 4 346.24
18.2.1
Ahmadabad District
DoLR-MoRD Rural
Development PMKSY-Watershed Component
Renovation/Desilting of Check dam
1 0 0.0 4 2.5
18.2.2
Ahmadabad District
DoLR-MoRD Rural
Development PMKSY-Watershed Component
Repair Causeway cum check dam
0 0 0.0 4 0
18.3 Ahmadabad District
DoLR-MoRD Rural
Development PMKSY-Watershed Component
Repair Earthen Dam/Bund
0 0 0.0 4 0
18.4 Ahmadabad District
DoLR-MoRD Rural
Development PMKSY-Watershed Component
Deepening/Desilting Percolation Tank
0 0 0.0 4 0
18.5.1
Ahmadabad District
DoLR-MoRD Rural
Development PMKSY-Watershed Component
Other water harvesting structures (if any)
0 0 0.0 4 0
18.5 Ahmadabad District
DoLR-MoRD Rural
Development PMKSY-Watershed Component
Ground water Recharging structures (Dugwell Recharge/Holiya in farm/Pond recharge/Injection well)
600 33240
0 554.0 4 486.07
18.6.1
Ahmadabad District
DoLR-MoRD Rural
Development PMKSY-Watershed Component
Soil Moisture Conservation
38941 0 0.0 4 1299.27
18.6.2
Ahmadabad District
DoLR-MoRD Rural
Development PMKSY-Watershed Component
Land development Activities
726484
0 0.0 4 1032.61
18.6.3
Ahmadabad District
DoLR-MoRD Rural
Development PMKSY-Watershed Component
Entry Point Activities 30 0 0.0 4 56.83
18.6.4
Ahmadabad District
DoLR-MoRD Rural
Development PMKSY-Watershed Component
AGRICULTURE ACTIVITIES
7531 22133
33 3688.9 4 944.558
18.6.5
Ahmadabad District
DoLR-MoRD Rural
Development PMKSY-Watershed Component
AGRO PROCESSING ACTIVITIES
279 0 0.0 4 134.966
18.6.6
Ahmadabad District
DoLR-MoRD Rural
Development PMKSY-Watershed Component
Animal Husbandry 2052 53000
0 883.3 4 428.67
18.6.7
Ahmadabad District
DoLR-MoRD Rural
Development PMKSY-Watershed Component
Establishing linkages 0 0 0.0 4 0
18.6.8
Ahmadabad District
DoLR-MoRD Rural
Development PMKSY-Watershed Component
Local traditional handicraft
0 0 0.0 4 0
18.6.9
Ahmadabad District
DoLR-MoRD Rural
Development PMKSY-Watershed Component
Minor Activities 656 0 0.0 4 171.97
18.6. Ahmadabad DoLR-MoRD Rural PMKSY-Watershed Non-conventional 0 0 0.0 4 0

69
10 District Development Component Energy Sources
18.6.11
Ahmadabad District
DoLR-MoRD Rural
Development PMKSY-Watershed Component
Revolving Fund 96 0 0.0 4 28.5
18.6.12
Ahmadabad District
DoLR-MoRD Rural
Development PMKSY-Watershed Component
Capacity building , Monitoring and evaluation
0 0 0.0 4 191.104
578
18.6.13
Ahmadabad District
DoLR-MoRD Rural
Development PMKSY-Watershed Component
Administrative 0 0 0.0 4 625.886
604
18.6.14
Ahmadabad District
DoLR-MoRD Rural
Development PMKSY-Watershed Component
Consolidation 0 0 0.0 4 218.489
864
19 Ahmadabad District
DoLR-MoRD Rural
Development Convergence with MGNREGA Newly Created 4
19.1.1
Ahmadabad District
DoLR-MoRD Rural
Development Convergence with MGNREGA Water Conservation 4
19.2.1
Ahmadabad District
DoLR-MoRD Rural
Development Convergence with MGNREGA
Water Harvesting-Check dam
0 0 0.0 4 0
19.2.2
Ahmadabad District
DoLR-MoRD Rural
Development Convergence with MGNREGA
Water conservation-Village/Community Pond
0 0 0.0 4 0
19.2.3
Ahmadabad District
DoLR-MoRD Rural
Development Convergence with MGNREGA
Water Conservation-Farm Pond
0 0 0.0 4 0
19.3.1
Ahmadabad District
DoLR-MoRD Rural
Development Convergence with MGNREGA
Creation of Irrigation Canals and Drains-Diversion Channel
0 0 0.0 4 0
19.3.2
Ahmadabad District
DoLR-MoRD Rural
Development Convergence with MGNREGA
Creation of Irrigation Canals and Drains-Flow Channel
0 0 0.0 4 0
19.3.3
Ahmadabad District
DoLR-MoRD Rural
Development Convergence with MGNREGA
Creation of Irrigation Canals and Drains-Stone Pitching
0 0 0.0 4 8
19.4 Ahmadabad District
DoLR-MoRD Rural
Development Convergence with MGNREGA 4
19.5.1
Ahmadabad District
DoLR-MoRD Rural
Development Convergence with MGNREGA Farm Bunding 0 0 0.0 4 0
19.5.2
Ahmadabad District
DoLR-MoRD Rural
Development Convergence with MGNREGA Afforestation 0 0 0.0 4 0
19.5. Ahmadabad DoLR-MoRD Rural Convergence with MGNREGA Tree Plantation on Farm 0 0 0.0 4 10

70
3 District Development Bunds
19.6.1
Ahmadabad District
DoLR-MoRD Rural
Development Convergence with MGNREGA Earthen bund 0 0 0.0 4 0
19.6.2
Ahmadabad District
DoLR-MoRD Rural
Development Convergence with MGNREGA Protection Wall 0 0 0.0 4 0
19.6.3
Ahmadabad District
DoLR-MoRD Rural
Development Convergence with MGNREGA Countour Bunding 0 0 0.0 4 2.8
19.6.4
Ahmadabad District
DoLR-MoRD Rural
Development Convergence with MGNREGA
Field Outlet / Farm Outlet
0 0 0.0 4 0
20 Ahmadabad District
DoLR-MoRD Rural
Development Convergence with MGNREGA Renovation 4
20.1.1
Ahmadabad District
DoLR-MoRD Rural
Development Convergence with MGNREGA
Deepening/Desiltation Of Pond
0 0 0.0 4 0
20.1.2
Ahmadabad District
DoLR-MoRD Rural
Development Convergence with MGNREGA
De-siltation of Checkdam
0 0 0.0 4 2.5
21.1 Ahmadabad District
State Irrigation Department
NWRWS&K AIBP Major Irrigation 0 0 0.0 4 0
21.2 Ahmadabad District
State Irrigation Department
NWRWS&K AIBP Medium Irrigation 0 0 0.0 4 0
21.3.1
Ahmadabad District
State Irrigation Department
NWRWS&K AIBP Surface Minor Irrigation 0 0 0.0 4 0
21.3.2
Ahmadabad District
State Irrigation Deptt
NWRWS&K AIBP
Construction of Asphalt & WBM road on the Existing SR of Canal and Strengthening, Renovation & Improvement of Existing Bunds/ Tanks including Constn of Flap type Gates and SWF for flow measurement in Fatewadi Canal System under Sanand Irrig Sub Dn, Sanand (NABARD Assistance Phase-II project)
2000 3083.24

71
21.3.3
Ahmadabad District
State Irrigation Deptt
NWRWS&K AIBP
Construction of Asphalt & WBM road on the Existing SR of Canal and Strengthening, Renovation & Improvement of Existing Bunds/ Tanks including Constn of Flap type Gates and SWF for flow measurement in Fatewadi Canal System under Bavala Irrig Sub Dn, Baval (NABARD Assistance Phase-II project)
0 2012.19
667
21.3.4
Ahmadabad District
State Irrigation Deptt
NWRWS&K AIBP
Construction of Asphalt & WBM road on the Existing SR of Canal and Strengthening, Renovation & Improvement of Existing Bunds/ Tanks including Constn of Flap type Gates and SWF for flow measurement in Fatewadi Canal System under Sanand Irrig Sub Dn, Sanand (NABARD Assistance Phase-II project)
1000 1540.97
2
21.3.5
Ahmadabad District
State Irrigation Deptt
NWRWS&K AIBP
Construction of Asphalt & WBM road on the Existing SR of Canal and Strengthening, Renovation & Improvement of Existing Bunds/ Tanks including Constn of Flap type
550 2012.19
667

72
Gates and SWF for flow measurement in Fatewadi Canal System under Bavala Irrig Sub Dn, Baval (NABARD Assistance Phase-II project)
21.3.6
Ahmadabad District
State Irrigation Deptt
NWRWS&K AIBP
Construction of Asphalt & WBM road on the Existing SR of Canal and Strengthening, Renovation & Improvement of Existing Bunds/ Tanks including Constn of Flap type Gates and SWF for flow measurement in Fatewadi Canal System under Bavala Irrig Sub Dn, Baval (NABARD Assistance Phase-II project)
200 2012.19
667
21.3.7
Ahmadabad District
State Irrigation Deptt
NWRWS&K AIBP Hathijan Canal Lining 0 5060
21.4.1
Ahmadabad District
State Irrigation Deptt
NWRWS&K Har Khet Ko Pani
Regrading, strenthening & protection of Banks of Waste channel from D/s of Sakoriya Bund to Rhoad River including Construction of Diversion head works
1935 1500
21.4.2
Ahmadabad District
State Irrigation Deptt
NWRWS&K Har Khet ko pani
Ewarthwork remodelling of structure on Nadan Charodi Drain ,
320 69.46

73
21.4.3
Ahmadabad District
State Irrigation Deptt
NWRWS&K Har Khet ko pani
Resectionning of borrow channel of Daduka Bund,Rethal Bund,Bamnaka Bund of Sanand Taluka
400 52.04
21.4.4
Ahmadabad District
State Irrigation Deptt
NWRWS&K Har Khet ko pani
Earthwork remodelling of structure,Series of check dam of chor Varoda Drain to Ogan drain to Ogan thuleta Drain to Ghoda Feeder of Extension of Nal Sarovar Etc
800 350
21.4.5
Ahmadabad District
State Irrigation Deptt
NWRWS&K Har Khet Ko Pani Kharicut Canal duct 0 55400
21.4.6
Ahmadabad District
State Irrigation Deptt
NWRWS&K Har Khet Ko Pani Vinzol Vahela 0 3600
21.4.7
Ahmadabad District
State Irrigation Deptt
NWRWS&K Har Khet Ko Pani Canal Road 0 5750
21.4.8
Ahmadabad District
State Irrigation Deptt
NWRWS&K Har Khet Ko Pani Ghodasar Colony 0 170
21.4.9
Ahmadabad District
State Irrigation Deptt
NWRWS&K Har Khet Ko Pani Canal Chowkies 0 150
21.4.10
Ahmadabad District
State Irrigation Deptt
NWRWS&K Har Khet ko pani Share Tank 0 350
21.5.1
Ahmadabad District
State Irrigation Deptt
NWRWS&K Per Drop more crop (SWMA)
Drought Proofing through Check Dam/Water Harvesting Structures
2875 700
21.5.2
Ahmadabad District
State Irrigation Deptt
NWRWS&K Per Drop more crop (SWMA) Secondary Storage structure
0 0
21.5.3
Ahmadabad District
State Irrigation Deptt
NWRWS&K Per Drop more crop (SWMA)
Drought Proofing through Check Dam/Water Harvesting Structures
1170 1000
21.5.4
Ahmadabad District
State Irrigation Deptt
NWRWS&K Per Drop more crop (SWMA) Secondary Storage structure
0 0

74
22 Ahmadabad District
Irrigation Scheme of State Agriculture Department
GGRC Per Drop more crop (SWMA) 0 0 0 0
23 Ahmadabad District
Irrigation Scheme of Other Line Departments of State Agriculture Department
GLDC Per Drop more crop (SWMA) 0 0 0 0 0
24 Ahmadabad District
Externally Aided Projects
NWRWS&K Har Khet Ko Pani 0 0 0 0 0
25 Ahmadabad District
Other Loan Projects like NABARD
NWRWS&K Har Khet Ko Pani
0 0 0 0 0
Grand Total 324192 236604

75
Annexure-I I.1 Strategic Action Plan of NWRWS&K in Ahmedabad District, 2016-20
S
r
n
o
Na
me
of
Blo
cks/
sub
Dist
rict
s
Concer
ned
Minist
ry/Dep
artmen
t
Co
mp
one
nt
Activit
y
2016-20 2016-17 2017-18 2018-19 2019-20
Total Number
Capacity (cum )
Total Com
mand area
(Ha.)
Period of Implementatio
n (5/4 yrs)
Fund
(in Lacs)
Existing Irrigation area
(Ha.)
Additional
Irrigated area
(Ha.)
Total Com
mand area
(Ha.)
Existing Irrigation area (Ha.)
Additional
Irrigated area
(Ha.)
Fund (in Lacs)
Total Com
mand area
(Ha.)
Existing Irrigation area (Ha.)
Additional
Irrigated area
(Ha.)
Fund ( in Lacs)
Total Com
mand area
(Ha.)
Existing Irrigation area (Ha.)
Additional
Irrigated area
(Ha.)
Fund
( in Lacs)
Total Com
mand area
(Ha.)
Existing Irrigation area (Ha.)
Additional
Irrigated area
(Ha.)
Fund
( in Lacs)
Tal
uka
-
San
and
1 San
and
MOW
R
Har
Khe
t ko
pani
Surfac
e
Minor
Irrigati
on
0 0 0 0
2 San
and
MOW
R
Har
Khe
t ko
pani
RRR
of
Water
Bodies
18
58
8
700
12
49
2.7
2
23
00
4647
2323
500
350
4647
2823
550
150
4647
3373
600
150 4647
3973
650
50
3 San
and
MOW
R
Har
Khe
t ko
pani
Constn
of
Lined
Field
Chann
el
36
00 100
29
05
27
5
900
625
70 50 900
695
65 25 900
760
65 12.
5
900
825
75 12.
5
4 San
and
MOW
R
Har
Khe
t ko
pani
Constn
of
UnLin
ed
78
00
123
.75
45
25
13
00
1950
650
300
50 1950
950
35
0 35
1950
1300
32
5 25
1950
1625
32
5
13.75

76
Field
Chann
el
5 San
and
State
Irrigati
on
Deptt
Oth
ers
Droug
ht
Proofi
ng
throug
h
Check
Dam/
Water
Harves
ting
Structu
res
15
20
0
700 74
75
28
75
3800
850
650
250
3800
1500
70
0
250
3800
2200
72
5 100
3800
2925
80
0 100
6 San
and
State
Irrigati
on
Deptt
Oth
ers
Secon
dary
Storag
e
structu
re
0 0 0 0 0 0 0 0 0 0 0 0 0 0 0 0 0 0 0 0
7 San
and
State
Irrigati
on
Deptt
Oth
ers
Regrad
ing,
strenth
ening
&
protect
ion of
Banks
of
Waste
channe
l from
D/s of
Sakori
ya
Bund
to
Rhoad
River
17
20
0
150
0
12
30
0
19
35
4300
2350
450
375
4300
2800
52
5
750
4300
3325
50
0 250
4300
3825
46
0 125

77
includi
ng
Constr
uction
of
Divers
ion
head
works
8
San
and
-
Fate
wad
i
Co
mm
and
Are
a
State
Irrigati
on
Deptt
AIB
P
Constr
uction
of
Asphal
t &
WBM
road
on the
Existin
g SR
of
Canal
and
Strengt
hening
,
Renov
ation
&
Impro
vemen
t of
Existin
g
Bunds/
Tanks
includi
ng
Constn
of Flap
type
Gates
40
00
0
308
3.2
4
35
00
0
20
00
10
00
0
8000
500
1233
10
00
0
8500
50
0
617
10
00
0
9000
50
0 617
10
00
0
9500
50
0 617

78
and
SWF
for
flow
measur
ement
in
Fatewa
di
Canal
Syste
m
under
Sanan
d Irrig
Sub
Dn,
Sanan
d
(NAB
ARD
Assista
nce
Phase-
II
project
)
9
San
and
Tall
uka
of
Fate
wad
i
Co
mm
and
Are
a
State
Irrigati
on
Deptt
AIB
P
Constr
uction
of
Asphal
t &
WBM
road
on the
Existin
g SR
of
Canal
and
Strengt
0
201
2.1
966
7
0 0
503.04917
0
503.04917
0
503.04916
7
0
503.04916
7

79
hening
,
Renov
ation
&
Impro
vemen
t of
Existin
g
Bunds/
Tanks
includi
ng
Constn
of Flap
type
Gates
and
SWF
for
flow
measur
ement
in
Fatewa
di
Canal
Syste
m
under
Bavala
Irrig
Sub
Dn,
Baval
(NAB
ARD
Assista
nce
Phase-

80
II
project
)
1
0
San
and
Tal
uka
State
Irrigati
on
Deptt
Har
Khe
t ko
pani
Ewarth
work
remod
elling
of
structu
re on
Nadan
Charo
di
Drain ,
27
00
69.
46
17
50
32
0
675
320
80 35 675
400
70 15 675
470
90 10 675
560
80 9.46
1
1
San
and
Tal
uka
State
Irrigati
on
Deptt
Har
Khe
t ko
pani
Resect
ionnin
g of
borrow
channe
l of
Daduk
a
Bund,
Rethal
Bund,
Bamna
ka
Bund
of
Sanan
d
23
00
52.
04
13
00
40
0
575
175
100
35 575
275
10
0
17.04
575
375
10
0 0
575
475
10
0 0

81
Taluka
1
2
San
and
Tal
uka
State
Irrigati
on
Deptt
Har
Khe
t ko
pani
Earthw
ork
remod
elling
of
structu
re,Seri
es of
check
dam of
chor
Varod
a
Drain
to
Ogan
drain
to
Ogan
thuleta
Drain
to
Ghoda
Feeder
of
Extens
ion of
Nal
Sarova
r Etc
66
00 350
46
00
80
0
1650
850
200
200
1650
1050
20
0
100
1650
1250
20
0 50
1650
1450
20
0 0
Tal
uka
-
Vir
am
ga
m
0 0 0 0 0 0 0
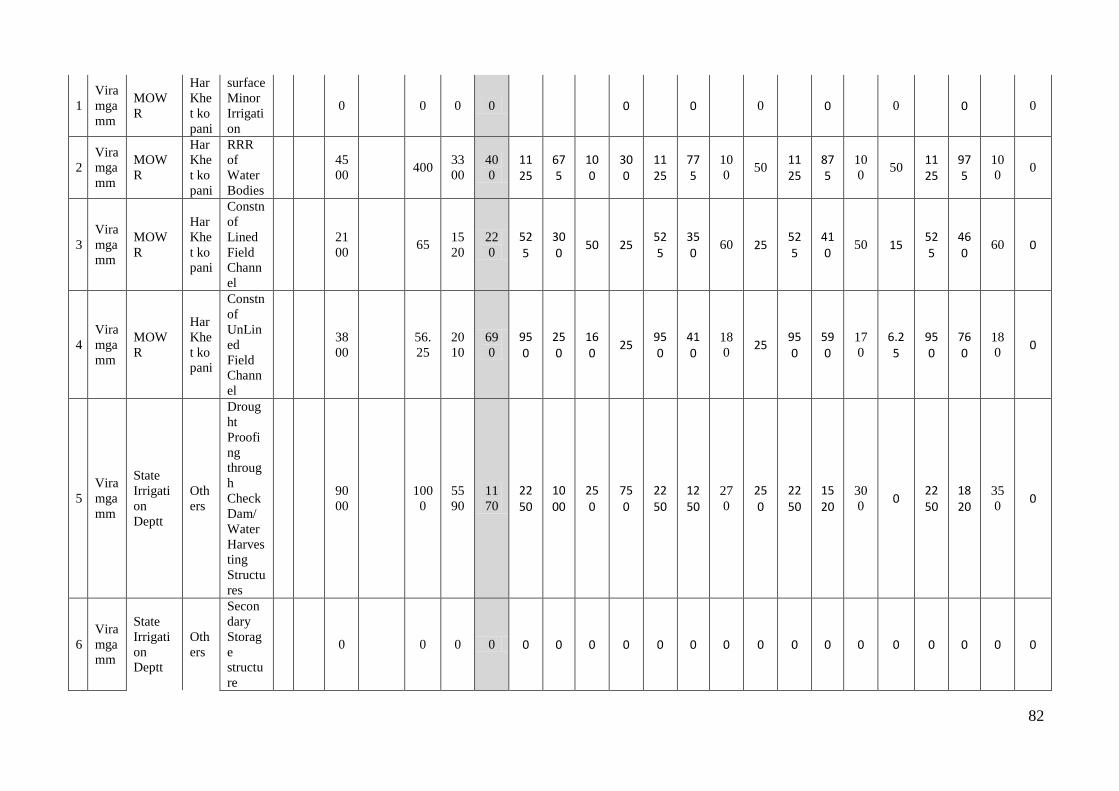
82
1
Vira
mga
mm
MOW
R
Har
Khe
t ko
pani
surface
Minor
Irrigati
on
0 0 0 0 0 0 0 0 0 0 0
2
Vira
mga
mm
MOW
R
Har
Khe
t ko
pani
RRR
of
Water
Bodies
45
00 400
33
00
40
0
1125
675
100
300
1125
775
10
0 50
1125
875
10
0 50
1125
975
10
0 0
3
Vira
mga
mm
MOW
R
Har
Khe
t ko
pani
Constn
of
Lined
Field
Chann
el
21
00 65
15
20
22
0
525
300
50 25 525
350
60 25 525
410
50 15 525
460
60 0
4
Vira
mga
mm
MOW
R
Har
Khe
t ko
pani
Constn
of
UnLin
ed
Field
Chann
el
38
00
56.
25
20
10
69
0
950
250
160
25 950
410
18
0 25
950
590
17
0
6.25
950
760
18
0 0
5
Vira
mga
mm
State
Irrigati
on
Deptt
Oth
ers
Droug
ht
Proofi
ng
throug
h
Check
Dam/
Water
Harves
ting
Structu
res
90
00
100
0
55
90
11
70
2250
1000
250
750
2250
1250
27
0
250
2250
1520
30
0 0
2250
1820
35
0 0
6
Vira
mga
mm
State
Irrigati
on
Deptt
Oth
ers
Secon
dary
Storag
e
structu
re
0 0 0 0 0 0 0 0 0 0 0 0 0 0 0 0 0 0 0 0

83
8
Vira
mga
m -
Fate
wad
i
Co
mm
and
Are
a
State
Irrigati
on
Deptt
AIB
P
Constr
uction
of
Asphal
t &
WBM
road
on the
Existin
g SR
of
Canal
and
Strengt
hening
,
Renov
ation
&
Impro
vemen
t of
Existin
g
Bunds/
Tanks
includi
ng
Constn
of Flap
type
Gates
and
SWF
for
flow
measur
ement
in
Fatewa
di
14
70
0
154
0.9
72
11
30
0
10
00
3675
2450
250
617
3675
2700
25
0
308
3675
2950
25
0 308
3675
3200
25
0 308

84
Canal
Syste
m
under
Sanan
d Irrig
Sub
Dn,
Sanan
d
(NAB
ARD
Assista
nce
Phase-
II
project
)
Tal
uka
-
Bav
la
0 0 0 0 0 0 0
9
Bav
la of
Fate
wad
i
Co
mm
and
Are
a
State
Irrigati
on
Deptt
AIB
P
Constr
uction
of
Asphal
t &
WBM
road
on the
Existin
g SR
of
Canal
and
Strengt
hening
,
Renov
ation
10
48
72
201
2.1
966
7
32
87
0
55
0
26218
8030
100
503.04917
26218
8130
15
0
503.04917
26218
8280
15
0
503.04916
7
26218
8430
15
0
503.04916
7

85
&
Impro
vemen
t of
Existin
g
Bunds/
Tanks
includi
ng
Constn
of Flap
type
Gates
and
SWF
for
flow
measur
ement
in
Fatewa
di
Canal
Syste
m
under
Bavala
Irrig
Sub
Dn,
Baval
(NAB
ARD
Assista
nce
Phase-
II
project
)

86
Tal
uka
-
Dho
lka
0 0 0 0 0 0 0
9
Dho
lka
of
Fate
wad
i
Co
mm
and
Are
a
State
Irrigati
on
Deptt
AIB
P
Constr
uction
of
Asphal
t &
WBM
road
on the
Existin
g SR
of
Canal
and
Strengt
hening
,
Renov
ation
&
Impro
vemen
t of
Existin
g
Bunds/
Tanks
includi
ng
Constn
of Flap
type
Gates
and
SWF
for
flow
67
92
0
201
2.1
966
7
13
16
0
20
0
16980
3215
50
503.04917
16980
3265
50
503.04917
16980
3315
50
503.04916
7
16980
3365
50
503.04916
7

87
measur
ement
in
Fatewa
di
Canal
Syste
m
under
Bavala
Irrig
Sub
Dn,
Baval
(NAB
ARD
Assista
nce
Phase-
II
project
)
Tal
uka
-
Ah
me
dab
ad
Cit
y
0 0 0 0 0 0 0
1
Ah
med
aba
d
(Cit
y)
State
Irrigati
on
Deptt
Oth
ers
Kharic
ut
Canal
duct
0 554
00 0 0 0 0
13850
0 0
13850
0 0 13850
0 0 13850
2
Ah
med
aba
d
State
Irrigati
on
Deptt
Oth
ers
Vinzol
Vahela 0
360
0 0 0 0 0
900
0 0 900
0 0 900 0 0 900

88
(Cit
y)
3
Ah
med
aba
d
(Cit
y)
State
Irrigati
on
Deptt
AIB
P
Hathij
an
Canal
Lining
58
40
506
0
42
76 0
1460
1069
0 1265
1460
1069
0 1265
1460
1069
0 126
5 1460
1069
0 126
5
4
Ah
med
aba
d
(Cit
y)
State
Irrigati
on
Deptt
Oth
ers
Canal
Road 0
575
0 0 0 0 0 0
1437.5
0 0 0
1437.5
0 0 0 1437.5
0 0 0 1437.5
5
Ah
med
aba
d
(Cit
y)
State
Irrigati
on
Deptt
Oth
ers
Ghoda
sar
Colon
y
0 170 0 0 0 0 0 42.5
0 0 0 42.5
0 0 0 42.5
0 0 0 42.5
6
Ah
med
aba
d
(Cit
y)
State
Irrigati
on
Deptt
Oth
ers
Canal
Chowk
ies
0 150 0 0 0 0 37.5
0 0 37.5
0 0 37.5
0 0 37.5
7
Ah
med
aba
d
(Cit
y)
State
Irrigati
on
Deptt
Har
Khe
t ko
pani
Share
Tank 0 350 0 0 0
87.5
0 87.5
0 87.5
0 87.5
Total:
:
32
67
20
862
57.
302
15
63
73.
72
16
43
5
81680
33132.18
3810
23424.092
81680
36942.18
4120
21746.16
81680
41062.18
4175
20722.545
5
81680
45237.18
4330
20364.505
5

89
I.2: Strategic Action Plan of Sardar Sarovar Narmada Nigam ltd in Ahmedabad District, 2016-20
Sr. No
Name of the Blocks/Sub Districts
Concerned Ministry/
Department Component Activity Total Number
Capacity (cum )
Command Area/
lrrigation Potential
(Ha)
Period of Implementation
(5/4 yrs)
Estimated cost (in
Rs.Crores)
1 Viramgam/Ahmedabad MoWR AIBP Major Irrigation 28 40.21 7603 2 15.96
1 Mandal/Ahedabad MoWR AIBP Major Irrigation 27 50.05 10786 2 22.65
1 Detroj/ Ahmedabad MoWR AIBP Major Irrigation 16 21.95 4151 2 8.72
1 Dhandhuka MoWR AIBP Major Irrigation 146 17.21 50516 2 334.92
1 Dholka MoWR AIBP Major Irrigation 46 1.07 3153 2 20.90
1 Dholka MoWR AIBP Major Irrigation
25 Nos, 33.24 km/ 78080400 14760 2 31.9163
1 Viramgam MoWR AIBP
Major Irrigation 11 Nos, 11.745 km/
9887010 1869 2 40.6998
1 Daskroi MoWR AIBP Major Irrigation 1 13.176
1 Sanand MoWR AIBP Major Irrigation 1 8.9884 Sub Total
Ahemdabad
263 92838 16 497.93632
2 Dholka MoWR AIBP Medium Irrigation
2 Daskroi MoWR AIBP Medium Irrigation
2 Sanand MoWR AIBP Medium Irrigation
Sub Total Ahemdabad
Total- Ahmedabad Dist
0 0 0 0
3 Dholka MoWR Har Khet Ko Pani Surface Minor Irrigation
3 Viramgam
MoWR Har khet ko pani Surface Minor
Irrigation
3 Daskroi
MoWR Har khet ko pani Surface Minor
Irrigation
3 Sanand
MoWR Har khet ko pani Surface Minor
Irrigation
Sub Total Ahemdabad
Total- Ahmedabad Dist 0 0 0 0

90
4 Dholka MoWR Har khet ko pani Lift Irrigation
4 Viramgam MoWR Har khet ko pani Lift Irrigation
Sub Total Ahemdabad
Total- Ahmedabad Dist 0 0 0 0
MoWR Har Khet Ko Pani Ground water development
5 Dholka
MoWR Har khet ko pani Ground water
development
5 Viramgam
MoWR Har khet ko pani Ground water
development
5 Daskroi
MoWR Har khet ko pani Ground water
development
5 Bavla
MoWR Har khet ko pani Ground water
development
5 Sanand
MoWR Har khet ko pani Ground water
development
Sub Total Ahemdabad
Total- Ahmedabad Dist 0 0 0 0
6 Dholka MoWR Har khet ko pani RRR of Water Bodies
6 Viramgam MoWR Har khet ko pani RRR of Water Bodies
6 Daskroi MoWR Har khet ko pani RRR of Water Bodies
6 Bavla MoWR Har khet ko pani RRR of Water Bodies
6 Sanand MoWR Har khet ko pani RRR of Water Bodies
Sub Total Ahemdabad
Total- Ahmedabad Dist 0 0 0 0
MoWR Har Khet Ko Pani Construction of Field Channels (UGPL)
7
Dholka
MoWR
Har khet ko pani Construction of Field Channels
7
Viramgam
MoWR
Har khet ko pani Construction of Field Channels
7
Daskroi MoWR
Har khet ko pani Construction of Field Channels
7 Sanand
MoWR Har khet ko pani Construction of Field
Channels
7 Bavla
MoWR Har khet ko pani Construction of Field
Channels

91
Sub Total Ahemdabad
Total- Ahmedabad Dist 0 0 0 0
7.1 Viramgam/Ahmedabad MoWR Har khet ko pani (UGPL)
Lined Field Channels (UGPL)
386 151.05 28554 2 134.204
7.1 Mandal/Ahedabad MoWR Har khet ko pani (UGPL)
Lined Field Channels (UGPL)
957 172.89 32684 2 153.615
7.1 Detroj/ Ahmedabad MoWR Har khet ko pani (UGPL)
Lined Field Channels (UGPL)
329 76.53 14467 2 67.995
3 Dhandhuka MoWR Har khet ko pani UGPL 1152
24.93cum 73168 3 292.67
4 Dholka MoWR Har khet ko pani UGPL 795 1.07cum 3153 3 12.61 7.1
Dholka MoWR Har khet ko pani UGPL 310 Nos , 314.1 KM / 108847040
20576 2 86.4192
7.1 Viramgam MoWR Har khet ko pani UGPL
190 Nos, 188.55 km/ 43986350
8315 2 34.923
7.1 Daskroi MoWR Har khet ko pani
UGPL 59 Nos, 57.565 km/
9818240
1856 2 7.7952 7.1 Bavla MoWR
Har khet ko pani UGPL
10 Nos, 9.09 km/ 4131490 781 1 3.2802
7.1 Sanand MoWR Har khet ko pani UGPL
165 Nos, 163.50km/ 42780230
8087 2 33.9654
Sub Total
Ahemdabad Total- Ahmedabad
Dist 3619 191641 827.481
7.2 Dholka MoWR Har khet ko pani Unlined Field Channels
7.2 Viramgam MoWR Har khet ko pani Unlined Field Channels
7.2 Daskroi MoWR Har khet ko pani Unlined Field Channels
7.2 Bavla MoWR Har khet ko pani Unlined Field Channels
7.2 Sanand MoWR Har khet ko pani Unlined Field Channels
Sub Total Ahemdabad
Total- Ahmedabad Dist 0 0 0 0

92
I.3 Strategic Action Plan of GGRC for Ahmedabad District, 2016-20
Sr. No.
District Taluka
Target for 2016-17
Total Drip Irrigation System (DIS) Sprinkler Irrigation System (SIS)
Total Numbe
r (Farme
rs)
Area (Ha.)
Estimated
Total Cost
(Rs. in lakh)
Estimated
Assistance (Rs. in lakh)
Total Numbe
r (Farme
rs)
Area (Ha.)
Estimated
Total Cost
(Rs. in lakh)
Estimated
Assistance (Rs. in lakh)
Total Numbe
r (Farme
rs)
Area (Ha.)
Estimated
Total Cost
(Rs. in lakh)
Estimated
Assistance (Rs. in lakh)
1 AHMEDABAD Ahmedabad 10 15.79 12.63 7.07 6 9.48 11.37 6.37 4 6.32 1.26 0.71
1 AHMEDABAD Asarva 0 0.28 0.22 0.12 0 0.17 0.20 0.11 0 0.11 0.02 0.01
1 AHMEDABAD Bavla 28 44.64 35.72 20.00 17 26.79 32.14 18.00 11 17.86 3.57 2.00
1 AHMEDABAD Daskroi 264
422.61 338.09 189.33 158
253.56 304.28 170.40 106
169.04 33.81 18.93
1 AHMEDABAD Dhandhuka 635
1016.05 812.84 455.19 381
609.63 731.56 409.67 254
406.42 81.28 45.52
1 AHMEDABAD Dholera 41 65.72 52.57 29.44 25 39.43 47.32 26.50 16 26.29 5.26 2.94
1 AHMEDABAD Dholka 275
440.63 352.51 197.40 165
264.38 317.26 177.66 110
176.25 35.25 19.74
1 AHMEDABAD Detroj 92
146.67 117.34 65.71 55 88.00 105.60 59.14 37 58.67 11.73 6.57
1 AHMEDABAD Ghatlodiya 1 0.87 0.70 0.39 0 0.52 0.63 0.35 0 0.35 0.07 0.04
1 AHMEDABAD Mandal 658
1053.13 842.50 471.80 395
631.88 758.25 424.62 263
421.25 84.25 47.18
1 AHMEDABAD Rampura 62 98.89 79.11 44.30 37 59.33 71.20 39.87 25 39.55 7.91 4.43
1 AHMEDABAD Sanand 356 570.3 456.27 255.51 214 342.2 410.65 229.96 143 228.1 45.63 25.55

93
4 1 4
1 AHMEDABAD Vatva 1 1.50 1.20 0.67 1 0.90 1.08 0.61 0 0.60 0.12 0.07
1 AHMEDABAD Vejalpur 1 1.29 1.03 0.58 0 0.78 0.93 0.52 0 0.52 0.10 0.06
1 AHMEDABAD Viramgam 233
372.38 297.91 166.83 140
223.43 268.11 150.14 93
148.95 29.79 16.68
1 AHMEDABAD TOTAL 2657
4250.80 3400.64 1904.36 1594
2550.48 3060.58 1713.92 1063
1700.32 340.06 190.44
Sr. No.
District Taluka
Target for 2017-18
Total Drip Irrigation System (DIS) Sprinkler Irrigation System (SIS)
Total Numbe
r (Farme
rs)
Area (Ha.)
Estimated
Total Cost
(Rs. in lakh)
Estimated
Assistance (Rs. in lakh)
Total Numbe
r (Farme
rs)
Area (Ha.)
Estimated
Total Cost
(Rs. in lakh)
Estimated
Assistance (Rs. in lakh)
Total Numbe
r (Farme
rs)
Area (Ha.)
Estimated
Total Cost
(Rs. in lakh)
Estimated
Assistance (Rs. in lakh)
1 AHMEDABAD Ahmedabad 7 11.84 9.48 5.31 4 7.11 8.53 4.78 3 4.74 0.95 0.53
1 AHMEDABAD Asarva 0 0.21 0.17 0.09 0 0.12 0.15 0.08 0 0.08 0.02 0.01
1 AHMEDABAD Bavla 21 33.48 26.79 15.00 13 20.09 24.11 13.50 8 13.39 2.68 1.50
1 AHMEDABAD Daskroi 198
316.96 253.56 142.00 119
190.17 228.21 127.80 79
126.78 25.36 14.20
1 AHMEDABAD Dhandhuka 476
762.04 609.63 341.39 286
457.22 548.67 307.25 191
304.82 60.96 34.14
1 AHMEDABAD Dholera 31 49.29 39.43 22.08 18 29.57 35.49 19.87 12 19.72 3.94 2.21
1 AHMEDABAD Dholka 207
330.47 264.38 148.05 124
198.28 237.94 133.25 83
132.19 26.44 14.81

94
1 AHMEDABAD Detroj 69
110.00 88.00 49.28 41 66.00 79.20 44.35 28 44.00 8.80 4.93
1 AHMEDABAD Ghatlodiya 0 0.66 0.52 0.29 0 0.39 0.47 0.26 0 0.26 0.05 0.03
1 AHMEDABAD Mandal 494
789.85 631.88 353.85 296
473.91 568.69 318.47 197
315.94 63.19 35.39
1 AHMEDABAD Rampura 46 74.16 59.33 33.23 28 44.50 53.40 29.90 19 29.67 5.93 3.32
1 AHMEDABAD Sanand 267
427.76 342.21 191.64 160
256.65 307.99 172.47 107
171.10 34.22 19.16
1 AHMEDABAD Vatva 1 1.13 0.90 0.51 0 0.68 0.81 0.45 0 0.45 0.09 0.05
1 AHMEDABAD Vejalpur 1 0.97 0.78 0.43 0 0.58 0.70 0.39 0 0.39 0.08 0.04
1 AHMEDABAD Viramgam 175
279.29 223.43 125.12 105
167.57 201.09 112.61 70
111.71 22.34 12.51
1 AHMEDABAD TOTAL 1993
3188.10 2550.48 1428.27 1196
1912.86 2295.43 1285.44 797
1275.24 255.05 142.83
Sr. No.
District Taluka
Target for 2018-19
Total Drip Irrigation System (DIS) Sprinkler Irrigation System (SIS)
Total Numbe
r (Farme
rs)
Area (Ha.)
Estimated
Total Cost
(Rs. in lakh)
Estimated
Assistance (Rs. in lakh)
Total Numbe
r (Farme
rs)
Area (Ha.)
Estimated
Total Cost
(Rs. in lakh)
Estimated
Assistance (Rs. in lakh)
Total Numbe
r (Farme
rs)
Area (Ha.)
Estimated
Total Cost
(Rs. in lakh)
Estimated
Assistance (Rs. in lakh)
1 AHMEDABAD Ahmedabad 7 11.84 9.48 5.31 4 7.11 8.53 4.78 3 4.74 0.95 0.53
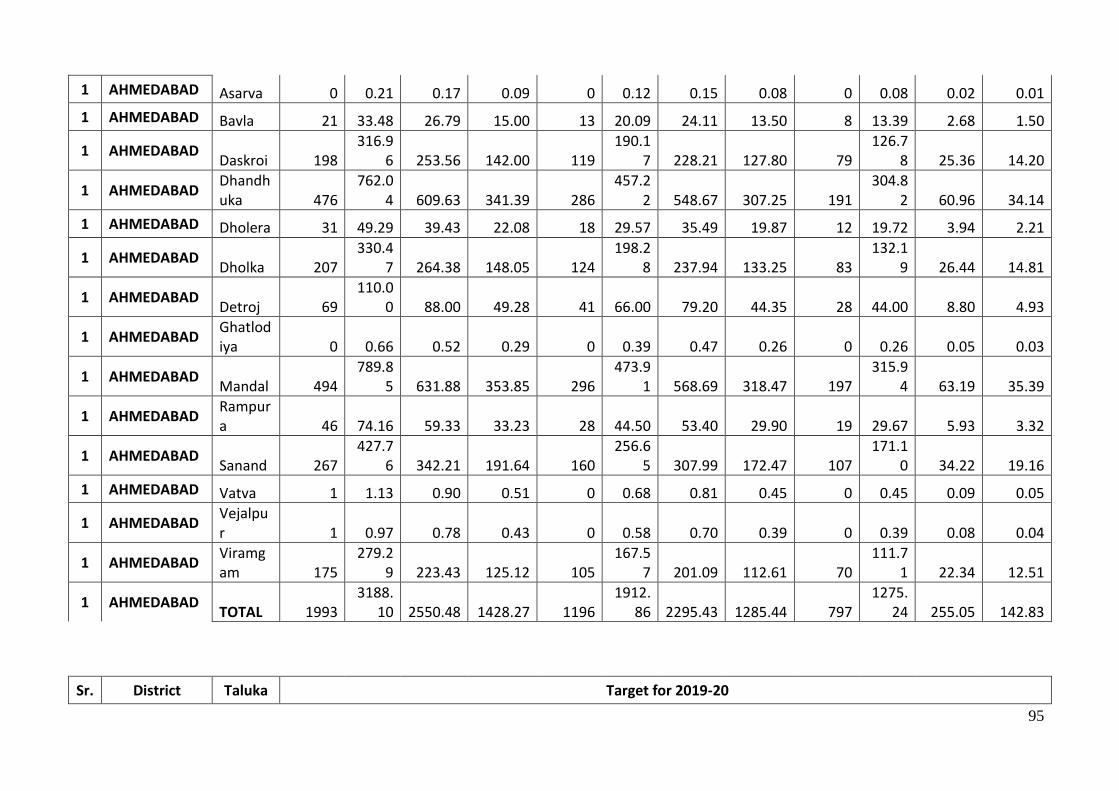
95
1 AHMEDABAD Asarva 0 0.21 0.17 0.09 0 0.12 0.15 0.08 0 0.08 0.02 0.01
1 AHMEDABAD Bavla 21 33.48 26.79 15.00 13 20.09 24.11 13.50 8 13.39 2.68 1.50
1 AHMEDABAD Daskroi 198
316.96 253.56 142.00 119
190.17 228.21 127.80 79
126.78 25.36 14.20
1 AHMEDABAD Dhandhuka 476
762.04 609.63 341.39 286
457.22 548.67 307.25 191
304.82 60.96 34.14
1 AHMEDABAD Dholera 31 49.29 39.43 22.08 18 29.57 35.49 19.87 12 19.72 3.94 2.21
1 AHMEDABAD Dholka 207
330.47 264.38 148.05 124
198.28 237.94 133.25 83
132.19 26.44 14.81
1 AHMEDABAD Detroj 69
110.00 88.00 49.28 41 66.00 79.20 44.35 28 44.00 8.80 4.93
1 AHMEDABAD Ghatlodiya 0 0.66 0.52 0.29 0 0.39 0.47 0.26 0 0.26 0.05 0.03
1 AHMEDABAD Mandal 494
789.85 631.88 353.85 296
473.91 568.69 318.47 197
315.94 63.19 35.39
1 AHMEDABAD Rampura 46 74.16 59.33 33.23 28 44.50 53.40 29.90 19 29.67 5.93 3.32
1 AHMEDABAD Sanand 267
427.76 342.21 191.64 160
256.65 307.99 172.47 107
171.10 34.22 19.16
1 AHMEDABAD Vatva 1 1.13 0.90 0.51 0 0.68 0.81 0.45 0 0.45 0.09 0.05
1 AHMEDABAD Vejalpur 1 0.97 0.78 0.43 0 0.58 0.70 0.39 0 0.39 0.08 0.04
1 AHMEDABAD Viramgam 175
279.29 223.43 125.12 105
167.57 201.09 112.61 70
111.71 22.34 12.51
1 AHMEDABAD TOTAL 1993
3188.10 2550.48 1428.27 1196
1912.86 2295.43 1285.44 797
1275.24 255.05 142.83
Sr. District Taluka Target for 2019-20

96
No.
Total Drip Irrigation System (DIS) Sprinkler Irrigation System (SIS)
Total Numbe
r (Farme
rs)
Area (Ha.)
Estimated
Total Cost
(Rs. in lakh)
Estimated
Assistance (Rs. in lakh)
Total Numbe
r (Farme
rs)
Area (Ha.)
Estimated
Total Cost
(Rs. in lakh)
Estimated
Assistance (Rs. in lakh)
Total Numbe
r (Farme
rs)
Area (Ha.)
Estimated
Total Cost
(Rs. in lakh)
Estimated
Assistance (Rs. in lakh)
1 AHMEDABAD Ahmedabad 7 11.84 9.48 5.31 4 7.11 8.53 4.78 3 4.74 0.95 0.53
1 AHMEDABAD Asarva 0 0.21 0.17 0.09 0 0.12 0.15 0.08 0 0.08 0.02 0.01
1 AHMEDABAD Bavla 21 33.48 26.79 15.00 13 20.09 24.11 13.50 8 13.39 2.68 1.50
1 AHMEDABAD Daskroi 198
316.96 253.56 142.00 119
190.17 228.21 127.80 79
126.78 25.36 14.20
1 AHMEDABAD Dhandhuka 476
762.04 609.63 341.39 286
457.22 548.67 307.25 191
304.82 60.96 34.14
1 AHMEDABAD Dholera 31 49.29 39.43 22.08 18 29.57 35.49 19.87 12 19.72 3.94 2.21
1 AHMEDABAD Dholka 207
330.47 264.38 148.05 124
198.28 237.94 133.25 83
132.19 26.44 14.81
1 AHMEDABAD Detroj 69
110.00 88.00 49.28 41 66.00 79.20 44.35 28 44.00 8.80 4.93
1 AHMEDABAD Ghatlodiya 0 0.66 0.52 0.29 0 0.39 0.47 0.26 0 0.26 0.05 0.03
1 AHMEDABAD Mandal 494
789.85 631.88 353.85 296
473.91 568.69 318.47 197
315.94 63.19 35.39
1 AHMEDABAD Rampura 46 74.16 59.33 33.23 28 44.50 53.40 29.90 19 29.67 5.93 3.32
1 AHMEDABAD Sanand 267
427.76 342.21 191.64 160
256.65 307.99 172.47 107
171.10 34.22 19.16
1 AHMEDABAD Vatva 1 1.13 0.90 0.51 0 0.68 0.81 0.45 0 0.45 0.09 0.05

97
1 AHMEDABAD Vejalpur 1 0.97 0.78 0.43 0 0.58 0.70 0.39 0 0.39 0.08 0.04
1 AHMEDABAD Viramgam 175
279.29 223.43 125.12 105
167.57 201.09 112.61 70
111.71 22.34 12.51
1 AHMEDABAD TOTAL 1993
3188.10 2550.48 1428.27 1196
1912.86 2295.43 1285.44 797
1275.24 255.05 142.83

98
I.4: Strategic Action Plan of GWRDC for Irrigation under PMKSY in Ahmedabad District, 2016-20
SNo
Taluka
Concerned Ministry/
Department
Department
Component Activity Total
Number
Capacity (cum )
Command Area/
lrrigation Potential
(Ha)
Period of Implementatio
n (5/7 yrs)
Estimated cost (in
Rs.) (Lakh)
1 Bavla MoWR GWRDC Har Khet ko Pani Recharge Structure 8 40 4 80
2 Bavla MoWR GWRDC
Per Drop more crop
New Tubewell with Drip 2 48 4 120
3 City Dascroi MoWR GWRDC Har Khet ko Pani Recharge Structure 16 80 4 160
4 Detroj MoWR GWRDC Har Khet ko Pani Recharge Structure 12 60 4 120
5 Detroj MoWR GWRDC
Per Drop more crop
New Tubewell with Drip 4 80 4 200
6 Dhandhuka MoWR GWRDC Har Khet ko Pani Recharge Structure 8 40 4 80
7 Dholka MoWR GWRDC Har Khet ko Pani Recharge Structure 8 40 4 80
8 Dholka MoWR GWRDC
Per Drop more crop
New Tubewell with Drip 2 48 4 120
9 Mandal MoWR GWRDC
Per Drop more crop
New Tubewell with Drip 4 80 4 200
10 Sanand MoWR GWRDC Har Khet ko Pani Recharge Structure 8 40 4 80
11 Sanand MoWR GWRDC
Per Drop more crop
New Tubewell with Drip 2 48 4 120
12 Viramgam MoWR GWRDC Har Khet ko Pani Recharge Structure 16 80 4 160
13 Viramgam MoWR GWRDC
Per Drop more crop
New Tubewell with Drip 5 96 4 240
14 Ahmadabad District
95 0 780 52 1760

99
I.5 Strategic Action plan of GLDC for Ahmedabad District, 2016-20
Sr.
No.
Name of the
Taluks/Sub districts Converened Ministry Department Component
Name of
Activity
Total
Number
Capacity
(cum)
Command
area/irrigation
potential (Ha.)
Period of
Implementation
year 2016-17 to
2020-21
Estimated
cost (in
Rs. lakh)
2 Detroj Agriculture & Co-
opration
GLDC Har Khet ko Pani Farm
pond
80
115.20 4 89.60
2 Detroj Agriculture & Co-
opration
GLDC Har Khet ko Pani Sim
pond
16
67.20 4 80.00
2 Detroj Agriculture & Co-
opration
GLDC Har Khet ko Pani Village
pond
12
345.60 4 84.00
2 Detroj Agriculture & Co-
opration
GLDC Har Khet ko Pani WHS 28
168.00 4 31.36
6 Daskroi Agriculture & Co-
opration
GLDC Har Khet ko Pani Farm
pond
80
115.20 4 89.60
6 Daskroi Agriculture & Co-
opration
GLDC Har Khet ko Pani Sim
pond
16
67.20 4 80.00
6 Daskroi Agriculture & Co-
opration
GLDC Har Khet ko Pani Village
pond
12
345.60 4 84.00
6 Daskroi Agriculture & Co-
opration
GLDC Har Khet ko Pani WHS 28
168.00 4 31.36
11 Dhandhuka Agriculture & Co-
opration
GLDC Har Khet ko Pani Farm
pond
80
115.20 4 89.60
11 Dhandhuka Agriculture & Co-
opration
GLDC Har Khet ko Pani Sim
pond
16
67.20 4 80.00
11 Dhandhuka Agriculture & Co-
opration
GLDC Har Khet ko Pani Village
pond
12
345.60 4 84.00
11 Dhandhuka Agriculture & Co-
opration
GLDC Har Khet ko Pani WHS 28
168.00 4 31.36
14 Dholera Agriculture & Co-
opration
GLDC Har Khet ko Pani Farm
pond
80
115.20 4 89.60
14 Dholera Agriculture & Co-
opration
GLDC Har Khet ko Pani Sim
pond
16
67.20 4 80.00

100
14 Dholera Agriculture & Co-
opration
GLDC Har Khet ko Pani Village
pond
12
345.60 4 84.00
14 Dholera Agriculture & Co-
opration
GLDC Har Khet ko Pani WHS 28
168.00 4 31.36
7 Dholka Agriculture & Co-
opration
GLDC Har Khet ko Pani Farm
pond
80
115.20 4 89.60
7 Dholka Agriculture & Co-
opration
GLDC Har Khet ko Pani Sim
pond
16
67.20 4 80.00
7 Dholka Agriculture & Co-
opration
GLDC Har Khet ko Pani Village
pond
12
345.60 4 84.00
7 Dholka Agriculture & Co-
opration
GLDC Har Khet ko Pani WHS 28
168.00 4 31.36
8 Bavla Agriculture & Co-
opration
GLDC Har Khet ko Pani Farm
pond
80
115.20 4 89.60
8 Bavla Agriculture & Co-
opration
GLDC Har Khet ko Pani Sim
pond
16
67.20 4 80.00
8 Bavla Agriculture & Co-
opration
GLDC Har Khet ko Pani Village
pond
12
345.60 4 84.00
8 Bavla Agriculture & Co-
opration
GLDC Har Khet ko Pani WHS 28
168.00 4 31.36
1 Mandal Agriculture & Co-
opration
GLDC Har Khet ko Pani Farm
pond
80
115.20 4 89.60
1 Mandal Agriculture & Co-
opration
GLDC Har Khet ko Pani Sim
pond
16
67.20 4 80.00
1 Mandal Agriculture & Co-
opration
GLDC Har Khet ko Pani Village
pond
12
345.60 4 84.00
1 Mandal Agriculture & Co-
opration
GLDC Har Khet ko Pani WHS 28
168.00 4 31.36
3 Viramgam Agriculture & Co-
opration
GLDC Har Khet ko Pani Farm
pond
80
115.20 4 89.60
3 Viramgam Agriculture & Co-
opration
GLDC Har Khet ko Pani Sim
pond
16
67.20 4 80.00
3 Viramgam Agriculture & Co- GLDC Har Khet ko Pani Village 12 345.60 4 84.00

101
opration pond
3 Viramgam Agriculture & Co-
opration
GLDC Har Khet ko Pani WHS 28
168.00 4 31.36
4 Sanand Agriculture & Co-
opration
GLDC Har Khet ko Pani Farm
pond
80
115.20 4 89.60
4 Sanand Agriculture & Co-
opration
GLDC Har Khet ko Pani Sim
pond
16
67.20 4 80.00
4 Sanand Agriculture & Co-
opration
GLDC Har Khet ko Pani Village
pond
12
345.60 4 84.00
4 Sanand Agriculture & Co-
opration
GLDC Har Khet ko Pani WHS 28
168.00 4 31.36
12 Ahmadabad
District Total
Agriculture & Co-
opration
GLDC Har Khet ko Pani Farm
pond
720
1036.80 4 806.40
12 Ahmadabad
District Total
Agriculture & Co-
opration
GLDC Har Khet ko Pani Sim
pond
144
604.80 4 720.00
12 Ahmadabad
District Total
Agriculture & Co-
opration
GLDC Har Khet ko Pani Village
pond
108
3110.40 4 756.00
12 Ahmadabad
District Total
Agriculture & Co-
opration
GLDC Har Khet ko Pani WHS 252
1512.00 4 282.24
1224 0 6264 144 2564.64

102
I.6: Strategic Action Plan of ATMA in Ahmedabad District, 2016-20
S# Name of District
No of
Training
No of
Trainees
Command
Area
Period of
Implementation
Estimated
Cost (In
Rs.) Year
1 Ahmedabad 388 4122 4 32.16276 2016-17
1 Ahmedabad 505 6201 4 42.28776 2017-18
1 Ahmedabad 614 7677 4 50.97051 2018-19
1 Ahmedabad 839 9072 4 63.20277 2019-20

103
I.7 Strategic Action Plan of GSWMA for Ahmedabad District, 2016-20
Sr.No Activity
Physical Target for FY (2016-17)
Unit Cost (In Lakhs)
Storage Volume (Cubic Meter)
Command Area/
Irrigation Potential
(Ha.)
Person days/Mandays
Planned
Convergence
Unit Amount (In
Lakhs) Name of Schemes
1.0 Animal camp 0.0 0.0 0.0 0.0 0.0 0.0 0.0 0.0
2.0 Animal water trough (Havada) 0.0 0.0 0.0 0.0 0.0 0.0 0.0 0.0
3.0 Causeway on connecting roads 3.0 10.4 0.0 0.0 0.0 0.0 0.0 0.0
4.0 Check / Protection wall 3.0 7.2 0.0 0.0 0.0 0.0 0.0 0.0
5.0 Demonstration for Agricultural / Animal Husbandry Productivity Enhancement
0.0 0.0 0.0 0.0 0.0 0.0 0.0 0.0
6.0 Drainage line correction (To prevent flooding of Gamtal)
1.0 2.2 0.0 0.0 0.0 0.0 0.0 0.0
7.0 Drinking water facility 10.0 13.5 0.0 0.0 0.0 0.0 0.0 WASMO
8.0 Fencing for protection from wild animals 0.0 0.0 0.0 0.0 0.0 0.0 0.0 0.0
9.0 Grassland/Gauchar Development 0.0 0.0 0.0 0.0 0.0 0.0 0.0 0.0
10.0 Improvised and energy efficient smashan gruh (Cemetery )
1.0 0.7 0.0 0.0 0.0 1.0 1.0 Forest
12.0 Panchayat Well Repair & Pump Room 0.0 0.0 0.0 0.0 0.0 0.0 0.0 0.0
13.0 Rain water harvesting system 1.0 2.4 0.0 0.0 0.0 0.0 0.0 0.0
14.0 Recharge / Repair of open wells 1.0 0.9 0.0 0.0 0.0 0.0 0.0 0.0
15.0 Repair / development of artificial water bodies
0.0 0.0 0.0 0.0 0.0 0.0 0.0 0.0
16.0 Revival of natural water bodies with recharge activities
0.0 0.0 0.0 0.0 0.0 0.0 0.0 0.0
17.0 Sanitation facilities/Sewerage line 6.0 12.4 0.0 0.0 1392.0 0.0 0.0 0.0
18.0 Use solar power for productive activities 0.0 0.0 0.0 0.0 0.0 0.0 0.0 0.0
19.0 Wind energy development 0.0 0.0 0.0 0.0 0.0 0.0 0.0 0.0
20.0 OTHERS (Specifiy activities ) 0.0 0.0 0.0 0.0 0.0 0.0 0.0 0.0
Washing ghat 0.0 0.0 0.0 0.0 0.0 0.0 0.0 0.0

104
Dugwell Recharge 0.0 0.0 0.0 0.0 0.0 0.0 0.0 0.0
Anganwadi Repairing 0.0 0.0 0.0 0.0 0.0 0.0 0.0 0.0
R.O. System 0.0 0.0 0.0 0.0 0.0 0.0 0.0 0.0
Books For Library 0.0 0.0 0.0 0.0 0.0 0.0 0.0 0.0
Village water tank Maintenance 3.0 6.3 0.0 0.0 0.0 0.0 0.0 0.0
Land Development 0.0 0.0 0.0 0.0 0.0 0.0 0.0 0.0
1.0 Farm Bunding 315744.3 237.1 0.0 0.0 26644.0 0.0 0.0 MGNREGA
2.0 Afforestation 57.5 74.2 0.0 0.0 8341.0 0.0 0.0 MGNREGA
3.0
Agriculture Demo 0.0 0.0 0.0 0.0 0.0 0.0 0.0 0.0
4.0 Agro Forestry 130.7 4.8 0.0 0.0 406.0 0.0 0.0 0.0
5.0 Horticulture 0.0 0.0 0.0 0.0 0.0 0.0 0.0 0.0
6.0 Land leveling 273.8 57.9 0.0 0.0 6501.0 0.0 0.0 0.0
7.0 Pasture development 29.7 23.5 0.0 0.0 2642.0 0.0 0.0 0.0
8.0 OTHERS (Specifiy activities ) 0.0 0.0 0.0 0.0 0.0 0.0 0.0 0.0
Tree plantation On Farm Bund 0.0 0.0 0.0 0.0 0.0 0.0 10.0 MGNREGA
Soil & Moisture Conservation 0.0 0.0 0.0 0.0 0.0 0.0 0.0 0.0
1.0 Check wall 1.0 2.0 0.0 0.0 0.0 0.0 0.0 0.0
2.0 Earthen bund 522.5 82.6 0.0 0.0 9283.0 0.0 0.0 MGNREGA
3.0
Protection Wall 30.7 139.9 0.0 0.0 15717.0 0.0 0.0 MGNREGA
4.0 Waste weir 67.3 175.5 0.0 0.0 19720.0 0.0 0.0 0.0
5.0 Bench Terracing 0.0 0.0 0.0 0.0 0.0 0.0 0.0 0.0
6.0 Bori bandh 0.0 0.0 0.0 0.0 0.0 0.0 0.0 0.0
7.0 Brushwood Checks 0.0 0.0 0.0 0.0 0.0 0.0 0.0 0.0

105
8.0
Countour Bunding 0.0 0.0 0.0 0.0 0.0 0.0 2.8 MGNREGA
9.0 Countour Trenches 0.0 0.0 0.0 0.0 0.0 0.0 0.0 0.0
10.0 Earthern Dam 2.0 6.5 0.0 0.0 0.0 0.0 0.0 0.0
11.0 Field Outlet / Farm Outlet 304.7 57.9 0.0 0.0 6507.0 0.0 0.0 MGNREGA
12.0
Gabion structure 0.0 0.0 0.0 0.0 0.0 0.0 0.0 0.0
13.0 Graded Bunding 0.0 0.0 0.0 0.0 0.0 0.0 0.0 0.0
14.0 Gully plug 0.0 0.0 0.0 0.0 0.0 0.0 0.0 0.0
15.0 Loose boulder Checks 0.0 0.0 0.0 0.0 0.0 0.0 0.0 0.0
16.0
Nala Plug 0.0 0.0 0.0 0.0 0.0 0.0 0.0 0.0
17.0
Stone bunding 1.0 8.0 0.0 0.0 0.0 0.0 0.0 0.0
18.0 Straggred Contour trenching(Terrace Talavadi)
0.0 0.0 0.0 0.0 0.0 0.0 0.0 0.0
19.0 pacca nala plug 0.0 0.0 0.0 0.0 0.0 0.0 0.0 0.0
Diversion Channel 46.7 156.7 0.0 0.0 17608.0 0.0 0.0 MGNREGA
Flow Channel 7614.0 59.6 0.0 0.0 6699.0 0.0 0.0 MGNREGA
Culvert 9.0 17.0 0.0 0.0 1910.0 0.0 0.0 0.0
Stone Pitching 0.0 0.0 0.0 0.0 0.0 0.0 8.0 MGNREGA
Water Harvesting Structure 0.0 0.0 0.0 0.0 0.0 0.0 0.0 0.0
1.0
Cause way cum Chek dam 23.7 81.5 62500.0 104.2 9152.0 0.0 0.0 0.0
2.0 Check dam 72.7 230.5 205000.0 341.7 25902.0 0.0 0.0 MGNREGA
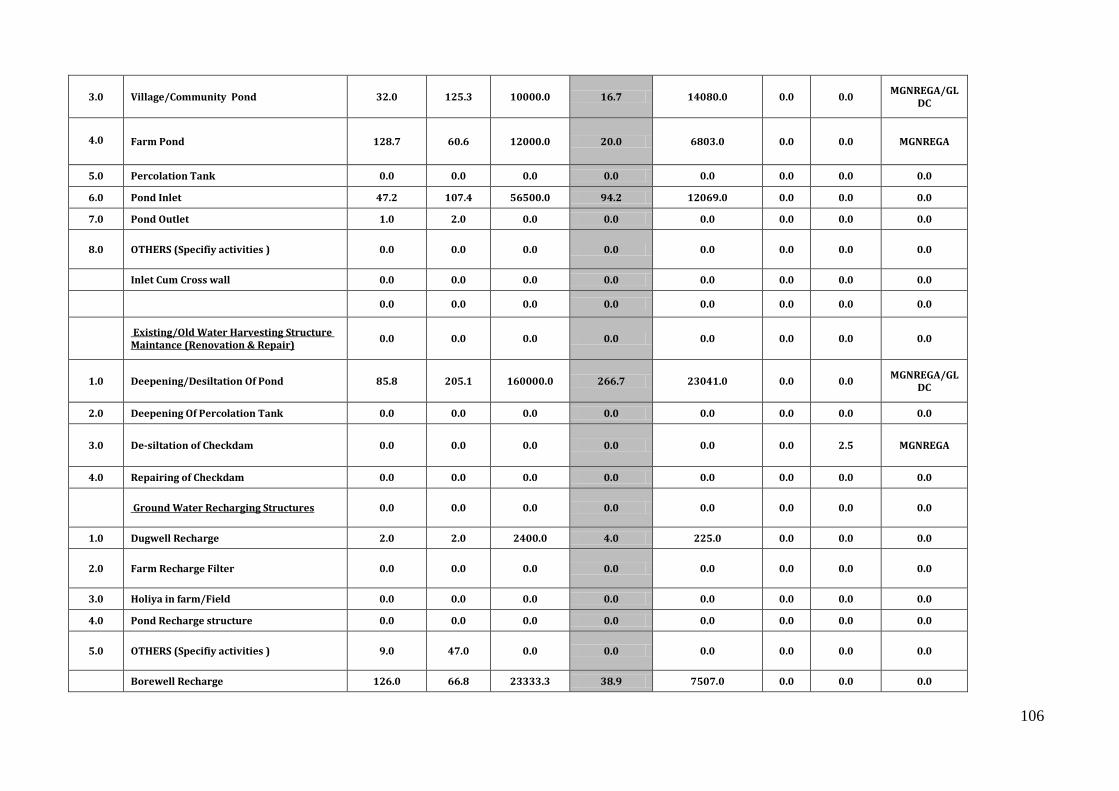
106
3.0 Village/Community Pond 32.0 125.3 10000.0 16.7 14080.0 0.0 0.0 MGNREGA/GL
DC
4.0
Farm Pond 128.7 60.6 12000.0 20.0 6803.0 0.0 0.0 MGNREGA
5.0 Percolation Tank 0.0 0.0 0.0 0.0 0.0 0.0 0.0 0.0
6.0 Pond Inlet 47.2 107.4 56500.0 94.2 12069.0 0.0 0.0 0.0
7.0 Pond Outlet 1.0 2.0 0.0 0.0 0.0 0.0 0.0 0.0
8.0
OTHERS (Specifiy activities ) 0.0 0.0 0.0 0.0 0.0 0.0 0.0 0.0
Inlet Cum Cross wall 0.0 0.0 0.0 0.0 0.0 0.0 0.0 0.0
0.0 0.0 0.0 0.0 0.0 0.0 0.0 0.0
Existing/Old Water Harvesting Structure Maintance (Renovation & Repair)
0.0 0.0 0.0 0.0 0.0 0.0 0.0 0.0
1.0 Deepening/Desiltation Of Pond 85.8 205.1 160000.0 266.7 23041.0 0.0 0.0 MGNREGA/GL
DC
2.0 Deepening Of Percolation Tank 0.0 0.0 0.0 0.0 0.0 0.0 0.0 0.0
3.0 De-siltation of Checkdam 0.0 0.0 0.0 0.0 0.0 0.0 2.5 MGNREGA
4.0 Repairing of Checkdam 0.0 0.0 0.0 0.0 0.0 0.0 0.0 0.0
Ground Water Recharging Structures 0.0 0.0 0.0 0.0 0.0 0.0 0.0 0.0
1.0 Dugwell Recharge 2.0 2.0 2400.0 4.0 225.0 0.0 0.0 0.0
2.0
Farm Recharge Filter 0.0 0.0 0.0 0.0 0.0 0.0 0.0 0.0
3.0 Holiya in farm/Field 0.0 0.0 0.0 0.0 0.0 0.0 0.0 0.0
4.0 Pond Recharge structure 0.0 0.0 0.0 0.0 0.0 0.0 0.0 0.0
5.0
OTHERS (Specifiy activities ) 9.0 47.0 0.0 0.0 0.0 0.0 0.0 0.0
Borewell Recharge 126.0 66.8 23333.3 38.9 7507.0 0.0 0.0 0.0

107
Injection Well 61.3 36.8 306666.7 511.1 4135.0 0.0 0.0 0.0
Drainage line correction 0.0 0.0 0.0 0.0 0.0 0.0 0.0 0.0
Recharge Shaft 0.0 0.0 0.0 0.0 0.0 0.0 0.0 0.0
S.No
Sub Activity Name 0.0 0.0 0.0 0.0 0.0 0.0 0.0 0.0
1.0
AGRICULTURE ACTIVITIES 3281.7 409.5 ####### 0.0 38425.0 0.0 0.0 Agri/NHM/Ho
rti./NFSM/ GGRC/ATMA
2.0
AGRO PROCESSING ACTIVITIES 89.7 43.1 0.0 0.0 2472.0 0.0 0.0 Agri/NHM/Ho
rti./NFSM/ GGRC/ATMA
3.0 Animal Husbandry 946.3 201.7 530000.0 0.0 16331.0 0.0 0.0 Ani. Hus.
4.0 Establishing linkages 0.0 0.0 0.0 0.0 0.0 0.0 0.0 0.0
5.0 Local traditional handicraft 0.0 0.0 0.0 0.0 0.0 0.0 0.0 0.0
6.0 Minor Activities 269.2 71.8 0.0 0.0 5713.0 0.0 0.0 GLPC
7.0 Non-conventional Energy Sources 0.0 0.0 0.0 0.0 0.0 0.0 0.0 0.0
8.0
Revolving Fund 48.0 14.3 0.0 0.0 1601.0 0.0 0.0 0.0
Capacity building , Monitoring and evaluation
60.0
Administrative 196.5
Consolidation 69.0
Total 3190.0 1397.3

108
Sr.No Activity
Physical Target for FY (2017-18)
Unit Cost (In
Lakhs)
Storage Volumes
(Cubic Meter)
Command Area/
Irrigation Potential
(Ha.)
Person days/Mandays
Planned
Convergence
Unit Amount
(In Lakhs)
Name of Schemes
1.0 Animal camp 0.0 0.0 0.0 0.0 0.0 0.0 0.0 0.0
2.0 Animal water trough (Havada) 0.0 0.0 0.0 0.0 0.0 0.0 0.0 0.0
3.0 Causeway on connecting roads 0.0 0.0 0.0 0.0 0.0 0.0 0.0 0.0
4.0 Check / Protection wall 0.0 0.0 0.0 0.0 0.0 0.0 0.0 0.0
5.0 Demonstration for Agricultural / Animal Husbandry Productivity Enhancement
0.0 0.0 0.0 0.0 0.0 0.0 0.0 0.0
6.0 Drainage line correction (To prevent flooding of Gamtal) 0.0 0.0 0.0 0.0 0.0 0.0 0.0 0.0
7.0 Drinking water facility 0.0 0.0 0.0 0.0 0.0 0.0 0.0 0.0
8.0 Fencing for protection from wild animals 0.0 0.0 0.0 0.0 0.0 0.0 0.0 0.0
9.0 Grassland/Gauchar Development 0.0 0.0 0.0 0.0 0.0 0.0 0.0 0.0
10.0 Improvised and energy efficient smashan gruh (Cemetery ) 0.0 0.0 0.0 0.0 0.0 0.0 0.0 0.0
12.0 Panchayat Well Repair & Pump Room 0.0 0.0 0.0 0.0 0.0 0.0 0.0 0.0
13.0 Rain water harvesting system 0.0 0.0 0.0 0.0 0.0 0.0 0.0 0.0
14.0 Recharge / Repair of open wells 0.0 0.0 0.0 0.0 0.0 0.0 0.0 0.0
15.0 Repair / development of artificial water bodies 0.0 0.0 0.0 0.0 0.0 0.0 0.0 0.0
16.0 Revival of natural water bodies with recharge activities 0.0 0.0 0.0 0.0 0.0 0.0 0.0 0.0
17.0 Sanitation facilities/Sewerage line 0.0 0.0 0.0 0.0 0.0 0.0 0.0 0.0
18.0 Use solar power for productive activities 0.0 0.0 0.0 0.0 0.0 0.0 0.0 0.0
19.0 Wind energy development 0.0 0.0 0.0 0.0 0.0 0.0 0.0 0.0
20.0 OTHERS (Specifiy activities ) 0.0 0.0 0.0 0.0 0.0 0.0 0.0 0.0
Washing ghat 0.0 0.0 0.0 0.0 0.0 0.0 0.0 0.0
Dugwell Recharge 0.0 0.0 0.0 0.0 0.0 0.0 0.0 0.0

109
Anganwadi Repairing 0.0 0.0 0.0 0.0 0.0 0.0 0.0 0.0
R.O. System 0.0 0.0 0.0 0.0 0.0 0.0 0.0 0.0
Books For Library 0.0 0.0 0.0 0.0 0.0 0.0 0.0 0.0
Village water tank Maintenance 0.0 0.0 0.0 0.0 0.0 0.0 0.0 0.0
Land Development 0.0 0.0 0.0 0.0 0.0 0.0 0.0 0.0
1.0 Farm Bunding 227101.0 188.1 0.0 0.0 21132.0 0.0 0.0 0.0
2.0 Afforestation 40.5 48.7 0.0 0.0 5473.0 0.0 0.0 0.0
3.0
Agriculture Demo 0.0 0.0 0.0 0.0 0.0 0.0 0.0 0.0
4.0 Agro Forestry 63.3 1.8 0.0 0.0 203.0 0.0 0.0 0.0
5.0 Horticulture 0.0 0.0 0.0 0.0 0.0 0.0 0.0 0.0
6.0 Land leveling 378.8 79.5 0.0 0.0 8928.0 0.0 0.0 0.0
7.0 Pasture development 33.8 21.3 0.0 0.0 2388.0 0.0 0.0 0.0
8.0 OTHERS (Specifiy activities ) 0.0 0.0 0.0 0.0 0.0 0.0 0.0 0.0
Tree plantation On Farm Bund 14515.0 7.0 0.0 0.0 0.0 0.0 0.0 0.0
Soil & Moisture Conservation 0.0 0.0 0.0 0.0 0.0 0.0 0.0 0.0
1.0 Check wall 0.0 0.0 0.0 0.0 0.0 0.0 0.0 0.0
2.0 Earthen bund 16.3 59.4 0.0 0.0 6672.0 0.0 0.0 0.0
3.0
Protection Wall 15.3 71.6 0.0 0.0 8047.0 0.0 0.0 0.0
4.0 Waste weir 30.7 86.5 0.0 0.0 9719.0 0.0 0.0 0.0
5.0 Bench Terracing 0.0 0.0 0.0 0.0 0.0 0.0 0.0 0.0
6.0 Bori bandh 0.0 0.0 0.0 0.0 0.0 0.0 0.0 0.0
7.0 Brushwood Checks 0.0 0.0 0.0 0.0 0.0 0.0 0.0 0.0
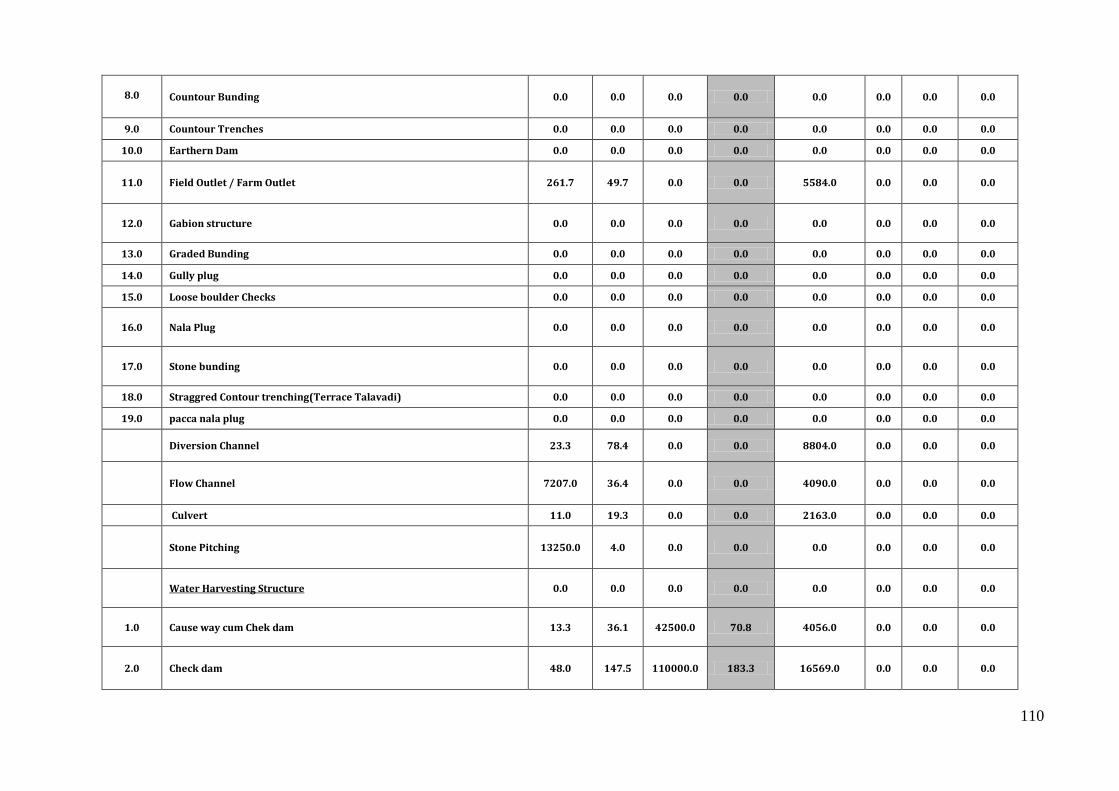
110
8.0
Countour Bunding 0.0 0.0 0.0 0.0 0.0 0.0 0.0 0.0
9.0 Countour Trenches 0.0 0.0 0.0 0.0 0.0 0.0 0.0 0.0
10.0 Earthern Dam 0.0 0.0 0.0 0.0 0.0 0.0 0.0 0.0
11.0 Field Outlet / Farm Outlet 261.7 49.7 0.0 0.0 5584.0 0.0 0.0 0.0
12.0
Gabion structure 0.0 0.0 0.0 0.0 0.0 0.0 0.0 0.0
13.0 Graded Bunding 0.0 0.0 0.0 0.0 0.0 0.0 0.0 0.0
14.0 Gully plug 0.0 0.0 0.0 0.0 0.0 0.0 0.0 0.0
15.0 Loose boulder Checks 0.0 0.0 0.0 0.0 0.0 0.0 0.0 0.0
16.0
Nala Plug 0.0 0.0 0.0 0.0 0.0 0.0 0.0 0.0
17.0
Stone bunding 0.0 0.0 0.0 0.0 0.0 0.0 0.0 0.0
18.0 Straggred Contour trenching(Terrace Talavadi) 0.0 0.0 0.0 0.0 0.0 0.0 0.0 0.0
19.0 pacca nala plug 0.0 0.0 0.0 0.0 0.0 0.0 0.0 0.0
Diversion Channel 23.3 78.4 0.0 0.0 8804.0 0.0 0.0 0.0
Flow Channel 7207.0 36.4 0.0 0.0 4090.0 0.0 0.0 0.0
Culvert 11.0 19.3 0.0 0.0 2163.0 0.0 0.0 0.0
Stone Pitching 13250.0 4.0 0.0 0.0 0.0 0.0 0.0 0.0
Water Harvesting Structure 0.0 0.0 0.0 0.0 0.0 0.0 0.0 0.0
1.0
Cause way cum Chek dam 13.3 36.1 42500.0 70.8 4056.0 0.0 0.0 0.0
2.0 Check dam 48.0 147.5 110000.0 183.3 16569.0 0.0 0.0 0.0

111
3.0 Village/Community Pond 20.0 73.6 0.0 0.0 8272.0 0.0 0.0 0.0
4.0
Farm Pond 60.0 20.9 800.0 1.3 2352.0 0.0 0.0 0.0
5.0 Percolation Tank 0.0 0.0 0.0 0.0 0.0 0.0 0.0 0.0
6.0 Pond Inlet 34.1 73.7 44000.0 73.3 8281.0 0.0 0.0 0.0
7.0 Pond Outlet 1.0 1.5 0.0 0.0 0.0 0.0 0.0 0.0
8.0
OTHERS (Specifiy activities ) 0.0 0.0 0.0 0.0 0.0 0.0 0.0 0.0
Inlet Cum Cross wall 2.0 4.0 0.0 0.0 0.0 0.0 0.0 0.0
Existing/Old Water Harvesting Structure Maintance (Renovation & Repair)
0.0 0.0 0.0 0.0 0.0 0.0 0.0 0.0
1.0 Deepening/Desiltation Of Pond 50.1 106.0 80000.0 133.3 11906.0 0.0 0.0 0.0
2.0 Deepening Of Percolation Tank 0.0 0.0 0.0 0.0 0.0 0.0 0.0 0.0
3.0 De-siltation of Checkdam 0.0 0.0 0.0 0.0 0.0 0.0 0.0 0.0
4.0 Repairing of Checkdam 0.0 0.0 0.0 0.0 0.0 0.0 0.0 0.0
Ground Water Recharging Structures 0.0 0.0 0.0 0.0 0.0 0.0 0.0 0.0
1.0 Dugwell Recharge 0.0 0.0 0.0 0.0 0.0 0.0 0.0 0.0
2.0
Farm Recharge Filter 0.0 0.0 0.0 0.0 0.0 0.0 0.0 0.0
3.0 Holiya in farm/Field 0.0 0.0 0.0 0.0 0.0 0.0 0.0 0.0
4.0 Pond Recharge structure 0.0 0.0 0.0 0.0 0.0 0.0 0.0 0.0
5.0
OTHERS (Specifiy activities ) 9.0 49.0 0.0 0.0 0.0 0.0 0.0 0.0
Borewell Recharge 166.3 87.6 0.0 0.0 9841.0 0.0 0.0 0.0
Injection Well 51.7 28.4 0.0 0.0 0.0 0.0 0.0 0.0
Drainage line correction 0.0 0.0 0.0 0.0 0.0 0.0 0.0 0.0

112
Recharge Shaft 0.0 0.0 0.0 0.0 0.0 0.0 0.0 0.0
S.No
Sub Activity Name 0.0 0.0 0.0 0.0 0.0 0.0 0.0 0.0
AGRICULTURE ACTIVITIES 2370.8 314.4 0.0 0.0 24795.0 0.0 0.0 0.0
AGRO PROCESSING ACTIVITIES 91.7 40.3 0.0 0.0 2472.0 0.0 0.0 0.0
3.0 Animal Husbandry 775.0 141.3 0.0 0.0 9618.0 0.0 0.0 0.0
4.0 Establishing linkages 0.0 0.0 0.0 0.0 0.0 0.0 0.0 0.0
5.0 Local traditional handicraft 0.0 0.0 0.0 0.0 0.0 0.0 0.0 0.0
6.0 Minor Activities 231.1 64.4 0.0 0.0 4024.0 0.0 0.0 0.0
7.0 Non-conventional Energy Sources 0.0 0.0 0.0 0.0 0.0 0.0 0.0 0.0
8.0
Revolving Fund 48.0 14.3 0.0 0.0 1601.0 0.0 0.0 0.0
Capacity building , Monitoring and evaluation 50.0
Administrative 164.6
Consolidation 76.9
Total 2245.9 462.2

113
Sr.No Activity
Physical Target for FY (2018-19)
Unit Cost (In
Lakhs)
Storage Volumes
(Cubic Meter)
Command Area/
Irrigation Potential
(Ha.)
Person days/Mandays
Planned
Convergence
Unit Amount
(In Lakhs)
Name of Schemes
1.0 Animal camp 0.0 0.0 0.0 0.0 0.0 0.0 0.0 0.0
2.0 Animal water trough (Havada) 0.0 0.0 0.0 0.0 0.0 0.0 0.0 0.0
3.0 Causeway on connecting roads 0.0 0.0 0.0 0.0 0.0 0.0 0.0 0.0
4.0 Check / Protection wall 0.0 0.0 0.0 0.0 0.0 0.0 0.0 0.0
5.0 Demonstration for Agricultural / Animal Husbandry Productivity Enhancement
0.0 0.0 0.0 0.0 0.0 0.0 0.0 0.0
6.0 Drainage line correction (To prevent flooding of Gamtal) 0.0 0.0 0.0 0.0 0.0 0.0 0.0 0.0
7.0 Drinking water facility 0.0 0.0 0.0 0.0 0.0 0.0 0.0 0.0
8.0 Fencing for protection from wild animals 0.0 0.0 0.0 0.0 0.0 0.0 0.0 0.0
9.0 Grassland/Gauchar Development 0.0 0.0 0.0 0.0 0.0 0.0 0.0 0.0
10.0 Improvised and energy efficient smashan gruh (Cemetery ) 0.0 0.0 0.0 0.0 0.0 0.0 0.0 0.0
12.0 Panchayat Well Repair & Pump Room 0.0 0.0 0.0 0.0 0.0 0.0 0.0 0.0
13.0 Rain water harvesting system 0.0 0.0 0.0 0.0 0.0 0.0 0.0 0.0
14.0 Recharge / Repair of open wells 0.0 0.0 0.0 0.0 0.0 0.0 0.0 0.0
15.0 Repair / development of artificial water bodies 0.0 0.0 0.0 0.0 0.0 0.0 0.0 0.0
16.0 Revival of natural water bodies with recharge activities 0.0 0.0 0.0 0.0 0.0 0.0 0.0 0.0
17.0 Sanitation facilities/Sewerage line 0.0 0.0 0.0 0.0 0.0 0.0 0.0 0.0
18.0 Use solar power for productive activities 0.0 0.0 0.0 0.0 0.0 0.0 0.0 0.0
19.0 Wind energy development 0.0 0.0 0.0 0.0 0.0 0.0 0.0 0.0
20.0 OTHERS (Specifiy activities ) 0.0 0.0 0.0 0.0 0.0 0.0 0.0 0.0
Washing ghat 0.0 0.0 0.0 0.0 0.0 0.0 0.0 0.0
Dugwell Recharge 0.0 0.0 0.0 0.0 0.0 0.0 0.0 0.0
Anganwadi Repairing 0.0 0.0 0.0 0.0 0.0 0.0 0.0 0.0

114
R.O. System 0.0 0.0 0.0 0.0 0.0 0.0 0.0 0.0
Books For Library 0.0 0.0 0.0 0.0 0.0 0.0 0.0 0.0
Village water tank Maintenance 0.0 0.0 0.0 0.0 0.0 0.0 0.0 0.0
Land Development 0.0 0.0 0.0 0.0 0.0 0.0 0.0 0.0
1.0 Farm Bunding 69228.8 69.5 0.0 0.0 7809.0 0.0 0.0 0.0
2.0 Afforestation 29.8 35.6 0.0 0.0 3999.0 0.0 0.0 0.0
3.0
Agriculture Demo 0.0 0.0 0.0 0.0 0.0 0.0 0.0 0.0
4.0 Agro Forestry 0.0 0.0 0.0 0.0 0.0 0.0 0.0 0.0
5.0 Horticulture 0.0 0.0 0.0 0.0 0.0 0.0 0.0 0.0
6.0 Land leveling 136.2 25.9 0.0 0.0 2910.0 0.0 0.0 0.0
7.0 Pasture development 11.5 10.1 0.0 0.0 1134.0 0.0 0.0 0.0
8.0 OTHERS (Specifiy activities ) 0.0 0.0 0.0 0.0 0.0 0.0 0.0 0.0
Tree plantation On Farm Bund 14663.5 17.2 0.0 0.0 0.0 0.0 0.0 0.0
Soil & Moisture Conservation 0.0 0.0 0.0 0.0 0.0 0.0 0.0 0.0
1.0 Check wall 0.0 0.0 0.0 0.0 0.0 0.0 0.0 0.0
2.0 Earthen bund 2.3 12.9 0.0 0.0 1454.0 0.0 0.0 0.0
3.0
Protection Wall 8.0 29.0 0.0 0.0 3258.0 0.0 0.0 0.0
4.0 Waste weir 0.0 0.0 0.0 0.0 0.0 0.0 0.0 0.0
5.0 Bench Terracing 0.0 0.0 0.0 0.0 0.0 0.0 0.0 0.0
6.0 Bori bandh 0.0 0.0 0.0 0.0 0.0 0.0 0.0 0.0
7.0 Brushwood Checks 0.0 0.0 0.0 0.0 0.0 0.0 0.0 0.0
8.0
Countour Bunding 0.0 0.0 0.0 0.0 0.0 0.0 0.0 0.0

115
9.0 Countour Trenches 0.0 0.0 0.0 0.0 0.0 0.0 0.0 0.0
10.0 Earthern Dam 0.0 0.0 0.0 0.0 0.0 0.0 0.0 0.0
11.0 Field Outlet / Farm Outlet 130.8 25.9 0.0 0.0 2912.0 0.0 0.0 0.0
12.0
Gabion structure 0.0 0.0 0.0 0.0 0.0 0.0 0.0 0.0
13.0 Graded Bunding 0.0 0.0 0.0 0.0 0.0 0.0 0.0 0.0
14.0 Gully plug 0.0 0.0 0.0 0.0 0.0 0.0 0.0 0.0
15.0 Loose boulder Checks 0.0 0.0 0.0 0.0 0.0 0.0 0.0 0.0
16.0
Nala Plug 0.0 0.0 0.0 0.0 0.0 0.0 0.0 0.0
17.0
Stone bunding 0.0 0.0 0.0 0.0 0.0 0.0 0.0 0.0
18.0 Straggred Contour trenching(Terrace Talavadi) 0.0 0.0 0.0 0.0 0.0 0.0 0.0 0.0
19.0 pacca nala plug 0.0 0.0 0.0 0.0 0.0 0.0 0.0 0.0
Diversion Channel 0.0 0.0 0.0 0.0 0.0 0.0 0.0 0.0
Flow Channel 7200.0 18.4 0.0 0.0 2070.0 0.0 0.0 0.0
Culvert 10.0 18.0 0.0 0.0 2017.0 0.0 0.0 0.0
Stone Pitching 2000.0 1.5 0.0 0.0 0.0 0.0 0.0 0.0
Water Harvesting Structure 0.0 0.0 0.0 0.0 0.0 0.0 0.0 0.0
1.0
Cause way cum Chek dam 0.0 0.0 0.0 0.0 0.0 0.0 0.0 0.0
2.0 Check dam 26.7 90.6 120000.0 200.0 10177.0 0.0 0.0 0.0
3.0 Village/Community Pond 5.0 15.0 0.0 0.0 1681.0 0.0 0.0 0.0
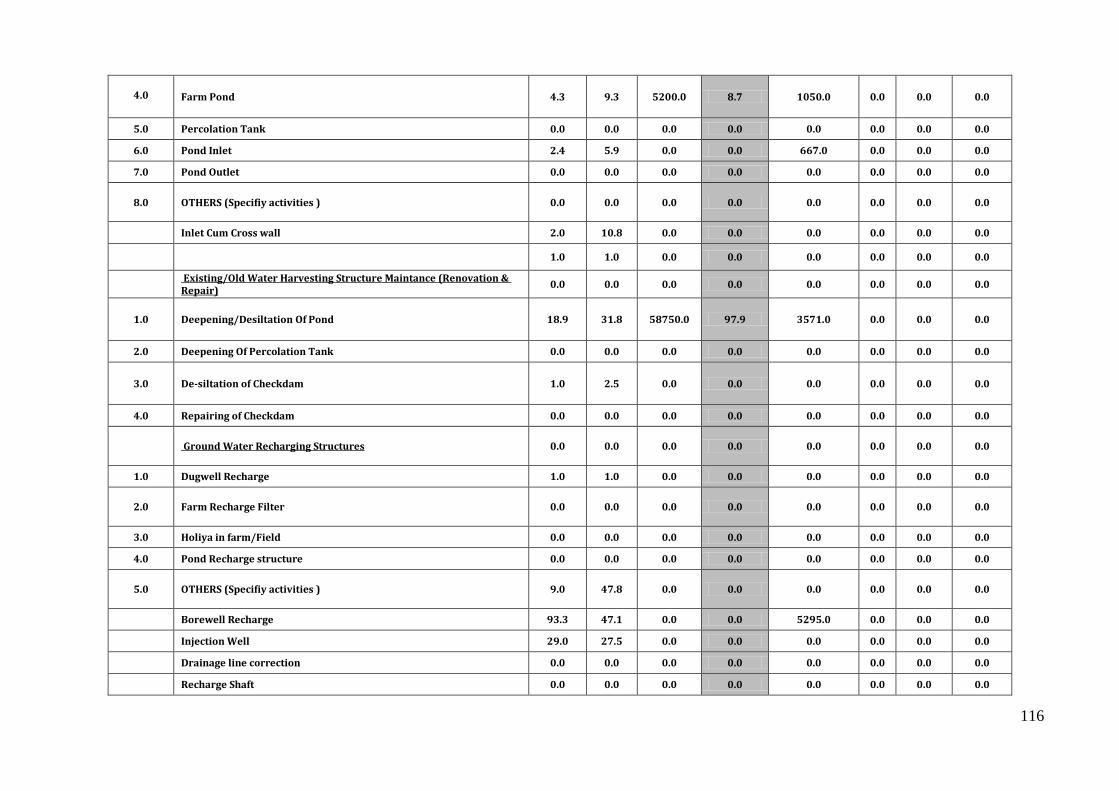
116
4.0
Farm Pond 4.3 9.3 5200.0 8.7 1050.0 0.0 0.0 0.0
5.0 Percolation Tank 0.0 0.0 0.0 0.0 0.0 0.0 0.0 0.0
6.0 Pond Inlet 2.4 5.9 0.0 0.0 667.0 0.0 0.0 0.0
7.0 Pond Outlet 0.0 0.0 0.0 0.0 0.0 0.0 0.0 0.0
8.0
OTHERS (Specifiy activities ) 0.0 0.0 0.0 0.0 0.0 0.0 0.0 0.0
Inlet Cum Cross wall 2.0 10.8 0.0 0.0 0.0 0.0 0.0 0.0
1.0 1.0 0.0 0.0 0.0 0.0 0.0 0.0
Existing/Old Water Harvesting Structure Maintance (Renovation & Repair)
0.0 0.0 0.0 0.0 0.0 0.0 0.0 0.0
1.0 Deepening/Desiltation Of Pond 18.9 31.8 58750.0 97.9 3571.0 0.0 0.0 0.0
2.0 Deepening Of Percolation Tank 0.0 0.0 0.0 0.0 0.0 0.0 0.0 0.0
3.0 De-siltation of Checkdam 1.0 2.5 0.0 0.0 0.0 0.0 0.0 0.0
4.0 Repairing of Checkdam 0.0 0.0 0.0 0.0 0.0 0.0 0.0 0.0
Ground Water Recharging Structures 0.0 0.0 0.0 0.0 0.0 0.0 0.0 0.0
1.0 Dugwell Recharge 1.0 1.0 0.0 0.0 0.0 0.0 0.0 0.0
2.0
Farm Recharge Filter 0.0 0.0 0.0 0.0 0.0 0.0 0.0 0.0
3.0 Holiya in farm/Field 0.0 0.0 0.0 0.0 0.0 0.0 0.0 0.0
4.0 Pond Recharge structure 0.0 0.0 0.0 0.0 0.0 0.0 0.0 0.0
5.0
OTHERS (Specifiy activities ) 9.0 47.8 0.0 0.0 0.0 0.0 0.0 0.0
Borewell Recharge 93.3 47.1 0.0 0.0 5295.0 0.0 0.0 0.0
Injection Well 29.0 27.5 0.0 0.0 0.0 0.0 0.0 0.0
Drainage line correction 0.0 0.0 0.0 0.0 0.0 0.0 0.0 0.0
Recharge Shaft 0.0 0.0 0.0 0.0 0.0 0.0 0.0 0.0

117
S.No
Sub Activity Name 0.0 0.0 0.0 0.0 0.0 0.0 0.0 0.0
AGRICULTURE ACTIVITIES 1316.0 146.0 0.0 0.0 8387.0 0.0 0.0 0.0
AGRO PROCESSING ACTIVITIES 60.8 40.5 0.0 0.0 1236.0 0.0 0.0 0.0
3.0 Animal Husbandry 211.3 59.5 0.0 0.0 2930.0 0.0 0.0 0.0
4.0 Establishing linkages 0.0 0.0 0.0 0.0 0.0 0.0 0.0 0.0
5.0 Local traditional handicraft 0.0 0.0 0.0 0.0 0.0 0.0 0.0 0.0
6.0 Minor Activities 99.3 25.4 0.0 0.0 1166.0 0.0 0.0 0.0
7.0 Non-conventional Energy Sources 0.0 0.0 0.0 0.0 0.0 0.0 0.0 0.0
8.0
Revolving Fund 0.0 0.0 0.0 0.0 0.0 0.0 0.0 0.0
Capacity building , Monitoring and evaluation 45.0
Administrative 117.5
Consolidation 73.0
Total 1061.2 306.6

118
Sr.No Activity
Physical Target for FY (2019-20)
Unit Cost (In
Lakhs)
Storage Volumes
(Cubic Meter)
Command Area/
Irrigation Potential
(Ha.)
Person days/Mandays
Planned
Convergence
Unit Amount
(In Lakhs)
Name of Schemes
1.0 Animal camp 0.0 0.0 0.0 0.0 0.0 0.0 0.0 0.0
2.0 Animal water trough (Havada) 0.0 0.0 0.0 0.0 0.0 0.0 0.0 0.0
3.0 Causeway on connecting roads 0.0 0.0 0.0 0.0 0.0 0.0 0.0 0.0
4.0 Check / Protection wall 0.0 0.0 0.0 0.0 0.0 0.0 0.0 0.0
5.0 Demonstration for Agricultural / Animal Husbandry Productivity
Enhancement 0.0 0.0 0.0 0.0 0.0 0.0 0.0 0.0
6.0 Drainage line correction (To prevent flooding of Gamtal) 0.0 0.0 0.0 0.0 0.0 0.0 0.0 0.0
7.0 Drinking water facility 0.0 0.0 0.0 0.0 0.0 0.0 0.0 0.0
8.0 Fencing for protection from wild animals 0.0 0.0 0.0 0.0 0.0 0.0 0.0 0.0
9.0 Grassland/Gauchar Development 0.0 0.0 0.0 0.0 0.0 0.0 0.0 0.0
10.0 Improvised and energy efficient smashan gruh (Cemetery ) 1.0 1.0 0.0 0.0 0.0 0.0 0.0 0.0
12.0 Panchayat Well Repair & Pump Room 0.0 0.0 0.0 0.0 0.0 0.0 0.0 0.0
13.0 Rain water harvesting system 0.0 0.0 0.0 0.0 0.0 0.0 0.0 0.0
14.0 Recharge / Repair of open wells 0.0 0.0 0.0 0.0 0.0 0.0 0.0 0.0
15.0 Repair / development of artificial water bodies 0.0 0.0 0.0 0.0 0.0 0.0 0.0 0.0
16.0 Revival of natural water bodies with recharge activities 0.0 0.0 0.0 0.0 0.0 0.0 0.0 0.0
17.0 Sanitation facilities/Sewerage line 0.0 0.0 0.0 0.0 0.0 0.0 0.0 0.0
18.0 Use solar power for productive activities 0.0 0.0 0.0 0.0 0.0 0.0 0.0 0.0
19.0 Wind energy development 0.0 0.0 0.0 0.0 0.0 0.0 0.0 0.0
20.0 OTHERS (Specifiy activities ) 0.0 0.0 0.0 0.0 0.0 0.0 0.0 0.0
Washing ghat 0.0 0.0 0.0 0.0 0.0 0.0 0.0 0.0
Dugwell Recharge 0.0 0.0 0.0 0.0 0.0 0.0 0.0 0.0
Anganwadi Repairing 0.0 0.0 0.0 0.0 0.0 0.0 0.0 0.0

119
R.O. System 0.0 0.0 0.0 0.0 0.0 0.0 0.0 0.0
Books For Library 0.0 0.0 0.0 0.0 0.0 0.0 0.0 0.0
Village water tank Maintenance 0.0 0.0 0.0 0.0 0.0 0.0 0.0 0.0
Land Development 0.0 0.0 0.0 0.0 0.0 0.0 0.0 0.0
1.0 Farm Bunding 69228.8 69.5 0.0 0.0 7809.0 0.0 0.0 0.0
2.0 Afforestation 16.8 17.8 0.0 0.0 2005.0 0.0 0.0 0.0
3.0
Agriculture Demo 0.0 0.0 0.0 0.0 0.0 0.0 0.0 0.0
4.0 Agro Forestry 4.0 1.2 0.0 0.0 0.0 0.0 0.0 0.0
5.0 Horticulture 0.0 0.0 0.0 0.0 0.0 0.0 0.0 0.0
6.0 Land leveling 131.2 24.8 0.0 0.0 2787.0 0.0 0.0 0.0
7.0 Pasture development 0.0 0.0 0.0 0.0 0.0 0.0 0.0 0.0
8.0 OTHERS (Specifiy activities ) 0.0 0.0 0.0 0.0 0.0 0.0 0.0 0.0
Tree plantation On Farm Bund 14664.5 17.2 0.0 0.0 0.0 0.0 0.0 0.0
Soil & Moisture Conservation 0.0 0.0 0.0 0.0 0.0 0.0 0.0 0.0
1.0 Check wall 0.0 0.0 0.0 0.0 0.0 0.0 0.0 0.0
2.0 Earthen bund 0.0 0.0 0.0 0.0 0.0 0.0 0.0 0.0
3.0
Protection Wall 9.0 29.2 0.0 0.0 3285.0 0.0 0.0 0.0
4.0 Waste weir 70.0 23.6 0.0 0.0 2652.0 0.0 0.0 0.0
5.0 Bench Terracing 0.0 0.0 0.0 0.0 0.0 0.0 0.0 0.0
6.0 Bori bandh 0.0 0.0 0.0 0.0 0.0 0.0 0.0 0.0
7.0 Brushwood Checks 0.0 0.0 0.0 0.0 0.0 0.0 0.0 0.0
8.0
Countour Bunding 0.0 0.0 0.0 0.0 0.0 0.0 0.0 0.0
9.0 Countour Trenches 0.0 0.0 0.0 0.0 0.0 0.0 0.0 0.0
10.0 Earthern Dam 0.0 0.0 0.0 0.0 0.0 0.0 0.0 0.0
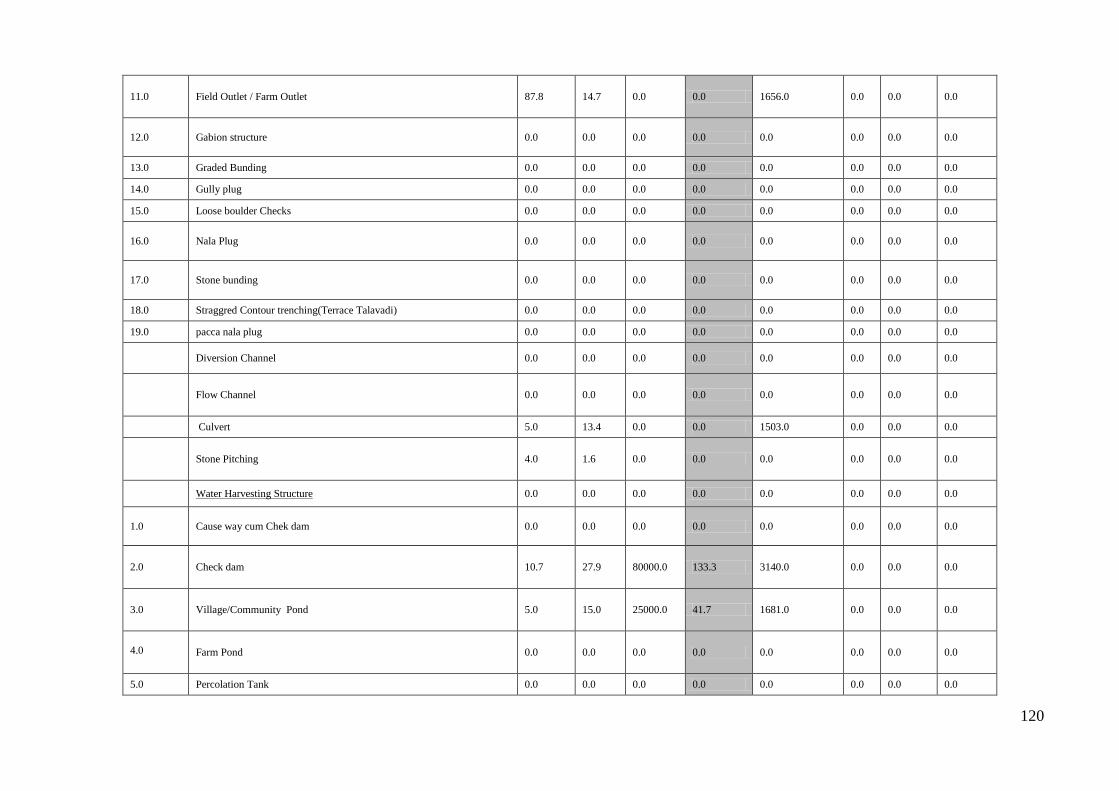
120
11.0 Field Outlet / Farm Outlet 87.8 14.7 0.0 0.0 1656.0 0.0 0.0 0.0
12.0
Gabion structure 0.0 0.0 0.0 0.0 0.0 0.0 0.0 0.0
13.0 Graded Bunding 0.0 0.0 0.0 0.0 0.0 0.0 0.0 0.0
14.0 Gully plug 0.0 0.0 0.0 0.0 0.0 0.0 0.0 0.0
15.0 Loose boulder Checks 0.0 0.0 0.0 0.0 0.0 0.0 0.0 0.0
16.0
Nala Plug 0.0 0.0 0.0 0.0 0.0 0.0 0.0 0.0
17.0
Stone bunding 0.0 0.0 0.0 0.0 0.0 0.0 0.0 0.0
18.0 Straggred Contour trenching(Terrace Talavadi) 0.0 0.0 0.0 0.0 0.0 0.0 0.0 0.0
19.0 pacca nala plug 0.0 0.0 0.0 0.0 0.0 0.0 0.0 0.0
Diversion Channel 0.0 0.0 0.0 0.0 0.0 0.0 0.0 0.0
Flow Channel 0.0 0.0 0.0 0.0 0.0 0.0 0.0 0.0
Culvert 5.0 13.4 0.0 0.0 1503.0 0.0 0.0 0.0
Stone Pitching 4.0 1.6 0.0 0.0 0.0 0.0 0.0 0.0
Water Harvesting Structure 0.0 0.0 0.0 0.0 0.0 0.0 0.0 0.0
1.0
Cause way cum Chek dam 0.0 0.0 0.0 0.0 0.0 0.0 0.0 0.0
2.0 Check dam 10.7 27.9 80000.0 133.3 3140.0 0.0 0.0 0.0
3.0 Village/Community Pond 5.0 15.0 25000.0 41.7 1681.0 0.0 0.0 0.0
4.0
Farm Pond 0.0 0.0 0.0 0.0 0.0 0.0 0.0 0.0
5.0 Percolation Tank 0.0 0.0 0.0 0.0 0.0 0.0 0.0 0.0

121
6.0 Pond Inlet 7.4 23.4 11062.5 18.4 2631.0 0.0 0.0 0.0
7.0 Pond Outlet 0.0 0.0 0.0 0.0 0.0 0.0 0.0 0.0
8.0
OTHERS (Specifiy activities ) 0.0 0.0 0.0 0.0 0.0 0.0 0.0 0.0
Inlet Cum Cross wall 5.0 11.0 0.0 0.0 0.0 0.0 0.0 0.0
0.0 0.0 0.0 0.0 0.0 0.0 0.0 0.0
Existing/Old Water Harvesting Structure Maintance (Renovation &
Repair) 0.0 0.0 0.0 0.0 0.0 0.0 0.0 0.0
1.0 Deepening/Desiltation Of Pond 7.2 3.4 35833.3 59.7 385.0 0.0 0.0 0.0
2.0 Deepening Of Percolation Tank 0.0 0.0 0.0 0.0 0.0 0.0 0.0 0.0
3.0 De-siltation of Checkdam 0.0 0.0 0.0 0.0 0.0 0.0 0.0 0.0
4.0 Repairing of Checkdam 0.0 0.0 0.0 0.0 0.0 0.0 0.0 0.0
Ground Water Recharging Structures 0.0 0.0 0.0 0.0 0.0 0.0 0.0 0.0
1.0 Dugwell Recharge 0.0 0.0 0.0 0.0 0.0 0.0 0.0 0.0
2.0
Farm Recharge Filter 0.0 0.0 0.0 0.0 0.0 0.0 0.0 0.0
3.0 Holiya in farm/Field 0.0 0.0 0.0 0.0 0.0 0.0 0.0 0.0
4.0 Pond Recharge structure 0.0 0.0 0.0 0.0 0.0 0.0 0.0 0.0
5.0
OTHERS (Specifiy activities ) 0.0 0.0 0.0 0.0 0.0 0.0 0.0 0.0
Borewell Recharge 12.3 7.4 0.0 0.0 829.0 0.0 0.0 0.0
Injection Well 22.0 11.6 0.0 0.0 0.0 0.0 0.0 0.0
Drainage line correction 4.0 16.1 0.0 0.0 0.0 0.0 0.0 0.0
Recharge Shaft 4.0 10.0 0.0 0.0 0.0 0.0 0.0 0.0
S.No
Sub Activity Name 0.0 0.0 0.0 0.0 0.0 0.0 0.0 0.0
1.0
AGRICULTURE ACTIVITIES 562.5 74.6 0.0 0.0 0.0 0.0 0.0 0.0

122
2.0
AGRO PROCESSING ACTIVITIES 36.8 11.0 0.0 0.0 0.0 0.0 0.0 0.0
3.0 Animal Husbandry 119.3 26.1 0.0 0.0 0.0 0.0 0.0 0.0
4.0 Establishing linkages 0.0 0.0 0.0 0.0 0.0 0.0 0.0 0.0
5.0 Local traditional handicraft 0.0 0.0 0.0 0.0 0.0 0.0 0.0 0.0
6.0 Minor Activities 56.5 10.4 0.0 0.0 0.0 0.0 0.0 0.0
7.0 Non-conventional Energy Sources 0.0 0.0 0.0 0.0 0.0 0.0 0.0 0.0
8.0
Revolving Fund 0.0 0.0 0.0 0.0 0.0 0.0 0.0 0.0
Capacity building , Monitoring and evaluation 40.0
Administrative 44.0
Consolidation 46.5
Total 592.6 253.2

WHEAT
BRINJAL