AgroPolo’s Bioeconomy opportunities dutch perspectiveAgroPolo’s Bioeconomy opportunities...
72
AgroPolo’s Bioeconomy opportunities – dutch perspective AgroPolo | Campinas Brasil | 02 06 2016 Luuk van der Wielen (TUD/BE-Basic) http://www.be-basic.org/downloads
Transcript of AgroPolo’s Bioeconomy opportunities dutch perspectiveAgroPolo’s Bioeconomy opportunities...

AgroPolo’s Bioeconomy opportunities – dutch perspective
AgroPolo | Campinas Brasil | 02 06 2016
Luuk van der Wielen (TUD/BE-Basic)
http://www.be-basic.org/downloads


contents
• Urgency and drivers
• Options and opportunities
• Roadmaps, macro-economic impact studies and reality
• AgroPolo – the Brazilian BBE opportunity
• Beyond techno-economics –examples (palm waste in
Malaysia, REDEFINERY)

Projected sea-level rise and northern-hemisphere summer heat events in a 2°C world and a 4°C world
• Increased sea-level rise from 70 cm to more than a meter
• Increased
frequency of extreme and unprecedented heat events
• … and 75% of the
poor in dev (agro) countries are hit first

Atmospheric CO2 is now higher than it’s been for 650,000 years and increasing rapidly
This graph, based on the comparison of atmospheric samples contained in ice cores and more recent direct measurements, provides evidence that atmospheric CO2 has increased since the Industrial Revolution. (Source: NOAA)
CO2 level as of February 28, 2015
400.26 ppm
Doubling in 50 yrs
Doubling in 50 yrs

Global drivers for a BBE ?
• more people with more wealth
• less nett GHG emission (global warming)
and/or climate adaptation
• politics (security of oil/gas supply)
• innovation, rural income and economic development
• increasing (and decreasing) prices of resources
• in time*, limited fossil reserves
• add sustainability to food chain
• add value to food chain and prevent hunger
Pick your personal selection !


NRW and NL are #1 and # 2 in Europe
CO2/ha/yr
#1
#2
… in GHG emissions !
(so we have carbon to be recycled)

… this enables the largest industry cluster worldwide Regional priorities: chemical
sector and transport w/o alternatives (aviation etc)

0,86
0,88
0,9
0,92
0,94
0,96
0,98
1
1,02
1,04
1,06
abr-15 mai-15 jul-15 set-15 out-15 dez-15 jan-16 mar-16 mai-16
Impact on pension funds
350 bn EUR
Legal minimum 105% (417 bn EUR)
400 bn EUR
-17%
ABP
AEX
-24%
NL pensions funds
Total: 150+ bn EUR capital loss
BrExit

contents
• Urgency and drivers
• Options and opportunities
• Roadmaps, macro-economic impact studies and reality
• AgroPolo – the Brazilian BBE opportunity
• Beyond techno-economics –examples (palm waste in
Malaysia, REDEFINERY)

drop-outs ?
mass yield: energy poor (O-rich) in materials*
C H
O
substitutes
fuels (energy dense) &
polymers (PE,PP, PS, PVC)
natural gas
crude
oil
biomass
CH2O0.5
ethanol
sugars, lactic
CO2
drop-ins
mass composition biobased and fossil
feedstocks and products
energy density
increases
global production (MT/year)
fuels 2000 (jet 300)
cement 3000 (600 MT CO2)
food 4000 (50% waste)
glass 120
plastics 280 (big 5: 200)
steel 120 (200 MT CO2)

Waste becomes scarce and pricy (and wanted) !

Biobased technology is/gets there “any” chemical can be produced from biobased feedstocks – by chemo / bio / thermo catalysis
but not all make sense
cost (benefit) emission (reduction) resource efficiency
yield is central parameter in both

15 Werpy & Peterson, 2004

“Drop-in Greenification” of Chemical Industry
BIOMASS
protein / sugar / lignocellulose
Iso-butanol ethanol methane SNG
Iso-butylene Ethylene
Gasification
B substitute A drop-in
Fermentation Aerobic
An-aerobic
other succinic
acid acetic
-acid
Lactic
acid
Funct.
molecules
Preservatives
, plastics
synthet.
polymers
glue
plastics,
thickeners
Paraxylene
PET- bottles
Propylene
fertilizer
methanol
=80% chemical industry
Plastics,
surfactants,
detergents
Plastics,
carpet
Biorefinery
Reforming
Fermentation and other processes
glycerol
From: Ton Runneboom Bio Based Chemicals March
22 2011, Rotterdam
Biopower
BioPVC
BioHydro
carbons

Aviation sector needs to green

Implementing the Bioport Holland PPP concept
NL (bio)Fuelsmix 2050
Aviation 50%
Marine 33%
Road+rail 17%
International setting is critical for globally operating
industries (transport & chemical)
*

0
5000
10000
15000
20000
25000
30000
35000
40000 2014
2016
2018
2020
2022
2024
2026
2028
2030
2032
2034
2036
2038
2040
2042
2044
2046
2048
2050
biofuels 1G
biofuels 2G
biofuels tot
fossil
total bio+fossil
reference
reference
CO2 emissions (kton/year) in NL at 3% net growth of aviation fuels
consumption
proposed path
fossil fuels
biofuels (1G+2G)
Aviation: GHG-reduction via TOI and jet biofuels
improved technology, operations, infrastructure
aviation biofuels
From “Visie Duurzame Luchtvaart”. SER Report Van der Wielen et al. June 2014. adopting NL to ATAG ambitions
Carbon neutral growth
50% GHG emission wrt ‘05
KLM 1% biofuels in ‘15
*

0
1000
2000
3000
4000
5000
6000
7000
8000
1 3 5 7 9 11 13 15 17 19 21 23 25 27 29 31 33 35
fossil
Vandaag (1G)
Morgen (2G)
Biofuels (1G+2G)
Fuel-pool composition in
(kton/year) at 3% net growth of
fuels consumption
2030 2050 2015
7 mio ton/yr
2G: - 80% GHG
0.7 mio ton/yr
4 mio ton/yr
Introducing aviation biofuels (NL- numbers)
150 kton/yr
1G: - 35% GHG
8 (16)
6 (12)
4 (8)
2 (4)
investment
estimates [bn $]
doubling jet fuel
towards 90% biojet
Carbon neutral growth
fossil
*

contents
• Urgency and drivers
• Options and opportunities
• Roadmaps, macro-economic impact studies and reality
• AgroPolo – the Brazilian BBE opportunity
• Beyond techno-economics –examples (palm waste in
Malaysia, REDEFINERY)


Synthetic Biology in the real world?
glucose
xylose
arabinose
acetate
glycerol
furanics
commercial product
based patent portfolio

2020 2030
2nd gen. advanced
biofuels (hydro carbon-like)
Synthetic biology: novel
pathways, robustness,
rate and yield
1st gen. EtOH
from sugar cane
2010
photosynthetic micro organisms
to excrete solar biofuels
Low cost photo
bioreactor technology
C5 & C6 cofermentation ; biomass
N –recycle HTE, m-array bioreactors
Genomics & (Directed) evolution
CO2 + solar light
based (3rd gen) biofuels
Low-cost lignocellulosic pretreatment
technology for efficient fail-proof intermediate:
low cost sugar (C5/6) platform
1st gen. advanced
liquid biofuels
(hydro carbon-like)
2nd gen lignocellulosic EtOH
pilot and demonstration plants
2nd gen lignocellulosic EtOH
commercial plants
System
Process
Engineering
Develop
Basic Hardware
Enabling
Technology
Basic Science
deploy
discovery
discovery
demonstrate
Solution
(piloting)
Low-cost lignocellulosic,
thermostable enzymes
Abengoa Bioenergy:
“1.3 million gallon/year
capacity demo
plant”.’09
“the advances made by Joule
Unlimited to achieve direct,
continuous conversion of solar
energy to renewable diesel at 15,000
gallons/acre/year ”2010
“Shell and Cosan Form
$12bn Ethanol Joint Venture
Raizen 21/11/2011
Amyris: “is scheduled to be in
full production of Amyris
renewable products by Q2
2012.
DSM-TUD-B-Basic:
“all you can eat
yeast”.2011
Genencor / Novozymes /
DSM: “commercial
hydrolytic enzymes”.’10
Sime Darby-Mitsui: “convert
oil palm empty fruit bunches,
or EFB, into bioethanol”.2010
GranBio 147 M$ = 464 mRM (160 ktpa sugars > 82 mio m3 ethanol)
ChemTex + Novozymes + DSM
DuPont 235 M$ = 744 mRM (200 ktpa hydrolysate
sugars > 100 mio m3 ethanol)
POET/DSM 250 M$ = 790 mRM (300 biomass > 160
ktpa sugars > 100 mio m3 ethanol)
Roadmap for tech innovations in the Chemical and Energy sectors : Energy | liquid biofuels
*
*
*

‘decades’ : process / agro / logistics are slow industries
0,1
1
10
100
1000
10000
0 5 10 15 20 25
agro & logistic systems
commercial
demo
pilot
new product, new application
existing product, new application investm
ent
(mio
euro
’s)
years
Example: Brazilian ethanol learning curve: 4x cost reduction in 30 yrs /20 x volume increase vd Wall Bake et al. Biomass & Bioenergy 33, 644-658, 2009

Oberhausen
Köln
Rotterdam
Terneuzen
Geleen
Marl
Ludwigshafen
Feluy
Jemeppe
Frankfurt
Antwerpen
Tessenderlo
ARG Connections tons
Connected Ethylene Supply
Connected Ethylene Derivatives
11m
18m
ARG Pipeline
Connected pipelines
bio-ethylene products
Large scale ethanol-to-
ethylene conversion is
feasible in R’dam.
tomorrow.
sustainable ethanol can green EU plastics industry fast

BBE roadmap and (direct) economic impact (’08)
56 (25 %)
8 (4 %)
NL chemistry 2010: € 13 bn GDP (3%) / € 47 bn sales / 20% export ;
NL energy € 11.2 bn GDP (2.2%) / € 30 bn sales
Internat HighTech
Chem’s, fuels &
materials
0 50 100 biomass (eq)
Mton/yr
€ 5-7 bn/yr
€ 1-2 bn/yr
added value €/ton
0
200
100
€ 2-3 bn/yr
- CO2e
Mton/yr
30
0 domestic
production
target € 20 bn/yr
(incl indirect: 4-5% GDP)
National LowTech
EU & electricity focus
todays technology € 2-3 bn/yr
2030
2020
2030 2010
1000

Reference numbers
• Biomass 15 PJ/MT 1
• Oil/gas 45 PJ/MT 3 (150 MT)
• GDP energy 15 bn EUR
• GDP chemicals 15 bn EUR ~ 200 MEUR/MT
• CH2 (1) + 1.5 O2 -> CO2 (3) + H2O
• CH2O (1) + O2 -> CO2 (1.5) + H2O
• Kerosine (NL): 4 (2015) >> 7 MT/yr (2050)
• Kerosine (‘EU’) ~ 12 (2015) >> 24 MT/yr (2050)

0 17 33 oil/gas Mton/yr (150!)
0 50 100 CO2 Mton/yr
BBE and fossil displacement
56 (25 %)
8 (4 %)
Internat HighTech
Chem’s, fuels &
materials
0 50 100 biomass (eq)
Mton/yr
€ 5-7 bn/yr
€ 1-2 bn/yr
added value €/ton
0
200
100
€ 2-3 bn/yr
- CO2e
Mton/yr
30
0 domestic
production
target € 20 bn/yr
(incl indirect: 4-5% GDP)
National LowTech
EU & electricity focus
todays technology € 2-3 bn/yr
2030
2020
2030 2010
1000
“fossil GDP”

0 17 33 oil/gas Mton/yr (150!)
0 50 100 CO2 Mton/yr
BBE displaces fossil: requires investment & differential GDP
(high + right) technology & volume
56 (25 %)
8 (4 %)
Internat HighTech
Chem’s, fuels &
materials
0 50 100 biomass (eq)
Mton/yr
€ 5-7 bn/yr
€ 1-2 bn/yr
added value €/ton
0
200
100
€ 2-3 bn/yr
- CO2e
Mton/yr
30
0 domestic
production
target € 20 bn/yr
(incl indirect: 4-5% GDP)
National LowTech
EU & electricity focus
todays technology € 2-3 bn/yr
2030
2020
2030 2010
1000
“fossil GDP”

contents
• Urgency and drivers
• Options and opportunities
• Roadmaps, macro-economic impact studies and reality
• AgroPolo – the Brazilian BBE opportunity
• Beyond techno-economics –examples (palm waste in
Malaysia, REDEFINERY)

2020 2030 2010
AgroPolo targets
System
Process
Engineering
Develop
Basic Hardware
Enabling
Technology
Basic Science
deploy
discovery
discovery
demonstrate
Solution
(piloting)
Roadmap for techno-economic innovations in BBE sectors : AgroPolo - topics

contents
• Urgency and drivers
• Options and opportunities
• Roadmaps and reality
• AgroPolo – the Brazilian BBE opportunity
• Other examples: palm ‘waste’, REDEFINERY

* PPP-models for bioeconomy Type Players example
R&D / testing / technological innovation
academia & industry, industry-industry
BE-Basic, EBI, CLIB, IAR, TWB, testing / pilot facilities
Market development auctions, cooperatives, market place, commodity / stock exchanges, blending mandates, launching costumer
(wood) pellets, sugar, agro-commodities, flowers, vegetables, Etanol (BR)
Infrastructure industry & government, ngo (ecosystems services), agri-cultural
Rotterdam port extension, agri-zoning, land consolidation*
Sustainability criteria / certification
industry, ngo, academia, (gov.) RSB + 100’s others, SCOPE / IPCC / Lorentz BioPanel
Investment/ implementation
(institutional) investors, industry, governments (state-owned, subsidy), development banks (regional, EIB), Worldbank Group
many (most) 2nd lignocellulosics plants multifunctional landscape (restoration) projects WB
* ruilverkaveling

Winning Team
2013 LST MSc
Design Competition
woodpellets + … power/heat + ethanol + biochemical + €€ (instead of –SDE)

conclusions
• BBE can be a great opportunity for targetted agro-forestry re-
industralization towards more, sustainable impact
• Economy and climate go hand in hand
• It is good to look back and learn: but the industry of
tomorrow maybe has to be created.
• Tools as roadmaps and macro-economic impact studies can
help to quantify scenarios, explore measures but …
• targets must be set by society, industry, academia
>>> THUS BY YOU !

Back-up slides
• palm ‘waste’ in Malaysia
• REDEFINERY
• BE-Basic

Technology development, maturity and learning curves ... … learn from best-practices elsewhere (Brazilian ethanol case)
Government supported R&D&I
and market competition:
4 x cost cut !

Palm: 10 x more biomass then oil -“Byproduct-to-Bioproduct”
OPBC
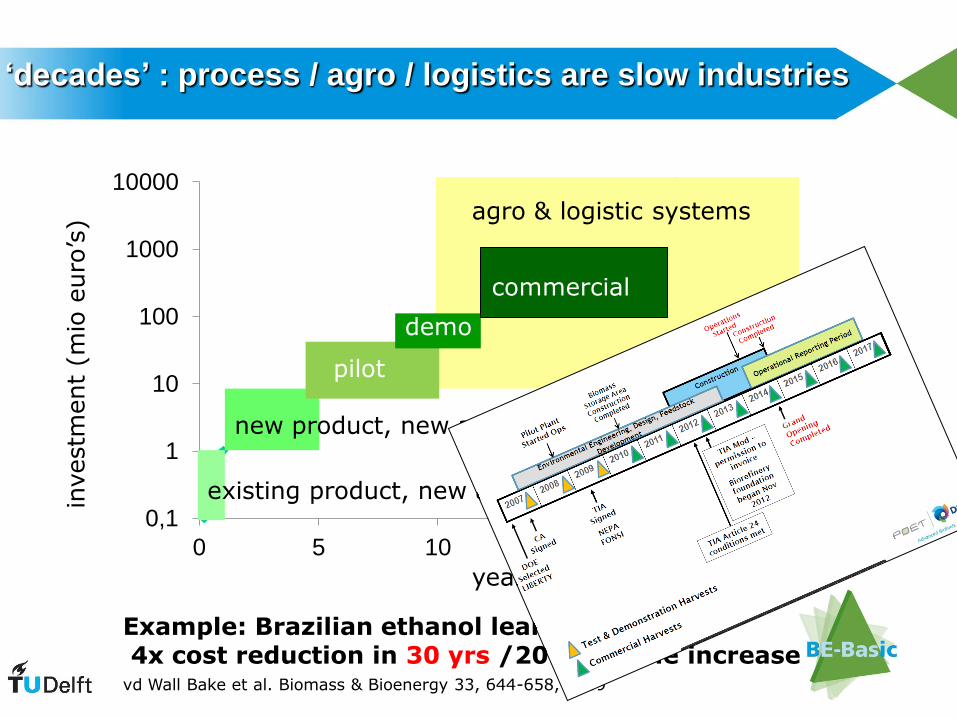
Palm oil
plantationPalm oil mill
Bio-refinery
Chemicals
FFB
Fronds+trunks
Compound Bio-
gasoline
Compound
Electricity
EFB+fiber+shell
EFB+fiber+shell
Fronds+trunks
Lignin
Transport
high-added value products
chemicals, materials, fuels
energy closes balance
International trade
high-added value products
chemicals, materials, fuels
energy closes balance
domestic biomass/use
energy and fuels focus
pellets
engineered wood and
simple materials
international trade
energy and fuels focus
pellets
engineered wood and
simple materials
domestic use
closed economy open
RE
D (
en
erg
y f
ocu
s)
B
LU
E (
ch
em
s f
ocu
s)
Macro-economic impact study based on MAGNET/GTAP model
based on accepted global model
international dimension (im-/ exports)
direct / indirect /displacement effects
qualitative confirmation
need further tuning
strong oil/coal dependence
M’sian growth predictions

OPBC
RM 71 bn
FFB
labour
crude oil
well
coal mine
natural gas
reservoir
palm oil
plantation
capital, land
materials
food/feed
chemicals
palm oil mill
oil refinery liquid fuels
cpo
other
resources exports / international demand
imports / international resources
14
food 8
oils/fats +6
wood 5
+5
29
+9
other agro 12
forestry 6
cpo refinery
power plant
To
tal M
ala
ys
ian
ec
on
om
y 5
09
Pre-NBS
transport
fuels
solid fuels
(power plants)
electricity/
heat
fertilizer

OPBC
RM 71 bn
FFB
fronds
& trunks labour
crude oil
well
coal mine
natural gas
reservoir
palm oil
plantation
capital, land
materials
food/feed
chemicals
palm oil mill
biofuels
biochemicals
oil refinery liquid fuels
cpo
EFB, fiber & shell
compound
fronds & trunks
EFB, fiber & shell
other
resources exports / international demand
imports / international resources
14
food 8
oils/fats +6
wood 5
+5
29
+9
other agro 12
forestry 6
Lignin
cpo refinery
biorefinery
To
tal M
ala
ys
ian
ec
on
om
y 5
09
NBS – starting point
pellets
power plant
compound
transport
fuels
solid fuels
(power plants)
electricity/
heat
fertilizer

OPBC
RM 71 bn
FFB
fronds
& trunks labour
crude oil
well
coal mine
natural gas
reservoir
palm oil
plantation
capital, land
materials
transport
fuels
solid fuels
(power plants)
electricity/
heat
food/feed
chemicals
fertilizer
palm oil mill
biofuels
biochemicals
oil refinery liquid fuels
cpo
EFB,fiber & shell
compound
fronds & trunks
EFB, fiber & shell
other
resources exports / international demand
imports / international resources
14
food 8
oils/fats +6
wood 5
+5
29
+9
other agro 12
forestry 6
pellets / lignin
cpo refinery
To
tal M
ala
ys
ian
ec
on
om
y 5
09
NBS - portfolio adds ca RM 28 bn (~ 2.7% of 2020 GDP) of revenues to 30 Mt biomass
biorefinery
4
2
?
18
pellets 5
power plant
compound
RM ?? bn
exports or
domestic?
Constraint ?
displacement ?
displacement ?
robust market
or hype ?
All
co
mm
od
ity p
rod
ucts
are
cyclic –
ho
w
to m
ove t
o s
pecia
ltie
s a
nd
reta
il m
ark
et
?
From 30 to 50+ Mt ?
Impact on CPO ?
Impact on
soil ?
Impact on soil ?
price
dynamics ?
price dynamics ?

Back-up slides
• palm ‘waste’ in Malaysia
• REDEFINERY
• BE-Basic

Winning Team
2013 LST MSc
Design Competition
woodpellets + … power/heat + ethanol + biochemical + €€ (instead of –SDE)

Biorefinery structure - biomass to integral value
• tune portfolio value renewable energy/fuels/chemicals
• counter-acting scale effects of logistics (5-10% for bagasse,
30% for palm oil biomass) and conversion costs
• energy/heat, water, and nutrient integration
• need for cross-industry sector collab’s (JVs, trade, co-op’s,…)
conversion
to fuels fuel
conversion
to chemicals
conversion to
power/heat
pretreatment /
hydrolysis
harvest /
logistics
chemicals/
materials
renewable
power/heat
nutrients/water
‘switch’
food/feed

(I) Bioenergy Only: sugars to ethanol (100%) , power (heat)
(II) Chem’s : sugars to organic acids (25%) + ethanol (75%), lignin to power (+ less excess heat), CO2
(III) Chem’s & Materials : sugars to organic acids (25%) + ethanol (75%), lignin to power (+ less excess heat), CO2 to bioconstruction
150
900 910
1743
3 tons of raw biomass at gate (2/3 cellulosics + 1/3 lignin)
biomass biorefined to sugars and lignin
revenue in US$
CO2
heat
CO2 in mat’s
(II) (III) (I)
power
ethanol sugars
chem’s
biorenewables’ scenarios
pos. and neg. economic value
lignin
(IV) Chem’s & Materials & LignoFuels : as III, lignin to liquid biofuels
CO2 in mat’s
(IV)

2013: 5 fairly different designs


53
Wood
Chips
4000
ktpa
Ethanol
Ethe
ne
EtOx
EC
PE
C
50
100
50
100
100
920
CO
2
O2
CO
2
H2O
50
490
CO
2
60 50
H2O
i-Butene
Lactic
acid
PLA
H2O H2O
240
100
100
Acrylic
acid
400
Succini
c acid
1,4 BDO 100
100
100
H2O
H2O
H2
CO
2
380
Methanol
686L 914L
100 700
CO
2
3HP 100
GTB
E
PE
PP
1,2 PDO
1,3 PDO
225
Acetic
acid
250
CO
Syngas
CO H2 30 400
MEG
100
H2O
MCA
i-Butanol
PX
H2
DMC
THF
Biosene
250 opt
CO
2
SHC
CO
2 opt

54
Wood
Chips
4000
ktpa
Ethanol
Ethe
ne
EtOx
EC
PE
C
i-Butene
Lactic
acid
PLA Acrylic
acid
Succini
c acid
1,4 BDO
Methanol
3HP
GTB
E
PE
PP
1,2 PDO
1,3 PDO
Acetic
acid
Syngas
MEG
MCA
i-Butanol
PX
DMC
THF
Biosene
SHC
Authors: Kim Meulenbroeks/
Jan van Breugel 54

wood chips at ‘mid price’
cost of /return on capital at market conform pricing included
Equal to wood Bunker oil
0
100
200
300
400
500
0 200 400 600 800
€/t
su
gars
€/t lignin
4 Mt/a
1.5 Mt/a
London #5 Sugar Price (26/06/2015)
New York #11 Sugar Price (03/07/2015)
o
o – transfer price for lignin priced as wood at target NPV
Presentation based on public data
NPV>0
NPV<0
REDEFINERY to produce sugars and fuels
& Kerosine
Coal value
NPV= 0 at various scales
various scales

Back-up slides
• palm ‘waste’ in Malaysia
• REDEFINERY
• BE-Basic

About us: www.BE-Basic.org/downloads *

RD & Innovation strategy
Focus: (1) start-ups , (2) training bio-engineers, (3) pilot facilities
DISCOVER DEVELOP DEMO DEPLOY
B - Basic &
Ecogenomics
2004 - 2009
front end
high risk
unbound
failure is an option
early spin - outs
new processes and products
new companies
new monitoring methods
new approaches (e.g. Smart Soil for CO2 capture)
in via partners
DISCOVER DEVELOP DEMO DEPLOY
B - Basic &
Ecogenomics
2004 - 2009
B-Basic 2004-2010
fuzzy
wild ideas
high risk
unbound
failure is an option
early spin - outs
new processes and products
new companies
new monitoring methods
new approaches (e.g. Smart Soil for CO2 capture)
spin - spin -
unbound
pilot plant
demo plant
full plant
lab R&D
BE-Basic 2010-2015

F1 Carbon F2 Nitrogen F3 Recycle F4 Biomat.
F5 Bioprocess Engineering
F6 Synthetic Biology & F10 Genomics
F7 Metagenomics mining & F10 Genomics
F8 Environ impacts of biobased products/processes
F9 Societal embedding (incl Integrat.biofuels/plastics project)
biobased technologies & systems (push)

Open innovation model in shells
<x> multiplier = (project $ / company $)
budget : risk – impact mapping
core
necessary
differentiating, full IP <1>
access to IP & skills,
JV or B2B partners <1..2>
strategic
• background knowledge, generate IP
public private HR-PR <4> ‘nice to know’
relevant academics/fields, scout IP
science foundation, inspiration vv, HR-PR <10> conferences
relevant fields, scout/set options-trends
inspiration vv, HR-PR-reputation <100>
+
innovation budget + FTE
(incl follow-up)
BE-Basic, other PPS
science foundation, EU, ...
joint ventures
• alt.: VC-fund, monitor deal
flow IP private-private <4..10>
*

Bioprocess Pilot Facility at Delft Biotech Campus N
operational since mid 2012, while being renovated (www.bpf.eu)
80 M€ public-private investment
*

Bioprocess Pilot Facility at Delft Biotech Campus N
operational since 2012, renovation complete 2014 (www.bpf.eu)
80 M€ public-private investment

BE-Basic 10 years

Synthetic Biology in the real world?
glucose
xylose
arabinose
acetate
glycerol
furanics
commercial product
based patent portfolio

Successful SME’s in BE-Basic (Q1 2013)
• TUD-spin-out discovered FDCA-technology for sustainable PET-
replacement (’09), developed in BE-Basic (’10-’11) for further
commercialisation in Purac (mar’13)
• WUR-starter pioneer in chemicals from
waste streams, closes series A investment
with Horizon3 and DGF* (5 apr 2013)
• TUD starter (oct’12) with BPF, TUD, VC
develops advanced biorenewables processes
… and more to come !
DḀB

The other 70% : FDCA for “BioPEF”
biomass
HM-furOH
• Top-12 value-added chemicals from biomass
• Platform chemical - market size 4-12 bn $/yr
• Replace terephthalate in 15 mio ton polymers
• Concept in B-Basic (TUD/TNO - ’09) – FDCA direct production from lignocellulosic HMF
• indust biocat (BIRD Eng /TUD-’09) – bioprocess (BIRD –’10) – invest round - piloting (BE-Basic-’11)
• 2013 - acquisition of BIRD Eng / FDCA by Purac kg-scale process
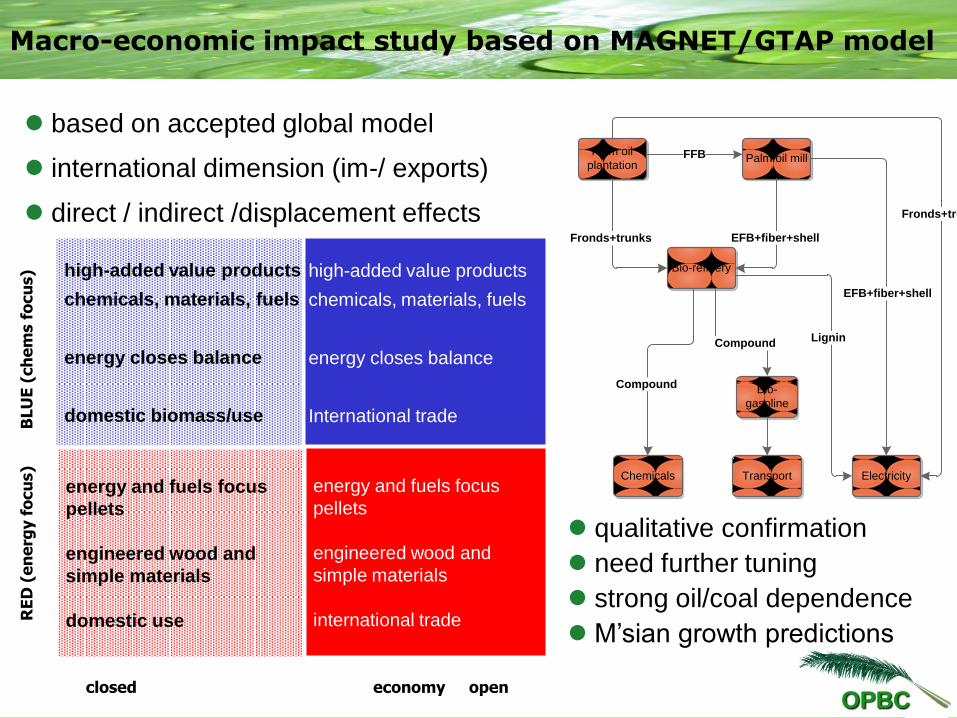
trends in biobased production
production [kT/yr]
concentration from reactor [kg/m3]
0,01
0,1
1
10
100
1000
10000
0,001 0,1 10 1000 100000
petrochemicals
bio-bulk
active ingredients
biopharma
Cooney, ‘84
0,01 1 10 100 1000
MAb, HSA
antibiotics,
nutraceuticals
bioplastics (PLA, PHA, PDO, ...)
(2nd gen) biofuels
co
st p
rice (
$/lb
)
Bioconstruction materials
(self-healing, cement,
bioconcrete,biogrout,
bioasphalt,, …)
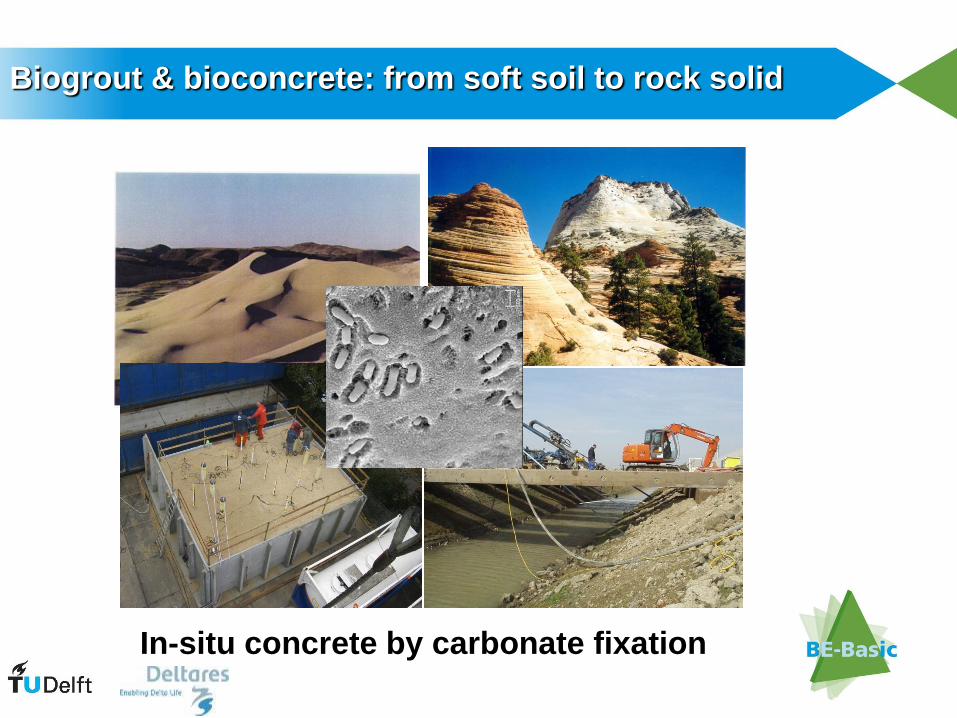
In-situ concrete by carbonate fixation
Biogrout & bioconcrete: from soft soil to rock solid

100 micrometer (10-4 m)
Van Paassen Animations ©

71
palmitic acid
glycerol
sugars
methane
butanol
propionic acid
ethanol
succinic acid
citric acid
lactic acid
p-xylene
crude oil
syngas
0.25
adipic/acrylic
ethylene
propylene
jetfuel/diesel
1,4 BDO
0.5
1.0
0.3
1.1
0.4
0.3
4
CO2
biomass
ligninemethanol
feedstocks
DHcomb 105 J/kg
600
0
biomass yield
Combined (drop-in/substitute/-out) scenarios ?
products
$400/ton
$50..130/ton
$660/ton
$6/ton biocon-struction
advanced fuels
connect 2 sectors w mega-volumes

conclusions
• biorenewables can play critical role in chemical & materials
industry, far ‘beyond bioethanol’ and
• in sustainable (people, planet, profit) development
• no premiums & subsidies: need to be integral part of
chemicals/ fuels/ food/ energy /logistics system
• fuels with priority for sectors w/o alternatives
• public-private partnerships are required to speed-up
development and implementation, in professional setting