
Agriculturen Serc°em Of Agricultural Materials
44
Agriculturen Industrial Uses Serc°e m Of Agricultural Materials December 1994 Materials Situation and Outlook Report ~-- Generating electricity from biogas.
Transcript of Agriculturen Serc°em Of Agricultural Materials

Agriculturen Industrial UsesSerc°em Of Agricultural
MaterialsDecember 1994 Materials
Situation andOutlook Report
~--
Generating electricityfrom biogas.

Industrial Uses of Agricultural Materials Situation and Outlook. Commercial Agriculture Division, Economic ResearchService, U.S. Department of Agriculture, December 1994, IUS-4.
ContentsPage
Summary .......... .......................................................... 3Introduction .................................................................. 4Current Macroeconomic and Industrial Outlook ....................................... 6Starches and Sugars ............................................................ 8Fats and Oils ................................................................. 11Forest Products ............................................................... 14Specialty Plant Products ........................................................ 17Special ArticlesBiogas Production from Animal Manures: What Is the Potential? . . . . . . . . . . . . . . . . . . . . . .. 20Pulping Catalysts from Lignin .................................................... 27
List of Tables ................................................................. 34
CoordinatorLewrene Glaser
Voice (202) 219-0091, Fax (202) 219-0042
ContributorsBob Armstrong, Alternative Agricultural Research and Allen Baker
Commercialization Center Lewrene GlaserHarry Parker, Cooperative State Research, Education, Thomas Marcin, Forest Service
and Extension Service Charles PlummerWilliam Tallent, Agricultural Research Service Donald Van Dyne, University of MissouriGloria Kulesa, U.S. Department of Energy Alan Weber, National Biodiesel BoardDavid Torgerson Joseph Bozell, National Renewable Energy LaboratoryChin Lee Donald Dimmel, Institute of Paper Science andJohn McClelland, Office of Energy TechnologyIrshad Ahmed, Booz, Allen & Hamilton, Inc. Arthur Power, Arthur J. Power and Associates
Statistical SupportAnton Raneses, (202) 501-8279 David Johnson, (202) 219-0355
Editor Graphics, Design, and LayoutDixie Lee Wynnice P. Napper
Approved by the World Agricultural Outlook Board. Summaries and text may be accessed electronicallySummary released December 14, 1994. The next through the USDA CID System; for details, call (202)summary of Industrial Uses of Agricultural Materials 720-9045.Situation and Outlook Report is scheduled for release onSeptember 14, 1995.
Acknowledgements
This report was made possible through the active support of many people and organizations. The June and December 1994issues were primarily funded by contributions from the U.S. Department of Energy's Office of Industrial Technologies;USDA's Alternative Agricultural Research and Commercialization Center; Cooperative State Research, Education, andExtension Service; and Agricultural Research Service. Donald Van Dyne, Professor of Economics at the University ofMissouri, and Irshad Ahmed, Director of Renewable Energy and Biotechnology at Booz, Allen & Hamilton, Inc., contributedtime and expertise to this report.
Mention of private firms or products does not indicate endorsement by USDA. Cover photo is of an engine generator, whichuses biogas to produce electricity, on Mason Dixon Farms in Gettysburg, PA (see special article).
2 Industrial Uses/IUS-4/December 1994

Summary
Market Conditions and Research Increase Industrial Useof Agricultural Materials
During fiscal 1993-94, USDA's Alternative Agricultural products and processes are developed. As supplies ofResearch and Commercialization (AARC) Center used virgin timber tighten, nonwood biomass fibers, such as$15.3 million to fund 39 projects. Private partners straw, and recycled fiber products, such as paper andcontributed another $43 million, resulting in a wood wastes, are being used as raw materials forprivate-public funding ratio approaching 3 to 1. The composite products.AARC Board recently met and made the initial round offiscal 1995 project selections from approximately 100 Relatively recent technological developments have allowedapplications. USDA's Cooperative State Research, improved screening of plants for potentially beneficialEducation, and Extension Service is working with the U.S. chemical compounds. Both public and private sectorsDepartment of Defense to develop advanced materials have responded by beginning natural-products drugfrom renewable resources. To date, USDA's Agricultural research. Markets for herbal remedies have alsoResearch Service has negotiated over 425 cooperative expanded, driven by increasing interest in health andresearch and development agreements with industrial alternative medicines.partners. U.S. Department of Energy's AlternativeFeedstocks Program has developed a thermal/chemical Livestock producers who operate large-scale confinementclean fractionation process that is being evaluated by operations, such as dairies and hog farms, are looking forindustry. ways to handle and dispose of animal wastes that are cost
effective and meet odor and pollution regulations. Farm-The U.S. gross domestic product and industrial production level production of biogas (using anaerobic digesters) isare expected to grow 3.9 and 5.6 percent, respectively, in one solution that also will help control methane emissions1994. Growth, however, is forecast to slow in 1995. into the atmosphere. With current technologies, anaerobicIndustrial markets for agricultural products should continue digesters generally require warm climates, large volumesto grow, albeit more slowly. of manure, high local electricity rates, and daily
maintenance and management to be profitable. "BiogasDespite the Court stay on the U.S. Environmental Production from Animal Manures: What Is the Potential?"Protection Agency's renewable oxygenate requirement, covers these issues and describes four case studies thathigh methanol prices and a recent Treasury Department demonstrate the feasibility of farm-level production ofannouncement that ethyl tertiary butyl ether (ETBE) is biogas.eligible for excise tax exemption could push ethanolproduction close to 1.5 billion gallons in 1995. Industrial The second special article is "Pulping Catalysts Fromuses of corn in 1994/95 are forecast up 12 percent from Lignin." Lignin, a common material in trees and woody1993/94. Most of the increase is expected to be used to plants, currently is a byproduct of pulp and papermake ethanol. Corn also is used to produce sorbitol, a production. However, joint research at the Nationalpolyol widely used in personal-care products.polyol widely used in personal-care products. Renewable Energy Laboratory and the Institute of Paper
Science and Technology is aimed at broadeningMeadowfoam, a new oilseed crop grown in Oregon,
commercial uses of lignin. One project is assessing thecontains a unique oil that is used in cosmetics and haspotential in other applications. Recent plant breeding, potential for converting lignin into anthraquinone-likeagronomic research, and oil-product development are pulping catalysts. Anthraquinone (AQ) improves kraftbringing meadowfoam closer to commercial viability. pulping, but its cost hinders widespread use. ThreePolyols, which are traditionally derived from processes were evaluated for their technical and economicpetrochemicals, are now being made from vegetable oils. feasibility of converting lignin into pulping catalysts.
Preliminary results indicate that two of the processes
Composite products are an important and growing segment appear viable. Comparing these two processes toof the forest products industry. Over 70 percent of all competing petrochemical-based, AQ-producing methods,wood materials in use today contain some type of showed that the lignin-based routes were potentially theadhesive, and that figure is expected to grow as new most cost effective.
Industrial Uses/IUS-4/December 1994 3

Introduction
Development and Commercialization of Biobased Materials Continue
USDA's Alternative Agricultural Research and Commercialization Board recently made initialselections of projects to be funded in fiscal 1995. USDA's Cooperative State Research,Education, and Extension Service is working with the U.S. Department of Defense to developadvanced materials from renewable resources. To date, USDA's Agricultural Research Servicehas negotiated over 425 cooperative research and development agreements with industrialpartners. DOE's Alternative Feedstocks Program has developed a thermal/chemical cleanfractionation process that is being evaluated by industry.
Updates: USDA's AARC Center stringent California clean air requirements. AARC Centerfunds are being used to upgrade the facility and develop
During fiscal 1993-94, USDA's Alternative Agricultural a marketing program for the product. The company isResearch and Commercialization (AARC) Center used using only larger mesquite trees, leaving the smaller ones$15.3 million to fund 39 projects. Private partners for harvest in later years.contributed another $43 million, resulting in aprivate-public funding ratio approaching 3 to 1. The Most CSREES Programs ContinueCenter requires at least a 50-percent match in funds andnegotiates a payback arrangement for each project. The Industrial use programs administered by USDA'sCenter received $6.5 million in funding for fiscal 1995. Cooperative State Research, Education, and ExtensionThe AARC Board met December 5-7, 1994, in Kansas Service (CSREES) were funded for fiscal 1995, with theCity, MO, and made the initial round of 1995 project exception of the high erucic acid development effort.selections from approximately 100 applications. (Under the Federal Crop Insurance Reform and
Department of Agriculture Reorganization Act of 1994In September 1994, Secretary of Agriculture Mike Espy [P.L. 103-354], the Cooperative State Research Serviceannounced a cooperative agreement between the AARC was merged with the Extension Service and renamedCenter and the National Association of State Departments CSREES). The Advanced Materials from Renewableof Agriculture to provide outreach for the Center in all 50 Resources Program, jointly administered by CSREES andstates. Local entrepreneurs and other-parties interested in the U.S. Army Natick Laboratory, was funded at $5the AARC Center program may now contact their local million, the same as 1994. A portion of the funds is beingstate department of agriculture for information. In utilized to test agricultural products in U.S. Department ofaddition, state officials can help identify and assist the Defense facilities. These tests include guayule rubber tiresCenter with worthy projects. and biodiesel at the Army's proving grounds in Yuma,
AZ, and spill adsorbents, solvents, cutting oils, peelableThe AARC Center completed its fiscal 1994 project coatings, and packaging foams at the U.S. Army Tank andfunding by supporting two projects in Georgia and Texas. Automotive Research, Development, and Engineering(See the June 1994 issue of this report for information on Center in Warren, MI.projects funded earlier this year.) The first project is withBioPlus, Inc., of Ashburn, GA. The company is using CSREES's industrial uses program recently displayed itswaste peanut hulls as a carrier for crop-protection accomplishments at two major technology exhibitions:compounds and, now, as cat litter. The hulls are run Technology 2004, November 8-10, 1994, in Washington,through a hammer mill and pelletized for the appropriate DC, and the Biobased Products Expo '94, December 5-7,use. AARC Center funds are being used to develop and 1994, in Kansas City, MO. Vernonia, lesquerella, kenaf,implement a marketing plan for the cat litter, which is and guayule were featured in the display.100-percent biodegradable, holds twice as much moistureas conventional clay litter, and is flushable. ARS Marks a Decade of Formal Technology
Transfer ActivitiesThe second project is with Indian Creek Mesquite ofBrownwood, TX. The company is processing mesquite In 1984, USDA's Agricultural Research Service (ARS)chips and marketing them as an environmentally friendly published its first official technology transfer plan, whichand taste-enhancing alternative to charcoal. The mesquite called for active interaction of agency scientists withis coated with U.S. Food and Drug Administration- industry to get ARS research results commercialized.approved paraffin to help it burn, but contains no noxious Passage of the Federal Technology Transfer Act of 1986hydrocarbons as does some charcoal. The product meets gave the ARS technology-transfer program further
4 Industrial Uses/IUS-4/December 1994

impetus. Under the act, ARS has negotiated over 425 DOE's Alternative Feedstocks ProgramCooperative Research and Development Agreements Reaches a Major Milestone(CRADA's) with industrial partners and pursued strongpatenting and licensing efforts. ARS is among the top The U.S. Department of Energy's (DOE) Alternativethree or four Federal agencies in terms of the number of Feedstocks Program (AFP), administered by the Office ofCRADA's signed. Industrial Technologies, marked its first year and a half of
research and development of technologies that convertDuring the first decade of its existence, the technology- renewable resources into chemicals. An objective of AFPtransfer program facilitated the commercialization of at is to demonstrate, through industrial partnerships, theleast a dozen new products from ARS research. These commercial feasibility of biobased processes. Currentlysuccesses include low-calorie, high-fiber baking products under development are two processes: One involves anfrom oat hulls, Oatrim (a fat substitute made from oat organic acid (to demonstrate production of a high-volumeflour), biodegradable plastics from cornstarch, starch-based intermediate chemical from a renewable resource), whileencapsulated pesticides, enzymatically assisted, peeled-and- the other uses lignocellulosic materials (to demonstrate ansectioned citrus products, and lactose-free milk. End improved clean-fractionation-of-biomass technology).products containing these items account for hundreds ofmillions of dollars in sales annually. For example, Oatrim The lignocellulosic project, which uses thermal/chemicalwas incorporated into $1 billion worth of "Healthy clean fractionation, has reached a major milestone. DOE'sChoice" consumer products within 18 months of patent National Renewable Energy Laboratory has demonstrated,issue. on a laboratory scale, the ability of the process to produce
cellulose and cellulose derivatives of interest to industry.ARS signed 93 CRADA's in fiscal 1994, compared with This project has the potential to produce purer, less59 the previous year. An agreement with Franz Haas expensive cellulose and lignin fractions as startingMachinery of Richmond, VA, is to develop biodegradable, materials for such products as:water-resistant coating products made with 100-percentpotato or cornstarch. As part of the CRADA, ARSscientists are evaluating several natural biodegradablepolymers to make items such as foam cups, plates, andpackaging that deter moisture absorption. * Cellulose esters used in coatings, thermoplastics, and
textiles;
The agency filed 40 patent applications in fiscal 1994,down from 68 in 1993. An example of a 1994 application · Cellulose ethers used in latex paints, industrialis a process to manufacture nonallergenic rubber latex thickeners, and food additives; andfrom domestic plant species such as guayule, milkweed,and goldenrod (see the specialty plant products section for * Lignin for quinones used in polymer intermediates,more information). Licensing of the technology is dyes, and pulping catalysts (see special article onunderway. pulping catalysts from lignin).
In fiscal 1995, ARS received $79.5 million for research Industry is currently evaluating the laboratory samples, andand development of new uses for agricultural commodities, the next step depends on their findings. Possible outcomesthe same as last year. Of this, $45.3 million is allocated
* ' 4. * . includes a collaborative partnership to further evaluate theto new, nonfood uses and $34.2 million to new foods andprocessing systems. A major benefit of the interactions derved products, a scale-up effort with an industrialfacilitated by CRADA's and patent licenses is the partner, or both. A decision is expected soon after thefeedback from industrial partners that helps the agency first of the year. [Bob Armstrong, (202) 401-4860; Harryprioritize its research program to get the biggest bang for Parker, (806) 742-3553; William Tallent, (301) 504-6786;taxpayer dollars. and Gloria Kulesa, (202) 586-8091]
Industrial Uses/IUS-4/December 1994 5

Current Macroeconomic and Industrial Outlook
Modest U.S. Economic Growth in 1995 Provides Supportfor Industries Using Agricultural Materials
The U.S. Gross Domestic Product and industrial production are expected to grow 3.9 and 5.6percent, respectively, in 1994. Growth, however, is forecast to slow in 1995. Inflation isexpected to be 3.4 percent in 1995, up from an anticipated 2.7 percent in 1994. Industrialmarkets for agricultural products should continue to grow, albeit more slowly.
The consensus of private forecasters is that the U.S. Gross Imports rose at an annualized rate of 15.6 percent duringDomestic Product (GDP) will grow by 2.9 percent in the third quarter, increasing the real trade deficit.1995. Industrial production is expected to be up between Spending on business construction rose slowly at an4 and 4.5 percent, along with strong export and investment annualized rate of 1.1 percent and residential investmentgrowth. Analysts forecast housing starts to decline and fell at an annualized rate of 3.9 percent. Oil pricesconsumer-durable growth to slow, dampening advances in stabilized and spending on nondurable consumer goodsboth GDP and industrial production. Housing starts are increased 8.9 percent during the quarter.expected to decrease from a likely 1.42 million units in1994 to 1.36 million units in 1995. Interest Rates and Employment Increase
In addition to a decline in residential construction, most Since the economy was on a solid recovery path in earlyforecasters expect weak plant investment in 1995, reducing 1994, the Fed decided to institute a neutral monetaryoverall construction for the year. Some analysts, however, policy to prevent a resurgence of inflation. As a result,pointing to high use of factory capacity, expect substantial the Federal funds rate (the rate which banks charge eachgrowth in plant construction that will offset the expected other for loans to cover reserve requirements) increaseddecline in housing starts, making 1995 a growth year for six times in 1994 from 3 percent in January to 5.6 percentthe construction industry in most areas of the country. in early December. Other rates went up (figure 1),Most analysts expect strong business-equipment spending reflecting the rise in the Federal funds rate, expectedbecause profits have been increasing and are expected to future tightenings, and increases in credit demand as ourcontinue rising in 1995. major trading partners recover. Most analysts expect the
Fed to push up interest rates again next year.Consumer prices are expected to rise 3.4 percent in 1995.Given this anticipated inflation and continued strength in Because of these interest rate hikes, GDP growth wasindustrial production, the Federal Reserve Board (Fed) is slightly slower than it would have been otherwise in theexpected to put more upward pressure on short-term third quarter of 1994. But the economy and the industrialinterest rates to restrain GDP growth to the 2.5- to 2.7-percent range. Figure 1
Interest Rates Have RisenEconomic Growth Was Strong in Third Quarter Throughout 1994
PercentIn the third quarter of 1994, growth was initially estimated Percentat 3.9 percent, higher than most analysts expected. Strong
annualized rate of 12.2 percent), and government spending, Long-term Treasury bond yield-along with substantial gains in business-equipment 7spending, led to the high rate. Increased consumer . - ,.o' Bank prime ratedisposable income, especially from wages, combined with 6 -.readily available bank loans (albeit at higher interest rates),fueled the demand for consumer durables and business 5equipment. Although real (adjusted for inflation) car andtruck spending was flat for the quarter, durables grew at 4an annualized rate of 6.3 percent because of strong Federalfunds ratefurniture and appliance sales. Nonfarm business Feder
inventories, which were expected to drop, grew by some 22
$6 billion. Oct 93 Dec Feb 94 Apr Jun Aug Oct
6 Industrial Uses/IUS-4/December 1994

sectors have been surprisingly resilient. Overall GDP Manufacturing Use of Agricultural Productsgrowth for 1994 is expected to be 3.9 percent. The year Will Grow More Slowly in 1995is likely to be as strong as any since 1988. The economicstrength was driven by productivity growth, providing very With GDP expected to grow 2.7 percent in 1995, industrialstrong employment growth and some modest wage markets for agricultural products should continue to grow,increases. Industrial production for the year grew at about albeit more slowly than in 1994. Although net exports are5.8 percent. Despite higher interest rates, most interest-sensitive sectors, including housing and furniture that rely expected to drop in 1994, the growth in exports ofon forest products and textile production, were profitable manufactured goods will likely reach double digits.and grew during 1994. Home sales fluctuated more from Modest increases in agricultural exports are expected nextquarter to quarter than other interest-sensitive sectors, but year, which will likely generate more demand for food andare expected to be higher in 1994 than in 1993. Housing kindred products and industrial products that usestarts are anticipated to be about 1.42 million, up from agricultural materials. The expected rise in investment and1.29 million in 1993, an increase of 10.1 percent. personal spending should bring further growth in
Employment grew an average of nearly 279,000 per month manufacturing sectors: furniture, plastics and rubber, cornfor the first 11 months of 1994, including an unexpectedly milling and oilseed crushing, textiles, and leather-relatedlarge increase of 350,000 in November (figure 2). The products.manufacturing sector added 50,000 new employees inNovember, also higher than expected. Except for Production of fabricated metal products is important toCalifornia, every region is in recovery. Some areas of the industrial rapeseed and crambe oils, which are used as rawMidwest recently reported bottlenecks in the labor market materials for lubricants in rolling and stamping metalwith wage increases above inflation. Overall labor products. Given the good outlook for industrial productionmarkets appear to have substantial slack, which, coupled in 1995, use of fabricated metal products is expected towith higher productivity growth, likely will restrain 1994 expand. Domestic textile production, which has beeninflation to 2.7 percent. Unemployment is expected to robust in 1994 compared with 1993, will likely remainaverage about 6.4 percent for 1994. strong. Growth in printing and publishing expected for
next year will raise the demand for paper and petroleumRefined crude oil prices rose this year from $13 per barrel and vegetable-oil inks.in January to $16 by the end of October, with a run up inthe middle of the year to almost $18. Prices for gasoline Even an increase in the demand for food and kindredand diesel fuel are expected to rise at the end of the year,reflecting the carbon monoxide provisions of the Clear Air products will (with some lag time) expand industrial usesAct. The U.S. Department of Energy's Energy of agricultural materials. For example, higher demand forInformation Administration and most other analysts expect meat products in 1995 would increase input use of fats andhigher crude oil prices in 1995, reaching $18 per barrel by oils; paper and allied products; chemicals and selectednext fall. The forecast is based on expected growth in chemical products; plastic and synthetic materials; anddeveloped countries, which will increase demand with no transportation, communication, and utility services. Moregreat shift in supply. specifically, a $1 increase in the final demand for meat
products would require, directly and indirectly, 11 centsFigure 2 worth of fat and oil products and 20 cents worth of otherEmployment Growth Increased in 1994 manufactured products, such as paper, chemicals, andNumber of new jobs per month plastics. Use of transportation services would increase 8500,000 cents, personal and business services would rise by 17
cents, and the wholesale and retail trade sector would400,000 generate an additional 12 cents of business activity.
Because of the expected slowdown in residential300,000 construction, wood and lumber use will likely decline.
The residential construction industry uses 21 percent of the200,000 output from the nation's saw and planing mills. These
mills used 89 percent of the timber harvested in 1987. If,as some analysts suggest, plant investment grows enough
100,000 to offset the expected decline in residential housing starts,lumber and wood product demand could still grow in
0 1995. [David Torgerson, (202) 501-8329; and Chin Lee,Oct 93 Dec Feb 94 Apr Jun Aug Oct (202) 501-8340]
Industrial Uses/IUS-4/December 1994 7

Starches and Sugars
Ethanol, Starch, and Sorbitol Increase the Demand for Corn
Despite the Court stay on the U.S. Environmental Protection Agency's renewable oxygenaterequirement, high methanol prices and a recent Treasury Department announcement that ETBEis eligible for excise tax exemption could push ethanol production close to 1.5 billion gallons in1995. Industrial uses of corn are forecast to reach 748 million bushels in 1994/95, up 12 percentfrom 1993/94. Cornstarch is used to make sorbitol, a polyol widely used in personal-careproducts.
Ethanol Had a Busy Year in 1994 resolved before the RFG program has been in effect a longtime. The Court order lays out a schedule for EPA, the
The year began with ethanol supporters, oil companies, oil industry, and the Renewable Fuels Association to fileagricultural interests, and the U.S. Environmental legal briefs with the Court. The last set of briefs is dueProtection Agency (EPA) continuing their debate over January 12, 1995, and oral arguments likely will beginwhat role ethanol will play in the Clean Air Act's shortly thereafter. A final decision is expected in thereformulated gasoline (RFG) program. EPA had spring.announced their decision in December 1993 to require 30percent of the oxygen in RFG be derived from renewable The RFG program will begin on January 1, 1995, in allsources. This "renewable oxygenate requirement" (ROR) areas that are mandated or have opted into the program.would guarantee ethanol a role in the RFG program. Annual demand for RFG is expected to be about 36 billion
gallons, all of which must contain at least 2.0-percentOn January 14, 1994, EPA held a public hearing on the oxygen by weight. Oxygen can be added to gasoline inROR and testimony was given by witnesses representing the form of alcohols or ethers made from alcohols.oil companies, agricultural interests, environmental groups, Currently, there are three oxygenates that are expected tostate regulatory agencies, and public interest groups. This be widely used in RFG: ethanol, ethyl tertiary butyl etherhearing was followed by a 30-day comment period during (ETBE) made from ethanol, and methyl tertiary butyl etherwhich written comments and other documents were placed (MTBE) made from methanol.in the official record.
All three can be used to produce RFG, but ethers likeUSDA submitted comments indicating strong support for ETBE and MTBE have some advantages over ethanol.the Administration's decision and pointing out the many First, RFG made with ethers can be shipped in pipelines;benefits this rule would have on U.S. agriculture. USDA ethanol blends cannot because they attract water. Second,estimated full implementation of the ROR would increase ethanol increases the evaporation rate of gasoline. For thisnet ethanol demand by 500 million gallons annually. This reason, ethanol cannot be mixed with other RFG fuelsincrease would account for an additional 200 million because the evaporative emissions contribute to smogbushels of corn use. Added to the 1.25 billion gallons of formation. ETBE, however, does not increase evaporation;production expected in 1994, ethanol production would in fact, it reduces evaporation significantly. A commonincrease to more than 1.7 billion gallons by crop year misunderstanding about ETBE is that it uses less ethanol1997/98. to make a gallon of RFG. This is not true. The oxygen
in ETBE comes from ethanol. Therefore, to make aEPA issued a final ROR regulation on June 30, 1994, gallon of RFG using ETBE, just as much ethanol iswhich would require 15 percent renewable oxygen in RFG needed for ETBE as would be needed for blending ethanolduring 1995 and 30 percent thereafter. However, on July directly into the fuel.13, 1994, the American Petroleum Institute and theNational Petroleum Refiners Association filed suit in the With the Court stay in place, many have wondered whatU.S. Court of Appeals for the District of Columbia asking the future holds for the ethanol industry. Difficultiesthe Court to overrule EPA and find the ROR illegal. associated with using ethanol in RFG, because of mixingWhile many expected this challenge by the oil industry, and blending restrictions, were thought to put ethanol at aROR supporters are pleased with the aggressive response disadvantage in RFG markets. ETBE has been moreEPA has made toward this suit. expensive than MTBE because methanol has been cheaper
than ethanol and it contains less oxygen than methanol. AOn September 13, 1994, the Appeals Court ordered EPA recent market development that could promote the use ofto stay its implementation of ROR. The Court also ethanol, regardless of the Court's ruling, has been theordered a quick review of the case so that it can be rapid increase in methanol prices over the past year.
8 Industrial Uses/IUS-4/December 1994

Methanol is made mostly from natural gas. Methanol is Starch production in 1993/94 used 2 percent more cornnot only used as fuel and a feedstock for MTBE, but also than the year before. Growth in the economy helpedin chemical applications. For example, methanol is a increase starch use, which was essentially unchangedfeedstock for the resins and adhesives used in making during marketing years 1991/92-1992/93. The U.S.plywood and other building materials. Greater economic economy will likely expand 2.9 percent in 1995, thusactivity and the upcoming RFG program have caused an starch production is expected to continue to rise. Inincrease in methanol demand that has pushed prices up to 1994/95, starch production for industrial purposes is$1.40 per gallon from 35 cents just a year ago. The recent anticipated to require 3 percent more corn than the 207temporary closing of a large U.S. methanol plant due to an million bushels needed in 1993/94. A lot of starch is usedexplosion has increased the tightness in methanol markets, in paper products, and as the economy grows, moreand prices in mid-October reached $1.80 per gallon. shipping boxes and other types of paper are needed. Also,Industry experts are now predicting these tight market greater use of recycled paper has helped boost starch useconditions may persist until additional plant capacity because the shorter wood fibers need extra bonding.comes on line in 1996.
With the decrease in corn prices in July 1994, starchIn addition, the Treasury Department announced on wholesale prices declined in August but still stayedOctober 17, 1994, that the ethanol portion of ETBE will slightly above year earlier levels. Prices for starch arebe eligible for the same excise tax exemption now generally negotiated between buyer and seller and dependavailable to ethanol and other qualifying alcohols. This upon size of purchase, amount of modification done to theruling will remove significant economic barriers to ETBE starch, and competition among sellers. Many starch userscommercialization in the RFG market. have shifted from buying unmodified starch to buying
modified starch that has the particular properties they needWhile the ROR Court stay could have negative effects on in their manufacturing process. Producers are nowethanol use, rising methanol and MTBE prices and the researching user needs and supplying different types ofrecent Treasury tax ruling have created positive economic modified starch to their customers. With the large cornopportunities for ethanol and ETBE in the RFG market. crop harvested in 1994, processing supplies will be lowerMany refiners are talking about using ethanol, ETBE, or priced than in 1993/94, but the stronger demand for starchboth in their RFG around the country. If the market will likely keep starch prices from reflecting the fullsituation continues with high methanol prices, this could decline in corn prices.be enough to maintain ethanol-industry growth at levelsUSDA predicted earlier this year (see June 1994 issue of Sorbitol Production Uses Cornstarch as a Feedstockthis report). Ethanol production is expected to be about1.25 billion gallons in 1994 and could approach 1.5 billion Sorbitol is a six-carbon polyol made by catalyticgallons next year. hydrogenation of sugars, using either batch or continuous-
flow processes. Most sorbitol produced today is fromMore Corn Needed for Ethanol and Starch in 1994/95 dextrose sugars derived from cornstarch. It is available
commercially in food and industrial grades, and is sold inIndustrial uses of corn are forecast to reach 748 million powdered, granular, or liquid form.bushels in 1994/95, up 12 percent from 1993/94 (table 1).Most of the increase is expected to be used to produce There are seven producers of sorbitol in the United States:ethanol. In 1994/95, industrial demand is expected to Archer Daniels Midland Company; ICI Americas; Pfizer,account for 8 percent of total corn use, down from 9 Inc.; Lonze, Inc.; Hoffmann-LaRoche; Ethichempercent in 1993/94. Corporation; and Roquette Corporation. They have a
Table 1--Industrial uses of corn, 1990/91-1994/95Starch Total
Marketing HFCS 2/ Glucose and Food Industrial Fuel industrialyear 1/ dextrose 2/ uses uses Total 3/ alcohol use 4/
Million bushels
1990/91 379 200 35 197 232 349 5461991/92 392 210 36 202 237 398 6001992/93 414 215 36 202 238 426 6281993/94 442 223 37 207 244 458 6651994/95 5/ 455 225 38 213 250 535 7481/ Marketing year begins September 1. 2/ High fructose corn syrup (HFCS), glucose, and dextrose are primarily used in edible applications, such as foodand health-care products. 3/ Industry estimates allocate 85 percent of total starch use to industrial applications and 15 percent to food applications.4/ Industrial uses of starch and fuel alcohol. 5/ Forecast.
Industrial Uses/IUS-4/December 1994 9

combined capacity of 527 million pounds. In 1992, 408 Figure 3
million pounds of sorbitol was produced and consumed in U.S. Uses of Sorbitol in 1992this country, utilizing roughly 25 million bushels of corn.
Four major market segments account for most of sorbitol Personal-care oducts 35%
use: personal-care products, food applications, surfactants,and vitamin C (figure 3). Plastics, specialty plasticizers,and pharmaceuticals make up the remaining 10 percent.The U.S. Food and Drug Administration has approved Food
sorbitol for use in foods, cosmetics, and pharmaceuticals. applications25%
PharmaceuticalsWithin the personal-care segment, sorbitol is used in 3%
toothpastes, cosmetics, and toiletries. The toothpaste astics and specalty
industry is a significant consumer, where sorbitol is used /asiersas a humidity control agent and delivery vehicle.Sorbitol's use in toothpaste grew rapidly in the 1970's Suractants 15%inC 15%
when gel toothpastes became popular. Gel toothpastescontain up to 50-percent liquid sorbitol, which is twice theamount in paste toothpastes. I/ Production and use in 1992 was 408 million pounds.
Source: Irshad Ahmed; Booz. Allen & Hamilton. Inc.; Bethesda, MD; October 1994.
Sorbitol's main competitor at the time for the toothpastemarket was glycerol (a 3-carbon alcohol commercially products, such as sugarless gums and candies. Sorbitolknown as glycerine), which had been used in toothpastes also is used as bulking and flavoring agents. A morefor some time. Although about 10 percent higher in recent application is as a cryoprotectant (to maintain thefor some time. Although about 10 percent higher in
structural integrity of frozen foods).price, sorbitol was viewed with favor because it was a
natural product. In the 1970's, about 70 percent of Vitamin C (ascorbic acid) production consumes about 15glycerol was petrochemically derived. By the middle of percent of sorbitol supply. Before sorbitol was used tothe 1980's, two-thirds of glycerol was derived from natural make Vitamin C, most of it was produced fromsources and there was no difference between the nature petrochemical sources, with a small percentage extractedand quality of sorbitol and glycerol. By then, however, from natural citrus sources.the markets for sorbitol were established and productioncosts were below those for glycerol. In the 1990's, Sorbitol is esterified to produce a wide range ofsorbitol has made further inroads into glycerol's markets surfactants and related surface-active products. The majorin the personal-care industry. Colgate regular toothpaste uses of sorbitol derivatives are as lubricant additives,is now the only toothpaste on the market that contains softeners in textile manufacturing, plasticizers, antifogonly glycerol. Currently, sorbitol is priced at 33 cents per agents, antistatic agents, and components in dry cleaningpound, while glycerol is $1.07 per pound. fluids. Sorbitol-based surfactants are also used in food
processing, cosmetics, and pharmaceuticals.
Sorbitol also is used in mouthwashes, imparting a coolingSorbitol also is used in mouthwashes, imparting a cooling Sorbitol is being used to manufacture plastics and specialty
sweet taste. The cosmetic industry uses sorbitol as a plasticizers. For example, various polyethers are madehumidity control agent and as a gel base. Because sorbitolhumidity control agent and as a gel base. Because sorbitol from sorbitol. It is also used in the manufacture of polyolis hygroscopic (it absorbs moisture from the air), it also components of polyurethane resins and foams. Sorbitolserves as an emollient in creams and lotions. has additional uses in the pharmaceutical industry as a
stabilizer or sweetening agent for a number of drugs, likeSorbitol is used in foods as a sweetener; it is 60 percent as cough syrup. [John McClelland, (202) 501-6631; Irshadsweet as sucrose. Since sorbitol is resistant to tooth-decay Ahmed, (301) 951-2060; and Allen Baker, (202)bacteria, it is increasingly used in many "sugarless" 219-0839]
10 Industrial Uses/IUS-4/December 1994

Fats and Oils
Meadowfoam Oil and Polyols Expand Vegetable Oil Markets
Meadowfoam, a new oilseed crop grown in Oregon, contains a unique oil that is used incosmetics and has potential in other applications. Recent plant breeding, agronomic research,and oil-product development are bringing meadowfoam closer to commercial viability. Polyols,which are traditionally derived from petrochemicals, are now being made from vegetable oils.
Meadowfoam Is Commercially Produced in Oregon yield variation have not all been identified, but differinglevels of insect pollination appears to be part of the cause.
Meadowfoam is a low-growing winter annual native to thePacific Northwest. Seeds collected from wild stands were The small seeds average about 30 percent oil.tested in the late 1950's as part of a USDA-initiated Meadowfoam oil consists primarily of long-chain fattysearch for plants that could provide industrial raw acids. More than 95 percent are 20 carbons or longer,materials. Research in the early 1960's indicated that the which is unique among commercial vegetable oils (tableWillamette Valley of Oregon would be a good area for 2). Most of the fatty acids also contain one or twomeadowfoam production. In 1967, Oregon State double bonds, which are referred to as monounsaturated orUniversity initiated a crop improvement and agricultural polyunsaturated, respectively. This composition impartsproduction program for meadowfoam. This program was considerable oxidative stability, which is required inexpanded in 1980 as a result of funding from the Oregon cosmetics and is potentially useful in lubricants. Anothergrass-seed industry, which was searching for alternative special feature of meadowfoam's dominant fatty acids iscrops for the poorly drained soils of the Willamette Valley the location of the double bond at the unusual delta-5and a way to lessen the pollution resulting from the field position. This allows chemists to make products thatburning required after harvesting grass seed. Legislation cannot be derived from other vegetable oils.adopted in 1991 reduces the acreage that may be open-burned from 250,000 to 65,000 in 1998. The first commercial sale of meadowfoam oil was made
in 1985 to a Japanese firm for use in cosmetics, and theMeadowfoam is an oilseed crop planted in the fall and Japanese cosmetic industry remains the major purchaser.harvested in early summer. Equipment and cultural In 1993, the Oregon Meadowfoam Growers Associationpractices are similar to those used for winter grain and signed a contract with Chicago-based Fanning Corporation,seed crops. Meadowfoam requires insect pollination; which sells lanolin and other products to the cosmetic andhoney bees have been the primary pollinator used by pharmaceutical industries, to market the oil. Skin-carefarmers and researchers. At maturity, plants are 10 to 18 products are currently the oil's primary use.inches tall. Commercial production began in 1984 with600 acres planted by the 24 members of the Oregon To explore additional uses, a number of meadowfoam oilMeadowfoam Growers Association. Since then, acreage derivatives have been made in the laboratory by scientistshas fluctuated from 0 to 1,000. This fall, 2,200 acres were at USDA's National Center for Agricultural Utilizationplanted. Yields have varied dramatically, from 600 to Research (NCAUR). For example, meadowfoam oils has1,300 pounds per acre. The major factors involved in been vulcanized (reacted with sulfur or sulfur mono-
Table 2--Typical compositions of meadowfoam, rapeseed, crambe, and soybean oilsFatty acid name and formula 1/ Meadowfoam oil Rapeseed oil Crambe oil Soybean oil
Percent
Less than C18 0.5 2.5 2.3 10Stearic (18:0) -- 1 1 4Oleic (18:1) 1.4 14.5 16 22Linoleic (18:2) 0.5 15.2 9 54Linolenic (18:3) -- 10 6 7.2Eicosanoic (20:0) 0.5 0.6 1cis-5-eicosenoic (5-20:1) 64 -- --cis-11-eicosenoic (11-20:1) 0.2 9.5 3.5 --cis-5-docosenoic (5-22:1) 3 -- --Erucic (13-22:1) 10 43 55 --cis-5, cis-13-docosadienoic (5,13-22:2) 19 -- -- ..---- = Not present in significant amounts.1/ The formula indicates the location of the double bonds, chain length, and number of double bonds.Source: S.M. Erhan and R. Kleiman, 'Vulcanized Meadowfoam Oil," Journal of the American Oil Chemists' Society, Vol. 67, No. 10, October 1990, pp. 671.
Industrial Uses/IUS-4/December 1994 11

chloride) to produce compounds used in rubber informal consortium has come together to furtherformulations. The vulcanized oil, which is called commercialize meadowfoam and its products. Participants"factice," had properties equivalent to or better than high- include the Oregon Meadowfoam Growers Association,quality, rapeseed-oil factice. However, factices are also Fanning Corporation, Oregon State University, andmade from soybean, castor, and other vegetable oils. NCAUR. Plant breeding, agronomic research, and oil-Meadowfoam factice would have to be cost competitive to product development is progressing rapidly--bringingenter this market. meadowfoam closer to commercial viability.
Meadowfoam oil has been epoxidized (adding an oxygen Vegetable-Oil-Based Polyols Hit the Marketatom across a double bond). The resulting derivativescould be used in coatings, polymers, and lubricants and as Polyol is the basic compound used in the production ofplasticizer-stabilizers. Some plasticizers currently are polyurethane and several other classes of plastic products.made from vegetable oils, primarily soybean oil (see the Traditionally derived from petrochemicals, polyol is nowJune 1994 issue of this report). Meadowfoam oil also can being made from vegetable oils. For example, Naturalbe hydrogenated to produce a wax similar to carnauba and Resources Group, a British research company, operatescandelilla waxes, but a significant market for these eight vegetable-oil-based polyol plants throughout thematerials has not yet developed. world. The company has two plants in Canada, two in
northern China, and one each in northern India,
Dimer acids and esters have been made using Zimbabwe, the United Arab Emirates, and Poland.meadowfoam oil. The meadowfoam compounds werecomparable to commercial products, which are used in Biobased polyol production can utilize a variety of rawadhesives, corrosion inhibitors, lubricants, and lubricant material sources--both virgin and waste vegetable oils.additives. Meadowfoam fatty amides have been prepared The list includes canola, castor, peanut, sunflowerseed,and purified, which could be used as slip and antiblock olive, cottonseed, palm kernel, coconut, and fish oils. Thisagents in polyethylene films. raw material flexibility not only protects against feedstock
shortages, it also makes polyol production suitable forMeadowfoam's fatty acids have also been used to make developing countries that produce surplus quantities ofestolides, which have potential uses in lubricants, vegetable oils.plasticizers, cosmetics, and printing inks. Traditionally,estolides are formed by esterifying the double bond in an Not only can vegetable-oil-derived polyol be used in theunsaturated fatty acid to the hydroxyl group of a hydroxy manufacture of polyurethane and related products, it alsofatty acid, thus linking the two fatty acids together. has exceptional blending properties. To date, biobasedHowever, a new procedure developed by NCAUR polyols have been tested as inputs in the production ofchemists produces estolides directly from monounsaturated foams, elastomers, marine coatings, adhesives, polymerfatty acids. The reaction has a particularly high yield concretes, and housing components. Polyol could be awhen using meadowfoam oil because of its high useful feedstock in developing new end-productconcentration of monounsaturated fatty acids. A patent applications, as well as producing environmentallyhas been allowed for this process, and it will be granted in improved versions of existing products, such as electricalmid-January. Patents are pending on other products based cord coatings and nontoxic fire retardant foams.on the chemistry of the delta-5 double bond.
The meal remaining after the oil is extracted contains 21 Currently, vegetable-oil-based polyol is being produced inThe meal remaining after the oil is extracted contains 21small-scale plants in multiple batches of 4 tons each.percent crude protein and 27 percent acid detergent fiber.
The amino acid profile of meadowfoa meal closely Such small-scale facilities allow producers to adapt toseasonal feedstock changes and to minimize capital costs.resembles those of industrial rapeseed and crambe meals.
It has been evaluated as a feed for chickens, rabbits, Ecotek Holdings, Ltd., of Lions Bay, British Columbia,sheep, goats, and beef cattle. Because of the has constructed a standard size polyol plant on a 40-footglucosinolates present in the meal, nonruminant animals truck that is capable of processing any vegetable oil intogained less weight than with a standard ration. However, polyol. It also is equipped with a quality controllambs and beef cattle responded satisfactorily when fed laboratory.meadowfoam meal.
International Polyol Chemicals, Inc., of Redmond, WA,According to David Nelson, executive secretary of the has develop a patented new technology for turninggrowers association, commercial development of cornstarch into polyols, such as propylene glycol,meadowfoam has been a break-even proposition for the glycerine, and ethylene glycol. The company currentlygrowers thus far. However, meadowfoam is becoming an processes 5,000 tons of cornstarch per year in a pilot-scaleimportant crop for grass-seed growers, enabling them to facility. Plans are underway to develop aclean up fields infected with grassy-type weeds. A commercial-scale plant, with the goal of processing
12 Industrial Uses/IUS-4/December 1994

100,000 tons per year. USDA's Alternative Agricultural comparable petroleum-based processes and such benefitsResearch and Commercialization Center invested $300,000 may compensate for some of the cost differential.in the venture to support additional research. The U.S. Furthermore, production costs could decrease in the futureDepartment of Energy's Alternative Feedstocks Program as the technology improves. Currently, a gallon of high-also contributed $300,000 to help transfer expertise in grade polyol derived from vegetable oil costs $15 a gallon.catalysis operations from Pacific Northwest Laboratory tothe company. Production costs also differ depending on the end product.
For example, vegetable-oil-based polyol used to coatPolyol from canola oil and polymerized with fuel ash from electrical cords is 10 to 15 percent cheaper than electrical-coal-fired power stations is being used to produce cord coatings derived from petrochemical feedstocks. Inpolyconcrete, a construction material produced in different comparison, biobased polyol used to produce fire-retardantstrengths for applications ranging from construction-grade foams tends to cost 15 to 20 percent more than similarbuilding blocks to household appliance shells. This products made from fossil fuels. However, most of theprocess has two environmental benefits. First, it replaces current fire-retardant foams are petroleum derived andnonrenewable fossil fuel feedstocks with renewable based on toluene 2,4-diisocyanate (TDI), which is avegetable oil. Second, it utilizes fuel ash that is otherwise carcinogen. When these foams are sprayed ondumped in a landfill or at sea. high-temperature fires, they produce toxic fumes. Fire-
retardant foams made from vegetable-oil-derived polyolAccording to industry sources, production costs for can replace TDI-based foams. The biobased-polyol foamsvegetable-oil-based polyol average 15- to 20-percent emit harmless water vapors when applied tohigher than for polyol made from petrochemicals. high-temperature flames. [Lewrene Glaser, (202) 219-However, the manufacturing process for vegetable-oil- 0091; Irshad Ahmed, (301) 951-2060, and Harry Parker,based polyol is more environmentally friendly than (806) 742-3553]
Industrial Uses/IUS-4/December 1994 13

Forest Products
Use of Composite Products Is Growing
Composite products are an important and growing segment of the forest products industry. Over70 percent of all wood materials in use today contain some type of adhesive, and that figure isexpected to grow as new products and processes are developed. As supplies of virgin timbertighten, nonwood biomass fibers, such as straw, and recycled fiber products, such as paper andwood wastes, are being used as raw materials for composite products.
Composite products are an important and growing segment OSB production has been growing steadily in the Unitedof the forest products industry. In the last 50 years, solid- States since its inception. Production increased from 2.7sawn lumber and timber construction have given way to million square feet (3/8-inch basis) in 1985 to about 7.1advances in composite technology. Within the industry, million in 1993. If present trends continue, OSBthe term composite is usually used to describe any wood production in the United States will rise to 10.4 millionproduct that is glued together. Over 70 percent of all square feet in 2000 (figure 4). Plywood production waswood materials in use today contain some type of about 20 million square feet (3/8-inch basis) in 1985 andadhesive, and that figure is expected to grow as new then rose to about 22 million square feet in the lateproducts and processes are developed. Composites offer 1980's. In the 1990's, however, OSB displaced plywoodsuperior performance, reduced weight and volume, cost in many uses, especially sheathing. Plywood productioneffectiveness, fatigue and chemical resistance, and declined to 19.3 million square feet in 1993 and iscontrolled biodegradability. In addition to wood, materials projected to go down to about 14.7 million square feet bysuch as plastics, glass, metal, synthetic fibers, and other 2000biomass materials can be used to make compositeproducts.
Composite panel products can also be produced from
The timber products industry has evolved to utilize timber nonwood biomass materials, waste wood, or wastepaper.resources that are available. As the quality of timber Straw from wheat or barley has been proposed as a rawresources has declined, new methods for processing and material for making particleboard that could be used as areconstituting forest products have been developed. This building material. Agricultural fiberboards have beentrend is expected to continue as-future harvests from found to offer superior strength, heat and sound insulation,Federal lands will remain low due to environmental and resistance to fire due to their density compared toconcerns. The forest products industry is conducting standard 2-by-4-inch lumber and sheetrock wall systems.research in cooperation with USDA's Forest ProductsLaboratory and universities to develop new processes and Figure 4
materials to extend timber supplies and promote energyefficiency.
in the United StatesComposite Evolution Began in the 1950's Million square feet, 3/8-inch basis
The original composite-panel product was plywood, whichbecame popular in the 1950's with the development ofphenolic adhesives. Plywood became a superior 20 Plywoodreplacement for 1-inch-sheathing lumber used in housingframes. In the 1970's, the waferboard industry emerged,principally in Canada, using mainly aspen flakes glued 15together under pressure. In the 1980's, a refinement ofthis process was developed that cuts logs into long strandsparallel to the grain, which are then oriented and blended 10 Oriented-strand board (OSB)with adhesives to produce a board with the outside layersoriented parallel to the grain and the center core with the 5short dimension. The panel is then pressed and cured.The resulting oriented-strand board (OSB) is similar toplywood in its applications. OSB generally costs slightly ° l l l l l l l I Iless than plywood, about 30 cents per square foot, and 1985 87 89 91 93 95 97 99
conserves wood use. 1/ 1995-2000 projected.Source: American Plywood Association.
14 Industrial Uses/IUS-4/December 1994

A large-scale plant using up to 340,000 tons of straw expectancy, it can tie up the preservatives for relativelyannually has been proposed for North Dakota by Isobord long periods of time. Considering that over 60 percent ofEnterprises, Inc., of Toronto, Ontario, to produce a fiber- all the southern pine lumber cut today is treated with somecomposite board. Another straw fiberboard plant is sort of preservative, the presence of this material in theproposed for Montana using an established English system waste stream will likely increase.to compress straw into fiberboards. Other agriculturalbiomass projects are under consideration in Iowa, Kansas, Several specific technologies exist that have the potentialOregon, and other states. for producing housing products from recycled wood waste.
Technologies with the greatest potential for successEnviroboard is a product similar to OSB that uses 75- to include: Dry-formed reconstituted wood products from90-percent cereal straw combined with cement and fibers, flakes, chips, or particles; wet-formed woodadhesives. Made by Home Builders International, it is products from fibers; wood/plastic combinations;being used to build homes in South Dakota, Minnesota, wood/cement combinations; reuse of old lumber fromand Wisconsin. Also, in Minnesota, Phenix Composite, razed buildings; and remanufacture of lumber from short-Inc., is commercializing a new composite product called piece wood wastes from construction sites. A significantEnviron, made of soybean monolithic resin and waste advantage of utilizing recycled wood waste is thepaper. According to the company, the material looks like opportunity to depart from conventional framing and panelgranite but has the construction properties of wood. It can building systems.be manufactured into panels, blocks, or veneers andcolored to simulate many granite hues. "Reconstituted" describes a process where wood-waste
materials are broken into small pieces and reassembledNew Technologies and Recycling into new forms with the aid of an adhesive. Because theMean New Wood-Conserving Composites raw materials are from waste, recyclable wood comes in
many different forms from many different sources. ThisOf the approximately 195 million tons of solid waste poses special processing considerations. These includegenerated in the United States in 1990, about 40 percent size reduction and necessary cleaning operations.was paper, 10 percent plastics, and 8 percent wood waste. Blending the wood pieces will reduce performanceWhile data are available for certain wood-based products variations caused by species differences. Much of thein municipal solid waste, information is incomplete for technology currently used for manufacture of fiber- andtimber thinnings, industrial production wastes, and particle-based wood products using virgin wood issawdust. In 1992, 540 million pallets were produced. transferable to recyclable wood. Commercially, woodMany will be reused, but all will eventually require fibers are used in all manner of fiberboard and can bedisposal. molded into a variety of geometric shapes. One readily
identifiable product made using this technology is interiorFiber-based waste products--such as paper, yard wastes,and solid-wood wastes--can be readily reduced to aparticulate or fiber form suitable for composites. Thepotential exists for recycled wood fibers and plastics to Wood waste as s the potential for use in wood-flakeproduce a wide spectrum of products ranging from very products as well. However, making wood flakes from
to expensive recyclable wood may be the most difficult of all theinexpensive, low-performance composiwtes technologies mentioned here. Therefore, flake technologyhigh-performance materials. New fiber technology, waste stream isbonding performance, and fiber modification can be used The raw material should be
with uniform very tightly controlled. The raw material should beto manufacturae wood-plastic composites softwood flakes with a high-moisture content and must be
densities, durability, and high strength. properly pre-sized to produce a consistent product. Flakes
An existing, though not widely used, building product that are commonly used to produce sheathing products, such asOSB. Flakeboards are also used as one or both skins in
can readily be adapted to use recycled wood materialutilizes an inorganic binder, such as portland cement.Inorganic-bonded wood panels made with virgin untreated
wood have very good strength properties, as well as Another process with potential for utilizing solid woodwood have very good strength properties, as well asexcellent resistance to fire, fungi, and termites. This type wastes, including lumber scraps and tree trimmings,of panel is being used in construction in Europe, Asia, and involves crushing the wood into splinters. This processSouth America. offers attractive advantages over other wood-reduction
techniques since no cutting is required. Because they have
A cement-bonded product may be an efficient way to high length-to-cross-section ratios, splinters are strong and
utilize preservative-treated recycled materials. Many end can be highly oriented. Dry hardwoods splinteruses are predicated on good performance in harsh exceptionally well, so this technology seems like a natural
environments and because the product has a long-life outlet for used hardwood pallets. This splintering process
Industrial Uses/IUS-4/December 1994 15

has shown potential in Australia, where a structural wood Greater demands on energy resources will require buildingproduct called "scrimber" has been developed. designs that reduce heat loss in cold regions and minimize
solar gain in hot regions. Population growth along coastalResearch is currently underway at USDA's Forest areas will increase chances of large population centersProducts Laboratory to produce both structural and being hit by the heavy winds associated with these areas.nonstructural housing components from recycled The same is true for areas threatened by seismic activity.wastepaper fiber. Using a three-dimensional pulp moldingprocess, a structural housing component, spaceboard, is Construction materials that contain recycled componentsformed by draining a pulp slurry through a resilient mold. that exhibit ductile/energy-dissipating characteristics wouldThe mold is then hot-pressed to densify and dry the have special applications in seismic areas. Rigid materialsproduct. A preliminary study has demonstrated the and connections that resist high loads and then failpotential of spaceboard as a floor panel product. This abruptly are more likely to result in extensive damage thanprocess can readily accept recycled wood fibers and has those that exhibit plastic behavior and ductile failure. Forthe potential for both curvilinear and three-dimensional example, cement-bonded-fiber composites exhibit asolid formed products. This molding potential will greatly characteristic elasto-plastic load displacement. Researchenhance the flexibility architects and engineers have in to improve their durability, connections, and paneldesigning housing. configuration could result in a low-cost structural material
that has good fire, insect, and decay resistance in additionAnother potential technology to use recycled wood fiber to its seismic load advantage. Low-density, shear-resistant
composites may have dual applications as shear walls andis a pulp extrusion process. A pulp slurry is dewatered, composites may have dual applications as shear walls andsound barriers for multi-family buildings.
densified, and dried as it is forced through special dies.This process has the potential to produce products withvarious dimensions and cross sections, with essentially ability to show a definite economic advantage. Plywood,ability to show a definite economic advantage. Plywood,unlimited length. Potential products might include casing for example, was more than a one-to-one substitute forand trim products and lumber-type profiles. board sheathing: it offered reduced labor costs and
application time, less waste on the job site, and improvedA third type of wet-formed, fiber-based process involves lateral-load (earthquake, wind) performance. Onceshaping structural components through the winding of accepted, plywood completely replaced board sheathing.paper-sheet stock. This process incorporates existing OSB, however, has offered no advantage other than pricesheet-forming technology, but has the potential to utilize and there are still contractors who refuse to use it.recycled paper stock. A number of potential housingcomponents can be produced this way, since many shapes Molded products for housing construction open the marketcan be formed. to innovative, energy-efficient, and wind-resistant
structures. For example, moldable structural compositesAll three of these technologies have potential to produce from recycled waste might be used to fabricate stress-skin-structural housing components, including studs and wall panel comers to replace the conventional three-stud corner.corner posts, interior and exterior sheathing, as well as This would reduce heat loss, improve shear performance,beams and floor panels. Nonstructural (nonload bearing) and reduce wind pressures due to turbulence aroundelements are also possible. Gridcore Systems International building corners in heavy winds. These products alsoof Carlsbad, CA, has licensed the spaceboard technology could provide more architectural possibilities than existingfrom USDA and is using it to manufacture Gridcore rectangular wood products. Shapes can be mass producedpanels. The panels--which are made from recycled to form curved surfaces with little or no framing members,corrugated containers, newspapers, and wood waste--are thus reducing labor and material costs.used in furniture, movie sets, and stage displays. Thecompany plans to expand portable applications and High-density fiber composites from recycled waste coulddevelop panels for use in the housing and construction also be used as substitutes for wood flooring and couldindustries. provide a good wear surface while being more
dimensionally stable than solid hardwood flooring.What Are Future Needs? Maintenance could be reduced compared to an open-celled
wood such as oak. Possible applications could includeA growing population will place greater demand on energy bowling alleys, gym floors, and decorative office flooring.resources, increasing the demand for energy efficiency. [Tom Marcin, (608) 231-9366]
16 Industrial Uses/IUS-4/December 1994

Specialty Plant Products
Interest Increases in Plants as Medicine
Relatively recent technological developments have allowed improved screening of plants forpotentially beneficial chemical compounds. Both public and private sectors have responded bybeginning natural-products drug research. Markets for herbal remedies have also expanded,driven by increasing interest in health and alternative medicines.
The natural-plant-products industries are very diverse. It compounds is only the first step. After finding a usefulis estimated that about 50 percent of natural plant products compound, organizations must find sources of raware used in food-related industries, including medicinal materials (or alternatives such as semisynthesis orinfusions and unlicensed herbal remedies (dietary synthesis) to create large quantities of the product forsupplements). Another 25 percent are used in cosmetics, extensive testing. NCI's Gordon Cragg estimates that20 percent in medicinal applications (ointments, creams, preclinical tests, followed by clinical trials and approval byoils, etc.), and 5 percent for miscellaneous uses, such as the U.S. Food and Drug Administration (FDA) may takeinsecticides and fungicides (1). Such diversity often as many as 15 years before a drug is ready for market.results in various plants being used by multiple, and often The cost incurred by the researching companies isunrelated, industries--for example, dietary supplements and tremendous, perhaps as much as $230 to $500 million incosmetics. just proving a drug safe and effective to meet FDA
standards. In addition, the companies generally seekMedical Treatment Uses Plant Products patent protection, which can be a difficult task in itself, to
ensure a return on investment.Plants are an important part of human medical treatmentand health care. The World Health Organization estimates Alternative Markets for Medicinalthat 70 to 80 percent of the world's population relies Plant Materials Expandmainly on traditional forms of medicine, of which plantsare a major part. Plants also play a significant role in The costs of prescription pharmaceutical research make itmodern medicine. Approximately 25 percent of all difficult, if not impossible, for smaller organizations toprescriptions dispensed in the United States contain plant undertake. However, the recent growth in natural foodextracts or active ingredients obtained from, or patterned products and herbs as medicinal plants (marketed asafter, plant materials. With the worldwide prescription dietary supplements) has created economic opportunitiespharmaceutical industry assessed at roughly $150 billion, for individuals and organizations of all sizes. StevenJames Duke, an economic botanist with USDA, has Foster, an herb industry expert, has identified threeestimated the current world market for plant-containing primary markets for medicinal plants in the United States:pharmaceuticals to be about $30 billion. Other estimates pharmaceuticals, health and natural foods, and exports.have suggested that U.S. medicinal plant imports alone European markets have potential, particularly Germany.could be worth over $1 billion annually. In that country, herb products are manufactured according
to recognized standards and allowed as treatments so longIn recent decades, there has been limited interest in as they have no proven detrimental side effects. Europeanresearch on plants for potential pharmaceutical uses. Prior phytomedicinal sales reached $2.2 billion in 1990, andto the mid-1980's, methods for screening plants were have a projected annual growth of 10 percent (2).relatively slow, and only a handful of drugs made it tomarket from several decades of research. However, recent Use statistics on natural plant products, other than for foodbioassay screening technology is faster, more thorough, or flavoring, are unavailable. For example, USDAand more economical than before. This helped lead to a Agricultural Marketing Service data on herbs are limited,new 5-year research program at the National Cancer and reflect only herbs used for food or flavoring. USDAInstitute (NCI) in 1987, which was renewed in 1991 for Foreign Agricultural Service data on bulk dried herbs,another 5 years at an estimated cost of $3.8 million. In spices, and essential oils cover only import trade at pointaddition, several major pharmaceutical companies, of origin. These figures do not give any indication as tospecialized plant-research companies, universities, and what products the herbs, spices, and oils will be used tobotanical gardens have begun extensive natural-products create. They may end up in spice racks, dietaryresearch. supplements, cosmetics, or personal-care items.
It may be years before the full economic impact of these Because of the lack of statistics, estimating the size andprograms is known. Discovery of useful natural growth rate of the alternative markets for medicinal plants
Industrial Uses/IUS-4/December 1994 17

is a difficult task. However, the recent growth in the The Supplements Industry Now Subject to Regulationhealth food industry is probably a good indicator of overallexpansion. As reported in the June 1994 Natural Foods In October, Congress passed and the President signed theMerchandiser, the volume of sales in health-food chains Dietary Supplement Health Education Act of 1994. Forreached $822 million in 1993, up 23 percent from 1992. the first time, dietary supplements are legally defined asHealth-food chains are defined as chains with at least 150 vitamins, minerals, herbs, etc., intended to supplement thestores that focus mostly on vitamins, supplements, and diet by increasing dietary intake, but not intended orherbs. Much of this increase can be attributed to surging represented as a conventional food or sole item of a mealsales of herbs and dietary supplements, which often or diet. This definition excludes ingredients that fit theinclude herbs, essential oils, and other plant materials. definition of a food additive (flavoring, seasoning, etc.) orOne industry expert has placed the retail value of herb a drug.products and homeopathic remedies at over $1 billion.
Other major aspects of the act:One of the most popular and high-valued herbs in bothdomestic and international markets is ginseng, a medicinal * Authorize FDA to remove a supplement from theherb for which some statistics do exist. According to U.S. market if it is found unsafe. The burden of proofFish and Wildlife Service data, nearly 1.4 million pounds rests with FDA.of certified, cultivated ginseng were produced in theUnited States in 1993, mostly in Wisconsin. That same * Authorize FDA to promulgate new good-year, approximately 110,000 pounds of certified wild manufacturing-practice regulations, which will be usedginseng were collected in the United States, with large to ensure quality products.amounts coming from the Appalachian Mountain region.Ginseng prices vary greatly, depending on quality and * Disallow direct health claims on product labelstype. American Ginseng generally sells for more than without FDA approval, but permit truthful andAsian Ginseng, and wild ginseng more than cultivated. nonmisleading claims on how ingredients affect theU.S. Department of Commerce trade data show that nearly body's structure or function so long as the statement$80 million worth of ginseng was exported in 1993. is registered with the Secretary of Health and Human
Services, and the following disclaimer is on the label:Growing retail sales of herbal products is evidence that "This statement has not been evaluated by the Foodmany Americans are beginning to use herbal remedies as and Drug Administration. This product is notalternatives to common over-the-counter drugs. The most intended to diagnose, treat, cure, or prevent anycommon uses for herbal remedies are as cold/flu disease." If this provision is not followed, FDA canmedicines, laxatives, diuretics, antacids, stress reducers, remove the product from the market.and sleep aids. Interest in Chinese herbs is growing asAmericans and Europeans learn about traditional Chinese Allow third party information to be made available inmedicine. One California herb-and-spice company has the store where a product is sold so long as it isnoticed dramatic increases in sales of ginkgo leaf and dong truthful and nonmisleading, independent of a specificquai root, while maintaining solid sales of domestically manufacturer or product, and displayed separately.grown herbs, such as echinacea and goldenseal. Other topselling herbs for various companies include chamomile * Create a 2-year commission to evaluate a moreflower, psyllium seed husk and powder, peppermint, effective health-claims approval process.licorice, and ginger (4).
Create a new Office of Dietary Supplements withinIndustry experts note the increasing importance of quality the National Institutes of Health (NIH) for the purposeproducts, particularly organically grown herbs. Many of further exploring the potential role of dietarysupplement producers are looking for quality herbs to supplements in improving health care.produce their formulas, which may boost domesticgrowers' chances to compete with imports. Many herbs Alternative Medicines and Phytochemicalsare currently imported due to lower labor costs in Are Hot Research Topicsproducing countries, but as the demand for high qualityand organic products grows, so to do the chances for The Federal government is interested in alternativedomestic producers with highly skilled labor and ideal medicines as well. NIH now has an Office of Alternativegrowing conditions, such as greenhouses. Foster suggests Medicine (OAM), which conducts and sponsors researchthat farmers interested in growing medicinal plants must on medical practices and interventions that do not havefirst do extensive research on particular commodity significant documentation of safety and effectiveness in themarkets and production practices. United States, are not generally taught in medical schools,
18 Industrial Uses/IUS-4/December 1994

or are generally not reimbursable by insurance companies. 4. Peterson, Natasha. "Medicinals Expected to LeadOAM will hold regular meetings with FDA in order to Herbal Sales Surge." Natural Foods Merchandiser,"enroll its cooperation in reevaluating the interpretation of Vol. 15, No. 6, New Hope Communications, Boulder,current rules and regulations governing device, herb, and CO, June 1994.homeopathic-drug research and use" (3). Currently, OAMhas issued two grants of about $30,000 each for researchon Chinese herbs and their effectiveness in treating Guayule Research Continuescommon warts and hot flashes.
Current research and recent studies on theOAM believes that pharmaceutical companies also may be hypoallergenic nature of guayule latex showinterested in studying traditional herbal formulas, even promising results for the future demand of guayulethough they may not be proprietary. If a formula was latex products. Prior clinical tests have shown thatproven safe and effective and approved by FDA, the patients who have severe reactions to Hevea latexcompany submitting the research could possibly receive a did not react to latex derived from guayule. Thenew-drug exclusivity award that could last 3 to 5 years. results of these studies have been verified in theDuring this time the company would have exclusive rights laboratory by Katrina Cornish and Deborah Siler,to market the formula as a drug, giving it an opportunity researchers with USDA's Agricultural Researchto receive a return on its research investment. As stated Service (ARS). Their research concludes that evenearlier, many pharmaceutical companies are indeed highly purified Hevea rubber still reacts stronglyscreening natural plant products for new drugs, but much with certain antibodies, indicating that highlyof this research is focused on tropical plants and not purified Hevea latex would not necessarily preventnecessarily on herbal remedies. allergic reactions in individuals who have already
developed an allergy to Hevea.Many phytochemicals (compounds that exist in plants)have been shown to have various effects on human health, Recent estimates indicate that as many as 17 millionranging from toxic to nutritionally beneficial. Scientists Americans may be affected by Hevea allergy, andhave begun isolating these chemicals and studying their this number is likely to climb as more people comeproperties. NCI's Designer Foods Program is currently in contact with latex products. Reactions can rangeworking on identifying, isolating, and quantifying from mild irritation to life-threatening. People withbeneficial chemicals in foods. [Charles Plummer, (202) type-I allergies to Hevea can still be affected by219-0009] highly purified Hevea products, which opens the
market to products such as guayule latex.I. Anjaria, J.V. "Herbal Drugs: Potential for Industry
and Cash." New Crops for Food and Industry. ARS is investigating commercialization opportunitiesChapman and Hall, Ltd., London, 1989. for guayule latex. Small-scale processing trials of
guayule latex have been successful, and guayule test2. Foster, Steven. "Medicinal Plant Production: plots have been grown in Arizona, Texas, and
Breaking into the Marketplace." Classic Botanical California. It is believed that even a small share ofReprints, Volume III. American Botanical Council, the U.S. latex glove market would be enough toAustin TX, 1992. make it economically feasible to produce guayule for
its hypoallergenic latex, even at current yields. ARS3. National Institutes of Health, Office of Alternative has applied for a patent on latex rubber from
Medicine. Functional Description of OAM, fascimille guayule.fact sheet, April 20, 1994.
Industrial Uses/IUS-4/December 1994 19

Special Article
Biogas Production from Animal Manures: What Is the Potential?
by
Donald L. Van Dyne and J. Alan Weber'
Abstract: Livestock producers who operate large-scale confinement operations, such as dairiesand hog farms, are looking for ways to handle and dispose of animal wastes that are cost effectiveand meet odor and pollution regulations. Farm-level production of biogas (using anaerobicdigesters) is one solution for livestock producers that also will help control methane emissions intothe atmosphere. Methane is a greenhouse gas that contributes to potential global warming. Biogasis 60- to 65-percent methane; carbon dioxide and trace amounts of water and other gases, such ashydrogen sulfide, account for the remaining 35 to 40 percent. It is a medium-Btu fuel that can beused to generate electricity or burned in natural-gas or propane boilers and space heaters. Heat,fertilizer, and soil amendments are coproducts of the digestion process that contribute to itseconomic viability.
In general, with current technologies, anaerobic digesters require warm climates, large volumes ofmanure, high local electricity rates, and daily maintenance and management to be profitable. TheFederal government, through the AgSTAR Program, is promoting biogas production as a way ofgenerating extra income for farmers, reducing greenhouse gasses, and improving water quality.Four case studies demonstrate that farm-level production of biogas is feasible under localconditions.
Keywords: livestock manure, methane, anaerobic digesters, biogas.
Methane-recovery systems and anaerobic digesters first The first comprehensive Federal efforts to improve watergained popularity in the United States during the 1970's. quality were implemented in the early 1970's with theAt the time, alternative energy sources were promoted due passage of the Clean Water Act (CWA). The initial focusto the rising costs of petroleum-based energy. Both state of the CWA was on regulating point sources of pollution,and Federal agencies provided financial assistance to help primarily municipal sewers and industrial plants.construct farm-level, methane-recovery systems. However, Subsequently, agricultural point sources were targeted,many systems were overdesigned and difficult to maintain. including livestock production systems that use manmadeSubsequent failure and/or poor performance of a number structures, such as feed pens, confinement buildings, slurryof anaerobic digesters reduced confidence in these tanks, pipes or culverts, holding ponds, lagoons, irrigationsystems. Since then, improved technology and increased systems, and dead-animal disposal facilities.concern for the environment have renewed interest in thefeasibility and use of methane-recovery systems. Concentrated animal feeding operations (CAFO's) are
considered point-source polluters. Livestock production isManaging Animal Wastes To Minimize Pollution included under the CAFO definition if:
The major problems associated with livestock and poultry · Animals are stabled or confined and fed for 45 daysmanure include: surface water 'and groundwater or more in a 12-month period;contamination from nitrogen and fecal bacteria; methaneemissions from anaerobic digestion of manure; and air · Vegetation is not sustained during the normal growingpollution resulting from the formation of odor, dust, season in any portion of the lot or facility;volatile organic acids, and ammonia.
The feedlot must have either 1,000 animal units anddischarge pollutants, or between 301 and 1,000 animal
Van Dyne is a Research Associate Professor, Department of Agricultural units if pollutants are discharged into navigable watersEconomics. University of Missouri, Columbia, MO. (314) 882-0141; and Weber is through a manmade conveyance or into navigableProgram Manager for Information Projects, National Biodiesel Board, Jefferson waters that originate outside of, but come into contactCity, MO, (314) 635-3893. with, the area used by the operation;
20 Industrial Uses/IUS-4/December 1994

* Pollutants are discharged in absence of a 25-year- The Federal government does not have formal rules orfrequency, 24-hour-duration rain storm (a theoretical regulations regarding methane emissions from agriculture."super storm" as defined for each specific state and However, the AgSTAR program, initiated by EPA'sregion). Global Change Division, is currently assessing the
technical and economic feasibility of capturing methaneSmaller facilities with less than 300 animal units may be for conversion into energy sources for farm use.designated as point-source polluters if they present asignificant risk to water quality by discharging directly Several states account for most of the methane emissionsinto navigable waters through the facility or through a from animals. An EPA study estimated that in 1990manmade conveyance. These facilities are evaluated on a methane emissions from dairy and hog production in thecase-by-case basis, but most are classified as nonpoint United States were 734,000 metric tons and 1.1 millionsources of pollution and face a different set of regulations. metric tons, respectively (table A-i). Emissions from
dairy farms were highest in California, while hog farmLivestock production facilities that are considered point- emissions were high in Missouri, Iowa, Illinois, Northsource polluters must obtain a National Pollutant Carolina, and Indiana.Discharge Elimination System permit as mandated bySection 402 of the CWA. Livestock point sources are Converting Manure into Biogas?regulated by the U.S. Environmental Protection Agency(EPA) or state environmental agencies acting on its behalf. Anaerobic digesters use bacteria to convert manure into
biogas, which is a combination of 60- to 65-percentThe CWA also created a program to control nonpoint methane (CH4), carbon dioxide that accounts for most ofsources (NPS) of pollution and to protect groundwater. the remaining 35 to 40 percent, and trace amounts of otherSection 319 of the act requires each state to submit an gases, such as hydrogen sulfide and ammonia. Theseassessment of state waters not expected to meet water digesters operate under anaerobic conditions and withinquality standards because of nonpoint-source pollution and certain temperature ranges. The methane in biogas cansubmit a management program for controlling such serve as a replacement for natural gas to produce heat orpollution. The NPS program has evolved more slowly electricity. In addition, anaerobic digesters stabilize thethan efforts to control point-source pollution because the remaining manure solids into a nearly odorless productlatter was easier to regulate and more cost-effective to that can be used as a soil amendment and fertilizer.implement. More recently, NPS pollution has receivedadditional attention, and controlling it has typically The potential for anaerobic digestion of animal manure ininvolved implementing best management practices (BMP) the United States depends on the manure handlingrather than enforcing specific regulations. Most BMP's practices used by producers and the size of their operation.include educational, technical, and financial incentives Methods of manure disposal vary widely depending on thedesigned to encourage better land- and resource- type of animal (table A-2). Some practices are moremanagement practices, plus more prudent use of pesticides amenable to biogas production than others. For instance,and fertilizers. manure left by beef cattle on range or pasture is not
economically collectable for anaerobic digestion or otherIn response to these water-pollution regulations, livestockproducers have built containment facilities--such as Table A-1 --Methane emissions from dairy and hoglagoons, ponds, and other types of storage devices--to facilities in selected states, 1990prevent runoff and leaching of nutrients from animal State Emissionsmanure. While the actions have helped to reduce water Metric tons/yearpollution, they have actually increased methane emissions. DairyUnder the anaerobic (oxygen-free) conditions that exist in California 174,978
Texas 63,708the containment facilities, bacteria convert the organic Missouri 54,522matter in manure to methane. Washington 44,031
Wisconsin 22,335Methane released into the atmosphere is a large contributor Other states 374,062to potential global warming, second only to carbon Total 733,636dioxide. Methane is 60 times more effective at trappingheat in the atmosphere than carbon dioxide over a 20 year Missouri 127,050period. Methane concentrations in the atmosphere have Iowa 117,518more than doubled over the last two centuries and continue Illinois 113,213to rise annually. Because methane has a short lifespan in North Carolina 103,261
Indiana 90,224the atmosphere (11 years compared with 120 years for Other states 572,011carbon dioxide), controlling emissions will have a rapid Total 1,123,277impact on mitigating potential climate change (1). Source: (6).
Industrial Uses/IUS-4/December 1994 21

uses. An estimated 90 percent of poultry manure is The simplest anaerobic digester is the lagoon. Manurecollected using solid disposal systems. While most of this progresses naturally through all three chemical stages ofmanure is economically collectable, feathers and certain methane formation. Significant quantities of biogas can betypes of poultry litter can clog anaerobic digesters. produced from a covered lagoon system that is properly
designed and in which the manure is held over 60 daysManure production from a 1,250-pound Holstein milk cow (6). A floating cover is placed over the lagoon and biogasis estimated at 1.75 cubic feet per day (table A-3). Also, is collected underneath the cover. Maximum biogasa sow unit (sow and pigs) is expected to produce a similar generation occurs in the summer, while the rate of gasvolume of manure on a daily basis. Biogas production production decreases with colder temperatures. Some gasfrom a properly functioning anaerobic digester using these can be stored under the cover and used later; however,sources is estimated to range from 54 to 56 cubic feet per long-term storage is not economical.animal per day. The actual volume of biogas will varydepending on the type of manure-collection system. For Plug-flow digesters are designed to accept a daily plug ofinstance, one farmer estimated that, using a flush manure- new manure. As a new plug is added, an equal amount ofhandling system on his farm, manure from one dairy cow effluent is discharged from the opposite end of thewill produce 60 cubic feet of biogas per day, while a digester. The retention time for most plug-flow digestersscrape system will yield up to 85 cubic feet per day. is between 20 and 30 days. Most plug-flow systems are
designed to move manure and effluent by gravity, thusOver 20 private methane-recovery systems are in operation eliminating the need for pumps. In addition, plug-flowacross the United States. An additional six experimental digesters must be designed to prevent the passage of airsystems are housed at various universities (6). Although into the digester when manure is added, as well as whenthere are many different types of digesters that could be effluent is discharged.used by livestock producers, only covered lagoons, plug-flow digesters, and complete-mix digesters are used on Complete-mix digesters are usually constructed forlivestock farms due to capital investment and management livestock operations that generate large amounts of low-requirements. solids manure (6). The basic concept is similar to the
Table A-2--How manure is handled in the United States 1/Livestock Liquid disposal Solid disposaland poultry Anaerobic Liquid Daily Solid Pasture, Litter,type lagoons slurry and spread storage range, and deep pit,
pit storage and drylot paddock and othersPercent
Dairy cattle 10 23 37 23 0 7Nondairy cattle 0 1 0 14 84 1Poultry 2/ 5 4 0 0 1 90Sheep 0 0 0 2 88 10Swine 25 50 0 18 0 6Other 3/ 0 0 0 0 92 81/ Totals may not add due to rounding. 2/ Includes chickens, turkeys, and ducks. 3/ Includes goats, horses, mules, and donkeys.Source: (5, 6).
Table A-3--Manure production from various livestock, and biogas yield from a properly functioning anaerobic digesterAnimal Average Manure Expected Recommended Electricity
animal production 1/ biogas yield retention time production 2/weightPounds Cubic feet/day Cubic feet/animal/day Days kW hours/day/animal
Holstein milking cow 3/ 1,250 1.75 54.00 20 2.00Beef feeder steer 800 1.00 25.00 15 1.00Feeder pig 130 0.16 5.60 15 0.20Sow and litter 4/ 1,300 1.75 56.00 15 2.001/ Solids, liquids, and 15 percent extra volume from waterers and wash water. 2/ Assumes biogas has an energy value of 600 Btu per cubic toot and thegenerator operates at 21 percent overall efficiency. 3/ Increase digester volume by 50 percent if manure from dry cows and replacement stock is added.4/ The average weight of a productive sow and pigs at any time from farrow to finish. A sow produces an average of 16 pigs annually.Source: (3).
22 Industrial Uses/TUS-4/December 1994

plug-flow digester. Animal manure is collected in a Using Biogas on the Farmmixing tank and then transferred to the digester. Becausethe manure is mixed, it creates a good environment for Biogas produced from farm-level, methane-recoverybiogas production. The system does not have a fixed systems is a medium-Btu-content fuel. Technologies existretention time due to the way the manure is added and to remove impurities to produce a higher quality fuel. Themixed. amount of clean-up that is necessary depends on the
composition of the biogas and its intended use. PrimaryIn order to protect the digester and to maintain the objectives of clean-up processes are usually either tonecessary temperatures for biogas production, some remove the corrosive elements (hydrogen sulfide and waterproducers enclose their systems in greenhouses or build vapor) or to remove both the corrosive elements and thosewind fences around them, while others recycle generator elements that dilute the methane level in the biogas and itsheat back to the digester. Greenhouses also can be built heating value (carbon dioxide and nitrogen). Although thenear digesters to use excess heat when needed and carbon removal of sulfur is sometimes recommended to avoiddioxide to stimulate plant growth. excessive engine wear, some methane-recovery systems
have been very successful without cleaning the biogasActual purchase and installation costs for anaerobic before is it used to fuel an engine generator. High-qualitydigesters vary widely. However, costs developed for a oil changed at regular intervals is cheaper and as effective1,000-cow dairy operation in a warm climate give an as sulfur-removing mechanisms.indication of investment required. The estimates--$145,000 for a covered lagoon, $154,000 for a plug-flow Fueling engine generators, boilers, and space heaters aredigester, and $213,000 for a complete-mix system--include the most common farm uses of biogas. Most livestockthe purchase of an engine generator to use the biogas and producers that install an anaerobic-digestion system tothe assumption that 55 percent of the dairy manure will be dispose of animal waste will burn the biogas in an enginecollected and processed. The life expectancy of the generator to meet the farm's electrical demands, producecomplete-mix digester is estimated to be 20 years, while heat and fertilizer, and sell any excess electricity to a localthe others are 15 (2). utility company.
Of the three types of systems, covered lagoons appear to Small engine generators usually convert only 20 to 25be an economical choice for swine and dairy farms in the percent of their fuel, such as biogas, into electricity (3).Southeast and West that use hydraulic flushing for manure A majority of biogas energy is actually converted intocollection and a lagoon system for their waste handling heat. In order to utilize this energy, heat exchangers forsystem (2). Lagoon systems as far north as North the exhaust system and engine coolant are used to recoverCarolina have proven successful in economically 40 to 50 percent of the energy. This heat can be used toproducing biogas for most of the year. A plug-flow- maintain the correct temperatures for anaerobic digestiondigester system is more expensive than a covered lagoon, and other purposes, such as heating water for cleaningbut it still can be economically viable option under certain equipment and facilities.climatic conditions, depending on the value received forthe coproducts of the process (heat, carbon dioxide, and Selling the excess electricity to the local utility companyfertilizer/soil amendments). may involve installing an automatic interrupting device,
which can isolate the farm generator from the utility linesComplete-mix systems have higher capital, operating, and when there is a loss of power by the utility or a fault inmaintenance costs than lagoon or plug-flow digesters the generator's circuitry.(table A-4). Therefore, the complete-mix system isprobably best suited for large livestock operations that are Natural-gas and liquid-propane-gas appliances (boilers andin climates too cold for covered lagoons or those that space heaters) will operate on biogas. However, the lowerhandle manures with low solids content (2). energy density of the biogas results in reduced heat output
(3). In order to maintain necessary levels of heatTable A-4--Characteristics of selected types of generation, relatively inexpensive modifications are
anaerobic digesters sometimes necessary. This is usually done by enlargingDigester process Process Operational Capital Operating the size of the orifice to allow more gas to pass through to
complexity complexity costs costs the appliance. Assuming a 65-percent methane content,Covered lagoon low low low low biogas would require an orifice 1.39 times larger than thePlug flow low low low lowComplete mix medium medium medium medium one for natural gas or 1.72 times larger than the one forSource: (7). propane to maintain a constant temperature.
Industrial Uses/IUS-4/December 1994 23

Barriers to Using Methane-Recovery Systems profitable, and appoint a manager to oversee participationin the program.
There are informational, managerial, and financial barriersto widespread use of methane-recovery systems. Many In return, EPA provides technical support. For example,digesters built during the 1970's failed because of poor producers receive a methane-recovery handbook anddesign, improper maintenance, or low local electricity reference guide for specific livestock-rearing methods andprices (6). While the technical problems have been mostly manure-management strategies. Included in the manualresolved for commercial-sized livestock operations, more are topics such as odor control, technical design, energydemonstrations of successful systems are necessary to applications, economics, case studies, financing options,verify operation on a continuing, dependable, and manure-management principles, and nutrient-managementeconomical basis. strategies. Producers who enroll also have access to a
computer software package that enables them to surveyCareful management is essential to maintaining optimum their facilities, assess energy options and applications, anddigester conditions and output. Although most managers select the most profitable digester. The software willof large livestock operations have little time to devote to generate financial reports that allow managers to compareother activities, anaerobic digestion and electricity the economics of a present waste-management system withgeneration is an additional enterprise that must be looked a methane-recovery system. AgSTAR will also manageafter on a regular basis. Unlike the 1970's, however, high-visibility demonstration projects and provide atoday's technologies require less management. The directory of participants.problems that must be dealt with include variablequantities and qualities of manure, inadequate heat What Are the Economics?maintenance, and buildup of nondegradable materials indigesters. Livestock producers and dairy farmers must deal with
disposing of animal waste products, including manure.The main financial barriers that exist for livestock Anaerobic digestion of animal manures can makeproducers interested in methane-recovery systems are economic sense for farmers in some cases when they areinitial design and installation costs, limited access to used to generate electricity, heat, fertilizers, and soilcapital, and low buy-back rates for the electricity from amendments for farm use. Using digesters to producelocal utilities. methane to sell off-farm does not make sense because the
gas is not pure enough for natural gas companies and thereAgSTAR Promotes Use of Digesters is no pipeline collection system in place. Electricity
generated in excess of a farm's needs often can be soldThe goal of the AgSTAR program is to help livestock and into the local electric power grid. Prices received varydairy producers lower capital, operational, and from a low of 3 cents per kilowatt hour to a high of 15maintenance costs; control odor and methane emissions; cents. The variation is due to different local rates, themaintain water quality; and utilize a renewable domestic need for additional electricity in the region, the need forenergy source--by encouraging more widespread use of enhanced environmental quality, and other factors.methane-recovery systems. In addition to EPA, USDAand the U.S. Department of Energy are also involved in Producing biogas solely for electricity generation requiresthe program. AgSTAR is considered a key component of rates greater than 6.5 cents per kilowatt hour. ValuesPresident Clinton's Climate Change Action Plan, which associated with coproducts enhance the economicpromotes U.S. ingenuity and efficiency as solutions to feasibility of any system, especially when rates are belowglobal warming. 6.5 cents. Society must also recognize the importance of
reducing methane emissions, controlling odor, improvingAgSTAR, a voluntary program, was designed to help water quality, and generating rural economic activity.producers overcome obstacles to adoption. Once fullyoperational, it will have three components: the Partner A recent study evaluated covered lagoons, plug-flowProgram, the Ally Program, and the Utility Program (4). digesters, and complete-mix systems using threeThe Ally and Utility Programs are aimed at people who investment strategies: net present value, internal rate ofdesign, promote, build, sell, and install manure digesters. return, and simple payback period (2). In many cases,EPA will work with utilities, universities, private firms, covered lagoons were found to have an economicand others to promote reliable methane-recovery systems, advantage due to lower capital, operating, and maintenanceprovide information, and develop financing mechanisms. costs. However, lagoons are usually limited to relatively
warm regions. Moreover, the results are sensitive to localThe Partner Program encourages livestock producers to electricity prices and coproduct values.investigate the viability of constructing and implementinga methane-recovery system. To become an AgSTAR Most analyses suggest that only larger livestock operationspartner, a producer signs a Memorandum of Understanding would be able to economically justify a methane-recoverywith EPA. The producer agrees to survey his/her system. Most dairies require at least 500 head of milkingfacilities, install AgSTAR-selected technology where cows and most swine operations require at least 2,000 to
24 Industrial Uses/IUS-4/December 1994

3,000 head for a methane-recovery system to be emphasized the importance of maintaining the specificeconomically viable (based on 1993 electricity prices, an herd population for which the digesters were designed. Heaverage milking cow weight of 1,400 pounds, and an does not clean his biogas prior to use, and the three engineaverage hog weight of 138 pounds) (6). generators have operated for several years with normal
wear and no unexpected operational problems.Although a major portion of U.S. milk productionoriginates in the northern Midwest, the dairies there have Langerwerf Dairy, Durham, CA, is a family-ownedrelatively small herds. Combined with the cold climate, operation with a 500-head dairy cow herd and 300 acresthese operations are generally not the best candidates for of cropland. In 1982, they installed a plug-flow digestermanure digesters. Opportunities exist, however, for large to produce electricity, hot water, composted solids, anddairies in California, Arizona, Texas, and Florida and liquid fertilizer. The decision was based on the risingemerging large-scale operations in New Mexico and costs of energy and the problems and costs associated withKansas. manure disposal. The annual cleanout of the existing
manure lagoon was costing from $10,000 to $15,000.Similar circumstances exist for swine herds. A majorityof hogs in the United States are raised in Iowa, Illinois, Manure is scraped from the dairy barns daily andIndiana, Missouri, and North Carolina. Most of the hogs deposited into a 20,000-gallon mix/holding tank. Theraised in Iowa, Missouri, and Indiana come from small mixed manure is pumped from the tank to the anaerobicherds. However, large increases in hog numbers by a few digester, which holds 225,000 gallons. The collection bagvertically integrated hog producers in North Carolina, can store about one-third of a day's biogas production.Arkansas, and Missouri are rapidly changing the structure They now have a greenhouse over the digester to protectof the hog industry, which could make anaerobic digestion the top from weather and wind damage.more feasible.
The biogas is piped through a filter before reaching theCase Studies Show Methane-Recovery engine generator set. The filter removes most of the waterSystems Can Be Profitable and hydrogen sulfide. The engine/generator set is a 85-
kilowatt (kW), induction-type generator powered by a six-While the technical and economic feasibility of biogas cylinder Caterpillar 3306 natural-gas engine. The engineproduction is site specific and highly dependent on system was modified to run on lower Btu biogas. The generatormanagement, the following case studies provide produces, on average, 40 kW of electricity per day. Theinformation on several livestock operations that have been dairy uses about 35 kW and the excess is sold to the localsuccessfully producing biogas. utility. Waste heat from the engine's cooling system and
exhaust are used to provide hot water for the dairy andMason Dixon Farms, Gettysburg, PA, is a 2,700-head help maintain the temperature of the digester.dairy cow operation. The owner built his first anaerobicdigester in 1979 when the operation had 600 cows. As the The effluent is pumped to a vibrating screen that separatesherd expanded, a system. Allnd three digesters awere locatdded to the solids and liquids. The solids are sold to landscaping
underground, which allows for a relative constant digester businesses, used as a soil amendment, or spread as atemperature through the year, thus minimizing weather- bedding material for dairy cows in the freestall barn.related problems. The owner expanded the digestion Liquids are applied to cropland as a source of fertilizer.system because he found that anaerobic digestion was a The liquid effluent remaining after the anaerobic processprofitable way to handle animal waste. has very little smell, which reduces the potential for odor
problems in a densely populated area.In addition to generating electricity, odor reduction is avery important characteristic of the digesters because the The system requires about a half an hour of labor eachfarm is located near populated areas. The nitrogen in day. The Langerwerfs experienced premature enginemanure is in the form of ammonia, which is very volatile. problems when they first started their system and had toDuring the digestion process, the ammonia changes to rebuild the engine after 5,000 hours of operation, wellammonium nitrate, which is more stable. The owner also short of the normal 24,000 hours. Since then, they haveuses the system's liquid effluent as a fertilizer for cropland changed the type of engine lube oil. Testing after 6,000and sells the remaining solids to area nurseries as a soil hours showed engine wear to be within normal limits.amendment. The pH level of this farm's manure is around4.5, but the digested effluent has a pH level of 7.3 to 7.5. The total installed cost, including site improvements andTherefore, liming the cropland is no longer necessary. repair costs in the first couple of years, was $203,800. An
8-year economic analysis of this system shows a total costThe owner has invested $250,000 (1991 dollars) in the for capital, interest, labor, and maintenance to besystem. After considering maintenance costs, the value of $324,968. Some of the credit was obtained on preferentialgenerated electricity, and the effluent, the net annual terms. Total income for those 8 years was estimated to beincome from the system is around $90,000 per year. He $692,900. The annual return on investment without
Industrial Uses/lUS-4/December 1994 25

considering tax credits is almost 30 percent and over 50 Mason-Dixon-Farms case study proves, cold-weatherpercent when tax credits are included. operations are both possible and profitable. In the case
studies, producers were able to recoup their initialRoyal Farms, Tulare, CA, is an 8,000-head, farrow-to- investment in equipment and facilities in about 3 years.finish hog farm. About 2.5 tons of manure solids are While this is an excellent return on investment forremoved from the barns each day by flushing the agricultural enterprises, such a rate should not be expectedconfinement houses with water. The water-flush system for all installations.uses 50-percent new water and 50-percent recycled water.The manure slurry is pumped into an anaerobic lagoon After a system has been properly designed and installed,system. The biogas that is produced fuels a 75-kW engine management of the enterprise is the key to success.generator. The electricity produced is used on the farm, Producers must be willing to devote to the system the timewith the excess sold to the Southern California Edison and effort required to assure continued profitableCompany. operation.
The initial capital investment was $89,000. First-year Referencesrevenue from the electricity was about $36,000. Thepayback period for the system was about 3 years. 1. Hogan, Kathleen B., editor. Anthropogenic Methane
Emissions in the United States: Estimates for 1990,Harlan Keener, Lancaster, PA, owns a sow farrow-to- EPA 430-R-93-003. U.S. Environmental Protectionfinish operation. He added a manure digester in 1984 Agency, Washington, DC, April 1993.when he expanded from 600 sows to the current 990.Potential problems with the laws regulating odor emitted 2. Lusk P. Methane Recoveryfrom Animal Manures: Afrom his confinement system prompted Mr. Keener to reconstruct an anaerobic digester for his operation. Current Opportunities Casebook, Volume 1. Prepared
for the National Renewable Energy Laboratory byManure is moved by a sump pump from the confinement Resource Development Associates, Washington, DC,houses to two mixing pits, each of which can hold up to 1994.25,000 gallons of animal waste. Twice a day, the manureslurry is pumped into the digester. The digestion process 3. Parsons, Robert A. On-Farm Biogas Production.takes 18 to 23 days, depending on conditions. A heavy Northeast Regional Agricultural Engineering Service,rubberized tarp that covers the 350,000-gallon digester Cooperative Extension, Cornell University, Ithaca,collects the biogas, which is then piped into the generator. NY, 1984.Keener's system produces an average of 125 kW on acontinuous basis and can be used to supply the farm's 4. Roos, Kurt. "The AgSTAR Program: Energy forelectrical needs or sold to the local utility company. The Pollution Prevention." Paper presented at the Secondeffluent contains 1-percent solids and is stored in a
Environmentally Sound Agriculture Conference,concrete holding tank or two holding ponds until it is used Orlando FL April 20-22 1994.by area farmers as fertilizer for their cropland.
Conclusions 5. Safley, Jr., L.M. and P.D. Lusk. Low TemperatureAnaerobic Digester. North Carolina Department of
The production of biogas by anaerobic digestion of manure Economic and Community Development, Energywill reduce methane emissions into the atmosphere if the Division, Raleigh, NC, 1992.gas is collected and used for heating or to generateelectricity. While technical barriers that occurred during 6. U.S. Environmental Protection Agency. Opportunitiesthe 1970's have largely been overcome, economic viability to Reduce Anthropogenic Methane Emissions in theof farm-level methane-recovery systems depends on the United States, EPA 430-R-93-012. Washington, DC,size of livestock operation, management capabilities, and October 1993.the value of the biogas products. Livestock producersacross the United States have profitably used all three 7. Whittier J. S. Haase R. Milward G. Churchill, M.B.types of digestion systems--covered lagoon, plug flow, andcomplete mix. While the case studies have been Searles, M. Moser, D. Swanson, and G. Morgan.successful and generated high rates of return, other "Energy Conversion of Animal Manures: Feasibilitysystems have failed because of poor design and inadequate Analysis for Thirteen Western States" Proceedings ofmanagement. the First Annual Biomass Conference of the Americas,
Burlington, VT, August 30-September 2, 1993.Much of the current interest in anaerobic digesters is from National Renewable Energy Laboratory, Golden, CO,large operations in milder climates. However, as the 1993, pp. 112-123.
26 Industrial Uses/lUS-4/December 1994
Special Article
Pulping Catalysts from Lignin
by
Joseph J. Bozell, Donald R. Dimmel, and Arthur J. Power'
Abstract: Lignin, a common material in trees and woody plants, is currently a byproduct of pulpand paper production. However, joint research at the National Renewable Energy Laboratory andthe Institute of Paper Science and Technology is aimed at broadening commercial uses of lignin.One project is assessing the potential of converting lignin into anthraquinone-like pulping catalysts.Anthraquinone (AQ) improves kraft pulping, but its cost, which ranges from $4.00 to $4.50 perpound, hinders widespread use.
Three processes for converting lignin into pulping catalysts were evaluated for their technical andeconomic feasibility. Preliminary results indicate that two of the processes appear viable.Amortized production costs for using lignin from kraft pulping, without intermediate conversionto vanillin and syringaldehyde, and lignin from organosolv pulping were estimated to be $1.24 and79 cents per pound, respectively. Comparing these two processes to competing petrochemical-based, AQ-producing methods, showed that the lignin-based routes were potentially the most costeffective.
Keywords: Lignin, pulping catalysts, anthraquinone, kraft pulping, organosolv pulping.
Lignin, the material in trees and woody plants that fuel during recovery of the pulping chemicals. The kraftdifferentiates them from herbaceous plants, is one of the method is widely used because it rapidly separates themost underused renewable sources of carbon. In nature, wood components, can utilize different types of wood,lignin makes up as much as 30 percent of the carbon in produces a strong pulp for paper manufacture, and has loworganic matter (1). Lignin, cellulose, and hemicellulose chemical costs.are the three major components found in wood.
However, the kraft process also has a number ofHowever, lignin, a byproduct of pulp and paper shortcomings. The pulp yield is relatively low and theproduction, is now used primarily as in-plant fuel. pulp is highly colored, requiring extensive bleaching. TheCommercial operations for isolating and converting the sodium sulfide contributes to the odor given off from kraftlignin from pulp mills to other materials are limited. Joint pulp mills. Plus, mandatory environmental safeguards andresearch at the National Renewable Energy Laboratory recovery of the pulping chemicals requires high capital(NREL) and the Institute of Paper Science and Technology investment.(IPST) is aimed at broadening the commercial uses oflignin as a chemical feedstock and converting it into A possible solution to several of these disadvantages wasuseful, higher value compounds such as pulping catalysts. discovered in 1977 with the report that adding small
amounts of anthraquinone (AQ) significantly improves theAnthraquinone Can Improve Kraft Pulping efficiency of the pulping process (2). This discovery has
since become one of the most widely studied effects inRoughly 80 percent of the paper made in the United States paper chemistry (3). Many advantages of adding AQ tois produced using the kraft pulping process. Wood is pulping processes have been reported:heated with a base and sodium sulfide, which helpsseparate the wood components. The kraft process * The rate of separation increases. This can result inproduces a cellulose fraction, which is made into paper, either a faster rate of pulp production with the sameand a fraction containing the lignin, which is burned as amount of pulping chemicals used or lower chemical
use at the same rate of production.
' Bozell is a Senior Chemist with the National Renewable Energy Laboratory, * The effects of AQ are seen with very low amounts.Golden, CO, (303) 384-6276; Dimmel is a Professor of wood chemistry at the A significant increase in component separationInstitute of Paper Science and Technology, Atlanta, GA, (404) 853-9705; and Poweris President of Arthur J. Power and Associates, Boulder, CO, (303) 275-2979 or occurs with as little as 0.01 percent by weight (based(303) 440-7216. on the starting weight of the wood) of added AQ (4).
Industrial Uses/IUS-4/December 1994 27

An effect has even been observed when waste streams The research, supported by the U.S. Department offrom AQ-catalyzed pulping reactions are recycled into Energy's Office of Industrial Technologies, focuses onsubsequent pulping runs (5). both the scientific and economic aspects of
commercializing a process that uses lignin as a feedstock.· Kraft pulp is bleached to remove residual lignin not Since its inception, the program has been driven by three
separated during initial pulping. AQ has been key factors: the process must be inexpensive,suggested as a key component in the development of environmentally benign, and fit well with existing pulpingnew processes that pulp wood for longer periods of technology. The NREL-IPST approach to the synthesis oftime to remove greater amounts of lignin. In the past, pulping catalysts from lignin is divided into two stages:such processes resulted in unacceptable decreases in lignin processing and chemical processing.the yield and strength of the pulp. In the presence ofAQ, however, yield and strength are maintained even The lignin processing stage involves selectively isolatingduring long-term pulping runs. These new processes a low-molecular-weight (LMW) fraction from lignin (11).decrease the amount of residual lignin in the pulp and, In theory, whole lignin could be used directly in thethus, reduce the amount of bleaching needed to obtain subsequent chemical-processing stage. However, chemicala bright, white pulp (6). reactions occur within the lignin component during and
after pulping that result in a mixture of polymeric and· Kraft pulping currently uses relatively high levels of oligomeric materials of widely differing molecular
sodium sulfide. AQ can replace sodium sulfide and weights. From an economic perspective, using wholefacilitate an evolution from high-sulfur (kraft) to low- lignin is unattractive because it would increase chemicalor nonsulfur processes. Nonsulfur pulping does not costs (12). It would also be difficult from an operationalhave the bad odors associated with kraft pulping. The standpoint because of the heterogeneity of the mixture.disadvantage of nonsulfur/AQ pulping is that pulp
Therefore, LMW lignins are isolated to serve as startingstrength is reportedly lower than for simple kraft . Two methods for separating this LMW fractiong. .r rmaterials. Two methods for separating this LMW fractionpulping. However, recent research aims to overcomeg ( have been evaluated: extraction using conventionalthis disadvantage (7).
solvents and extraction using supercritical carbon dioxide
All of these advantages may not occur simultaneously, but in the presence of small amounts of organic solvents (13).they can provide economic benefits to mill operators andlessen the potential for air and water pollution (3). The second stage of the process, chemical processing of
the LMW fraction, involves two steps. First, the LMWMaking AQ From Lignin lignin is oxidized to give a mixture of benzoquinones
(intermediate chemicals whose structure makes up the coreDespite the reported advantages of AQ-catalyzed pulping, of AQ). Second, the benzoquinones are converted tothe current cost of AQ, which ranges from $4.00 to $4.50 pulping catalysts by adding chemicals with the appropriateper pound, hinders its general use, except under certain number of carbons. AQ-like materials are formed duringcircumstances. For example, where wood costs are high, the second reaction, but the final product is a mixture ofsuch as in Japan, pulping yields take on greater importance different compounds that show activity as pulpingand AQ-type processes are common. As part of the. catalysts. For example, isoprene is used in the reactionNREL-IPST program, scientists have been investigating because the AQ derivative obtained, dimethylanthra-ways to prepare AQ or AQ-like pulping catalysts at a cost quinone, has been shown to be twice as active as AQ inlow enough to make it attractive for general industry use pulping studies.and have found lignin to be a suitable startingmaterial (8-10). Three Base Cases Were Analyzed
Lignin has a number of attractive features as a rawmaterial for AQ production. It is inexpensive (3 to 4 centsconomic evaluation of the various stages of theper pound when used for fuel) and is readily available as technoeconomc evaluaton of the varous stages of thea byproduct from the paper industry. A variety of process. Three base-case scenarios were prepared as adifferent lignin sources are available. The NREL-IPST starting point for the analysis. Two were based on the useeffort is directed primarily at converting lignin from the of kraft lignin as a starting material and one was based onkraft process to pulping catalysts because it is the organosolv lignin. Once the base cases were established,dominant U.S. technology. The program also is it became possible to ask various "what-if' questions andinvestigating the use of organosolv lignin (lignin separated probe the sensitivity of production costs as a function offrom wood using organic solvents) as a starting material, different operating parameters.because it exhibits some chemical-property advantagesover kraft lignin. However, its availability is much lower The primary difference among the cases is in the ligninthan kraft lignin. processing stage. In the first kraft case, LMW lignin is
28 Industrial Uses/IUS-4/December 1994

isolated and then converted to pulping catalysts as outlined material and operating costs were based on technicalabove. The second kraft-based approach modifies the first specifications and current input costs.by eliminating the isolation of a LMW lignin fraction.Instead, the lignin is converted using known commercial The initial economic evaluation gave several interestingtechnology to a crude mixture of two known compounds, conclusions. First, the base case producing pulpingvanillin and syringaldehyde (V/S). The V/S mixture is catalysts from an intermediate V/S mixture did notthen treated with the same two-step chemical processing compare favorably with the other two processes, becausesequence as the first base case. This approach was of a high projected amortized production cost of slightlyevaluated because laboratory results indicated that V/S greater than $4 per pound (figure B-l). In contrast, bothcould be converted to benzoquinone more efficiently than the kraft case (without the intermediate V/S step) and theLMW lignin. However, producing vanillin from lignin is organosolv case appear viable, with amortized productiona low-yield, expensive process that takes place under costs of $1.24 and 79 cents per pound, respectively (tablessevere conditions. This base case probes whether the B-2 and B-3).lower efficiency in the V/S production step can be offsetby greater efficiency in the conversion to pulping catalyst. An analysis was also made of competing methods that
could be used to make AQ to see how a lignin-based routeThe organosolv case uses lignin produced by solvent would fit into the market. Five petrochemical-basedfractionation of lignocellulose, followed by the two-step processes--using styrene, naphthalene, benzene, phthalicchemical conversion into pulping catalysts. Isolating a anhydride, and anthracene--were identified from the openLMW fraction is not necessary in this case because and patent literature. All five are, or have been, used fororganosolv lignin tends to be lower in molecular weight commercial AQ synthesis and were judged to be the mostthan kraft lignin. serious competitors to the lignin-based process. The
analysis calculated total raw material costs for eachThe analysis, which is commonly known as preliminary process, with estimated values for utilities, operating costs,chemical-process design, involves a number of steps: and capital charges based on similar processes. The usual
detailed work on preliminary process designs, capital andDrawing a flow diagram for each base case, operating cost estimates, and profitability calculations wasCalculating the material balance, not done. The approximate results, however, are goodCalculating the energy balance, enough to rank the processes on potential sales priceEstimating equipment sizes, (figure B-2). The lignin-to-AQ route was potentially theEstimating capital costs, most cost effective of all those analyzed.Estimating operating costs,Evaluating the economics and potential profitability, Further Technical RefinementsDefining and evaluating variations of the base cases, Yield Additional ProgressandDeveloping conclusions and recommendations. A number of lignin processing techniques to separate the
LMW fractions have been examined. Recent resultsThe degree of detail in each step can vary considerably, indicate that simple solvent extraction of either kraft orusually depending on the availability and quality of basic organosolv lignin provides significant amounts of LMWprocess-chemistry information. Approximate, short-cut material that can be converted to benzoquinones in thedesign and costing methods are used because they chemical processing stage. Supercritical fluid extraction,conserve time and are more than adequate to identify areas using carbon dioxide and a small amount of organicfor further research or more detailed calculations. solvent, has been used to remove LMW lignin from
Results Favor Processes That Use Non-V/S pulping liquor (13). While the selectivity for LMW ligninwas good, the yield was low.
Kraft Lignin and Organosolv Lignin
A number of oxidizing agents have been studied for use inThe initial evaluation of the three base cases wasperformed using several key technical assumptions (table the first step of the chemical processing stage. Initially,
B-1), which are based on small-scale laboratory research. hydrogen peroxide was examined. It has a number ofThe analysis, conducted Arthur J. Power and Associates, attractive features; it is inexpensive, environmentallywas based on a hypothetical, new production plant and benign, and well established in the chemical and paperfacilities located in the southeastern United States during industries. However, early research generated low yieldsthe third quarter of 1994, which could produce 19.3 of benzoquinones. In contrast, more recent work indicatesmillion pounds of pulping catalysts per year. Capital costs that both kraft LMW and organosolv lignin can bewere based on process design, material and energy oxidized to benzoquinones using hydrogen peroxide and abalances, and major equipment specifications. Raw catalyst.
Industrial Uses/IUS-4/December 1994 29
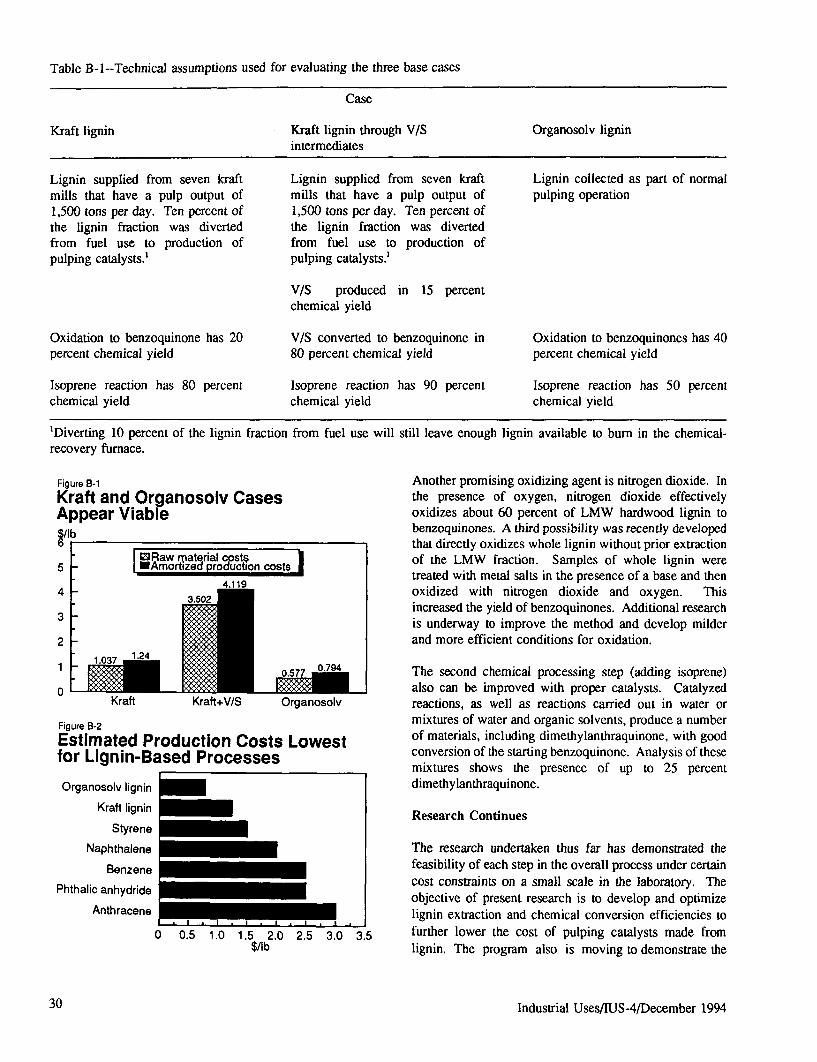
Table B-l--Technical assumptions used for evaluating the three base cases
Case
Kraft lignin Kraft lignin through V/S Organosolv ligninintermediates
Lignin supplied from seven kraft Lignin supplied from seven kraft Lignin collected as part of normalmills that have a pulp output of mills that have a pulp output of pulping operation1,500 tons per day. Ten percent of 1,500 tons per day. Ten percent ofthe lignin fraction was diverted the lignin fraction was divertedfrom fuel use to production of from fuel use to production ofpulping catalysts.' pulping catalysts.'
V/S produced in 15 percentchemical yield
Oxidation to benzoquinone has 20 V/S converted to benzoquinone in Oxidation to benzoquinones has 40percent chemical yield 80 percent chemical yield percent chemical yield
Isoprene reaction has 80 percent Isoprene reaction has 90 percent Isoprene reaction has 50 percentchemical yield chemical yield chemical yield
'Diverting 10 percent of the lignin fraction from fuel use will still leave enough lignin available to burn in the chemical-recovery furnace.
Figure B-1 Another promising oxidizing agent is nitrogen dioxide. InKraft and Organosolv Cases the presence of oxygen, nitrogen dioxide effectivelyAppear Viable oxidizes about 60 percent of LMW hardwood lignin to
benzoquinones. A third possibility was recently developedthat directly oxidizes whole lignin without prior extraction
5 :aw r;mate rial csts of the LMW fraction. Samples of whole lignin were5 "Amortlzeo proouctlon coststreated with metal salts in the presence of a base and then
4 oxidized with nitrogen dioxide and oxygen. Thisincreased the yield of benzoquinones. Additional researchis underway to improve the method and develop milder
2 and more efficient conditions for oxidation.
1.0370.7941 .57 0.794 The second chemical processing step (adding isoprene)o aft = I also can be improved with proper catalysts. Catalyzed
Kraft Kraft+V/S Organosolv reactions, as well as reactions carried out in water orFigure B-2 mixtures of water and organic solvents, produce a numberEstimated Production Costs Lowest of materials, including dimethylanthraquinone, with goodfor Lignin-Based Processes conversion of the starting benzoquinone. Analysis of these
mixtures shows the presence of up to 25 percentOrganosolv lignin dimethylanthraquinone.
Kraft lignin- Research Continues
Styrene
Naphthalene The research undertaken thus far has demonstrated theBenzene feasibility of each step in the overall process under certain
n e cost constraints on a small scale in the laboratory. Theobjective of present research is to develop and optimize
Anthracene lignin extraction and chemical conversion efficiencies to
0 0.5 1.0 1.5 2.0 2.5 3.0 3.5 further lower the cost of pulping catalysts made from$/lb lignin. The program also is moving to demonstrate the
30 Industrial Uses/IUS-4/December 1994

Table B-2--Costs of producing pulping catalysts from kraft LMW lignin in a hypothetical, new 19.3-million-poundproduction plant and facilities in the southeastern United States, third quarter 1994
Item Units used Cost per Total Annual cost perper year unit annual cost pound of productionPounds Dollars Thousand dollars Dollars
Production costs:Raw materials--
LMW lignin 1/ 57,592,000 0.180 10,367 0.537Methanol 13,520,000 0.100 1,352 0.070Oxygen 1,237,000 0.025 31 0.002Nitric oxide 3,552,000 0.300 1,066 0.055Isoprene 25,264,000 0.285 7,200 0.373
Total raw material costs 20,015 1.037
Utilities--Kilowatt hours
Electric power 787,200 0.035 28
Million pounds
Steam 2/ 110,900 3.900 433
Million gallons
Cooling water 1,344,000 0.060 81Total utility costs 542 0.028
Operating costs and expenses--Workers
Operating labor 12 28,700 344Foremen 4 32,500 130Supervisor 1 40,000 40Direct overhead 3/ 1 325Maintenance 4/ 275General plant overhead 5/ 513Insurance and property taxes 6/ 132
Total operating costs and expenses 1,760 0.091
Total cash cost of production 22,317 1.156
Annual capital charges 7/ 1,610 0.083
Total amortized manufacturing cost 23,927 1.2401/Cost of 18 cents per pound based on the fuel value of the contained organics in the kraft black liquor plus processing costs. 2/ 150 pounds-per-square-inch gauge. 3/ 45 percent of operating labor costs plus supervision (foremen and supervisor) costs. 4/ 4 percent of inside-battery-limit costs.5/65 percent of operating costs. 6/ 1.5 percent of total fixed investment ($8,794,000). 7/15 percent of total utilized investment ($10,735,600) per year.
Industrial Uses/IUS-4/December 1994 31
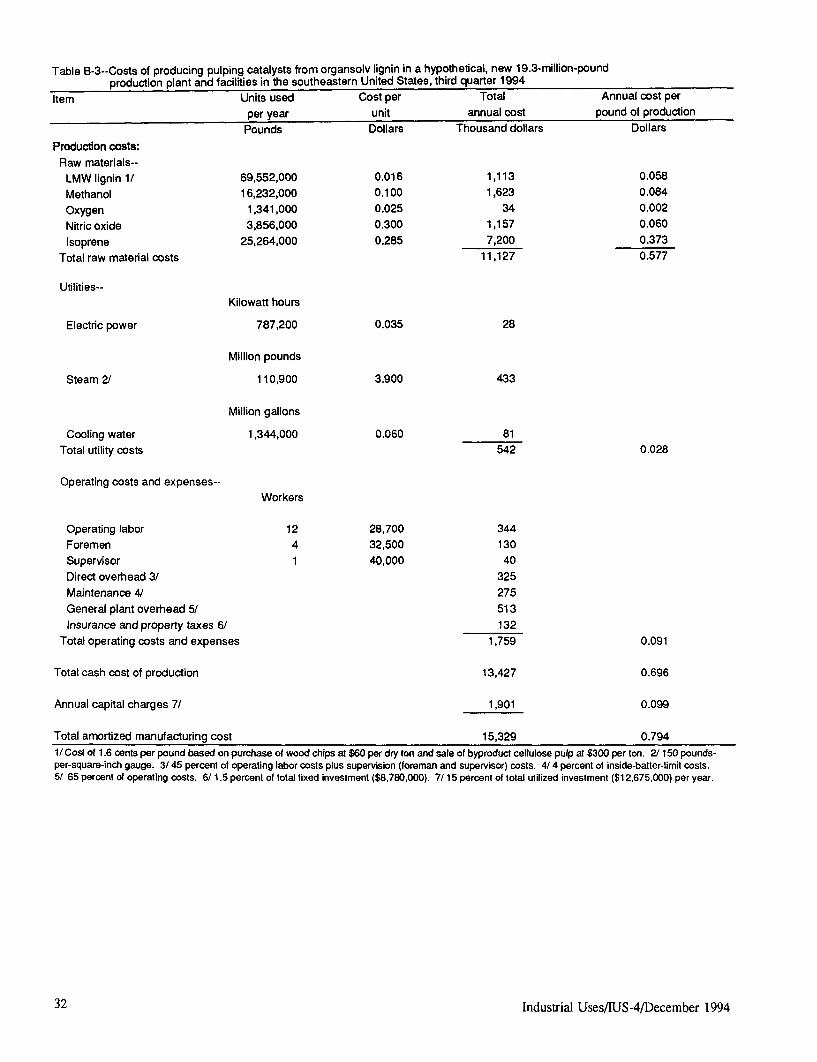
Table B-3--Costs of producing pulping catalysts from organsolv lignin in a hypothetical, new 19.3-million-poundproduction plant and facilities in the southeastern United States, third quarter 1994
Item Units used Cost per Total Annual cost perper year unit annual cost pound of productionPounds Dollars Thousand dollars Dollars
Production costs:Raw materials--
LMW lignin 1/ 69,552,000 0.016 1,113 0.058Methanol 16,232,000 0.100 1,623 0.084
Oxygen 1,341,000 0.025 34 0.002Nitric oxide 3,856,000 0.300 1,157 0.060Isoprene 25,264,000 0.285 7,200 0.373
Total raw material costs 11,127 0.577
Utilities--Kilowatt hours
Electric power 787,200 0.035 28
Million pounds
Steam 2/ 110,900 3.900 433
Million gallons
Cooling water 1,344,000 0.060 81Total utility costs 542 0.028
Operating costs and expenses--Workers
Operating labor 12 28,700 344Foremen 4 32,500 130Supervisor 1 40,000 40Direct overhead 3/ 325Maintenance 4/ 275General plant overhead 5/ 513Insurance and property taxes 6/ 132
Total operating costs and expenses 1,759 0.091
Total cash cost of production 13,427 0.696
Annual capital charges 7/ 1,901 0.099
Total amortized manufacturing cost 15,329 0.7941/Cost of 1.6 cents per pound based on purchase of wood chips at $60 per dry ton and sale of byproduct cellulose pulp at $300 per ton. 2/150 pounds-per-square-inch gauge. 3/45 percent of operating labor costs plus supervision (foreman and supervisor) costs. 4/4 percent of inside-batter-limit costs.5/ 65 percent of operating costs. 6/ 1.5 percent of total fixed investment ($8,780,000). 7/15 percent of total utilized investment ($12,675,000) per year.
32 Industrial Uses/IUS-4/December 1994

successful results of the laboratory research on a larger 5. K. Goel, A.M. Ayroud, and B. Branch.scale, with the goal of producing between 1.0 and 1.5 "Anthraquinone in Kraft Pulping." TAPPI, Vol. 63,pounds of an active pulping catalyst mixture. An No. 8, 1980, pp. 83-85.important component of the near-term work will be testingthe catalyst mixtures under actual pulping conditions. 6. L. Lowendahl. and 0. Samuelson. "Carbohydrate
Stabilization During Kraft Cooking with Addition ofPreparation of AQ and other pulping catalysts from lignin Anthraquinone." Svensk Papperstidning, Vol. 80,looks to be a promising new direction for lignin use. 1977, pp. 549-551.However, it is only one possible material that potentiallycan be produced from lignin. In the future, the NREL- 7. R.C. Eckert, G.O. Pfeiffer, M.K. Gupta, and C.R.IPST program may be expanded to evaluate the production Lower. "Soda Anthraquinone Pulping of Douglasof other lignin-derived, high-value chemicals. Fir." TAPPI, Vol. 67, No. 11, 1984, pp. 104-108.
Acknowledgments 8. J.C. Wozniak, D.R. Dimmel, and E.W. Malcolm.
"The Generation of Quinones From Lignin andThe authors wish to acknowledge the other members ofthe research team. From IPST: Mr. Patrick Van Vreede Lignin-Related Compounds." Journal of Wood(technician), Mr. David von Oepen (graduate student), Dr.Mohammad Karim (postdoctoral fellow), and Dr. Earl 9 J.C. Wozniak D.R. Dimmel and E.W Malcolm.Malcolm (research division director). From NREL: Dr. "DielsAlder Reactions of Lignin Derived Quinones."
"Diels-Alder Reactions of Lignin Derived Quinones."Helena Chum (manager of the Industrial Technologies Journal of Wood Chemistry and Technology, Vol. 9,Journal of Wood Chemistry and Technology, Vol. 9,Division), Dr. Gene Petersen (Program Manager, Industrial
Programs), Ms. Bonnie Hames (staff member and graduate 1989, pp. 513-5student), and Dr. David Johnson (senior chemist).
10. J.C. Wozniak, D.R. Dimmel, and E.W. Malcolm.References "Lignin Derived Quinones as Pulping Additives."
Journal of Wood Chemistry and Technology, Vol. 9,
1. D. Fengel and G. Wegener. "Chemical Composition 1989, pp. 535-548.and Analysis of Wood." Wood: Chemistry,
and Analysis of Wood." Wood: Chemistry, 11. H.L. Chum and G. Filardo. "Fractionation of BlackUltrastructure, Reactions. Walter de Gruyter, NewYork, NY, 1989 pp. 56-58. Liquor Components and Similar Mixtures with
Supercritical Carbon Dioxide and Entrainers." U.S.
2. H.H. Holton. "Major New Process: Soda Additive Patent 4,964,995. 1990.
Pulping of Softwoods. " Pulp and Paper Canada, Vol. 12. A.J. Power, J.J. Bozell, and H.L. Chum. Preliminary
78, 1977, T218-T223 Feasibility Study of Pulping Catalyst Production FromLignin, DOE/CH/10093-T19. Department of Energy,
3. T.J. Blain. "Anthraquinone Pulping: Fifteen Years November 1989.Later." TAPPI, Vol. 76, No. 3, 1993, pp. 137-146.(A good description of the benefits of AQ-catalyzed 13. D.K. Johnson, H.L. Chum, and G. Filardo. "Somepulping in actual mill operations.) Aspects of Supercritical Carbon Dioxide Extractions,
with Entrainers, of Black Liquor Components."4. T.J. Fullerton and A.J. Kerr. "Practical Aspects of Proceedings of the 1989 International Symposium on
Kraft-AQ Pulping of Pinus Radiata." Appita, Vol. 35, Wood and Pulping Chemistry, Vol 1. TAPPI Press,1981, pp. 135-139. Atlanta, GA, 1989, p. 325.
Industrial Uses/IUS-4/December 1994 33
List of Tables
Table Page
1. Industrial uses of corn, 1990/91-1994/95 ................................................ 92. Typical compositions of meadowfoam, rapeseed, crambe, and soybean oils ...................... 113. Total fats and oils consumption, with inedible by category, United States, 1986/87-93 ................ 354. Castor oil consumption, with inedible by category, United States, 1986/87-93 ...................... 355. Coconut oil consumption, with inedible by category, United States, 1986/87-93 ..................... 356. Edible tallow consumption, with inedible by category, United States, 1986/87-93 ................. 357. Inedible tallow consumption, with inedible by category, United States, 1986/87-93 .................. 368. Lard consumption, with inedible by category, United States, 1986/87-93 ......................... 369. Linseed oil consumption, with inedible by category, United States, 1986/87-93 ..................... 36
10. Palm oil consumption, with inedible by category, United States, 1986/87-93 ....................... 3611. Rapeseed oil consumption, with inedible by category, United States, 1989/90-93 .................... 3712. Soybean oil consumption, with inedible by category, United States, 1986/87-93 ..................... 3713. Tall oil consumption, with inedible by category, United States, 1986/87-93 ................ 3714. Vegetable oil foots consumption, with inedible by category, United States, 1986/87-93 ................ 3715 Linseed oil, U.S. imports, by country .................................................. 3816. Linseed oil, U.S. exports, by country .................. ........................... 3817. Castor oil, U.S. imports, by country ................................................... 3818. Castor oil, U.S. exports, by country ................................................... 3819. Tung oil, U.S. imports, by country .................................................... 3820. Tung oil, U.S. exports, by country .................................................... 3821. Jojoba oil, U.S. imports, by country ................................................. 3822. Jojoba oil, U.S. exports, by country .................................................. 3823. Peat, U.S. imports, by country ...................................................... 3924. Peat, U.S. exports, by country ...................................................... 3925. Flax, raw or retted, U.S. imports, by country ............................................. 3926. Flax, raw or retted, U.S. exports, by country ............................................. 3927. Flax, broken, scutched, hackled or otherwise processed, but not spun, U.S. imports, by country .......... 3928. Flax, broken, scutched, hackled or otherwise processed, but not spun, U.S. exports, by country .......... 3929. Flax tow and waste, U.S. imports, by country ............................................ 3930. Flax tow and waste, U.S. exports, by country ........................................... 3931. Cattle hides, whole, fresh or wet-salted, U.S. imports, by country ............................... 4032. Cattle hides, whole, fresh or wet-salted, U.S. exports, by country ............................... 4033. Sheep or lamb skins, wool-on, U.S. imports, by country ..................................... 4034. Sheep or lamb skins, wool-on, U.S. exports, by country ..................................... 4035. Bovine upper leather, whole, without hair, U.S. imports, by country ............................. 4036. Bovine lining leather, whole, without hair, U..S. imports, by country ............................ 4037. Bovine upper leather, whole, without hair, U.S. exports, by country ............................. 4038. Sheep or lamb skin leather, without wool, U.S. imports, by country ............................. 4039. Sheep or lamb skin leather, without wool, U.S. exports, by country ............................. 4140. Swine leather, without hair, U.S. imports, by country ....................................... 4141. Swine leather, without hair, U.S. exports, by country ....................................... 4142. Newsprint, in rolls or sheets, U.S. imports, by country ................................. 4143. Newsprint, in rolls or sheets, U.S. exports, by country ...................................... 4144. Kraftliner, uncoated, bleached, in rolls or sheets, U.S. exports, by country ......................... 4145. Kraftliner, uncoated, bleached, in rolls or sheets, U.S. imports, by country ........................ 4146. Kraftliner, uncoated, unbleached, in rolls or sheets, U.S. imports, by country ....................... 4147. Kraftliner, uncoated, unbleached, in rolls or sheets, U.S. exports, by country ....................... 4248. Sack kraft paper, uncoated, bleached, in rolls or sheets, U.S. exports, by country ................... . 4249. Sack kraft paper, uncoated, bleached, in rolls or sheets, U.S. imports, by country .................... 4250. Sack kraft paper, uncoated, unbleached, in rolls or sheets, U.S. imports, by country ................. 4251. Sack kraft paper, uncoated, unbleached, in rolls or sheets, U.S. exports, by country .................. 4252. Natural rubber latex, whether or not prevulcanized, U.S. imports, by country ....................... 4253. Natural rubber latex, whether or not prevulcanized, U.S. exports, by country ....................... 42
34 Industrial Uses/rIUS-4/December 1994

Table 3--Total fats and oils consumption, with inedible by category, United States, 1986/87-93Total Total Total Paint or Resins and Fatty Other
Year 1/ consumption edible inedible Soap varnish Feed plastics Lubricants 2/ acids products--Million pounds--
1986/87 d d 5,990.6 d d d d d d d1987/88 20,241.2 14,175.5 6,065.7 868.6 179.1 1,967.6 196.3 107.8 2,203.8 542.81988/89 19,426.7 13,542.0 5,884.7 744.5 180.3 2,079.3 202.3 115.8 2,074.1 488.41989/90 20,036.0 14,382.7 5,653.3 792.0 89.5 2,143.5 222.4 157.1 1,944.7 304.11991 20,332.1 14,613.0 5,719.1 832.9 106.8 1,974.0 182.6 101.7 2,234.7 286.41992 20,751.7 14,847.3 5,904.4 738.8 123.8 2,176.5 165.5 109.4 2,041.2 549.31993 21,590.4 15,744.7 5,845.7 748.5 125.2 2,199.5 170.2 116.0 1,897.6 588.7d = Data withheld to avoid disclosing figures for individual companies.1/ Crop year runs from October 1 to September 30. Annual totals reported on a calendar year basis beginning in 1991. 2/ Includes similar oils.Source: Bureau of Census.
Table 4--Castor oil consumption, with inedible by category, United States, 1986/87-93Total Total Total Paint or Resins and Fatty Other
Year 1/ consumption edible inedible Soap varnish Feed plastics Lubricants 2/ acids products--Million pounds--
1986/87 70.4 0.0 70.4 d 4.6 0.0 4.2 5.6 d 53.81987/88 74.6 0.0 74.6 d 4.3 0.0 4.8 6.1 d 59.01988/89 59.2 0.0 59.2 d 4.8 0.0 4.5 6.2 0.0 43.21989/90 51.4 0.0 51.4 d 5.9 0.0 4.0 5.7 0.0 d1991 46.0 0.0 46.0 d 5.9 0.0 4.0 d 0.0 31.71992 41.3 0.0 41.3 d d 0.0 3.3 3.5 0.0 28.41993 54.2 0.0 54.2 d d 0.0 3.5 2.8 0.0 37.8d = Data withheld to avoid disclosing figures for individual companies.1/ Crop year runs from October 1 to September 30. Annual totals reported on a calendar year basis beginning in 1991. 2/ Includes similar oils.Source: Bureau of Census.
Table 5--Coconut oil consumption, with inedible by category, United States, 1986/87-93Total Total Total Paint or Resins and Fatty Other
Year 1/ consumption edible inedible Soap varnish Feed plastics Lubricants 2/ acids products--Million pounds--
1986/87 858.2 319.4 538.8 216.1 d 0.0 d d 95.7 d1987/88 788.6 233.4 555.4 213.8 d 0.0 7.2 d 131.4 d1988/89 688.8 211.2 477.6 130.6 1.4 d 14.6 d 121.9 206.61989/90 525.2 160.6 364.6 156.9 2.1 0.0 9.7 4.0 134.6 57.31991 815.6 153.0 662.6 158.0 d d 2.4 d 426.7 72.81992 875.4 176.3 699.1 121.7 d 0.0 3.2 d d d1993 936.3 218.0 718.3 132.0 d 0.0 3.1 d d dd = Data withheld to avoid disclosing figures for individual companies.1/ Crop year runs from October I to September 30. Annual totals reported on a calendar year basis beginning in 1991. 2/ Includes similar oils.Source: Bureau of Census.
Table 6--Edible tallow consumption, with inedible by category, United States, 1986/87-93Total Total Total Paint or Resins and Fatty Other
Year 1/ consumption edible inedible Soap varnish Feed plastics Lubricants 2/ acids products--Million pounds--
1986/87 979.2 910.6 68.6 d 0.0 0.0 d d d d1987/88 954.3 863.6 90.5 d 0.0 0.0 d d d d1988/89 923.3 779.2 144.1 d 0.0 d d d d d1989/90 846.4 706.3 140.1 113.9 0.0 d d d d d1991 611.8 463.1 148.7 d 0.0 d d d d d1992 595.0 429.3 165.7 d 0.0 d d d d d1993 562.1 408.9 153.2 d 0.0 d d d d dd = Data withheld to avoid disclosing figures for individual companies.1/ Crop year runs from October 1 to September 30. Annual totals reported on a calendar year basis beginning in 1991. 2/ Includes similar oils.Source: Bureau of Census.
Industrial Uses/IUS-4/December 1994 35

Table 7--Inedible tallow consumption, with inedible by category, United States, 1986/87-93Total Total Total Paint or Resins and Fatty Other
Year 1/ consumption edible inedible Soap varnish Feed plastics Lubricants 2/ acids products--Million pounds--
1986/87 3,040.9 0.0 3,040.9 543.6 0.0 1,698.9 0.0 70.3 693.6 35.11987/88 3,137.8 0.0 3,137.8 502.0 0.0 1,820.3 0.0 69.9 712.6 33.01988/89 3,086.7 0.0 3,086.7 374.9 0.0 1,925.4 0.0 70.3 680.0 36.11989/90 3,219.0 0.0 3,219.0 398.4 0.0 1,982.9 0.0 109.0 684.0 44.71991 2,949.3 0.0 2,949.3 391.5 0.0 1,748.4 0.0 59.6 700.9 48.91992 3,050.1 0.0 3,050.1 334.4 0.0 1,954.4 0.0 63.2 659.0 39.11993 3,018.2 0.0 3,018.2 299.6 0.0 1,994.7 0.0 71.5 615.1 37.3d = Data withheld to avoid disclosing figures for individual companies.1/Crop year runs from October 1 to September 30. Annual totals reported on a calendar year basis beginning in 1991. 2/ Includes similar oils.Source: Bureau of Census.
Table 8--Lard consumption, with inedible by category, United States, 1986/87-93Total Total Total Paint or Resins and Fatty Other
Year 1/ consumption edible inedible Soap varnish Feed plastics Lubricants 2/ acids products--Million pounds--
1986/87 301.2 240.9 60.3 d 0.0 d 0.0 6.2 d d1987/88 347.5 280.3 66.9 d 0.0 d 0.0 8.4 d d1988/89 389.9 324.5 65.4 0.0 0.0 d 0.0 d d d1989/90 369.3 303.8 65.5 d 0.0 d 0.0 9.1 d d1991 393.1 313.8 79.3 0.0 0.0 d 0.0 5.7 d 4.11992 479.7 345.0 134.6 0.0 0.0 d 0.0 10.9 d 13.51993 473.3 324.6 149.7 0.0 0.0 d 0.0 8.6 d 28.7d = Data withheld to avoid disclosing figures for individual companies.1/ Crop year runs from October 1 to September 30. Annual totals reported on a calendar year basis beginning in 1991. 2/ Includes similar oils.Source: Bureau of Census.
Table 9--Linseed oil consumption, with inedible by category, United States, 1986/87-93Total Total Total Paint or Resins and Fatty Other
Year 1/ consumption edible inedible Soap varnish Feed plastics Lubricants 2/ acids products--Million pounds--
1986/87 280.8 0.0 280.8 0.0 187.6 0.0 d d d d1987/88 159.3 0.0 159.3 0.0 85.5 0.0 31.0 d d 40.51988/89 154.9 0.0 154.9 0.0 101.6 0.0 23.1 d d 28.21989/90 110.5 0.0 110.5 0.0 30.3 d 52.5 d d 23.81991 95.8 0.0 95.8 0.0 40.7 0.0 41.6 d d 12.71992 154.4 0.0 154.4 0.0 69.0 0.0 31.3 d d d1993 125.8 0.0 125.8 0.0 66.9 0.0 25.4 d d dd = Data withheld to avoid disclosing figures for individual companies.1/ Crop year runs from October 1 to September 30. Annual totals reported on a calendar year basis beginning in 1991. 2/ Includes similar oils.Source: Bureau of Census.
Table 10--Palm oil consumption, with inedible by category, United States, 1986/87-93Total Total Total Paint or Resins and Fatty Other
Year 1/ consumption edible inedible Soap varnish Feed plastics Lubricants 2/ acids products--Million pounds--
1986/87 317.9 278.7 39.2 d d d d d d d1987/88 242.6 197.5 45.1 d d d d d d d1988/89 247.0 203.8 43.2 d 0.0 d d 0.0 d d1989/90 177.7 124.0 53.7 d 0.0 d 0.0 d d d1991 d d d d 0.0 d 0.0 d d d1992 220.5 108.1 112.4 d 0.0 d 0.0 d 40.6 3.61993 192.3 76.2 116.1 d 0.0 d 0.0 d 37.2 5.3d = Data withheld to avoid disclosing figures for individual companies.1/ Crop year runs from October 1 to September 30. Annual totals reported on a calendar year basis beginning in 1991. 2/ Includes similar oils.Source: Bureau of Census.
36 Industrial Uses/IUS-4/December 1994

Table 11--Rapeseed oil consumption, with inedible by category, United States, 1989/90-93 1/Total Total Total Paint or Resins and Fatty Other
Year 2/ consumption edible inedible Soap varnish Feed plastics Lubricants 2/ acids products--Million pounds--
1989/90 d 265.0 d 0.0 d d d d d d1991 d 285.1 d 0.0 0.0 d 0.0 d d d1992 d 360.5 d 0.0 0.0 d 0.0 d d d1993 d 362.5 d 0.0 0.0 0.0 0.0 d d dd = Data withheld to avoid disclosing figures for individual companies.1/ Includes both canola and industrial rapeseed. 2/ Crop year runs from October 1 to September 30. Annual totals reported on a calendar year basisbeginning in 1991. 3/ Includes similar oils.Source: Bureau of Census.
Table 12--Soybean oil consumption, with inedible by category, United States, 1986/87-93Total Total Total Paint or Resins and Fatty Other
Year 1/ consumption edible inedible Soap varnish Feed plastics Lubricants 2/ acids products--Million pounds--
1986/87 10,512.2 10,212.7 299.5 d 63.2 d 109.2 d d 65.31987/88 10,714.5 10,429.1 285.3 2.7 54.1 d 106.1 d d 72.31988/89 9,917.6 9,635.8 281.8 1.5 34.9 d 123.7 d d 68.21989/90 10,808.3 10,536.7 271.6 d 38.2 d 112.4 d d 52.41991 11,267.7 10,966.7 301.0 d 49.2 d 104.7 d d 40.41992 11,471.6 11,168.7 302.8 d 43.5 22.3 94.0 5.9 d 69.81993 12,495.6 12,200.9 294.7 d 38.7 23.7 98.1 5.8 d 65.8d = Data withheld to avoid disclosing figures for individual companies.1/Crop year runs from October 1 to September 30. Annual totals reported on a calendar year basis beginning in 1991. 2/ Includes similar oils.Source: Bureau of Census.
Table 13--Tall oil consumption, with inedible by category, United States, 1986/87-93Total Total Total Paint or Resins and Fatty Other
Year 1/ consumption edible inedible Soap varnish Feed plastics Lubricants 2/ acids products--Million pounds--
1986/87 1,227.0 0.0 1,227.0 12.2 d 0.0 15.7 12.9 1,152.6 19.21987/88 1,269.4 0.0 1,269.4 16.8 23.3 0.0 20.9 9.6 1,181.1 17.81988/89 1,234.3 0.0 1,234.3 8.3 31.8 0.0 18.0 8.1 1,157.3 10.81989/90 1,024.7 0.0 1,024.7 8.4 7.4 0.0 21.7 7.1 969.9 10.21991 940.0 0.0 940.0 3.5 5.4 0.0 11.6 4.0 906.5 9.01992 883.5 0.0 883.5 d d 0.0 19.4 7.0 841.8 11.41993 891.8 0.0 891.8 d d 0.0 23.0 6.3 806.9 dd = Data withheld to avoid disclosing figures for individual companies.1/ Crop year runs from October 1 to September 30. Annual totals reported on a calendar year basis beginning in 1991. 2/ Includes similar oils.Source: Bureau of Census.
Table 14--Vegetable oil foots consumption, with inedible by category, United States, 1986/87-93Total Total Total Paint or Resins and Fatty Other
Year 1/ consumption edible inedible Soap varnish Feed plastics Lubricants 2/ acids products--Million pounds--
1986/87 94.9 0.0 94.9 d d d d d d d1987/88 91.1 0.0 91.1 d d 74.3 d d d d1988/89 87.5 0.0 87.5 d d 72.7 d d d d1989/90 100.1 0.0 100.1 d d 81.7 d d d d1991 148.8 0.0 148.8 d 0.0 131.4 d d d d1992 134.9 0.0 134.9 d 0.0 120.2 0.0 d d d1993 132.5 0.0 132.5 d 0.0 116.8 0.0 d d dd = Data withheld to avoid disclosing figures for individual companies.1/ Crop year runs from October 1 to September 30. Annual totals reported on a calendar year basis beginning in 1991. 2/ Includes similar oils.Source: Bureau of Census.
Industrial Uses/IUS-4/December 1994 37

Table 15--Linseed oil, U.S. imports, by country 1/ Table 19--Tung oil, U.S. imports by country 1/Exporting country 1993 Jan-Aug 94 Average Exporting country 1993 Jan-Aug 94 Average
--Kilograms-- --Kilograms--
Canada 151,998 186,566 169,282 Argentina 2,136,530 1,036,240 1,586,385West Germany 2,600 2,394 2,497 China 546,146 430,616 488,381
Other 30,400 15,200 22,800
Total 154,598 188,960 171,7791/Crude and refined, not chemically modified. Total 2,713,076 1,482,056 2,097,566Source: Bureau of Census, Department of Commerce. 1/ Whether or not refined, not chemically modified.
Source: Bureau of Census, Department of Commerce.
Table 16--Linseed oil, U.S. exports, by country 1/Importing country 1993 Jan-Aug 94 Average
--Kilograms-- Table 20--Tung oil, U.S. exports by country 1/Importing country 1993 Jan-Aug 94 Average
Canada 1,458,076 951,897 1,204,987 --Kilograms--Mexico 639,484 223,815 431,650Brazil 272,610 0 136,305 Canada 168,927 88,338 128,633South Korea 176,545 57,456 117,001 Mexico 102,039 54,862 78,451Belize 97,710 130,155 113,933 Other 19,764 0 9,882France 0 185,170 92,585Australia 129,600 51,445 90,523 Total 290,730 143,200 216,966Japan 135,470 10,137 72,804 1/Whether or not refined, not chemically modified.Other 148,357 118,150 133,254 Source: Bureau of Census, Department of Commerce.
Total 3,057,852 1,728,225 2,393,0391/ Crude and refined, not chemically modified.Source: Bureau of Census, Department of Commerce.
Table 21 --Jojoba oil, U.S. imports, by country 1/Table 17--Castor oil, U.S. imports, by country 1/ Exporting country 1993 Jan-Aug 94 AverageExporting country 1993 Jan-Aug 94 Average --Kilograms--
--Kilograms--Mexico 121,448 132,045 126,747
India 32,046,325 27,521,479 29,783,902 Canada 18,155 4,906 11,531Ecuador 4,070,548 2,776,522 3,423,535 Other 2,830 0 1,415Brazil 5,906,259 359,780 3,133,020Other 49,342 42,864 46,103 Total 142,433 136,951 139,693
1/ Whether or not refined, not chemically modified.Total 42,072,474 30,700,645 36,386,560 Source: Bureau of Census, Department of Commerce.
1/ Crude and refined, not chemically modified.Source: Bureau of Census, Department of Commerce.
Table 22--Jojoba oil, U.S. exports, by country 1/Table 18--Castor oil, U.S. exports, by country 1/ Importing country 1993 Jan-Aug 94 AverageImporting country 1993 Jan-Aug 94 Average --Kilograms--
--Kilograms--West Germany 197,382 104,908 151,145
Mexico 452,427 659,502 555,965 Japan 91,220 59,675 75,448Canada 636,138 434,360 535,249 France 40,210 23,595 31,903Other 125,178 88,458 106,823 Other 13,999 15,790 14,897
Total 1,213,743 1,182,320 1,198,037 Total 342,811 203,968 273,3931/ Crude and refined, not chemically modified. 1/ Whether or not refined, not chemically modified.Source: Bureau of Census, Department of Commerce. Source: Bureau of Census, Department of Commerce.
38 Industrial Uses/IUS-4/December 1994
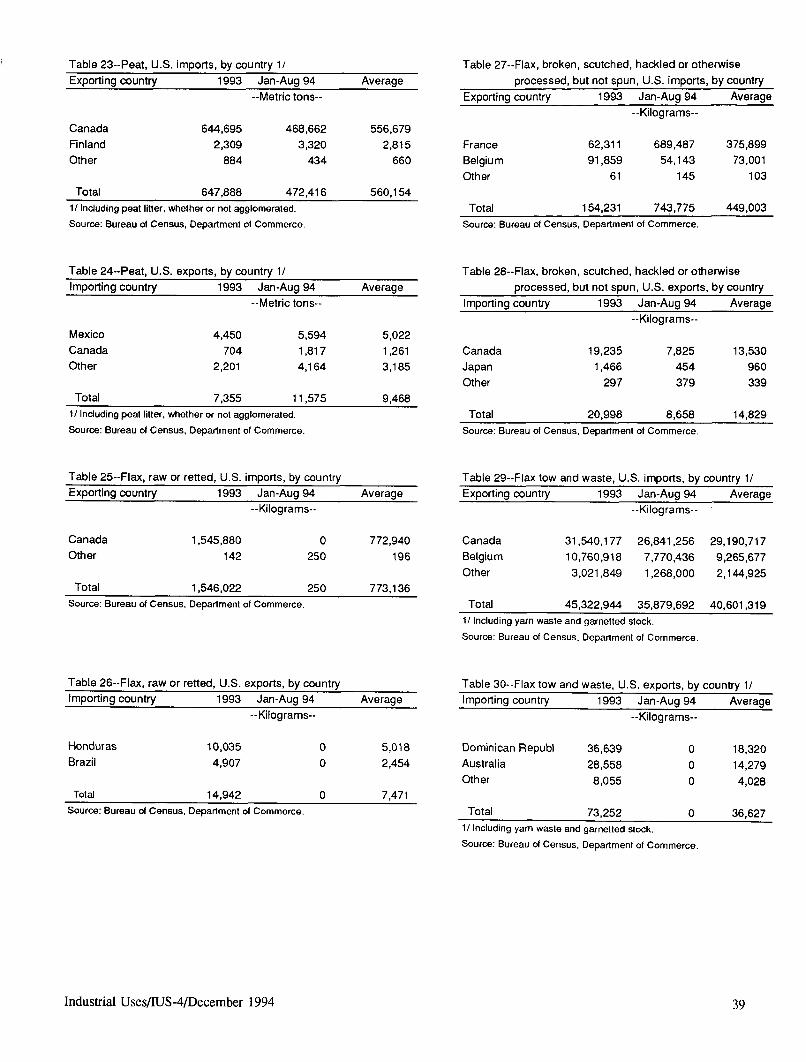
Table 23--Peat, U.S. imports, by country 1/ Table 27--Flax, broken, scutched, hackled or otherwiseExporting country 1993 Jan-Aug 94 Average processed, but not spun, U.S. imports, by country
--Metric tons-- Exporting country 1993 Jan-Aug 94 Average--Kilograms--
Canada 644,695 468,662 556,679Finland 2,309 3,320 2,815 France 62,311 689,487 375,899Other 884 434 660 Belgium 91,859 54,143 73,001
Other 61 145 103Total 647,888 472,416 560,154
1/ Including peat litter, whether or not agglomerated. Total 154,231 743,775 449,003Source: Bureau of Census, Department of Commerce. Source: Bureau of Census, Department of Commerce.
Table 24--Peat, U.S. exports, by country 1/ Table 28--Flax, broken, scutched, hackled or otherwiseImporting country 1993 Jan-Aug 94 Average processed, but not spun, U.S. exports, by country
--Metric tons-- Importing country 1993 Jan-Aug 94 Average--Kilograms--
Mexico 4,450 5,594 5,022Canada 704 1,817 1,261 Canada 19,235 7,825 13,530Other 2,201 4,164 3,185 Japan 1,466 454 960
Other 297 379 339Total 7,355 11,575 9,468
1/ Including peat litter, whether or not agglomerated. Total 20,998 8,658 14,829Source: Bureau of Census, Department of Commerce. Source: Bureau of Census, Department of Commerce.
Table 25--Flax, raw or retted, U.S. imports, by country Table 29--Flax tow and waste, U.S. imports, by country 1/Exporting country 1993 Jan-Aug 94 Average Exporting country 1993 Jan-Aug 94 Average
--Kilograms-- --Kilograms--
Canada 1,545,880 0 772,940 Canada 31,540,177 26,841,256 29,190,717Other 142 250 196 Belgium 10,760,918 7,770,436 9,265,677
Other 3,021,849 1,268,000 2,144,925Total 1,546,022 250 773,136
Source: Bureau of Census, Department of Commerce. Total 45,322,944 35,879,692 40,601,3191/ Including yarn waste and garnetted stock.Source: Bureau of Census, Department of Commerce.
Table 26--Flax, raw or retted, U.S. exports, by country Table 30--Flax tow and waste, U.S. exports, by country 1/Importing country 1993 Jan-Aug 94 Average Importing country 1993 Jan-Aug 94 Average
--Kilograms-- --Kilograms--
Honduras 10,035 0 5,018 Dominican Republ 36,639 0 18,320Brazil 4,907 0 2,454 Australia 28,558 0 14,279
Other 8,055 0 4,028Total 14,942 0 7,471
Source: Bureau of Census, Department of Commerce. Total 73,252 0 36,6271/ Including yarn waste and garnetted stock.Source: Bureau of Census, Department of Commerce.
Industrial Uses/IUS-4/December 1994 39

Table 31--Cattle hides, whole, fresh or wet-salted, Table 35--Bovine upper leather, whole, without hair,U.S. imports, by country U.S. imports, by country 1/
Exporting country 1993 Jan-Aug 94 Average Exporting country 1993 Jan-Aug 94 Average--Pieces-- --Square meters--
Canada 1,481,122 1,038,928 1,260,025 Argentina 429,499 42,265 235,882Mexico 85,185 62,765 73,975 Brazil 24,765 41,406 33,086Ireland 21,020 0 10,510 France 24,444 25,405 24,925Finland 8,286 0 4,143 Mexico 31,173 2,401 16,787Other 11,324 1,520 6,423 Other 14,115 11,498 12,807
Total 1,606,937 1,103,213 1,355,076 Total 523,996 122,975 323,486Source: Bureau of Census, Department of Commerce. 1/ With a surface area not exceeding 2.6 square meters.
Source: Bureau of Census, Department of Commerce.
Table 32--Cattle hides, whole, fresh or wet-salted, Table 36--Bovine lining leather, whole, without hair,U.S. exports, by country U.S. imports, by country 1/
Importing country 1993 Jan-Aug 94 Average Exporting country 1993 Jan-Aug 94 Average--Pieces-- --Square meters--
South Korea 7,851,241 5,004,486 6,427,864 Brazil 284,477 172,768 228,623Japan 4,167,324 2,086,950 3,127,137 Kenya 49,213 15,444 32,329Mexico 2,035,137 1,038,194 1,536,666 Bangladesh 24,122 24,908 24,515Other 1,796,688 1,685,047 902,978 Other 11,131 21,743 16,439
Total 15,850,390 9,814,677 11,994,645 Total 368,943 234,863 301,906Source: Bureau of Census, Department of Commerce. 1/ With a surface area not exceeding 2.6 square meters.
Source: Bureau of Census, Department of Commerce.
Table 33--Sheep or lamb skins, wool-on, U.S. imports, Table 37--Bovine upper leather, whole, without hair,by country 1/ U.S. exports, by country 1/
Exporting country 1993 Jan-Aug 94 Average Importing country 1993 Jan-Aug 94 Average--Pieces-- --Square meters--
Mexico 99,169 19,444 59,307 Hong Kong 5,586,120 281,514 2,933,817Canada 69,411 46,720 58,066 Dom. Republic 2,660,528 531,373 1,595,951Australia 28,107 57,782 42,945 West Germany 1,861,526 14,043 937,785Other 26 6,150 3,088 South Korea 1,115,223 52,463 583,843
Other 4,072,025 199,899 2,135,969Total 196,713 130,096 163,406
1/ Fresh, salted, dried, limed, pickled, or otherwise perserved but not tanned. Total 15,295,422 1,079,292 8,187,365Source: Bureau of Census, Department of Commerce. 1/ With a surface area not exceeding 2.6 square meters.
Source: Bureau of Census, Department of Commerce.
Table 34--Sheep or lamb skins, wool-on, U.S. exports, Table 38--Sheep or lamb skin leather, without wool,by country 1/ U.S imports, by country 1/
Importing country 1993 Jan-Aug 94 Average Exporting country 1993 Jan-Aug 94 Average--Pieces-- --Square meters--
Italy 327,300 225,244 276,272 France 8,658 14 4,336South Korea 251,462 65,089 158,276 Italy 1,032 915 974Mexico 231,330 34,356 132,843 Mexico 415 1,461 938France 152,441 53,857 103,149Other 161,823 114,448 138,138 Total 10,105 2,390 6,248
1/ Vegetable pretanned.Total 1,124,356 492,994 808,678 Source: Bureau of Census, Department of Commerce.
1/ Fresh, salted, dried, limed, pickled, or otherwise perservedbut not tanned.Source: Bureau of Census, Department of Commerce.
40 Industrial Uses/IUS-4/December 1994

Table 39--Sheep or lamb skin leather, without wool, Table 43--Newsprint, in rolls or sheets, U.S. exports,U.S. exports, by country 1/ by country
Importing country 1993 Jan-Aug 94 Average Importing country 1993 Jan-Aug 94 Average--Square meters-- --Metric tons--
South Korea 10,453 0 5,227 Japan 293,136 192,295 242,716Italy 4,602 0 2,301 Mexico 129,636 113,008 121,322Mexico 3,288 0 1,644 Malaysia 57,626 49,539 53,583Chile 0 2,702 1,351 Hong Kong 51,631 32,236 41,934Other 1,604 0 802 South Korea 41,469 12,842 27,156
China 34,841 7,987 21,414Total 19,947 2,702 11,325 Other 142,283 81,439 111,873
1/ Vegetable pretanned.Source: Bureau of Census, Department of Commerce. Total 750,622 489,346 619,998
Source: Bureau of Census, Department of Commerce.Table 40--Swine leather, without hair, U.S. imports,
by country Table 44--Kraftliner, uncoated, bleached, in rolls or sheets,Exporting country 1993 Jan-Aug 94 Average U.S. exports, by country
--Square meters-- Importing country 1993 Jan-Aug 94 Average--Kilograms--
China 511,501 163,558 337,530Japan 485,066 168,442 326,754 Mexico 2,421,621 833,448 1,627,535West Germany 156,155 22,364 89,260 Japan 2,234,768 318,116 1,276,442Hong Kong 107,128 35,543 71,336 Canada 1,559,739 26,000 792,870Mexico 35,173 10,754 22,964 Colombia 1,281,751 55,759 668,755Czech Republic 19,336 8,678 14,007 Ecuador 54,393 1,050,851 552,622Other 40,226 25,113 32,670 Guatemala 607,682 72,331 340,007
Egypt 629,368 0 314,684Total 1,354,585 434,452 894,519 China 0 614,191 307,096
Source: Bureau of Census, Department of Commerce. Other 2,082,694 723,788 1,403,244
Table 41--Swine leather, without hair, U.S. exports, Total 10,872,016 3,694,484 7,283,255by country Source: Bureau of Census, Department of Commerce.
Importing country 1993 Jan-Aug 94 Average--Square meters--
Table 45--Kraftliner, uncoated, bleached, in rolls or sheets,Dom. Republic 1,445,887 1,207,698 1,326,793 U.S. imports, by countryCanada 1,109,962 628,187 869,075 Exporting country 1993 Jan-Aug 94 AverageChile 811,182 374,837 593,010 --Kilograms--Hong Kong 581,819 397,020 489,420Costa Rica 499,207 356,615 427,911 Canada 85,895,507 79,629,158 82,762,333Mexico 236,928 345,525 291,227 Finland 338,403 3,007,655 1,673,029Other 781,968 602,802 692,389 Other 699 1,000 850
Total 5,466,953 3,912,684 4,689,825 Total 86,234,609 82,637,813 84,436,212Source: Bureau of Census, Department of Commerce. Source: Bureau of Census, Department of Commerce.
Table 42--Newsprint, in rolls or sheets, U.S. imports, Table 46--Kraftliner, uncoated, unbleached, in rolls or sheets,by country U.S. imports, by country
Exporting country 1993 Jan-Aug 94 Average Exporting country 1993 Jan-Aug 94 Average--Metric tons-- --Kilograms--
Canada 6,922,007 4,597,585 5,759,796 Canada 108,941,364 70,759,640 89,850,502Finland 19,011 8,698 13,855 West Germany 2,186,396 78,881 1,132,639Other 3,182 1,362 2,272
Total 111,127,760 70,838,521 90,983,141Total 6,944,200 4,607,645 5,775,923 Source: Bureau of Census, Department of Commerce.
Source: Bureau of Census, Department of Commerce.
Industrial Uses/IUS-4/December 1994 41

Table 47--Kraftliner, uncoated, unbleached, in rolls or sheets, Table 51--Sack kraft paper, uncoated, unbleached, in rolls orU.S. exports, by country sheets, U.S. exports, by country
Importing country 1993 Jan-Aug 94 Average Importing country 1993 Jan-Aug 94 Average--Kilograms-- --Kilograms--
Hong Kong 322,342,833 256,939,948 289,641,391 Canada 13,646,514 9,048,215 11,347,365China 246,361,063 197,393,439 221,877,251 Malaysia 8,590,525 9,359,630 8,975,078Ecuador 158,093,595 120,648,832 139,371,214 Japan 7,929,609 5,084,465 6,507,037Costa Rica 165,928,301 105,506,654 135,717,478 Indonesia 4,962,792 2,496,831 3,729,812Italy 130,325,345 115,812,812 123,069,079 Hong Kong 2,013,112 1,195,879 1,604,496Canada 155,779,694 89,755,772 122,767,733 China 176,027 2,645,983 1,411,005West Germany 134,249,686 92,857,743 113,553,715 Guatemala 994,029 1,659,294 1,326,662Other 689,464,245 542,891,990 616,178,118 Other 3,748,274 6,205,734 4,977,004
Total 2,002,544,762 1,521,807,190 1,762,175,976 Total 42,060,882 37,696,031 39,878,457Source: Bureau of the Census. Source: Bureau of the Census.
Table 48--Sack kraft paper, uncoated, bleached, in rolls or Table 52--Natural rubber latex, whether or not prevulcanized,sheets, U.S. exports, by country U.S. imports, by country
Importing country 1993 Jan-Aug 94 Average Exporting country 1993 Jan-Aug 94 Average--Kilbgrams-- --Kilograms--
Mexico 3,879,270 3,015,682 3,447,476 Malaysia 35,036,281 19,849,945 27,443,113Canada 3,950,000 2,553,000 3,251,500 Indonesia 28,524,147 16,912,442 22,718,295Iran 499,230 699,880 599,555 Guatemala 2,649,454 1,711,473 2,180,464Argentina 0 802,323 401,162 Other 667,532 110,933 389,234Other 614,075 931,476 772,779
Total 66,877,414 38,584,793 52,731,106Total 8,942,575 8,002,361 8,472,472 Source: Bureau of Census, Department of Commerce.
Source: Bureau of Census, Department of Commerce.
Table 53--Natural rubber latex, whether or not prevulcanized,Table 49--Sack kraft paper, uncoated, bleached in rolls or U.S. exports, by country
sheets, U.S. imports, by country Importing country 1993 Jan-Aug 94 AverageExporting country 1993 Jan-Aug 94 Average --Kilograms--
--Kilograms--Mexico 1,241,693 2,072,599 1,657,146
Finland 61,805 132,824 97,315 Canada 1,882,458 533,465 1,207,962Canada 82,184 85,622 83,903 Japan 893,141 877,916 885,529Other 13,200 9,224 11,212 Italy 720,700 205,121 462,911
Argentina 515,928 257,599 386,764Total 157,189 227,670 192,430 Hong Kong 260,811 140,973 200,892
Source: Bureau of Census, Department of Commerce. Belgium 355,087 19,086 187,087Other 702,514 548,142 625,335
Table 50--Sack kraft paper, uncoated, unbleached, rolls orsheets, U.S. imports, by country Total 6,572,332 4,654,901 5,613,626
Exporting country 1993 Jan-Aug 94 Average Source: Bureau of Census, Department of Commerce.--Kilograms--
Canada 36,758,508 28,999,296 32,878,902France 4,571 0 2,286Finland 0 4,430 2,215Other 0 558 279
Total 36,763,079 29,004,284 32,883,682Source: Bureau of Census, Department of Commerce.
42 Industrial Uses/IUS-4/December 1994

Global -EnvironmentalPolicies AffectAgriculturalTradeThe global community has recently become more concerned about theenvironment, making it one of the leading issues of the 1990's.Environmental issues include water quality, soil erosion, deforesta-tion, product safety, and the protection of wildlife and biodiversity.These reports address how policy measures adopted to deal withenvironmental issues may affect agricultural trade.
Environmental Policies: Implications forAgricultural Trade.145 pp. June 1994.
This report, consisting of 14 separate articles, analyzes linkagesbetween environmental policies and agricultural trade. Topicscovered include a global inventory of environmental policies, theimplications of environmental policies on U.S. and worldagricultural trade, the implications for environmental policy inthe context of multilateral and regional trade negotiations, andthe effects of global climate change on agricultural trade.
To order thesereports, please call Stock # FAER-252 $15.001-800-999-6779(outside the U.S. andCanada, please call Global Review of Resource and Environmental1-703-834-0125). VISA Policies: Water Resource Development andand MasterCard Management.accepted. 90 pp. June 1994.
This report reviews how 30 countries develop and manage theirwater resources. Because the focus of the report is onagriculture, particular attention is given to irrigation. The studyfound that differing climatic conditions, demand for water, andhistorical situations led to diverse laws, policies, andadministrative structures across countries.
Stock # FAER-251 $12.00

United StatesDepartment of Agriculture FIRST CLASS1301 New York Avenue, N.W. POSTAGE & FEES PAIDWashington, D.C. 20005-4789 USDA
PERMIT NO. G-145OFFICIAL BUSINESSPenalty for Private Use, $300
Moving? To change yur address, sendthis sheet with label Intact, showingnew address to ERS Information, Rm.228, 1301 New York Ave., N.W. Wash-ington, D.C. 20005-4789.
The United States Department of Agriculture (USDA) prohibitsdiscrimination In its programs on the basis of race, color, nationalorigin, sex, religion, age, disability, political beliefs and marital orfamilal status. (Not all prohibited bases apply to all programs).Persons with disabilities who require alternative means for com-munication of program Information braille, large print, audiotape,etc.) should contact the USDA Office of Communications at (202)720-5881 (voice) or (202) 720-7808 (TDD).To file a complaint, write the Secretary of Agriculture, U.S. Depart-ment of Agriculture, Washington, D.C., 20250, or call (202) 720-7327 (voice) or (202) 720-1127 (TDD). USDA Is an equalopportunity employer.
k PRINTED WITH|
New!
USDA TO HOLD AGRICULTURALECONOMIC OUTLOOK FORUM
The U.S. Department of Agriculture will hold its first agricultural economicforum on February 22 and 23, 1995, in Washington, D.C. The forum willreplace the 70-year-old outlook conference that USDA traditionally heldeach December. Responding to feedback from outlook conferenceparticipants and information users, the conference is being redesigned toadd a new longer-term focus that will help farmers, agribusiness, andpolicy officials make strategic decisions for the future.
Specific details on the forum will be announced later. To request a noticeof program and registration details call 202-720-3050, fax 202-690-1805, orwrite to Outlook Forum, Room 5143 South Building, USDA, Washington,D.C. 20250-3800.


![SERC[1] Copy](https://static.fdocuments.net/doc/165x107/577d21281a28ab4e1e94a21a/serc1-copy.jpg)


