![Trend Analysis of Rainfall in Ganga Basin, India during ...Ganga basin showed stable. Similarly, analyz[7]ed basin wise trends of rainfall, rainy days and temperature over India with](https://static.fdocuments.net/doc/165x107/5f519c18fef09f2a0d24cbc9/trend-analysis-of-rainfall-in-ganga-basin-india-during-ganga-basin-showed-stable.jpg)
AGRICULTURE : SPECIAL INITIATIVES IN TRIPURA. RAINFALL SITUATION IN TRIPURA: 2010 Month RAINFALLNOS....
21
AGRICULTURE : SPECIAL INITIATIVES IN TRIPURA
Transcript of AGRICULTURE : SPECIAL INITIATIVES IN TRIPURA. RAINFALL SITUATION IN TRIPURA: 2010 Month RAINFALLNOS....

AGRICULTURE : SPECIAL INITIATIVES IN TRIPURA

RAINFALL SITUATION IN TRIPURA: 2010
Month
RAINFALL NOS. OF RAINY DAYS
Actual Rainfall (mm)
Normal Rainfall (mm)
Deviation(% to
Normal)
Actual Rainy Days (nos.)
Normal Rainy Days (nos.)
Deviation(% to
Normal)
January 0 12.3 -100% 0 0.8 -100%February 2.4 28.1 -91% 0.4 1.6 -75%
March 21.9 69.3 -68% 1.3 3.5 -63%April 138.3 172.3 -20% 5.8 7 -17%May 366.7 314.8 16% 12.9 12 8%June 239.9 449 -46% 13.1 17.4 -25%July 442.1 370 19% 12.3 18 -32%
August 380.9 328.9 16% 16.4 17 -4%
Sept 85.7(Upto 14th)
240.0 5.6 13.2
January to 14th Sept
1720.5 1984.7 -13% 75.1 90.5 -17%

SOILS OF TRIPURA
• Four soil orders viz. Entisols, Inceptisols, Alfisols and Ultisols have been identified in Tripura.
• Soils of Tripura have been grouped into five soil reaction classes viz. extremely acidic (<4.5 pH)-10%, very strongly acidic (4.6-5.0)-26%, strongly acidic (5.1-5.5)- 54% and medium (5.6-6.0)-8% and slightly acidic (6.1-6.5)-2%.

District-wise Soil Reaction (pH) in Tripura (area in ha)
Class West South Dhalai North State
Extremely acidic
17419.5 10135 50145 17771 95470.5(5.81) (4.70) (19.65) (6.30) (9.09)
Very strongly acidic
91038.7 82239 55311 28090 256678.7(30.37) (38.21) (21.67) (9.96) (24.46)
Strongly acidic
150587.28 112094 58515 195085 516281.28(50.26) (52.09) (22.92) (69.16) (49.20)
Moderately acidic
15761.6 4971 20660 39208 80600.6(5.26) (2.31) (8.10) (13.90) (7.68)
Slightly acidic5304 191 12316 1909 19720
(1.76) (0.10) (4.82) (0.68) (1.87)
(Parenthesis indicates respective percentage)

Status of Available Zinc of Tripura (area in ha)
Class West South Dhalai North State
Low27923 21941 26221 96015 172100(9.32) (10.20) (10.27) (34.04) (16.40)
Marginal173500.08 82816 74037 151601 481954.08
(57.89) (38.48) (29.00) (53.75) (45.93)
Adequate 57105 21349 73234 22395 174083
(19.05) (9.92) (9.19) (7.94) (16.59)
High 21583 83524 23455 12052 140614(7.20) (38.81) (28.69) (4.27) (13.40)
(Parenthesis indicates respective percentage to State)

OUR AIMWe are working together through various disciplines to fulfill the following three aspects:
Food Security : 5.13 lakh MT (1999) 6.48 lakh MT (2010) 8.62 lakh MT ( 2012-target)
Livelihood Improvement: 1.16 lakh mostly tribal beneficiaries, have been provided with 1.72 lakh hectares under Forest Right Act,2006.
Sustainable Environment contd..
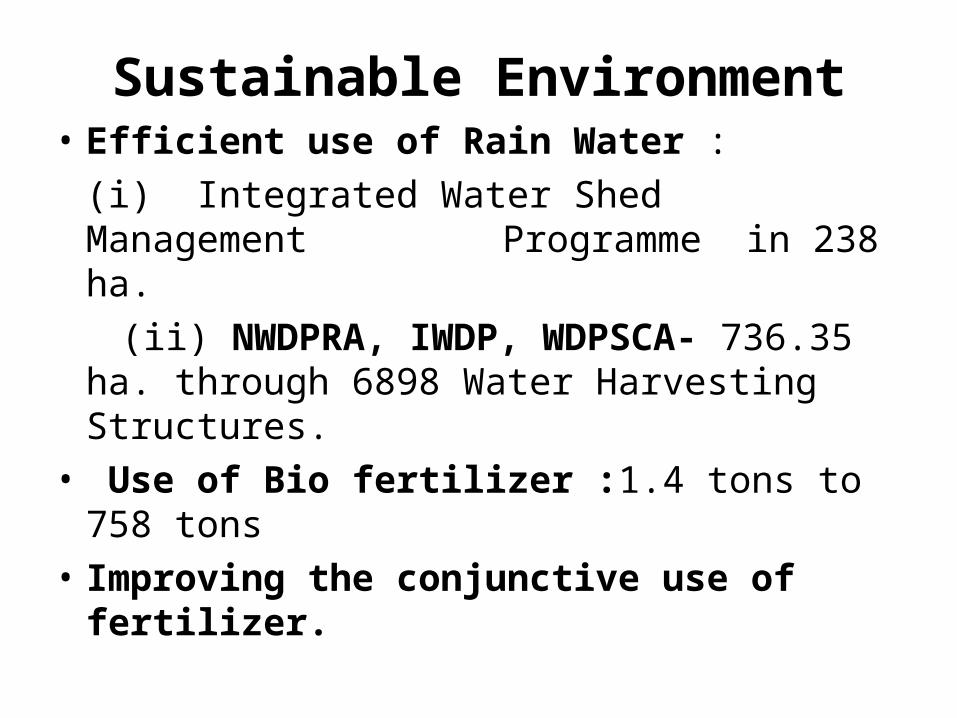
Sustainable Environment• Efficient use of Rain Water :
(i) Integrated Water Shed Management Programme in 238 ha.
(ii) NWDPRA, IWDP, WDPSCA- 736.35 ha. through 6898 Water Harvesting Structures.
• Use of Bio fertilizer :1.4 tons to 758 tons• Improving the conjunctive use of
fertilizer.

Addressing unexplored areas• Tilla land utilization
through mixed cropping – increase in net cropped area.
• 1.72 lakh ha land made available to 1.16 lakh tribals for cultivation under Forest Dwellers’ Rights Act.
• Survey on present status, crop suitability, mixed cropping etc of the allotted land is in progress.
Tilla land utilization with diversified cropping
Colocasia in tilla land-source of starch to the tribal people

Tilla Land Utilization
•No tillage/minimal tillage.•Major crops in the system are : Paddy, Maize, Bottle Gourd, Radish,Cauliflower, Sesamum, Rapeseed, Blackgram, Arhar, Pineapple, Banana, Ginger, Chilli Bamboo, etc.
Black gram-Bottle gourd after paddy harvest
Paddy in tilla land with minimal land development
Maize in Jhum
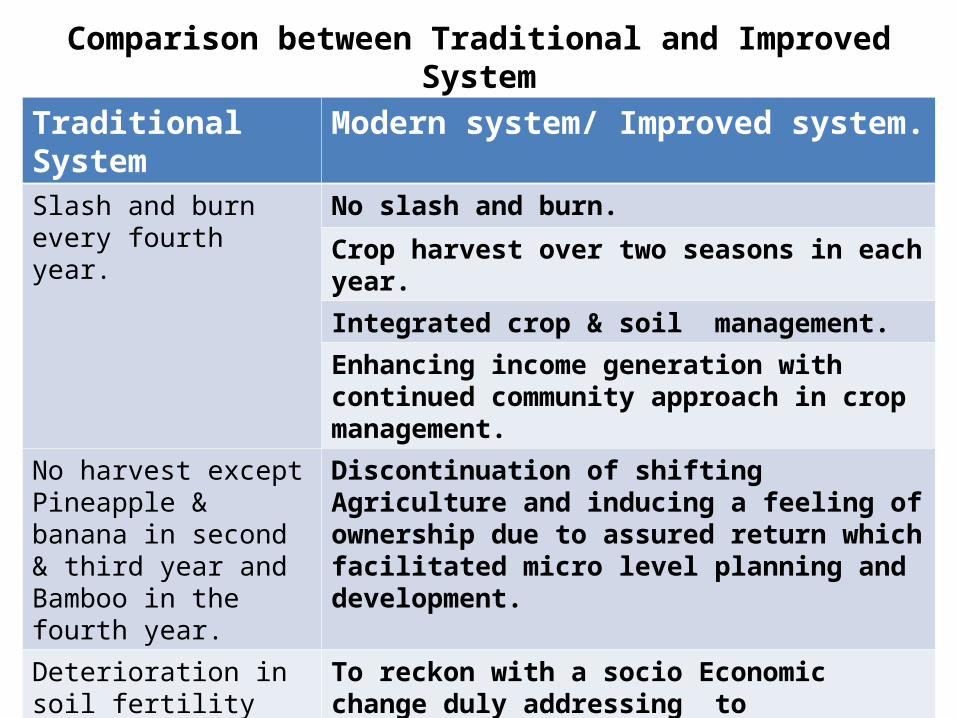
Comparison between Traditional and Improved System
Traditional System Modern system/ Improved system.Slash and burn every fourth year.
No slash and burn.
Crop harvest over two seasons in each year.
Integrated crop & soil management.
Enhancing income generation with continued community approach in crop management.
No harvest except Pineapple & banana in second & third year and Bamboo in the fourth year.
Discontinuation of shifting Agriculture and inducing a feeling of ownership due to assured return which facilitated micro level planning and development.
Deterioration in soil fertility and environmental pollution.
To reckon with a socio Economic change duly addressing to environmental concerns.
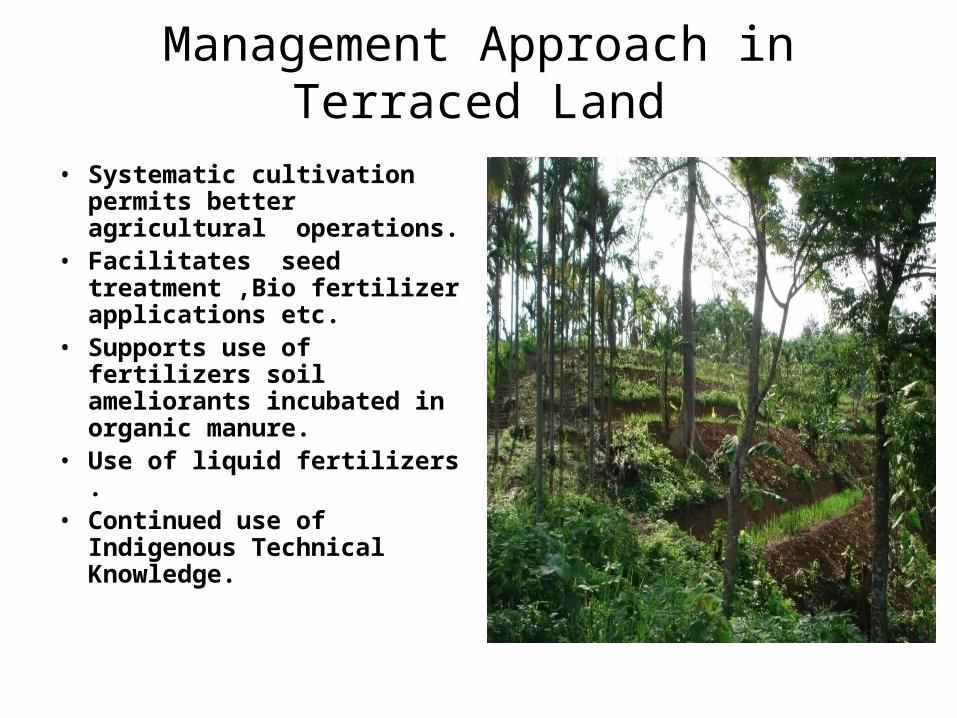
Management Approach in Terraced Land
• Systematic cultivation permits better agricultural operations.
• Facilitates seed treatment ,Bio fertilizer applications etc.
• Supports use of fertilizers soil ameliorants incubated in organic manure.
• Use of liquid fertilizers .• Continued use of
Indigenous Technical Knowledge.

INTRODUCTION OF NEW VARIETIES
• Five new varieties introduced in the Improved system of tilla land cultivation ( Bali White, Bali Red, Yapuna Yamukh, Kimin and Nsusu).
• Introduction of short duration varieties of paddy in plain land situation for 13000 hectares which facilitates to increase cropping intensity up to 300% (Paddy-Paddy- Vegetable) in a year.

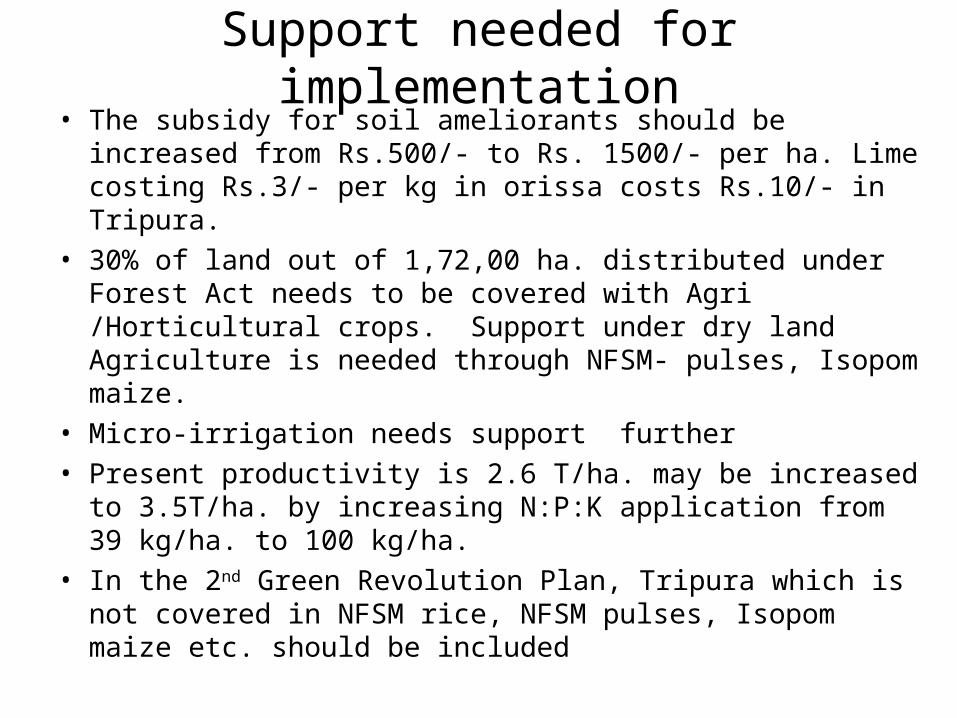
Support needed for implementation• The subsidy for soil ameliorants should be increased from
Rs.500/- to Rs. 1500/- per ha. Lime costing Rs.3/- per kg in orissa costs Rs.10/- in Tripura.
• 30% of land out of 1,72,00 ha. distributed under Forest Act needs to be covered with Agri /Horticultural crops. Support under dry land Agriculture is needed through NFSM- pulses, Isopom maize.
• Micro-irrigation needs support further• Present productivity is 2.6 T/ha. may be increased to
3.5T/ha. by increasing N:P:K application from 39 kg/ha. to 100 kg/ha.
• In the 2nd Green Revolution Plan, Tripura which is not covered in NFSM rice, NFSM pulses, Isopom maize etc. should be included

Thank you
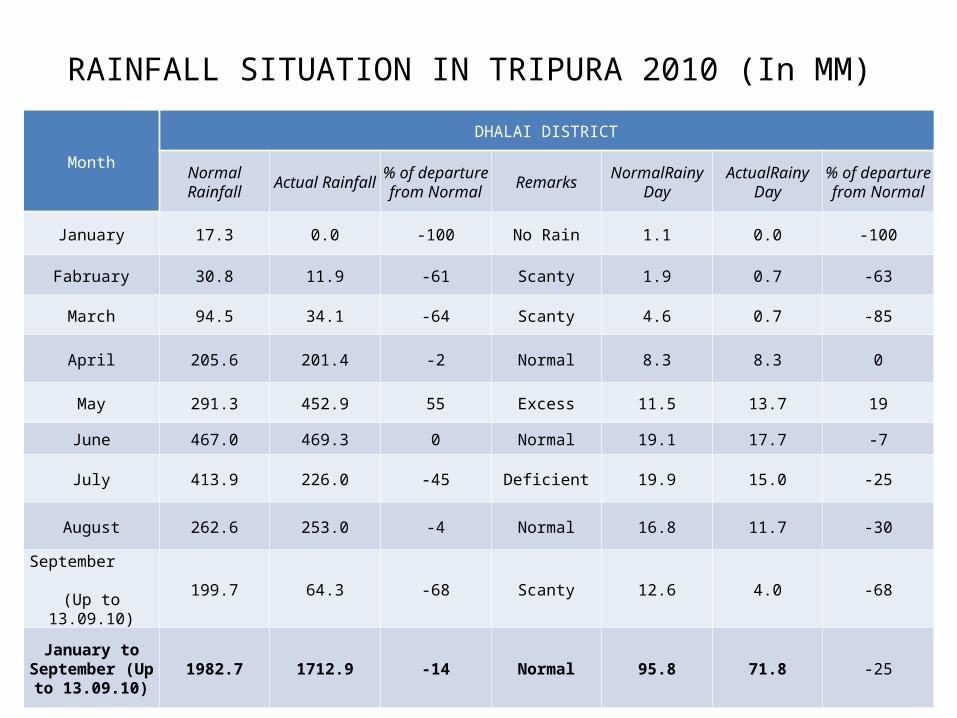
RAINFALL SITUATION IN TRIPURA 2010 (In MM)
Month
DHALAI DISTRICT
Normal Rainfall
Actual Rainfall
% of departure
from NormalRemarks
NormalRainy Day
ActualRainy Day
% of departure
from Normal
January 17.3 0.0 -100 No Rain 1.1 0.0 -100
Fabruary 30.8 11.9 -61 Scanty 1.9 0.7 -63
March 94.5 34.1 -64 Scanty 4.6 0.7 -85
April 205.6 201.4 -2 Normal 8.3 8.3 0
May 291.3 452.9 55 Excess 11.5 13.7 19
June 467.0 469.3 0 Normal 19.1 17.7 -7
July 413.9 226.0 -45 Deficient 19.9 15.0 -25
August 262.6 253.0 -4 Normal 16.8 11.7 -30
September (Up to 13.09.10)
199.7 64.3 -68 Scanty 12.6 4.0 -68
January to September
(Up to 13.09.10)
1982.7 1712.9 -14 Normal 95.8 71.8 -25

RAINFALL SITUATION IN TRIPURA 2010 (in mm)
Month
WEST TRIPURA DISTRICT
Normal Rainfall
Actual Rainfall
% of departure
from Normal
RemarksNormal
Rainy DayActual
Rainy Day
% of departure
from Normal
January 11.9 0.0 -100 No Rain 0.8 0 -100
Fabruary 27.5 15.6 -43 Deficient 1.5 0.8 -47
March 59.6 63.0 6 Normal 3.0 2.7 -10
April 167.7 161.7 -4 Normal 6.6 7.3 11
May 297.6 443.2 49 Excess 11.1 12.3 11
June 434.7 415.1 -5 Normal 16.4 15.8 -4
July 348.7 171.2 -51 Deficient 17 11.2 -34
August 319.3 206.1 -35 Deficient 16.3 12.7 -22
September (Up to
13.09.10)
231.4 55.2 -76 Scanty 13.0 3.3 -75
January to September
(Up to 13.09.10)
1898.4 1531.1 -19 Normal 85.7 66.1 -23

Month
SOUTH TRIPURA DISTRICT
Normal Rainfall
Actual Rainfall
% of departure
from Normal
RemarksNormal
Rainy DayActual
Rainy Day
% of departure
from Normal
January 8.7 0.0 -100 No Rain 0.6 0 -100
Fabruary 26.2 17.9 -32 Deficient 1.4 1.2 -14
March 49.9 59.9 20 Excess 2.6 3.4 31
April 125.6 59.1 -53 Deficient 5.5 4.2 -24
May 257.5 345.8 34 Excess 11 10.6 -4
June 423.0 409.1 -3 Normal 16.3 16.6 2
July 382.1 236.1 -38 Deficient 17.7 11.8 -33
August 350.5 289.0 -18 Normal 16.8 11.3 -33
September (Up to
13.09.10)
240.4 34.3 -86 Scanty 12.9 4.0 -69
January to September
(Up to 13.09.10)
1863.9 1451.2 -22 Deficient 84.8 63.1 -26

Rainfall Situation
Month
NORTH TRIPURA DISTRICT
Normal Rainfall
Actual Rainfall
% of departure
from NormalRemarks
Normal Rainy Day
Actual Rainy Day
% of departure
from Normal
January 14.6 0.0 -100 No Rain 1 0 -100
February 30.7 0.0 -100 No Rain 1.8 0 -100
March 100.2 116.3 16 Normal 5 3.3 -34
April 232.6 333.6 43 Excess 9.1 14.4 58
May 438.3 623.6 42 Excess 15.2 18 18
June 499.1 419.3 -16 Normal 19.9 17.7 -11
July 365.4 244.7 -33 Deficient 18.8 20.3 8
August 343.9 430.6 25 Excess 18.6 19.7 6
September (Up to
13.09.10)273.9 112.8 -59 Deficient 14.3 7.7 -46
January to September
(Up to 13.09.10)
2298.7 2280.9 -1 Normal 103.7 101.1 -3

SRIYear Total
Kharif Paddy Area
Area SRI in Kharif Paddy
% covera
ge
2007-08 1,73,279 15,868 9%
2008-09 1,66,522 25,266 15%
2009-10 1,65,801 39,864 24%
2010-11 1,80,230 41, 693 23%
From a single seedlingWeeding in
paddy
Line sowing and spacing

Comparison : Benefit Cost Ratio of different system of cultivation of paddy (Rs./ ha)
CropCost of
ProductionRs/ha.
Net ReturnRs/ha.
Yield per ha
( MT/ha)
B:C Ratio
SRI 24,381/- 35,618/- 5.5 2.26
ICM 29,685/- 20,000/- 5 1.68
HYV Conventio
nal28,347/- 14,152/- 5 1.50
Hybrid paddy
31,428/- 19,071/- 6 1.61